Embed Size (px)
Citation preview
Characterization and application of humic acid modifiedcarbon electrodes
Carlos D. Garcıa, Patricia I. Ortiz *
INFIQC, Facultad de Ciencias Quımicas, Departamento de Fısicoquımica, Universidad Nacional de Cordoba Ciudad Universitaria,
Cordoba, Argentina
Received 11 March 2003; received in revised form 9 May 2003; accepted 14 May 2003
Abstract
Four routes for the modification of carbon electrodes with humic acids and the determination of three divalent
metallic cations were studied. The determination of bound Fe2�, Cu2� and Ni2� was performed by cyclic and square
wave voltammetry using either a batch or flow analysis system. Using the FIA system and SWV, linear relationships
between the oxidation (or reduction) current and the cations concentration were obtained with the modified electrodes,
while no signals were obtained for the same conditions for bare carbon electrodes. The system can be used to study the
interaction between a wide range of electroactive cations and humic substances; however, the performance as an
analytical tool is limited due to the high limits of detection (mM). However, some advantages like simplicity, short
analysis time, inexpensive instrumentation needs and miniaturization capabilities are remarkable.
# 2003 Elsevier B.V. All rights reserved.
Keywords: Fe2�, Cu2� and Ni2� determination; Humic acid; Modified carbon electrodes
1. Introduction
Humic substances comprise a general class of
biogenic, refractory, yellowish-black organic sub-
stances that are ubiquitous, occurring in all
terrestrial and aquatic environments. These humic
substances constitute the major organic fractions
in soils and have been studied by soil scientists for
two centuries. One of the first difficulties encoun-
tered in the study of humic substances relates to
terminology, because these substances do not
corresponds to a unique chemical entity, and
accordingly, cannot be described in unambiguous
structural terms. There are three major fractions of
humic substances operationally defined in terms of
their solubility. By these criteria, humic acids
(HAs) are considered those humic substances
that are not soluble in water under acid conditions
(below pH 2), but becomes soluble at greater pH
values [1]. Humic (and also fulvic) acids are
natural, weak polyelectrolytes that are very active
in binding ions and organic molecules [2] and play
* Corresponding author. Present address: INFIQC,
Departamento de Fısicoquımica, Facultad de Ciencias
Quımicas, Universidad Nacional de Cordoba, Ciudad
Universitaria, Cordoba, Argentina. Tel.: �/54-351-4334169/80;
fax: �/54-351-4334188.
E-mail addresses: [email protected] (C.D.
Garcıa), [email protected] (P.I. Ortiz).
Talanta 61 (2003) 547�/556
www.elsevier.com/locate/talanta
0039-9140/03/$ - see front matter # 2003 Elsevier B.V. All rights reserved.
doi:10.1016/S0039-9140(03)00321-7

an important role in the environment, being one ofthe major complexing components in soils and
water systems [3]. They can also affect diverse
phenomena such as transport mechanisms, toxicity
or bioavailability [4,5]. Citric acid groups, weakly
acid enols [6], malonate, salicylic and aromatic o-
dicarboxylic acids groups present in HA are as
responsible for the complexing properties between
HA and metallic cations such as H�, Ca2�, Cd2�,Cu2� [7], Pb2� [8], Al3� [9,10], Ni2�, Fe2� and
Fe3� [11].
However, the potential utility of HA for metal
ion analysis depends on the modifications that can
be performed on electrode surfaces using these
substances. Chemically modified electrodes have
been widely applied in electroanalytical chemistry
as a means of improving sensitivity and selectivity[12], in particular those based on carbon, have
gained much attention during the last few years.
Different preparation methods for these modified
electrodes have been described [12,13] and depend-
ing on the electrode material, there are various
methods for each modification. In the case of
carbon paste electrodes (CPEs), one of the most
commonly used preparations is the direct mixingof the modifier into the carbon, i.e. an insoluble
particulate component is mixed into the graphite
powder and then the pasting liquid is added [14]
allowing the preferential preconcentration of ana-
lytes on their surfaces [15,16]. In the case of glassy
carbon electrodes [17], HA cannot be included into
the base material, so a surface modification must
be performed. A film deposition can be obtainedby a combination of chemisorptive effects and low
solubility in the contacting solution [18] allowing
one to control the deposited amount or speed of
the process by adjusting the deposition time and/or
the applied potential, respectively.
As pointed out above, modification of carbon
surfaces with HAs can impart selectivity and
sensitivity to the electrochemical quantificationof cations. The main purpose of this paper is to
report some of the analytical possibilities of
carbon electrodes modified by HAs. Different
deposition methods and two modified carbon
electrodes were studied using standard solutions
of Ni2�, Cu2� and Fe2� as probes. For each
electrode, a different working procedure was used.
The first one is a batch arrangement, using cyclicvoltammetry (CV) and a modified carbon paste
electrodes (MCPEs). The second approach con-
sists of a flow injection analysis (FIA) system
coupled with square wave voltammetry (SWV)
detection and using modified glassy carbon elec-
trodes (MGCEs).
2. Experimental
2.1. Reagents
All the chemicals were of analytical grade. The
solutions were prepared with ultrapure water from
Millipore MilliQ System. Nickel, iron and copper
stock solutions were prepared daily and diluted as
required to prepare standard solutions from nickel
sulphate (Mallinckrodt), iron(II) sulphate (Ane-
dra) and copper(II) sulphate (Cicarelli), respec-tively. A 1.0 M HClO4 solution from Merck was
used for cleaning the electrode.
HA, provided by Fluka, was washed with
concentrated HCl and the precipitate was thor-
oughly washed with water to remove Cl� anions.
HA was then oven-dried at 40 8C, and the powder
was weighed and redissolved in NaOH (pH 12.0)
to prepare a stock solution of 4.766 g l�1.
2.2. Apparatus
Cyclic voltammetry experiments were per-
formed with a LyP M5 potentiostat coupled to a
LyP programmer and a Houston X-Y recorder
and carried out in a conventional three-electrode
cell. SWV experiments were performed with an
Autolab PGSTAT 30 and data collected with a PC
using GPES software (version 4.8). AgjAgClj3 MNaCl and Pt were used as reference and auxiliary
electrodes, respectively. Carbon paste electrodes,
described previously [19], and glassy carbon elec-
trodes (MF-1000 BioAnalytical Systems) were
used throughout. A Metrolab Spectrophotometer
was used for HA adsorption characterization.
C.D. Garcıa, P.I. Ortiz / Talanta 61 (2003) 547�/556548
2.3. Electrode preparation
Four different immobilization routes were ana-
lyzed for the HA immobilization on carbon
particles. For the first modified carbon paste
electrode (MCPE1), carbon particles were mixed
with the HA solution and gently stirred overnight.
The modified carbon particles were mixed with
light mineral oil (30%, w/w). Direct, solid HAmixing with the carbon and mineral oil was also
tested (MCPE2), but a visible loss of HA was
observed during the experiment. The third mod-
ification route was performed electrochemically
(MCPE3) on an already prepared carbon paste
electrode, applying 1.2 V vs Pt in a stirred alkaline
HA solution for 1 h. Finally, for comparative
purposes the carbon paste electrode was immersedin the HA solution without applying any potential,
up to 3 h (MCPE4); nevertheless, no HA adsorp-
tion was observed under these conditions. Accord-
ing to these previously obtained results, MGCEs
were prepared using the same scheme of MCPE3.
2.4. Analytical procedure
For the first batch procedure, a typical accumu-lation step was performed by immersing the
modified electrode in stirred solutions of different
HA concentration values for 5 min and applying
�/0.40 V. Further, the electrode was washed with
purified water and finally the corresponding cyclic
voltammogram was obtained in a new base solu-
tion between �/0.20 and 1.00 V at 0.10 V s�1.
For the FIA procedure, the accumulation wascarried out by flowing different HA concentration
solutions for 5 min, applying �/0.60 V. After that,
the corresponding SWV procedure was performed
in the same working solution from the accumula-
tion potential value (�/0.60 V) to 1.20 V (forward)
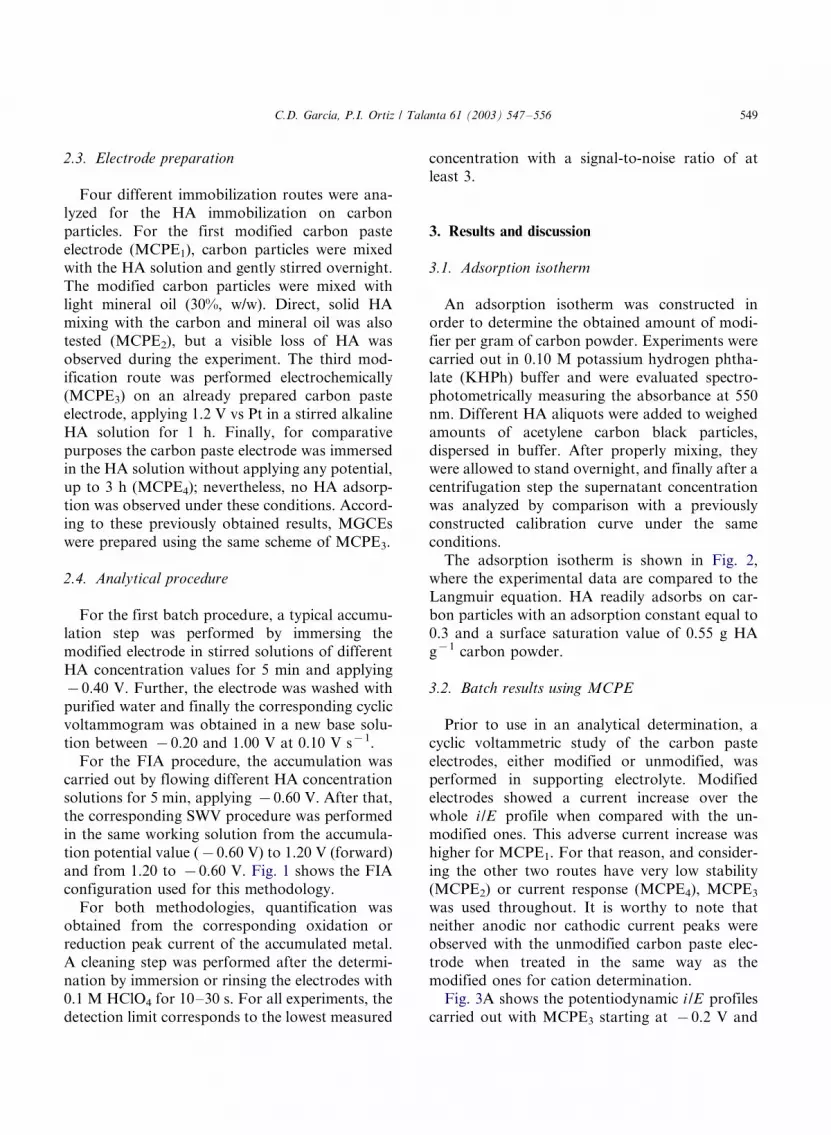
and from 1.20 to �/0.60 V. Fig. 1 shows the FIA
configuration used for this methodology.
For both methodologies, quantification wasobtained from the corresponding oxidation or
reduction peak current of the accumulated metal.
A cleaning step was performed after the determi-
nation by immersion or rinsing the electrodes with
0.1 M HClO4 for 10�/30 s. For all experiments, the
detection limit corresponds to the lowest measured
concentration with a signal-to-noise ratio of atleast 3.
3. Results and discussion
3.1. Adsorption isotherm
An adsorption isotherm was constructed inorder to determine the obtained amount of modi-
fier per gram of carbon powder. Experiments were
carried out in 0.10 M potassium hydrogen phtha-
late (KHPh) buffer and were evaluated spectro-
photometrically measuring the absorbance at 550
nm. Different HA aliquots were added to weighed
amounts of acetylene carbon black particles,
dispersed in buffer. After properly mixing, theywere allowed to stand overnight, and finally after a
centrifugation step the supernatant concentration
was analyzed by comparison with a previously
constructed calibration curve under the same
conditions.
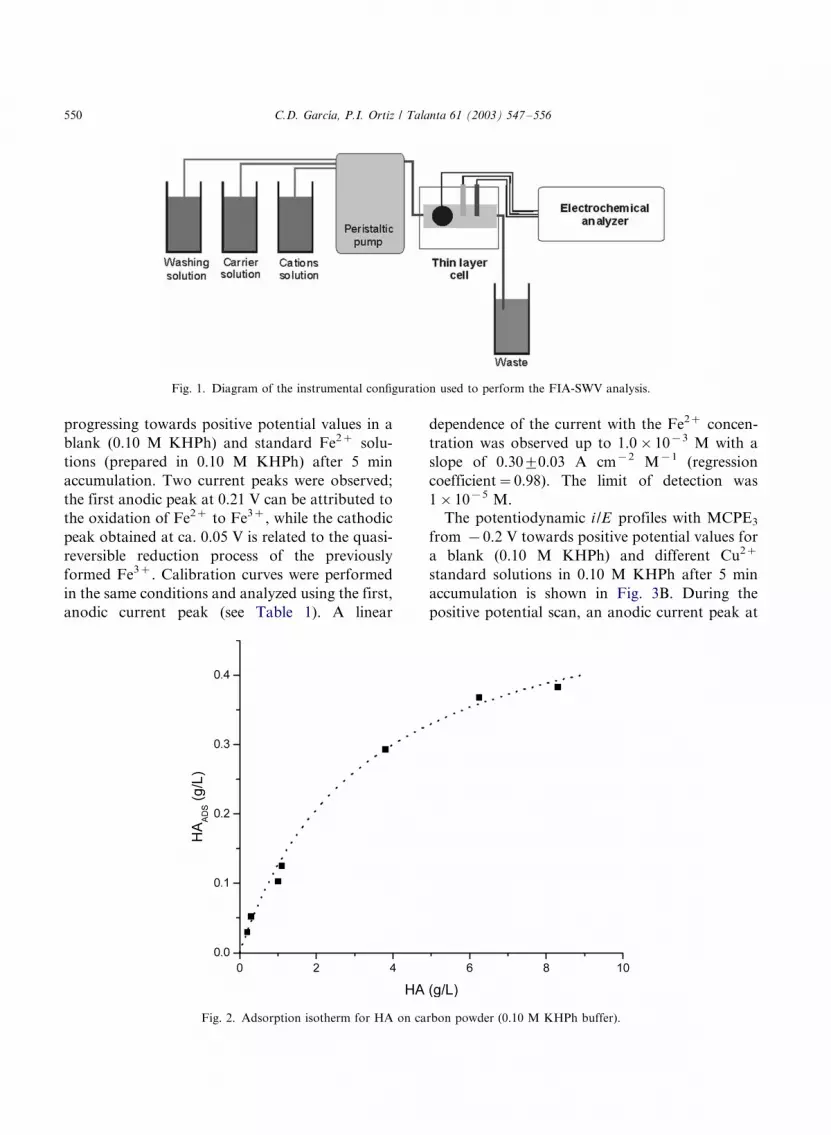
The adsorption isotherm is shown in Fig. 2,
where the experimental data are compared to the
Langmuir equation. HA readily adsorbs on car-bon particles with an adsorption constant equal to
0.3 and a surface saturation value of 0.55 g HA
g�1 carbon powder.
3.2. Batch results using MCPE
Prior to use in an analytical determination, a
cyclic voltammetric study of the carbon paste
electrodes, either modified or unmodified, wasperformed in supporting electrolyte. Modified
electrodes showed a current increase over the
whole i /E profile when compared with the un-
modified ones. This adverse current increase was
higher for MCPE1. For that reason, and consider-
ing the other two routes have very low stability
(MCPE2) or current response (MCPE4), MCPE3
was used throughout. It is worthy to note thatneither anodic nor cathodic current peaks were
observed with the unmodified carbon paste elec-
trode when treated in the same way as the
modified ones for cation determination.
Fig. 3A shows the potentiodynamic i /E profiles
carried out with MCPE3 starting at �/0.2 V and
C.D. Garcıa, P.I. Ortiz / Talanta 61 (2003) 547�/556 549
progressing towards positive potential values in a
blank (0.10 M KHPh) and standard Fe2� solu-
tions (prepared in 0.10 M KHPh) after 5 min
accumulation. Two current peaks were observed;
the first anodic peak at 0.21 V can be attributed to
the oxidation of Fe2� to Fe3�, while the cathodic
peak obtained at ca. 0.05 V is related to the quasi-
reversible reduction process of the previously
formed Fe3�. Calibration curves were performed
in the same conditions and analyzed using the first,
anodic current peak (see Table 1). A linear
dependence of the current with the Fe2� concen-
tration was observed up to 1.0�/10�3 M with a
slope of 0.309/0.03 A cm�2 M�1 (regression
coefficient�/0.98). The limit of detection was
1�/10�5 M.
The potentiodynamic i /E profiles with MCPE3
from �/0.2 V towards positive potential values for
a blank (0.10 M KHPh) and different Cu2�
standard solutions in 0.10 M KHPh after 5 min
accumulation is shown in Fig. 3B. During the
positive potential scan, an anodic current peak at
Fig. 1. Diagram of the instrumental configuration used to perform the FIA-SWV analysis.
Fig. 2. Adsorption isotherm for HA on carbon powder (0.10 M KHPh buffer).
C.D. Garcıa, P.I. Ortiz / Talanta 61 (2003) 547�/556550
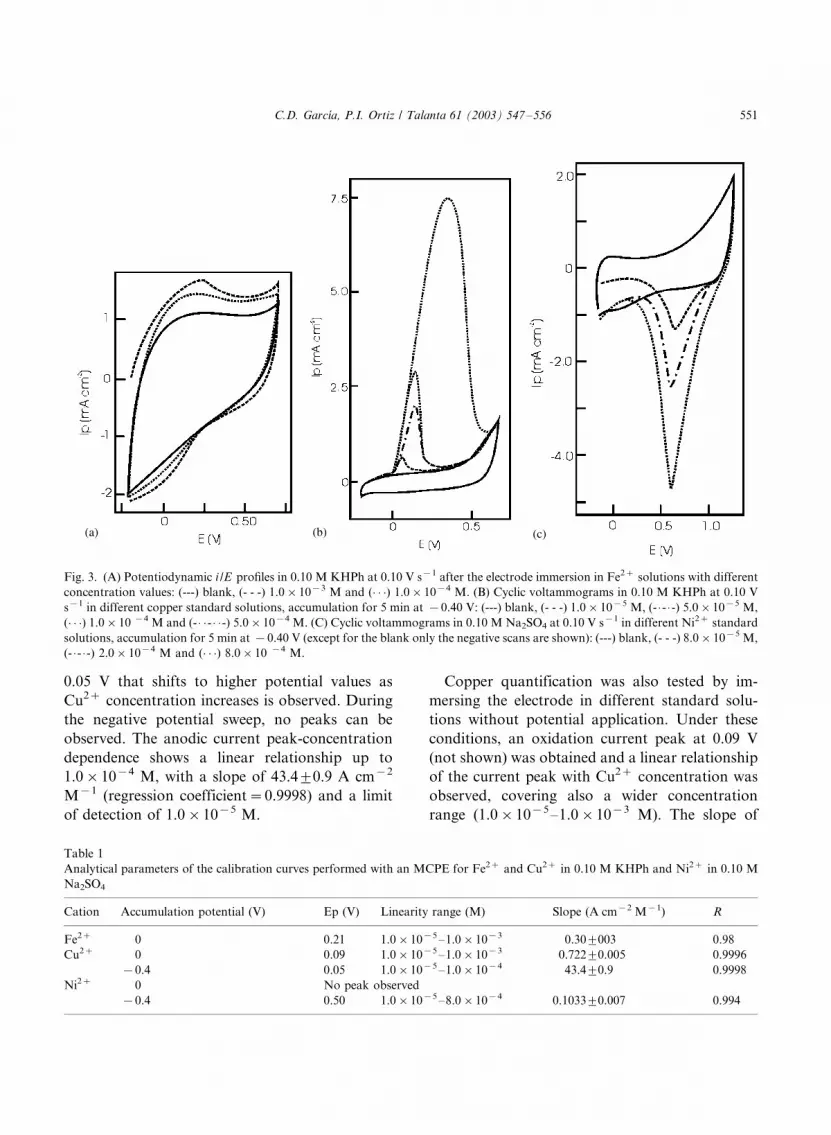
0.05 V that shifts to higher potential values as
Cu2� concentration increases is observed. During
the negative potential sweep, no peaks can be
observed. The anodic current peak-concentration
dependence shows a linear relationship up to
1.0�/10�4 M, with a slope of 43.49/0.9 A cm�2
M�1 (regression coefficient�/0.9998) and a limit
of detection of 1.0�/10�5 M.
Copper quantification was also tested by im-
mersing the electrode in different standard solu-
tions without potential application. Under these
conditions, an oxidation current peak at 0.09 V
(not shown) was obtained and a linear relationship
of the current peak with Cu2� concentration was
observed, covering also a wider concentration
range (1.0�/10�5�/1.0�/10�3 M). The slope of
Fig. 3. (A) Potentiodynamic i /E profiles in 0.10 M KHPh at 0.10 V s�1 after the electrode immersion in Fe2� solutions with different
concentration values: (---) blank, (- - -) 1.0�/10�3 M and (� � �) 1.0�/10�4 M. (B) Cyclic voltammograms in 0.10 M KHPh at 0.10 V
s�1 in different copper standard solutions, accumulation for 5 min at �/0.40 V: (---) blank, (- - -) 1.0�/10�5 M, (- �/- �/-) 5.0�/10�5 M,
(� � �) 1.0�/10 �4 M and (- �/ �/- �/ �/-) 5.0�/10�4 M. (C) Cyclic voltammograms in 0.10 M Na2SO4 at 0.10 V s�1 in different Ni2� standard
solutions, accumulation for 5 min at �/0.40 V (except for the blank only the negative scans are shown): (---) blank, (- - -) 8.0�/10�5 M,
(- �/- �/-) 2.0�/10�4 M and (� � �) 8.0�/10 �4 M.
Table 1
Analytical parameters of the calibration curves performed with an MCPE for Fe2� and Cu2� in 0.10 M KHPh and Ni2� in 0.10 M
Na2SO4
Cation Accumulation potential (V) Ep (V) Linearity range (M) Slope (A cm�2 M�1) R
Fe2� 0 0.21 1.0�/10�5�/1.0�/10�3 0.309/003 0.98
Cu2� 0 0.09 1.0�/10�5�/1.0�/10�3 0.7229/0.005 0.9996
�/0.4 0.05 1.0�/10�5�/1.0�/10�4 43.49/0.9 0.9998
Ni2� 0 No peak observed
�/0.4 0.50 1.0�/10�5�/8.0�/10�4 0.10339/0.007 0.994
C.D. Garcıa, P.I. Ortiz / Talanta 61 (2003) 547�/556 551

the curve was 0.7229/0.005 A cm�2 M�1, with aregression coefficient of 0.9996 and a limit of
detection of 1�/10�5 M. Although this method
can be used for copper quantification and the
concentration range is wider, the slope is consider-
ably lower than that obtained with a potential
accumulation step, so that the first procedure is
recommended.
For Ni2� determination, no response wasobtained in KHPh solutions using the conditions
previously described. For that reason, the accu-
mulation was studied in 0.10 M Na2SO4. Fig. 3C
shows the potentiodynamic i /E profiles with
MCPE3 starting at �/0.2 V towards positive
potential values for a blank (0.10 M Na2SO4)
and different Ni2� standard solutions after 5 min
accumulation. No current peaks were obtainedduring the positive sweep while in the negative
scan, a sharp cathodic current peak at 0.50 V was
observed. The peak shifts toward less positive
potential values as Ni2� concentration increases.
A linear relationship between the cathodic current
peak and Ni2� concentration was obtained up to
8.0�/10�4 M, with a slope of 0.10339/0.007 A
cm�2 M�1 (regression coefficient�/0.994) and thelimit of detection was 1.0�/10�5 M.
Analytical parameters corresponding to the
calibration curves for the three analyzed cations
in the above-mentioned conditions are summar-
ized in Table 1.
In all cases, neither an oxidation nor a reduction
current peak was observed with an unmodified
carbon paste electrode, under the same conditionspreviously described, indicating that Fe2�, Cu2�
or Ni2� cannot be deposited on the electrode
surface in the absence of HA.
3.3. FIA results using MGCE
Several parameters can affect the current peak
in the FIA-SWV method. Specifically, each para-
meter of the SWV method is able to modify, in acertain way, the magnitude of the current peak.
Fig. 4 shows the waveform and the assigned names
of the optimized parameters during the following
study. Note that according to the SWV technique,
the recorded curve corresponds to the difference
between the average currents in the forward and
the reverse pulse, sampled just before each flank
[20].
During the first step, the accumulation proce-
dure parameters were optimized recording the
positive scan (�/0.6 to 1.2 V) and the reverse
scan (1.2 to �/0.6 V) with no delay time. Fig. 5
shows the effect of deposition time on the electro-
chemical response evaluated from 100 to 750 s
using a 1.9�/10�4 M Cu2� solution in Na2SO4
and applying �/0.6 V. As can be observed, a clear
current increase can be obtained increasing the
accumulation time but, in order to obtain a good
relationship between current magnitude and ana-
lysis time, 300 s was found to be optimum.
Not only the time, but also the deposition
potential has an important effect on the electro-
chemical response of the cations. This effect was
studied from 0 to �/0.80 V using 0.10 V steps. As
the potential becomes more negative, a linear
current increase was observed for Cu2� until �/
0.60 V, where a current plateau was reached (Fig.
6). An analogous behavior was found for Ni2�.
Similar to the experiments performed in batch, it
was not necessary to apply potential to perform
the accumulation of Fe2�. However, in order to
analyze mixtures, the same procedure was applied
to all the analytes.
For all three cations, the forward and reverse
scans were recorded in order to characterize the
responses and analyze mixtures of them. SWV was
optimized by the variation of modulation time
(MT), modulation amplitude (MA), interval time
(IT) and step potential (SP) values that should be
adjusted according to the kinetics of the electro-
Fig. 4. Waveform and assigned names of the optimized
parameters during the electrochemical study, according to the
SWV technique.
C.D. Garcıa, P.I. Ortiz / Talanta 61 (2003) 547�/556552

chemical process. The variation of different para-
meters affects not only the magnitude of the signal,
but also the oxidation (or reduction) potential
value.
Fig. 5. Effect of deposition time on the electrochemical response from 100 to 750 s (1.9�/10�4 M Cu2� solution in Na2SO4 and
applying �/0.6 V).
Fig. 6. Effect of deposition potential (DP) on the electrochemical response from �/100 to �/800 V (1.9�/10�4 M Cu2� solution in
Na2SO4).
C.D. Garcıa, P.I. Ortiz / Talanta 61 (2003) 547�/556 553
For Ni2�, the reverse scan was used for thequantification process, where a clear cathodic
wave was obtained at around 0.60 V. In the case
of Cu2�, three peaks were observed in the positive
scan (�/0.6 to 1.2 V), but only the best defined one
at �/0.19 V was used for the quantification. A
well-defined peak was observed for iron solutions
during the positive scan at 0.030 V (not shown).
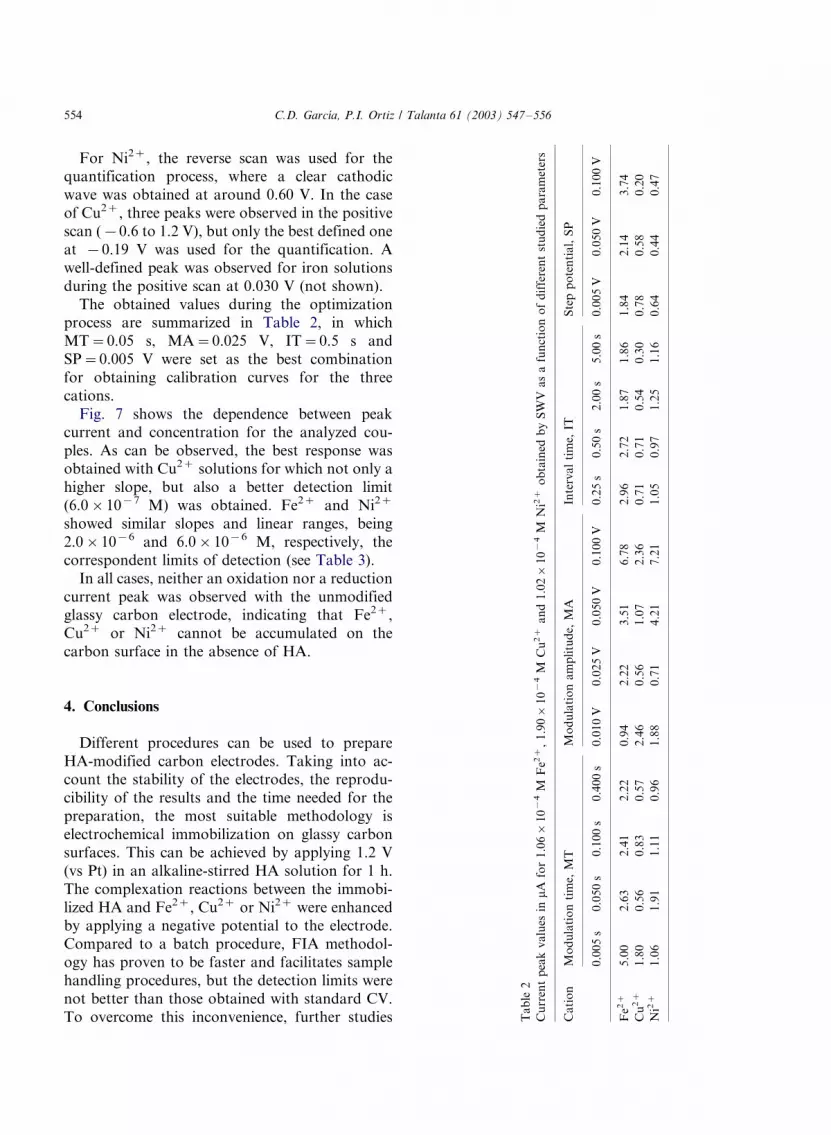
The obtained values during the optimizationprocess are summarized in Table 2, in which
MT�/0.05 s, MA�/0.025 V, IT�/0.5 s and
SP�/0.005 V were set as the best combination
for obtaining calibration curves for the three
cations.
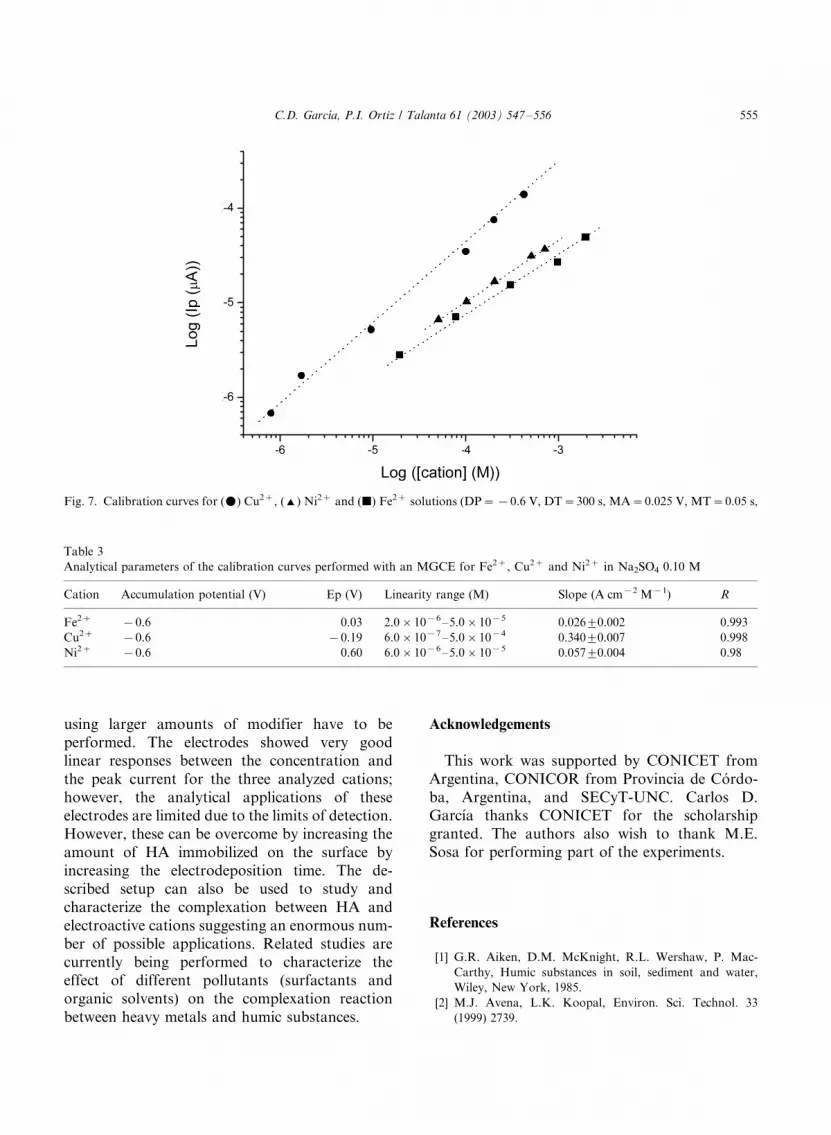
Fig. 7 shows the dependence between peak
current and concentration for the analyzed cou-
ples. As can be observed, the best response wasobtained with Cu2� solutions for which not only a
higher slope, but also a better detection limit
(6.0�/10�7 M) was obtained. Fe2� and Ni2�
showed similar slopes and linear ranges, being
2.0�/10�6 and 6.0�/10�6 M, respectively, the
correspondent limits of detection (see Table 3).
In all cases, neither an oxidation nor a reduction
current peak was observed with the unmodifiedglassy carbon electrode, indicating that Fe2�,
Cu2� or Ni2� cannot be accumulated on the
carbon surface in the absence of HA.
4. Conclusions
Different procedures can be used to prepare
HA-modified carbon electrodes. Taking into ac-count the stability of the electrodes, the reprodu-
cibility of the results and the time needed for the
preparation, the most suitable methodology is
electrochemical immobilization on glassy carbon
surfaces. This can be achieved by applying 1.2 V
(vs Pt) in an alkaline-stirred HA solution for 1 h.
The complexation reactions between the immobi-
lized HA and Fe2�, Cu2� or Ni2� were enhancedby applying a negative potential to the electrode.
Compared to a batch procedure, FIA methodol-
ogy has proven to be faster and facilitates sample
handling procedures, but the detection limits were
not better than those obtained with standard CV.
To overcome this inconvenience, further studies Ta
ble
2
Cu
rren
tp
eak
va
lues
inmA
for
1.0
6�
/10�
4M
Fe2
�,
1.9
0�
/10�
4M
Cu
2�
an
d1
.02�
/10�
4M
Ni2�
ob
tain
edb
yS
WV
as
afu
nct
ion
of
dif
fere
nt
stu
die
dp
ara
met
ers
Ca
tio
nM
od
ula
tio
nti
me,
MT
Mo
du
lati
on
am
pli
tud
e,M
AIn
terv
al
tim
e,IT
Ste
pp
ote
nti
al,
SP
0.0
05
s0
.05
0s
0.1
00
s0
.40
0s
0.0
10
V0
.02
5V
0.0
50
V0
.10
0V
0.2
5s
0.5
0s
2.0
0s
5.0
0s
0.0
05
V0
.05
0V
0.1
00
V
Fe2
�5
.00
2.6
32
.41
2.2
20
.94
2.2
23
.51
6.7
82
.96
2.7
21
.87
1.8
61
.84
2.1
43
.74
Cu
2�
1.8
00
.56
0.8
30
.57
2.4
60
.56
1.0
72
.36
0.7
10
.71
0.5
40
.30
0.7
80
.58
0.2
0
Ni2�
1.0
61
.91
1.1
10
.96
1.8
80
.71
4.2
17
.21
1.0
50
.97
1.2
51
.16
0.6
40
.44
0.4
7
C.D. Garcıa, P.I. Ortiz / Talanta 61 (2003) 547�/556554
using larger amounts of modifier have to be
performed. The electrodes showed very good
linear responses between the concentration and
the peak current for the three analyzed cations;
however, the analytical applications of these
electrodes are limited due to the limits of detection.
However, these can be overcome by increasing the
amount of HA immobilized on the surface by
increasing the electrodeposition time. The de-
scribed setup can also be used to study and
characterize the complexation between HA and
electroactive cations suggesting an enormous num-
ber of possible applications. Related studies are
currently being performed to characterize the
effect of different pollutants (surfactants and
organic solvents) on the complexation reaction
between heavy metals and humic substances.
Acknowledgements
This work was supported by CONICET from
Argentina, CONICOR from Provincia de Cordo-
ba, Argentina, and SECyT-UNC. Carlos D.Garcıa thanks CONICET for the scholarship
granted. The authors also wish to thank M.E.
Sosa for performing part of the experiments.
References
[1] G.R. Aiken, D.M. McKnight, R.L. Wershaw, P. Mac-
Carthy, Humic substances in soil, sediment and water,
Wiley, New York, 1985.
[2] M.J. Avena, L.K. Koopal, Environ. Sci. Technol. 33
(1999) 2739.
Fig. 7. Calibration curves for (m) Cu2�, (') Ni2� and (j) Fe2� solutions (DP�/�/0.6 V, DT�/300 s, MA�/0.025 V, MT�/0.05 s,
Table 3
Analytical parameters of the calibration curves performed with an MGCE for Fe2�, Cu2� and Ni2� in Na2SO4 0.10 M
Cation Accumulation potential (V) Ep (V) Linearity range (M) Slope (A cm�2 M�1) R
Fe2� �/0.6 0.03 2.0�/10�6�/5.0�/10�5 0.0269/0.002 0.993
Cu2� �/0.6 �/0.19 6.0�/10�7�/5.0�/10�4 0.3409/0.007 0.998
Ni2� �/0.6 0.60 6.0�/10�6�/5.0�/10�5 0.0579/0.004 0.98
C.D. Garcıa, P.I. Ortiz / Talanta 61 (2003) 547�/556 555
[3] J.P. Pinheiro, A.M. Mota, J.M.R. d’Oliveira, J.M.G.
Martinho, Anal. Chim. Acta 329 (1996) 15.
[4] P. Warwick, T. Hall, Analyst 117 (1992) 151.
[5] P.C. Hubbard, E.N. Barata, A.V.M. Canarioa, Aquat.
Toxicol. 60 (2002) 169.
[6] J.P. Pinheiro, A.M. Mota, M.L.S. Simoes Gonzalves, H.P.
van Leeuwen, Colloid. Surf. 137 (1998) 165.
[7] M. Plavsic, B. Cosovic, S. Miletic, Anal. Chim. Acta 255
(1991) 15.
[8] X. Lu, Z. Chen, S.B. Hall, X. Yang, Anal. Chim. Acta 418
(2000) 205.
[9] D.G. Kinniburgh, W.H. van Riemsdijk, L.K. Koopal, M.
Borkovec, M.F. Benedetti, M.J. Avena, Colloid. Surf. 151
(1999) 147.
[10] E. Tipping, C. Rey-Castro, S.E. Bryan, J. Hamilton-
Taylor, Geochim. Cosmochim. Acta 66 (2002)
3211.
[11] M. Hiraide, H. Hommi, H. Kawaguchi, Fresenius’ J. Anal.
Chem. 342 (1992) 387.
[12] R.W. Murray, A.C. Ewing, R.A. Durst, Anal. Chem. 59
(1987) 379A.
[13] K. Kalcher, Electroanalysis 2 (1990) 419.
[14] K. Ravichandran, R.P. Baldwin, J. Electroanal. Chem. 126
(1981) 293.
[15] C. Wang, H. Zhang, Y. Sun, H. Li, Anal. Chim. Acta 361
(1998) 133.
[16] C. Wang, Q. Sun, H. Li, Electroanalysis 9 (1997) 645.
[17] K. Shiu, K. Shi, Electroanalysis 10 (1998) 959.
[18] J.T. Bard, Electroanalytical Chemistry, vol. 13, Marcel
Dekker, New York, 1984.
[19] G.A. Rivas, P.I. Ortiz, Anal. Lett. 27 (1994) 751.
[20] M.A. Bret, A.M. Oliveira Bret, Electrochemistry: Princi-
ples, Methods and Applications, Oxford University Press,
New York, 1993.
C.D. Garcıa, P.I. Ortiz / Talanta 61 (2003) 547�/556556