Embed Size (px)
Citation preview

ORIGINAL PAPER
Copper hexacyanoferrate modified electrodes for hydrogenperoxide detection as studied by X-ray absorptionspectroscopy
Marco Giorgetti & Domenica Tonelli & Mario Berrettoni &Giuliana Aquilanti & Marco Minicucci
Received: 28 September 2013 /Revised: 19 November 2013 /Accepted: 25 November 2013 /Published online: 13 December 2013# Springer-Verlag Berlin Heidelberg 2013
Abstract X-ray absorption spectroscopy (XAS) has beenused to monitor the local geometry of Fe and Cu sites ofcopper hexacyanoferrates (CuHCF)-modified electrodeswhich find application in the electrochemical detection ofhydrogen peroxide. TheXAS approach has permitted to checkthe nature of the Cu and Fe sites and to investigate their localstructure around about 500 pm from the metal centres. Themeasurements have been done on electrodes prior and afterthe addition of known quantities of hydrogen peroxide at twodifferent concentration ranges, following a protocol consistingof H2O2 addition, applied potential, and rest period. For theCuHCF-modified electrode, this protocol leads to the increas-ing conversion to an already present “inactive” component,which limits the usability of the sensor; whereas the electrodemodified with the Cu2+-loaded CuHCF displays a better re-sistance to this unavoidable process. In particular, the
formation of the “inactive” component takes place more slow-ly, confirming the capability, at molecular scale, of such Cu-enriched CuHCF used as electrode modifier to detect moreefficiently hydrogen peroxide, as recently demonstrated in ourprevious paper.
Keywords X-ray absorption spectroscopy . Hydrogenperoxide .Copperhexacyanoferrate .Graphite foilelectrodes .
Sensor
Introduction
Prussian Blue (PB) and related metal hexacyanoferrates(MHCFs) are a class of interesting polymeric inorganic com-pounds which have been largely studied for many years [1].Applications in the field of thermochromism andelectrochromism, charge storage, ion capture, andnanomaterials have been reported [2–6] and, since the workby Sato in the late 1990s [7], relevant studies on the photo-induced magnetisation have been carried out [8]. The ion-storage capabilities have also made them attractive for poten-tiometric sensing [9] and due to the various redox statesplayed by the metals involved, hexacyanoferrates can alsoact as redox mediators, so allowing the electrocatalytic deter-mination of different analytes [10–12]. Among PB analogs,the copper (Cu) hexacyanoferrates (CuHCF) has been suc-cessfully used for hydrogen peroxide detection, and recentlywe reported a new synthetic procedure to increase the amountof active Cu into a CuHCF which led to an increased responsesensitivity to H2O2 with respect to the pristine material [13].The procedure was based on the potentiodynamic depositionof a CuHCF film on a glassy carbon electrode followed by theCu2+ ion intercalation into the hexacyanoferrate. Determina-tion of H2O2 at other chemically modified solid electrodeshave been proven as well [14–16].
Electronic supplementary material The online version of this article(doi:10.1007/s10008-013-2343-5) contains supplementary material,which is available to authorized users.
M. Giorgetti (*) :D. TonelliDepartment of Industrial Chemistry “Toso Montanari”, University ofBologna, INSTM, UdR Bologna, Viale Risorgimento 4,40136 Bologna, Italye-mail: [email protected]
M. BerrettoniDepartment of Industrial Chemistry “Toso Montanari,” UOs (unitàoperativa di sede) Campus di RIMINI, University of Bologna,INSTM, Bologna, Italy
G. AquilantiSincrotrone Trieste S.C.p.A, S.S. 14 Km 163.5, 34149 Basovizza,Trieste, Italy
M. MinicucciCNISM, School of Science and Technology, Physics Division,University of Camerino, Via Madonna delle Carceri,62032 Camerino, (MC), Italy
J Solid State Electrochem (2014) 18:965–973DOI 10.1007/s10008-013-2343-5

From the structural viewpoint, MHCFs and CuHCF, inparticular, are characterised by a rigid three-dimensional cubicnetwork of repeating –NC–Ma–CN–Mb–NC– units where Ma
is Fe and Mb is Cu in CuHCF, although other crystal symme-tries are found in a few other hexacyanoferrates. Fe and Cusites are typically octahedral, and the sites at the cube centreare occupied by water (zeolitic water) as well as bycountercations as necessary to achieve charge neutrality. Thestructure of thin film electrode can be studied by X-ray ab-sorption spectroscopy (XAS) [17, 18] and structural studies onMHCFs using have been recently reviewed [19].
Structural details on several electrodepositedCuHCFs, amongwhich also the Cu2+-loaded CuHCF, have been recently studiedby using a combined spectroscopic approach (XAS, Raman, andSEM). The study has, demonstrated that it is not possible toobtain a pure electrosynthesisedCuHCF, because a small amountof an “inactive” component, which has been postulated to be PB,is deposited during the synthesis [20]. The only possible way toenhance the amount of pure CuHCF in the deposit was toperform a second step, after the electrosynthesis, consisting inCu2+ ions intercalation. The paper has also evidenced thestrength and limitation of the extended X-ray absorption finestructure (EXAFS) approach for these materials, by presenting acomparison of the single vs. multiple edge approach for the dataanalysis, indicating the single Cu–K edge approach as the mostreliable one. These experimental findings have been confirmedby a structural characterisation of CuHCF deposited on ITO [21].AXAS approach has been used for the structural characterisationof a mixed Cu and Pd hexacyanoferrates electrode for theglucose biosensing [22] indicating that the deposited Cu- andPd-based hexacyanoferrates is a mixture of single CuHCF- andPdHCF-pure phases.
In the present paper, we reveal the structural rearrangements,at molecular scale, occurring at electrodes modified with twoCuHCF, the pristine CuHCF or the Cu2+-loaded CuHCF, whenperforming chronoamperometric measurements of H2O2. Thestudy has been conducted by comparing the X-ray absorptionnear-edge structure (XANES) spectra at different levels of addedH2O2 (within two concentration ranges) with the data obtainedfrom EXAFS analysis at the Cu–K edge.
Experimental
Electrode preparation
Thin films of pure Cu (CuHCF) and Cu-loaded (Cu2+-loadedCuHCF) hexacyanoferrates were potentiodynamically depositedon graphite foils (from Cixi Weilite Sealing Material Co., Ltd,Zhejiang,China), according to a previously described [13] pro-cedure. A three-electrode conventional cell was employed, with agraphite foil as the working, a saturated calomel electrode (SCE;AMEL 303/SCG/RJ), as the reference, and a Pt wire as the
counter electrode. The modification of the graphite foil surfacewas performed with a CHI 660C (CH Instruments, Inc.).
XAS measurements
XAS experiments were performed at the XAFS beamline ofElettra Synchrotron (Basovizza, Italy) [23]. The storage ringoperated at 2.0 GeV in top up mode with a typical current of300 mA. The beam was monochromatised using a fixed exitmonochromator equipped with a pair of Si(111) crystals.Harmonics were rejected by using the cutoff of the reflectivityof the Pt mirror placed at 3 mrad with respect to the beamupstream the monochromator and by detuning the secondcrystal of the monochromator by 30 % of the maximum.The data were recorded at Cu–K edges in fluorescence modeusing a large area Si drift detector diode (KETEK GmbHAXAS-M). The energies were defined by assigning the firstinflection point of the spectra of themetallic Cu to 8,979 eV. Aspectrum of metallic Cu for calibration purpose was recordedsimultaneously to each scan. Three to five spectra were col-lected with a constant k-step of 3 pm−1 with 5 s/point acqui-sition time, to improve the statistics.
Description of XAS experiment
In the present study, a set of XANES and EXAFS spectra havebeen recorded for the CuHCF-modified electrodes before andafter selected additions of hydrogen peroxide. We have there-fore used this protocol (called hydrogen peroxide additionprotocol): (1) immersion of the electrode in 0.1 mol dm−3
phosphate-buffered saline (PBS) at pH 5.5 and addition of aselected quantity of H2O2; (2) recording of a set ofchronoamperometric curves in 0.1 mol dm−3 PBS at pH 5.5,by applying a potential of 0.0 V vs. SCE, for 100 s; (3) after thepulse the electrode was removed from the cell and placed (after30 min) into the sample holder at the XAFS beamline. Exam-ples of the open circuit potential (OCP) relaxation after thepulse is presented in Fig. 1. It is seen that the electrodes reached
0 20 40 60 80 100
0.00
0.05
0.10
0.15
0.20
Pot
entia
l / V
vs.
SC
E
Time / s
Fig. 1 Examples of OCP relaxation obtained following the potential stepin the chronoanoamperometry (electrode O) after each H2O2 addition.The successive XAS measurements have been recorded after 30 min
966 J Solid State Electrochem (2014) 18:965–973
a somewhat fast equilibrium, and, even though did not reach aplateau in the first 100 s, the protocol above described (XASmeasurements after 30 min) ensures that the XAS measure-ments have been obtained in equilibrium condition. In addition,this protocol can be considered as the closest one to the use ofthese electrodes in real conditions [13]. After the XASmeasure,the points 1 to 3 of the protocol has been completed once again.EXAFS and XANES measurements have been performedtwice, at Cu and Fe–K edge thresholds.
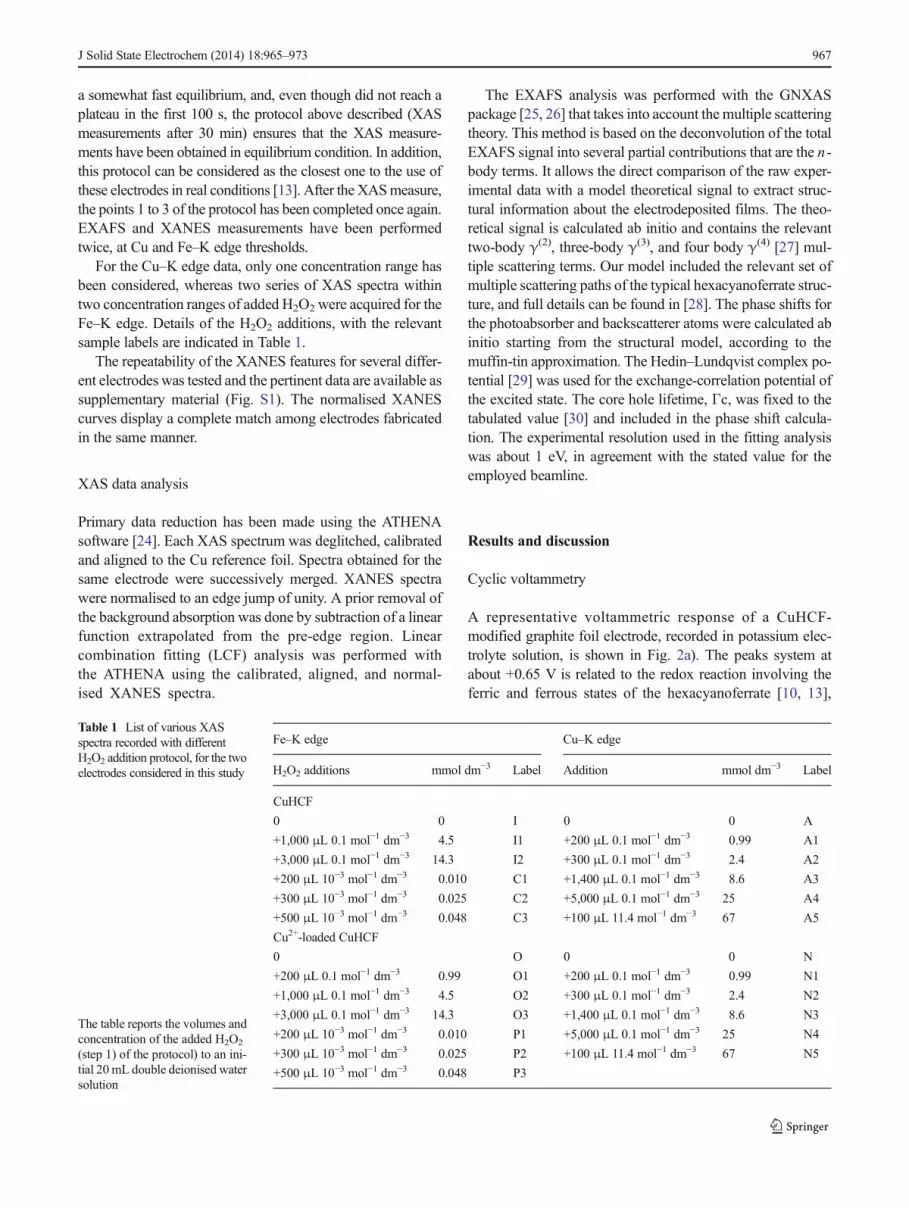
For the Cu–K edge data, only one concentration range hasbeen considered, whereas two series of XAS spectra withintwo concentration ranges of added H2O2 were acquired for theFe–K edge. Details of the H2O2 additions, with the relevantsample labels are indicated in Table 1.
The repeatability of the XANES features for several differ-ent electrodes was tested and the pertinent data are available assupplementary material (Fig. S1). The normalised XANEScurves display a complete match among electrodes fabricatedin the same manner.
XAS data analysis
Primary data reduction has been made using the ATHENAsoftware [24]. Each XAS spectrum was deglitched, calibratedand aligned to the Cu reference foil. Spectra obtained for thesame electrode were successively merged. XANES spectrawere normalised to an edge jump of unity. A prior removal ofthe background absorption was done by subtraction of a linearfunction extrapolated from the pre-edge region. Linearcombination fitting (LCF) analysis was performed withthe ATHENA using the calibrated, aligned, and normal-ised XANES spectra.
The EXAFS analysis was performed with the GNXASpackage [25, 26] that takes into account the multiple scatteringtheory. This method is based on the deconvolution of the totalEXAFS signal into several partial contributions that are the n -body terms. It allows the direct comparison of the raw exper-imental data with a model theoretical signal to extract struc-tural information about the electrodeposited films. The theo-retical signal is calculated ab initio and contains the relevanttwo-body γ(2), three-body γ(3), and four body γ(4) [27] mul-tiple scattering terms. Our model included the relevant set ofmultiple scattering paths of the typical hexacyanoferrate struc-ture, and full details can be found in [28]. The phase shifts forthe photoabsorber and backscatterer atoms were calculated abinitio starting from the structural model, according to themuffin-tin approximation. The Hedin–Lundqvist complex po-tential [29] was used for the exchange-correlation potential ofthe excited state. The core hole lifetime, Γc, was fixed to thetabulated value [30] and included in the phase shift calcula-tion. The experimental resolution used in the fitting analysiswas about 1 eV, in agreement with the stated value for theemployed beamline.
Results and discussion
Cyclic voltammetry
A representative voltammetric response of a CuHCF-modified graphite foil electrode, recorded in potassium elec-trolyte solution, is shown in Fig. 2a). The peaks system atabout +0.65 V is related to the redox reaction involving theferric and ferrous states of the hexacyanoferrate [10, 13],
Table 1 List of various XASspectra recorded with differentH2O2 addition protocol, for the twoelectrodes considered in this study
The table reports the volumes andconcentration of the added H2O2
(step 1) of the protocol) to an ini-tial 20 mL double deionised watersolution
Fe–K edge Cu–K edge
H2O2 additions mmol dm−3 Label Addition mmol dm−3 Label
CuHCF
0 0 I 0 0 A
+1,000 μL 0.1 mol−1 dm−3 4.5 I1 +200 μL 0.1 mol−1 dm−3 0.99 A1
+3,000 μL 0.1 mol−1 dm−3 14.3 I2 +300 μL 0.1 mol−1 dm−3 2.4 A2
+200 μL 10−3 mol−1 dm−3 0.010 C1 +1,400 μL 0.1 mol−1 dm−3 8.6 A3
+300 μL 10−3 mol−1 dm−3 0.025 C2 +5,000 μL 0.1 mol−1 dm−3 25 A4
+500 μL 10−3 mol−1 dm−3 0.048 C3 +100 μL 11.4 mol−1 dm−3 67 A5
Cu2+-loaded CuHCF
0 O 0 0 N
+200 μL 0.1 mol−1 dm−3 0.99 O1 +200 μL 0.1 mol−1 dm−3 0.99 N1
+1,000 μL 0.1 mol−1 dm−3 4.5 O2 +300 μL 0.1 mol−1 dm−3 2.4 N2
+3,000 μL 0.1 mol−1 dm−3 14.3 O3 +1,400 μL 0.1 mol−1 dm−3 8.6 N3
+200 μL 10−3 mol−1 dm−3 0.010 P1 +5,000 μL 0.1 mol−1 dm−3 25 N4
+300 μL 10−3 mol−1 dm−3 0.025 P2 +100 μL 11.4 mol−1 dm−3 67 N5
+500 μL 10−3 mol−1 dm−3 0.048 P3
J Solid State Electrochem (2014) 18:965–973 967

while the occurrence of a second electrochemical process atmore negative potentials was postulated to involve the CuII/CuI couple by Shankaran [31] and by Makowski [32]. Thisprocess appears to be much less reversible. While nothingnovel is obtained from Fig. 2a with respect to CuHCF filmelectrochemistry, the use of low scan rate (0.001 V s−1) per-mits the checking of the typical response of thin film deposit.As seen, the oxidation/reduction peak separation at about0.65 V is only few mV, which is a typical behaviour of a thinlayer of electroactive material. Figure 2b reports few examplesof cyclic voltammetry recorded after the hydrogen peroxideadditions protocol for electrodes N, C, and O. The electro-chemical response displays the peaks due to the Fe redoxcouple. Oxidation/reduction peaks separation lies in the150–300 mV range, depending to the electrode, with a scanrate of 0.05 V s−1. The formal potential Ef=(Ep, anodi+Ep,cathodic)/2 for the electrodes appearing in Fig. 2b are 0.687,0.691, and 0.681 V. These values fall in the formal poten-tial observed for CuHCF [33], excluding the presence of an
iron/CuHCF solid solution after the hydrogen peroxideadditions.
XANES
Figures 3 and 4 display the normalised XANES curves for theCuHCF electrodes at the Cu–K edge and Fe–K edge, respec-tively. Surprisingly, the Cu site results only slightly modifiedby the H2O2 additions protocol, and mayor changes are evi-denced at the Fe–K edge. From this result Fe appears moreelectro-active than Cu. A close inspection of Fig. 3 reveals thatthe edge maximum at 8,996 eV slightly enhances upon thehydrogen peroxide addition protocol. This behaviour has beensuggested to be correlated to the number of Cu–O axialinteractions with mobile water [34]. Structurally speaking,the Cu site is rather the same during the usage of the sensor,with the possibility of having a small amount of O atoms(from water) coordinating the Cu site. In other words, a smallnumber of Cu–N–C–Fe structural units may be lost, makingthe concentration of the Fe(CN)6
3− ion vacancies slightlygreater than in the pristine material. This fact is not surprisingsince MHCFs have been known to have the capability to tunetheir structure between a regular “soluble” and a defective“insoluble” one [28], the latter characterised by Fe(CN)6
3− ionvacancies. This also agrees with the observed partial dissolu-tion of the electrodes during its use as a sensor for hydrogenperoxide (see below and Fig. S4). The charge associated to Cu
0.0 0.2 0.4 0.6 0.8 1.0-4.0x10⁻⁴
-2.0x10⁻⁴
0.0
2.0x10⁻⁴
4.0x10⁻⁴
0.0 0.2 0.4 0.6 0.8 1.0-4.0x10⁻⁴
-2.0x10⁻⁴
0.0
2.0x10⁻⁴
4.0x10⁻⁴
CuII/CuI
Cur
rent
/ A
Potential / V vs. SCE
a FeIII/FeII
Cur
rent
/ A
Potential / V vs. SCE
b
Fig. 2 a Cyclic voltammogram of a pristine CuHCF-modified graphitefoil electrode. Electrolyte, 0.1 M KCl+0.1 HCl. Scan rate, 0.001 V s−1. bExamples of cyclic voltammetry recorded after the hydrogen peroxideadditions protocol for electrodesN, C, andO. Electrolyte, 0.1MKCl+0.1HCl. Scan rate, 0.05 V s−1. Electrode C (solid lines). Electrode N (dashedlines). Electrode O (dotted lines)
Fig. 3 Normalised XANES curves obtained at the Cu–K edge of theCuHCF electrode (a) and of the Cu2+-loaded CuHCF electrode (b), aftereach H2O2 addition protocol. Arrows in the figure indicate modificationsrecorded upon each additional protocol
968 J Solid State Electrochem (2014) 18:965–973
sites does not change significantly during the hydrogen per-oxide addition protocol, as suggested from the edge energyinvariance at this metal K edge. Therefore, the Cu effectivecharge in all measurements is found to be less than +2, aspreviously postulated [20].
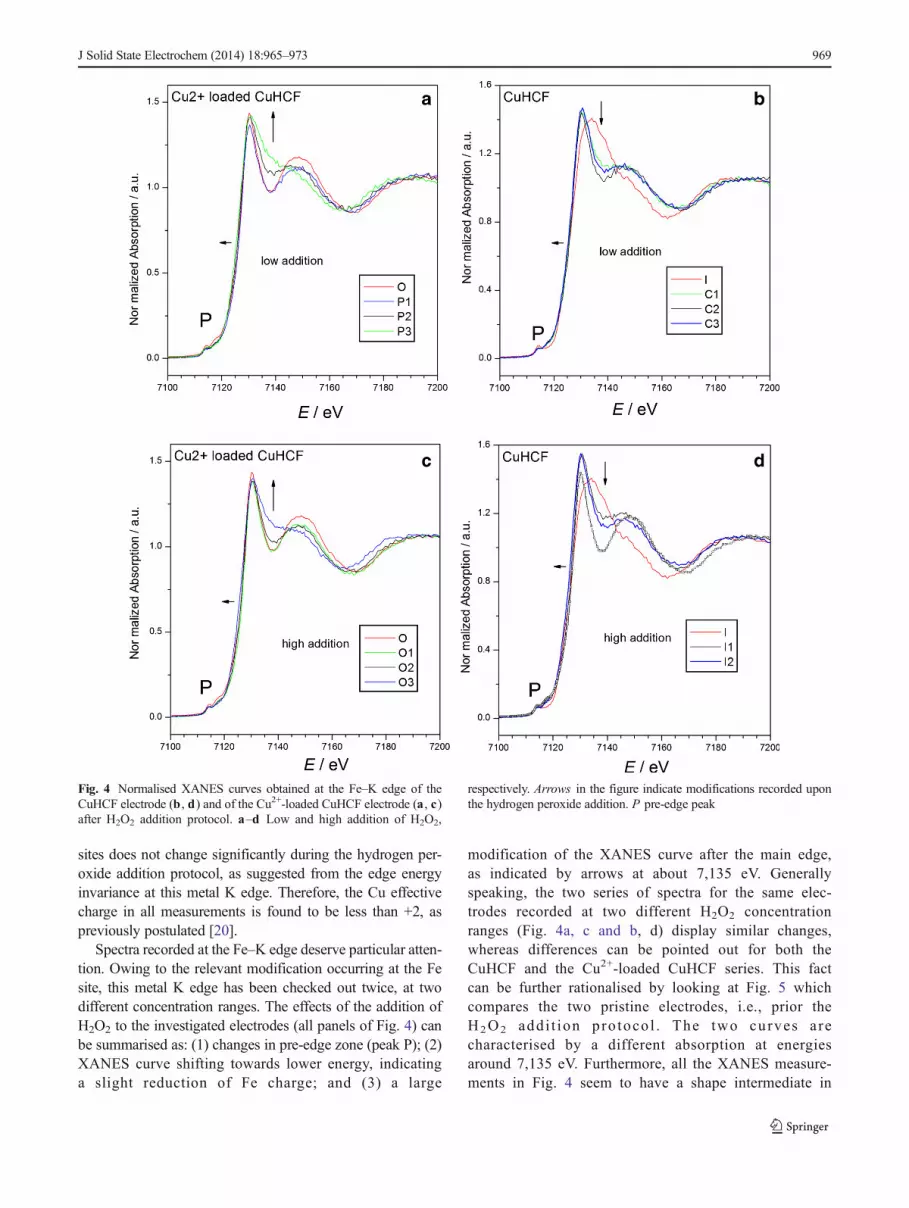
Spectra recorded at the Fe–K edge deserve particular atten-tion. Owing to the relevant modification occurring at the Fesite, this metal K edge has been checked out twice, at twodifferent concentration ranges. The effects of the addition ofH2O2 to the investigated electrodes (all panels of Fig. 4) canbe summarised as: (1) changes in pre-edge zone (peak P); (2)XANES curve shifting towards lower energy, indicatinga slight reduction of Fe charge; and (3) a large
modification of the XANES curve after the main edge,as indicated by arrows at about 7,135 eV. Generallyspeaking, the two series of spectra for the same elec-trodes recorded at two different H2O2 concentrationranges (Fig. 4a, c and b, d) display similar changes,whereas differences can be pointed out for both theCuHCF and the Cu2+-loaded CuHCF series. This factcan be further rationalised by looking at Fig. 5 whichcompares the two pristine electrodes, i.e., prior theH2O2 addi t ion pro toco l . The two curves arecharacterised by a different absorption at energiesaround 7,135 eV. Furthermore, all the XANES measure-ments in Fig. 4 seem to have a shape intermediate in
Fig. 4 Normalised XANES curves obtained at the Fe–K edge of theCuHCF electrode (b , d) and of the Cu2+-loaded CuHCF electrode (a , c)after H2O2 addition protocol. a–d Low and high addition of H2O2,
respectively. Arrows in the figure indicate modifications recorded uponthe hydrogen peroxide addition. P pre-edge peak
J Solid State Electrochem (2014) 18:965–973 969

respect to the two curves of Fig. 5. This fact suggeststhat an inter-conversion between two extreme species,the CuHCF and the Cu2+-loaded CuHCF, takes placeduring the hydrogen peroxide addition protocol. Theconversion goes in opposite direction for the two elec-trodes as demonstrated by the height of the X-ray ab-sorption coefficient after the main edge. This is indicat-ed by the arrows at about 7,135 eV in Fig. 4.
The different behaviour of the two kinds of studied elec-trodes in real conditions demonstrates the suitability of theXAS technique to investigate the electronic modifications ofthese electrodes and a XANES LCF analysis will be presentedsuccessively. It is here worth to point out that the observedinter-conversion between two species can also be rationalisedconsidering the frequently switch of the applied potentialduring the chronoamperometry and the rest period, whichmay cause structural rearrangements and partial dissolutionof the electrodes.
EXAFS
To gain a quantitative understanding of the structure of Cu inboth types of electrodes (Cu2+-loaded and CuHCF) in realconditions, an EXAFS analysis has been done by comparingthe Cu local environment for the pristine electrode and afteraddition of H2O2 to a 0.28 mol dm−3 concentration. EXAFSdata have been analysed at Cu–K edge only, as this metal Kedge has been recently proved the most suitable for obtainingstructural information on CuHCF films on carbon substrates[20]. Figure 6 displays the results of the fitting analysis interms Fourier transform (FT) signals of the extracted EXAFS,and Table 2 reports the outcomes of the data analysis.
As the FT curve is related to the radial atomic distributionaround the photo-absorbing atom which is Cu, the three mainpeaks depicted in Fig. 6a–c, are related to N, C, and Fe, which
are the three main atomic shells around Cu atom. A closeinspection of Fig. 6 reveals that peak C becomes smaller forboth modified electrodes, after addition of H2O2, indicatingeither the occurrence of a structural disorder or the release ofsome (Fe(CN)6) fragments. This is confirmed by looking atthe structural parameters of Table 2, obtained from the fittingprocedures. Table 2 also includes the statistical errors [35]associated to the structural parameters, which have been foundto be larger after H2O2 addition than those observed for thepristine electrode and generally for amorphous materials [36].The atomic distances related to the Fe–C–N–Cu linear chain,i.e., the Fe–C, C≡N, and Cu–N distances have been found inagreement to the values of the bulk CuHCF compound [37]and with previous studies [20]. The addition of H2O2 does notcauses appreciable variation of the distances associated to the
Fig. 5 Normalised XANES curves obtained at the Fe–K edge of thepristine electrodes: CuHCF and Cu2+-loaded CuHCF
Fig. 6 Best fit of the Cu–K edge EXAFS signals of the CuHCF andCu2+-loaded CuHCF electrodes. The comparison of the experimental(solid lines) with the theoretical (dotted lines) Fourier transform (FT) ofthe k2-extracted EXAFS signal is displayed for the pristine electrode andafter 0.28mol dm−3 H2O2 addition and after steps 2 and 3 or the hydrogenperoxide addition protocol. Peaks A–C are related to nitrogen, carbon,and iron atomic shells around Cu
970 J Solid State Electrochem (2014) 18:965–973

chain, but causes a lowering of the coordination numberassociated to the number of the chains (CN1) at the Cu sitein both investigated electrodes. For instance, it is seen adecrease from 3.0 to 2.4 in the case of CuHCF-modifiedelectrode. The dimension of the cell parameter a for this seriesof CuHCF cubes ranges from 1,004 to 1,010 pm, as comingfrom geometrical considerations using the quoted EXAFSbond lengths.
Overall, the Cu–K edge EXAFS analysis supports thehypothesis of a typical MHCF structure in all the investigatedCuHCF electrode (in terms of Fe–C, C–N, and Cu–N dis-tances), with different extent of vacancies. The addition ofhydrogen peroxide at the applied potential favours the occur-rence of these vacancies.
Linear combination fitting analysis of XANES
As seen previously, the H2O2 addition protocol produces largemodification in the XANES spectra at the Fe–K edge, whereasCu–K edge data remain mainly unaltered. Certainly the Cu andthe Fe sites are visible from each other metal K-edges, sincestrong four body contribution occurs inMHCFs, as demonstratedin the literature [27]. This apparent dilemma has been resolved inone of our previous studies [20] by a spectroscopic multi-technique approach. It has been demonstrated that it is notpossible to obtain a pure CuHCF by electrosynthesis, because asmall amount of a second “inactive” component is deposited atthe same, and that a second step consisting of Cu2+ ions interca-lation enhances the amount of pure CuHCF in the electrodeposit.These two materials can be used as reference samples for pure
CuHCF (Cu2+-loaded CuHCF, even though a portion of thesecond component is still present) and two-component CuHCF,and any XAS measurements at the Fe–K edges of CuHCF-modified electrode is affected by this second component. Wehave postulated this second component to be PB [20], and onlyrecently this has been considered possible [38].We also excludedthe formation of a substitutional solid solution of iron-CuHCF[33] thanks to the observed formal potential (as seen from Fig. 2).
Table 2 Structural parameters obtained from EXAFS fitting procedure at the Cu–K edge of CuHCF and Cu2+-loaded electrodes (as such and afteraddition of 0.28 mol dm−3 H2O2 and after steps 2 and 3 or the hydrogen peroxide addition protocol
CuHCF electrode A CuHCF+H2O2 electrode A5 Cu2+-loaded CuHCF electrode N Cu2+-loaded CuHCF+H2O2 electrode N5
Fe–C/pm 189 (4) 192 (10) 191 (2) 190 (4)
σ2 Fe–C/pm2 50 (30) 50 (30) 40 (20) 20 (10)
C≡N/pm 116 (2) 115 (3) 114 (2) 115 (3)
σ2 C≡N/pm2 30 (20) 30 (20) 30 (20) 4 (30)
Cu–N/pm 197 (2) 198 (2) 199 (2) 197 (2)
σ2 Co–N/pm2 40 (20) 20 (10) 90 (40) 20 (10)
Cu–O/pm 201 (2) 197 (3) 201 (2) 201 (3)
σ2 Cu–O/pm2 100 (70) 30 (20) 60 (40) 20 (10)
CN Cu–K (FIX) 1.9 1.9 1.5 1.5
E0 8,989 (1) 8,989 (1) 8,989.2 (6) 8,988.3 (15)
CN 1 (Cu–N–C–Fe) 3.0 (6) 2.4 (7) 2.6 (4) 2.3 (6)
CN 2 (Cu–O) 2.2 (6) 1.9 (8) 1.5 (6) 1.9 (8)
S02 0.77 (6) 0.78 (6) 0.87 (8) 0.89 (9)
a /pm 1,004 1,010 1,008 1,004
The estimated parameter errors are indicated in parentheses. The cell parameter a is evaluated from geometrical considerations using the correspondingthree- and four-body atomic configurations
Table 3 Degree of conversion from the pristine electrode, as obtained bythe LCF analysis of the XANES spectra
% Cu2+-loaded CuHCF % CuHCF
High additions of H2O2
Electrode O 100 0
Electrode O1 95 5
Electrode O2 80 20
Electrode O3 47 53
Electrode I 0 100
Electrode I1 62 38
Electrode I2 66 34
Low additions of H2O2
Electrode O 100 0
Electrode P1 91 9
Electrode P2 59 41
Electrode P3 38 62
Electrode I 0 100
Electrode C1 50 50
Electrode C2 70 30
Electrode C3 58 42
J Solid State Electrochem (2014) 18:965–973 971

To gain a more quantitative understanding of Fe atomicenvironment during the H2O2 treatment, the XANES spectra atthe Fe–K edge were examined by means of LCF. Therefore,using the two electrodes modified with pristine Cu2+-dopedCuHCF and CuHCF as standards, this LCF data treatment cangive the relative abundance in terms of these two referencematerials. A similar application of LCF analysis has been alreadypresented by our group for the case of Au nanoparticles [39].Table 3 summarises the obtained results in terms of abundance(in percent) for the measurements at different concentrations ofadded H2O2 whereas the complete series of XANES LCF areavailable in the Fig. S2. As seen from the table, at molecularlevel, it seems that there is a conversion between two referencematerial, one consisting in an almost pure CuCHF and the othercontaining some impurities, most likely PB. At present, wecannot indicate if those two referencematerials appear as amixedphase or different separated phases. The mutual conversionbetween the two hexacyanometallates does not reach a pointwhere one species is exclusively present. This hypothesis is alsoin agreement with the fact that PB deposits, generated by poten-tial sweep of ferri(III)cyanide anions, are hardly detectable in thecathodic region [40] in neutral solutions as in our experimentsetup. As evidenced, not only themutual conversion between thetwo hexacyanometallates is certainly due to the added H2O2 butalso the frequent switch between the applied potential during theH2O2 addition and the rest period may play a role.
A rearrangement of the data in Table 3, considering the %conversion of the pristinematerials used tomodify the electrodes,i.e., the CuHCF or Cu2+-loaded CuHCF, produces the interestinggraphs of Fig. 7a, b relative to H2O2 additions leading to the lowand high concentration ranges, respectively. It is seen that at boththe investigated concentration ranges, the Cu2+-loaded CuHCFmodified electrode keeps it native structure more efficiently thanCuHCF. In other words, the speed of conversion (which is ofstructurally origin) is higher in the CuHCF than in the Cu2+-
loaded CuHCF. This result fully complies with the one we haveobserved by looking at both electrodes sensing performances[13], where we have seen a greater sensitivity to H2O2 detectionfor the Cu2+-loadedCuHCF electrode than for that modifiedwitha thin CuHCF film.
Eventually, a few words on the electrode durability. Acomparison of the XANES curves prior to the normalisationprocedure has indicated a progressive decreasing of the inten-sities upon H2O2 addition, indicating that the CuHCF goesslightly to dissolution (see Fig. S4 in Electronic supplemen-tarymaterials). At present, it is difficult to tell which of the twoconsidered pristine electrodes dissolute faster (in terms ofdecay of fluorescence intensity), an error of about 10 % dueto sample alignment and beam intensity variation should beconsidered, which is comparable to the observed differences.
Conclusions
An EXAFS and XANES approach has been used to gain awide understanding of the charge and structure changes ofCuHCF-modified electrodes during hydrogen peroxide addi-tions. The experiments have been done in equilibrium condi-tions, after addition of a selected amount of hydrogen perox-ide (at potential of 0.0 V vs. SCE for 300 s) and after a restperiod. Two types of electrodes have been investigated, onemodified with the electrodeposited CuHCF and the othermodified with a Cu2+-loaded CuHCF, the last being reportedto be more efficient for the H2O2 detection. Experiments takenat the Cu–K edge have demonstrated that Cu is only slightlyaffected by H2O2 addition protocol even at high concentra-tions, for both CuHCF and Cu2+-loaded CuHCF, whereasmajor changes have been evidenced at Fe site for both seriesof samples. The XANES analysis based on LCF has permittedto quantitatively determine the amount of two known
Fig. 7 Plot of the degree ofconversion (percent) of thepristine electrodes at the twodifferent concentration ranges ofH2O2 addition. a Low addition,using 10−3 mol dm−3 solution. bHigh addition, using0.1 mol dm−3 solution. Data arerelated to Table 3
972 J Solid State Electrochem (2014) 18:965–973

reference materials, i.e., pure - and two -component CuHCF(with an inactive component), during the H2O2 addition pro-tocol. It has been shown a partial conversion of some areas ofCuHCF to the inactive component. A different behaviour forthe two kinds of modified electrodes has been evidenced,demonstrating the capability, at molecular scale, of such Cuenriched CuHCF to detect more efficiently hydrogen perox-ide, as recently experimentally observed [13]. The other rele-vant experimental finding is the slow dissolution of CuHCFfilm during the H2O2 additions protocol.
Acknowledgments XAS measurements at ELETTRAwere supportedby Sincrotrone Trieste S.C.p.A. (proposal no. 20095163, “X Ray Ab-sorption Spectroscopy Structural studies of MHCFs-based mediators forH2O2 detection”). M.G. also acknowledges the University of Bologna forRFO funding.
References
1. Sharpe AG (1976) The chemistry of cyano complexes of the transi-tion metals. Academic, London
2. Itaya K, Uchida I, Neff VD (1986) Acc Chem Res 19:162–1683. Kulesza PJ, Malik MA, Berrettoni M, Giorgetti M, Zamponi S,
Schmidt R, Marassi R (1998) J Phys Chem B 102:1870–18764. De Tacconi NR, Rajeshwar K, Lezna RO (2003) Chem Mater 15:
3046–30625. Berrettoni M, Giorgetti M, Zamponi S, Conti P, Ranganathan D,
Zanotto A, Saladino L, Caponetti E (2010) J Phys Chem C 114:6401–6407
6. Ranganathan D, Zamponi S, Berrettoni M, Layla Mehdi B, Cox JA(2010) Talanta 82:1149–1155
7. Sato O, Iyoda T, Fujishima A, Hashimoto K (1996) Science 272:704–706
8. Tokoro H, Ohkoshi SI (2011) Dalton Trans 40:6825–68249. Giorgetti M, Scavetta E, Berrettoni M, Tonelli D (2001) Analyst
(Cambridge, U K) 126:2168–217110. Karyakin AA (2001) Electroanalysis 13:813–81911. Liu Y, Chu Z, Jin W (2009) Electrochem Commun 11:484–48712. Chen L, Wang X, Zhang X, Zhang H (2012) J Mater Chem 22:
22090–2209613. Guadagnini L, Tonelli D, Giorgetti M (2010) Electrochim Acta 55:
5036–5039
14. Wang J, Cui L, Yin H, Dong J, Ai S (2012) J Solid State Electrochem16:1545–1550
15. Wu R, Chen X, Hu J (2012) J Solid State Electrochem 16:1975–1982
16. Manivel A (2011) Anandan. J Solid State Electrochem 15:153–16017. Hillman AR, SkopekMA,Gurman SJ (2011) Phys ChemChemPhys
13:5252–526318. Hillman AR, Skopek MA, Gurman SJ (2010) J Solid State
Electrochem 14:1997–201019. Giorgetti M (2013) ISRNMater Sci 2013:938625. doi:10.1155/2013/
93862520. Giorgetti M, Guadagnini L, Tonelli D, Minicucci M, Aquilanti G
(2012) Phys Chem Chem Phys 14:5527–553721. Giorgetti M, Aquilanti A, Minicucci M (2013) J Phys Conf Ser 430:
01204922. Guadagnini L, Giorgetti M, Tonelli D (2013) J Solid State
Electrochem 17:2805–281423. Di Cicco A, Aquilanti G, Minicucci M, Principi E, Novello N,
Cognigni A, Olivi L (2009) J Phys Conf Ser 190:01204324. Ravel B, Newville M (2005) J Synchrotron Radiat 12:537–
54125. Filipponi A, DiCicco A, Natoli CR (1995) Phys Rev B 52:15122–
1513426. Filipponi A, Di Cicco A (1995) Phys Rev B 52:15135–1514927. Giorgetti M, BerrettoniM, Filipponi A, Kulesza PJ,Marassi R (1997)
Chem Phys Lett 275:108–11228. Giorgetti M, Berrettoni M (2008) Inorg Chem 47:6001–600829. Hedin L, Lundqvist BI (1971) J Phys C Solid State Phys 4:2064–
208330. Krause MO, Oliver JH (1979) J Phys Chem Ref Data 8:329–33831. Shankaran DR, Narayanan SS (1999) Fres J Anal Chem 364:686–
68932. Makowski O, Stroka J, Kulesza PJ, Malik MA, Galus Z (2002) J
Electroanal Chem 532:157–16433. Schwudke D, Stößer R, Scholz F (2000) Electrochem Commun 2:
301–30634. Frank P, Benfatto M, Hedman B, Hogdson KO (2012) Inorg Chem
51:2086–209635. Filipponi A (1995) J Phys: Condens Matter 7:9343–935636. Giorgetti M, Berrettoni M, Smyrl WH (2007) ChemMater 19:5991–
600037. Avila M, Reguera L, Rodriguez-Hernandez J, Balmaseda J, Reguera
E (2008) J Solid State Chem 181:2899–290738. Sharma MK, Aggarwal SK (2013) J Electroanal Chem 705:64–6739. Fazzini S, Nanni D, Ballarin B, Cassani MC, Giorgetti M, Maccato
C, Trapananti A, Aquilanti G, Ibrahim Ahmed S (2012) J Phys ChemC 116:25434–25443
40. Zhang D, Wang K, Sun DC, Xia XH, Chen HY (2003) Chem Mater15:4163–4165
J Solid State Electrochem (2014) 18:965–973 973


