Embed Size (px)
Citation preview
A
oo(4(sAbbttoPa©
KD
1
haog[itg
o
H
0d
Colloids and Surfaces A: Physicochem. Eng. Aspects 306 (2007) 29–39
Binding of cationic surfactants to humic substances
Munehide Ishiguro ∗,1, Wenfeng Tan 2, Luuk K. KoopalLaboratory of Physical Chemistry and Colloid Science, Wageningen University, Dreijenplein 6, 6703 HB Wageningen, The Netherlands
Received 30 September 2006; received in revised form 2 December 2006; accepted 4 December 2006Available online 9 December 2006
bstract
Commercial surfactants are introduced into the environment either through waste products or site-specific contamination. The amphiphilic naturef both surfactants and humic substances (HS) leads to their mutual attraction especially when surfactant and HS are oppositely charged. Bindingf the cationic surfactants dodecyl-pyridinium chloride (DPC) and cetyl- or hexadecyl-pyridinium chloride (CPC) to purified Aldrich humic acidPAHA), Dando humic acid (DHA), Inogashira humic acid (IHA), Laurentian fulvic acid (LFA) and Strichen Bs fulvic acid (SFA) is studied at pH.5–5 at 0.005 M NaCl. For PAHA CPC binding is also studied at pH 5 and 0.1 M NaCl. Measurements with the Mutek Particle Charge DetectorPCD) and poly-DADMAC, a strong cationic polyelectrolyte, are used to determine the charge of the HS samples. PCD measurements with theurfactants reveal that the surfactant–HS complexes reach their iso-electric-point (IEP) before the critical micelle concentration (CMC) is reached.t the IEP the adsorption values (mol/g) of CP+ and DP+ to PAHA are the same, i.e. at the IEP the charge associated with the HS is neutralizedy bound surfactant ions. For the other humic acids (HAs) CPC binding at the CMC corresponds with the charge obtained with poly-DADMAC,ut for the fulvic acid (FA) samples CP(C) adsorption at the IEP is larger than the FA charge. The surfactant–HS complexes flocculate aroundhe IEP. Binding isotherms are obtained using surfactant electrodes. The results for CPC and DPC to the HA samples show a pseudo-plateau nearhe IEP, which is missing in the isotherms to the FA samples. The CP+–PAHA isotherms at 0.005 M and 0.1 M intersect at the IEP. The affinity
+ +
f CP binding to PAHA is larger than that of DP due to the longer aliphatic tail of CPC. The bound amount of DP(C) decreases in the orderAHA � IHA ≈ DHA � LFA ≈ SFA. The results demonstrate that cationic surfactant binding to HS is due both to electrostatic and hydrophobicttraction and that the fate of HS in aqueous environmental systems can be strongly affected by cationic surfactants. 2006 Elsevier B.V. All rights reserved.ulvic
eic
apei
eywords: Surfactant binding isotherms; Cationic surfactants; Humic acid; FADMAC
. Introduction
Natural organic particles can be divided in fulvic acids (FA),umic acids (HA) and humins. The solubility discriminates HAnd FA from humins (insoluble). FA and HA are soluble in aque-us solution in a wide pH range and both contain acid functionalroups that can dissociate and give the particle a negative charge1]. Together FA and HA are denoted as humic substances (HS)
n this paper. The molar mass of FA particles is much smallerhan that of HA particles and at a given pH the charge/g of FA isenerally higher than that of HA. HA particles are often consid-∗ Corresponding author. Tel.: +81 86 251 8875; fax: +81 86 251 8875.E-mail address: [email protected] (M. Ishiguro).
1 On leave of absence from: Faculty of Environmental Science and Technol-gy, Okayama University, 3-1-1, Tsushima-naka, Okayama 700 8530, Japan.2 On leave of absence from: College of Resources and Environment,uazhong Agricultural University, Wuhan 430070, China.
imcHcootm[
927-7757/$ – see front matter © 2006 Elsevier B.V. All rights reserved.oi:10.1016/j.colsurfa.2006.12.024
acid; Iso-electric-point; Surfactant electrodes; Particle charge detector; Poly-
red to be polydisperse and of amphiphilic nature [2,3]. Recentnsights [4] also point to a micellar type of particle structureomposed of sub-units.
Due to their solubility, HSs can easily be transported in thequeous phase through soil and other natural waters and theylay an important role in the distribution of contaminants in thenvironment [5]. Contaminant binding to HS may significantlympact the total and free contaminant concentrations presentn surface and ground waters as well as in soils. Contaminant
obility in natural waters can be reduced by binding to pre-ipitated HS or it can be increased by binding to dissolved HS.owever, under certain conditions contaminants may also floc-
ulate/precipitate dissolved HS and this will reduce the mobilityf the complex. The extent of flocculation/precipitation depends
n the conditions, the type of HS and the nature of the con-aminant. The interaction of contaminants with dissolved HSay also affect the binding of both to soil mineral particles6–11].
3 : Phy
ccpcum[aatwiiot
tcattftaaHmmaTw
2
tmdcoopc
aatwaacsi
fPaVtwhrK
ftaori
btliN
nasmft
TC
N
PDILS
0 M. Ishiguro et al. / Colloids and Surfaces A
Surfactants can be considered as a special class of organicontaminants that may affect the fate of HS [12]. Surfactantsan be introduced into the environment by wastewater discharge,oint-charge pollution [13], deliberate action, e.g. to remediateontaminants from soil or from ground water [14,15] and nat-ral secretion from aquatic plants [16]. Wastewater treatmentay remove some of the surfactants, yet detectable levels persist
17–19]. Previous studies performed on surfactant–HA inter-ctions can be found in Refs. [12,20–25]. Koopal et al. [12]nd Adou et al. [24] mention that humic acid is removed fromhe aqueous phase by forming neutral hydrophobic complexesith cationic surfactants. Only two studies describe binding
sotherms of cationic surfactants to HSs [12,25]. In general, its well known that interactions between ionic surfactants andppositely charged polyelectrolytes are quite strong [26,27] andhat phase separation may occur [28].
The objective of this study is to investigate the binding ofhe cationic surfactants dodecyl-pyridinium chloride (DPC) andetyl- or hexadecyl-pyridinium chloride (CPC) to a range of HSst a given pH and salt concentration. The work is an extension ofhe studies of Koopal et al. [12] and Yee et al. [25] with the aimo assess the importance of cationic surfactant–HS interactionsor a range of humic substances at relatively low pH. In ordero investigate the binding two complementary titration methodsre used. With the particle charge detector method [29,30] themount of surfactant that is needed to neutralize the charge of aS is measured. With the second method a surfactant selectiveembrane electrode [12,25,31–36] is used to detect the freeonomer surfactant concentration after each surfactant addition
nd this allows the calculation of the complete binding isotherm.his method was also applied in the previous study [12] but heree use more sensitive surfactant electrodes.
. Materials
Aldrich humic acid (Aldrich H1, 675-2) is purified by usinghe method described by Vermeer et al. [10], except for the treat-
ent with the Dowex resin. The final freeze-dried product isenoted as PAHA (purified Aldrich HA). Aldrich humic acid ishosen because it is easily available and studies [37,38] of vari-
us humic acids including Aldrich have shown that ion bindingf PAHA is similar to that of other humic acids. Potentiometricroton titration results of PAHA can be found in [10,39]. Table 1ontains some relevant data.c(S
able 1haracterization of the HSs used in this study
ame C (%) O (%) H (%) N (%) Particle mass (D
AHA 55.8 38.9 4.6 0.6 20,000HA 53.0 36.9 5.3 4.5 –
HA 54.8 36.6 4.3 4.0 –FA 45.1 49.7 4.1 – 9,000FA 43 – – – 680
a Approximate value derived from proton titrations reported in the literature (*estimb Measured in this study, see text.
sicochem. Eng. Aspects 306 (2007) 29–39
Dando humic acid (DHA) and Inogashira humic acid (IHA)re supplied by the Japanese Humic Substance Society (JHSS)nd they are isolated according to the method recommended byhe International Humic Substance Society (IHSS) [40]. DHAas extracted from brown forest soil in Dando, Aichi Prefecture,
nd has an ash content of 0.67%. IHA was extracted from thendo soil in Inogashira, Shizuoka Prefecture, and has an ashontent of 0.49%. Both samples were obtained from A-horizons,ome data are presented in Table 1, more details can be foundn [41].
Laurentian fulvic acid (LFA) was obtained from C.H. Lang-ord and is obtained from a sample of podzol (Laurentian Forestreserve) near Quebec, Canada. The preparation and a first char-cterization of the sample have been reported by Wang et al. [42];ermeer and Koopal [11] have provided a further characteriza-
ion. The weight average molar mass of LFA is about 10 kDa,hich is high for a FA. Potentiometric proton titrations of LFAave been carried out by Avena and Koopal [39], however, theseesults deviate seriously from those reported by Vermeer andoopal [11]. The data are summarized in Table 1.
Strichen Bs fulvic acid (SFA) is extracted from a Bs horizonrom a peaty podzol (Strichen Soil Association, Scotland) usinghe methods recommended by the IHSS [40]. The preparationnd characterization (including potentiometric proton titrations)f SFA has been reported by Filius et al. [43]. Weng et al. [44]eport a molar mass of 683 Da. The relevant data are summarizedn Table 1.
The Stock solutions of the HAs are made in measuring flasksy dissolving the HAs at pH 10.5, shaking for at least 6 h andhen bringing the pH to neutral and the volume to the appropriateevel. Stock solutions of the FAs are made by dissolving the FAsn pure water, shaking for at least 2 h and then fixing the volume.aCl is added just before each experiment.The n-dodecyl-pyridinium chloride (DPC; >98% purity) and
-hexadecyl- or cetyl-pyridinium chloride (CPC; >98% purity)re supplied by Sigma–Aldrich and used as received. The twourfactants display a linear aliphatic tail. From the absence of ainimum in the plots of the surface tension of the air–water inter-
ace against the log surfactant concentration it is concluded thathe samples contain no or very little surface-active impurities.
A solution (20 wt.%, density 1.04 g/cm3) of the strongationic polymer poly-diallyldimethylammonium chloridepoly-DADMAC), molar mass 162 kDa, was obtained fromigma–Aldrich.
a) Charged groups (mmol/g) (pH ≈ 5; I ≈ 0.005 M) References
H-titra Poly-DADMACb CPCb
1.8 1.93 2.05 [10,39]1.9* 2.06 2.04 [41]2.2* 2.40 2.50 [41]1.6–4.3* 2.34 3.12 [11,39,42]3.5 3.13 4.41 [44,45]
ated as 0.5 times the COOH-groups).

A: Ph
fit1g
3
3m
ctctiitmteKopioabwcntDstsrpaaow
3
stb[mtuero
fteftmlcppsotm>
3
reS
wcictsAecr
3
scsawbdnapt
M. Ishiguro et al. / Colloids and Surfaces
Water used for the experiments was twice de-ionized andltered through an activated carbon column and a micro fil-
er (EASYpure UV), that resulted in a resistance greater than8.3 M� cm. The inorganic chemicals used were of analyticalrade quality (obtained from Merck or Sigma–Aldrich).
. Methods
.1. Particle charge detector/iso-electric-pointeasurements
Iso-electric-points (IEP) of HS complexes with large organications can be measured using a “Mutek Particle Charge Detec-or” (PCD03). This apparatus acts by moving a piston inside aylindrical sample cell up and down and this produces an elec-rokinetic signal depending on the charge of the particles presentn the cell. Most investigators assume that the signal is a stream-ng potential of particles that are bound to the walls of cell andhe piston [29,30], but it is also possible that the particles and theobile counterions in the solution move with different veloci-
ies [45]. The method has been discussed in relation to otherlectrokinetic measurements by Barron et al. [46]. Dentel andingery [29] and Walker et al. [30] provide quantitative modelsf the technique based on the assumption that the particles com-letely cover the walls of piston and cell. In any case the methods well suited to measure the charge sign of colloidal particlesr complexes and in the case of titrations with a complexinggent of opposite charge the charge reversal point or IEP cane precisely detected. The method is, for instance, popular inater purification practice to measure the amount of polymeric
ationic flocculants needed to neutralize the charge of dissolvedatural organic matter [47]. Here the PDC03 is used to determinehe charge of the HS samples at the given conditions with poly-ADMAC [47] and to determine the IEP of the HS–cationic
urfactant complexes. With the PDC03 equipment a titrant solu-ion is added with an automatic titrator (Mutek PCD-Two) inteps of 0.02 mL into 25 mL of HS solution that is placed in theeaction vessel and the potential (mV) of the titrant–HS com-lexes is recorded together with the solution pH. The rate ofddition is 30 s/step, but in some titrations the first 15 steps aredded at 5 s/step. The titrations for DHA and IHA were carriedut with small amounts of HA, because the amounts availableere small.
.2. Surfactant electrode
The equilibrium concentration of surfactant monomers inolution is determined with a membrane electrode that is selec-ive for cationic surfactants. This use of surfactant electrodes hasecome routine for the study of polymer–surfactant interactions31,33,34] and is also deemed the most suitable for our experi-ental system. The electrode membrane is prepared according to
he procedure described in [25]. This type of membrane has been
sed before in several surfactant studies (e.g. [25,32,35,36]). Thelectrode is made by mounting the membrane (polyvinylchlo-ide (PVC) with Elvarroy 742 (Du Pont) plasticizer) on the topf a PVC tube with a cross section of 11 mm by using tetrahydro-sDii
ysicochem. Eng. Aspects 306 (2007) 29–39 31
uran. The tube is filled with the reference solution that containshe surfactant and NaCl. The surfactant concentration in the ref-rence solution, C0S, is 2.5 × 10⁻⁴ M for DPC and 2.5 × 10⁻⁵ Mor CPC. The values of C0S for the two surfactants are lower thanheir critical micelle concentrations (CMCs). This facilitates the
easurement of low surfactant concentrations and minimizeseakage through the membrane. The reference solution is inontact with an Ag/AgCl electrode to be able to measure theotential. The Ag/AgCl electrode is reversible, not sensitive toolarization effects and it gives a stable reading if the internalolution contains a fixed concentration of NaCl (C0N; 0.005 Mr 0.1 M). The concentration C0N is made the same as that inhe samples to minimize the liquid junction potential over the
embrane. The surfactant electrode assembly has a resistance10 M�.
.3. Electrochemical cell
The surfactant electrode potential (EMF in mV) is measuredelative to a commercial Ag/AgCl (3.3 mol/L KCl) referencelectrode equipped with a ceramic plug (Schott, Type B2920).chematically the set-up is as follows:
{Internal Ag/AgCl electrode|reference solution (C0S, C0N)|selective membrane}|test solution (CS, CN)|Ag/AgCl (3.3 M KCl) reference electrode|
here CS and CN are respectively the surfactant and NaCl con-entration in the test solution. The blank or the sample solutions contained in a double walled glass cell of 100 mL (Schott)overed with a lid that holds the electrodes and, in the case ofitrations, the burette tips. Because of the high resistance of theurfactant electrode all cables are screened (co-ax), the internalg/AgCl electrode is connected to earth, the entire cell is cov-
red with aluminum foil that is also connected to earth (Faradayage) and a high impedance input voltmeter is used for the EMFeadings.
.4. Cell calibration
The calibration of the electrochemical cell is done in twoteps. At relatively high surfactant concentrations the electro-hemical cell is calibrated by titrating a concentrated surfactantolution into the reaction cell containing 50 mL of solution withgiven NaCl concentration and pH ≈ 5. Surfactant additionsere made using a motorized piston burette (Schott T100; 5 mLurette, minimum dosage of 2 �L) and an automated titrationevice (Schott TR250). The solution was mixed with a mag-etic stirrer. A mixing time of 1–3 min was allowed after eachliquot addition. The stirring was then stopped and the electrodeotential was recorded. The reaction cell was kept at a constantemperature of 25 ± 0.5 ◦C, and maintained in an argon atmo-
phere. In the low concentration range (10−7 M to 10−5 M forPC and 2.5 × 10⁻⁸ M to 10−6 M for CPC) the titration methods unsatisfactory and the calibration of the cell is done by refresh-ng a given solution repeatedly until the cell and electrode walls
3 : Physicochem. Eng. Aspects 306 (2007) 29–39
atapa
ivcmT
3
tcrsAlckstplmse
4
4
HNPitDpsstiTHtTFtttcg
Fic
vLascwtitfcralo
4
odfusrtTarts
2 M. Ishiguro et al. / Colloids and Surfaces A
re equilibrated at the given concentration and the EMF value ofhe cell becomes constant. This requires multiple times rinsingt each surfactant concentration for a good result. Also with thisrocedure the cell is kept at a constant temperature of 25 ± 0.5 ◦Cnd argon atmosphere is applied.
An electrochemical cell that functions properly yields accord-ng to the Nernst equation a straight calibration line (EMF in mVersus the logarithm of the surfactant concentration) below theritical micelle concentration (CMC) of the surfactant. Blankseasured should have a correlation coefficient of at least 0.990.he data presented in this study adhere to these criteria.
.5. Binding isotherms
Binding isotherms are generated by employing the surfac-ant titration protocol in the presence of HS. However, in thisase, after each aliquot addition, the electrode potentials areecorded at time intervals of 20 s until the electrode potential istable with respect to time (equilibration criterion ≤5 mV/min).
maximum equilibration time of 10 min is allowed if this equi-ibration criterion is not met. The quantity of free surfactant isalculated from the equilibrium monomer concentration and thenown total solution volume. Binding to HS is determined byubtracting the free amount from the quantity initially added tohe solution. Accordingly, the binding isotherm is obtained. TheH was also recorded. In order to get accurate EMF readings atow surfactant concentrations, the surfactant electrode and cell
ust be well washed with blank solution before the titrationtarts (EMF � EMF of lowest surfactant concentration in blankxperiment).
. Results
.1. HS titration with poly-DADMAC
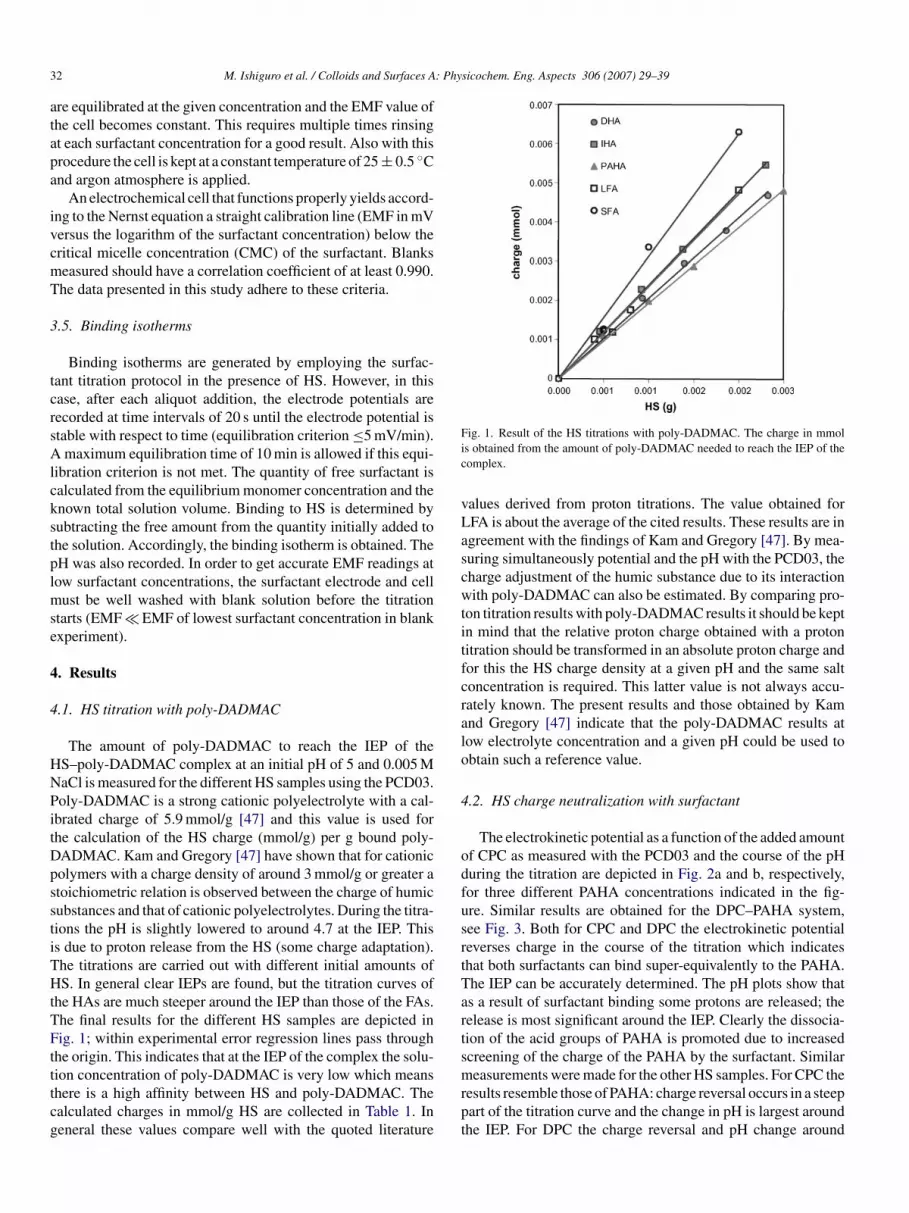
The amount of poly-DADMAC to reach the IEP of theS–poly-DADMAC complex at an initial pH of 5 and 0.005 MaCl is measured for the different HS samples using the PCD03.oly-DADMAC is a strong cationic polyelectrolyte with a cal-
brated charge of 5.9 mmol/g [47] and this value is used forhe calculation of the HS charge (mmol/g) per g bound poly-ADMAC. Kam and Gregory [47] have shown that for cationicolymers with a charge density of around 3 mmol/g or greater atoichiometric relation is observed between the charge of humicubstances and that of cationic polyelectrolytes. During the titra-ions the pH is slightly lowered to around 4.7 at the IEP. Thiss due to proton release from the HS (some charge adaptation).he titrations are carried out with different initial amounts ofS. In general clear IEPs are found, but the titration curves of
he HAs are much steeper around the IEP than those of the FAs.he final results for the different HS samples are depicted inig. 1; within experimental error regression lines pass through
he origin. This indicates that at the IEP of the complex the solu-
ion concentration of poly-DADMAC is very low which meanshere is a high affinity between HS and poly-DADMAC. Thealculated charges in mmol/g HS are collected in Table 1. Ineneral these values compare well with the quoted literaturemrpt
ig. 1. Result of the HS titrations with poly-DADMAC. The charge in mmols obtained from the amount of poly-DADMAC needed to reach the IEP of theomplex.
alues derived from proton titrations. The value obtained forFA is about the average of the cited results. These results are ingreement with the findings of Kam and Gregory [47]. By mea-uring simultaneously potential and the pH with the PCD03, theharge adjustment of the humic substance due to its interactionith poly-DADMAC can also be estimated. By comparing pro-
on titration results with poly-DADMAC results it should be keptn mind that the relative proton charge obtained with a protonitration should be transformed in an absolute proton charge andor this the HS charge density at a given pH and the same saltoncentration is required. This latter value is not always accu-ately known. The present results and those obtained by Kamnd Gregory [47] indicate that the poly-DADMAC results atow electrolyte concentration and a given pH could be used tobtain such a reference value.
.2. HS charge neutralization with surfactant
The electrokinetic potential as a function of the added amountf CPC as measured with the PCD03 and the course of the pHuring the titration are depicted in Fig. 2a and b, respectively,or three different PAHA concentrations indicated in the fig-re. Similar results are obtained for the DPC–PAHA system,ee Fig. 3. Both for CPC and DPC the electrokinetic potentialeverses charge in the course of the titration which indicateshat both surfactants can bind super-equivalently to the PAHA.he IEP can be accurately determined. The pH plots show thats a result of surfactant binding some protons are released; theelease is most significant around the IEP. Clearly the dissocia-ion of the acid groups of PAHA is promoted due to increasedcreening of the charge of the PAHA by the surfactant. Similar
easurements were made for the other HS samples. For CPC theesults resemble those of PAHA: charge reversal occurs in a steepart of the titration curve and the change in pH is largest aroundhe IEP. For DPC the charge reversal and pH change around

M. Ishiguro et al. / Colloids and Surfaces A: Physicochem. Eng. Aspects 306 (2007) 29–39 33
Fa
tg
hFioitbtAtihMctnr
Fa
la
lil0.035 mmol. The latter value corresponds to 1.4 mmol/L DPCin solution. Most likely also DP+ binds with a 1:1 stoichiom-etry to the charged groups of PAHA. For SFA the DPC slope(4.49 mmol/g) is also close to that of CPC, but for DHA, IHA
ig. 2. PCD-potential of the CPC–PAHA complex (a) and the solution pH (b)s a function of the added amount of CPC at 0.005 M and 0.1 M salt.
he IEP are more gradual for the other HS than for PAHA. Theradual slopes make the measured IEP’s less accurate.
The amounts of CPC and DPC needed to reach the IEP of theumics are plotted in Fig. 4 as a function of the HS concentration.or CPC the dependence is linear and the lines pass within exper-
mental error through the origin. Therefore, at the IEP the amountf CPC in the solution is negligible (≤0.002 mmol, correspond-ng to a solution concentration ≤0.08 mmol/L) as comparedo the bound amount. This is indicative for the high affinityetween HS samples and CPC. The slopes of the lines representhe amounts of bound surfactant at the IEP in mmol/g of HS.ssuming a 1:1 stoichiometry these values can be interpreted as
he charge in mmol/g HS at the given pH and they are includedn Table 1. For the HA samples these charge values are slightlyigher than those observed with poly-DADMAC (see Table 1).ost likely the reason for this is that upon surfactant binding the
harge adaptation is a bit larger (better screening). However, forhe two FA samples charge values measured with CPC are sig-ificantly larger than those measured with poly-DADMAC. Theeason for this difference with HA is most likely the relatively
Fc
ig. 3. PCD-potential of the DPC–PAHA complex (a) and the solution pH (b)s a function of the added amount of CPC at 0.005 M salt.
ow affinity between FA and CP+, so that FA–CP(C) complexest the IEP contain some neutral CPC as well.
The results for DPC can also be approximated as straightines, but the scatter is larger than for CPC and the lines haventercepts above the origin. For PAHA the slope of the DPCine is very similar to that found for CPC and the intercept is
ig. 4. Amount of surfactant needed to reach the IEP of the HS–surfactantomplex. The samples and surfactants are indicated in the figure.

3 : Physicochem. Eng. Aspects 306 (2007) 29–39
atH4h(iDaestctsiniTIpahioWli
siefl
4
dltoAmtccttccatww5sa
tTd
ctrcw0sttPdcusctAc
PoNa3
4 M. Ishiguro et al. / Colloids and Surfaces A
nd LFA the slopes for DPC (4.6, 3.5, and 7.4 mmol/g, respec-ively) are substantially larger than with CPC and for all theseSs the intercept is around 0.12 mmol, which corresponds with.8 mmol/L DPC in solution. This value is three to four timesigher than that for DPC–PAHA. Two conclusions can be drawn:1) the DP+–PAHA affinity is relatively high and (2) the affin-ty of CP+ for the HS samples is much higher than that ofP+. The latter can be explained by hydrophobic attraction: the
liphatic tails of the surfactants are removed from an aqueousnvironment to the much more hydrophobic environment of theurfactant–HS complex at the IEP and the longer the aliphaticail is the stronger is this hydrophobic attraction. The first con-lusion explains that the slope for DPC–PAHA agrees well withhat of CPC–PAHA, whereas for the other HSs DPC leads to ateeper slope. The impression that with DPC a higher HS charges found at the IEP than with CPC must be an artifact. There iso reason to believe that the screening of the HS charge by DP+
s better than that by CP+ when the DP+–HS affinity is weaker.herefore, we have to conclude that, except for PAHA, at the
EP some chloride ions must be included in the DP(C)–HS com-lexes. Chloride inclusion is most likely caused by the fact thatround and above the IEP the DPC concentration is relativelyigh and that some DPC is bound in its neutral form (the behav-or of alkylpyridinium surfactants often shows some dependencen the type of counterion, indicating incomplete dissociation).ith CPC the affinity for HAs is so high that there is hardly CP+
eft in solution and even less neutral CPC. Therefore, the effects insignificant for CPC.
When the surfactant titrations are stopped at the IEP and theample is left at rest precipitation/flocculation of the complexess observed. This is in agreement with the observations by Adout al. [24] and Koopal et al. [12]. For the DP(C)–LFA complexesocculation already occurred during the surfactant titration.
.3. Calibration lines for CPC
The measured calibration lines of CPC at 0.005 M NaCl areepicted in Fig. 5. The calibrations are performed from veryow CPC concentrations (10−8 M) to relatively high concentra-ions (10−3 M) beyond the CMC. Upon the gradual increasef the monomer surfactant concentration, the CMC is reached.t this concentration, the chemical potential of the surfactantonomers becomes practically constant due to micelle forma-
ion, and therefore, the EMF response of the electrode remainsonstant. This corresponds to the small plateau at the end of thealibration lines. The basic property of the calibration curves isheir linear response as a function of the logarithm of the concen-ration (up to the CMC). Calibrations 1 and 4 cover a surfactantoncentration range from 10−8 M to 10−3 M. Calibration 1 isarried out before contact of the cell and electrodes with PAHAnd calibration 4 after a titration with PAHA and subsequenthorough cleaning of the cell and electrodes by excessive rinsingith pure water. The linear regions of both calibrations coincide
ithin experimental error and the slopes are in the range of4–56 mV. These values are close to the theoretical Nernstianlope of 59.2 mV and indicate that the electrodes work well overlarge concentration range. The position of the kink represents[mal
Fig. 5. CPC calibration curves for CPC–PAHA system at 0.005 M NaCl.
he CMC of CPC at 0.005 M NaCl (2.8 × 10⁻⁴ ± 5 × 10⁻⁶ M).he CMC value is in line with the trend of the CMC values atifferent ionic strength reported by Van Os et al. [48].
Calibration curves 2 and 3 are obtained by titration afterontact with PAHA and only a few rinsing steps. They are sys-ematically shifted somewhat (up to 10 mV at 10−4 M CPC) withespect to calibrations 1 and 4. The slopes of these calibrationurves are slightly lower (54–55 mV/decade) than those of theell cleaned electrode but the regression coefficients are above.995. This is most likely due to some adsorption of PAHA at theurfactant electrode. The effect of PAHA adsorption on the elec-rode is also visible in the potential at which the CMC is reached;his potential gradually decreases after repeated contact withAHA. However, the CMC itself is not affected. The systematicifference between the two sets of calibrations indicates that thealibration line measured after contact with PAHA should besed for the calculation of the CPC adsorption. Because of themall uncertainty range of the calibration curves measured afterontact with PAHA a small parallel shift (<3 mV) of the calibra-ion curve is allowed for the calculation of the binding curves.s additional calibration point for this calculation the IEP (ads;
onc. range) measured with the PCD03 can be used.The CPC calibration curves at 0.1 M NaCl after contact with
AHA and a few times rinsing with pure water have slopesf only 38.3–41.9 mV which is considerably lower than theernst value of 59 mV. Nevertheless, the regression coefficients
re still within the limits and also the value of the CMC of.5 × 10−5 M, is in good agreement with the value quoted in
−5
48], 3.8 × 10 M. The small value of the slope indicates auch stronger effect of PAHA on the membrane electrode thant 0.005 M NaCl. The reason for this is not clear. For the calcu-ation of the CPC binding isotherm at 0.1 M NaCl we have used

M. Ishiguro et al. / Colloids and Surfaces A: Physicochem. Eng. Aspects 306 (2007) 29–39 35
Fc
tP
4
iertftti5
FTb
vcCiiiAco
4
0bodetcmesmesfacidDca
ig. 6. DPC calibration curves for DPC–HA systems at 0.005 M NaCl: (a) entireoncentration range; (b) detail at relatively high DPC concentration.
he calibration line that is measured directly after contact withAHA.
.4. Calibration lines for DPC
The calibration lines of DPC in 0.005 M NaCl are collectedn Fig. 6. The behavior is very similar as for CPC. A differ-nce with the CPC calibration lines is that the same EMF iseached at higher surfactant concentrations (about a decade);his means that the electrode is more sensitive for CPC thanor DPC. Also for DPC the slope of the lines and the EMF at
he CMC are somewhat decreased after contact with PAHA, buthe value of the CMC is not affected. The slopes of the cal-bration lines range from 57.9 mV for the “pure electrode” to4.8 mV for the electrode after contact with several HSs; allNl(r
ig. 7. Blank and titration curves for the CPC–PAHA system at 0.005 M NaCl.he titration curves are measured 0.25 g PAHA/L and 0.1 g PAHA/L. The cali-ration curve after contact with PAHA is depicted.
alues are close to the theoretical slope of 59.2 mV. The longalibration gives a good regression line from 1 × 10⁻⁷ M to theMC at 1.52 × 10⁻² ± 5 × 10⁻⁴ M DPC. This CMC value is
n line with the trend of the CMC values of DPC at differentonic strength reported in [49]. For the calculation of the bind-ng curves the same procedure is followed as described for CPC.s additional calibration point we have used the solution con-
entration of DPC at the IEP (Fig. 4) together with the chargesf the HS as measured with poly-DADMAC and CPC.
.5. Binding of CPC and DPC
Two typical examples of a titration of PAHA with CPC at.005 M salt and pH ≈ 5 are depicted in Fig. 7. The differenceetween the two curves is caused by using different amountsf PAHA. For sake of comparison also the blank measuredirectly after the binding experiments is plotted. The differ-nce between the blank and the PAHA titration is caused byhe adsorption. The curves in the presence of PAHA start atell EMF values that are negative and that correspond with freeonomer concentrations that are around 10−8 M or lower. How-
ver, at these very low concentrations the electrode signal is notelective any more. Clearly adsorption takes place (total addedonomer concentration � free monomer concentration), but the
quilibrium concentration at which this happens cannot be mea-ured accurately. Once the cell EMF values start to increase, theree monomer concentration can be established and the boundmount can be calculated as a function of the monomer con-entration. The situation is similar for CPC at 0.1 M salt. Alson the case of DPC a similar behavior is found, see Fig. 8 thatepicts the raw results for the HA samples. Note that blank andPC–HA titration curves are much closer than for CPC. The
onsequence is that the calculated binding isotherms for DPCre less accurate than those of CPC.
The CP+–PAHA binding isotherms at 0.005 M and 0.1 M
aCl and pH 4.5–5 are depicted in Fig. 9 as single and doubleogarithmic plot. The various symbols at 0.005 M salt in panela) indicate repeated experiments and show that there is a goodeproducibility except at concentrations very close to the CMC.

36 M. Ishiguro et al. / Colloids and Surfaces A: Physicochem. Eng. Aspects 306 (2007) 29–39
FN
H0wbPcctadicbpwwTibsamttbotttsiwPapaita
Fig. 9. Binding isotherms of CPC to PAHA at 0.005 M and 0.1 M NaCl (closedsymbols) and the adjoining proton release (open symbols). Panel (a) singlelo
itbtpttk
ig. 8. Blank and titration curves for the DPC–HA (0.1 g/L) systems at 0.005 MaCl. The calibration curve after contact with PAHA is depicted.
ere the curves measured at 0.1 g/L PAHA differ from that at.25 g/L. The steep part of the curve at 0.25 g/L nicely matchesith the CMC of CPC, but the curves at 0.1 g/L rise steeplyefore the CMC. We believe that this is an artifact that is due toAHA interaction with the electrode. This will occur at all PAHAoncentrations, but with more PAHA present the error in the cal-ulated ‘bound amount’ is much less. The adsorbed amount inhe IEP (2.03 mmol/g; ≤0.08 mmol/L) at pH 4.5 and 0.005 Mnd 0.1 M NaCl measured with the PCD03 is indicated with aotted line. In the double logarithmic plot the duplicate exper-ments were left out for sake of clarity, only the more accurateurve measured at the high PAHA concentration is shown. Foroth salt concentrations the bound amount rises gradually till aseudo-plateau around the adsorption value of the IEP and some-hat before the CMC. For 0.1 M salt the pseudo-plateau is veryeak, but it can be clearly seen in the double logarithmic plot.his indicates that around the IEP the electrostatic attraction van-
shes and becomes an electrostatic repulsion. The fact that theinding still progresses is due to the hydrophobic attraction. Theteep increase of the isotherm very near the CMC is an artifactnd indicates that the CMC of the surfactant is reached: addedonomers are bound in micelles formed in solution. The start of
he isotherm at 0.1 M NaCl occurs at a higher surfactant concen-ration than that at 0.005 M because the electrostatic attractionetween PAHA and CP+ is screened better. After charge reversalf the CP+–PAHA complex the electrostatic repulsion betweenhe surfactant molecules in the complex is screened better andhis leads to a stronger adsorption at 0.1 M. This explains thathe two isotherms intersect and that the intersection point corre-ponds with the IEP of the complex. A close agreement betweenntersection point of the isotherms and the IEP will only occurhen there is no specific binding of salt ions to the complex. For
AHA–CP+ this is indeed the case because the IEP’s measuredt 0.005 M and 0.1 M salt coincided. In the double logarithmiclot it can be observed that the initial slope of the binding curve
t 0.005 M is close to unity (Henry slope), whereas that at 0.1 Ms larger than unity. This indicates that at low salt concentra-ion the binding is fairly ideal. At high salt concentration event the lowest measured concentration cooperativity in the bind-taat
ogarithmic scale and panel (b) double log scale. In panel (a) the reproducibilityf the isotherm in 0.005 M is also shown.
ng is already important. At high salt concentration not onlyhe electrostatic attraction between PAHA and CP+ is screened,ut also the lateral electrostatic repulsion between the surfac-ant molecules and this makes the hydrophobic attraction moreronounced. The ideality of the curve at 0.005 M extends upo about 0.2 mol/kg. This is a pseudo-ideality that results fromhe compensation of the heterogeneity of the binding by someind of structurally induced lateral attraction at very low concen-rations. At higher concentrations the decrease in electrostatic
ttraction is overcompensated by the increase in hydrophobicttraction and this leads to a slope of the isotherm slightly largerhan unity (positive cooperativity).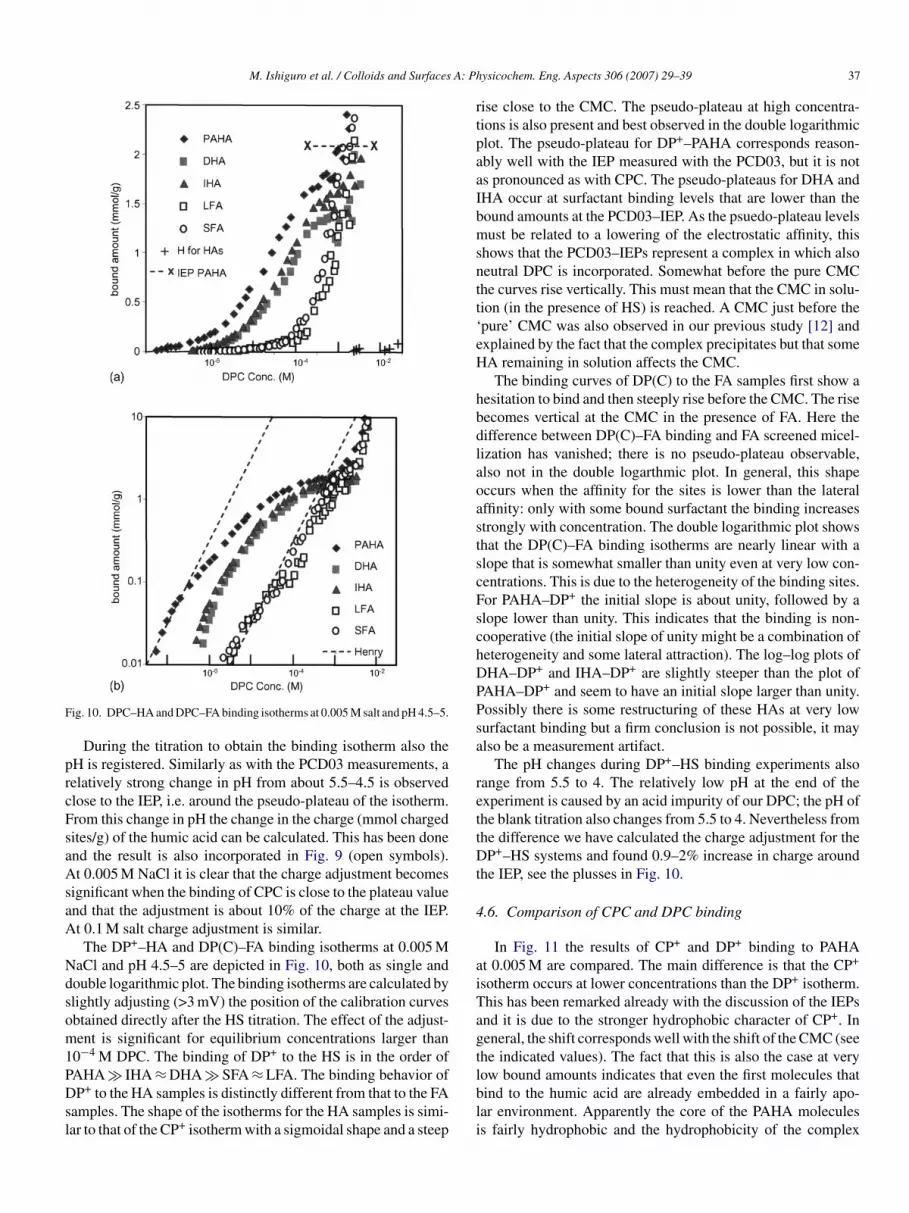
M. Ishiguro et al. / Colloids and Surfaces A: Ph
F
prcFsaAsaA
Ndsom1PDsl
rtpaaIbmsntt‘eH
hbdlaoastscFschDPPsa
rettDt
4
aiTagt
ig. 10. DPC–HA and DPC–FA binding isotherms at 0.005 M salt and pH 4.5–5.
During the titration to obtain the binding isotherm also theH is registered. Similarly as with the PCD03 measurements, aelatively strong change in pH from about 5.5–4.5 is observedlose to the IEP, i.e. around the pseudo-plateau of the isotherm.rom this change in pH the change in the charge (mmol chargedites/g) of the humic acid can be calculated. This has been donend the result is also incorporated in Fig. 9 (open symbols).t 0.005 M NaCl it is clear that the charge adjustment becomes
ignificant when the binding of CPC is close to the plateau valuend that the adjustment is about 10% of the charge at the IEP.t 0.1 M salt charge adjustment is similar.The DP+–HA and DP(C)–FA binding isotherms at 0.005 M
aCl and pH 4.5–5 are depicted in Fig. 10, both as single andouble logarithmic plot. The binding isotherms are calculated bylightly adjusting (>3 mV) the position of the calibration curvesbtained directly after the HS titration. The effect of the adjust-ent is significant for equilibrium concentrations larger than
0−4 M DPC. The binding of DP+ to the HS is in the order of
AHA � IHA ≈ DHA � SFA ≈ LFA. The binding behavior ofP+ to the HA samples is distinctly different from that to the FAamples. The shape of the isotherms for the HA samples is simi-ar to that of the CP+ isotherm with a sigmoidal shape and a steep
lbli
ysicochem. Eng. Aspects 306 (2007) 29–39 37
ise close to the CMC. The pseudo-plateau at high concentra-ions is also present and best observed in the double logarithmiclot. The pseudo-plateau for DP+–PAHA corresponds reason-bly well with the IEP measured with the PCD03, but it is nots pronounced as with CPC. The pseudo-plateaus for DHA andHA occur at surfactant binding levels that are lower than theound amounts at the PCD03–IEP. As the psuedo-plateau levelsust be related to a lowering of the electrostatic affinity, this
hows that the PCD03–IEPs represent a complex in which alsoeutral DPC is incorporated. Somewhat before the pure CMChe curves rise vertically. This must mean that the CMC in solu-ion (in the presence of HS) is reached. A CMC just before thepure’ CMC was also observed in our previous study [12] andxplained by the fact that the complex precipitates but that someA remaining in solution affects the CMC.The binding curves of DP(C) to the FA samples first show a
esitation to bind and then steeply rise before the CMC. The riseecomes vertical at the CMC in the presence of FA. Here theifference between DP(C)–FA binding and FA screened micel-ization has vanished; there is no pseudo-plateau observable,lso not in the double logarthmic plot. In general, this shapeccurs when the affinity for the sites is lower than the lateralffinity: only with some bound surfactant the binding increasestrongly with concentration. The double logarithmic plot showshat the DP(C)–FA binding isotherms are nearly linear with alope that is somewhat smaller than unity even at very low con-entrations. This is due to the heterogeneity of the binding sites.or PAHA–DP+ the initial slope is about unity, followed by alope lower than unity. This indicates that the binding is non-ooperative (the initial slope of unity might be a combination ofeterogeneity and some lateral attraction). The log–log plots ofHA–DP+ and IHA–DP+ are slightly steeper than the plot of
AHA–DP+ and seem to have an initial slope larger than unity.ossibly there is some restructuring of these HAs at very lowurfactant binding but a firm conclusion is not possible, it maylso be a measurement artifact.
The pH changes during DP+–HS binding experiments alsoange from 5.5 to 4. The relatively low pH at the end of thexperiment is caused by an acid impurity of our DPC; the pH ofhe blank titration also changes from 5.5 to 4. Nevertheless fromhe difference we have calculated the charge adjustment for theP+–HS systems and found 0.9–2% increase in charge around
he IEP, see the plusses in Fig. 10.
.6. Comparison of CPC and DPC binding
In Fig. 11 the results of CP+ and DP+ binding to PAHAt 0.005 M are compared. The main difference is that the CP+
sotherm occurs at lower concentrations than the DP+ isotherm.his has been remarked already with the discussion of the IEPsnd it is due to the stronger hydrophobic character of CP+. Ineneral, the shift corresponds well with the shift of the CMC (seehe indicated values). The fact that this is also the case at very
ow bound amounts indicates that even the first molecules thatind to the humic acid are already embedded in a fairly apo-ar environment. Apparently the core of the PAHA moleculess fairly hydrophobic and the hydrophobicity of the complex
38 M. Ishiguro et al. / Colloids and Surfaces A: Phy
Fs
mwittacrp
5
cIteo
c
Htetitcai
stFRuINPC
taaTtsbtiiiwsootittahid
ccshctwfb
ig. 11. Comparison of the CPC–PAHA and DPC–PAHA isotherms at 0.005 Malt and pH 4.5–5.
ay increase with increased surfactant binding. In both plotse see that at intermediate adsorption values the CP+ isotherm
s slightly steeper than the DP+ isotherm. As mentioned before,he double logarithmic plot indicates that at about 0.2 mol/kghe CP+ binding progresses by positive cooperativity (slope > 1)nd this does not occur for the less hydrophobic DP+. At higheroncentrations the positive cooperativity with CP+ leads to aelatively ‘early saturation’ and therefore a more pronouncedseudo-plateau for CP+ than for DP+.
. Discussion and conclusions
The charge of the complexes of cationic surfactant and HShanges from negative to positive as the bound amount increases.n agreement with the results reported by Koopal et al. [12],his observation indicates that the surfactant ions bind super-
quivalently to HSs. In the present paper this has been workedut in more detail and for different HSs.The bound amount (mmol/g) of CP+ at the IEP of the CP+–HSomplex is a measure of the amount of dissociated groups of the
ab
i
sicochem. Eng. Aspects 306 (2007) 29–39
S. The long chain surfactant CPC is well suited to determinehe charge because the amount of surfactant required to reach thequilibrium concentration in solution is very small compared tohat for the binding. DPC is less suited because here the affin-ty is less, the amount in solution is not negligible compared tohe bound amount and some DPC may become included in theomplex. The binding of CP+ causes an increase of the dissoci-tion of the acid groups of the PAHA by about 10%. The mainncrease occurs around the IEP of the surfactant–HS complex.
At 0.005 M the surfactant electrodes used in this study arelightly affected by contact with HS. For measurements of CPChe resulting uncertainty in the binding isotherms is very small.or DPC this uncertainty affects the top part of the isotherm.eliable binding isotherms of DP(C) have been obtained bysing the independently measured DPC concentration at theEP and the HS charge as reference point. With CPC at 0.1 MaCl the surfactant electrode is strongly affected by contact with
AHA, but the electrode behaved reproducible and the CMC ofPC at 0.1 M NaCl is found at the correct concentration.
At 0.005 M NaCl only a weak cooperativity is detected forhe CP+, but at 0.1 M the CP+–PAHA isotherm shows event very low concentrations positive cooperativity. Koopal etl. [12] also found cooperative binding for CPC at 0.025 M.his cooperativity is directly related to the long aliphatic
ail of CP+. The increase in cooperativity with increasingalt concentration occurs because the electrostatic repulsionetween the bound surfactant molecules decreases. Althoughhe CP+–PAHA isotherm at 0.1 M is steeper than that at 0.005 Mt starts later and both isotherms intersect at the IEP. This behav-or is also caused by the increased screening of the electrostaticnteractions: before the IEP is reached the electrostatic attractionith the surface is weaker and after the IEP the lateral electro-
tatic repulsion is weaker. Although super-equivalent adsorptionccurs due to hydrophobic attraction, the binding progressesnly little after the charge compensation (pseudo-plateau forhe HA samples). The electrostatic repulsion sets in and thencrease in the free surfactant concentration is limited becausehe IEP occurs close to the CMC whereafter normal micelliza-ion is favored. Pseudo-plateaus after charge compensation werelso found in the previous study [12]. We may conclude thatydrophobic attraction is an important contribution to the affin-ty but that the level of adsorption just before the CMC is largelyetermined by the charge of the HS at the given pH.
At 0.005 M NaCl the CP+–PAHA binding occurs at loweroncentrations than that of DP+–PAHA, and the shift of theurves is similar to the shift of the CMCs, even at very lowurfactant concentration. This reveals the importance of theydrophobic attraction for the binding and, moreover, that theore of the PAHA molecules must be of similar hydrophobicityhan the core of the micelles. Also this result is in agreementith that by Koopal et al. [12] for PAHA at 0.025 M and dif-
erent pH values. Yee et al. [25] observed for n-alkylpyridiniumromide binding to HAs at high pH and 0.03 M ionic strengthlso parallel shifts of the isotherms with increasing chain length,
ut did not reveal the behavior at very low concentrations.At 0.005 M NaCl the binding of DP(C) to HSs decreasesn the order of PAHA � IHA ≈ DHA � SFA ≈ LFA. This indi-
A: Ph
cticcseict[F
ibrcsc
hdcstottest
A
PbmfiUs
R
[
[[
[[
[[[[[[[
[
[[
[[
[
[
[[[[
[
[
[
[
[
[[
[
[
[[
[
[
[
M. Ishiguro et al. / Colloids and Surfaces
ates that the hydrophobicity of these HS samples decreases inhe same order. At very low concentrations “Henry-behavior”s observed for DP+ binding to the HA samples, at higheroncentration the hydrophobic attraction increases, but this isounter-balanced by the decrease in electrostatic attraction. Thehape of the DP(C) isotherms to the FAs is distinctly differ-nt from that of the HAs and indicative for a relatively weaknteraction. DP(C) binding to the FA samples reflects at lowoncentrations the heterogeneity of the FA. Close to the CMChe isotherm rises steeply due to cooperative binding. Yee et al.28] observed for DPC very similar differences between HA andA at pH 9.2 and 0.03 M salt.
Similarly as in [12] the CMC of DPC in the presence of HSs somewhat lower than the ‘pure’ CMC. This may be causedy the presence of some HS left in solution after the IEP iseached and phase separation (observed as flocculation of theomplex) occurs. However, this result has to be considered withome reservation because the accuracy of this part of the bindingurve is limited.
Our overall conclusion is that cationic surfactants bind toumic substances even at very low concentrations. This bindingrastically changes the physicochemical characteristics, such as,harge density, hydrophobicity and internal structure of humicubstances. Therefore, even small amounts of cationic surfac-ants in the aquatic environment will affect the nature and fatef the humics. Considering the limited attention paid in litera-ure to cationic surfactant binding to humic substances, it seemshat the role of cationic surfactants in natural systems is under-stimated. A reason for this might be that most of the syntheticurfactants used in domestic life and industries are anionic andhese surfactants do not (strongly) bind to the humics [12].
cknowledgements
The choice of MI to spend his sabbatical at the Laboratory ofhysical Chemistry and Colloid Science is highly appreciatedy LK. The “Wageningen Institute for Environment and Cli-ate Research”, WIMEK, is kindly acknowledged for providingnancial support for WT. We thank Prof. K. Shirahama (Saganiv.) for his advices regarding the preparation of surfactant-
elective membrane and Du Pont for supplying Elvaroy 742.
eferences
[1] L.K. Koopal, T. Saito, J.P. Pinheiro, W.H. van Riemsdijk, Colloid Surf. A265 (2005) 40–54.
[2] T.F. Guetzloff, J.A. Rice, Sci. Total Environ. 152 (1994) 31.[3] S.C.B. Myneni, J.T. Brown, G.A. Martinez, I.W. Meyer, Science 286 (5443)
(1999) 1335–1337.[4] R. Sutton, G. Sposito, Environ. Sci. Technol. 39 (2005) 9009.[5] J. Buffle, Complexation Reactions in Aquatic Systems, Ellis Horwood Ltd.,
Chichester, 1988.[6] E. Tipping, R. Griffith, J. Hilton, Croat. Chem. Acta 56 (1983) 613.[7] E.M. Murphy, J.M. Zachara, S.C. Smith, J.L. Philips, Sci. Total Environ.
117/118 (1992) 413.[8] B. Gu, J. Schmitt, Z. Chen, L. Liang, J.F. McCarty, Environ. Sci. Technol.
28 (1994) 38.[9] J.P. Pinheiro, A.M. Mota, M.S. Goncalves, H.P. van Leeuwen, Environ.
Sci. Technol. 28 (1994) 2112.
[[
ysicochem. Eng. Aspects 306 (2007) 29–39 39
10] A.W.P. Vermeer, W.H. van Riemsdijk, L.K. Koopal, Langmuir 14 (1998)2810.
11] A.W.P. Vermeer, L.K. Koopal, Langmuir 14 (1998) 4210.12] L.K. Koopal, T.P. Goloub, T.A. Davis, J. Colloid Interf. Sci. 275 (2004)
360.13] C.A. Moody, J.A. Field, Environ. Sci. Technol. 34 (2000) 3864.14] M.R. Taha, I.H. Soewarto, R.J. Acar, R.J. Gale, M.E. Zappi, Water Air Soil
Pollut. 100 (1997) 33.15] J.H. Harwell, D.A. Sabatini, R.C. Knox, Colloid Surf. A 151 (1999) 255.16] C. Wegner, M. Hamburger, Environ. Sci. Technol. 36 (2002) 3250.17] M. Stalmans, E. Matthijs, N.T. De Oude, Water Sci. Technol. 43 (1991) 1.18] J. Waters, T.C.J. Feijtel, Chemosphere 30 (1995) 1939.19] H.R. Rogers, Sci. Total Environ. 185 (1996) 3.20] E. Tombacz, K. Varga, F. Szanto, Colloid Polym. Sci. 266 (1988) 734.21] E. Tombacz, I. Regdon, in: N. Senesi, T.M. Miano (Eds.), Humic Substances
in the Global Environment and Implications on Human Health, ElsevierScience B.V., Amsterdam, 1994, p. 139.
22] S.J. Traina, D.C. McAvoy, D.J. Versteeg, Environ. Sci. Technol. 30 (1996)1300.
23] W.H. Otto, D.J. Britten, C.K. Larive, J. Colloid Interf. Sci. 261 (2003) 508.24] A.F.Y. Adou, V.S. Muhandiki, Y. Shimizu, S. Matsui, Water Sci. Technol.
43 (2001) 1.25] M.M. Yee, T. Miyajima, N. Takisawa, Colloid Surf. A 272 (2006) 182.26] K. Shirahama, The nature of polymer-surfactant interactions, in: J.C.T.
Kwak (Ed.), Polymer–surfactant Systems, Surfactant Science Series, vol.77, Marcel Dekker, New York, 1998, pp. 143–191.
27] P. Linse, P. Hansson, L. Piculell, Models of polymer–surfactant com-plexation, in: J.C.T. Kwak (Ed.), Polymer–surfactant Systems, SurfactantScience Series, vol. 77, Marcel Dekker, New York, 1998, pp. 193–238.
28] L. Pikulell, B. Lindman, G. Karlstrom, Phase behavior of polymer–surfactant systems, in: J.C.T. Kwak (Ed.), Polymer–surfactant Systems,Surfactant Science Series, vol. 77, Marcel Dekker, New York, 1998, pp.65–141.
29] S.K. Dentel, K.M. Kingery, Water Res. 23 (1989) 413.30] C.A. Walker, J.T. Kirby, S.K. Dentel, J. Colloid Interf. Sci. 182 (1996) 71.31] T. Shimizu, M. Seki, J.C.T. Kwak, Colloid Surf. 20 (1986) 289.32] N. Takisawa, D.G. Hall, E. Wyn-Jones, P. Brown, J. Chem. Soc. Faraday
Trans. 1 (84) (1988) 3058.33] D.M. Bloor, W.M.Z. Wan-Yunus, W.A. Wan-Badhi, Y. Li, J.F. Holzwarth,
E. Wyn-Jones, Langmuir 11 (1995) 3395.34] S.M. Ghoreishi, Y. Li, D.M. Bloor, J. Warr, E. Wyn-Jones, Langmuir 15
(1999) 4380.35] J. Liu, K. Kobayashi, L. Yang, N. Takisawa, K. Shirahama, J. Colloid Interf.
Sci. 213 (1999) 412.36] H. Fukui, A. Kaminaga, T. Maeda, K. Hayakawa, Anal. Chim. Acta 481
(2003) 221.37] C.J. Milne, D.G. Kinniburgh, W.H. van Riemsdijk, E. Tipping, Environ.
Sci. Technol. 37 (2003) 958.38] M.J. Avena, A.P.W. Vermeer, L.K. Koopal, Colloid Surf. A 151 (1999) 213.39] M.J. Avena, L.K. Koopal, W.H. van Riemsdijk, J. Colloid Interf. Sci. 217
(1999) 37.40] G.R. Aiken, E.M. Thurman, R.L. Malcolm, H.F. Walton, Anal. Chim. Acta
51 (1979) 1799.41] A. Watanabe, K. Itoh, S. Arai, S. Kuwatsuka, Soil Sci. Plant Nutr. 40 (1994)
601.42] Z.D. Wang, B.C. Pant, C.H. Langford, Anal. Chim. Acta 232 (1990) 43.43] J.D. Filius, D.G. Lumsdon, J.C. Meeussen, T. Hiemstra, W.H. van Riems-
dijk, Geochim. Cosmochim. Acta 64 (2000) 51.44] L. Weng, W.H. van Riemsdijk, L.K. Koopal, T. Hiemstra, J. Colloid Interf.
Sci. 302 (2006) 442.45] H.M. Muller, Zetapotential in der Laborpraxis, Wissenschaftliche Verlags-
gesellschaft, mbH, Sturtgart, Germany, 1996.46] W. Barron, B.S. Murray, P.J. Scales, T.W. Healy, D.R. Dixon, M. Pascoe,
Colloid Surf. A 88 (1994) 129.47] S.-K. Kam, J. Gregory, Water Res. 35 (2001) 3557.48] N.M. Van Os, J.R. Haak, L.A.M. Rupert, Physicochemical Properties of
Selected Anionic, Cationic and Nonionic Surfactants, Elsevier ScienceB.V., Amsterdam, 1993.