Embed Size (px)
Citation preview
HAL Id: hal-02507306https://hal.archives-ouvertes.fr/hal-02507306
Submitted on 26 May 2020
HAL is a multi-disciplinary open accessarchive for the deposit and dissemination of sci-entific research documents, whether they are pub-lished or not. The documents may come fromteaching and research institutions in France orabroad, or from public or private research centers.
L’archive ouverte pluridisciplinaire HAL, estdestinée au dépôt et à la diffusion de documentsscientifiques de niveau recherche, publiés ou non,émanant des établissements d’enseignement et derecherche français ou étrangers, des laboratoirespublics ou privés.
Humic-like acids from hydrochars: Study of the metalcomplexation properties compared with humic acids
from anthropogenic soils using PARAFAC andtime-resolved fluorescence
João Vitor Do Santos, Lais Gomes Fregolente, Altair Benedito Moreira, OdairPastor Ferreira, Stéphane Mounier, Bruno Viguier, Houssam Hajjoul, Márcia
Cristina Bisinoti
To cite this version:João Vitor Do Santos, Lais Gomes Fregolente, Altair Benedito Moreira, Odair Pastor Ferreira,Stéphane Mounier, et al.. Humic-like acids from hydrochars: Study of the metal complexation prop-erties compared with humic acids from anthropogenic soils using PARAFAC and time-resolved flu-orescence. Science of the Total Environment, Elsevier, In press, 10.1016/j.scitotenv.2020.137815.hal-02507306
1 2 3 4 5 6 7 8 9 10 11 12 13 14 15 16 17 18 19 20 21 22 23 24 25 26 27 28 29 30 31 32 33 34 35 36 37 38 39 40 41 42 43 44 45 46 47 48 49 50 51 52 53 54 55 56 57 58 59 60 61 62 63 64 65
Humic-like acids from hydrochars: Study of the metal complexation properties
compared with humic acids from anthropogenic soils using PARAFAC and time-
resolved fluorescence
João Vitor do Santosa, Lais Gomes Fregolente
a,b, Altair Benedito Moreira
a, Odair Pastor
Ferreirab, Stéphane Mounier
c, Bruno Viguier
c, Houssam Hajjoul
c, and Márcia Cristina
Bisinotia*
a Laboratório de Estudos em Ciências Ambientais, Departamento de Química e Ciências
Ambientais, Instituto de Biociências, Letras e Ciências Exatas, Universidade Estadual
Paulista “Júlio de Mesquita Filho,” 15054-000, São José do Rio Preto, São Paulo,
Brazil.
b Laboratório de Materiais Funcionais Avançados (LaMFA), Departamento de Física,
Universidade Federal do Ceará, 60455-900, Fortaleza, Ceará, Brazil.
c Laboratoire MIO–Equipe CEM, Université de Toulon, CS 60584, 83041, CEDEX 9,
Toulon, France.
*Corresponding author
Name: Márcia Cristina Bisinoti
E-mail: [email protected]
Phone: +55 17 3221-2352
Address: Laboratório de Estudos em Ciências Ambientais, Departamento de Química e
Ciências Ambientais, Instituto de Biociências, Letras e Ciências Exatas, Universidade
Estadual Paulista “Júlio de Mesquita Filho”, Rua Cristóvão Colombo, 2265, 15054-000,
São José do Rio Preto, São Paulo State, Brazil.
*Title Page
1
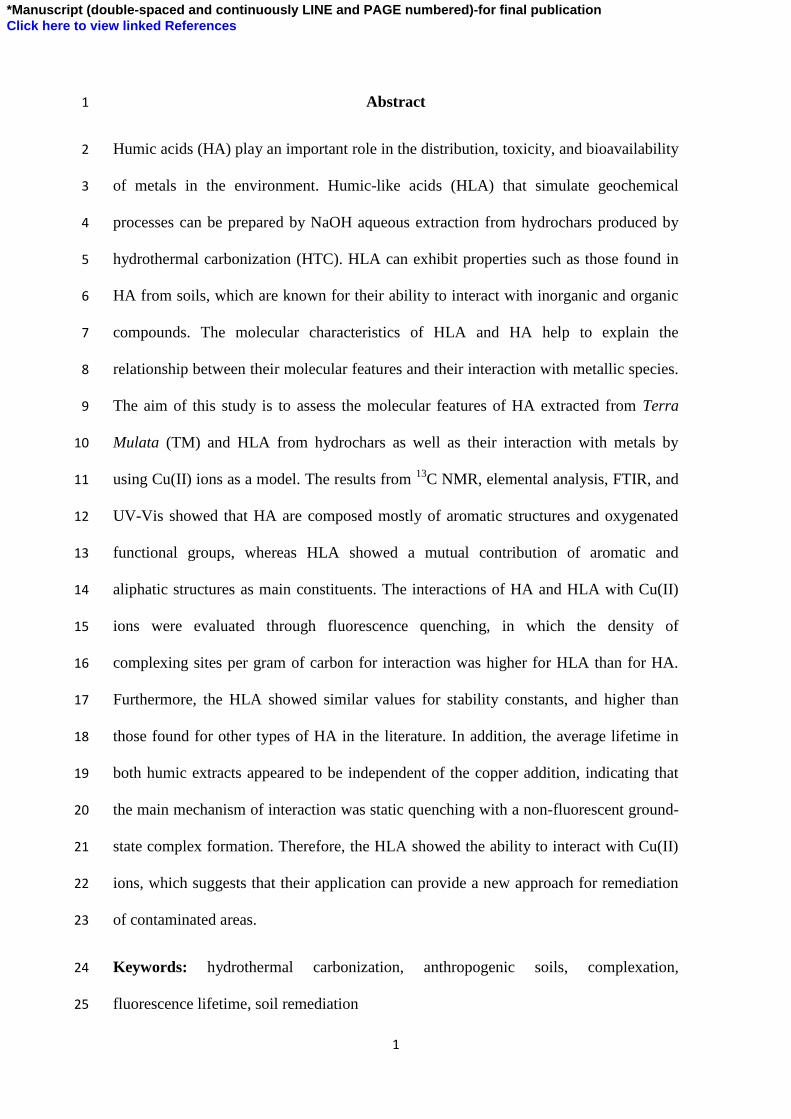
Abstract 1
Humic acids (HA) play an important role in the distribution, toxicity, and bioavailability 2
of metals in the environment. Humic-like acids (HLA) that simulate geochemical 3
processes can be prepared by NaOH aqueous extraction from hydrochars produced by 4
hydrothermal carbonization (HTC). HLA can exhibit properties such as those found in 5
HA from soils, which are known for their ability to interact with inorganic and organic 6
compounds. The molecular characteristics of HLA and HA help to explain the 7
relationship between their molecular features and their interaction with metallic species. 8
The aim of this study is to assess the molecular features of HA extracted from Terra 9
Mulata (TM) and HLA from hydrochars as well as their interaction with metals by 10
using Cu(II) ions as a model. The results from 13
C NMR, elemental analysis, FTIR, and 11
UV-Vis showed that HA are composed mostly of aromatic structures and oxygenated 12
functional groups, whereas HLA showed a mutual contribution of aromatic and 13
aliphatic structures as main constituents. The interactions of HA and HLA with Cu(II) 14
ions were evaluated through fluorescence quenching, in which the density of 15
complexing sites per gram of carbon for interaction was higher for HLA than for HA. 16
Furthermore, the HLA showed similar values for stability constants, and higher than 17
those found for other types of HA in the literature. In addition, the average lifetime in 18
both humic extracts appeared to be independent of the copper addition, indicating that 19
the main mechanism of interaction was static quenching with a non-fluorescent ground-20
state complex formation. Therefore, the HLA showed the ability to interact with Cu(II) 21
ions, which suggests that their application can provide a new approach for remediation 22
of contaminated areas. 23
Keywords: hydrothermal carbonization, anthropogenic soils, complexation, 24
fluorescence lifetime, soil remediation 25
*Manuscript (double-spaced and continuously LINE and PAGE numbered)-for final publicationClick here to view linked References
2
1. Introduction 26
Metal pollution is a worldwide environmental issue in which human activity 27
plays a major role (Lesmana et al., 2009; Li et al., 2014). Unlike most organic 28
contaminants, metals are not biodegradable and can accumulate in living organisms, 29
thereby causing problems for both human health and the environment (Lesmana et al., 30
2009). Some metals of great concern are cadmium, zinc, copper, and nickel (Li et al., 31
2014; Tang et al., 2014). Among them, copper is important for cellular metabolism. 32
However, this element is highly toxic if swallowed at high concentrations and can cause 33
gastrointestinal problems, hair loss, weight loss, and even death (Andreazza et al., 2010; 34
Fu and Wang, 2011; Tang et al., 2014). Intensified industrial, agricultural, mining, and 35
urbanization activities are the main causes of copper contamination (Hladun et al., 2015; 36
MacKie et al., 2012). Therefore, research is needed to develop techniques for reducing 37
the concentrations of metals in contaminated soils. 38
It is widely accepted that soil fertility depends on the presence of nutrients and 39
organic matter (Stevenson, 1994). Humic substances (HS) are the main constituents of 40
soil organic matter and are formed from the remains of plant and animal degradation. 41
Humic acids (HA) are one of the components of HS. They represent the most 42
hydrophobic part and play important roles in soil fertility, water retention, plant growth 43
promotion, and interaction with organic and inorganic compounds (Bento et al., 2019; 44
Canellas and Façanha, 2004; Jindo et al., 2016). The bioavailability, distribution, and 45
toxicity of pollutants are affected by their interaction (He et al., 2016; Tang et al., 46
2014); thus, the use of HA has gained attention for remediation (Piccolo et al., 2019). 47
Anthropogenic soils such as TM occur near the Amazon basin and are known 48
for exhibiting high fertility (Glaser et al., 2000; Oliveira et al., 2018). Such soils have 49
gained the attention of researchers who have attempted to reproduce their organic matter 50
3
by thermochemical methods of biomass conversion, such as pyrolysis and hydrothermal 51
carbonization (HTC). These methods use various biomass types to obtain a material 52
with the characteristics of TM. 53
The HTC process is a suitable biomass disposal method for the production of 54
carbon-based materials known as hydrochar. In addition, the process water (liquid 55
phase) is generated by this method. Some authors have proposed the use of this process 56
water as a hydrothermal medium in a new carbonization process (Kabadayi Catalkopru 57
et al., 2017; Stemann et al., 2013; Weiner et al., 2014) or for liquid fertilizer (Fregolente 58
et al., 2018). 59
Most HA used in the literature are extracted from soils, water, sediments, or peat 60
(Chen et al., 2015; Plaza et al., 2005; Zherebtsov et al., 2015). The formation of these 61
environmental elements under natural conditions requires significant amounts of time 62
and involves several chemical and biological reactions that can last for years (Yang et 63
al., 2019a). However, the formation of HTC needs only hours (Melo et al., 2017; Silva 64
et al., 2017). Humic-like acids (HLA) are defined as extracts of different organic 65
materials that have not undergone the natural process of humification (Bento et al., 66
2019; Jindo et al., 2016, 2019). Although there is not the natural humification process 67
that occurs in soils, HLA extracted from hydrochars might have characteristics similar 68
to those of natural HA extracted from anthropogenic soils, which are known as a model 69
of organic matter. Knowledge of the chemical structure of HLA is essential for 70
predicting their behavior and benefits in soil. 71
Because natural HA form complexes with metals (Stevenson, 1994), the study of 72
interaction between metallic ions and HLA is of significant value for predicting whether 73
HLA can assist in the complexation reactions if applied to the soil, and thus the metal 74
bioavailability. A variety of agents has been used for soil washing including 75
4
biosurfactants as well as synthetic agents such as ethylenediaminetetraacetic acid 76
(EDTA) (Mulligan et al., 2001, Mulligan, 2009). Despite the efficiency of these agents 77
in removing metals from soils, they cause environmental problems and are high in cost, 78
which justifies the need for more studies to develop new washing agents. In previous 79
research, a solution of HLA from manure compost biochar showed the remediation of 80
soils contaminated by multiple metals (Kulikowska et al., 2015); the same was shown 81
for HLA from composted sewage sludge (Piccolo et al., 2019). In addition, the potential 82
of HLA extracted from hydrochars produced with crude waste biomass was presented 83
(Yang et al., 2019a). In that case, HLA from hydrochars produced with by-products of 84
the sugarcane industry were shown to act in complexation reactions between metals and 85
active sites on the HLA surface. 86
The fluorescence excitation emission matrix (EEM) has gained prominence in 87
the characterization of organic matter and its interaction with metallic species (Elkins 88
and Nelson, 2002). The analytical potential of fluorescence EEM spectra coupled with 89
chemometric tools such as Parallel Factor Analysis (PARAFAC) has been successfully 90
realized for this type of analysis (Mounier et al., 2011; Nouhi et al., 2018; Stedmon and 91
Bro, 2008; Tadini et al., 2019; Yuan et al., 2015). Moreover, PARAFAC has also been 92
used in the characterization of dissolved organic matter (DOM) of biochars produced 93
with different biomass content (El-Naggar et al., 2020; Rajapaksha et al., 2019; Yang et 94
al., 2019b). Further, because different chemical species have different fluorescence 95
lifetimes, it is also possible to study organic matter–metal interaction through time-96
resolved fluorescence (TRF), particularly in complex samples such as HA and HLA 97
(Nouhi et al., 2018). 98
Thus, the chemical characterization of HLA from hydrochars obtained with 99
sugarcane industry by-products was conducted, and the results were compared with that 100
5
of HA from TM. In addition, the interaction of HA and HLA with Cu(II) ions by 101
fluorescence quenching was studied to provide quantitative data on the complexation 102
capacity (CC), concentration of binding sites (CL), and conditional stability constant 103
(K). TRF as a complementary technique of fluorescence quenching was used to 104
investigate the interaction by measuring the fluorescence lifetime and its variation with 105
the addition of metal. Thus, the present study can provide a new perspective for 106
analyzing Cu(II)–HLA interactions and the potential of HLA as a complexing agent in 107
the remediation of soils polluted by metals. 108
109
2. Materials and methods 110
2.1 Terra Mulata sampling 111
Soil sampling was performed following the 2000 United States Environmental 112
Protection Agency (EPA) method (US EPA, 2000). For this study, three different areas 113
of TM were selected. The first TM soil was obtained from an open area region 114
containing native vegetation and low vegetation cover (TM I; 3°04′05.45″ S and 115
58°33′51.11″ W); the second was taken from a closed area region containing native 116
vegetation (TM II; 3°04′05.17″ S and 58°34′11.68″ W); and the third was collected near 117
cultivated areas (TM III; 3°03′59.15″ S and 58°27′04.64″ W). All areas are located near 118
Itacoatiara city in the Amazonas State (Brazil). (SISBio collection was authorized by 119
the Chico Mendes Institute for Biodiversity Conservation, n ° 50042 -2, and registered 120
in the National System for the Management of Genetic Heritage and Associated 121
Traditional Knowledge (SisGen), No. A0018C2.) Soil samples were collected from the 122
0 to 30 cm deep layer, air-dried, and subsequently sieved through a 2 mm mesh for 123
removal of plant debris and fragments. 124
125
6
2.2 Hydrothermal carbonization and recarbonization process 126
HTC was performed using vinasse and sugarcane bagasse, in which the vinasse 127
was used to produce the hydrothermal medium (Melo et al., 2017; Silva et al., 2017). 128
The HTC processes were conducted in a Teflon® closed reactor coated with stainless 129
steel. Each mixture (Table 1) was heated in a muffle furnace at 230 °C for 13 h. Then, 130
the reactor was cooled in an ice bath, and the suspension was filtered under vacuum 131
filtration to separate the hydrochar from the process water. The hydrochar was washed 132
with distilled water until constant pH was reached and was then dried at 50 °C until 133
constant mass was achieved. The process water generated in the HTC process was used 134
in the recarbonization process to produce the hydrothermal medium for sugarcane 135
bagasse carbonization. The subsequent steps after carbonization, i.e., filtration, 136
hydrochar washing, and drying, were the same. 137
Table 1 138
2.3 Extraction of humic acids and humic-like acids 139
The extractions were performed following the recommendations of the 140
International Humic Substances Society (IHSS) (Swift, 1996). HS were extracted from 141
TM at a proportion of 1:10 (soil:extractor). Thus, the extraction was conducted in 100 g 142
of soil to 1 L of solution (NaOH 0.1 mol L-1
) under nitrogen flow for 4 h. The solution 143
extracted was acidified with HCl (6 mol L-1
) to reach pH~1. Thus, HA were 144
precipitated, and fulvic acids remained in the supernatant. Subsequently, the HA were 145
separated by centrifugation, dialyzed using a Fisherbrand apparatus with a molecular 146
weight cut-off at 6,000–8,000 Da, and freeze-dried. 147
The method was modified for the extraction of humic-like substances (Jindo et al., 148
2016). Those from hydrochars were extracted at a proportion of 1:10 149
(hydrochar:extractor) using NaOH (0.1 mol L-1
) under nitrogen flow for 4 h. This 150
7
procedure was repeated, with the same hydrochar portion until the final extract 151
(supernatant phase) showed a lighter color. HLA were obtained by the pH difference, 152
with HCl (6 mol L-1
) to pH~1, and was separated from the fulvic-like acids by 153
centrifugation. Finally, the extracts of HLA obtained from each extraction step were 154
combined, dialyzed, and freeze-dried. 155
156
2.4 Characterization of humic acids and humic-like acids 157
2.4.1 Elemental analysis 158
Elemental analyses were performed on solids using an elemental analyzer (2400 159
Series II CHNS/O, Perkin Elmer, Walther, Massachusetts, USA). The oxygen content 160
was determined according to the difference, i.e., O% = 100 - (C, H, N, S + ashes). The 161
ash content was determined in a muffle furnace at 750 °C for 4 h. The C, H, N, S, and O 162
contents were recalculated on an ash-free basis. The H/C, O/C, and C/N atomic ratios 163
were determined by elemental analysis (Giovanela et al., 2010; Stevenson, 1994). 164
165
2.4.2 Infrared spectroscopy 166
Infrared spectra were obtained using an attenuated total reflectance (ATR)-167
coupled spectrophotometer (FTIR; Spectrum Two UATR, Perkin Elmer, Walther, 168
Massachusetts, USA). The solid material was placed directly on the ATR crystal and 169
was analyzed at a spectral range of 4000–400 cm-1
with 20 scans and a resolution of 4 170
cm-1
. 171
172
2.4.3 Ultraviolet–visible spectroscopy 173
The ultraviolet-visible (UV–Vis) scanning spectra were obtained by employing a 174
UV–Vis spectrophotometer (UV-2600, Shimadzu, Japan) at a range of 200–700 nm. HA 175
8
and HLA solutions (10 mg L-1
) in total organic carbon (TOC; TOC-VCSN Shimadzu, 176
Japan) were diluted in 0.05 mol L-1
of NaHCO3 at pH 8. From the spectra, the ratios 177
E465/E665 (E4/E6) and E270/E407 (E2/E4) were calculated. These ratios have been used to 178
describe the degree of aromatic ring condensation and the presence of lignin derivatives, 179
respectively (Budziak et al., 2004; Canellas and Façanha, 2004). 180
181
2.4.4 Solid-state 13
C–CPMAS–NMR spectroscopy 182
Solid-state 13
C–cross-polarized magic angle spinning (CPMAS)–nuclear 183
magnetic resonance (NMR) characterization was performed by employing a Bruker 184
AVANCE 400 MHz spectrometer (Bruker, Billerica, Massachusetts, USA) equipped 185
with a magic angle spin (MAS) probe. A zircon cylindrical rotor with a diameter of 4.0 186
mm was packed with 80 mg of sample. The spectra were acquired by using a rotor 187
rotation frequency of 10 kHz, recycle time of 1 s, and 5,000 scans. The spectral areas 188
were integrated and divided into seven chemical shifts: C-alkyl (0–45 ppm), C-189
methoxyl (45–60 ppm), O-alkyl-C (60–110 ppm), aryl-C (110–145 ppm), phenol-C 190
(145–160 ppm), carboxyl-C (160–190 ppm), and carbonyl-C (190–220 ppm). 191
According to the area integration, the aromaticity (ARM), alkyl (A/AO), and 192
hydrophobicity (HB/HI) indices were calculated. (Monda et al., 2018). 193
194
2.5 Interaction of humic acids and humic-like acids with Cu(II) 195
2.5.1 Fluorescence quenching 196
Studies involving interaction with Cu(II) ions were performed using 10 mg L-1
197
of HA or HLA in a buffer medium with 0.1 mol L-1
4-(2-hydroxyethyl)-1-198
piperazineethanesulfonic acid (HEPES) at pH 7.0. Titration experiments were 199
performed in 13 cuvettes for each HA or HLA sample with various concentrations of 200
9
Cu(II) (Cu(ClO4)2·6H2O), ranging from 0 mg L-1
to 11.2 mg L-1
. The equilibrium time 201
of 30 min was determined on the basis of changes observed in the fluorescence signal. 202
Fluorescence measurements were performed using a spectrofluorometer (F4500, 203
Hitachi, Santa Clara, California, USA) equipped with a 450 W xenon lamp. The spectra 204
were acquired in the scan ranges of 220–700 nm for emission and 220–500 nm for 205
excitation, with both slits fixed at 5 nm. The scan speed was set at 2,400 nm min-1
, and 206
the detector voltage was 700 V. The obtained EEM spectra were treated by using the 207
PARAFAC chemometric model. The number of components responsible for 208
fluorescence was defined by using the core consistency diagnostic (CORCONDIA) 209
(Mounier et al., 2011). The density of binding sites (CL) as well as the conditional 210
stability constant (K) were determined following the metal complexation model 211
proposed by Ryan and Weber (1982), as represented by 212
, (1) 213
where L is a free complexing site, M is the free or uncomplexed metal, and ML is the 214
complex. Based on this reaction, the conditional stability constant can be calculated as 215
. (2) 216
Metal and complexing sites follow a mass balance in solution: 217
, (3) 218
, (4) 219
where CL and CM represent the total concentration of complexing sites and the metal in 220
the solution system, respectively. 221
222
2.5.2 Time-resolved fluorescence 223
Three samples were selected from the data obtained from the fluorescence 224
quenching experiment, i.e., three total copper concentrations for each HA and HLA 225
10
interaction. The first contained no concentration of copper (C0), whereas C0.7 and C5.6 226
contained 0.7 mg L-1
and 5.6 mg L-1
, respectively. Prior to each measurement, the 227
prepared solution was bubbled with nitrogen for 10 min to prevent photodegradation. 228
TRF experiments were performed at 266 nm from the fourth harmonic generation from 229
a nanosecond laser Nd:YAG (Quanta-Ray INDI, Spectra Physic, Germany), and 230
excitation (1024 nm) occurred with a pulse width of 5 ns and a repetition of 20 Hz. Six 231
hundred spectra were accumulated at each time step of 0.2 ns with an optical fiber and 232
were detected by an intensified charge-coupled device (CCD) camera with a 35 ns gate 233
width. Data obtained by TRFS were corrected by energy fluctuation and were treated by 234
using a homemade MATLAB®
program to obtain the spectral deconvolution and the 235
associated lifetime values. 236
237
3. Results and discussion 238
3.1 Characterization of humic acids and humic-like acids 239
Determining the molecular formula of HA and HLA is still a challenge; 240
however, elemental analysis can provide a general idea about their compositions. The 241
elemental analysis and UV–Vis ratios of soil HA and hydrochar HLA samples are 242
shown in Table 2. In general, HA and HLA showed carbon as the main constituent, at 243
36.6% to 62.2%, followed by oxygen, hydrogen, nitrogen, and sulfur. In addition, HLA 244
RHH2SO4 had the highest sulfur content of the samples. Regarding the carbon 245
percentage, the HLA samples showed higher values than did HA. 246
The O/C, H/C, and C/N atomic ratios (Table 2) based on elemental analysis, 247
have been used to describe the content of oxygenated groups in the molecules, the 248
degree of aromatic ring condensation, and the nitrogen content, respectively (Giovanela 249
et al., 2010; Stevenson, 1994). In general, HA showed higher O/C ratios than those of 250
11
HLA, suggesting a greater abundance of oxygen-containing functional groups 251
(Fukushima et al., 2014). The H/C ratio showed that HA, except for the TM II HA, have 252
higher condensation of aromatic rings than do HLA; lower C/N atomic ratios for HA 253
suggest more nitrogen-containing structures (F. Yang et al., 2019). 254
The UV–Vis spectra of HA have been previously described in the literature and 255
provide little structural information. Generally, however, the overall absorbance 256
decreases with increasing wavelength (Uyguner and Bekbolet, 2005). In this study, both 257
HA and HLA showed this behavior; the spectra are shown in the supplementary 258
material (Figure S1). For better interpretation of UV–Vis analysis, the absorbance ratios 259
at certain wavelengths were utilized. The E465/E665 absorbance ratio is related to the 260
degree of condensation of aromatic rings. Values lower than 4 indicate compounds with 261
more condensed aromatic groups (Canellas and Façanha, 2004; Stevenson, 1994; He et 262
al., 2016). The E270/E407 absorbance ratio refers to the presence of lignin derivatives, of 263
which the content is directly proportional to this value (Budziak et al., 2004). This ratio 264
might be indicative for organic matter studies because lignin is involved in the 265
formation of both soils and hydrochars. The obtained parameters are presented in Table 266
2. 267
HA showed a higher degree of aromatic condensation than HLA. Furthermore, 268
the lower number of compounds with lignin structures might be linked to greater 269
decomposition of organic matter. 270
Table 2 271
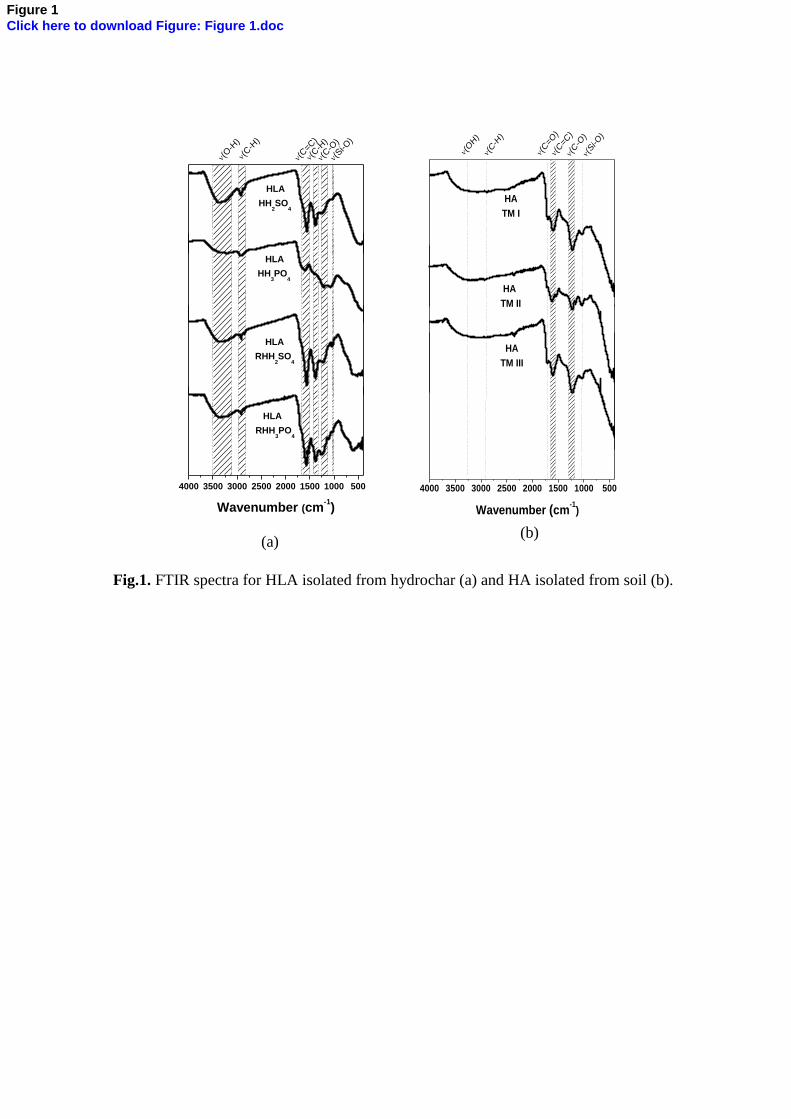
The FTIR spectra (Figure 1a and 1b) showed that both HA and HLA have 272
typical features of HS (Esteves et al., 2009; Fernandes et al., 2010; Giovanela et al., 273
2010). In the 3500–3300 cm-1
region, larger bands were observed for HA. However, the 274
bands for HLA were more defined and might be related to N-H stretching of amines or 275
12
amides and O-H stretching of alcohols and phenols (Dick et al., 2003). The same result 276
was observed for the C-H stretching of aliphatic methyl and methylene groups near 277
2900 cm-1
. In the 1730–1710 cm-1
region, low intensity of C=O stretching of carboxylic 278
acids or ketones was found for HA (Figure 1a), and a slight shoulder was observed for 279
the HLA samples (Figure 1b) (Senesi et al., 2003). Bands in the 1620–1600 cm-1
280
regions were associated with aromatic C=C stretching (Stevenson, 1994). C-H bending 281
of CH3 and deformation of CH2 and CH3 structures were observed in the 1420–1380 cm-
282
1 region for HLA but not for HA. All spectra showed C-O-C stretching at approximately 283
1250–1030 cm-1
, likely resulting from polysaccharides; stretching in esters, alcohols, 284
and phenols was also observed. In addition, Si-O stretching bands were identified in the 285
825–750 cm-1
region (Giovanela et al., 2010; Stevenson, 1994). 286
Figure 1 287
The 13
C–CPMAS–NMR spectra of HA and HLA are shown in Figure 2. Both 288
samples showed complex chemical compositions, with peaks related to aromatic and 289
aliphatic carbons, substituted or not by heteroatoms, and different intensities. The 290
following peaks were observed in all samples: 0–45 ppm, attributed to the presence of 291
alkyl carbons of methyl and methylene groups; 45–60 ppm for carbons linked to 292
methoxyl groups and nitrogen compounds (C-N); 60–110 ppm, indicating the presence 293
of oxygen-substituted carbons and alkyl groups (O-alkyl); 110–145 ppm, attributed to 294
the presence of aromatic groups; and 145–160 ppm for substituted aromatic carbons, 295
160–190 ppm for carbonyl groups, and 190–220 ppm for carboxylic groups in the 296
structures of HA and HLA (Mazzei and Piccolo, 2012; Monda et al., 2017; Spaccini and 297
Piccolo, 2009; Tadini et al., 2015). 298
Chemical shifts near 15 ppm were assigned to short-chain aliphatic structures, 299
whereas those at 30 ppm were assigned to long-chain aliphatic structures attributed to 300
13
lipid compounds, such as plant waxes and biopolyesters (Francioso et al., 2002; Monda 301
et al., 2017; Spaccini et al., 2019). These peaks were more intense in the HLA samples 302
(Figure 2). The peak at 54 ppm, related to the presence of methoxyl carbons in both 303
guaiacil and syringyl units of lignin fragments, as well as Cα of oligo- and polypeptides 304
(Monda et al., 2017), was present for both HA and HLA except in those in which 305
sulfuric acid was used as an additive (Figure 2). 306
The peaks in the 71–74 ppm range were more evident in HA and are typical of 307
O-akyl-C in mono and polysaccharides, in which the centered peak at 72 ppm is 308
attributed to the overlapping of carbon numbers 2, 3, and 5 in the pyranosidic cellulose 309
and hemicellulose structures, referred to as C-2, C-3, and C-5, respectively (Monda et 310
al., 2017; Spaccini and Piccolo, 2009). Unsubstituted aromatic carbons were responsible 311
for the intense signal at 130 ppm (Monda et al., 2017) in the HA and HLA structures, 312
whereas their analogs containing -OH, -OCH3, and -NH2 groups were found in the 145–313
160 ppm region. The signal at 174 ppm corresponds to carboxylic acids, and the low 314
signal at 190–220 ppm refers to carbonyl groups of ketones, amides, and aldehyde (Mao 315
et al., 2011) in the HA and HLA, as shown in Figure 2. 316
Figure 2 317
By employing spectral integration, it is possible to estimate the distribution of 318
carbons in the HA and HLA structures as well as some indices such as A/AO, ARM, 319
and HB/HI, as shown in Table 3. These indices are related to the biochemical stability 320
of different organic compounds. The HA showed aromatic compounds as the main 321
constituents, whereas HLA showed the presence of aromatic and aliphatic carbons 322
(Table 3). The ARM index was similar for both materials. Higher HB/HI index values 323
indicate the incorporation of hydrophobic moieties in HLA (Bento et al., 2019). 324
Furthermore, the natural HA were more hydrophilic than those HLA obtained from 325
14
HTC, which is indicated by the decrease in the A/OA index (Table 3). All of these 326
factors, such as presence or absence, greater incorporation of functional groups or not in 327
humic and humic-like acids, influence the binding properties with metal ions. 328
Table 3 329
330
3.2 Interaction of humic acids and humic-like acids with Cu(II) 331
3.2.1 Fluorescence quenching 332
The interactions of HA and HLA with Cu(II) ions were evaluated by 333
fluorescence quenching; the concentration of each humic extract was 10 mg L-1
. Other 334
authors have used this concentration value of humic extract in experiments for the same 335
purpose: to avoid inner filters (Guo et al., 2015; Yuan et al., 2015). The quenching 336
results were combined with the PARAFAC multivariate statistical tool, in which the 337
complex signal of the fluorescence spectra was decomposed into simple and 338
independent components. 339
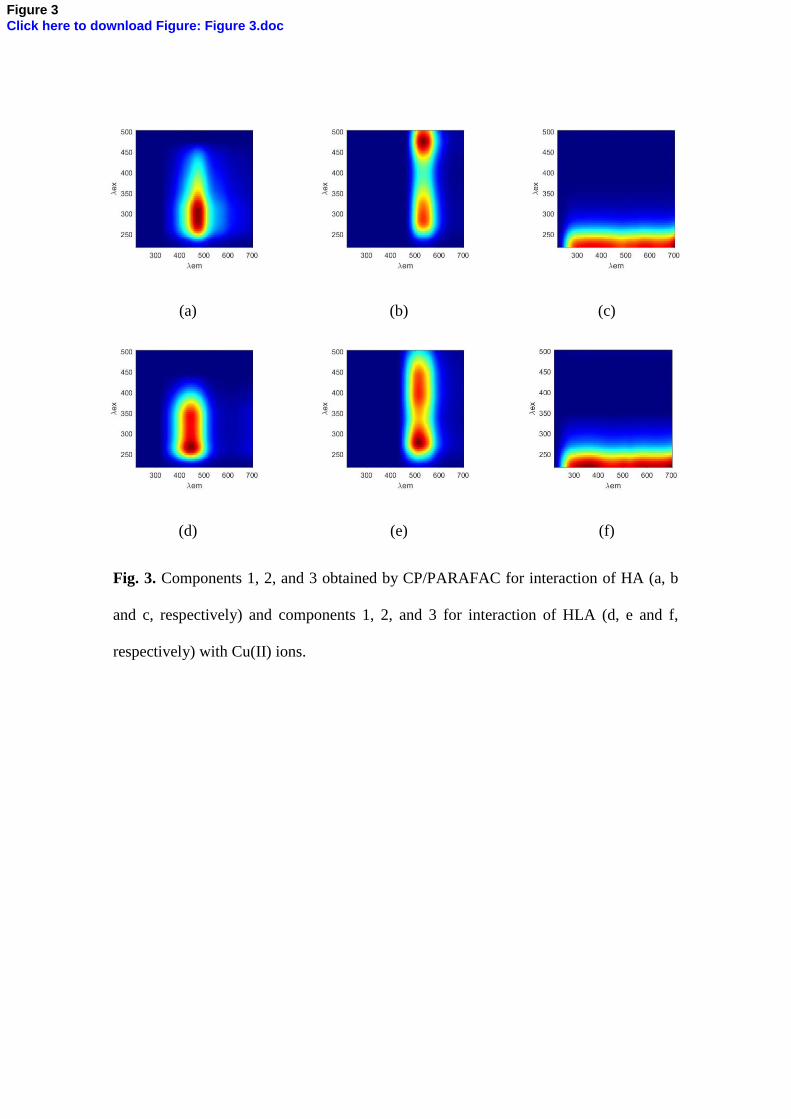
Thus, a three-component model was found for HA quenching experiments with 340
a good CORCONDIA value (94.75%). The components are shown in Figure 3. 341
Component 1 (Figure 3a) had a main peak at [λEx 300 nm/λEm 475 nm], which is typical 342
of humic-like substances. Component 2 (Figure 3b) had a secondary peak at [λEx 275 343
nm/λEm 530 nm], which is associated with low-energy peaks known to be typically 344
linked to terrestrial HA (Matthews et al., 1996; Stedmon et al., 2003), and a main peak 345
at [λEx 475 nm/λEm 530 nm], which is typical of lignin-derived terrestrial HA. In 346
addition, component 1 showed a blue shift for fluorescence emission intensity, whereas 347
component 2 demonstrated a red shift, characterizing the presence of simple and 348
complex structures, respectively (Senesi et al., 2003). Conversely, component 3 (Figure 349
3c) showed no variation in its contribution during the quenching experiments, which is 350
15
likely related to a noise factor. Therefore, this component was not considered in the 351
discussion. 352
A three-component model was also found for the interaction with HLA, with a 353
CORCONDIA value of 97.46%; these components are also shown in Figure 3. 354
Component 1 (Figure 3d) showed a main and a secondary peak at [λEx 260 nm/λEm 425 355
nm] and [λEx 340 nm/λEm 425 nm], respectively. Both components are characteristic of 356
humic substances from terrestrial environments (Coble, 1996; Matthews et al., 1996; 357
Stedmon et al., 2003). Component 2 (Figure 3e) had a main peak at [λEx 275 nm/λEm 358
510 nm] and a secondary peak at [λEx 400 nm/λEm 510 nm]. The main peak was 359
classified as typically humic-like, and the secondary peak refers to soil fulvic acid. 360
Component 3 (Figure 3f) showed no fluorescence variation; therefore, similar to that for 361
HA, it was not considered in the discussion. 362
Figure 3 363
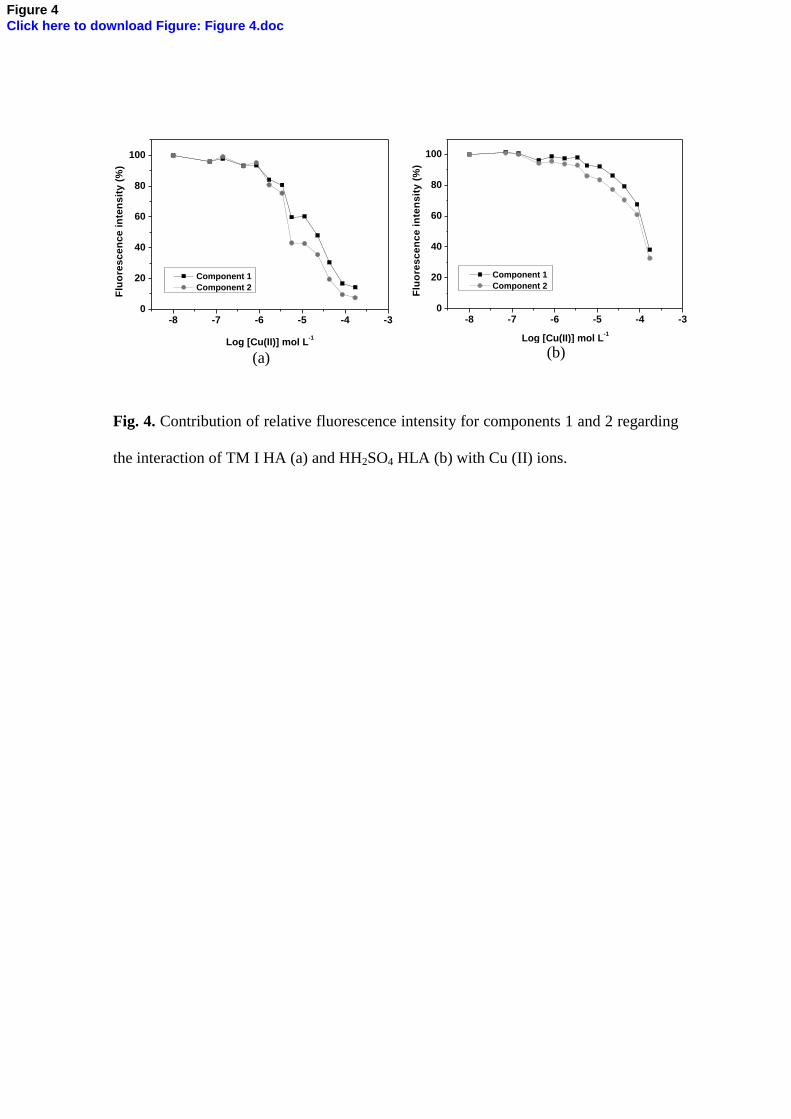
It is possible to obtain the fluorescence contribution of each component in the 364
sample, known as the score, depending on the metal addition. The initial humic extracts 365
were considered as 100%, and the contribution decreased with the addition of metal. 366
Figure 4a shows the scores of components 1 and 2 regarding the interaction of TM I HA 367
with Cu(II) ions, and Figure 4b shows those regarding the interaction of HH2SO4 HLA. 368
All three HA samples showed similar behavior; additional graphs are given in the 369
supplementary material (Figure S2). The four HLA samples also showed similarly 370
behavior, as shown in the supplementary material (Figure S3). 371
Figure 4 372
The fluorescence quenching curve for the first component of HA and Cu(II) 373
(Figure 4a) showed a fluorescence intensity decay of approximately 85.6%, and the 374
second component had a value of 92.5%. This significant decay in fluorescence 375
16
contribution is attributed to the formation of a complex in which the fluorescence 376
quantum yield changed (Mounier et al., 2011; Tadini et al., 2019). Moreover, the 377
interaction with Cu(II) was shown to influence the optical properties of organic matter. 378
For the interaction between HLA and Cu(II) (Figure 4b), the fluorescence intensity 379
decay for the first component remained at approximately 67.3%, whereas that for the 380
second was approximately 58.2%. The decrease in fluorescence intensity of the HA 381
components appeared at the first concentrations of Cu(II). For the HLA components, an 382
increase in copper concentration was necessary for better visualization of the quenching 383
phenomenon. 384
Optimization of the data using the 1:1 (ligand:metal) complexation model 385
proposed by Ryan and Weber (1982) enables evaluation of the equilibrium parameters, 386
particularly CL and K, of which CL is the concentration of binding sites capable of 387
forming a complex and K is the conditional stability constant of the complex formed. 388
The equilibrium parameters for the HA and HLA experiments, including CL, log 389
K, CC, and the bias values, are given in Table 4. To evaluate the 1:1 complexation 390
model, bias was used as an optimization parameter. Bias is the sum of the absolute 391
value of the difference between the experimental and calculated fluorescence logarithm 392
intensity. In this study, the bias values ranged from 0.27 to 4.18, which are lower than 393
those found in the literature (Tadini et al., 2019). Therefore, the experimental data fit 394
well in the theoretical model (Table 4). The titration curves of the theoretical and 395
experimental values for components 1 and 2 of HA and components 1 and 2 of HLA 396
with Cu(II) can be found in the supplementary material (Figures S4 and S5). 397
Table 4 398
For HA components 1 and 2, the log K values remained in the ranges of 5.30– 399
5.41 and 5.58–5.60, respectively; for HLA components 1 and 2, these values were in the 400
17
ranges of 4.88–4.90 and 5.06–5.09, respectively. The HA components showed higher 401
values for log K and both blue and red shifts in the fluorescence emission wavelengths. 402
In addition, the fluorophores exhibited different chemical structures and compounds 403
with good binding capacities, which is confirmed by Figure 3a, b. The HLA 404
components showed similar values for log K compared with HA and values either 405
similar to or higher than those found in the literature for other types of HA (Fuentes et 406
al., 2013; Plaza et al., 2005; Tadini et al., 2019). Blue and red shifts were also observed 407
(Figure 3d, e); therefore, the fluorophores have different chemical structures and are 408
weakly bonded compared to HA. 409
It is noteworthy that TM, which occurs in the Amazon, is different from 410
common soils and has high fertility because of the carbon stock and long-term nutrients. 411
This fact was demonstrated by good interaction with the metal ion (log K 5.30–5.60). 412
HLA showed higher log K values than those found in Spodosols, which also occur in 413
the Amazon region (log K 3.79–5.32) (Tadini et al., 2019), or peat and leonardite (log K 414
4.58–5.10) (Fuentes et al., 2013). This indicates that the organic matter extracted from 415
hydrochars can also interact satisfactorily with Cu(II) ions to form complexes. 416
Additionally, by using the CL values, it was also possible to determine the CC for all 417
components 1 and 2 from HA and HLA. This parameter was obtained by dividing the 418
CL values by the carbon content. CC represents the concentration of binding sites per 419
gram of carbon available to interact with Cu(II) ions. Table 4 also shows the CC values 420
for HA and HLA components 1 and 2. 421
Both HLA components 1 and 2 showed higher concentrations of binding sites 422
per gram of carbon for interaction with Cu(II) ions than those of HA; and the highest 423
value was observed for RHH2SO4 HLA. Regarding log K, the CC values were also 424
higher than those found in the literature for HA from soils, peat, or leonardite (Fuentes 425
18
et al., 2013; Plaza et al., 2005; Tadini et al., 2019). Tadini et al. (2019) determined the 426
CC of components by fluorescence quenching for HA extracted from Amazonian 427
Spodosols with Cu(II) ions and found CC values ranging from 0.01–0.13 mmol of Cu g-428
1 C. The values found in this study for HA extracted from TM were higher, indicating 429
both a larger amount of complexing sites and an affinity of organic matter with the 430
metallic ion. The same result was observed for HLA, indicating that if applied to the 431
soil, it could help in the complexation reactions. 432
Previous research indicates that the high stability constants of HA are associated 433
with increased oxygen-containing groups such as -COOH and -OH as well as π-π bonds 434
in the C=C of aromatic rings (Guo et al., 2012, 2015). These functional groups were 435
observed for HA and HLA by using both FTIR and 13
C NMR techniques. The results 436
show that the predominance of conjugate and aromatic structures as well as oxygen-437
containing groups are responsible for HA complexation, and for HLA, both aromatic 438
and aliphatic groups are responsible. Pearson established the concept of chemical 439
bonding regarding the affinity of different metals to different ligands (Pearson, 1963). It 440
was reported that chemical species can be classified as “hard” and “soft” or “borderline” 441
acids and bases and that the concepts of “hardness” and “softness” can help to interpret 442
the mechanism of complexation. Soft acids tend to have preferential interaction by soft 443
bases, whereas hard acids tend to bind with hard bases; borderline acids form 444
considerably stable bonds with both hard and soft bases, although it is sometimes 445
difficult to determine the preferential order for bond formation. These concepts partly 446
explain the stability of chemical compounds (Pearson, 1963). 447
As observed in the 13
C NMR spectra and in the H/C, O/C, and C/N atomic 448
ratios, HA and HLA showed similar ARM, although HA showed a higher percentage of 449
oxygenated groups and nitrogen in its structure. The Cu(II) ion used in this study is a 450
19
borderline acid and interacts with both hard bases such as oxygen and soft bases such as 451
nitrogen; thus, HA had a stronger interaction with Cu(II) because of their molecular 452
structures. Lu and Allen (2002) found that the interaction of DOM with Cu(II) ions is 453
attributed mostly to phenol OH groups, and Hernández (2006) showed a positive and 454
significant correlation with carboxylic acid and phenols. Moreover, the presence of 455
large amounts of functional groups and π-π bonds of aromatic rings should confer a 456
greater complexation capacity for HA from TM; however, this did not occur potentially 457
owing to the different molecular arrangements. Further, it is possible that the functional 458
groups and aromatic carbons in HA structures were already occupied by another metal 459
or more condensed aromatic rings. All of these factors can affect the behavior of Cu(II) 460
ions in both soils and hydrochar extracts. Conversely, HLA showed more binding sites 461
available for interaction considering the amount of carbon in the sample, and thus 462
greater complexation capacity. 463
464
3.2.2 Time-resolved fluorescence 465
In addition, fluorescence quenching can be induced by two mechanisms. The first 466
is dynamic quenching, which is caused by collision with a quencher and occurs during 467
the lifetime of the excited state, affecting the fluorescence lifetime. The second is static 468
quenching, which occurs when a ground-state non-fluorescent complex is formed, and 469
the lifetimes of the fluorescent ligand and complex are unaffected (Lakowics, 1999). 470
Therefore, TRF is the best method for distinguishing whether static or dynamic 471
quenching occurs during the interaction of organic matter with copper. 472
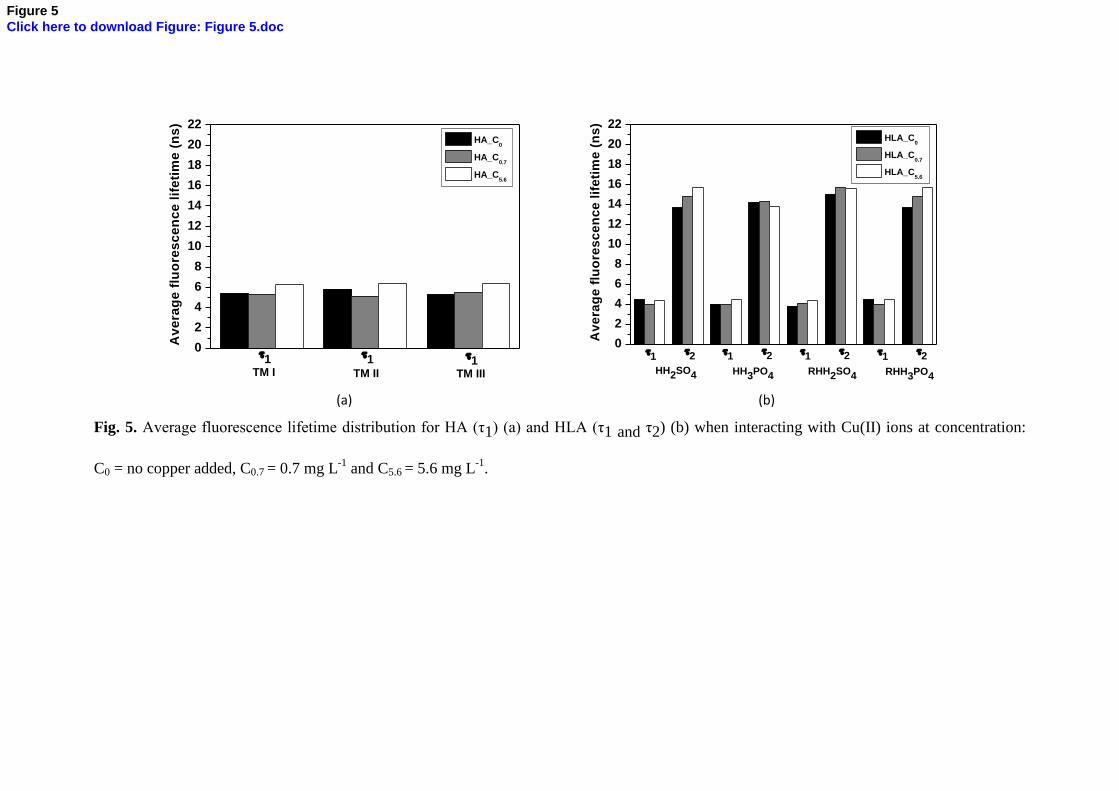
Figure 5a and 5b show the fluorescence average lifetime distribution of HA and 473
HLA complexes with copper, respectively. The deconvolution of TRF results in the HA 474
complexes show that the decay was mono-exponential (τ1) decay containing only one 475
20
lifetime. The average lifetime values observed were shorter, at approximately 5–6 ns, 476
which is associated with the simple structure of HA. This average lifetime can be 477
attributed to component 1 (Figure 3a) observed in PARAFAC. The average lifetime of 478
component 2, with emission at 530 nm (Figure 3b) did not appear in the results because 479
the emission spectra in TRF reached only 510 nm owing to laser leakage at 532 nm. 480
The best fit for HLA complexes showed a bi-exponential decay (τ1 and τ2), the 481
average lifetimes of which were approximately 4 ns and 14 ns, respectively. These 482
results fit well with the PARAFAC for HLA, which showed two components, one with 483
a simple structure (component 1) and the other with a complex structure (component 2), 484
reflecting lower and higher lifetimes, respectively. The first average lifetime τ1 was 485
almost the same as that for HA (Figure 3d). Lifetime τ2 can be associated with 486
component 2 (Figure 3e), which has a more complex fluorophore structure. 487
Figure 5 488
The average lifetime values were determined to be independent of the copper 489
concentration for HA and HLA interaction (Figure 5). This suggests that the mechanism 490
of Cu(II) quenching by fluorescence occurs with a non-fluorescent ground-state 491
complex, i.e., the complexation occurs by static quenching. Nouhi (2018) also reported 492
static quenching and similar lifetime values for interaction between Cu(II) and Eu(III) 493
with HA extracted from the Saint Lawrence Estuary in Canada (Nouhi, 2018). 494
In summary, this study demonstrated the potential of fluorescence quenching 495
and TRF for evaluating the interaction between metallic species and organic matter, 496
which provides insight into the interaction mechanism. No previous studies related to 497
fluorescence quenching and lifetime measurements of HA extracted from Amazonian 498
TM and HLA from hydrochars with metallic species are available for comparison with 499
the results achieved here. 500
21
501
4. Conclusion 502
HLA were obtained by NaOH aqueous solution extraction from hydrochar 503
produced by the HTC process using sugarcane industry by-products. These HLA 504
showed greater complexation capacity with Cu(II) ions than the HA extracted from TM. 505
In addition, similar values for stability constants for both HA and HLA were observed. 506
The interaction with Cu(II) in HLA occurs by both aromatic and aliphatic moieties, 507
showing that π-π interaction and oxygen groups are not the only factors that play 508
important roles in the CC. Furthermore, the TRF for the interaction of metallic species 509
and organic matter showed that the main interaction mechanism was static quenching. 510
These results show that HLA extracted from hydrochars can be an efficient approach for 511
interacting with metals and can be a new tool for remediating areas contaminated by 512
metals. 513
514
Acknowledgments 515
This work was supported by the São Paulo Research Foundation (FAPESP) 516
(grants 15/22954-1, 17/26718-6, and 18/15733-7). J.V.S acknowledges a scholarship 517
from FAPESP (grants 17/05408-9 and 18/09914-9). O.P.F acknowledges financial 518
support from FUNCAP (PRONEX PR2-0101-00006.01.00/15). The authors thank Dr. 519
Maurício Boscolo for offering assistance with the FTIR analysis (process 2017/13230-520
5) and Dr. Isabella Constatino and Dr. Fabiana Paschoal for their assistance with soil 521
sampling. 522
523
References 524
Andreazza, R., Okeke, B.C., Lambais, M.R., Bortolon, L., de Melo, G.W.B., de Oliveira 525
22
Camargo, F.A., 2010. Bacterial stimulation of copper phytoaccumulation by 526
bioaugmentation with rhizosphere bacteria. Chemosphere 81, 1149–1154. 527
https://doi.org/10.1016/j.chemosphere.2010.09.047 528
Bento, L. R.; Melo, C. A.; Ferreira, O. P.; Moreira, A. B.; Mounier, S.; Piccolo, A.; 529
Spaccini, R.; Bisinoti, M.C., 2020. Humic extracts of hydrochar and Amazonian 530
Dark Earth: Molecular characteristics and effects on maize seed germination. Sci. 531
Total Environ. https://doi.org/10.1016/j.scitotenv.2019.135000 532
Bento, L.R., Melo, C.A., Ferreira, O.P., Moreira, B., Mounier, S., Piccolo, A., Spaccini, 533
R., Bisinoti, M.C., 2019. Humic extracts of hydrochar and Amazonian Dark Earth: 534
Molecular characteristics and effects on maize seed germination. Sci. Total 535
Environ. 135000. https://doi.org/10.1016/j.scitotenv.2019.135000 536
Budziak, C.R., Maia, C.M.B.F., Mangrich, A.S., 2004. Transformações químicas da 537
matéria orgânica durante a compostagem de resíduos da indústria madeireira. 538
Quim. Nova 27, 399–403. https://doi.org/10.1590/S0100-40422004000300007 539
Canellas, L.P., Façanha, A.R., 2004. Chemical nature of soil humified fractions and 540
their bioactivity. Pesqui. Agropecu. Bras. 39, 233–240. 541
https://doi.org/10.1590/S0100-204X2004000300005 542
Chen, J., Chen, H., Zhang, X.W., Lei, K., Kenny, J.E., 2015. Combination of a Copper-543
Ion Selective Electrode and Fluorometric Titration for the Determination of 544
Copper(II) Ion Conditional Stability Constants of Humic Substances. Acta radiol. 545
56, 1293–1302. https://doi.org/10.1366/14-07835 546
Coble, P.G., 1996. Characterization of marine and terrestrial DOM in the seawater using 547
exciting-emission matrix. Mar. Chem. 51, 325–346. https://doi.org/10.1016/0304-548
4203(95)00062-3 549
23
Dick, D. P.; Santos, J. H. Z.; Ferranti, E.M., 2003. Chemical Characterization and 550
Infrared Spectroscopy of Soil Organic Matter From Two Southern Brazilian Soils ( 551
1 ). Rev. Bras. Cienc. do Solo 27, 29–39. https://doi.org/10.1590/S0100-552
06832003000100004 553
El-Naggar, A., Lee, M.H., Hur, J., Lee, Y.H., Igalavithana, A.D., Shaheen, S.M., Ryu, 554
C., Rinklebe, J., Tsang, D.C.W., Ok, Y.S., 2020. Biochar-induced metal 555
immobilization and soil biogeochemical process: An integrated mechanistic 556
approach. Sci. Total Environ. 698, 134112. 557
https://doi.org/10.1016/j.scitotenv.2019.134112 558
Elkins, K.M., Nelson, D.J., 2002. Spectroscopic approaches to the study of the 559
interaction of aluminum with humic substances. Coord. Chem. Rev. 228, 205–225. 560
https://doi.org/10.1016/S0010-8545(02)00040-1 561
Esteves, V.I., Otero, M., Duarte, A.C., 2009. Comparative characterization of humic 562
substances from the open ocean, estuarine water and fresh water. Org. Geochem. 563
40, 942–950. https://doi.org/10.1016/j.orggeochem.2009.06.006 564
Fernandes, A.N., Giovanela, M., Esteves, V.I., Sierra, M.M. de S., 2010. Elemental and 565
spectral properties of peat and soil samples and their respective humic substances. 566
J. Mol. Struct. 971, 33–38. https://doi.org/10.1016/j.molstruc.2010.02.069 567
Francioso, O., Sánchez-Cortés, S., Casarini, D., Garcia-Ramos, J. V., Ciavatta, C., 568
Gessa, C., 2002. Spectroscopic study of humic acids fractionated by means of 569
tangential ultrafiltration. J. Mol. Struct. 609, 137–147. 570
https://doi.org/10.1016/S0022-2860(01)00971-1 571
Fregolente, L.G., Miguel, T.B.A.R., de Castro Miguel, E., de Almeida Melo, C., 572
Moreira, A.B., Ferreira, O.P., Bisinoti, M.C., 2018. Toxicity evaluation of process 573
24
water from hydrothermal carbonization of sugarcane industry by-products. 574
Environ. Sci. Pollut. Res. 1–11. https://doi.org/10.1007/s11356-018-1771-2 575
Fu, F., Wang, Q., 2011. Removal of heavy metal ions from wastewaters: A review. J. 576
Environ. Manage. 92, 407–418. https://doi.org/10.1016/j.jenvman.2010.11.011 577
Fuentes, M., Olaetxea, M., Baigorri, R., Zamarreño, A.M., Etienne, P., Laîné, P., Ourry, 578
A., Yvin, J.C., Garcia-Mina, J.M., 2013. Main binding sites involved in Fe(III) and 579
Cu(II) complexation in humic-based structures. J. Geochemical Explor. 129, 14–580
17. https://doi.org/10.1016/j.gexplo.2012.12.015 581
Fukushima, M., Okabe, R., Nishimoto, R., Fukuchi, S., Sato, T., Terashima, M., 2014. 582
Adsorption of pentachlorophenol to a humin-like substance-bentonite complex 583
prepared by polycondensation reactions of humic precursors. Appl. Clay Sci. 87, 584
136–141. https://doi.org/10.1016/j.clay.2013.10.022 585
Giovanela, M., Crespo, J.S., Antunes, M., Adamatti, D.S., Fernandes, A.N., Barison, A., 586
Da Silva, C.W.P., Guégan, R., Motelica-Heino, M., Sierra, M.M.D., 2010. 587
Chemical and spectroscopic characterization of humic acids extracted from the 588
bottom sediments of a Brazilian subtropical microbasin. J. Mol. Struct. 981, 111–589
119. https://doi.org/10.1016/j.molstruc.2010.07.038 590
Glaser, B., Balashov, E., Haumaier, L., Guggenberger, G., Zech, W., 2000. Black 591
carbon in density fractions of anthropogenic soils of the Brazilian Amazon region. 592
Org. Geochem. 31. https://doi.org/10.1016/S0146-6380(00)00044-9 593
Guo, X., Jiang, J., Xi, B., He, X., Zhang, H., Deng, Y., 2012. Study on the spectral and 594
Cu (II) binding characteristics of DOM leached from soils and lake sediments in 595
the Hetao region. Environ. Sci. Pollut. Res. 19, 2079–2087. 596
https://doi.org/10.1007/s11356-011-0704-0 597
25
Guo, X. jing, Zhu, N. min, Chen, L., Yuan, D. hai, He, L. sheng, 2015. Characterizing 598
the fluorescent properties and copper complexation of dissolved organic matter in 599
saline-alkali soils using fluorescence excitation-emission matrix and parallel factor 600
analysis. J. Soils Sediments 15, 1473–1482. https://doi.org/10.1007/s11368-015-601
1113-7 602
He, E., Lü, C., He, J., Zhao, B., Wang, J., Zhang, R., Ding, T., 2016. Binding 603
characteristics of Cu2+ to natural humic acid fractions sequentially extracted from 604
the lake sediments. Environ. Sci. Pollut. Res. 23, 22667–22677. 605
https://doi.org/10.1007/s11356-016-7487-2 606
Hernández, D., Plaza, C., Senesi, N., Polo, A., 2006. Detection of Copper(II) and 607
zinc(II) binding to humic acids from pig slurry and amended soils by fluorescence 608
spectroscopy. Environ. Pollut. 143, 212–220. 609
https://doi.org/10.1016/j.envpol.2005.11.038 610
Hladun, K.R., Parker, D.R., Trumble, J.T., 2015. Cadmium, Copper, and Lead 611
Accumulation and Bioconcentration in the Vegetative and Reproductive Organs of 612
Raphanus sativus: Implications for Plant Performance and Pollination. J. Chem. 613
Ecol. 41, 386–395. https://doi.org/10.1007/s10886-015-0569-7 614
Jindo, K., Sánchez-Monedero, M.A., Matsumoto, K., Sonoki, T., 2019. The efficiency 615
of a low dose of biochar in enhancing the aromaticity of humic-like substance 616
extracted from poultry manure compost. Agronomy 9, 1–10. 617
https://doi.org/10.3390/agronomy9050248 618
Jindo, K., Sonoki, T., Matsumoto, K., Canellas, L., Roig, A., Sanchez-Monedero, M.A., 619
2016. Influence of biochar addition on the humic substances of composting 620
manures. Waste Manag. 49, 545–552. 621
26
https://doi.org/10.1016/j.wasman.2016.01.007 622
Kabadayi Catalkopru, A., Kantarli, I.C., Yanik, J., 2017. Effects of spent liquor 623
recirculation in hydrothermal carbonization. Bioresour. Technol. 226, 89–93. 624
https://doi.org/10.1016/j.biortech.2016.12.015 625
Kulikowska, D., Gusiatin, Z.M., Bułkowska, K., Klik, B., 2015. Feasibility of using 626
humic substances from compost to remove heavy metals (Cd, Cu, Ni, Pb, Zn) from 627
contaminated soil aged for different periods of time. J. Hazard. Mater. 300, 882–628
891. https://doi.org/10.1016/j.jhazmat.2015.08.022 629
Lakowics, J.R., 1999. Principles of fluorescence spectroscopy, 2nd ed. New York: 630
Kluwer Academic/ Plenum Publisher. 631
Lesmana, S.O., Febriana, N., Soetaredjo, F.E., Sunarso, J., Ismadji, S., 2009. Studies on 632
potential applications of biomass for the separation of heavy metals from water and 633
wastewater. Biochem. Eng. J. 44, 19–41. https://doi.org/10.1016/j.bej.2008.12.009 634
Li, Z., Ma, Z., van der Kuijp, T.J., Yuan, Z., Huang, L., 2014. A review of soil heavy 635
metal pollution from mines in China: Pollution and health risk assessment. Sci. 636
Total Environ. 468–469, 843–853. https://doi.org/10.1016/j.scitotenv.2013.08.090 637
Lu, Y., Allen, H.E., 2002. Characterization of copper complexation with natural 638
dissolved organic matter (DOM) - Link to acidic moieties of DOM and 639
competition by Ca and Mg. Water Res. 36, 5083–5101. 640
https://doi.org/10.1016/S0043-1354(02)00240-3 641
MacKie, K.A., Müller, T., Kandeler, E., 2012. Remediation of copper in vineyards - A 642
mini review. Environ. Pollut. 167, 16–26. 643
https://doi.org/10.1016/j.envpol.2012.03.023 644
27
Mao, J., Chen, N., Cao, X., 2011. Characterization of humic substances by advanced 645
solid state NMR spectroscopy: Demonstration of a systematic approach. Org. 646
Geochem. 42, 891–902. https://doi.org/10.1016/j.orggeochem.2011.03.023 647
Matthews, B.J.H., Jones, A.C., Theodorou, N.K., Tudhope, A.W., 1996. Excitation-648
emission-matrix fluorescence spectroscopy applied to humic acid bands in coral 649
reefs. Mar. Chem. 55, 317–332. https://doi.org/10.1016/S0304-4203(96)00039-4 650
Mazzei, P., Piccolo, A., 2012. Quantitative evaluation of noncovalent interactions 651
between glyphosate and dissolved humic substances by NMR spectroscopy. 652
Environ. Sci. Technol. 46, 5939–5946. https://doi.org/10.1021/es300265a 653
Melo, C.A., Junior, F.H.S., Bisinoti, M.C., Moreira, A.B., Ferreira, O.P., 2017. 654
Transforming sugarcane bagasse and vinasse wastes into hydrochar in the presence 655
of phosphoric acid: an evaluation of nutrient contents and structural properties. 656
Waste and Biomass Valorization 1139–1151. https://doi.org/10.1007/s12649-016-657
9664-4 658
Monda, H., Cozzolino, V., Vinci, G., Drosos, M., Savy, D., Piccolo, A., 2018. 659
Molecular composition of the Humeome extracted from different green composts 660
and their biostimulation on early growth of maize. Plant Soil 429, 407–424. 661
https://doi.org/10.1007/s11104-018-3642-5 662
Monda, H., Cozzolino, V., Vinci, G., Spaccini, R., Piccolo, A., 2017. Molecular 663
characteristics of water-extractable organic matter from different composted 664
biomasses and their effects on seed germination and early growth of maize. Sci. 665
Total Environ. 590–591, 40–49. https://doi.org/10.1016/j.scitotenv.2017.03.026 666
Mounier, S., Zhao, H., Garnier, C., Redon, R., 2011. Copper complexing properties of 667
dissolved organic matter: PARAFAC treatment of fluorescence quenching. 668
28
Biogeochemistry 106, 107–116. https://doi.org/10.1007/s10533-010-9486-6 669
Mulligan, C.N., 2009. Recent advances in the environmental applications of 670
biosurfactants. Curr. Opin. Colloid Interface Sci. 14, 372–378. 671
https://doi.org/10.1016/j.cocis.2009.06.005 672
Mulligan, C.N., Yong, R.N., Gibbs, B.F., 2001. Heavy metal removal from sediments 673
by biosurfactants. J. Hazard. Mater. 85, 111–125. https://doi.org/10.1016/S0304-674
3894(01)00224-2 675
Nouhi, A., 2018. Caractérisation Spectrale et Temporelle par Quenching de 676
Fluorescence des Interactions Matière Organique-Eléments Métalliques. Universté 677
de Toulon. 678
Nouhi, A., Hajjoul, H., Redon, R., Gagné, J.P., Mounier, S., 2018. Time-resolved laser 679
fluorescence spectroscopy of organic ligands by europium: Fluorescence 680
quenching and lifetime properties. Spectrochim. Acta - Part A Mol. Biomol. 681
Spectrosc. 193, 219–225. https://doi.org/10.1016/j.saa.2017.12.028 682
Oliveira, N.C., Paschoal, A.R., Paula, R.J., Constantino, I.C., Bisinoti, M.C., Moreira, 683
A.B., Fregolente, L.G., Santana, A.M., Sousa, F.A., Ferreira, O.P., Paula, A.J., 684
2018. Morphological analysis of soil particles at multiple length-scale reveals 685
nutrient stocks of Amazonian Anthrosols. Geoderma 311, 58–66. 686
https://doi.org/10.1016/j.geoderma.2017.09.034 687
Pearson, R.G., 1963. Hard and Soft Acids and Bases. J. Am. Chem. Soc. 85, 3533–688
3539. https://doi.org/10.1021/ja00905a001 689
Piccolo, A., Spaccini, R., De Martino, A., Scognamiglio, F., di Meo, V., 2019. Soil 690
washing with solutions of humic substances from manure compost removes heavy 691
29
metal contaminants as a function of humic molecular composition. Chemosphere 692
225, 150–156. https://doi.org/10.1016/j.chemosphere.2019.03.019 693
Plaza, C., D’Orazio, V., Senesi, N., 2005. Copper(II) complexation of humic acids from 694
the first generation of EUROSOILS by total luminescence spectroscopy. 695
Geoderma 125, 177–186. https://doi.org/10.1016/j.geoderma.2004.07.012 696
Rajapaksha, A.U., Ok, Y.S., El-Naggar, A., Kim, H., Song, F., Kang, S., Tsang, Y.F., 697
2019. Dissolved organic matter characterization of biochars produced from 698
different feedstock materials. J. Environ. Manage. 233, 393–399. 699
https://doi.org/10.1016/j.jenvman.2018.12.069 700
Ryan, D.K., Weber, J.H., 1982. Fluorescence Quenching Titration for Determination of 701
Complexing Capacities and Stability Constants of Fulvic Acid. Anal. Chem. 54, 702
986–990. https://doi.org/10.1021/ac00243a033 703
Senesi, N., D’Orazio, V., Ricca, G., 2003. Humic acids in the first generation of 704
EUROSOILS. Geoderma 116, 325–344. https://doi.org/10.1016/S0016-705
7061(03)00107-1 706
Silva, C.C., Melo, C.A., Soares Junior, F.H., Moreira, A.B., Ferreira, O.P., Bisinoti, 707
M.C., 2017. Effect of the reaction medium on the immobilization of nutrients in 708
hydrochars obtained using sugarcane industry residues. Bioresour. Technol. 237, 709
213–221. https://doi.org/10.1016/j.biortech.2017.04.004 710
Spaccini, R., Cozzolino, V., Di Meo, V., Savy, D., Drosos, M., Piccolo, A., 2019. 711
Bioactivity of humic substances and water extracts from compost made by ligno-712
cellulose wastes from biorefinery. Sci. Total Environ. 646, 792–800. 713
https://doi.org/10.1016/j.scitotenv.2018.07.334 714
30
Spaccini, R., Piccolo, A., 2009. Molecular characteristics of humic acids extracted from 715
compost at increasing maturity stages. Soil Biol. Biochem. 41, 1164–1172. 716
https://doi.org/10.1016/j.soilbio.2009.02.026 717
Stedmon, C.A., Bro, R., 2008. Characterizing dissolved organic matter fluorescence 718
with parallel factor analysis: a tutorial. Limnol. Oceanogr. 6, 1–8. 719
https://doi.org/10.4319/lom.2008.6.572 720
Stedmon, C.A., Markager, S., Bro, R., 2003. Tracing dissolved organic matter in aquatic 721
environments using a new approach to fluorescence spectroscopy. Mar. Chem. 82, 722
239–254. https://doi.org/10.1016/S0304-4203(03)00072-0 723
Stemann, J., Putschew, A., Ziegler, F., 2013. Hydrothermal carbonization: Process 724
water characterization and effects of water recirculation. Bioresour. Technol. 143, 725
139–146. https://doi.org/10.1016/j.biortech.2013.05.098 726
Stevenson, F.J., 1994. Humus chemistry: Genesis, composition, and reactions. New 727
York John Wiley Sons. 728
Swift, R.S., 1996. Methods of soil analysis. Part 3. Chemical methods. Soil Sci. Soc. 729
Am. 1011–1020. 730
Tadini, A. M.; Mounier, S.; Milori, D.M.B.P., 2019. Modeling the quenching of 731
fluorescence from organic matter in Amazonian soils. Sci. Total Environ. 698, 732
134067. https://doi.org/10.1016/j.scitotenv.2019.134067 733
Tadini, A.M., Constantino, I.C., Nuzzo, A., Spaccini, R., Piccolo, A., Moreira, A.B., 734
Bisinoti, M.C., 2015. Characterization of typical aquatic humic substances in areas 735
of sugarcane cultivation in Brazil using tetramethylammonium hydroxide 736
thermochemolysis. Sci. Total Environ. 518–519, 201–208. 737
31
https://doi.org/10.1016/j.scitotenv.2015.02.103 738
Tang, W.W., Zeng, G.M., Gong, J.L., Liang, J., Xu, P., Zhang, C., Huang, B. Bin, 2014. 739
Impact of humic/fulvic acid on the removal of heavy metals from aqueous 740
solutions using nanomaterials: A review. Sci. Total Environ. 468–469, 1014–1027. 741
https://doi.org/10.1016/j.scitotenv.2013.09.044 742
US EPA, 2000. Environmental Protection Agency, Environmental Response Team. 743
Standard operating procedures – SOP 1–4. 744
Uyguner, C.S., Bekbolet, M., 2005. Evaluation of humic acid photocatalytic degradation 745
by UV-vis and fluorescence spectroscopy. Catal. Today 101, 267–274. 746
https://doi.org/10.1016/j.cattod.2005.03.011 747
Weiner, B., Poerschmann, J., Wedwitschka, H., Koehler, R., Kopinke, F.D., 2014. 748
Influence of Process Water Reuse on Hydrothermal Carbonization of Paper. 749
Sustain. Chem. Eng. 2, 2165–2171. https://doi.org/10.1021/sc500348v 750
Yang, F., Zhang, S., Cheng, K., Antonietti, M., 2019. A hydrothermal process to turn 751
waste biomass into artificial fulvic and humic acids for soil remediation. Sci. Total 752
Environ. 686, 1140–1151. https://doi.org/10.1016/j.scitotenv.2019.06.045 753
Yang, X., Tsibart, A., Nam, H., Hur, J., El-Naggar, A., Tack, F.M.G., Wang, C.H., Lee, 754
Y.H., Tsang, D.C.W., Ok, Y.S., 2019. Effect of gasification biochar application on 755
soil quality: Trace metal behavior, microbial community, and soil dissolved 756
organic matter. J. Hazard. Mater. 365, 684–694. 757
https://doi.org/10.1016/j.jhazmat.2018.11.042 758
Yuan, D.H., Guo, X.J., Wen, L., He, L.S., Wang, J.G., Li, J.Q., 2015. Detection of 759
Copper (II) and Cadmium (II) binding to dissolved organic matter from 760
32
macrophyte decomposition by fluorescence excitation-emission matrix spectra 761
combined with parallel factor analysis. Environ. Pollut. 204, 152–160. 762
https://doi.org/10.1016/j.envpol.2015.04.030 763
Zherebtsov, S.I., Malyshenko, N. V., Bryukhovetskaya, L. V., Lyrshchikov, S.Y., 764
Ismagilov, Z.R., 2015. Sorption of copper cations from aqueous solutions by 765
brown coals and humic acids. Solid Fuel Chem. 49, 294–303. 766
https://doi.org/10.3103/S0361521915050110 767
768
769
770
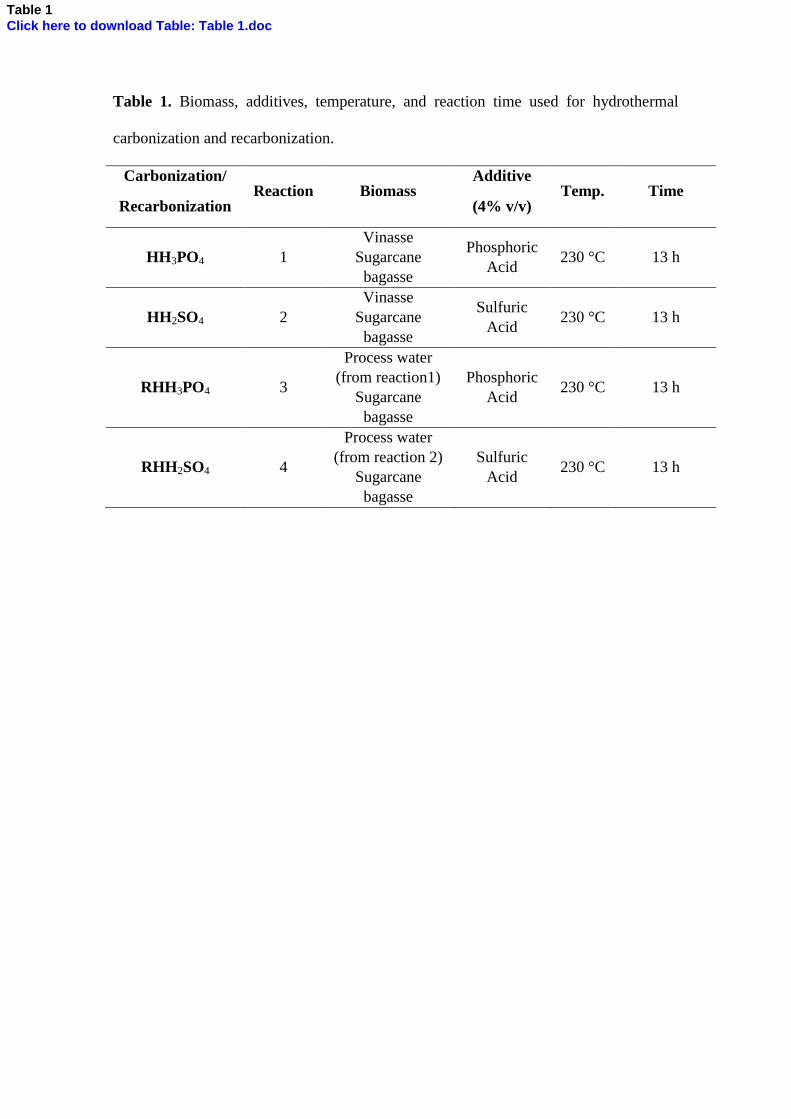
Table 1. Biomass, additives, temperature, and reaction time used for hydrothermal
carbonization and recarbonization.
Carbonization/
Recarbonization Reaction Biomass
Additive
(4% v/v) Temp. Time
HH3PO4 1
Vinasse
Sugarcane
bagasse
Phosphoric
Acid 230 °C 13 h
HH2SO4 2
Vinasse
Sugarcane
bagasse
Sulfuric
Acid 230 °C 13 h
RHH3PO4 3
Process water
(from reaction1)
Sugarcane
bagasse
Phosphoric
Acid 230 °C 13 h
RHH2SO4 4
Process water
(from reaction 2)
Sugarcane
bagasse
Sulfuric
Acid 230 °C 13 h
Table 1Click here to download Table: Table 1.doc
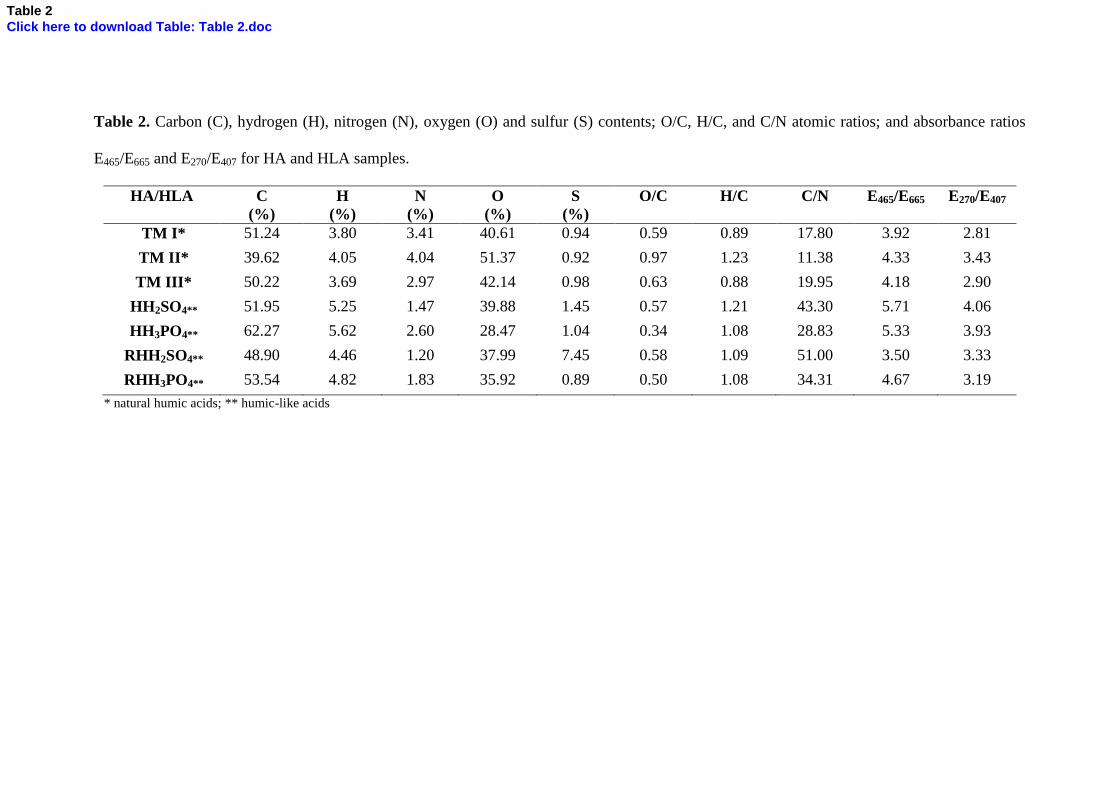
Table 2. Carbon (C), hydrogen (H), nitrogen (N), oxygen (O) and sulfur (S) contents; O/C, H/C, and C/N atomic ratios; and absorbance ratios
E465/E665 and E270/E407 for HA and HLA samples.
HA/HLA C
(%)
H
(%)
N
(%)
O
(%)
S
(%)
O/C H/C C/N E465/E665 E270/E407
TM I* 51.24 3.80 3.41 40.61 0.94 0.59 0.89 17.80 3.92 2.81
TM II* 39.62 4.05 4.04 51.37 0.92 0.97 1.23 11.38 4.33 3.43
TM III* 50.22 3.69 2.97 42.14 0.98 0.63 0.88 19.95 4.18 2.90
HH2SO4** 51.95 5.25 1.47 39.88 1.45 0.57 1.21 43.30 5.71 4.06
HH3PO4** 62.27 5.62 2.60 28.47 1.04 0.34 1.08 28.83 5.33 3.93
RHH2SO4** 48.90 4.46 1.20 37.99 7.45 0.58 1.09 51.00 3.50 3.33
RHH3PO4** 53.54 4.82 1.83 35.92 0.89 0.50 1.08 34.31 4.67 3.19
* natural humic acids; ** humic-like acids
Table 2Click here to download Table: Table 2.doc
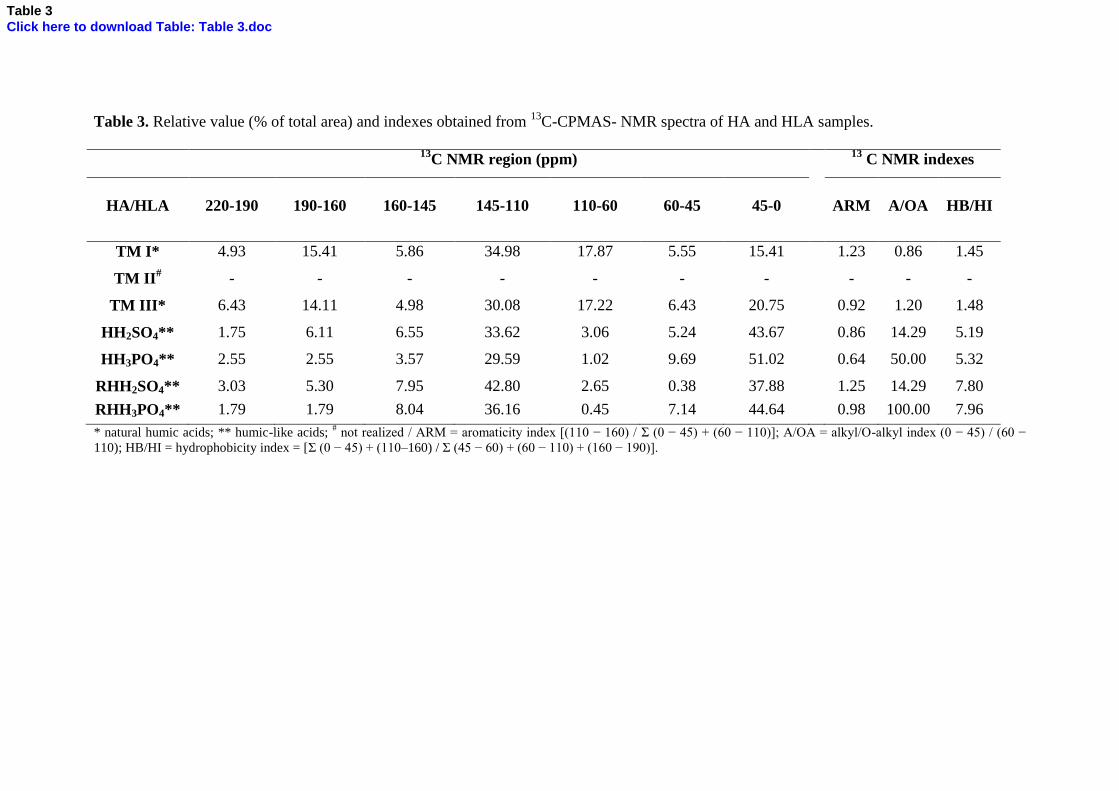
Table 3. Relative value (% of total area) and indexes obtained from 13
C-CPMAS- NMR spectra of HA and HLA samples.
13C NMR region (ppm)
13 C NMR indexes
HA/HLA
220-190
190-160
160-145
145-110
110-60
60-45
45-0
ARM
A/OA
HB/HI
TM I* 4.93 15.41 5.86 34.98 17.87 5.55 15.41 1.23 0.86 1.45
TM II# - - - - - - - - - -
TM III* 6.43 14.11 4.98 30.08 17.22 6.43 20.75 0.92 1.20 1.48
HH2SO4** 1.75 6.11 6.55 33.62 3.06 5.24 43.67 0.86 14.29 5.19
HH3PO4** 2.55 2.55 3.57 29.59 1.02 9.69 51.02 0.64 50.00 5.32
RHH2SO4** 3.03 5.30 7.95 42.80 2.65 0.38 37.88 1.25 14.29 7.80
RHH3PO4** 1.79 1.79 8.04 36.16 0.45 7.14 44.64 0.98 100.00 7.96
* natural humic acids; ** humic-like acids; # not realized / ARM = aromaticity index [(110 − 160) / Σ (0 − 45) + (60 − 110)]; A/OA = alkyl/O-alkyl index (0 − 45) / (60 −
110); HB/HI = hydrophobicity index = [Σ (0 − 45) + (110–160) / Σ (45 − 60) + (60 − 110) + (160 − 190)].
Table 3Click here to download Table: Table 3.doc
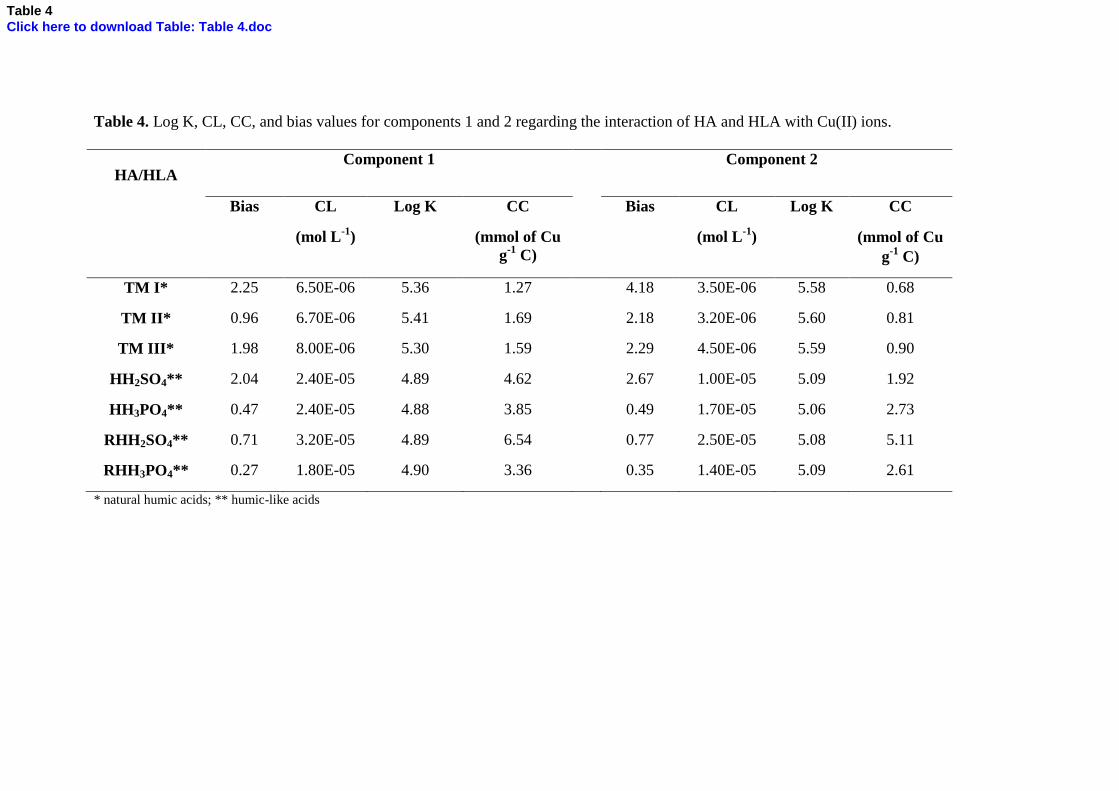
Table 4. Log K, CL, CC, and bias values for components 1 and 2 regarding the interaction of HA and HLA with Cu(II) ions.
HA/HLA Component 1 Component 2
Bias CL
(mol L-1
)
Log K CC
(mmol of Cu
g-1
C)
Bias CL
(mol L-1
)
Log K CC
(mmol of Cu
g-1
C)
TM I* 2.25 6.50E-06 5.36 1.27 4.18 3.50E-06 5.58 0.68
TM II* 0.96 6.70E-06 5.41 1.69 2.18 3.20E-06 5.60 0.81
TM III* 1.98 8.00E-06 5.30 1.59 2.29 4.50E-06 5.59 0.90
HH2SO4** 2.04 2.40E-05 4.89 4.62 2.67 1.00E-05 5.09 1.92
HH3PO4** 0.47 2.40E-05 4.88 3.85 0.49 1.70E-05 5.06 2.73
RHH2SO4** 0.71 3.20E-05 4.89 6.54 0.77 2.50E-05 5.08 5.11
RHH3PO4** 0.27 1.80E-05 4.90 3.36 0.35 1.40E-05 5.09 2.61
* natural humic acids; ** humic-like acids
Table 4Click here to download Table: Table 4.doc
4000 3500 3000 2500 2000 1500 1000 500
(C-H
)
(C-H
)
HLA
HH2SO
4
HLA
HH3PO
4
HLA
RHH2SO
4
(Si-O
)
(C-O
)
(C=C
)
(O-H
)
HLA
RHH3PO
4
Wavenumber (cm-1)
(a)
4000 3500 3000 2500 2000 1500 1000 500
(C=O
)
(Si-O
)
(C-O
)
(C=C
)
(C-H
)
(OH)
HA
TM I
HA
TM II
Wavenumber (cm-1
)
HA
TM III
(b)
Fig.1. FTIR spectra for HLA isolated from hydrochar (a) and HA isolated from soil (b).
Figure 1Click here to download Figure: Figure 1.doc
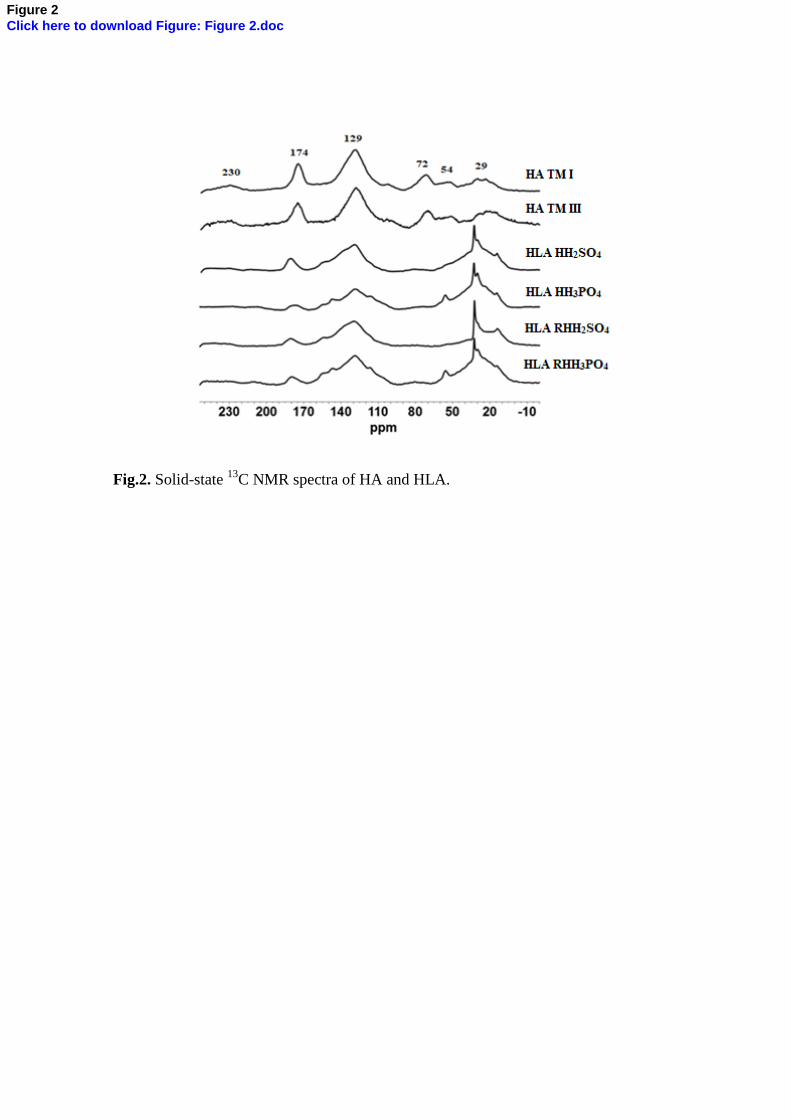
Fig.2. Solid-state 13
C NMR spectra of HA and HLA.
Figure 2Click here to download Figure: Figure 2.doc
(a)
(b)
(c)
(d)
(e)
(f)
Fig. 3. Components 1, 2, and 3 obtained by CP/PARAFAC for interaction of HA (a, b
and c, respectively) and components 1, 2, and 3 for interaction of HLA (d, e and f,
respectively) with Cu(II) ions.
Figure 3Click here to download Figure: Figure 3.doc
-8 -7 -6 -5 -4 -30
20
40
60
80
100
F
luo
res
ce
nc
e i
nte
ns
ity
(%
)
Log [Cu(II)] mol L-1
Component 1
Component 2
(a)
-8 -7 -6 -5 -4 -30
20
40
60
80
100
Flu
ore
sc
en
ce
in
ten
sit
y (
%)
Log [Cu(II)] mol L-1
Component 1
Component 2
(b)
Fig. 4. Contribution of relative fluorescence intensity for components 1 and 2 regarding
the interaction of TM I HA (a) and HH2SO4 HLA (b) with Cu (II) ions.
Figure 4Click here to download Figure: Figure 4.doc
0
2
4
6
8
10
12
14
16
18
20
22
Av
era
ge
flu
ore
sc
en
ce
lif
eti
me
(n
s)
HA_C0
HA_C0.7
HA_C5.6
TM I
1
TM II
1
TM III
1
(a)
0
2
4
6
8
10
12
14
16
18
20
22
2
HH2SO4
HLA_C0
HLA_C0.7
HLA_C5.6
Av
era
ge
flu
ore
sc
en
ce
lif
eti
me
(n
s)
1
2
HH3PO4
1
2
RHH2SO4
1
2
RHH3PO4
1
(b)
Fig. 5. Average fluorescence lifetime distribution for HA (τ1) (a) and HLA (τ1 and τ2) (b) when interacting with Cu(II) ions at concentration:
C0 = no copper added, C0.7 = 0.7 mg L-1
and C5.6 = 5.6 mg L-1
.
Figure 5Click here to download Figure: Figure 5.doc