Embed Size (px)
Citation preview
Pergamon Chemosphere, Vol. 39, No. 11, pp. 1957-1969, 1999 © 1999 Elsevier Science Ltd. All rights reserved
0045-6535/99/$ - see front ter
Plh S0045-6535(99)00077-6
BIODEGRADATION KINETICS OF SURFACTANTS IN SEAWATER
Ouiro~a J. M(*), Perales J.A., Romero L. I., Sales D.
Dept. of Chemical Engineering, Food Technology and Environmental Technology
Faculty of Sea Science. University of Cfidiz
Campus Rio San Pedro s/n, 11510 Puerto Real, Cfidiz (Spain)
(Received in Switzerland 6 November 1998; accepted 10 March 1999)
(*) Author to whom all correspondence should be addressed
ABSTRACT
In this paper, a general kinetic model for degradation processes of surfactants is proposed. The model
equation is v = K2 S 2 + K1 S + K o , where v is the substrate consumption rate in the biodegradation process,
S is the surfactant concentration in the medium and K2, K1, and Ko are kinetic constants. From this general
expression, different simplified equations can be obtained (where Ko = 0 ; 1(,2 and Ko = 0 ; K2 = 0 ; K2 and K/
= 0), which are representative of the process for different operating conditions. This model was tested by
measuring the degradation of two different surfactants (Sodium dodecyl benzene sulfonate, LAS; and
Sodium dodecyl sulfate, DSNa) under two different temperatures (5 and 20°C). Values predicted by the
model are close to experimental data obtained. ©1999 Elsevier Science Ltd. All rights reserved
1. INTRODUCTION
Although removal of an organic chemical from an environmental compartment can take place by
abiotic processes such as hydrolysis, photolysis, adsorption onto particular matter and volatilisation into the
atmosphere, its complete conversion into mainly inorganic products is invariably due to microbial activity.
This process, termed ultimate biodegradation, results in a conversion of the compound into CO2, H20,
inorganic salts, new microbial biomass and organic products associated with the normal metabolic processes
of bacteria.
The biodegradation of surfactants has been studied for many years [1, 2] and is still being
investigated [3, 4]. However, most studies of the biodegradation of this type of substance deal with the
1957
1958
determination of the metabolic degradation pathway [5, 6], the relation between structure and
biodegradability, [7, 8, 9], the behaviour in Waste Water Treatment Plants (WWTP) [10, 11] or the levels in
the environment [12, 13]. Nevertheless, very few authors have undertaken a study of the basic kinetic
parameters of surfactant degradation, which would provide fundamental information for the study of their
environmental behaviour. However, biodegradation data are important factors in the development of
mathematical models for predicting the distribution and concentration of synthetic chemicals in the
environment [14, 15, 16].
In this paper, the effect of test conditions on the kinetics of for generating such data will be
discussed. Lastly, an experimental approach for producing environmentally realistic kinetic information will
be outlined.
2. KINETIC MODELS FOR DESCRIBING BIODEGRADATION PROCESSES
The kinetics of biodegradation have been described by a variety of mathematical expressions,
increasing in complexity as they attempt to accommodate more of the many variables which can affect the
rate of biological removal of an organic chemical in the environment.
The kinetic biodegradation process can be described from two different perspectives, by means of :
a) microorganism growth models ; and b) substrate consumption models
2.1 Microorganism growth models
The degradation kinetics of particular substrates have been studied by many authors [17,18], by
relating them to the growth dynamics of the microorganism population. The classic method suggested by
Monod [19] is widely accepted because it is simple; using only two parameters it can predict the transition
between zero order and first order kinetics, which occurs in fermentation processes after a decrease in the
level of substrate present in the medium, and the parameters used have a clear physical interpretation.
However, Monod's model is not based on a clear mechanism and the equation implies that the
specific growth rate is not equal to zero for any f'mite value of substrate concentration, that the influence of
the initial concentrations on the growth rate is not taken into account, the physiological state and the
population history of the microorganisms are not taken into consideration and the Monod's model does not
take full account of all phases of microorganism growth (the lag phase and the death phase are not well
described).
All these factors have led to a large number of bacterial growth models [20,21] based on Monod's
original approach, which include some of the factors mentioned above.
So-called logistic models are also among the classic models. They are based on Malthus' Law [ 17].
The best known logistic model is that of Pearl & Reed [22] who introduced a factor of inhibition of
1959
population growth to Malthus' equation. This model has been less widely used than Monod's model for
microorganism growth, for the following reasons: it does not consider the mechanisms of the biological
reactions implied; the relationship between ~t (exponential growth rate) and S is not defined; bacterial
growth is expressed in terms of the viable biomass present in the medium (this parameter is difficult to
determine experimentally) and it does not enable the prediction of population decrease phase, following the
stationary phase, when all available nutrients have been consumed.
This last deficiency was remedied by Volterra [17] by incorporating an integral term which includes
the influence of the population history on the growth rate, a factor which is difficult to evaluate.
As we have seen, these microorganism growth models show some inconveniences. They are not
based on a mechanistic approach. Furthermore, depending on the operating conditions, the type of substrate
used, the microorganisms involved, one particular model must be selected. None of them describe generally
the phenomenon of biodegradation.
2.2 Substrate consumption models
If we accept the fact that microbial growth kinetics cannot be used to predict biodegradation rate
constants, what other rate functions can be used instead?. One possibility is to study the kinetics of the
degradation process itself i.e. by proposing a mechanism for the reaction as a whole, and then developing the
corresponding kinetic expression. This model has only one parameter "S" which is easily quantifiable.
However, in principle, the development of this type of models is extremely complicated since the
degradation of organic material is a heterogeneous process, and the microorganisms involved are usually not
pure cultures
Some of the mathematical equations which have been proposed to describe the kinetics of the
substrate degradation process, are based on curve fitting of the experimental substrate consumption or CO2
production during biodegradation [23].The simplest approximation used by the majority of authors is a
curve fitting of the decrease of the substrate concentration using a first order equation. Some authors [24]
consider this approach to be complete, taking in the account an initial acclimatisation term.
While first order kinetic biodegradation equations are applicable to laboratory experiments, the
reliable use of such rate constants for the environment is doubtful, for there is also evidence that discrete
alterations of some chemicals in surface water samples are highly dependent on population size, making "k"
a second or pseudo first order constant. Thus, pseudo first order kinetics are sometimes observed during
degradation in the laboratory, as indicated by the S shape of the curve of concentration versus time. Larson
[25] explains this shape of curve by the fact that the rate of product formation or substrate consumption is a
function not only of the concentration of product or substrate, but also of time.
Larson's explanation of the S shape of the substrate/time function is feasible, but the procedure is not
strictly correct, because time is considered as a function of the number of microorganisms. It is merely an
artificial means of producing a quadratic equation. If dS/dt really is a function of substrate and bacteria
1960
concentration, then these two variables, not time, should be included in the second term of the equation, and
the resulting differential equation should be integrated.
2.3 Proposed Model
Therefore, it would be better to have a new model with a coherent theoretical base, consistent with
the experimental data obtained, and should be capable of simulating the various more specific equations
proposed by other authors to predict degradation kinetics under specific operating conditions..
Thus, considering a discontinuous reactor to which an organic substrate (S) is added, a slow substrate
conversion rate is observed at the beginning of the test. But because the microorganisms multiply during the
course of the process, the reaction rate increases until a maximum is reached. Then substrate consumption
gradually decreases and this rate falls to zero. This is clearly autocatalytic behaviour, observing the
following equation of reaction rate:
S + n > c o P + a n > V = d S / d t = K v Sn
According to the stoichiometry of the reaction, for each molecule of S consumed, c~ molecules of P are
formed, and ~ microorganisms are produced (or should be >1). If the initial concentration is So and the initial
number of microorganisms is no, when part of the substrate has been consumed and the amount of substrate
remaining in the medium is S, then the result will be "n" microorganisms given by the expression a(S0 - S).
Thus the number of microorganisms in the medium at a given moment (when the experimental measurement
is made) is n-- a(S0 - S)+ no. Substituting this for n in the rate equation gives :
d S - d--~ = Kv S[no + G(So-S ) ] (1)
d S n n
-_~7 = Kv ~ [ ( ~ + So) S - S 2] (2) ta
These equations assume that all the substrate is biodegraded by the microorganisms (S = ST = SB ).
But there is usually a proportion not metabolized by the microorganisms. Therefore, given that:
ST = Sa q- SNB ; SOT = SOB q- SONB ; SNB = SONB
where: ST = total substrate concentration ; SB = biodegradable substrate concentration
SNB = nonbiodegradable substrate concentration ; ST = initial (t = 0) total substrate concentration
SB = initial biodegradable substrate concentration ; S ~ = initial nonbiodegradable substrate concentration
Substituting in (2)
d S
d t - Kv a { [ K + (Sot - SoNs)] ( S t - SNB) - ( S t - S ~ J } (3)
Developing and simplifying this equation:
d S
d t - K2 S~ + KI Sr + Ko
where K2, KI and Ko are:
K., = - K,. o- (5)
(4)
1961
(6)
Ki = K~ cr( n° + SoT - Soun + 2Sun) ~r
Ko = - K~ or( no SuB+ Sot SuB - SouB S ~ + Seun) (7) ¢3r
By separating variables and integrating into equation (4), the relationship between organic material and
degradation time is obtained:
?o a t = i s - a S so K2S2 + K I S + K ° (8) andtherefore: S = h (S° -q ) -q (S° -h )eP ' (So- q)- (So - h) e p' (9)
where: p = [ ( K 1 2 - 4KzK0)I/2I q = (-Kl+p)/2K2 h = (-KI-p)/2K2
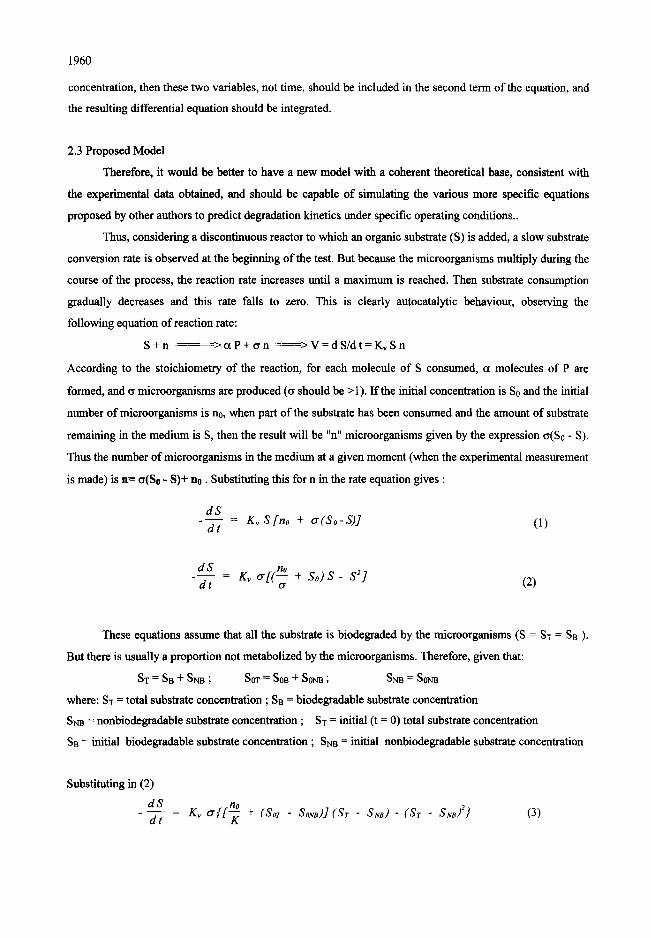
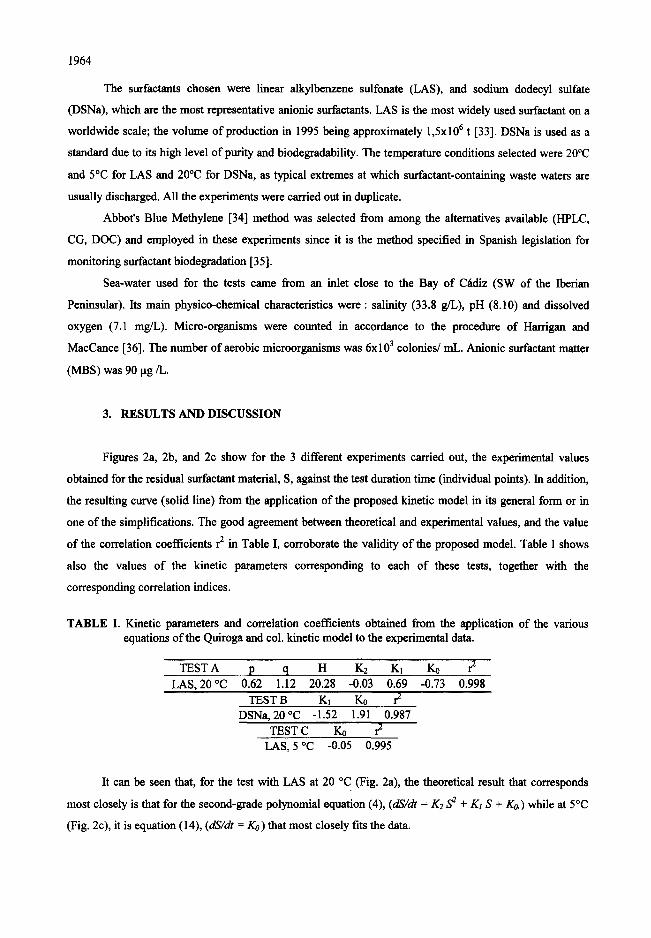
By plotting substrate concentration against time as given by equation (9), the curve shown in Figure
la. is obtained.
The meaning of the kinetic parameters p, q and h can be deduced fxom the mathematical equations
used earlier. From equation (4) it can be deduced that the substrate consumption rate is zero when the
substrate concentration in the medium is equal to q or h, because these are the solutions of this equation. The
implication of the solution S = q is that q represents the minimum possible value for the organic material
concentration Therefore q is the level of nonbiodegradable organic material for this type of microorganism.
The solution S = h implies that h corresponds to the maximum amount of organic material available in the
medium for the formation ofbiomass. Romero [26] found that h can also be given by the equation:
X v o h = + S O (10)
where: Xzo = initial concentration of microorganisms ; Y~v = growth yield and So = initial concentration
of substrate.
Lastly, the term p represents the maximum rate and it can be shown that it is the product of the rate
constant observed, multiplied by the maximum concentration of microorganisms that it is possible to reach
in the medium [27]. In other words, it represents the maximum specific growth rate of those microorganisms
responsible for the biodegradation process, and it is that maximum rate possible when the term K2 from the
equation forp is equal to zero (1£2 = 0).
1962
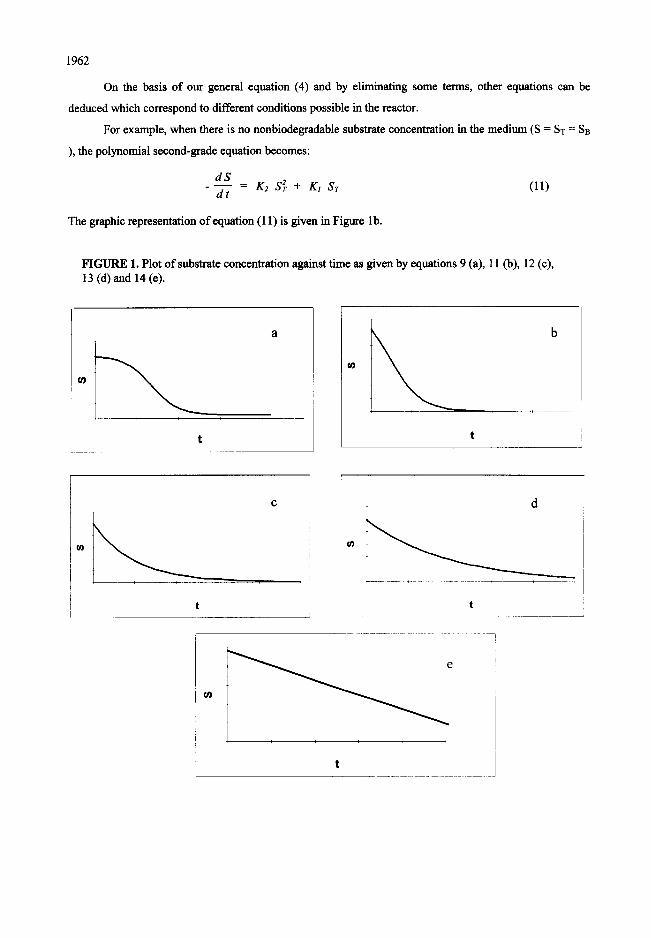
On the basis of our general equation (4) and by eliminating some terms, other equations can be
deduced which correspond to different conditions possible in the reactor.
For example, when there is no nonbiodegradable substrate concentration in the medium (S = ST = SB
), the polynomial second-grade equation becomes:
dS - - - = K2 S~ + KI ST (11)
d t
The graphic representation of equation (11) is given in Figure lb.
FIGURE 1. Plot of substrate concentration against time as given by equations 9 (a), 11 (b), 12 (c), 13 (d) and 14 (e).
i
Ct~
b
t i
i i
e
i i i
t
1963
Considering a process in which not only S~m is zero but the concentration of active microorganisms
remains high and practically constant, it can be shown that the coefficients 1(,2 and Ko in the initial rate
equation (4) are negligible. Thus this equation can be simplified to :
dS V . . . . KjS (12)
dt
The graphic representation of equation (12) is given in Figure lc.
If not all the substrate is biodegradable, then n will again remain constant and the equation will
become :
d S - - - = KI Sr + Ko (13)
d t
The concentration of S against time given by equation (13) is represented in Figure 1 d.
When K2 and K1 are zero, equation (4) is transformed into
dS - d ~ = K o (14)
where the degradation rate of the organic material remains constant and independent of concentration. For
this condition, the representation of substrate concentration against time given by equation (14) is shown in
Figure le.
Our basic equation (4) can also be derived from other theoretical considerations presented by the
same authors in an earlier paper [27]. There, a comparison is made with the models of Volterra and Monod
referred to in the bibliography.
2. MATERIAL AND METHODS
In order to validate the mathematical model proposed here, a series of experiments were carried out
with various substrates (vinasses [27], both anionic [28] and non-ionic surfactants [4]) and under various
experimental conditions (different temperatures [29], concentrations [4], salinity [30 ], darkness [31], light
[31]). The assays were carried out in duplicate and, in some cases, in triplicate and the results obtained in all
experiments showed an excellent fit of the experimental data to the kinetic model proposed. This paper
presents the results obtained for two anionic surfactants in order to show the operating conditions
corresponding to the general equation of the model or to some of its simplifications.
The test method used was the "river die-away" test, fully described in the bibliography and used by
many authors [7, 30]. Briefly, the test consisted of adding a concentration of 20 ppm of the surfactant into
sea water at two representative temperatures. This concentration has been found by various authors [32] near
the discharge outlets of untreated urban waste-water. At pre-set intervals of time, samples were taken for
analysis. A preservative was added to the sample and it was then refrigerated at 5 ° C until its analysis.
1964
The surfactants chosen were linear alkylbenzene sulfonate (LAS), and sodium dodecyl sulfate
(DSNa), which are the most representative anionic surfactants. LAS is the most widely used surfactant on a
worldwide scale; the volume of production in 1995 being approximately 1,5x10⁶ t [33]. DSNa is used as a
standard due to its high level of purity and biodegradability. The temperature conditions selected were 20°C
and 5°C for LAS and 20°C for DSNa, as typical extremes at which surfactant-containing waste waters are
usually discharged. All the experiments were carried out in duplicate.
Abbot's Blue Methylene [34] method was selected from among the alternatives available (HPLC,
CG, DOC) and employed in these experiments since it is the method specified in Spanish legislation for
monitoring surfactant biodegradation [35].
Sea-water used for the tests came from an inlet close to the Bay of Cadiz (SW of the Iberian
Peninsular). Its main physico-chemical characteristics were: salinity (33.8 g/L), pH (8.10) and dissolved
oxygen (7.1 mg/L). Micro-organisms were counted in accordance to the procedure of Harrigan and
MacCance [36]. The number of aerobic microorganisms was 6x 10³ colonies/mL. Anionic surfactant matter
(MBS) was 90 ~tg/L.
3. RESULTS AND DISCUSSION
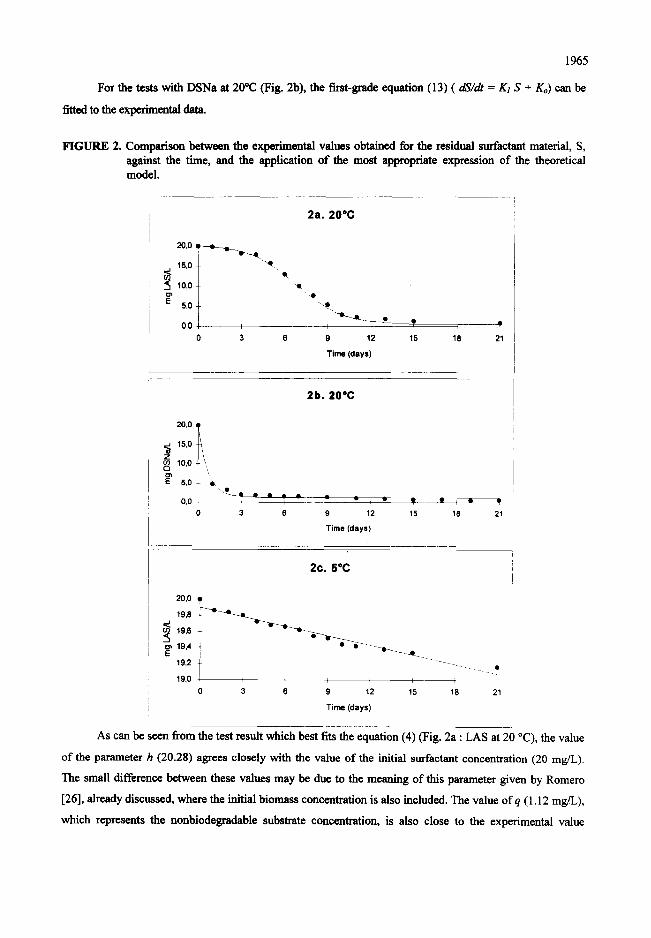
Figures 2a, 2b, and 2c show for the 3 different experiments carried out, the experimental values
obtained for the residual surfactant material, S, against the test duration time (individual points). In addition,
the resulting curve (solid line) from the application of the proposed kinetic model in its general form or in
one of the simplifications. The good agreement between theoretical and experimental values, and the value
of the correlation coefficients r 2 in Table I, corroborate the validity of the proposed model. Table I shows
also the values of the kinetic parameters corresponding to each of these tests, together with the
corresponding correlation indices.
TABLE I. Kinetic parameters and correlation coefficients obtained from the application of the various equations of the Quiroga and col kinetic model to the experimental data.
TEST A p q H K2 K1 I% r 2 LAS, 20°C 0.62 1.12 20.28 -0.03 0.69 -0.73 0.998
TEST B K1 K0 r 2 DSNa, 20°C -1.52 1 .91 0.987
TEST C Ko r 2
LAS, 5°C -0.05 0.995
It can be seen that, for the test with LAS at 20 °C (Fig. 2a), the theoretical result that corresponds
most closely is that for the second-grade polynomial equation (4), (dS/dt = K2 S 2 + 1(1 S + K~) while at 5°C
(Fig. 2c), it is equation (14), (dS/dt = Ko) that most closely fits the data.
1965
For the tests with DSNa at 20°(2 (Fig. 2b), the first-grade equation (13) ( dS/dt = Kl S + Ko) can be
fitted to the experimental data.
FIGURE 2. Comparison between the experimental values obtained for the residual surfactant material, S, against the time, and the application of the most appropriate expression of the theoretical model.
20,0 (
15,0
10,0
5,0
0,0
I
2a. 20°C
3 6 9 12 15 18 21
Time (days)
2b. 20°C
20,0
10,0 \,\
s,o ~ *~ •
o , o . - ~ u , • • . _ _ _ ~ + 0 3 6 9 12
Time (days)
15 18 21
2c. 5°C
20,0
19,8
" 9,6
~ 19,4 19,2
: 19,0
i
0 3 6 9 12 15 18 21
Time (days)
As can be seen fTom the test result which best fits the equation (4) (Fig. 2a : LAS at 20 °C), the value
of the parameter h (20.28) agrees closely with the value of the initial surfactant concentration (20 rag/L).
The small difference between these values may be due to the meaning of this parameter given by Romero
[26], already discussed, where the initial biomass concentration is also included. The value ofq (1.12 rag/L),
which represents the nonbiodegradable substrate concentration, is also close to the experimental value
1966
(0.9mg/L). Finally, the value of parameter p, representing microorganism growth rate, (0.62 day1), is within
the values reported in the bibliography for microorganism growth in the degradation of this and other types
of organic material [ 37].
The values of Kz K1 and Ko, also given in Table I, can be calculated from the values ofp, q and h.
The value for K2 is negative (-0.03), and can be interpreted as the inhibiting effect of the substrate on the
bacterial flor at the concentrations employed. However, its very low value indicates minimal inhibition. The
term K2"S: is therefore a correction factor which reflects the lag phase of the microorganisms' activity,
while they adapt to the substrate to be degraded.
For the term KI, the value obtained is positive (0,69). This value increases in proportion to the
biodegradation rate, shown by the results obtained by the same authors in other biodegradation studies [38].
Finally, the value for the term Ko is negative and can be explained by the competition among the bacterial
population for the limited amount of substrate remaining in the medium.
From Test C (LAS at 5 °C : Fig.2c), the best fit to the experimental data is not given by the second-
grade polynomial, but by the equation dS/dt = Ko. The value of the slope of the straight line allows the
calculation of the value of Ko. This is very small (0,05 dayl), indicating a process in which practically no
biodegradation is taking place.
By comparing the tests on LAS at 5°C and 20°C, it can be observed that the biodegradation rate
depends strongly on the temperature; at 5°C, the metabolic processes of the microorganisms are
considerably inhibited. Furthermore, the microorganisms used in the tests came from the Bay of Cfidiz,
where such a low temperature is not found even in the winter months.
It is established that the contamination potential of this type of substrate is closely related to seasonal
factors. Thus in coastal waters with relatively low temperatures, the adverse effect of the discharge of this
type of anionic surfactant can be considerable, since it remains in the water for a relatively long time until it
is degraded. This contamination is particularly serious in coastal areas with low water renovation rates, such
as bays and estuaries, where aquaculture is practised, because of the harmful effect of this type of substance
on the larvae and fry of many species of commercial interest [39].
The surfactant DSNa is considered "sott" ; it is much more easily biodegraded than LAS because
mineralization of the aromatic ring is not required. The equation which best describes the process is a first-
order kinetic (equation (13)). This is in line with the findings of other authors [40].
The nature of the fit resulting from the DSNa test indicates a microorganism induction period of less
than one day, as well as the existence of a minimum level of organic matter which the microorganisms
cannot biodegrade (Fig.2b).
DSNa is biodegraded by hydrolytic enzymes which are likely to exist in the medium or are
synthesized by the microorganisms ; this probably explains why there is no period of acclimatisation. LAS,
on the other hand, is more resistant to biodegradation because the carbon link between the aromatic ring and
1967
the sulphur of the sulphonate group is more difficult for the microorganisms to break down, since the
enzymes, being more specific, need time to be synthesized.
Also in the case of first-order kinetics, the concentration of nonbiodegradable substrate is given by
the ratio -Ko/KI, resulting in a theoretical nonbiodegradable substrate concentration of 1.25 mg/L, whereas
the experimental value is lower (0.6 mg/L). This leads us to conclude that if the test had been continued for
more than 21 days, the residual surfactant matter would probably have disappeared totally and we would be
left with a first-order kinetic in which the term Ko (case lc) had disappeared.
4. BIBLIOGRAPHY
1.
2.
3.
4.
5.
6.
7.
8.
9.
10.
R.B. Cain, Microbial biodegradation of surfactants and similar compounds, In Microbial
Degradation of Xenobiotics and Recalcitrant Compounds (Eds. Leisinger, T.; Cook, AM; Hunder,
R. and Nuesch, J.,) 325-370, (1981).
W.K. Fischer, Biodegradability: An important criterion for the environmental compatibility of
surfactants and other product compounds, Riv. Ital.Sostanze Grasse Vol LII, Noviembre, 373-376
(1975).
P.A. Gilbert, A.M Nielsen, L.N. Britton, C.E. Beall, T.P Mccormick and G.L. Russell,
Biodegradation of coproducts of commercial linear alkylbenzene sulfonate source, Environ. Sci.
Technol. 31, (12), 3397-3404 (1997).
M.A. Manzano, J.M. Quiroga, J.A. Perales, E. Nebot, and D. Sales, La biodegradaci6n de
tensioactivos no i6nicos en funci6n de su concentraci6n, Tecnologia del Agua 150, 41-46 (1996).
P. Schrberl, Basic Principles ofLAS Biodegradation, Tenside Surfactant. Det. 26, 86-94 (1989).
S.J. Patterson, C.C. Scott, and K.Tucker, Non-ionic detergent degradation HI. Initial mechanism of
the biodegradation, J.Am. Oil Chem. Soc. 47 (2), 37-41 (1970).
R.D. Swisher, Biodegradation of ABS in relation to chemical structure, Journal WPCF Vol. 35, N °
7, 877-892 (1963).
J. Ruiz and M.C. Dobarganes, Contaminaci6n de los cursos de aguas naturales por los detergentes
sintrticos. Relaci6n entre estructura y biodegradaci6n de tensioactivos no i6nicos, Grasas Aceites
Vol. 28, Fase. 3, 325-3431 (1977).
J. Ruiz Cruz, Contaminaci6n de los cursos de aguas naturales por los detergentes sintrticos.
Relaci6n entre estructura y biodegradaci6n de tensioactivos cati6nicos. Grasas Aceites Vol. 30,
Fase. 2, 67-74 (1979).
H. De Henau, E. Matthijs and W.D. Hopping, Linear alkylbenzene sulphonates (LAS) in sewage
sludge, soils and sediments: Analytical determination and environmental safety considerations, Int.
J. Environ. Anal.Chem., 26, 297-293 (1986).
1968
11.
12.
13.
14.
15.
16.
17.
18.
19.
20.
21,
22.
23.
24.
25.
H.A. Painter and T. Zebel, The behaviour of LAS in sewage treatment, Tenside Surfactant Deterg.
26, 108-115 (1989).
J.L. Berna, J. Ferrer, A. Moreno, D. Prats and F. Ruiz, The Fate of LAS in the Environment,
Tenside Surfactant. Deterg. 26, 101-107 (1989).
E. Gonz~lez, J.M. Quiroga, D. Sales and A. G6mez-Parra, Levels of Linear Alkylbenzene
Sulphonate (LAS) in Waters and Sediments of the coastal ecosystem of the Gulf of C~idiz, ToxicoL
Environ. Chem. 59, 77-87 (1997).
B.N. Jacobson, A mathematical model for behaviour of xenobiotic compounds in an activated
sludge reactor. Water Pollution Report 6, Behaviour of Organic micropolulutants in Biological
Waste Water Treatment, Proceedings of COST641 Workshop, pp 185-195, Copenhagen May 1987.
EUR 11356 (1960).
L.A. Bums, Models for predicting the fate of synthetic chemicals in aquatic ecosystems. In
Validation and Predictability of Laboratory Methods for Assessing the Fate and Effects of
Contaminants in Aquatic Ecosystems ASTM STP 865. Edited by T.P. Boyle, pp 176-190.
American Society for Testing and Materials : Philadelphia (1985).
P.H.Howard, Determining "real world" biodegradation rates, Environ. Toxicol. Chem. 4, 129-130
(1985).
J. M. Bayley, and D.F. Ollis, Biochemical Engineering Fundamentals. Ed. Mc G-raw Hill, Inc.,
N.Y. (1986).
D. Hrsak, M. Bonjak and V. Johanides, Kinetics of linear alkilbenzene sulphonate and secondary
alkane sulphonate biodegradation, Tenside Surfactant Deterg. 18, 3, 137-140 (1981).
J. Monod, The growth of bacterial cultures, Annu. Rev. Microbiol. 3, 371-394 (1949).
J.F. Andrews, A Mathematical Model for the Continuous Culture of Microorganisms Utilizing
Inhibitory substrates, Biotechnol. Bioeng. 10, 707-712 (1968).
D.E. Contois, Kinetics of bacterial growth, relationship between population density and specific
growth of continuous culture, J. Gen. Microbiol. 21, 40-46 (1959).
R. Pearl and L.J. Reed, Skeen-growth curves, Proc. Natt. Acad. Sci. 11, 16-22 (1923).
R.J. Larson and A.G. Payne, Fate of the benzene ring of linear alkilbenzene sulfonate in natural
waters, Appl.Environ. Microbiol. 41,621-627 (1981).
N. S. Battersby, A review of biodegradation kinetics in the aquatic environment, Chemosphere .21,
1243-1284 (1990).
R.J. Larson, Role of biodegradation kinetics in predicting environmental fate. In Biotransformation
and fate of Chemicals in the Aquatic Environment (Ed. by A.W. Moki, K.L. Dikson & J. Cairns) pp
67-86 American Society for Mierobioloy : Washington (1980).
26.
27.
28.
29.
30.
31.
32.
33.
34.
35.
36.
37.
38.
39.
40.
1969
Romero, L. I. Desarrollo de tm modelo matenuttico general para los procesos fermentativos :
cin~tica de la degradaci6n anaerobia. Ph.D. Thesis, Universidad de C~idiz (Spain), C~idiz, (1991 )
J.M. Quiroga, L.I. Romero, D. Sales and E. Nebot, Kinetic Model Development for Aerobic
Treatment of Wine Vinasse, Chem.Biochem. Eng. Q. $ (2), 53-61 (1994).
J.M.Quiroga and D.Sales, Influence of different surfactants on kinetic biodegradation rate in waters
with sediments of the Bay of Cadiz, Sixth International Symposium on Surfactants in Solution,
August 18-22, 1986, New Delhi.
J.M. Quiroga and D. Sales, Effect of Temperature Kinetics on Anionic Surfactant Detergents in
Sea-water, J.Dispersion Sci. Technol. 10 (6), 773-784 (1989).
J.M. Quiroga, D. Sales and A. G6mez-Parra, Experimental evaluation of pollution potential of
anionic surfactants in the marine environmental, Water Res. Vol 23, 801-807 (1989).
J.M. Quiroga, D. Sales, Experimental variables in biodegradation of surfactants in marine
environment, Bull.Environ. Contam. Toxicol. 44, 851-858 (1990).
V. Flores, D. Sales and R. Establier, Contaminaci6n de las aguas de la Bahia de Cfidiz IV. Ensayos
de biodegradabilidad con dodecil sulfato s6dico, Ing. Qulm. 131, 81-89 (1980).
J. Granados, Surfactant raw materials. Constant evaluation and solid future, 4th Worm Surfactants
Congress, Barcelona, 100-123 (1996).
D. C. Abbot, The colorimetric determination of anionic surface-active materials in water, Analy~
87, 286-293 (1972).
Orden del 5 -IX-1985 sobre la actualizaci6n de la determinaci6n de la biodegradabilidad de agentes
tensioactivos. Official State Bulletin (Spain) n ° 260,30-X-1985, pp 34266-74.
W.F. Harrigan and M.C. MacCance, Lab. Methods Microbiol. Academic Press. London (1976).
R.J. Larson, Comparison of biodegradation rates in laboratory screening studies with rates in
natural waters Res. Rev. 85, 159-171 (1983).
J.M.Quiroga, D.Sales, M.Manzano y J.A. Perales, Determination of metabolites on LAS
biodegradation, 4th World Surfactants Congress, Barcelona 3-7 Junio 1996.
M. Lewis, Chronic and sublethal toxicities of surfactants to aquatic animals : a review and risk
assessment. Water Res. 25, 101-113 (1991).
D. Sales, J. Naranjo and V. Flores, Biodegradabilidad de los dodecil-sulfatos de sodio o
trietanolamonio en agua de mar, Grasas Aceites, 32, 305-311 (1981).