Embed Size (px)
Citation preview
Ž .Marine Chemistry 69 2000 19–31www.elsevier.nlrlocatermarchem
Marine barite and celestite saturation in seawater
Ahmed I. Rushdi a,b, James McManus c,), Robert W. Collier a
a College of Oceanic and Atmospheric Science, Oregon State UniÕersity, 104 Ocean Admin. Building, CorÕallis, OR 97331-5503, USAb Department of Oceanography, Faculty of Science, Sana’a UniÕersity, Sana’a, Yemen
c Large Lakes ObserÕatory, UniÕersity of Minnesota, 10 UniÕersity Dr., Duluth, MN 55812, USA
Received 23 July 1998; accepted 18 August 1999
Abstract
The stoichiometric solubility product, KU , of barite and celestite in seawater has been calculated using thermodynamicsp,T
constants, K , and the activity coefficients for barium, strontium, and sulfate in seawater. An equation of the form:s0
CU nln K sAqBlnTq qDSsp,T T
Ž .has been used. The constants A, B, C, D and n are derived from the calculated stoichiometric or total solubility product ofŽ .barite and celestite in seawater as a function of temperature and salinity. T is the absolute temperature K and S is the
salinity. The effect of pressure on KU is also calculated. Comparing the solubility products determined from this equationsp,T
and the pressure effect equation to the distribution of Ba, Sr and SO in seawater, we conclude that the upper surface water4wof the Southern Ocean is likely supersaturated with respect to pure barite, in agreement with Jeandel et al. Jeandel, C.,
Dupre, B., Lebaron, G., Monnin, C., Minster, J.F., 1996. Longitudinal distributions of dissolved barium, silica and alkalinityx win the western and southern Indian Ocean. Deep-Sea Res. 43, 1–31. and Monnin et al. Monnin, C., Jeandel, C., Cattaldo,
xT., Dehairs, F., 1999. The marine barite saturation state of the world oceans. Mar. Chem. 65, 253–261. and that the oceanicwater column is typically -30% saturated with respect to celestite. The model, which includes the thermodynamicsolid–solution behavior of barite in seawater at 258C and 1 atm, suggests that this mineral may contain up to 13 mol%SrSO at equilibrium. Accordingly, we have determined the stoichiometric solubility products of strontian barite as a4
function of salinity and temperature:
15421XBa 0.3ln K s247.88y38.333lnTy q1.27Ssp T
Using our model results for the total solubility product of the Sr-barite phase and seawater Ba and SO concentration data,4
we conclude that the maximum saturation level of the oceans with respect to marine barite is 63% in the North Atlantic, 88%in the Indian Ocean, and 111% in the North Pacific. The depth of this maximum saturation level is shallower in the Atlantic
) Corresponding author. Tel.: q1-218-726-7384; E-mail: [email protected]
0304-4203r00r$ - see front matter q 2000 Elsevier Science B.V. All rights reserved.Ž .PII: S0304-4203 99 00089-4
( )A.I. Rushdi et al.rMarine Chemistry 69 2000 19–3120
Ž . Ž .Ocean about 1000 m than in the Pacific and Indian oceans about 2000 m . q 2000 Elsevier Science B.V. All rightsreserved.
Keywords: barite; celestite; seawater
1. Introduction
The processes that control the formation of baritein the marine environment are poorly understoodŽChow and Goldberg, 1960; Church, 1970, 1979;Church and Wolgemuth, 1972; Dehairs et al., 1980;
.Bishop, 1988; Bernstein et al., 1992 . However, themechanism most frequently advocated is that bariteis formed in organic-rich microenvironments during
Žthe decay of biogenic debris Dehairs et al., 1980;.Bishop, 1988; Gingele and Dahmke, 1994 . It is also
known that the injection of hydrothermal fluids intothe deep ocean provides the necessary conditions for
Ž .barite precipitation Dymond, 1981 .The association of barium with biogenic processes
results in a dissolved Ba distribution where barium isgenerally depleted in the surface ocean and enriched
Žin the deep ocean Wolgemuth and Broecker, 1970;.Li et al., 1973 . This association, coupled with the
observation that barium-rich sediments are oftenfound underlying biologically productive regions,were behind the initial suggestion that barium may
Žbe a proxy for paleoproductivity Arrhenius, 1963;Turekian and Tausch, 1964; Goldberg and Arrhe-
.nius, 1969; Church, 1970 . Further evidence for theutility of barium as a paleoproductivity proxy hasbeen derived from sediment trap correlations be-
Žtween Ba and organic carbon Dymond et al., 1992;.Francois et al., 1995 and surface sediment barite
correlations with upper water column productivityŽ .Paytan et al., 1996 . The low solubility of barite in
Ž .pelagic sediments Dymond et al., 1992 and the factthat marine sediment pore waters quickly saturatewith respect to barite are the primary reasons whybarite is thought to be well-preserved in most oceanicsediments.
Both barite and celestite coexist in the marineenvironment with significant fractions of Sr and Bain solid solution. In the marine environment celestite,SrSO , is primarily found as the skeletal compo-4Žs.nent of the marine planktonic organism acantharianŽBottazzi, 1978; Rieder et al., 1982; Bernstein et al.,
.1992 . This phase contains up to 5800 ppm Ba
Ž .Bernstein et al., 1992 . Celestite tends to dissolvewithin the water column due to its high solubilityrelative to seawater saturation. Barite crystals found
Ž .in the oceanic water column Dehairs et al., 1980 orŽinorganically precipitated in the laboratory Hanor,
.1968, 1969; Church, 1970, 1979 contain variableamounts of Sr. Data from the upper water column ofthe oceans demonstrates that the mole fraction of
ŽSrSO in barite may exceed 20% Dehairs et al.,4Žs..1980 . Thus, the marine barite and celestite solubility
systems may be linked and the influence of Sr on thesolubility of marine barite is of particular interest. Aquantitative understanding of barite and celestite sol-ubility is therefore essential for understanding thedissolved distribution of Ba in oceanic environmentsand the preservation of marine barite as a paleopro-
Ž .ductivity proxy Church and Wolgemuth, 1972 .Accordingly, we derive here a generalized empiri-
cal equation for estimating the stoichiometric equi-librium solubility product of barite and celestite inseawater as a function of salinity and temperaturebased on available thermodynamic data and activitycoefficients for barium, strontium and sulfate. Theeffect of pressure on the equilibrium solubility prod-uct of barite and celestite is also considered andestimated. One of the goals of this paper is to presenta set of equations that are based on the best availabledata and information that will allow us to directlyuse the ionic concentration products of Ba, Sr, andSO in seawater, thus avoiding the effort of calculat-4
ing the mean activity coefficients of aqueous BaSO4
and SrSO in seawater. We use these equations to4
estimate the saturation state of seawater with respectto pure barite at selected stations in the Atlanticsector of the Southern Ocean. These results comparefavorably with previously published estimates thatused slightly different calculation approaches —supporting the veracity of a number of differentapproaches to estimate barite solubility. We thenexplore the idea that ‘‘marine barite’’ suspended inseawater is better represented as a mixed Ba–Sr–SO4
phase. The effect of strontium on the solubility ofmarine barite is then included in an empirical equa-
( )A.I. Rushdi et al.rMarine Chemistry 69 2000 19–31 21
tion for calculating the solubility products of baritein seawater. This equation is then used to estimatethe saturation state with respect to the strontianbarite for seawater at selected stations in the At-lantic, Indian, and Pacific Oceans. We propose thatthis modified equation offers a more accurate viewof barite solubility in the marine environment.
2. Pure barite and celestite phase solubility atSTP
The solubilities of pure barite and celestite in anaquatic system are expressed by the following reac-tions:
BaSO mBa2qqSO2y 1aŽ .4 4Žs .
and
SrSO mSr 2qqSO2y 1bŽ .4 4Žs .
and the thermodynamic solubility product constantsof barite, Ba K , and celestite, SrK , are:s0 s0
a 2qa 2yBa SOBa 4K s 2aŽ .s0 aBaSO4Ž s .
anda 2qa 2ySr SOSr 4K s 2bŽ .s0 aSrSO4Ž s .
where, a 2q, a 2q and a 2y are the activities ofBa Sr SO4
Ba2q, Sr 2q and SO2y, respectively, and a4 BaSO4Ž s .
and a are the activities of barite and celestiteSrSO4Ž s .
solids. The activity of an ion i, a , as a function ofiŽionic medium Johnson and Pytkowicz, 1978;
.Pytkowicz, 1983; Rushdi et al., 1998 is:
a sg m sg m 3Ž .i i ,T i ,T i ,F i ,F
where g is the activity coefficient and m is thei i
concentration of the ion i in that ionic medium andthe subscripts T and F refer to total and free, respec-tively. Therefore, the relationship between the ther-modynamic solubility product constants, K , ands0
the stoichiometric solubility product equilibriumconstants, K U of barite and celestite are:sp,T
g 2q g 2yBa K UŽ . Ž .Ba SO sp ,TT 4Ba TK s 4aŽ .s0 aBaSO4Ž s .
and:
g 2q g 2ySrK UŽ . Ž .Sr SO sp ,TT 4Sr TK s 4bŽ .s0 aSrSO4Ž s .
where the stoichiometric solubility product equilib-rium constants of barite and celestite are:Ba K U s m 2q m 2y 5aŽ . Ž . Ž .sp ,T Ba SOT ,e 4 T ,e
and:SrK U s m 2q m 2y 5bŽ . Ž . Ž .sp ,T Sr SOT ,e 4 T ,e
Ž .The subscript e refers to equilibrium. Eqs. 4aŽ .and 4b can be rewritten: as
Ba K s g 2q g 2yBa K U 4cŽ . Ž . Ž .s0 Ba SO sp ,TT 4 T
andSrK s g 2q g 2y
SrK U 4dŽ . Ž . Ž .s0 Sr SO sp ,TT 4 T
and they are valid for pure barite and pure celestitein ionic media, where the activity of the pure solid isassumed to have a value of unity.
3. Solubility effects of temperature, salinity andpressure
The values of Ba K U , and SrK U , as a functionsp,T sp,T
of temperature and salinity, can be estimated byknowing the values of thermodynamic solubilityconstants, Ba K , and SrK at different temperatures,s0 s0
and the values of the total activity coefficients ofBa2q, Sr 2q and SO2y at different salinities and4
temperatures. For the present case Ba K , and Ba K ,s0 s0
as a function of temperature, are calculated from theŽfollowing empirical equation Raju and Atkinson,
.1988, 1989 :T T C I Ih g
ln K sAln qB q y y 6Ž .s0 2R 2 R RT RRTwhere the constants A, B, C, I and I are listed inh g
Table 1, R is the gas constant, and T is the absolute
Table 1Ž .The values of the constants used in Eq. 6 to compute the
thermodynamic solubility constants of barite and celestite as aŽ .function of temperature from Raju and Atkinson, 1988, 1989
A B C I Ih g
Barite 594.534 y1.91171 40.0731eq6 200,488 3740.12Celestite 641.541 y1.90146 y4.28eq7 y251,748 4102.24
( )A.I. Rushdi et al.rMarine Chemistry 69 2000 19–3122
Table 2The values of the coefficients for the equation logg sa qa q . . . qa qSn to calculate the activity of barium and sulfate in seawater ati 0 1 n
258C
Ion a a a a a a R0 1 2 3 4 5
2qBa 4.9375ey1 y3.8288ey2 2.4683ey3 y8.8411ey5 1.6193ey6 y1.1795ey8 0.999982qSr 5.1774ey1 y3.9703ey2 2.7407ey3 y1.04840ey4 2.0016ey6 y1.518ey8 0.99998
2ySO 4.4850ey3 y4.5890ey4 2.9708ey5 y1.0840ey4 2.028ey6 y1.5077ey8 1.000004
Ž .temperature K . This equation shows good agree-Ba Žment with barite experimental K values Tem-s0
pleton, 1960; Blount, 1977; Monnin and Galineir,.1988 . The estimated error between the predicted
Ž .value from Eq. 6 and that derived experimentally is-0.05 pK unit. The equation also predicts pK for
Žcelestite Culberson et al., 1978; Roger, 1981; Rear-.don and Armstrong, 1987; Felmy et al., 1990 within
0.03 pK unit of experimentally derived values.Ž .Millero and Schrieber 1982 have estimated and
tabulated the activity coefficients of free and totalions in seawater at various salinities at 258C by usingthe mean salt method, Pitzer Formalism and ionpairing model. From the total activity coefficients forBa2q, Sr 2q and SO2y the following relationship is4
derived:
logg sa qa q . . . qa Sn 7Ž .i 0 1 n
where the constants a , a , . . . , a of the equation0 2 n
are listed in Table 2. The temperature effects on thetotal activity coefficients are estimated from the ex-tended Debye–Huckel equation using the Debye–¨
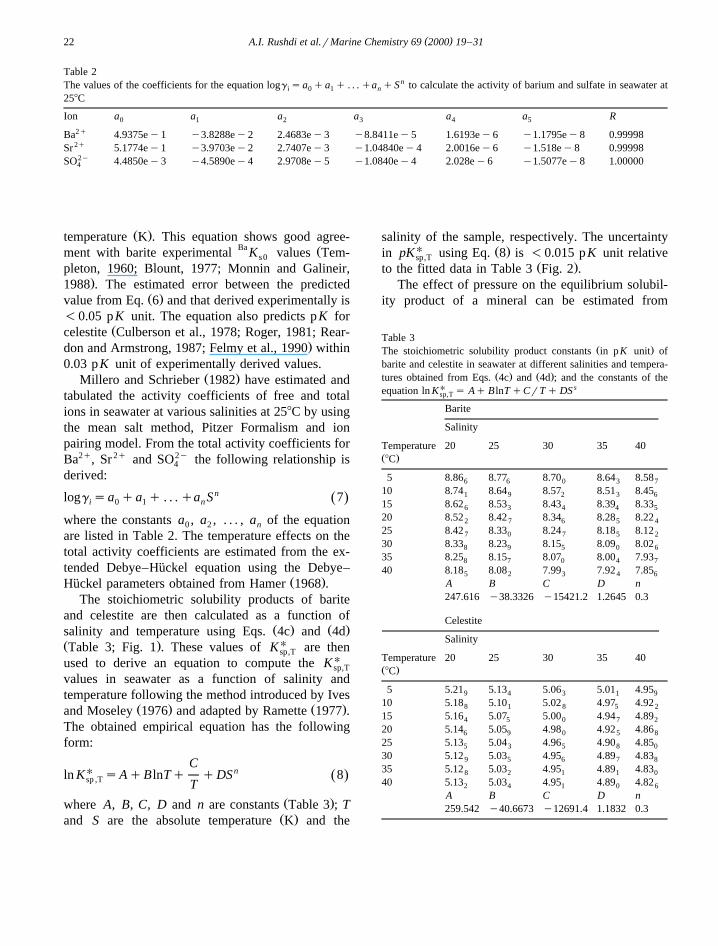
Ž .Huckel parameters obtained from Hamer 1968 .¨The stoichiometric solubility products of barite
and celestite are then calculated as a function ofŽ . Ž .salinity and temperature using Eqs. 4c and 4d
Ž . UTable 3; Fig. 1 . These values of K are thensp,T
used to derive an equation to compute the K Usp,T
values in seawater as a function of salinity andtemperature following the method introduced by Ives
Ž . Ž .and Moseley 1976 and adapted by Ramette 1977 .The obtained empirical equation has the followingform:
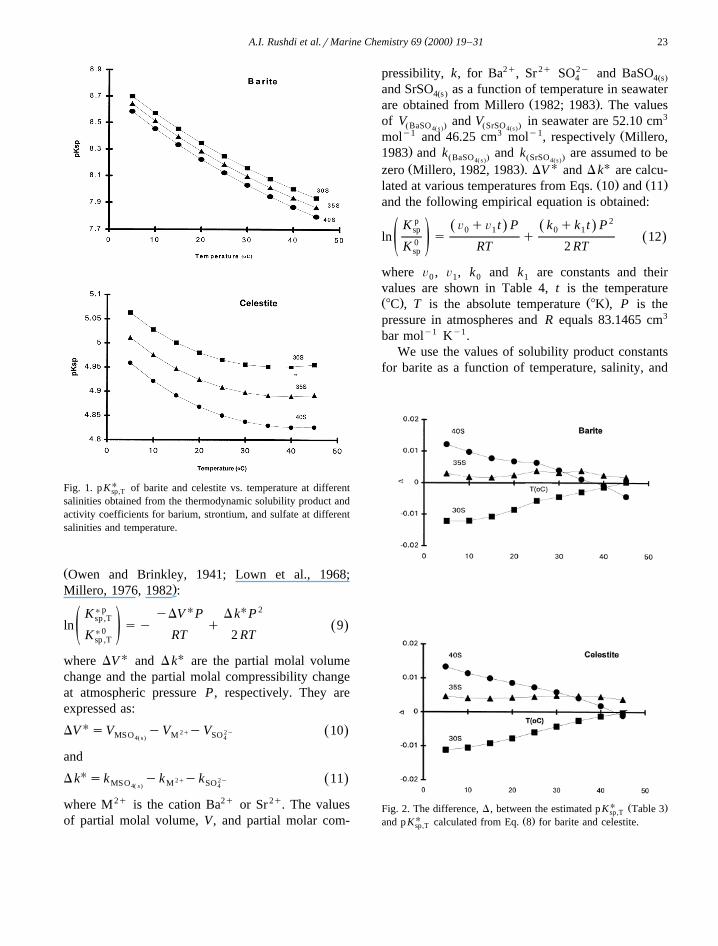
CU nln K sAqBlnTq qDS 8Ž .sp ,T T
Ž .where A, B, C, D and n are constants Table 3 ; TŽ .and S are the absolute temperature K and the
salinity of the sample, respectively. The uncertaintyU Ž .in pK using Eq. 8 is -0.015 pK unit relativesp,T
Ž .to the fitted data in Table 3 Fig. 2 .The effect of pressure on the equilibrium solubil-
ity product of a mineral can be estimated from
Table 3Ž .The stoichiometric solubility product constants in pK unit of
barite and celestite in seawater at different salinities and tempera-Ž . Ž .tures obtained from Eqs. 4c and 4d ; and the constants of the
equation ln KU s Aq B lnT qCrT q DS ssp,T
Barite
Salinity
Temperature 20 25 30 35 40Ž .8C
5 8.86 8.77 8.70 8.64 8.586 6 0 3 7
10 8.74 8.64 8.57 8.51 8.451 9 2 3 6
15 8.62 8.53 8.43 8.39 8.336 3 4 4 5
20 8.52 8.42 8.34 8.28 8.222 7 6 5 4
25 8.42 8.33 8.24 8.18 8.127 0 7 5 2
30 8.33 8.23 8.15 8.09 8.028 9 5 0 6
35 8.25 8.15 8.07 8.00 7.938 7 0 4 7
40 8.18 8.08 7.99 7.92 7.855 2 3 4 6
A B C D n247.616 y38.3326 y15421.2 1.2645 0.3
Celestite
Salinity
Temperature 20 25 30 35 40Ž .8C
5 5.21 5.13 5.06 5.01 4.959 4 3 1 9
10 5.18 5.10 5.02 4.97 4.928 1 8 5 2
15 5.16 5.07 5.00 4.94 4.894 5 0 7 2
20 5.14 5.05 4.98 4.92 4.866 9 0 5 8
25 5.13 5.04 4.96 4.90 4.855 3 5 8 0
30 5.12 5.03 4.95 4.89 4.839 5 6 7 8
35 5.12 5.03 4.95 4.89 4.838 2 1 1 0
40 5.13 5.03 4.95 4.89 4.822 4 1 0 6
A B C D n259.542 y40.6673 y12691.4 1.1832 0.3
( )A.I. Rushdi et al.rMarine Chemistry 69 2000 19–31 23
Fig. 1. pKU of barite and celestite vs. temperature at differentsp,T
salinities obtained from the thermodynamic solubility product andactivity coefficients for barium, strontium, and sulfate at differentsalinities and temperature.
ŽOwen and Brinkley, 1941; Lown et al., 1968;.Millero, 1976, 1982 :
K U p yDV UP DkUP 2sp ,T
ln sy q 9Ž .U 0ž / RT 2 RTK sp ,T
where DV U and DkU are the partial molal volumechange and the partial molal compressibility changeat atmospheric pressure P, respectively. They areexpressed as:
DV U sV yV 2qyV 2y 10Ž .MSO M SO4Ž s . 4
and
DkU sk yk 2qyk 2y 11Ž .MSO M SO4Ž s. 4
where M2q is the cation Ba2q or Sr 2q. The valuesof partial molal volume, V, and partial molar com-
pressibility, k, for Ba2q, Sr 2q SO2y and BaSO4 4Žs.and SrSO as a function of temperature in seawater4Žs.
Ž .are obtained from Millero 1982; 1983 . The valuesof V and V in seawater are 52.10 cm3
ŽBaSO . ŽSrSO .4Ž s . 4Žs .y1 3 y1 Žmol and 46.25 cm mol , respectively Millero,.1983 and k and k are assumed to beŽBaSO . ŽSrSO .4Ž s . 4Žs .
Ž . U Uzero Millero, 1982, 1983 . DV and Dk are calcu-Ž . Ž .lated at various temperatures from Eqs. 10 and 11
and the following empirical equation is obtained:
K p Õ qÕ t P k qk t P 2Ž . Ž .sp 0 1 0 1ln s q 12Ž .0ž / RT 2 RTK sp
where Õ , Õ , k and k are constants and their0 1 0 1
values are shown in Table 4, t is the temperatureŽ . Ž .8C , T is the absolute temperature 8K , P is thepressure in atmospheres and R equals 83.1465 cm3
bar moly1 Ky1.We use the values of solubility product constants
for barite as a function of temperature, salinity, and
U Ž .Fig. 2. The difference, D, between the estimated pK Table 3sp,TU Ž .and pK calculated from Eq. 8 for barite and celestite.sp,T
( )A.I. Rushdi et al.rMarine Chemistry 69 2000 19–3124
Table 4Ž .The values of the constants for Eq. 12
Õ Õ k k0 1 0 1
Barite 45.61714 y0.25097 y14.445ey3 1.251ey4Celestite 44.75463 y0.21603 y14.74ey3 1.25Xey4
Žpressure reported by others e.g., Church and Wolge-muth, 1972; Falkner Kenisson et al., 1993; Monnin,
.1999 to compare with those estimated from ourŽ .model Table 5 . Here, the thermodynamic solubility
products, K , of barite which were reported bys0Ž . Ž .Falkner Kenisson et al. 1993 and Monnin 1999
were converted to K U by using the aqueous meansp,TŽ . Žactivity coefficients of BaSO "g from4 BaSO4
.Monnin, 1999 . As shown in Table 5, our model forestimating K U of barite in seawater is in goodsp,T
Ž .agreement with Monnin 1999 at temperature rangesbetween 58C and 258C as a function of salinity andpressure. Our pK U values generally deviate bysp,T
-0.05 pK unit. They are higher than the valuesŽ .obtained by Falkner Kenisson et al. 1993 and
deviate by )0.10 pK unit. The deviation is muchhigher when compared to the values of Church and
Ž . Ž .Wolgemuth 1972 )0.36 pK unit .Ž . Ž .By combining Eqs. 8 and 12 we can calculate
the saturation state of a water parcel with respect to a
pure mineral phase at a given S, T , and P. InSection 4, we apply these equations to several sta-tions in the Atlantic sector of the Southern ocean.We choose these stations to compare our model witha previous approach applied to the same data setŽ .Jeandel et al., 1996; Monnin et al., 1999 . In Sec-tion 6, we examine the potential impact of impuritieson the barite solubility product and then reexaminethe saturation state of the oceans with respect to thisimpure marine barite.
4. Comparison of our model with previous work
The degree of water column saturation, %V , withrespect to pure barite or pure celestite can be definedby:
100% IPŽ . in-situ%Vs 13Ž .
KŽ .sp in-situ
Ž .where IP , is the in-situ ionic product for bar-in-situ
ium and sulfate or strontium and sulfate ions. Avalue of %Vs100 represents saturation, and thevalues above or below 100 represent super and un-dersaturation, respectively. The in-situ stoichiometric
Ž .solubility product, K , of barite or celestite, issp in-situ
Table 5Ž .The values of pK of barite and celestite in seawater computed by Eq. 8 compared with other values from literaturesp
U U U UŽ . Ž . Ž . Ž . Ž . Ž . Ž .P bar Temperature 8C Salinity ‰ ylog K TW ylog K F ylog K M ylog K CWsp sp sp sp
1 5 22 8.86 8.75 8.826 1 1
10 5 22 8.85 8.73 8.819 9 5
20 5 22 8.85 8.72 8.800 6 5
1 7 22 8.81 8.70 8.773 3 8
10 7 22 8.80 8.68 8.776 8 1
20 7 22 8.79 8.67 8.768 7 1
1 9 22 8.76 8.65 8.732 3 3
100 9 22 8.68 8.553 0
200 9 22 8.60 8.45 8.563 7 7
1 20 22 8.50 8.40 8.519 6 2
10 20 22 8.50 8.39 8.502 6 6
20 20 22 8.49 8.38 8.495 7 8
1 25 18 8.46 8.59 8.519 4 4
1 25 35 8.181 8.21 8.136 6 0
1 1 35 8.78 8.69 8.290 6 6
500 1 35 8.34 8.27 7.989 5 6
Ž . Ž . Ž . Ž . Ž . Ž . Ž .TW sThis Work; F sFalkner Kenisson et al. 1993 ; M sMonnin 1999 ; CW sChurch and Wolgemuth 1972 .
( )A.I. Rushdi et al.rMarine Chemistry 69 2000 19–31 25
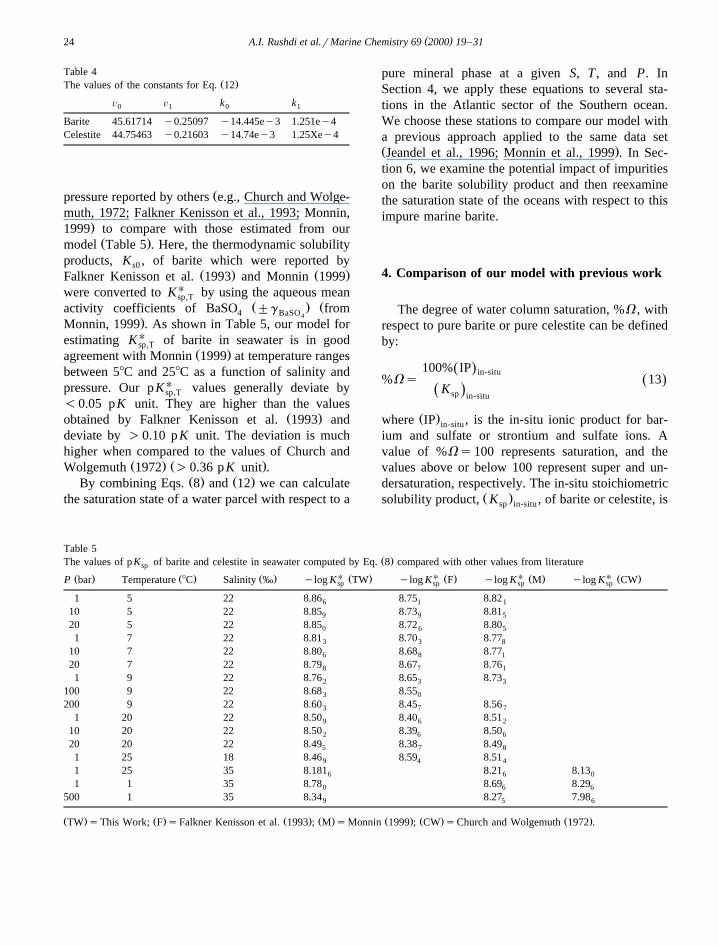
Ž . Ž . Ž . ŽFig. 3. %V for pure barite from the same stations used by Jeandel et al. 1996 Stations 07, 36, 79 and Monnin et al. 1999 Stations 78,.89, 82 .
corrected for the effect of pressure and temperatureat a given salinity. The in-situ ion product is esti-mated using GEOSECS dissolved Ba profilesŽ . Ž .m , Sr profiles from Brass and Turekian 1974 ,Ba,T
and salinity-normalized SO concentrations.4
Fig. 3 shows the saturation profiles for the threeŽ . Žstations discussed by Jeandel et al. 1996 stations
. Ž . Ž07, 36 and 79 and Monnin et al. 1999 stations 78,.89, and 82 . These authors used ‘‘Saturation Index,
Ž . Ž .SI ’’, which is equivalent to our %V . Eq. 13reproduces similar %V profiles to the same profiles
Ž .shown by Jeandel et al. 1996 and Monnin et al.Ž .1999 for pure barite, thus showing the equivalenceof both modeling approaches. It is clear that theupper Southern Ocean water column is slightly su-persaturated with respect to pure barite and undersat-urated at depth below 2000 m in agreement with
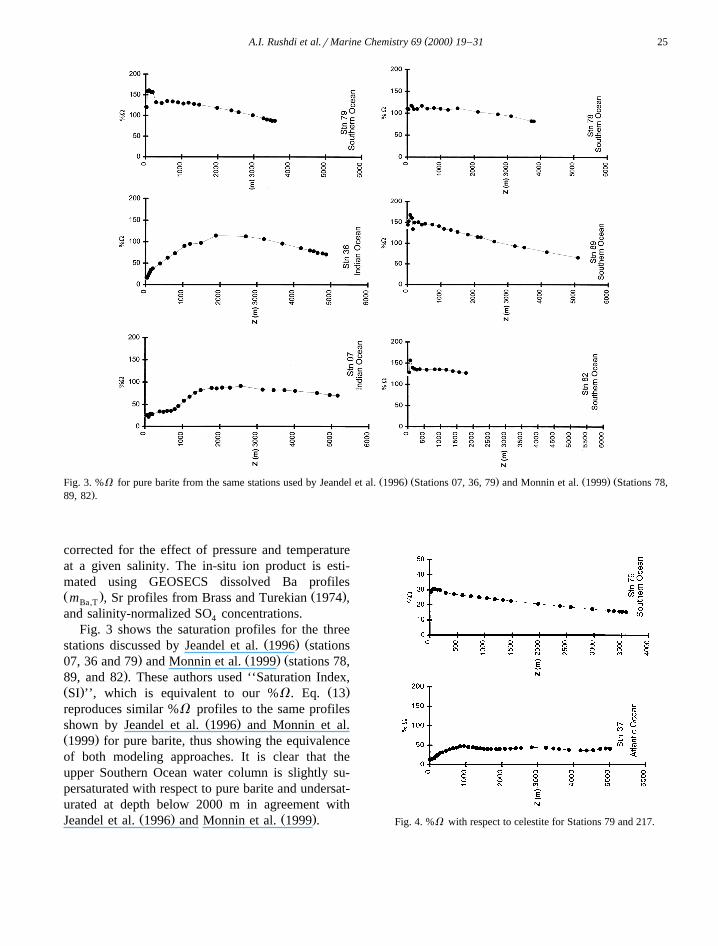
Ž . Ž .Jeandel et al. 1996 and Monnin et al. 1999 . Fig. 4. %V with respect to celestite for Stations 79 and 217.
( )A.I. Rushdi et al.rMarine Chemistry 69 2000 19–3126
The %V of oceanic water with respect to purecelestite is illustrated in Fig. 4. Both stations areclearly undersaturated with respect to pure celestite.Station 37 reaches a maximum at approximately1000 m depth, decreasing slightly at depth and Sta-tion 79 reaches a much shallower maximum -500m, followed by a larger decrease to ;3500 m.
5. Solubility effects of strontium substitution
Marine barite is found to contain minor, but sig-Žnificant, concentrations of strontium Hanor, 1968;
.Church, 1979; Dehairs et al., 1980 , which resultsbecause of the high concentrations of strontium inseawater. The incorporation of this Sr into the baritecrystal lattice will influence the solubility product ofbarite in seawater. The K value for pure barite andsp
Ž .celestite computed using Eq. 8 , are listed in Table6, along with the experimental values in seawater
Žobtained from the literature Krauskopf, 1956; Bur-.ton et al., 1968; Culberson et al., 1978 . There is
excellent agreement between the experimental valueavailable for celestite K U determined in seawater atsp
Ž .258C. Culberson et al., 1978 and our estimate usingŽ .Eq. 8 . On the other hand, the estimated stoichio-
metric solubility product of barite is much smallerthan the experimental value in seawater at 258CŽ .Burton et al., 1968 . We suggest that this discrep-ancy may be caused by Sr Ba SO solid solu-x 1yx 4Žs.tion equilibrium. Because the presence of x inSrSO4Žs .
the barite solid may increase the activity of barite, itmay not have a value of unity. We assume the
Table 6The values of ylog K of barite and celestite in seawater com-sp
Ž .puted by Eq. 8 , compared with experimental values from litera-ture
U UT pK pK Referencesp,T spŽ . Ž . Ž .8C this work Literature
Ž .Barite 20 8.282 8.185"0.23 Krauskopf 1956Ž .25 8.185 8.050"0.03 Whitfield 1975
Žobtained from Burton,.personal communication
Ž .Celestite 25 4.908 4.909"0.03 Culberson et al. 1978
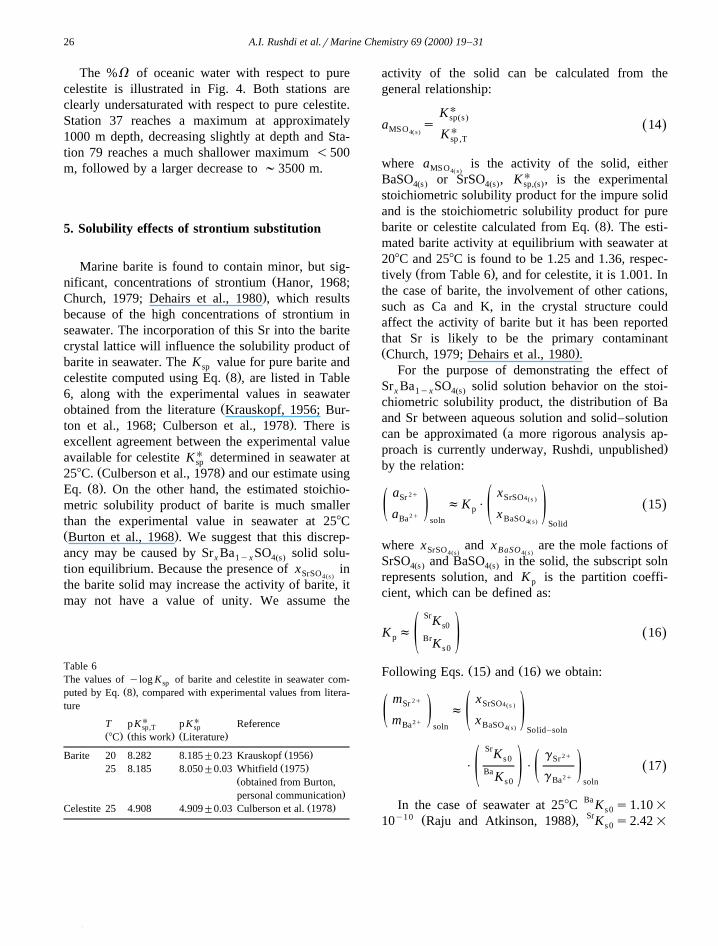
activity of the solid can be calculated from thegeneral relationship:
K UspŽs.
a s 14Ž .MSO U4Ž s . K sp ,T
where a is the activity of the solid, eitherMSO4Ž s .
BaSO or SrSO , K U , is the experimental4Žs. 4Žs. sp,Žs.stoichiometric solubility product for the impure solidand is the stoichiometric solubility product for pure
Ž .barite or celestite calculated from Eq. 8 . The esti-mated barite activity at equilibrium with seawater at208C and 258C is found to be 1.25 and 1.36, respec-
Ž .tively from Table 6 , and for celestite, it is 1.001. Inthe case of barite, the involvement of other cations,such as Ca and K, in the crystal structure couldaffect the activity of barite but it has been reportedthat Sr is likely to be the primary contaminantŽ .Church, 1979; Dehairs et al., 1980 .
For the purpose of demonstrating the effect ofSr Ba SO solid solution behavior on the stoi-x 1yx 4Žs.chiometric solubility product, the distribution of Baand Sr between aqueous solution and solid–solution
Žcan be approximated a more rigorous analysis ap-.proach is currently underway, Rushdi, unpublished
by the relation:
a 2q xSr SrSO4 Ž .sfK P 15Ž .pž / ž /2qa xBa BaSOsoln 4Ž s . Solid
where x and x are the mole factions ofSrSO BaSO4Žs . 4Ž s.
SrSO and BaSO in the solid, the subscript soln4Žs. 4Žs.represents solution, and K is the partition coeffi-p
cient, which can be defined as:
SrK s0K f 16Ž .p Brž /K s0
Ž . Ž .Following Eqs. 15 and 16 we obtain:
m 2q xSr SrSO4 Ž .sfž / ž /2qm xBa BaSOsoln 4Ž s . Solid–soln
SrK g 2qs0 SrP P 17Ž .Ba ž /ž / 2qgK Bas0 soln
In the case of seawater at 258C Ba K s1.10=s0y10 Ž . Sr10 Raju and Atkinson, 1988 , K s2.42=s0
( )A.I. Rushdi et al.rMarine Chemistry 69 2000 19–31 27
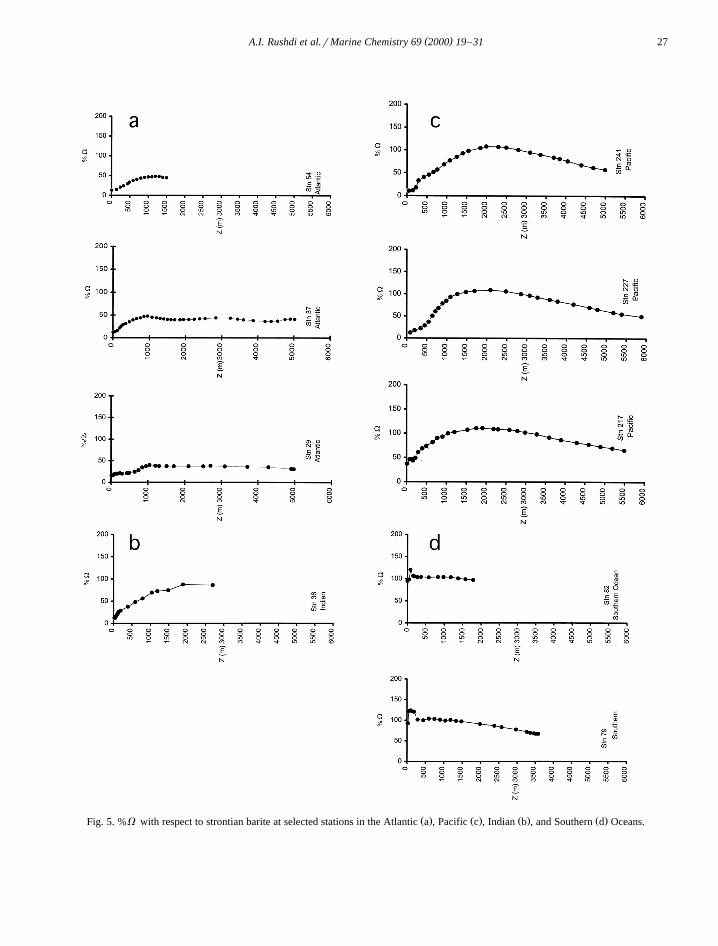
Ž . Ž . Ž . Ž .Fig. 5. %V with respect to strontian barite at selected stations in the Atlantic a , Pacific c , Indian b , and Southern d Oceans.
( )A.I. Rushdi et al.rMarine Chemistry 69 2000 19–3128
y7 Ž . 2q 2q10 Culberson et al., 1978 , g s0.197, g sBa SrŽ2y0.231 and g s0.085 Millero and Schrieber,SO 4
.1982 . From the experimental study on barite solubil-Ž .ity in natural seawater Burton et al., 1968 , the
concentration of barium at equilibrium is about 3.24=10y7 mol kgy1 at 258C and assuming that thestrontium concentration is f8.9=10y5 mole kgy1,
Ž . Ž .then from Eq. 17 , the ratio of m rm s2.75Sr Ba soln
=10q2 , which is equivalent to about 13 mol%SrSO .4Žs.
For estimating the mixed solid solubility in sea-water, the following congruent reaction is assumed:
Sr Ba SO mxSr 2qq 1yx Ba2qqSO2yŽ .x 1yx 4Žs. 4
18Ž .
and the stoichiometric solubility product ofSr Ba SO , K X , is expressed by:x 1yx 4Žs. sp
x1yxK a aŽ . Ž .s0 BaSO4 SrSO4Ž . Ž .s sXK s 19Ž .sp x1yx
2yg g gŽ . Ž .Ba Sr SO4
The value of K X is estimated to be 8.51=10y9, forsp
Sr Ba SO which is closer to the value re-0.13 0.87 4Žs.Ž . Ž y9 .ported by Whitfield 1975 8.91=10 .
6. Saturation state of the oceans with respect tostrontian barite
As a first step towards assessing the degree ofseawater saturation with respect to strontian barite,one could assume that the solubility of barite innatural seawater is higher by a factor of 1.3 than that
Ž .calculated using Eq. 8 for pure barite. However,considerably more experimental measurements areneeded to verify this assumption. The followingmodified equation is derived and we used it toestimate the %V of seawater with respect to theimpure barite phase:
1521.20X 0.3ln K s247.88y38.333lnTy q1.265Ssp T
20Ž .
The %V of seawater with respect to marine bariteŽ .e.g., strontian barite for selected stations from theAtlantic, Pacific, Indian and Southern oceans areshown in Fig. 5. The surface waters in the SouthernOcean still appear to be slightly saturated with re-spect to a mixed barite phase but are much closer toequilibrium. In all the other ocean basins examined,
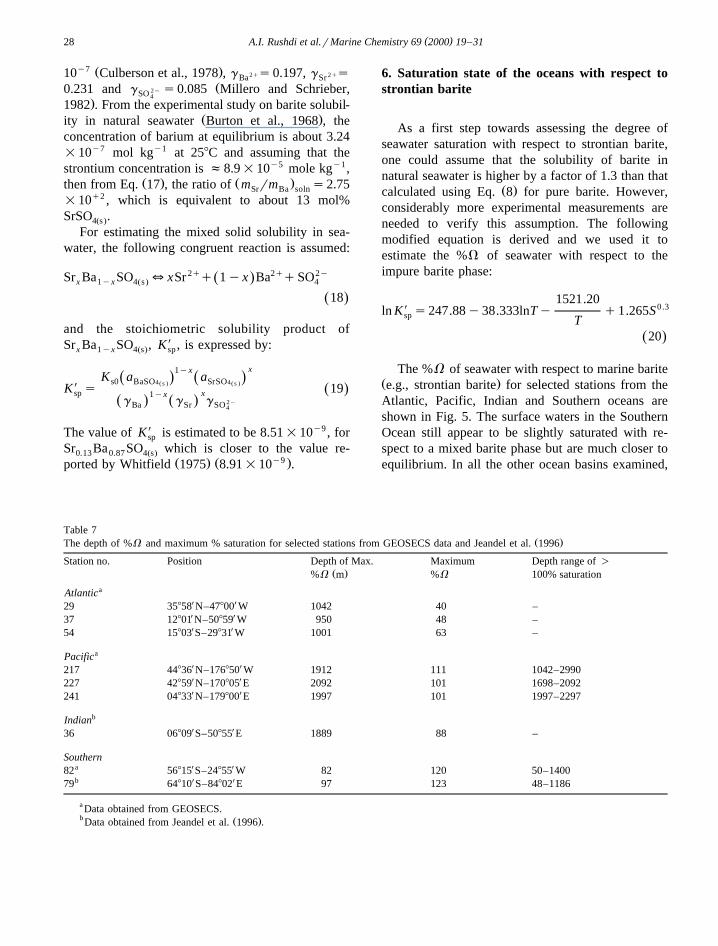
Table 7Ž .The depth of %V and maximum % saturation for selected stations from GEOSECS data and Jeandel et al. 1996
Station no. Position Depth of Max. Maximum Depth range of )Ž .%V m %V 100% saturation
aAtlanticX X29 35858 N–47800 W 1042 40 –X X37 12801 N–50859 W 950 48 –X X54 15803 S–29831 W 1001 63 –
aPacificX X217 44836 N–176850 W 1912 111 1042–2990X X227 42859 N–170805 E 2092 101 1698–2092X X241 04833 N–179800 E 1997 101 1997–2297
bIndianX X36 06809 S–50855 E 1889 88 –
SouthernX Xa82 56815 S–24855 W 82 120 50–1400X Xb79 64810 S–84802 E 97 123 48–1186
a Data obtained from GEOSECS.b Ž .Data obtained from Jeandel et al. 1996 .
( )A.I. Rushdi et al.rMarine Chemistry 69 2000 19–31 29
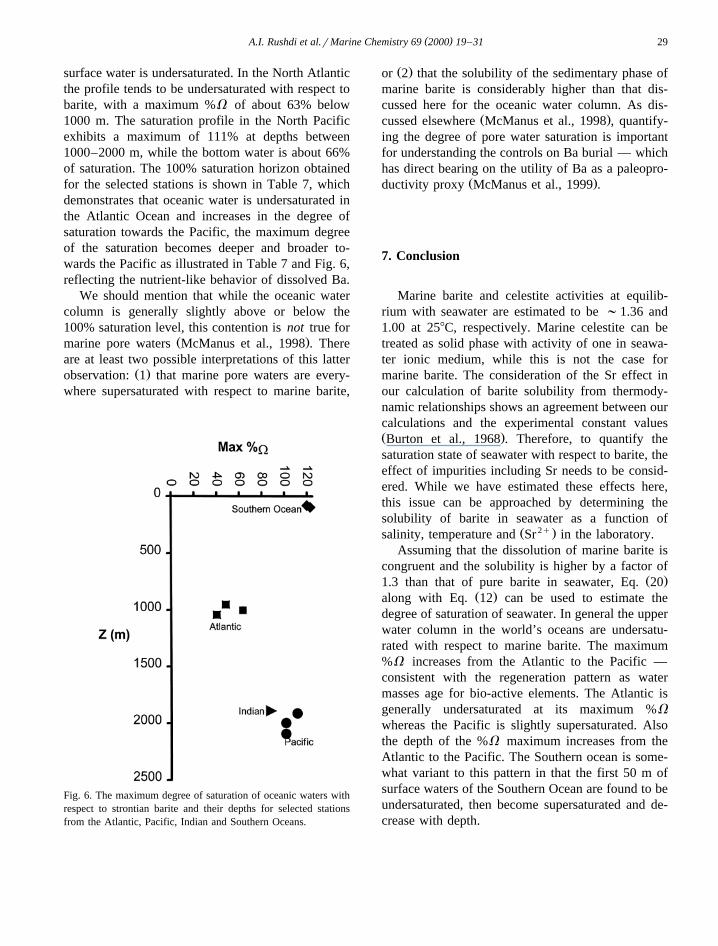
surface water is undersaturated. In the North Atlanticthe profile tends to be undersaturated with respect tobarite, with a maximum %V of about 63% below1000 m. The saturation profile in the North Pacificexhibits a maximum of 111% at depths between1000–2000 m, while the bottom water is about 66%of saturation. The 100% saturation horizon obtainedfor the selected stations is shown in Table 7, whichdemonstrates that oceanic water is undersaturated inthe Atlantic Ocean and increases in the degree ofsaturation towards the Pacific, the maximum degreeof the saturation becomes deeper and broader to-wards the Pacific as illustrated in Table 7 and Fig. 6,reflecting the nutrient-like behavior of dissolved Ba.
We should mention that while the oceanic watercolumn is generally slightly above or below the100% saturation level, this contention is not true for
Ž .marine pore waters McManus et al., 1998 . Thereare at least two possible interpretations of this latter
Ž .observation: 1 that marine pore waters are every-where supersaturated with respect to marine barite,
Fig. 6. The maximum degree of saturation of oceanic waters withrespect to strontian barite and their depths for selected stationsfrom the Atlantic, Pacific, Indian and Southern Oceans.
Ž .or 2 that the solubility of the sedimentary phase ofmarine barite is considerably higher than that dis-cussed here for the oceanic water column. As dis-
Ž .cussed elsewhere McManus et al., 1998 , quantify-ing the degree of pore water saturation is importantfor understanding the controls on Ba burial — whichhas direct bearing on the utility of Ba as a paleopro-
Ž .ductivity proxy McManus et al., 1999 .
7. Conclusion
Marine barite and celestite activities at equilib-rium with seawater are estimated to be ;1.36 and1.00 at 258C, respectively. Marine celestite can betreated as solid phase with activity of one in seawa-ter ionic medium, while this is not the case formarine barite. The consideration of the Sr effect inour calculation of barite solubility from thermody-namic relationships shows an agreement between ourcalculations and the experimental constant valuesŽ .Burton et al., 1968 . Therefore, to quantify thesaturation state of seawater with respect to barite, theeffect of impurities including Sr needs to be consid-ered. While we have estimated these effects here,this issue can be approached by determining thesolubility of barite in seawater as a function of
Ž 2q.salinity, temperature and Sr in the laboratory.Assuming that the dissolution of marine barite is
congruent and the solubility is higher by a factor ofŽ .1.3 than that of pure barite in seawater, Eq. 20
Ž .along with Eq. 12 can be used to estimate thedegree of saturation of seawater. In general the upperwater column in the world’s oceans are undersatu-rated with respect to marine barite. The maximum%V increases from the Atlantic to the Pacific —consistent with the regeneration pattern as watermasses age for bio-active elements. The Atlantic isgenerally undersaturated at its maximum %V
whereas the Pacific is slightly supersaturated. Alsothe depth of the %V maximum increases from theAtlantic to the Pacific. The Southern ocean is some-what variant to this pattern in that the first 50 m ofsurface waters of the Southern Ocean are found to beundersaturated, then become supersaturated and de-crease with depth.
( )A.I. Rushdi et al.rMarine Chemistry 69 2000 19–3130
Acknowledgements
A.I.R. would like to thank Prof. B.R.T. Simoneitfor providing the space and the facilities in hislaboratory. The authors also express their apprecia-tion to Professor T. Church and two other anony-mous reviewers for their constructive comments andsuggestions. Discussions with Prof. J. Dymond andDr. M. Torres at various stages of this work werefruitful. This work was supported by NSF grantOCE-9530056 and OCE-9617929 to J.M.
References
Ž .Arrhenius, G., 1963. The Sea, Vol. 3. In: Hill Ed. , Wiley-Inter-science, New York.
Bernstein, R.E., Byrne, R.H., Betzer, P.R., Gerco, A.M., 1992.Morphologies and transformations of celestite in seawater: therole of acantharians in strontium and barium geochemistry.Geochim. Cosmochim. Acta 65, 3273–3279.
Bishop, J.K.B., 1988. The barite–opal–organic association inoceanic particulate matter. Nature 331, 341–343.
Blount, C., 1977. Barite solubilities and thermodynamic quantitiesup to 3008C and 1400 bars. Am. Miner. 62, 942–957.
Bottazzi, E.M., 1978. Boll. Zoo. 45, 133.Brass, G., Turekian, K.K., 1974. Strontium distribution in
GEOSECS oceanic profiles. Earth Planet. Sci. Lett. 28, 141–148.
Burton, J.D., Marshall, N.J., Phillips, A.J., 1968. Solubility ofbarium sulfate in seawater. Nature 217, 834–835.
Chow, T.J., Goldberg, E.D., 1960. On the marine geochemistry ofbarium. Geochim. Cosmochim. Acta 20, 192.
Church, T.M., Wolgemuth, K., 1972. Marine barite saturation.Earth Planet. Sci. Lett. 15, 35–44.
Church, T.M., 1970. Marine barite. PhD Thesis, University ofCalifornia.
Ž .Church, T.M., 1979. Marine Minerals. In: Burns, R.G. Ed. ,Mineralogical Society of America, Vol. 6. Washington, DC,pp. 175–209.
Culberson, C.H., Lathan, G., Bates, R.G., 1978. Solubility andactivity of calcium and strontium sulfates in synthetic seawater
Ž .at 0.5 and 258C. J. Phys. Chem. 82 25 , 2693–2699.Dehairs, R., Chesselet, R., Jedwab, J., 1980. Discrete suspended
particles of barite and the barium cycle in the open ocean.Earth Planet. Sci. Lett. 49, 529–550.
Dymond, J., 1981. Geochemistry of Nazca Plate surface sedi-ments: an evaluation of hydrothermal, biogenic, detrital andhydrogenous sources. Geol. Soc. Am. Mem. 154, 133–174.
Dymond, J., Suess, E., Lyle, R., 1992. Barium in deep seasediment: a geochemical proxy for paleoproductivity. Paleo-ceanography 7, 163.
Falkner Kenisson, K., Klinkhammer, G.P., Bowers, T.S., Todd,J.F., Lewis, B.L., Landing, W.M., Edmond, J.M., 1993. The
behavior of barium in anoxic marine waters. Geochim. Cos-mochim. Acta 57, 537–554.
Felmy, A.R., Rai, D., Amonette, J.E., 1990. The solubility ofbarite and celestite in sodium sulfate: evaluation of thermody-
Ž .namic data. J. Solution Chem. 19 2 , 175–185.Francois, R., Honjo, S., Manganini, S.J., Ravizza, G.-E., 1995.
Biogenic barium fluxes to the deep sea: implication for paleo-productivity reconstruction.
Gingele, F., Dahmke, A., 1994. Discrete barite particles andbarium as tracers of paleoproductivity in south Atlantic sedi-ments. Paleoceanography 9, 151–168.
Goldberg, E., Arrhenius, G., 1969. Chemistry of pelagic sediment.Geochim. Cosmochim. Acta 33, 894.
Hamer, W.J., 1968. Theoretical mean activity coefficients ofstrong electrolytes in aqueous solutions from 0 to 1008C.National Standard Reference Data Series, National Bureau ofStandards, Publ. No. 24, Washington.
Hanor, J.S., 1968. Frequency distribution of compositions in thebarite–celestite series. Am. Miner. 53, 1215–1222.
Hanor, J.S., 1969. Barite saturation in seawater. Geochim. Cos-mochim Acta 33, 894–898.
Ives, D.J.G., Moseley, P.G.N., 1976. Deviation of thermodynamicfunctions of ionization from acidic dissociation constants. J.
Ž .Chem. Soc., Faraday Trans. I 72 1 , 1132–1143.Jeandel, C., Dupre, B., Lebaron, G., Monnin, C., Minster, J.F.,
1996. Longitudinal distributions of dissolved barium, silicaand alkalinity in the western and southern Indian Ocean.Deep-Sea Res. 43, 1–31.
Johnson, K.S., Pytkowicz, R.M., 1978. Ion association of Cly,with Hq, Kq, Ca2q, and Mg2q aqueous solution at 258C.Am. J. Sci. 278, 1428–1447.
Krauskopf, K.B., 1956. Factors controlling the concentration ofthirteen rare metals in seawater. Geochim. Cosmochim Acta 9,1.
Li, Y.H., Ku, T.L., Mathieu, G.G., Wolgemuth, K., 1973. Bariumin the Antarctic Ocean and implications regarding the marinegeochemistry of Ba and 226Ra. Earth Planet. Sci. Lett. 19,352.
Lown, D.A., Thirsk, H.R., Wynne-Jonnes, L., 1968. Effect ofpressure on ionization equilibria in water at 258C. Trans.Faraday Soc. 64, 2073–2080.
McManus, J. et al., 1998. Geochemistry of barium in marinesediments: implications for its use as a paleoproxy. Geochim.Cosmochim. Acta 62, 3453–3473.
McManus, J., Berelson, W.M., Hammond, D.E., Klinkhammer,G.P., 1999. Barium cycling in the North Pacific: implicationsfor the utility of Ba as a paleoproductivity and paleoalkalinityproxy. Paleoceanography 14, 53–61.
Millero, F.J., 1976. The effect of pressure on the solubility ofcalcite in seawater at 258C. Geochim. Cosmochim. Acta 40,983–985.
Millero, F.J., 1982. The effect of pressure on the solubility ofminerals in water and seawater. Geochim. Cosmochim. Acta46, 11–22.
Millero, F.J., 1983. Influence of pressure on chemical processes inŽ .the sea. In: Riley, J.P., Chester, R. Eds. , Chemical Oceanog-
raphy, Vol. 8, 1–88.
( )A.I. Rushdi et al.rMarine Chemistry 69 2000 19–31 31
Millero, F., Schrieber, D.R., 1982. Use of the ion pairing model toestimate activity coefficients of the ionic components of natu-ral waters. Am. J. Sci. 282, 1508–1540.
Monnin, C., 1999. A thermodynamic model for the solubility ofbarite and celestite in electrolytic solutions and seawater to2008C and to 1 kbar. Chemical Geology 153, 187–209.
Monnin, C., Galineir, C., 1988. The solubility of celestite andbarite in electrolyte solutions and natural waters at 258C: athermodynamic study. Chemical Geology 71, 283–296.
Monnin, C., Jeandel, C., Cattaldo, T., Dehairs, F., 1999. Themarine barite saturation state of the world oceans. Mar. Chem.,in press.
Owen, B.B., Brinkley, S.R., 1941. Calculation of the effect ofpressure upon ionic equilibrium in pure water and saltedsolutions. Chem. Rev. 29, 461–474.
Paytan, A., Kastner, M., Chavez, F.P., 1996. Glacial to inter-glacial fluctuations in productivity in the Equatorial Pacific asindicated by Marine Barite. Science 274, 1355–1357.
Pytkowicz, R.M., 1983. Equilibria, non-equilibria and naturalwaters, Vol. II. Wiley Interscience, New York, 353 pp.
Raju, K., Atkinson, G., 1988. Thermodynamics of ‘‘scale’’ min-eral solubilities: 1. BaSO in H O and aqueous NaCl. J.4Žs . 2
Chem. Eng. Data 33, 490–495.Raju, K., Atkinson, G., 1989. Thermodynamics of ‘‘scale’’ min-
eral solubilities: 2. SrSO in aqueous NaCl. J. Chem. Eng.4Žs .Data 34, 361–364.
Ramette, R.W., 1977. On deducing the pK-Temperature equation.J. Chem. Educ. 54, 280–283.
Ž .Reardon, E.J., Armstrong, D.K., 1987. Celestite SrSO solubil-4Žs .ity in water, seawater and NaCl solution. Geochim. Cos-mochim. Acta 51, 63–72.
Rieder, N., Ott, H.A., Pfundstein, P., Schoch, R., 1982. J. Proto-zool. 29, 15–18.
Roger, P.S.Z., 1981. Thermodynamics of geothermal fluids. PhDdissertation. University of California, Berkeley, 242 pp.
Rushdi, A.I., Chen, C.T., Suess, E., 1998. The solubility of calcitein seawater solution of different magnesium concentrations at258C and 1 atm total pressure: a laboratory re-examination. Lamer. 36, 9–22.
Templeton, C.C.J., 1960. Solubility of barium sulfate in sodiumchloride solution from 258C to 958C. J. Chem. Eng. Data 5,514–516.
Turekian, K.K., Tausch, E.H., 1964. Barium in deep-sea sedimentof the Atlantic Ocean. Nature 201, 696.
Whitfield, M., 1975. The extension of chemical models for seawa-ter to include trace components at 258C and 1 atm. pressure.Geochim. Cosmochim. Acta 39, 1545–1557.
Wolgemuth, K., Broecker, W.S., 1970. Barium in seawater. EarthPlanet. Sci. Lett. 8, 372.