Embed Size (px)
Citation preview

Interactions between Charged Polypeptides and Nonionic Surfactants
Helen Sjogren,*§ Caroline A. Ericsson,* Johan Evenas,y and Stefan Ulvenlund*z
*Physical Chemistry 1, Lund University, Lund, Sweden; and yMedicinal Chemistry and zProduct Development, AstraZeneca R&D Lund,Lund, Sweden
ABSTRACT The influence of molecular characteristics on the mutual interaction between peptides and nonionic surfactantshas been investigated by studying the effects of surfactants on amphiphilic, random copolymers of a-L-amino acids containinglysine residues as the hydrophilic parts. The hydrophobic residues were either phenylalanine or tyrosine. The peptide-surfactantinteractions were studied by means of circular dichroism spectroscopy and binding isotherms, as well as by 1D and 2D NMR.The binding of surfactant to the peptides was found to be a cooperative process, appearing at surfactant concentrations justbelow the critical micellar concentration. However, a certain degree of peptide hydrophobicity is necessary to obtain aninteraction with nonionic surfactant. When this prerequisite is fulfilled, the peptide mainly interacts with self-assembled, micelle-like surfactant aggregates formed onto the peptide chain. Therefore, the peptide-surfactant complex is best described in termsof a necklace model, with the peptide interacting primarily with the palisade region of the micelles via its hydrophobic sidechains. The interaction yields an increased amount of a-helix conformation in the peptide. Surfactants that combine smallheadgroups with a propensity to form small, nearly spherical micelles were shown to give the largest increase in a-helix content.
INTRODUCTION
Many peptides and proteins interact strongly with amphi-
philic molecules and these interactions are of vast impor-
tance, not only in vivo but also in technical applications. The
conformational changes in prion proteins provide a pertinent
example. Here, interactions with amphiphiles may stabilize
the a-helical conformation of the protein and hence decrease
the risk for the devastating b-sheet formation (1). Similarly,
interactions between peptides and amphiphiles (lipids) are
inherent features of the mechanism of membrane binding pep-
tides, including antibiotic ones (2–10). A large group of peptide
antibiotics fold into an amphipathic a-helical conformation
when interacting with the target membranes (7). Examples of
other native peptides and proteins that undergo a-helix for-
mation upon membrane binding include plasma apolipo-
proteins, mitochondrial presequences, virus fusion peptides,
and antibacterial peptides (11). For example, the binding of
magainin to a nonionic vesicle has been shown to be an
enthalpy-driven process, primarily driven by the increased
formation of a-helix (2–6). Similarly, the peptides melittin and
cecropin A show a transition from random coil to a-helix upon
interaction with micelles (12,13) and gelatin has been shown to
display a coil-helix transition in the presence of nonionic sur-
factants (14,15).
That interactions with surfactants and other amphiphiles
lead to an increased amount of a-helix conformation in
peptides is thus well known from the literature. Nevertheless,
the understanding of surfactant binding, concentration-
dependent effects, and the nature of peptide-surfactant
complexes still seems somewhat sketchy. Furthermore, the
influence of surfactant and peptide molecular characteristics
on the a-helix formation has not been studied in a systematic
fashion.
In this study, we have examined a range of nonionic
surfactants in terms of their ability to stabilize the a-helical
conformation of peptides. These studies have been supple-
mented by a thorough investigation of the specific inter-
molecular interactions between peptides and surfactants, as
well as their dependence on molecular characteristics. The
prime objectives of the study are to identify the molecular
properties of the peptides and surfactants that primarily govern
their mutual interaction. For this reason, the study comprises
simple model peptides, with well-defined secondary confor-
mation. More precisely, the peptides in this work are random
copolymers containing lysine as the hydrophilic part and
either phenylalanine or tyrosine as the hydrophobic part. For
these peptides, random coil and a-helix are the only two
conformations that need to be taken into account under the pH
conditions used in the study (16). Similarly, peptide aggre-
gation is strongly disfavored under these conditions, for
electrostatic reasons (16). The model peptides make it possible
to derive detailed information, at the molecular level, about
the roles of hydrophilic and hydrophobic side chains in the
interactions between peptide and surfactant. They also make it
possible to directly correlate these interactions with confor-
mational changes (random coil to a-helix) of the peptide. To
avoid end effects, model peptides with a large degree of
polymerization (generally .200 amino acid residues, corre-
sponding to .40 kDa) were selected.
A more specific objective of this study is to pave the way
for a rational selection of surfactants for pharmaceutical
formulations containing peptides. In such formulations,
surfactants provide a means to enhance the physical stability
Submitted April 26, 2005, and accepted for publication August 29, 2005.
Address reprint requests to Stefan Ulvenlund, Product Developoment,
AstraZeneca R&D Lund, 221 87 Lund, Sweden. Fax: 46-46-337128;
E-mail: [email protected].§nee Gillgren.
� 2005 by the Biophysical Society
0006-3495/05/12/4219/15 $2.00 doi: 10.1529/biophysj.105.065342
Biophysical Journal Volume 89 December 2005 4219–4233 4219

by preventing undesirable conformational changes, aggregation,
and surface adsorption caused by changes in pH, temperature,
and other parameters (17,18). An important contributing factor
to physical instability of peptide formulations is the propensity
of many peptides to form intramolecular b-sheets. In general,
this formation leads to precipitation of the peptide, which is
clearly detrimental for product performance. The b-sheet
formation in pharmaceutical peptides may be inhibited by
stabilization of the a-helical conformation and this, in turn, can
be achieved by addition of a suitable surfactant. It is preferable
to use nonionic surfactants, since they tend to be less potent
irritants on mucosa and other biointerfaces than ionic sur-
factants (17). Nevertheless, detrimental effects on mucosa and
epithelia are observed also for nonionic surfactants, and these
effects are concentration-dependent (19). For this reason, it is
desirable to select a surfactant that provides a high enough
physical stability of the peptide (i.e., preventing peptide
aggregation) at a sufficiently low concentration. However,
a clear rationale for this selection has not been established,
partly due to the incomplete understanding of the details of
peptide-surfactant interactions in aqueous solution.
This study focuses on alkylglycoside surfactants, but also
comprises a comparison with surfactants based on poly-
ethyleneoxide (PEO). PEO-based surfactants are approved
for use in pharmaceutics and are extensively used in for-
mulation. The alkylglycosides, on the other hand, are a class
of surfactants frequently used for membrane protein solu-
bilization, since they generally do not unfold the protein
(20). Their chemical stability and high biocompatibility
mean that they can be regarded as strong candidates for
future use in drug formulations.
MATERIALS AND METHODS
Chemicals
Co-poly-L-(lysine, phenylalanine) HBr, poly-L-lysine HCl and two different
types of co-poly-L-(lysine, tyrosine) were purchased from Sigma Chemicals
(Steinheim, Germany). They were stored at �18�C and used as received.
The mean molecular weight determined by viscosimetry, ÆMwævis, the cor-
responding average degree of polymerization, Dp, and the molar ratio
between the amino acids, all as stated by the manufacturer, are listed in Table
1. The table also presents the shorthand notations henceforth used to refer to
the various peptides.
n-Heptyl-b-D-glucoside (b-C7G1), n-octyl-b-D-glucoside (b-C8G1),
n-nonyl-b-D-glucoside (b-C9G1), n-octyl-b-D-maltoside (b-C8G2), n-decyl-
b-D-maltoside (b-C10G2), n-dodecyl-b-D-maltoside (b-C12G2), n-tetradecyl-
b-D-maltoside (b-C14G2), n-dodecyl-a-D-maltoside (a-C12G2), and
n-dodecyl-b-D-maltotrioside (b-C12G3) were obtained from Anatrace (Mau-
mee, OH) and were of Anagrade quality. Representative examples of the
molecular structure of these alkylglycosides are given in Fig. 1. Mono-
disperse samples of pentaethyleneglycol mono n-dodecyl ether (C12E5),
hexaethyleneglycol mono n-dodecyl ether (C12E6), and octaethyleneglycol
mono n-dodecyl ether (C12E8) were provided by Nikkol Chemical (Tokyo,
Japan).
Acetic acid, NaCl, and sodium acetate (p.A. grade), HCl and NaOH
(Titrisol grade), and D-(1)� glucose (‘‘for microbiology’’ grade) were
purchased from Merck (Darmstadt, Germany). Sodium hydrogen carbonate
(p.A. grade) was purchased from Fluka (Buchs, Switzerland). Deuterium
oxide, acetic acid-D4, and sodium deuteroxide, with an isotopic purity of
99.9%, 99.5%, and 99.5%, respectively, were purchased from Cambridge
Isotope Laboratories (Andover, MA). Distilled water, purified on a PureLab
Plus water purification apparatus and filtered through a 0.10-mm filter, was
used in all experiments.
Spectra/Por regenerated cellulose membrane discs, with a molecular
weight cutoff of 6–8 kDa, were purchased from Spectrum Laboratories
(Breda, The Netherlands).
Circular dichroism spectroscopy
Circular dichroism (CD) spectra of the peptides were recorded on a Jasco
J715 spectropolarimeter with the samples enclosed in standard cuvettes
made of quartz and with an optical pathlength of 1.000 cm. For each sample,
30–50 individual spectra were collected and added. All measurements,
except the temperature study of C12E6, were carried out at 20�C. The
temperature was controlled by a Peltier-type temperature control system.
A peptide concentration of 25 mg/ml (which equals 0.14 mM of amino
acid residues) was used, and the samples were buffered at pH 4.90 (60.02)
with 20 mM acetate buffer. All measurements were performed within 1 h of
TABLE 1 Mean molecular weight, degree of polymerization,
and molar ratio of the poly-L-amino acids used
Polypeptide
Shorthand
notation
(ÆMwævis
(kDa) Dp
Molar
ratio
Poly-L-lysine HCl Kn 52.5 319 —
Co-poly-L-(lysine,
phenylalanine) 1:1
HBr
(KF)n 49.0* 275* 52:48
42.2y
237y
52:48
Co-poly-L-(lysine,
tyrosine) 1:1 HBr
(KY)n 128 684 53:47
Co-poly-L-(lysine,
tyrosine) 4:1 HBr
(K4Y)n 24.6 123 80:20
The degree of polymerization, Dp, refers to the number of amino acid
residues in each peptide chain.
*Used for NMR and binding isotherm.yUsed for all other studies.
FIGURE 1 Chemical structure of three different alkylglycosides:
n-octyl-b-D-glucoside (b-C8G1), n-dodecyl-a-D-maltoside (a-C12G2), and
n-dodecyl-b-D-maltotrioside (b-C12G3). Note the difference between
alkylglycosides (surfactants with an undefined number of sugar units in
the headgroup) and alkylglucosides (surfactants with one sugar unit in the
headgroup).
4220 Sjogren et al.
Biophysical Journal 89(6) 4219–4233

sample preparation. For (KF)n 1 b-C8G1, measurements were also
performed in deuterated solutions, to allow for a direct comparison with
the binding isotherm experiments. However, no significant difference in the
a-helix content of (KF)n was observed when deuterated solutions were used.
The CD signal recorded at 225 nm was used in calculations of the a-helix
content. However, CD spectra were recorded between 220 and 250 nm to
verify absence of secondary conformations other than a-helix and random
coil (e.g., b-sheets and b-turns). Additionally, for (KF)n, the absence of
peptide conformations other than random coil and a-helix was verified by
measuring the CD spectra in a wider wavelength region (200–250 nm),
before and after addition of 2 mM b-C12G2 (results not shown) or 0.2 M
b-C8G1 (Fig. 2). For these studies, a cuvette with an optical pathlength of
0.100 cm was used to allow for data acquisition in the far-UV region.
A baseline offset of ,1.4 mdeg was observed in most measurements.
This offset is a normal effect of minor instrument misalignments and
changes slightly every time the instrument is restarted. When the data were
evaluated the offset was subtracted by assuming that the CD signal is zero at
250 nm. However, in the (KY)n and (K4Y)n case, no baseline correction was
applied, since the tyrosine residues give a significant CD contribution at
wavelengths around 250 nm.
The total CD signal depends linearly on the CD signals of the different
types of secondary conformation in the peptide. The peptides used in this
study only form a-helical and/or random coil conformation under the
relevant conditions. Hence, the recorded CD signal at any given wavelength,
A, can be expressed as
A ¼ AaXa 1 ð1 � XaÞAc; (1)
where Aa and Ac are the CD signals for a peptide in a 100% a-helix and
a 100% random coil conformation, respectively, and Xa is the fraction of the
peptide in a-helical conformation. Eq. 1 can be rewritten as
Xa ¼ ðA� AcÞ=ðAa � AcÞ: (2)
For Kn, conditions for obtaining 100% a-helix or 100% random coil
conformation can be found in the literature. At a 0.01–0.06% concentration,
Kn has been reported to form a 100% random coil conformation at pH 5 and
22�C, whereas it forms a 100% a-helix conformation at pH 11 and 22�C(21,22). In this study, a 0.15-mM (amino acid residue concentration)
solution of Kn in 0.1 M HCl and 0.1 M NaOH was used to determine the
100% random coil and 100% a-helix spectra, respectively. In contrast to Kn,
it was found necessary to use a medium with very low ionic strength (0.02 M
acetic acid) to achieve 100% random coil conformation in (KF)n. Similarly,
formation of 100% a-helix in (KF)n requires addition of nonionic surfactant.
Consequently, the a-helix spectrum of this peptide was recorded in 0.1 M
NaOH solution containing 5 mM b-C12G2, as has previously been reported
(16).
For (K4Y)n and (KY)n, 100% a-helix conformation is impossible to
obtain by titration, due to the fact that tyrosine residues (pKa ¼ 10.07) (23)
are charged under pH conditions where the lysine residues (pKa ¼ 10.53)
(24) are uncharged, and vice versa. Furthermore, the CD results for the
tyrosine-containing peptides cannot be evaluated using the 100% a-helix
spectra for Kn or (KF)n, since the tyrosine residues absorb in the region of the
characteristic a-helix minima and random coil maximum. Therefore, the
results from the tyrosine-containing peptides are only reported in terms of
absolute changes in CD signal upon addition of surfactant, DCD.
Using the spectra for the all-coil and all-helix reference solutions, Aa and
Ac for Kn and (KF)n were determined. From these values, Xa were calculated
for any given sample by means of Eq. 2.
The increased amount of peptide in a-helix conformation obtained upon
addition of surfactant, DXa, is calculated as the difference between Xa at
surfactant concentrations $10 3 CMC (critical micellar concentration,
where the fraction of peptide in a-helix conformation is independent of the
surfactant concentration) and Xa observed in the absence of surfactant.
Tensiometry
A KSV Sigma 70 tensiometer equipped with a du Nouy ring made of
platinum was used to determine the liquid/air surface tension as a function of
surfactant concentration. The system was temperature-controlled at 20�C by
a circulating water bath. The surfactant solutions were prepared in 20 mM
acetate buffer at pH 4.90. At each measurement, the surface tension was
recorded after a maximum of 1 h of equilibration. With time, a small drift
toward lower surface tension was observed. However, the drift was not
affecting the determination of the CMC, except for b-C14G2. For this
surfactant, the very low CMC renders the measurements difficult, and
a larger drift was observed. As a consequence, the CMC determination for
b-C14G2 is less accurate than for the other surfactants.
NMR spectroscopy
All samples were prepared in 20 mM deuterated acetate buffer at pD 5.0, as
measured with a pH meter. All 1H chemical shifts are referenced to the
residual HDO signal set to 4.75 ppm. Indirect chemical shift referencing is
employed for 13C using the frequency ratio J ¼ nC/nH ¼ 0.25145002,
where nC and nH correspond to the 13C and 1H frequencies, respectively, of
the methyl resonances (0 ppm) in tetramethylsilane in H2O (25). All studies
were performed at 25�C.
In the investigation of the binding isotherm of b-C8G1 to (KF)n, 1D 1H
spectra were acquired on a 400 MHz Varian INOVA spectrometer equipped
with a 5-mm 1H-13C switchable gradient probe (Nalorac, Martinez, CA). All
spectra were recorded with a spectral width of 6250 Hz, 24,992 complex
points, and a spectra total relaxation delay of 4 s between each scan. For each
experiment, 512 scans were recorded. Automatic gain adjustment was
employed. The NMR data were processed with a pure cosine window
function, zero-filled to 128,000 before the Fourier transform, and followed
by automatic baseline correction.
Initial studies of possible interactions between various peptides and the
surfactant b-C12G2 were performed by acquiring standard 1D 1H spectra on
400 and 500 MHz Varian INOVA spectrometers on seven separate samples,
namely (KF)n, Kn, (K4Y)n, b-C12G2, (KF)n 1 b-C12G2, Kn 1 b-C12G2, and
(K4Y)n 1 b-C12G2. The NMR samples contained 0.25–0.65 mM of
polypeptide (which corresponds to 80 mM of amino acid residues) and/or 40
mM surfactant. More detailed studies were performed on samples of (KF)n,
b-C12G2, (KF)n 1 b-C12G2, and (K4Y)n 1 b-C12G2 using 2D NMR
techniques. Nearly complete 1H and 13C chemical shift assignments were
FIGURE 2 CD spectra for (KF)n with (dotted trace) and without (dashedtrace) addition of 0.2 M b-C8G1. The reference spectra for 100% a-helix
and 100% random coil (solid traces) are given for comparison. A (KF)n
concentration of 25 mg/ml (which equals 0.14 mM of amino acid residues)
was used in the CD measurements. All measurements were performed in
a 20-mM acetate buffer at pH 4.9.
Peptides and Nonionic Surfactants 4221
Biophysical Journal 89(6) 4219–4233

obtained for these four samples by recording 13C–1H heteronuclear single
quantum correlation (HSQC) (26,27), 1H nuclear Overhauser enhancement
spectroscopy (NOESY) (28,29), and 1H total correlation spectroscopy
spectra (30,31) with a DIPSI-2 relaxation-compensated isotropic sequence
(32). Intermolecular contacts were studied from a series of 2D NOESY
spectra with mixing times from 15 to 200 ms. All 2D spectra were acquired
on a 500 MHz Varian INOVA spectrometer equipped with a 5-mm1H/13C/15N triple-resonance probe.
Dialysis and binding isotherm measurements
The binding of b-C8G1 to (KF)n was determined by equilibrium dialysis,
using a Spectrum equilibrium dialyzer with semi-micro cells. We used 800-
ml aliquots of solutions containing a peptide concentration of 18 mM (5 mM
of amino acid residues) and 0.5 mM b-C8G1 dialyzed against 800 ml aliquots
of b-C8G1 in the concentration range 0.5–60 mM. All solutions were
prepared in 20 mM deuterated acetate buffer at pD 5.0. The dialyzer was run
at maximum speed (30 rpm) until equilibrium was reached (;70 h). At
equilibrium, the free b-C8G1 concentration in the peptide-free dialysis cell
halves was determined by 1H NMR from the area of the signals in three
different regions of the 1H NMR spectra, namely 0.66–1.03, 1.03–1.53, and
1.53–1.83 ppm. The regions were carefully selected so that all chemical shift
changes observed in the studied concentration interval were taken into
account. The integral values were corrected for the various gain parameters
employed (as given in the preceding section) and evaluated with reference to
standard curves for b-C8G1 measured in the range 0.5–40 mM. The
reference curves displayed a linear regression coefficient R $ 0.9996.
Attempts were made to determine the binding isotherm also for the
binding of b-C9G1 to (KF)n (results not shown). In this case, the
establishment of dialysis equilibrium was found to be exceedingly time-
consuming (dialysis times of �300 h). The membrane pore size used
(molecular weight cutoff ¼ 6–8 kDa) is smaller than the size of both b-C8G1
and b-C9G1 micelles, implying that only surfactant monomers pass through
the membrane pores. However, the propensity of b-C9G1 (33) to form
elongated aggregates may open the possibility for surfactant monolayer
coverage of the membrane. This stronger interaction with the dialysis
membrane could possibly lead to a concomitant bilayer coverage of the
membrane pores, which would dramatically decrease the membrane
permeability. Such a scenario could possibly serve as an explanation
for the huge decrease in dialysis equilibrium rate between b-C8G1 and
b-C9G1.
Dynamic light scattering
Dynamic light scattering (DLS) experiments were performed at 20�C on
a Brookhaven ZetaPALS instrument (Brookhaven Instruments, Holtsville,
NY). The instrument was equipped with a thermostated sample cell and
a laser operating at 532 nm. The scattered light was measured at an angle of
90� with the samples enclosed in 1.00-cm polystyrene cuvettes. The samples
contained 10 g/L of surfactant, dissolved in 20 mM acetate buffer at pH 4.90.
All solutions used in the DLS experiments were filtered through an Acrodisc
filter with a pore size of 0.1 or 0.2 mm. Data were collected for 10 min for
each sample and analyzed by means of the software supplied with the
instrument (Brookhaven DLS software, ver. 2.13). The analysis is based on
the method of cumulants (34).
The analysis yields the diffusion coefficient D of the particles in the
system. The effective hydrodynamic diameter, dH, reported in this work is
derived directly from Stoke-Einstein’s equation (Eq. 3) using the diffusion
coefficient, D:
D ¼ kT=ð3phdHÞ: (3)
Here, k is the Boltzmann constant, T the absolute temperature of the
solution, and h the solvent viscosity.
Since the micelles may be elongated objects and the Stoke-Einstein
equation strictly applies only to hard spheres, the effective hydrodynamic
diameter is to be considered merely as an alternative way to represent the
primary DLS data, namely the diffusion coefficient D.
RESULTS
Effects of surfactants on peptide conformation
The pKa for lysine in solution is 10.53 (24) and the lysine
residues in Kn, (KF)n, (KY)n and (K4Y)n are therefore
protonated and charged under the pH conditions used in this
study (pH 4.9). The high charge of the peptides at pH 4.9
means that their conformation is predominantly random coil
and that peptide aggregation is strongly disfavored for
electrostatic reasons. Previous work on Kn and (KF)n shows
that b-sheet formation with concomitant aggregation and
precipitation only occur at pH .9 for (KF)n (16). For Kn,
b-sheet formation occurs at pH.11 and elevated temperatures
(.35�C) and/or very high peptide concentrations (35–37).
However, the CD spectra of aqueous peptide solutions at pH
4.9 reveal that addition of 5 mM b-C12G2 significantly
increases the amount of a-helix conformation in (KF)n and
(KY)n (Table 2). In contrast, the conformation of the more
hydrophilic peptides Kn and (K4Y)n is unaffected by addition
of surfactant (Table 2). These results clearly indicate that
nonionic surfactants interact with peptides, provided that the
peptide comprises a high enough relative number of hydro-
phobic amino acid residues. This is in agreement with previous
studies, where (KF)n was shown to interact with net neutral
phosphatidylcholine liposomes (38).
The amount of surfactant required to induce an increased
amount of a-helix was determined by measuring the CD
signal of (KF)n solutions as a function of surfactant con-
centration. The stabilization of the a-helix conformation was
found to be a cooperative effect, the onset of which occurs at
a surfactant concentration somewhat lower than the CMC of
each pure surfactant (Figs. 3 and 4, Tables 2 and 3). Upon
increasing surfactant concentration, the amount of a-helix
increases drastically within a relatively narrow concentration
range and then levels off. At high surfactant concentrations
($10 3 CMC), the peptide conformation is thus inde-
pendent of surfactant concentration. As described above, this
limiting amount of a-helix stabilization is referred to as DXa.
Variation of the surfactant headgroup was found to
strongly influence the stabilization of a-helix conformation,
as measured in terms of DXa (Table 2, Fig. 4). For sugar
surfactants, a larger headgroup makes the surfactant less
efficient as stabilizer for the a-helix conformation (Fig. 5). In
addition, the ability of alkylmaltosides to stabilize a-helix
also depends on headgroup conformation, as is evident when
a-C12G2 is compared with b-C12G2 (Fig. 4, Table 2). In
terms of the effect of headgroup size on a-helix stabilization,
surfactants based on PEO display the same trend as the sugar
surfactants (Table 2, Fig. 5).
4222 Sjogren et al.
Biophysical Journal 89(6) 4219–4233

For alkylglycosides, the effect of the surfactant hydrocar-
bon chain length on the peptide a-helix content actually
depends on the surfactant headgroup (Fig. 6). For the
alkylmaltosides investigated here, the a-helix stabilization is
independent of the hydrocarbon chain length, thus suggest-
ing that the headgroup size is the limiting factor for DXa.
Similarly, there is no difference in a-helix stabilization between
the short-chain alkylglucosides b-C7G1 and b-C8G1. On the
other hand, for b-C9G1, the stabilization effect is markedly
lower. Since b-C7G1 and b-C8G1 both form small, nearly
spherical micelles, whereas b-C9G1 forms elongated ones
(33,39), the observed differences in a-helix stabilization may
be due to differences in preferred aggregate morphology and
hence to differences in critical packing parameter (CPP). To
further investigate this possibility, the conformation of (KF)n
in the presence of C12E6 was determined as a function of
temperature. As for all PEO-based surfactants, the CPP for
C12E6 increases with temperature, which leads to a dramatic
increase of the hydrodynamic diameter of C12E6 micelles at
higher temperatures (Fig. 7). It is known from literature that the
micelles preferentially grow in one dimension (40,41). As can
be seen in Fig. 7, the a-helix content of (KF)n at constant C12E6
concentration indeed decreases with increasing temperature,
which lends strong support to the idea that CPP and preferred
micelle morphology play a role in the efficiency of the a-helix
stabilization. In contrast, the effect of temperature on (KF)n
conformation in the absence of surfactant was found to be
minute.
The surfactant binding isotherm
In agreement with the CD studies of surfactant effects on
peptide conformation, the binding isotherm of b-C8G1 to
(KF)n, as determined by equilibrium dialysis combined with
1D 1H NMR spectroscopy, displays a strong binding of the
surfactant slightly below the surfactant CMC of the pure
surfactant (22 mM; Fig. 8) This strongly suggests the binding
is a cooperative process that produces micellar-like self-
assembled surfactant structures on the peptide chain. We
may therefore assume that the presence of surfactant aggre-
gates is a key feature in the stabilization of a-helix (Fig. 8).
TABLE 2 Stabilizing effect of different surfactants
on peptide a-helix
Peptide Surfactant DXa (%)
Kn b-C12G2 0
(K4Y)n b-C12G2 0
(KY)n b-C12G2 DCD ¼ 2.7 6 0.1 mdeg*
(KY)n a-C12G2 DCD ¼ 1.0 6 0.1 mdeg*
(KF)n b-C12G2 14.7 6 0.3
(KF)n a-C12G2 11.3 6 0.1
(KF)n b-C8G2 14.3 6 0.6
(KF)n b-C10G2 15.1 6 0.3
(KF)n b-C14G2 15.8 6 0.1
(KF)n b-C7G1 22.4y
(KF)n b-C8G1 22.9 6 0.3
(KF)n b-C9G1 17.7 6 0.8
(KF)n b-C12G3 12.5 6 0.1
(KF)n C12E5 17.2 6 0.8
(KF)n C12E6 16.7 6 0.6
(KF)n C12E8 15.1 6 0.4
The stabilizing effect is expressed as the increase in peptide a-helix fraction,
DXa, at surfactant concentration $10 3 CMC. The values represent the
mean value from at least three independent measurements 6 1 SD.
Standard deviations #0.1 are given as 60.1.
*For (KY)n, it is not possible to determine an absolute value for the
increased amount of a-helix, due to inherent limitations of the CD
technique (see Materials and Methods).yThe (KF)n CMC required extremely large amounts of surfactant, and
because of cost considerations, only one sample solution was prepared.
FIGURE 3 Surface tension (:) and the fraction of (KF)n in a-helix
conformation (Xa, ¤) as a function of b-C12G2 concentration. A (KF)n
concentration of 25 mg/ml (which equals 0.14 mM of amino acid residues)
was used in the CD measurements. All measurements were performed in
a 20-mM acetate buffer at pH 4.9. The kink in the tensiometric data indicates
the CMC of b-C12G2. The solid traces are added as guides for the eye.
FIGURE 4 The fraction of (KF)n in a-helix conformation, Xa, as
a function of surfactant concentration for a-C12G2 (d), b-C12G2 (n),
b-C9G1 (:), and C12E5 (¤). All curves are normalized to the CMC of the
specific surfactant. A (KF)n concentration of 25 mg/ml (which equals 0.14
mM of amino acid residues) was used, and the measurements were
performed in a 20-mM acetate buffer at pH 4.9. The solid traces are added as
guides for the eye.
Peptides and Nonionic Surfactants 4223
Biophysical Journal 89(6) 4219–4233

On the average, more than one surfactant monomer bind
each peptide amino acid residue at high surfactant con-
centration. The binding isotherm does not afford any infor-
mation about the aggregation number of the self-assembled
structures (micelles) on the peptide chain. However, a rough
estimate of the number of micelle aggregates bound to each
peptide chain can be calculated if the aggregation number is
assumed to be identical to that in the corresponding pure
surfactant solution. At 29 mM, the approximate micellar
aggregation number for b-C8G1 micelles is 54 (42).
According to the binding isotherm data, the number of
bound surfactant molecules per amino acid residue (b) is 1.2
at this surfactant concentration. Considering that the average
degree of polymerization of (KF)n is 275 (Table 1), this
would correspond to six micelles per peptide molecule,
assuming that the micelle aggregation number is unaffected
by the presence of peptide.
The binding isotherm is analyzed in more detail in the
Discussion section.
Characterization of thepeptide-surfactant complex
1D and 2D NMR spectra were acquired at 400 and 500 MHz
spectrometers to characterize the peptide-surfactant com-
plex. Three peptides, (KF)n, Kn, and (K4Y)n, were studied
separately in the absence and presence of b-C12G2. Since all
samples were prepared in D2O, no exchangeable protons
were observed and the results presented here mainly rely on
the amino acid side chains. In other words, no conclusions
can be drawn about possible surfactant interaction, either
with the amide protons in the backbone or with the amine
end group of the lysine residues.
It is noteworthy that the NMR spectra of (KF)n and (K4Y)n
show significantly sharper resonance lines for lysine protons
than for the phenylalanine and tyrosine protons, both in the
TABLE 3 Critical micellar concentration for the
different surfactants
Surfactant
Shorthand
notation
CMC*
(mM) (this
work)
CMC (mM)
(literature values)
n-Dodecyl-b-D-maltoside b-C12G2 0.21 0.16y
n-Dodecyl-a-D-maltoside a-C12G2 0.15z
n-Octyl-b-D-maltoside b-C8G2 26.5§
n-Decyl-b-D-maltoside b-C10G2 2.0{
n-Tetradecyl-b-D-maltoside b-C14G2 0.014 (H2O) 0.01z
n-Heptyl-b-D-glucoside b-C7G1 70z
n-Octyl-b-D-glucoside b-C8G1 22y
n-Nonyl-b-D-glucoside b-C9G1 6.3 6.9 (H2O) 6.5y
n-Dodecyl-b-D-maltotrioside b-C12G3 0.2§
Pentaethyleneglycol mono
n-dodecyl ether
C12E5 0.060 0.057**
Hexaethyleneglycol mono
n-dodecyl ether
C12E6 0.087**
Octaethyleneglycol mono
n-dodecyl ether
C12E8 0.092**
*Determined in 20 mM acetate buffer, pH 4.9, unless otherwise stated.yDetermined in H2O (67,68).zDetermined in H2O by Anatrace.§Determined in 0.15 mM KCl (69).{Determined in 0.01 M NaCl (70).
**Determined in H2O (71).
FIGURE 5 Increase in peptide a-helix conformation, DXa, (determined
with CD spectroscopy) as a function of surfactant headgroup size, for
b-C12GX surfactants (:) and C12EX surfactants (¤). A (KF)n concentration
of 25 mg/ml (which equals 0.14 mM of amino acid residues) was used, and
the measurements were performed in a 20-mM acetate buffer at pH 4.9.
Since the Krafft point of b-C12G1 is above room temperature, it cannot be
used for comparison. The glucosides are therefore represented by b-C9G1.
The data points represent the mean value from at least three independent
measurements, and the error bars correspond to 1 SD.
FIGURE 6 Increase in peptide a-helix conformation, DXa, as determined
with CD spectroscopy, as a function of surfactant hydrocarbon chain length,
for b-CXG1 surfactants (:) and b-CXG2 surfactants (¤). Data represent
systems with a surfactant concentration of $10 3 CMC and a (KF)n
concentration of 25 mg/ml (which equals 0.14 mM of amino acid residues) in
a 20-mM acetate buffer at pH 4.9. The solid traces are added as guides for
the eye. The data points represent the mean value from at least three
independent measurements, and the error bars correspond to 1 SD.
4224 Sjogren et al.
Biophysical Journal 89(6) 4219–4233

absence and presence of b-C12G2. The line broadening is
more pronounced for (KF)n than for (K4Y)n, which may
reflect the larger size of the former peptide (275 residues)
compared to that of the latter (123 residues). The broader
signals from tyrosine and phenylalanine compared to lysine
side chains seemingly imply that the correlation time of the
lysine side chain is shorter, i.e., that lysine residues are more
flexible. This could be explained by a higher degree of
solvent exposure for the lysine residues than for the aromatic
ones; for example, aromatic residues may take part in the
formation of transient, intramolecular hydrophobic domains.
A complementary or alternative explanation would be that
the aromatic side chains experience more chemical exchange
on the microsecond to millisecond timescales than do lysine
side chains and thereby get an extra contribution to the
transverse relaxation rate, resulting in broader resonance
lines. Such chemical exchange would be compatible with the
idea that the motion of the hydrophobic side chains is more
restricted, due to intramolecular hydrophobic interactions. In
addition, some apparent line broadening is likely to be
a consequence of the natural sequence variation in these
random polypeptides. More in-depth studies would be required
to establish the exact structural and dynamic origin(s) of the
observed line broadening in the peptides themselves. However,
the primary aim of these studies is to investigate effects due to
intermolecular interactions between the surfactant and peptide
molecules. Therefore, the NMR results presented and dis-
cussed henceforth are focused on the differences between the
spectra of individual peptides and surfactants on the one hand,
and the spectra of the corresponding binary mixtures on the
other.
Addition of b-C12G2 to the peptide solutions showed no
effect on line shapes or chemical shifts of the proton reso-
nance lines for Kn or (K4Y)n in the 1D 1H NMR spectra. In
contrast, the proton signals of the phenyl rings in (KF)n were
clearly broadened and altered, consistent with appreciable
peptide-surfactant interaction (Fig. 9). The side-chain proton
peaks of the lysine residues in (KF)n were, however, un-
affected upon addition of surfactant. This suggests that
peptide and surfactant mainly interact through the aromatic
rings of the peptide. The NMR data therefore substantiate the
assumption that a certain minimum fraction of hydrophobic
and/or aromatic amino acid residues is necessary for
FIGURE 7 Increase in peptide a-helix conformation, DXa, (¤) (measured
with CD spectroscopy) and the effective hydrodynamic diameter, dH, (:)
(measured with DLS) as a function of (A) temperature for C12E6 and (B)
hydrocarbon chain length for b-CXG1. A surfactant concentration of $10 3
CMC and a (KF)n concentration of 25 mg/ml (which equals 0.14 mM of
amino acid residues) were used. The measurements were performed in a
20-mM acetate buffer at pH 4.9. The DLS measurements were performed
on solutions of pure surfactant (no peptide added). The solid traces are added
as guides for the eye.
FIGURE 8 Number of bound b-C8G1 molecules per amino acid residue
in (KF)n (b) as a function of free b-C8G1 concentration [Sfree]. [Sfree] as
determined by equilibrium dialysis and subsequent NMR assay of surfactant
concentration. The data points represent the average of values calculated
from signals in three different regions in the NMR spectra, and the error bars
correspond to 1 SD. The solid trace is a fit to the Hill equation (Eq. 5),
whereas the dashed trace is a fit to the Scatchard equation (noncooperative
binding, Eq. 5 with n ¼ 1) and the dotted line to the Satake-Yang equation
(Eq. 4).
Peptides and Nonionic Surfactants 4225
Biophysical Journal 89(6) 4219–4233

surfactant-peptide interaction. The NMR signals of the
surfactant tell the same story. The 1H peaks of b-C12G2 are
both shifted and broadened by addition of (KF)n, but
seemingly unchanged by addition of (K4Y)n or Kn. This
observation is illustrated by Fig. 10, which displays the 1D1H spectral region containing the sugar protons of the
b-C12G2 alone and mixed with (KF)n and (K4Y)n, re-
spectively (data for Kn not shown).
To investigate the peptide-surfactant interaction in more
detail, 2D NMR spectra were acquired for (KF)n and
b-C12G2, separately as well as when mixed (Tables 4 and 5).
The 1H and 13C chemical shift assignments of both the
peptide and the surfactant were readily obtained by standard
2D NMR techniques, as described in the Materials and
Methods section. Even the chemical shifts of the crowded
spectral region of the sugar protons proved possible to
resolve by means of 1H-13C correlated spectroscopy (Fig. 11,
top). The chemical shift assignments demonstrate that the
protons of b-C12G2 are significantly affected by the peptide,
and that the effect is most pronounced for the inner sugar
ring and the hydrocarbon tail (Fig. 12). The chemical shift
distributions of the protons in the surfactant hydrocarbon
chain do not allow for any definite conclusion to be drawn
about the exact location of the hydrophobic peptide side
chain within the micelle core. This is mainly a consequence
of the statistical distribution of the CH2 and CH3 groups
in the alkyl chain within a spherical or ellipsoidal shaped
micellar core, where a large fraction of the hydrocarbon
chain segments are located in the vicinity of the core surface
(43–45).
There are no significant changes in the 13C chemical shifts
of the surfactant in the absence or presence of peptide. In
strong contrast to the surfactant, the 1H and 13C chemical
shifts of (KF)n are virtually unchanged (see Tables 4 and 5),
although, as already stated, the proton signals of the phenyl
ring are clearly broadened. The absence of changes in the Ha
and Ca chemical shifts upon addition of surfactant is
noteworthy, considering the clear increase in a-helical content
observed from the CD data (46). In some sense, based on the
chemical shift data, it appears as if the peptide affects the
surfactant micelles more than the micelles affect the peptide.
Although the chemical shift analyses strongly suggest that
(KF)n and b-C12G2 interact, more robust and unambiguous
proofs of intermolecular interactions are obtained from 2D1H-1H NOESY experiments. This type of 2D spectrum
displays NOE crosspeaks located at the chemical shifts of
protons that are correlated through magnetization transfer
mediated by dipole-dipole interactions. The effect occurs
through space and is independent of covalent bonds. It is
strongly distance-dependent and the protons normally need
to be separated by ,;5 A to be observed in NOESY spectra.
NOE crosspeaks are observed between the aromatic rings of
(KF)n and the aliphatic hydrocarbon chain of b-C12G2, as
shown in Fig. 11 (bottom). Weak NOE crosspeaks are
observed also between the phenyl ring and the surfactant
headgroup. This finding shows that the aromatic rings and
the hydrophobic tail of the surfactant, at least on an average
level, are spatially close (like CD spectroscopy, NMR only
captures the ensemble- and time-averaged properties of the
sample). In contrast, no intermolecular NOEs are observed
between (K4Y)n and b-C12G2 (data not shown). It is
noteworthy that no obvious NOEs are observed between
FIGURE 9 Expansion of the aromatic region of 1D 1H NMR spectra
acquired at 500 MHz for (A) 80 mM (KF)n, (B) 80 mM (KF)n 1 40 mM
b-C12G2, (C) 80 mM (K4Y)n, and (D) 80 mM (K4Y)n 1 40 mM b-C12G2.
All concentrations are given as amino acid residue concentrations. All
solutions were prepared in 20 mM deuterated acetate buffer, pD 5.
FIGURE 10 Expansion of 1D 1H NMR spectra recorded at 500 MHz showing
the sugar proton resonances for (A) 40 mM b-C12G2, (B) 40 mM b-C12G2 1
80 mM (KF)n, and (C) 40 mM b-C12G2 1 80 mM (K4Y)n. Ha peaks of lysine
and phenylalanine are indicated by * and **, respectively, in B. Similarly, in C, *
and ** indicate the Ha peaks of lysine and tyrosine. For the peptides, all
concentrations are given as the amino acid residue concentrations. All solutions
were prepared in 20 mM deuterated acetate buffer, pD 5.
4226 Sjogren et al.
Biophysical Journal 89(6) 4219–4233

the lysine and phenylalanine side chains in (KF)n, even if
these should, at least transiently, interact since they reside
within the same molecule. However, these crosspeaks may
be obscured by the strong and adjacent intermolecular
(KF)n–b-C12G2 crosspeaks in the 2D spectra. Similarly, no
unambiguous intermolecular contacts are found between
lysine side chains and surfactant. In this case, the crosspeaks
may be difficult to observe, due to potential crosspeak over-
lap and/or proximity to the strong diagonal of autocrosspeaks
in the aliphatic proton region of the 2D NOESY spectra.
Taking all NMR data together, the results support the
notion that important interactions take place between
aromatic rings of the peptides and the surfactant alkyl chain,
with possible interaction also with the inner sugar ring of the
micellar headgroup.
DISCUSSION
Peptide-surfactant binding
CD spectroscopic and isotherm data show that both the
a-helix stabilization and the surfactant binding are cooper-
ative processes. Furthermore, by comparing the surfactant
binding isotherm (Fig. 8) with the a-helix content of (KF)n
as a function of surfactant concentration (Fig. 13), it is
obvious that the surfactant binding as such leads to the
TABLE 4 1H and 13C chemical shift for 40 mM b-C12G2 in acetate buffer with and without addition of 80 mM (KF)n
b-C12G2 b-C12G2 1 (KF)n Chemical shift difference
Position 1H (ppm) 13C (ppm) 1H (ppm) 13C (ppm) 1H (ppm) 13C (ppm)
1 5.34 101.10 5.32 101.10 0.02 0.00
2 3.60 72.60 3.58 72.80 0.02 �0.20
3 3.70 73.70 3.66 73.70 0.04 0.00
4 3.45 70.00 3.42 70.10 0.03 �0.10
5 3.70 73.70 3.66 73.70 0.04 0.00
6* 3.82 61.30 3.79 61.30 0.03 0.00
19 4.37 103.40 4.30 103.40 0.07 0.00
29 3.36 73.70 3.32 73.70 0.04 0.00
39 3.75 77.10 3.70 77.10 0.05 0.00
49 3.68 78.50 3.64 78.40 0.04 0.10
59 3.48 75.50 3.39 75.4 0.09 0.10
69* 3.82 61.30 3.79 61.30 0.03 0.00
1t 3.89/3.57 71.20 3.81/3.48 71.10 0.08/0.09 0.10
2t 1.66 30.30 1.57 30.40 0.09 �0.10
3t 1.34 26.90 1.23 26.90 0.11 0.00
4t–9ty ;1.29 ;30.60 ;1.17 ;30.80 ;0.12 ;�0.20
10t 1.27 32.90 1.16 32.90 0.11 0.00
11t 1.28 23.50 1.19 23.60 0.09 �0.10
12t 0.87 14.70 0.79 14.70 0.08 0.00
1H chemical shifts are referenced to the residual HDO signal set to 4.75 ppm. Indirect chemical shift referencing is employed for 13C using the frequency ratio
J ¼ nC/nH ¼ 0.25145002, where nC and nH correspond to the 13C and 1H frequency, respectively, of the methyl resonances (0 ppm) in tetramethylsilane in
H2O. The error limits are 60.01 ppm for the 1H signals and 60.3 ppm for the 13C signals. The proton positions are numbered as in Fig. 12.
*Total overlap in 13C HSQC.yTotal overlap in 13C HSQC.
TABLE 5 1H and 13C chemical shift for 80 mM (KF)n in acetate buffer with and without addition of 40 mM b-C12G2
(KF)n (KF)n 1 b-C12G2 Chemical shift difference
Position 1H (ppm) 13C (ppm) 1H (ppm) 13C (ppm) 1H (ppm) 13C (ppm)
Lys Lys Lys
a 4.24 54.30 4.26 54.1 �0.02 0.20
b 1.70 31.40 1.71 31.30 �0.01 0.10
g 1.40/1.32 22.90 1.40/1.32 23.00 0.00 �0.10
d 1.66 27.20 1.66 27.10 0.00 0.10
e 2.96* 40.00 2.97* 40.00 �0.01 0.00
Phe Phe Phe
a 4.55 55.40 4.55 55.50 0.00 �0.10
b 2.96* 38.00 2.97* 38.00 �0.01 0.00
1H chemical shifts are referenced to the residual HDO signal set to 4.75 ppm. Indirect chemical shift referencing is employed for 13C using the frequency ratio
J ¼ nC/nH ¼ 0.25145002, where nC and nH correspond to the 13C and 1H frequency of the methyl resonances (0 ppm), respectively, in tetramethylsilane in
H2O. The error limits are 60.01 ppm for the 1H signals and 60.3 ppm for the 13C signals.
*Total overlap in 13C HSQC.
Peptides and Nonionic Surfactants 4227
Biophysical Journal 89(6) 4219–4233

coil-helix transition in the peptide. These observations
strongly suggest that the main surfactant-peptide interaction
is due to formation of surfactant micellar-like self-assembled
structures on the peptide, whereas the number of randomly
bound surfactant monomers may be assumed to be
negligible. The observation that the onset of cooperative
surfactant binding occurs at a concentration slightly lower
than the CMC of the pure surfactant is in agreement with
results on manifold other surfactant-polymer systems in
which either the surfactant or polymer is uncharged. The
surfactant concentration required to achieve surfactant
aggregation in the presence of a polymer is often referred
to as the critical aggregation concentration. Just as is
observed in our systems, critical aggregation concentration
of nonionic surfactants interacting with charged polymers is
often marginally lower than CMC, meaning that the binding
of the surfactant to the polymer has relatively little effect on
the surfactant monomer concentration (47,48).
A number of different models may be applied in the
analysis of surfactant binding to a protein, peptide, or polymer.
The two most common ones are the closed association model,
described by the Hill equation (49), and the Satake-Yang
model (50), which is based on the Zimm-Bragg theory (51).
The Satake-Yang model, first introduced to explain the coil-
helix transition in polypeptide chains induced by binding of
oppositely charged surfactants, can be expressed as
b ¼ g
211
ðuK0½Sfree�Þ½ð1 � uK0½Sfree�Þ2
1 4K0½Sfree��1=2
!: (4)
Here, b is the number of bound surfactant molecules per
amino acid residue, [Sfree] is the unbound (free) surfactant
concentration, and g is the number of binding sites per amino
acid residue. K0 is the binding constant for the binding of
a surfactant molecule to a binding site where both neighboring
binding sites are unoccupied; for binding to sites where these
conditions are not met the binding constant is uK0. The
variable u is referred to as a cooperativity parameter.
The Hill equation (49), on the other hand, is expressed as
b ¼ gðK½Sfree�Þn
11 ðK½Sfree�Þn: (5)
As in Eq. 4, g is the number of binding sites per amino acid
residue, whereas K is the association constant (comparable
with uK0 in the Satake-Yang model) and n is the Hill
coefficient. The Hill coefficient reflects the aggregation
number of the bound surfactant micelles. For a noncooperative
binding (where n ¼ 1), Eq. 5 reduces to a Langmuir-type
equation often called the Scatchard equation (52–55).
FIGURE 11 Expansions of the 2D 1H-13C HSQC spectrum (top) and the
2D 1H NOESY spectrum, using a mixing time of 15 ms (bottom), of
a mixture of 80 mM (KF)n and 40 mM b-C12G2 solution in 20 mM
deuterated acetate buffer, pD 5. For peptides, all concentrations are given as
the amino acid residue concentrations. The atom-specific assignment is
indicated with the numbering presented in Fig. 12. The NOESY spectrum
shows NOE crosspeaks between the aromatic ring protons of the
phenylalanine residues and the protons in the aliphatic hydrocarbon chain
of b-C12G2. Atom-specific assignments of the 1H peaks are presented in the
corresponding regions of the 1D 1H spectrum displayed along the edges of
the 2D spectrum.
FIGURE 12 1H chemical shift difference for 40 mM b-C12G2 in acetate
buffer observed upon addition of 80 mM (KF)n. (solid bars) and 9.3 mM
naphthylacetate (open bars). For peptides, all concentrations are given as the
amino acid residue concentrations. Small chemical shift differences (#;0.04
ppm) could simply be explained by subtle sample variations (e.g., pH and
ionic strength) rather than significant peptide-surfactant interactions.
4228 Sjogren et al.
Biophysical Journal 89(6) 4219–4233
As can be seen in Fig. 8, both the Satake-Yang and the Hill
equations fit the experimental data well. However, the
quality of the fit as such can obviously not be used as a tool to
assess the physical relevance of the models. There is one
fundamental and, in this context, quite discriminative dif-
ference between the two models. The Satake-Yang model
describes the binding of surfactant molecules to the peptide
without accounting for packing effects favoring a particular
shape or aggregation number of the self-associated micellar-
like surfactant aggregates. The Hill model, on the other hand,
describes a micelle formation process modified by peptide
binding, neglecting possible random, noncooperative (mo-
nomeric) surfactant-peptide binding. Considering what our
data tell us about the surfactant-peptide interaction, the Hill
model is preferred. In addition, previous investigations show
that since the Satake-Yang model does not include micellar
size, the fitting results are in qualitative disagreement with
experimental results for polyelectrolyte-surfactant interac-
tions (56). Hereafter, the analysis of the binding isotherm
will therefore be based on the Hill equation. Fitting the data
in Fig. 8 to the Hill equation (Eq. 5) by least-squares fit yields
g ¼ 1.4 6 0.2, K ¼ 51.8 6 3.1 M�1, and n ¼ 5.9 6 1.4,
where error limits are given as the standard error of the mean.
As previously mentioned, a Hill coefficient greater than unity
is an indication of a cooperative binding.
It is interesting to compare our results on the binding of
b-C8G1 to (KF)n with previous results on the binding of the
same surfactant to globular proteins. Such a comparison
reveals a number of important differences between peptides
and proteins in terms of surfactant interaction. First, we find
that the total number of binding sites per protein/peptide
residue (g) is almost 200 times larger in the b-C8G1-(KF)n
system (g ¼ 1.4 6 0.2) than in systems containing b-C8G1
and globular proteins (g ¼ 0.0081 6 0.0010) (57). The huge
difference may, at least in part, be explained by the fact that
(KF)n behaves as a rather flexible chain in which the amino
acid residues are exposed to the surrounding media, whereas
globular proteins are folded into a compact tertiary confor-
mation, in which a large fraction of the hydrophobic amino
acid residues are hidden in the interior of the globule and
therefore less accessible for surfactant micellar binding. The
isotherm binding data therefore highlight a pertinent differ-
ence in behavior between peptides and proteins in solution.
The association constant K obtained from the Hill equa-
tion (Eq. 5) amounts to a change in Gibbs free energy on
binding of �9.7 kJ mol�1 per mole of free surfactant, which
corresponds to �4 kT for the binding of b-C8G1 to (KF)n.
This change in Gibbs free energy is in good agreement with
previously obtained results on binding of b-C8G1 to different
globular proteins (DG0 ¼ �10.8 6 0.6 kJ mol�1) (57).
Influence of surfactant characteristics onpeptide conformation
The peptides (KF)n and (KY)n show an increased amount of
a-helix upon surfactant addition, whereas Kn and (K4Y)n do
not. This study therefore shows that nonionic surfactants
stabilize the a-helical conformation of peptides, provided
that the peptide contains a sufficient amount of hydrophobic
amino acid residues. The results on Kn agree with previous
studies, in which no surfactant-induced a-helix stabilization
was observed (58). Additionally, it has previously been
shown that nonionic surfactants interact with polymers, only
if the polymer is sufficiently hydrophobic (59,60).
For all surfactants studied in this work, the onset of the
a-helix stabilization effect, i.e., increased Xa, occurs just below
the surfactant CMC. By combining our CD and binding
isotherm data, we see that the onset of stabilization coincides
with the onset of appreciable surfactant binding to the peptide.
A further increase of the surfactant concentration above CMC
does not increase the amount of peptide in a-helix con-
formation. Rather, the amount of a-helix as a function
FIGURE 13 (A) Number of bound b-C8G1 molecules per (KF)n mono-
mers (b, 3) as determined by equilibrium dialysis and the fraction of (KF)n
in a-helix conformation (Xa, ¤; determined by CD spectroscopy) as a
function of free b-C8G1 concentration [Sfree]. (B) The number of bound
b-C8G1 molecules per (KF)n amino acid monomers (b) as a function of the
fraction of (KF)n in a-helix conformation (Xa) plotted for the same free
b-C8G1 concentration.
Peptides and Nonionic Surfactants 4229
Biophysical Journal 89(6) 4219–4233

of surfactant content levels off at a constant value. However, the
limiting value of a-helix stabilization, DXa, observed at high
surfactant concentration varies with surfactant characteristics.
The CMC (Table 3) of any given surfactant does not
correlate with DXa. Rather, the size of the surfactant head-
group, as well as surfactant characteristics related to the
preferred micellar morphology, are the factors that govern
DXa. We will discuss these factors one by one, starting with
the most clear-cut, namely the headgroup size.
The increased amount of a-helix in (KF)n is directly
dependent on headgroup size in the sense that increasing
headgroup size within a homologous series of surfactants
leads to decreasing DXa. This is evident when comparing the
homologs C12E5, C12E6, and C12E8, as well as alkylmalto-
triosides, -maltosides, and -glucosides. In the case of large
headgroups, DXa shows little or no dependence on the
surfactant hydrocarbon chain length. It is also independent of
the CPP, and therefore of the preferred micelle size and
morphology of the surfactant.
For surfactants with large headgroup, the conformation
provides an additional factor that needs to be taken into
account. This is exemplified by b-C12G2 and a-C12G2 (Table
2). The headgroup in a-C12G2 is known to be more compact
due to the smaller angle between the hydrocarbon chain and
the headgroup in comparison to b-C12G2 (61).
For surfactants with small headgroup, exemplified by the
alkylglucosides and PEO-based surfactants, the situation is
different. Here, CPP influences the capacity to stabilize
a-helix. As can be seen for the alkylglucosides (Fig. 7), the
a-helix stabilization is independent of the hydrocarbon chain
length for a given headgroup, as long as the hydrocarbon
chain length is short enough for the surfactant to preferen-
tially form small, nearly spherical micelles (b-C7G1 and
b-C8G1) (39). For surfactants with longer hydrocarbon
chains, i.e., surfactants with a large CPP and an inherent
tendency to form elongated micelles (b-C9G1) (33,39,62),
a lower degree of peptide a-helix stabilization is obtained.
In conclusion, the largest peptide stabilization effect
(highest DXa) is obtained when surfactants with low CPP
and small headgroups are used (b-C7G1 or b-C8G1). This
effect can be rationalized once we have discussed the
properties of the peptide-surfactant complex.
Characteristics of the peptide-surfactant complex
In 1D 1H NMR spectra, the peptide-surfactant interaction is
evident as changes in the chemical shift of the surfactant
proton signals upon addition of peptide (Fig. 10). This effect
resembles previously reported surfactant proton shifts ob-
served for alkylglucoside-cyclodextrin inclusion complexes
(63). The peptide-surfactant interaction is also evident as an
alteration and broadening of the proton signals of the (KF)n
phenyl rings (Fig. 9), which bears a close resemblance to the
results previously obtained for cresol red when bound to
b-C12G2 (64). However, the combination of 1D and 2D NMR
results in this work provides much more detailed information
as to the properties of the peptide-surfactant complex.
From the data in Fig. 12, it is clear that the 1H chemical-
shift changes, and thereby the peptide-surfactant interaction,
are largest for the surfactant hydrocarbon chain region and
the inner sugar ring, whereas the outer sugar ring only
displays smaller signal shifts. Similarly, NOE crosspeaks are
observed between the surfactant hydrocarbon chain and the
peptide phenyl ring (Fig. 11, bottom). It is highly relevant to
compare these results to NMR data on solubilization of small
aromatic molecules in alkylglycoside micelles. Data on
solubilization of naphthylacetate (Fig. 12) shows that this
relatively small and weakly amphiphilic molecule is localized
as a cosurfactant in the surfactant micelle. The most hy-
drophilic part of naphthylacetate is located in the micelle
palisade layer, whereas the hydrophobic part is totally
enclosed in the hydrocarbon chain micellar core (61).
The most notable difference between the surfactant
interaction with naphthylacetate and peptides is the ability
for naphthylacetate to be fully enclosed in one micelle. Due to
the large size of the peptides in the study (Table 1) the whole
peptide chain can never be enclosed in one micelle-like
surfactant aggregate. The consequence is that part of the
peptide chain needs to be located in the outer headgroup sugar
ring (Fig. 12), whereas for naphthylacetate the interaction with
the outer headgroup sugar ring is negligible (Fig. 12).
According to the NMR data, the complex between (FK)n
and b-C12G2 is thus best described by a necklace model, in
which surfactant micelles bind to the peptide chains, pri-
marily through interaction with the aromatic groups. The
suggested peptide-surfactant complex is schematically repre-
sented in Fig. 14 and is similar to the structure previously
proposed for the complex between charged poly(acrylic
acid) and PEO-based surfactants (48). It is important to
clearly distinguish the structure of this type of complex from
that of complexes in which the micelle core encloses the
peptide chains. In this case, the peptide is located in the
interface between the headgroup and the micellar hydro-
carbon chain core, with an appreciable number of the
hydrophobic, aromatic side chains sticking into the micelle
core region. Location of charged lysine residues in the core
region would be highly energetically unfavorable and the
lysine residues would therefore be expected to point away
from the micelle, in agreement with experimental data.
In principle, it would be possible to envisage an alternative
explanation, in which hydrophobic blocks in the random
(KF)n and (KY)n peptides are assumed to be long enough to
be fully enclosed by surfactant micelles. The increased
a-helix content would then be attributable to a-helix formation
within these blocks. However, the probability that the hydro-
phobic blocks in a random polymer are large enough for this
model to make sense is minute. According to the first-order
Marcov model of copolymerization (65), the number-average
segment length of a 1:1 copolypeptide is 2, assuming equal
amino acid monomer reactivity for lysine, phenylalanine, and
4230 Sjogren et al.
Biophysical Journal 89(6) 4219–4233
tyrosine. Assuming spherical micelles with a C12 chain, at
least 24 subsequent amino acid residues would need to be
hydrophobic to form an all-hydrophobic a-helix long enough
to span the entire micelle core region. Statistically, only ,0.2
ppm of a random 1:1 copolymer contains unbroken blocks of
24 amino acids or longer (65,66), which clearly makes this
model highly implausible.
Origin of the a-helix stabilization
The proposed structure of the peptide-surfactant complex
makes it possible to rationalize the influence of surfactant
characteristics on a-helix stabilization. The lower efficiency
of surfactants with large headgroups can be understood as
a steric effect, where a bulky headgroup sterically hinders the
hydrophobic residues on the peptide from interacting with the
micelle core. As for the influence of the surfactant CPP, we
note that the unfavorable contact between water and the
surfactant hydrophobic hydrocarbon chain region is largest for
small spherical micelles (small CPP), due to a larger curvature
of the hydrophobic hydrocarbon chain core. Consequently,
small micelles have more to gain in terms of screening of their
hydrocarbon-water contact through interaction with hydro-
phobic peptide residues. This serves as an explanation for the
correlation between the preferred micelle morphology of a
given surfactant and its ability to stabilize a-helix.
The cause of the increased amount of peptide in a-helix
conformation upon interaction with surfactant micelles can,
at least partly, be understood from the fact that formation of
an a-helical turn in a random coil domain is entropically
costly. However, when a random coil peptide chain is bound
to a surfactant micelle, the peptide chain entropy is markedly
lower as compared to a free peptide chain. Consequently, the
further entropy loss suffered upon a-helix formation can
be assumed to be considerably lower than is the case for
a free peptide chain in solution.
CONCLUSIONS
Nonionic surfactants have been shown to interact with suf-
ficiently hydrophobic peptides, thereby inducing an increased
amount of a-helix conformation. The onset of a-helix stabi-
lization occurs at surfactant concentrations slightly lower
than the CMC of the surfactant, and the a-helix content
levels off toward a constant value at surfactant concen-
trations above CMC. The surfactant-peptide binding process
is cooperative. Surfactant micelles on the peptide chain,
rather than randomly adsorbed surfactant monomers, are
therefore the likely cause of the a-helix stabilization.
The propensity of a given surfactant to stabilize the
a-helix conformation depends on a number of its character-
istics, namely
The headgroup size, where a larger headgroup is less
favorable than a smaller one.
The headgroup conformation (observed for surfactants
with a large headgroup).
The surfactant CPP, where a larger CPP is less favorable
than a smaller one (observed for surfactants with a
small headgroup).
In other words, the largest increase in peptide a-helix
conformation is obtained for surfactants with a small head-
group and low CPP value.
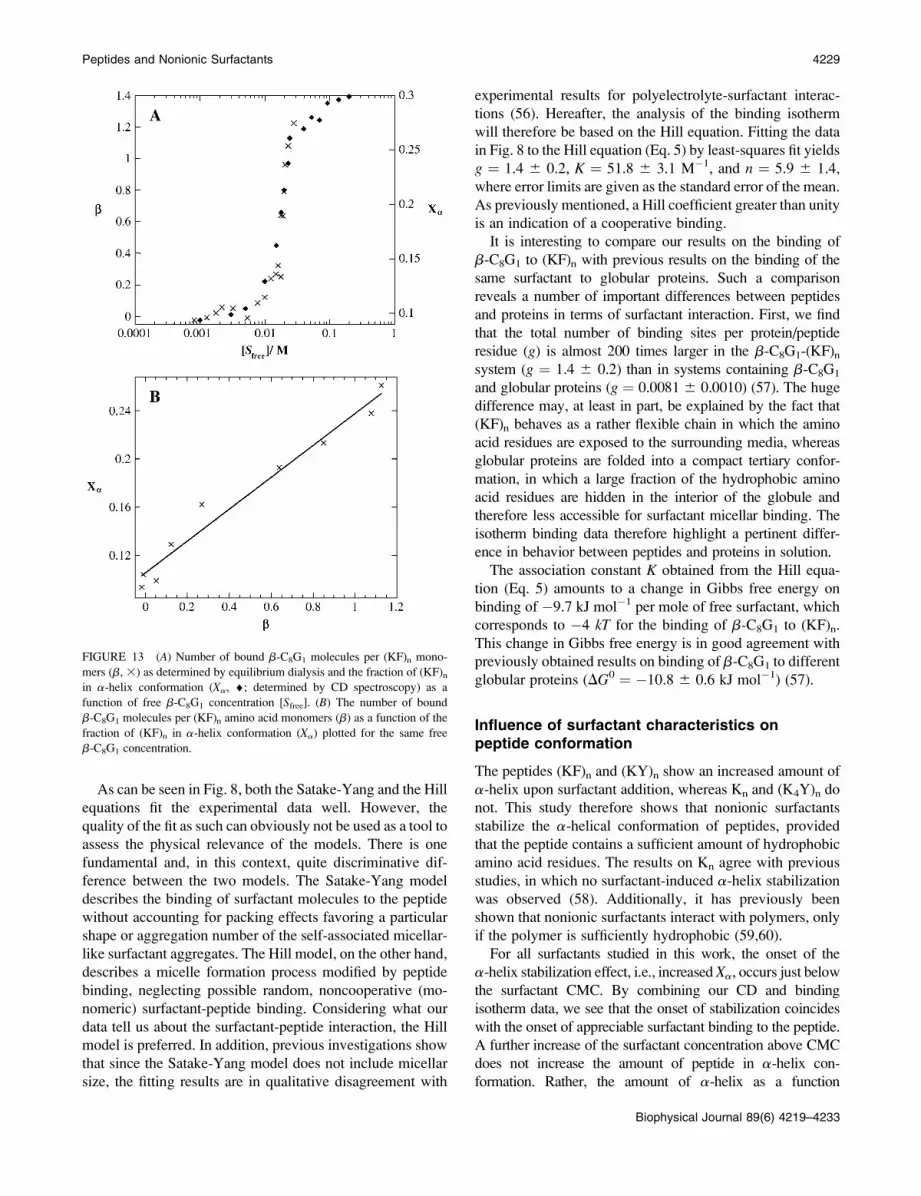
The peptide-micelle complex can best be described by
a necklace model, as illustrated in Fig. 14. The surfactant-
peptide interaction occurs mainly between the surfactant
hydrophobic micellar core and the inner surfactant sugar ring
FIGURE 14 Schematic view of the surfactant-peptide binding. The upper
left panel illustrates the surfactant micelle-peptide binding above CMC,
yielding an increased fraction of peptide in a-helix conformation. The
enlargements of the b-C12G2 micelle and the (KF)n-b-C12G2 complex
(lower left and right) are drawn to scale. Previously reported (72,73)
dimensions of the oblate ellipsoid b-C12G2 micelle have been used. Thus,
the radii of the hydrocarbon region (rsmall ¼ 14.1 A and rlarge ¼ 28.2 A) and
the thickness of the headgroup region (6.2 A) as well as the micelle
aggregation number (132, assuming an unchanged aggregation number
upon peptide binding) are taken from literature data on the ‘‘free’’ micelle.
In the lower left panel, the peptide-micelle complex is sketched based on the
NMR results and by using the number of amino acid (3.6) and the pitch (5.4
A) per a-helix turn (74), and an approximate amino acid side-chain length
(for a fully stretched chain) of 6 A, assuming that the side-chain length of
phenylalanine is the same as for lysine side chain as presented in the
literature (75). For clarity, only part of the micelle and the peptide chain is
drawn for the peptide-micelle complex in the lower left panel.
Peptides and Nonionic Surfactants 4231
Biophysical Journal 89(6) 4219–4233

and the phenyl rings of the (KF)n peptide. This type of
complex is fully compatible with the observed correlation
between surfactant characteristics and a-helix stabilization.
Goran Carlstrom is gratefully acknowledged for his assistance with the
NMR experiments. We thank Tommy Nylander and Lennart Piculell for
valuable and constructive discussions.
Financial support from AstraZeneca R&D Lund, the Centre of Competence
for Surfactants Based on Natural Products (SNAP), and The Swedish
Foundation for Strategic Research (Program of Colloid and Interface
Technology, SSF) is gratefully acknowledged.
REFERENCES
1. Kuroda, Y., Y. Maeda, S. Sawa, K. Shibata, K. Miyamoto, and T.Nakagawa. 2003. Effects of detergent on the secondary structures ofprion protein peptides as studied by CD spectroscopy. J. Pept. Sci.9:212–220.
2. Wieprecht, T., M. Beyermann, and J. Seelig. 1999. Binding ofantibacterial magainin peptides to electrical neutral membranes: thermo-dynamics and structure. Biochemistry. 38:10377–10387.
3. Wieprecht, T., M. Beyermann, and J. Seelig. 2002. Thermodynamics ofthe coil-a-helix transition of amphipathic peptides in a membrandeenvironment: the role of vesicle curvature. Biophys. Chem. 96:191–201.
4. Wieprecht, T., S. Rothemund, M. Bienert, and E. Krause. 2001. Role ofhelix formation for the retention of peptides in reversed-phase high-performance liquid chromatography. J. Chromatogr. A. 912:1–12.
5. Wieprecht, T., O. Apostolov, M. Beyermann, and J. Seelig. 2000.Interaction of a mitochondrial presequence with lipid membranes: roleof helix formation for membrane binding and perturbation. Bio-chemistry. 39:15297–15305.
6. Wieprecht, T., O. Apostolov, M. Beyermann, and J. Seelig. 2000.Membrane binding and pore formation of the antibacterial peptide PGLa:thermodynamic and mechanistic aspects. Biochemistry. 39:442–452.
7. Dathe, M., and T. Wieprecht. 1999. Structural features of helicalantimicrobial peptides: their potential to modulate activity on modelmembranes and biological cells. Biochim. Biophys. Acta. 1462:71–87.
8. Silvestro, L., and P. H. Axelsen. 2000. Membrane-induced folding ofcecropin A. Biophys. J. 79:1465–1477.
9. Zhao, H., J.-P. Mattila, J. M. Holopainen, and P. K. J. Kinnunen. 2001.Comparison of the membrane association of two antimicrobial pep-tides, magainin 2 and indolicidin. Biophys. J. 81:2979–2991.
10. Zhao, H. X., A. C. Rinaldi, A. Rufo, A. Bozzi, P. K. J. Kinnunen, andA. Di Giulio. 2003. Structural and charge requirements for antimicro-bial peptide insertion into biological and model membranes. In Cellularand Molecular Mechanisms of Toxin Action. G. Menestrina, M. DallaSerra, and P. Lazarovici, editors. Taylor & Francis, London. 151–177.
11. Wieprecht, T., and J. Seelig. 2002. Isothermal titration calorimetry forstudying interactions between peptides and lipid membranes. Curr.Top. Membr. 52:31–56.
12. Bechinger, B. 2004. Structure and function of membrane-lyticpeptides. CRC Crit. Rev. Plant Sci. 23:271–292.
13. Akashi, S., and K. Takio. 2001. Structure of melittin bound tophospholipid micelles studied using hydrogen-deuterium exchange andelectrospray ionization Fourier transform ion cyclotron resonance massspectrometry. J. Am. Soc. Mass Spectrom. 12:1247–1253.
14. Schuetze, W., and C. C. Mueller-Goymann. 1992. Mutual interactionsbetween nonionic surfactant and gelatin—investigations in cubic liquidcrystalline systems and micellar systems. Colloid Polym. Sci. 269:85–90.
15. Rades, T., W. Schutze, R. Hirsch, and C. C. Muller-Goymann. 1994.Influence of amphiphilic substances on the coil-helix transformation ofgelatin. Pharmazie. 49:294–295.
16. Sjogren, H., and S. Ulvenlund. 2005. Comparison of the helix-coiltransition of a titrating polypeptide in aqueous solutions and at the air-water interface. Biophys. Chem. 116:11–21.
17. Banga, A. K. 1995. Therapeutic Peptides and Proteins. TechnomicPublishing, Lancaster, PA.
18. Chi, E. Y., S. Krishnan, T. W. Randolph, and J. F. Carpenter. 2003.Physical stability of proteins in aqueous dolution: mechanism anddriving forces in nonnative protein aggregation. Pharm. Res. 20:1325–1336.
19. Ekelund, K., K. Osth, C. Pahlstorp, E. Bjork, S. Ulvenlund, and F.Johansson. 2005. Correlation between epithelial toxicity and surfactantstructure as derived from the effects of polyethyleneoxide surfactantson caco-2 cell monolayers and pig nasal mucosa. J. Pharm. Sci. 94:730–744.
20. le Maire, M., P. Champeil, and J. V. Møller. 2000. Interaction ofmembrane proteins and lipids with solubilizing detergents. Biochim.Biophys. Acta. 1508:86–111.
21. Greenfield, N., B. Davidson, and G. D. Fasman. 1967. The use ofcomputed optical rotatory dispersion curves for the evaluation ofprotein conformation. Biochemistry. 6:1630–1637.
22. Greenfield, N., and G. D. Fasman. 1969. Computed circular dichroismspectra for the evaluation of protein conformation. Biochemistry.8:4108–4116.
23. Winnek, P. S., and C. L. A. Schmidt. 1935. ThesSolubilities, apparentdissociation constants, and thermodynamic data of the dihalogenatedtyrosine compounds. J. Gen. Physiol. 18:889–903.
24. Schmidt, C. L. A., P. L. Kirk, and W. K. Appleman. 1930. Theapparent dissociation constants of arginine and of lysine and theapparent heats of ionization of certain amino acids. J. Biol. Chem.88:285–293.
25. Wishart, D. S., C. G. Bigam, J. Yao, F. Abildgaard, H. J. Dyson, E.Oldfield, J. L. Markley, and B. D. Sykes. 1995. 1H, 13C and 15Nchemical shift referencing in biomolecular NMR. J. Biomol. NMR.6:135–140.
26. Bax, A., M. Ikura, D. A. Torchia, and R. Tschudin. 1990. Comparisonof different modes of two-dimensional correlation NMR for the studyof proteins. J. Magn. Reson. 86:304–318.
27. Norwood, T. J., J. Boyd, J. E. Heritage, N. Soffe, and I. D. Campbell.1990. Comparison of techniques for 1H-detected heteronuclear 1H-15Nspectroscopy. J. Magn. Reson. 87:488–501.
28. Jeener, J., B. H. Meier, P. Bachmann, and R. R. Ernst. 1979. Inves-tigation of exchange processes by two-dimensional NMR spectros-copy. J. Chem. Phys. 71:4546–4563.
29. Macura, S., and R. R. Ernst. 1980. Elucidation of cross relaxation inliquids by two-dimensional NMR spectroscopy. Mol. Phys. 41:95–117.
30. Bax, A., and D. G. Davis. 1985. MLEV-17 based two-dimensionalhomonuclear magnetization transfer spectroscopy. J. Magn. Reson. 65:355–360.
31. Braunschweiler, L., and R. R. Ernst. 1983. Coherence transfer byisotropic mixing: Application to proton correlation spectroscopy.J. Magn. Reson. 53:521–528.
32. Cavanagh, J., and M. Rance. 1992. Suppression of cross-relaxationeffects in TOCSY spectra via a modified dipsi-2 mixing sequence.J. Magn. Reson. 96:670–678.
33. Ericsson, C. A., O. Soderman, V. M. Garamus, M. Bergstrom, andS. Ulvenlund. 2004. Effects of temperature, salt, and deuterium oxideon the self-aggregation of alkylglycosides in dilute solutions. 1. n-Nonyl-b-D-glucoside. Langmuir. 20:1401–1408.
34. Koppel, D. E. 1972. Analysis of macromolecular polydispersity inintensity correlation spectroscopy: the method of cumulants. J. Chem.Phys. 57:4814–4820.
35. Kakiuchi, K., and H. Akutsu. 1981. Hydrodynamic behavior andmolecular conformation of poly(L-lysine HBr) in carbonate buffersolution. Biopolymers. 20:345–357.
36. Dzwolak, W., T. Muraki, M. Kato, and Y. Taniguchi. 2004. Chain-length dependence of a-helix to b-sheet transition in polylysine: model
4232 Sjogren et al.
Biophysical Journal 89(6) 4219–4233

of protein aggregation studied by temperature-tuned FTIR spectros-copy. Biopolymers. 73:463–469.
37. Li, L.-K., and A. Spector. 1969. The circular dichroism of b-poly-L-lysine. J. Am. Chem. Soc. 91:220–222.
38. Bach, D., and I. R. Miller. 1976. Influence of basic polypeptides on thephase transition of phospholipid lipsomes. Biochim. Biophys. Acta.433:13–19.
39. Zhang, R., P. A. Marone, P. Thiyagarajan, and D. M. Tiede. 1999.Structure and molecular gluctuations of n-alkyl-b-D-glucopyranosidemicelles determined by x-ray and neutron scattering. Langmuir.15:7510–7519.
40. Mitchell, D. J., G. J. T. Tiddy, L. Waring, T. Bostock, and M. P.McDonald. 1983. Phase behaviour of polyoxyethylene surfactants withwater. Mesophase structures and partial miscibility (cloud points). J.Chem. Soc., Faraday Trans. 1. 79:975–1000.
41. Nilsson, P.-G., H. Wennerstrom, and B. Lindman. 1983. Structure ofmicellar solutions of nonionic surfactants. Nuclear magnetic resonanceself-diffusion and proton relaxation studies of poly(ethylene oxide)alkyl ethers. J. Phys. Chem. 87:1377–1385.
42. Pastor, O., E. Junquera, and E. Aicart. 1998. Hydration andmicellization processes of n-octyl b-D-glucopyranoside in aqueoussolution. A thermodynamic and fluorimetric study in the absence andpresence of salts. Langmuir. 14:2950–2957.
43. Cabane, B. 1981. Structure of the water/surfactant interface in micelles:an NMR study of SDS micelles labelled with paramagnetic ions.J. Phys. [E]. 42:847–859.
44. Dill, K. A., and P. J. Flory. 1981. Molecular organization in micellesand vesicles. Proc. Natl. Acad. Sci. USA. 78:676–680.
45. Dill, K. A. 1982. Configurations of the amphiphilic molecules inmicelles. J. Phys. Chem. 86:1498–1500.
46. Wishart, D. S., and B. D. Sykes. 1994. Chemical shifts as a tool forstructure determination. Methods Enzymol. 239:363–392.
47. Saito, S., and D. F. Anghel. 1998. Interactions of polymers andnonionic surfactants. In Polymer-Surfactant Systems. J. C. T.Kwak,editor. Marcel Dekker, New York. 357–408.
48. Anghel, D. F., S. Saito, A. Baran, and A. Iovescu. 1998. Interactionbetween poly(acrylic acid) and nonionic surfactants with the samepoly(ethylene oxide) but different hydrophobic moieties. Langmuir.14:5342–5346.
49. Hill, A. V. 1910. A new mathematical treatment of changes of ionicconcentration in muscle and nerve under the action of electriccurrents, with a theory as to their mode of excitation. J. Physiol. 40:190–224.
50. Satake, I., and J. T. Yang. 1976. Interaction of sodium decyl sulfatewith poly(L-ornithine) and poly(L-lysine) in aqueous solution. Bio-polymers. 15:2263–2275.
51. Zimm, B. H., and J. K. Bragg. 1959. Theory of the phase transitionbetween helix and random coil in polypeptide chains. J. Chem. Phys.31:526–535.
52. Wasylewski, Z., and A. Kozik. 1979. Protein–non-ionic detergentinteraction. Interaction of bovine serum albumin with alkyl glucosidesstudied by equilibrium dialysis and infrared spectroscopy. Eur. J.Biochem. 95:121–126.
53. Nishiyama, H., and H. Maeda. 1992. Reduced lysozyme in solution andits interaction with non-ionic surfactants. Biophys. Chem. 44:199–208.
54. Wasylewski, Z. 1979. Protein-cationic detergent interaction. Equilib-rium dialysis study of the interaction of bovine serum albumin andother proteins with alkylpyridinium bromide. Acta Biochim. Pol.26:195–203.
55. Poland, D. 1978. Cooperative Equilibria in Physical Biochemistry.Clarendon Press, Oxford, UK.
56. Linse, P., L. Piculell, and P. Hansson. 1998. Models of Polymer-Surfactant Complexation. In Polymer-Surfactant Systems. J. C.T.Kwak, editor. Marcel Dekker, New York. 193–238.
57. Cordoba, J., M. D. Reboiras, and M. N. Jones. 1988. Interaction ofn-octyl-b-D-glucopyranoside with globular proteins in aqueous solution.Int. J. Biol. Macromol. 10:270–276.
58. Shirahama, K., and J. T. Yang. 1979. Induced helical conformation ofionic polypeptides by phospholipids solubilized in a nonionicsurfactant solution. Int. J. Pept. Protein Res. 13:341–345.
59. Brackman, J. C., and J. B. F. N. Engberts. 1993. Polymer-micelleinteractions: physical organic aspects. Chem. Soc. Rev. 22:85–92.
60. Brackman, J. C., N. M. van Os, and J. B. F. N. Engberts. 1988.Polymer-nonionic micelle complexation. Formation of poly(propyleneoxide)-complex n-octyl thioglucoside micelles. Langmuir. 4:1266–1269.
61. Ericsson, C. A. 2005. Alkylglycoside surfactants—self-assembly,solid-state properties and interactions with hydrophobic molecules.PhD thesis. Lund University, Lund, Sweden.
62. Ericsson, C. A., O. Soderman, and S. Ulvenlund. 2005. Aggregatemorphology and flow behaviour of micellar alkylglycoside solutions.Colloid Polym. Sci 283:1313–1320.
63. Reinsborough, V. C., and V. C. Stephenson. 2004. Inclusioncomplexation involving sugar-containing species: b-cyclodextrin andsugar surfactants. Can. J. Chem. 82:45–49.
64. Focher, B., G. Savelli, G. Torri, G. Vecchio, D. C. McKenzie, D. F.Nicoli, and C. A. Bunton. 1989. Micelles of 1-alkyl glucoside andmaltoside: anomeric effects on structure and induced chirality. Chem.Phys. Lett. 158:491–494.
65. Odian, G. 1981. Chain copolymerization. In Principles of Polymeri-zation. John Wiley & Sons, New York. 423–507.
66. Vollmert, B. 1973. Polymer Chemistry. Springer-Verlag, New York.
67. de Grip, W. J., and P. H. M. Bovee-Geurts. 1979. Synthesis andproperties of alkylglucosides with mild detergent action: improvedsynthesis and purification of b-1-octyl-, -nonyl-, and -decyl-glucose.Synthesis of b-1-undecylglucose and b-1-dodecylmaltoside. Chem.Phys. Lipids. 23:321–325.
68. Kjellin, U. R. M., P. M. Claesson, and E. N. Vulfson. 2001. Studies ofN-dodecyllactobionamide, maltose 69-O-dodecanoate, and octyl-b-glucoside withsSurface tension, surface force, and wetting techniques.Langmuir. 17:1941–1949.
69. Alpes, H., K. Allmann, H. Plattner, J. Reichert, R. Riek, and S. Schulz.1986. Formation of large unilamellar vescicles using alkyl maltosidedetergents. Biochim. Biophys. Acta. 862:294–302.
70. Liljekvist, P., and B. Kronberg. 2000. Comparing decyl-b-maltosideand octaethyleneglycol mono n-decyl ether in mixed micelleswith dodecyl benzenesulfonate. J. Colloid Interface Sci. 222:159–164.
71. Mukerjee, P., and K. J. Mysels. 1971. Critical micelle concentrations ofaqueous surfactant systems. U.S. Dept. of Commerce, National Bureauof Standards, Washington, DC.
72. He, L.-Z., V. M. Garamus, S. S. Funari, M. Malfois, R. Willumeit, andB. Niemeyer. 2002. Comparison of small-angle scattering methods forthe structural analysis of octyl-b-maltopyranoside micelles. J. Phys.Chem. B. 106:7596–7604.
73. Dupuy, C., X. Auvray, C. Petipas, I. Rico-Lattes, and A. Lattes. 1997.Anomeric effects on the structure of micelles of alkyl maltosides inwater. Langmuir. 13:3965–3967.
74. Stryer, L. 1995. Protein structure and function. In Biochemistry. W.H.Freeman & Co., New York. 17–44.
75. Hesselink, F. T., T. Ooi, and H. A. Scheraga. 1973. Conformationalenergy calculations. Thermodynamic parameters of the helix-coiltransition for poly(L-lysine) in aqueous salt solution. Macromolecules.6:541–552.
Peptides and Nonionic Surfactants 4233
Biophysical Journal 89(6) 4219–4233