Embed Size (px)
Citation preview

Ga
FD
a
ARRAA
KF(FnHDMB
1
aiiti(pipsot
0d
Electrochimica Acta 63 (2012) 37– 46
Contents lists available at SciVerse ScienceDirect
Electrochimica Acta
jou rn al hom epa ge: www.elsev ier .com/ locate /e lec tac ta
lassy carbon electrodes modified with hemin-carbon nanomaterial films formperometric H2O2 and NO2
− detection
ederica Valentini ∗, Lara Cristofanelli, Marilena Carbone, Giuseppe Palleschiipartimento di Scienze e Tecnologie Chimiche, Università degli Studi di Roma Tor Vergata, via della Ricerca Scientifica 1, 00133 Roma, Italy
r t i c l e i n f o
rticle history:eceived 2 September 2011eceived in revised form 7 December 2011ccepted 8 December 2011vailable online 23 December 2011
eywords:unctionalised carbon nanofiberCNF-COOH)unctionalised single-wall carbonanotubes (SWCNT-OH)emin-nanocompositeirect electrocatalysisodified glassy carbon electrode (GC)
iosensor
a b s t r a c t
In this work a new chemical sensor for the H2O2 and nitrite amperometric detection was assembled, usinga glassy carbon (GC) bare electrode modified by two different nanocomposite materials. The nanocom-posite films were prepared by casting a functionalised carbon nanofiber (CNF-COOH) and single-walledcarbon nanotubes (SWCNT-OH, for comparison) on the glassy carbon electrode surface; then an iron(III)protoporphyrin IX (Fe(III)P) was adsorbed on these modified surfaces. A morphological investigationof the nanocomposite layers was also carried out, using the Scanning Electron Microscopy (SEM). Theelectrochemical characterization, performed optimising several electro-analytical parameters (such asdifferent medium, pH, temperature, scan rate, and potential window), demonstrated that the directelectrochemistry of the Fe(III)P/Fe(II)P redox couple involves 1e−/1H+ process. A kinetic evaluationof the electron-transfer reaction mechanism was also carried out, demonstrating that the heteroge-neous electron transfer rate constant resulted higher at CNF/hemin/GC biosensor than that evaluatedat SWCNT/hemin/GC modified electrode. Finally, the electrocatalytic activity toward the H2O2 reduc-tion was also demonstrated for both sensors but better results were observed working at CNF/hemin/GCmodified electrode, especially in terms of an extended linearity (ranging from 50 to 1000 �M), a lower
−6 −3 −1 −2
detection limit (L.O.D. = 3�) of 2.0 × 10 M, a higher sensitivity of 2.2 × 10 A M cm , a fast responsetime (9 s), a good reproducibility (RSD% < 1, n = 3) and operational stability. In addition, a nitrite electro-catalytic effect was also demonstrated only at CNF/hemin/GC modified electrode, showing an extendedlinearity (ranging from 5.0 × 10⁻³ to 2.5 × 10⁻¹ M), a lower detection limit (L.O.D. = 3�) of 3.18 × 10⁻⁴ M,a higher sensitivity of 1.2 × 10⁻² A M−1 cm−2, a fast response time of 10 s, a good reproducibility (RSD%<1, n = 3) and finally a good operational stability.© 2011 Elsevier Ltd. All rights reserved.
. Introduction
The study of direct electron exchange between redox–proteinsnd an electrode surface represents an interesting subject ofnvestigation in electrochemistry [1–3] as the process modelsmportant biochemical mechanisms (for metabolism and energyransformation) and is relevant to assembly of new and interest-ng enzyme-based biosensors [4]. From this perspective, heminiron(III) protoporphyrin IX) demonstrates interesting chemicalroperties [5] and could be able to reproduce the redox activ-
ty of several heme-proteins (i.e. cytochrome c, catalases, anderoxidases) [6,7]; but also the oxygen-carrying properties of
ome proteins [8] (such as myoglobin and hemoglobin). More-ver, as hemin shows an electrocatalytic mechanism similar tohat observed for some enzymes, such as peroxidases [5], or nitrite∗ Corresponding author.E-mail address: [email protected] (F. Valentini).
013-4686/$ – see front matter © 2011 Elsevier Ltd. All rights reserved.oi:10.1016/j.electacta.2011.12.027
reductase [9], it offers the possibility to detect several compounds,e.g. H2O2 [5], NO/NO2
− [9,10], O2 [11,12], superoxides [6], and tryp-tophan [13], and therefore can provide for interesting analyticalapplications.
Several methods for the immobilization of hemin and otherheme proteins on electrode surfaces have been reported in theliterature, where biomembrane films [14], kieselgubr films [15],nano gold colloid particles [16], nanostructured titanium oxide[17] and organic solvents [18] were employed and allowed theobservation of direct electrochemistry. A relatively new approachinvolves the possibility to immobilize the heme-proteins onthe electrode surface by entrapment in a polymeric matrix[19] created using surfactants [20] or lipids [20–23]. Recently,functionalised multi-walled (MWCNT-COOH) and single-walledcarbon nanotubes (SWCNT-COOH) have also been used to cat-
alyze the electrochemical reaction of several biomolecules, suchas �-NADH [24], dopamine [24,25], epinephrine [24,26], hemin[27], hemoglobin [28,29], myoglobin [30], cytocrome c [31,32],glucose oxidase [33–35] and peroxidase [36,37]. Finally, hemin
3 chimi
aat
tnnetaotstpoamOmTra
2
2
EahtNtbfatHcCc((i0PfawA(
2
vAi(tcUw
8 F. Valentini et al. / Electro
dsorption on a graphite-based electrode and its entrapment in Nafion matrix, resulting in a significant electrocatalytic effectoward the H2O2 and NO2
− reduction, has been reported [27].In this work hemin immobilization on GC modified elec-
rodes has been carried out using a different functionalised carbonanomaterials, CNF-COOH and SWCNT-OH. The choice of carbonanofibers for this study was dictated by its particular properties,specially the larger surface area and its open structure [38] relativeo that of nanotubes, thus resulting in a much larger ratio of surface-ctive groups-to-volume. The higher density of functional groupsn the outer surface of carbon nanofibers also allows the selec-ive immobilization and stabilization of functional biomoleculesuch as proteins, enzymes, and DNA. Also taking into considerationhe high conductivity of carbon nanofibers, this material seemedromising for creating the conditions for direct electrochemistryf heme-proteins. Finally, for the first time to our knowledge, H2O2nd NO2
− electrocatalysis is observed at a CNF-COOH/hemin/GCodified electrode and is compared with that observed at SWCNT-H/hemin-modified GC electrode (without the need to use Nafionembranes or other trapping membrane for proteins or enzymes).
hese systems showed good results especially in terms of a linearange of concentration, a low detection of limit, a high sensitivitynd reproducibility, and finally good operational stability.
. Experimental
.1. Materials
Carbon nanofibers (GFE graphitized fibers) were purchased fromlectrovac AG (Austria, Europe). Among all the CNFs commerciallyvailable from Electrovac AG, we selected CNFs-GFE for having theighest amount of surface functional groups (the total acidity ofhese carbon nanofibers was determined by direct titration withaOH, as reported in literature) [38]. They consequently supported
he highest degree of biomolecule immobilization. SWCNTs (Car-olex AP-grade) were acquired from Aldrich (USA) and the OHunctionalisation was performed using the KOH-based procedure,s described in the literature [39,40]. The resulting OH content onhe SWCNT’s walls and surfaces was estimated by TG/DTA [41].emin (iron(III) protoporphyrin IX chloride; Fe(III)P) was pur-hased from Fluka (Switzerland). Na2HPO4, NaH2PO4, CH3COONa,H3COOH, Na2CO3, NaHCO3, K3[Fe(CN)6], and KOH, were pur-hased from Sigma (Italy). The hydrogen peroxide stock solution30%, w/v) was from Sigma (Italy). A phosphate buffer solutionPB; pH 7.0, ionic strength 0.1 M), acetate buffer solution (pH 5.6,onic strength 0.2 M) and a carbonate buffer (pH 10.0, ionic strength.1 M) were prepared in distilled water. For the pH study, the pH ofB solution was adjusted with HCl and NaOH. The buffer solutions,reshly prepared in distilled water each day, were kept refriger-ted to avoid bacterial growth. The hemin solution (i.e. 10 mg/mL)as prepared by dissolving the protein powder in 0.1 M NaOH.ll chemicals were of analytical grade and were used as received
without further purification).
.2. Apparatus and procedures
Electrochemical investigations were carried out using a con-entional three-electrode system, equipped by a GC (ModelMEL GC/492/3); the system included a 3 mm diameter work-
ng electrode, a platinum counter electrode, and an Ag/AgClAMEL/805/CPG/6, from Milan, Italy) as a reference electrode. For
he cyclic voltammetry (CV) experiments, the electrodes wereonnected to an Autolab electrochemical system (Eco Chemie,trecht, The Netherlands) provided with PGSTAT-12 and GPES soft-are (Eco Chemie, Utrecht, The Netherlands). Cyclic voltammetricca Acta 63 (2012) 37– 46
measurements were performed in a unstirred electrochemical cell,at room temperature. Initially the scan rate study was performedby CV in a wide range, from 50 to 500 mV/s, vs. Ag/AgCl referenceelectrode, while a scan rate of 50 mV/s was eventually chosen tosurvey the behaviour of the various electrodes being evaluated.The thermal stability study performed at CNF/hemin/GC-modifiedelectrode was performed by increasing the cell temperature andrecording the cyclic voltammograms after maintaining a giventemperature for 20 min. The amperometric measurements werecarried out with a 641 VA-Detector (Metrohm, Switzerland) andcurrents were recorded using a Linseis L6512 recorder (Linseis, Selb,Germany). All the amperometric measurements were carried outin a stirred electrochemical cell solution, at room temperature.
Micrographs of the electrode surfaces were obtained by Field-Emission Scanning Electron Microscopy (FE-SEM) using a Hitachimodel S-4000, with an accelerating voltage of 4.4 kV. The FE-SEMsample preparation is described in Section 2.3.
For evaluating the surface concentration of electrocatalyticsites (� mol cm−2) on GC surfaces, several cyclic voltammo-grams were recorded at different scan rates at CNF/hemin/GCand SWCNT/hemin/GC electrodes in 5 mM K3[Fe(CN)6] preparedin 0.1 M phosphate buffer +1 M KCl, at pH 7.0. On the basis ofthe Q (C) value estimated by integration of the CV reduction peakand the equation, � = Q/nFA [42], the surface concentration of theelectroactive protein on the GC modified electrodes was deter-mined where n, F, and A have their usual meaning. In addition,the permeability parameter was evaluated (as described in ourprevious work [43]) in 5 mM K3[Fe(CN)6] prepared in 0.1 M phos-phate buffer +1 M KCl, at pH 7.0, for both electrodes (CNF/hemin/GCand SWCNT/hemin/GC modified electrodes) together with GC bareelectrode.
The operational stability study under operative conditions wascarried out for the same modified electrode surfaces (CNFs andSWCNTs) by performing CV and recording 300 consecutive cyclesin 0.1 M phosphate buffer, pH 7.0, at scan rate of 50 mV/s.
Finally, the H2O2 amperometric detection was performed byusing the method of successive additions with the H2O2 concen-tration ranging from 0.05 to 5 mM, working at an applied potentialof 0.0 V, vs. Ag/AgCl (as reference electrode). For the ampero-metric calibration curve of NO2
−, the same analytical approachdescribed for H2O2, is used, working at an applied potentialof +0.3 V, vs. Ag/AgCl in the concentration range of 5–250 mM.The measurement of both analytes implies a direct electrontransfer based mechanism which has widely been described inthe literature for several protein redox functions: cytochrome c(Cyt-c), hemoglobin (Hb) and hemin (H) [44].
2.3. Electrode surface modification
Before modification, the GC electrode surface was polished usingalumina powder (Al2O3, Buehler, Evanston, IL) having particle sizeof 1, 0.3, and 0.05 �m. Then, the working electrodes were copiouslyrinsed with distilled water, and finally sonicated in H2O/acetonesolution, 50/50 (v/v) for 10 min.
The CNF/GC modified electrode was assembled using the fol-lowing procedure: briefly, the functionalised CNFs were dispersedin CH3CN. The resulting suspension, containing 1.0 mg/mL of CNFs,was put in a ultrasonic bath for 1 h at room temperature. From thishomogeneous CNF dispersion, 2 �L were cast on the GC electrodesurface allowing the solvent to evaporate at room temperature.This step was repeated for 5 consecutive times. An optimisation
study concerning the coating procedure was also performed, usinga final volume of 5 and 10 �L respectively, but in these last casesthe coating of the electrode surfaces, resulted in a thick film thatgave diffusion problems for the substrates.
F. Valentini et al. / Electrochimica Acta 63 (2012) 37– 46 39
F d on electrode surface (×40 of magnitude). (B) Hemin micrograph, deposited on electrodes f magnitude). (D) SEM picture of SWCNT/H/GC based biosensor. Accelerating voltage of4
waCsrs
i(pGt
3
3G
Sa
Table 1Carbon nanofiber and SWCNT physical characteristics.
Physical parametersa GFE SWCNT
Diameter (nm) 80–150 1.2–1.5N2 surface area (m2/g) >50 300Density (g/cm3) 2.17 1.7–1.9Heat treatment (◦C) 3000 500Metal Content (wt%) <0.01 Ni 2.91; Y < 0.01Electrical resistivity (�/cm) <10−3 >10−2
a These physical parameters were from the Electrovac AG, and the Carbolex AP-grade (Aldrich, USA) commercial sources for CNFs and SWCNTs, respectively. Theheat treatments were performed by TG/DTA (Thermogravimetric Differential Ther-
ig. 1. (A) Scanning electron microscopy (SEM) image of carbon nanofibers depositeurface (×40 of magnitude). (C) SEM picture of CNF/H/GC based biosensor (×40 o.4 kV.
For the hemin immobilization, the CNF-modified GC electrodeas dipped into a 3 mg/mL hemin solution (at pH = 5.6 in 0.2 M
cetate buffer) overnight, at room temperature. Then, the CNF-OOH/GC hemin-based biosensor was removed from the proteinolution, copiously washed with distilled water and stored dry atoom temperature. The resulting modified electrode was repre-ented as CNF/H/GC-based biosensor in the text.
The SWCNT-OH/hemin modified GC electrode was assembledn the same way, using a homogeneous suspension of SWCNT-OH1 mg/mL, previously purified and functionalised with KOH [39,40])repared in CH3CN (after 1 h of sonication). The resulting modifiedC electrode was reported as a SWCNT/H/GC based biosensor in
he text.
. Results and discussion
.1. Morphological and structural characterization of CNF-basedC electrode
Table 1 summarizes the physical characteristics of the CNFs andWCNTs. Fig. 1A shows the typical CNF morphology with an aver-ge diameter of 80–150 nm. This image is completely different from
mal Analyzer, Perkin-Elmer) and the elemental analysis, was carried out by the EDX(energy dispersive X-ray analysis). The nominal surface area was estimated by BETprocedure.
that obtained for the hemin coated electrode (Fig. 1B), in whichglobular structures appear. Moreover, the CNF–hemin composite,used to modify the GC electrode surface (see Fig. 1C) shows a very
well defined protein layer which completely surrounded the typ-ical carbon nanofiber structure (homogeneously deposited on theelectrode surface). On the contrary, the morphology of the result-ing SWCNT/hemin composite-based GC electrode (used here for
40 F. Valentini et al. / Electrochimica Acta 63 (2012) 37– 46
Table 2Electrochemical parameters obtained by CV at CNF/H/GC and SWCNT/H/GC biosensors.
Biosensors E◦′ (V) �EFWHM (V) � (mol cm−2) P% (a) ks (s−1)
CNF/H/GC −0.429 V 0.155 1.4 × 10⁻⁸ 173 10.1 ± 0.8SWCNT/H/GC −0.430 V 0.173 7.8 × 10⁻⁹ 112 3.8 ± 0.2 × 10⁻³
-electrod
ctabanSnhndti
3m
bciipepiarpi
cSmatwTe0rTrcuoFC
Cthttec
electrodes.In both cases, we find a lower formal potential than in the
literature [27]. In the former case, this can be related to the
v / (mV s-1)6004002000
I/ μA
-80
-40
0
40
80
0.500.250-0.25-0.50-0.75-1.00-1.25-75
-25
0
25
75
E vs. (Ag/AgCl)/ V
0.500.250-0.25-0.50-0.75-1.00-35
-25
-15
0
15
E vs. (Ag/AgCl)/ V
I / μ
AI /
μA
I / μ
A
-0.25-0.50-0.75-1.00-1.25 0.25 0 0.50
-150
-50
0
50
150
E vs. (Ag/AgCl)/ V
a
h
A
B
C
Fig. 2. Cyclic voltammograms of (A) CNF/GC (dotted line) and CNF/H/GC (solid line)
a The permeability was calculated in the following way: P% = (Imodified-electrode/Ibare
omparison) revealed a non uniform and homogeneous deposit onhe electrode surface (Fig. 1D). On the basis of this consideration,nd also the thermal decomposition of the single-walled CNs (thategins at around 450 ◦C, and increases drastically as the temper-ture increases [45]), it could be demonstrated that graphitizedanofibers are much more stable to heat treatment as compared toingle-Walled CNs. This thermal stability indicates that graphitizedanofibers are very homogeneous, and of very high quality (withoutigh percentage of amorphous carbon or of other different carbonanostructure species). In addition, the higher functionalisationegree, exhibited by CNFs, is also responsible for a significantly bet-er operational stability of the resulting nanomaterial dispersionsn several media.
.2. Direct electrochemistry of CNF/H/GC and SWCNT/H/GCodified electrodes
Fig. 2A shows the cyclic voltammograms recorded in phosphateuffer (pH 7.0) at CNF/GC and CNF/H/GC modified electrodes. For aomparative study, in Fig. 2B the cyclic voltammograms, recordedn phosphate buffer (pH 7.0) at SWCNT/GC and SWCNT/H/GC mod-fied electrodes, are also reported. Obviously, when hemin was notresent on the electrode surfaces, no redox peaks appeared over thentire potential range investigated. Contrarily, a very well resolvedair of redox peaks was clearly recorded when the hemin was
mmobilized on the GC electrode surface modified by CNF. Fig. 2Blso shows the presence of additional pre-peaks related to the redoxeactions of the oxygenated functional groups (in this case, OH)resent on their walls and ends of the SWCNTs, as widely reported
n literature [46].From this comparative study, it is possible to observe lower
urrent peak values for the Fe(III)P/Fe(II)P redox couple at aWCNT/H/GC modified electrode, probably because the SWCNTaterial: (1) results in a closed geometric shell that does not allow
high degree of hemin entrapment [38], (2) displays a lower func-ionalisation degree and (3) the type of functional group is OH,hich is less effective than COOH in immobilizing the hemin.
hese redox peaks could be attributed to a quasi-reversible mono-lectron transfer process (�EFWHM = 0.155 V for CNF/H/GC, and.173 V for SWCNT/H/GC, see Table 2) related to the Fe(III)/Fe(II)edox couple [42], typically seen in a porphyrinic ring-structure.hese �EFWHM (mV) values turned out to be higher than the theo-etical references (0.0905 V/n [46,47]) and correspond to a surfaceonfined redox process. This is probably due to a locally non-niform layer of the adsorbed redox couples, and to the existencef repulsive interactions between the active redox centres [48,49].urthermore, the �EFWHM are quite similar to those reported byurulli et al. [27].
The lower potential of the hemin redox couple observed at theNF/H/GC electrode (compared to the SWCNT/H/GC modified elec-rode) could probably be related to the better entrapment of theemin within the CNF’s open structure, [38]. In addition, the func-
ionalised nanofibers showed high electrical conductivity, due tohe presence of –COOH– groups [50,51]. This means that a morefficient electron-transfer mechanism between the CNF/H activeentres and the transducer surface likely occurred.e) × 100, as described in our previous work [43].
The formal potential, E◦′ (mV), is −0.429 V vs. Ag/AgCl forCNF/H/GC, and −0.430 V vs. Ag/AgCl for SWCNT/H/GC modified
and (B) SWCNT/GC (dotted line) and SWCNT/H/GC (solid line) in 0.1 M phosphatebuffer pH 7.0, at scan rate of 50 mV/s. (C) Cyclic voltammograms of CNF/H/GC per-formed at various scan rates: (a) 50 mV/s, (b) 100 mV/s, (c) 150 mV/s, (d) 200 mV/s,(e) 250 mV/s, (f) 300 mV/s, (g) 400 mV/s and (h) 500 mV/s, respectively. Inset: plotof anodic (�) and cathodic (�) peak current vs. v (mV/s).

chimi
pcte
h(aicc
0Oioct
siicawmtibrt(twFsd–Totaiis
Cdstthtt[Sftbwfa[
wi
F. Valentini et al. / Electro
resence of –COOH– groups on the CNF walls. The lower potential inase of SWCNT/H/GC modified electrodes may depend, instead, onhe generally high degree of –OH– functionalisation. Both types ofnrichment may be responsible for the enhanced electro-catalysis.
This value, −0.429 V, is more negative than the one ofemin immobilized on the Ta-covered MWCNTs/GC electrodeE◦′ = −0.340 V, vs. Ag/AgCl) [51], probably due to the differentmount and nature of the surface structural defects (MWCNTs arentrinsically more defected). This implies a higher conductivity andonsequently, an enhancement of the direct electrochemistry pro-ess.
The �Ep for CNF/H/GC and SWCNT/H/GC are of 0.120 V and of.125 V, respectively, higher than those recorded by Curulli et al.n the other hand, they use very efficient dispersing procedure
n preparing their modified electrodes such as ultra-centrifugationf a dispersion in 1% (w/w) SDS (an anionic surfactant), and theoating in nafion membrane. However, both SDS and nafion areoxic material for cells, and for human health [85].
A scan rate study performed by means of CV for a wide range ofcan potentials (50–500 mV/s) was also carried out, and the result-ng plots of the anodic and cathodic peak currents (see Fig. 2C)ncreased linearly with the scan rate, suggesting that a surface-ontrolled electron transfer process occurred [42]. This result waslso confirmed by the slope obtained for the plot of log I vs. log v,hich was very close to 1 (data not shown) for the CNF/H/GCodified electrode. The Fe(III)P/Fe(II)P redox couple present in
he porphyrinic structure shows a quasi-reversible electrochem-cal profile, as confirmed by the Ipa/Ipc ratio close to 1 [54] andy the slight increase of �Ep upon increasing the potential scanate. Similarly, for SWCNT/H on GC electrode a linear increase ofhe peak currents vs. the potential scan rate was also observeddata not shown), indicating that a surface-controlled electron-ransfer process occurred. On the other hand, lower current valuesere detected at SWCNT/H/GC modified electrode (as shown in
ig. 2B) and this effect can probably be related to the typical closedhell structure of SWCNTs [55] that does not allow for a highegree of functionalisation and at the same time, the presence ofOH– groups, did not guarantee a stable hemin immobilization.his means that the adsorption and the covalent immobilizationf biomolecules could be successfully achieved only by openinghe ends of carbon nanotubes by several oxidation processes [56]nd chemical modifications [57]. In light of this consideration, its clear that the amount of immobilized proteins is limited, result-ng in nanostructured platform-based transducers showing a lowensitivity (and lower signal to noise ratio).
As shown in this paper, the best results were obtained usingNFs and this points to the possibility of overcoming the SWCNT’sisadvantages for biosensor applications. Considering that CNFshow a larger nominal surface area [38] and a more open structure,he resulting functionalised surface area is significantly higher thanhat observed for SWCNTs and provides a rationalization for theigher current peak values observed at CNF/H/GC modified elec-rode (see Fig. 2A). These results were also confirmed by calculatinghe fraction of immobilized electroactive proteins (� (mol cm−2),42]) which turned out to be higher than that obtained at theWCNT/H/GC modified electrode surface (see Table 2). The sur-ace concentration of the electroactive hemin (H) (represented byhe � parameter) on CNF/H/GC and SWCNT/H/GC was estimatedy integration of the anodic peaks according to formula, Q = nFA� ,here A is the electrode area, n is the number of electrons trans-
erred, and F is Faraday’s constant. Values of 1.4 × 10⁻⁸ mol cm−2
nd 7.8 × 10⁻⁹ mol cm−2 are found in the two cases, respectively
42,47].These data suggest that an approximate monolayer of heminas obtained on the CNF’s and SWCNT’s surfaces, as also reported
n literature [52,53]. However, the sligthly larger amount of hemin,
ca Acta 63 (2012) 37– 46 41
which is found on CNF’s surfaces, with respect to SWCNTs, mayfavour the electron transfer process from the redox centre ofthe protein. In line with these results, the permeability towardpotassium ferricyanide [43] increased at the CNF/H/GC modifiedelectrode, compared to that for the SWCNT/H/GC (see Table 2) judg-ing from the permeability values. The ability of CNFs to promote theelectrocatalysis of hemin was also confirmed by calculating the het-erogeneous electron transfer rate constant values, ks (displayed inTable 2 and compared with those obtained for SWCNT/H/GC) usingthe Laviron’s approach, [47].
Briefly, Laviron derived a simple relationship (Eq. (1)) betweenthe logarithm of electron-transfer rate constant (ks) at Ø overpo-tential and the scan rate (v):
ln kS= ̨ ln(1 − ˛) + (1 − ˛)ln ̨ − ln(
RT
nF�
)− ˛(1 − ˛)
nF�Ep
RT(1)
where R is the transfer coefficient, n is the number of electronstransferred in the rate determining reaction (n = 1 in this case), R isthe gas constant, T is the absolute temperature, and �Ep is the peak-to-peak separation. A graph of the peak potential vs. the logarithmof the scan rate yields a straight line with a slope equal to a charge-transfer coefficient ̨ of 0.50 for Hb. For a peak separation largerthan 100 mV and for a scan rate of 0.1 V s−1, ks (s−1) values wereestimated to be 10.1 ± 0.8 for CNF/GC/Hb, and 3.8 ± 0.2 × 10⁻³ forSWCNT/GC/Hb, respectively. In particular, for the SWCNT/GC/Hbbased system, these values are in the range of ks for typical surface-controlled quasi-reversible electron transfer and are close to thosereported for Cyt-c and Hb adsorbed on other electrodes such as vio-logen self-assembled monolayers, graphite, and gold carbon pastemodified electrodes [58–60]. In the case of CNF/GC/Hb, comparingthe ks value obtained in this work with other values reported inliterature (for the direct electrochemistry of hemoglobin at carbonnanotube interface [29], in the case of multi-walled carbon nano-tubes functionalised with hemin for oxygen detection in neutralsolution [52], and finally for the direct electrochemistry and bio-electrocatalysis of horseradish peroxidase immobilized on activecarbon, [61]) it was found to be higher, probably because the func-tionalised CNFs offer an effective microenvironment for the heminimmobilization. On the other hand, ks was lower if compared withother biosensors described in reference [6], where a direct contactbetween the active centres of the hemin and the electrochemicaltransducer surface was realized.
Finally, considering that the best electro-analytical results wereobtained using the CNF/H/GC modified electrode, this biosensorwas optimised investigating the effects of the medium, the pH andtemperature.
3.3. The pH study performed for the CNF/H/GC based electrode
Considering the iron(III)-protoporphyrin IX structure that wasinvolved in the modification of the CNF-based GC electrode [62,63],it is evident that the nature of different electrolytes (i.e. buffer solu-tions) and the pH of the medium can strongly influence the directelectron-transfer mechanism of hemin at CNF/GC electrode. For thispurpose different buffers (i.e. acetate pH 4.5, phosphate pH 7.0, andcarbonate pH 9.5, buffers respectively) were investigated by use ofcyclic voltammetry experiments performed at the CNF/H/GC mod-ified electrode, working at potential scan rate of 50 mV/s. In Fig. 3Athe cyclic voltammograms recorded in different buffer solutionsare reported, showing the best electrochemical profile is obtainedin the presence of 0.1 M phosphate buffer, pH 7.0. This results in ahigher signal to noise ratio. Moreover, the negative potential shift
observed using phosphate buffer turned out to provide a good com-promise to avoid the oxygen reduction (that occurs at negativepotential values, as in carbonate buffer) and the interference effects(that are noted to occur at positive potential values, as in acetate
42 F. Valentini et al. / Electrochimi
pH11109876543
E0'/m
V
-700
-600
-500
-400
-300
-200Coefficients: y/mV = y0 + m*x/pHy[0] = 0.357m[1] = -63.5R² = 0.976
pH11109876543
I/ μA
0
4
8
12
16
-1.25 0.250-0.25-0.50-0.75-1.00 0.50
-30
-10
0
10
30
E vs. (Ag/AgCl)/ V
I / μ
A
ac
b
-1.00-1.25 0-0.25-0.50-0.75 0.25 0.50-50
-30
-10
10
30
E vs. (Ag/AgCl)/ V
I / μ
A
ag
A
B
C
D
Fig. 3. CV recorded at 50 mV/s for CNF/H/GC in different buffers solution: (a) 0.1 Macetate buffer pH 4.5; (b) 0.1 M phosphate buffer pH 7.00; (c) 0.1 M carbonate bufferpH 9.5. (B) CV curves for CNF/H/GC in 0.1 M phosphate buffer recorded at differentpat
bsf(are([vphupwf
H values, from external to internal: pH 4.0 (a), 5.0 (b), 6.0 (c), 7.0 (d), 8.0 (e), 9.0 (f)nd 10.0 (g) at 50 mV/s. Inset plots: influence of pH on the formal potentials (C) andhe anodic peak current (D).
uffer). For this purpose, 0.1 M phosphate buffer was selected totudy the pH effect on the hemin redox potential, in the pH rangerom 4.0 to 10.0 (see Fig. 3B). The plot of the formal potential (E◦′
mV)) vs. pH is reported in Fig. 3C where the pH increase produces negative shift of the standard formal potential, indicating that theedox process is a proton assisted mechanism. In addition, the lin-ar dependence of E◦′ vs. pH units was: y (mV) = 0.357 − 63.5x (pH)R2 = 0.976), that is, close to the theoretical value of −57.8 mV/pH63,64]. On the basis of this result and considering also the �EFWHMalue (data not shown), one can conclude that one electron and oneroton participated in the direct electron-transfer reaction, for theemin redox couple [65,66]. Fig. 3D shows the Ipa (�A) vs. the pH
nits plot, where the better signal to noise ratio was observed atH 7.0. From Fig. 3 onward, a small pre-peak appears in the curveshich is easily related to the redox reactions of the COOH–COO–unctional groups and it is strictly dependent on the pH of the
ca Acta 63 (2012) 37– 46
different buffer solutions [46]. When negative charged species werepresent in solution, they are able to reject the most common inter-ferences, typical of the anodic potential range, as ascorbate andurate.
3.4. Operational stability evaluated at the CNF/H/GC modifiedelectrode
The operational stability of the CNF/H/GC electrode was alsoinvestigated, working by use of CV in potentiodinamic conditions,continuously cycling the electrode potential between +0.3 and−0.8 V (at 50 mV/s) in 0.1 M phosphate buffer solution, pH 7.0. InFig. 4A, 300 consecutive cycles performed with the same CNF/H/GCelectrode are reported, showing a response decrease of 40% at the100th cycle (as shown in Fig. 4B). After the 300th cycle the responseremained almost constant (∼30% of the original signal). In addition,the � /� ◦ vs. time plot (not reported here) showed a typical firstorder kinetic profile [67] allowing the estimation of the rate con-stant (kdeact.) related to the deactivation process, which was foundto be 1.48 × 10⁻² cm2 mol−1 s−1, and 3.72 × 10⁻³ cm2 mol−1 s−1 forCNF/H/GC and SWCNT/H/GC biosensors, respectively. According tothese data, the CNF/H/GC modified electrode showed an opera-tional stability comparable with that obtained for the SWCNT/H/GCmodified electrode. This effect is probably related to a betterabsorption of hemin on the CNF COOH, compared with the weakadsorption that occurs with the SWCNT OH.
3.5. Thermal stability of CNF/H/GC modified electrode
Fig. 4C shows the super imposable cyclic voltammograms ofthe CNF/H/GC modified electrode in 0.1 M phosphate buffer, pH7.0, at scan rate of 50 mV/s, recorded at different temperatures. InFig. 4D the anodic and cathodic current peak values decreased from298 to 320 K, and remained almost constant for higher tempera-tures (ranging from 320 to 350 K). This effect is probably related tothe polar microenvironment that surrounded the hemin molecularstructure during the immobilization procedure. According to theliterature [68] a remarkable thermal stabilization of the biosensorscan be achieved only when the biocatalyst is confined in a highlyhydrophobic microenvironment, which gives a conformationalrigidity to these biocatalysts. Consequently, the redox current peakprofile vs. the temperature should show a significant increase withtemperature, displaying a theoretical Arrhenius-type temperaturedependence [69]. This effect was not observed in our case study,probably because of the presence of a hydrophilic binding envi-ronment for hemin on GNFs, that increases the chemical–physicalinteractions (in terms of H-bonds and van der Waals’ contacts) withthe medium, responsible for the lack of the native structure andrigidity of protein, as widely described in literature (where onlythe hydrophobic interactions are very important in determiningprotein stability [70]).
3.6. Electrocatalytic effect toward the H2O2 reduction atCNF/H/GC based biosensor
The development of a hydrogen peroxide biosensor representsan interesting aspect for several analytical applications, consid-ering that H2O2 is the substrate of more than 800 oxidase-basedenzymes [48,70]. Before to perform a calibration plot for H2O2, ahydrodynamic voltammetric study (Fig. 5A) was also performed atCNF/H/GC and SWCNT/H/GC (for this last, data not shown) modi-fied electrodes, in the potential window ranging from −0.3 to 0.3 V,
vs. Ag/AgCl. The best working potential for the H2O2 amperomet-ric measurements resulted of 0.0 V because of a higher signal tonoise ratio. One of the most important advantages to detect H2O2 atthis low potential is to minimize the interference effect (due to the
F. Valentini et al. / Electrochimica Acta 63 (2012) 37– 46 43
Number of cycles100806040200%
of t
he in
itial
resp
onse
0
40
80
T/K360350340330320310300290
I p/ μ
A
-20
0
20
-1.00 0.25 0-0.25-0.50-0.75 0.50
-30
-20
-10
10
20
E vs. (Ag/AgCl)/ V
I / μ
A
-0.75-1.25 0.50 0-0.25
-100
-50
0
50
E vs. (Ag/AgCl)/ V
I / μ
A
10
300
A
B
C
D
Fig. 4. (A) Operational stability performed at CNF/H/GC by CV for 300 consecutivecycles in 0.1 M phosphate buffer, pH 7.0 at 50 mV/s. (B) Inset plot: % of the initialresponse vs. the number of cycles. (C) CV for CNF/H/GC in 0.1 M phosphate buffer,pH 7.0 at 25 ◦C (solid line), 35 ◦C (–·–), 45 ◦C (–·–·–), 55 ◦C (····), 65 ◦C (–··–··) and 75 ◦C(c
piwtahCoCs
C
0,30,20,10,0-0,1-0,2-0,30
1
2
3
4
5
6
7
5mM H2O2
I/μA
E vs. (Ag/AgCl)/ V
[H2O2] / (μmol L-1 )6500040003000200010000
Δ =
(I tot
- I b
ack)
/μA
0,0
0,1
0,2
0,3
0,4
0,5
[H2O2] / (μmol L-1 )120010008006004002000
Δ =
(I tot
- I b
ack)
/μA
0,00
0,02
0,04
0,06
0,08
0,10
0,12
0,14
0,16
0,18
A
B
C
Fig. 5. (A) Hydrodynamic voltammograms for 5 mM H2O2 at CNF/H/GC, performedfrom −0.3 to +0.3. (B) Calibration curves at GC (�), CNF/GC (�) and CNF/H/GC (�) fordifferent concentration of H2O2, ranging from 0.05 to 5 mM, performed by amper-ometry at 0.0 V as applied potential vs. Ag/AgCl as reference electrode. (C) Inset plot:
—) at a scan rate of 50 mV/s. (D) Inset plot of anodic (�) and cathodic (�) peakurrent vs. temperature.
resence of ascorbic or uric acids, and acetaminophen) as reportedn our previous work [43]. At the same time, the possibility to
ork at 0.0 V minimizes the oxygen electrochemical reduction,hat occurs at −0.3 and −0.1 V, as described in literature [52], andlso catalyzed by the presence of hemin. This detection based onydrogen peroxide oxidation could be related to the presence ofOOH COO− groups, more than the hemin electrocatalytic effectr a combination of both aspects (synergism between hemin and
OOH groups). At the state of the art, this mechanism is not clearo further study will be required.According to this, further investigation will be carried out atNF/H/GC based biosensor to study the interferents (in particular
the calibration plot for H2O2 in the linear range (0.05–1 mM). Other experimentalconditions as described in Fig. 4.
degassing for O2 and evaluating the perm-selectivity parameter, inthe case of ascorbic and uric acid, acetaminophen, etc.).
Appling 0.0 V potential in amperometry, the calibration curves
for H2O2 were carried out and reported in Fig. 5B and C (C, the insetplot) and all the analytical parameters are summarized in Table 3.The best results were obtained working at CNF/H/GC modified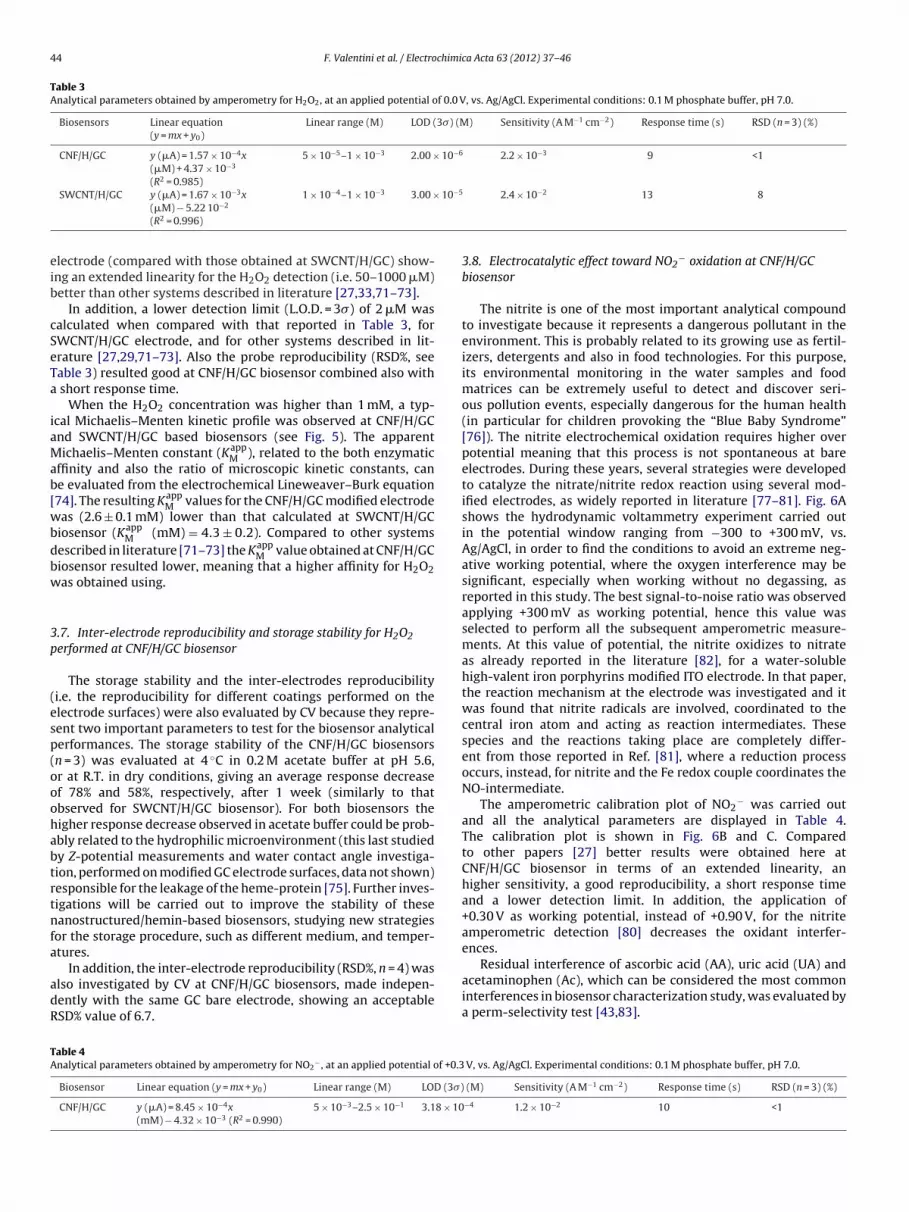
44 F. Valentini et al. / Electrochimica Acta 63 (2012) 37– 46
Table 3Analytical parameters obtained by amperometry for H2O2, at an applied potential of 0.0 V, vs. Ag/AgCl. Experimental conditions: 0.1 M phosphate buffer, pH 7.0.
Biosensors Linear equation(y = mx + y0)
Linear range (M) LOD (3�) (M) Sensitivity (A M−1 cm−2) Response time (s) RSD (n = 3) (%)
CNF/H/GC y (�A) = 1.57 × 10⁻⁴x(�M) + 4.37 × 10⁻³
(R2 = 0.985)
5 × 10⁻⁵–1 × 10⁻³ 2.00 × 10⁻⁶ 2.2 × 10⁻³ 9 <1
−3 −4 −3 10−5 −2
eib
cSeTa
iaMab[wbdbw
3p
(esp(ooohabtrtnfa
adR
TA
SWCNT/H/GC y (�A) = 1.67 × 10 x(�M) − 5.22 10−2
(R2 = 0.996)
1 × 10 –1 × 10 3.00 ×
lectrode (compared with those obtained at SWCNT/H/GC) show-ng an extended linearity for the H2O2 detection (i.e. 50–1000 �M)etter than other systems described in literature [27,33,71–73].
In addition, a lower detection limit (L.O.D. = 3�) of 2 �M wasalculated when compared with that reported in Table 3, forWCNT/H/GC electrode, and for other systems described in lit-rature [27,29,71–73]. Also the probe reproducibility (RSD%, seeable 3) resulted good at CNF/H/GC biosensor combined also with
short response time.When the H2O2 concentration was higher than 1 mM, a typ-
cal Michaelis–Menten kinetic profile was observed at CNF/H/GCnd SWCNT/H/GC based biosensors (see Fig. 5). The apparentichaelis–Menten constant (Kapp
M ), related to the both enzymaticffinity and also the ratio of microscopic kinetic constants, cane evaluated from the electrochemical Lineweaver–Burk equation74]. The resulting Kapp
M values for the CNF/H/GC modified electrodeas (2.6 ± 0.1 mM) lower than that calculated at SWCNT/H/GC
iosensor (KappM (mM) = 4.3 ± 0.2). Compared to other systems
escribed in literature [71–73] the KappM value obtained at CNF/H/GC
iosensor resulted lower, meaning that a higher affinity for H2O2as obtained using.
.7. Inter-electrode reproducibility and storage stability for H2O2erformed at CNF/H/GC biosensor
The storage stability and the inter-electrodes reproducibilityi.e. the reproducibility for different coatings performed on thelectrode surfaces) were also evaluated by CV because they repre-ent two important parameters to test for the biosensor analyticalerformances. The storage stability of the CNF/H/GC biosensorsn = 3) was evaluated at 4 ◦C in 0.2 M acetate buffer at pH 5.6,r at R.T. in dry conditions, giving an average response decreasef 78% and 58%, respectively, after 1 week (similarly to thatbserved for SWCNT/H/GC biosensor). For both biosensors theigher response decrease observed in acetate buffer could be prob-bly related to the hydrophilic microenvironment (this last studiedy Z-potential measurements and water contact angle investiga-ion, performed on modified GC electrode surfaces, data not shown)esponsible for the leakage of the heme-protein [75]. Further inves-igations will be carried out to improve the stability of theseanostructured/hemin-based biosensors, studying new strategies
or the storage procedure, such as different medium, and temper-tures.
In addition, the inter-electrode reproducibility (RSD%, n = 4) waslso investigated by CV at CNF/H/GC biosensors, made indepen-ently with the same GC bare electrode, showing an acceptableSD% value of 6.7.
able 4nalytical parameters obtained by amperometry for NO2
− , at an applied potential of +0.3
Biosensor Linear equation (y = mx + y0) Linear range (M) LOD (3�)
CNF/H/GC y (�A) = 8.45 × 10⁻⁴x(mM) − 4.32 × 10⁻³ (R2 = 0.990)
5 × 10⁻³–2.5 × 10⁻¹ 3.18 × 10
2.4 × 10 13 8
3.8. Electrocatalytic effect toward NO2− oxidation at CNF/H/GC
biosensor
The nitrite is one of the most important analytical compoundto investigate because it represents a dangerous pollutant in theenvironment. This is probably related to its growing use as fertil-izers, detergents and also in food technologies. For this purpose,its environmental monitoring in the water samples and foodmatrices can be extremely useful to detect and discover seri-ous pollution events, especially dangerous for the human health(in particular for children provoking the “Blue Baby Syndrome”[76]). The nitrite electrochemical oxidation requires higher overpotential meaning that this process is not spontaneous at bareelectrodes. During these years, several strategies were developedto catalyze the nitrate/nitrite redox reaction using several mod-ified electrodes, as widely reported in literature [77–81]. Fig. 6Ashows the hydrodynamic voltammetry experiment carried outin the potential window ranging from −300 to +300 mV, vs.Ag/AgCl, in order to find the conditions to avoid an extreme neg-ative working potential, where the oxygen interference may besignificant, especially when working without no degassing, asreported in this study. The best signal-to-noise ratio was observedapplying +300 mV as working potential, hence this value wasselected to perform all the subsequent amperometric measure-ments. At this value of potential, the nitrite oxidizes to nitrateas already reported in the literature [82], for a water-solublehigh-valent iron porphyrins modified ITO electrode. In that paper,the reaction mechanism at the electrode was investigated and itwas found that nitrite radicals are involved, coordinated to thecentral iron atom and acting as reaction intermediates. Thesespecies and the reactions taking place are completely differ-ent from those reported in Ref. [81], where a reduction processoccurs, instead, for nitrite and the Fe redox couple coordinates theNO-intermediate.
The amperometric calibration plot of NO2− was carried out
and all the analytical parameters are displayed in Table 4.The calibration plot is shown in Fig. 6B and C. Comparedto other papers [27] better results were obtained here atCNF/H/GC biosensor in terms of an extended linearity, anhigher sensitivity, a good reproducibility, a short response timeand a lower detection limit. In addition, the application of+0.30 V as working potential, instead of +0.90 V, for the nitriteamperometric detection [80] decreases the oxidant interfer-ences.
Residual interference of ascorbic acid (AA), uric acid (UA) andacetaminophen (Ac), which can be considered the most commoninterferences in biosensor characterization study, was evaluated bya perm-selectivity test [43,83].
V, vs. Ag/AgCl. Experimental conditions: 0.1 M phosphate buffer, pH 7.0.
(M) Sensitivity (A M−1 cm−2) Response time (s) RSD (n = 3) (%)
−4 1.2 × 10⁻² 10 <1

F. Valentini et al. / Electrochimi
0,60,50,40,30,20,10,0-0,1-0,2-0,3-0,4
0,0
0,5
1,0
1,5
2,0
2,5
3,0 5mM NO2-I/μ
A
E (V)
100080060040020000,00
0,04
0,08
0,12
0,16
0,20
Δ =
(I tot
- I b
ack)
/μA
[NO2- ], mM
2502001501005000,00
0,01
0,02
0,03
0,04
0,05
0,06
0,07
0,08
Δ =
(I tot
- I b
ack
)/μA
[NO2- ], mM
A
B
C
Fig. 6. (A) Hydrodynamic voltammograms for 5 mM NO2− at CNF/H/GC, performed
from −0.3 to +0.3 V. (B). Calibration curves at GC (�), CNF/GC (�) and CNF/H/GC(�) for different concentration of NO2
− , ranging from 5 to 1000 mM, performedby amperometry at +0.3 V as applied potential vs. Ag/AgCl as reference electrode.(e
aa
a
[[[[
[
[[
[
[[[
Advances in Colloid and Interface Science 116 (2005) 111–120.
C) Inset plot: the calibration plot for NO2− in the linear range (5–250 mM). Other
xperimental conditions as described in Fig. 4.
It was found a value of 50% for ascorbic acid (AA), 45% for uriccid (UA) and 38% for acetaminophen (Ac). Such values guarantee
non-compromised signal-to-noise ratio.Similarly to the H2O2 reduction, the calibration plot displayed
typical Michaelis–Menten profile for NO2− concentration higher
[[[
ca Acta 63 (2012) 37– 46 45
than 250 mM (see Fig. 6B and C). The apparent Michaelis–Mentenconstant (Kapp
M ), related to the protein–electrode affinity, can beevaluated from the electrochemical Lineweaver–Burk equation[71] resulting in 0.44 ± 0.01 mM at CNF/H/GC biosensor. This valuewas lower than that described in literature for other NO2
− biosen-sors [84] meaning that a higher affinity toward the substrate wasobtained here.
4. Conclusions
In this paper a new functionalised carbon nanomaterial (i.e. car-bon nanofibers) has been used to immobilize hemin on the GCelectrode surface, using a simple and reproducible procedure (bydrop-coating). The best electroanalytical performances observedat CNF/H/GC biosensor were compared with those recorded atSWCNT/H/GC biosensor, demonstrating that the open structureof CNFs combined with its higher surface functional group den-sity were responsible for a beneficial effect on the hemin catalyticactivity, firstly related to a strong covalent protein immobilization(absorption).
The pH investigation demonstrated that a quasi-reversible elec-trochemical profile occurred at CNF/H/GC biosensor involving oneproton and one electron redox process. In addition, a higherreversibility was recorded at this modified electrode, as confirmedby the electrochemical parameters and the increased value of theheterogeneous electron transfer rate constant.
Moreover, for the first time to our knowledge, the H2O2 andNO2
− electrocatalytic effect observed at CNF/H/GC based biosen-sor was reported, demonstrating good analytical performances interms of an extended linearity, a lower detection limit, a high sen-sitivity, a significant reproducibility and short response time.
Acknowledgement
The authors wish to thank the “Regione Lazio project” for finan-cial support.
References
[1] H. Wang, B. Qi, B. Lu, X. Bo, L. Guo, Electrochimica Acta 56 (2011) 3042–3048.[2] J. Huang, Y. Liu, T. You, Analytical Methods 2 (2010) 202–211.[3] X. Lua, J. Zhoua, W. Lua, Q. Liu, J. Li, Biosensors and Bioelectronics 23 (2008)
1236–1243.[4] P.U. Arumugama, H. Chena, S. Siddiquia, J.A.P. Weinrichc, A. Jejelowod, J. Li, M.
Meyyappan, Biosensors and Bioelectronics 24 (2009) 2818–2824.[5] K. Liu, J. Zhang, G. Yang, C. Wanga, J.-J. Zhu, Electrochemistry Communications
12 (2010) 402–405.[6] J. Xiea, X. Fenga, J. Hua, X. Chena, A. Li, Biosensors and Bioelectronics 25 (2010)
1186–1192.[7] N. Jia, Y. Wen, G. Yang, Q. Lian, C. Xu, H. Shen, Electrochemistry Communications
10 (2008) 774–777.[8] C.-Z. Li, G. Liu, S. Prabhulkar, American Journal of Biomedical Science 1 (4)
(2009) 303–311.[9] Y. Zhang, X. Chen, W. Yang, Sensors and Actuators B 130 (2008) 682–688.10] Y. Liu, H. Liu, N. Hu, Biophysical Chemistry 117 (2005) 27–37.11] L. Shen, N. Hu, Biochimica et Biophysica Acta 1608 (2004) 23–33.12] W. Zhang, G. Li, Analytical Sciences 20 (2004) 603–609.13] C.G. Nan, Z.Z. Fena, W.X. Li, D.J. Ping, C.H. Qin, Analytica Chimica Acta 452 (2002)
245.14] X. Han, W. Huang, J. Jia, S. Dong, E. Wang, Biosensors and Bioelectronics 17
(2002) 741.15] H. Wang, R. Guan, C. Fan, D. Zhu, G. Li, Sensors and Actuators 84 (2002) 214.16] J.-J. Feng, G. Zhao, J.-J. Xu, H.-Y. Chen, Analytical Biochemistry 342 (2005)
280–286.17] M. Viticoli, A. Curulli, A. Cusmà, S. Kaciulis, S. Nunziante, L. Pandolfi, F. Valentini,
G. Padeletti, Materials Science and Engineering C 26 (2006) 947.18] D. Wei, A. Ivaska, Analytica Chimica Acta 607 (2008) 126–135.19] N. Jia, Q. Lian, Z. Wang, H. Shen, Sensors and Actuators B 137 (2009) 230–234.20] F.W. Scheller, N. Bistolas, S. Liu, M. Janchen, M. Katterle, U. Wollenberger,
21] J. Gao, J.F. Rusling, Journal of Electroanalytical Chemistry 449 (1998) 1.22] C. Fan, I. Suzuki, Q. Chen, G. Li, J.-I. Anzai, Analytical Letters 33 (2000) 2631.23] Z. Zhang, A.E. Nassar, Z. Lu, J.B. Schenkman, J.F. Rusling, Journal of the Chemical
Society, Faraday Transactions 93 (1997) 1769.

4 chimi
[
[
[
[
[[[[[[
[[[
[[
[
[
[
[
[
[[
[[[[[[[
[
[
[
[
[[[[[
[[[[[[
[[[
[[[[[
[[[
[[[[
6 F. Valentini et al. / Electro
24] F. Valentini, A. Amine, S. Orlanducci, M.L. Terranova, G. Palleschi, AnalyticalChemistry 75 (2003) 5413.
25] X.-X. Yan, D.-W. Pang, Z.-X. Lu, J.-Q. Lu, H. Tong, Journal of ElectroanalyticalChemistry 569 (2004) 47.
26] F. Valentini, G. Palleschi, E. Lopez Morales, S. Orlanducci, E. Tamburri, M.L.Terranova, Electroanalysis 19 (7–8) (2007) 859–869.
27] G.L. Turdean, I.C. Popescu, A. Curulli, G. Palleschi, Electrochimica Acta 51 (2006)6435.
28] B.S. Sherigara, W. Kutner, F. D’Souza, Electroanalysis 15 (2003) 753.29] Y.-D. Zhao, Y.-H. Bi, W.-D. Zhang, Q.-M. Luo, Talanta 65 (2005) 489.30] L. Zhang, G.-C. Zhao, X.W. Wei, Z.-S. Yang, Chemistry Letters 33 (2004) 86.31] J. Wang, M. Li, Z. Shi, N. Li, Z. Gu, Analytical Chemistry 74 (2002) 1993.32] Z.-Z. Yin, G.-C. Zhao, X.-W. Wei, Chemistry Letters 34 (2005) 992.33] S. Sotiropoulou, V. Gavalas, V. Vamvakaki, N.A. Chaniotakis, Biosensors and
Bioelectronics 18 (2003) 211.34] A. Guiseppi-Elie, C. Lei, R.H. Baughman, Nanotechnology 13 (2002) 559.35] J. Wang, Electroanalysis 17 (2005) 7.36] X. Yu, D. Chattopadhyay, I. Galeska, F. Papadimitrakopoulos, J.F. Rusling, Elec-
trochemistry Communications 5 (2003) 408.37] J.-Z. Xu, J.-J. Zhu, Q. Wu, Z. Hu, H.-Y. Chen, Electroanalysis 15 (2003) 219.38] V. Vamvakaki, K. Tsagaraki, N. Chaniotakis, Analytical Chemistry 78 (2006)
5538.39] E. Tamburri, S. Orlanducci, M.L. Terranova, F. Valentini, G. Palleschi, A. Curulli,
F. Brunetti, D. Passeri, A. Alippi, M. Rossi, Carbon 43 (2005) 1213.40] A. Curulli, F. Valentini, S. Orlanducci, E. Tamburri, M. L. Terranova, S. Nunziante
Cesaro, G. Palleschi, Proceedings of the IV IEEE Conference on Nanotechnology(2004).
41] L. Zhang, V.U. Kiny, H. Peng, J. Zhu, R.F.M. Lobo, J.L. Margrave, V.N. Khabashesku,Chemistry of Materials 16 (11) (2004) 2055.
42] R.W. Murray, in: A.J. Bard (Ed.), Electroanalytical Chemistry, vol. 13, Dekker,New York, 1984, p. 191.
43] A. Curulli, F. Valentini, S. Orlanducci, M.L. Terranova, G. Palleschi, Biosensorsand Bioelectronics 20 (2004) 1223.
44] C. Cai, J. Chen, Analytical Biochemistry 325 (2004) 285–292.45] M. Carbone, F. Valentini, R. Caminiti, A.R. Petrinca, D. Donia, M. Divizia, G.
Palleschi, Biomedial Materials 5 (2010) 035001.46] J.J. Gooding, Electrochimica Acta 50 (2005) 3049–3060.47] E. Laviron, Journal of Electroanalytical Chemistry 101 (1979) 19.48] B. Wang, J. Zhang, G. Cheng, S. Dong, Analytica Chimica Acta 407 (2000) 111.
49] M.J. Honeychourch, G.A. Rechnitz, Electroanalysis 5 (1998) 285.50] C.A. Dyke, J.M. Tour, Chemistry European Journal 10 (2004) 812.51] K. Chattopadhyay, S. Mazumdar, Bioelectrochemistry 53 (2000) 17.52] J.-S. Ye, Y. Wen, W.D. Zhang, H.-F. Cui, L.M. Gan, G.Q. Xu, F.-S. Sheu, Journal ofElectroanalytical Chemistry 562 (2004) 241.
[
[[
ca Acta 63 (2012) 37– 46
53] M. Chicharro, Alberto S. Arribas, M. Moreno, E. Bermejo, A. Zapardiel, Talanta74 (2007) 376–386.
54] A.J. Bard, L.R. Faulkner, Electrochemical Methods, Wiley-VCH, New York, 1980,pp. 515–522.
55] S. Sotiropoulou, N.A. Chaniotakis, Analytical and Bioanalytical Chemistry 375(2003) 103.
56] B.R. Azamian, K.S. Coleman, J.J. Davis, N. Hanson, M.L.H. Green, Journal of theChemical Society, Chemical Communications 4 (2002) 366.
57] A. Hirsch, Angewandte Chemie International Edition 41 (2002) 1853.58] Q. Li, G. Luo, J. Feng, Electroanalysis 13 (2001) 359.59] J.L. Willit, E.F. Bowden, Journal of Electroanalytical Chemistry 221 (1987) 265.60] H. Ju, S. Liu, B. Ge, F. Lisdat, F.W. Scheller, Electroanalysis 14 (2002) 141.61] D. Sun, C. Cai, X. Li, W. Xing, T. Lu, Journal of Electroanalytical Chemistry 566
(2004) 415.62] C. Cai, J. Chen, Analytical Biochemistry 325 (2004) 285.63] T.G. Spiro, A.A. Jarzecki, Current Opinion in Chemical Biology 5 (2001) 715.64] H. Sun, N. Hu, H. Ma, Electroanalysis 12 (2000) 1064.65] X. Chen, N. Hu, Y. Zeng, J.F. Rusling, J. Yang, Langmuir 15 (1999) 7022.66] Q. Wang, J. Lu, B. Yang, Sensors and Actuators B 99 (2004) 50.67] D.L. Pilloud, X. Chen, P.L. Dutton, C.C. Moser, Journal of Physical Chemistry B
104 (2000) 2868.68] A. Ciszewske, G. Milczarek, Analytical Chemistry 72 (2000) 3203.69] J. Wang, J. Liu, G. Cepra, Analytical Chemistry 69 (1997) 3124.70] L. Serrano, J.T. Kellis Jr., P. Cann, A. Matouschek, A.R. Fersht, Journal of Molecular
Biology 224 (1992) 783.71] S. Liu, Z. Dai, H. Chen, H. Ju, Biosensors and Bioelectronics 19 (2004) 963.72] L. Zhao, H. Liu, N. Hu, Journal of Colloid and Interface Science 296 (2006) 204.73] R.A. Kamin, G.S. Willson, Analytical Chemistry 52 (1980) 1198.74] J. Li, S.N. Tan, H.L. Ge, Analytica Chimica Acta 335 (1996) 137.75] J.H. Qian, Y.C. Liu, H.Y. Liu, T.Y. Yu, J.Q. Deng, Journal of Electroanalytical Chem-
istry 397 (1995) 157.76] V. Yu Titov, Yu M. Petrenko, Biochemistry 70 (2005) 473.77] I.G. Casella, M. Gatta, Journal of Electroanalytical Chemistry 568 (2004) 183.78] S. Trevin, F. Bedioui, J. Devynck, Journal of Electroanalytical Chemistry 408
(1996) 261.79] S. Trevin, F. Bedioui, J. Devynck, Talanta 43 (1996) 303.80] J.-J. Feng, J.-J. Xu, H.Y. Chen, Electrochemistry Communications 8 (2006) 77.81] P. Liu, J. Hu, Sensors and Actuators B 84 (2002) 194.82] J. Lei, H. Ju, O. Ikeda, Journal of Electroanalytical Chemistry 567 (2004) 331–338.
83] V. Biagiotti, F. Valentini, E. Tamburri, M.L. Terranova, D. Moscone, G. Palleschi,Sensors and Actuators B 122 (2007) 236.84] Z. Dai, X. Xu, H. Ju, Analytical Biochemistry 332 (2004) 23.85] S. Sirisattha, Y. Momose, E. Kitagawa, H. Iwahasci, Water Research 38 (2004)
61–70.


