Embed Size (px)
Citation preview
This article appeared in a journal published by Elsevier. The attachedcopy is furnished to the author for internal non-commercial researchand education use, including for instruction at the authors institution
and sharing with colleagues.
Other uses, including reproduction and distribution, or selling orlicensing copies, or posting to personal, institutional or third party
websites are prohibited.
In most cases authors are permitted to post their version of thearticle (e.g. in Word or Tex form) to their personal website orinstitutional repository. Authors requiring further information
regarding Elsevier’s archiving and manuscript policies areencouraged to visit:
http://www.elsevier.com/copyright
Author's personal copy
Transport behavior of humic acid-modified nano-hydroxyapatite in saturatedpacked column: Effects of Cu, ionic strength, and ionic composition
Dengjun Wang a,f, Lingyang Chu a,b, Marcos Paradelo c, Willie J.G.M. Peijnenburg d,e,Yujun Wang a, Dongmei Zhou a,⇑a Key Laboratory of Soil Environment and Pollution Remediation, Institute of Soil Science, Chinese Academy of Sciences, Nanjing 210008, PR Chinab College of Resources and Environmental Sciences, Anhui Agricultural University, Hefei 230036, PR Chinac Soil Science Group, Department of Plant Biology and Soil Science, Faculty of Sciences, University of Vigo, Ourense E-32004, Spaind Laboratory of Ecological Risk Assessment, National Institute of Public Health and the Environment, P.O. Box 1, 3720 BA Bilthoven, The Netherlandse Institute of Environmental Sciences (CML), Leiden University, P.O. Box 9518, 2300 RA Leiden, The Netherlandsf Graduate School of the Chinese Academy of Sciences, Beijing 100049, PR China
a r t i c l e i n f o
Article history:Received 25 January 2011Accepted 20 April 2011Available online 7 May 2011
Keywords:Nano-hydroxyapatite (nHAP)Humic acid (HA)CuIonic strength (IS)Ionic composition (IC)
a b s t r a c t
The surfaces of nano-hydroxyapatite (nHAP) used for contaminated soil and groundwater remediationmay be modified to render nHAP highly mobile in the subsurface. Humic acid (HA) is widely used tomodify and stabilize colloid suspensions. In this work, column experiments were conducted to determinethe effects of contaminant (e.g., Cu) concentration, ionic strength (IS), and ion composition (IC) on thetransport behavior of HA-modified nHAP in saturated packed columns. IS and nature of the cation hadstrong effects on the deposition of nHAP, and the effect was greater for divalent than for monovalentcations. Divalent cations have a greater capacity to screen the surface charge of nHAP, and Ca2+ bridgesthe HA-modified nHAP colloidal particles, which causes greater deposition. Moreover, Cu2+ had a greatereffect on the transport behavior than Ca2+ due to their strong exchange with Ca2+ of nHAP and its surfacecomplexation with nHAP. The relative travel distance LT, of the injected HA-modified nHAP colloids,ranges from less than one to several meters at varying Cu concentrations, ISs, and ICs in saturated packedcolumns. The results are crucial to evaluate the efficacy of nHAP on the remediation of contaminated soiland groundwater environments.
� 2011 Elsevier Inc. All rights reserved.
1. Introduction
Nanotechnology focuses on the investigation and application ofmaterials with at least one characteristic dimension less than100 nm [1]. The properties of nanomaterials such as small size,high surface area, low density, and high surface to volume ratiomake them a highly promising novel class of materials for a varietyof potential applications. Nano-hydroxyapatite (Ca10(PO4)6(OH)2,nHAP), which is the main component of hard tissues of vertebratessuch as bones and teeth, for example, has significant potential inthe field of orthopedics, dentistry, and drug delivery [2–4]. In theenvironmental science and engineering community, it has beenwidely applied for the remediation of contaminated soil [5–7]and purification of wastewaters polluted by heavy metals for itsstrong ability to fix heavy metals [8–10]. Metal ions such as Pb2+,Cu2+, Zn2+, Cd2+, and Co2+ were successfully stabilized in contami-nated soil or removed from wastewater through coprecipitation
with nHAP by means of ion exchange, surface complexation, anddissolution of nHAP to form new metal phosphates [6,7,8–10].
Natural organic matters (NOMs) such as HA and fulvic acid (FA),present in the soil solutions and groundwater environments, areone of the key factors governing the environmental transport andfate of colloids. NOMs can be adsorbed onto colloidal particles,altering their surface properties, and consequently affecting theirtransport patterns. In previous work, we demonstrated that thenHAP exhibited limited transport in the absence of HA becauseof its high aspect ratio and high surface area. However, its trans-port capacity was significantly enhanced by the presence of HAin the bulk solution in saturated sand columns [11]. It is generallyaccepted that HA adsorbed on the surface of colloidal particles canstabilize the colloidal particles due to the existence of both electro-static repulsion and steric hindrance effects [12,13]. nHAP has beenwidely used for the remediation of contaminated soil and ground-water environments, typically comprising a large amount of HA.HA was therefore selected as a modifier to stabilize nHAP colloidalsuspensions to simulate a more realistic subsurface environmentin the present study.
0021-9797/$ - see front matter � 2011 Elsevier Inc. All rights reserved.doi:10.1016/j.jcis.2011.04.064
⇑ Corresponding author. Fax: +86 25 8688 1000.E-mail address: [email protected] (D. Zhou).
Journal of Colloid and Interface Science 360 (2011) 398–407
Contents lists available at ScienceDirect
Journal of Colloid and Interface Science
www.elsevier .com/locate / jc is
Author's personal copy
The most of the surfaces in natural porous media, minerals, andsoil organic matter possess a negative surface charge at the prevail-ing pH conditions, thus leading to unfavorable attachment condi-tions [14,15], although the source of the negative electrokineticpotential of the nHAP colloid is still not understood [16]. Theeffects of solution chemistry such as IS and IC (mono- and divalentcations) governing the fate and transport behavior of nanomateri-als such as nanoscale zerovalent iron [17] and fullerene (C60) [18]in porous media have been studied extensively. The expected effect– increased deposition at higher IS or in the presence of divalentcation in the bulk solution – is attributed to decreasing of repulsivesurface interaction energies between colloids, and colloids andgrain surfaces [19], which is in agreement with the prediction bythe classic Derjaguin–Landau–Verwey–Overbeek (DLVO) theory[20,21]. However, there has been no systematic study so far onthe transport behavior of nHAP, especially HA-modified nHAP insaturated packed column. Meanwhile, it is worth noting that inthe presence of NOM and Ca2+ (e.g., groundwater environment),enhanced aggregation is observed due to the bridging of the nano-particles by the microgels formed by the Ca-mediated bridging ofNOM [22–24]. Therefore, it is crucial to investigate the impact ofthe divalent Ca2+ cation on the transport behavior of HA-modifiednHAP colloidal particles in saturated packed columns.
In China, nHAP has been widely used as an ideal candidate forremediation of soils contaminated by heavy metals such as Cu2+,Zn2+, Pb2+, and Cd2+ [5]. Contaminants such as Cu ions are typi-cally present in contaminated soil pore water solutions andgroundwater environments in their dissolved state. The presenceof dissolved Cu2+ ions in bulk solution can substantially changethe electrochemical properties of colloidal particles having a sig-nificant influence on particle transport and deposition in porousmedia [25,26]. A more realistic investigation therefore entailsobserving the transport behavior of HA-modified nHAP in thepresence of dissolved Cu2+ ions. This will be more closely minicconditions in natural soil and groundwater environments andthus allow for a more accurate simulation of their fate and trans-port in these systems.
In this work, a series of one-dimensional (1D) column experi-ments were conducted to assess the transport behavior of HA-modified nHAP in porous media. Experiments were conductedto investigate the effects of Cu concentration, IS, and IC on thetransport behavior of HA-modified nHAP in saturated packedcolumn.
2. Materials and methods
2.1. Porous media
Quartz sand obtained from Sinopharm Chemical Reagent Co.,Ltd., China, was used as porous media. The grain size distributionof the sand was determined by sieve analysis. The median grainsize (d50) of the sand was 600 lm, and the coefficient of uniformity(Ui = d60/d10 where x% of the mass was finer than dx) was 1.3. Priorto use, the sands were sonicated (KQ-300VDE sonicator, 100 W,45 kHz, Shanghai, China) in 0.01 M NaOH solution for 30 min atroom temperature, rinsed with deionized water, and then soni-cated again for an additional 30 min in 0.01 M HCl solution beforea final thorough rinsing with deionized water. The sands were thendried in an oven at 105 �C.
2.2. Characterization of nHAP
nHAP used in this study (purity > 99.99%) was purchased fromAipurui Nanomaterial Company (Nanjing, China). The nHAP wascharacterized by a variety of techniques. Powder X-ray diffraction
(XRD) patterns were taken on a diffractometer (ShimadzuXRD-6000, Japan) with a Cu Ka radiation (40 kV, 30 mA). Thescanning range (2h) was from 10 to 80� at a speed of 5� min�1.The surface morphological features of the nHAP were observedusing a Scanning Electron Microscope (LEO-1530 SEM, Germany).Crystal size and shape were studied by Transmission ElectronMicroscopy (JEM-2100 TEM, Japan), and the sample was preparedby placing a droplet of the colloidal suspension (200 mg L�1) on aCu mesh TEM grid and left to air drying. The specific surface areaof the nHAP was measured by nitrogen adsorption–desorption iso-therms using the Brunauer–Emmett–Teller (BET) method (Micro-metrics Accusorb 2100E, USA). The sample was degassed undervacuum at room temperature before measurement. The contentsof Ca2+ and PO3�
4 in the nHAP were determined by Atomic Absorp-tion Spectrometry (AAS, Hitachi Z-2000, Japan) and a molybdenumblue method [27], respectively. In order to eliminate the interfer-ence of PO3�
4 in measuring Ca2+, masking agent (strontium chlo-ride) was added in the test solution.
2.3. Adsorption isotherm of Cu on nHAP in the absence and presence ofHA
Adsorption isotherms of Cu on nHAP in the absence and pres-ence of HA were obtained by adding 2.5 � 10�2 g of nHAP to5.0 mL of different concentrations of Cu(NO3)2 solution (analyticalreagent) ranging from 0 to 5.0 mM in centrifuge tubes. Then, 20 mLultrapure water (18.2 MX, Millipore, Inc., USA) containing 0 or12.5 mg L�1 HA (Sigma Aldrich, Germany) in different sets wasadded, and the final volume was 25 mL. Therefore, the suspendedCu concentrations were 0, 1.0 � 10�2, 2.0 � 10�2, 0.10, 0.20, 0.50,0.75, and 1.0 mM, respectively, and the concentrations of HA were0 or 10 mg L�1 HA in different sets. The pH of the solutions wasadjusted to 6.0 by adding 1.0 � 10�2 M HCl or NaOH solution.The experiments were conducted in triplicate.
Samples were continuously shaken for 24 h at 20 �C on areciprocating shaker, centrifugated at 170,000g for 1 h (OptimaTML-80XP Ultracentrifuge, Beckman), and then filtered through a0.22 lm membrane filter. The Cu concentration in the filtratewas determined by AAS. The amount of Cu adsorbed onto the nHAPwas calculated from the difference in concentrations between theinitial and equilibrium solutions.
2.4. Preparation of nHAP colloidal suspensions
To test the effect of Cu concentration on the transport behav-ior of nHAP, a series of nHAP colloidal suspensions at varyinginitial Cu concentrations were prepared. The procedures aredescribed below. First, 5.0 � 10�2 g of nHAP and 25 mL of100 mg L�1 HA solution were added to a 250 mL volumetricflask, shaken vigorously for 1 min to disperse the nHAP. Then,25 mL of different concentrations of Cu solution (1.0 � 10�2–13 mM) and 200 mL ultrapure water were added. The final vol-ume was 250 mL, and the concentrations of nHAP and HA were200 and 10 mg L�1, respectively. The initial suspension Cu con-centrations were 1.0 � 10�3, 1.0 � 10�2, 5.0 � 10�2, 0.10, 0.50,and 1.3 mM. The colloidal suspension was sonicated (100 W,45 kHz) for 30 min at room temperature. Prior to use, the sus-pension was stirred for 1 min to ensure a homogeneoussuspension.
To determine the effects of IS and IC on the transport behaviorof nHAP, experiments were conducted over a range of ISs (1.0, 10,50, and 100 mM of KCl) and ICs (0.10, 0.30, 0.50, and 1.0 mM ofCaCl2). Here, the monovalent K+ and divalent Ca2+ cations areselected in the experiments as these cations are abundant andomnipresent in the groundwater environments.
D. Wang et al. / Journal of Colloid and Interface Science 360 (2011) 398–407 399
Author's personal copy
2.5. Packed column
The transport experiments were conducted in glass chromatog-raphy column packed with quartz sand. The column was 2.6 cm indiameter and 20.0 cm in length, and was fitted with an 80 lm wiremesh at both ends. Each column contained approximately 150 gquartz sand with an average length of 20 cm. To achieve uniformpacking, the sand was carefully deposited in the column using aspatula and then gently vibrated. The column was slowly saturatedby pumping ultrapure water in the upward direction at anapproach velocity of 1.0 � 10�5 m s�1 for 1 h. Following thissaturated step, the water content of each column was determinedgravimetrically. The porosity of the packed columns variedbetween 0.39 and 0.41. Each column was packed carefully follow-ing the same procedure to ensure reproducibility between thecolumns.
2.6. Transport experiments
The packed column was initially equilibrated by flushing sev-eral pore volumes (PVs) of ultrapure water and at least 5 PVs ofthe colloid-free background electrolyte solution in order to estab-lish a steady state flow and to standardize the chemical conditions.Experiments were then performed in three phases (Detailed exper-imental procedures are provided in Table 1): (1) phase 1, nHAP col-loidal suspensions at varying initial suspension Cu concentrations,ISs, and ICs (as described in Section 2.4.) were gently stirred whileapplied at the bottom end of the column via a peristaltic pump(YZP-15, Baoding Longer Precision Pump Co., Ltd, Hebei, China)at a constant approach velocity (7.3 � 10�5 m s�1) for 3.75 PVs,(2) phase 2, several PVs of particle-free background electrolytesolution were pumped into the column to ensure that nearly nocolloidal particle was detected in the effluent, and (3) phase 3,about 5 PVs ultrapure water were injected into the column reduc-ing dramatically the IS of the bulk solution. Notice that the trans-port experiments at varying Cu concentrations consist of onlytwo phases. Ultrapure water was injected during phase 2 to avoidthe interference of the dissolved Cu2+ ions on the mobilization ofretained colloids through re-adsorption and re-distribution ofthem to the nHAP and HA-nHAP complex of the pore fluid. Columnoutflow was collected into a 15-mL glass tube in regular timeintervals using a fraction collector (BS-100A, Huxi AnalyticalInstrument Factory Co., Ltd, Shanghai, China).
2.7. Analytical procedures
2.7.1. Electrokinetic potential of nHAP and porous mediaTriplicate nHAP colloidal suspensions with varying Cu concen-
trations, ISs, and ICs were used for electrophoretic mobility mea-surement using a microelectrophoresis instrument (JS94G,Zhongcheng Digital Technology Co., Ltd., Shanghai, China). Thevalues of the zeta potential (f-potential) were calculated on thebasis of the Helmholtz–Smoluchowski equation [28]. Meanwhile,the f-potentials of quartz sand with varying Cu concentrations,ISs, and ICs were also determined by the method described by Zhouet al. [29]. Briefly, clean pulverized quartz surfaces were dispersedin the electrolyte solution of interest. The solution was sonicated(100 W, 45 kHz) for 1 h, and then the supernatant was taken forelectrophoretic mobility measurement.
2.7.2. Concentrations of nHAP and Cu in the effluentsThe concentrations of nHAP in the outflow were determined by
UV/Vis spectrophotometer (721–100, Jinghua Science and Technol-ogy Instrument Co., Ltd, Shanghai, China), at a wavelength of300 nm [11]. A calibration curve was constructed by diluting of200 mg L�1 colloid suspension. Spectrometer response versuscolloid concentration was linear in the range of 0–200 mg L�1 witha coefficient of determination of R2 = 0.999. The detection limit isequal to approximately 1.0 mg L�1.
The concentrations of the dissolved Cu2+ in the effluents whenconducting the transport experiment at varying Cu concentrationconditions were also determined. Aliquots (5 mL) of the effluentswere centrifugated at 170,000 g for 1 h and then filtered througha 0.22 lm membrane filter to determine the dissolved Cu by theAAS.
The bromide tracer, which was used to determine the hydro-dynamic performance of the column, was analyzed by bromideion-selective electrode (PBr-1, Kangyi Instrument Co., Ltd.,Shanghai, China). Based on the tracer concentration data andmeasured approach velocity (v), the dispersion coefficient (D)of the porous media was determined by fitting the standardconvection–dispersion equation for a conservative solute to thebromide breakthrough curves using the CXTFIT 2.1 program[30]. Colloid concentrations in the outflow were related to theconcentrations in the inflow and represented as relative concen-trations Ci/C0.
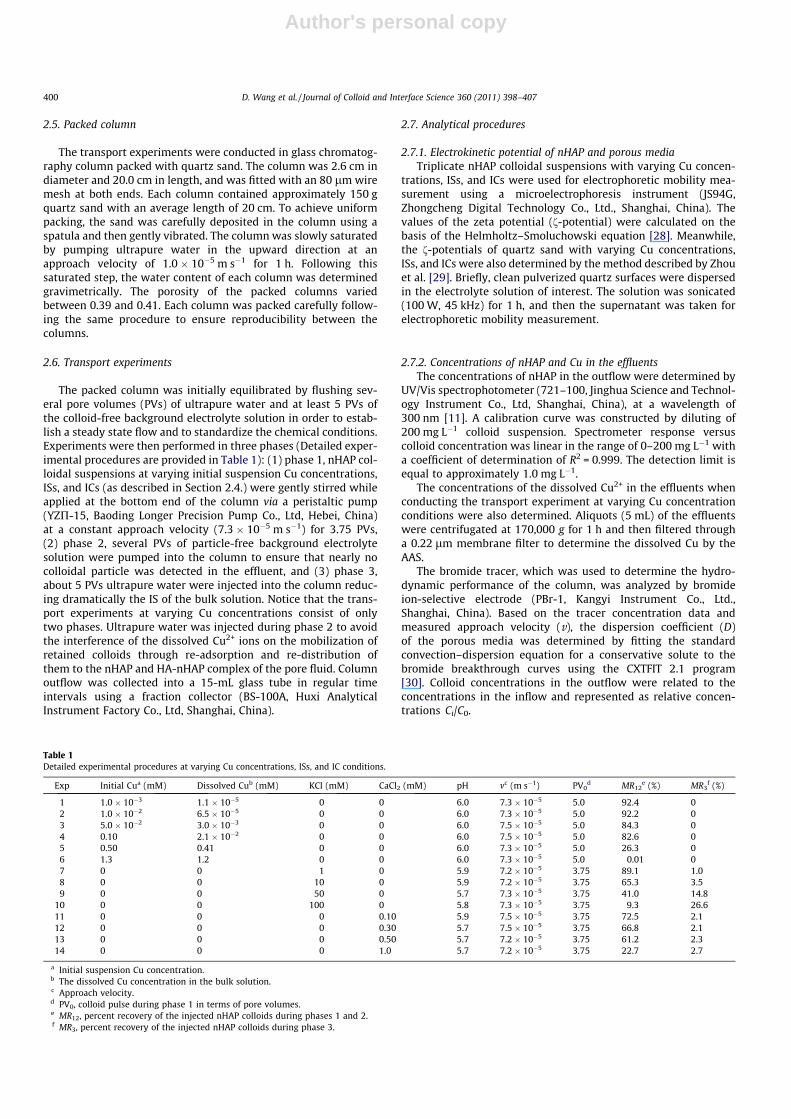
Table 1Detailed experimental procedures at varying Cu concentrations, ISs, and IC conditions.
Exp Initial Cua (mM) Dissolved Cub (mM) KCl (mM) CaCl2 (mM) pH vc (m s�1) PV0d MR12
e (%) MR3f (%)
1 1.0 � 10�3 1.1 � 10�5 0 0 6.0 7.3 � 10�5 5.0 92.4 02 1.0 � 10�2 6.5 � 10�5 0 0 6.0 7.3 � 10�5 5.0 92.2 03 5.0 � 10�2 3.0 � 10�3 0 0 6.0 7.5 � 10�5 5.0 84.3 04 0.10 2.1 � 10�2 0 0 6.0 7.5 � 10�5 5.0 82.6 05 0.50 0.41 0 0 6.0 7.3 � 10�5 5.0 26.3 06 1.3 1.2 0 0 6.0 7.3 � 10�5 5.0 0.01 07 0 0 1 0 5.9 7.2 � 10�5 3.75 89.1 1.08 0 0 10 0 5.9 7.2 � 10�5 3.75 65.3 3.59 0 0 50 0 5.7 7.3 � 10�5 3.75 41.0 14.8
10 0 0 100 0 5.8 7.3 � 10�5 3.75 9.3 26.611 0 0 0 0.10 5.9 7.5 � 10�5 3.75 72.5 2.112 0 0 0 0.30 5.7 7.5 � 10�5 3.75 66.8 2.113 0 0 0 0.50 5.7 7.2 � 10�5 3.75 61.2 2.314 0 0 0 1.0 5.7 7.2 � 10�5 3.75 22.7 2.7
a Initial suspension Cu concentration.b The dissolved Cu concentration in the bulk solution.c Approach velocity.d PV0, colloid pulse during phase 1 in terms of pore volumes.e MR12, percent recovery of the injected nHAP colloids during phases 1 and 2.f MR3, percent recovery of the injected nHAP colloids during phase 3.
400 D. Wang et al. / Journal of Colloid and Interface Science 360 (2011) 398–407
Author's personal copy
2.8. Data analysis
2.8.1. nHAP colloids attachment and quantifying relative transportdistances
The fraction of mass recovery (MR) of the injected nHAP colloidsin the column outflow during phases 1 and 2 was calculated by thezero moment by integrating a nHAP colloid breakthrough curve(BTC) and normalizing it to the total amount injected:
MRð%Þ ¼R1
0 QðtÞCðtÞdtR T0
0 QðtÞC0ðtÞdtð1Þ
where Q is the flow rate (L3 T�1), C0 and C are the concentration insolution for the injection solution and column outflow, respectively(M L�3), t is the time (T), and T0 is the duration of the pulse (T). Here,T0 is the duration of phases 1 and 2.
The attachment efficiency (a) that is defined as the probabilityof a collision between a particle and grain resulting in attachmentof the particle [31] can be determined by:
a ¼ � 2dc
3ð1� hÞLg0lnðMRÞ ð2Þ
where dc is the average diameter of quartz sand (600 lm), h is theporosity (0.39–0.41), L is the column length (20.2–20.2 cm), andg0 is the theoretical single collector contact efficiency.
The single collector contact efficiency, g0, represents the frac-tion of particles that collide with the collector and is a functionof the physical properties of both the porous media and the colloidparticles. It is the sum of collector efficiencies due to diffusion (gD),interception (gI), and sedimentation (gG), as expressed below [32]:
g0 ¼ gD þ gI þ gG
¼ 2:4A1=3S N�0:081
R N�0:715Pe N0:052
vdW þ 0:55ASN1:675R N0:125
A
þ 0:22N�0:24R N1:11
G N0:053vdW ð3Þ
in which
AS ¼1� e5
1� 1:5eþ 1:5e5 � e6 ð4Þ
e ¼ ð1� hÞ1=3 ð5Þ
NR ¼dp
dcð6Þ
NPe ¼vdc
D1ð7Þ
NvdW ¼A
kTð8Þ
NA ¼A
12pa2pv
ð9Þ
NG ¼2a2
pðqp � qrÞg9lv ð10Þ
where As is the Happel model parameter, e is porosity-dependentparameter, dp is the nHAP diameter (100 nm), v is the approachvelocity, D1 is the bulk solution coefficient, A is the Hamaker con-stant (1.0 � 10�20 J), k is the Boltzmann constant(1.38 � 10�23 J K�1), T is the fluid temperature (293 K), ap is thenHAP radius (50 nm), qp is the nHAP density (3.2 g cm�3 for nHAP),qr is the fluid density (103 kg m�3), l is the fluid viscosity(8.9 � 10�4 kg m�1 s�1), and g is the gravitational acceleration(9.8 m s�2).
To quantify the relative transport distances of nHAP under dif-ferent Cu concentrations, ISs, and ionic composition conditions, LT
which is defined as the travel distance required to remove 99% ofthe injected colloids, i.e., where CL/C0 = 1% is introduced [33].
LT ¼ �2dc
3ð1� hÞag0ln
CL
C0ð11Þ
2.8.2. nHAP-sand interaction energy predictionThe classic DLVO theory was used to calculate the total interac-
tion energy (sum of London-van der Waals attraction and electro-static double layer repulsion) for nHAP colloidal particle upon closeto approach to quartz sand surface (assuming sphere–plate inter-action). Retarded London-van der Waals attractive interactionforce was determined from the expression of Gregory [34] utilizinga value of 1.0 � 10�20 J for the Hamaker constant. In these calcula-tions, constant potential electrostatic double layer interactionswere quantified using the expression described by Hogg et al.[35], with f-potentials in place of surface potentials.
3. Results and discussion
3.1. Characterization of the nHAP
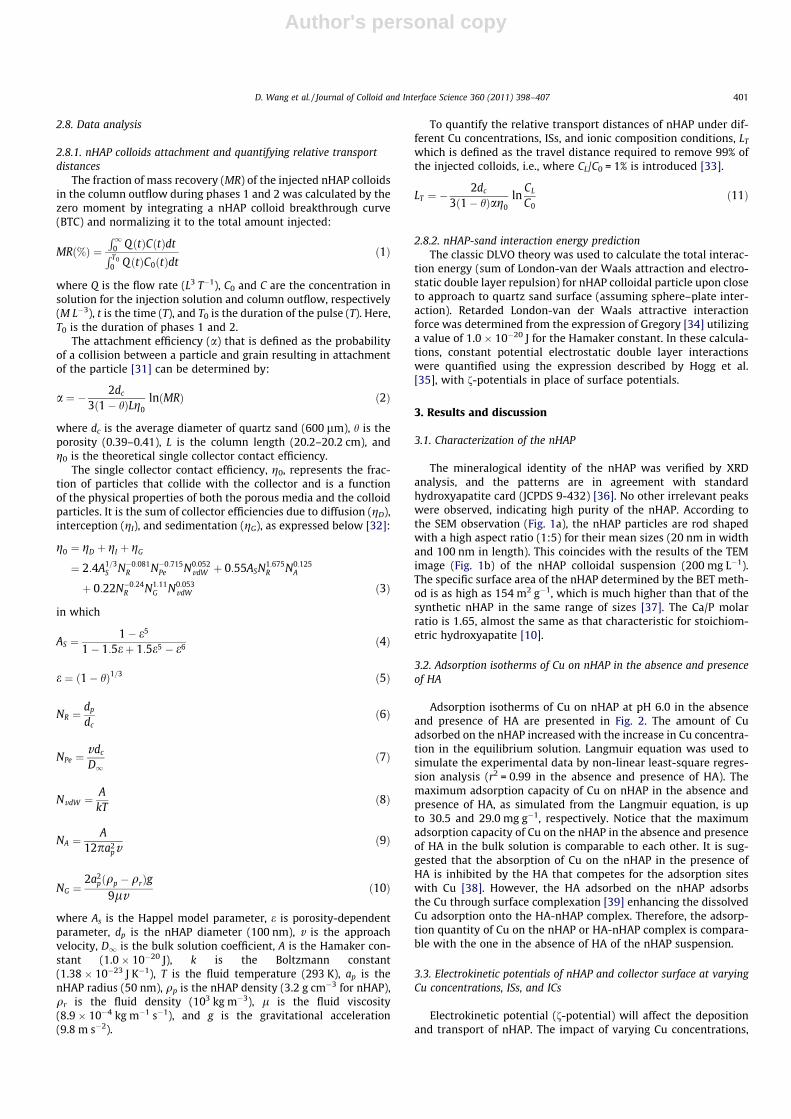
The mineralogical identity of the nHAP was verified by XRDanalysis, and the patterns are in agreement with standardhydroxyapatite card (JCPDS 9-432) [36]. No other irrelevant peakswere observed, indicating high purity of the nHAP. According tothe SEM observation (Fig. 1a), the nHAP particles are rod shapedwith a high aspect ratio (1:5) for their mean sizes (20 nm in widthand 100 nm in length). This coincides with the results of the TEMimage (Fig. 1b) of the nHAP colloidal suspension (200 mg L�1).The specific surface area of the nHAP determined by the BET meth-od is as high as 154 m2 g�1, which is much higher than that of thesynthetic nHAP in the same range of sizes [37]. The Ca/P molarratio is 1.65, almost the same as that characteristic for stoichiom-etric hydroxyapatite [10].
3.2. Adsorption isotherms of Cu on nHAP in the absence and presenceof HA
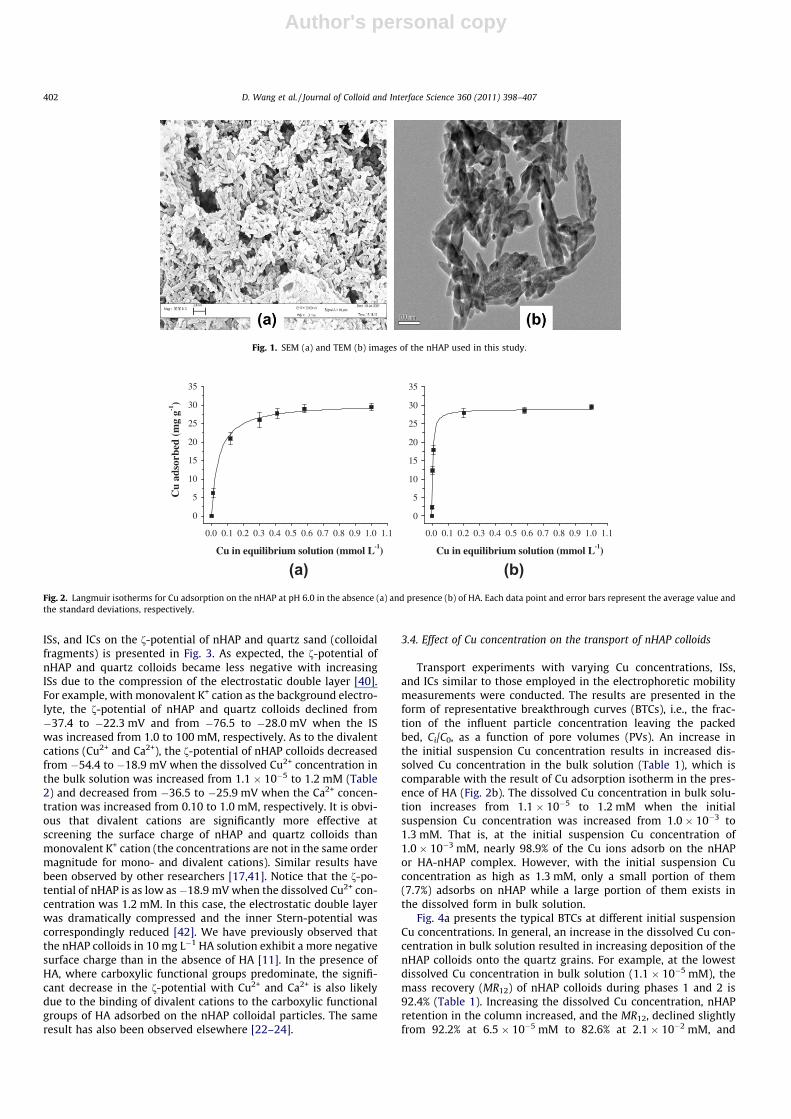
Adsorption isotherms of Cu on nHAP at pH 6.0 in the absenceand presence of HA are presented in Fig. 2. The amount of Cuadsorbed on the nHAP increased with the increase in Cu concentra-tion in the equilibrium solution. Langmuir equation was used tosimulate the experimental data by non-linear least-square regres-sion analysis (r2 = 0.99 in the absence and presence of HA). Themaximum adsorption capacity of Cu on nHAP in the absence andpresence of HA, as simulated from the Langmuir equation, is upto 30.5 and 29.0 mg g�1, respectively. Notice that the maximumadsorption capacity of Cu on the nHAP in the absence and presenceof HA in the bulk solution is comparable to each other. It is sug-gested that the absorption of Cu on the nHAP in the presence ofHA is inhibited by the HA that competes for the adsorption siteswith Cu [38]. However, the HA adsorbed on the nHAP adsorbsthe Cu through surface complexation [39] enhancing the dissolvedCu adsorption onto the HA-nHAP complex. Therefore, the adsorp-tion quantity of Cu on the nHAP or HA-nHAP complex is compara-ble with the one in the absence of HA of the nHAP suspension.
3.3. Electrokinetic potentials of nHAP and collector surface at varyingCu concentrations, ISs, and ICs
Electrokinetic potential (f-potential) will affect the depositionand transport of nHAP. The impact of varying Cu concentrations,
D. Wang et al. / Journal of Colloid and Interface Science 360 (2011) 398–407 401
Author's personal copy
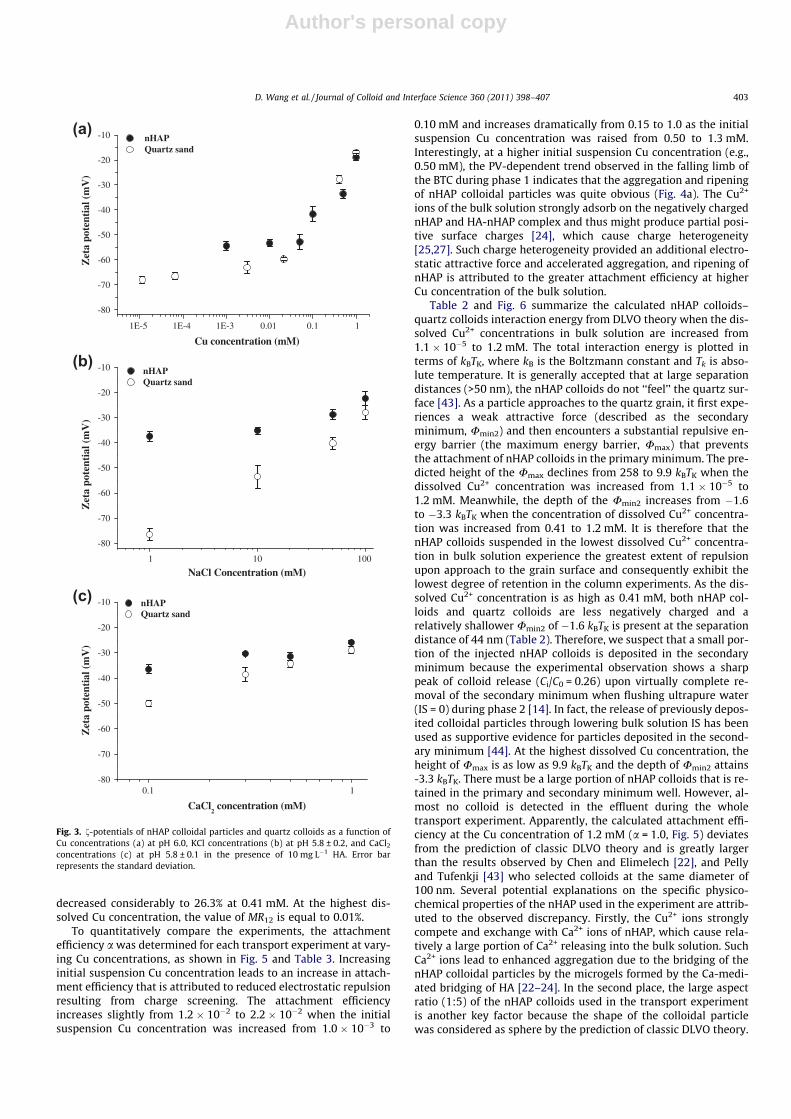
ISs, and ICs on the f-potential of nHAP and quartz sand (colloidalfragments) is presented in Fig. 3. As expected, the f-potential ofnHAP and quartz colloids became less negative with increasingISs due to the compression of the electrostatic double layer [40].For example, with monovalent K+ cation as the background electro-lyte, the f-potential of nHAP and quartz colloids declined from�37.4 to �22.3 mV and from �76.5 to �28.0 mV when the ISwas increased from 1.0 to 100 mM, respectively. As to the divalentcations (Cu2+ and Ca2+), the f-potential of nHAP colloids decreasedfrom �54.4 to �18.9 mV when the dissolved Cu2+ concentration inthe bulk solution was increased from 1.1 � 10�5 to 1.2 mM (Table2) and decreased from �36.5 to �25.9 mV when the Ca2+ concen-tration was increased from 0.10 to 1.0 mM, respectively. It is obvi-ous that divalent cations are significantly more effective atscreening the surface charge of nHAP and quartz colloids thanmonovalent K+ cation (the concentrations are not in the same ordermagnitude for mono- and divalent cations). Similar results havebeen observed by other researchers [17,41]. Notice that the f-po-tential of nHAP is as low as �18.9 mV when the dissolved Cu2+ con-centration was 1.2 mM. In this case, the electrostatic double layerwas dramatically compressed and the inner Stern-potential wascorrespondingly reduced [42]. We have previously observed thatthe nHAP colloids in 10 mg L�1 HA solution exhibit a more negativesurface charge than in the absence of HA [11]. In the presence ofHA, where carboxylic functional groups predominate, the signifi-cant decrease in the f-potential with Cu2+ and Ca2+ is also likelydue to the binding of divalent cations to the carboxylic functionalgroups of HA adsorbed on the nHAP colloidal particles. The sameresult has also been observed elsewhere [22–24].
3.4. Effect of Cu concentration on the transport of nHAP colloids
Transport experiments with varying Cu concentrations, ISs,and ICs similar to those employed in the electrophoretic mobilitymeasurements were conducted. The results are presented in theform of representative breakthrough curves (BTCs), i.e., the frac-tion of the influent particle concentration leaving the packedbed, Ci/C0, as a function of pore volumes (PVs). An increase inthe initial suspension Cu concentration results in increased dis-solved Cu concentration in the bulk solution (Table 1), which iscomparable with the result of Cu adsorption isotherm in the pres-ence of HA (Fig. 2b). The dissolved Cu concentration in bulk solu-tion increases from 1.1 � 10�5 to 1.2 mM when the initialsuspension Cu concentration was increased from 1.0 � 10�3 to1.3 mM. That is, at the initial suspension Cu concentration of1.0 � 10�3 mM, nearly 98.9% of the Cu ions adsorb on the nHAPor HA-nHAP complex. However, with the initial suspension Cuconcentration as high as 1.3 mM, only a small portion of them(7.7%) adsorbs on nHAP while a large portion of them exists inthe dissolved form in bulk solution.
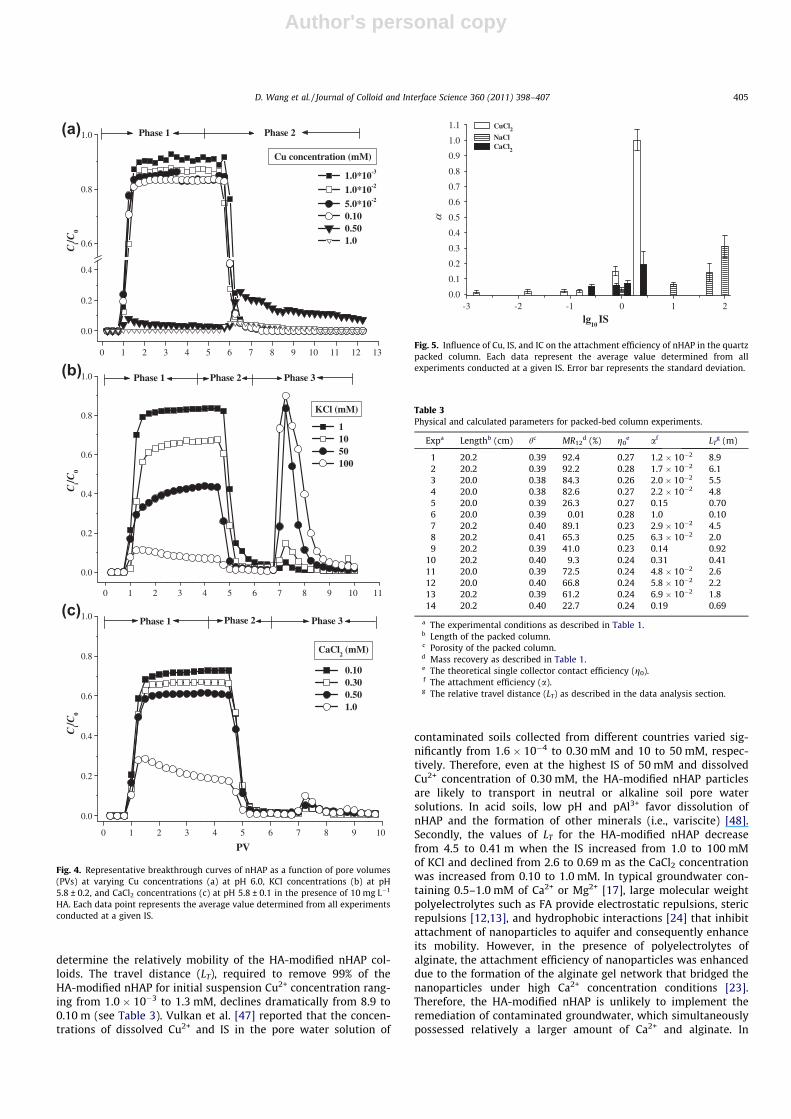
Fig. 4a presents the typical BTCs at different initial suspensionCu concentrations. In general, an increase in the dissolved Cu con-centration in bulk solution resulted in increasing deposition of thenHAP colloids onto the quartz grains. For example, at the lowestdissolved Cu concentration in bulk solution (1.1 � 10�5 mM), themass recovery (MR12) of nHAP colloids during phases 1 and 2 is92.4% (Table 1). Increasing the dissolved Cu concentration, nHAPretention in the column increased, and the MR12, declined slightlyfrom 92.2% at 6.5 � 10�5 mM to 82.6% at 2.1 � 10�2 mM, and
Fig. 1. SEM (a) and TEM (b) images of the nHAP used in this study.
0
5
10
15
20
25
30
35
Cu in equilibrium solution (mmol L-1)
0.0 0.1 0.2 0.3 0.4 0.5 0.6 0.7 0.8 0.9 1.0 1.10.0 0.1 0.2 0.3 0.4 0.5 0.6 0.7 0.8 0.9 1.0 1.1
0
5
10
15
20
25
30
35
Cu
adso
rbed
(m
g g-1
)
Cu in equilibrium solution (mmol L-1)
(a) (b)Fig. 2. Langmuir isotherms for Cu adsorption on the nHAP at pH 6.0 in the absence (a) and presence (b) of HA. Each data point and error bars represent the average value andthe standard deviations, respectively.
402 D. Wang et al. / Journal of Colloid and Interface Science 360 (2011) 398–407
Author's personal copy
decreased considerably to 26.3% at 0.41 mM. At the highest dis-solved Cu concentration, the value of MR12 is equal to 0.01%.
To quantitatively compare the experiments, the attachmentefficiency a was determined for each transport experiment at vary-ing Cu concentrations, as shown in Fig. 5 and Table 3. Increasinginitial suspension Cu concentration leads to an increase in attach-ment efficiency that is attributed to reduced electrostatic repulsionresulting from charge screening. The attachment efficiencyincreases slightly from 1.2 � 10�2 to 2.2 � 10�2 when the initialsuspension Cu concentration was increased from 1.0 � 10�3 to
0.10 mM and increases dramatically from 0.15 to 1.0 as the initialsuspension Cu concentration was raised from 0.50 to 1.3 mM.Interestingly, at a higher initial suspension Cu concentration (e.g.,0.50 mM), the PV-dependent trend observed in the falling limb ofthe BTC during phase 1 indicates that the aggregation and ripeningof nHAP colloidal particles was quite obvious (Fig. 4a). The Cu2+
ions of the bulk solution strongly adsorb on the negatively chargednHAP and HA-nHAP complex and thus might produce partial posi-tive surface charges [24], which cause charge heterogeneity[25,27]. Such charge heterogeneity provided an additional electro-static attractive force and accelerated aggregation, and ripening ofnHAP is attributed to the greater attachment efficiency at higherCu concentration of the bulk solution.
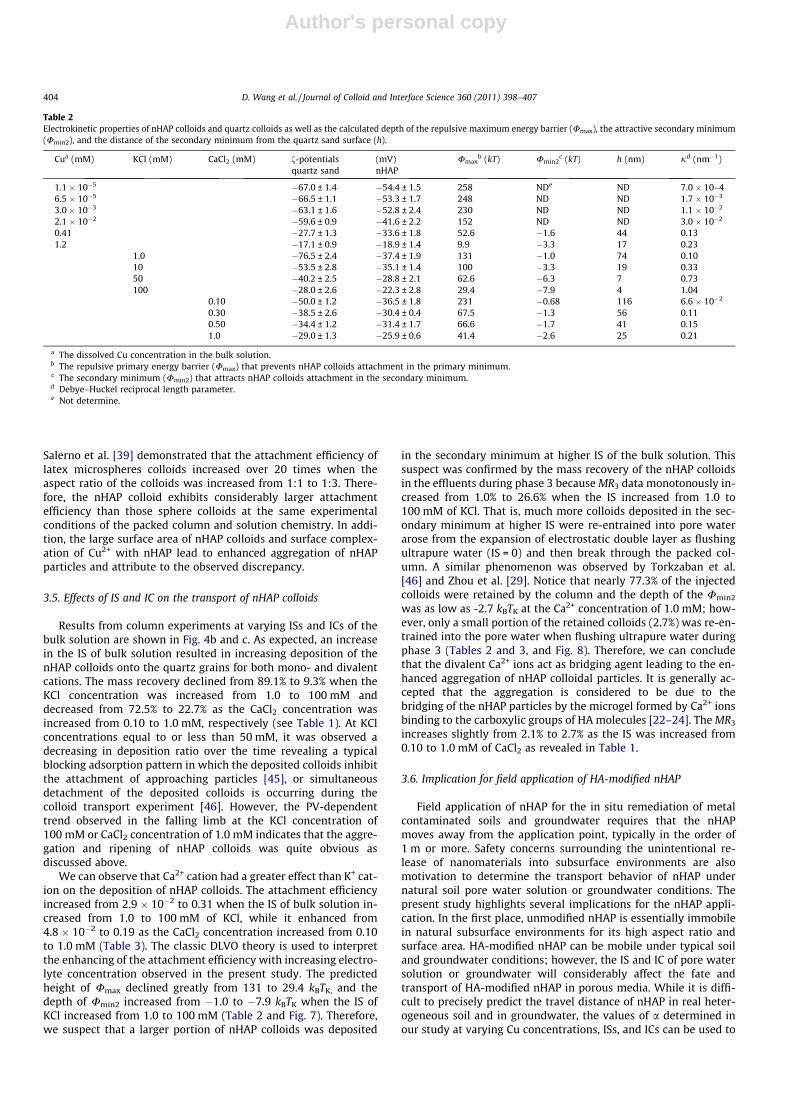
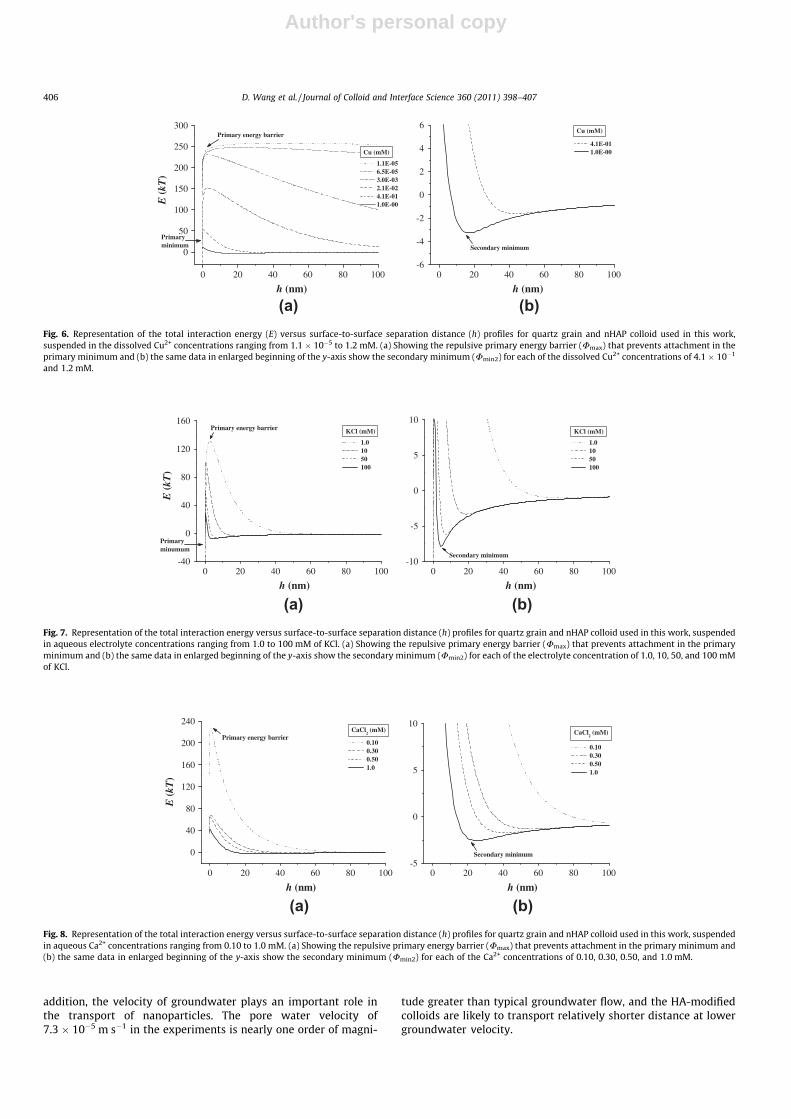
Table 2 and Fig. 6 summarize the calculated nHAP colloids–quartz colloids interaction energy from DLVO theory when the dis-solved Cu2+ concentrations in bulk solution are increased from1.1 � 10�5 to 1.2 mM. The total interaction energy is plotted interms of kBTK, where kB is the Boltzmann constant and Tk is abso-lute temperature. It is generally accepted that at large separationdistances (>50 nm), the nHAP colloids do not ‘‘feel’’ the quartz sur-face [43]. As a particle approaches to the quartz grain, it first expe-riences a weak attractive force (described as the secondaryminimum, Umin2) and then encounters a substantial repulsive en-ergy barrier (the maximum energy barrier, Umax) that preventsthe attachment of nHAP colloids in the primary minimum. The pre-dicted height of the Umax declines from 258 to 9.9 kBTK when thedissolved Cu2+ concentration was increased from 1.1 � 10�5 to1.2 mM. Meanwhile, the depth of the Umin2 increases from �1.6to �3.3 kBTK when the concentration of dissolved Cu2+ concentra-tion was increased from 0.41 to 1.2 mM. It is therefore that thenHAP colloids suspended in the lowest dissolved Cu2+ concentra-tion in bulk solution experience the greatest extent of repulsionupon approach to the grain surface and consequently exhibit thelowest degree of retention in the column experiments. As the dis-solved Cu2+ concentration is as high as 0.41 mM, both nHAP col-loids and quartz colloids are less negatively charged and arelatively shallower Umin2 of �1.6 kBTK is present at the separationdistance of 44 nm (Table 2). Therefore, we suspect that a small por-tion of the injected nHAP colloids is deposited in the secondaryminimum because the experimental observation shows a sharppeak of colloid release (Ci/C0 = 0.26) upon virtually complete re-moval of the secondary minimum when flushing ultrapure water(IS = 0) during phase 2 [14]. In fact, the release of previously depos-ited colloidal particles through lowering bulk solution IS has beenused as supportive evidence for particles deposited in the second-ary minimum [44]. At the highest dissolved Cu concentration, theheight of Umax is as low as 9.9 kBTK and the depth of Umin2 attains-3.3 kBTK. There must be a large portion of nHAP colloids that is re-tained in the primary and secondary minimum well. However, al-most no colloid is detected in the effluent during the wholetransport experiment. Apparently, the calculated attachment effi-ciency at the Cu concentration of 1.2 mM (a = 1.0, Fig. 5) deviatesfrom the prediction of classic DLVO theory and is greatly largerthan the results observed by Chen and Elimelech [22], and Pellyand Tufenkji [43] who selected colloids at the same diameter of100 nm. Several potential explanations on the specific physico-chemical properties of the nHAP used in the experiment are attrib-uted to the observed discrepancy. Firstly, the Cu2+ ions stronglycompete and exchange with Ca2+ ions of nHAP, which cause rela-tively a large portion of Ca2+ releasing into the bulk solution. SuchCa2+ ions lead to enhanced aggregation due to the bridging of thenHAP colloidal particles by the microgels formed by the Ca-medi-ated bridging of HA [22–24]. In the second place, the large aspectratio (1:5) of the nHAP colloids used in the transport experimentis another key factor because the shape of the colloidal particlewas considered as sphere by the prediction of classic DLVO theory.
10.1-80
-70
-60
-50
-40
-30
-20
-10 nHAP Quartz sand
CaCl2 concentration (mM)
Zet
a po
tent
ial (
mV
)
-80
-70
-60
-50
-40
-30
-20
-10 nHAP Quartz sand
Zet
a po
tent
ial (
mV
)
Cu concentration (mM)
1E-5 1E-4 1E-3 0.01 0.1 1
1 10 100
-80
-70
-60
-50
-40
-30
-20
-10 nHAP Quartz sand
Zet
a po
tent
ial (
mV
)
NaCl Concentration (mM)
(a)
(b)
(c)
Fig. 3. f-potentials of nHAP colloidal particles and quartz colloids as a function ofCu concentrations (a) at pH 6.0, KCl concentrations (b) at pH 5.8 ± 0.2, and CaCl2
concentrations (c) at pH 5.8 ± 0.1 in the presence of 10 mg L�1 HA. Error barrepresents the standard deviation.
D. Wang et al. / Journal of Colloid and Interface Science 360 (2011) 398–407 403
Author's personal copy
Salerno et al. [39] demonstrated that the attachment efficiency oflatex microspheres colloids increased over 20 times when theaspect ratio of the colloids was increased from 1:1 to 1:3. There-fore, the nHAP colloid exhibits considerably larger attachmentefficiency than those sphere colloids at the same experimentalconditions of the packed column and solution chemistry. In addi-tion, the large surface area of nHAP colloids and surface complex-ation of Cu2+ with nHAP lead to enhanced aggregation of nHAPparticles and attribute to the observed discrepancy.
3.5. Effects of IS and IC on the transport of nHAP colloids
Results from column experiments at varying ISs and ICs of thebulk solution are shown in Fig. 4b and c. As expected, an increasein the IS of bulk solution resulted in increasing deposition of thenHAP colloids onto the quartz grains for both mono- and divalentcations. The mass recovery declined from 89.1% to 9.3% when theKCl concentration was increased from 1.0 to 100 mM anddecreased from 72.5% to 22.7% as the CaCl2 concentration wasincreased from 0.10 to 1.0 mM, respectively (see Table 1). At KClconcentrations equal to or less than 50 mM, it was observed adecreasing in deposition ratio over the time revealing a typicalblocking adsorption pattern in which the deposited colloids inhibitthe attachment of approaching particles [45], or simultaneousdetachment of the deposited colloids is occurring during thecolloid transport experiment [46]. However, the PV-dependenttrend observed in the falling limb at the KCl concentration of100 mM or CaCl2 concentration of 1.0 mM indicates that the aggre-gation and ripening of nHAP colloids was quite obvious asdiscussed above.
We can observe that Ca2+ cation had a greater effect than K+ cat-ion on the deposition of nHAP colloids. The attachment efficiencyincreased from 2.9 � 10�2 to 0.31 when the IS of bulk solution in-creased from 1.0 to 100 mM of KCl, while it enhanced from4.8 � 10�2 to 0.19 as the CaCl2 concentration increased from 0.10to 1.0 mM (Table 3). The classic DLVO theory is used to interpretthe enhancing of the attachment efficiency with increasing electro-lyte concentration observed in the present study. The predictedheight of Umax declined greatly from 131 to 29.4 kBTK, and thedepth of Umin2 increased from �1.0 to �7.9 kBTK when the IS ofKCl increased from 1.0 to 100 mM (Table 2 and Fig. 7). Therefore,we suspect that a larger portion of nHAP colloids was deposited
in the secondary minimum at higher IS of the bulk solution. Thissuspect was confirmed by the mass recovery of the nHAP colloidsin the effluents during phase 3 because MR3 data monotonously in-creased from 1.0% to 26.6% when the IS increased from 1.0 to100 mM of KCl. That is, much more colloids deposited in the sec-ondary minimum at higher IS were re-entrained into pore waterarose from the expansion of electrostatic double layer as flushingultrapure water (IS = 0) and then break through the packed col-umn. A similar phenomenon was observed by Torkzaban et al.[46] and Zhou et al. [29]. Notice that nearly 77.3% of the injectedcolloids were retained by the column and the depth of the Umin2
was as low as -2.7 kBTK at the Ca2+ concentration of 1.0 mM; how-ever, only a small portion of the retained colloids (2.7%) was re-en-trained into the pore water when flushing ultrapure water duringphase 3 (Tables 2 and 3, and Fig. 8). Therefore, we can concludethat the divalent Ca2+ ions act as bridging agent leading to the en-hanced aggregation of nHAP colloidal particles. It is generally ac-cepted that the aggregation is considered to be due to thebridging of the nHAP particles by the microgel formed by Ca2+ ionsbinding to the carboxylic groups of HA molecules [22–24]. The MR3
increases slightly from 2.1% to 2.7% as the IS was increased from0.10 to 1.0 mM of CaCl2 as revealed in Table 1.
3.6. Implication for field application of HA-modified nHAP
Field application of nHAP for the in situ remediation of metalcontaminated soils and groundwater requires that the nHAPmoves away from the application point, typically in the order of1 m or more. Safety concerns surrounding the unintentional re-lease of nanomaterials into subsurface environments are alsomotivation to determine the transport behavior of nHAP undernatural soil pore water solution or groundwater conditions. Thepresent study highlights several implications for the nHAP appli-cation. In the first place, unmodified nHAP is essentially immobilein natural subsurface environments for its high aspect ratio andsurface area. HA-modified nHAP can be mobile under typical soiland groundwater conditions; however, the IS and IC of pore watersolution or groundwater will considerably affect the fate andtransport of HA-modified nHAP in porous media. While it is diffi-cult to precisely predict the travel distance of nHAP in real heter-ogeneous soil and in groundwater, the values of a determined inour study at varying Cu concentrations, ISs, and ICs can be used to
Table 2Electrokinetic properties of nHAP colloids and quartz colloids as well as the calculated depth of the repulsive maximum energy barrier (Umax), the attractive secondary minimum(Umin2), and the distance of the secondary minimum from the quartz sand surface (h).
Cua (mM) KCl (mM) CaCl2 (mM) f-potentials (mV) Umaxb (kT) Umin2
c (kT) h (nm) jd (nm�1)quartz sand nHAP
1.1 � 10�5 �67.0 ± 1.4 �54.4 ± 1.5 258 NDe ND 7.0 � 10–46.5 � 10�5 �66.5 ± 1.1 �53.3 ± 1.7 248 ND ND 1.7 � 10�3
3.0 � 10�3 �63.1 ± 1.6 �52.8 ± 2.4 230 ND ND 1.1 � 10�2
2.1 � 10�2 �59.6 ± 0.9 �41.6 ± 2.2 152 ND ND 3.0 � 10�2
0.41 �27.7 ± 1.3 �33.6 ± 1.8 52.6 �1.6 44 0.131.2 �17.1 ± 0.9 �18.9 ± 1.4 9.9 �3.3 17 0.23
1.0 �76.5 ± 2.4 �37.4 ± 1.9 131 �1.0 74 0.1010 �53.5 ± 2.8 �35.1 ± 1.4 100 �3.3 19 0.3350 �40.2 ± 2.5 �28.8 ± 2.1 62.6 �6.3 7 0.73100 �28.0 ± 2.6 �22.3 ± 2.8 29.4 �7.9 4 1.04
0.10 �50.0 ± 1.2 �36.5 ± 1.8 231 �0.68 116 6.6 � 10�2
0.30 �38.5 ± 2.6 �30.4 ± 0.4 67.5 �1.3 56 0.110.50 �34.4 ± 1.2 �31.4 ± 1.7 66.6 �1.7 41 0.151.0 �29.0 ± 1.3 �25.9 ± 0.6 41.4 �2.6 25 0.21
a The dissolved Cu concentration in the bulk solution.b The repulsive primary energy barrier (Umax) that prevents nHAP colloids attachment in the primary minimum.c The secondary minimum (Umin2) that attracts nHAP colloids attachment in the secondary minimum.d Debye–Huckel reciprocal length parameter.e Not determine.
404 D. Wang et al. / Journal of Colloid and Interface Science 360 (2011) 398–407
Author's personal copy
determine the relatively mobility of the HA-modified nHAP col-loids. The travel distance (LT), required to remove 99% of theHA-modified nHAP for initial suspension Cu2+ concentration rang-ing from 1.0 � 10�3 to 1.3 mM, declines dramatically from 8.9 to0.10 m (see Table 3). Vulkan et al. [47] reported that the concen-trations of dissolved Cu2+ and IS in the pore water solution of
contaminated soils collected from different countries varied sig-nificantly from 1.6 � 10�4 to 0.30 mM and 10 to 50 mM, respec-tively. Therefore, even at the highest IS of 50 mM and dissolvedCu2+ concentration of 0.30 mM, the HA-modified nHAP particlesare likely to transport in neutral or alkaline soil pore watersolutions. In acid soils, low pH and pAl3+ favor dissolution ofnHAP and the formation of other minerals (i.e., variscite) [48].Secondly, the values of LT for the HA-modified nHAP decreasefrom 4.5 to 0.41 m when the IS increased from 1.0 to 100 mMof KCl and declined from 2.6 to 0.69 m as the CaCl2 concentrationwas increased from 0.10 to 1.0 mM. In typical groundwater con-taining 0.5–1.0 mM of Ca2+ or Mg2+ [17], large molecular weightpolyelectrolytes such as FA provide electrostatic repulsions, stericrepulsions [12,13], and hydrophobic interactions [24] that inhibitattachment of nanoparticles to aquifer and consequently enhanceits mobility. However, in the presence of polyelectrolytes ofalginate, the attachment efficiency of nanoparticles was enhanceddue to the formation of the alginate gel network that bridged thenanoparticles under high Ca2+ concentration conditions [23].Therefore, the HA-modified nHAP is unlikely to implement theremediation of contaminated groundwater, which simultaneouslypossessed relatively a larger amount of Ca2+ and alginate. In
0.0
0.2
0.4
0.6
0.8
1.0 Phase 2
1.0*10-3
1.0*10-2
5.0*10-2
0.10 0.50 1.0
Ci/C
0
Phase 1
Cu concentration (mM)
0.0
0.2
0.4
0.6
0.8
1.0
1 10 50 100
Phase 1 Phase 2 Phase 3
KCl (mM)
Ci/C
0
0 1 2 3 4 5 6 7 8 9 10 11 12 13
0 1 2 3 4 5 6 7 8 9 10 11
0 1 2 3 4 5 6 7 8 9 10
0.0
0.2
0.4
0.6
0.8
1.0
PV
0.10 0.30 0.50 1.0
CaCl2 (mM)
Phase 1 Phase 2 Phase 3
Ci/C
0
(a)
(b)
(c)
Fig. 4. Representative breakthrough curves of nHAP as a function of pore volumes(PVs) at varying Cu concentrations (a) at pH 6.0, KCl concentrations (b) at pH5.8 ± 0.2, and CaCl2 concentrations (c) at pH 5.8 ± 0.1 in the presence of 10 mg L�1
HA. Each data point represents the average value determined from all experimentsconducted at a given IS.
-3 -2 -1 0 1 20.0
0.1
0.2
0.3
0.4
0.5
0.6
0.7
0.8
0.9
1.0
1.1
α
lg10
IS
CuCl2 NaCl CaCl2
Fig. 5. Influence of Cu, IS, and IC on the attachment efficiency of nHAP in the quartzpacked column. Each data represent the average value determined from allexperiments conducted at a given IS. Error bar represents the standard deviation.
Table 3Physical and calculated parameters for packed-bed column experiments.
Expa Lengthb (cm) hc MR12d (%) g0
e af LTg (m)
1 20.2 0.39 92.4 0.27 1.2 � 10�2 8.92 20.2 0.39 92.2 0.28 1.7 � 10�2 6.13 20.0 0.38 84.3 0.26 2.0 � 10�2 5.54 20.0 0.38 82.6 0.27 2.2 � 10�2 4.85 20.0 0.39 26.3 0.27 0.15 0.706 20.0 0.39 0.01 0.28 1.0 0.107 20.2 0.40 89.1 0.23 2.9 � 10�2 4.58 20.2 0.41 65.3 0.25 6.3 � 10�2 2.09 20.2 0.39 41.0 0.23 0.14 0.92
10 20.2 0.40 9.3 0.24 0.31 0.4111 20.0 0.39 72.5 0.24 4.8 � 10�2 2.612 20.0 0.40 66.8 0.24 5.8 � 10�2 2.213 20.2 0.39 61.2 0.24 6.9 � 10�2 1.814 20.2 0.40 22.7 0.24 0.19 0.69
a The experimental conditions as described in Table 1.b Length of the packed column.c Porosity of the packed column.d Mass recovery as described in Table 1.e The theoretical single collector contact efficiency (g0).f The attachment efficiency (a).g The relative travel distance (LT) as described in the data analysis section.
D. Wang et al. / Journal of Colloid and Interface Science 360 (2011) 398–407 405
Author's personal copy
addition, the velocity of groundwater plays an important role inthe transport of nanoparticles. The pore water velocity of7.3 � 10�5 m s�1 in the experiments is nearly one order of magni-
tude greater than typical groundwater flow, and the HA-modifiedcolloids are likely to transport relatively shorter distance at lowergroundwater velocity.
0
50
100
150
200
250
300
E (
kT)
h (nm)
1.1E-05 6.5E-05 3.0E-03 2.1E-02 4.1E-01 1.0E-00
Cu (mM)
Primary energy barrier
Primaryminimum
0 20 40 60 80 100 0 20 40 60 80 100-6
-4
-2
0
2
4
6
h (nm)
4.1E-01 1.0E-00
Secondary minimum
Cu (mM)
(a) (b)Fig. 6. Representation of the total interaction energy (E) versus surface-to-surface separation distance (h) profiles for quartz grain and nHAP colloid used in this work,suspended in the dissolved Cu2+ concentrations ranging from 1.1 � 10�5 to 1.2 mM. (a) Showing the repulsive primary energy barrier (Umax) that prevents attachment in theprimary minimum and (b) the same data in enlarged beginning of the y-axis show the secondary minimum (Umin2) for each of the dissolved Cu2+ concentrations of 4.1 � 10�1
and 1.2 mM.
-40
0
40
80
120
160
E (
kT)
h (nm)
1.0 10 50 100
KCl (mM)Primary energy barrier
Primaryminumum
0 20 40 60 80 100 0 20 40 60 80 100-10
-5
0
5
10
h (nm)
1.0 10 50 100
KCl (mM)
Secondary minimum
(a) (b)Fig. 7. Representation of the total interaction energy versus surface-to-surface separation distance (h) profiles for quartz grain and nHAP colloid used in this work, suspendedin aqueous electrolyte concentrations ranging from 1.0 to 100 mM of KCl. (a) Showing the repulsive primary energy barrier (Umax) that prevents attachment in the primaryminimum and (b) the same data in enlarged beginning of the y-axis show the secondary minimum (Umin2) for each of the electrolyte concentration of 1.0, 10, 50, and 100 mMof KCl.
0
40
80
120
160
200
240
E (
kT)
h (nm)
0.10 0.30 0.50 1.0
CaCl2 (mM)
Primary energy barrier
0 20 40 60 80 100 0 20 40 60 80 100-5
0
5
10
h (nm)
0.10 0.30 0.50 1.0
CaCl2 (mM)
Secondary minimum
(a) (b)Fig. 8. Representation of the total interaction energy versus surface-to-surface separation distance (h) profiles for quartz grain and nHAP colloid used in this work, suspendedin aqueous Ca2+ concentrations ranging from 0.10 to 1.0 mM. (a) Showing the repulsive primary energy barrier (Umax) that prevents attachment in the primary minimum and(b) the same data in enlarged beginning of the y-axis show the secondary minimum (Umin2) for each of the Ca2+ concentrations of 0.10, 0.30, 0.50, and 1.0 mM.
406 D. Wang et al. / Journal of Colloid and Interface Science 360 (2011) 398–407
Author's personal copy
4. Conclusions
Column experiments were conducted to determine the effectsof Cu concentration, IS, and IC on the transport behavior ofHA-modified nHAP in saturated packed columns. An increase insolution IS results in greater deposition, which is revealed by theattachment efficiency (a). The result is consistent with theprediction by classic DLVO theory. Regarding to the effect of cat-ions, the divalent Ca2+ cation has a greater effect than monovalentK+ cation on the deposition of the HA-modified nHAP colloids dueto its effectively screening the surface charge of nHAP and bridgingwith the nHAP particles. As to the contaminant, Cu, the attachmentefficiency increased dramatically with increasing initial suspensionCu concentration. Moreover, it is important to note that the Cu2+
ions have a greater effect on the transport behavior thanCa2+ and K+ cations for its strong competition and exchange withCa2+ of nHAP and its surface complexation with nHAP, whichgreatly enhanced the deposition of the nHAP. The relative traveldistance, LT, ranges from less than one to several meters at varyingCu concentrations, ISs, and ICs in saturated packed columns. Theresults presented above are crucial to evaluate the efficacy of nHAPon the remediation of contaminated soil and groundwaterenvironments.
Acknowledgments
This research was supported by the Knowledge Innovative Pro-ject of Chinese Academy of Sciences (KZCX2-YW-Q02-02), the Na-tional Basic Research and Development Program (2007CB936604),and the Open Fund of the State Key Laboratory of Soil and Sustain-able Agriculture (Y052010027). We are grateful to the critical re-view of Dr. J. Eugenio Lopez (University of Vigo) that led torevision and substantial improvement of this manuscript. We alsothank Dr. Jun Jiang (Institute of Soil Science, Chinese Academy ofSciences) for assistance with measurement of the f-potentials ofnHAP and quartz colloids.
References
[1] R. Taylor, J.P. Hare, A.K. Abdulsada, H.W. Kroto, J. Chem. Soc., Chem. Commun.(1990) 1423.
[2] M. Akao, H. Aoki, K. Kato, J. Mater. Sci. 16 (1981) 809.[3] W. Suchanek, M. Yoshimura, J. Mater. Res. 13 (1998) 94.[4] M.C. Branco, J.P. Schneider, Acta Biomater. 5 (2009) 817.[5] J.H. Chen, Y.J. Wang, D.M. Zhou, Y.X. Cui, S.Q. Wang, Y.C. Chen, Environ. Prog.
Sustain 29 (2010) 233.[6] E. Mavropoulos, A.M. Rossi, A.M. Costa, C.A.C. Perez, J.C. Moreira, M. Saldanha,
Environ. Sci. Technol. 36 (2002) 1625.[7] J. Boisson, A. Ruttens, M. Mench, J. Vangronsveld, Environ. Pollut. 104 (1999)
225.
[8] Q.Y. Ma, S.J. Traina, T.J. Logan, J.A. Ryan, Environ. Sci. Technol. 28 (1994) 1219.[9] R.R. Sheha, J. Colloid Interf. Sci. 310 (2007) 18.
[10] I. Smiciklas, S. Dimovic, I. Plecas, M. Mitric, Water Res. 40 (2006) 2267.[11] L.Y. Chu, D.J. Wang, Y.J. Wang, Y.B. Si, D.M. Zhou, Environ. Sci. 32 (2011) 98
(in Chinese).[12] E. Illes, E. Tombacz, J. Colloid Interf. Sci. 295 (2006) 115.[13] S.E. Mylon, K.L. Chen, M. Elimelech, Langmuir 20 (2004) 9000.[14] A. Franchi, C.R. O’Melia, Environ. Sci. Technol. 37 (2003) 1122.[15] J.M. Wan, T.K. Tokunaga, J. Colloid Interf. Sci. 247 (2002) 54.[16] D.R. Vucinic, D.S. Radulovic, S.D. Deusic, J. Colloid Interf. Sci. 343 (2010) 239.[17] N. Saleh, H.J. Kim, T. Phenrat, K. Matyjaszewski, R.D. Tilton, G.V. Lowry,
Environ. Sci. Technol. 42 (2008) 3349.[18] B. Espinasse, E.M. Hotze, M.R. Wiesner, Environ. Sci. Technol. 41 (2007) 7396.[19] D. Grolimund, M. Elimelech, M. Borkovec, K. Barmettler, R. Kretzschmar, H.
Sticher, Environ. Sci. Technol. 32 (1998) 3562.[20] B. Derjaguin, L. Landau, Prog. Surf. Sci. 43 (1993) 30.[21] E.J.W. Verwey, J.T.G. Overbeek, Theory of the stability of lyophobic colloids,
Elsevier, Amsterdam, 1948.[22] K.L. Chen, M. Elimelech, J. Colloid Interf. Sci. 309 (2007) 126.[23] X.Y. Liu, M. Wazne, Y. Han, C. Christodoulatos, K.L. Jasinkiewicz, J. Colloid
Interf. Sci. 348 (2010) 101.[24] T. Abe, S. Kobayashi, M. Kobayashi, Colloids Surf. A: Physicochem. Eng. Aspects
2010, doi: 10.1016/j.colsurfa.2010.11.052.[25] A. Abramson, D.G. Brown, Water Res. 41 (2007) 4435.[26] R.A. Akbour, J. Douch, M. Hamdani, P. Schmitz, J. Colloid Interf. Sci. 253 (2002)
1.[27] R.K. Lu, Analysis method of the soil agriculture chemistry, China Agriculture
Science and Technology Press, Beijing, China, 2000 (in Chinese).[28] R.J. Hunter, Zeta potential in colloid science. Principles and applications,
Academic Press, New York, 1981.[29] D.M. Zhou, D.J. Wang, L. Cang, X.Z. Hao, L.Y. Chu, J. Soils Sed. 11 (2011) 491.[30] N. Toride, F.J. Leij, M. Th. Van Genuchten, The CXTFIT code for estimating
transport parameters from laboratory or field tracer experiments. Version 2.1,US Salinity Laboratory, Agricultural Research Service, US Department ofAgriculture, Riverside, California, US, 1999.
[31] R.W. Harvey, S.P. Garabedian, Environ. Sci. Technol. 25 (1991) 178.[32] N. Tufenkji, M. Elimelech, Environ. Sci. Technol. 38 (2004) 529.[33] H.F. Lecoanet, J.Y. Bottero, M.R. Wiesner, Environ. Sci. Technol. 38 (2004) 5164.[34] J. Gregory, J. Colloid Interf. Sci. 83 (1981) 138.[35] R. Hogg, T.W. Healy, Dw. Fuersten, Trans. Faraday Soc. 62 (1966) 1638.[36] L. Zeng, H.B. Wang, G.X. Fu, J.W. Jiang, X.F. Zhang, J. Colloid Interf. Sci. 352
(2010) 36.[37] Y.J. Wang, J.H. Chen, Y.X. Cui, S.Q. Wang, D.M. Zhou, J. Hazard. Mater. 162
(2009) 1135.[38] W.P. Inskeep, J.C. Silvertooth, Soil Sci. Soc. Am. J. 52 (1988) 941.[39] J.G. Hering, F.M.M. Morel, Environ. Sci. Technol. 22 (1988) 1234.[40] M. Elimelech, J. Gregory, X. Jia, R.A. Williams, Particle Deposition and
Aggregation: Measurement Modeling and Simulation, Butterworth-Heinemann Ltd, Oxford, 1995.
[41] K.L. Chen, M. Elimelech, Langmuir 22 (2006) 10994.[42] R.J. Hunter, Foundations of Colloid Science, Oxford University Press, Oxford,
1986.[43] A.J. Pelley, N. Tufenkji, J. Colloid Interf. Sci. 321 (2008) 74.[44] N. Tufenkji, M. Elimelech, Langmuir 21 (2005) 841.[45] M. Elimelech, C.R. O’Melia, Environ. Sci. Technol. 24 (1990) 1528.[46] S. Torkzaban, S.S. Tazehkand, S.L. Walker, S.A. Bradford, Water Resour. Res. 44
(2008).[47] R. Vulkan, F.J. Zhao, V. Barbosa-Jefferson, S. Preston, G.I. Paton, E. Tipping, S.P.
McGrath, Environ. Sci. Technol. 34 (2000) 5115.[48] W.L. Lindsay, Chemical equilibria in soils, John Wiley & Sons, New York, USA,
1979. p. 449.
D. Wang et al. / Journal of Colloid and Interface Science 360 (2011) 398–407 407