Embed Size (px)
Citation preview

General rights Copyright and moral rights for the publications made accessible in the public portal are retained by the authors and/or other copyright owners and it is a condition of accessing publications that users recognise and abide by the legal requirements associated with these rights.
Users may download and print one copy of any publication from the public portal for the purpose of private study or research.
You may not further distribute the material or use it for any profit-making activity or commercial gain
You may freely distribute the URL identifying the publication in the public portal If you believe that this document breaches copyright please contact us providing details, and we will remove access to the work immediately and investigate your claim.
Downloaded from orbit.dtu.dk on: Sep 22, 2022
Technological, political and economic changes and their implications for the evolutionof broadcasting services- a political economy of digital broadcasting
Tadayoni, Reza
Publication date:2000
Document VersionPublisher's PDF, also known as Version of record
Link back to DTU Orbit
Citation (APA):Tadayoni, R. (2000). Technological, political and economic changes and their implications for the evolution ofbroadcasting services: - a political economy of digital broadcasting. CTI Ph.D series No. 1

Chapter 1: Introduction i
Technological, political and economic changes and their implications for the evolution of broadcasting services
- A political economy of digital broadcasting
Ph.D. thesis
By
Reza Tadayoni
Center for Tele-Information Technical University of Denmark
November 2000
Tutor: Knud Erik Skouby

Chapter 1: Introduction i
Preface The subject of this Ph.D. thesis is changes in the market for broadcasting services as a result of technological, political, and economic drivers. Broadcasting services can be categorised as a part of the ICT-based information and knowledge intensive services that have gone through radical changes in the last couple of decades. The aim of this report is to give an in-depth analysis of the evolution of the broadcasting market from the traditional organisation models to the more market oriented modern organisation models.
This thesis is part of a broader research project on Service development, Internationalisation and development of Competencies (SIC) and the study of the broadcasting market is, in this context, a case study of the general changes in the service industries. Participating in the SIC project running from 1997 to 2000 were researchers from Roskilde University Center (RUC), Technical University of Denmark (DTU), the Danish Technological Institute (DTI) and Copenhagen Business School (CBS). During the project period, I have further participated in two major projects with high relevance for the subject of this thesis and providing input to it: 1) A study of the development of digital TV in Europe. The project was led by the French institute, IDATE, and collected quantitative and qualitative data on digital TV in the 15 EU countries with the aim to analyse the roll-out of digital services and the development of different infrastructures. 2) A techno -economic study of different aspects of introduction of terrestrial digital broadcasting in Denmark, as a part of the working group on digital radio and TV appointed by the Ministry of Culture in Denmark. The thesis contains two parts. The first part comprises three chapters (chapter 2, chapter 3, and chapter 4) containing analysis of the regulatory framework, economy, and technology of broadcasting at a theoretical level. The second part contains an empirical analysis of digital broadcasting structured in four chapters (chapter 6 to chapter 10), where digital broadcasting is analysed with respect to: resource issues, access issues, new business models and funding issues, and emergence of new services and the convergence process. Between these two parts, chapter 5 summarises the theoretical analysis of the impact of the interrelation between technological, political, and economic parameters and also introduces the empirical part of the project. The Ph.D. study has been located at Center for Tele-Information, Technical University of Denmark, and is funded by the SIC project, which is a part of the Danish Research Programme, Human Resources in the Working Life.
I will use the opportunity to express my thanks to my tutor, Knud Erik Skouby. Furthermore, I will thank Anders Henten for his fruitful discussions and comments throughout the thesis, which has been a big help in different phases of the project. Finally, I will thank Osa Bennett, for kindly reading the proofs of this text.
November 2000
Reza Tadayoni

ii
Table of contents 1. Introduction ...................................................................1
1.1 The digital broadcasting case ......................................................... 4 1.2 Methodology ............................................................................ 6
1.2.1 Theory..........................................................................................................................................8 1.2.2 Empirical data.............................................................................................................................9
1.3 Structure ............................................................................... 9 2. Regulatory framework of broadcasting in Europe and the US, a historical analysis ................................................................ 11
2.1 A general overview of broadcasting history .........................................12 2.1.1 Terrestrial broadcasting ....................................................................................................... 12 2.1.2 Cable ........................................................................................................................................... 13 2.1.3 Satellite..................................................................................................................................... 14
2.2 Europe..................................................................................15 2.2.1 Short history............................................................................................................................ 16 2.2.2 Public service broadcasting ................................................................................................... 17 2.2.3 European regulation................................................................................................................. 21 2.2.4 Regulation of satellite and cable platforms...................................................................... 24
2.3 US ......................................................................................25 2.3.1 Short history........................................................................................................................... 26 2.3.2 Structure and ownership ...................................................................................................... 27 2.3.3 Actors ....................................................................................................................................... 28 2.3.4 The structure of regulation of broadcasting.................................................................... 31 2.3.5 Regulation of ownership and content in The Telecommunications Act of 1996........ 33 2.3.6 Regulation of satellite and cable platforms...................................................................... 35
2.4 Conclusion ..............................................................................36 3. Broadcasting economics..................................................... 38
3.1 The broadcasting market .............................................................42 3.1.1 Market structures.................................................................................................................. 42 3.1.2 Discrete quality models......................................................................................................... 47 3.1.3 Continuous quality model ....................................................................................................... 50
3.2 Market failure .........................................................................54 3.2.1 Public good................................................................................................................................ 55 3.2.2 Externalities ............................................................................................................................ 57 3.2.3 Natural monopoly .................................................................................................................... 59 3.2.4 Asymmetrical information ..................................................................................................... 61 3.2.5 Radio spectrum........................................................................................................................ 62 3.2.6 Content issues ......................................................................................................................... 64
3.3 Conclusion ..............................................................................66 4. Digital broadcasting, technology and service ............................. 68
4.1 Analogue broadcasting.................................................................69 4.1.1 Value chain of analogue broadcasting................................................................................. 69 4.1.2 Analogue TV systems .............................................................................................................. 71 4.1.3 Distribution and contribution networks ............................................................................ 74 4.1.4 Delivery networks.................................................................................................................... 81 4.1.5 Technological drivers towards Digital broadcasting ...................................................... 86
4.2 Digital broadcasting ...................................................................87 4.2.1 Value chain of digital broadcasting .................................................................................... 88

iii
4.2.2 Basic technologies .................................................................................................................. 89 4.2.3 Access technologies ..............................................................................................................100 4.2.4 Delivery networks..................................................................................................................105 4.2.5 Service provision and multiplexing.....................................................................................107
4.3 Service development in digital broadcasting ....................................... 107 4.3.1 Interactivity...........................................................................................................................107 4.3.2 Provision of traditional broadcastings services.............................................................. 110 4.3.3 Advanced broadcastings services ...................................................................................... 110 4.3.4 Data services .......................................................................................................................... 110
4.4 Convergence.......................................................................... 113 4.5 Conclusion ............................................................................ 114
5. Leaving the traditional broadcasting model..............................117 5.1 Traditional broadcasting model .................................................... 117 5.2 Development of traditional broadcasting models .................................. 119 5.3 The modern market-oriented broadcasting model ................................ 120 5.4 Current and future digital market; the problems addressed in the empirical chapters....................................................................................... 121
6. Resource issues ............................................................123 6.1 Level of development of cable and satellite delivery networks .................. 123
6.1.1 Satellite...................................................................................................................................124 6.1.2 Cable .........................................................................................................................................126 6.1.3 Satellite and cable.................................................................................................................128
6.2 Assignment and organisation of resources in terrestrial networks............... 129 6.2.1 HDTV versus multi-service allocation ...............................................................................130 6.2.2 Organisation forms of multiplex function........................................................................130 6.2.3 Development of terrestrial delivery networks ...............................................................132
6.3 Simulcasting.......................................................................... 137 6.4 Using other infrastructures......................................................... 137 6.5 Complementarity and competitiveness of infrastructures, the Danish case ..... 138 6.6 The US case ......................................................................... 141
6.6.1 Level of development of cable and satellite delivery networks .................................. 141 6.6.2 Assignment and organisation of resources in the terrestrial network .....................145 6.6.3 Simulcasting............................................................................................................................146 6.6.4 Using other infrastructures for broadcasting ...............................................................146 6.6.5 Complementarity and competitiveness of different infrastructures........................147
6.7 Conclusion ............................................................................ 147 7. Access issues...............................................................149
7.1 Access to the signal................................................................. 149 7.1.1 Infrastructure independency of set-top-boxes............................................................. 151 7.1.2 Portable and mobile reception ............................................................................................ 151 7.1.3 Interactivity...........................................................................................................................152 7.1.4 Ease of accessibility .............................................................................................................152
7.2 Access to the content .............................................................. 153 7.2.1 Conditional Access (CA) .......................................................................................................153 7.2.2 Application Program Interface (API)................................................................................156 7.2.3 Electronic Program Guide (EPG) .........................................................................................159 7.2.4 Free to air compatibility of Set-Top-Boxes....................................................................159
7.3 Conclusion ............................................................................ 159 8. Market development and funding issues..................................162

iv
8.1 Market for broadcasting services .................................................. 162 8.1.1 Nordic countries....................................................................................................................162 8.1.2 The US .....................................................................................................................................165 8.1.3 Funding public service broadcasting in digital age .........................................................166
8.2 Structure of the market for digital TV ........................................... 167 8.2.1 Horizontal concentration .....................................................................................................168 8.2.2 Vertical integration / affiliation ........................................................................................169 8.2.3 Competition between infrastructure.................................................................................170 8.2.4 New models for service provision ......................................................................................170
8.3 Conclusion ............................................................................ 171 9. Emergence of new services and convergence ............................173
9.1 New services in digital broadcasting platforms ................................... 174 9.1.1 Innovative services ...............................................................................................................177
9.2 Internet on TV, a solution to information divide ................................. 177 9.3 TV on Internet ...................................................................... 178 9.4 Regulatory implications .............................................................. 179 9.5 Conclusion ............................................................................ 180
10. Conclusion ................................................................181 10.1 Economy .............................................................................. 181 10.2 History ............................................................................... 182 10.3 Digitalisation ......................................................................... 184
11. References ...............................................................186 Summary.........................................................................192 Resumé...........................................................................199
Table of Appendixes Appendix I: Basic data Appendix II: Development of infrastructures Appendix III: Access issues Appendix IV: Available services Appendix V: Financing statistics Appendix VI: Vertical integration Appendix VII: Organisations and standards related to digital TV
Table of Figure Figure 1-1 Theoretical framework...................................................................................................................6 Figure 1-2 Methodological framework............................................................................................................7 Figure 2-1: Model for broadcast TV control.............................................................................................. 32 Figure 3-1 Broadcasting Industries in different market structures ................................................... 44 Figure 3-2 Two dimension market structure ............................................................................................. 45 Figure 3-3: Concentration ratios .................................................................................................................. 46
v
Figure 3-4 Discrete quality model................................................................................................................ 48 Figure 3-5 The continuous quality model in a market with one broadcaster ...................................... 50 Figure 3-6 With two broadcasters .............................................................................................................. 52 Figure 3-7 Considerations regarding cost .................................................................................................. 53 Figure 3-8 Quality model in a monopoly organisation............................................................................... 54 Figure 3-9 Elements in definition of media Good / service market...................................................... 65 Figure 3-10 Defining the market .................................................................................................................. 66 Figure 4-1 Value chain in analogue broadcasting ....................................................................................... 70 Figure 4-2 8 bit quantisation levels for component signals .................................................................... 76 Figure 4-3 European and North American Transmission Hierarchies .................................................. 77 Figure 4-4 Basic 34 Mbit/s Satellite Link configuration ......................................................................... 81 Figure 4-5 TV spectrum.................................................................................................................................. 82 Figure 4-6: TV2s main transmitters ............................................................................................................ 83 Figure 4-7 A diagram of SMATV system.................................................................................................... 84 Figure 4-8 Frequency bandwidth in relation to the number of channels............................................. 85 Figure 4-9 Satellite network ......................................................................................................................... 86 Figure 4-10 Value chain of digital broadcasting........................................................................................ 88 Figure 4-11 MPEG-2 TS Multiplexer ............................................................................................................ 92 Figure 4-12 PES and TS packet structures................................................................................................ 93 Figure 4-13 Multiple TS multiplexing........................................................................................................... 93 Figure 4-14 QPSK Constellation diagram .................................................................................................... 95 Figure 4-15 16-QAM constellation diagram................................................................................................ 96 Figure 4-16 CA at the supply site ................................................................................................................ 101 Figure 4-17 CA at the end-user’s site ........................................................................................................102 Figure 4-18 Digital Set-Top-Box .................................................................................................................104 Figure 4-19 IB and OOB networks ..............................................................................................................109 Figure 4-20 Convergence in value chain ..................................................................................................... 113 Figure 8-1 TV market in Denmark as absolute figures and as index....................................................163 Figure 8-2 TV market in Sweden as absolute figures and as index.....................................................164 Figure 8-3 TV market in Finland as absolute figures and as index ......................................................164 Figure 9-1 The available capacity at the end users site.........................................................................179
Table of tables Table 2-1 Different stages of broadcasting............................................................................................... 17 Table 2-2 Number of TV stations in USA .................................................................................................. 28 Table 2-3 TV networks in USA ..................................................................................................................... 28 Table 2-4 Development in financing public broadcasting in USA ........................................................... 31 Table 3-1: Types of Goods.............................................................................................................................. 56 Table 3-2 Frequency bands ............................................................................................................................ 63 Table 4-1 Characteristics of Broadcast satellite systems ..................................................................... 86 Table 4-2 Levels and profiles of MPEG-2.................................................................................................... 91 Table 4-3 Available bit rates (in Mbit/s) in a 8 MHz TV channel ......................................................... 98 Table 4-4 Modulation efficiency (Bit/s per Hz) for fixed Guard Interval = 1/32............................ 98 Table 4-5 Typical net bit-rates .................................................................................................................... 99 Table 4-6 Service Information ..................................................................................................................... 111 Table 6-1 Development of access to satellite networks in Denmark ...................................................124

vi
Table 6-2 Development of access to satellite networks in Sweden.....................................................124 Table 6-3 Development of access to satellite networks in Finland......................................................125 Table 6-4 Satellite households in Europe..................................................................................................126 Table 6-5 Development of access to cable networks in Denmark ........................................................126 Table 6-6 Development of access to cable networks in Sweden ..........................................................127 Table 6-7 Development of access to cable networks in Finland ...........................................................127 Table 6-8 Cable households in Europe........................................................................................................128 Table 6-9 Digital terrestrial TV in Denmark (trail) ................................................................................133 Table 6-10 Digital terrestrial TV in Sweden.............................................................................................134 Table 6-11 Digital terrestrial TV in Finland ..............................................................................................135 Table 6-12 Roll out of digital terrestrial TV in Europe..........................................................................136 Table 6-13 Model of licensing adopted in some European countries....................................................136 Table 6-14 Model of licensing likely to be adopted .................................................................................137 Table 6-15 Country fundamentals in USA..................................................................................................142 Table 6-16 Development of access to satellite networks in the US....................................................142 Table 6-17 Development of cable TV in the US .......................................................................................144 Table 6-18 Major cable operators in the US ............................................................................................144 Table 6-19 MMDS households in the US ...................................................................................................146 Table 7-1 Signal access parameters............................................................................................................150 Table 7-2 CA systems used in Europe ........................................................................................................155 Table 7-3 API systems used in Europe.......................................................................................................157 Table 7-4 CA and API systems used in some European countries........................................................158 Table 8-1 TV market in the US ....................................................................................................................166 Table 9-1 Services in the digital satellite network in Denmark............................................................175 Table 9-2 Services in the digital cable network in Denmark.................................................................176 Table 9-3 Services in the digital terrestrial network in Sweden ........................................................177
Abbreviations ADSL Asymmetrical Digital Subscriber Line AM Amplitude Modulation AMI Andersen Management International AOL American On Line API Application Program Interface ATM Asynchronous Transfer Mode ATSC CA Conditional Access CAS Conditional Access System CATV CAble TV CCIR Comité Consultatif International de Radiocommunication CENELEC Comité Européen de Normalisation ELECtrotechniqe CI Common Interface COFDM Coded Orthogonal Frequency Division Multiplexing CSA Common Scrambling Algorithm CW Code Word

vii
DAB Digital Audio Broadcasting DAVIC Digital Audio-Visual council DigiTAG Digital terrestrial Television Action Group DL Dynamic Label DR Danmarks radio DRC Dynamic Range Control DSM-CC Digital Storage Media Command and Control DTH Direct To Home DTTV Digital Terrestrial TV DTV Digital TV DVB Digital Video Broadcasting DVB-C DVB- Cable networks DVB-CI DVB- Common Interface DVB-MOU DVB- Memorandum Of Understanding DVB-S DVB- Satellite DVB-SI DVB- Service Information DVB-T DVB- Terrestrial DVB-TAM DVB-Technical issues Associated with MHP DVB-TXT DVB- Text TV EBU European Broadcast Union EDTV Enhanced Definition TV EPG Electronic Program Guide ERC European Radiocommunications Committee ES Elementary Stream ESG Electronic Service Guide ETSI European Telecommunications Standards Institute EU European Union FCC Federal Communications Commission FDM Frequency Division Multiplexing FEC Forward Error Correction FM Frequency Modulation GI Guard Interval GPS Global Positioning System GSM Global System for Mobile communication HDTV High Definition TV HHI Herfindahl-Hirchman Index IB In Band IEC International Electronical Commission IP Internet Protocol IRD Integrated Receiver Decoder (Set Top Box) ISDN Integrated Services Digital Network ISO International Standardisation Organisation

viii
ITU International Telecommunication Union ITU-T ITU-Telecommunication I-TV Interactive TV LF Low Frequency LDTV Low Definition TV MAC Multiplex Analogue Component MATV Master Antenna TV MF Medium Frequency MFN Multi Frequency Network MHEG Multimedia Hypermedia Expert Group MHP Multimedia Home Platform MMDS MPEG Moving Pictures Expert Group MTG Modern Times Group MUX Multiplexer MVDS Microwave Video Distribution System MVMS Multichannel Multipoint Distribution Service NAB National Association of Broadcasters NTSC National Television System Committee NVOD Near Video On Demand ONA Open Network Access ONP Open Network Provision OOB Out Of Band OSA Open Systems Architecture PAD Program Associated Data PAL Phase Alternation Line PCM Pulse Code Modulation PCMCIA Personal Computer Memory Card International Association PDH Plesiochronous Digital Hierarchy PES Packetised Elementary Stream POTS Plain Old telephony Services PRBS Pseudo Random Binary Sequence PSI Program Specific Information QAM Quadrature Amplitude Modulation QPSK Quadrature Phase Shift Keying RCA Radio Cooperation of America RGB Red Green Blue RS read Solomon SAS Subscriber Authorization System SBS Scandinavian Broadcasting System SDH Synchronous Digital Hierarchy SDI Serial Digital Interface

ix
SDTV Standard Definition TV SFN Single Frequency Network SHF Supper High Frequency SMS Subscriber Management System SMATV Satellite Master Antenna TV SMS Subscriber Management System SNG Satellite News Gathering STB Set Top Box STM Synchronous Transfer Mode SVT Sveriges TV TDM Time Division Multiplexing TMC Traffic Message Channel TS Transport Stream UHF Ultra High Frequency UK United Kingdom UN United Nations US United States VBI Vertical Blanking Interval VHF Very High Frequency VHS Video Home System VLF Very Low Frequency

1
1. Introduction The subject of this Ph.D. thesis is changes in the market for broadcasting services as a result of technological, political, and economic drivers. Broadcasting services can be categorised as a part of the ICT-based information and knowledge intensive services that have gone through radical changes in the last couple of decades. Broadcasting services can be categorised as a part of the information and knowledge intensive services that has gone through radical changes in the last couple of decades. There are, however, specific characteristics like deployment of advanced technologies at both supply and demand sites, scarcity of transmission resources, and the historical aspects that make the development of the broadcasting service market different from other information and knowledge intensive services.
The rapid development in, among others, Information and (Tele) Communication Technology (ITT / ICT) has had great impacts on the production, development, and delivery of services. The degree of these impacts varies depending on the type of the service. Services that can be transmitted on a communication network like banking and broadcasting are directly influenced where, e.g., person and thing oriented services are influenced indirectly in terms of innovation in e.g. administration processes and automation of internal publication activities. The service industries, especially the information intensive services, have experienced radical changes during the last 20 - 30 years. The development in ICT has apart from improved transportability, influenced and improved conditions for, among others, divisibility and tradability of the services. Consequently, the service industries that in the beginning were concentrated on the domestic markets have expanded to the international markets both in term of international division of labour and also regarding cross-boarder trade in services. One of the objectives of general research within the service sector is to analyse the dynamics of changes and to identify the technological, political and economic parameters that have impact on these changes, including the above-mentioned evolution of service industries - from the domestic to the international market - and the consequences of the public good characteristics (and other market failures) on the information intensive services1. The aim of this project is to contribute to this research by giving an analysis of the development of the market for broadcasting services with respect to identification and analysis of driving forces and barriers in this development as well as implications of this development on the structure of the market. The broadcasting services cover several and different types of services in the value chain from the content creation to the final delivery of the services (TV / radio programs) to the end-consumers. We can distinguish between two main and different parts:
- Contribution: The information / service exchange between broadcast stations, broadcast stations and service providers and internally between different departments of broadcast stations. Contribution denotes the business-to-
1 See, among others, publications from SIC project (Service development, Internationalisation, and development of competency), Roskilde University Center, Denmark, 1997-2000. For example: Sundbo J. :“Innovation in services – Denmark”, Larsen N. J. : “Knowledge-intensive business Service in the Danish economy”, Henten A. “Implication of Information and Communication Technologies for The International Distribution of Labour”, Henten A & Skouby K.E.: ” Internationalisation of Services - Implication of Information and Communication Technologies”, Pedersen M.K. :“ Professional business service Innovation: A distributed Knowledge approach”, Ileris S.:” Skills in Services: A Study in Denmark”, Fuglsang L. & Tadayoni R. :” International trade with and exchange of news for television as a case of innovation in services”.

Chapter 1: Introduction 2
business and inter-firm part of the chain. - Distribution & delivery: The provision of the final broadcasting services (radio /
TV programs) to the end consumer. Distribution and delivery denotes then business to consumer part of the chain.
Different requirements are applied to the contribution and distribution / delivery networks, and the content provided on these networks. Furthermore the market development and regulation of the services have evolved in different ways in the business-to-business and business-to-consumer part of the chain. Regarding the contribution part, the international components in broadcasting services industry, as trade in service and specialisation, can be identified early in the development. Establishment of international news agencies, co-operation between Public service broadcasters, trade in movies, serials, etc. are some examples of the internationalisation of broadcastings services in the contribution part. The provision of services to end-consumers (broadcasting of radio / TV programs) has, on the other hand, been a nationally regulated industry for long time. The preconditions for national regulations have been changed, and service provision to end consumers goes beyond national boundaries. The financing aspects of the broadcasting service provision are also going through fundamental changes due to, among others, the technological possibility of targeting the broadcasting services towards the individual consumers. Within this project, the market for business-to-consumer part of broadcasting services (from now on called broadcasting services) is analysed, technological, economic and political parameters that have impacts on this development are identified, and implications of the changes on the market are analysed. The analysis is performed on the European and the US markets. Broadcasting started in Europe and the US and the continents have had the most advanced markets for broadcasting services. Furthermore, these two markets are chosen in this project because they, in the beginning, selected two different approaches regarding regulation and organisation of broadcasting, but later on the two markets have looked more and more alike and have come through similar developments. Analysis of these two markets in a comparative manner will give a good framework for understanding the development of broadcasting market. From the invention of radio broadcasting, the importance of this new medium was obvious both as a commercial product / service, which opened up for new business opportunities, and as a new platform for providing educational and information related services to general public. In the 1920’s and the 1930’s, radio broadcasting in Europe was organised as governmental institutions. Radio that was invented already in the beginning of the century remained unregulated and was primarily driven by private, and more or less, amateur initiatives. In the 1920’s, technological development reached such a level, that the national governments realised the huge political potentials this medium represented, among others, in terms of an important source for information, education, agitation, etc. Furthermore, from the beginning, radio communication - in a point-to-point structure - had vital military use and interest. Because of radio being identified with military and espionage activity in the past, most European governments considered it essential to take control of radio broadcasting. The introduction of broadcasting took place in a period where the European societies went through various problems:

Chapter 1: Introduction 3
“The period of introduction was one of the major social and political divisions: general strikes, depressions, popular fronts, fascism on the right, and Bolshevism on the left, pre-war confrontations, the war itself, post-war reconstruction, and the cold war’s ideological and military stalemate. Governments did not wish to abdicate the control over this medium to a few privileged owners”2.
Furthermore, it was argued that the use of broadcasting for cultural development, educational purposes, etc. was best utilised in public hands. The resource scarcity and its allocation to national broadcasters with nation-wide coverage resulted in a situation, where many European countries had only few allocations for radio and TV broadcasting. Using the available resources for establishing a few countrywide radio and TV networks per country resulted in a high sensitivity regarding which interests should lead the broadcasting market (public or commercial). However the scarcity argument has been challenged from the beginning3. According to Noam for example:
“ This was never correct, because the scarcity was to a certain extent self-imposed and spectrum was being allocated to various official uses without regard for its opportunity cost. The emergence of dozens of low power stations, as well as the locating of frequencies for all kinds of new national broadcast channels once the political will was there, demonstrated that the “scientific” spectrum argument had been carried much too far”4.
In Europe it was chosen to regulate radio as a governmental property. This was in continuation of the European tradition of governmental organisation of infrastructures like railroads, post & telegraph and telecommunication – a tradition that builds upon the importance of national governmental organisations in Europe in the 1800’s and the first part of the 1900’s. Furthermore, in Europe it was realised that radio could play an important role to strengthen the national culture as a foundation for strong national governmental constructions– with positive and negative implications. The ‘positive’ aspect was that radio was a good medium to send education and information to a huge part of society and consequently to increase the level of knowledge, education and the political engagement in the society. The negative aspect was that radio could be used as an agitation- and propaganda tool. One extreme example is the role the radio played in the Nazi-Germany. Apart from the technological and political considerations there were sound economic reasons for the selected organisation forms. Traditional broadcasting was considered as a public good with its two characteristics; non exclusivity (once a good is produced nobody can be excluded from using it) and non-rival consumption (additional consumers can use the good / service at zero marginal cost). Consequently, the regular price mechanism could not control the production and consumption of the service in a perfect completion market and other, non-market, solutions was necessary to finance the service. In Europe the funding was based on direct license payment and in the US it was based on indirect advertising payment, known from the writing press. A combination of public good characteristic (and other market failures) and the resource scarcity made it necessary to put some restrictions on the organisation of the market, e.g., regarding optimal utilisation of available resources and maximisation of welfare. The result was the establishment of monopoly markets in Europe and an oligopoly market in United States. Later on and in different speeds the European countries opened 2 Noam E. M. :” Television in Europe”, Oxford University Press, New York, 1991 3 See among others Coase R. :“The federal Communication Commission”, The journal of Law & Economics, October 1959. And (Noam 1991), Op. Cit. 4 (Noam 1991) Op. Cit.

Chapter 1: Introduction 4
up for competition and, consequently, the monopoly markets were transformed to duopoly and oligopoly types of market organisations. The monopoly and oligopoly markets in Europe and the US developed powerful incumbent broadcasters with strong connections to governments. The incumbent broadcasters have been challenged and diversity has been demanded during its history. This has been done both by way of pirate actions, like the broadcasting of Radio Mercur from international waters to the Danish audience in 19585, and also through regular applications for commercial licenses by private actors. Later on the emergence of cable / satellite systems increased the available resources significantly and decreased the technological barriers for the number of actors on the market making the political barriers more obvious. In the United States, the problem of scarcity of resources was solved in a slightly different way, namely by giving the governmental authorities the control of frequency allocation and assignment and maintaining content regulation, but apart from that, leaving the organisation and financing in the hands of private industry. The license for broadcasting services provision was obtained in return for conforming to certain regulations generally denoted as “public interest” regulations. The argumentation was that as frequency spectrum was a public property, the broadcasters who wanted to use the medium should provide services in “public interest, necessity and convenience”. There were never nation-wide licenses in the US and the licenses were provided to local radio and TV stations. Development of a national advertising market, however, resulted in almost national TV networks in US. There have always been limitations on the number of TV stations one person or one entity have been permitted to own. The national networks have, however, emerged through the networks’ own local stations, and affiliations with other local stations. Broadcasting in the US has been in the hands of private and commercial enterprises and, as stated above, based on advertising. Commercial broadcasting could not cover all the program needs of the society and especially education related programming was missing in the market. Therefore public broadcasting emerged to fill these gabs and, in the beginning, provided mainly education-related programming. Public broadcasting was funded by contributions from individuals and private funds until 1967, when the government accepted partly to contribute to the funding. The development of different infrastructures like satellite and cable networks has changed the assumptions for the traditional regulation and organisation of the broadcasting market. In the last couple of decades, technological developments have further evolved towards using digital technology and interactivity in broadcasting. This development can be considered as the most radical innovation in the history of broadcasting since the invention of TV. This technological development along with the development in the political and economic set-up have created new conditions for the market for broadcasting services, which will be described in the following.
1.1 The digital broadcasting case The aim of this project, as mentioned before, is to analyse broadcasting as a case study in the overall research in development of service industry. The objective is to identify the technological, political and economic driving forces and barriers in the development of 5 To prevent such pirate broadcasting the Telecommunication by radio Act of 1949 had legislated that, ”The setting up of, operation of, or use of broadcasting stations on the open sea or in the air space above it shall not be permitted.” On that basis, radio Mercur was shut down by the government in 1963.

Chapter 1: Introduction 5
broadcasting services, and consequently to analyse the implications of this development on the broadcasting market. In the following, the main questions and problems of the project are presented, including the aspects of the development that have been considered as vital in the analysis of the market development. The starting point and the general problem of this project is to identify the economic, political and technological parameters that have had influence on the development of the broadcasting market and its regulation. Furthermore, it is necessary to identify the changes of these parameters and their inter-relation through the history. After the problem is identified at a general level, it is then broken down and different aspects of the development that have been important in the development until digitalisation of broadcasting, and that are important in the future development of digital broadcasting are analysed in more detail, using the theoretical framework and the empirical data. The following aspects of digital broadcasting will be analysed in detail:
• Resource issues,
• Access issues,
• Business models and funding issues,
• Development of new services and the convergence process Technological developments, mainly emergence of cable / satellite and digitalisation of broadcasting, and changes in the political and economic set-up have, in the last couple of decades, removed some of the preconditions and assumptions for traditional allocation of resources for broadcasting. Consequently, a new broadcasting market has emerged, where seen from the supply side perspective some of the entry barriers, like resource scarcity, are removed (diminished). The problem is then to identify to what degree resource scarcity or efficient utilisation of resources can still justify future regulations. Here it is important to analyse the problem with respect to different infrastructures. On the other hand from a demand side perspective, access to broadcasting services is getting more complicated in digital broadcasting, partly due to the level of development of digital technology and, partly due to the strategy of the commercial actors and the regulatory bodies in different countries. The question is then to identify the parameters that can create sub optimal access conditions and to identify to what degree regulations are necessary to create optimal access conditions. Traditional funding mechanisms need to be tested in the new market, where broadcasting services are transforming from a public to a private good. Using new technologies, broadcasting services can be customised and targeted to the individual users, resulting in a development from a one-to-many to a one-to-one market; consequently, new business models can be deployed in the provision of broadcasting services. But there are other parameters that will influence this process, and the indirect funding will remain as one of the business models in broadcasting. These parameters are, e.g., political arguments like the necessity of keeping public service broadcasting with overall societal responsibilities and, consequently, keeping free access to the service based on the non-market funding systems. There are also pure economic reasons for keeping, for example, the current indirect advertising financing, even when it is possible to sell the content directly to the end consumers, because the advertising market is a solid and proven revenue source for commercial broadcasters. To have an understanding of market development, different funding forms must be analysed in the

Chapter 1: Introduction 6
light of economic, political, and technological parameters. Development of the technology, emergence of new services and introduction of interactivity in broadcasting, more efficient utilisation of transmission resources, and loosening of ownership regulations are among parameters that influence, and shape the broadcasting market. The question is to identify the new services and their influence on the development of the market. Furthermore, the question is what the empirical data reveal about the development of the broadcasting market with respect to roll-out of digital services, service innovations, market concentration and vertical and horizontal integration / ownership. Moreover, these developments influence and get influenced by the ongoing process of convergence and the synergy / spillover from the development in Information Technology (IT) and telecommunications. One of the important parameters in the convergence process is the evolution of the Internet and Internet’s ability to deliver broadcasting services as well as broadcasting platforms’ ability to provide Internet services to the end-user. The question is then to identify to what degree there are potentials for this convergence to take place, and what the regulatory implications are.
1.2 Methodology The analysis is performed using an interdisciplinary approach. One of the methodological challenges in this project has been to base the project upon a focused interdisciplinary approach and, consequently, to identify the vital disciplines that could contribute to understanding the broadcasting market. To give a sustainable analysis of the broadcasting (and other communication) markets, it is important to identify the interplay between technological, economic and political parameters. The formal model of the interrelation between these parameters is depicted on figure 1-1.
Technological parameters
Economic parameters
Political parameters
Figure 1-1 Theoretical framework
The technological aspect is taken into consideration, because broadcasting is very sensitive to technological development. Advanced technologies have been used in the whole value chain from supply to consumption of service. Technological changes have had direct influence on different parts of the value chain and, consequently, on the organisation of the market. Looking at the development of broadcasting through the last century, the vital role of political intervention and regulation is obvious. It will not be possible to analyse the

Chapter 1: Introduction 7
broadcasting market without taking into consideration political intervention and the role of the regulatory bodies in content / market regulations. The economic parameters have also been important, primarily, due to specificities of broadcasting services that made it impossible to offer the service in a free competition market. And further because of the new market opportunities and the role of commercial actors in this development. These inter-relations between the different parameters are depicted in figure 1-1 by the direction of arrows. The dashed arrows indicate that the analysis is not based on looking at two parameters isolated from the third one, e.g., the impacts of technology on the interrelation between political and economic parameters and vice versa are also taken into consideration. The methodological challenge in this project has not only been to find the right theoretical disciplines, but based on empirical evidence, to weigh the role of these technological, political and economic factors in the shaping and development of the market. To do this a comparative approach is used, where the empirical analysis is performed on the European and the US markets. The different regulatory frameworks for broadcasting in the European countries and the US will help identifying the importance of different parameters in the development of broadcasting market. As it is shown throughout the thesis in different historical phases, the weight of these three parameters has been different. Sometimes it has been the technological changes that have pushed the political system to change regulations and, consequently, new conditions in the market have been created and, sometimes, new political decisions have created incentives for new technological development and enabled new technological innovations. Another aspect of the methodological choice in this thesis is depicted in Figure 1-2. The question is to identify what the changing parameters are that drive the development from the old to the new state and in this way to give an analysis of the development. As depicted in the figure, the old state is the traditional broadcasting market and the new state is the current and future market. The changes are a variety of technological, political and economic parameters that enable movement from the old to the new state. The figure gives a simplified version of the real development, as neither old nor new states are static. On the contrary, they are in a continuum of development and evolution. But still a distinction between traditional and current/future broadcasting and identification of changes in between these two states will be useful and is deployed in this thesis.
Old state • Few
transmission resources
• Public service / public interest regulation
• Funding through license-fee & advertising
Changes
• Emergence of multi-channel systems
• Conditional Access • Digitalisation • Liberalisation • Transformation from
public good to private good.
• Lower production and distribution costs
New state • More
transmission resources
• New regulatory implications
• Complicated access issues
• New entry barriers
Figure 1-2 Methodological framework
Chapter 1: Introduction 8
The figure gives, further, a graphical illustration of the structure of this report: First the old state (traditional broadcasting) is analysed in detail, where the economic, political and technological parameters are analysed in the first 3 chapters. Then the changes are identified, and the rest of the report analyses the implications of the changes on emergence of the new state.
1.2.1 Theory The theoretical framework of the project is broadcasting economics, which deals with the specificities of the market for broadcasting services, and consequently with the question of production and consumption of broadcasting services. One of the major questions in this respect is, how scarce transmission resources can be allocated to produce the needs and wants of individuals, as well as the overall societal needs and wants optimally. The central elements are the theory of market and market failure. And the theories about how to deal with the market failures using regulation or more market oriented solutions. Central economic theories deployed in the project are listed in the following:
• Theories on market are used to understand different market structures, and how the broadcasting market fits in different structures in different phases of the history.
• Central theories of market failure from the welfare economic theory, namely the theories of public / club goods, externalities and natural monopoly are deployed to understand the organisation of markets in traditional broadcasting at a theoretical level.
• Theories on market concentration and vertical integration / transaction cost theories are given, both as parameters that can create entry barriers and limit competition.
• The theories on the dual-product-market characteristic of the market for commercial broadcasting based on advertising funding are described. Advertising financed broadcasting operates in two different markets, namely content and advertising markets that are interdependent and influence each other.
• The economic theories that deal with transmission resource (spectrum) scarcity in broadcasting are described.
• Market oriented theories that deal with the problem of provision of high quality programming and diversity in the provided programs are presented. These theories deal with the assumptions for the market by itself to be able to allocate resources optimally. However also in this approach regulation is seen as necessary when the transmission resources are scarce.
Further political and technological theories are deployed in the project. Regarding the political theory it is the political theory in direct relation to the economic system, e.g., the role of governmental interventions to assure that the market behaves normally, which is deployed. Regarding the technology of broadcasting, relevant technical literature and technical standards are used to give a description of the broadcasting technology and the technological changes. The description of broadcasting technology is given in an extent (and level) that is necessary regarding the overall objective of this thesis.

Chapter 1: Introduction 9
1.2.2 Empirical data The empirical data are gathered through different projects that I have been involved with, mainly:
• Quantitative and qualitative data gathered on the development of digital TV in Europe. I participated the project from the beginning and helped define the layout of the project and the overall questions to be answered. I had responsibility for information gathering and preparation of reports in Denmark, Sweden and Finland. These data are extensively used in this thesis.
• The data gathered in connection with the working group on digital TV appointed by the Ministry of Culture in Denmark. These working groups have resulted in two reports on digital broadcasting in Denmark. I had an active role in defining the questions and problems that are analysed in these reports. Recently in another working group we have updated some of the market data in the light of new developments. The relevant data from these projects are used.
Furthermore, the available statistics and secondary data from available literature are used to the extent it has been necessary.
1.3 Structure In the following, the structure of the report is described shortly. The intention is to give an overview of the structure of the thesis and to describe the interrelation between different chapters. Chapter 2 contains a historical comparative analysis of the development of broadcasting in US and Europe. Furthermore, the regulatory framework of broadcasting in Europe and the US are described and analysed. Chapter 3, with the title broadcasting economics, contains the theoretical framework of the project. In this chapter relevant parts of the economic theory that contributes to understanding the broadcasting market and broadcasting economy are presented and discussed. The chapter starts with a definition of market structures and parameters influencing the market development. Broadcasting is then analysed in different market structures. Finally, the general market failures are described, and the broadcasting market is analysed in the light of these market failures. In chapter 4, a description on broadcasting technology and broadcasting service development is given. The chapter starts with a short description of analogue broadcasting to identify the roots of digital technology in the analogue era. Then the technologies used in digital broadcasting are described with focus on technologies that influence the market structure. The description of the technology of broadcasting is used both in the technological analysis given in this chapter, and in following chapters containing the empirical analysis of the project Based on the analysis in the three former chapters, the technological, political and economic changes in the process towards digitalisation of broadcasting are analysed and summed up in chapter 5. The rest of the thesis contains analysis of the implications of different aspects of digital broadcasting based on the empirical data. Chapter 6 contains the implications on resource issues. One of the major developments on the transmission resource side is the possibility of more efficient utilisation of the

Chapter 1: Introduction 10
available resources in all delivery platforms. The increased capacity obtained in digital broadcasting can be allocated in different ways resulting in different implications on market development. Chapter 7 contains the implications on access issues. Access to digital broadcasting is more complicated than analogue broadcasting. In digital broadcasting, among others, the Conditional Access (CA) technology is deployed that gives possibility for development of new business models in broadcasting market but also introduces access limitations. The access issues will influence market development as well as regulation of broadcasting. Chapter 8 contains the implications on funding of the service. The analysis will cover the development of traditional as well as the new funding system and business models and their possible future based on available data. Furthermore, the implications on the market structure regarding, e.g., vertical and horizontal concentration of market are given. Chapter 9 contains an analysis of emergence of new services and the convergence process. This consists both the available services and the services that potentially can be offered in the market. The implications on the ongoing convergence process, that are analysed in this chapter, imply the question that, to what degree convergence takes place in different parts of the value chain, with focus on service provision. Chapter 10 contains the conclusion, and the references used in this thesis are listed in chapter 13. Furthermore, before the section containing the appendixes, a comprehensive English and Danish summary are given. The appendix section contain seven chapters, containing empirical data on broadcasting markets in the three Nordic countries; Denmark, Sweden, and Finland, which has been decided as the fields for data collection in this thesis. Appendix I contains basic statistics that are seen as necessary in the analysis of broadcasting market. Appendix II contains empirical data on the level of development of different infrastructures. Data on penetration of digital broadcasting in different infrastructures are differentiated. Regarding digital terrestrial broadcasting, as it is not available in all markets, the political decisions and possible plans for digitalisation are outlined.
Appendix III contains empirical data on different access technologies used in the Nordic countries. It is not differentiated between the Nordic countries as the markets are similar and the service providers consider them as the same market. Appendix IV contains the service available in all digital platforms.
Appendix V contains statistics on the funding of TV, including digital TV. Appendix VI contains data on the level of vertical integration. Appendix VII contains an overview on the organisations with relations to digital TV and different standards used in the major markets.

11
2. Regulatory framework of broadcasting in Europe and the US, a historical analysis
Broadcasting emerged from the wireless telegraphy that was organised as state monopoly, first in the developed countries and later almost globally. This historical starting point had tremendous impact on how the service was organised and regulated. As mentioned earlier and as described in next chapter, there were pure technological reasons for regulation of broadcasting, but content related considerations influenced the formation of regulation. The content aspect in the mass communication delivery-structure was important, as practically every citizen, whether child or adult could use the service. This raised concerns about the way broadcasting could influence society as a whole and gave governments incentives to control the medium. As described in the next chapter, there are also pure economic reasons that explain the development and the selected organisation forms for broadcasting. The aim of this chapter is, however, to identify to what degree historical and content-related reasons have influenced the shaping of the broadcasting landscape, and to give a more detailed description of the regulatory framework of broadcasting. The analysis concerns the US and different European markets in a comparative manner. Broadcasting started in Europe and US, which have had the most advanced markets for broadcasting services. These two markets are chosen in this project because they in the beginning selected two different approaches regarding regulation and organisation of broadcasting, but later in the history the two markets have looked more and more like each other and have gone through similar developments. Analysis of these two markets in a comparative manner will give a good framework for understanding of the development of broadcasting market. There are similarities in the development of broadcasting in different European countries but also differences. The countries can be seen as going through the same development but at different historical periods. Regarding the similarities and differences between the US and the European markets, in the common understanding, they are seen as totally different markets and the development in Europe is seen as Americanisation of broadcasting. The objective of the following analysis is to show that the development of broadcasting market in the European countries and the US have been similar in several aspects. In both markets similar technological, economic and political drivers and barriers can be identified, the incumbents have obtained central market position and huge power that they have used (misused) when they have been challenged, and in both markets the incumbents are under pressure of competition from the newcomers. It is shown that the development of broadcasting in Europe is not an Americanisation of European broadcasting; there is merely a parallel development in the two continents. With the emergence of satellite and its use in broadcasting, the technological platform for broadcasting to go beyond national boundaries was a reality, but it was first due to loosening of regulation and liberalisation of the market that the market developed from a nationally regulated market to a market, where the appearance of international actors in the national markets was a reality. And where regulations took an international or regional character, like “TV without frontiers” in the European Community. In the following first a general overview on broadcasting history is given. Later the European and the US market are described in two separate subchapters, each subchapter starting with a short history and continuing with description of the regulatory framework of broadcasting.

Chapter 2: Regulatory framework of broadcasting In Europe and US, a historical analysis 12
2.1 A general overview of broadcasting history In the following the history of terrestrial, cable and satellite broadcasting are described. The next phase in the development is digitalisation of broadcasting, which is described in detail in chapter 4.
2.1.1 Terrestrial broadcasting The existence of electromagnetic waves was theorised by the Scottish physicist James Maxwell in 1867 and demonstrated in 1888 by the German physicist Heinrich Hertz. The Italian, Guglielmo Marconi, in 1895, succeeded in sending messages using electromagnetic waves. He succeeded in sending Morse codes of dots and dashes over long distances. Using the airwaves to transmit information was obviously of great importance for the development of electronic communications. Marconi patented and commercialised the invention as “wireless telegraphy”. The “wireless telegraph” system was a point-to-point communication system initially mainly used to enable ship to shore communication. Another step in this development was the transmission of voice instead of Morse codes over communication lines. This was realised by the American engineer Reginald Fessenden in the beginning of this century (demonstrated in 1906 and patented in 1907). However, it was still point-to-point communications, but different receivers could tune in on the same frequency and hear the same messages (a sort of point to multi-point communication). The next step in this development was broadcasting. The origination of the idea of broadcasting goes back to, among others, David Sarnoff at the Marconi Company in the US where he left the famous memo to his boss in 19161:
“I have in mind a plan of development, which would make radio a household utility in the same sense as the piano or the phonograph. The idea is to bring music to the households by wireless…The receiver can be designed in the form of a simple “Radio Music Box” and arranged for several different wavelengths, which would be changeable with the throwing of a single switch or the pressing of a single button. [That way] hundreds of thousand families [could] simultaneously receive from a single transmitter. “
The first radio broadcast services were Amplitude Modulated (AM)2 radio operating in the LF and MF bands (Long and Medium waves)3. LF and MF bands have good propagation characteristics enabling them to cover very large geographic areas. However, the coverage can be limited by diminishing the radiated power from the transmitters. When the MF and LF bands where assigned to broadcast stations, the radio amateurs were assigned to the HF band that was not attractive for broadcasting. It soon turned out that the HF frequencies had unique propagation characteristic: They first propagate along earth or water and then they depart from the surface of earth and are reflected by the ionosphere. This provided the opportunity to transmit HF radio (short wave radio) to remote locations. Two of the results were: 1) Some countries established short wave radio stations to broadcast to their remote sites, and 2) short wave radio began to be used as a relay device to gather special international news for domestic broadcasting. Radio began to be a significant news medium.
1 In Brinkley J.: ”Defining vision- the battle for the future of television”, Harcourt brace & company, New York 1998 2 Amplitude Modulation denotes basically a technique where the amplitude of the carrier wave is varied concurrently with the variation in the message signal (e.g. the voice signal). 3 See chapter 2 for a definition of different frequency bands

Chapter 2: Regulatory framework of broadcasting In Europe and US, a historical analysis 13
Another step in the development was the emergence of Frequency Modulated (FM)4 radio invented by Armstrong in USA in the beginning of 1930s. The quality of the transmitted audio signal in FM was higher than AM and along with its possibility of transmitting in stereo, FM was a radical innovation in audio broadcasting. FM uses much more bandwidth than AM and is, therefore, allocated in the VHF band. Even though the quality of FM was superior to AM radio, it took FM several years to be recognised and implemented. This was primarily due to the resistance of the incumbents in AM radio broadcasting and, especially, the Radio Corporation of America (RCA) that had major investments in AM radio and invested in television as their new innovative product. The first FM launch in the US was by the end of the thirties and the second launch was in the mid-forties where the frequency band shifted from 42 - 50 MHz to 82 – 108 MHz. The following step was the introduction of TV, first black and white and later colour TV. Different standards have been used in different markets, NTSC in the US and PAL and SECAM in Europe. Other countries have followed one (or a variant) of these standards. In comparison to radio, TV requires huge amounts of bandwidth and from the beginning certain parts of the VHF band were allocated to TV broadcasting. Soon it was obvious that the VHF band got crowded and the lower part of the UHF band was also allocated to TV broadcasting5.
2.1.2 Cable The history of using wires / cables to bring broadcasting content to end-users goes back to the beginning of the broadcasting era. In the UK in the mid 1920s, the relay companies provided radio at low cost for the working class who had no electricity and little money6. Apart from providing radio cheaply, the signal quality of ‘cable radio’ was better than the signal received from “air”. It was easier to tune and did not suffer from interference problems. This signal quality aspect was later on one of the main reasons for the introduction of cable TV. Introduction of cable TV was very much based on the opportunity for remote areas to receive TV in good quality, especially in geographic areas where regular reception of TV was impossible or very bad, e.g., in areas with mountain landscapes. The increasing quality of the picture could also be used to offer TV in the cities because of the multi-path interference from buildings that degraded the signal quality. Another reason for using cable TV was to avoid the forests of individual antennas on the roofs. Cable TV started as individual systems without any connection with each other, serving buildings and building complexes called Master Antenna TV (MATV) or Community Antenna TV (CATV). It did not require much imagination to see the huge opportunities in connecting these MATVs and CATVs. Apart from higher signal quality and removal of the multiple antennae from roofs, cable TV had other characteristics with great impacts on broadcasting:
• There was great capacity in the cable networks compared to the terrestrial radio spectrum. This capacity could be used for the provision of multiple TV channels, and it
4 Using FM technique, the frequency of the signal is varied concurrently with the variation in the message signal (e.g. the voice signal). 5 Television has had its own history and evolution from mechanical to electronic TV. This development can be traced back to 1884 where the German student Paul Gottlieb Nipkow obtained patent on the very first television system. For more about the evolution from mechanical to elkectronic TV see among others: Bruin R. and Smith J.:” Digital Video Broadcasting- Technology, Standards, and Regulations”, Artech House Publishers, 1999. 6 According to Maddox B.: “Beyond Babel, new directions in communications”, Simon and Schuster, New York, 1972, radio could be obtained in a home with no electricity by having a loudspeaker from which wires ran back to what was called a wireless exchange. The power to operate the loudspeaker was supplied along with the signal.

Chapter 2: Regulatory framework of broadcasting In Europe and US, a historical analysis 14
could even free the resources in the radio spectrum for other uses.
• Cable providers began to charge the consumers based on the service they demanded. Prior to this time, it was either advertising or license fee that funded broadcasting.
Generally speaking, as far as the new distribution forms have been seen as complementary to the existing ones, the incumbents have welcomed and not resisted them. However, from the time the new distribution forms started to compete with the existing ones, resistance from the incumbents started. In the US, as long as cable TV providers amplified the existing (local) terrestrial channels and provided them to the consumers, the terrestrial broadcasters were quite happy with this new distribution form. It expanded their consumer base and increased their advertising revenue. But from the time the cable providers began to receive signals from neighbouring stations or other sources of programming, they were competitors to the local broadcasters and consequently resisted by them. In Europe, MATV started also as a delivery form for higher signal quality and as a solution to remove multiple antennas from roofs. The MATV systems were not allowed to be connected to each other and for example in Denmark, the systems were owned by the housing associations or municipalities. In spite of the high capacity that was available in these networks, only the existing terrestrial channels, mainly public service channels, were transmitted in these networks. To utilise the great capacity in cable TV, sources for programming were needed. There were many TV channels in different countries, but the transmission of them was not always economically viable. The use of satellites for program distribution and the ongoing media liberalisation, in 1980’s, had vital impacts on the further development.
2.1.3 Satellite The history of satellite communications can be traced back to an article by the British science writer Arthur Clarke in the British Magazine “Wireless World”. He pointed out that if a satellite could be flung into an orbit 36,000 Km above earth, it would travel at the same speed as the rotation of earth. It would thus appear to be stationary and would be in line of sight for sending and receiving stations at about 40% of the globe. Clark concluded that only three satellites would be needed for global communication7. The first satellite (Sputnik) was sent up by the former Soviet Union in October 1957, but not in the geo-stationary orbit. The first geo-stationary satellite was sent up by the US in 1963. The satellites where primarily designed to render possible a high-capacity transmission medium for the increasing international telephone traffic. The development of optical fibre technology was also intensified. The optical fibres showed to be competitive with satellite communication in handling international telephone traffic. One of the alternative uses of the satellites that turned out to be a success was broadcasting, both as a means of distribution to the transmitters and relay stations but also as direct broadcasting to end-consumers. As far as satellite and cable addressed different market segments, e.g., when satellite provided content to the cable TV head-ends, there was no conflict of interest between them. Also in the beginning, when satellite operators started to operate at the end-consumer market, there were complementarities based on the fact that cable offers advantages to most urban and suburban viewers, whereas satellite can cover less densely populated regions and feed the cable systems in other areas. However when satellites began to address end-consumers in urban and suburban areas with the introduction of high power Direct Broadcasting Satellites, it became a competitor to cable TV. 7 Maddox 1972, Op. Cit.

Chapter 2: Regulatory framework of broadcasting In Europe and US, a historical analysis 15
Another dimension of satellite distribution that created political problems, at least in Europe, was its ability to disrespect national boundaries. This was a big problem in Europe, where broadcasting has been under tight regulation by national authorities. The fear was not only based on the fact that the national governments would lose the ability to control the media, but the fact that American broadcasting could threaten European culture and languages. Prior to this time, there were empirical evidences of an asymmetrical flow of international trade in TV programs from big to small countries8. The emergence of satellites intensified this concern, stated clearly by the French PTT minister:
“If the American businessmen attempt to test our ability to accept their challenge, then we answer them: impossible in a European framework. In any case we are not willing to let the Coca-Cola satellites undermine our linguistic and cultural identity” 9.
The breakthrough of direct satellite broadcasting in Europe came in the late 1980s where Europe experienced a media liberalisation. Satellites intensified this process and soon many impediments for their penetration were removed. However, it was still under national regulation when the up-link was in the country, and under European regulation when the up-link was in other European countries. In the US, the actors in cable and terrestrial TV resisted the new competing infrastructure for the provision of TV to end-consumers. They tried to formulate some arguments for this resistance, for instance:
“Satellite represents significant threats to localism, to free television, and perhaps the American way of life”10.
Another argument was that the free reception of programs from satellite distribution would put terrestrial and cable transmission in an unfair competitive position. This problem was, to some extent, solved by scrambling the signals and by charging the consumer for the services they used. By the scrambling of signals, the satellite providers could also base their economy on selling services to the consumers rather than having revenues only from advertising.
2.2 Europe There are similarities and differences between the developments of broadcasting markets in different European countries. For example the notion of public service broadcasting is historically connected to European broadcasting as a whole, with content, organisation / regulation, and funding related similarities between the European broadcasters. The intention of public service broadcasters is generally to focus on high quality programming and programming that increases the level of knowledge in society, education etc. The differences between European broadcasters can primarily be found on the level of political control and the timing for opening up towards commercial broadcasting. Another similarity, that comes later on, is that all European countries must adopt common regulations that are specified by the European Union. This process started already in 1984 with the directive, ”Television Without Frontiers” and has strongly influenced the liberalisation of the European broadcasting market and consequently opened the doors for the commercial broadcasters. In the following, first a short history of broadcasting in Europe is given. Then the concept of Public Service Broadcasting is defined and finally the European regulations with regard to
8 Varis T.: “Trends in the Global Traffic of Television Programs”, in Noam E.M. and Millonzi J. C. (ed.): “The International Market in Film and Television programs”, Alex Publishing Corporation, New Jersey, 1993. 9 Neu Medien 1984, in (Noam 1991), page 302 10 Comer 1998, in (Neuman 1998)

Chapter 2: Regulatory framework of broadcasting In Europe and US, a historical analysis 16
broadcasting are described.
2.2.1 Short history Because of the connection to government, the development of the European public service broadcasting depends tightly on the general development in society. Broadcasting has been at the same time political/ ideological reflections of the society and the fundamental elements in the formation of the public opinion in the European countries. This is part of the explanation on why public service is not only defended by the incumbents themselves but also by more progressive actors in the society. The monopoly situation in broadcasting has been challenged and diversity has been demanded during its history. This has been done both by way of pirate actions, like the broadcasting of Radio Mercur from international waters to the Danish audience in 195811, and also through regular applications for commercial licenses by private actors. As shown in the following, the situation was loosened, first by permitting the establishment of several public channels and later by liberalisation and giving licenses to commercial channels. The tempo of liberalisation varied in different countries. Finland was one of the first European countries to open up for entrance of commercial actors and Sweden was the last country. At the end of 1980s, all West European countries had opened up for limited commercial broadcasting. The original government monopoly and the central status of public service institution in the European broadcasting are the most important similarities between different broadcast systems in different European countries – in contrary to the US, where public broadcasting came as a correction of the commercial broadcasting that dominates the market. Connected to the original organisation of broadcasting, the financing of the system was through license fees, when service was used (acquisition of receiver equipment). This was the most natural financing form in a situation where broadcasting was a public good and it was decided not to be dependent on advertising, and when the majority of people did not have the possibility of acquiring a receiver equipment. In ”Television in Europe”, Eli Noam12 outlines the historical development in broadcasting related to the political development and ownership in the following phases: 1) Early private, 2) state-broadcasting, 3) Independent public, 4) privileged private and 5) open broadcasting (see Table 2-1).
Country Early private State broadcasting
Independent Public
Privileged private
Open broadcasting
Denmark 1920-1926 1926-1959 1959-1988 1988- - Finland 1921-1934 1934-1958 - 1958- - France 1921-1938 1938-1986 - 1986- Italy 1924-1929 1929-1975 - - 1975-
11 To prevent such pirate broadcasting the Telecommunication by radio Act of 1949 had legislated that, ”The setting up of, operation of, or use of broadcasting stations on the open sea or in the air space above it shall not be permitted.” On that basis, radio Mercur was shut down by the government in 1963. 12 Noam 1991

Chapter 2: Regulatory framework of broadcasting In Europe and US, a historical analysis 17
Netherlands 1919-1924 - 1924-1990 1990- - Norway 1923-1933 1933-1980 1980-1990 1990- - Sweden 1923-1933 - 1933-1991 1991- - Germany 1923-1927 1927-1949 1949-1987 1987- - UK 1920-1926 - 1927-1954 1954-1990 1990- USA 1920-1926 - - 1926-1980 1980-
Table 2-1 Different stages of broadcasting13 A definition of different phases is given in the following: ’Early private’ was when broadcasting was driven by private initiatives and when governmental regulation was minimum. ’State-broadcasting’ was the phase where governments had the monopoly and when broadcasters were connected to the government both politically and regarding the organisation. ‘Independent public’ is characterised by governments having monopoly but where the broadcaster had a more independent status related to the governmental institution. ‘Privileged private’ refers to the phase when government allows private broadcasting, however to achieve this right the broadcaster must accept governmental regulations. And finally the phase of ‘open broadcasting’ must be understood as open market situation, where governmental regulation is very limited. These phases and especially the borderline between different phases are not necessarily correct. For example in Denmark it is difficult to find a sharp borderline between state and independent broadcasting. The borderline between ’privileged private’ and ’open broadcasting’ is not so obvious either, and furthermore, today, all the countries in the table must be placed in the ‘open broadcasting’ phase – because of the high penetration of cable and satellite networks. Regarding terrestrial transmission, because of the resource scarcity, which also is valid in the digital age, many countries are still in the ‘privileged phase’. The advantage of this table is however clear: It is a very useful kind of overview, where many countries are set in a common frame. Furthermore it shows clearly the differences and similarities between the European and American development, where today the stage of privileged broadcasting also dissolves in the US satellite and cable market but remains in the terrestrial market. Today, there are a variety of combinations in the ownerships and financing forms in radio and TV broadcasting: Government owned public service institutions that are financed fully by license fee; government owned public service institutions that are partly financed by advertisement; Privately owned stations that are financed by advertisement and have public service obligations; privately owned stations without public service obligations that are financed by advertising; privately owned pay -TV-stations; and many others, including many local broadcasters with different financing forms. In other words, we are far into the phase that Noam calls the ‘open broadcasting phase’, with a variety of offers and different radio and TV stations. In the following a more detailed description of public service broadcasting in Europe is given.
2.2.2 Public service broadcasting The concept of public service broadcasting originates from the early days of British broadcasting in the 1920s and has continuously been closely related to broadcasting 13 Ibid. Page 316. The table is partly represented here. Furthermore, in Eli Noam’s table, state monopoly in Denmark occurs in 1925. This is corrected to 1926.

Chapter 2: Regulatory framework of broadcasting In Europe and US, a historical analysis 18
developments in Great Britain in the creation of BBC. However as mentioned above, other European countries have adopted similar forms for regulation of broadcasting. As seen in the following, the situation has been somewhat different in the US market, with commercial broadcasting dominating the field and public broadcasting developing much later. The concept, practice and institution of public service broadcasting have thus existed for a good number of decades. However, the increasing focus that we witness today in Europe regarding public service broadcasting is relatively new. It started in the 1980s with the challenge to public service broadcasters from satellite and cable transmission and the liberalisation of broadcasting. In this respect, the discussion of public service broadcasting resembles the discussion in the telecommunication area regarding universal service. Universal service discussions first gained strength when the incumbent telecommunication monopoly operators were challenged by the threat of competition. Today, public service broadcasting may be interpreted as a deal between broadcasters and the state, where broadcasters are assigned radio frequencies for the delivery of broadcasting with a public interest dimension. As in the case of telecommunications, there is a tendency to interpret history in the light of present understandings. In the case of telecommunications, the history of universal service has often been understood as an agreement to deliver universal service for monopoly rights. However, whereas this interpretation has been shown to be, at best, very defective14 (with interconnection as a much more important factor than universal service), there is more substance to the interpretation in the case of broadcasting - though it may not be a deal between an independent broadcaster and the state, but the state taking hold of the usage of scarce radio frequencies for the transmission of certain (public service) contents. In an Oftel document, “Beyond the Telephone, the Television and the PC – III”15, public service broadcasting is defined in the following way:
“At the minimum it involves special rules applied to broadcasters … in order to influence broadcasters’ portfolio of content and consumers’ access to services”.
As mentioned above, the dominance of public service broadcasting in different European countries varies significantly. The Scandinavian countries, e.g., represent markets with heavy dominance by national public service broadcasting institutions, which according to Preben Sepstrup, rely on the same basis of concepts and principles:
“Radio and television must not be commercial business, radio and TV must not be a state business proper, and are obliged to serve the public interest”16.
In summary, the Scandinavian regulations state four obligations for public service broadcasters:
“The public service broadcaster is obliged: 1. To supply the public with a versatile program mix, which is relevant to all
groups of population, including minorities and including prime time. 2. To produce a substantial part of the programs and, in doing so, maintain its
integrity towards both economic and political interests in the society. 3. To distribute the radio and TV signals so that they can be received at the
same price by all households in the country. And
14 Mueller M.: “Universal Service in Telephone History: a reconstruction." Telecommunications Policy 17, 5 – 352-69, 1993. 15 Oftel: ”Beyond the Telephone, the Television and the PC – ”, March 1998, http://www.oftel.gov.uk/broadcast/dcms398.htm 16 Sepstrup P.; ” Scandinavian Public Service Broadcasting: The case of Denmark”, in Avery R.K. (ed.):”Public Service Broadcasting in a multichannel environment”, Longman publishing group, 1993

Chapter 2: Regulatory framework of broadcasting In Europe and US, a historical analysis 19
4. To support the national production of cultural products”17
Hence the content and access are the two basic elements of public service broadcasting – in contrast to universal service in telecommunications where only access is important. These are the two basic requirements that the state has towards public service broadcasters in exchange for the usage of the limited frequency resources. In analysing public service broadcasting, however, two other elements must be considered; funding/ownership and frequencies. In this section, content, access and funding/ownership are discussed (the frequency question is discussed at length in the next chapter):
• Content, including control and positive programming
• Access, including coverage of broadcast signals and affordability
• Financing and ownership
2.2.2.1 Content The content issue in public service broadcasting has both a control (negative) aspect and what is often called positive programming, i.e. requirements for diversity and pluralism in the programming. The keen interest in the content issue stems from the great ideological and political power that broadcasting media have. In Europe, the states wanted to control these powerful media directly, whereas in the US, the majority of licenses were given to commercial companies, and social control has been based on a ‘public trustee’ model. The logic of ‘public trustee’, dictates that private vendors in limited competition can provide better services than can a publicly managed system. Because spectrum is a public property, however, in order to maintain their access to it, broadcasters would need to demonstrate their responsiveness to the “public interest, convenience and necessity” at regular Intervals18. The reason that direct control was important in Europe was the centrality of the nation state in a multi-nation / multi-state Europe. The broadcasting media were, therefore, assigned the role of uniting the nation and extending the hegemonic national, linguistic, cultural values. The broadcast media were thus assigned an educational role, both in the narrow sense of extending education but also in the broader cultural and political sense, giving way to a strong paternalistic tradition in public service broadcasting. Over the years, the understanding of public service broadcasting has, however, changed from more paternalistic and nation state oriented programming toward diversity and pluralism aiming at serving different groups of end-users (narrow programmes) and focusing on quality in the broader programmes.
2.2.2.2 Access There is also an access aspect of public service broadcasting. The people of a nation or a region, in which a public service broadcaster is assigned a licence, must all be able to receive the signals and the services delivered by the broadcaster. It must, therefore, be a free to air signal that does not need any decoding19 to be transformed into an
17 Ibid. 18 Neuman W. R., McKnight L. Solomon R. J.:” The Gordian Knot, Political Gridlock on Information Highway”, the MIT Press, Cambridge, Massachusetts, London, England, 1998 19 In digital broadcasting, however, it can be necessary to scramble the signals because of, e.g., copy

Chapter 2: Regulatory framework of broadcasting In Europe and US, a historical analysis 20
understandable picture and/ or sound. Furthermore, the price of the service must be affordable to people in general. This is similar to the universal service requirement in telecommunications. However, because of the differences between the two technologies, there are also some differences in the universal service practices. In telecommunications, every body has the right to receive the basic services defined on equal terms and at affordable prices – equal terms meaning equal quality and price no matter where geographically. In broadcasting, it may be a bit more difficult to interpret the universal service requirement. In some areas, terrestrial signals are not equally strong – the reason possibly being factors that the broadcaster has no influence on, such as high trees. Moreover, all homes may not be able to receive satellite signals because they do not have a satellite dish or are connected to a cable TV network. In Denmark, this has caused a lively discussion because the incumbent broadcaster, DR, has opened a satellite TV-channel, DR2, that hitherto only has been visible for homes with satellite dishes or connection to cable networks.
2.2.2.3 Funding and ownership There is, furthermore, an institutional aspect of public service broadcasting. Public service broadcasters in Europe have been state institutions of different kinds, e.g. by ownership. Generally, however, they have kept distance to the state and the central state institutions have not directly interfered in the programming. Financing of European public service broadcasters has generally come from licenses paid by owners of broadcast receivers (televisions and radios). In the US, public service broadcasters are not state-owned and are not financed by licenses but by grants/ donations and collections. In the US, there is a negotiated deal between public authorities and public broadcasters. Public broadcasters are assigned licenses in exchange for a commitment to broadcast material that is considered to have a public service dimension. (see more in the next subsection on US broadcasting) The resistance against using advertising to finance broadcasting came originally from the writing press:
“There is no doubt that the first [Danish] broadcasting act was inspired from the principals governing BBC and influenced by the “vested interests” of the newspaper industry, which for a long time ran the news service for the Danish Broadcasting Company (DR) and ensured that there would be no advertising”20
Later, different other types of argument, such as the possible influence from advertising to the content market (see next chapter) were (and are) used to resist the involvement of broadcasters in advertising market. But advertisers have always tried to gain access the broadcasting market and, as shown above, they succeeded in doing so in 1955 (by introduction of the British ITV). During the past few decades, broadcasters that are partly or wholly commercial have also taken on a public service broadcasting commitment in exchange for terrestrial frequencies. In Denmark, TV2 is a fully state-owned broadcaster with public service broadcasting obligations, but it is partly financed by commercials. In Sweden, TV4 is a private channel with public service broadcasting obligations financed by commercials. Most countries have examples of such hybrid public service channels.
right issues in terms of spill-over, obvious in satellite network but also valid in terrestrial networks due to spill-over to the neighbouring countries. This is the case of digital terrestrial broadcasting in Sweden where the public service signals are scrambled. The decryption card must then be distributed to the license payers without (or with minimum) cost. 20 Sepstrup 1993

Chapter 2: Regulatory framework of broadcasting In Europe and US, a historical analysis 21
2.2.3 European regulation In 1957 the European Economic Community (ECC) was established based on the Rome Treaty and with the initial participation of six countries. The objective was to ease the free movement of goods, capital and services. In 1994 the EEC changed to the European Union (EU) based on the Maastricht Treaty. At present, mid 1999, the EU consists of fifteen members. Free movement of services was included in the Rom Treaty but telecommunication remained a nationally regulated business until 1987. In 1987 with the “Green paper on the development of the common market for telecommunications and services and equipments”, the first common European efforts for liberalisation of the telecommunication market started. The goal was to fully liberalise the state-controlled telecommunication markets in Europe. Mainly, two different legal instruments were used:
“1. Introducing open and fair competition with the privatisation of the state-owned public PTTs (Post, Telegraph and Telephone) and markets; 2. Harmonizing the (mostly very different) technical specifications of all member sates”21
eleven years after the 1987 Green paper, EU succeeded to free the market for telecommunications services and infrastructures in January 1998. Broadcasting was not a part of this telecommunication regulation. Common regulations on broadcasting can be traced back to the “Television without frontiers” Directive of 1989. In the following this directive is described. Furthermore it is shown to what degree European regulation also concerns public service broadcasting. European regulation / harmonisation has also played a major role in the standardisation of broadcasting technology and services, which is described in detail in the next chapter.
2.2.3.1 TV without frontiers 1989 was the starting point for enforcement of common regulations and liberalisation of European broadcasting. It was with the “TV without Frontiers directive” (89/552/EEC), liberalisation and regulation of broadcasting got a European dimension. As seen through the historical analysis, national regulations of the broadcasting sector have been very important for European countries. Replacing this close interdependency between national regulation and the sector with overall European rules was difficult from the beginning. But the special characteristic of satellites, where the up link station and the end-consumers can be in different countries, required common regulations in the field22. To underline that the intention was not to interfere in the national regulations, it was stated clearly in the article 3 of the 1989 directive that:
“Member states shall remain free to require television broadcasting under their jurisdiction to lay down more detailed or stricter rules in the areas covered by this Directive”23
The directive was based mainly on the article 57 of the Rome Treaty that covers the issue of free movement and delivery of services throughout the EU. This is stated clearly in the text 21 Bruin and Smith 1999, Op.Cit. 22 Otherwise, when the uplink was located in another country, the only possibility was to regulate reception of the signals. This was done in the beginning in, e.g., Sweden and Denmark, by prohibiting the use of satellite dishes and consequently impending the reception of the satellite signals. This policy was of course unusable in a democratic country in long run. 23 Directive 89/552/EEC

Chapter 2: Regulatory framework of broadcasting In Europe and US, a historical analysis 22
of the directive: “… Whereas television broadcasting constitutes, in normal circumstances, a service within the meaning of the [Rome] Treaty; Whereas the Treaty provides free movement of all services normally provided against payment, without exclusion on ground of their cultural or other content and without restriction of nationals of Member States established in the Community country other than that of the person for whom the services are intended; ….”24
Furthermore other considerations like, establishing an even closer union among the people of Europe, promotion of broadcasting production in Europe, and protection of television viewers in advertising financed TV can be identified as background for the 1989 directive. The directive itself, deals primarily with the tasks like:
• Member States shall ensure freedom of reception and shall not restrict retransmission on their territory of television broadcast from other member states for reasons, which fall within the field coordinated by this directive.
• Member states shall ensure, where practicable and by appropriate means, that broadcasters reserve at least 10 % of their transmission time for European works, created by producers who are independent of broadcasters. This is in line with the Directives overall intention of promoting “European works” within broadcasting.
• Regulation of advertising in broadcasting regarding among others: o Characteristics of advertising, e.g., advertising shall be recognizable and kept
separate from the program itself. o How to place advertising between and inside programs. o The programs, which are not allowed to contain advertisements, like religious
services. o The products, which are not allowed to be advertised, like tobacco and
cigarettes.
• Protection of minors Some parts of the directive, like the rules for the protection of minors and rules regulating adverting, have been tested by member states in different courts. The judgments of the courts can be found in the first, second, and third reports on the Application of Directive 89/552/EEC. The results from these court decisions are among reasons, which have resulted in an amendment of the 1989 Directive and adoption of a new Directive, 97/36/CE. Other reasons for this amendment have been the general development of information society, including the Commissions communication on 19 July 1994 entitled ‘Europe’s way to the information society: an action plan’, where the importance of the regulatory framework applying to the content of audiovisual services is underlined. The most important new issue in the 97 Directive is the rule about the broadcasting of major events. In the following based on a summary of the new directive (called “the new “television without frontiers” Directive) the major elements of the new directive are outlined. Some of the points are just clarification of the rules in the 1989 Directive:
“Principles of jurisdiction: The directive makes it clearer under which Member State's jurisdiction television broadcasters fall; this is determined mainly by where their central administration is located and where management decisions concerning programming are taken.
24 Ibid.

Chapter 2: Regulatory framework of broadcasting In Europe and US, a historical analysis 23
Freedom of reception and retransmission: It is confirmed that, as a general rule, the Member States must ensure freedom of reception and must not restrict the retransmission on their territories of television broadcasts from other Member States for reasons falling within the fields coordinated by the directive.
Better legal redress: Appropriate procedures are to be introduced by the Member States, via their own legislation, to enable third parties concerned, including nationals of other Member States, to refer to the competent legal or other authorities in order to ensure compliance with the directive.
Events of major importance to the public (particularly sport): The Member States may each draw up a list of events, which must be broadcast unencrypted even if exclusive rights have been bought by pay-television stations. On the basis of the principle of mutual recognition, they must ensure that the various stations respect each of these lists. The events concerned may be national or other, such as the Olympic games, the World Cup or the European Football Championship. These provisions apply to contracts concluded after the publication of the directive and relate to events taking place after its entry into force.
Measures to promote European programmes: The clause requiring televisions stations "where practicable" to reserve a majority proportion of their broadcasting time for European works remains unchanged; a certain flexibility continues to be allowed for the implementation of this provision. The definition of European works has been extended to include co-productions with third countries.
Definition of European works: Productions which are not "European works" but are made under bilateral co-production agreements concluded between Member States and third countries will be treated as European works if the major portion of the costs of the production is covered by the Community co-producers and provided that the production is not controlled by a producer or producers established outside the territory of the Member States.
Independent productions: Member States must introduce a definition of "independent producer" to facilitate application of the rule requiring 10% of transmission time or of programme budget to be reserved for independent productions.
Film broadcasting: The periods for which cinematographic works may not be broadcast on television after first being shown in cinemas have been abolished. Member States are merely required to ensure that the periods agreed between broadcasters and rights-holders are complied with.
Television advertising: The provisions concerning advertising remain virtually unchanged. The limit of 20% of any given one-hour period of broadcasting time has been altered to 20% of any given clock hour. Self-promotion is assimilated to advertising and subject to most of the same provisions. Public service messages and charity appeals are not to be included for the purposes of calculating these maximum periods.
Teleshopping: A definition of teleshopping is introduced. Teleshopping is made subject to virtually the same rules as advertising. The one-hour per day limit for teleshopping is abolished. Teleshopping channels are subject to most of the provisions of the directive. Teleshopping windows on the generalist channels have to last at least 15 minutes and be clearly identifiable. They may not number more than 8 per day and their total duration may not exceed 3 hours per day. Teleshopping must not incite minors to conclude contracts for the purchase of goods or services.
Sponsorship: Pharmaceutical companies may in future sponsor broadcasts but will still not be able to promote specific medicines or medical treatments.

Chapter 2: Regulatory framework of broadcasting In Europe and US, a historical analysis 24
Protection of minors and public order: Programmes which might seriously impair the development of minors, are prohibited. Those, which might simply be harmful to minors must, where they are not encrypted, be preceded by an acoustic warning or made clearly identifiable throughout their duration by means of a visual symbol. Broadcasts must not contain any incitement to hatred on grounds of race, sex, religion or nationality. Within one year, the Commission is to submit a study of the advantages and disadvantages of other measures to facilitate parents' control of broadcasts watched by their children.
Right of reply: The provisions relating to the right of reply of parties whose reputation and good name have been damaged by an assertion of incorrect facts in a television programme have been strengthened.
Monitoring of the directive: A contact committee has been set up to monitor the implementation of the directive and developments in the sector and as a forum for the exchange of views. Chaired by the Commission and composed by representatives of the authorities of the Member States, it may be convened at the request of any of the delegations.”25
2.2.3.2 European regulation and public service As described above, Public Service Broadcasting has a strong historical and national component. Even in the era of competition, Public Service Broadcasting plays a vital role at a national level with overall cultural and language related responsibilities. This can, among others, be seen in the national governments’ dedication of resources in digital terrestrial platforms to Public Service broadcasting resulting in continuation of the privileged status of Public Service broadcasters in different European countries. Also at European Union (EU) level special attention has been paid to Public Service Broadcasting:
“The parliamentary Committee on Culture, Youth and Media adopted a report on the Public Service TV (PST) on July, 1996. This report stresses the importance of PST and calls on the commission to do following:
• Propose changes to the treaty to allow development of positive PST policy;
• Exclude PST from provisions of future media concentration legislation;
• Recognise the key role of PST in a forthcoming Green Paper on new audiovisual services;
• Financially support European PST, such as ARTE and EURONEWS.”26 This report and several expert meetings27 resulted in a PST protocol that has been added to the Amsterdam treaty. The protocol allows member states, among others, to finance national television channels in return for public services obligations. The details of public service must however be defined at a national level.
2.2.4 Regulation of satellite and cable platforms One of the important issues in regulation of satellite broadcasting in Europe is to agree on which country has the right to regulate a specific broadcaster. It is stated clearly in the
25 The new “Television without Frontier” Directive. 26 Bruin R. and Smits J. 1999, Op.Cit. 27 Ibid.

Chapter 2: Regulatory framework of broadcasting In Europe and US, a historical analysis 25
above-mentioned 1997 Directive that it is the country of origin, where “their [broadcasters’] central administration is located and where management decisions concerning programming are taken”. The technology used in terrestrial broadcasting, and the way allocation of resources for terrestrial broadcasting are handled, make terrestrial broadcasting a local business, addressing a local market. As seen in the following subchapter, in the US, e.g., broadcasting industry is formed around these local markets. To have countrywide coverage, which is used widely in Europe, it is necessary to transmit the same type of programming in several local markets. The point regarding regulation is that apart from areas around country borders, service can be kept totally inside the country, and the country of origin is also the country of the end-consumer. This makes possible the national regulation of the service that is consumed in the country28. Regarding satellite broadcasting, the country of origin can be different from the country where the service is consumed. The broadcaster will place its administration in the countries that give them best opportunities. An example in the Scandinavian countries is TV3, a popular TV channel, which is transmitted from England and conforms to English regulations. In this way TV3 avoids conforming to Scandinavian regulation on advertising, one of the strictest in the EU. Of course if the country of origin is within the Scandinavian countries, for example, in Denmark even, satellite broadcasting targeted to other countries must undergo Danish regulation. Regarding cable TV, in so far as the cable operator is not involved directly in programming and only retransmits satellite signals, the individual broadcasters must conform to the regulations of the country of origin. If the cable operator is involved in programming, as in regard to the provision of cable-only channels, the national regulation is applied. Among others, because cable TV can be considered as local monopoly, there are detailed rules regarding the services that may be available on the network. One of the important rules applied both in Europe and the US is the “must carry” rule, which requires that certain TV channels are deemed necessary to be distributed in every cable TV network29. In Denmark, e.g., the national public service and local terrestrial channels are available in all cable TV networks due to the “must carry” rule. Access to the “must carry” channel must further be affordable. This has resulted in a structure where the channels are provided in different packages (bouquet/tire) with one of them (the cheapest one, called the basis package) containing as minimum all “must carry” channels. The other packages (optional packages) contain mostly services from satellite networks. There are also different rules on how the channels in the optional packages may be selected. In Denmark, e.g., the cable operator must ask the users and, by majority voting, the channels in the optional package are selected. The services beyond the optional package are premium pay TV channels that are offered directly to the end-consumers who subscribe to the service and are not covered by any regulation.
2.3 US As seen in the following, from the beginning, commercial actors have dominated broadcasting in US. What is more important, there has never existed a free broadcasting market in US. The market can, at best, be characterised as (regulated) oligopoly. Oligopoly, because of the transmission resource scarcity resulting in limitation of number of
28 Here regulations based primarily on resource scarcity are applied in almost every single country 29 The must carry rule is not applied to the satellite networks but it is interesting that the satellite networks, both in the US and Europe, try to carry the “must carry” signals free of charge and without any regulations in establishment of their business.

Chapter 2: Regulatory framework of broadcasting In Europe and US, a historical analysis 26
broadcasters operating in a market, and regulated, because the broadcasters were (and are) obliged to conform to a set of content regulation rules, denoted as public interest regulation in return for broadcasting licence. Public broadcasting emerged to provide services, which were not profitable for commercial broadcasters, like education related programming, but the federal and state governments avoided involvement in the funding of the service until the late 1960’s. Funding was mainly due to user contribution and contributions from private funds. In the following, a short history of broadcasting, including public broadcasting, in the US market is given. Further the structure of the regulation is described. Finally some of the main issues in regulation of broadcasting in the US market, including “public Interest” regulation are described.
2.3.1 Short history After a brief period in the beginning of the 1920’s, where there was no control on broadcasting and where the number of the broadcasting providers increased to a level where the interference problem was acute, the American government decided to implement a regulation framework to control the service provision. The objective of this regulation was mainly to solve the technological problem of frequency interference. The first regulatory organ was the FRC (Federal Radio Commission), and later the FCC (Federal Communication Commission) was established to regulate both telecommunications and broadcasting. In the beginning there was no regulation regarding broadcasting in the US, and several radio stations emerged with many different purposes. A range of different actors could be identified in radio broadcasting, from the amateurs and new inventors who wanted to explore the opportunities in the new medium, to researchers at the universities and patent holders like Marconi who developed products for wireless telegraphy. The situation got chaotic:
“There were so many stations and no rules for using the frequencies. Everybody wanted to talk but nobody could hear anybody. This imposed the necessity for some type of regulation to put an end to the ‘chaos in the ether’. The regulation that was imposed had the character of ‘traffic regulation’ but since the frequencies were scarce, the regulatory duty grew into the area in which consideration of common goods (i.e., public interest, convenience and necessity) were used to find or justify criteria for allocation” 30.
The regulation got more comprehensive and already the first legislation, Radio Act of 1927, contained both market and content regulations:
“From the beginning, broadcasting in the US developed under different political and legal conditions than in central Europe. At no time did the federal government have a broadcasting monopoly. This would have conflicted with the understanding of the basic First Amendment right of freedom of speech and the press. Accordingly, government regulation is not there to serve a comprehensive, ‘positive’ assurance of the communication system but, rather, to create certain minimum conditions for a functional broadcasting order”31.
In contrast to Europe, the licenses for broadcasting in the US were given to local, commercial stations, resulting in the current situation with a large number of radio and TV stations. Funding has primarily been through sponsoring and advertisement. The rapidly 30 Hoffmann-Reim W.: “Regulating Media”, The Guilford Press, New York and London, 1996 31 Ibid

Chapter 2: Regulatory framework of broadcasting In Europe and US, a historical analysis 27
growing national advertisement industry began to create national commercial networks and centralised program production32. This led to the creation of 3 main networks: National Broadcasting Company (NBC), Columbia Broadcasting System (CBS) and later American Broadcasting Company (ABC). For decades, commercial broadcasting was controlled by these networks and the success and survival of several local stations were dependent on whether they were affiliated with one of these networks. Alongside with the development of the commercial market, public broadcasting emerged to fill the programming void left by commercial TV. The important thing here is not that American broadcasting was regulated, but that the way the market was structured has resulted in a situation, where a few actors have dominated the traditional broadcasting market (The domination of few national networks in US can easily be compared with the situations of public service broadcasters in large European markets like Germany and France). Consequently, the incumbent challenger dynamic in both European and American markets has been quite similar, where the incumbents have used all their power to keep their privileges, e.g., in resisting the satellite and cable providers to enter the local markets.
2.3.2 Structure and ownership The backbone of the American broadcasting consists of local stations. In addition, there are countrywide networks that own some local stations and have agreements with others to transmit their programmes. Table 2-2 shows statistics about the number of TV stations in the US from 1994 to 1995. Different categories of stations can be identified regarding their ownership:
• Stations owned by the networks: These are called O&O (Owned & Operated) stations and are the property of the networks and everything connected to them, regarding administration, programme policy etc. are decided by the networks.
• Independent stations: Private persons and firms own these stations either singly or in groups. The owner decides on the program policy, and will add the local production by programs acquired elsewhere.
• Affiliated stations: The ownership is like the independent stations, but their program policy is connected to the networks. The contract with the networks obliges them to show network programs in predefined time intervals and consequently to canalise some of the advertising revenues to the networks.
It is through O&O and affiliated stations the networks in US have countrywide coverage, similar to the European public service. Following table shows the number of the different stations in US.
1994 1995 1996 1997 1998 1999
TV stations total 1512 1532 1533 1574 1572 1558 Here of commercial 1145 1161 1174 1205 1204 1216
UHF 584 599 620 654 642 654 VHF 561 562 554 560 562 562
32 Willard 1998

Chapter 2: Regulatory framework of broadcasting In Europe and US, a historical analysis 28
Table 2-2 Number of TV stations in USA33
2.3.3 Actors The following table (Table 2-3) gives an overview of the 6 commercial networks in the American traditional (terrestrial) TV broadcasting market. These will be explained in more details later34.
TV network Start year Ownership
NBC 1940 (radio in 1926) Bought for $6,28 bill. US$ in 1986 by GE
CBS 1941 (radio in 1927) Bought for $5,4 bill. US$ in 1995 by Westinghouse Electric. In September 1999 it was bought by Viacom for 37,2 bill. US$.
ABC 1948 In 1986 bought by Capital Cities Communication for 3,5 bill. US$ and in 1995 by Walt Disney Company for $19 bill. US$
FOX 1986 Rupert Murdoch
UPN 1995 Paramount & BHC communication
WB 1995 Warner Brothers
Table 2-3 TV networks in USA • NBC: NBC (National Broadcasting Company) is the first broadcasting network in the
US. It started as a radio network in 1926 and later when TV technology emerged, it was one of the important actors in the introduction of TV. NBC’s TV transmission began in 1940. NBC was one of the owners of RCA (Radio Corporation of America) in 1920’s. In the beginning, the financing of NBC was based on selling radio equipment and later it deployed advertisement financing. In 1986 General Electrics (GE) bought NBC for 6.28 bill. US$.
• CBS: CBS (Columbia Broadcasting System) began as an independent American network in 1927. CBS has in long periods been the leading network, in regard to the viewer- listener ratings. In 1995 CBS was bought by Westinghouse Electronics for 5.4 bill. US$.
• ABC: The third network, ABC (American Broadcasting Company), did not exist in the first phase of the radio era and was established in 1948 as a TV network. For a long period ABC was the third biggest network in the viewer ratings until 1976 where ABC conquered the first place. In 1986 ABC was bought by Capital Cities Communication for 3.5 Bill. US$ and changed its name to Capital Cities /ABC, and in 1995 Walt Disney bought the company for the value of 19 Bill. US$. Walt Disney changed the name back to ABC.
• FOX: With his immense financing resources from other media businesses, Australian Roubert Mourdoch started FOX network in Fall 1986. From one single evening program provision in 1987 FOX developed to produce programs for 5 evenings in 1990 and seven evenings in 1993. FOX targeted its program provision from the beginning towards the young and the ethnical groups.
33 TV and Cable Fact book 1999 34 The informations are mainly from: Walker J. and Ferguson D.: ”The broadcast Television Industry”, Allyn and Bacon, 1998

Chapter 2: Regulatory framework of broadcasting In Europe and US, a historical analysis 29
• WB: Owned by Warner (Brothers) Communication WB started its program provision in 1995. In 1995 and 1996 WB was a purely losing concern, and it started working on a merger with UPN that never got implemented. WB is one of the stations that apart from O&O and affiliated stations has contracts with some of the super-stations35, which results in national coverage of its services.
• UPN: BHC Communication owns United Paramount Network (UPN) and began its service provision in 1995. UPN owned 156 stations in the beginning of 1996 and was very popular from the beginning. UPN had a deficit in 1995 – 96, but among others by targeting its programs towards Afro-Americans gained more and more success.
2.3.3.1 Public broadcasting The necessity for non-commercial broadcasting has been in the debates from the beginning of the broadcasting history in the US. Non-profit broadcasting has never had the best conditions for service development. However, during the early 1930s, as the Depression deepened and a broader debate raged about appropriate economic and social reforms, there was a certain degree of dissatisfaction with the limited extent of public service in commercial radio36. Many educational institutions, particularly land grant colleges and universities, continued to develop a separate system of educational stations. But by the mid-1930s, such efforts had failed. As a result of the Depression and the discriminatory spectrum allocation and other licensing policies of the Federal Radio Commission (FRC), many public agencies and private non-profit institutions withdrew from radio operations (frequently selling out to commercial interests)37 After World War Two, the structure of non-profit broadcasting was an amalgamation of individual decentralised stations with their own broadcasting licenses, individually tailored broadcasting schedules and station management38. The first federally funded television programming was established under the auspices of the 1958 National Defiance Act. Later, in 1967 Congress passed the Public Broadcasting Act with emphasis on public broadcasting, the establishment of new national funding and program service agencies and the appropriation of federal funding for public broadcasting39. Public broadcasting in the US consists mainly of:
• 350 TV stations and hundreds of radio stations.
• A centralised Corporation of Public Broadcasting (CPB) that is a private non-profit organisation created by Congress in 1967. CPB funds the local public radio and TV stations using among other means an annual appropriation from Congress.
• Public Broadcasting Service (PBS) owned and operated by public TV stations in the US. PBS has the role of providing technical interconnection among the public TV stations and co-ordination of their program schedule for them. For a long time when the US market was dominated by three major networks, PBS was known as the fourth network.
The source of programming for public broadcasting has been its own production, national suppliers and import of programs from abroad. Especially BBC has been a major provider of programming to public broadcasting in the US.
35 Local stations, that transmit via satellite to the whole country. 36 Willard D. R.: “The institution of U.S. Public Broadcasting”, In Noam E.M. and Waltermann J. (ed.) (1998).1998, pp. 55-64 37 Ibid. 38 Ledbetter J.: “Funding and Economics of American Public Television”, in Noam E.M. and Waltermann J. (ed.) (1998). 39 See among others Willard 1998 and Ledbetter 1998.

Chapter 2: Regulatory framework of broadcasting In Europe and US, a historical analysis 30
Public broadcasting is financed with the aid of federal government, individual states, and private contributions. Furthermore it is possible to achieve funding through sponsoring. Table 2-4 shows an overview of financing possibilities in the US. Furthermore important legislation and regulation regarding public broadcasting is depicted.
Federal Non federal
State & Local Private
Regulation Year Total
(mill. US$ )
% Total (mill. US$ )
% Total (mill. US$ )
%
Total (mill. US$ )
Public Broadcasting Act of 1967 (PL 90 - 129)
Public Broadcasting financing Act of 1970 (PL 91 - 411)
1967 - 1971
1972 59.8 25.5 107.7 46.0 66.8 28.5 234.3
1973 55.6 21.8 127.3 50.0 71.9 28.2 254.8
CPB Appropriation Authorization (PL 92 - 411)
CPB Appropriation Authorization (PL 93 - 84)
1974 67.1 23.1 139.1 47.9 84.3 29.0 290.4
Public Broadcasting financing Act of 1975 (PL 94 - 192)
1975 92.3 25.3 156.6 42.9 115.9 31.8 364.8
1976 130.1 30.0 175.9 40.6 127.3 29.4 433.3
1977 135.3 28.1 191.3 39.7 155.6 32.3 482.1
Public Telecommunication financing Act of 1978 (PL 98 - 214)
1978 160.8 29.1 218.2 39.5 173.4 31.4 552.3
1979 163.2 27.0 245.5 40.7 194.7 32.3 603.5
1980 192.5 27.3 271.6 38.5 240.7 34.2 704.9
Omnibus Reconciliation Act of 1981 (PL 97 - 35)
1981 193.7 25.2 277.5 36.1 297.7 38.7 768.9
1982 197.6 23.4 301.0 35.6 346.6 41.0 845.2
FCC Authorization Act of 1983 (PL 99 - 279)
1983 163.7 18.2 318.3 34.4 417.1 46.4 899.2
1984 167.0 17.1 334.5 34.3 472.8 48.5 974.2
Consolidate Omnibus budget Reconciliation Act of 1985 (PL 99- 272)
1985 179.5 16.3 358.4 32.7 558.7 51.0 1096.3
1986 185.7 16.4 378.8 33.4 569.5 50.2 1130.4
1987 243.0 18.8 389.2 30.1 662.3 51.2 1294.5
Public Telecommunication Act of 1988 (PL 100-626)
1988 247.5 18.1 415.9 30.4 704.4 51.5 1367.8

Chapter 2: Regulatory framework of broadcasting In Europe and US, a historical analysis 31
1989 263.9 17.0 454.0 29.3 830.7 53.6 1548.7
1990 267.4 17.0 473.8 30.0 840.2 53.0 1581.5
Public Telecommunication Act of 1991(for 94 – 96)
1991 333.4 19.4 503.4 29.3 884.0 51.4 1720.9
1992 373.8 20.9 484.5 27.1 931.8 52.1 1790.1
1993 369.5 20.6 475.1 26.5 945.4 52.8 1790.2
1994 329.9 18.4 509.5 28.4 955.1 53.2 1794.1
1995 338.4 17.7 560.5 29.2 1018.4 53.1 1917.2
1996 338.9 17.3 517.6 26.5 1099.1 56.2 1955.7
Table 2-4 Development in financing public broadcasting in USA40 As seen from the table, the contribution from Congress has been very much dependent on the political system. This is clearly indicated in table at 1983, when the Reagan administration cut off some of the government contribution.
2.3.4 The structure of regulation of broadcasting Regulation of broadcasting started with the Radio Act of 1927. Later it was integrated in the Telecommunication Act of 1934, which has since been the basis for regulation of broadcasting in the US market. Since 1934, there have been several amendments and changes to the Act, with the latest amendments forming the Telecommunication Act of 1996. Furthermore, there are other separate sets of regulations such as the Cable TV Act, 1984 and the Children Programming Act, 1980, concerning broadcasting services. In Figure 2-1 different actors involved in regulation of broadcasting in the US market and their interrelationship is depicted.
40 Source: Willard1998, Op. Cit.

Chapter 2: Regulatory framework of broadcasting In Europe and US, a historical analysis 32
FCC
White House Congress Federal Courts
Industry resistance
Viewers and voters
The organised
public
Television industry
Figure 2-1: Model for broadcast TV control41
In the following, based on the analysis given in “The broadcast television industry”42 the structure of regulation of broadcasting in the US market is described.
FCC The central actor in regulation of broadcasting in US is the Federal Communications Commission (FCC). FCC is the independent regulatory agency established in connection with the Telecommunication Act of 1934, in charge of the regulation of telecommunications and broadcasting, including among others, frequency allocation/allotment/assignment, standardisation of technology, regulation of ownership and content regulation (e.g., requirements on a minimum of children and educational programming). The control of broadcasters is done in different ways:
• Through the creation of rules and imposition of penalties for violation of rules.
• Through de facto rules. Thus, the reasons for denying renewal of the broadcasting licenses will be a de facto rule43.
• Through production of position papers that state the current FCC position on issues of concern.
and
• Through indirect influencing the television industry by promoting informal negotiations among conflicting parties44.
At present, FCC has five commissioners, including a chairman. To avoid domination of one party, no more than three of the commissioners can be from the same party.
41 Walker J. and Ferguson D.: ”The broadcast Television Industry”, Allyn and Bacon, 1998. 42 Ibid. 43 According to Walker and Ferguson (1998), in 1966, when WLBT in Jackson Mississippi lost its license for failing to serve its community’s African American minority, the television industry was served notice that racism would have a price. 44 Walker and Ferguson 1998, Op. Cit.

Chapter 2: Regulatory framework of broadcasting In Europe and US, a historical analysis 33
As it is depicted on the figure, FCC is controlled by (and receives inputs from) different bodies:
• Congress: Congress has the clearest authority over the FCC. By amending the Communication Act of 1934, Congress can change the makeup of the FCC, assign it new duties, and eliminate or curtail old ones. In addition, Congress has influence on the budget of FCC and therefore it has influence on the resources and capacity available for the FCC.
• White House: The president appoints the FCC commissioners and thus has great influence on the FCC. The president has also persuasive influence over the commission through direct consultation with the FCC chairman.
• Federal courts: The FCC’s decisions are often subject to appeal to the US Court of Appeals. The decisions can be overturned due to three reasons: 1) If the established policies of FCC conduct are not followed, 2) The decisions are not supported by the authority granted to the FCC by Congress, and 3) The decision is unconstitutional. This can delay full implementation of new policies for several years.
• The broadcast television industry: TV industry and the organized broadcasters have influence on the FCC, through intensive lobby work. Some of the most powerful organizations are National Association of Broadcasters (NAB), who represent a large part of traditional broadcasters and the National Cable TV Association (NCTA).
• The organized public: Organized citizens’ groups with legal representations influence the FCC on maters of public concern, e.g., FCC Actions on children’s television in the mid-1970’s were provoked and shaped by Action for Children’s Television, originally a group of concerned Boston mothers45. The organized public both influences the FCC and also the television industry through their associations like NAB.
• Viewers and Voters: The influence of the citizens as individuals are twofold: As viewers, they influence the TV industry directly by their selection of different programs, in this case the television industry competes forviewers’ attention both internally and externally in the competition with other media products. As voters, the citizens have influence on the overall political situation and consequently have influence on the FCC.
2.3.5 Regulation of ownership and content in The Telecommunications Act of 1996 One of the guiding principles in the regulation of broadcasting in the US market has been to conform to “public interest” regulation in return for permission to operate in the market, i.e., broadcasters must operate in the “public interest, convenience and necessity”.
“The notion of serving the public interest was associated from the start with stable, broadly available commercial communication services, and government was responsible for monitoring socially significant audiences, arenas, and services that the market serves poorly”46
‘Conforming to public interest’ is a very general definition and the FCC has the task to establish rules and change them when necessary. Two major tasks that are dealt with in 45 Sterling C.H. and Kittross J. M.: “Stay tuned: A concise History of American Broadcasting”, 2nd ed., Belmont, CA: Wadsworth, 1990, in (Walker and Ferguson 1998). 46 Aufderheide P.:”Communications Policy and the Public Interest- the telecommunication act of 1996”, Guilford press, 1999.

Chapter 2: Regulatory framework of broadcasting In Europe and US, a historical analysis 34
different telecommunications Acts and that FCC have the competency to develop further upon, are regulations regarding ownership / cross-ownership and content. Ownership regulations, to promote competition, avoid creation of monopolies, and to promote diversity by allowing a greater variety of voices to use the spectrum. And content regulations, to make sure that the resources are used in the interests of the general public. Ownership regulations have been loosened and tightened throughout the history of broadcasting in US, but the overall tendency has been towards removal of restrictions. Developments in the delivery infrastructures have made it possible for more actors to enter the market. Consequently, there is more and more competition in the market that makes it un-necessary to have strict ownership restrictions. Ownership regulation has national and local components, i.e., ownership is restricted at the national level by means of some parameters and at the local level by means of other parameters. Furthermore there are regulations on cross ownership to avoid different media concentrate in the hands of few. The Telecommunications Act of 1996 contains the most recent regulation of these areas, outlined in the following47.
• National ownership limits: By Telecommunication Act of 1996 the restriction on the number of the television stations that a person or an entity may own, operate or control was eliminated. The ownership limitation is only posed on the share of national audiences, in a way that no individual company or cooperation can own television stations that reach more than 35% of the households in US48. This can be considered as a big loosening of the regulations. Prior to this time, the number of TV stations was restricted to 12%49 and the national coverage limit to 25%.
• Local ownership: National ownership regulations without local regulations can result in immense concentration of TV in the local markets, an issue FCC has opposed since the Telecommunication Act of 1934. Prior to the 1996 Act it was not allowed for a person or entity to own more than one TV station in the local market. The Telecommunication Act of 1996 does not change the rule but gives the FCC the task of “conducting a rulemaking proceeding to determine whether to retain, modify, or eliminate its limitations on the number of television stations that a person or entity may own, operate, or control, or have a major interest in, within the same television market”50. In August 1999 FCC modified the local TV “duopoly” ownership regulation and permitted duopoly in the local market51.
• Cross ownership: Another attempt has been to avoid concentration of the media market. For example the newspaper/broadcast cross-ownership rules restricts television station owners from publishing newspapers in the same market52. The 1996 Act removed two vital restrictions in the broadcasting market, first the ban on new combinations of television and radio station ownership in the same market is removed, and second, it allows a broadcast station to own cable systems, but not in the same market.
47 See, e.g., Aufderheide P.: ”Communications Policy and the Public Interest- the telecommunication act of 1996”, Guilford press, 1999. 48 Ibid. 49 The restriction on the number of TV stations was increased from 7 to 12 in 1985. This resulted in increasing of station sales, which partly is described in the history section. 50 Ibid. 51 Regarding radio market the restriction on duopoly has been removed in 1992, where a single owner can own up to 4 radio stations in the large markets (markets with 15 or more stations) and up to 3 stations in smaller markets 52 According to (Walker & Ferguson 1999) some of the newspaper / broadcasting combinations that exited prior to establishment of regulation in 1975 are permitted to continue in markets where a variety of news sources can be identified.

Chapter 2: Regulatory framework of broadcasting In Europe and US, a historical analysis 35
From the beginning of the history of broadcasting, certain restrictions have been posed to the content provided to the general public. The idea is that content must also serve the public interest, because the public airways have been used for its provision. These regulations are posed both regarding the individual programme where some restrictions on the level of, e.g., sex and violence are required, and also on the variety of programmes, where for example, a minimum of children programming is required. One of the vital parts of the content regulation has been the “fairness doctrine” that has required broadcasters to present reasonable opportunities to discuss conflicting views of public importance. FCC has eliminated most of its earlier fairness regulations but still some regulations are valid, e.g., “if individuals or groups whose honesty, character … are attacked by a station must be allowed to respond to the attack using the station’s facilities”53. Kattemaker and Powe in “Regulating broadcast programming” give a detailed description of different types of content regulations that has been used in the US market. They also identify the cases where the courts have been used for clarification of cases. In their analysis they denote content regulation as censorship and conclude among others:
“Whenever commission regulates program content, its rule rest on the (often unstated) view that listeners and viewers cannot be trusted to fend for themselves”54
One of the important outcomes of the 1996 Act was the television programme rating and implementation of the V-chip in the future TV sets that gives parents the possibility to filter unwanted programming from their sets. The broadcasters opposed the step fearing that if viewers set their TV set to exclude whole chunks of programming, their advertising revenue would be jeopardised55. The Parental Guide (PG) rating based on the level of violence, sex, bad language, suggestive dialogue and fantasy violence for children was an agreement between the actors and was approved by the FCC in 1998. The broadcasters considered that this PG rating was sufficient, and installation of the V chip could restrict their market. The argumentation was that the system does not give enough information to make a useful selection mechanism.
2.3.6 Regulation of satellite and cable platforms As described above, the incumbent local terrestrial broadcasters have resisted satellite and cable providers, whenever they have tried to have a share in the broadcasting market. The reasoning and argumentation for this resistance has partly been the threat against “localism” and, partly the “unfair competition” local broadcasters experience from the entrance of the newcomers. The issue has been that the broadcasters have conformed to public interest regulation and have built up an industry. This industry was then threatened when a satellite provider could transmit the signals to the whole country, or a cable TV provider could have plenty of TV channels. The reasoning was then, that the regulators should protect local broadcasting against the newcomer, and looking at the FCC’s rulings it is obvious that this has been a key element in the regulation of cable and satellite broadcasting. For a long time, the cable networks only were permitted to carry the local “must carry” channels. Later, cable networks started their own type of programming that were mainly based on subscription and therefore targeted another market segment than the advertising market. Rate regulation is another strong regulation of cable TV in the US. It concerns again the affordability and the local monopoly considerations. A great number of households (more than 70% of US households) receive their TV through cable and, when the “must carry” signals are deemed to be necessary, then they must also be affordable for the general
53 Walker and Ferguson 1998, Op Cit. 54 Kattemaker and Powe 1994, Op. Cit. 55 Aufderheide 1999, Op. Cit.

Chapter 2: Regulatory framework of broadcasting In Europe and US, a historical analysis 36
public. Cable TV is regulated by the Telecom Act of 1996 and also by separate cable TV Acts, such as “Cable TV Act of 1984”. Transmission of free to air TV in the satellite networks created debates in the US in the1970’s56. As mentioned above, this problem was partly solved by scrambling of the signals. The scrambled service was no more a Free-To-Air service and the market that was addressed was not the advertising but the subscription market. Transmission of local TV in satellite networks will contribute immensely to the successes of satellite broadcasting in reaching the mass audiences. According to the “Satellite Home Viewer Act of 1988”, the satellite providers must obtain agreement with the local station and national network as by paying royalties to the content providers to use their program57. Furthermore the satellite TV providers in US must conform to certain public interest regulations, e.g., according to section 25 of the “cable Television Consumer Protection and Competition Act of 1992” Direct satellite broadcasters must conform to certain public Interest regulations by setting aside a percentage of channel capacity for non-commercial programming of educational or informational nature58.
2.4 Conclusion In this chapter a historical comparative analysis on the broadcasting market and its regulation is given. The notions, public service and public interest have been discussed in relation to broadcasting. Furthermore, the structure of broadcasting in the US and the newer European broadcasting framework is described. What is evident from the analysis is that the starting point for broadcasting was similar in the US and Europe. There were similar problems of resource scarcity due to the technical characteristics of the medium, and the transmission resources were considered as public property, and consequently the provided content should conform to public interest. The two markets faced two main challenges from the beginning: How to allocate the resources, and how to fund the service. In the US, the resources were assigned to the private enterprises in local markets, and a regulatory organ (FCC) was established to ensure that the market organisation and the content provision served the public interest. Regarding funding, it was accepted was financed by advertising revenues. In Europe, the UK model was generally deployed where the resources were given to nationwide public broadcasters with a public service obligation, and the service was funded by license fees on receiver equipments. The deployed regulation and the later development resulted in the establishment of a few strong national public service broadcasters in different European countries and few strong broadcasting networks in the US. Regarding content, the US market consisted of more popular programming to maximise the audiences (and consequently revenues through advertising), whereas in Europe, the content was independent of advertising revenues and conformed to strict regulations. Apart from the content issue, the organisation of the markets was similar with strong incumbents that had received permission to operate in the market in return for conforming to a set of market and content regulations. Another similar issue is that the national governments have strongly been supported the industry they had created. When new infrastructures emerged, the incumbent broadcasters with the support from national governments resisted them. The further development can be characterised by strict regulations of the newcomers, defending the incumbents. This incumbent challenger
56 Joel Brinkley in “Defining vision- the battle for the future of TV” (Brinkley 1998), gives a detailed description of the case. 57 Because of the high penetration of Direct Satellite Broadcasting a debate is going on in US to enforce “must carry” rules on satellite networks, similar to the cable regulation. The argumentation against it is the waste of frequency resources when several local channels are transmitted by satellite 58 Report number IN 98-59, FCC, November 19 1998

Chapter 2: Regulatory framework of broadcasting In Europe and US, a historical analysis 37
dynamic has been similar in the two continents. The reasons for this development have however been different; in the US the driving force for the regulatory body has been protection of commercial terrestrial broadcasters and their advertising market, and in Europe protection of cultural and language related issues. European broadcasting has further undergone another change related to the establishment of the European Economic Community and later the European Union. Through different directives, starting with the “TV without frontiers” of 1989 certain common regulations have been formed and adopted by the national regulations. Especially, when the service could not be kept inside the country, common regulations have been seen as necessary. The development shows two different and interrelated trends: The national regulated broadcasting service industry has evolved towards more internationalisation, and in the local and national markets the competition has been intensified. The emergence of satellite transmission and their use for broadcasting and the development in cable TV networks created the technological platform, and the liberalisation process created the legal platform for this development. The next step is the digitalisation of broadcasting that will have vital impacts on the development of broadcasting market, which will be discussed in the other chapters of the thesis.

38
3. Broadcasting economics A substantial part of the theoretic discussion about broadcasting concerns the markets ability to produce consumers’ program-needs1, including high quality programs, on its own and without interventions from the political regimes or regulatory bodies2. Or the traditional understanding is correct that the market driven broadcasting only serves the lucrative “popular” part of the preference spectrum, and leaves the other parts unserved. The later approach (understanding) has formed the basis for the severe governmental regulations of broadcasting in the European and the US markets.
As elaborated throughout this thesis the reasons for regulations go far beyond pure economic, and include historical, content related and political parameters. The aim of this chapter is, however, to identify and analyse the economic parameters, including the particularities of the broadcasting market compared to the markets for other goods and services.
One of the central questions in Economic theory is the study of how scarce resources are allocated to satisfy the consumers’ wants and needs. This allocation involves answering 3 main questions:
1. How much of which good / service will be produced?
2. How will the goods / services be produced?
3. Who will consume the goods / services?
These are also the main questions in broadcasting economics, and consequently the objective of broadcasting economics is to answer how scarce resources in broadcasting are allocated to satisfy consumers wants and needs and to answer the above mentioned production and consumption questions with regard to broadcasting services.
In mainstream economics, the market is recognised as the most efficient allocative mechanism that regulates production and consumptions of goods / services in an optimal way. According to the father of modern economics, Adam Smith3:
“The market is its own regulator and will operate in an orderly fashion, producing what is needed and wanted by consumers, in the amounts needed and wanted by consumers, at prices consumers are willing to pay and at which the producers are willing to sell. The market constantly readjusts to meet changing needs and wants and the demand of consumers of products”.
Consequently according to this laissez faire doctorine, there is no need for governmental intervention since the economy on its own, as led by an invisible hand, produces not only what is needed but also in the cheapest way4. But certain goods and services will not be produced optimally (or at all) in the market. Even Adam Smith recognized the need for government interventions and provisions in a number of areas like establishment of a justice
1 In the following program denotes the service, which the broadcasters provide, i.e., entertainment, news, information, public affairs, debate, education, etc. 2 In a traditional analysis this includes provision of program types that are demanded in the market 3(Smith 1952) in Picard R.G.: “Media economics-concepts and issues”. Sage publication, 1989. 4 Johansson P.O.: “An introduction to modern welfare economics”. Cambridge University Press, 1991. The term invisible hand is associated with Adam Smith and the term laissez faire is associated to the French economist Jacques Gournay.

Chapter 3: Broadcasting economics 39
system, protection against invasions, provision of schools, etc.5.
The important issue regarding this project is this recognition of some goods / services that have specificities that can require other than market mechanisms to regulate their production / consumption. Throughout this chapter, at a theoretical level, it is shown that broadcasting services have some particularities making regular market mechanism inefficient in regulation of their production / consumption. Some of these particularities can further be applied generally to production and consumption of information services.
For the above-mentioned invisible hand allocation-form to work, the economists make several assumptions on consumer preferences and producer conditions (see later). If these assumptions are fulfilled then there exits a market equilibrium connected to a price-system. In a normative approach, this market equilibrium is further Pareto-optimal, i.e., it is impossible to make a change in the direction of improvement of one individual’s well-being without making some others worse off6. However, if the assumptions for the ideal market conditions do not exist, the market (with the given price-system) cannot guarantee a Pareto-optimal state, a situation that generally has been denoted as market failure.
The branch of economic theory that deals with production of goods / services, which cannot optimally be regulated by market mechanisms and, which can require governments’ involvement is called welfare economy. Welfare economy origins in the modern economists observations that some activities were societal useful, even when they were not individually profitable7. One of the later developments of the theory of welfare economics has been focused on market failures and the allocation of resources in situations with market failures.
In the welfare economic literature regarding efficient organisation of production of broadcasting services 3 different approaches can be identified. In the first approach the market is seen as a solution, i.e., the market by itself and without intervention can cover all individuals’ relevant program needs and wants. Here the research question is, in given circumstances, which market structure is more efficient regarding optimal utilisation of the societal resources, and which market structure will result in welfare waste.
Peter O. Steiner was one of the first economists who built a model of the broadcasting market8. The objective of his model was to describe the structure of the broadcasting market for radio services and his most important research question was to find out, which organisation form was most efficient with less resource waste: Monopoly or competitive markets? His work was generalised by, among others, Jack H. Beebe9. Their conclusion was that the most efficient organisation form depends on how the users preferences are distributed and how many resources are available10. If the majority of users’ preferences on the type of TV programs are identical and there are few transmission resources available, the monopoly will be a more effective market structure than the competition market. The argumentation is: when there are few transmission resources available and all actors target the same type of preferences, then duplication and consequently waste will occur11. They 5 Cornes R. and Sandler T.: “The theory of Externalities, Public Goods, and Club goods”. Cambridge University Press, 1986. 6 Cornes and Sandler (1986) 7 One of the first economists who formulated the problem was David Hume in ”A Treatise of Human Nature”, London, 1739. 8 P.O. Steiner: ”Program Patterns and Preferences and the Workability of Competition in Radio Broadcasting”, Quarterly Journal of Economics, 1952. 9 Jack H. Beebe: “Institutional Structure and Program Choice in Television”, Quarterly Journal of Economics, 1977. 10 Another Theoretical approach has been introduced by Spence og Owen (1977). They build an analytical model based on the ”viewer demand function” to compare the monopoly and free market competition on pay-TV and advertising financed TV. Regarding the advertising financed TV they come to the same conclusion as Steiner and Bebee. 11 See later in this chapter why duplication in broadcasting results in waste.

Chapter 3: Broadcasting economics 40
conclude further that if there are more resources available and / or people have different quality norms regarding TV, then the competitive market can be the most efficient12.
Later Eli Noam13 further developed the model and used a continuous model to describe the structure of the broadcasting market. In his model the preferences are distributed as a continuous distribution. His research question was, among others, to analyse under which circumstances and conditions the market performs optimally based on the assumption of normal distribution of preferences. The conclusion on this model was - supported by the empirical studies in US market14 - that in a perfect competition market, when there are the necessary transmission resources available, the unregulated service provision will cover all users’ preferences, from the very low quality programs to the high quality programs. The conclusions of the model are interesting and applicable in large markets like the US market, but it is questionable whether there will be enough demand for program types targeted towards a narrow public in smaller markets.
In recent years and starting by Robert G. Picard15 a new economic school, namely media economics, tries to answer the media economic question of “how media industries use the scarce resources to produce content that is distributed among consumers in a society to satisfy various wants and needs?” The work has been continued by among others Alan B. Albarran16. They analyse the media products financed by advertising including broadcasting in a dual product economy (advertisement and content provision) and analyse the dynamics and behaviours of media markets17.
A second approach focuses on the particularities of the broadcast market and the market failures connected to it. In this type of approach the intervention from the regulatory body is seen as necessary to correct some of these market failures. The transmission resource scarcity is one of the market failures that has been used as argument for governmental interventions after the initial period of free broadcasting in the beginning of 1920’s18. General market failures: externalities, public good, natural monopoly and asymmetrical information can also be applied to broadcasting and are among other reasons for the deployed organisation of broadcasting in the European and US market.
Externality is one of the recognised market failures that has been analysed and theoretised by A.C. Pigou19. Externalities occur when a firm’s production possibilities are affected by, e.g., the choice of another firm. Externalities can both be positive and negative, as an example for negative externalities smoke and pollution can be mentioned. When it is not possible to establish property rights and deal with the problem of externalities in the juridical system, governments are given the job to correct this failure and to neutralise the effects of externalities, i.e., re-establishment of Pareto equilibrium by imposing taxes, subsidies, etc. R. Coase in the “the problem of social costs”20 has challenged the necessity of governmental intervention, especially if there are few actors involved, with the reasoning that participants 12 Jerome Rotherberg came to some of the same conclusions without knowledge of Steiner’s work. See”Consumer Sovereignty and economics of TV programming”. Studies in public communication, IV (Fall 1962), P 45 – 54 13 Noam E.: “Television in Europe”, Oxford University Press, New York 1991 14 Noam E.: “Public interest programming by American Commercial television”, in (Noam & Waltermann1998) 15 Picard 1989 16 Albarran A. B.: “Media Economics – understanding Markets, Industries and Concepts”, Iowa State University Press, 1996. 17 Another extensive work of this kind is done by Alexander A., Owers J, and Carveth R.: “Media economics- theory and practice”. Lawrence Erlbaum Associates, inc. publishers, 1998. 18 Coase R. in a study for Federal Communication Commision (FCC): “The federal Communication Commission”, The journal of Law & Economics, October 1959, challenges using the transmission resource scarcity argumentation for establishment of central regulation. 19 See among others A.C. Pigou: “The Economics of Welfare”, London, 1920. 20 Coase R.: “The Problem of Social Costs”, Published in Coase R.: “The Firm, The Market and The Law”, Chicago, 1990.

Chapter 3: Broadcasting economics 41
can bargain with each other and eliminate the potential inefficiency associated with externalities.
Another aspect of market failure is public goods. Poul Samuelson’s analysis in 1950’s of public goods21 and their relation to other goods was a major contribution for understanding the market failures in the formalised theory of welfare economy. Public goods are characterised by non-excludability and non-rival consumption. Traditional broadcasting has been recognised to have both characteristics of public goods and was used as an example of a public good in the general development of public good theory22. The discussions around public goods were later focused on to what extent a given good was public or private. James M. Buchanan in “An economic theory of Clubs” 23 gave an exploration of the spectrum of goods to analyse what are called impure public goods. Buchanan and others argued that goods whose benefits were simultaneously received by more than one individual (e.g., swimming pools, golf courses, highways), could be allocated privately by a sharing group (or club), provided that exclusion mechanism could be installed at a reasonable cost24.
Natural monopoly is another major market failure. An industry is a natural monopoly if one firm can produce the demanded good / service with lower costs than two or more. Natural monopolies are often identified by the possibility of economics of scale, decreasing average costs 25. The theory of natural monopoly is deployed extensively in the analysis of the utility sector; railroads, telecommunication infrastructure, etc. In recent research on the production of information services the role of economics of scale has been emphasised. This is due to the high cost of production and low cost of distribution of information services. According to Varian et al:
In the language of economists, the fixed costs of production [of information services] are large, but the variable costs of reproduction are small. This cost structure leads to substantial economics of scale. The more you produce, the lower your average cost of production.26
A third approach is developed based on Amartya Sen’s capability concept. The focus in this theory regarding broadcasting services is the developing and improving effect, that offering of high quality programming has in building up the individuals’ so-called capabilities, i.e., their possibilities for joining the society. Nicholas Garnham deploys Sen’s approach in “Amartya Sen’s capabilities approach” 27:
In looking at communication policy from this [Sen’s] perspective, we need to think of newspapers and broadcasting as enablers of a range of functionings rather than providers of a stream of content to be consumed. We can then judge media and communication policy on the basis of how well or how badly they serve these needs and how the relevant capabilities are, in fact, socially distributed….
The theoretical framework of this thesis is based on the two first approaches, which gives a good theoretical framework for understanding development of broadcasting market. The third (Sen’s) approach is helpful in an analysis with focus on content provided in the
21 Samuelson P.A.: “The Pure Theory of Public Expenditure”, Review of Economics and Statistics, Vol. 36, p.387-89, 1954 and Samuelson P.A.: “A Diagrammatic Exposition of a Theory of Public Expenditure”, Review of Economics and Statistics, Vol. 37, p.350-56, 1955. 22 See, a.o., Mishan (1964), Samuelson (1964), Buchanan (1967) and Demsetz (1970) 23 Buchanan J.M.: “An economic theory of clubs”, Economica, 32, 1 - 14, 1965 24 See Cornes and Sandler 1986. 25 For a detailed discussion see among others Sharkey W. W.: “The theory of natural monopoly”, Cambridge University Press, 1982 26 Varian H. R. and Shapiro C.: “Information Rules”, Harvard Business School Press, 1999. 27 Garnham N.: “Amartya Sen’s ‘capabilities’ approach”, in Burgelman J. C. & Calabrese A.: “Communication, Citizenship and social policy”, London, 1999.

Chapter 3: Broadcasting economics 42
broadcasting market. The content issue and judgment / analysis of the necessity and usefulness of different contents in the society is not the subject of this thesis. Whenever it is seen necessary to deal with the content issue, simplified assumptions are used to be able to develop the chosen theoretical framework of the thesis. But it is clear that in the further research on the problem of this thesis, using Sen’s approach will identify some other aspects of the problem and together with the market / market failure approach, which is used in this project, it will result in a more complete analysis of development of broadcasting market.
In the following the two first approaches, the economic theory on market and market failures in broadcasting services, are described in more detail.
3.1 The broadcasting market The problem that will be analysed in this subchapter is the ability of the broadcasting market, on its own, to produce the program types demanded on the market. And to identify, under different conditions, which market structure is most effective to organise this production.
In the traditional economic theory the problem is partly dealt with in the following way: In which market structure the economic welfare will be maximised, i.e., waste of resources will be minimised? Here economic welfare is the sum of consumer surplus and producer surplus. Regarding the content aspect, which could be denoted as the political welfare, the economic theory is less clear due to the necessity of judging on the value and comparison of different consumers’ “utility” of the program content. A method to avoid this comparison of utility is to investigate under which circumstances there will be sufficient diversity of content available, with the implicit assumption that when there is a sufficient number of offers, the whole preference spectrum, including the high quality spectrum, will be covered.
According to Noam28, e.g., it is not correct that commercial broadcasters cannot deliver quality programs only because they are commercial. He refers to, among others, the analogy to the magazine and newspaper market, where high quality offer exists, even when a commercial market drives them. In this type of approach, the lack of quality programs in, e.g., the US commercial market and the necessity for the US Public broadcasting is sought in the technical problem of the scarcity of transmission resources in traditional broadcasting, a problem that is almost solved in the modern broadcasting environment.
In the following, first a description on different market structures, including market concentration and vertical integration is given. Later, two quality models, the discrete and the continuous models, which analyse a market driven broadcasting market are described and discussed.
3.1.1 Market structures Traditionally 4 main different market structures are identified; perfect competition, monopolistic competition, oligopoly and monopoly. It is mainly the number of suppliers, the characteristics of the products and the level of competition that determines the market structure for a given product. The market structure determines the power of the suppliers and the demand side the amount of production and consumption and the prices for goods / services.
28 Noam 1991.

Chapter 3: Broadcasting economics 43
Apart from some “technical assumptions”, following assumptions must be fulfilled for a market structure to be denoted as perfect / atomic competition29:
• There are so many suppliers and consumers on the market that no one individual can impact on supply and demand for the product.
• The goods / services are homogeneous.
• The goods / services are private (see later for a definition for private goods).
• There are no governmental interventions in form of taxes, subsidisation, etc.
• There is free entry to (and exit from) the market, i.e., entry and exit barriers are low.
• The suppliers are driven by profit maximisation.
• Production factors move freely (are mobile).
• The consumers maximise their “utility”.
• There are information transparencies. All consumers and suppliers have full information on the products on the market.
In a perfect competition market, the price of the products is set by the market and no single supplier or consumer can influence the market price. Furthermore, in the perfect competition market, the supplier produces so little compared to the total market that even a substantial increase or decrease of the production will not have influence on the total market. The same argumentation is also valid regarding the demand side; no consumers’ increase or decrease in consumption will influence the total market. The market on its own drives the perfect competition market most efficiently and no intervention is necessary to regulate production or consumption.
In the monopolistic competition, there are also many suppliers and consumers and the entry / exit barriers are low but the products are differentiated and not homogeneous (heterogeneous). The price varies in this market structure and both market and the suppliers influence the prices.
An oligopoly market consists of few suppliers, where each supplier has certain control over the market. The offered products can be either homogenous or differentiated. In an oligopolistic market structure the few firms that control the market are mutually dependent. The leading firms will influence other firms, and this mutual dependency in the market can develop towards more competition or co-operation. The barriers to entry are high but not as high as monopoly. The terrestrial broadcasting market is often mentioned as an oligopolistic market structure. The leading firms in the market often set the price of the product in the oligopoly markets.
A monopoly market is a market with only one single supplier. The entry barriers in a monopoly market are high and the supplier sets the price for the products. The reasons for monopoly creation are different; it can be due to national regulation (like national banks), due to access to specific knowledge, natural resource, patent, etc., due to economy of scale / scope, or due to cost reasons where it is more efficient to have one firm than two or more (like rail-road infrastructure). The last one is denoted as natural monopoly discussed later in this chapter.
29 Petersen J. H.: “Welfare and market”, Odense Universitetforlag, 2000

Chapter 3: Broadcasting economics 44
3.1.1.1 Broadcasting and different market structures As depicted in Figure 3-1, different media industries operate in different markets. Cable TV is an example of (local) monopoly, traditional terrestrial broadcasting market is an example on an oligopolistic market structure. As seen in the following chapters dealing with the changes in the broadcasting landscape, the number of actors has increased in all broadcasting platforms. The digital terrestrial broadcasting market, at least the European version of it, is no more an oligopolistic market structure. It is a more competitive market with characteristics of the monopolistic competition market structure. Satellite service provision in the modern broadcasting market is a good example of an oligopolistic market with high entry barriers that approaches a monopoly (in some markets duopoly).
Perfect Competion
Monopolisitic Competion
Oligopoly Monopoly
Television / radio Programming
Internet TV
Digital Terrestrial TV
and radio
Traditional radio
Traditional TV Broadcast
Satellite TV
Cable
Entry barriers
Very low Low High Very high
Figure 3-1 Broadcasting Industries in different market structures
Furthermore in Figure 3-1 the entry barriers are depicted on an axis from very low to very high entry barriers, and different market structures are depicted due to their position on the axis.
Schere30 formalises the above discussed characteristics of the number of actors and product types in different market structures and presents a two dimensional model, shown in Figure 3-2.
30 Schere F. M.: “Industrial Market Structure and Economic Performance”, Chicago: Rand Mcnally, 1980, in (Allbaran 1998).

Chapter 3: Broadcasting economics 45
One Type of product
Number of firms
A few many
Homogenous
Differentiated
Pure monopoly
Pure monopoly
Homogenous oligopoly
Differentiated oligopoly
Pure competition
Monopolistic competition
Figure 3-2 Two dimension market structure
The distinction in this two-dimensional model between homogenous and differentiated oligopoly is helpful regarding broadcasting’s dual product market. The advertising market and the relationships between the broadcasters and the advertisers can be characterised as a homogenous oligopoly. The content and audience market in traditional broadcasting can be denoted as a differentiated oligopoly. Emergence of multi-channel systems and digitalisation have created the basis for a development towards monopolistic competition. On the other hand and regarding ownership, there are incentives for the market to develop towards more concentration31, discussed in the following.
3.1.1.2 Market concentration In the above-mentioned discussion on market structures, the number of supplier was identified as an important factor in determination of the market structure. But the number of suppliers do not indicate how concentrated the market is, i.e., how the market shares are distributed. When the markets are “concentrable”, because of, e.g., economics of scale /scope, then the unregulated market will develop towards more concentration. More concentration creates high entry barriers for new competitors and lead to monopoly-like market structures. The broadcasting market is a “concentrable” market and this has been the main reason for intensive ownership regulation, when resource scarcity was an important factor in the broadcasting market32.
Ownership concentration indicates how market shares between different firms are distributed. The market is concentrated if this distribution is “skew” and few firms dominate the market. There are different methods of evaluating how concentrated a market is. In the following, two of the most used methods are described.
One approach involves calculating concentration ratios, i.e., the ratio of the total revenue of the major players with the revenue of the entire industry. The ratio is calculated, e.g., by using top four or top eight firms and evaluating how their share of the market is. Following criteria shown in Figure 3-3 for concentration ratios have been suggested in the literature33.
31 For a detailed analysis of media concentration see amongst others: Bagdikian B. H.: ”The media monopoly”, Boston, Beacon Press, fifth edition, 1997 32 General Cross-ownership regulations have also been posed to media market to avoid concentration of media in few hands (see later for more discussions). 33 See, e.g., Allbaran 1996

Chapter 3: Broadcasting economics 46
Top four firms Top eight firms
High concentration ≥ 50%
Moderate concentration
Low concentration
33%≤ to <50%
≤33%
≥ 75%
50%≤ to <75%
≤50%
Figure 3-3: Concentration ratios34
Another, and more accurate, way to measure the level of concentration in a market is using Herfindahl-Hirchman Index (HHI). HHI denotes the sum of squared market share of all firms. HHI is very powerful in identifying the level of concentration in a developing and dynamic market. The index increases as the number of firms decline. When HHI index is bigger than 1,8, the market is considered as highly concentrated. When the index is below 1 then the market is unconcentrated. When the HHI index is between 1 and 1,8 then the market is considered as being moderate concentrated35.
3.1.1.3 Vertical integration Vertical integration (affiliation / ownership) is another factor that can create high entry barriers for new competitors and give monopoly like status to some firms. While ownership concentration described above occurs horizontally in the market, vertical integration denotes ownership or affiliation of a different part of the value chain from content creation to final delivery to the end-users.
Vertical integration creates high entry barriers but it also increases efficiency, due among others to diminishing transaction costs. D. Waterman and A Weiss36 in their detailed, theoretical and empirical study of vertical integration in cable TV in US market conclude, that vertical integration promotes economic efficiency and that diversity is maintained in the vertical integrated US cable TV.
One of the important aspects of vertical integration, suppression of the price mechanism and diminishing transaction costs, is dealt with in the extensive empirical and theoretical literature on transaction cost economics37. An ownership relation between transacting parties will further aid enforcement of agreements and otherwise facilitate the contracting process. Thus, the parties can reduce the risk of opportunistic behaviour and of changing conditions and can reduce or eliminate what economics call doublet marginalisation.
Apart from transaction cost efficiency there are other economic benefits in a vertically integrated industry: The enhanced availability of capital and creative resources, as well as
34 Allbaran 1996. 35 Ibid. 36 Waterman D. and Weiss A. A.: “Vertical Integration in cable Television”, AEI Press, 1997 37 See , e.g.,
• Coase R. H.: “the nature of the firm” published in Williamson O.E. and Winter S. G (ed.): “The nature of the firm- origins, Evolution, and Development “,Oxford University press 1993.
• Williamson O.E.: “Markets and Hierarchies: Analysis and antitrust implications”, New York Free press,1975.
• Williamson O.E.: “Transaction- Cost Economics: The governance of contractual relations”, Journal of law and economics 3, 1979.

Chapter 3: Broadcasting economics 47
risk reduction by means of signalling commitments38. The accumulated capital and resources in vertical integrated media firms will be used to further development and production of new services. In its 1990 report, the FCC notes in defence of vertical integration in cable TV, that “ on several occasions cable systems investment has enabled a programming service to remain in operation when it otherwise would have been forced to discontinue its programming”39.
In the broadcasting market, which has immense political interests, the pure economic efficiency is however not sufficient. Even diversity in the hands of few owners cannot be optimal. Here the important question is, apart from economic efficiency, to what degree vertical integration increases or decreases the number of “voices” in a democratic society. The regulation of the market must address both problems.
3.1.2 Discrete quality models The main problem in this model is to identify which market structure is most efficient in maximising economic welfare, i.e., minimum waste of resources, in a market driven broadcasting market: A monopoly or a competition market. Steiner40 developed the model in 1952 to analyse the US radio broadcasting market. The model was further developed and generalised by Jack H. Beebe in 197741.
As shown in the following, solving this problem through development of a model requires making simplifying assumptions, among others, on how consumers preferences are distributed, how supply side reacts to these preferences, and how much transmission capacity is available on the supply side. Furthermore, production of different programs requires different costs, which depends on the type of programming, and there will be a break-even audience share to make a programming profitable at all. In the following, it is assumed that the cost of production is constant and does not depend on the type of programming. Furthermore it is assumed that the advertising rate per audience is fixed, and all audiences are worth the same amount to advertisers.
The following are among other assumptions of the model and the analysis:
• Each station strives, in every period, to maximise the number of audiences42.
• On the supply side there are identifiable programme types.
• There are determinate number of audiences who will listen to (see) the given program type.
• The production and presentation of a program does not cause any changes in program preferences of the individuals. The preference function is independent of the actual programs presented.
• Preferences for any given program are exclusive – that is, in each case non-listening / viewing is the second choice.
38 Waterman and Weiss 1997, Op. Cit. 39 “1990 FCC cable report” in (Waterman and Weiss 1997) 40 Steiner 1952 41 Beebe 1977 42 Steiner uses the term listener as he analyses the radio market.

Chapter 3: Broadcasting economics 48
• All stations simultaneously producing the same program type will share equally the total available audience for the program of that type.
• The program is a free good to the consumer.
Furthermore it is assumed that the distribution of people with the similar preferences follows a “skewed” distribution, like the example presented in Figure 3-4. Later in the analysis some of these assumptions are relaxed.
In Figure 3-4 a hypothetical example is depicted to simplify the description of the model. Here it is assumed that there is a market of 1300 audiences that can be grouped in 3 groups according to their preferences.
Program quality
Audiances
BA C
900
250 150
Figure 3-4 Discrete quality model
If there is only one TV channel available on the market, it will – based on previous mentioned assumptions – try to meet the requirements of the TV audiences that are grouped in group B to maximise the number of audiences and consequently to maximise its revenues from advertisement. The TV channel will then obtain 900 audiences. If there are two TV channels available on the market, they will also try to meet the preferences of the group B, because each channel will then obtain 450 audiences. Obviously, offering programs to group A or C will not result in this amount of audiences. Using the same argumentation, it is easy to see that even the third channel available on the market will target its programming against group B, and it is only when the fourth channel is available it will try to meet the requirements of group A and target its programming towards this group. Continuing this argumentation it is obvious that it requires 8 TV channels ensure that programs that are demanded by group C will be produced.
A conclusion of this simplified model is that if there are sufficient numbers of TV channels all end-users’ demand, including, e.g., minority or high quality programming, will be covered in a market driven broadcasting. Another conclusion is that some of these channels will address similar preferences, i.e., duplicate the same program type43. Because duplicating of
43 Rothenberg J. in his paper ”Consumer sovereignty and the economics of TV programming” (Rothenberg 1962) uses the same thinking to analyse the broadcasting market. He comes to some of Steiner’s conclusions without any knowledge of Steiner’s work.

Chapter 3: Broadcasting economics 49
broadcasting programs results in waste of societal resources, the conclusion will then be that when there are few channels available, organising the production in a monopoly market will reduce waste of societal resource and still address the majority of preferences. Consequently, in the above-mentioned example it would be more efficient to provide only one TV channel, with the other two remaining dark, even when there are transmission resources available for 3 TV channels.
But why will duplicating in broadcasting result in waste of societal resources? Duplication happens obviously in supply of other goods / services, without wasting any societal resources. The answer lies in the particularity of the broadcasting market and the difference between this market and most others. Once a programme is produced, the incremental resource cost of reaching an additional user is zero. The resources that are used in programme duplication (in production as well as distribution) are wasted because there should not be produced more of the original program to reach the TV audiences that the station duplicating programmes reaches. As Jerome Rothenberg44 puts it: “All set owners who would have watched the duplicating program could watch the original program with little loss of satisfaction and without requiring any additional resource cost at all. In production of the majority of other goods / services the marginal costs for producing one more entity is typically not zero and, consequently, it is not necessarily more efficient when the good is produced by the original producer of the good than anyone else that produces the same good”.
Other conclusions can be obtained by relaxing some of the assumptions of the model:
• Providing the financial basis available, if there are sufficient numbers of TV channels available, the competition market can deliver diversity and cover all end-users’ demands, including high-quality programming. As mentioned earlier, if in the above-mentioned example there are transmission resources for four channels available, then the program-type-A will be offered on the market. If we assume that people in group-A are high quality users then the model shows that high quality programming can be offered on the free competition market.
• If we choose another distribution of the preferences, e.g., by choosing a distribution that is not so “skew” and looks more like geometrical distribution we obtain other conclusions. Let us assume that the distribution of A, B and C preferences in figure 2-1 follows a nearly geometrical distribution: There are 500 with A-preference, 400 with B-preference and 400 with C-preference. Here, if there are transmission resources available for only 3 TV channels, then monopoly organisation of market is not necessarily more efficient than free competition or an oligopoly market structure, which will be the case.
• The assumption of exclusivity of programme choice can be loosened by assuming that if one individual cannot find his / her first choice then they are willing to see a lesser choice and if the lesser choice does not exist then they are wiling to see a much lesser choice, a common denominator (Suggested by Rothenberg). In this case the monopoly broadcaster will offer only the common denominator, because it’s objective is to make people choose seeing TV (listening to radio) rather than other activities. The competitive market will, on the other hand, offer preferred choices to attract audiences from other programs (and also other activities). Here the welfare comparison between monopoly and competitive market will be difficult, due to the necessity for ranging consumer satisfactions of first and lesser choices. The obvious result though is the existence of more diversity in the competitive market.
44 Ibid.

Chapter 3: Broadcasting economics 50
One of the major building blocks of this model is the assumption of discrete distribution of preferences and choice function (first priority, lesser priority, etc.). These assumptions are changed in the continuous model developed by Eli Noam45 that is the subject of the next subchapter. As seen in the following, changing the distributions from discrete to continuous implies different behaviour on the supply side.
3.1.3 Continuous quality model This model builds partly upon development of discrete quality model and partly on the theories of public choice. The public choice theory analyses the optimal platforms that political parties adopt to maximise their political support. According to Noam, this can be extended to analyse TV (and radio) programming, particularly, the relationship between program diversity, channel capacity, and institutional structure.
In this model the distribution of preferences is assumed to follow the continuous normal distribution. The X-axis represents program quality starting with the low quality programs on the left most side of the axis and high quality programs on the right most side of the axis, i.e., the quality increases from left to right. The choice function of the user is however also continuous. A market with one broadcaster is depicted on Figure 3-5.
Program quality
Audiences
Px B-B
x
Figure 3-5 The continuous quality model in a market with one broadcaster
As depicted in Figure 3-5, the quality distribution follows a normal distribution and regarding the choice function, i.e., how the audiences choose the broadcasting programs, it is assumed that all consumers have a primary priority but they are willing to see programs at both side of their priority, however, in a declining rate. The sides of the triangle –BXB indicate the choice function. It is then assumed that B is finite. The consumers are not willing to see programs far from their preferences. In this way Noam models the choice function in a more elegant way than the discrete quality model, where the priorities were modelled stepwise, first, second, third …, and finally the common denominator.
As mentioned above, the sides of the triangle indicate the end-users’ declining willingness to
45 Noam 1991, Op. Cit.

Chapter 3: Broadcasting economics 51
see programs away from his / her primarily preference (denoted by the program quality Px). In this model it is first assumed that the single broadcaster (broadcaster X) chooses a position on the quality spectrum that maximises its revenues. The area under the triangle indicates the number of audiences of broadcaster X. If we assume further that all audiences are equal in terms of advertising revenues, then the commercial broadcasters’ strategy will be to maximise the number of audiences, i.e., the area under the triangle. The problem is then simplified to calculate the position of X on the normal distribution curve that maximises the area under the triangle –BXB.
The height of the triangle is according to normal distribution given by following formula (formula 1).
2½½)2( PxePxH −−= π (1)And the area under the triangle is given according to following formula (formula 2).
BPx
e
BPx
eBPxHA
.2½½
)2(
2.2½½
)2½(2.½.
−−
=−−
==
π
π
(2)It is then obvious that this area will be maximised when Px = 0 and consequently the broadcaster X will place itself on the middle of the spectrum.
The assumption of equality of all audiences regarding advertising revenues is a simplified assumption. The audience will be weighted by its “consumption power” as it is what the advertisers seek46. This consideration is very important in the modern broadcasting market, where the available transmission resources are increasing and the broadcasters can customise their programs towards individuals with different profiles. Noam incorporates the consumption power in the model in the following way:
It is assumed that consumption power equals income, and that income and preferences, on average, are positively and linearly correlated because higher educational levels are commonly associated to higher income. Maximising the above audience triangle is then weighted with consumption power. It is then proved - using a linear weight function - that the greater income is, the more the position of the broadcaster will be shifted to the right towards higher quality.
Now let us give an analysis on a situation where the possibility will be opened for a new broadcaster to enter to the market.
46 Poltrack D. F.: “Television Marketing, Network/Local/Cable. New York: McGraw-Hill,1983 in (Noam 1991)

Chapter 3: Broadcasting economics 52
Program quality
Audiences
Px B-B
x Y
Py
S
Figure 3-6 With two broadcasters
In Figure 3-6 it is assumed that a new broadcaster (identified with Y) positions itself on the quality Py. When the position of X is given, broadcaster Y tries to maximise the area under the triangles that is defined by Py minus half of the area common for both triangle (the grey area indicated by S in the figure). When Y finds its place on the curve, X changes strategy and moves to maximise its audiences in the new conditions. This mutual dependency between X and Y causes several changing of strategies until an equilibrium is achieved, where X and Y are placed symmetrically on both sides of the middle position. The conclusion of the model is then that X and Y do not duplicate each other’s programming, as it is assumed in the discrete quality model and as it is accepted generally in the popular debate, they will differentiate their programming to some degree. Furthermore Y that is assumed to offer lower quality programming pushes X towards higher quality programming, also in this case the opposite is accepted in the general debate.
In this approach, the explanation on the traditional American broadcasting market’s lack of provision of high quality programming and its concentration on the popular part of the spectrum, is found in one of the market failures, namely resource scarcity. The model shows that when there are only few broadcasters on a market, and they are financed through advertising, they will place themselves around the middle of the preference spectrum to maximise their revenues. According to the assumptions of the model it is not profitable to offer, e.g., high quality programming in this market.
When more TV channels emerge, due to, e.g., emergence of new infrastructures or a technical possibility for more efficient utilisation of available resources (e.g., digitalisation), the new channels continue the process of finding their best position on the quality spectrum, and the new broadcasters will place themselves on different places on the quality spectrum until the whole spectrum is covered. But there is also a cost problem. Figure 3-7 models how the cost of production and distribution of revenue influence this process.

Chapter 3: Broadcasting economics 53
Program quality
Revenue
Pl Ph
C
Revenue curve weighted with consumption power
Figure 3-7 Considerations regarding cost
As depicted in Figure 3-7 the revenue curves also follow a normal distribution. Furthermore the cost of programming is considered to be fixed and is indicated by C. The dashed curve is the revenue curve that incorporates the effect of consumption power. As it is shown in the figure there is a spectrum from Pl to Ph that will be covered using advertising revenues. The dashed curve shows, further, that the commercially viable spectrum will be tiled towards higher quality programming, when the effect of consumption power is incorporated. Changes in the cost structure of production and distribution (e.g., by emergence of digitalisation) and increasing advertising per audience price will influence this spectrum.
If there is a sufficient number of channels available but the basis for advertising revenues are not fulfilled to offer quality programs, then other financing forms like direct pay TV or a mixed pay and advertising TV can be deployed. This method is very much used in the multi-channel, satellite and cable and recently in digital terrestrial TV. Another approach will be to cover the uncovered part of the spectrum by public broadcasting, which is used on the US market. Newer empirical evidences show however that pay TV is a viable competitor to Public broadcasting in the uncovered part of the spectrum47.
To compare this model with the discrete model, e.g., regarding the efficiency of monopoly market compared to competitive market the following example will be discussed. In Figure 3-8 it is assumed that there are few (3) channels available. It is further assumed that the available resources are organised in a monopoly organisation. The monopoly provider has the possibility to cover the whole preference spectrum because it can minimise the overlap areas. In Figure 3-8 it is depicted the situation where the 3 available channels (Y, X and Z) have covered the whole spectrum. This will however only be possible in the case of, e.g., cross-subsidy from X is transferred to Y and Z and consequently requires, e.g., public interest regulation.
47 Noam E.: “”, published in Noam E.M. and Waltermann J. (ed.): Public Television in America. Gütersloh: Bertelsmann Foundation Publ, 1998.

Chapter 3: Broadcasting economics 54
Program Quality
Audiences
x
Y Z
Figure 3-8 Quality model in a monopoly organisation
Using this model the covered spectrum will be enlarged, but it will not enlarge the variety of content and the number of voices available in the broadcasting landscape. Another strategy can be to let X be a commercial broadcaster and place Y and Z precisely at both sides of X and base financing of Y and Z on public financing )(the case of US public broadcasting).
In the following chapter, the market failures that are applied to broadcasting are described in detail. To correct these market failures and re-establish Pareto equilibrium, governmental interventions can be necessary. The identified market failures and the above described market behaviours supplement each other and give a theoretical framework for understanding the development in broadcasting market.
3.2 Market failure The market driven discussion that is given above deals primarily with the problem of scarcity of transmission resources but there are other specificities, market failures, connected to broadcasting, which have influenced the way the service is organised in different markets.
In the following general market failures are described, and at a theoretical level it is identified to what degree these market failures can be applied to the broadcasting market. Finally broadcasting specific market failures like transmission resource scarcity and content issues are analysed at a theoretical level. There are, however, disagreements in the literature about resource scarcity and content issues being real market failures, or structural created to justify the deployed organisation / regulation in different markets, including European and US markets48.
Generally four types of market failure are identified in the literature:
• Public goods
• Externalities
48 See among others Coase 1959, Noam 1991, Neuman et.al.1998

Chapter 3: Broadcasting economics 55
• Natural monopoly
and
• Asymmetrical information
Some economists have suggested the problem of “allocation over longer time period” as another market failure. Allocation over time is a market failure in production areas where the amounts of total resources are limited, like natural resources. In these cases regular market mechanisms cannot allocate the resources in efficient way. It is however difficult to apply this market failure on broadcasting.
In the following the market failures are analysed with respect to broadcasting services. We start with the public goods that have been central for the way broadcasting has been organised and financed.
3.2.1 Public good A good is denoted as public good when it has the following two properties:
• Non exclusivity
• Non-rival consumption.
The first characteristic indicates that once a good is produced nobody can be excluded from using it, and the second indicates that additional consumers can use the good / service at zero marginal cost49. The national defence is often used as an example of a public good but both of these characteristics can adequately be applied to the traditional terrestrial broadcasting. Looking at terrestrial broadcasting, when a program is produced and the signal is emitted from the transmitters, it can be “consumed” by additional users, without excluding others and with zero marginal production costs in a given market. This is contrary to private goods, e.g., food, where one individual’s use of a particular food will exclude others from consuming the same food and the marginal costs are not zero.
It is, however, in the light of technological development not ‘natural’ that broadcasting must be transmitted un-encrypted and in a terrestrial network. Exclusion mechanisms can be built at reasonable costs. The signals can be encrypted and / or transmitted through cable networks and, in both cases, it would be possible to exclude users, establish payment systems and target the individual users who are willing to pay for the specific services. The characteristics of broadcasting services are changing from a pure public good to a club good (see below for detailed discussion).
For many years, terrestrial broadcasting has been the major transmission form and it is still the dominating transmission form in large parts of the world. Regarding radio broadcast it is the major transmission form, also in the developed part of the world. With the current technology it is also possible to encrypt the signals transmitted in the terrestrial network. This indicates that the characteristics of broadcasting are dynamic and also dependent on the deployed infrastructure and the level of technological development.
It is important to note that the question of ‘being’ a public or a private good is not an issue of ownership. A public good can be owned privately and the government can own a private
49 See among others: Johansson P. O. “An introduction to modern welfare economics”,

Chapter 3: Broadcasting economics 56
good. There are for example lots of privately owned broadcasters and, e.g., in France, the government has for many years partly owned the car industry. It is not the ownership but the access to the goods/services that is decisive. When the public goods are offered by governmental institutions, the general argument is that there can be problems connected to establishment of a regular market for these goods / services.
In the following table different types of goods are depicted to illustrate non-exclusivity and non-rival consumption.
Exclusivity Non-exclusivity
Rivalry Private goods Common goods
Non-rivalry Club goods Pure public goods
Table 3-1: Types of Goods
The table illustrates, that apart from private and public goods there are ‘middle’ forms of goods, common and club goods that, generally, are denoted as impure public goods that differ from the pure public goods in different ways. Club goods are exclusive, but there is non-rivalry in the consumption (i.e. One individual’s consumption = the total consumption). Common goods are non-exclusive, but there is rivalry in consumption in the sense that one’s consumption of a good will impend the others from using the same good (like fish in the sea). In connection to broadcasting, the club goods are interesting because, e.g., cable TV and encrypted terrestrial TV can be considered as club goods. These types of services are not available for free, but the possibilities of the current subscribers of the services will not decrease, when a new user subscribes to the service. On the contrary, their possibilities will increase as a result of externalities (discussed later in detail).
The theory of public goods was first formalised by the economist Paul A. Samuelson in the beginning of 1950’s50. The problem (specificity) of public goods is that they cannot be traded in a regular market, because they can be consumed by anybody without paying for them (free rider problem). Consequently the supply side cannot cover their production expenses, unless government is involved and, e.g., covers the expenses through taxes or the government authorises other institutions to collect license fees, or if possible to find alternative market solutions.
Financing through advertisements, the model that was chosen in USA, and which in recent years has been deployed in Europe is an example of such an alternative market solution (according to dual product market, discussed later). Another solution that was used in the beginning broadcasting history in the US was to cover the expenses connected to the production of services by selling receiver equipments51. The precondition for using this solution was that the production of broadcasting services and receiver equipments was vertically integrated52, or that the broadcasters through governmental regulation have part of their expenses covered through other actors that are only in the service production business (cross subsidy) or through income taxes.
50 See, e.g., (Samuelson1954) and (Samuelson1955). 51 See, e.g., Coase R. H.: “British broadcasting, a study in monopoly”, London school of economics and political science, 1948 52 This type of solution is known today from software world, where the supply side has difficulties to impend copying and illegal use of the product.

Chapter 3: Broadcasting economics 57
In another categorisation of public goods, the geographical division is suggested, where the concept local public good is introduced. Traditional terrestrial and cable broadcasting are examples of local public goods (and club goods). As mentioned above the public good characteristics of a service is not related to ownership, and even when the service is local public good it can be operated by foreign actors if the regulations allow it, a tendency that paints the broadcasting landscape more and more in recent years. Understanding the geographical division of public goods is helpful in the competition between regions. Organising the local public goods in an efficient way promotes the regions attractiveness for people to live53.
As mentioned above, one of the other market solutions is to encrypt the signals in the terrestrial network or to transmit them in the cable networks. In this case it is possible to control the access to the system. The technological development, e.g., using digital broadcasting, can in the long-term result in transformation of broadcasting services from a public to a private good. This will be achieved when it is possible to customise services in a way that one individual’s consumption does not depend on others.
As it can be seen through the empirical part of this report, the development towards club good and private goods has radical impacts on how the services are organised and funded.
3.2.2 Externalities Externalities are external effects of production, distribution or consumption of different goods / services, which are not directly connected to the primary objective of the production, distribution and consumption. There are both positive and negative externalities. Pollution and smoke are often used as an example for a negative externality, where the above-mentioned software that adds value to a hardware platform can be denoted as a positive externality.
When negative externalities exist, i.e., a solution to the problem is not found at a social level, the people who are not directly involved in the economic activity will have extra costs. Consequently the directly involved parties in the economic activity do not pay the total real costs of their economic activity. This can be considered a market failure that may require governmental intervention. Governmental regulation can, e.g., be a requirement for the pollution-maker to remove the pollution himself or a tax, levied on certain types of products like motor oil with the intention to use the proceeds to solve the problem later.
Arthur Pigou was the first economist that formalised the arguments for externalities54. His main idea was that the difference between the private and the societal costs (and advantages / utilities) in different situations can make governmental intervention necessary like, e.g., by levying taxes when externalities are negative or subsidising when positive. The objective is here to optimise the total welfare that is not necessarily achieved in the market process.
Ronald Coese in “The problem of social cost”55 challenged Pigue’s thinking on governmental interventions and posing taxes as a correction to externalities. When there are few parties
53 See among others Tiebout’s argumentation on local governments facing competition like small firms in the market., in (Johansson 1991). Tiebout C:”A pure theory of local expenditure”, Journal of political Economy, 64, 416 – 24, 1956. 54 Arthur Cecil Pigou’s main work is from 1912 with the title, ”Wealth and Welfare”. Another important work in relation to welfare economy is ”A Study in Public Finance” from 1928. 55 Coase 1990, Op. Cit.

Chapter 3: Broadcasting economics 58
involved, they can bargain with each other and eliminate the inefficiency associated with the externality.
A category of positive externalities that is extensively used in, e.g., telecommunication research is network externality. It is simply illustrated by the fact that when one additional user is connected, e.g., to a telephone network it is not only his or her communication possibilities that are enhanced. All other people connected to the network also have their possibilities enhanced for communication by this additional user. Varian develops the concept network externality to also cover the networks that are not physically connected, like the network of Nintendo computer game users56.
There are both positive and negative externalities in connection to broadcasting. Using the same reasoning as Varian’s, a network could be identified of, e.g., BBC users that share some experiences with each other and enhance their possibilities when new users are “connected” to the system.
Another aspect is a pure economic aspect of externality when more or less users are connected to the broadcasting system. The reason can be found in one of the characteristics of a public good, where one individual’s consumption is equal to the total consumption. The costs of production and distribution are the same regardless of how many consumers use the service. Consequently the consumers are interested in having as many as possible to share the costs. In this way there is a positive externality connected to entrance of a new user and a negative externality to departure of one user. This is directly applicable when licence fees are used to fund the service and indirectly in advertising financed broadcasting. The latter with the implicit assumption that increase in advertising revenue will be used in production.
The content related externalities are also important regarding broadcasting. There are negative externalities connected to bad quality and potentially subversive types of programming. When a consumer satisfies his preferences (utility) consuming a type of programming it is at the same time possible that it will have negative external effects on others in form of, e.g., violence or indifference. The broadcasting program does not need to result in direct action or non-action from the consumers. It may be enough when, e.g., the elderly people believe that programmes containing violence result in violence. They will in this case get scared and consequently have lower welfare57.
On the other hand, there are positive effects connected to ’positive’ and good quality programmes. Examples are educational programmes or programmes that increase the general level of knowledge in the society and, consequently, result in more economic activity that is good for the society as a whole.
Another dimension is the contribution from broadcasting to keep the society coherent and to develop a common publicity, where different interests and demands are balanced in a reasonable form. This is also an aspect of network externality, where there is a social interest to influence as many users as possible to move in the same direction by broadcasting services.
In connection with the negative, content related, externalities the government can limit access to or forbid un-acceptable content. On the other hand government can support ’good’ content by giving special good possibilities to the broadcasters that meet the quality requirements. This has in Europe, but also in the American debate, been used as a strong 56 Varian 1999, Op. Cit. 57 The examples are from Andrew Graham’s paper. s. 166: “Broadcasting Policy in the Digital Age2, in Charles Firestone and Amy Korzick Garmer (red.): “Digital Broadcasting and the Public Interest”, The Aspen Institute, Washington DC 1998

Chapter 3: Broadcasting economics 59
argument for content regulation, and certain requirements are imposed on children’s and educational programs.
3.2.3 Natural monopoly In Europe, broadcasting was in the beginning organised as governmental monopolies or monopolies granted by concessions by governments. A real competitive market for broadcasting did not have the possibility to develop and, consequently, the broadcasting market may be characterised as having market failures. But this was, among others, a result of the chosen organisation of broadcasting in Europe. The question is then: Did broadcasting have specific characteristics that ”naturally” resulted in organisation of the service as a monopoly, or was it a political, and content-related decision? This is discussed in the following.
The traditional theory of natural monopoly is related to economy of scale and economy of scope, that results in a more efficient allocation of resources if the production is organised as a monopoly because of decreasing unit costs in the relevant production interval. Also, structural reasons may be given, where, e.g., the requirements to investments are so heavy that production only can be achieved by one firm in the given economy.
However, this type of solution is only efficient if the monopolist does not misuse its monopoly status by requiring over prices, producing goods of low quality or other forms for inefficiency. Natural monopoly can, consequently, result in a two-folded governmental policy: On the one hand, government must protect the monopolist by giving it special privileges and, on the other hand, government must control the monopolist in relation to prices, quality and other performance parameters.
Apart from economy of scope and scale, discussed in the following, two other issues related to broadcasting influence the monopoly organisation of the service; namely the resource and the content issue. The resource and content aspects are discussed later in this chapter.
3.2.3.1 Economy of scale As for discussions of the economy of scale and the economy of scope, it can be difficult to give a final answer to the question about whether there are tendencies towards a natural monopoly in the broadcasting field. However, the premises for the answer are important. Marginal costs of reaching an extra viewer or listener by terrestrial transmission would be equal to or close to zero, unless it is necessary to set up new transmission equipment to reach the new user. It does not cost more to produce the programmes and to transmit them when a new user joins in. Thus it is an obvious case of the economy of scale – not necessarily in the sense of fewer costs per produced broadcasting service if you are big, but in the sense that it costs less per user. But, naturally, the level is decisive. If the total costs are low there are many broadcasters who would be able to make use of the economy of scale.
In fact, the total costs of producing a broadcasting service vary considerably. If the case is a high quality broadcasting, the total costs and accordingly the input costs of becoming a broadcaster will be high since it is cost demanding to produce or to buy high quality programmes. However, this point is primarily valid for TV. For instance, calculations show that the average costs of one hour BBC TV production in the middle of 1990’s amounted to

Chapter 3: Broadcasting economics 60
approx. 1.5 mill. DKr. (200.000 US$), and a drama programme cost around 7.5 mill. DKr. (1 mill. US$) per hour58. In the case of low quality productions or programmes that are cheap due to other reasons, the total costs and entrance costs for new operators become proportionally lower, and on cost grounds it would be easy for new operators to establish themselves, the fact which speaks against a tendency towards monopolisation59.
The discussion, therefore, depends highly on which type of programme is considered. It is thus a characteristic illustration of the market, that the most significant of the emerging competitors on, e.g., the Danish TV market, TV3 and TV Danmark both send mainly cheap imported serials or talk shows plus a few expensive high profiled programmes. Otherwise it would be too costly to establish a new broadcast-service on the Danish market.
The discussion can be further developed. The marginal costs to offer services to an extra consumer are, as mentioned, equal to or almost zero. But, inversely, the costs also remain constant, even though there are fewer consumers. In the free market situation, followed by fewer consumers per broadcaster, the costs per consumer become higher. This is of course most critical in the smaller countries, where the markets for broadcast services are limited. This is the situation, which TV2 (one of the Danish national public service stations) in recent years have had to gradually acknowledge, as the commercial broadcasters TV3 and TV Danmark have entered the market.
As for the consumers, this means that, either they will have to pay more in order to deal with the increasing expenses - in the situation when there are more broadcasters - or they just have to resign themselves to a declining quality, in order to keep the expenses down. There is, in this way, a trade-off between more channels and lower costs, and / or between more channels and quality.
The reasoning presupposes that the monopoly provider doesn’t make use of the position of his monopoly to broadcast low quality programmes, and that competition doesn’t spur the providers to be more effective and produce more quality for less money. It also implies that the consumer doesn’t appreciate this larger diversity, which is possible when there are more providers, but the reasoning also points to the fact that the providers can face financial problems if their number increases.
3.2.3.2 Economy of scope As for the advantages of economy of scope (joint production benefits), it is also possible to show they exist within broadcasting. In historical terms the benefits of economy of scope have not been significant. Radio and television in European countries have the same organization, but there has been no market synergy between the two areas. In Denmark, e.g., the Danish State Radio and Television has for many years been based in different locations. These have had parallel departments within the different areas such as news, entertainment, etc. It is only recently, in connection with the discussion about a move to the new location, digitalisation, and similar matters that Danmark Radio (DR) has been trying to realize potential advantages in joint production, as in merging the news and other departments. The explanation for this development can be that DR is seeking to rationalize its program production in the competitive situation, which now exists on the Danish
58 See Andrew Graham: ”Broadcasting Policy in the Digital Age”, in Charles Firestone and Amy Korzik Garmer: ”Digital Broadcasting and the Public Interest”, The Aspen Institute, 1998, page 156. 59 Note that the issue here is the costs of production of programs. The transmission, in principal, costs the same for all if the intention is to reach the same audience. But it is the content costs, i.e. the costs of manpower, talents, or rights (of sports, for instance), which is the major cost in connection to most of broadcasting.

Chapter 3: Broadcasting economics 61
broadcast market. But this change is also connected to the technological changes, which are taking place within different areas of communication. Digitalisation gives new possibilities for storing and processing information for use in various media, and so the new technology provides benefits of joint production60.
These advantages go beyond the traditional broadcast area. Digitalisation creates a background for convergence not only in technological terms but also with regard to business. Areas that until now have been kept separate, such as telecommunication, information technology, broadcasting and other forms of publication can now be combined.
This development can further be shown in the many large mergers of firms, which have taken place in the later years and which continue in ever-greater tempo, as result of loosening ownership regulations. It is, naturally, a question of making use of the advantages of large units of production, but also of profiting from the benefits of joint utilization, as when the American telephone company, AT&T buys up the cable television company TCI, when Disney takes over ABC, and when the Internet company AOL joins forces with Time-Warner.
It was at one time discussed whether there really is a possibility of realizing benefits of joint production in various areas of communication, or if it is a question of such different spheres with different traditions and customer relations that no synergy could thereby be obtained. But today it is apparent that it is not just megalomania, which is behind the buy-outs and the mergers, but that there in fact are advantages in joint utilization in the ongoing convergence process in different parts of communication system. For this reason it is likely that we will experience ever more concentration of economies within the communications sectors.
3.2.4 Asymmetrical information According to the neo-classical economic theory, one of the basic pre-conditions for a perfect competition market is that there is full information available in the market for all actors (See above). Not only must all agents have full knowledge on the prices, they must also have knowledge on the quality and the utility they will achieve when consuming different goods. It is obvious that this is a theoretical situation, and that no market can meet these preconditions. The question is then if broadcasting have a special problem regarding this, which requires specific governmental interventions.
Compared to the good market, the service market, including information services, has a bigger problem, because the consumers have no knowledge on the quality of the service before they consume it. Regarding information services, including broadcasting, the buyer does not have any knowledge on the information before he / she consumes it. If he / she did have knowledge, he / she will never buy it. More detailed discussion is given, among others, by the American economist Kenneth Arrow61.
60 In the US market, however, the cross ownership regulations have played an impending role regarding economy of scope. 61 See Arrow K.: ”Economic Welfare and the Allocation of Resources for Invention”, in ”The Rate and Direction of Inventive Activity: Economic and Social Factors”, Princeton University Press, 1962.

Chapter 3: Broadcasting economics 62
3.2.5 Radio spectrum The aim of this sub-chapter is to discuss, what the spectrum is and whether the scarcity of resources in the radio spectrum will necessitate regulation or, e.g., monopoly organisation of the service in a monopoly market. The scarcity argument has been one of the most used argumentation for regulation of broadcasting.
A definition of spectrum and radio spectrum is given in the FCC spectrum agreement on banc hearing62:
“Spectrum is a conceptual tool used to organise and map a set of physical phenomena. Electric and magnetic fields produce electromagnetic waves that move through the space at different frequencies, and the set of all possible frequencies is called the electromagnetic spectrum. The subset of frequencies between 3 kHz and 300 GHz is what we refer as the radio spectrum”.
One of the problems of using the electromagnetic waves is interference. The problem is that two electromagnetic waves of the same frequency can cancel or magnify each other. Therefore, two users cannot use the same frequency at the same geographical location at the same time.
The radio spectrum has 3 dimensions: Frequency, space and time. Two spectrum users can only transmit on the same frequency at the same time if they are sufficiently separated physically. They then occupy different parts of the spectrum in the spatial sense. Similarly, the spectrum can be divided in terms of frequency or in a temporal sense, depending largely on the hours of use. Interference occurs when two signals attempt to occupy the same spectrum in all three of its dimensions.
Furthermore, different frequencies have different propagation characteristics and different capacities for transport of information making them proper for specific services and improper for other services. When frequencies are low (long wavelengths), the electromagnetic waves bend around corners or buildings or mountains. When they are high, they travel only in straight lines, requiring line of sight between transmitter and receiver. The amount of information that can be carried increases with the increase of the frequencies.
In principal the frequency resources are unlimited. But at different levels of technological development, the portions of the frequency that can be used are different. In the beginning, especially in the smaller countries, where the frequencies could not be reused, the amount of resources was very limited.
Even in the large countries the interference problem cannot allow a total free use of the available resources. The situation of broadcasting in the beginning years is illustrated by Riem Hoffmann:
“In the beginning there was no regulation on the use of the radio spectrum but the situation got chaotic. There were so many stations and no rules for using the frequencies. Everybody wanted to talk but nobody could hear anybody. This imposed the necessity for some type of regulation to put an end to the ‘chaos in the ether’. The regulation that was imposed had the character of ‘traffic regulation’ but since the frequencies were scarce, the regulatory duty grew into the area in which consideration of common goods63 was used to find or justify criteria for allocation”64.
62 FCC Spectrum agreement on banc hearing, April 6, 1999, Washington D.C 63 i.e. ”public interest, convenience and necessity” 64 Hoffmann R. W.: “Regulating Media”, The Guilford Press, New York and London, 1996

Chapter 3: Broadcasting economics 63
As depicted on Table 3-2, the spectrum is divided into different bands, extending from Very Low Frequencies (VLF) to Extremely High Frequencies (EHF).
Frequency band Frequency range Typical service
Very Low Frequency (VLF) 3 kHz to 30 kHz Point-to-Point communication and navigation aids
Low Frequency (LF) 30 kHz to 300 kHz AM radio
Medium Frequency (MF) 300 kHz to 3 MHz AM radio
High Frequency (HF) 3 MHz to 30 MHz Short wave radio
Very High Frequency (VHF) 30 MHz to 300 MHz FM radio, DAB as well as TV
Ultra High Frequency (UHF) 300MHz to 3 GHz TV, DVB and Microwave
Super High Frequency (SHF) 3 GHz to 30 GHz Microwave and satellite
Extremely High Frequency (EHF) 30 GHz to 300 GHz Microwave and satellite
Table 3-2 Frequency bands
To avoid interference and optimise the use of these resources, national and international bodies have been established to cope with ‘allocation policies’.
Dividing the spectrum among the services and users is an important and highly complex issue that involves both technical and non-technical considerations. This process has been denoted as frequency management and consists of 3 separate but not always distinct processes65: (Carter et all, 1986):
• Allocation: The division of the spectrum in blocks of frequencies to be used for specific services. TV services are, for instance, allocated certain frequencies in the VHF and UHF bands (See table 1).
• Allotment: The distribution of the spectrum rights within allocated bands to uses in various geographical areas.
• Assignment: The choice among potential users of allocated and allotted channels or frequency bands.
Using scarcity of radio spectrum as an argument for governmental intervention has been criticised from the beginning of the radio broadcastings establishment. The argument against regulation has been that the market is there to allocate scarce resources and the scarcity by itself does not validate external regulations. One of the economists that has done major work in this area is Ronald Coase66. Coases’ conclusion is that the spectrum must be seen as another production factor and the value of it must be set in the market in a free competition, and the interference problem must be solved by the regular private property right legislation. Coase argues that by using this approach the frequencies will be allocated
65 Carter T. B., Franklin M. A., Wright J. B.: “The First Amendment and the Fifth Estate”, the foundation Press New York, 1986. 66 R. Coase: The federal Communication Commission, The journal of Law & Economics, October 1959

Chapter 3: Broadcasting economics 64
in the most efficient way and to the best-valued users.
The resource conditions have very much changed in the current situation. Today it is possible to use satellites, cables that are dominant transmission systems in some areas. Especially using digital technology in broadcasting results in more efficient use of the available resources, also in the terrestrial network, and it is possible to use other transmission forms like MVDS, ADSL etc. (see the chapter on technological changes). Consequently, today, at a general level, the scarcity of resources is not significant, though there can be struggles between the actors to acquire resources in the terrestrial broadcasting network for digital TV.
The new situation, with the huge amount of resources and new distribution forms that can be used for broadcasting, does not result in ending governmental regulation of the radio spectrum. There is still a need for procedures for allocation, allotment and assignment of frequencies. This is not only because of interference, but there are plenty of other reasons, like maintaining a coherent platform for the development of the industry, to maintain the system.
The fact that in the majority of European countries there was only one broadcaster, was very much a political and content related decision, where the political intention was to control the media and the limited and scarce resources has been used as a neutral argumentation. The connection between the resource scarcity and the intention (and institution) of public service has, with this background, been that in return for using the frequencies the broadcasters are required to meet a regulatory framework regarding content and organisation.
3.2.6 Content issues It has generally been required that the general public must have access to the services that from the societal (or government) side have been considered to be the ‘right’ and ‘appropriate’ type of programming. These being the requirements for individual programs, like decency, or requirements for availability of certain types of programming, like programs for children and educational programming, or requirements for the combination of different program types, like pluralism, neutrality, and fairness. The argumentations are at best political argumentation. However, they will contribute to the welfare economic analysis of broadcasting using the above-mentioned “Sen’s capability approach” to understand the organisation of broadcasting and will justify the historically deployed organisations of Public service broadcasting in Europe, also in the monopoly organisation.
There is another issue related to content that can be analysed in the framework of this project: Broadcasting and generally media markets differ from regular markets because they are at the same time involved in two different markets; the content market and the advertising markets. This creates a dependency between the two markets, where the advertising market can have influence on the offered content. This dual market nature is described in the following.
3.2.6.1 Dual-product market As described above, traditional broadcasting has both characteristics of public goods, the non-excludability and non-rival consumption can be applied to. Modern broadcasting can be considered as Club good due to decreasing costs of excluding the non-payers. The

Chapter 3: Broadcasting economics 65
discussion in the following regards traditional broadcasting. Like production of other public goods there are constrains on how the market works. It is not possible to exclude people resulting in the situation, where some consumers can enjoy the service without paying for it (free rider problem). As mentioned above, when the program is produced the marginal costs of reaching one more consumer is small (almost zero), which makes it difficult for the price mechanism to work optimally.
As mentioned previously to find a solution for the problem, in the beginning a private market for radio broadcasting was established, where the hardware radio manufactures, vertically integrated with the service providers, collected revenues from selling radio receivers and the broadcasting service was considered as a service provided to add value to the hardware67. The revenue collected from selling radio receivers was used to fund the service. Later, firms that did not have any hardware radio production established broadcasting service provision. These new firms had the problem of making revenues on their business. They added value to the existing broadcasting service market, a sort of positive externality to the existing radio manufactures, without making any profit. New business models had to be deployed for the industry to survive.
Using indirect payment by providing advertising was a known revenue source from the writing press, which could easily be used to finance broadcasting services. By using advertising, a business was created that functioned without any interventions like posing cross subsiding to correct the mentioned positive externality. In the beginning the incumbent writing press resisted the entrance of newcomers but advertising was deployed initially in the US broadcasting market and later also in Europe.
Basing the revenues on advertising implies that media, including broadcasting, operate in two markets, a dul product market, as depicted in Figure 3-9. They create one product but participate in two product markets.
Goods / service Market
Media goods
(Content product)
Access to Audiences
(for advertisers)
Figure 3-9 Elements in definition of media Good / service market68
The first market is the content product market; regarding broadcasting it is the market for production of radio and TV programs. The content is marketed to the consumers and the performance is measured through audience rating. The second market is the market for selling advertising. Advertisers seek access to the audience and as Pickard puts it “Media [including broadcasting] sell access to the audiences to the advertisers”69. These two markets are however in close relation with each other and influence each other; greater demand for media content enables companies to charge higher prices for their advertising. 67 See, e.g., Coase R. H.: “British broadcasting, a study in monopoly”, London school of economics and political science, 1948 68 Pickard 1989 69 Ibid.

Chapter 3: Broadcasting economics 66
Likewise, a drop in audience share will trigger a decline in advertising revenues.
In addition to operating in the content and advertising market, the broadcasting companies operate in specific geographic areas. Due to regulation in different countries the radio /TV broadcasters operate at national or regional basis. Emergence of cable / satellite infrastructures and loosening regulations have enabled broadcasters to operate in larger regions and also on an international basis. In Figure 3-10 the total market for media, including broadcasting, is depicted.
Goods / service Market
Media goods
(Content product)
Access to Audiences
(for advertisers)
Geographic Market
Geographic Boundaries
(Defined by industry, government, or media unit)
Figure 3-10 Defining the market70
The number of suppliers in a given market and the level of competition between them define the market structures.
3.3 Conclusion In this chapter, the broadcasting market is described at a theoretical level. In a market oriented theory, the strength and weaknesses of the market to allocate the available resources are analysed. The conclusion is, that in the situation with few resources available, e.g. in traditional broadcasting, the market on its own could not meet all consumers’ demand. It can further be concluded that when resource scarcity is removed and the market is large enough then the consumer’s preference spectrum can be covered by the market. There will especially in small markets remain a funding problem for provision of a narrow type of programming. As it can be seen throughout this report, in the light of technological development and development in political set-up, new organisation and funding forms can be implemented to cover the program types that will not be served in a market-oriented solution.
The second part of this chapter shows, that even when the transmission resource scarcity is removed, other market failures result in non-optimal performance of the market on its own. At a theoretical level, it is proved that due to public good characteristic of broadcasting as well as externality and other market failures, the regulation of broadcasting in Europe and US has been necessary and can to some extent be justified in the future. It is also shown that the pre-conditions for public good characteristic of the broadcasting services are changing, and broadcasting services are developing towards Club and private goods. But the pricing problem will not be solved at this level, and regular pricing systems cannot regulate production of broadcasting services even in its characteristic as club good. 70 Ibid.

Chapter 3: Broadcasting economics 67
Furthermore, regarding advertising financed broadcasting, the involvement of broadcasting in the dual product market will result in the advertisement market’s influence on the content market. This, alongside, with the possibilities for, e.g., market concentration and vertical integration are among other factors that can necessitate remaining regulation in the broadcasting market.

68
4. Digital broadcasting, technology and service
The aim of this chapter is to give a description of the technology deployed in digital broadcasting and to outline the emerging new possibilities for service development in digital broadcasting. Deploying digital technology in broadcasting, combined with interactivity, create immense possibilities for development of new services and business opportunities. In analogue broadcasting, for a long time the service did not change radically. The major development occurred in emergence of new infrastructures to carry basically the same type of service, but more of it. Looking at history and regulation of broadcasting (see previous chapters), it is obvious why the development took this direction towards expansion of transmission resources. The resources in terrestrial broadcasting were scarce and were assigned already, and new competition could only occur if new transmission resources were invented, or the available resources were used more efficiently. There have, however, also been technological developments in the quality of the service and emergence of new services in analogue broadcasting. The direction of the development has been towards more advanced camera and editing technologies on the supply side and better and more robust receiver and antenna technologies on the demand site. Another important development has been exploiting unutilised part of the spectrum that was allocated to broadcasting, but in practice, could not be deployed for transmission of active pictures, e.g., using Vertical Blanking Interval (VBI) for transmission of text TV in Europe. VBI has also been deployed to transmit additional signals to the receivers to improve the technical quality of pictures at the receive site. Both regarding development of camera/editing and receiver technologies, and regarding development of new services, digital technology has been deployed in different degrees in analogue broadcasting. Furthermore, in the 1980’s research towards defining the standard for advanced TV systems with higher signal quality was intensified and new standards in satellite broadcasting emerged. Efforts were also done to use these standards in terrestrial broadcasting, but at the culmination of these developments and almost before their use in terrestrial broadcasting1, digital broadcasting was developed and found to be a better alternative. A common international standard for digital TV is not available, but some of central elements, as the video coding standard MPEG-2, are standardised. However the (European) Digital Video Broadcasting (DVB) 2 project has defined standards for distribution of digital TV in the different delivery networks. The important DVB standards are; DVB-T for terrestrial, DVB-S for satellite, and DVB-C for cable networks. In the US market the ATSC standard is used for digital terrestrial broadcasting, where satellite and cable networks use either DVB or North American standards. Other countries have used one of these standards or a combination of different standards. As seen in the following TV broadcasting consists both of video, audio and data components. Video and audio have been subject for intensive technological 1 The Japanese standard “narrow MUSE” was almost accepted as the new standard in US. See later about narrow MUSE. 2 Appendix VII contains an overview of different digital TV standards.

Chapter 4: Digital broadcasting, technology and service 69
developments in digital broadcasting, and data, with exception of Text TV, almost only emerged by digital technology. The main challenge in TV broadcasting has, however, been to reduce the capacity required to transmit video. Therefore in the following, the descriptions on technological development concern primarily the video component. In the following, analogue broadcasting is described and it is identified how digital technology has been deployed in the analogue era. Digital broadcasting will only be completely understood if its roots in analogue broadcasting are identified. In the next subchapter, digital broadcasting is described both regarding the basic technologies that are deployed, and regarding the changes in the value chain from content production to the end-users’ consumption. Later, service development in digital broadcasting is described. Finally, the convergence process between digital broadcasting, telecommunication and Information Technology is described shortly.
4.1 Analogue broadcasting Looking at the value chain from content creation to the end user consumption, described in the following, it is obvious that delivery networks are the most important parts regarding the objective of this project. This is due to the fact that the delivery networks are the infrastructures that connect the producer to the end-user, and determine the type and quality of services that can be offered in the market. Changes and development in delivery networks have direct impacts both at the supply and demand sides. Consequently, the technological development in delivery networks has been important technological parameters in the evolution of the broadcasting market. Understanding the standards deployed in analogue broadcasting is important to be able to apprehend the technology of broadcasting. In Europe, two different standards, PAL/SECAM, are used and in North America a totally different standard, NTSC, is used. In search for better technical quality, the two continents have been competing from the beginning to define the future analogue TV standards. Europe has joined efforts towards one common standard, led by the ECC and later the EU to avoid having different standards in Europe. However, the competition for standardisation of advanced TV has not only been between Europe and the US. Japan that allocated substantial resources in research and development of advanced TV systems was among the first to define standards for advanced TV systems. As history showed later, none of the analogue standards could survive, as digital broadcasting proved its superiority in all aspects. In the development of analogue broadcasting services, both in the development towards better picture quality and the development of new services, digital technology was partly used. The pure digital broadcasting can be seen as the natural development inside broadcasting and the spill-over from the development of multi-media systems in information technology and telecommunications. In the following, the value chain of analogue broadcasting is defined. Then different analogue TV systems and service development in analogue broadcasting are described. Later, the distribution and delivery networks are described in more detail. Finally, the driving parameters in development from analogue to digital broadcasting are summarised.
4.1.1 Value chain of analogue broadcasting In the Figure 4-1 the value chain for analogue broadcasting is depicted.

Chapter 4: Digital broadcasting, technology and service 70
Broadcasting Station
Produc- tion part
Distribu- tion part
Delivery Network
End-User (Receiver Equipment)
Distribution Network
Contribution Network
Content Provider
Contribution Network
Distribution Network
Broadcast- ing station
News Agency
Freelance
Cable
Satellite
Terrestrial
TV
TV
TV
TV
TV
TV
Contribution part Distribution and delivery part
Figure 4-1 Value chain in analogue broadcasting As shown in the figure the value chain can be divided in two main parts: The Contribution (inter-firm and business-to-business) and the distribution / delivery (business-to-consumer) parts. The characteristics of the services and the requirements to the networks are different in these two parts. In the contribution part, the majority of the services are not finalised and are in un-edited (raw) format. However, the level of finalisation of the services varies, in some cases, they are source materials like video materials from a News agency on different events, and in some cases they are more prepared like a movie or a documentary bought from a content provider. Even in the latter case, some further processing, like putting subtitles, removing some parts or adding some other information, e.g., advertisements within the programs can be necessary. This rawness of materials and the necessity for further processing requires that the material must be of high quality, as the editor must be able to work with the material almost frame by frame. Consequently the requirements on the technical quality of the signal in the contribution network are very high. Regarding the distribution and delivery part, the service is in the finalised state and is ready to be consumed, and the consumer does not need to process the information. Therefore the requirements on the technical quality of the signal in these networks are lower than the contribution network. In the following, different parts of the value chain are described in brief. Later, in the next subchapter, the distribution and delivery networks are described in more detail.
• Content: The content providers are broadcasting stations and different specialised and general bureaus. The broadcasting station by itself creates some of the content, but it also acquires content from commercial firms like news agencies, freelance journalists, and firms specialised in creation of entertainment / education

Chapter 4: Digital broadcasting, technology and service 71
programming. Furthermore, the broadcasters provide content to each other, e.g., members of European Broadcasting Union (EBU) provide news materials from their countries to others.
• Contribution network: The network that carries the content to the broadcasting station is called contribution network. It can be a high-speed telecommunication link as well as other high-speed links, like radio wave and satellite links.
• Broadcasting station: The broadcasting station can in this respect be divided in two different parts: The production part, connected to the contribution network, with the task of editing and finalising programs, and the distribution part that handles the final distribution of the programs to the end-users.
• Distribution network: The network between the broadcasting station and the delivery network is called a distribution network. In the beginning high-speed telecommunication networks were used as distribution network. In recent years satellite and radio links are replacing the telecommunication networks as distribution networks. Distribution network is only necessary when there is a geographical distance between the delivery networks and the broadcasting station. A local TV station, which only operates one transmitter and is physically located near the transmitter connects directly to the transmitter and, consequently, to the delivery network. Another example is broadcasting stations that directly feed the signal into cable TV networks.
• Delivery network: Delivery networks are the infrastructures that the end-user is connected to. The major delivery networks are terrestrial, satellite and cable TV networks. These networks, in the analogue world, are one-way networks towards the end-users
• End user: The end-user is of course the one who consumes the service. The reception of the service is done using receiver equipment consisting of a TV receiver and possibly an outdoor antenna.
4.1.2 Analogue TV systems3 The American NTSC and the European PAL (and SECAM) standards have dominated electronic TV systems, as all countries have conformed to one of these standards. In the following, these standards are defined, and the development of them and the emergence of new standards are described. First, a short definition of NTSC and PAL:
• NTSC. In 1940, The National Television System Committee (NTSC), the US standardisation organ, adopted the NTSC standard for TV broadcasting. The signal was initially black and white, colour was added in 1950. The colour TV standard was defined such that it was backward compatible with the black and white signal (see later for more details on the colour components). Two important parameters in the standardisation of TV systems were the resolution of the picture and the deployed frequency bandwidth. Through laboratory and user tests, the engineers of the National Television System Committee decided to use a vertical resolution of 525 lines and a horizontal resolution of 330 lines (pixels), and to use 6 MHz frequency bandwidth for a TV channel. The number of pictures per second is another
3 Analogue TV systems are described in many textbooks on broadcasting technology. The description in this chapter is based on following books: Prentiss S.: “ Television from Analogue to Digital”, TAB Books, Inc, 1985. Evans B.: “ Understanding digital TV- the route to HDTV”, IEEE PRESS, 1995. Brinkley J.: “Defining Vision- the battle for the future of television”, Harcourt Brace & Company, 1997. Baldwin T. F., McVoy D. S., Steinfield C.: “ Convergence- integrating media, information and communication”, SAGE Publication Inc., 1996. Whitaker J.: “ DTV the revolution in electronic imaging”, McGraw Hill, 1998.

Chapter 4: Digital broadcasting, technology and service 72
parameter that has been selected to be 304.
• PAL. The NTSC standard showed sensitivity for certain distortions caused during transmission and signal processing5. In Europe, the search for a better standard resulted in, among others, the Phase Alternation Line (PAL) standard, developed by the German W. Burch in 19616. In 1967 PAL started in Germany and UK. Today PAL is used in the rest of Western Europe and many other countries, including Brazil, Argentina, and China. PAL uses 625 vertical lines and about 420 horizontal lines (pixels) and 25 pictures per second7. The frequency bandwidth for a PAL TV channel is 7 MHz in VHF band and 8 MHz in the UHF band.
These standards have remained since, and practically all television equipments conform to one of these standards. Looking at the development of the standards one can see two different approaches: 1) Standardisation of TV system with better (sharper) picture quality / aspect ratio, and 2) Utilisation of the unused part of the assigned spectrum to transmit value added services. These two aspects are described in the following two sub-chapters.
4.1.2.1 New analogue TV standards In the search for new standards, better vertical and horizontal resolutions and better aspect ratio were meant to be vital in the next generation of TV systems. The TV monitor has been standardised to have the aspect ratio 4:3, but the TV industry in their search for better aspect ratio has argued for the superiority of 16:9, that also is used for movies8. Digital broadcasting supports 16:9, but analogue standards should be modified to be able to transmit 16:9 signals. In the following some of these standards are described.
• PAL plus. This is a system that makes it possible to transmit 16:9 signals in the conventional PAL TV spectrum. The system transmits the basic PAL letter-box format (420 horizontal pixel) signal. It adds additional data in the unused lines of the picture. These additional data are processed in the receiver to enhance the horizontal resolution with the needed 33% to 700 pixels. In this way the 16:9 TV receivers will be able to show a 16:9 program and the conventional 4:3 TV sets show the program in letter-box format.
• EDTV. Enhanced Definition TV (EDTV) or Improved Definition TV (IDTV) are the common concepts used in the US for improvements that has been made on the ordinary TV systems. The enhancement signals are transmitted along with the original TV signals using the unused part of the spectrum. This extra information is then processed in the receiver to improve the displayed picture. Using this definition the PAL plus can also be considered as EDTV.
• MAC. In 1982 a new colour TV system called Multiplex Analogue Component (MAC) was standardised. MAC was designed to bring the studio quality signal of 700/720 pixels (see the Rec 601, later in this chapter) to the end users. The frequency spectrum MAC standard uses is more than the frequency allocations of terrestrial TV (12 MHz). The intention has never been to use the MAC standard for terrestrial broadcasting but to use it for direct satellite broadcasting. Different types of MAC
4 30 pictures per second is chosen, because it is easy to obtain the frequency from AC power supply that is 60 Hz in US. 5 Bruin R. and Smits J. 1999, Op. Cit 6 Another standard was Systèm Électronique Couleur Avec mèmoire (SECAM) developed by Henri de Franc in 1957. In 1967 SECAM started in France and the former Soviet Union. Today SECAM is used in France, Greece, Eastern Europe and Iran 7 AC power in Europe is 50 Hz 8 16:9 TV has a had hard time to be accepted. There are still too few programs in this format. The development of digital technology will have positive impacts on penetration of 16:9.

Chapter 4: Digital broadcasting, technology and service 73
standards have been used on the market. We can distinguish between the following MAC systems9:
o B-MAC. B-Mac is the oldest form of MAC in the market place. It offers better definition than NTSC and PAL and has enjoyed worldwide success in the specialist markets.
o C-MAC. Was the first MAC to be based on the 700/720 pixel resolution. It has been suppressed by D-MAC.
o D-MAC. Is what is referred as regular MAC with 700/720 pixel picture resolution.
o Wide D-MAC. Is D-MAC, where horizontal resolution is extended to 960 pixels.
o HD-MAC. Is the higher definition variant of Wide D-MAC, which depends on additional digital enhancement signal to achieve sharper picture. HD-MAC was the European answer to HDTV standardisation
o D2-MAC. Is the bandwidth-limited version of D-MAC that is optimised to fit into one PAL 8 MHz channel. Horizontal definition in D2-Mac is reduced from 700 to 450 pixels.
• MUSE. The Multiple Subnyquist Sampling Encoding (MUSE) was Japans answer to the enhanced TV systems. MUSE is a satellite High Definition TV (HDTV) standard that was used in Japan and that was almost to be used in the US in late 1980’s. The vertical resolution of the signal was 1125 lines and the horizontal resolution could vary. The frequency spectrum of MUSE exceeded one NTSC TV channel (it used about 9 MHz), but NHK, the national broadcaster in Japan, designed a new standard, called narrow MUSE10 that fitted in one 6 MHz NTSC channel. MUSE and narrow MUSE were intended to be marketed in US in the beginning of 1990’s, where digital technology was in a very mature state. MUSE could not survive the competition with pure digital standards11.
4.1.2.2 New services in analogue TV As mentioned before, another direction of the development was towards development of new services. Also here, like in the case of EDTV, the part of the spectrum that could not be used for transmission of active pictures was used for transmission of additional signals. These were used to offer stand-alone services to the end-consumers. One of the most successful new services was Tele-text, commonly called text TV. But what are these unused parts of the spectrum and why cannot they be used for transmission of active pictures? Two of the major ones are the taboo channels and the Vertical Blanking Interval (VBI) described in the following:
• Taboo channels. The taboo channels are the channels that have remained unused because of problems of interference and inter-modulation. One example is the neighbour channels to a TV channel that must remain unused due to co-channel interference. If two analogue TV channels are transmitted in neighbour channels, the signal on both channels will be degraded due to co-channel interference, but if one of them is used to transmit, e.g., low power digital data it will not interfere with the TV signal. In this way, immense resources can be released for other uses.
9 Evans B. 1995, Op. Cit. 10 Narrow MUSE was primarily developed to convince the American market to accept the standard. 11 See among others Brinkley J. 1998, Op Cit.

Chapter 4: Digital broadcasting, technology and service 74
• VBI. A 525-line NTSC television frame consists of two fields of 262.5 horizontal lines each. The first 21 lines of each field are not part of the active / visible picture and are called the Vertical Blanking Interval (VBI). Of these 21 lines, the first 9 are used while the cathode ray moves from the bottom to the top of the screen, but the remaining lines are available for data transport. There are 12 possible VBI lines being broadcast 60 times a second (each field 30 times a second). In some countries Line 21 is reserved for the transport of closed captioning data. It should be noted that some of these lines are used for existing, proprietary, data and testing services12.
It is primarily VBI that has been used for development of new services, because VBI is a part of the allocated and assigned spectrum that the broadcaster is allowed to use. The taboo channels are kept unused to meet some minimum requirements in frequency planning, and to use these resources for provision of new services the user must apply for these frequencies. Text TV has been one of the most successful services transmitted in VBI in Europe. Closed captioning (sub-titling) for the deaf and elder people is another service that has been globally successful. Apart from these, as stated above, there are many test signals, clock and date signals, etc. transmitted in VBI that can be considered as Value added services. As a new service transmission of the Internet Protocol (IP) over VBI has been standardised. This standardisation is done in the project, RFC 2728, funded by Internet Society. IP over VBI will open up for transmission of services known from Internet, like HTML pages over broadcasting network. The success of new VBI services will highly depend on the penetration of digital TV, because data services are an integrated part of digital TV.
4.1.3 Distribution and contribution networks The distribution and contribution networks have gone through similar technological developments. In the following these developments are described. It is important to underline that even when development of contribution networks in a technological sense is similar to distribution networks, the market development in the contribution and distribution parts is quiet different. The following description of the technological development in contribution networks is given to give a better understanding of the technological development and does not change the focus of the project that is on the distribution part. Contribution and distribution networks have mainly been implemented using telecommunication networks. Therefore the development of new standards and the increase of available capacity in the telecommunication networks have been among the important parameters in this development. The radio links and satellite links, used in contribution and distribution, have followed the standards used in telecommunication. In the following a description of the development in telecommunication standards is given. The transmission forms in modern telecommunication networks have been digital for the last 30 – 40 years. To use them as transport infrastructure for TV signals it has been necessary to digitalise the analogue TV signal. An international standard, Rec 601, is used to digitise TV signals (see below). The digitised TV signal requires immense capacity to be transmitted, 270 Mbit/s for studio quality (see below). This capacity has not always been available, and when available has been too expensive to use. There are, however, redundant informations in the TV signal that can be removed prior to the transmission of the signal. Using compression, it is possible to reduce the digital signal capacity in a way that it is feasible to transmit TV signals in the
12 See Prentiss S. 1985 page 187 for a detailed description of different lines

Chapter 4: Digital broadcasting, technology and service 75
telecommunication networks without considerable loss of signal quality that is one of the requirements for contribution/distribution purposes. In the following first, the basic technology of analogue to digital conversion is described, then a short description of the development of different transmission forms in telecommunication networks is given. Then the digital standard, Rec 601 is described and, finally, some of the compression standards used in contribution and distribution networks are described.
4.1.3.1 Analogue to digital conversion Analogue to digital conversion (A/D) is the process of converting a continuous analogue signal into digital codes. The inverse process of re-generating the analogue signal from the digital codes is called digital to analogue (D/A) conversion. Two main processes are deployed in the analogue to digital conversion of a signal: Sampling and quantisation. Sampling denotes registration of the value of the analogue signal at different discrete times, and quantisation denotes the representation of these values using absolute numbers (digital codes). One of the questions regarding sampling is, how often a signal must be sampled to be sure that the analogue signal can be reproduced without spurious effects. The rule is first described and proved by Nyquist in the ‘Nyquist theorem’13 defining the minimum sampling frequency for a band limited signal to be at least twice the maximum frequency of the signal. Regarding video as described later in this subchapter, a sampling frequency of 13.5 MHz is used for the luminance component, which has a maximum frequency of 5.75 MHz. Another step is quantisation, i.e., representation of the sample values by digital codes. The number of codes used per sample is called the resolution of quantisation. In practice the quantisation process is not an exact process as it is impossible to represent the analogue signal values by digital codes. The signal will often be rounded up and down to match the chosen codes, generating quantisation noise. On the other hand, it is not necessary to have exact representation of signals as regarding, e.g., audio and video the sensitivity of the human ear and eye will put a natural minimum for the resolution. The resolution of 8 bits is defined regarding TV broadcast signals14 and 10 bits for the studio quality signal. When for example 8 bits resolution is used, there are 28 or 256 possible quantisation levels for the signal to take. Figure 4-2 shows how different quantisation levels are used for the luminance and chrominance signals15 in a colour TV component signal.
13 See for example: Owen F. F. E.:”PCM and Digital Transmission Systems”, Texas Instruments Electronic Series, 1982, page 46. 14 Regarding audio higher resolution is necessary. Here resolutions of 16, 20 and 24 bit are defined in different standards. 15 The luminance and chrominance signals are defined later in this sub chapter in relation to description of Rec 601 standard.

Chapter 4: Digital broadcasting, technology and service 76
0
255
Black level
Luminance Component
16
0
255
Zerro level Chrominance Component
128
Figure 4-2 8 bit quantisation levels for component signals16
As seen in the figure, the luminance signal can take values in the range of 16 to 235, where 16 represent black level and the chrominance is centred on the value 128 and can take values in the range 16 to 240. The reasons for choosing these ranges are17:
• To reduce the granular noise of all three signals (one luminance and two colour difference signals) in later stage of processing, and
• To make chrominance values positive to ease processing operations (e.g., storage)
4.1.3.2 Transmission forms in telecommunication networks The basis and the fundament of telecommunication networks has been transmission of regular telephony service, also called Plain Old Telephony Services (POTS). The development of the telecommunication network has been driven by the demand for carrying more and more POTS from one geographical area to the other. The first technology to carry several POTS on the same transmission line was Frequency Division Multiplexing (FDM), where the signals were modulated on different carrier frequencies. In the beginning of the1960’s, a radical transformation was introduced as analogue telephone signals were digitised and multiplexed digitally using Pulse Code Modulation (PCM). As described above, digitalisation of an analogue signal is performed by sampling and quantisation of the signal. A telephone signal has a bandwidth of 3.1 KHz. The signal is sampled, using sampling frequency of 8 KHz and quantised by 8 bit per sample resulting in a digital bandwidth of 64 Kbit/s for a telephone signal. This basis signal is multiplexed using Time Division Multiplexing (TDM) to obtain a high-speed bit stream. In Europe, e.g., 32 of the 64 Kbit/s signals are used to establish a 2 Mbit/s channel, also called the first order Plesiochronous18 Digital Hierarchy (PDH). Figure 4-3 shows different orders of PDH hierarchy.
16 O’leary S.: “Understanding digital terrestrial broadcasting”, Artech House, 2000 17 Ghanbari M. : “ Video coding – an introduction to standard codecs”, IEEE, 1999 18 Almost synchronous

Chapter 4: Digital broadcasting, technology and service 77
64 Kbit/s
2.048 Mbit/s Zero Order
First Order
X32
1.544 Mbit/s
DS1
X24
E1
8.448 Mbit/s
Second
6.312 Mbit/s
DS2
E2 X4
X4
X3
34.368 Mbit/s
Third Order
44.736 Mbit/s
DS3
E3 X4
X7
139.264 Mbit/s
Fourth
274.176 Mbit/s
E4 X4
X6
X3
564.992 Mbit/s X4
Figure 4-3 European and North American Transmission Hierarchies19 Of these different PDH hierarchies, E3 and E4 in Europe and DS3 in US, are used for transmission of high quality video signals in Contribution and distribution networks. DS3 and E4 are the last hierarchies implemented in PDH, as a new transmission standard, Synchronous Digital Hierarchy (SDH) emerged as more efficient than PDH to handle high-speed data transmission. PDH is almost synchronous, meaning that, e.g., different 2 Mbit/s channels can be generated by different equipments each generating slightly different bit rates. Thus, before these 2 Mbit/s channels can be bit interleaved they must all brought up to the same bit rate by adding ‘dummy’ information bits, or ‘justification bits’. The justification bits are recognised as such when the demultiplexing occurs, and discarded from the original signal20 This process is the main drawbacks of the PDH system, resulting in the necessity of demultiplexing of, e.g., all 2 Mbit/s channels to provide one 2 Mbit/s channel to a customer. The use of justification bits at each level in the PDH means that identifying the exact location of the frames from a single 2 Mbit/s line within say a 140 Mbit/s channel is impossible. In order to access a single 2 Mbit/s line in the 140 Mbit/s channel it must be completely demultiplexed to its 64 constituent 2 Mbit/s lines via 34 and 8 Mbit/s… This lack of flexibility of PDH induced the development of the Synchronous transmission system, SDH21. SDH is a complex transmission system that provides flexibility in multiplexing /demultiplexing as well as management of the network. The basis rate of SDH (STM-1) is 155.52 Mbit/ s and the higher rates occure by multiplying the basis rate with four. So the second rate (STM-4) is 622.080 mbit/s and the third rate (STM-16) is almost 2.5 Gbit/s (2.48832 Gbit/s)22. SDH is backward compatible with PDH in a way that the multiplexing structure can handle all different order PDH channels. In this way the E3 and E4 (34 and 140 Mbit/s) channels and DS3 (45 Mbit/s) channel that are important for contribution and distribution networks will be carried in a STM-1 frame. Furthermore it is possible to use the whole capacity of STM-1 (155 Mbit/s) to transmit super high quality video in a contribution networks. Another major development in the transmission forms was standardisation of Asynchronous
19 Newall C.: “ Synchronous Transmission Systems”, Northern Telecom Europe, 1992 20 Ibid. 21 The North American standard that is standardized by ANSI is SONET. SONET is mainly similar to SDH and after ITU-T has standardized SDH as the global standard, SONET can be considered as a subset of SDH. 22 SDH is described in several recommendations, standards and lately also text books. A reference that gives a good overview of different transmission forms, including SDH is: Ericsson Telia “Understanding telecommunications”, Sweden 1998.

Chapter 4: Digital broadcasting, technology and service 78
Transfer Mode (ATM)23. ATM enables a more flexible sharing of network resources than both PDH and SDH. ATM is a cell-based technology, where the data are transmitted in small packets called cells. ATM is used both as a transmission form of its own, and can easily be used in connection with, e.g., SDH networks, where the ATM cells are carried in the STM-1 frames. ATM is not described in more details here because the main contribution / distribution standards that are in use are based on PDH standards (see below).
4.1.3.3 Rec 601 Rec 601 is an abbreviation of CCIR24 Recommendation 601 that sets a high quality digital television studio picture standard for both European 625 line and the American 525 line TV systems. Rec 601 is used to transmit video signals in a studio, and different compressed version of it is used in the contribution and distribution networks. Before giving a description of Rec 601, some basics on video technology and formats are given in the following. The retina contains three set of cones that are separately sensitive to red, green and blue light. The cones are dispersed uniformly in the colour sensitive area of retina, so that light falling on them produces a sensation of colour depending on the amount of red, green and blue components, e.g., if the ratio of R:G:B: is 30:60:10 the colour is white25. A colour camera outputs the three RGB signals and a colour TV needs this RGB signal to display the colour picture. The only problem is that if the RGB signal is broadcasted to all TV equipments, then the Black and White TV receivers cannot use the signal. One of the requirements on the colour TV standard was that it should be backward compatible with the black and white signal. The RGB signals should then be converted to another signal containing both black and white information (luminance) and the colour information (chrominance). These luminance and chrominance signals are then converted back to RGB in the TV receiver and displayed on the monitor. The luminance signal (Y) is the sum of RGB signal in different ratios. Symbolically the Y can be presented as: Y = R + G + B26. Regarding chrominance, it is decided to transmit two signals (U or Cb, and V or Cr)27, also called colour difference signals: U = B – Y and V = R – Y. It is not necessary to also transmi G – Y signal as it can be calculated in the receiver: G – Y = - (R + B). The digital standard, Rec 601, is based on this new signal set, YUV signals. The frequency bandwidth of the Luminance signal (Y) is 5.75 MHz and the two colour difference signals, U and V, have a frequency bandwidth of 2.75 MHz. According to Rec 601 a sampling frequency of 13.5 MHz is used for the Y component and a sampling frequency of 6.75 for U and V components28. This results in a format that generally is called the 4:2:2 format indicating that the chrominance signals are sampled by half of the frequency of the luminance signal. Using 8 bit per sample will result in a total digital bandwidth of: 13.5 MHz * 8bit + 6.75 MHz * 8 bit + 6.75 MHz * 8 bit = 216 Mbit / s for an analogue TV channel. If we use 10 bit per sample, which is used for studio quality TV, then the gross bit rate of an analogue TV channel will be 270 Mbit/s using the same calculation. 23 ATM is also described in variety of standards and recommendation and text book. Good description of ATM and its connection to video transmission is given in, among others, following books: Riley M. J. and Richardson I. E. G.:”Digital video communications”, Artech House, London, 1997. And Leduc J. P.: “Digital moving pictures, coding and transmission on ATM networks”, Elesvier, 1994. 24 Cometé Consultatif International Télégraphe et Téléphone (an ITU organisation) 25 Whitaker J. 1998 26 See Ghanbari M.: “ Video coding, an introduction to standard codecs”, IEEE, 1999, page 9 for the exact formula consisting of the ratios. 27 Cb, and Cr denote Colour difference Blue and Colour difference red 28 According to Nyquist samplings theorem the minimum sampling frequency most be the double of the frequency bandwidth of the signal.

Chapter 4: Digital broadcasting, technology and service 79
An important aspect of Rec 601 is the ability of defining a common digital standard that has been accepted both in Europe and the US. What is more, the horizontal resolution of the visible part of the picture is chosen to be 720 pixels, that results in the same bit rate for the active part of the picture both in the European 625 lines and the American 525 lines standards. The following calculations show the logic: According to above-mentioned discussion about VBI, the active part of the picture is a fraction of the total number of lines. In Europe, the active part consists of 576 lines. When the horizontal resolution is set to 720 pixels and there are 25 pictures per second and every pixel can be represented by 16 bits (8 bit luminance and 8 bits the two chrominance components), then the bit rate for active pictures will be: 576 * 720 * 25 * 16 = 165.888 Mbit /s. Now let us do the same calculation for the American standard. Here the number of active lines is 480, the horizontal resolution and the number of bits per pixel are the same, and the number of pictures per second is 30. Hence the bit rate for active picture is: 480 * 720 * 30 * 16 = 165.888 Mbit / s, exactly the same bit rate as in the European case. As long as we are in the studio environment and the distances are not too long, it is possible to establish transmission lines to transmit, e.g., the 270 Mbit / s signal. A transmission format, Serial Digital Component Video (4:2:2) (SMPTE 259M/EBU Tech. 3627), commonly called SDI29 interface, is standardised to carry the 270 Mbit/s and is widely used in the studios. But as seen in the sub-chapter on transmission forms in telecommunication networks, even 216 Mbit / s is too much and too expensive to be transmitted outside studios. There are different ways to deal with these problems. The sampling frequency can be reduced, like e.g., in 4:2:0 sampling format, where the chrominance signals are sampled in every second line, keeping the same horizontal resolution as 4:2:2 but halving the vertical resolution of the colour component. Or compression technologies can be used to remove redundant information from the signal and send the compressed signal in telecommunication lines. The latter is described in the following.
4.1.3.4 Compression standards used in contribution and distribution networks There are redundant informations in the video signals. These can be removed and consequently the amount of bits per second that must be transmitted will be reduced substantially (see next subchapter for more details). Compression technologies determine the digital bandwidth by making a trade off between how much capacity is available and the quality of service that is needed. More detailed discussion on compression technologies is given in the next sub chapter on digital broadcasting. As described earlier, the quality requirements of distribution and especially contribution networks are very high. Therefore, the bit rate reduction in these networks is not so high but high enough to make them feasible to be transmitted in telecommunication networks. In the pure digital broadcasting environment, however, the requirements on signal quality will be similar in distribution and delivery networks because it is the same signal that is transmitted in the two networks. In the following, some of the standards used in these distribution and contribution networks are described30: Contribution: 29 Serial Digital Interface 30 See among others: ITU. : “ A planning guide for digital television: Contribution and distribution networks”, Geneva, 1999

Chapter 4: Digital broadcasting, technology and service 80
• ITU-T J. 80: This is a 140 Mbit/s top quality standard for 625/25 European standard, normally via optical fibre links. In an annex to the standard it is specified how to use the standard for transmission of NTSC 525/30 system. Here a bit rate of 150 Mbit / s is suggested.
• ITU-T J. 81: In this standard the compression level is higher: 34 Mbit/s in Europe and 45 Mbit /s in North America are used to transmit high quality digital TV signal. Several manufacturers increase the compression even more and can supply 2 TV channels in these 34 and 45 Mbit /s frames, e.g., they provide 2 X 17 Mbit/s option, which is a useful option if the quality requirements are not that high.
• MPEG–2 High Profile @ Main level (4:2:2): This is a 4:2:2 standard based on MPEG-2 (see later). The importance of this standard is that it is based on MPEG-2 that has different levels covering both contributions, distribution and delivery networks within the same family of standards.
Distribution:
• MPEG –2 Main Profile @ Main level (4:2:0): This is a distribution standard, intended for delivering TV signals to the general public, either through delivery network or directly to the end-consumers. The deployed capacity for a TV channel varies and bit rates up to 15 Mbit/s can be used (See later about MPEG-2).
• 8.448 Mbit/s derived from ITU-T J. 81: This standard is appropriate for the networks where the delivery network is analogue. It has the advantage of transmitting 4:2:2 signals, compared to 4:2:0 MPEG-2, and has the disadvantage of being a stand alone standard compared to MPEG-2. The system is used, among others, for Satellite News Gathering (SNG) feeds and distribution to analogue terrestrial delivery networks.
Different transmission lines can be used to transport contribution and distribution signals. It can be terrestrial networks consisting of, e.g., optical fibres using PDH, SDH or ATM transmission systems. Regarding 34 and 45 Mbit/s, satellite links can also be used. In the following figure (Figure 4-4) an example of using satellite link is depicted.

Chapter 4: Digital broadcasting, technology and service 81
High power Amplifier
14 GHz
UPConverter
14 GHz
Modulator
70 MHz IF
34 Mbit/s Coder
34 Mbit/s
Select D1 or P/S/N inputConditional Access control
SDI (270 Mbit/s)P/S/N
LR
14 GHz
11 GHz
Low Noise Amplifier
11 GHz
DownConverter
11 GHz
Demodulator
70 MHz IF
34 Mbit/s Decoder
34 Mbit/s
Misc signal
SDI (270 Mbit/s)P/S/N
LR
P = PAL L = Left Audio
S = SECAM R = Right Audio
N = NTSC
IF = Intermediate frequency
Figure 4-4 Basic 34 Mbit/s Satellite Link configuration31
As seen in the figure, the SDI studio quality or analogue PAL/SECAM/NTSC signal is send to the 34 Mbit/s encoder. The encoder uses the video and the audio signals to encode the signal to 34 Mbit/s. If required Conditional Access system (see next subchapter) will then be implemented prior to transmission of the signal. The signal is then modulated to an Intermediate Frequency with 70 MHz bandwidth and Up converted to the frequency band that is used for up-link in satellite networks (14 GHz). At the reception end the downlink frequency (11 GHz) is downconverted to an Intermediate Frequency and the demodulated signal is sent to the 34 Mbit/s decoder that outputs the original analogue or digital signals.
4.1.4 Delivery networks Delivery networks are the final infrastructures that facilitate the end user to be able to consume the services. 3 major delivery networks in the analogue world, terrestrial, satellite and cable networks, are described in the following.
4.1.4.1 Terrestrial Terrestrial networks are the oldest and most common networks in the world. Terrestrial networks are used intensively and the majority of people receive the national broadcasting services either directly through terrestrial networks or indirectly by means of MATV or cable networks. In the following figure (Figure 4-5) the allocated frequencies for radio and TV in Europe are specified.
31 ITU 99, OP. Cit.

Chapter 4: Digital broadcasting, technology and service 82
EHF
SHF
UHF
VHF
HF
MF
LF
VLF
AM radio
AM radio
2 - 4 TV FM radio 5 - 12 TV
21 - 60 TV
3 KHz
30 KHz
300 KHz
3 MHz
30 MHz
300 MHz
3 GHz
30 GHz
30 KHz
300 KHz
3 MHz
30 MHz
300 MHz
3 GHz
30 GHz
300 GHz
EHF : Extremely High Frequency SHF : Super High Frequency UHF : Ultra High Frequency VHF : Very High Frequency HF : High Frequency MF : Medium Frequency LF : Low Frequency VLF : Very Low Frequency
Figure 4-5 TV spectrum
The allocated frequencies for analogue TV channel that occupy 7 MHz in VHF band and 8 MHz in UHF band are numbered, from 2 to 6032. These numbers indicate exactly where in the spectrum the TV channels are located. A terrestrial TV transmitter is a ground-based antenna that emits the modulated TV signal using the allocated VHF or UHF frequencies. The TV tuner can directly tune to the signal that is received through an antenna. The VHF and UHF frequencies have good propagation characteristics but at the same time suffer from noise, multi-path interference, etc. A complicated frequency planning is necessary to use the frequency resources optimally and at the same time provide an acceptable technical Quality Of Service. As described earlier, interference will occur if the same frequency is used by more than one in the same geographical area and at the same time. What is more, e.g., the neighbour channels to a TV channel must also remain unused to avoid co-channel interference. Furthermore, in the coverage area of one transmitter and in part of neighbouring area33 of the transmitter, the TV channels that are 9 channels above the transmitter channels (mirror frequency) may not be used, due to inter modulation problems. The coverage of transmitters can be different depending on the geographical characteristics of the area. To cover large areas a detailed frequency planning will indicate how many main transmitters are necessary. Figure 4-6 shows the location of main transmitters for one of the national TV stations in Denmark, TV2, to establish country-wide coverage. 32 Channel one and channels 61 to 69 are also allocated for TV but are reserved for military use 33 Depends on several factors, like the geographical terrain (mountains, flat, water, etc.)

Chapter 4: Digital broadcasting, technology and service 83
Sendere for TV 2Hovedsender
Figure 4-6: TV2s main transmitters34 During the last couple of decades a range of new low power UHF channels are allocated to local radio/TV broadcasting. The local broadcasting stations have a short geographical coverage and are mainly implemented in high-populated areas, especially in big cities.
4.1.4.2 Cable As described earlier, cable TV started as Master Antenna TV (MATV) and later Satellite MATV (SMATV) to serve building blocks of more than two households in a more efficient way. As the name indicates the MATV and SMATV use a master antenna that receives signals either from the terrestrial network or from satellite networks and retransmit the signals to the consumers using cables. Later, regulations permitted establishment of cable networks that is a further development of MATV and SMATV. A cable TV network can cover larger geographical areas. Many MATV and SMATV systems have been connected to cable TV networks and receive their signals from them. In the following Figure 4-7 the overall structure of a SMATV network is depicted. As depicted in the figure, the feed to the head station can come from a satellite network or an external cable network35. The cable TV networks have developed rapidly and reach a substantial part of the households in the industrialised countries. This has created the possibility for provision of cable-only services, services that are only available in the cable TV network. Furthermore the cable TV networks enable bypassing a distribution network as the services can be directly fed into the cable TV networks.
34 Annex of the report: “DVB the future of TV”, published by Center for Tele-Information, Denmark 1998 35 In many cases only one of these inputs is selected, but of course the owners of the system can decide to compose their program provision from both sources

Chapter 4: Digital broadcasting, technology and service 84
"external" CableHeadstation
Spliter
Amplifier
Spliter Spliter
Set-TopBox
TVTV
Network
Figure 4-7 A diagram of SMATV system36
As described earlier, one of the advantages of using cable networks was that it increased the available resources for transmission of TV. There are, however, also constraints on the capacity of cable TV in different technological developments. The frequency resources that can be utilised have developed due to technological development in the components that deal with the reception of the signals and transmission of them in the network, as well as technological development in cabling and connection of the networks. In the oldest cable TV systems the frequency capacity that could be utilised was 230 MHz equivalent to 11 TV channels. A capacity that was OK as long as the problem was re-distribution of the locally available terrestrial signals. Development of satellite technology created the possibility for new sources of content. This development together with the political liberalisation of broadcasting had vital impacts on the development of cable TV towards expantion of usable resources. Figure 4-8 illustrates different frequency capacities, and their equivalent number of TV channels, that can be used in cable TV / SMATV systems. There are still older SMATV systems that only have 230 MHz capacity.
36 Source: Andersen Management International (AMI): “A report on digital decoders and cable TV – prepared for the Ministry of Research”, Denmark 1999.

Chapter 4: Digital broadcasting, technology and service 85
0 10 20 30 40 50 60 70
230 300 450 606 860 Frequency bandwidth MHz
Number of TV channels
Figure 4-8 Frequency bandwidth in relation to the number of channels37
4.1.4.3 Satellite As described earlier, in the beginning satellite networks38 were primarily used as distribution and contribution networks. However from the start, also in the low power and medium power era, there were private households that were willing to invest in complicated and expensive equipments that were necessary to receive the signal. The development towards high power Direct Broadcast Satellites that resulted in cheaper transmission and reception technologies changed the profile of the satellite TV consumers radically, from a niche group of enthusiasts to mass consumers of these TV services. Figure 4-9 a schematic diagram is depicted showing different uses of satellite networks. Satellite delivery network denotes the Direct To Home (DTH) segment of the network that is directly targeted to the end-consumers. In the beginning of the 1980’s some portions of C-band (around 7 GHz) were allocated for satellite broadcasting. C-bands satellites were low power satellites and were meant to be used primarily for contribution and distribution purposes. Later portions of KU band (around 11 GHz) were allocated to medium power satellites again for contribution / distribution purposes. 1) The power level, 2) the characteristics of the frequencies, and 3) the allocated distance between satellites along the geo-stationary orbital arc, are among the parameters that determine the size of the receiving dish and the complexity of the receiving equipments.
37 Source: Andersen Management International 1999, Op Cit. 38 The satellite networks in this paper denote, as described earlier, the geo-stationary satellite networks used for TV transmission.

Chapter 4: Digital broadcasting, technology and service 86
Cable / MMDS Head end
DTH
SMATV
SNG
UP LINK
Figure 4-9 Satellite network
By optimising these parameters, the new allocations for Direct To Home Satellites in the Ku-band resulted in a more simple reception of the signals and this has been a driving factor in the success of satellite broadcasting. Table 4-1 illustrates some characteristics of different broadcast satellite systems.
Power Spectrum use Transponder power Receiving antenna diameter
Users
Low C-band 2-15 watts 8 – 10 feet Contribution / distribution
Medium Ku-band 20-60 watts 3 – 4 feet Contribution / distribution
High Ku-band 100-200 watts 1 – 2 feet Direct To home delivery
Table 4-1 Characteristics of Broadcast satellite systems39
4.1.5 Technological drivers towards Digital broadcasting As seen throughout this subchapter, digital technology has been used in different parts of the broadcasting system also in the analogue era. Digital broadcasting was standardised in Rec 601 long before the emergence of standards for digitalisation of delivery networks. Digital technology was also used extensively in the development of new services like Text TV and in the refinement of the technical picture quality by transmitting extra information in digital form alongside with the TV signals. As mentioned above, these extra digital informations are processed in the TV receiver to obtain a better picture quality. Hence, the roots of digital technology in the analogue world are obvious and identifiable.
39 Source: Johnson L. L.: “Towards competition in cable television”, MIT press, 1994

Chapter 4: Digital broadcasting, technology and service 87
As mentioned above, the transmission bandwidth a pure digitised TV signal occupies is so high that, apart from specialised use, it is un-economical to transmit the signal out of studios. On the other hand, it is not necessary to transmit the whole signal in digital form, because there are redundant informations in the signal that can be removed prior to transmission. Removing redundant information, bit rate reduction, audio/video coding, or compression as the concept has been called has been the key element in the technological development towards digital broadcasting. Hence, the bandwidth economy has been the main driver in the development of digital technology in transmission of broadcast services. Development of services has been another driver towards digital broadcasting. The development here has been towards better quality video / audio signals and development of totally new type of services, including data services. The objective of this development from the industry side was adding value to the services and consequently creating new market opportunities. The spill-over from development in Information Technology (IT) and telecommunications and the synergy effects that could be obtained from these developments is another obvious driver towards digitalisation of broadcasting. Next subchapter is about deployment of digital technology in the delivery networks that indicates the total digitalisation of the broadcasting value chain. As for the distribution and contribution networks, the bandwidth economy has been the main driver in this development. Delivery networks and, especially, terrestrial networks suffer from resource scarcity that requires even more bit rate reduction. It has been possible to develop standards that use much lower bit rates, than discussed in this subchapter, and still deliver an acceptable technical quality. This is, among others, due to the lower requirements for technical quality in distribution and delivery networks compared with contribution networks, that result in the possibility of not only removing the redundant information from the signal but also accepting information losses that the human eye is not able detect.
4.2 Digital broadcasting40 Digital broadcasting denotes a broadcasting system, where the broadcasting signal is digital through the whole value chain from content creation until the consumption of the service at the end users’ site. The digital signal at the end users’ site can directly be fed into the integrated digital television receivers, or in a transition period through a set-top-box, to a regular analogue TV receiver. The simple digitalisation of an analogue signal was a revolution when it was invented, but it is not a recent phenomenon. As described earlier, digital technologies have been used in telecommunication networks since beginning of 1960’s using Pulse Code Modulation (PCM) of Plain Old Telephony Services (POTS). In broadcasting, using digital technology for transmission of signals has, however, become relevant in the recent years due to the above mentioned extensive development in audio/video coding and modulation of digital signals making it possible to ‘compress’ the digital data and drastically reduce the required transmission capacity, and also by development in modulation technologies. Consequently, the number of modulated bits per second per frequency unit has been increased and the frequency bandwidth needed to transmit a TV program has been reduced substantially.
40 Digital broadcasting has been described in different standards, recommendations, textbooks, etc. The description in this chapter is based on: Dambacher P.: “digital terrestrial television Broadcasting-Designs, systems and operation”, Springer, 1997. O’Leary S.: “ Understanding Digital terrestrial Broadcasting”, Artech House, 2000. Bruin R. d. and Smith J.: “Digital video broadcasting – Technology, Standards, and Regulations”, Artech House 1998. Whitaker J.: “ DTV the revolution in electronic imaging”, McGraw Hill, 1998. Richardson I. E. G: and Riley M. J.: “Digital Video Communications”, Artech House 1997. Leduc J. P.: “Digital Moving pictures – Coding and transmission on ATM networks”, Elsvier, 1994. Gerbarg D. (ed.):” The economics, technology, and content of digital TV”, Kulver Academic publishers, 1998. Rzeszawski T. S.:”Digital Video, Concepts and applications across industries”, IEEE Press, 1995.

Chapter 4: Digital broadcasting, technology and service 88
Today, the frequency capacity needed for a transmitter to distribute an analogue TV-program can be shared by several TV-programs or TV/radio-services41. Exactly how many services can share the capacity for one TV-channel depends very much on the quality requirements, deployed technology and the complexity of the video/audio sources that are subject for transmission, described in the following. In the following, first the value chain of digital broadcasting and the changes in value chain compared to analogue broadcasting are analysed. Then some basics technologies of digital broadcasting are described, leading to identification of the capacity available in the digital terrestrial, cable, and satellite networks. Later the access systems in digital broadcasting are described. Finally, an analysis is given on the delivery networks and service provision in digital broadcasting.
4.2.1 Value chain of digital broadcasting As it is seen throughout this chapter, digitalisation of broadcasting has radical impacts on the whole value chain of broadcasting. Furthermore, a new ‘chain’, service provision and multiplex function, is added to terrestrial digital broadcasting compared to analogue broadcasting. In Figure 4-10, the value chain of digital broadcasting is depicted. In the following, different parts of the value chain are analysed, in the light of the digitalisation process.
Multiplex operatorBroadcaster 1
Broadcaster 2
Broadcaster N / Data service provider
MUX
Delivery Network
Content provision.
Service provision
End user terminal
CA
EPG
Terrestrial, cable or satellite network
User 1(STB)
CA
User 2(STB)
User M(STB)
Distribution
Distribution
CA
CA
Figure 4-10 Value chain of digital broadcasting
• Content. Digitalisation influences on the content both regarding the content itself and regarding the new actors that will enter the market. By using the possibility of interactivity, the programs can evolve to involve the end-consumers actively in the programs they consume. Furthermore, new types of data services can be created and services known from the Internet can be provided in the broadcasting networks, and therefore new actors can enter in the broadcasting content provision market. The possibility for transmission of programmes in different technical qualities gives further the content providers new possibilities in their content creation and provision.
41 For digital broadcasting the concept service is used instead of channel. This is because there is no longer a unique relationship between the frequency and a TV / radio channel.

Chapter 4: Digital broadcasting, technology and service 89
• Distribution networks42 will carry the MPEG-2 TS from content providers to service providers and from service providers to delivery networks. The distribution networks are of course only used if there is a distance between the content provider, service provider, and the delivery networks. Distribution networks were one of the first parts of the value chain that was digitised using different ‘compression’ standards, including MPEG-2 standard (see previous subchapter).
• The end-user terminal will in a transition period be a digital Set-Top-Box eventually with a CA interface. In the long run integrated digital TV will replace the combination of analogue TV and digital Set-Top-Box. The interface to the end-user will be enhanced in digital TV as the programs give the end-user possibility for more active involvement in program production.
Delivery networks and service provision are most important regarding the objective of this thesis and are described in more detail in separate sub chapters.
4.2.2 Basic technologies The basic technologies that contribute to understanding of the resource, access and funding issues in digital broadcasting are among others: analogue to digital conversion, compression technologies, multiplexing of different services, Forward Error Correction (FEC), modulation, and (regarding terrestrial networks) Single Frequency Networks (SFN). Analogue to digital conversion is described in the previous sub-chapter and a description of other technologies is given in the following.
4.2.2.1 Compression As described earlier, different standards are used to reduce the number of bits of the video signal prior to transmission. The standards described in the previous subchapter concerned the contribution and distribution part of the chain. In this subchapter, a short description of basic concepts and technologies regarding compression of signals in delivery networks is given. MPEG-2 is the common standard for audio and video compression. MPEG-2 video is used in all standards in digital TV around the world and, as described earlier, covers both contribution and distribution / delivery networks, where MPEG-2 audio is only used in implementation of digital TV in some markets. The DVB standard uses both MPEG-2 video and audio. Before describing the MPEG-2 standard, it is important to give a description of some concepts and techniques used in the compression process.
Digital entropy
According to the definition presented by the Austrian physicist Ludwig Boltzmann, entropy43 is a measure of the number of different ways in which a system can be arranged, given by:
S= K loge W Where, S is the entropy, K is the Boltzmann’s constant and W is the number of ways the system can be arranged. Similarly for television signal the concept can be used in following way. The higher the number of possible pixels for the next picture, the higher is the entropy of the signal. In other 42 The Contribution part is not analysed here as the level of analysis given in the previous sub-chapter about analogue broadcasting is assumed to be sufficient in the framework of this thesis. 43 Originally the concept entropy comes from the second thermodynamic low and is defined as the ratio between the amount of heat (in joule) transferred to an object and the objects temperature (in Kelvin).

Chapter 4: Digital broadcasting, technology and service 90
words, the entropy of a television signal is what cannot be predicted about the content of the next picture44. The formula for this digital entropy is:
E= k log2 n Where, E is the picture entropy (bits/pixel), K is a constant and n is the number of possible states/pixel for the next picture45. A test signal with low noise has entropy of almost zero, because one picture has been sent and no changes occur in other frames, there is nothing that cannot be predicted. A movie scene with lots of action can have entropy of 5 or 6. TV pictures have entropy of 1 (bit/pixel) for, e.g., talking heads and 3 (bit/pixel) for fast moving sport events, higher entropies can also occur. Let us set the entropy for a normal TV picture to 3 bits/pixel. According to Rec 601 the TV picture contains: 720 * 576 * 25 = almost 10 mill. Pixels/second. With the entropy of 3 there must be transmitted 30 mill. bits /second, i.e., 30 Mbit/s to ensure no loss of information occurs when transmitting normal TV pictures. So the source video material that occupies about 166 Mbit/s can be compressed to 30 Mbit/s without any information loss for a moderately critical TV picture. This is what has been used in the J. 81, 34 Mbit / s standard that is used, e.g., in ETSI 34 Mbit/s Codecs. Digital entropy gives an indication of how much the bit rate can be reduced without loosing information. In ‘compression’ technologies, however, the bit reductions go far beyond the entropy levels, as limitations in display technology and limitations of the human eye permit to remove information from the signal. That is, some information can be removed from the signal in a way that the signal degradation cannot be perceived by the user, or the signal quality received at the users site conforms to the specific quality levels.
Intra-frame and inter-frame coding
The video signals can be coded or ‘compressed’ using two major characteristics of the signal:
• There are redundant informations in different frames of a TV signal.
• There are redundant informations in the successive frames transmitted in a TV signal.
The first characteristic implies using a method, where a TV picture is analysed on a frame basis to determine how the amount of bits of one frame can be reduced. As an example, if we look at a TV news-program on frame basis, we can see several similar pixels that represent the background picture. Instead of transmitting all similar bits on a line, one can transmit one of the bits and the number of them. In this way the bit rate is reduced inside a frame without having information about preceding and succeeding frames. This is called intra-frame or spatial compression. Another characteristic is used to reduce the transmitted bit rate by analysing the sequence of the transmitted pictures. In the European standards the pictures are sent 25 times per second. When one analyses two successive pictures there are small differences from one picture to the other. Instead of transmitting two almost identical pictures the difference of them can be sent. That is, after one picture is transmitted the difference between the successive pictures can be transmitted. The system is refreshed frequently by sending the original frame. This method is called inter-frame or temporal compression.
44 ITU 1999, Op. Cit. 45 Ibid.

Chapter 4: Digital broadcasting, technology and service 91
MPEG-2 MPEG-2 is standardised by the Moving Pictures Expert Group (MPEG)46. MPEG has various subgroups working on different areas like audio, video, systems, tests, digital storage media, requirements, and applications. MPEG has generated several standards for audio / video compression in different applications, among others:
• MPEG-1. Primarily intended for applications like computer images and graphics.
• MPEG-4. Contrary to MPEG-1 and MPEG-2 that are frame based, MPEG-4 is object based. MPEG-4 supports two-dimensional arbitrarily shaped, natural video object as well as synthetic data. Synthetic data includes text, generic 2D/3D graphics, and animated faces, enabling content-based interaction and manipulation. It is believed that MPEG-4 will be an important standard in Digital TV for handling data47.
• MPEG-7. Efficient and quick search for audio and video data, like DAB, Digital TV, Video on CD-ROMs and Internet is one of the challenges of the future. MPEG-7 will specify standards for multimedia description as well as description of a definition language to make it easy and efficient to search for audio/video information.
MPEG-2 is the most important standard regarding the subject of this thesis as it is used in digital broadcasting, both at contribution and distribution / delivery levels. MPEG-2 uses both intraframe and interframe coding and can generate different levels of bit rate reduction, some of them listed in Table 4-2. The bit rates in the table are maximum bit rates per given profile and level.
Levels Simple Profile (SP)
Main Profile (MP)
SNR Scalable Profile (SNRP)
Spatially Scalable Profile (SSP)
High Profile (HP)
High (HL) 1920X1152 pixels
MP@HL
80 Mbit/s
HP@HL
100 Mbit/s
High-1440 (H14L) 1440X1152 pixels
MP@H14L
60 Mbit/s
SSP@H14L
60 Mbit/s
HP@H14L
80 Mbit/s
Main (ML) 720X576 pixels (Rec 601 )
SP@ML
15 Mbit/s
MP@ML
15 Mbit/s
SNRP@ML
15 Mbit/s
HP@ML
20 Mbit/s
Low (LL) 352X288 pixels
SP@LL
4 Mbit/s
SNRP@LL
4 Mbit/s
Table 4-2 Levels and profiles of MPEG-248 MPEG-2 is intended to be generic in the sense that it serves a wide range of applications, bit rates, resolutions and services. As shown in the table, MPEG-2 covers different picture
46 In the subchcapers on organizations and standards, MPEG group is described. 47 O’leary S. 2000, Op. Cit. 48 Dambacher P.: ”Digital Terrestrial Television Broadcasting- Designs, system and operation”, Springer, 1997

Chapter 4: Digital broadcasting, technology and service 92
resolution from Low Level (352X288) pixels to a very high resolution of 1920X1152 pixels, also called High Definition TV (HDTV) resolution. As depicted in the table, MPEG-2 is divided in different levels and profiles. A profile is a subset of the entire bit-stream that is identified by the MPEG-2 specification. Profiles specify the samplings mode (4:2:2: or 4:2:0)49, scalability /Non-scalability, and technical parameters on coding forms. Within the bounds imposed by the syntax of a given profile, it is possible to encompass very large variations in the performance of encoders and decoders. Therefore the levels are defined to set standardised constraints on parameters in the bit stream. The levels define the vertical and horizontal resolution of frames.
4.2.2.2 Multiplexing and Multiplex-block MPEG-2 does not only provide compression / coding standard. At the system level of MPEG-2 standards, the multiplexing and transport frame structure of digital video / audio and data are standardised. Figure 4-11 shows a rough diagram of the MPEG-2 multiplexing structure. As shown in the figure, the MPEG-2 transport stream consists of different video/audio and data components. MPEG-2 TS multiplexer receives a mixture of video / audio and data signals at its input. These can in extreme cases consist of a large number of audio signals, pure data, or of video signals having different MPEG-2 specified quality levels up to and including HDTV.
MPEG TS MUX
TS
Packetiser Encoder Raw video ES PES
PES
PES
PES
Packetiser Encoder Raw Audio ES
Packetiser Data, e.g., text TV
PSI
Figure 4-11 MPEG-2 TS Multiplexer In Figure 4-11 the Elementary Stream (ES) denotes the encoded video and audio components, and Program Specific Information (PSI) is data transmitted in the TS for the receiver demultiplexer. As it can be seen ES and data services must be pocketised to a common frame, Packetised Elementary Stream (PES) before multiplexing. In Figure 4-12 the PES and TS frame structures are depicted.
49 Only High profile deploys 4:2:2. All other profiles deploy 4:2:0

Chapter 4: Digital broadcasting, technology and service 93
6 bytes
Header
3 to 259 bytes
PES Header(optional) Packet data bytes
up to 65,526bytes
PES packet structure
4 bytes
Header Payload
184 bytes
TS packet structure
Figure 4-12 PES and TS packet structures
The header fields contain different control informations that will be used by the demultiplexer to find the frame boundaries and demultiplex different components and send them to the decoders for further processing. The TS frames from different TS multiplexers can be multiplexed to generate new TS frames containing a variety of sources. A rough outline of a TS MUX handling different TS streams is given in the following.
MPEG TS MUX
TS
Packetiser Encoder Raw video ES PES
PES
PES
PES
Packetiser Encoder Raw Audio ES
Packetiser Data, e.g., text TV
PSI
MPEG TS MUX
TS
Packetiser Encoder Raw video ES PES
PES
PES
PES
Packetiser Encoder Raw Audio ES
Packetiser Data, e.g., text TV
PSI
MPEG TS MUX
TS
Packetiser Encoder Raw video ES PES
PES
PES
PES
Packetiser Encoder Raw Audio ES
Packetiser Data, e.g., text TV
PSI
MPEG TS MUX
TS
Figure 4-13 Multiple TS multiplexing

Chapter 4: Digital broadcasting, technology and service 94
The term Multiplex block denotes the MPEG-2 TS that can be transmitted in the same frequency bandwidth of an analogue channel. The term is commonly used for terrestrial digital broadcasting and denotes the MPEG-2 TS that can be transmitted in one 8 MHz TV channel.
Statistical multiplexing As described above, the amount of capacity a given source occupies after compression depends on the type and complexity of the material. In analogue transmission of TV and in most current digital transmission a constant transmission bandwidth is allocated to a service. As described above, Video-coding is based on compression of complex source materials that can have different (variable) bandwidth requirements. A talk show, e.g., requires less bandwidth than a fast moving sport event. These characteristics of the source material can be utilised in the multiplexing process and the allocation of capacity to different inputs. The digital transmission of audio / video through a multiplex-block containing different TV-services (and data-services) makes it relevant to allocate the bandwidth dynamically. At a given time, the services that require more bandwidth get more bandwidth and vice versa. This technology is called dynamic or statistical multiplexing. Efficient use of statistical multiplexing might be promoted by program planning, such that during given periods mixes of programs with potential low bandwidth requirement and high bandwidth requirements are transmitted. If a multiplex block is allocated one actor it can be easier to make this type of program planning. In the other, and more usual, cases where the capacity is shared by different actors this type of program planning can be rather difficult and involve the multiplex-operator in daily program planning. A solution that is not likely to be seen as attractive to the content providers.
4.2.2.3 Forward Error Correction Due to, among other things, noise and multi-path interference in the transmission medium the signals that are received at the end users’ site are often erroneous. These errors are experienced at the end-user as signal degradations, and consequently degradation of the quality of the audio / video signal. In the two-ways communication networks, the problem of errors are often solved by retransmission of the signal. Another technology that can be used, when there is no return path to send commands up-stream and ask the source to retransmit the signal, or the timing requirements of the signal does not permit retransmission, is Forward Error Correction (FEC). FEC is used in transmission of digital TV services. The idea is that some overhead informations are calculated and added to the signal prior to transmission. These overhead informations are then used in the decoder to detect and, if possible, correct the errors in the signal. An important issue regarding FEC is that part of the transmission capacity is ‘sacrificed’ to reduce errors and increase quality, and the more capacity that is ‘sacrificed’ for the FEC overhead the more secure is the transmission. In practice, the level of FEC is determined by the characteristic of the transmission medium. In the Digital Video Broadcasting (DVB) standard two different steps are deployed in the FEC process, inner and outer coding50. Regarding the outer router, the dedicated capacity
50 For the outer coder Read Solomon coding, RS(204,188) is used and for the inner coder other methods are used. See among others: Dambacher P. 1997, Op. Cit.
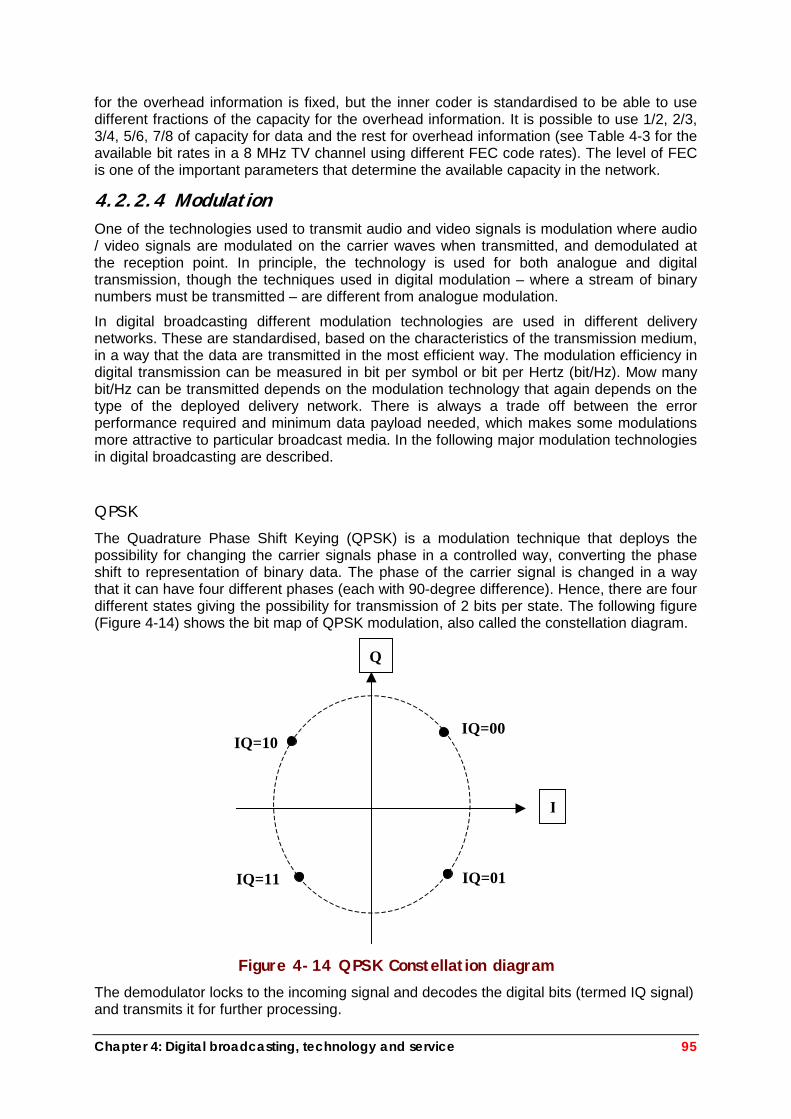
Chapter 4: Digital broadcasting, technology and service 95
for the overhead information is fixed, but the inner coder is standardised to be able to use different fractions of the capacity for the overhead information. It is possible to use 1/2, 2/3, 3/4, 5/6, 7/8 of capacity for data and the rest for overhead information (see Table 4-3 for the available bit rates in a 8 MHz TV channel using different FEC code rates). The level of FEC is one of the important parameters that determine the available capacity in the network.
4.2.2.4 Modulation One of the technologies used to transmit audio and video signals is modulation where audio / video signals are modulated on the carrier waves when transmitted, and demodulated at the reception point. In principle, the technology is used for both analogue and digital transmission, though the techniques used in digital modulation – where a stream of binary numbers must be transmitted – are different from analogue modulation. In digital broadcasting different modulation technologies are used in different delivery networks. These are standardised, based on the characteristics of the transmission medium, in a way that the data are transmitted in the most efficient way. The modulation efficiency in digital transmission can be measured in bit per symbol or bit per Hertz (bit/Hz). Mow many bit/Hz can be transmitted depends on the modulation technology that again depends on the type of the deployed delivery network. There is always a trade off between the error performance required and minimum data payload needed, which makes some modulations more attractive to particular broadcast media. In the following major modulation technologies in digital broadcasting are described.
QPSK The Quadrature Phase Shift Keying (QPSK) is a modulation technique that deploys the possibility for changing the carrier signals phase in a controlled way, converting the phase shift to representation of binary data. The phase of the carrier signal is changed in a way that it can have four different phases (each with 90-degree difference). Hence, there are four different states giving the possibility for transmission of 2 bits per state. The following figure (Figure 4-14) shows the bit map of QPSK modulation, also called the constellation diagram.
I
Q
IQ=00 IQ=10
IQ=01 IQ=11
Figure 4-14 QPSK Constellation diagram
The demodulator locks to the incoming signal and decodes the digital bits (termed IQ signal) and transmits it for further processing.

Chapter 4: Digital broadcasting, technology and service 96
QPSK is used in digital satellite broadcasting, for example in DVB-S. The modulation is also widely used for transmission of data in other systems, like in POTS modems, Digital Audio Broadcasting (DAB), and in transmission of data in radio links.
QAM In QPSK the phase shift is the only information used for modulation. By also changing the amplitude of the signal, it is possible to increase the number of bits per symbol compared to QPSK. The satellite networks are subject to power limitations and therefore the phase modulation (QPSK) is the most optimal digital modulation in satellite networks. Cable TV networks, on the other hand, can perfectly use amplitude modulation together with QPSK as there are no power limitations on cable TV and the noise level in cable TV networks is low. The modulation technology that uses changes in amplitude together with QPSK is called Quadrature Amplitude Modulation (QAM). Depending on, among others, the level of noise in the transmission medium different levels of amplitude modulation can be deployed. The basis level is 4-QAM where the amplitude modulation is not used and is equivalent to QPSK with the modulation efficiency of 2 bits/symbol. The next level is 16-QAM, where 4 bits per symbol are transmitted. Here two states of amplitudes are added to every quadrant of QPSK scheme. Following figure (Figure 4-15) shows the constellation diagram of 16-QAM.
I
Q IQ=00 IQ=10
IQ=01 IQ=11
00010000
0010 0011
1000 1010
1011 1001
0111 0101
0100 0110
11101111
1101 1100
Figure 4-15 16-QAM constellation diagram
In the next level of QAM, 32-QAM, 5 bits per symbol are transmitted. 64-QAM is the highest level QAM, which is widely used in cable TV and also in terrestrial broadcasting. The constellation diagram of 32-QAM and 64-QAM looks like 16-QAM with the difference that every quadrant represents 3 states in 32-QAM and 4 states in 64-QAM. As mentioned above QAM is used in digital cable networks. For example in DVB-C standard 64-QAM is standardised as the digital modulation technique.

Chapter 4: Digital broadcasting, technology and service 97
COFDM As mentioned previously, QAM modulation is used in terrestrial broadcasting but according to the DVB standard, prior to QAM modulation the carrier frequency is divided in several lower frequency carriers using Coded Orthogonal Frequency Division Multiplexing (COFDM). COFDM is a multi carrier modulation scheme also known from Digital Audio Broadcasting (DAB). The information data carried by the COFDM system is divided between many carriers in a way that each carrier is modulated with a very low bit rate signal. For modulation of the carriers 64-QAM can be used. COFDM is a Coded Orthogonal FDM modulation technique. The FDM refers to division of the overall spectrum of, e.g., a TV channel to several carriers that are spaced at a fixed frequency separation from each other. The term Coded denotes the fact that the system is error protected (coded). In the same way as FEC (described above), extra information is transmitted to correct the possible errors in the signal. The data and extra informations can be modulated on different carriers to increase the efficiency of the coding. The term Orthogonal means that the carriers must be placed in a way that they do not cause interference with each other. It is the requirement that the carriers are arranged in such way that the side bands of each carrier overlap and can be received without inter-carrier interference, hence the carriers must be orthogonal51. The COFDM standardised by DVB can operate in 2K and 8Kmode. The 2K mode contains 1705 carriers and the 8K mode contains 6817 carriers. 2K mode was standardised first and is implemented in the UK market. Sweden has adopted the 8k mode and other European countries will adopt this mode. As described above terrestrial environment suffers from the problem of multi path interference. One of the important characteristics of COFDM standard is that the multi path interference will not degrade the signal quality, on the contrary, COFDM utilises the multi path interference to increase the received signal quality as follows. Every carrier has a total symbol period that can be used for transmission of data. This symbol period is divided in two parts; the active symbol period, where the data is transmitted and a Guard Interval (GI), where nothing is transmitted. At the reception site both the direct signal and the delayed signals (caused by multi path interference) are received. If the Guard interval is dimensioned optimally, the delayed signals will be received in the Guard interval and can be ignored by the receiver or can even be added to the direct signal. The major difference between 2K and 8K systems is that, using the similar ratios for Guard interval and active period, the 8K system has a longer Guard interval. Consequently 8k system is more robust against multi path interference and also more efficient in Single Frequency Networks (SFN), described in the following. In Table 4-3, the bit rate available in a 8 MHz TV channel is presented using different modulations and Guard intervals. The code rate in the table refers to the FEC code rate (See above).
51 Shelswell P.: “ The COFDM modulation system: The heart of digital audio broadcasting”, Electronic & Communication Engineering Journal, 1995, PP. 127 – 136, in (O’leary S. 2000)

Chapter 4: Digital broadcasting, technology and service 98
Modulation Code rate Guard Interval 1/4
1/8
1/16
1/32
QPSK 1/2 2/3 3/4 5/6 7/8
4,98 6,64 7,46 8,29 8,71
3,53 7,37 8,29 9,22 9,68
5,85 7,81 8,78 9,76 10,25
6,01 8,04 9,05 10,05 10,56
16-QAM 1/2 2/3 3/4 5/6 7/8
9,95 13,27 14,93 16,59 17,42
11,06 14,75 16,59 18,43 19,35
11,71 15,61 17,56 19,52 20,49
12,06 16,09 18,10 20,11 21,11
64-QAM 1/2 2/3 3/4 5/6 7/8
14,93 19,91 22,39 24,88 26,13
16,59 22,12 24,88 27,65 29,03
17,56 23,42 26,35 20,27 30,74
18,10 24,13 27,14 30,16 31,67
Table 4-3 Available bit rates (in Mbit/s) in a 8 MHz TV channel52 As the table shows, using different parameters result in transmission of more or less data bit rates per 8 MHz TV channel. The network operator must decide the parameters that must be used depending on the complexity of the reception environment. The following parameters are used in implementation of digital TV in the Danish trail (see appendix II about the Danish trail): Guard interval of 1/32, FEC code rate of 2/3, and the 64-QAM modulation that result in about 24 Mbit/s. When planning for mobile reception other parameters will be used than is the case of stationary reception. Here it can be necessary to have high Guard Interval parameters and low FEC code rate parameters. Hence the capacity available for mobile reception will be less than stationary reception. Table 4-4 shows the modulation efficiency in bit/Hz using different parameters. The numbers are calculated by dividing the numbers in Table 4-3 by 8 MHz.
FEC code rate QPSK 16-QAM 64-QAM
1/2 2/3 3/4 5/6 7/8
0,75
1,01
1,13
1,25
1,32
1,50
2,01
2,26
2,31
2,63
2,26
3,01
3,39
3,77
3,95
Table 4-4 Modulation efficiency (Bit/s per Hz) for fixed Guard Interval = 1/32
4.2.2.5 Single Frequency Network (SFN) As described earlier, to cover an extended geographical area with the same signal it is necessary to use a number of transmitters. Using the same frequency planning for digital TV
52 ETSI/EBU EN 300 744

Chapter 4: Digital broadcasting, technology and service 99
as for analogue TV results in dedication of different frequencies to different transmitters. With this planning, a frequency set corresponding to analogue distribution of a countrywide program has the capacity for one countrywide multiplex block. Under certain conditions (e.g. with respect to the distance between transmitters) it is possible via Single Frequency Network (SFN) technology to use the same frequency on two or three neighbour transmitters, when COFDM modulation is used. In this technology ‘neighbour-signals’ are not received as interference, but as amplified ‘correct’ signals, due to the discussion of Guard Interval presented above. This will however depend on the distance between transmitters and the necessary Guard Interval. SFN originates from standardisation of Digital Audio Broadcasting (DAB). The DAB network is a SFN network and the allocation of frequencies for DAB is based on SFN. In DVB, on the other hand, the allocation is based on Multi Frequency Network (MFN). It is however possible to use SFN in connection to DVB if certain conditions are fulfilled. Because of the deployed MFN allocation, using SFN technology for TV broadcasting is not straightforward. This is, especially, the case since it is not always possible to use SFN technology in the border areas of a country because frequencies in one country may not meet the frequency requirements of a neighbouring country.
4.2.2.6 The capacity available for digital broadcasting As seen in the previous chapters about history, regulation and economics of broadcasting, one of the major problems of broadcasting has been the resource scarcity. As seen from the short technological overview presented in this chapter, the transmission resources are utilised more efficiently in digital broadcasting. Typical bit-rates in different delivery networks are presented in Table 4-5.
Typical net bit-rates
Terrestrial pr. 8 MHz 53 18-24Mb/s
Cable pr. 8 MHz 38 Mb/s
Satellite – typical54 39 Mb/s
Table 4-5 Typical net bit-rates55 The amount of capacity needed to transmit a TV service depends on the requirements on the signal quality and characteristics of the transmission medium. The capacity is, among others, determined by:
• The number of multiplex blocks defined within given frequency resources – E.g., the Single Frequency Network (SFN) technology can be used to increase this number in terrestrial networks.
53 This corresponds to the capacity for an analogue program transmission, but the result for digital depends on the chosen error correction mode 54 The frequency bandwidth of Satellite can vary considerably and different error correction modes can be deployed. Here is an example for 36 MHz bandwidth with 3/4 of the total capacity used for data transmission 55 Dambacher 1998, The bit-rates for satellite and cable are from the standards for DVB-C and DVB-S (ETS300429 and ETS300421) quoted in http://www.dvb.org)

Chapter 4: Digital broadcasting, technology and service 100
• Data capacity of a multiplex block – Here the modulation technology, the amount of overhead for error correction and statistical multiplexing are among the important factors.
• Data capacity requirements of one TV service – This is determined by, e.g., the required signal quality (TV standards) and audio-video ‘compression’ (coding) technologies and.
As seen earlier, MPEG2 is able to compress the digital TV signal in different levels resulting in different picture qualities. Generally four different quality categories are identified for digital TV:
• Low Definition TV (LDTV): requires approximately 2 Mbit/s and is comparable with VHS format (regular home video quality).
• Standard Definition TV (SDTV): requires approximately 5- 6 Mbit/s and is comparable with PAL TV-format (The quality of current analogue TV in many countries).
• Enhanced Definition TV (EDTV): requires approximately 8 Mbit/s and is comparable with the TV camera quality
• High Definition TV (HDTV): Requires approximately 20 Mbit/s and is comparable with high resolution TV cameras.
For comparison with analogue broadcasting let us assume that the TV services will continue to be transmitted in PAL quality (SDTV), which is chosen in Europe in the first phase. It is then obvious that in the same spectrum of an analogue TV channel, minimum four digital TV services can be transmitted in the terrestrial network and about seven services in the cable and satellite networks. This huge increase of four and seven times as analogue broadcasting, removes (or at least substantially decreases) the resource scarcity and opens the possibility for new actors to enter the market. Further increase of resources in digital broadcasting is achieved due to more efficient frequency planning, like utilising the taboo channels, deploying single frequency networks technology and statistical multiplexing as described above.
4.2.3 Access technologies In digital broadcasting, the signals can be targeted to specific users using Conditional Access (CA) technologies. Using CA the service can be targeted to the consumers who pay for the service and others can be excluded. This development has been and is vital for the development of pay TV market. An important characteristic of digital broadcasting is the possibility for provision of interactive services, where the user can be involved in the programs he or she consumes. The interactivity is implemented using a technology called Application Program Interface (API). API for TV is like the operating system for PC. These technologies are described in the following.
4.2.3.1 Conditional Access (CA) Conditional Access (CA) provides access to the end-users when certain requirements are met. Access systems are important in analogue satellite broadcasting to be able to offer

Chapter 4: Digital broadcasting, technology and service 101
services on subscription basis, and regarding cable infrastructure for provision of pay TV services. In digital broadcasting, Conditional Access is important in all infrastructures. This is because pay-TV (and other pay services) will also be available in terrestrial digital broadcasting, and even regarding free to air services, it can be necessary to use CA systems due to, e.g., copy right issues. The CA system consists mainly of two functions:
• Encryption / decryption of signals. The signals are encrypted in a way that only authorised users are able to decrypt and use them. The information necessary for decryption of the signal is transmitted alongside with the signal
• The CA management. The management function has the task of network management and subscriber management.
The following two figures (Figure 4-16 and Figure 4-17) give a rough illustration of the CA system at the supply and end-user sites. The figures are used in the following description of the two main functions of the CA system.
Pseudo Random Sequence generator
Conditional Access
Terrestrial, cable or satellite network
User 1(STB) CA
User 2(STB) CA
User n(STB) CA
Mathematical operation
P 1
P 2
P n
Code Word (CW) generator
CW
Data 1 Data 2 Data n Data 1’ Data 2’ Data n’
Original data coded data
Incoming data stream
Encryption module
CW
encryptedCW
Scrambler
CA system
Figure 4-16 CA at the supply site

Chapter 4: Digital broadcasting, technology and service 102
Pseudo Random Sequence generator
Terrestrial, cable or satellite network
Mathematical operation
P 1
P 2
P n
CW
Data 1Data 2Data nData 1’Data 2’Data n’
Uncoded dataCoded data
Decryptionmodule
encryptedCW
Descrambler
CA system
Recalculated original data
”Smart card” reader
Control module
Control_signal
Figure 4-17 CA at the end-user’s site
Encryption / decryption Encryption /decryption denotes the system that manipulates the original signal in a way that only the end-user having the decryption key is able to decrypt the signal. The technology is also called scrambling / descrambling56 of the signals. As depicted in the figure (Figure 4-16), at the supply site, a mathematical operation57 is performed between the original signal (Data 1, Data 2,…, Data n) and the output of a Pseudo Random Binary Sequence (PRBS) generator (P1, P2,..Pn). At the end users site, the same PRBS is generated and by performing the inverse of the mathematical operation on the received data (Data 1’, Data 2’, …, Data n’) the original signal is recreated. The PRBS generator is initialised by a Code Word (CW)58, which is generated by a Code Word Generator. The CW is then transmitted in encrypted form in, e.g., the System Information (SI) alongside with signal to the decoder. The decoder decrypts the CW and uses it to initialise the PRBS generator in the decoder to generate exactly the same sequence as in the encoder. While the scrambling algorithm is standardised as Common Scrambling Algorithm (CSA) in the DVB project, the CW generation is not standardised to avoid a piracy problem. The algorithm for the CW generation and its life cycle is an important part of the proprietary CA systems in the market. The proprietary CA systems result in quite complicated access issues and can be seen as a barrier for making the competition market work. These aspects are analysed in the next chapter.
56 The concept, scrambling / descrambling, denotes also the technology used for energy dispersal of signals. Energy-dispersal-scrambling/descrambling is used in MPEG-2 TS by deploying two PRBS (Pseudo Random Binary Sequence) generators at transmit and receive ends. See for example (Bruin and Smith 1999) page 175. 57 The commonly used mathematical operation is the logical XOR operation 58 In DVB project two different CWs are used; one scrambling at byte level and one scrambling bit wise. See, e.g., (Bruin and Smith 1999)

Chapter 4: Digital broadcasting, technology and service 103
CA management The CA management is a complex administrative and technical system dealing with the management of the network and subscribers. The CA management system consists of two parts; Subscriber Management System (SMS) and Subscriber Authorisation System (SAS). The SMS is the administrative system dealing with the consumer bases and storing data on the consumers, the services they subscribe, and facilitating financial transactions. The SAS is a technical system that implements processing of the data from SMS into commands that can be used by the receiver equipments. These commands are transmitted alongside with the data to the decoders and facilitate decryption of the signals the users are authorised to use.
4.2.3.2 Application Programming Interface (API) Application Programming Interface (API) for TV performs the same function as the operating system does for the PC. An API is used in a terminal device to implement certain functionalities that allow hardware-independent development of content and applications. According to DVB-TAM59 (Technical issues Associated with MHP), API is defined as a set of high-level functions, data structures and protocols, which represent a standard interface for platform-independent application software. Some of the APIs on the market use object-oriented languages that enhance the flexibility and re-usability of the platform functionalities60. API gives the possibility of accessing data services. API makes it possible to navigate, to use Electronic Program Guides, to access Internet and to use several other value added and interactive services. The problem regarding API is that the system was not standardized in the beginning and competing technologies are available on the market. This has created barriers for the end-users when they want to change service providers and consequently have complicated access issues. This issue is elaborated in more details in the next chapters.
4.2.3.3 Digital Set-Top-Box In the following, a short description of the digital set-top-box is given with reference to the architecture used in the Nordig (see later) standard. Digital set-top-box contains all the technologies that have been described in this chapter. The digital Set Top Box or Integrated Receiver Decoder (IRD) (see Figure 4-18) converts the digital distributed signal to analogue and feeds the regular TV-receivers. The Set Top Box can be seen as an intermediate technological solution to promote penetration of digital TV using the existing analogue TV-receivers. In a next stage the Set Top Box and analogue TV will be replaced by integrated digital TV.
59 Evain J. P.” The Multimedia Home Platform- an overview”, EBU Technical Department, 2000 60 Ibid

Chapter 4: Digital broadcasting, technology and service 104
None-demodulated signal (RF/IF- input)
Demodulated signal (TS- input/output)
HARDWARE & SYSTEM SOFTWARE(Tuner, demodulator, embedded CA,
demultiplexer, MPEG-2 decoder, etc.)
Applications software
API
Common Interface
Smart card Interface
Interaction channel/modem
Remote control/ keyboard
Outputs (Video, audio, graphics)
I/Os
Figure 4-18 Digital Set-Top-Box61 As depicted in Figure 4-18, the IRD consists of the necessary hardware and software for, among others, signal tuning, demodulation, demultiplexing, decoding etc. The IRD contains further the API and CA module. One CA system will be embedded in the box but other CA modules can be inserted in the Common Interface slot (See later). The interfaces to the IRD are described shortly in the following:
• RF / IF input: This is the raw non-demodulated signal from cable, satellite or terrestrial network.
• TS-input / output: This is the demodulated Transport Stream (TS) interface. Using this interface the embedded tuner and demodulator will be bypassed.
• Common Interface: An open Conditional Access (CA) interface developed by the DVB group62.
• Smart Card readers: Used for, e.g., payment by credit card or the control of the embedded CA module.
• Interaction channel Interface: Through this interface the upstream communication in interactive services is implemented. Regular POTS modem can, e.g., be used.
• Remote control / keyboard: Gives access to remote control and key board devices.
• Outputs: the outputs - video, audio and graphics - will feed the presentation equipments, analogue TV, PC, etc.
• IO: This is a RS232 data interface for software, firmware down load etc. It is a problem that different modulation technologies for different transmission technologies result in dedicated Set Top Boxes for cable, satellite and terrestrial distribution. From a consumer point of view it is preferable to have a Set Top Box that can operate in all distribution forms. The NorDig solution (see above) has partly solved the problem by requiring a Transport Stream (TS) interface to which an external tuner and demodulator can be connected.
61 The figure depicts the architecture chosen by NorDig [NorDig 1998] 62 In the Access issues chapter a Common Interface is described in more details

Chapter 4: Digital broadcasting, technology and service 105
4.2.4 Delivery networks Different delivery networks, used in analogue broadcasting, can also be used for digital TV broadcasting. Furthermore, other networks like Microwave Video Distribution System (MVDS) have been used for transmission of digital TV in some countries. Recently it has become technologically possible to use the telephone network to distribute digital TV-signals using, e.g., xDSL technologies. Different infrastructures have, however, specific characteristics described in the following.
4.2.4.1 Terrestrial Transmission of TV and radio signals using ground-based transmitters in a terrestrial network is traditionally the most used and known distribution form. Using, for example, Plain Old Telephony Services (POTS) as return path it is possible to offer interactive services. The modest capacity for digital TV in most European countries will be a barrier for the development of these services but when more capacity for digital TV is released there will be better conditions for development of such services. The advantages of using terrestrial distribution for digital TV are among others:
• The signal can be received using simple roof or in-house antenna. The end consumer is not forced to invest in cable connections or satellite dishes. This provides simple access opportunity for the whole population;
• There is possibility for simple portable and mobile reception; and
• Regionalisation of the signals can be made in a cost efficient manner. This means that targeting the signal towards limited areas (regional and local TV) can be done in a cost efficient form.
One of the disadvantages comparing e.g. satellite and cable distribution is:
• The limited capacity immediately available for digital TV. This is a problem because the number of digital services is a parameter that influences interest in investing in digital equipment.
4.2.4.2 Satellite (DTH) As for terrestrial distribution it is possible to use e.g. POTS as return path to offer interactive services. The large capacity for satellite digital TV will provide better conditions for development of such services. The advantages of using satellite distribution for digital TV are:
• TV programs can be transmitted with high technical quality and can be received far away from a country’s borderlines.
• The high capacity provides the opportunity to broadcast more TV and other digital services.
The disadvantages, when for example comparing with terrestrial distribution, are among others:
• The necessity to invest in satellite dishes. It can be both an economical burden and a practical problem to find a place to install the satellite dish.
• It is not appropriate for portable and mobile reception.
• Copyright problems connected to wide-area reception can force the providers to

Chapter 4: Digital broadcasting, technology and service 106
encrypt their programs.
4.2.4.3 Cable As with analogue TV, it is possible to distribute digital TV in the cable TV-network. Cable TV is very well developed in many developed countries and the penetration is associated with the geographical characteristics of the country and the concentration of population. Cable network providers compose their services by gathering TV-services from satellite and terrestrial distribution. Some TV services are only distributed in the cable network. The advantages of using cable distribution for digital TV are among others:
• The high capacity in the cable network.
• Cable network is an optimal platform for data / interactive service provision. In contrast to satellite and terrestrial distribution the return path is integrated in the network.
The disadvantages, when for example comparing with terrestrial distribution, are among others:
• It is hard to assume that the penetration will be 100%. There will still be people without access to cable networks.
• Only stationary reception is possible.
4.2.4.4 MVDS Microwave Video Distribution System (MVDS) is a broadband radio system for distribution of TV-programs. MVDS, also called wireless cable, will typically be used in areas where it is not economically feasible to install cable network – in Europe it is especially used in Ireland and Switzerland. The characteristics of MVDS is almost similar to cable networks
4.2.4.5 xDSL Using xDSL (ADSL, VDSL, etc.) technologies based on POTS copper wires for distribution of TV signals are very new and promising. Using ADSL technology it is possible, for example, to transmit (downstream) between 2 and 6 Mbit/s data over regular telephone lines. This corresponds to digital TV of LDTV to SDTV quality. POTS network is the most well developed network in the industrialised countries (for example with almost 100% coverage in Northern Europe). Therefore it provides a good possibility for offering TV services to parts of the population that are spread over large geographical areas. The disadvantage of using POTS network is its structure. The POTS network is not dimensioned for distributive services and it is not obvious that provision of digital TV in broadcast form will create a good business opportunity. However, the technology for, e.g., high speed ADSL is in its initial phase and the future will show, to what degree the network is used for broadcasting and to what degree specialised services like Video On Demand will dominate the network.

Chapter 4: Digital broadcasting, technology and service 107
4.2.5 Service provision and multiplexing As depicted in Figure 4-10, a new function, service provision, is added to the value chain of digital broadcasting compared to analogue broadcasting. Service provision exists also in the value chain of analogue satellite and cable broadcasting. As seen in the figure, service provision can consist of different functions: multiplexing of different inputs, Conditional Access, and generating the Electronic Programme Guide (see later). Of course, CA can also be performed, elsewhere, (e.g., by the content providers), and EPG can be provided as a data service by a content provider. But the illustrated model is commonly used in different markets. In terrestrial broadcasting, service provision is a totally new function as in the analogue era there is a unique connection between the frequency assigned to a broadcaster and the content provided. In digital broadcasting, there must be a technical and administrative function called multiplex operator function that facilitates both the pure technical job of multiplexing the signal but also, if necessary, handles the access issues of subscriber management etc. The way this function is organised and regulated has vital impacts on the market development (see the chapter on resource issues).
4.3 Service development in digital broadcasting Service development in digital broadcasting proceeds in different directions. Three main directions can be identified:
• Provision of the same service as analogue broadcasting. Here the increased capacity available in digital broadcasting will be used to provide the same type of service as traditional broadcasting, but more of it.
• Provision of advanced broadcasting services. Here the new possibilities in digital broadcasting are used to add value and change the character of broadcasting services.
• Provision of new data services. The data services can be both program related and ‘stand alone’ data services.
In the following, these three developments are analysed. But before we discuss the directions of development, the interactive component of digital broadcasting that is a vital aspect in the service development is described.
4.3.1 Interactivity The main difference between the traditional telecommunication networks and the TV-networks is that the first is two-way and the second is one-way. To be able to provide interactive service in digital broadcasting network a return path must be used. The lack of a ‘built-in’ return channel is a weakness in the development of interactive services, within broadcasting. In the cable network it is possible to implement the return channel inside the network63. Regarding satellite and terrestrial networks the solution to this problem has been to use, for example, telecom network (POTS/ISDN) as the return channel. It is technically possible also to build the return channel into terrestrial and satellite networks. There is, however, no 63 DVB has developed a standard called ‘prETS300 800’. “DVB interaction channel for cable TV distribution system (CATV)”, TM 1640 Rev.5, prETS 300 800, 30. September, 1996. Furthermore, DVB has developed standards for using POTS and ISDN as return path.

Chapter 4: Digital broadcasting, technology and service 108
standard solution available64 for this and the complexity and the cost of implementing the return path in the terrestrial and satellite networks will, at least in the current technological development, make such integration unfeasible. Another problem is the capacity available per user, as the broadcasting networks are designed for transmission of the same content to many users. Among different distribution platforms, cable networks are technologically best positioned to integrate the return path inside the network and to optimize the networks to keep the capacity per user on a reasonable level. The emerging interactive services are adapted to the environment in which the services are offered. Interactive broadcasting services - especially on the terrestrial and satellite platforms - will have other characteristics than regular Interactive services known from, e.g., Internet. Here we can distinguish between two different types of interactive services, real and pseudo interactive services.
4.3.1.1 Real interactivity Real interactive services are services that use the return path in the network or a return path that is implemented using other networks. Using real interactive services, the user communicates with the service provider and the influence on the service he or she consumes. Here a point-to-point communication is created between the user and the service provider. When a return path is created, an extra forward path can also be implemented in the network. We distinguish between two types of interactive networks: Out-Of-Band (OOB) and In Band (IB) networks65 (see Figure 4-19). In both of them a return path is created for the up-stream communication but regarding the down stream communication:
• In OOB the down stream signalling communication between the service provider and the end-user goes through an extra forward path that is created in the network. The MPEG-2 TS only transports the content.
• IN IB, on the other hand, no extra forward path is created and the down-stream communication is integrated in the MPEG-2 TS.
64 DVB is working on a standard for return path in terrestrial networks 65 The prETS 300 800 has standards for both OOB and IB formats.

Chapter 4: Digital broadcasting, technology and service 109
MPEG-2 TS
MPEG-2 TS
Extra forward path
Return path
Return path
Down stream control information
Supply site
End-user site
In Band network
Out Of Band network Figure 4-19 IB and OOB networks
Recently some providers of interactive services on the market have implemented solutions, where the OOB forward channel, in addition to control and signaling data, also carries advanced data services, like the Internet. That is, the solution only uses, e.g., POTS network to provide Internet services that are displayed on the TV monitor, and the user can navigate by a remote control. This type of service does not use the broadcasting networks at all. They only use TV as a display medium instead of a PC monitor and will not be categorized as advanced broadcasting services.
4.3.1.2 Pseudo (local) interactivity Some of the interactive services used in the broadcasting networks do not use the return path. These can be called ‘local’ or ‘pseudo’ interactive services. Here, without having a return path it is possible to give the end-user the possibility to interact with the application and select between different choices. A simple example is selecting between different programs and text TV services by remote control. All services are transmitted to the end user and the remote control facilitates the choice between them. Below examples on interactive services offered on the broadcasting networks without using a return path at all are given:
• Transmission of data in a repetitive form. For example, the Financial Times can be broadcasted in intervals to the set-top-boxes. Attached to the data the selection icon can be downloaded to the boxes and the user can choose to access the data by clicking on the icon. However, this example is identical to tele-text in the analogue world.
• Transmission of film or other entertainment programs in regular intervals on different channels. This service is known as Near Video On Demand (NVOD) and offers the user a possibility for ‘pseudo interactivity’.
• Transmission of, e.g., a Java applet to the boxes that communicates with the user. A simple example is to send an applet that, based on some input parameters, tell people their optimal weight. The applet can communicate with the user, ask lots of questions, gather the necessary data from the user and calculate the optimum weight

Chapter 4: Digital broadcasting, technology and service 110
without any need for return channel.
4.3.2 Provision of traditional broadcastings services The service development that until now has dominated the digital broadcasting market is simply to send the same type of services known from the analogue world, but more of them. These are, e.g., movies, documentaries, and entertainment programs that are consumed passively (without interactions with the application or service provider). The development has however been in differentiating the provided content and the emergence of new TV channels. This development is in continuation of the development of analogue satellite / cable broadcasting that rendered emergence of new TV channels, e.g., channels providing all sport, all news, all art, etc. possible.
4.3.3 Advanced broadcastings services The advanced broadcastings services denote value added services that basically are the same services as offered in analogue broadcasting but more value is added to them using facilities and possibilities in digital broadcasting. Using different characteristics of digital broadcasting, different advanced services can be produced. In the following some of the possibilities for this development are outlined:
• Allocating different bit rates for digital TV results in different technical quality of the received TV signal. This parameter can be used in development of new programs. Some of the programs like sport events will be more valuable at the end-users’ site if they are transmitted in high resolution like in HDTV quality.
• The above mentioned Near Video On Demand (NVOD) can be used to give the end user the flexibility of deciding when he/she will see a program, as the same program is repeated frequently.
• Regarding sport events, for example, different camera angles can be transmitted such that the end-user can decide the camera angle he/she will watch. In this way the user will be involved in the production, if he/she does not want to watch the producers’ choice.
• Interactive TV programs in different categories, like entertainment, education, etc. can be produced.
4.3.4 Data services Data services offered in digital TV networks can be divided in two different categories; basic data services and advanced data services. The basic data services are mainly control and data signals that are needed for the decoder to demultiplex and decode the services, while advanced data services are real services provided to the end consumers. These are described in the following.
4.3.4.1 Basic data services Programme Specific information (PSI) defined in the MPEG-2 standard, MPEG-2 PSI, contains minimum information needed to enable automatic configuration of set-top-boxes to demultiplex and decode the different content available in the MPEG-2 TS.

Chapter 4: Digital broadcasting, technology and service 111
MPEG-2 allows, however, a separate Service Information (SI) system to complement the PSI. DVB has incorporated a service information system called DVB-SI (ETS 300 468), described in the following.
Service Information (SI) SI contains additional information to PSI, which can be used to navigate through the array of services offered in the MPEG-2 TS. The information in the SI can be used by the API to create a simple EPG, called basic navigator, that gives the end user the possibility to navigate between different programs. Different APIs must be able to handle DVB-SI making basic navigator independent of the API. As mentioned before, key data necessary for the DVB set-top-box to automatically configure itself is provided in the MPEG-2 PSI. DVB-SI adds informations that enable the set-top-boxes to automatically tune to specific services and allow the services to be grouped in different categories. Other informations available in DVB-SI are program start time, name of service provider and classification of events (news, entertainment, documentary, etc.). Following table (Table 4-6) outlines different tables contained in the MPEG-2 PSI and DVB-SI.
MPEG-2 PSI DVB SI (Mandatory) DVB SI (Optional)
Network information PAT NIT NIT (other delivery systems)
Bouquet information CAT - BAT
Service description PMT SDT SDT (other TS)
Event information - EIT EIT (other TS)
Running status - TDT RST
Stuffing - - ST
Time Offset - - TOT
Table 4-6 Service Information66 The content of the table is described shortly in the following:
• Programme Association Table (PAT): Indicates the packet ID values of TS packets for each service in the multiplex.
• Programme Map Table (PMT): The PMT indicates among others the location of different streams that make up each service.
• CA Table (CAT) :Contains information on the CA management system.
• Network Information Table (NIT): Groups together the services belonging to a particular network provider.
• Service Description Table (SDT): Lists the names and other parameters associated with each service in a particular MPEG multiplexer.
• Event Information Table (EIT): Contains data related to events or programs such as duration, the start time, or the event name.
• Time Data Table (TDT): Gives information about present time and date.
66 Source: Bruin Smits 1998, Op.Cit.

Chapter 4: Digital broadcasting, technology and service 112
• Bouquet Association Table (BAT): The term bouquet is used to describe a collection of services marketed as one entity. BAT provides the services in a bouquet and the bouquet’s name.
• Running Status Table (RST): Contains data on running or not running status of an event
• Stuffing Sable (St): The ST can be used to replace or invalidate either a subtable or a complete SI table
• Time Offset Table (TOT): gives among others information about local time offset.
4.3.4.2 Advanced data services The interactive component can be used to offer different data services in digital broadcasting networks. Exactly which data services will be popular and profitable is an empirical question that will be answered in the future. Later in this thesis (In the chapter on new services and convergence), some of the data services that have been offered on the market until now are outlined. In the following, different types of data services are described.
Program related data The possibility for transmission of data can be used to transmit additional information about the programs. Program related data can be background information about a specific program, e.g., information about actors, products, background research materials etc.
Electronic Program Guide (EPG) As mentioned above a simple navigator, that is independent of API, can be used to list the programs that are available. To give a better interface to the end-user for selecting between different services a more advanced EPG is necessary. EPG is a pseudo interactive system that will help the end user in choosing the services he/she wants to consume. EPG is the users gateway to access digital TV services, and therefore at different levels special attention has been paid to EPG67. The service information that is used by the basic navigator contains different tables and facts about the programs. The SI information does not say anything about how, when or where on the display the informations about the programme must be displayed. The EPG on the other hand, is a standalone API dependent service that maintains the users interface to the digital TV world. Both dependence on API and the way the service presents different programmes can create barriers in access to specific services. The access implications of EPG are analysed in the next chapter.
Other data services As mentioned above, the types of services that will be feasible in the broadcasting networks will be determined on the market. The important issue is that the above mentioned capacity-per-user problems and the problems of return path in broadcasting network will influence the development of data services that will be available in the broadcasting networks. In the following a few possible data services are listed: 67 See among others: EBU: “Difficult to be easy - the Electronic Programme Guide”, BPN 015, January 1998. And ITC: “Code of conduct on Electronic Programme Guide”, June 1997.

Chapter 4: Digital broadcasting, technology and service 113
• Enhanced text TV. By using graphical tools, hypertext, etc. the text TV in digital version can be more advanced and usable.
• Download of software. The broadcasting networks is mostly used in the day and evening hours. The transmission capacity in the nighttime can be used to download, e.g., new versions of software to the set-top-boxes68.
• Download of newspapers. In the same way newspapers can be downloaded to the set-top-boxes.
• E-commerce. The products can be ordered by remote control, e.g., during advertisement.
• Internet on TV. Access to the Internet as it is known in the communication networks will not be possible because of capacity-per-user problems of digital TV networks. Here the solution can be to broadcast a limited version of Internet, e.g., sites that are seen relevant from a political / societal perspective.
More examples are given in the empirical chapter on new services and convergence.
4.4 Convergence In the previous subchapters, different aspects of digital broadcasting have been described in the framework of what traditionally is known as the broadcasting sector. The possibility for going beyond the broadcasting sector and creating new data services in the broadcasting platforms has also been analysed. Crossing sectoral boundaries, however, goes far beyond the pure content provision and can involve different parts of value chain, described in the following. The traditional broadcasting and telecommunication industries have co-evolved with the developing Internet, but the technological development is making this current sectoral distinction un-maintainable. Content and service provision have already been taking place across the traditional sectoral boundaries for some time. Different services can be carried on different infrastructures and the end users’ access equipment will be designed to communicate with different services. This process of fusion of content, service, infrastructure and end user equipment is denoted as convergence69. This convergence process is illustrated in Figure 4-20.
ContentProvision
ServiceProvision
InfrastructureProvision
End userProvision End User
Convergence
Broadcasting
Telecommunication
Information Technology
Figure 4-20 Convergence in value chain
68 This will need a new generation of set-top-boxes with hard disk 69 See among others: Baldwin, T.F., McVoy, D.S. and Steinfield C.: “Convergence. Integrating Media, Information & Communication. Thousand Oaks: Sage Publications, Inc., 1996.OR Winseck, D.:” Reconvergence. A Political Economy of Telecommunications in Canada. Cresskill, N.J.: Hampton Press, Inc, 1998.

Chapter 4: Digital broadcasting, technology and service 114
According to the European Commissions Green Paper on convergence70, convergence can be expressed as:
• ”The ability of different network platforms to carry essentially similar kinds of services; and
• the coming together of consumer devices such as the telephone, television and personal computer”.
In the green paper it is furthermore stated “Convergence is not just about technology. It is about services and about new ways of doing business and of interacting with society“. This approach is interesting regarding the objective of this project to identify broader implication of the technological parameters on market development. Media or communication convergence is no longer a theoretical possibility but rather the realistic trend of the actual development within telecommunications, broadcasting and information technology. For content provision, for example, broadcasters no longer have a monopoly for offering entertainment, news or documentaries by means of electronic networks. But because of the scarcity of resources in terrestrial networks and because of the regulatory framework, access to the recourses has in reality not been opened or generally only opened under strict conditions. Emerging new infrastructures with more capacity have removed the technical-based limitations. As shown above, digitalisation of broadcasting will further increase the available capacity and different providers may be established offering focused or broader content through different delivery platforms. Using the Internet for provision of traditional broadcasting services is another aspect of the convergence process.
4.5 Conclusion In this chapter, the technology of broadcasting is described at a level that is necessary to analyse the impacts of technological developments on the market development. The technological development within analogue broadcasting was mainly focused on emergence of new infrastructures and better utilisation of available resources. Using satellites to transmit content over large geographical areas in a cost efficient manner had two main influences on the development: It became possible to fill the available capacity in the cable networks using program sources from distant providers, and it became possible to connect the cable networks in large geographical areas together and create a critical mass to provide programming that were only available in the cable networks. Later the emergence of high power direct satellite broadcasting it became possible for satellite broadcast providers to target the services directly to the end-consumers. The combination of satellite and cable broadcasting reduced the scarcity of transmission resources in terrestrial networks substantially. Another aspect was better utilisation of available resources and transmission of data in the Vertical Blanking Interval (VBI). In Europe it resulted in a successful Text-TV service without using additional resources but utilising the assigned resources more efficiently. The VBI capacity was also used to transmit data signals that was used to enhance the resolution of the picture and also its aspect ratio. Development towards improving the picture quality and the aspect ratio was not limited to using the enhancement signals in the framework of available standards. From the beginning of the 1980’s, development of new TV standards was the goal of the broadcasting industry in different markets. New standards needed more frequency bandwidth and therefore the
70 European Commission: “Green paper on the convergence of the Telecommunications, Media and Information Technology Sectors, and its Implications for Regulation. Towards an Information Society Approach. Brussels: European Commission, DG XIII A4 and DB X C1. (COM(97)623), 1997

Chapter 4: Digital broadcasting, technology and service 115
development was focused on the satellite networks. Here different standards emerged, in Europe the MAC family of standards and in Japan the MUSE standard that was able to transmit HDTV signals. The MAC standards and the MUSE were marketed in Europe and Japan. A limited MUSE that was adapted to the American 6 MHz bandwidth TV channel was almost approved in the US market. But the culmination of high quality analogue standards, coincided with the standard of digital broadcasting technologies and they proved to be better than analogue standards, both regarding the flexibility, the resolution and the efficiency of utilisation of transmission standards. The efficient utilisation of transmission resources is a vital parameter in the development of the broadcasting market. As seen in previous chapters, the resource scarcity has been a main parameter for the chosen organisation of the service in the market. However the way the resources are used in digital broadcasting can have different outcomes. If the terrestrial resources, e.g., are used for transmission of HDTV signals, as it is chosen for the US market, there will not be substantial changes in the market structure for terrestrial broadcasting. The same actors will continue, but with a service that has a higher technical quality. But if the resources are used for transmission of SDTV, like in Europe, entrance of new actors is faciliated, and the market will be different and look more like the multi-channel delivery markets. This will however have new implications on the market. A multiplex function is needed to facilitate sharing of transmission capacity. The way the multiplex operator is organised will have impacts on the market. There are also other parameters like using Single Frequency Networks and Statistical multiplexing that influence the number of services available in a market. The access will be complicated in digital broadcasting. This is partly due to the Conditional Access (CA) systems that maintain subscription to the signals, the API technology that enables development of innovative interactive services, and services like EPG that is the gatekeeper in the digital broadcasting market. CA systems are not standardised and different proprietary systems exist on the market. This will make it difficult for the end users to change service provider or collect services from different service providers. At European level, through, for example, standardisation of common Interface, some efforts are done to limit this access complexity. Also regarding API, different technologies exist on the market that makes it difficult to use interactive services cross service providers. The EPG service is meant to assist the users in finding the services they want to consume. The way different services are presented in the EPG can discriminate some services. One of the important tasks of Conditional Access systems is to enable establishment of pay systems such that the service can be directed towards specific users. This will result in creation of new types of business models with implications on the market. The possibility for provision of data services, including interactive services, creates immense possibilities for development of new services in broadcasting market. The new services cover a range from simple services like Text TV to more advanced services like e-commerce, where both ordering and payment transactions are done using the broadcasting network. The success of the new services will have vital implication on the market and will also have regulatory implications as data services are typically conform to regulation in other sectors. These developments will go beyond traditional broadcasting and impact the formation of the communication landscape in the ongoing convergence process. Technically the broadcasting platforms will be able to carry other services than traditional broadcasting services, and traditional broadcasting services can be delivered through other platforms like the Internet. A major technical parameter in this development is, however, the available transmission capacity at the end users’ site. In the following chapters based on empirical data, it is analysed to what degree the
Chapter 4: Digital broadcasting, technology and service 116
technological parameters have influence on the development of the market.

117
5. Leaving the traditional broadcasting model In the three previous chapters, the economic, political, and technological parameters that have influenced the development of the broadcasting market are identified. In this chapter, the parameters in the previous chapters and the interplay between them are analysed to identify the influence on the development of the broadcasting market. A development that can be characterised as a clear tendency to leave traditional broadcasting models and approach a general competitive and market oriented model. The analysis in the following is further based on the other methodological approach of the project, namely the comparative analysis of the development of broadcasting with regard to the European and the US markets. As mentioned earlier, Europe and the US are selected due to the totally different starting points for organisation of these two markets. There were different political, market, and organisational regimes, including different financing models. These different starting points make the comparative method of analysis a powerful tool in identifying the weights of different parameters influencing the development of the broadcasting market. Another fundamental question of the project is, however, to identify the driving forces and barriers in the further development of the market, and to give an analysis of the direction of the future development of the broadcasting market. The overall problem is described shortly at the end of this chapter, where an introduction to following empirical chapters that analyse the problem is given. Based on the empirical data, the recent developments in the market are analysed with focus on the digital broadcast market. After these empirical chapters and based on a combination of theoretical and empirical analysis a more conclusive analysis of the driving forces and barriers of the current and future broadcasting market is given. In the following, first the traditional models of organisation of broadcasting are analysed. Then the parameters influencing development towards the modern and more market-oriented model are analysed1. Finally the overall tendencies in the current and future markets are given followed by a short introduction to the empirical chapters.
5.1 Traditional broadcasting model Two major aspects have been related to regulation and organisation of broadcasting in both Europe and the US, one is the necessity of regulation, the other the way regulation is performed:
• The specific characteristics of the technology of broadcasting have been the major reason for posing regulations on provision of broadcasting services.
• A combination of the content related political considerations and economic specificities of the service determined the actual formation of regulation and organisation of broadcasting.
In the beginning of broadcasting history it was totally unregulated. As seen, the situation got chaotic and it was almost impossible to establish a service provision in the market, due to the technical problem of interference. It was not possible to solve the problem of interference at a technological level; therefore both in Europe and in the US, regulatory interventions were introduced and the frequency resources were assigned to different service providers so interference was avoided. The method of establishing national regulation agencies to assign
1 Traditional model corresponds to what Noam calls ‘state-broadcasting’, ‘Independent public’, and ‘privileged private’, and modern broadcasting model corresponds to open broadcasting (see Table 2-1).

Chapter 5: Leaving the traditional broadcasting model 118
the resources, provide license to some users, and recall them or intervene politically if some assumption were not met was, however, a political choice. Another solution could be to consider frequency resources as another production factor that could be traded in the market. The interference problem could then be solved by the private property protection regime. So while interference was a technical parameter, the chosen methods of regulation were not the only solutions. In the models used for assignment of resources and organisation of the service provision, other parameters were decisive. Content provision was considered to have political importance, as it had major impacts on society; consequently, governments considered it as necessary to control the medium by establishing assignment processes for the frequency resources and imposing different types of obligations on the content providers. Also here the technology that was deployed in production and consumption of the service had vital relevance. Broadcasting services were based on audio and later audio/video that was consumable by everybody; children as well as adults, and illiterate as well as literate. Furthermore, the distribution technology made it possible to give the major part of the population easy access to the service. The coverage and the ease of use, in combination with content that could consist of information, news, debate, education, etc. were among the reasons for the political importance of the services. Assignment and organisation of resources were, however, different in European countries, with the UK as frontrunner, and the US. Based on cultural and language related considerations, the available transmission resources in European countries were assigned to countrywide public service broadcasters with social responsibilities. In the US, on the other hand, the resources were allocated to local private broadcasters that conformed to less severe ‘public interest’ regulations. Also economic parameters, as described in the following, influenced the way broadcasting services were organised. It is however important to emphasise that also the specific economic characteristics of broadcasting mainly have their roots in the broadcasting technology and its level of development. In the beginning, the broadcasting services had some of the basic characteristics of pure public goods. The non-exclusive characteristic was due to the level of technological development; it was not possible at a technological level to target service towards individual consumers and exclude others. The non-rival consumption characteristic was basically due to the characteristics of service as information services, and also due to using airwaves in the distribution technology, where in the coverage area of one transmitter, marginal costs of reaching one more consumer is zero. The public good characteristic of the service resulted in other market organisations than the competitive market to regulate production and consumption of the services. Different business models have been used to provide the service through the history of broadcasting. The public good characteristic of the service does not in itself imply public production of it. In the US, e.g. the broadcasting services have, mainly, been provided by private commercial actors. Choosing the public service organisation of broadcasting in the European countries has mainly been due to political and language related considerations. The public good characteristic of broadcasting services resulted in two financing models; licence fee on receiver equipments in Europe and indirect advertising financing in the US. The decision on financing was a political decision. Using advertising was resisted by the writing press and license fee seemed to fit public service broadcasting better, with the content production based on public service obligations and independency of the advertising market. For a period of time in the beginning of broadcasting, however, financing based on revenues from selling radio receivers was used. This required a vertically integrated industry that was not acceptable, neither in Europe nor in the US. In a technical sense, access to the service was obviously free when the transmission was

Chapter 5: Leaving the traditional broadcasting model 119
established. It was simply not possible at a technical level to impend individual users’ access to the available services2. The service was also defined as a free-to-air service that should be available for the general public, a concept that survived also when it became technically possible to target the service to some individuals and exclude others. To sum up: based on a combination of technical, political and economic parameters in different ratios, two different organisation forms for broadcasting were used in Europe and the US; countrywide public service broadcasting in a monopoly structure in the European countries, and local commercial broadcasters in a oligopoly market structure in the US. The technical parameters have been the major driver for posing regulations on broadcasting, and a combination of content related political parameters and economic parameters have been decisive for the chosen organisation. The development of these broadcasting models, that are denoted the traditional broadcasting models in this thesis, are analysed in the following.
5.2 Development of traditional broadcasting models The development of traditional broadcasting in the European countries was tightly controlled and driven by the national governments, based on political considerations. As seen earlier, the development can be characterised mainly by going from state monopoly to a broadcasting regime, where the broadcasters had a more independent status related to the governmental institution, and by going from a monopoly market structure to duopoly and oligopoly market structures in some markets. Some of the new actors in the market were other public service and some of them were pure commercial broadcasters. The major aspect of the development that is used in the following is that the markets remained in the monopoly structure in some countries and evolved to an oligopoly market structure with few broadcasters in other countries, and that the development was mainly driven by political parameters. In the US because of the existence of a national advertising market, countrywide networks were created. As the ownership regulations limited the number of local stations a person or entity could own, national networks emerged by a combination of ownership to local stations and affiliation with others. The number of these national networks remained limited for a long time; two in the first couple of decades of radio and three when TV was invented. The domination of the two and later three national networks in an oligopolistic market structure is exactly the same as in many European countries. The starting points in Europe and the US were different, with the political control driving the development of broadcasting in European countries, but the two markets ended up in almost the same market structure, where few broadcasters had the dominant market position. The main reason for the limited number of national networks in the US was the technology of broadcasting. The national coverage and the transmission of programmes to different local broadcasting stations were established in the distribution network using expensive telecommunication lines or dedicated coax cables and complicated conversion equipments. The cost of establishing national coverage was very high and the balance between national advertising revenues and the cost of establishing and maintaining national coverage plus the cost of program production determined the number of networks that could exist on the market at the same time. The technological parameters were important at the starting point but they were also important in development of the market. Even if the political factors had not been so decisive 2 This discussion is about limiting access for individual users. It was possible at a technical level to impend access to signals from other countries by creating interference and transmitting noise signals in the frequency bands they used. This is however not relevant in this project.

Chapter 5: Leaving the traditional broadcasting model 120
in European countries as they were, the technological characteristics and the market for broadcasting would limit the number of actors in the market. The political factors had vital influence on the societal role of broadcasting and the provided content has been totally different in the two markets, but the organisation of the market has been mainly determined by the technical parameters. The technology of broadcasting was subject to changes and it was these changes that mainly induced the radical transformation of the broadcasting paradigm, from traditional broadcasting models to more market oriented type of organisation of broadcasting, as described in the following.
5.3 The modern market-oriented broadcasting model The traditional broadcasting models used mainly terrestrial networks as delivery network to the end consumer. MATV and later cable TV also were deployed to some degree in this period but their impacts on the market was limited due to regulation both in the European countries and in the US. The regulators in both markets, under pressure from the incumbents, regulated this infrastructure in a way that it could only be used to retransmit the existing terrestrial signals. Technologically, it was however also complicated to bring signals from distant sources or to establish large cable networks that could give the critical mass of consumers to start cable-only programming. Also here the balance between the gained market and cost of extension of cable networks would limit the development of this infrastructure to some degree even in the absence of the political parameter. There was however a major difference between cable and terrestrial platform; in cable networks it was technologically possible to exclude users. That is, it was possible to establish other business models and for example sell the services directly to the consumers. It was only possible to offer services in packages or what later is called bouquets, but this could be deployed to address another market segment than through advertising and new incentives could drive the market. Another technical development with a radical impact on the market development and paradigm shift in broadcasting was the emergence of satellites and their use in broadcasting. Satellite providers established cost efficient distribution systems. Consequently, countrywide terrestrial networks could be established in a cost efficient way and the SMATV systems and cable networks could be connected together and cover large geographical areas and increase their consumer bases substantially. In relation to the new infrastructures, another technical development was the possibility for signal encryption / decryption that enabled the satellite service providers to sell cable-TV-like program bouquets, but it was also possible to sell the services singly in the satellite and cable networks, as the services could be encrypted singly. These technical developments resulted in new market possibilities and started a political liberalisation process. The implications of these developments were mainly:
• It became easier to establish countrywide terrestrial networks; consequently new networks emerged, e.g., in the US
• It became easier to establish large cable networks, consequently a number of broadcasters started programming that were only available in the cable and satellite networks.
• It became possible to import signals from distant areas and fill the resources available in the cable networks.
• Satellite providers also began targeting their services directly towards end consumers

Chapter 5: Leaving the traditional broadcasting model 121
in the Direct To Home market. The new broadcasting model that emerged afterwards can be characterised as.
• A transformation of broadcasting services from public to club/private goods.
• Expansion of transmission resources and the use of market oriented allocation mechanisms in the new infrastructures.
• Availability of different quality programs in the large markets, like the US, without posing specific content requirements / regulations.
What is important in this paradigm shift is that the new business models and the increased resources available in the modern broadcasting models can only be used to fulfil the demand sides’ wants and needs if there is a market for it. Here the small nations have the problem of the cost of providing narrow types of programming against the revenue possibilities available in the market. The necessity for non-market solutions and regulation will then continue to exist in these markets. Another important aspect is the cultural, political and language related parameters that will have impact on broadcasting market, in Europe compared to the US, which consequently will result in a continuation of giving high priority for public service broadcasting in Europe. Also in the US the political factors are important and influence the market under the main idea of protection of ‘localism’, that results in FCC’s protection of incumbent traditional broadcasters in their competition with newcomers in the satellite and cable networks. These indicate the importance of political parameters in the further development of broadcasting in Europe and the US. As seen in the following, digitalisation of broadcasting will enable further possibilities for market development and organisation, but also create new barriers and political challenges in the development.
5.4 Current and future digital market; the problems addressed in the empirical chapters Digitalisation of broadcasting increases the available resources, and using Conditional Access systems it will be possible to target the services in different granularities, i.e., program bouquets, single services, or part of a service to individual users in all infrastructures. Using Application Program Interface it will be possible to provide interactive services in digital TV platforms. These developments have far reaching implications on the market development and organisation of the markets, where new business models can be used and the services can be differentiated in different levels. This is in continuation of the development towards a more market oriented broadcasting model. However, the way digital broadcasting is standardised complicates access issues and implies new challenges regarding allocation of resources. In the following four chapters, the implications of digital broadcasting on market development are analysed using empirical data. As mentioned earlier, the aspects important to this project are the implications on resource, access, market organisation and funding and the convergence with other sectors. The empirical data cover recent market developments in Europe and the US. The data that is collected is limited to the three Nordic countries, Denmark, Sweden and Finland in Europe and the US, through the last five years, of which the quality data covers the last three years. The data in the Nordic countries is collected using basic statistics and interviews with

Chapter 5: Leaving the traditional broadcasting model 122
relevant actors, and the data in the US is based on basic statistics and secondary data. Furthermore, secondary data is used to cover the development in other countries in the EU, however, in fewer details and when necessary. The analysis of resource issues consists, among others, of the analysis of penetration of digital TV and development different infrastructures, new problems in resource allocations, the actual resource allocations, and calculations on the complementarity and competitiveness of the infrastructures. The analysis of the access issues consists of the deployed CA systems, the interoperability between CA systems, the interoperability between infrastructures, the deployed API systems, the interoperability between API systems, and possible regulatory parameters connected to access issues. The analysis of the market and funding issues consists of the deployed funding forms, the market for license fees, advertising, and pay-TV services, and the market concentration and vertical integration of the market. The analysis of the emergence of new services and convergence consist mainly identification of services provided on different platforms, including services provided across sectoral boundaries, the characteristics of digital TV platforms with regard to provision of data services, the characteristics of internet to provide TV services, and the regulatory implications of the convergence.

123
6. Resource issues This chapter contains a data analysis of the resource issues in digital broadcasting. The data consists mainly of: the level of penetration of different infrastructures, the level of development of digital broadcasting in different platforms, and the level of development of digital terrestrial TV network and the schedule for the further development. Furthermore, regarding terrestrial broadcasting the data consists of the political decisions, assignments of the resources, the chosen multiplex operator organisation, and the defined simulcasting period. The deployed data on the Nordic countries is presented in appendix I, II, and IV. Regarding other European countries and the US market, secondary data is used. One of the important parameters regarding resource issues is the level of development of satellite and cable delivery networks and the amount of resources available in the terrestrial networks. Especially, as the assignment of terrestrial resources broadcasting or other use is a political decision, it is important to analyse the level of development of different infrastructures to be able to conclude on the advantages and drawbacks of assignment of terrestrial resources for broadcasting. As seen in the following, however, the development of infrastructures is only one of parameters that impacts this political process. Regarding the satellite and cable networks, the increased capacity in digital broadcasting will be used to expand the number of available services and open up for new actors to use the resources. Satellite and cable networks are mainly operated by commercial actors, they use the increased capacity to expand their market by providing more differentiated services and also by opening their infrastructures for new service providers. There are, however, other implications, among others:
• Regulation of services. Both in continuation of content regulation of traditional broadcasting, and also as the consequence of the convergence process,
• regulations of market organisation, including ownership, and
• problems related to access issues, that are described in other chapters. Regarding terrestrial networks, organisation of resources is, however, more complicated and different from the analogue world. Terrestrial resources are valuable for different uses, and their scarcity that is relevant, however, to a lesser degree, also in the digital age, makes their optimal allocation even more vital. Here, organisation and assignment of resources, selection of technical quality of signals used for digital TV, i.e., selection of HDTV standard or multi-service-allocation, deploying other infrastructures for broadcasting both for implementing a return path but also for delivery of broadcasting services, and decisions on the timing of the termination of analogue broadcasting are among important parameters, described in the following.
6.1 Level of development of cable and satellite delivery networks In the following, data on the development of different delivery networks and services in Denmark, Sweden, Finland, and less detailed also other EU countries is given. The data used in the following are mainly from appendix I, appendix II, and appendix IV.

Chapter 6: Resource Issues 124
6.1.1 Satellite Table 6-1, Table 6-2, and Table 6-3 show the development of access to satellite networks in Denmark, Sweden and Finland. Using the household statistics in the three countries presented in appendix I the ratio of satellite households and subscribers to the total households in these countries is given. Satellite households and subscribers are differentiated, as part of satellite households only consume free-to-air TV services, which do not need any subscription. According to the satellite service providers in Denmark1, another reason for this difference is piracy problems. People do not subscribe but get access to encrypted services, using smart cards available on the piracy grey market2.
Denmark 1994 1995 1996 1997 1998 1999
Satellite households (millions) 0.240 0.270 0.390 0.430 0.470 0.530
Satellite households (% of TV households) 10,4% 11,8% 17,0% 18,4% 19,9% 22,5%
Satellite subscribers (millions) 0.239 0.245 0.252 0.274 0.300 0.345
Satellite subscribers (% of TV households) 10,4% 10,7% 11,0% 11,7% 12,7% 14,7%
of which digital (millions) 0.000 0.000 0.000 0.000 0.004 0.030
of which digital (% of TV households) 0.0% 0.0% 0.0% 0.0% 0,2% 1,3%
Table 6-1 Development of access to satellite networks in Denmark Sweden 1994 1995 1996 1997 1998 1999
Satellite households (millions) 0.390 0.450 0.510 0.610 0.700 0.750
Satellite households (% of TV households) 10.6% 12.1% 13.6% 16.1% 18.3% 18,8%
Satellite subscribers (millions) 0.280 0.390 0.400 0.430 0.500 0.560
Satellite subscribers (% of TV households) 7.6% 10.5% 10.7% 11.3% 13.1% 14,0%
Of which digital (millions) 0.000 0.000 0.000 0.000 0.006 0.052
Of which digital (% of TV households) 0.0% 0.0% 0.0% 0.0% 0.2% 1,3%
Table 6-2 Development of access to satellite networks in Sweden Finland 1994 1995 1996 1997 1998 1999
Satellite households (millions) 0.050 0.063 0.074 0.089 0.100 0.120
Satellite households (% of TV households) 2.3% 2.9% 3,3% 4.0% 4.4% 5.3%
Satellite subscribers (millions) 0.040 0.050 0.059 0.071 0.080 0.098
Satellite subscribers (% of TV households) 1.9% 2.3% 2.7% 3.2% 3,6% 4.3%
of which digital (millions) 0.000 0.000 0.000 0.000 0.003 0.010
of which digital (% of TV households) 0.0% 0.0% 0.0% 0.0% 0.1% 0.4%
1 Canal Digital and Viasat 2 See the: Center for Tele-Information: “Investigation of piracy decoder cards”, DTU, CTI, 1999

Chapter 6: Resource Issues 125
Table 6-3 Development of access to satellite networks in Finland As shown in the tables, the satellite Direct To Home (DTH) market has been growing in all three countries. Digital satellite broadcasting started in 1998 and, as shown in the tables in 1998 and 1999 only a small part of the households subscribed to digital services. Satellite service providers in the three countries are Canal Digital and Viasat. Canal Digital started digital broadcasting in fall 1998 and VIASAT started digital services in summer / fall 2000 (see appendix II for more information). The tables also show the ratio of households using and subscribing to satellite services are different in the three countries, with Finland being at a level of about 25% of Denmark and Sweden. There are two main reasons for this difference:
• Geography of the country. The reception of satellite transmission gets harder, the further north you go from the equator - the wider dish you need and the elevation angle becomes lower making it harder to reach the transmissions.
• Finnish satellite services. One of the main reasons for the success of satellite networks in Denmark and Sweden has been the existence of TV3/Denmark and TV3/Sweden (see appendix IV), that have been provided in the Danish and Swedish language and targeted towards Danes and Swedes, and have become popular alternatives to the national services. Modern Times Group (MTG), the creator of TV3, did not provide the same service in Finland.
As seen in the tables, in 1998 and 1999, the number of subscribers to satellite services subscribed to digital services is insignificant as added values obtained, using digital platforms compared to analogue platforms, are still too low to make consumers having analogue subscriptions shift to digital. As seen in appendix II, however, different methods are used to speed up this conversion. The providers want to speed up this conversion both to use digital platforms to provide new services, and to stop analogue simulcasting that implies major costs. Some of the methods used to promote digital satellite broadcasting in the Nordic countries are:
• Viasat has announced the policy of not accepting new analogue consumers.
• Canal Digital has offered free digital set-top-boxes to their premium pay-TV consumers in Denmark and has turned the analogue simulcast off. Viasat will use the same method of subsidizing digital boxes to their premium pay-TV subscribers in all three markets.
• Both Viasat and Canal Digital try to make agreements with the national public service channels to make them available in their line ups. This is important, as otherwise, the satellite households may depend also on terrestrial services, and consequently be forced to maintain both satellite dishes and VHF/UHF antennas, a situation that is not so attractive for the end-users. In Denmark there is however a problem of offering TV2 in the satellite line ups, due to the regionalized structure of TV2/Denmark (see sub-chapter 6.5 for more discussion).
• Offering new and value added services. The available services are given in appendix IV.
Table 6-4 shows an overview of satellite households in the 15 EU countries. As seen, the level of development varies very much in different countries.
Satellite households in Europe (in % of TV households), 1999
Country

Chapter 6: Resource Issues 126
Between 30% and 40% Germany and Austria
Between 10% and 20% Sweden, Denmark, UK, Ireland, France, Spain, and Luxembourg
Less than 10% Portugal, Italy, Greece, Finland, Netherlands, and Belgium
Table 6-4 Satellite households in Europe3
6.1.2 Cable Table 6-5, Table 6-6, and Table 6-7 show the development of access to cable networks in Denmark, Sweden and Finland. It is differentiated between home passed and subscribers, where the home passed refer to households that potentially can subscribe to cable services, i.e., the cable connection is established at their premises, and subscribers are the households who subscribe to basic services. Digital home passed are the households that can obtain a digital subscription and digital subscribers are the households subscribing to a digital service. Different subscriber types are not differenciated, as the important issue here is connectivity.
Denmark 1994 1995 19964 1997 1998 1999
Home passed (millions) 1.700 1.700 1.500 1.600 1.700 1.700
of which digital (millions) 0.000 0.000 0.000 0.000 1.150 1.150
Home passed (% of TV households) 73.9% 74.6% 65.2% 68.3% 72.2% 70.3%
of which digital (% of TV households) 0.0% 0.0% 0.0% 0.0% 48.8% 47.6%
Analogue basic subscribers (millions) 1.170 1.270 0.950 1.000 1.316 1.335
Digital package subscribers (millions) 0.000 0.000 0.000 0.000 0.048 0.065
Analogue basic subscribers (% of TV households) 50.9% 55.7% 41.3% 42.7% 55.9% 56.8%
Digital package subscribers (% of TV households) 0.0% 0.0% 0.0% 0.0% 2.0% 2,8%
Table 6-5 Development of access to cable networks in Denmark Sweden 1993 1994 1995 1996 1997 1998 1999
Home passed (millions) 2.100 2.100 2.200 2.450 2.600 2.700
Of which digital (millions) 0.000 0.000 0.000 0.690 1.100 1.300
Home passed (% of TV households) 57.2% 56.6% 58.6% 67.0% 67.9% 67,6%
Of which digital (% of TV households) 0.0% 0.0% 0.0% 18.2% 28.7% 32,5%
Analogue Basic Subscribers (millions) 1.830 1.850 1.900 1.930 2.000 2.140
Digital package subscribers (millions) 0.000 0.000 0.000 0.000 0.025 0.060
Analogue Basic Subscribers (% of TV households) 49.9% 49.9% 50.7% 50.9% 52.2% 53.5%
3 Source: Development of digital TV in EU countries, IDATE, 2000. 4 The fall in the number of cable house holds is due to change in the statistics, as from 1996 small SMATV networks are taken out of cable TV statistics

Chapter 6: Resource Issues 127
Digital package subscribers (% of TV households) 0.0% 0.0% 0.0% 0.0% 0.7% 1,5%
Table 6-6 Development of access to cable networks in Sweden
Finland 1994 1995 1996 1997 1998 1999
Home passed (millions)5 1.300 1.300 1.200 1.200 1.200 1.200
of which digital (millions) 0.000 0.000 0.000 0.000 0.000 0.000
Home passed (% of TV households) 60.5% 59.8% 54.1% 53.6% 53.2% 53.1%
of which digital (% of TV households) 0.0% 0.0% 0.0% 0.0% 0.0% 0.0%
Analogue Basic subscribers (millions) 0.892 0.924 0.976 1.025 1.07 1.11
Digital package subscribers (millions) 0.000 0.000 0.000 0.000 0.000 0.000
Analogue Basic subscribers (% of TV households) 41.5% 42.5% 44.0% 45.8% 47.4% 49.1%
Digital package subscribers (% of TV households) 0.0% 0.0% 0.0% 0.0% 0.0% 0.0%
Table 6-7 Development of access to cable networks in Finland As shown in the tables a growth in the number of cable subscribers can be identified. Regarding Finland the number of home passed almost unchanged and the ratio to total household has been declining. The ratio of cable home passed to the total households in Finland is also less that the two other markets. This is due to the geography of the country, where only half of the population is living in urban areas where it is economically feasible to establish cable-TV networks. Digital cable TV exists in Sweden and Denmark with Tele Danmark cable TV in Denmark and Telia (Com Hem) in Sweden, as the major providers. The level of development of digital home passed is very high in the two countries, as Tele Danmark Cable TV and Com hem have fully digitalized their networks. The number of digital subscribers is however insignificant. The number is rising but at a very slow rate, among others due to the high cost and low added value of these services. Tele Danmark cable TV has offered its premium pay TV subscribers free digital set-top-boxes and terminated analogue transmission of these services. In Finland there is no digital cable TV, according to the market actors primarily because of the absence of added value and high costs of this transformation, and also because the Finnish cable TV networks focus on upgrading the networks to two-way to provide Internet services (see appendix II). The capacity available in analogue cable TV in the three Nordic countries is sufficient to provide the most popular services and also additional services. This makes it difficult to market digital TV based only on its expanded transmission capacity. The increased capacity in the digital cable TV has, however, been used to increase the number of premium pay TV channels and programs targeted towards minorities, both being narrow segments of the total market. Even in these narrow market segments cable competes intensively with satellite networks, i.e., cable households can use satellite as additional infrastructure to access narrow and special type of programming. Cable TV has the comparative advantage of the possibility of an easy and efficient integrated return path, compared to other infrastructures. The driving force of cable TV in the future will be a combination of traditional and new interactive services. Until now the level of 5 The decrease in 1996 is due to using different statistic sources.

Chapter 6: Resource Issues 128
development in this type of services has been slow, as outlined in appendix IV, new services are becoming available in Denmark and Sweden. Table 6-8 gives an overview of cable households in the 15 EU countries. The variation between different countries is very high with Italy and Greece having less than 10%, and Germany, Belgium, Netherlands and Luxembourg more than 85% of households passed with cable TV.
Cable households in Europe (in % of TV households), 1999
Country
More than 85% Germany, Belgium, Netherlands, and Luxembourg
Between 45% and 70% Sweden, Denmark, Finland, UK, Ireland, Portugal, and Austria
Between 20% and 40% France and Spain
Less than 10% Italy and Greece
Table 6-8 Cable households in Europe6
6.1.3 Satellite and cable One of the major problems concerning resource issues is how and if it can be justified that terrestrial frequency resources are assigned for digital broadcasting, in the light of the opportunity cost of not assigning the resources for other valuable uses. The question is then if this problem can be solved by using information about the level of penetration of other delivery networks. Looking at the three Nordic countries, the total ratio obtained by adding satellite and cable households in Denmark, Sweden and Finland in 1999 was about 92.8%, 86.4%, and 58.4%. The real ratio of cable and satellite households is however less than these numbers as part of the cable households also use satellite networks to obtain special programming. Another problem is that part of the cable and satellite households, 21.3% in Denmark, 17.3 % in Sweden and 5% in Finland, do not subscribe to any services and receive their programs from terrestrial network. The latter problem can be solved by reducing the price of basic packages such that all cable and satellite households subscribe to the basic service. The conclusion that can be given at this level, using the maximum figures, is that the question of using terrestrial frequency resources for digital TV depends heavily on the level of development of other infrastructures. In Finland and other countries with low development of cable and satellite networks (see above), terrestrial TV has an important role to play to make it possible that all households can have access to digital TV services. In Denmark and Sweden (and also, e.g., Netherlands, Luxembourg and Germany), however, the answer to the question of assigning or not assigning terrestrial resources to broadcasting is not so straightforward. Also in these countries, a number of households receive their programs purely from terrestrial networks. This problem has two aspects, discussed later in this chapter:
• If terrestrial TV is considered a pure complimentary infrastructure to maintain 100% coverage, then the socio-economic costs of implementing terrestrial networks in comparison of promoting 100% use of satellite and cable networks must be analysed and calculated.
6 Source: Ibid.

Chapter 6: Resource Issues 129
• If terrestrial delivery network is seen as a competitor to other infrastructure, with its comparative advantages of enabling portability and mobility, and its ease of use, then even when other infrastructures are highly developed, the infrastructure competition may show to what degree there is a role for terrestrial TV to play.
6.2 Assignment and organisation of resources in terrestrial networks As shown earlier, digital broadcasting is standardised such that the allocations of frequencies will remain as in analogue broadcasting. The digital TV standards define how the data is transmitted in a frequency bandwidth that corresponds to one analogue TV channel7 and how the data is structured in a multiplex block. When, for example, a TV station receives a licence to operate in a digital terrestrial network, apart from geographical coverage, hours of operation, type of services, etc. that are commonly specified in analogue broadcasting, also the ratio of the total capacity in a multiplex block must be specified. The optimal allocation of this ‘ratio’ will have influence on different types of organisations, described in the following. In the following it is assumed that:
• Based on technical considerations, the data capacity in a multiplex block will be determined at the political level. That is, the modulation technology, the FEC overhead, the selection between 2K and 8K COFDM modulation, and the Guard interval will be specified at a techno-political level.
• The regulatory body will then, based on political and technological considerations, specify the number of multiplex blocks that will be available in a market. Of which, further, the number of MFN and SFN multiplex blocks and the multiplex blocks planned for portable and mobile reception will be specified.
When this is done the total capacity for digital TV and the characteristics of different multiplex blocks will be known parameters. As mentioned earlier, a multiplex operator is, further, necessary to facilitate the sharing of the capacity. The multiplex function can be a pure technical function but the task of managing the capacity of the multiplex block can, however, also be performed by this function. As mentioned earlier, the Conditional Access (CA) and/or EPG service can also be maintained by the multiplex operator. Two main approaches can be deployed in resource allocation in a multiplex block:
• Static allocation. In this allocation the amount of capacity assigned to different content providers is fixed. The multiplex function performs only the technical multiplexing of the inputs and generating the output stream.
• Dynamic allocation. In this allocation the whole or part of the capacity is allocated dynamically. Different approaches can be used in allocation of resources to different content providers, but the important thing is that the allocated capacity may change over time.
Different approaches can be used in the organisation of a multiplex block and assignment of the available capacity, with different advantages and drawbacks. The multiplex block can be organised by the content provider, infrastructure provider or by a totally independent provider. The resources in one multiplex block can be assigned to one HDTV service or multiple lower quality services. In the following first, HDTV versus multi-service allocations, and later different organisation forms for multiplex operation are analysed. Finally, empirical
7 For example in 8 MHz TV channel in UHF band in Europe
Chapter 6: Resource Issues 130
data are presented on the development of terrestrial TV.
6.2.1 HDTV versus multi-service allocation The increased capacity available in digital broadcasting can be used to transmit:
• A number of TV services with less quality than HDTV, e.g., SDTV quality8,
• a combination of TV services with, e.g., SDTV quality and new services such as data, audio or video services, or
• one single HDTV program and its program related data, in the same frequency bandwidth as one analogue TV channel. In the following, the two first cases are called multi-service, and the latter HDTV allocation. When the resources are used for transmission of signals of HDTV quality, digitalisation of broadcasting will not cause radical changes in the organisation of market. There will still be a one-to-one relation between a TV service and the frequency bandwidth of a TV channel. The only difference is that the technical quality of the transmitted pictures in terms of, for example, resolution of picture, the quality of audio, and additional data will increase substantially compared to analogue broadcasting. This is not to undervalue the gained technological improvements obtained in this approach, but to underline that allocation of resources in this way does not reduce the resource scarcity that has been a central reason for establishing regulations in broadcasting. Consequently the HDTV allocation will not have positive impacts on competition between different delivery networks. The increased transmission capacity will not be used to give the possibility for new actors to enter the market, and the incumbents will be best positioned to gain the resources and can continue to dominate the market due to their market position and historical relations to the regulatory bodies The multi service allocation will, on the other hand, open up for new actors to enter the market. The new actors can come from the traditional broadcasting sector and/or from other sectors like the Information technology sector. The multi service allocation will have positive impacts on the market development as, for first time, immense transmission resources will be available in the terrestrial networks. Allocation of resources in an optimal way will intensify more competition on the market between content providers but also between infrastructure providers as, multi service allocation will upgrade the terrestrial networks to a viable competitor to satellite and cable networks. In Europe, multi-service allocation is used and in all the three Nordic countries the SDTV quality is used or is planned to be used in the terrestrial networks. As seen in the following, in the Nordic countries, the resources are used to give public service broadcasters better possibilities to develop services but also new service providers have obtained licenses in Sweden and Finland. But first an analysis of different organisation forms for multiplex function.
6.2.2 Organisation forms of multiplex function Different models can be deployed in the organisation of a multiplex function. To what degree static or dynamic allocation is used depends on the regulations related to the assignment of content and multiplex blocks. In the following, different possible models are described. In a specific market one or a combination of these models can be available.
8 Similar to the current PAL quality (see the chapter on broadcasting technology)

Chapter 6: Resource Issues 131
Single content-provider led: Here, licenses for content provision and multiplex operation are given to the same actor. That is, a content provider obtains licenses for operating in one whole multiplex block, and the license for operating the multiplex function is given to the same content provider. In this approach the whole multiplex block is assigned to one content provider. Regulation can be posed on the type, quality, and the number of the services available in the multiplex block, but the resources are organised by the content provider. This is similar to allocation of resources in analogue broadcasting, as there is a one-to-one relation between the allocation of frequencies and the assignment of resources. As only a few numbers of multiplex blocks are available in different markets, this will be in continuation of few actors dominating the market, known from analogue broadcasting. This approach will have a negative influence on competition, as the number of content providers in a market does not increase at the same proportion as the capacity increases. On the other hand, there are advantages using this approach. In Europe, e.g., high priority is given to public service broadcasting, among others, due to cultural political reasons. When one multiplex block is assigned to a public service provider, it will have more optimal conditions to conform to its public service responsibilities. It will have better conditions to differentiate its service provision and target different services towards different part of the society in a more optimal way. Educational programs for children can, for example, be provided parallel with other programming targeted towards the grownups and the older part of the society. If regulation allows it, the public service broadcaster can, further, use the new possibilities in digital broadcasting to develop innovative data services in addition to the traditional programs. As described earlier, it is inefficient to provide general Internet in the terrestrial network; the public service broadcaster can as a part of its public service responsibility provide a limited version of Internet to general public. Other examples can be given on how the increased capacity can be deployed to develop public service responsibility, the important issue here is, however, the increased possibilities for conforming to the public service responsibilities. Another important advantage of assigning the whole multiplex block to one actor is that the resources can be utilised more efficiently. Using statistical multiplexing, the content provider can, in program planning, optimise capacity utilisation by distributing the programs requiring high and low capacity such that the statistical gain can be maximised.
Multi content-provider led: Several content providers obtain licenses for operating in one multiplex block, and the license for operating the multiplex function is shared by these content providers. This is basically the same as the single content-provider led organisation, with the difference that the capacity of the multiplex block is assigned to more than one content provider. The content providers in the multiplex block have, further, the responsibility of the organisation of the multiplex function. By co-ordination of their programming, the content providers can also in this approach obtain statistical gains that can be used for development of new services.
Multiplex led: Separate licenses are given to the program providers and the multiplex providers. Here the market is driven by competition between different multiplex operators and different content providers at different levels. The competition between multiplex operators will have positive impacts on market development but extra regulatory efforts are needed to avoid complicated access issues, due to, e.g., selection of different CA and API in different multiplexes. This is a general approach and some of the multiplex blocks in this case can be organised as single and multi content provider led organisation forms.
Service led: The multiplexes are organised and maintained by the infrastructure provider or a third party, and the content providers obtain licenses on these multiplexes. This provides a uniform multiplex structure, and the content providers in competition with each other drive the market development. There is no competition between the multiplexes at the multiplex block level. In this model, the Conditional Access and API and services like EPG can be organised in the multiplex, giving a uniform interface to the end users. The same actor can

Chapter 6: Resource Issues 132
of course obtain licenses to operate a number of services, for example, corresponding to a complete multiplex block, like it is the case of the single content-provider led.
Unlicensed multiplex led. Here only the multiplex operator must obtain license. The multiplex operator can then sell capacity on the market. The content providers do not need any license and it is the multiplex operator’s responsibility to make them conform to relevant regulation. Looking at the regulatory framework in Europe and the US, this organisation seems to be inapplicable. This organisation is however the most market oriented solution, and a realistic approach will be to deploy the organisation form only partly and in specific markets. By allocating some of the capacity in this way other dynamics than the pure licensed regime will determine the service development and innovation in the future market. There are advantages and disadvantages connected to these organisations and licensing forms. In a particular market, a combination of different solutions can be used to have the most efficient allocation of resources and to gain advantages of different models in specific cases.
6.2.3 Development of terrestrial delivery networks The only platform, where the national regulation still defines the regulatory framework is the terrestrial broadcasting9. The national government can use the possibility to promote some types of services and impend some others. They can put their emphasis on traditional broadcasting services, new and innovative advanced TV services, or data services. This is an important tool that the national government can use to influence the national broadcasting market and give the national actors possibilities to compete with the ever increasing and powerful international actors. As terrestrial networks are in competition with satellite and cable and, in the future, also with other infrastructures, the responsibility of national governments is even more important to create the most optimal conditions for terrestrial networks by using the best allocation and organisation forms for terrestrial broadcasting. In the following development of terrestrial networks in the 3 Nordic countries and to a lesser degree some other European countries are given.
Denmark Terrestrial digital broadcasting does not exist in Denmark. The major reason for this is that the available resources for digital broadcasting are few in Denmark. There is however an ongoing work, by the Danish telecom agency, to find new resources for digital TV by re-planning and harmonisation with the neighbouring countries. The Danish telecom agency is working on making four countrywide multiplexes available in Denmark (see appendix II). Furthermore, as described in appendix II, preparation studies are done regarding introduction of digital terrestrial TV in Denmark and a trail is established, using frequencies from the only countrywide set of frequencies that is reserved for digital broadcasting in Denmark, to gain technological and organizational experiences. Table 6-9 shows the services available in the trail. Furthermore, the multiplex operator as well as population coverage are indicated.
9 According to European regulations, satellite networks must conform to regulations of the country of origin. When the uplink is located in another country the national government will not be able to regulate the services available in the satellite and consequently in the cable networks.

Chapter 6: Resource Issues 133
Multiplex Operator Free to air Subscription Coverage
1 DR & TV2 DR1
DR2
TV2
TV2 regional:
TV-Lorry
TV-Øst
50%
Table 6-9 Digital terrestrial TV in Denmark (trail) As shown in the table, the pilot project is operated by the public service channels DR and TV2. After the trail period (end 2000) and, among others, depending on the available frequency resources, a political decision will be taken on the further development of digital terrestrial TV in Denmark. The organization of the multiplex function can be considered as multi-content-provider led.
Sweden Terrestrial digital TV in Sweden is available and as seen in Table 6-10 the licenses for four multiplexes are assigned. An organisation, called Senda, is established as the multiplex operator for all multiplexes in Sweden10.
Multiplex Operator Free to air Subscription Coverage by 2001
1 Senda SVT 1
SVT 2
SVT 24
SVTRegional:
SVTSYD
SVT VÄST
SVT ÖSTNYTT24
SVT MITT
SVT MÄLAR-
KANALEN
78%
2 Senda TV 4
TV 4 Regional:
TV 4 Stockholm
TV 4 Göteborg
TV 4 Norr
e-TV
NollEttan Television* 78%
10 For a comprehensive description of development of terrestrial TV and different actors involved in terrestrial TV, please refer to appendix II.

Chapter 6: Resource Issues 134
Skånekanalen
3 Senda K-world Canal+*
Kanal 5
78%
4 Senda TV3
TV 8
TV 1000*
ZTV
VIASAT Sport
78%
Table 6-10 Digital terrestrial TV in Sweden Terrestrial TV currently covers about 50% of the Swedish viewers, and is expected to expand to 78% in 2001. The first multiplex consists of public service channels provided by Sveriges Television. The second multiplex is used by TV4, which provides a mixture of news, entertainment and documentaries. e-TV is an interactive channel where viewers can purchase e.g. CDs, watch music videos and get up to date weather forecasts. Nollettan is a regional channel that covers news, sport and entertainment for the region of Östergötland. Skånekanalen fulfil a similar function for the Skåne region, while it also uses the opportunities of digital TV to create an interactive contact between citizens and local authorities. The third multiplex is used by Canal+, Kanal 5 and K-world. Canal+ specialises in block buster movies and direct coverage of major national and international sport events such as the English Premier League, NHL and NBA. Kanal 5 focuses on Swedish and international TV drama series and films. K-world (Knowledge World) covers documentaries, films and music and distributes products related to learning and knowledge. TV3 in multiplex 4 provides family entertainment, sport and documentaries. TV8 specialises in financial information and documentaries as well as financial news from the global financial markets. TV1000 shows films, and major sport events and concerts. ZTV concentrates on the youth and covers a range of music, talk shows, entertainment and culture. Viasat Sport is a sport channel that shows international football, golf and horse racing as well as other major events. Historically, the Swedish government has been a major actor in the Swedish mass communication market. The structure that has been created with Senda (multiplex operator) and Teracom (infrastructure oprator)11 seems to suggest that it has no intention of changing this, and a digital terrestrial TV network with publicly controlled network providers enables it to continue this. As described earlier, using one centralized multiplex operator for all multiplexes (the service led model), has different advantages and drawbacks. For the end customer, the centrally planned structure results in a transparent and homogenous market with convertible technology, which gives potential access to all available services offered through terrestrial digital TV. They thereby avoid having to make choices that could result in technological lock-ins, as with users of digital satellite services. Since the market is still very dynamic and future developments are uncertain, this can be said to be of significant value. However, because of the slow decision-making process involving different layers of government evaluation, the market is not allowed to respond and expand as quickly as when commercial actors operate. Regarding content provision, as seen in the table, the government has used its possibility of 11 See appendix II

Chapter 6: Resource Issues 135
giving public service and the national broadcaster privileged status in the Swedish terrestrial TV market. What is also important, the government has also opened up for commercial actors and more than half of the available resources are assigned to these actors. Even in the case of TV312, that was not willing to conform to national advertising regulations, there was enough flexibility to come to an agreement, such that TV3 became available in the terrestrial network. A case that shows flexibility even in the centralized regulation model. The downstream part of the DTTV market, i.e. the distributor (Senda) and the infrastructure provider with direct contact to the end customer (Teracom), has had its profit-maximising motives delimited by societal aims. This limits the organisational development of these organisations, especially in terms of vertical integration and ownership: An example is the commercial broadcaster TV 4 AB, which acquired a 1/3 share in Senda in June 1998, but subsequently had to sell it back to its original owners because of discontent among other market participants.
Finland Table 6-11 shows the content providers and the multiplex operator that have licenses for operation in the digital terrestrial network in Finland. A detailed description of the digital terrestrial TV in Finland is given in appendix II.
Multiplex Operator Free to air Subscription Coverage by
2001
1 Digita YLE (TV1 & TV2)
YLE24 (24 hours news channel)
FST (Swedish language channel)
YLE Plus (culture and education)
70%
2 Digita MTV3Oy
Suomen Urheilutelevisio (Sports channel)
Wellnet Oy ( The service will cover health issues)
70%
3 Digita Regional :
City-TV Oy Helsinki
City-TV Oy Pirkanmaa
City-TV Oy Suomi
City-TV Oy Turku
Oy Ruutunelonen Ab (a digital version of Channel Four Finland)
Helsinki Media Company Oy (Film channel)
Werner Soderstrom Oy (Education channel)
Deuterium Oy (the name will be changed to Canal+ Finland Oy)
70%
Table 6-11 Digital terrestrial TV in Finland
12 Ibid.

Chapter 6: Resource Issues 136
Also in Finland the public service and national broadcasters have a privileged market position in the terrestrial network. The commercial broadcasters have also obtained license to operate in the digital terrestrial network. As described earlier, the case of Finland is different as the terrestrial network is the only possibility for about half of the population to access broadcasting services. Regarding the multiplex organization the same model as in Sweden, service-led, is chosen in Finland. Here Digita, a subsidiary of the public service broadcaster YLE, has obtained the responsibility to operate all multiplexes in the network. The same considerations as in the Swedish case are applicable to Finland regarding advantages and drawbacks of the model.
Other European countries Table 6-12 shows the roll out of digital terrestrial TV in different EU countries at the end of 1999. As shown in the table different countries are at different levels of development.
Roll out of digital terrestrial TV in Europe, 1999
Country
DTTV already launched Sweden and UK
Likely to be launched at the end of 2000 Spain, Ireland, and Netherlands
DTTV roll-out plan on a political and legal level / Field tests in operation
Finland, France, Italy, Germany, Denmark, and Portugal
DTTV still in a first phase of discussion Austria, Belgium, Luxembourg, and Greece
Table 6-12 Roll out of digital terrestrial TV in Europe13 Table 6-13 and Table 6-14 show the chosen multiplex models in the UK, Sweden, Spain, and Finland, and the models some other European countries are likely to adopt. Furthermore the strategies on simulcasting is indicated. This is however the subject of the following sub chapter.
Country Model of licensing adopted Simulcasting
UK Multiplex led Yes
Sweden Service led Yes
Spain Hybrid Yes (but not mandatory)
Finland Service led Yes
Table 6-13 Model of licensing adopted in some European countries
Country Model of licensing likely
to be adopted
Simulcasting
Ireland Hybrid Yes
Germany Service led Yes (« islands » conversion approach)14
13 Source: Development of digital TV in EU 14 Different plans regarding different geographical areas

Chapter 6: Resource Issues 137
Netherlands Service led Via cable
France Multiplex led Yes
Italy Multiplex led Yes
Table 6-14 Model of licensing likely to be adopted
6.3 Simulcasting As described earlier, digital broadcasting is not backward compatible with analogue broadcasting. This makes it necessary in a period to broadcast both digital and analogue programs in parallel. The natural timeframe for this parallel simulcasting is given by the renewal cycle for electronic equipment (10-15 years), from the time analogue equipments are removed from the market, provided that infrastructures for digital TV are developed at this time. Other methods like subsidising digital set top boxes can be used to shorten this period. The socio-economic considerations, regarding the protection of the end-users investment in analogue equipment versus the financial burden of maintaining the analogue broadcasting network, can give the policymakers an indication of timing for the termination of analogue broadcasting systems. Pressure from neighbouring countries is another parameter that impacts the timing for termination of analogue transmission. The countries that are faster in implementation of digital broadcasting networks will require the neighbouring countries to stop analogue transmission giving them better possibilities to utilise their frequency resources. After the simulcast period that will be maximum 10-15 years, all the frequencies that are used by the current analogue services will be released, and if the governments assign these resources for digital broadcasting, the number of actors in the terrestrial broadcasting will increase substantially. As seen in Table 6-13 and Table 6-14, some countries use other networks to simulcast the programs in analogue form and release the terrestrial frequencies from day one. Simulcasting will also be used in the satellite and cable networks. Here the renewal of the electronic equipments will set a maximum time for simulcasting. In reality the providers, especially the satellite providers, as shown above, subsidise set-top-boxes in connection with subscription to terminate analogue broadcasting as soon as possible, as the financial burden of simulcasting is quite heavy.
6.4 Using other infrastructures As described earlier, other infrastructures like telecommunication networks, can be deployed in digital broadcasting both for implementing interactivity in the networks where integrated return path is complicated to implement, like terrestrial and satellite networks and also to transmit digital TV services to the end users. As mentioned earlier, using XDSL technologies, the regular telephone networks can carry digital TV services, and digital MMDS can be used to implement wireless cable networks. Also new type of networks, like advanced wireless networks and Local Area Networks implemented in private premises can carry digital TV signals in the future. They are primarily developed to provide advanced data services like Internet, but when the capacity is high enough they can be used for transmission of digital TV signals. The possibility of using other infrastructures will increase the available resources for

Chapter 6: Resource Issues 138
provision of broadcasting services. This will help to diminish resource scarcity, and intensify the competition between content providers and different infrastructures. This will also have regulatory implications, as different networks are regulated under different regulatory regimes. So far in none of the three Nordic countries are these alternative infrastructures used for transmission of digital TV services. Return path in terrestrial networks As mentioned earlier, DVB is developing standards for return path as an integrated part of terrestrial networks. Implementing this return path requires, that the regulatory body considers the advantages and disadvantages of the implementation of the integrated return path compared to using other networks as return path. If it is seen as necessary, then frequency resources must be allocated to the purpose. An integrated return path must be considered in relation to the available capacity per end user and the requirements of interactive services.
6.5 Complementarity and competitiveness of infrastructures, the Danish case As described above in the markets with a high level of development of satellite and cable networks, terrestrial network can be considered as complementary or competitors to these networks. Terrestrial networks have the comparative advantage of offering mobility, portability and ease of reception. But for the network to be a competitor to other infrastructure a minimum transmission capacity is necessary. In the following the case of Denmark is analysed. The resources available in Denmark correspond to one country wide multiplex block and the capacity is reserved for the public service broadcasters, DR and TV2. In the following, it is assumed that one multiplex block is not sufficient to make terrestrial network a viable competitor to cable and satellite. Consequently, the terrestrial network if implemented, is considered as complimentary to cable and satellite. The question is then the socio-economic costs of implementing terrestrial networks compared to the further development of satellite/cable networks. In the following, the cost of covering all households in Denmark by satellite and cable versus implementing a countrywide terrestrial network for carrying four services in one multiplex block is given.
Main assumptions used in the following analysis: • Each of public service broadcasters has possibility for distribution of two TV services,
where one of them must have the possibility to be regionalised in eight different regions, i.e., in eight different regions it must be possible to add regional programs to the countrywide service.
• Every household in Denmark must be able to access broadcasting services.
• The calculations are based on one connection per household. Additional houses (summer house, camping, or similar housings), where access to TV can be necessary are not considered.
• As seen in appendix I a high ratio of households have two or more TV sets and VCRs that they use in parallel. In digital TV each equipment must have a dedicated set-top-box, and regarding satellite they must further have either a dedicated

Chapter 6: Resource Issues 139
satellite dish or a switching structure that enables access to the same dish. For simplicity, in the following these additional set-top-boxes and connections are not considered.
• The losses that can occur due to the lack of portable and mobile reception is not considered.
• If the country is covered by only satellite and cable, all households will receive their signals from either satellite or cable and therefore do not have much incentive to maintain their UHF/VHF antennas. This will cause losses to local TV. These losses are not considered in the following.
• The value of not using the resources for terrestrial and using them for other services is not calculated and set to zero in the following.
Some basic data (see appendix I and II): Number of households15: 2.41 mill. Number of cable TV households (home passed): 1.7 mill. Number of cable TV households (subscribers): 1.4 mill. Number of satellite households: 0.53 mill. Number of satellite subscribers: 0.35 mill.
The cost of covering the whole country by cable and satellite networks
In the following the cost is divided in two parts; the costs at the supply and at the demand side. At the supply side some of the services are already transmitted in the satellite network: DR1 is already being transmitted in DVB-S standard, TV2-ZULU and DR2 are being transmitted in D2-MAC and DVB-S standard, and the access to them can be obtained free, for example, through Canal Digital. In the following, however, this current situation is not considered and the cost of the supply side is calculated with the assumption that the services do not already exist on the satellite network.
On the supply side: The cost of transmission of one DVB-S (8 Mbit) = 5.783 mill. Dkr. per year16 Satellite transmission of TV2 will require eight DVB-S17 transmissions. Three other services (DR1, DR2, and TV2’s other service) require 3 DVB-S transmissions
The total cost at the supply side will then be 11 X 5.783 mill. = 63.613 mill. Dkr. per year. In addition to this, there are other costs related to the up-link and amortising of equipments18 and possibly some costs connected to the transmission of the regional signals to a head
15 The calculations are performed with regard to the total number of households and not the TV households, as the whole population must have the possibility of accessing services. 16 Source: DR 17 Eight transmissions are required to maintain the regional structure of TV2 18 The cost of uplink for digital DR1, digital DR2 analogue DR2 are 3.3 mill. DKr. per year. The rental of equipments, etc. cause an additional cost of 2.918 DKr. per year for DR.

Chapter 6: Resource Issues 140
station.
On the demand side: The calculations in the following do not consider the possible subsidisation of the receiver equipments when one subscribes to a service. Neither the price of digital set-top-boxes are considered as all households accessing digital TV must acquire a digital set-top-box independent of the infrastructure that is used. Following prices are used in the calculations:
Price of a satellite dish = 1000 Dkr. Average cost of installation = 1000 Dkr.
Three migrations cases can be considered:
• Case 1: All cable TV households subscribe to a basic package containing the four public service programs that are intended to be transmitted in the terrestrial network. This can be done if the rate for accessing the basic package is low (here zero). This implies that 2,23 mill. households will receive their services from cable and satellite networks (1,7 mill. cable, and 0,53 mill. satellite)19 and:
2,41 - 2,23 = 180.000 households must acquire a satellite dish. Satellite dish (1000) + installation (1000) = 2000 Dkr.20 Total costs for the end consumer = 360 mill. Kr.
• Case 2: The subscription rate of the basic package in the cable networks is high and the cable households that do not subscribe to the basic package are referred to use satellite reception.
Using this assumption 2,41 – (1.4 + 0.53) = 480.000 households must acquire a satellite dish. Satellite dish (1000) + installation (1000) = 2000 Dkr. Total costs for the end-user = 960 mill. DKr.
• Case 3: The development of cable TV networks are increased, such that the whole country will be covered by cable TV. The cost of this expansion is so high21 that the case becomes irrelevant beside the other cases.
Total cost: Using the average between case 1 and case 2 the cost at the end-users site can be estimated to 660 mill. DKr., that corresponds to about 100 mill. DKr. per year22. The total cost of transmitting the four services using satellite and cable networks can then be estimated to 100 + 63 = 163 mill DKr. per year. 19 There will be additional costs for some satellite households to acquire new dishes if their current dishes are directed towards other satellites than the one general Danish programs are provided 20 Prices are form a radio/TV retailer in Denmark, FONA in Farum 21 See KUM 22 The conversion to the annual cost is done using a 10 years loan with 10% rate. This is also used in other calculations in the following.

Chapter 6: Resource Issues 141
The cost of covering the whole country by terrestrial networks
In the following, the cost of establishing a digital terrestrial network to carry these four services with one of them having TV2’s regional structure is given.
On the supply side: According to TV2/ Denmark the cost of implementing this network is about 100 mill. DKr (about 16 mill. per year). Furthermore, there is an additional cost of about 32 mill. per year for operation and maintenance of the network. The total cost of establishing and operation and maintenance will then be 48 mill. per year
On the demand side: Ot the demand side, it is estimated that half of the pure terrestrial households (2.41 – (1.4 + .35) = 660.000 households) will have an additional cost of 1000 DKr., resulting in a total cost of 330 mill. on the demand side (54 mill. per year).
Total cost of using terrestrial network: The total cost of terrestrial network will then be 102 mill. DKr. per year. The calculations show that the cost of establishing a terrestrial network for serving the part of Danish households that do not subscribe to cable and satellite services is lower than promoting development of cable and satellite networks to cover all households. These calculations are however based on several assumptions. In reality, there are many advantages of using terrestrial networks but also drawbacks. The major drawback, in the scenario discussed here, is the low number of services available in the network. It is difficult to imagine that the TV households transform to digital if there are not more available services. The advantages are connected to terrestrial broadcasting in general that enables simple reception, portability and cost efficient local and regional broadcasting.
6.6 The US case In the following, the resource issues that are analysed in above subchapters in the Nordic countries and other European countries are analysed in the US market.
6.6.1 Level of development of cable and satellite delivery networks Basic statistics on the number of population, households and TV households are given in Table 6-15. Furthermore the GDP statistics that primarily is used in the following chapter on market development is given.
As of 31 December 1994 1995 1996 1997 1998 1999
Population (millions) 260,5 262,8 265,5 267,8 270,2 272,7

Chapter 6: Resource Issues 142
Households (millions) 98,2 99,0 99,6 101,0 102,5 103,9
TV Households (millions) 95 96 96,3 97,7 97,8 98
GDP (in USD billion) 6947 7401 7636 8301 8760 9256
Table 6-15 Country fundamentals in USA23
6.6.1.1 Satellite Table 6-16 shows the development of access to satellite services. The main actors in the market are also indicated in the table.
1994 1995 1996 1997 mid-1998 1998 mid- 1999
C-band 2.20 2.30 2.20 2.10 2.03 1.92 1.78
DIRECTV & USSB 0.35 1.30 2.30 3.30 3.75 4.46 7.46
PRIMESTAR24 0.25 0.75 1.20 1.75 2.12 2.30 -
EchoStar - - 0.35 1.00 1.38 1.94 2.62
Total Satellite 2.80 4.35 6.05 8.15 9.28 10.62 11.86
% of TV households 2.9% 4.5% 6.3% 8.3% 9.5% 11% 12%
Table 6-16 Development of access to satellite networks in the US25 As seen in the table, there are over 11 million Direct To Home (DTH) TV-households (12 % of TV households) in the US. Out of these, 90% subscribe to one or more satellite services. The main actors in the American satellite market are DIRECTV and EchoStar. Other actors United States Satellite Broadcasting (USSB)26 and PRIMESTAR27 were acquired by Hughes Electronics and are now part of DIRECTV. DIRECTV is a subsidiary of Hughes Electronic Corporation, a unit of General Motors Corporation. DIRECTV launched its services in the summer of 1994. The subscribers of DIRECTV have increased 1 million per year from 1995 and ended in 4,46 million subscribers at the end of 1998. DIRECTV’s programming has been distributed by 3 satellites (DBS-1, DBS-2 and DBS-3) built by Hughes Electronics. Acquisition of USSB, the premium multi-channel movie services, increased the number of services in DIRECTV from 185 to 210 services, including, the premium multi-channel movie services like HBO28 and Showtime. PRIMESTAR had 2.3 million DTH subscribers at the time of acquisition and this acquisition had significant impacts on DIRECTV. According to DIRECTV, upon completion of these transactions, DIRECTV features: 23 Source: Statistical abstract of the USA 98 & www.census.org. 24 PRIMESTAR was acquired by DIRECTV in the beginning of 1999 25 Source: Broadcasting & cable, July 19, and the WEB sites of the satellite providers 26 USSB was acquired on Dec 14, 1998 by DIRECTV. 27 PRIMESTAR was acquired on Jan 22, 1999 by DIRECTV. Number of PRIMESTAR subscribers in 1995, 1996, and 1997 have not been available and are estimated. 28 Home Box Office is the premium television programming division of Time Warner Entertainment Company, L.P., providing two 24-hour premium television services, HBO and Cinemax. Together, both networks reach nearly 35 million subscribers in the United States via a variety of distribution modes including direct broadcast satellite (DBS). Home Box Office’s international ventures bring HBO branded services to more than 40 countries around the globe.

Chapter 6: Resource Issues 143
• More than 7 million U.S. subscribers;
• More than 370 entertainment channels delivered through five high-power DBS spacecraft: DBS-1, -2 and -3, a high-power Tempo satellite and DIRECTV 1-R (planned for launch in mid-1999);
• The broadest distribution network in the DBS industry, combining more than 26,000 points of retail sale with PRIMESTAR’s rural and small urban-based distribution network; and
• High-power DBS frequencies at each of the three orbital slots that provide full coverage of the continental United States: 101 degrees West Longitude (WL), 110 degrees WL and 119 degrees WL.
In July 1999, DIRECTV announced transmission of a 24 hours HDTV service. The service, which is the first continuous HDTV broadcast available, features Hollywood films and original movies from HBO. The announcement was made at the 1999 Satellite Broadcasting and Communication Association National Convention. The service was started from the first of August 1999. EchoStar Satellite Corporation is part of EchoStar Communication Corporation. In 1987, EchoStar Communications Corporation filed for a Direct Broadcast Satellite (DBS) license with the FCC. EchoStar Satellite Corporation was established to build, launch and operate DBS satellites. In 1992, the Company was granted a DBS orbital slot at 119 degrees West Longitude, and three years later, the DISH (Digital Sky Highway) Network brand name was created. EchoStar deploys 4 satellites (EchoStar I .. EchoStar IV) that give, according to EchoStar, the DISH Network capacity for over 250 channels of digital video, audio and data services to be delivered to homes throughout continental United States. The only services that remain analogue are the C-band satellites that reached their culmination in 1995 with 2.3 million subscribers. C-band subscribers change to direct satellite services, as they become available in different markets and share of C-band subscribers to total satellite market continues the declining rate. One of the important developments in satellite networks in recent years has been their market expansion from rural areas to urban and sub-urban areas, where they compete with the cable networks29. Furthermore, they try to obtain agreements with local TV stations to make these services available in their line-ups that can be considered as one of the major elements in intensifying competition with the cable networks.
6.6.1.2 Cable Table 6-17 shows the development of cable TV in the US.
1994 1995 1996 1997 1998 mid-1999
Home passed (millions) 91.6 91.8 91.8 91.8 91.8 95.6
of which digital (millions) - - - - - 29.66
Home passed (% of TV households) 96% 95% 95% 94% 94% 97%
of which digital (% of TV households) 30%
Total Subscribers (millions) 60.5 61.8 63.4 64.1 65.1 64.71
Digital package subscribers (millions) - - - - - 2.79
29 See among others: Higgins J. H.” Anyone for plain vanilla cable?”, Broadcasting & cable, July 1999.

Chapter 6: Resource Issues 144
Analogue Subscribers (% of TV households) 64% 64% 65% 65% 66% 66%
Digital subscribers (% of TV households) 3%
Table 6-17 Development of cable TV in the US30 As seen in the table, in mid 1999, there were about 66 cable TV subscribers in USA. The top 25 operators in American cable TV market now control 60.8 million subscribers, or about 90% of all US cable subscribers, up from 85% in 1998. Due to relaxation of cable ownership, there have been huge interests for the big operators to expand their market shares driving the prices of the cable systems to about $5000 per subscriber in August 1999. Cable TV in USA consists of several small and big SMATV systems. There are around 11.000 cable TV systems in USA. The ownership of the cable systems is, however, concentrated as depicted in Table 6-18.
In million, May 1999
Home passed Total Subscribers
Digital ready households
Digital Subscribers
Internet ready households
Internet subscribers
AT&T Broadband 25.00 16.20 10.40 1.30 7.5 0.21
Time Warner 21.00 12.90 9.37 0 6.00 0.15
Comcast 7.57 5.35 1.80 0.13 1.93 0.07
Cox 7.45 5.14 5.50 0.60 2.50 0.20
Adelphia 7.63 4.95 NA 0.47 NA 0.02
Total top 5 68.65 44.54 27.07 2.5 17.93 0.65
Top 6 to top 10 16.16 10.40 1.60 0.06 1.76 0.03
Top 11 to top 15 4.92 3.18 0.74 0.12 0.42 0.07
Top 16 to top 20 2.55 1.70 NA 0.10 0.36 NA
Top 21 to top 25 2.35 0.97 0.25 0.01 0.15 0.03
Total top 25 94.63 60.79 29.66 2.79 20.62 0.78
Table 6-18 Major cable operators in the US31 As seen in the table, upgrading the cable systems have both direction towards enabling digital transmission and towards enabling provision of Internet services.
6.6.1.3 Satellite and cable networks Based on these data, it is quite obvious that the US market can be assumed to be totally
30 Source: NCTA home page. And Hazlett T.W. & Spitzer M.L.: “ Public policy towards cable TV”, page 116 1997, Broadcasting & cable, July 1999 (May 24 & July 19) and Statistical abstract of the USA
31 Source: Broadcasting & cable, May 1999

Chapter 6: Resource Issues 145
(100%) covered by satellite and cable networks. In mid 1999 half of the satellite subscribers were in the urban and sub-urban areas and the other half in the rural areas. It may therefore be a reasonable conclusion that the 3% of households that are not cable households are among satellite households. One of the important issues is that in the era of C-band satellites, the satellite market was totally complementary to the cable market. Satellite provided services in the areas where it was economically unfeasible to establish cable networks. The situation has changed in recent years by having satellite networks competing with cable networks in the urban and sub-urban areas. Another important issue is, however, the relevance of terrestrial networks when cable/satellite networks are so well developed. Here it is important to note, that about 20% of the households do not subscribe to satellite and cable services and receive their programs from the terrestrial networks. There are, however, other problems like the function of terrestrial networks as the distribution network for the cable head-ends, analysed in more details in this subchapter.
6.6.2 Assignment and organisation of resources in the terrestrial network Terrestrial digital TV is introduced in USA. FCC’s deadline for the ten largest markets has been met and, at least 41, stations in the top 10 markets were on the air with digital channels as of mid-July 1999, up from 28 some five months earlier. According to National Association of Broadcasters (NAB), 100 stations did broadcast digital TV at the end of 1999. Some barriers for the development like tower space problems, reception problems, interference with VHF cable channels and interface with other equipments like hospital equipments, have slowed the development. The history of digital terrestrial TV in USA has been different from Europe and needs some further description. The dominant understanding of ‘advanced television services’ in USA is provision of HDTV and digital TV in the US market is equivalent to HDTV. HDTV transmission requires the whole bandwidth of an analogue NTSC signal. The strong broadcasters in the US began to market HDTV at the end of 1980s to replace NTSC in USA32 trying to hold on the extra TV channels allotted for television services in every city33. This resulted in FCC’s provision of spectrum without cost to virtually all of the current television broadcasters to provide for parallel transmission of ‘advanced television services’ in the 1996 Telecommunication Act. The plan is that the broadcasters must deliver the analogue resources back to FCC after the end of the simulcast period, at year 2006. The argumentation from the broadcast industry has been that they want to replace NTSC with a higher quality standard. They did not want to change business strategy or acquire more resources for new services and new forms of revenue. In this way, the incumbent broadcasters have maintained their market position in the terrestrial broadcasting market and hindered the entrance of competitors. Later, when the licenses were granted, the broadcasters changed some of the arguments and in the growing recognition of the all cost
32 This was a lobbying strategy against Land Mobile. By the end of the 1980s, actors from ”Land Mobile” industries applied for these resources to use them for mobile communication systems. Broadcasters, led by the National Association of Broadcasters (NAB), came up with the argument that they needed these resources to introduce HDTV. 33 In Washington, e.g., networks and independent stations broadcast on channels 4, 5, 7, and 9 on the VHF and 20, 26, 32 and 50 on UHF. The rest of the designated broadcast TV channels, 2 through 69, were vacant and the situation was similar in every city

Chapter 6: Resource Issues 146
and no-new-revenue character of the new technology, broadcasters claimed that if they were required to broadcast HDTV in their newly assigned frequencies, it would be the end of local broadcasting34. At this time, they argued for the necessity of using the resources for multi-service provision to gain new revenues to be able to transfer to digital transmission. From the legal point of view, the broadcasters are allowed to use the resources for multi-service provision. This is pronounced in the “broadcast spectrum flexibility amendment” in the Telecommunication Act of 1996: “If the commission (FCC) determines to issue additional licenses for advanced television services, the commission shall adopt regulations that allow the holders of such licenses to offer such ancillary or supplementary services on designated frequencies as may be consistent with public interest, convenience, and necessity”. This has raised resistance from other market actors that are interested in the spectrum, especially, the actors from the “land mobile” and computer industry. They claim that this is an unfair advantage to give the broadcasters spectrum recourses that is worth $70 billion for free and to let them provide services that the computer and land mobile industry also can provide. FCC tries to keep the broadcasters to their promise to use the resources for HDTV and, so far, none of the broadcasters have offered multi-service digital TV. Some of them have, however, strategies to offer mixed programming, e.g., providing some sport events and prime time shows in HDTV and in other times of the day offer multi-service. The multiplex organisation is a single content provider model, with the same entity having licenses both for content and multiplex. In the HDTV case the multiplex operator has not the same role as the multi service case as all the bandwidth is used by one service and no sharing is possible.
6.6.3 Simulcasting As stated above, the simulcast period has been set to year 2006. At this time the broadcasters must give the analogue frequencies back to FCC and it is not decided if these frequencies will be used for broadcasting or other uses. The termination of analogue broadcasting is however conditioned on the level of development of digital TV.
6.6.4 Using other infrastructures for broadcasting MMDS networks are used in the US market to provide TV to the end consumers. However, as seen in the table MMDS is only used by a small fraction of TV consumers.
In million 1994 1995 1996 1997 1998 mid-1999
MMDS households - 0.8 1.2 1.0 1.0 0.9
Table 6-19 MMDS households in the US35 As seen in the table, MMDS systems have had about one million subscribers in USA during the last five years. There are no indications of expansion of these networks
34 Exactly the same argument was used in the lobbying for “holding on” the frequencies in late 1980s, where they argued that “if the broadcasters did not gain resources for HDTV, it would be the end of local broadcasting” illustrating the broadcasters hidden agenda. 35 http:// ntca.cyberserve.com, summer 1999

Chapter 6: Resource Issues 147
6.6.5 Complementarity and competitiveness of different infrastructures As seen from the data presented in this chapter, the level of the development of satellite and cable networks in the US is very high approaching total coverage. Also regarding digitalisation of these networks, the level of development is very high, with satellite provision mainly in digital form (only apart from the C-band segment of the market), and 30% of the cable networks being digital. It is not unreasonable to assume that using severe rate regulation on the basic package in the cable TV networks (E.g., if the basic package can be obtained free of charge, like it is the case in terrestrial networks), all cable households will use the basic package and then the terrestrial networks will be superfluous. The problem is however more complicated. The local structure of the US broadcasting has resulted in several local stations (about 1500) being available on the market. Because of this structure of the US broadcasting market, the terrestrial networks play an important role of being the distribution networks for the cable head-ends. This is, however, changing in recent years as satellite networks are used more and more as a transmission medium for local TV. At first glance, transmission of over 1500 local TV services over satellite networks seems to be difficult to explain. But there are two major parameters that have influenced this development, one of them is digitalization that have decreased the cost of using services in the satellite networks, and the other is the development of the DTH satellite market and the importance of the satellite service providers to have local services in their line-ups. Otherwise the satellite households must access local service through terrestrial networks, requiring double maintenance of reception antennas. When all local service become available in the satellite networks, establishing local TV stations for transmission of terrestrial digital TV in the US market can only be justified in the following way:
• HDTV allocation. The digital terrestrial TV services are offered in HDTV quality. It is not economically feasible to transmit all local services in HDTV quality through satellite networks; therefore terrestrial networks are necessary.
• Multi-service allocation: If the development of terrestrial networks approaches a situation of using multi-service allocation, then terrestrial TV networks in the local markets can be considered as a multi-channel infrastructure and compete with cable and satellite networks.
So far it seems that the first situation is valid, that results in continuation of the strong market position of incumbent broadcasters in the US market.
6.7 Conclusion One of the important outcomes of the digitalisation of broadcasting has been implications on the resource issues, a.o., the expansion of the transmission resources for broadcasting due to more efficient utilisation of available resources. Up until the digital broadcasting era, the increase in the available resources occurred primarily due to the emergence of new infrastructures like cable/satellite networks and development of technology enabling utilisation of unused resources in these networks. This was done for example by increasing the available transmission capacity in the terrestrial networks by making use of UHF frequencies and in cable and satellite networks by expanding the deployed frequency

Chapter 6: Resource Issues 148
resources. This expansion of available resources can be identified in all infrastructures; however, the implications on the terrestrial networks are the most important as the frequency resources in terrestrial networks are scarce, also in the digital age, and valuable for plenty types of uses. Satellite and cable networks are operated by commercial actors that deploy the increased capacity in digital platforms to expand their businesses. To analyse the resource issues in the terrestrial networks, it is necessary in a specific market to analyse to what degree implementation of digital terrestrial networks can be justified, in the light of the development in other infrastructures. As seen in this chapter, however, this problem has different aspects and, specially, using multi-service allocation of the resources can upgrade terrestrial networks to a competing infrastructure to other delivery networks with comparative advantages like simple reception, including the possibility for portable and mobile reception. When considering terrestrial networks as pure complementary to other delivery networks, the level of development of other infrastructures becomes more important. As seen, e.g., the geographical location of a country like Finland results in the terrestrial networks playing a major role to establish full coverage to the population. Even in Denmark, as a small country with a relative high development of cable and satellite infrastructures, it is economically more feasible to maintain full coverage by establishing terrestrial networks than developing the cable and satellite reception further. As seen in the US case, another important parameter is the structure of the broadcasting market. Here the cost of transmitting over 1500 local TV broadcasts in HDTV quality, which has only local interests, through satellite networks seems not to be a justifiable replacement for the local transmission of terrestrial signals. The way digital TV is standardised makes it necessary to have a multiplex operator function where organisation in terrestrial networks is a vital parameter. The allocation of resources can be static or dynamic, and the major organisation forms for the multiplex function are: content-provider (broadcaster)-led, multiplex-led, and service-led. The broadcaster-led is used in the US, and in different European countries service-led or multiplex-led organisation forms are used. Different organisation forms will have different market impacts: In the content-provider-led the market organisation will remain as analogue broadcasting, in the multiplex-led the competition exists at two levels (service and multiplex levels), and the service-led enables a uniform interface to the end-users. Another major parameter is allocation of resources for a single HDTV service or for several services (multi-service allocation). In Europe, multi-service allocation is deployed and, in the US, HDTV allocation. In multi-service allocation the expanded capacity can be used to increase the number of services in the market. In Sweden, e.g., the capacity available in the terrestrial networks has been used to provide 16 TV services that cover the most popular services, and there has also been room for new interactive service like eTV and premium pay TV service like Canal+ and TV1000. Using HDTV, the technical quality of the received signals will be higher, but as resources remain few it will be difficult for new actors to enter the market. The timing for simulcasting of analogue and digital services is also an important parameter, as this will release immense resources for broadcasting or other uses, and removes the burden of operation and maintenance of the analogue systems. This timing will depend on the penetration of digital TV, but 10-15 years based on the natural renewal cycle of electronic equipment is suggested in different market Finally, the emergence of the possibility of other infrastructures to provide broadcasting services and also emergence of new infrastructures are considered as important parameters, as they also expand the available resources. However, this development is at a very low stage.

149
7. Access issues In analogue terrestrial broadcasting, access to the signal is equivalent to access to the content, as the terrestrial TV services both in European countries and the US are regulated to be consumed for free, free-to-air, services. In analogue satellite and cable networks, however, access to some of the services requires that other conditions than pure accessibility to signals are met, for example, it can be necessary to subscribe to a service to be able to use it. As described earlier, in digital broadcasting this separation between signal and content accessibility can also be applied to terrestrial broadcasting. Especially, as seen in the following, using non-standard, ‘closed’, systems to facilitate content accessibility will have negative impacts on market development. The conclusion of the previous chapter on resource issues was that digitalisation has vital impacts on the development of the modern broadcasting model, with the market competition playing a more and more decisive role in the regulation of production and consumption of broadcasting services. The above-mentioned complicated access conditions in digital broadcasting can have negative impacts on the formation and development of the competitive market in digital broadcasting, as it can be difficult for the consumers to change between service providers. Therefore, in this chapter a detailed analysis of different aspects of access issues is given, and it is identified to what degree the access problems can be solved at a technological level and to what degree regulation can be necessary. In general the access issues in digital broadcasting can be divided in issues related to:
• Access to infrastructure (access to signal)
• Access to content Access to infrastructure is a necessary, but not sufficient, precondition for accessing the digital TV services. Using Conditional Access systems, the services can be targeted towards some individuals and others can be excluded. In this chapter the impacts of digitalisation of broadcasting on the access issues are analysed based on empirical data from Europe and the US. The data on the Nordic countries are presented in appendix III and, furthermore, secondary data from other European countries and the US are used. Based on the analysis, relevant access parameters are identified.
7.1 Access to the signal The potential coverage has a “signal access” perspective and is related to the different delivery networks available for digital TV. Different delivery networks will have different coverage characteristics. With satellite, e.g., it is possible to cover very large geographical areas, whereas the cost of laying cable for cable TV will limit its use to areas with high population density. The important signal access parameters are:
• Coverage: The specific characteristics of the delivery networks related to geographical coverage. This relates both to coverage of bigger geographical areas but also to the possibility of implementing limited coverage. The limited coverage can be attractive due to, e.g., copyright issues by reducing the signal overspill in the border areas.
• Capacity: The data capacity available in different delivery platforms. This is important both regarding the number of traditional broadcasting services but also

Chapter 7: Access Issues 150
regarding provision of new data services. The access implications are the level of variety of services that can be consumed.
• Interactivity: The possibility for access to interactive services. Here the available capacity plays an important role but another important aspect is the possibility for establishment of a return channel.
• Portability / mobility: This is more related to the way the service is used. For example, radio is mostly used in cars or by using portable receivers. Also regarding TV, portability and mobility will increase the flexibility when using the service.
• Reception complexity: Access to the signal in some networks is more complicated than others. Access to satellite signals requires satellite dishes that can be complicated to install, while terrestrial signals, if they are planned for indoor reception, can be received by indoor antennas.
The above parameters are summarized in Table 7-1, with regards to different delivery networks:
Signal Access parameters Delivery networks
Coverage Capacity Interactivity Portability / Mobile
Reception
TERRESTRIAL Local, Regional and countrywide
Low Limited, integrated or e.g., POTS as return path
Yes (when using COFDM1)
Roof or in-house antenna
Satellite Wide areas, difficult to limit the coverage to specific country
High High, e.g., POTS as return path
No Satellite dishes
Cable High population areas
High High, e.g., integrated return path
No Cable connection
MMDS High population areas
High High, e.g. POTS as return path
No MVMS antenna
xDSL High Depending on technology
High, integrated return path
No POTS Connection
Table 7-1 Signal access parameters Based on the data in this table, it is not possible, to conclude on one of the delivery platforms having optimal access characteristics. The access issues must be analyzed in the specific cases and will depend on the level of development of different platforms and the services that will be offered. As described earlier, different platforms have complementary as well as competitive characteristics; these must be utilized to obtain the best possible access conditions. The level of development of different infrastructures is described in details in the previous chapter on resource issues. In the following, some specific implications on access issues 1 COFDM is the modulation technique used in DVB standard (See the chapter on technology of broadcasting for further details).

Chapter 7: Access Issues 151
that are related to different infrastructures are given.
7.1.1 Infrastructure independency of set-top-boxes Currently the digital TV broadcasting market is characterised by different set-top-boxes for different delivery networks. It will be in the end-users’ interest not to be forced to buy different receivers to access services from different delivery networks. Therefore a Set-Top-Box system that can handle all three major distribution forms (terrestrial, satellite and cable) would be a considerable advantage for the end-user. Even though such a Set-Top-Box might, at least in an introductory phase, be more expensive, the long run advantages may outweigh this problem. This is a problem that can be solved by the industry. If the industry does not solve the problem and if it is seen as necessary, then regulatory interventions can be necessary. The infrastructure independent set-top-box enables the users to easily change between different services providers across different platforms available on the market and will have positive influence on the competition. The set-top-boxes standardised by NorDig are a step towards this situation. NorDig boxes must implement a MPEG-2 transport stream interface that makes it possible to connect an external demodulator to the box. The change between infrastructures can then be implemented by only changing the external modulator. Another step that is related to this problem is the provision of Duomaster by Force Electronic in Denmark (See appendix III). Duomaster is a combined digital / analogue set-top-box in the satellite market. The similarity between Duomaster and the problem discussed here is implementing two demodulation systems (D2-MAC and DVB-S) in the same box, making it easy to change between analogue and digital services. The step further can, e.g., be integration of terrestrial demodulation in the digital satellite set-top-boxes. And finally, of course, integrating the demodulation systems of all three major delivery platforms (cable, satellite and terrestrial). Provision of infrastructure independent receiver equipment is only interesting when different platforms use common standards with minor differences, like the case regarding the DVB standards, where different standards used in different platforms differ mainly in the deployed modulation technology from each other. The case here is to integrate the three demodulation technologies in the same receiver equipment. This will, for example, be very complicated and unrealistic in the US market, where different infrastructures conform to different standards and even in the same infrastructure different standards are used.
7.1.2 Portable and mobile reception Implementing possibility for portable and mobile reception is partly a political question, as it is more complicated to implement portable reception, and the available bandwidth will be reduced when planning for mobile reception. For the end consumer portable and mobile reception will give optimal flexibility in using digital services. Political decisions in this area has been taken in Sweden and Finland, where the terrestrial network will be planned for portable reception. In Denmark, the possibility for portable and mobile reception has been marketed by the actors as a qualitative advantage of terrestrial networks compared to other infrastructures. In some other European countries the possibility for portable reception has been explicitly discussed. In the UK and Spain, for example, the discussion about the possible implementation of this “functionality” is or has been closely linked with the extra-costs it entailed for upgrading the network. In Germany and the Netherlands, it has been considered an essential condition for a successful DTTV development since TV households are mainly

Chapter 7: Access Issues 152
connected to cable networks2. Regarding mobile reception, because the available resources in this reception form will be less than portable and stationary reception, special considerations are required in analysing the necessity of this reception form regarding different multiplexes available in the country. The mobile services will primarily be used in trains, buses and cars. None of the available multiplexes in the Nordic countries are assigned for mobile reception; however, several field tests are performed in Finland and Sweden. As described previously, the chosen modulation technology in the ATSC standard for terrestrial digital TV in the US makes it impossible to offer mobility and difficult to offer portability. This has been considered as an important weakness of the ATSC standard, and some of the important market actors3 have required permission to use the European COFDM modulation that enables mobility and portability.
7.1.3 Interactivity As seen in appendix III, all the digital set-top-boxes available in the three Nordic countries contain integrated modems for interactive services. Furthermore, as mentioned earlier, DVB is developing standards for return path as an integrated part of terrestrial networks. Implementing this return path will make terrestrial networks independent of other networks, however, frequency resources will be sacrificed to obtain this independence. As described in appendix II, one of the directions of the development of cable TV networks in the Nordic countries is towards enabling two-way transmission. This has been the major development in Finland, but also in Denmark and Sweden, several cable networks have been upgraded to be able to provide Internet services. This two-ways structure combined with upgrading the networks for provision of digital TV give the cable networks the possibility to provide advanced interactive digital services. Furthermore, as seen in the previous chapter, the US cable networks are upgrading to two-ways structure to provide Interactive digital TV services and also to provide Internet services. In appendix IV a list of interactive services available in different infrastructures on these markets is given. When the problem of return path is solved there is another major problem, regarding access to content that can be complicated due to different API systems, described in the following sub chapter.
7.1.4 Ease of accessibility For the TV households that do not have cable or satellite connections, the easiest and cheapest way to access digital services will be through terrestrial networks. As described previously, the political regime can, among others, based on the level of penetration of cable and satellite networks decide on implementation of terrestrial network to give the majority of the society possibility to access digital services. As seen the decision of implementing digital terrestrial TV is taken in the US and in some of the European countries, including Sweden and Finland. In other European countries the decision will be taken in the future, where easiness of access is one of the parameters impacting the decisions.
2 Digital TV study in Europe, IDATE, 2000 3 See appendix VI

Chapter 7: Access Issues 153
7.2 Access to the content The services in digital TV platforms can be targeted towards specific users by using Conditional Access (CA) systems. As the CA systems are not standardised and different service providers in a market may base their service provision on proprietary standards, the end users may be ‘locked’ to a system and the change between different service providers can be complicated. Access to interactive services, facilitated by the Application Program Interface (API), is another access level that is complicated in digital broadcasting. The reason is that, from the beginning, no common standards have been available for API, and different service providers may use different standards. As mentioned earlier, the Electronic Program Guide (EPG) is a data service aiming at simplifying navigation between the huge amounts of services available in digital TV platforms. However, as the EPG is the users interface to the available services, its composition and presentation of the services can discriminate some services and promote others. Based on the available data, these major parameters: Conditional Access (CA), Application Programme Interface (API), and Electronic Programme Guide (EPG), are described in the following.
7.2.1 Conditional Access (CA) Conditional Access is a necessary instrument for access control and maintaining copyright for the content producers. But it can on the other hand limit the user’s access to programs offered by different service providers. Generally two situations are foreseen:
• Conditional Access is standardized - all or most service providers use the same system. The advantage is that all service providers can reach all users. However the disadvantage is that the system is vulnerable to hacking. If the security system is compromised all data/TV services can be accessed freely. This can result in enormous losses for the content and service providers. As mentioned earlier, this was among the reasons for the lack of standardisation of CA in the DVB project.
• Every service provider uses a proprietary system. This solution is not less vulnerable to hacking but the damages are limited to one system at a time. However this solution has the drawback of access limitations across systems. This is the solution commonly used in different markets, including different European countries and the US market.
Using ‘closed systems’ have negative impacts on market development as it becomes difficult to move between different service providers. The negative impacts must be limited to give the end-users best possible access conditions. This can be done through agreement between the actors at the supply side, technological solutions, and also regulatory interventions. To solve the problem, different models are suggested by DVB to implement interoperability: Simulcrypt model, Multicrypt (or Common Interface) model, and the transcontrol model described in the following.
• Multicrypt or Common Interface (CI) model. Here the Set Top Boxes (or PC, TV, VCR etc.), are implemented in a way that a CA module can be connected (inserted) to the equipment. By changing the CA module, different CA systems can be supported by the same receiver equipment. The commonly used module is a PCMCIA-module. The receiver equipment will, in addition to the CI module, contain an embedded CA. Implementing the CI module will increase the cost of the receiver equipment but it

Chapter 7: Access Issues 154
enables flexibility of use.
• Simulcrypt model: While Common Interface can be categorised as a pure technological solution, the simulcrypt model is based on an agreement between the service providers. Here, e.g., service provider A, apart from its own management information, transmits management information of the service provider B along side with the program signal. In this way both the set-top-boxes containing operator A’s CA system and set-top-boxes with operator B’s CA system can access the program.
• Transcontrol model. To give the cable operators full control over the services in their cable TV networks the transcontrol model is supported by DVB. Here the cable operator replaces the management system of the satellite operator’s CA with its own management system at the local or regional level.
The main reason for the possibility for, in a relatively simple way, to expand interoperability between different systems and provide services across systems that are vertically integrated is the use of common DVB standards. In the markets where different standards are used for digital TV it would be very difficult to implement this interoperability. In the following, CA systems and their interoperability in the three Nordic countries, rest of the EU and the US are given.
7.2.1.1 Nordic countries Generally, the EU directive (EU directive 95/47/EF 1995) about deployment of standards for transmission of TV signals requires that the operators of CA-systems offer broadcasters access on a fair and non-discriminatory basis. This directive has, e.g., been implemented in Denmark in the act on standards for transmission of TV signals, etc (Danish Act no. 471 of the 12th of June 1996). As seen in appendix III, two CA systems are used in the three Nordic countries: Viaccess and Conax. Conax is used by Canal Digital and Viaccess is used by Viasat in the satellite market and by Tele Danmark cable TV and STOFA cable TV in Denmark and by Telia (Com Hem) cable TV in Sweden. Furthermore, the CA deployed in the Swedish digital terrestrial network is Viaaccess. So far, there are no agreements between the satellite providers, but as seen in appendix III, part of set-top-boxes available on the market have Common Interface module. Regarding cable TV market, using simulcrypt model, the services available in Canal Digital’s line up are provided in the digital cable TV networks. In the Swedish and the Finnish markets, the service-led4 organisation is used in the digital terrestrial network. Consequently, the same CA system is used for the whole network. Therefore the problem of interoperability does not exist in the terrestrial network. The problem will, however, appear when a subscriber of terrestrial network in the future wants to use the same set-top-box5 to access, for example, satellite services with other CA systems. Here also simulcrypt and Common Interface model may solve the problem.
7.2.1.2 Other EU countries Table 7-2 shows the CA systems used in the EU countries in 1999.
4 See previous chapter 5 Either because in the future integrated Set-top-boxes for different platforms will be available or like in the NorDig case the same set-top-box is used and the external demodulators are changed.

Chapter 7: Access Issues 155
Systems Designers
Viaccess France Télécom
Mediaguard Seca
BetaCrypt Beta-Research
Na Irdeto
Nagravision Kudelski
Videoguard News Data System
Digicipher II General Instrument
Conax CAS3 Conax Telenor
Table 7-2 CA systems used in Europe6 According to the digital TV study led by IDATE7, Simulcrypt agreements have proved to be more easily concluded between non-competing platforms – for example Canal+ and the cable-operators (France) have signed Simulcrypt agreements – or between an “independent” TV channel and different platform operators for multiple carriage. Agreements relating to the interoperability of rival companies’ decoders may indeed be difficult to reach. As significant cases, at the beginning of 19998:
• No Simulcrypt agreements had been signed between the two French rivals, TPS and Canalsatellite
• Despite rapid development on the technical front, the outline plan for BSkyB and OnDigital to draw up a formal Simulcrypt agreement was far from being materialised
And in the recent introduction of Viasat in the Nordic market no simulcrypt agreement was reached between Canal Digital and Viasat. As seen in appendix III, all set-top-boxes available in the Nordic countries have Common Interface module. This is however a general tendency in Europe, where in spite of the increased cost of implementing CI module, it is seen as the optimal model for enabling interoperability between rival operators. Neither in the Nordic nor in the other EU countries was it possible (until 1999) to find examples of using transcontrol model. It seems that, the simulcrypt agreements have been the dominant model for enabling interoperability between satellite and cable networks.
7.2.1.3 The US market In the US market the problems are totally different, as no common standard is used in the three main digital platforms, terrestrial, cable and satellite. In terrestrial networks the digital services continue the analogue model of free-to-air provision. Satellite and cable networks use different digital standards, including DVB standards (DVB-S and DVB-C) and specific standards developed in the US like DSS in DirecTV and standards from Cable Labs in the cable networks. However, the Federal Communication Commission (FCC) has generally required the separation of security (Conditional Access) from non- security functions in the navigation devices by July 2000, and phasing out of set-top-boxes with embedded CA function by 6 Digital TV study in EU countries, IDATE, 2000 7 Ibid. 8 Ibid.

Chapter 7: Access Issues 156
20059. The order applies not only to set-top-boxes but also to other receiving equipments like TV sets, VCR, PC, etc. Only the separation of CA is considered by this regulation and full interoperability is not considered. FCC asserted however that if “service providers retain the ability to limit, substantially, consumer access to content, applications, and other services” 10, it retains the authority to revisit the issue and enforce more stringent separation obligations.
7.2.2 Application Program Interface (API) While CA maintains subscription and overall access to the digital services, API implements access to interactive services. Different proprietary non-standard API systems are used in the market that result in incompatible systems for different services restricting users’ choice (as the problem of incompatibility between different operative systems for personal computers). That is, even when the problem of CA is solved using one of the above-mentioned models, the access to interactive services will be impossible if different API technologies are used by different service providers. The problems can be solved by the standardisation of API or by regulation of different APIs such that open access can be achieved to all API systems. Different service providers can then develop services for different platforms. The advantage of having different proprietary API systems is the possibility for competition between systems. The drawback is the complicated access to interactive services cross platforms, and in the case of open standards, the resources that are wasted to convert a service to different platforms. DVB’s answer to the problem was to standardise an API system, called the Multimedia Home Project (MHP). The DVB project incorporated Sun Microsystem's Java into the core of its open interactive digital TV standard, DVB-MHP, in November 1999. Java TV is due to be finalised early in year 2000. OpenTV, Canal+, Sun, and other developers and Consumer Electronics manufacturers have helped shape it and intend to support it. DVB-MHP will offer backwards compatibility with existing APIs such as MHEG5, Mediahighway and Open TV. Nevertheless, this progress is not expected to prevent certain compatibility problems from arising. It therefore seems that the "switch" to DVB-MHP will constitute a major issue over the coming years. If MHP is used by different service providers the problem of interoperability will disappear in the long run, but as seen in the following, several API systems are in use on the market and Regulatory steps could be necessary to ensure interoperability between different API systems. This can be done by posing regulations requiring open systems, i.e. rules concerning the availability of the necessary tools to implement applications for a specific API.
7.2.2.1 Nordic countries As seen in appendix III, two different API systems are in use in the Nordic countries: Open TV, used by digital cable and terrestrial providers and on the satellite market by Viasat, and mediahighway used by Canal Digital on the satellite market. While the CA problem is solved by using the Common Interface Set-top-boxes available on the market, the API remains unsolved in the market. This becomes especially important as the number of interactive
9 FCC, in the matter of implementation of section 304 of the Telecommunication Act of 1996: Commercial availability of navigation devices, in Galperiri H. & Bar F.: “ Reforming TV regulation for the digital era: an international/cross-industry perspective”, presented at the 27th Annual Telecommunication Policy Research Conference, September 25-27, 1999 10 Ibid

Chapter 7: Access Issues 157
services is increasing in the Nordic markets. As NorDig conforms to MHP, it is highly probable that the terrestrial networks in the Nordic countries will use MHP. In Finland, for example, the Steering Committee of the Digital TV Forum Finland recommends, that the API to be used in Finland shall meet the specifications of the Digital Video Broadcasting (DVB) Multimedia Home Platform (MHP). The Nordig II receivers with DVB MHP API will be available in time for the national launch of the digital terrestrial digital network in 200111. Also the digital satellite service providers, Canal Digital and Viasat, consider changing to DVB-MHP in the near future.
7.2.2.2 Other EU countries Table 7-3 shows the API systems used in Europe, and Table 7-4 shows the combination of API and CA systems used in different European markets.
Systems Designers Open TV Thomson Multimédia Mediahighway Seca Sun Chorus Sun Microsystem Power TV Scientific Atlanta DTV Navigator Network Computer Inc. Betanova Beta-Research
Table 7-3 API systems used in Europe12
Service C.A.S. A.P.I.
Italy Stream (Sat) Beta Research
/Irdeto Open TV (Open TV)
D+ (Sat) Beta Research /Irdeto
Mediahighway (Seca)
RAI - Open TV & Mediahighway Spain
Via Digital (Sat) Nagravision (Kudelski) Open TV (Open TV)
Canal Satellite (Sat) Mediaguard (Seca)
Mediahighway (Seca)
Portugal TV cabo (Sat) Nagravision (Kudelski) n.a.
Belgium Canal + Belgique (cable) Mediaguard
(Seca) Mediahighway (Seca)
Le bouquet (cable) Mediaguard Mediahighway
11 See appendix III 12 Digital TV study in EU countries, IDATE, 2000

Chapter 7: Access Issues 158
(Seca) (Seca) Canal + Digitaal (cable) Irdeto (1rst gen.)
Mediaguard (2nd gen.) (Seca)
Mediahighway (Seca)
The Netherlands Canal+ Digitaal (sat) Irdeto (1rst gen.)
Mediaguard (2nd gen.) (Seca)
Mediahighway (Seca)
CASEMA/ Mediakabel (cable)
Viaccess (FRANCE TELECOM)
Open TV (Open TV)
Nordic countries Canal Digital (Sat) Conax
(Conax Telenor) Mediahighway (Seca)
Senda (Ter.) Viaccess (FRANCE TELECOM)
Open TV (Open TV)
Tele Danmark (Cable) STOFA
Viaccess (FRANCE TELECOM)
Open TV (Open TV)
Table 7-4 CA and API systems used in some European countries13
As seen in the tables in several markets, different API systems are used. As seen, the interoperability regarding interactive services is a general problem in different European countries. As seen earlier, some of the major actors in the digital TV market in Europe are behind DVB-MHP. Consequently, in the future, several service providers may transform to using DVB-MHP. Here the service providers that use systems like OpenTV that has guaranteed backwards compatibility have easier conditions for the change.
7.2.2.3 The US market In the US also a variety of different API systems are in use and efforts towards standardisation are in process, but like in Europe, it is not clear to what degree the market actors will conform to the standards. The two major satellite providers, DirecTV and EchoStar use two different APIs, namely, DirecTV INTERACTIVE and OpenTV. While OpenTV is also used in the cable networks in the US, DirecTV INTERACTIVE is only used by DirecTV. In the cable networks, OpenTV, PowerTV, and Microsoft’s WEB TV are the major actors, however, CableLabs has defined some standards, called OpenCable. FCC considers the standardisation of tools used for interactive TV as being very important, and like the European regulators’ reliance on a market migration to the DVB-MHP project, the FCC is setting the stocks high on the OpenCable project14. The OpenCable project was launched by Cable Labs in 1997, aimed at developing open interface specifications for digital navigation devices and the integrated digital TV sets. OpenCable standards are designed to work with a variety of microprocessors and multiple CA systems. OpenCable specifications have already been approved by the Society of Cable
13 Digital TV study in EU countries, IDATE, 2000 14 Galperiri H. & Bar F.: “ Reforming TV regulation for the digital era: an international/cross-industry perspective”, presented at the 27th Annual Telecommunication Policy Research Conference, September25-27, 1999

Chapter 7: Access Issues 159
television engineers15.
7.2.3 Electronic Program Guide (EPG) Both the ever-increasing quantity and the variety of TV services make it necessary to have an electronic program guide (EPG). EPG is a navigation tool making it simpler to get an overview and navigate between different TV services. EPG is the consumer’s interface to the available services. The way the TV services are represented in the EPG can enable promotion or discrimination of some TV services. Regulation of the EPG can be desirable to create and maintain optimal conditions for different service providers on the market. Regulation can also be necessary to give privileged conditions to some service providers, e.g., due to reasons like preserving national and cultural interests to give better visibility and conditions to for example public service broadcasters in Europe. In the EGP area, regulatory steps should ensure that the service does not discriminate any broadcaster by excluding them from the EPG. This may be defined as a simple right of the end user to have the possibility to access all service providers through an EPG. According to a study done by the European Broadcasting Union (EBU)16
• There shall be free and equal access to the basic program guide for all broadcasters.
• The broadcasters must have the opportunity to produce their own EPG-applications. To give the European public service broadcasters privileged status, according to EBU, “There shall be easy access to the programs from public service broadcasters by giving them a visible position in EPG”17. Also in the UK specific regulations regarding public service in EPG are applied. According to Independent Television Commission (ITC) “the EPG provider must give due prominence to any public service channels included on the EPG. Access to such channels should not be more difficult for viewers than access to any other services included on the EPG” 18.
7.2.4 Free to air compatibility of Set-Top-Boxes From the political side it can be required that all Set-Top-Boxes, Integrated digital TVs, and other receiving equipments must be able to receive all non-encrypted free-to-air TV services. Some system manufactures might not include this feature due to agreement with a service provider. This feature has been put into legislation in a number of countries. In Denmark, e.g., the Ministry of Research and Communication has decided (Danish Ministry of Research. Departmental order no. 709 of the 25th of June 1996) that: “Digital decoders must be constructed in a way that allows non-encrypted digital TV signals to pass transparently through them”.
7.3 Conclusion In this chapter, access issues in digital broadcasting is analysed, based on empirical data. 15 Open cable Status report, January 7, 1999. 16 European Broadcasting Union (EBU): “ Difficult to be easy. The Electronic Program Guide”, (Annex Com.J. dt. SPG 9930/3), 1998 17 Ibid 18 Independent Television Commission ITC, “ITC Code of Conduct on Electronic Programme Guides”. London: ITC. June 1997

Chapter 7: Access Issues 160
Two different levels of access are identified in this chapter, namely access to the infrastructure and access to the content. One can perfectly have access to infrastructure but not to the content as access to content may require other assumptions to be met. This is easily seen in the difference between cable home passed and subscribers described in the previous chapter. This complication of access issues is, however, in continuation of the development satellite and cable networks in analogue broadcasting. In traditional analogue terrestrial broadcasting equal access to all households is maintained by two requirements: 1) The content to be free-to-air, and 2) The signal to be available in the whole geographical area covered by the license. Easiness of access for 100% of households has never been part of the rule. This has for a minor percent of households with complicated access conditions, surrounded by high trees, etc. resulted in extra costs to establish reception. In digital broadcasting, however, due to different standards, and functions that are not standardised, several different parameters must be considered to maintain easy access and possibility for easy change across different service providers in the same platforms and cross platforms. The major parameters that are identified in this chapter are: Regarding access to infrastructure:
• Infrastructure independency of digital receivers. This is especially applicable in Europe due to common DVB standards used for different infrastructures. When the same digital receiver, in the beginning mainly set-top-boxes, can be used in different platforms, the end-user has the most optimal condition in changing between service providers across different platforms. In the US, at least in the short term, infrastructure independency is impossible, as different infrastructures conform to totally different digital standards across platforms and also within the same platform.
• Portable and mobile reception. Portable and mobile receptions give valuable flexibility at the end users site. Portable and mobile receptions are only possible in terrestrial networks, and make demands on the allocation of resources and planning the networks that are political parameters. In the US, portability is difficult and mobility is impossible as far as the modulation technology 8-VSB is used. There are however pressures from the market actors to make the use of the European COFDM possible.
• Implementation of return path in terrestrial networks. This will give the consumers of terrestrial services possibility for using interactive services without reliance on other infrastructures. Implementing this valuable option will among others involve a political process of resource allocation and assignment.
• Ease of accessibility. The easiest way for the current non-satellite/cable households to access digitals services is, if digital services are available in the terrestrial networks. This is however only one of the parameters that impacts decision-making on the implementation of terrestrial networks.
Regarding access to content:
• Conditional Access (CA). Different CA systems used by the actors in one market impend the end-users’ possibility to change between different providers. Two technological solutions, Common Interface and Transcontrol, and one solution that requires contracting between service providers, simulcrypt agreements, are suggested by DVB. FCC requires separation of the security from the navigation unit and monitors the market development to see if further interventions are necessary.
• Application Program Interface (API). The market for interactive TV is dominated by different API systems. Both in Europe and the US, standardisation process are going on. If the market does not conform to the common standards, regulations to make the competing systems ‘open’ can be necessary.

Chapter 7: Access Issues 161
• Electronic Program Guide (EPG). EPG is a data service aiming at simplifying navigation between the huge amounts of services available in digital TV platforms. However, as it is the users interface to the services, its composition and presentation of the services can discriminate some services and promote others. The important task here is to implement an even and non-discriminatory access to all services. The governments can also regulate the service to promote certain services based on societal considerations.
• Free-to-air compatibility of set-top-boxes. To impend tight vertically relations between receiver equipments and the service provision as minimum, it can be necessary that all receiver equipments can access the non-encrypted services.
As seen in the previous chapter, digitalisation of broadcasting increases available resources and promotes more competition in the market. This chapter shows, however, that the way digital TV is standardised and the way households receive the services can result in complex situations, where change across service providers can be impossible and enabling optimal access condition to make the competitive market to work requires intervention from regulatory side. This is, however, contrary to the process that we have been witnessing through the history of broadcasting, where the regulatory body has worked against competition, to promote public service in Europe and local broadcasting in the US.

162
8. Market development and funding issues Alongside with the resource and access issues, digitalisation of broadcasting has other implications on the market development; both with regards to structure of the market and the way broadcasting services are financed. These implications are partly due to the characteristics of the technology of digital broadcasting like possibility for provision of pay-services in all platforms, partly due to economic parameters, like scale and scope economics, and partly due to the overall regulation framework of broadcasting. This chapter contains an empirical analysis of the development of broadcasting market in the Nordic countries and in the US, mainly with respect to implications on funding and market structure. One of the important aspects of funding is the amount of the market for broadcasting, including digital broadcasting, and the level of growth of the market for major funding forms, namely license fee, advertising, and pay-TV markets. Two of the major funding forms for broadcasting, license fees and advertising, have their roots in the public good characteristics of broadcasting services. The transformation of broadcasting services from public to private / club goods has rendered new funding forms possible. This does, however, not exclude traditional funding forms in digital era, as they can and will be used in the future market. Another important aspect is the structure of the broadcasting market. As seen in previous chapters, digitalisation enables possibility for more competition, and at the same time creates access barriers that will have negative impacts on competition. Also economy of scale and the vertically integrated pay-TV systems can result in concentration of market, which consequently can have negative implications on the competition in broadcasting market. Here, as concluded in the previous chapter, the regulators will have a major task of enabling optimal access conditions to avoid ‘lock-ins’, and as described in the following, a task of considering the necessity of ownership regulations. Regarding concentration of market it is important to identify at which level of value chain the market is concentrated. As seen in the following, terrestrial broadcasting in, e.g., Sweden is highly concentrated at service and infrastructure provision, as a monopoly structure is used for service- and infrastructure provision. At the level of content provision, however, a variety of actors operate on the Swedish market. Other parameters impacting the market structure are the level of competition between different infrastructures and the use of the new possibilities for service provision that are facilitated by broadcasting. In the following, the development of broadcasting market with respect to the major funding forms, including an analysis of the future funding forms for public service broadcasting is given, with reference to the Nordic and the US markets. Then the market structure of digital broadcasting is analysed.
8.1 Market for broadcasting services In the following, first the development of broadcasting market in the Nordic countries and the US is given. Then, an analysis of the future of funding of public service broadcasting in Europe that hitherto has been mainly based on license fees is given.
8.1.1 Nordic countries In appendix V the market data for development of three main funding forms:
• License fees on receiver equipments that is the main funding forms for the public

Chapter 8: Market development and funding Issues 163
service broadcasters,
• Advertising that is used both by public service channels and the private commercial services, and
• Pay-TV that consist of direct payment for subscription to broadcasting services is given in Denmark, Sweden and Finland. Pay-TV covers both subscription to satellite and cable, basic and optional, packages and subscription of premium pay-TV services, like movie channels and other narrow types of programming. These data are depicted in Figure 8-1, Figure 8-2, and Figure 8-3, both as absolute and as index figures.
0
5 0
1 0 0
1 5 0
2 0 0
2 5 0
3 0 0
3 5 0
4 0 0
4 5 0
1 9 9 3 1 9 9 4 1 9 9 5 1 9 9 6 1 9 9 7 1 9 9 8 1 9 9 9 2 0 0 0
L i c e n s f e e A d v e r t i s i n gS u b s c r i p t i o n
M i l l E u r o
T V m a r k e t i n a b s o l u t e n u m b e r s
0
5 0
1 0 0
1 5 0
2 0 0
2 5 0
1 9 9 2 1 9 9 4 1 9 9 6 1 9 9 8 2 0 0 0
T V m a r k e t a s i n d e x
Figure 8-1 TV market in Denmark as absolute figures and as index

Chapter 8: Market development and funding Issues 164
05 0
1 0 01 5 02 0 02 5 03 0 03 5 04 0 04 5 05 0 0
1 9 9 3 1 9 9 4 1 9 9 5 1 9 9 6 1 9 9 7 1 9 9 8 1 9 9 9 2 0 0 0
L i c e n s f e e A d v e r t i s i n gS u b s c r i p t i o n
M i l l E u r o
T V m a r k e t i n a b s o l u t e n u m b e r s
0
5 0
1 0 0
1 5 0
2 0 0
2 5 0
3 0 0
1 9 9 3 1 9 9 4 1 9 9 5 1 9 9 6 1 9 9 7 1 9 9 8 1 9 9 9 2 0 0 0
T V m a r k e t a s i n d e x
Figure 8-2 TV market in Sweden as absolute figures and as index
0
5 0
1 0 0
1 5 0
2 0 0
2 5 0
3 0 0
1 9 9 3 1 9 9 4 1 9 9 5 1 9 9 6 1 9 9 7 1 9 9 8 1 9 9 9 2 0 0 0
L i c e n s f e e A d v e r t i s i n gS u b s c r i p t i o n
M i l l E u r o
T V m a r k e t i n a b s o l u t e n u m b e r s
02 0
4 0
6 0
8 01 0 01 2 0
1 4 01 6 0
1 8 0
1 9 9 3 1 9 9 4 1 9 9 5 1 9 9 6 1 9 9 7 1 9 9 8 1 9 9 9 2 0 0 0
T V m a r k e t a s i n d e x
Figure 8-3 TV market in Finland as absolute figures and as index
As seen in the figures the advertising and pay-TV markets have had considerable growth rates, with the pay-TV growing fastest in Denmark and Sweden. The growth rate of pay-TV

Chapter 8: Market development and funding Issues 165
and advertising markets in Finland is lower than the other two Nordic countries, due to lower level of development of multi-channel infrastructures in Finland. As seen in appendix V the market share of digital broadcasting is insignificant compared to the total TV market. The digital market, in appendix V, is estimated using the ratio of digital subscribers to the total number of subscribers. Digital TV in Denmark, Sweden, and Finland consist mainly of pay-TV subscribers. The market value of digital TV in these countries amounted to about € 11 million in Denmark (1.3% of total TV market), € 23 million (1.9% of total TV market) in Sweden, and only € 2.5 million (0.4% of total TV market) in Finland. These values are still small, but digital TV market has more than doubled compared to 1998. This is mainly due to strategic investments by the commercial network operators and the free replacement of analogue boxes with digital boxes. The digital TV users are still mainly the former customers of premium analogue pay-TV channels who had their proprietary decoder boxes replaced, and foreigners who want to watch programs in their native languages. Due to the small population, a large proportional adoption rate is necessary for new digital TV-based services to appear on the Nordic countries. The nationwide digitalisation of the terrestrial network is likely to have a positive effect on the development of the market because of the large potential user base. Especially in Finland terrestrial TV will play an important role in the development of digital market. Both public service actors and commercial providers have obtained licenses to operate in the network that will render possible bringing several commercial TV services to half of the population that are unable to access to cable/satellite networks. Also in Sweden that has been dominated by public service broadcasters through the history, several commercial services are available in the digital terrestrial networks. However, as seen in appendix II the penetration of digital TV services in the terrestrial network has not been that fast. As described in the appendix II this is due to starting problems, among others the high cost of set-top-boxes in the beginning and problems related to TV3 (and other services from MTG): Due to disagreements regarding regulations around advertising, TV3 did not start in the terrestrial network. The development will, according to the market actors, be faster in the future as the two mentioned problems are solved: A rental service is established for set-top-boxes and TV3 is available in the network (see appendix II for more details). The potentials for development of digital TV in these three countries are quite high. This is due to the high priority regarding establishment of terrestrial digital TV in Finland and Sweden (and major work going around in Denmark), and the clear strategies of the major cable operators and satellite providers towards digital broadcasting.
8.1.2 The US Table 8-1 shows the market data regarding the US TV market. License fee on receiver equipments is not used in the US, and the public broadcasting is financed by user contributions and contributions from federal and sates governments, denoted as the public funds in the table.
USA, Billions US$ 1994 1995 1996 1997 1998 1999
TV Market
Public funds 1.8 1.9 2.0 1.9 2.0
Advertising 35.4 37.8 42.5 44.5 48.0
Pay-TV 25.7 28.0 32.0 35.9 40.0

Chapter 8: Market development and funding Issues 166
Total TV 62.9 67.7 94.6 82.3 90.0
Table 8-1 TV market in the US1 Also in the US, the advertising and pay-TV markets are growing fast. Here, however, the public funds that finance public broadcasting has been at the same level in the last 5 years. The expansion of transmission capacity and the declining costs of distribution and delivery in digital era have resulted in severe competition between Public broadcasting in the US and the commercial broadcasters, providing narrow type of programming, like children programming, education-related programming, classical arts, etc2. The share of digital TV market in the US is also increasing. Regarding satellite market the majority of the subscribers are digital subscribers, 85% of total satellite subscribers in 1999, and regarding cable networks the share of the digital cable is still low, 4% of subscribers to cable services in 1999. As seen, there are much more potentials for ‘going digital’ as over 30% of cable households had the possibility for subscription to digital services in the middle of 1999, and in the satellite market the C-band subscription has declined throughout recent years3.
8.1.3 Funding public service broadcasting in digital age The considerable growth rate of advertising and pay-TV markets show that in the future it can be difficult for the public service broadcasters, purely based on license fees, to maintain their market position in the European countries. In the modern broadcasting market one of the important resources that is scarce is content. Here, it is important to be able to pay for talent, major (e.g., sport) events, movies, etc, which prices will more and more follow the market. Here the commercial broadcasters have the advantage of being able to calculate on their revenues when they acquire content. For example, an advertising financed commercial channel can calculate on the number of audiences and the value of the audiences in the advertising market when buying, for example, the rights for transmission of a popular football match in a market. As seen in the figures the advertising and pay-TV markets are increasing. The problem of public service broadcasters is that the level of license fee cannot increase at the same level making it more and more difficult to maintain their market position. The question is then: how can public service broadcasters use new possibilities in the modern broadcasting market to be able to compete with the commercial broadcasters. In the following different possible funding forms to be deployed for public service broadcasting in the future are described.
License fee. License fee on receiver equipments is the traditional most used financing form for public service broadcasting in Europe. But license fee cannot be increased in the same tempi that answers to the general development of production and distribution costs of broadcasting services. But the possibility to increase the licenses in connection to introduction of terrestrial digital TV (digital license fee) will exist. This funding form will continue to be used for public service broadcasting.
1 U.S. Census Bureau, Statistical Abstract of the United State: 1999. The 1998 statistics are estimated 2 See among others: Noam E. :”Public-Interest Programming by American Commercial Television” in Noam E. and Watermann J. :“public television in America”, Bertelsmann Foundation Publishers, 1998. 3 See the chapter on resource issues in this thesis.

Chapter 8: Market development and funding Issues 167
The advantages of financing through license fee for public service broadcasting is that the financing form fits well in the overall societal obligations public services have. Public service must cover the interests of the whole society and this can be done by this homogenous and equal type of payment. The disadvantage is that this financing form does not fit into the media reality public service broadcasters face. There are, e.g., several delivery forms and receiver equipments. It is, e.g., possible to se TV on a PC on the Internet and there are no legislations on paying license fee in this case.
Advertisement. Advertisement is another big source for financing broadcasting. As mentioned earlier, both commercial and private public service broadcasters have used this form for financing. The most common forms for advertising are: Spots, Sponsor contracts, and Banner advertisement, where sponsor contracts has been allowed, e.g., in American public and many European Public service broadcasting, and banner advertisement will be used extensively in the digital future, e.g., in the EPG, etc. The advantages for advertisement financed TV is that consumption of service is free for the users and the disadvantage is that commercial interests can influence the content. There are however limited resources in the advertising market and other resources for financing public service, and also, private broadcasting will be necessary.
Income tax. Income taxes are similar to license fee, especially in a situation where the majority of the users use the service. The major difference is that when using license fee the public service broadcasters economy is more independent from governments and the political system, and consequently the allocations of public resources. As discussed earlier, for example, in US there have been problems on the amount of funding in changing administrations.
Subscription and pay TV. Subscription and pay-TV are the financing forms used in the multi-channel (satellite and cable) environment and as seen above, this market has increased rapidly. As discussed earlier, especially when using pay TV and Pay-per-view, the broadcasting service will be organised as a club/private good that can be customised to the individual user and traded in a competition market structure. It can be foreseen that the market for subscription in digital broadcasting will increase in continuation of a growth that can be identified in the analogue satellite and cable markets.
Transfer from commercial providers. Transfer from the commercial operators is known from telecommunications, where in connection to liberalisations in many countries a so-called universal service fond is established. The operators must pay to this fond, and it will be used to finance development of services that are not profitable in regular market. The idea can also be transferred to broadcasting in a way that the commercial broadcasters pay to a similar fond for having the right of operating in the market. This fond can then be used partly to finance public service broadcasting. This has been used in for example Sweden, where TV4 (that is a commercial channel) pays to such a fond (for more details see appendix II)
Donations and selling own products. Donations and selling own products are among other forms for acquiring financing for broadcasting services, including public service broadcasting. Donations are known from the American way of financing public broadcasting and selling own products can give the European public service broadcasters immense financing possibilities because they in so many years have produced programming and own valuable archive materials.
8.2 Structure of the market for digital TV The implications on the structure of the market is analysed in the following. Here the major aspects are: 1) Horizontal concentration of market, 2) Vertical integration of industry, 3) Competition between different infrastructures, and 4) The impacts on new models for

Chapter 8: Market development and funding Issues 168
services provision in digital TV.
8.2.1 Horizontal concentration As described earlier, in this thesis it is assumed that if there is a variety of services available, different content providers will try to fulfil the wants and needs of demand sides. As seen in the previous two chapters, optimal allocation of resources and creation of optimal access conditions will result in more competition and therefore have positive impacts on the variety of services available on the market. On the other hand as described earlier, broadcasting market has a tendency of being horizontally and vertically concentrated. When the fixed costs are paid the variable costs for providing one more service will be lower than starting a new service provision within broadcasting. What is more, the horizontal concentration can occur at different levels of value chain. In the following, concentration of market at service provision level is described. When the broadcasting market is highly concentrated at the service and infrastructure provision level, the service provider can have a decisive role in selecting the services that are available on the market. To establish fair and non-discrimination in service provision in the analogue cable networks that are, locally, highly concentrated some regulations on the available content (TV channels) have been posed. In Denmark, for example, the services available in basic and optional bouquets must be decided through user voting. In digital broadcasting, there are however so many transmission resources available, that every commercially viable service should be offered on the market but also here the market power of a totally concentrated market can result in barriers and discriminations. Furthermore, the large companies involved in different media businesses are positioned optimally in the market as they can join advantages and synergy from their different media businesses, as the different contents in different media are similar and almost all media productions is performed using digital technologies. These scale and scope economics can result in a situation, where only few big companies control provision of broadcasting services on the market, and have influence on the variety of content available on the market. Terrestrial resources are regulated by national governments and therefore the problem of variety can be considered in the licensing process. The problem of concentration can occur in the satellite and cable networks. Here regulatory intervention can be necessary both to establish optimal conditions for competition and to establish content and rate regulations when local monopoly and duopoly are unavoidable (‘natural’). The large set-up costs and limited market, in the Nordic countries, has created a natural monopoly for digital satellite broadcasting, which is only just being threatened, by entrance of Viasat into the digital satellite market. Canal Digital has until recently been the sole digital service provider in the Nordic countries. Consequently, at the service provision level, the market for digital TV is highly concentrated. Also the analogue broadcasting market in the Nordic countries is (and has been) highly concentrated, where the same service providers, namely Canal Digital and Viasat are the only actors on the market. There are no ‘must carry’ rules in the satellite market, but due to the popularity of public service, the satellite providers in the Nordic countries are eager to having them in their line-ups. This is an example that indicates the highly concentrated market does not necessarily have anti-competitive performance. Digital cable TV market is also highly concentrated as, due to the high cost of digitalisation of cable TV networks, the markets in different countries are dominated by one or two cable TV providers. As seen in appendix II, digitalisation of cable TV is not started in Finland, In Sweden Telia (Com Hem) is the only network that is digitalised, and the market in Denmark

Chapter 8: Market development and funding Issues 169
is dominated by Tele Danmark cable TV and to less degree by STOFA cable TV. Also part of revenues from digital cable TV is canalised to Canal Digital and recently to Viasat resulting in an even more concentrated digital TV market. Terrestrial markets for digital TV are also highly concentrated at the service level in the Nordic countries. In Sweden and Finland due to selection of service-led organisation model, only one service provider operates in the terrestrial network. The difference between terrestrial and satellite/cable networks is, however, that the resources in the networks are assigned by national regulators and in the assignment process both societal preferences and variety of services can be considered. Also in the US the satellite and cable markets can be considered as being very concentrated. The satellite market is dominated by DirecTV and Echostar, and the top 5 on the cable TV market count for 68% of the total cable market (both analogue and digital). The terrestrial digital TV follows however the same market structure as analogue broadcasting, namely oligopoly market organisation at local and national levels, as the broadcaster-led / HDTV models are used for resource allocation.
8.2.2 Vertical integration / affiliation Due to, among others, end-to-end operation and maintenance of CA systems, it can be foreseen that some of the satellite and cable networks in digital broadcasting will be vertically integrated/affiliated in different degrees. The vertically integrated industry can establish barriers for competition in the market. If the implications of this vertically dependency are seen as a barrier for competition, regulation can be necessary. In the following the vertical integration is examined regarding the two actors on the Nordic satellite market (more details on other market actors are given in appendix VI).
Canal Digital. Canal Digital was founded in 19974 as a 50-50 joint venture between the French TV-group Canal Plus and the Norwegian telecommunications company Telenor. Canal Plus is the leading pay-TV channel in Europe with 13.6 million subscribers, while Telenor owns three satellites and has activities within cable TV, mobile phone networks and provision of Internet services. Canal Digital was established to target the Nordic region and has activities in Denmark, Norway, Finland and Sweden. It has 1.1 million subscribers out of which 280,000 are digital. 100,000 of these are Swedish digital subscribers. Furthermore, Canal Digital sells TV-commercials for the Nordic market that are to be shown on the international channels that Canal Digital distributes, such as CNN, Discovery etc. Furthermore, Canal Digital has a strategic alliance with SBS, as the SBS-controlled channels Kanal 5, TVNorge and TVDanmark are distributed in all of Canal Digital’s program packages, analogue as well as digital. Vertical Integration: Canal Digital is owned by a content provider, Canal Plus, and a infrastructure provider, Telenor.
Viasat. Viasat is owned by Modern Times Group (MTG) that is a media giant having activities in different media businesses in the Nordic region. MTG owns among others TV channels TV 3, TV 1000. Furthermore, Viasat does the marketing for the cable TV-network company Kabelvision, and has made a deal to provide the content for Kabelvision's network and several other cable networks. 4 Digital satellite service provision started first in 1998

Chapter 8: Market development and funding Issues 170
Vertical Integration: Apart from the channels outlined above, MTG owns the production companies Strix Television and Sonet. It also owns the properties company (rättighedsbolaget MTG Media Properties) and a number of firms that provide services to the TV corporations, such as SDI (subtitles and dubbing) and InTV (tele-text). So Viasat, through its parent company, is highly involved in both service and content provision. Vertical integration in the cable market (and also satellite market) in the US is analyzed in depth by David Waterman and Andrew A. Weiss5. This analysis shows a high level of vertically integration in these industries. However, the conclusion is not that these vertically integrated industries can be considered as barriers in the market development. The conclusion is that on the contrary the vertically integrated market has been necessary for the market development.
8.2.3 Competition between infrastructure Competition between satellite and cable networks will be intensified as more and more satellite service providers target their services directly towards end consumers. Cable networks will, on the other hand, continue their dependence on satellites, as more and more sources are needed to fill the increased capacity available in cable networks. The cost per household of digitalisation of satellite networks is lower than cable networks, making it easier to digitise satellite networks. Especially small cable networks will have a problem of financing to digitise their networks. Many small cable networks and SMATV networks will remain analogue long time from now. The important aspect regarding digital broadcasting is that terrestrial networks, when multi-service allocation is used, will be able to compete with satellite and cable on the end-user segment of the market. However, satellite networks will continue to be used as distribution networks by terrestrial networks and terrestrial networks will continue to feed the cable head ends. Consequently the interdependency between the three networks will continue to exist also in digital era. The competition aspect can however have radical impacts on the market development, as terrestrial networks due to their optimal reception characteristics are well positioned in this competition. In the HDTV allocation on the other hand, the available number of services in terrestrial networks in different markets remain ‘few’ compared to satellite and cable networks. This ‘few’ number of services does not give the terrestrial network the necessary conditions to be upgraded to multi-channel infrastructure, and compete with the multi-channel delivery forms, cable and satellite.
8.2.4 New models for service provision At a technological level it is possible in digital broadcasting, to target individual programs directly to the individual end-consumers. Currently the use of TV services in satellite and cable networks is based mainly on subscription to a group of programs called a bouquet. In analogue cable networks there is a technological reason to provide the programmes in bouquets, as the users access is maintained by using filters. A group of programs in a bouquet are located in a frequency spectrum such that access to them can be prohibited using a filter. As the filters do not have ideal characteristics (and also will impend transmission of part of neighbouring channels), using one filter per TV channel will waste immense resources in the cable TV networks. A technological trade-off has been grouping the services in the two groups (basic and optional bouquets).
5 See forexample: Waterman D and Weiss A. : “Vertical integration in cable television”, AEI, 1997.

Chapter 8: Market development and funding Issues 171
Also in analogue satellite, the concept of programme bouquet is deployed in the service provision. This is, however, not due to the pure technological reasons, as satellite service providers use encryption technology to maintain access that can be deployed individually on the programs. Programme bouquets are used partly due to the ease of organisation of subscription to a group of programmes and similarity with the way cable services are organised, and partly because the advertising financed services need a critical mass of viewers. Beside the subscription services to programme bouquets, individual programmes targeted towards end-consumers also exist in analogue satellite and cable networks. Here especially pay TV channels, containing movie or sport channels, can be acquired individually. In digital broadcasting also in terrestrial networks it will be possible to subscribe to a group of services or individual services. In digital broadcasting predefined programme bouquets, a la carte bouquet, and individual services will co exist even as it is technologically possible to sell services to the end-consumers individually. Also here the advertising financed services will rather be available in a program bouquet, due to the needed critical mass. The empirical evidences are deploying the bouquet concept in the digital line-ups of digital satellite and cable services (see among others appendix IV).
8.3 Conclusion The figures presented in this chapter on the development of market for broadcasting show a considerable growth of advertising and pay-TV market in the last 5 years. The enormous investments in different digital platforms and increasing number of commercial content providers and their availability in different platforms are among evidences for the likely continuation of this development in the future market. As seen, the licence fees have had much less growth compared to the commercial market. It is unrealistic to assume that in the future, the license fee can grow at the same rate as the commercial market. This will impact the market position of public service broadcasters in Europe. It is obvious that the national governments will protect the public service broadcasting, also in the digital future. This can be seen in the relatively high amount of resources allocated for broadcasting in the digital terrestrial networks in Sweden and Finland and the reservation of, so far, the only terrestrial multiplex in Denmark for the public service broadcasters. The relatively low growth of license fees compared to advertising and pay-TV market will put an economic pressure to maintain the status of public service broadcasters. It is difficult to give an unambiguous and unique answer to the funding of public service broadcasting in the future. License fee is a fair and, in the European case, traditionally accepted form for financing but the problem is that the public service broadcasters cannot compete with the commercial broadcasters if they base all their business on licence fees. The license fees can be increased and a ‘digital license fee’ will probably be accepted as it was with ‘colour TV license fee’ but the amount will be far from the necessary resources for public service broadcasters to hold their market position. Therefore other financing forms must be considered. Here, as mentioned above, both transfer from the commercial operators and establishing specific pay TV services beside the regular public service channels can be used. Provision of pay TV services must though be kept separate from the regular public service channels. Advertisement can also be used (and is used in the European public service), but there is danger of influence on the content, here sponsor contracts and banner advertisement on EPG, text TV etc. are more appropriate. Regarding the structure of the market for digital broadcasting it is showed in this chapter that service provision in the market is highly concentrated horizontally, and vertical integration can be identified in the industry. Cable TV is locally concentrated due to the natural characteristics of the network, also at national level the digital cable TV market is dominated

Chapter 8: Market development and funding Issues 172
by few actors due to the high costs of digitalisation. Satellite market is concentrated due to high costs of establishing the service provision. The terrestrial service provision is concentrated in the Nordic countries due to the selection of service-led multiplexing model. The difference between terrestrial and other delivery networks is the assignment of resources that is maintained by the regulators. And the problem of variety and barriers for competition that can occur in concentrated market / industries can be dealt with at the regulatory level. It is important to denote that purely because the industry is vertically integrated and the market is concentrated at service provision level, it cannot be concluded that the implications on market are anti-competitive behaviours. As seen, in the Nordic countries, there are a variety of services available on the market and the commercial satellite providers, on their own and without regulatory pressures, try to have public service broadcasters in their line-ups. Concentration of market can potentially result in barriers against competition. To what degree concentration can be considered as barrier to competition and, e.g., ownership regulations can be considered necessary, is, however, an empirical question. In the digital future the competition between infrastructures will also impact the market development, where terrestrial networks will, at least in the European countries, be able to compete with satellite and cable networks in providing a number of different types of programming. This is obvious in the current number and types of services in Sweden and Finland and their perspectives for the future. Also customisation of services and targeting services towards individual users in the process of approaching broadcasting services to private goods, will have impacts on the future of broadcasting market.

173
9. Emergence of new services and convergence
Digitalisation enables new possibilities for development and creation of services within and beyond the framework of traditional broadcasting. Services that go beyond the traditional broadcasting services, like Internet services, will have certain weight on the broadcasting market in the future, as demand for these services is obviously increasing looking at the penetration of the Internet. When the transmission capacity on the end-user site reaches the capacities needed for transmission of video services, Internet itself can be one of the platforms to carry interactive TV services. In short term, however, dedicated broadcasting delivery networks will be the major platform for provision of TV services to the end-consumers. These networks are optimised for broadcasting services and are able to transmit huge number of traditional TV services with high technical quality, and also new interactive services, to the end-users. As described earlier, this provision of services cross the traditional sectoral boundaries is considered as a part of the ongoing convergence process between telecommunication, Information Technology, and broadcasting sectors. The process of convergence can be identified at different levels of the value chain. In this chapter, however, the focus is on the convergence between Information Technology and broadcasting and primarily on the new data services that can be available on the broadcasting platforms and the possibility of provision of broadcasting services on other platforms like the Internet. To what degree the formation of the current communication landscape, consisting of three separate communication sectors (telecommunication, IT, and broadcasting) has been due to technological or political parameters is a complicated issue and out of the subject of this thesis. Different approaches to the problem have been presented in the literature. One of the recent, and detailed, analyses is presented by Dwayne Winseck1 in his analysis of Convergence, or what he calls re-convergence, of the Canadian communication market. In a historical sense, Winseck does not accept the convergence process being determined purely by technological parameters. According to Winseck “the distinction between telecommunications and other media, and the evolution of separate regulatory traditions for each, represented the outcome of strategic rivalry, collusion, and post hoc explanations aimed to “naturalise” the established state affairs” and not the pure specificities of technologies deployed in different sectors. Regarding the connection between convergence and digitalisation he says: “ Convergence is neither natural nor new. It is rather the process of an accumulation of political decisions that brought together and separated numerous communications instruments over the course of history. The coming together of computers and telecommunications today is just the latest version of a specific type of convergence, given form and power by the social choices in the neo-liberal business agenda that now governs so much of Canadian Society.” In the analysis of convergence process in this chapter the starting point is the current sectoral division in communication sectors. The subject of this chapter is then not a general discussion of convergence but the impacts of digitalisation of broadcasting on the possibility of provision of data services in broadcasting platforms and vice versa. This cross-sectoral service provision will, however, only be fulfilled and utilised due to the ongoing liberalisation, or what could be called the ‘convergence’ process at the regulatory level. The ongoing convergence process and the information economy in general pose a wide range of opportunities for communication and information gathering. But also a number of
1 Winseck D. :” Re-convergence, A political economy of telecommunications in Canada, Hampton press, 1998.

Chapter 9: Emergence of new services and convergence 174
challenges, including the risk of creating uneven access, for citizens, to the information carried by these new systems. Here broadcasting can play a major role in enabling access to the part of the population that stay out of information society. Broadcasting networks cover huge part of population (almost 100% in the industrialized countries), and people are used to use, for example, TV for gathering information. By creating usable interfaces, the data services can be consumed by practically any TV viewer. There are however, as described earlier, limitations on offering interactive data services in the broadcasting platforms. The consequences of these limitations are discussed in this chapter. The subject of this thesis is digital broadcasting, where the development of broadcasting has been analysed with focus on digitalisation of broadcasting. As described through this thesis, digital broadcasting conforms to dedicated standards to carry traditional broadcasting and new audio/video/data services in the broadcasting platforms. The development will however go further, and according to for example Eli Noam2, the development will go from the current multi channel systems to the future Mega channel systems, where current TV systems will be replaced by Internet / Cyber TV. Internet TV is not the subject of this thesis, but obviously there are several pre-conditions that must be fulfilled before Internet TV can replace the current broadcasting industry. The problems that Internet TV faces in the future are discussed shortly in this chapter. In the following, the services available on digital TV platforms on the Nordic market are outlined shortly, and the level of new and innovative services in different platforms is analysed. Then problems around provision of Internet on the TV and TV on the Internet are discussed. Finally some regulatory implications of convergence are identified and discussed.
9.1 New services in digital broadcasting platforms The services available in digital platforms in the Nordic countries are given in appendix IV. As seen, the increased capacity is used to increase the number of traditional TV services in different digital TV delivery platforms. Furthermore, new advanced types of audio/video services are provided in different platforms. In the following some samples of available services in different platforms are given. As examples, the services in the terrestrial network in Sweden, and the services available in the satellite and cable networks in Denmark are outlined. More detailed description of these services and other services available in these three countries can be found in appendix IV. Table 9-1 shows services available in the Canal Digital’s and Viasat’s line-up.
Channel type Number in type Comments
Non-subscription 7
DR2, Viasat Interactive services, TV2 Zulu, DR1, TVDanmark1, TVDanmark2, Canal Digital Interactive services
News 7 BBC world, Bloomberg, Sky News, CNN, CNBC, Sky News, BBC world
Entertainment
11
Four channels from TV3, Hallmark, TV6 Action, ZTV, Viasat Plus, Eurotica (also as stand-alone: DKR 69), Adult channel, Cinecinemas(also as stand-alone DKR 69), BBC Prime
Sport 3 VIASAT Sport, Eurosport News, Eurosport Nordic
2 Noam E. M.: “Towards the Third Revolution of Television”, presented at the symposium on “productive regulation in the TV market”, Bertelsmann Foundation, 1995

Chapter 9: Emergence of new services and convergence 175
Documentaries 10 History Channel, Travel Channel, TV6 Nature, Four from Discovery Channel, Adventure One, National Geographic, [.tv]
Kids 5 Nickelodeon, Fox Kids, Cartoon Network, TCC, TCM
Music 4 MTV, VH-1, Multi-music (10 channels), Music Choice (20 channels)
Premium movies 6 TV1000, Cinema, Playboy TV, Three channels from Canal+
Pay-per-view 2 Ticket, KIOSK
Stand-alone premium
Channels
5 TV Finland, NRK International, Manchester United, ORT International, Two channels from Prime TV
Table 9-1 Services in the digital satellite network in Denmark In September 2000, Canal Digital and the interactive TV-channel eTV announced a three-year contract that outlines a joint effort to introduce a new interactive service. Canal Digital will have the exclusive satellite distribution rights, and it is based on the interactive features e-TV launched in Sweden (see below). The service will be introduced in the beginning of year 2001, and will cover the entire Nordic region. In late 2000, VIASAT plans to invest more than € 80 million on interactive digital TV in order to become the dominant digital provider in Scandinavia. This will be realised by Viasat’s plan to give away around 350.000 set top boxes to the existing subscribers of premium packages in Sweden, Norway and Denmark. 70.000 of these are targeted to Danish subscribers. Another attempt to strengthen the digital presence is undertaken by Viasat’s parent group Modern Times Group (MTG), by launching the Internet portal Everyday.com in July 2000. Everyday.com is a joint project with Netcom and it is going to be introduced on Viasat’s digital platform as Everyday.TV. The solution is modeled after the British SkyTV’s interactive portal for digital TV. This means that viewers will have access to the following interactive services:
- e-mail, chat rooms and SMS - EPG (Electronic Program Guide) - news, sport and weather - games - on-line shopping - interactive commercials
The movie channels TV1000 and Cinema expand to six channels to enable viewers to see the movies at different times (NVOD3), a service type that has been used in Canal Digital’s Kiosk concept since 1998. NVOD is also used in other areas such as sports, where Canal Digital in one of its innovative services transmitted different camera angles of a formel-1 final in parallel. The user could then decide which camera angle he or she wanted to follow. Table 9-2 shows the services available in the Tele Danmark’s digital cable TV.
Channel type Number in type Comments
3 Near video on demand

Chapter 9: Emergence of new services and convergence 176
Non-subscription 8
DR1, DR2, TV 2, Two regional programmes, two foreign public service channels, Infokanalen
News 4 Bloomberg, WorldNet, CNBC, Sky News.
Entertainment 5 [.tv], E!, TCM Classic Movies, Hallmark, Adult Channel, KIOSK
Documentaries 2 National Geographic, Travel channel
Lifestyle 3 Arte, Fashion TV, MCM International
Kids 3 Fox Kids, Nickelodeon, Cartoon Network
Music 4 MTV 2, VH-1, Muzzik, Performance
Stand-alone premium
Channels
5 Three from Canal+, two from TV1000
Table 9-2 Services in the digital cable network in Denmark Furthermore, a number of services targeted towards minorities are available in the Tele Danmark’s cable TV, given in the following box.
Services in other languages in Tele Danmark’s digital cable TV: Turkish (4 TV & 3 radio), Balkan (6 TV & 4 radio), Italian (4 TV & 3 radio), French (4 TV & 3 radio), Spanish (4 TV & 3 radio), Asian (2 TV & 3 radio), Arabic (4 TV & 3 radio) & Tamil (1 TV & 3 radio)
The interactive services from Tele Danmark are called I-TV and comprise of on-line services provided by the public service channel DR-TV, a TV Guide, on-line browsing of products, e-mail services, and chat-rooms. The DR-TV services includes overview of programs, access to on-line news and weather, and information regarding cultural arrangements. The TV Guide provides a search function and a description of each program, which gives direct access to the relevant program. The ‘Nu&Næste’ (Now&Next) function displays information concerning the program being watched. It shows the title, when the program commenced and when it will finish. Further, it can show the same information for other channels together with the title of the channel number and the current time. The intention is that this function will allow for ‘zapping’ without actually changing channels. The on-line browsing services include at present the D-I-Y chain Silvan, the on-line clothes retailer Ellos, Travel market and the booking agency BILLETnet. At present, these allow for browsing only, while transactions have to be carried out over the telephone or the Internet. The e-mail is facilitated using regular POTS network and the service is similar to the SMS text messages on mobile phone (no attachments are accepted). According to Tele Danmark, the chat service is amongst the first in the world. It allows viewers to access Selector chat rooms, as well as Internet chat rooms. Finally, the services also include pay-per-view movies. Table 9-3 shows the services available in the terrestrial network in Sweden.

Chapter 9: Emergence of new services and convergence 177
Channel type Number in type Comments
Free to view 10 SVT 1, SVT 2, SVT 24, SVTRegional, TV4, TV 4 Regional, eTV, Skånekanalen, K-world.
Primary channels 5
TV3, TV 8, ZTV, VIASAT Sport, Kanal 5
Currently these are are provided free of charge, but this is only temporarily
Premium channels 5
3 from Canal+, TV1000, NollEttan Television
Table 9-3 Services in the digital terrestrial network in Sweden
So far the Swedish digital terrestrial network consists of four multiplexes, where as seen in the table, apart from traditional broadcasting services, new narrow types and special services are available on the market. e-TV is one of the first interactive services, where viewers can purchase e.g. CDs, watch music videos and get up to date weather forecasts.
9.1.1 Innovative services As seen in this subchapter, digitalization of broadcasting has changed broadcasting landscape in several ways:
• The number of traditional services in different platforms is increased. This has, among others, caused more focused types of services, like specialized news (SVT 24), financial services (TV8), and premium pay-TV services (like Canal+), also to be available in the terrestrial network.
• New types of services like NVOD and interactive shopping services are available in the satellite and cable networks. Furthermore several special services, like weather channel, travel channel, etc. are available that give in depths information in different areas.
And
• New services like e-mail, browsing in limited Internet pages (like DR online), chat rooms, on – line shopping and interactive advertising and entertainment are either available or will be available soon.
Especially the last types of services are interesting in relation to convergence process. As seen in the following, however, several interactive services are provided using other infrastructures, like POTS network, and they only use TV as presentation and interface equipment.
9.2 Internet on TV, a solution to information divide Penetration of TV is much higher than PC in the industrialised countries. Providing interactive services, including Internet, on TV can potentially benefit especially the ‘information poor’ and thus reduce the ‘information gap’ in the society. This is an important implication of the convergence, as a part of the society will only benefit form the new values of the information society if they receive the data services on TV. As described earlier in the chapter on technology of broadcasting, there are two ways of providing Internet services to be used on TV, namely Out Of Band (OOB) and In Band (IB)

Chapter 9: Emergence of new services and convergence 178
structures. The provision of Internet on TV in OOB structure is implemented through the alternative forward path that is implemented in parallel to return path, where in IB structure the downstream part of Internet services are transmitted within the MPEG-2 transport stream. Several new interactive services provided on the market use OOB structure. In this case the problem is not about broadcasting delivery networks and their possibilities to offer interactive services, as they are not used at all. The TV is connected through a modem to, e.g., regular telephone network and all communication goes through this network. From the network side, the situation is exactly the same as when a PC is connected to the network. This is however important, as it enables the households without PC, or members of a household who do not use PC, to use interactive services like WEB browsing and E-mail. Furthermore it integrates different information services and traditional and new broadcasting services on the user site, and enables a convergence at the end-user terminal part of the value chain. In the IB structure the interactive signals are transmitted alongside with other broadcasting signals. Here broadcasting infrastructures are used to carry the interactive service downstream and the TV (PC, VCR, etc.) is used to present the service to the user. The convergence happens both at infrastructure part and at the end user part of the values chain. Here, the characteristics of the broadcasting infrastructures that have been described in detail in previous chapters will have a decisive role on the available services. Especially the amount of available transmission capacity per household and the availability of integrated return path will have vital impacts on the services available in these networks. As mentioned earlier, even when the amount of capacity per user is low, as it is in terrestrial and satellite networks, it is possible to use the characteristics of broadcasting infrastructures and, e.g., broadcast selected pages from Internet to general public in the terrestrial network. This will enable all the consumers of terrestrial TV to use some information from Internet. More sophisticated interactive services will be developed especially for broadcasting networks based on their characteristics of one-to many structure, few transmission resources, and lack of integrated return path in the terrestrial4 and satellite networks. The important thing here is, whether OOB or IB structures are used to provide interactive services, this will extend the possibility of accessing to new and innovative information services and help diminishing the gab between different information classes in the society.
9.3 TV on Internet As mentioned above, TV on Internet, also called Internet TV/WEB TV/Cyber TV can be the future of broadcasting. A precondition for the WEB TV to be able to replace digital TV is that the transmission capacity at the end users site increases to such level that it can be possible to provide digital TV services. The capacity necessary to provide digital TV services is very high (HDTV about 20 Mbit/s and SDTV about 4 Mbit/s). By using a simple assumption that two or three services must be available for a households (different family members must have the opportunity to watch different programmes, at the same time, and be able to record a program on VCR), the necessary capacity will increase to about 40/60 Mbit/s in the case of HDTV and 8/12 Mbit/s in the case of SDTV. In 1997 in a paper on “Bandwidth capacity and demand co-evolution in interactive services” we tried to give a realistic approach about the available capacity and its development at the end users site. The state of the art modems and their break through was depicted in different years from 1987 to 1997 (see Figure 9-1).
4 As described earlier, DVB is developing standards for return path in the terrestrial networks.

Chapter 9: Emergence of new services and convergence 179
1997 1995 1993 1991 1989 1987
Modem speed bit/sec
1,2k 2,4k
4,8k 9,6k
14,4k 28k
34k 56k
128k
0,5M
1999 2001 2003
64kb/s (voice connection)
Figure 9-1 The available capacity at the end users site What is evident from the figure is that the capacity at the end users site evolves quite slowly and reaching the extreme figures of 40/60 Mbit/s or the more liberal requirements of 8/12 Mbit/s at the end users’ site can be, at best, considered as a long term possibility. The increase of the capacity at the end-users site in the telecom networks is a complicated issue that involves deploying new technologies in the access network and at the same time upgrading the core networks. For long time to come the broadcasting networks with their one-to-many structure will be the most optimal way of transmitting broadcasting services to the end user. Even when we reach the time when the capacity is available to provide broadcasting services over Internet other parameters like the way services are used can impend provision of them over Internet. For example, if a service is used by the majority of people, it is waste of resources to provide it through a switched/routed network, as it easily can be broadcasted to all people using broadcast networks. A scenario can be that WEB TV co-evolves with digital TV and exists as a complementary and competitive platform to other delivery networks. As a complementary platform, special type of services that will not be feasible to be provided on other platforms can be provided on the Internet. And as competitive platform services like special narrow types of services provided on cable and satellite delivery networks can be provided on the Internet and compete with these infrastructures.
9.4 Regulatory implications Different communication sectors have traditionally been regulated by different acts and also by different institutions. As seen in the following, the convergence process will require not only adjustment but also rethinking and redesign of the whole regulatory framework. Different aspects are connected to having separated regulatory frameworks. It can, for example, be necessary to have common rules to regulate different services regardless which platform they are provided on. The same services can be provided in the terrestrial networks, on the Internet, and/or in a dedicated telecommunication / IT network. Having different regulatory frameworks in different sectors can be inefficient in long run. Another important aspect is that convergence process enables synergy between different sectors. This synergy will only be unutilised when the convergence also occurs at the regulatory level.

Chapter 9: Emergence of new services and convergence 180
These are only some parameters that identify that even when the technological possibility for further development is there, the regulatory and political parameters play a vital role to make it possible to utilize the new possibilities.
9.5 Conclusion Convergence is not just about the technology but the technology is a vital factor in the process of convergence. Digitalisation of broadcasting has created the possibility to provide other than traditional services in the broadcasting networks. This enables different information services to be integrated in the broadcasting networks making broadcasting platforms evolve form a medium for provision of one-way information and entertainment services to mass users, to an interactive platform where both traditional audio video services and new innovative services are provided. In long run, the direction of development can go the other way and, for example, Internet becomes the integrator and all services, including broadcasting services, get provided on the Internet. This long-term perspective has not been the subject of this project. The short-term perspective of the possibilities of providing data services on the broadcasting networks, however, will have vital impacts on development of broadcasting market, and on the whole communication market. The convergence process enables new business opportunities and business models. Actors doing Internet and electronic commerce business can by modification of their service adopt them to the digital broadcasting platforms and increase their consumer base rapidly. Also in the business-to-business sector, broadcasting platforms have optimal characteristics when the same types of services must be provided to many receivers. For example the big retailer chains can download new prices for their products in the supermarkets distributed in a big geographical area. This kind of service that broadcasts the same content to multiple receivers is optimal in the broadcasting networks. The data in this chapter shows that the actors in the broadcasting market consider the possibilities for provision of new and innovative services in broadcasting platforms to be very important, and already a number of new services are provided on the market. As seen in this chapter and throughout this thesis, the technological development in broadcasting, including digital broadcasting can be identified as the major parameter that has created the possibilities for new market development in broadcasting. These new possibilities will, however, only be utilised if the political regime establishes the necessary regulatory for it for it. When data services are provided on the broadcasting network that are primarily regulated due to cultural issues, and when broadcasting services are provided on the Internet that is unregulated, then a regulatory conflict occurs. The way this conflict is solved will have vital impacts on the future communication landscape, including the broadcasting market.

181
10. Conclusion The aim of this project has been to identify the driving forces and barriers in the development of the broadcasting market as an ICT-based knowledge intensive service sector. This point of departure has led to an interdisciplinary approach as the methodology of the thesis, where the impacts of the technological, political and economic parameters, and their interrelation, on the development of the broadcasting market has been analysed. Furthermore, in the analysis, a comparative approach is deployed, where the broadcasting market and its development is studied in Europe and the US. As seen, both the interdisciplinary and the comparative methodologies have been powerful tools in the analysis,
• as regarding the interdisciplinary approach, it is shown throughout the thesis that development of broadcasting has been determined by a combination of technological, political and economic parameters in different phases of its development.
• as regarding the comparative approach, the different regulatory frameworks imposed on broadcasting in the European countries and the US have created different framework for the development of broadcasting in these two markets, giving the possibility for identifying to what degree different parameters have influenced the development at different phases of the development.
The thesis contains two parts. The first part contains analysis of the regulatory framework, economy, and technology of broadcasting at a theoretical level. The second part contains an empirical analysis of digital broadcasting with respect to: resource issues, access issues, new business models and funding issues, and emergence of new services and the convergence process.
10.1 Economy At a theoretical level, it is shown in this thesis, that in the situation with few resources available in traditional broadcasting, the market on its own could not meet all consumers’ demand. It can further be concluded that when resource scarcity is removed and the market is large enough then the consumer’s preference spectrum can be covered by the market. There will especially in small markets remain a funding problem for provision of a narrow type of programming. As it can be seen throughout this report, in the light of different levels of technological development and development in the political set-up, other organisation and funding forms have been implemented to cover the program types that will not be served in a market-oriented solution. Furthermore, it is shown that even when the transmission resource scarcity is removed, other market failures result in non-optimal performance of the market on its own. At a theoretical level, it is proved that due to public good characteristic of broadcasting as well as externality and other market failures, the regulation of broadcasting in Europe and the US has been necessary and can to some extent be justified in the future. It is also shown that the ‘natural monopoly’ characteristic of the broadcasting market has influenced the formation and development of the broadcasting market, regardless of the regulatory framework. Furthermore it is shown that the pre-conditions for public good and ‘natural monopoly’ characteristics of the broadcasting services have changed, and broadcasting services have developed towards Club / private goods, and broadcasting market structures have developed towards more competitive market structures.

Chapter 10: Conclusion 182
10.2 History The history of broadcasting in this thesis is divided in three main phases prior to digital broadcasting. These are: 1) the initial phase of traditional broadcasting model, 2) the developed phase of traditional broadcasting model, and 3) the modern market-oriented broadcasting model. In the traditional broadcasting model, two major aspects related to regulation and organisation of broadcasting can be seen in both European countries and the US, one is the necessity of regulation, the other the way regulation is performed:
• The specific characteristics of the technology of broadcasting have been the major reason for posing regulations on provision of broadcasting services.
• A combination of content related political considerations and the economic specificities of the service determined the actual formation of regulation and organisation of broadcasting.
In the beginning of broadcasting history, broadcasting services were totally unregulated. The situation got chaotic, however, and it was almost impossible to establish service provision in the market, due to the technical problem of interference. It was not possible to solve the problem of interference at a technical level; therefore both in Europe and in the US, regulatory interventions were introduced and the frequency resources were assigned to different service providers so interference was avoided. The method of establishing national regulation agencies to assign the resources, provide license to some users, and recall them or intervene politically if some assumption were not met was, however, a political choice. Another solution could be to consider frequency resources as another production factor that could be traded on the market. The interference problem could then be solved by the private property protection regime. So while interference was a technical parameter, the chosen methods of regulation were not the only solutions. In the models used for assignment of resources and organisation of the service provision, other parameters than the technological parameters were decisive. Content provision was considered to have political importance, as it had major impacts on society; consequently, governments considered it as necessary to control the medium by establishing assignment processes for the frequency resources and imposing different types of obligations on the content providers. Also here the technology that was deployed in production and consumption of the service had vital relevance. Broadcasting services were based on audio and later audio/video that was consumable by everybody; children as well as adults, and illiterate as well as literate. Furthermore, the distribution technology made it possible to give the major part of the population easy access to the service. The coverage and the ease of use, in combination with content that could consist of information, news, debate, education, etc. were among the reasons for the political importance of the services. The later development of traditional broadcasting in the European countries was tightly controlled and driven by the national governments, based on political considerations. The development, in the European countries, can be characterised mainly by going from state monopoly to a broadcasting regime, where the broadcasters had a more independent status related to the governmental institutions, and by going from a monopoly market structure to duopoly and oligopoly market structures in some markets. Some of the new actors in the market were other public service stations and some of them were pure commercial broadcasters.
In the US because of the existence of a national advertising market, countrywide networks were created. As the ownership regulations limited the number of local stations a person or entity could own, national networks emerged by a combination of ownership to local stations

Chapter 10: Conclusion 183
and affiliation with others. The number of these national networks remained limited for a long time; two in the first couple of decades of radio and three when TV was invented. The domination of the two and later three national networks in an oligopolistic market structure is the same as in many European countries.
The regulatory framework of broadcasting was different in Europe and the US, with the political control driving the development of broadcasting in European countries, and commercial interests the US. But the two markets ended up in almost the same market structure, where few broadcasters had the dominant market position. The technological parameters were important at the starting point but they were also important in development of the market. Even if the political factors had not been so decisive in the European countries as they were, the technological characteristics and the market for broadcasting would limit the number of actors in the market. The political factors had vital influence on the societal role of broadcasting and the provided content has been totally different in the two markets, but the organisation of the market has also been determined by the technical and technological parameters.
The market structures in the two continents became similar due to technology of broadcasting resulting in natural monopolies. The content provided on the two markets developed, however, in totally different directions; in the US the content was driven by maximisation of advertising revenues and consequently covered mainly the popular part of the preference spectrum, while in the European countries the content was determined by societal obligations formulated by the national governments.
In the era of the modern broadcasting model, the available transmission resources increased due to emergence of new infrastructures and the ‘natural monopoly’ characteristic of broadcasting service industry was removed (or strongly diminished) at a technical level. This was mainly due to emergence of satellites and their use in broadcasting. Satellite providers established cost efficient distribution systems. Consequently, countrywide terrestrial networks could be established in a cost efficient way and the SMATV systems and cable networks could be connected together and cover large geographical areas and increase their consumer bases substantially.
Another development was the transformation of broadcasting services from a pure public good to club goods, as it was possible to exclude people from using the service at a technological level, by development of cable networks and the use of encryption/ decryption technologies. This implied the possibility of establishing other business models and, for example, to sell the services directly to the consumers.
These technological developments alongside with political liberalisation of broadcasting in the modern broadcasting era influenced the market development in radical ways, a.o.:
• It became easier to establish countrywide terrestrial networks; consequently new networks emerged, e.g., in the US
• It became easier to establish large cable networks, consequently a number of broadcasters started programming that were only available in the cable and satellite networks.
• It became possible to import signals from distant areas and fill the resources available in the cable networks.
• Satellite providers also began targeting their services directly towards end- consumers in the Direct To Home market.
The new broadcasting model that emerged afterwards can be characterised as.

Chapter 10: Conclusion 184
• A transformation of broadcasting services from public to club/private goods.
• Expansion of transmission resources and the use of market oriented allocation mechanisms in the new infrastructures.
• Availability of different quality programs in the large markets, like the US, without the necessity of posing specific content requirements / regulations.
• Internationalisation of broadcasting service provision.
10.3 Digitalisation Digitalisation of broadcasting is the continuation of the modern broadcasting model, however, with radically new possibilities for the market development. Therefore digitalisation is considered a new phase in the development of broadcasting in this thesis, namely the digital broadcasting model. Digitalisation of broadcasting will enable further possibilities for market development and organisation, but also create new barriers and political challenges in the development.
One of the important outcomes of digitalisation of broadcasting has been implications on the resource issues, a.o., the expansion of the transmission resources for broadcasting due to more efficient utilisation of available resources. Up until the digital broadcasting era, the increase in the available resources occurred primarily due to emergence of new infrastructures like cable/satellite networks and development of technology enabling utilisation of unused resources in these networks. This was done for example by increasing the available transmission capacity in the terrestrial networks by making use of UHF frequencies, and in cable and satellite networks by expanding the deployed frequency resources. The increase of transmission resources is however not the only aspect of digitalisation of broadcasting that impacts the market development. There are three other major aspects of digitalisation of broadcasting, analysed in this thesis, with vital implications on market development, namely new access conditions, new business models and funding forms, and the ongoing process of convergence. These four different aspects of digital broadcasting are analysed and it is shown, that the technological possibilities in digital broadcasting can only be utilised efficiently when the organisation and allocation of resources are performed optimally. It is further shown that regulation will be necessary also in the digital era, partly to ‘correct’ the possible ‘lock-in’ situation and other structural and technological created barriers on the digital broadcasting market, and partly due to the cultural and language related considerations in small nations, where the available market will not necessarily result in coverage of consumers’ needs and wants in a pure market-oriented model. The development in the modern, multi-channel, era of broadcasting and later in digital broadcasting has been towards internationalisation of markets, where the scarcity of content / talent, scale and scope economies, and the huge consumer base on the international market, once again tend to lead to concentration of the available resources in the hands of few actors, this time on the international market. The increased transmission capacity is in this way not likely to result in greater variety, but will contribute to strengthen the market position of these few actors, who operate beyond the frameworks of the national regulations. This may be seen as giving possibilities to create terrestrial network in the small countries. If states create competitive markets at a national level, the national actors are given the possibility to survive on these niche markets. The national actors can then continue to develop programming that reflect the wants and needs of citizens in the small nations,

Chapter 10: Conclusion 185
basing their programs on a cultural political agenda rather than the international profit maximisation agenda. This implies, however, that the national governments go against the general political development that has opened up the national markets and facilitated internationalisation.

186
11. References Alexander A., Owers J, and Carveth R. (1998). Media economics- theory and practice. Lawrence Erlbaum Associates, inc. publishers.
Albarran A. B. (1996). Media Economics – understanding Markets, Industries and Concepts. Iowa State University Press.
Andersen Management International (AMI) (1999). A report on digital decoders and cable TV – prepared for the Ministry of Research. Denmark, 1999.
Arrow K. (1962): Economic Welfare and the Allocation of Resources for Invention. In ”The Rate and Direction of Inventive Activity: Economic and Social Factors”, Princeton University Press.
Avery R.K. (ed.) (1993). Public Service Broadcasting in a multi-channel environment. Longman publishing group.
Bagdikian B. H. (1997). The media monopoly. Boston, Beacon Press, fifth edition.
Baldwin T. F., McVoy D. S., Steinfield C. (1996). Convergence- integrating media, information and communication. SAGE Publication Inc.
Beebe, J. H. (1977). Institutional Structure and Program Choice in Television Markets. Quarterly Journal of Economics 91, P 15 – 37.
Brinkley, J. (1998). Defining vision- the battle for the future of television. Harcourt brace & company, New York.
Bruin R. and Smith J. (1999): Digital Video Broadcasting- Technology, Standards, and Regulations. Artech House Publishers, Boston . London.
Buchanan J.M. (1965). An economic theory of clubs. Economica, 32, 1 - 14.
Buchanan, J. M. (1967). Public good in theory and practice; A note on the Minasian Samuelson discussion. Journal of Law and Economics X (Oct. 1967), P 193 – 97.
Carter T. B., Franklin M. A., Wright J. B. (1986). The First Amendment and the Fifth Estate. The foundation Press New York.
Center for Tele-Information (CTI) (1999). Investigation of piracy decoder cards. DTU, CTI.
Coase R. H. (1948). British broadcasting, a study in monopoly. London school of economics and political science.
Coase R. (1959). The federal Communication Commission. The journal of Law & Economics, October.
Coase R. (1990): The Problem of Social Costs. Published in “The Firm, The Market and The Law”. Chicago, 1990.
Coase R. H. (1993). The nature of the firm. Published in Williamson O.E. and Winter S. G (ed.): “The nature of the firm- origins, Evolution, and Development “,Oxford University press.

Chapter 11: References 187
Originally published in1937.
Cornes R. and Sandler T. (1986). The theory of Externalities, Public Goods, and Club goods. Cambridge University Press.
Dambacher P. (1997): Digital Terrestrial Television Broadcasting- Designs, system and operation. Springer.
Demsetz, H. (1970). The private production of Public good. Journal of Law and Economics XIII (Oct. 1970), P 293 – 306.
European Broadcasting Union (EBU) (1998). Difficult to be easy - the Electronic Programme Guide. BPN 015, January 1998.
Ericsson Telia (1998). Understanding telecommunications. Telia, Sweden.
European Commission (EC) (1997). Green paper on the convergence of the Telecommunications, Media and Information Technology Sectors, and its Implications for Regulation. Towards an Information Society Approach. Brussels: European Commission, DG XIII A4 and DB X C1. (COM(97)623).
Evans B. (1995). Understandingg digital TV- the route to HDTV. IEEE PRESS.
Evain J. P. (2000). The Multimedia Home Platform- an overview. EBU Technical Department.
Federal Communication commission (FCC) (1999). Spectrum agreement on banc hearing. Washington D.C, April 6, 1999.
Fuglsang L. & Tadayoni R. (2000). International trade with and exchange of news for television as a case of innovation in services. SIC project, Roskilde University, Denmark, 1997-2000.
Gallup, (2000). Gallup TV-meter – årsrapport (annual report) 1999. Gallup, Copenhagen.
Galperiri H. & Bar F. (1999). Reforming TV regulation for the digital era: an international/cross-industry perspective. Presented at the 27th Annual Telecommunication Policy Research Conference, September25-27, 1999
Garnham N. (1999). Amartya Sen’s ‘capabilities’ approach. In Burgelman J. C. & Calabrese A.: “Communication, Citizenship and social policy”, London, 1999.
Gerbarg D. (ed.) (1998). The economics Technology and content of digital TV. Kluwer Academic Publishers.
Ghanbari M. (1999): Video coding, an introduction to standard codecs. IEEE, 1999
Henten A. (2000). Implication of Information and Communication Technologies for The International Distribution of Labour. SIC project, Roskilde University, Denmark, 1997-2000.
Henten A & Skouby K.E. (2000). Internationalisation of Services - Implication of Information and Communication Technologies. SIC project, Roskilde University, Denmark, 1997-2000.
Hoffmann R. W. (1996). Regulating Media. The Guilford Press, New York and London.

Chapter 11: References 188
IDATE (2000). Digital TV study in Europe. IDATE, 2000
Ileris S. (2000). Skills in Services: A Study in Denmark. SIC project, Roskilde University, Denmark, 1997-2000.
Independent Television Commission (ITC) (1997). Code of conduct on Electronic Programme Guide. ITC, June 1997
International Telecommunication Union (ITU) (1999). A planning guide for digital television: Contribution and distribution networks. Geneva.
Johansson P.O. (1991). An introduction to modern welfare economics. Cambridge University Press.
Johnson L. L. (1994). Towards competition in cable television. MIT press.
Larsen N. J. (2000). Knowledge-intensive business Service in the Danish economy. SIC project, Roskilde University, Denmark, 1997-2000.
Ledbetter J. (1998). Funding and Economics of American Public Television. In Noam E.M. and Waltermann J. (ed.) (1998).
Leduc J. P. (1994). Digital moving pictures, coding and transmission on ATM networks. Elesvier.
Madox B. 1972. Beyond Babel, new directions in communications. Simon and Schuster, New York.
Minasian, J. A. (1964). Television pricing and the theory of Public good. Journal of Law and Economics VII (Oct. 1964), P 71 – 80.
Mueller M (1993). Universal Service in Telephone History: a reconstruction. Telecommunications Policy 17, 5 – 352-69.
Neuman W. R., Mcknight L and Solomon R. J. (1998). The Gordian Knot- political gridlock on the information highway. MIT Press, Cambridge, Massachusetts, London, England.
Neuman W. R. (1998). Broadcasting and Bandwidth. Published in Gerbarg D. (ed.) (1998): “The economics Technology and content of digital TV”, Kluwer Academic Publishers.
Newall C. (1992). Synchronous Transmission Systems. Northern Telecom Europe.
Noam E. M. (ed.) (1985). Video media Competition. Columbia University Press, New York.
Noam E. M. (1991). Television in Europe. Oxford University Press, New York.
Noam E. M. and Millonzi J. C. (ed.) (1993): The International Market in Film and Television programs. Alex Publishing Corporation, New Jersey.
Noam E. M. (1995). Taking the next step beyond the spectrum auctions: Open spectrum access. CITI, Columbia university.
Noam E. M. (1995). Towards the Third Revolution of Television. Presented at the symposium on “productive regulation in the TV market”, Bertelsmann Foundation, 1995

Chapter 11: References 189
Noam E. M. and Waltermann J. (ed.) (1998). Public Television in America. Gütersloh: Bertelsmann Foundation Publication.
NVISION (1999). More engineering guidance for digital transition. NVISION, USA.
O’Leary S. (2000). Understanding Digital terrestrial Broadcasting. Artech House.
Owen F. F. E. (1982). PCM and Digital Transmission Systems. Texas Instruments Electronic Series.
Pedersen M.K. (2000). Professional business service Innovation: A distributed Knowledge approach. SIC project, Roskilde University, Denmark, 1997-2000.
Petersen J. H. (2000). Welfare and market. Odense Universititsforlag.
Picard R.G. (1989): Media economics-concepts and issues. Sage publication.
Poltrack D. F. (1983). Television Marketing, Network/Local/Cable. New York: McGraw-Hill.
Prentiss S. (1985). Television from Analogue to Digital. TAB Books, Inc.
Riley M. J. and Richardson I. E. G. (1997). Digital video communications. Artech House, London.
Rothenberg , J. (1962). Consumer Sovereignty and economics of TV programming. Studies in public communication, IV (Fall 1962), P 45 – 54.
Rzeszawski T. S. (1995). Digital Video, Concepts and applications across industries. IEEE Press.
Samuelson P.A. (1954): The Pure Theory of Public Expenditure. Review of Economics and Statistics. Vol. 36, p.387-89.
Samuelson P.A. (1955): A Diagrammatic Exposition of a Theory of Public Expenditure. Review of Economics and Statistics, Vol. 37, p.350-56.
Samuelson, P. A., (1964). Public good and subscription TV. Journal of Law and Economics VII (Oct. 1964), P 81 – 83.
Sen A, (1999). Choice, Welfare and Measurement. Oxford, 1982.
Sen A, (1999). Commodities and capabilities. New Delhi, 1999.
Septrup P. (1993). Scandinavian Public Service Broadcasting. The case of Denmark. In Avery R.K. (ed.) (1993).
Sharkey W. W. (1982). The theory of natural monopoly. Cambridge University Press.
Schere F. M. (1980). Industrial Market Structure and Economic Performance. Chicago: Rand Mcnally.
Shelswell P. (1995). The COFDM modulation system: The heart of digital audio broadcasting. Electronic & Communication Engineering Journal, 1995, PP. 127 – 136
Smith A. (1952). An Inquiry into the Nature and cause of the wealth of Nations. Encyclopedia

Chapter 11: References 190
Britannica (original book published in 1776).
Spence, A. and Owen, B., (1977). Television programming, Monopolistic competition and welfare. Quarterly Journal of Economics 91, P 103 – 26.
Steiner P. O., (1952). Program patterns and preferences and the Workability of Competition in Radio broadcasting. Quarterly Journal of Economics 66, P 194 – 223.
Sterling C.H. and Kittross J. M. (1990): Stay tuned: A concise History of American Broadcasting. 2nd ed., Belmont, CA: Wadsworth.
Sundbo J. (2000). Innovation in services – Denmark. SIC project, Roskilde University, Denmark, 1997-2000.
Tadayoni R., Magnussen, A. (1998). Bandwidth Capacity and Demand Co-evolution in Interactive Services. Paper presented at International Telecommunication Services conference (ITS98), Stockholm, June 21-24.
Tadayoni R. & Christensen T. (1999). Universal Access in Broadcasting: Solving the Information Problems of the digital age? The paper was presented at INET99. San Jose, summer. INET is the annual conference held by ISOC (Internet society).
Tadayoni R., Skouby, K.E. (1999). Terrestrial digital broadcasting: Convergence and its regulatory implications. Telecommunications Policy, March.
Tadayoni R., Henten, A. (1999). Public service broadcasting in a digital age. The paper was presented at ITS European Conference, Turin, September.
Tadayoni R., Henten, A. Skouby K. E. (2000). The future of public service broadcasting- finansing broadcasting in digital age. The paper was presented at ITS international Conference, ITS 2000, Bouenos Aires, July.
Tadayoni R. (2000). A comparative analysis of the access issues in digital broadcasting in Europe and USA. The paper was presented at ITS international Conference, ITS 2000, Bouenos Aires, July.
Tiebout C (1956). A pure theory of local expenditures. Journal of political Economy, 64, 416 – 24.
TV and Cable Fact book (1999). TV and Cable Fact book of 1999.
U.S. Census Bureau (1999). Statistical Abstract of the United State. Census Bureau, 1999
Varian H. R. and Shapiro C. (1999): Information Rules. Harvard Business School Press.
Varis T. (1993). Trends in the Global Traffic of Television Programs. In Noam E.M. and Millonzi J. C. (ed.) (1993)
Walker J. and Ferguson D. (1998). The broadcast Television Industry. Allyn and Bacon, A Viacom company
Waterman D. and Weiss A. A. (1997). Vertical Integration in cable Television. AEI Press.
Whitaker J. (1998). DTV the revolution in electronic imaging. McGraw Hill.

Chapter 11: References 191
Willard D. R, Jr. (1998). The institution of U.S. Public Broadcasting. In Noam E.M. & Waterman J. (ed.) (1998).
Williamson O.E. (1975). Markets and Hierarchies: Analysis and antitrust implications. New York: Free press.
Williamson O.E. (1979). Transaction- Cost Economics: The governance of contractual relations. Journal of Law and Economics 3.
Winseck D. (1998). Re-convergence, A political economy of telecommunications in Canada. Hampton press.

192
Summary The subject of this Ph.D. thesis is changes in the market for broadcasting services as a result of technological, political, and economic drivers. Broadcasting services can be categorised as a part of the ICT-based information and knowledge intensive services that has gone through radical changes in the last couple of decades. The aim of this report is to give an in-depth analysis of evolution of broadcasting market from the traditional organisation models to the more market oriented modern organisation models.
One of the objectives of general research within the service sector is to analyse the dynamics of changes and to identify the technological, political and economic parameters that have impact on these changes, including the evolution of service industries - from the domestic to the international market - and the consequences of the public good characteristics (and other market failures) on the information intensive services. The aim of this project is to contribute to this research by giving an analysis of the development of the market for broadcasting services with respect to identification and analysis of driving forces and barriers in this development as well as implications of this development on the structure of the market. This point of departure has led to an interdisciplinary approach as the methodology of the thesis, where the impacts of the technological, political and economic parameters, and their interrelation, on the development of the broadcasting market has been analysed. In the analysis, a comparative approach is deployed, where the broadcasting market and its development is studied in Europe and the US. As seen, both the interdisciplinary and the comparative methodologies have been powerful tools in the analysis,
• as regarding the interdisciplinary approach, it is shown throughout the thesis that development of broadcasting has been determined by a combination of technological, political and economic parameters in different phases of its development,
• as regarding the comparative approach, the different regulatory frameworks imposed on broadcasting in the European countries and the US have created a different framework for the development of broadcasting in these two markets, giving the possibility for identifying to what degree different parameters have influenced the development at different phases of the development.
In the historical analysis of the development in broadcasting history, three main phases are identified prior to digital broadcasting. These are: 1) the initial phase of traditional broadcasting model, 2) the developed phase of traditional broadcasting model, and 3) the modern market-oriented broadcasting model. In the following, the modern market-oriented broadcasting model is also divided in two phases; initial and developed phases. The initial phase of traditional broadcasting is the end of the unregulated broadcasting era. Prior to this, broadcasting was totally unregulated and, as seen, the situation got chaotic and because of the technical problem of interference it was almost impossible to establish a service provision in the market. It was not possible to solve the problem of interference at a technical level; therefore both in Europe and in the US, regulatory interventions were introduced and the frequency resources were assigned to different service providers so interference was avoided.
In the models used for assignment of resources and organisation of the service provision, other parameters were decisive. Content provision was considered to have political importance, as it had major impacts on society; consequently, governments considered it necessary to control the medium by establishing assignment processes for the frequency resources and imposing different types of obligations on the content providers. Also here the

Summary 193
technology that was deployed in production and consumption of the service had vital relevance. Broadcasting services were based on audio and later audio/video that was consumable by everybody; children as well as adults, and illiterate as well as literate. Furthermore, the distribution technology made it possible to give the major part of the population easy access to the service. The coverage and the ease of use, in combination with content that could consist of information, news, debate, education, etc. were among the reasons for the political importance of the services.
Also economic parameters, having their roots in the specificities of the technology of broadcasting, influenced the way broadcasting services were organised. In the beginning, the broadcasting services had some of the basic characteristics of pure public goods. The non-exclusive characteristic was due to the level of technological development; it was not possible at a technological level to target service towards individual consumers and exclude others. The non-rival consumption characteristic was basically due to the characteristics of service as information services, and also due to using airwaves in the delivery medium, where in the coverage area of one transmitter, marginal costs of reaching one more consumer is zero.
Assignment and organisation of resources were, however, different in European countries with the UK as frontrunner, and the US. Based on cultural and language related considerations, the available transmission resources in European countries were assigned to countrywide public service broadcasters with social responsibilities. In the US, on the other hand, the resources were allocated to local private broadcasters that conformed to less severe ‘public interest’ regulations.
The method of establishing national regulation agencies to assign the resources, provide license to some users, and recall them or intervene politically if some assumption was not met was, however, a political choice. Another solution could be to consider frequency resources as another production factor that could be traded in the market. The interference problem could then be solved by the private property protection regime. So while interference was a technical parameter, the chosen methods of regulation were not the only solutions.
The public good characteristic of the service required that other market organisations than the competitive market to regulate production and consumption of the services. It is, however, important to note that the public good characteristic of the service does not in itself imply public production of it. In the US, e.g. the broadcasting services have, mainly, been provided by private commercial actors. Choosing the public service organisation of broadcasting in the European countries has mainly been due to political and language related considerations.
The public good characteristic of broadcasting services resulted in two financing models; licence fee on receiver equipments in the European countries and indirect advertising financing in the US. The decision on financing was a political decision. Using advertising was resisted by the writing press and license fee seemed to fit public service broadcasting better, with the content production based on public service obligations and independency of the advertising market. For a period of time in the beginning of broadcasting, however, financing based on revenues from selling radio receivers was used. This required a vertically integrated industry that was not acceptable, neither in Europe nor in the US.
The development of traditional broadcasting in the European countries was tightly controlled and driven by the national governments, based on political considerations. The development can be characterised mainly by going from state monopoly to a broadcasting regime, where the broadcasters had a more independent status related to the governmental institutions, and by going from a monopoly market structure to duopoly and oligopoly market structures in some markets. Some of the new actors in the market were other public service

Summary 194
broadcasters and some of them were pure commercial broadcasters.
In the US because of the existence of a national advertising market, countrywide networks were created. As the ownership regulations limited the number of local stations a person or entity could own, national networks emerged by a combination of ownership to local stations and affiliation with others. The number of these national networks remained limited for a long time; two in the first couple of decades of radio and three when TV was invented. The domination of the two and later three national networks in an oligopolistic market structure is exactly the same as in many European countries.
The main reason for the limited number of national networks in the US was the technology of broadcasting. The national coverage and the transmission of programmes to different local broadcasting stations were established in the distribution network using expensive telecommunication lines or dedicated coax cables and complicated conversion equipments. The cost of establishing national coverage was very high and the balance between national advertising revenues and the cost of establishing and maintaining national coverage plus the cost of program production determined the number of networks that could exist on the market at the same time. These characteristics of the technology created the situation, where broadcasting could be considered having characteristics of ‘natural monopoly’. Other market failures, like externalities, and asymmetric information have also had great influence on the formation of regulation of broadcasting in these markets. The traditional broadcasting models used mainly terrestrial networks as delivery network to the end consumer. MATV and later cable TV also were deployed to some degree in this period but their impacts on the market was limited due to regulation both in the European countries and in the US. The regulators in both markets, under pressure from the incumbents, regulated this infrastructure in a way that it could only be used to retransmit the existing terrestrial signals. Technologically, it was however also complicated to bring signals from distant sources or to establish large cable networks that could give the critical mass of consumers to start cable-only programming.
The regulatory framework of broadcasting was different in Europe and the US, with the political control driving the development of broadcasting in European countries, and commercial interests the US. But the two markets ended up in almost the same market structure, where few broadcasters had the dominant market position. The technological parameters were important at the starting point but they were also important in development of the market. Even if the political factors had not been so decisive in European countries as they were, the technological characteristics and the market for broadcasting would limit the number of actors in the market. The political factors had vital influence on the societal role of broadcasting and the provided content has been totally different in the two markets.
Apart from minor overspill at the border areas, the service provision continued to be limited inside the national boundaries and under national regulations also in this more developed phase of traditional broadcasting. This was both because at a technological level it was complicated and expensive to bring signals from remote sources, and because at a regulatory level the national governments did not want to lose control of the medium reasoned in protection of local service industry and also, especially regarding the European countries, reasoned in cultural-, language-, and security related reasons. In this period a tight relationship between the national regulators and the incumbent broadcasters was established that had vital impacts on the future development. The technology of broadcasting was subject to changes and it was these changes that mainly induced the radical transformation of the broadcasting paradigm, from traditional broadcasting models to a more market oriented type of organisation of broadcasting; the modern broadcasting model. In the following the modern broadcasting model is divided in two different phases; initial and developed phases.

Summary 195
The initial phase of the modern broadcasting model denotes the period in broadcasting history, where the ‘natural monopoly’ characteristic of broadcasting service industry was removed (or strongly diminished) at a technological level. This was mainly due to emergence of satellites and their use in broadcasting. Satellite providers established cost efficient distribution systems. Consequently, countrywide terrestrial networks could be established in a cost efficient way and the SMATV systems and cable networks could be connected together and cover large geographical areas and increase their consumer bases substantially.
Another development was the transformation of broadcasting services from a pure public good to club goods, as it was possible to exclude people from using the service at a technological level. This implied the possibility of establishing other business models and, for example, to sell the services directly to the consumers. In the cable networks it was only possible to offer services in packages or what later is called bouquets. But another technical development, namely the possibility for signal encryption / decryption, enabled the satellite service providers to provide cable-TV-like program bouquets, but it was also possible to provide the services singly in the satellite and cable networks, as the services could be encrypted singly. The consequence of this development was that the broadcasting services did not need to be free-to-air anymore and could be traded on the market, with direct payment for the consumed services.
Emergence of satellites had another vital implication on broadcasting market. It established conditions for internationalisation of the broadcasting service industry at a technological level. However, the possibility for internationalisation, could be realised due to the development in the regulatory set-up.
This was however not the case in the beginning, where the cultural, political and language related considerations created a strong political barrier for this development in the European countries. Also in the US, the political factors were important and influenced the market development under the main idea of protection of ‘localism’ that resulted in FCC’s protection of interests of the incumbent traditional broadcasters in their competition with newcomers in the satellite and cable networks.
The political liberalisation at the developed phase of the modern broadcasting model started a process of utilisation of these new possibilities. The liberalisation process was extensive and comprised the whole communication sector, starting in the telecommunication sector.
The implications of these techno-political developments were mainly that:
• It became easier to establish countrywide terrestrial networks; consequently new networks emerged, e.g., in the US
• It became easier to establish large cable networks, consequently a number of broadcasters started programming that were only available in the cable and satellite networks.
• It became possible to import signals from distant areas and fill the resources available in the cable networks.
• Satellite providers also began targeting their services directly towards end consumers in the Direct To Home market.
The new broadcasting model that emerged afterwards can be characterised as.
• A transformation of broadcasting services from public to club/private goods.
• Expansion of transmission resources and the use of market oriented allocation

Summary 196
mechanisms in the new infrastructures.
• Availability of different quality programs in the large markets, like the US, without the necessity of posing specific content requirements / regulations.
• Internationalisation of broadcasting service provision.
What is important in this paradigm shift is that the new business models and the increased resources available in the modern broadcasting models can only be used to fulfil the demand sides’ wants and needs if there is a market for it. Here the small nations have the problem of the cost of providing narrow types of programming against the revenue possibilities available in the market. The necessity for non-market solutions and regulation will then continue to exist in these markets.
As seen in the following, digitalisation of broadcasting is the continuation of the modern broadcasting model, however, with radical new possibilities for the market development. Therefore digitalisation is considered a new phase in the development of broadcasting in this thesis, namely the digital broadcasting model. Digitalisation of broadcasting will enable further possibilities for market development and organisation, but will also create new barriers and political challenges in the development, as seen in the following.
One of the important outcomes of the digitalisation of broadcasting has been implications on the resource issues, a.o., the expansion of the transmission resources for broadcasting due to more efficient utilisation of available resources. Up until the digital broadcasting era, the increase in the available resources occurred primarily due to the emergence of new infrastructures like cable/satellite networks and development of technology enabling utilisation of unused resources in these networks. This was done for example by increasing the available transmission capacity in the terrestrial networks by making use of UHF frequencies and in cable and satellite networks by expanding the deployed frequency resources. More efficient utilisation of resources has resulted in a radical expansion of available transmission resources in all different delivery networks. This can be considered as the major impact of digitalisation on the broadcasting market that removes (or strongly diminishes) the resources scarcity problem, being in continuation of the development of the market oriented broadcasting model. The increased capacity in the digital platforms at the technical level will only be efficiently utilised if the allocation and assignment of resources are performed in an optimal way. As seen in this thesis, there are different models for organisation of resources and several technological, techno-political, and political parameters that will have influence on the development of the broadcasting market. The regulatory implications of the new resource conditions are most important in terrestrial network, as these resources are valuable for different uses and are scarce also in the digital era. Satellite and cable networks are operated by commercial actors that deploy the increased capacity in the digital networks to expand their businesses. The major parameters that influence optimal utilisation of the available resources in the digital terrestrial network that are identified in this thesis are among others:
• A combination of different parameters determines the available resources in the terrestrial networks. This will involve: Re-planning of frequency allotments to utilise available resources, including ‘taboo channels’ in the most efficient way. And Selection of different parameters that impact the utilisation of available resource in digital broadcasting, like the amount of Single Frequency Networks (SFN) and selection of technical parameters like the level of FEC and Guard Interval.
• The chosen approach on assignment of resources: the assignment of resources in a

Summary 197
multiplex to multiple service providers or to a single HDTV service provider.
• The chosen approach in the organisation of the multiplex function. Here multiplex-led, service-led, and content-provider-led are among the most deployed organisation forms.
• The methods of resource allocation in a multiplex. Here the resources in a multiplex can be assigned as fixed portions using static allocation method, or they can be allocated dynamically.
• Simulcast of analogue and digital services is costly and occupies immense transmission capacities. The timing for the termination of the simulcast period in the terrestrial networks is a political decision that involves considerations both at supply and demand side.
• Creating optimal regulatory conditions for the new platforms to provide broadcasting services when the technology is sufficiently mature.
The resource issue is, however, not the only aspect of the digitalisation of broadcasting that impacts the market development. There are three other major aspects of the digitalisation of broadcasting, analysed in this thesis, with vital implications on market development, namely 1) new access conditions, 2) new business models and funding forms, and 3) the ongoing process of convergence. The access aspect considers the new access conditions in digital broadcasting. In traditional broadcasting the service is free-to-air and the access can be achieved using standardised receiver equipments. In digital broadcasting the service is not necessarily free-to air, and the access may, apart from the decision on the service type to be consumed, involve technological choices on the Conditional Access (CA), Application programme Interface (API) and their possibilities for interoperability. The way digital TV is standardised and the way households receive the services can result in complex situations, where movement across service providers can be impossible and, enabling optimal access condition to make the competitive market work, can requires intervention from regulatory side. This is however contrary to the process that we have been witnessing through the history of broadcasting, where the regulatory body has worked against competition, to promote and protect public service in Europe and local broadcasting in the US. The new business models and funding aspect is about the possibility for targeting services towards individual end-consumers in all delivery platforms, using different Conditional Access (CA) systems. In digital broadcasting it is possible to provide services to individual consumers using very large granularity levels, i.e., it is, for example, possible to differentiate the service at the programme level, where the consumer buys some of the programs in a service or even at a lower level, where the consumer acquires only part of a program in a service. This enables immense business opportunities and possibilities for establishing new business models. Using price differentiation, the same service can be provided with different quality, being the technical quality of the signal, e.g., with different sharpness in picture resolution or the quality of content where different levels of added value can be provided along side with the services. Regarding the emergence of new business models and implications on funding forms, it is identified that the implications on the market organisation could be the possibility for horizontal and vertical organisation of market, new possibilities for competition between infrastructures and the development towards customisation of services, in continuation of the transformation of broadcasting services from public to private good. Regarding funding, it is identified that new funding forms can be used but also traditional funding forms can be used.

Summary 198
Regarding the structure of the market for digital broadcasting, it is showed that service provision in the market is highly concentrated horizontally, and vertical integration can be identified in the industry. Cable TV is locally concentrated due to the natural characteristics of the network. However, also at national level, the digital cable TV market is dominated by few actors due to the high costs of digitalisation. Satellite market is concentrated due to high costs of establishing the service provision. The terrestrial service provision is concentrated in the Nordic countries due to the selection of service-led multiplexing model. The difference between terrestrial and other delivery networks is, however, the assignment of resources that is maintained by the regulators. And the problem of variety and barriers for competition that can occur in concentrated market / industries can be dealt with at the regulatory level. The convergence aspect regards the possibility for provision of other than traditional broadcasting services, and the potentials for further development of traditional broadcasting services using the new possibilities in digital broadcasting. This enables provision of services from other communication sectors in the broadcasting platforms and involves entrance of other actors than traditional broadcasting actors in the broadcasting market. This process of convergence between different communication sectors enables synergy effects both in terms of knowledge spill-over between different communication sectors, and expansion of business opportunities. For example, Internet services that are out of reach for part of the population can be provided to all TV households, i.e., almost to all households in the industrialised countries. This will help diminishing the gab between information classes in the society. The convergence is, however, not only about other services being available in the broadcasting platforms, the reverse process is also developing, where traditional broadcasting services will be provided on other platforms like Internet. Both the data services available on broadcasting platforms and broadcasting services provided on other platforms will, however, be adjusted to the new platforms. These four different aspects of digital broadcasting are analysed and it is shown, that the technological possibilities in digital broadcasting can only be utilised efficiently when the organisation and allocation of resources are performed optimally. It is further shown that regulation will be necessary also in the digital era, partly to ‘correct’ the possible ‘lock-in’ situation and other structural and technological created barriers on the digital broadcasting market, and partly due to the cultural and language related considerations in small nations, where the available market will not necessarily result in coverage of consumers’ needs and wants in a pure market-oriented model.

199
Resumé Titlen på dette Ph.D. projekt er: ”Teknologiske, politiske og økonomiske forandringer og deres inflydelse på udviklingen af broadcasting-services”. Projektet handler om de forandringer indenfor markedet for broadcasting-services, der er opstået som følge af teknologiske, politiske og økonomiske påvirkninger. Broadcasting-services kan betragtes som en del af de ICT baserede informations- og vidensintensive ydelser, der har gennemgået radikale forandringer indenfor de sidste årtier. Formålet med denne opgave er en dybdegående analyse af broadcasting markedets udvikling fra de traditionelle regulerede organiseringsmodeller til mere moderne markedsorienterede organiseringsmodeller. Et af formålene for den generelle forskning indenfor service sektoren er at analysere dynamikken ved forandringer og at identificere de teknologiske, politiske og økonomiske parametre, der har indflydelse på disse forandringer, herunder udviklingen af service industrierne – fra de nationale til de internationale markeder. Herudover har dele af denne forskning, bl.a., fokuseret på konsekvenserne af offentligt gode karakteren (og andre markedsfejl) på de informationsintensive services. Formålet med dette projekt er at bidrage til denne forskning ved at give en analyse af udviklingen indenfor markedet for broadcasting-services med særlig henblik på identifikation og analyse af drivkræfter og barrierer i denne udvikling såvel som implikationerne af denne udvikling på markedsstrukturen. Dette har ført til valget af en tværfaglig tilgang som metode for denne tese, hvor påvirkningen af de teknologiske, politiske og økonomiske parametre på udviklingen af broadcasting markedet - er blevet analyseret. I analysen anvendes endvidere en komparativ tilgang, hvor broadcasting markedet og dets udvikling studeres i Europa og i USA. Som det fremgår er både den tværfaglige og den komparative metode yderst anvendelige i denne analyse,
• Hvad angår den tværfaglige tilgang ses det gennem hele tesen at udviklingen af broadcasting er blevet bestemt af en kombination af teknologiske, politiske og økonomiske parametre i forskellige faser af dens udvikling.
• Hvad angår den komparative tilgang har forskellige regulatoriske rammer, der har været pålagt broadcasting i de europæiske lande og i USA skabt forskellige forudsætninger for udviklingen af broadcasting indenfor disse to markeder, hvilket har givet mulighed for at identificere i hvilken grad forskellige parametre har påvirket udviklingen i forskellige faser af udviklingen.
I den historiske analyse af broadcastingens udvikling er der identificeret tre hovedfaser forud for den digitale broadcasting. Disse er : 1) den initiale fase af den traditionelle broadcasting model, 2) den udviklede fase af den traditionelle broadcasting model og 3) den moderne markedsorienterede model. I det følgende er den moderne markedsorienterede model yderligere opdelt i to faser; initial og udviklet fase. Den initiale fase af traditionel broadcasting startede ved afslutningen af den uregulerede broadcasting æra. Forud for denne fase var broadcasting fuldstændig ureguleret og situationen blev kaotisk fordi det tekniske interferensproblem næsten umuliggjorde etablering af serviceudbud på markedet. Det var ikke muligt at løse interferensproblemet på teknisk niveau, hvilket medførte at der både i Europa og i USA introduceredes regulatoriske interventioner og at frekvens ressourcerne blev tildelt forskellige serviceudbydere således at interferensproblemet kunne undgås. Med hensyn til de modeller der blev valgt til tildeling af ressourcer og organiseringen af

Resumé 200
serviceudbydere var andre parametre afgørende. Indholdsudbud blev regnet for at være politisk vigtigt, da det havde stor indflydelse på samfundet og som en konsekvens heraf mente regeringerne, at det var nødvendigt at kontrollere mediet ved at etablere frekvenstildelingsregler for frekvensressourcerne og pålægge forskellige typer forpligtigelser for indholdsudbyderne mod at opnå tilladelse. Broadcasting-services blev baseret på lyd og senere lyd/billede, der var brugbare for alle; børn såvel som voksne, analfabeter såvel som uddannede. Desuden gjorde distributionsteknologien det muligt at give størstedelen af befolkningen nem adgang til serviceydelsen. Dækningen og den nemme brug var tillige med indholdet, der kunne bestå af information, nyheder, debat, uddannelse osv. medvirkende årsag til at gøre serviceydelsen politisk vigtig. Også økonomiske parametre, der havde rødder i specifikke karakteristikker ved broadcastingteknologien havde indflydelse på den måde hvorpå broadcasting- servicesne blev organiseret. I begyndelsen havde broadcasting-servicesne karakter af rene offentlige goder, hvor bl.a. ingen kunne ekskluderes fra at forbruge ydelsen og der var ingen rivalisering i forbruget. Den ikke-eksklusive karakter skyldtes niveauet af den teknologiske udvikling; det var ikke teknologisk muligt at rette services mod enkelte forbrugere eller at forhindre andre i at bruge dem. Den ikke-rivaliserende karakter er knyttet til at broadcasting-servicen er en informationsservice, og at æteren blev brugt til at transmittere servicen ukrypteret til forbrugerne, idet at de marginale omkostninger for at nå en forbruger i dækningsområdet af en transmitter, er nul. Tildelingen og organiseringen af ressourcerne var dog forskellig i de europæiske lande og i USA. Baseret på kulturpolitiske og sprogrelaterede overvejelser, blev transmissions-ressourcerne i de europæiske lande tildelt landsdækkende public service broadcastere med samfundsmæssige forpligtelser. I USA blev ressourcerne derimod tildelt private broadcastere med mindre omfattende ’public interest’ regulering i de lokale markeder. Den anvendte metode, nemlig at implementere nationale reguleringsorganer for at allokere ressourcer: at tildele frekvenslicenser mod visse forpligtigelser og trække dem tilbage eller blande sig politisk, hvis disse ikke blev opfyldt, var et politisk valg. En anden løsning kunne være at se på frekvenser som en produktionsfaktor, som kunne handles på markedet. Interferensproblemet kunne så løses ved almindelig lovgivning om beskyttelse af private rettigheder. Interferens var en teknisk parameter, men de valgte regulerings modeller var ikke de eneste løsninger. Karakteren af servicen som et offentligt gode var en af grundene til at andre markedsorganisationer end konkurrencemarkedet valgtes til at regulere produktionen og forbruget af serviceydelsen. Det er dog vigtigt at nævne at karakteren af et offentligt gode ikke i sig selv medfører nødvendigheden af offentlig produktion af servicen. I USA har broadcasting-services for eksempel hovedsageligt været udbudt af private kommercielle aktører. Valget af public service organiseringen af broadcasting i de europæiske lande var en følge af politiske overvejelser. Karakteren af broadcasting-services som et offentligt gode resulterede i to hoved- modeller for finansiering: Licensgebyr på modtageudstyr i de europæiske lande og indirekte reklamefinansiering i USA. Den skrivende presse var imod anvendelse af reklamefinansiering i broadcasting, og licensgebyr passede bedre til public service broadcasting, idet man kunne basere produktionen af indholdet på public service forpligtigelser og være uafhængig af reklamemarkedet. Dog benyttede man i begyndelsen af broadcastingperioden finansiering baseret på indtægter fra salg af radiomodtagere. Dette krævede en vertikalt integreret industri, der ikke var accepteret hverken i Europa eller i USA. Udviklingen af den traditionelle broadcasting i de europæiske lande blev kontrolleret tæt og drevet af de nationale regeringer, baseret på politiske overvejelser. Udviklingen kan hovedsageligt karakteriseres som gående fra et statsmonopol til en form, hvor broadcasterne havde en mere uafhængig status i forhold til de regerende institutioner, og

Resumé 201
som gående fra en monopolistisk markedsstruktur til en duopolistisk eller en oligopolistisk markedsstruktur. Nogle af de nye aktører på markedet var andre public service broadcastere, andre var udelukkende kommercielle broadcastere. I USA medførte eksistensen af et nationalt reklamemarked, at der blev dannet landsdækkende broadcastere. Ejerskabsreguleringerne begrænsede det antal lokale stationer, en person eller enhed kunne eje. Dette medførte, at der dannedes landsdækkende net som en kombination af egne lokale stationer og kontrakter med andre lokale stationer. Antallet af disse landsdækkende broadcastere forblev begrænset i længere tid; i løbet af de første årtier kun to og da TV blev opfundet, var der tre nationale netværk i USA. Dominansen af de to, senere tre nationale netværk i en oligopolistisk markedsstruktur, svarede til forholdene i mange europæiske lande. Hovedårsagen til det begrænsede antal nationale netværk i USA var broadcasting teknologien. Den nationale dækning og transmissionen af programmer til forskellige lokale broadcasting stationer, blev etableret ved brug af dyre telekommunikationslinier eller i dedikerede koaks kabler og kompliceret konverteringsudstyr i distributionsnetværket. Prisen for at etablere national dækning var meget høj, og balancen mellem nationale reklameindtægter og prisen på at etablere og vedligeholde national dækning plus omkostninger ved programproduktionen bestemte antallet af netværk, der kunne eksistere på markedet på samme tid. Disse er blandt årsagerne til ’naturligt monopol’ karakteren af broadcasting-service industrien. Andre markedsfejl, som eksternaliteter, og asymmetrisk information har også haft indflydelse på udviklingen af regulering af broadcasting på disse markeder. De traditionelle broadcasting modeller brugte hovedsageligt terrestrisk (jordbaserede) netværk til slutbrugeren. MATV og senere kabel TV blev anvendt i nogen grad i denne periode, men deres indflydelse på markedet blev begrænset som følge af reguleringer både i de europæiske lande og USA. Under pres fra eksisterende broadcastere reguleredes disse infrastrukturer i begge markeder således, at de kun kunne bruges til at retransmittere de eksisterende terrestriske signaler. Teknologisk var det dog også kompliceret at bringe signaler fra fjerne områder, eller at etablere store kabelnet, med den nødvendige kritiske masse af tilslutninger, til at starte ’cable-only’ kanaler. Rammerne for regulering af broadcasting var forskellig i Europa og USA, med politisk kontrol som drivkraft i udviklingen i de europæiske lande og kommercielle interesser i USA. Men begge markeder endte i næsten samme markedsstruktur, hvor nogle få broadcastere dominerede markedet. Teknologiske parametre var vigtige i starten, og som det fremgår var de også vigtige i den senere udvikling af markedet. Selv hvis de politiske faktorer ikke var så afgørende i de europæiske lande ville de teknologiske karakteristikker begrænse antallet af aktører på markedet. Noget andet er, at politiske faktorer havde vital indflydelse på den samfundsmæssige rolle, som broadcasting havde. Dette medførte, at det indhold, der blev leveret på de to markeder, var vidt forskellige, med seriøse og samfundsrelaterede programmer i Europa og lette populære programmer i USA. Dette medførte bl.a. fremkomsten af den amerikanske version af public broadcastere til at fylde manglerne på markedet. Bortset fra begrænset ’overspill’ i grænseområderne fortsatte serviceudbudet indenfor landenes grænser under national regulering. Dette skyldtes dels, at det var teknologisk kompliceret at udbyde services over landegrænser, og dels ønskede man at beskytte nationale kulturpolitiske interesser. I denne periode blev en stærk relation mellem eksisterende broadastere og de nationale regulatorer skabt. Udviklingen i broadcasting teknologi og udviklingen af de politiske rammer for broadcasting ændrede mange af disse forudsætninger, og var med til at transformere broadcasting paradigmet fra de traditionelle broadcasting modeller til mere markedsorienterede moderne modeller. I det følgende er den moderne broadcasting model delt i to forskellige faser; initial

Resumé 202
og udviklet fase. Den initiale fase af den moderne broadcasting model betegner den periode i broadcasting historie, hvor en af forudsætningerne for karakteren af broadcasting service industriens ’naturlige monopol’ blev fjernet (eller stærkt formindsket) på det teknologiske niveau. Dette skyldtes hovedsageligt fremkomsten af satellitter og deres brug indenfor broadcasting. Satellitudbydere etablerede omkostningseffektive distributionssystemer. Som en konsekvens heraf kunne landsdækkende terrestriske netværker etableres på en omkostningseffektiv måde, og SMATV systemerne og kabelnetværkerne kunne forbindes og dække store geografiske områder, og samtidigt øge deres brugeres baser markant. En anden udvikling var transformationen af broadcasting-services fra rene offentlige goder til klub goder, da det blev muligt på et teknologisk niveau at udelukke forbrugere fra at benytte services. Dette åbnede for muligheden for at etablere andre forretningsmodeller og for f.eks. at sælge services direkte til forbrugerne. I kabelnet var det kun muligt at tilbyde services i pakker. Fremkomsten af muligheden for at kryptere/dekryptere signaler gjorde satellit serviceudbyderne i stand til at tilbyde kabel TV lignende programpakker, samt at tilbyde services enkeltvis i satellit og kabel-netværker, da servicen kunne krypteres enkeltvis. Konsekvensen af denne udvikling var, at broadcasting-servicen ikke længere behøvede at være free-to-air og kunne handles på markedet med direkte betaling for servicen. Fremkomsten af satellitter havde en anden vigtig indflydelse på broadcasting markedet, idet det etablerede et grundlag for internationalisering af broadcastingserviceindustrien på et teknologisk niveau. Dog kunne muligheden for internationalisering kun realiseres som følge af udviklingen indenfor de regulatoriske rammer. Dette var dog ikke tilfældet i begyndelsen, hvor kulturelle, politiske og sproglige overvejelser var medvirkende til at danne en stærk politisk barriere for denne udvikling i de europæiske lande. Ligeledes var der i USA vigtige politiske faktorer, der influerede på markedsudviklingen under hovedideen om at beskytte ’det lokale’ broadcasting market. Dette resulterede i FCC’s beskyttelse af eksisterende broadcastere i deres konkurrence mod de ’nye’ i satellit og kabel nettene. Den politiske liberalisering i den udviklede fase af moderne broadcasting modeller medførte at disse nye muligheder blev udnyttet. Liberaliseringsprocessen omfattede hele kommunikationssektoren og startede indenfor telekommunikationen. Betydningen af disse teknisk-politiske udviklinger var hovedsageligt:
• Det blev lettere at etablere landsdækkende terrestriske net, hvilket medførte at der for eksempel i USA opstod nye ’landsdækkende’ broadcastere.
• Det blev endvidere lettere at etablere store kabel net, og mange broadcastere begyndte at udsende programmer, der udelukkende var tilgængelige i kabel eller satellit net.
• Det blev muligt at importere signaler fra fjerne områder og fylde de tilgængelige ressourcer i kabel net.
• Satellitudbydere begyndte at udbyde deres services direkte til forbrugerne i ’Direct To Home’ markedet.
Den nye broadcastingsmodel, der herefter opstod kan karakteriseres som:
• En transformation af broadcasting-services fra et offentligt til et privat/club gode.
• Udvidelsen af transmissionsressourcerne og brugen af markedsorienterede allokerings mekanismer i de nye infrastrukturer.
• Tilgængelighed af programmer af forskellig kvalitet i de store markeder, som f.eks.

Resumé 203
det amerikanske, uden nødvendigvis at pålægge specifikke indholdskrav eller regulationer.
• Internationalisering af broadcasting serviceudbudet. Det vigtige i dette paradigmeskift er, at de nye forretningsmodeller og de øgede ressourcer, som er tilgængelige i de moderne broadcasting modeller kun kan bruges til at opfylde forbrugernes ønsker og behov, hvis der er et marked for det. Her vil de små nationer have et problem, idet der ikke er marked nok til at tilbyde ’smalle’ programtyper i forhold til indtægtsmulighederne på markedet. Nødvendigheden af ikke-markeds løsninger og regulation vil således fortsat eksistere på disse markeder. Som det fremgår af det følgende er digitaliseringen af broadcasting en fortsætning for den moderne broadcastingsmodel, dog med radikalt nye muligheder for markedsudvikling. Derfor anses digitaliseringen i denne tese som værende en ny fase i udviklingen af broadcasting; nemlig den digitale broadcastingsmodel. Digitaliseringen af broadcasting vil ikke kun bane vejen for yderligere muligheder for markedsudvikling og –organisering, men også skabe nye barrierer og politiske udfordringer i denne udvikling. Et af de vigtige resultater af digitaliseringen af broadcasting har været effekten på resourceforholdene, herunder ekspederingen af transmissionsressourcerne for broadcasting som følge af den mere effektive udnyttelse af de tilrådighedsværende ressourcer. Indtil den digitale broadcastingsera fremkom øgedes ressourcerne primært som følge af fremkomsten af nye infrastrukturer som satellit og kabel samt udviklingen af teknologier, der muliggjorde udnyttelsen af ubrugte ressourcer i disse netværker. Dette blev gjort ved f.eks. at øge den tilgængelige transmissionskapacitet i de terrestriske netværker ved at bruge UHF frekvenser samt i kabel og satellit ved at udvide de anvendte frekvens ressourcer. Mere effektiv udnyttelse af ressourcerne resulterede i en radikal udvidelse af de tilgængelige transmissionsressourcer i forskellige platformer. Dette kunne betragtes som digitaliseringens store indflydelse på broadcasting markedet, idet problemet med ressourceknaphed blev fjernet (eller stærkt formindsket). Dette i kontinuation med udviklingen af den markedsorienterede broadcastingsmodel. På det tekniske område vil den øgede kapacitet i de digitale platforme kun kunne udnyttes effektivt, hvis allokeringen og tildelingen af ressourcer udføres effectivt. Som det ses i denne tese er der forskellige modeller for organisering af ressourcer og adskillige teknologiske, tekno-politiske og politiske parametre, der har indflydelse på udviklingen af broadcasting markedet. De regulatoriske implikationer på de nye ressourceforhold er vigtigst i den terrestriske platform, da disse ressourcer har høj værdi for forskellige alternative brugere og er knappe også i den digitale æra. Satellit og kabel net drives af kommercielle aktører, som udnytter den øgede kapacitet i de digitale net til at ekspandere deres markeder. De væsentlige parametre, der har indflydelse på den optimale udnyttelse af de tilgængelige ressourcer i det digitale terrestriske netværk identificeres i denne tese bl.a. som:
• En kombination af forskellige parametre bestemmer de tilgængelige ressourcer i det terrestriske netværk, såsom Re- planlægning af frekvensallokeringen og evt. udnyttelse af tilgængelige ressourcer inklusive ’taboo kanaler’ samt valget af forskellige tekniske parametre, der har indflydelse på udnyttelsen af tilgængelige ressourcer som f.eks. mængden af ’Single Frekvens Net (SFN) i et marked og valg af f.eks. niveauet af FEC, ’Guard Interval’, mm.
• Den valgte tildelingsmodel: Tildelingen af ressourcer i en multiplex til forskellige services eller til en enkelt HDTV service.
• Den valgte organisationsmodel af multiplex funktion. Her er ”multiplex-led”, ’service-led’ og ’content-provider-led’ organisationsformer blandt de mest anvendte.

Resumé 204
• Ressource allokerings metoden i en multiplex. Her kan ressourcerne i en multiplex blive tildelt som faste dele ved brug af statisk allokeringsmetode eller de kan allokeres dynamisk.
• ’Simulcast’ af analoge og digitale services er kostbart og optager enorme transmissionskapaciteter. Timingen for afslutningen af ’simulcast’ periode i de terrestriske netværker er en politisk beslutning, der involverer overvejelser på både udbud og efterspørgselssiden
• At danne optimale regulatoriske forhold for de nye og fremtidige platforme, der kan bruges til udbud af broadcasting-servicer, når teknologien er tilstrækkelig ’moden’.
Ressourceaspektet er dog ikke det eneste aspekt af digitaliseringen af broadcasting, der influerer på markedets udvikling. Tre andre væsentlige aspekter af digitaliseringen af broadcasting, har ligeledes stor betydning på markedsudviklingen: 1) nye adgangs forhold, 2) nye business og finansierings modeler, og 2) processen af konvergens med andre kommunikationssektorer. Access (adgangs-) aspektet betegner de nye adgangsforhold i den digitale broadcasting. I den traditionelle broadcasting er servicesne ’free-to-air’ og adgangen kan opnås ved brug af standardiseret modtageudstyr. I den digitale broadcasting er servicesne ikke nødvendigvis ’free-to-air’ og adgangen kan , ud over valget af hvilken ydelsestype der ønskes, involvere teknologiske valg som ’Conditional Access’ (CA), ’Applikations Program Interface’ (API) og deres mulighed for interoperabilitet. Den måde digital TV er standardiseret og måden hvorpå husholdningen modtager serviceydelsen kan resultere i komplekse situationer, hvor lukkede systemer gør skift mellem forskellige udbydere om ikke umulig så vanskelig. At etablere optimale adgangsforhold med henblik på at få de konkurrerende markeder til at fungere kan kræve intervention fra regulatorisk side. Finansierings aspektet har udviklet sig således at det er blevet muliggjort at udbyde services til individuelle slutbrugere på alle platforme, og at etablere business modeller, som kan håndtere direkte betaling. I den digitale broadcasting er det muligt at udbyde services til individuelle forbrugere i forskellige grader af oplysning. For eksempel er det muligt at differentiere services på programniveau, hvor forbrugeren køber nogle programmer i en serviceydelse eller på et endnu lavere niveau, hvor forbrugeren kun modtager en del af et program i en serviceydelse. Dette muliggør enorme forretningsmuligheder og muliggør etableringen af nye business modeller. Ved at bruge prisdifferentiering, kan den samme service udbydes med forskellige tekniske kvaliteter, f.eks. skarpheden af billedopløsningen eller med hensyn til kvaliteten af indholdet, hvor forskellige niveauer af ’added value’ kan tilægges serviceydelsen. Med hensyn til markedsstrukturen for digital broadcasting ses det at serviceudbudet på markedet er stærkt koncentreret horisontalt og at vertikal integration kan identificeres i industrien. På det nationale niveau domineres det digitale kabel TV markede af få aktører p.g.a. de høje omkostninger forbundet med digitaliseringen. Satellitmarkedet er også koncentreret p.g.a høje omkostninger ved etablering af serviceudbudet. Det terrestriske serviceudbud er koncentreret i de nordiske lande p.g.a. selektionen af den serviceydelses- styrede multiplex model. Forskellen mellem terrestriske og andre net er imidlertid tildelingen af ressourcer, der foretages af regulatorerne. Variations problemet og konkurrence barriererne, der opstår i koncentrerede markeder / industrier kan der tages hånd om på det regulatoriske niveau. Konvergensprocessen betegner i denne sammenhæng muligheden for at udbyde andet end de traditionelle broadcasting-services tillige med muligheden for yderligere udvikling af de traditionelle services ved brug af de nye muligheder i digital broadcasting. Dette muliggør udbud af services fra andre kommunikationssektorer i broadcasting platformene og

Resumé 205
involverer adgang for andre aktører end de traditionelle broadcasting aktører på broadcastingmarkedet. Denne konvergensproces mellem forskellige kommunikationssektorer fremmer en synergistisk effekt både i form af videns transfer mellem forskellige kommunikationssektorer, og med hensyn til udvidelsen af forretningsmuligheder. F.eks. kan Internet services, der ikke kan opnås af store dele af befolkningen i de industrialiserede lande udbydes til TV husholdninger, d.v.s. til næsten alle husholdninger i de industrialiserede lande. Dette vil mindske gabet mellem informationsklasserne i samfundet. Konvergens består dog ikke kun af at andre services bliver tilgængelige på broadcasting platformene, idet den omvendte proces også udvikler sig. For eksempel bliver de traditionelle broadcasting-servicer udbudt på andre platforme f.eks. Internettet. I analysen af disse fire aspekter af digital broadcasting er det vist at de teknologiske muligheder i digital broadcasting, kun kan blive udnyttet, når ressourcerne er allokeret effektive. Det er endvidere vist, at der er andre grunde, der kan nødvendiggøre fortsættelsen af reguleringen også i den digitale æra. Disse er dels nødvendigheden af at rette op på mulige ’lock in’ situationer skabt af lukkede systemer på markedet, og andre struktur- eller teknologiskabte markedsfejl. Dels på grund af skulturpolitiske overvejelser i små nationer, hvor det eksisterende marked ikke nødvendigvis vil resultere i at efterspørgslen bliver dækket i en rent markedsorienteret model.