Embed Size (px)
Citation preview

General rights Copyright and moral rights for the publications made accessible in the public portal are retained by the authors and/or other copyright owners and it is a condition of accessing publications that users recognise and abide by the legal requirements associated with these rights.
Users may download and print one copy of any publication from the public portal for the purpose of private study or research.
You may not further distribute the material or use it for any profit-making activity or commercial gain
You may freely distribute the URL identifying the publication in the public portal If you believe that this document breaches copyright please contact us providing details, and we will remove access to the work immediately and investigate your claim.
Downloaded from orbit.dtu.dk on: Oct 15, 2022
Enabling Technologies for Smart Grid Integration and Interoperability of ElectricVehicles
Martinenas, Sergejus
Publication date:2017
Document VersionPublisher's PDF, also known as Version of record
Link back to DTU Orbit
Citation (APA):Martinenas, S. (2017). Enabling Technologies for Smart Grid Integration and Interoperability of Electric Vehicles.Technical University of Denmark, Department of Electrical Engineering.

Sergejus Martinenas
Enabling Technologies for Smart GridIntegration and Interoperability ofElectric Vehicles
PhD Thesis, September 2017Risø, Roskilde, Denmark


DANMARKS TEKNISKE UNIVERSITETCenter for Electric Power and Energy
DTU Electrical Engineering
Enabling Technologies for Smart Grid
Integration and Interoperability of Electric
Vehicles
Teknologier til intelligent integration og
interoperabilitet af elbiler i elnettet
PhD Thesis by
Sergejus Martinenas
Supervisors:
Associate Professor Chresten Træholt, Technical University of Denmark
Associate Professor Mattia Marinelli, Technical University of Denmark
Senior Researcher Peter Bach Andersen, Technical University of Denmark
DTU - Technical University of Denmark, Roskilde - September 2017

Enabling Technologies for Smart Grid Integration and Interoperability of Electric Vehicles
This thesis was prepared by:Sergejus Martinenas
Supervisors:Associate Professor Chresten Træholt, Technical University of DenmarkAssociate Professor Mattia Marinelli, Technical University of DenmarkSenior Researcher Peter Bach Andersen, Technical University of Denmark
Dissertation Examination Committee:Senior Researcher Oliver Gehrke, Technical University of DenmarkProfessor Inmaculada Zamora Belver, University of the Basque CountryProfessor Ghanim Putrus, Northumbria University
Center for Electric Power and EnergyDTU Electrical Engineering
Frederiksborgvej 399, Building 776DK-4000 RoskildeDenmarkwww.cee.elektro.dtu.dk
Tel: (+45) 4525 3500Fax: (+45) 4588 6111E-mail: [email protected]
Release date: August 2017
Class: Public
Field: Electrical Engineering
Remarks: The dissertation is presented to the Department of Electrical Engineering ofTechnical University of Denmark in partial fulfilment of the requirementsfor the degree of Doctor of Philosophy.
ISBN: 000-00-00000-00-0

If we were logical, the future would be bleak, indeed. But we aremore than logical. We are human beings, and we have faith, and wehave hope, and we can work.
— Jacques Yves Cousteau
Dedicated to My Family


Preface
This thesis is prepared at the Department of Electrical Engineering of the Technical University ofDenmark in partial fulfillment of the requirements for acquiring the degree of Doctor of Philosophyin Engineering. The PhD project was funded by COTEVOS EU project and Danish NIKOLAproject.
This dissertation summarizes the work carried out by the author during his PhD project. It startedon August 1st 2014, and was completed on July 31st 2017. During this period, he was employed byTechnical University of Denmark as a PhD student at the Center for Electric Power and Energy(CEE).
The thesis is composed of 6 chapters and 9 attached scientific papers, 8 of which have beenpeer-reviewed and published, and the other is currently under the review process.
Sergejus MartinenasAugust 2017
i


Acknowledgements
Through the years of this PhD study, I have ventured not alone. Hereby, I would like to thank allof those that accompanied me in this journey.
Firstly, I would like to thank supervisors Prof. Chresten Træholt, Prof. Mattia Marinelli and Dr.Peter Bach Andersen for their trust and opportunity to contribute to transportation electrificationresearch; for all the guidance, productive discussions and constructive feedback. I am especiallygrateful to Prof. Dr. Don Mattia Marinelli for all the encouragement and everyday help to stay oncourse, at times when PhD study seemed troublesome.
I want to thank my colleagues Alex, Anders, Andreas, Anna, Antonio, Esteban, Giuseppe, Michel,Venkat, Xue and others. For the interesting discussions, working collaboration, overseas trips toconferences and other fun extracurricular activities :)
Finally, I want to thank my loving family for their unconditional support and patience throughoutthe years. I owe my success to you.
Sergejus
Frederiksborgvej 399, Building 776DK-4000 RoskildeDenmarkAugust 2017
iii


Table of Contents
Preface i
Acknowledgements iii
Table of Contents v
Abstract ix
Resumé xi
Nomenclature & Acronyms xiii
1 Introduction 11.1 The age of change . . . . . . . . . . . . . . . . . . . . . . . . . . . . . . . . . . . . . . 1
1.1.1 Power grid transformation . . . . . . . . . . . . . . . . . . . . . . . . . . . . 11.1.2 Transportation electrification . . . . . . . . . . . . . . . . . . . . . . . . . . . 21.1.3 The fusion of two industries . . . . . . . . . . . . . . . . . . . . . . . . . . . . 2
1.2 Thesis objectives . . . . . . . . . . . . . . . . . . . . . . . . . . . . . . . . . . . . . . . 31.3 Thesis outline and research contributions . . . . . . . . . . . . . . . . . . . . . . . . 31.4 Publications . . . . . . . . . . . . . . . . . . . . . . . . . . . . . . . . . . . . . . . . . 4
2 Synthesis between EVs and the Smart Grid 72.1 Why integrate EVs into the smart grid? . . . . . . . . . . . . . . . . . . . . . . . . . 7
2.1.1 Grid structure and operation . . . . . . . . . . . . . . . . . . . . . . . . . . . 72.1.2 System wide services . . . . . . . . . . . . . . . . . . . . . . . . . . . . . . . . 82.1.3 Distribution grid services . . . . . . . . . . . . . . . . . . . . . . . . . . . . . 92.1.4 Smart grid services . . . . . . . . . . . . . . . . . . . . . . . . . . . . . . . . . 11
2.2 EV as a smart mobile distributed energy resource . . . . . . . . . . . . . . . . . . . 12
3 Enabling technologies: hardware, communication and control 153.1 What are EVs made of? . . . . . . . . . . . . . . . . . . . . . . . . . . . . . . . . . . . 15
3.1.1 Battery . . . . . . . . . . . . . . . . . . . . . . . . . . . . . . . . . . . . . . . . 163.1.2 Charger . . . . . . . . . . . . . . . . . . . . . . . . . . . . . . . . . . . . . . . 17
3.2 Communication in e-mobility . . . . . . . . . . . . . . . . . . . . . . . . . . . . . . . 223.2.1 E-mobility architecture . . . . . . . . . . . . . . . . . . . . . . . . . . . . . . . 223.2.2 Actors in e-mobility architecture . . . . . . . . . . . . . . . . . . . . . . . . . 223.2.3 Communication in e-mobility architecture . . . . . . . . . . . . . . . . . . . 243.2.4 Communication requirements . . . . . . . . . . . . . . . . . . . . . . . . . . 253.2.5 EV to EVSE communication . . . . . . . . . . . . . . . . . . . . . . . . . . . . 26
v

vi TABLE OF CONTENTS
3.2.6 EVSE to CPO communication . . . . . . . . . . . . . . . . . . . . . . . . . . . 323.2.7 Grid Service Communication . . . . . . . . . . . . . . . . . . . . . . . . . . . 343.2.8 Roaming communications . . . . . . . . . . . . . . . . . . . . . . . . . . . . . 353.2.9 Gaps in communication protocols . . . . . . . . . . . . . . . . . . . . . . . . 363.2.10 Future standards . . . . . . . . . . . . . . . . . . . . . . . . . . . . . . . . . . 37
3.3 Control . . . . . . . . . . . . . . . . . . . . . . . . . . . . . . . . . . . . . . . . . . . . 373.3.1 Aggregators . . . . . . . . . . . . . . . . . . . . . . . . . . . . . . . . . . . . . 373.3.2 Control architecture . . . . . . . . . . . . . . . . . . . . . . . . . . . . . . . . 37
3.4 Conclusion . . . . . . . . . . . . . . . . . . . . . . . . . . . . . . . . . . . . . . . . . . 403.5 Contribution summary . . . . . . . . . . . . . . . . . . . . . . . . . . . . . . . . . . . 403.6 List of publications . . . . . . . . . . . . . . . . . . . . . . . . . . . . . . . . . . . . . 40
4 Grid service applications 414.1 Frequency services . . . . . . . . . . . . . . . . . . . . . . . . . . . . . . . . . . . . . 41
4.1.1 EV charging controllability . . . . . . . . . . . . . . . . . . . . . . . . . . . . 464.1.2 Fast frequency regulation and synthetic inertia . . . . . . . . . . . . . . . . . 504.1.3 Pilot project . . . . . . . . . . . . . . . . . . . . . . . . . . . . . . . . . . . . . 53
4.2 Voltage quality in low voltage networks . . . . . . . . . . . . . . . . . . . . . . . . . 544.3 Price based smart charging . . . . . . . . . . . . . . . . . . . . . . . . . . . . . . . . . 614.4 Conclusion . . . . . . . . . . . . . . . . . . . . . . . . . . . . . . . . . . . . . . . . . . 654.5 Contribution summary . . . . . . . . . . . . . . . . . . . . . . . . . . . . . . . . . . . 654.6 List of publications . . . . . . . . . . . . . . . . . . . . . . . . . . . . . . . . . . . . . 66
5 Interoperability issues and integration challenges 675.1 What is interoperability and why is it needed? . . . . . . . . . . . . . . . . . . . . . 675.2 What interoperability problems exist in e-mobility? . . . . . . . . . . . . . . . . . . 675.3 How is interoperability ensured? . . . . . . . . . . . . . . . . . . . . . . . . . . . . . 70
5.3.1 Interoperability testing . . . . . . . . . . . . . . . . . . . . . . . . . . . . . . . 705.3.2 Recommendations for ensuring interoperability . . . . . . . . . . . . . . . . 71
5.4 Conclusion . . . . . . . . . . . . . . . . . . . . . . . . . . . . . . . . . . . . . . . . . . 735.5 Contribution summary . . . . . . . . . . . . . . . . . . . . . . . . . . . . . . . . . . . 735.6 List of publications . . . . . . . . . . . . . . . . . . . . . . . . . . . . . . . . . . . . . 73
6 Conclusion 756.1 Research conclusions . . . . . . . . . . . . . . . . . . . . . . . . . . . . . . . . . . . . 756.2 E-mobility development perspective . . . . . . . . . . . . . . . . . . . . . . . . . . . 776.3 Future work . . . . . . . . . . . . . . . . . . . . . . . . . . . . . . . . . . . . . . . . . 77
Bibliography 79
Publications
Standards for EV charging and their usability for providing V2G services in the primaryreserve market . . . . . . . . . . . . . . . . . . . . . . . . . . . . . . . . . . . . . . . . 88
Implementation of E-mobility architecture for providing Smart Grid services using EVs 98Implementation and demonstration of grid frequency support by V2G enabled electric
vehicle . . . . . . . . . . . . . . . . . . . . . . . . . . . . . . . . . . . . . . . . . . . . 106

TABLE OF CONTENTS vii
Validating a centralized approach to primary frequency control with series-producedelectric vehicles . . . . . . . . . . . . . . . . . . . . . . . . . . . . . . . . . . . . . . . 114
Evaluation of Electric Vehicle Charging Controllability for Provision of Time Critical GridServices . . . . . . . . . . . . . . . . . . . . . . . . . . . . . . . . . . . . . . . . . . . . 126
Comparison between Synthetic Inertia and Fast Frequency Containment Control Basedon Single Phase EVs in a Microgrid . . . . . . . . . . . . . . . . . . . . . . . . . . . . 132
Management of Power Quality Issues in Low Voltage Networks using Electric Vehicles:Experimental Validation . . . . . . . . . . . . . . . . . . . . . . . . . . . . . . . . . . 146
Electric Vehicle Smart Charging using Dynamic Price Signal . . . . . . . . . . . . . . . . 156Analysis of needs for on-going or incipient standards. Design of Round Robin tests and
results of the performed tests. Recommendations for existing standards . . . . . . 164


Abstract
Conventional, centralized power plants are being replaced by intermittent, distributed renewableenergy sources, thus raising the concern about the stability of the power grid in its current state.All the while, electrification of all forms of transportation is increasing the load on the transformingpower grid and potentially only contributing to the problem. However, an intelligent integrationof EVs into the grid, could not only alleviate potential self induced problems, but also make EVs avital resource for providing grid services.
This thesis investigates the technical requirements for successful EV integration into the smart grid,as a smart, mobile distributed energy resource. The work is split into three key topics: enablingtechnologies, grid service applications and interoperability issues.
The current state of e-mobility technologies is surveyed. Technologies and protocols in the fulle-mobility architecture, enabling the synthesis between EVs and smart grid, are analyzed forpotential gaps. A test system, inspired by the core of the e-mobility architecture, is implemented toenable testing of EVs providing grid services.
The grid services identified in the NIKOLA project, as potentially viable to be provided using EVs,are tested in laboratory- and field experiments. The work shows that EVs can provide a varietyof grid services on the distribution- and transmission level, such as improving voltage quality,preventing transformer overloading and frequency regulation.
The issue of interoperability in the field of e-mobility, investigated in the COTEVOS project, isexplored. It is concluded, that collective testing of the OEM equipment in testing symposiums, isthe best way to ensure interoperability between different OEMs, and to discuss as well as fix theissues in the standard itself.
Altogether, it is demonstrated that the provision of different grid services, using EVs, is technicallyfeasible. While some gaps in standards/protocols still exist, standardization committees are activelylistening to inputs from e-mobility research projects to cover them in the new versions. This enablesEVs to not only mitigate their own effects on the grid, but also provide value to grid operators,locally as well as system wide.
Finally, it is shown that active integration of EVs into the smart grid, is not only achievable, but iswell on its way to becoming a reality.
ix


Resumé
Konventionelle, centrale kraftværker erstattes af de grønne energikilder og det giver store bekym-ringer for stabilitet af elnettet i dens nyværende form. Samtidig belastningen på det transformerendeelnettet øges med stigende tendens til udskift af de konventionalle transport former med de grønneel-transport fx elbiler. Intelligent integration af elbiler i elnettet, kan ikke kun afhjælpe potentieltselvforesagede problemer, men også gøre elbiler mere tilgængelige, i form af deres evne til attilbyde ydelser til elnettet.
Denne studie har undersøgt de tekniske krav for en vellykket integration af elbiler i fremtidenssmart grid, som en smart, mobil distribueret energikilde. Studiet er opdelt i tre hovedemner: elbilteknologier, applikationer til system ydelser i elnettet og interoperabilitetsproblemer.
Den aktuelle tilstand af e-mobility teknologier er undersøgt. Teknologier og protokoller i denfulde e-mobility arkitektur, som muliggør foreningen af elbiler og smarte elnettet, analyseres medhenblik på at klarlægge potentielle mangler. Et test setup, der er inspireret af kernen i e-mobilityarkitekturen, er implementeret for at kunne muliggøre yderligere tests af elbiler, der leverer ydelseri elnettet.
De systemydelser der er blevet identificeret i NIKOLA projektet, hvor elbiler har vist sig særligtnyttive i relation til elnettet, er testet i laboratorie- og felt eksperimenter. Studiet har påvist, atelbiler kan tilbyde en række ydelser på distribution- og transmissionsniveaue, som for eksempelspændingskvalitet, modvirking af transformator overbelastning og frekvensregulering.
Spørgsmålet om interoperabilitet inden for e-mobility, hvilket blev undersøgt i COTEVOS-projektet,er udforsket. Det er konkluderet, at den kollektive test af OEM-udstyr i test symposier, ikke kuner den bedste måde hvorpå man kan sikre interoperabilitet mellem forskellige OEM’er, også atdiskutere og løse problemerne i standarderne.
I det hele taget er det påvist, at levering af forskellige systemydelser til elnettet, ved hjælp afelbiler, er teknisk muligt. Selv om nogle mangler i standarder og protokoller stadig eksisterer,er standardiseringsudvalgene åbne for input fra de forkellige e-mobility forskningsprojekter ogdækker emnerne i de nye versioner. Dette gør det muligt for elbiler ikke kun at afbøde deres egneeffekter på elnettet, men også give værdi til netoperatører lokalt og system bredt.
Endeligt er det påvist, at aktiv integration af elbiler i smart grid ikke kun er en muligthed, menallerede er i færd med at blive en realitet.
xi


Nomenclature & Acronyms
η Efficiency
E Energy
I Current
P Active power
Q Reactive power
t Time
U Voltage
AC Alternating Current
BRP Balance Responsible Party
CCS Combined Charging System
CP Charging Point
CP Control Pilot
CPO Charge Point Operator
DC Direct Current
DER Distributed Energy Resource
DR Demand Response
DSM Demand Side Management
DSO Distribution System Operator
EMSP E-Mobility Service Provider
EV Electric Vehicle
EVSE Electric Vehicle Supply Equipment
GFCI Ground Fault Circuit Interrupter
GSM Global System for Mobile Communications
HP Heat Pump
xiii

xiv RESUMÉ
HV High Voltage
HVAC Heating, Ventilation, and Air Conditioning
ICE Internal Combustion Engine
ICT Information and Communication Technology
IEC International Electrotechnical Commission
LV Low Voltage
MV Medium Voltage
OCA Open Charge Alliance
OCHP Open Clearing House Protocol
OCPI Open Charging Point Interface
OCPP Open Charging Point Protocol
OEM Original Equipment Manufacturer
OICP Open InterCharge Protocol
OpenADR Open Automated Demand Response
OSCP Open Smart Charging Protocol
PE Protective Earth
PFR Primary Frequency Regulation
PHEV Plugin Hybrid Electric Vehicle
PLC Power Line Communication
PP Proximity Pilot
PV Photo-Voltaic
PWM Pulse Width Modulation
RCCB Residual Current Circuit Breaker
RES Renewable Energy Sources
SGU Smart Grid Unit
SOC State Of Charge
TSO Transmission System Operator
V2G Vehicle to Grid
VUF Voltage Unbalance Factor

Chapter 1Introduction
1.1 The age of change
The world is facing a threat from accelerating climate change happening due to greenhouse gas fromhumanity’s emissions. These emissions are coming from multiple sectors: energy, transportation,agriculture and manufacturing. The emissions from the energy sector could be eliminated byswitching to emission free renewable resources e.g. wind and solar. This is already well underwaywith current installed wind power capacity of 153.7 GW by 2016 in Europe alone and 486.8 GW inthe whole world [1], [2]. The solar - photo-voltaic (PV) power capacity is also on the rise growingby 75 GW in 2016 to a total of around 300 GW of solar power installed in the world [3]. Combiningthis with transportation electrification, the emissions from transportation sector would also besignificantly reduced.
1.1.1 Power grid transformation
There are two main transformation trends happening in the modern electrical power system:distributed renewable energy integration and smart grid roll out. Both of these trends are welldepicted in Figure 1.1.
The power grid is transforming from fossil fueled power plants to distributed renewable energyresources. These energy resources are intermittent in nature: PVs are generating energy duringdaytime and wind generators energy output is rather stochastic. Introduction of renewable energyresources transforms the grid from centralized energy generation to a more distributed one. Thisis due to distribution of suitable geographical locations for installation of renewable energy powerplants and convenience of local installation e.g. rooftop PV. While this change improves ecologicalsituation, it brings new challenges to the power system. As renewable energy resources are sointermittent, their introduction increases the need for ancillary services to maintain the balancebetween the production and consumption in the power grid.
The other transformation coming to the power grid is a roll out of the smart grid. The main ideaof the smart grid is that the whole grid is interconnected, not only with power cables, but alsowith communication links. It is done by introduction of modern communication technologies togather information and coordinate the actions of loads and power generation units. This upgradeenables previously uncontrolled large loads to participate in maintaining grid stability by providingDemand Response (DR) as Distributed Energy Resources (DER). These loads could be electricheaters, heat pumps, refrigerators, lighting installations and newly appearing electric vehicles.
1

2 CHAPTER 1. INTRODUCTION
Figure 1.1: Smart grid concept [4].
1.1.2 Transportation electrification
In our daily lives, the most obvious source of pollution and greenhouse gas emissions, istransportation. Therefore, all modes of transportation except for rockets are currently beingelectrified. Diesel trains are being phased out as rail networks are electrified. Aerospace industry isactively researching and developing hybrid and fully electric airplanes [5]. But perhaps the loudesttransformation is happening in automotive industry. Under stricter environmental regulationsalmost every automotive Original Equipment Manufacturer (OEM) is currently producing hybridand Plugin Hybrid Electric Vehicle (PHEV) versions of their current models. Additionally, mostOEMs have announced new fully electric vehicle models coming in the near future. This wayconventional gasoline powered vehicles are being slowly replaced by EVs charged with electricityfrom the power grid. Incentives are already driving EV sales up in some countries, such asNorway - where 9 of 10 best selling vehicles in 2016 were electric or electrified [6]. Other countriesannounced their commitment to ban ICE vehicle sales in the future.All this makes the automotivecompanies, traditionally producing ICE vehicles, pledge to switch to only electric and electrifiedmodel manufacturing in near future [7].
All in all, the goal is clear - complete electrification of the transportation sector, combined withelectrical grid powered by renewable energy sources would ensure emissionless transport.
1.1.3 The fusion of two industries
Transportation and energy are two sectors that generate a large portion of global green house gasemissions [8]. Transition to distributed, intermittent energy sources and additional load of electric

1.2. THESIS OBJECTIVES 3
vehicles poses a serious threat to the stability of the electric power grid [9]. These concurrentchanges, happening in conservative energy and automotive industries, are bringing them together.
Transportation electrification brings challenges and opportunities to the transforming powergrid. On one hand uncontrolled charging of large number of EVs could make grid infrastructureoverloading - a daily issue. On the other hand, smart integration of the same EVs into smart gridcould alleviate this effect and help grid stability [10–13]. The flexibility and controllability of theEVs, combined with possibility of vehicle to grid (V2G) capability, make them almost ideal MobileDistributed Energy Resource (Mobile DER).
1.2 Thesis objectives
The main motivation behind the integration of EVs into smart grid operation is their potential abilityto provide grid services. The objective of this thesis is to investigate the technologies that enableEVs to effectively become a Mobile DER. The focus of the work, is put on overview, implementationand testing of the technologies. A handful of technologies is chosen for implementation, it is done toidentify technical gaps and propose solutions for filling them. Additionally, interoperability issues,in the field of e-mobility, are investigated. The main research question this work strives to answeris: What is technically required to convert an EV into a smart mobile distributed energy resource?This main question can be divided into components presented as the following sub-questions:
• Which grid services could EVs provide? Provision of grid services is the main motivation forintegrating EVs into the smart grid. Implementation and testing of various grid services isdone to identify the best suiting candidates for provision by EVs.
• What are technical requirements for EV aggregation? One of the key components to successfulEV integration is aggregation. It is essential to identify the communication requirementsbetween EVs and aggregators.
• What is current EV technology development status in relation to grid integration? It isimportant to assess the status of e-mobility development before proceeding with integrationinto smart grid.
• Which technical challenges are still present for EV integration? After assessing the currentstate of technology and its applications, key barriers for future development are identifiedand solutions are proposed.
• What are prerequisites and current state of EV interoperability? EV interoperability should beconsidered when integrating EVs for grid applications to enable a greater variety of resourcesto provide grid services. In this work, interoperability issues are not discussed as part thetechnical assessment of e-mobility. The issues were investigated as a part of the COTEVOSproject, thus the results are presented in a self contained chapter.
1.3 Thesis outline and research contributions
Following this introduction, the thesis is organized into 5 self-contained chapters and 9 papersattached as appendices A through I. Chapters 3, 4 and 5 outline and expand on the contributionsof the attached papers and summarize them.

4 CHAPTER 1. INTRODUCTION
Chapter 2 describes the motivation for EV integration into the smart grid and background on gridpower operation. The chapter reasons splitting the work into 3 main parts and why the focus isput on grid services, enabling technologies and interoperability issues. The enabling technologiesfor EV integration are the main focus of the work. These technologies are then divided into 3 maintopics: hardware, communication and control. The topics are briefly outlined and explored indetail in the next chapter.
Chapter 3 reviews the enabling technologies used for smart grid integration of EVs i.e. hardware,communication and software. Each technology is described in detail in a corresponding sectionwith references to the state of art and papers. The requirements for enabling technologies arecompared to state of contemporary e-mobility technologies. This comparison allows to identifytechnical shortcomings in the technologies. Additionally, design and implementation of a testsystem based on a real e-mobility architecture is presented. The chapter expands on the contentsof Pub. A and Pub. B.
Chapter 4 presents the application of previously described technologies to provide grid services.The services are chosen from the grid service catalog developed in the NIKOLA project. The chosenservices are implemented in the developed test system. In addition to theoretical description, anexperimental validation of multiple services is presented and analyzed. The results presented inpapers Pub. C, Pub. D, Pub. E, Pub. F, Pub. G and Pub. H are included in the chapter.
Chapter 5 turns the focus onto the existing and potential interoperability issues in e-mobilityinfrastructure and possible solutions for it. The chapter is mostly based on the work performedfor COTEVOS project. The findings and results e.g. test procedures designed for interoperabilitytesting, are presented and expanded upon. The chapter expands on the contents of the deliverablePub. I.
Finally, in Chapter 6, conclusions are stated with a summary of thesis contributions and outline forfuture work.
1.4 Publications
The relevant publications included in this work are the following:
A S. Martinenas, S. Vandael, P.B. Andersen, B. Christensen, ”Standards for EV charging andtheir usability for providing V2G services in the primary reserve market,” in Proceedingsof International Battery, Hybrid and Fuel Cell Electric Vehicle Symposium (EVS29), Montreal,Canada, IEEE, Jun. 2016.
B S. Martinenas, ”Implementation of E-mobility architecture for providing Smart Grid servicesusing EVs,” in International Battery, Hybrid and Fuel Cell Electric Vehicle Symposium (EVS30),Stuttgart, Germany, 2017.
C S. Martinenas, M. Marinelli, P.B. Andersen, C. Træholt, ”Implementation and Demonstrationof Grid Frequency Support by V2G Enabled Electric Vehicle,” in Proceedings of the 49thInternational Universities Power Engineering Conference (UPEC) 2014, Cluj-Napoca, Romania,Sep. 2014.
D M. Marinelli, S. Martinenas, K. Knezovic, P.B. Andersen, ”Validating a centralized approachto primary frequency control with series-produced electric vehicles,” in Journal of EnergyStorage, Vol. 7, 2016, p. 63–73.
1.4. PUBLICATIONS 5
E S. Martinenas, M. Marinelli, P.B. Andersen, C. Træholt, ”Evaluation of Electric VehicleCharging Controllability for Provision of Time Critical Grid Services,” in Proceedings of the51st International Universities Power Engineering Conference (UPEC) 2016, Coimbra, Portugal,Sep. 2016.
F M. Rezkalla, A. Zecchino, S. Martinenas, A. Prostejovsky, M. Marinelli, ”Comparison betweenSynthetic Inertia and Fast Frequency Containment Control Based on Single Phase EVs in aMicrogrid,” in Applied Energy, 2017.
G S. Martinenas, K. Knezovic, M. Marinelli, ”Management of Power Quality Issues in LowVoltage Networks using Electric Vehicles: Experimental Validation,” in IEEE Transactions onPower Delivery, IEEE, 2016.
H S. Martinenas, A.B. Pedersen, M. Marinelli, P.B. Andersen, C. Træholt, ”Electric Vehicle SmartCharging using Dynamic Price Signal,” in Proceedings of IEEE International Electric VehicleConference (IEVC) 2014, Florence, Italy, Dec. 2014.
I T.M. Sørensen, M.B. Jensen, S. Martinenas, ”Analysis of needs for on-going or incipientstandards. Design of Round Robin tests and results of the performed tests. Recommendationsfor existing standards” in COTEVOS project deliverable, Feb. 2016
Other publications
In addition to the main publications attached to this thesis, the author, during his PhD study, hascontributed to multiple other publications and a patent application. However, these publicationswere not directly included in the thesis as they are not directly related to the primary objective, orthey are partially covered by other presented papers. The following publications have also beenwritten and contributed to during the PhD study:
• A.B. Pedersen, P.B. Andersen, T.M. Sørensen, S. Martinenas, ”IPC No. B60L 11/ 18 A I. Electricvehicle battery charging controller (Patent No. WO2016087150.)”, 2016
• A.B. Pedersen, S. Martinenas, P.B. Andersen, T.M. Sørensen, H.S. Høj, “A Method for RemoteControl of EV Charging by Modifying IEC61851 Compliant EVSE Based PWM Signal,” inProceedings of IEEE International Conference on Smart Grid Communications (SmartGridComm)2015 Miami, Florida, Nov. 2015.
• A. Kieldsen, A. Thingvad, S. Martinenas, T.M. Sørensen, “Efficiency Test Method for ElectricVehicle Chargers,” in Proceedings of International Battery, Hybrid and Fuel Cell Electric VehicleSymposium (EVS29), Montreal, Canada, Jun. 2016.
• A. Thingvad, S. Martinenas, P.B. Andersen, M. Marinelli, B. Christensen, O.J. Olesen,“Economic Comparison of Electric Vehicles Performing Unidirectional and BidirectionalFrequency Control in Denmark with Practical Validation,” in Proceedings of the 51st InternationalUniversities Power Engineering Conference (UPEC) 2016, Coimbra, Portugal, Sep. 2016.
• K. Knezovic, S. Martinenas, P.B. Andersen, A. Zecchino, M. Marinelli, “Enhancing the Role ofElectric Vehicles in the Power Grid: Field Validation of Multiple Ancillary Services,” in IEEETransactions on Transportation Electrification, 3(1), 201 - 209. DOI: 10.1109/TTE.2016.2616864

6 CHAPTER 1. INTRODUCTION
• M. Rezkalla, S. Martinenas, A. Zecchino, M. Marinelli, E. Rikos, “Implementation andvalidation of synthetic inertia support employing series produced electric vehicles,” inProceedings of CIRED 2017, Glasgow, Scotland, Jun. 2017.

Chapter 2Synthesis between EVs and the Smart
Grid
In this chapter, the background provision of grid services is presented, which is the core motivationfor smart grid integration of EVs. Then the requirements for converting the EV into a mobile DERand reasoning for splitting the thesis into 3 main parts: grid services, technical requirements andinteroperability issues, are presented. The topics are then briefly outlined and explored deeper inthe corresponding chapters.
2.1 Why integrate EVs into the smart grid?
The reason for integrating EVs into the power grid is their potential ability to provide grid services.Grid services are an essential part of daily grid operation. To better understand the need for theseservices, the power grid structure, operation and ongoing transformation is explained.
2.1.1 Grid structure and operation
Typical electrical power grid has two levels: transmission and distribution as shown in Figure 2.1.
GeneraonRed: Blue: Green:
Primary Customer
Transmission Distribuon
Black: Customer
Substaon Step Down
Transformer
Transmission grid
Generang Transmission CustomerStep Up
Transformer
Generang Staon
Color Key:
Subtransmission Customer
Secondary CustomerD
istr
ibu
on g
rid
Figure 2.1: Simple diagram of electricity grids [14].
The power produced by the generation plants is fed through the step up transformers to the highvoltage transmission lines. These lines are historically designed to cover long distances betweencentralized generation and remote consumption areas as well as for interconnection betweendifferent areas. Once the transmission line reaches the area where the power will be consumedit is transformed into Medium Voltage (MV) distribution lines. Some bigger consumers, such asindustrial scale manufacturing plants, are connecting directly to the MV lines. Typical MV lines,distribute the power in the area by transforming down into local Low Voltage (LV) feeders thatthen connect to individual consumers.
7

8 CHAPTER 2. SYNTHESIS BETWEEN EVS AND THE SMART GRID
2.1.2 System wide services
The power grid is a balanced system, where generation and consumption are in constant equilibrium.This means that the power produced by the generators should always equal to the power consumedby the grid loads. That is ensured by forecasting the consumption that generators then follow.The predictions of the consumption profile are not always accurate, the bigger power imbalancesare accommodated by balancing energy sources. This balancing energy is usually imported fromadjacent areas or local power plants that are contracted to increase their power production ondemand. The smaller, more immediate fluctuations in the power balance of the grid are resolvedby system-wide ancillary services - frequency regulation reserves.
The frequency regulation reserves in the power grid are typically divided into the three levels:primary, secondary and tertiary. An overview of the activation timing of different frequencyregulation reserves is shown in Figure 2.2.
Figure 2.2: Frequency reserve activation timing [15]
Primary reserve is always active and has a short activation period. Secondary reserve is activatedto relieve the primary reserve providers and restore frequency to the nominal value. Tertiaryreserves are used in exceptionally long and large frequency deviations, to aid the secondary reservein restoring the frequency to normal operating value.
Typically, each synchronous region ,or even each Transmission System Operator (TSO), has theirown definition of the frequency regulation services. A unique feature of the Danish power grid isthat it is located in two separate synchronous regions as shown in Figure 2.3.
DK1 region that covers Jylland (continental part of Denmark) and island of Fyn is connected to therest of continental Europe. DK2 region covers the islands of Sjælland and Bornholm connected toother Nordic countries. Each region has three levels of frequency regulation reserves, defined by aDanish TSO Energinet.DK [16].
DK1 region has frequency regulation reserves like the rest of Europe:

2.1. WHY INTEGRATE EVS INTO THE SMART GRID? 9
Figure 2.3: Danish power grid areas DK1 and DK2
• Primary Reserve - restores balance between production and consumption, stabilizing thefrequency close to 50Hz. The regulation is automatic, power output of the reserve is controlledby frequency deviation, with a small permitted deadband.
• Secondary Reserve - is enabled during major operational disturbance. It is used to indirectlyrestore frequency to 50Hz followed by stabilization by primary reserve. It also serves thepurpose of releasing the activated primary reserve. The regulation is automatic and controlledby a signal from Energinet.dk.
• Manual Reserve - is used to restore system balance, acting as a tertiary reserve. It is activatedmanually from Energinet.dk’s Control Center.
DK2 region also has similar reserves like the rest of the Nordic power system:
• Normal Operation Reserve - ensures that production and consumption equilibrium is restored.The regulation is automatic and controlled by frequency deviation, without deadband.
• Disturbance Reserve - is a fast reserve, activated in the event of major system disturbances.It is started automatically in the event of sudden frequency drop under 49.9Hz and remainsactive until frequency is restored or manual reserve takes over.
• Manual Reserve - is used to restore system balance, acting as a tertiary reserve. It is manuallyactivated from Energinet.dk’s Control Center.
2.1.3 Distribution grid services
Distribution grid have been historically designed for unidirectional power use - bringing electricityto the consumer. Therefore most grids have a radial topology, sometimes with quite long feederlines. An example distribution feeder topology is shown in Figure 2.4.

10 CHAPTER 2. SYNTHESIS BETWEEN EVS AND THE SMART GRID
Figure 2.4: LV feeder topology example.
Traditionally, distribution grids are planned and upgraded for increasing customer demand, thusavoiding power supply security issues. While transmission system operators have a well definedset of services they procure to keep the grid stable, the distribution grid operators do not. Thathowever does not mean that distribution grid has no problems or is unregulated. Local distributiongrids also suffer from problems usually called power quality issues. Common power quality issuesthat occur in the local grids are over- and under-voltages, voltage unbalances, transformer andline overloading. These problems are typically created by high loads unevenly distributed amongthree phases.
Figure 2.5 illustrates the voltage drop that naturally occurs on a long feeder line due to its internalimpedance.
Figure 2.5: Voltage drop on a long feeder line.
The voltage drop on a feeder line can be calculated from:
∆U = (R+ jX) · I = (R+ jX) · (P + jQ)∗
U∗r
= RP +XQ
U∗r
+ jXP −RQ
U∗r
(2.1)
As the voltage angle between the nodes is very small, the imaginary part can be disregarded andthe voltage drop simplifies to:

2.1. WHY INTEGRATE EVS INTO THE SMART GRID? 11
∆U ≈ RP +XQ
Ur(2.2)
As can be seen from the resulting equation the magnitude of the voltage drop is directly proportionalto the increasing active power load on the feeder.
In the unbalanced 3 phase systems heavy loading of one or two of the phases might bringunder-voltage issues to those phases. At the same time the voltage on the remaining lightly loadedphase is raised and could potentially create over-voltage problem. In Europe the limits of thedistribution grid voltages are defined by EN50160 [17].
2.1.4 Smart grid services
Until recently, in the conventional power grid, only large generators and industrial consumerscommunicated with the grid operators. However, this is recently changing with the transformationinto the age of smart grid. The power grid that utilizes communication technologies to communicatewith and control the distributed energy resources is called smart grid. Introduction of distributedenergy resources and new communication technologies now enable for every consumer to beconnected not only to the power grid but also communicate with the grid operators. Suchcommunication and control technology enables the consumers to participate in grid services. Inparticular the focus is put on the integration of local generation units like rooftop PV and biggerhousehold loads e.g. electric heaters, heatpumps and electric vehicles.
There are several reasons to integrate EVs in the smart grid, making them a sort of a mobiledistributed energy resource. Firstly, controlling the charging of large numbers of EVs using smartalgorithms would reduce local grid congestion and power quality issues [18, 19]. The issuespotentially created by the EVs themselves, being large number of high power loads. Secondly, as aflexible, controllable and fast energy resource, EVs could provide ancillary services for the grid e.gfrequency regulation.
An extensive amount of research shows that controllable EVs could be used for lowering theimpact on the power system or providing different ancillary services e.g. frequency regulation,congestion reduction, voltage quality improvement [10, 13, 20–24]. Table 2.1 displays some of thechosen grid services that EVs could potentially provide, identified in NIKOLA project [25].
Table 2.1: List of grid services from the NIKOLA service catalog [26].
Service Group Name Exist in DenmarkSystem-wide Frequency Regulation Yes
Fast Frequency Regulation NoSecondary Regulation YesTertiary Regulation YesSynthetic Inertia NoSmart Charging Yes
Distribution grid Mitigation phase unbalance in LV feeder NoIslanded microgrid and black start -MV-LV transformer line overloading NoVoltage quality improvement in LV feeder No
12 CHAPTER 2. SYNTHESIS BETWEEN EVS AND THE SMART GRID
Grid services were divided into two grid levels described earlier. While most system wideservices were inspired by their existing counterparts, distribution services were developed fromthe commonly occurring issues and grid codes.
All services were given an implementation priority, based on available technology as well asrelevance to current and near future issues in Danish grid.
Grid services marked with high priority were implemented in experimental validations during thisPhD study. Implementations and test results are discussed in detail in Chapter 4 and correspondingattached papers.
2.2 EV as a smart mobile distributed energy resource
Enabling EVs to provide grid services requires converting them into a distributed energy resource.There are technical and regulatory requirements to transform EVs into mobile DER in smartgrid. This thesis is focusing on the technical requirements, while regulatory challenges are onlymentioned.
Regulatory requirements for EV integration as grid service providers are:
• Permission to provide services by aggregated units - many grid operators currently allowgrid service provision only by large centrally located units. Aggregation of large numbers ofEVs would allow for providing the same service even with the distributed fleets.
• Revision of distribution grid regulations for EVs. As relatively new household loads EVshave no grid regulation requirements (besides feeder power capacity) to be connected to thegrid. As they are large loads and could potentially worsen power quality issues in the localgrid, appropriate grid code for EVs should be developed. This grid code could be inspiredby existing PV inverter regulations, as they had to undergo a similar process.
• Establishment of incentive schemes for grid service provision, especially relevant for distri-bution grid services. As it is evident from numerous trials, monetary incentive is the bestway to motivate EV users to participate in grid service provision.
On the technical side, to integrate a distributed energy resource, specifically an EV, into the smartgrid there are three main technical requirements:
Controllable hardware - EVs have three main components: electric drivetrain, energy storage andauxiliary electronics. The large batteries and high power controllable chargers are the mainparts that make EVs interesting for grid integration. Built-in AC chargers and an optionalcapability to be connected to an external DC charger can be found in every modern EV.
Communication channel - even minimal EV to EVSE communication is a necessary part of thecharging standards (e.g. IEC 61851, IEC 15118, CHAdeMO). Majority of modern chargepoints also have communication links (e.g. GSM, wireless or cable connection) to the chargepoint operator for maintenance and control purposes. These and other communication linksto the higher level actors are vital for EV to grid integration.
Control software - a large number of connected and controllable EVs can be managed by a singlecentralized entity usually called EV aggregator. It implements the control strategy and sendspower set-points for individual vehicles.

2.2. EV AS A SMART MOBILE DISTRIBUTED ENERGY RESOURCE 13
These three requirements are discussed in detail in Chapter 3. There, the EV hardware capabilitiesare overviewed, contemporary e-mobility communication standards are presented and analyzedfor compliance. Additionally a controller architecture based on these standards is presented.
The controller is then implemented for a variety of system-wide and distribution grid services,that EVs could provide, in Chapter 4.
Additional requirement that is often overlooked is interoperability. Interoperable equipment andinfrastructure greatly increases scale on which the grid integration of EVs could be applied. Theissue of interoperability in e-mobility context is discussed in Chapter 5.


Chapter 3Enabling technologies: hardware,
communication and control
Integration of electric vehicles into smart grid raises the need for corresponding technologies. Thischapter overviews and describes the technologies used for smart grid integration of EVs. Theessential enabling technologies can be divided into three categories: hardware, communication andcontrol. Firstly, physical infrastructure components are described to give the necessary technicalbackground. Secondly, communication infrastructure and requirements identified during thePhD study are presented. This is followed by relevant descriptions of communication protocols.Once all of the relevant protocols are introduced, the results of their analysis to fit for use in EVintegration with the grid services is presented. Thirdly, after reasoning about the need for EVaggregation, multiple versions of the control architectures developed during the PhD study aredescribed.
3.1 What are EVs made of?
Before diving into the grid applications of EVs it is essential to familiarise with the design of anelectric vehicle. Figure 3.1 shows an grid connected EVSS that is connected to an EV. The diagramis focusing on the power electronics components of the EV.
Figure 3.1: EV connected to an EVSE, with detailed view of the EV power electronics components.
15

16CHAPTER 3. ENABLING TECHNOLOGIES: HARDWARE, COMMUNICATION AND
CONTROL
The colors in this and following component diagrams depict the function of the component: Green- microcomputer based control electronics aka controllers; Red - power electronics components;Yellow - batteries; Grey - grid and safety breakers.
Electric vehicle powertrain is simple and can be split into 3 main parts: drivetrain power electronics,energy storage and auxiliary power components. Typical contemporary EV uses 3 phase ACmotor, which is powered by a motor inverter. The speed and power of the motor is controlledby the inverter via changing the frequency and amplitude of the 3 phase AC signal. The invertergenerates this 3 phase AC signal from DC power coming from the vehicle battery.
Vehicle battery is the biggest and heaviest part of the vehicle powertrain, it stores all the energyrequired for vehicle operation. The battery is monitored and protected by a Battery ManagementSystem (BMS) that keeps battery operating in the safe operating area. Typically the battery ischarged by a built-in charger that is basically an AC-DC converter. The battery is also chargedwhen vehicle is slowing down, by the effect known as regenerative braking. In this case the electricmotor becomes an AC generator and the inverter converts this back to the DC energy that is fedback into the battery.
Auxiliary power electronics are typically powered from an auxiliary 12V battery, that in turn ischarged from the main battery via DC-DC converter.
From the perspective of smart grid, EVs are viewed as a mobile distributed energy resource orsimply a battery on wheels. Therefore two main components of the EV are of interest: battery andcharger, which will be examined closer next.
3.1.1 Battery
Modern EVs typically use high voltage lithium-ion batteries of varying chemistries as a mainenergy storage. The most common battery chemistries are lithium-manganese with nickel-manganese-cobalt(LMO/NMC) blend and nickel-cobalt-aluminum(NCA). EV battery packs aremade of hundreds or even thousands of individual battery cells connected in series and/or parallelconfigurations. This is done due to the fact that individual lithium-ion cell voltage ranges around3.7 V, but the motor inverters are designed for input voltage of hundreds of volts. The cells comein different shapes and sizes e.g. cylindrical (18650 or 2170 standard) or rectangular as shown inFigure 3.2.
Figure 3.2: Comparison of battery cell sizes [27].

3.1. WHAT ARE EVS MADE OF? 17
Once the cells are assembled into a battery pack, the voltage range from a few hundred to around400 V. Future EV models are planning to use battery packs with voltages as high as 800 V to enablehigher charging powers without increasing charging current.Contemporary OEM EV batterypack capacities range from 16 to 100 kWh providing from 100 to over 500km range. The batteryis managed by a battery management system which tries to keep the battery cells inside safeoperating area by monitoring their voltage, current and temperature among other parameters.
3.1.2 ChargerTwo types of chargers are typically used for EVs - onboard AC chargers and external DC chargersalso called fast chargers. The names of Alternating Current (AC) and Direct Current (DC) chargercome from the type of the current that is used in the charging plug.
AC charging
Most electric vehicles currently in the market come with a build-in AC charger that allows theuser to charge the vehicle almost anywhere as long as at least a simple electrical socket and cableadapter is available. Figure 3.3 displays a most common EV charging architecture in the e-mobilityfield - an AC charging setup.
Figure 3.3: Electrical AC charging architecture.
The setup consists of a grid connected EVSE that is connected to an EV via charging cable. Oncethe EV is connected and ready to charge, the grid breaker inside the EVSE is closed. The AC powerthen flows to the vehicle where it is converted to DC current that charges the battery. The chargingcable between the EV and EVSE has a simple communication link for ensuring safe chargingprocess. This link uses a simple analog signal based communication from IEC 61851 standard ormore advanced Power Line Communication (PLC) according to IEC 15118 standard. Finally, anEVSE typically has a communication channel to a Charge Point Operator (CPO).
Figure 3.4 shows a charging point made by DTU, mostly from available industrial components.
This charging point is using Phoenix Contact EVSE Controller to support IEC61851 standard and aBeaglebone Black microcomputer as a communication controller that connects the EVSE to CPOusing OCPP protocol. Typical charging spot also includes electrical protection components likeshort circuit breaker/fuse, a residual-current circuit breaker (RCCB) (also known as ground faultcircuit interrupter (GFCI)) and an EVSE controlled relay that connects the EVSE charging socket tothe grid. It should be noted that it is common to use EVSE and Charging Point as interchangeableterms, although they do not mean exactly the same thing. An EVSE represents a single supplyequipment interface, therefore a Charging Point contains one or more EVSEs in it.
18CHAPTER 3. ENABLING TECHNOLOGIES: HARDWARE, COMMUNICATION AND
CONTROL
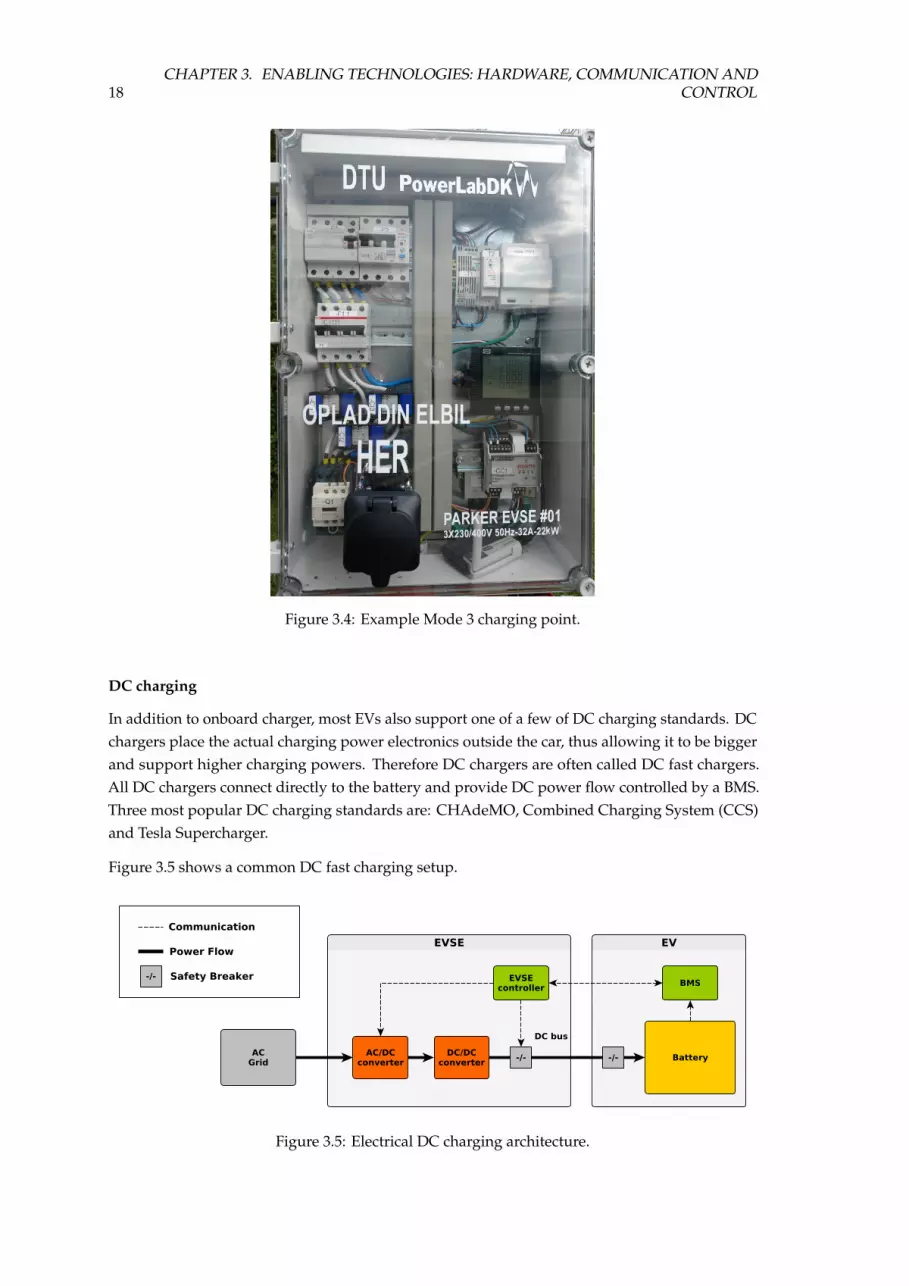
Figure 3.4: Example Mode 3 charging point.
DC charging
In addition to onboard charger, most EVs also support one of a few of DC charging standards. DCchargers place the actual charging power electronics outside the car, thus allowing it to be biggerand support higher charging powers. Therefore DC chargers are often called DC fast chargers.All DC chargers connect directly to the battery and provide DC power flow controlled by a BMS.Three most popular DC charging standards are: CHAdeMO, Combined Charging System (CCS)and Tesla Supercharger.
Figure 3.5 shows a common DC fast charging setup.
Figure 3.5: Electrical DC charging architecture.

3.1. WHAT ARE EVS MADE OF? 19
Similarly to the AC charger, this setup also consists of the grid connected EVSE. However, the AC toDC power conversion happens in the EVSE, instead of the EV. Once the EV and EVSE are connectedby a charging cable and the secure connection is confirmed by the high level communication aswell as multiple safety pins on the connector, the charging of the battery starts. In the DC fastcharging case the EVSE connects directly and charges the EV battery under supervision fromthe vehicle BMS. This entails exchange of charger and vehicle battery parameters as specified byIEC 61851-23 and IEC 61851-24.
V2G
Vehicle to Grid (V2G) is an ability of an electric vehicle to supply power back to the power grid.Just like with charging technologies, there are two main ways to enable vehicle to grid capabilityin the EV: AC and DC.
AC V2G requires built-in inverter capability inside the vehicle charger, where DC V2G requires theuse of an external bidirectional DC charger that just directly connects to vehicle battery using fastcharging DC connector. The following are three (two AC and one DC) V2G architectures currentlyused in EV grid applications.
Vehicle to grid implementation inside the vehicle also known as AC V2G is more complicated toimplement. Figure 3.6 shows an AC V2G architecture, where bidirectional charger is built into thevehicle.
Figure 3.6: V2G architecture for integrated charger/inverter e.g. AC Propulsion eBox.
Here the EV powertrain is more complex as it was designed with bidirectional grid power flow inmind. This approach allows for a compact power electronics unit (PEU) size, but more complicatedelectronics and increased production costs. One could also notice a vehicle management system(VMS) on the figure, it is responsible for coordinating the actions between user, BMS and PEU.Example vehicles with such powertrain produced by AC propulsion are AC propulsion eBox andBMW Mini-E [28]. Both of these vehicles were used in University of Delaware grid integratedvehicle studies [29].
Figure 3.7 shows another AC V2G architecture where charger and inverter are separate, thusrelying on relays to switch between charging and discharging modes.
This way almost any EV could be retrofitted to enable AC V2G capabilities, by adding an inverterand Inverter Management System (IMS). This solution requires sacrificing some storage space to
20CHAPTER 3. ENABLING TECHNOLOGIES: HARDWARE, COMMUNICATION AND
CONTROL
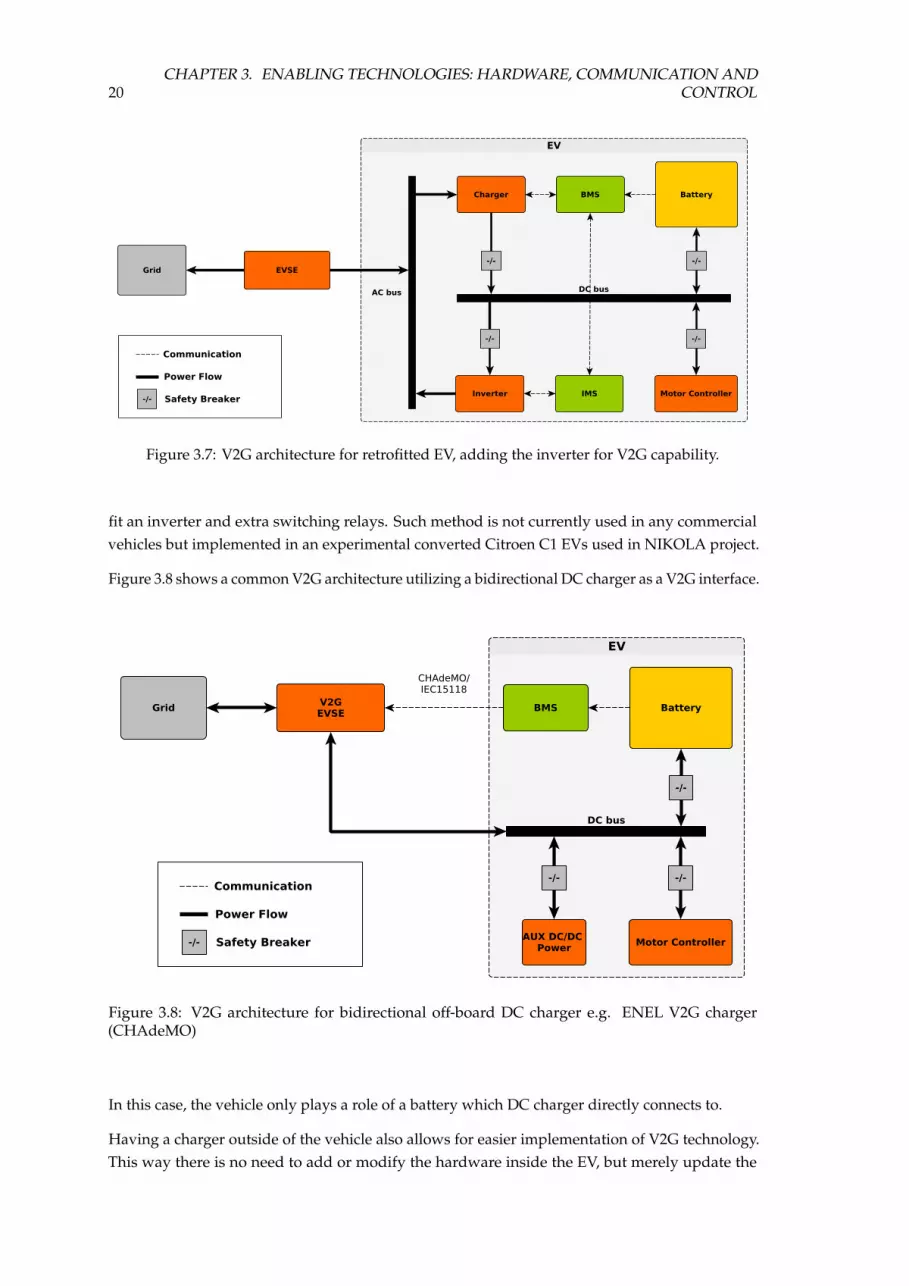
Figure 3.7: V2G architecture for retrofitted EV, adding the inverter for V2G capability.
fit an inverter and extra switching relays. Such method is not currently used in any commercialvehicles but implemented in an experimental converted Citroen C1 EVs used in NIKOLA project.
Figure 3.8 shows a common V2G architecture utilizing a bidirectional DC charger as a V2G interface.
Figure 3.8: V2G architecture for bidirectional off-board DC charger e.g. ENEL V2G charger(CHAdeMO)
In this case, the vehicle only plays a role of a battery which DC charger directly connects to.
Having a charger outside of the vehicle also allows for easier implementation of V2G technology.This way there is no need to add or modify the hardware inside the EV, but merely update the

3.1. WHAT ARE EVS MADE OF? 21
BMS firmware to allow reverse power flow on a DC charging connector. This approach is alreadyimplemented in CHAdeMO protocol as a part of CHAdeMO V2X technology [30]. V2X meansvehicle to anything, allowing vehicles to supply power to stand-alone loads or islanded houses.
Figure 3.9 is showing 10kW bidirectional ENEL DC fast charger from Parker project, connected toPSA iOn and providing primary frequency regulation to DK2 grid.
Figure 3.9: 10kW ENEL DC V2G charger connected to PSA iOn EV providing frequency regulationfor DK2 grid.
As discussed previously, DC fast chargers connect directly to the EV battery, so the process ofusing V2G charger is identical to using any other DC fast charger. Therefore every vehicle thatsupports DC fast charging e.g. using CHAdeMO protocol, can be used for V2G services after aBMS firmware update.
Important characteristics of chargers for grid service provision are: response time, efficiency, powerstep and ramping rate [18, 31].
Wireless charging
Another type of charging that is currently being actively developed and would free EV users fromfiddling with cables is wireless charging. There are two main development paradigms in wirelesscharging: dynamic and static. Dynamic wireless charging enables vehicle to recharge while it ismoving over a series of coils integrated under the road surface [32]. Static wireless charging ismeant for vehicle recharge while it is parked [33].
Wireless charging has rather obvious pros:
• Does not require any cables - park and charge, which greatly simplifies charging process.
• Reduces the battery size requirement - in case of dynamic wireless charging, as the vehicle isconstantly being recharged while driving.
• Future proof - easy to automate using self driving EVs. Integration of robotic actuators in theconventional cabled charging points is much more complicated than just parking in a preciseposition.

22CHAPTER 3. ENABLING TECHNOLOGIES: HARDWARE, COMMUNICATION AND
CONTROL
Unfortunately, with the current state of technology it also has a few cons:
• Low efficiency - requiring precise positioning.
• Limited power - due to coil size limitations and available power electronics [34].
• Safety concerns - nearby humans and animals could be affected by strong EM fields.
• High installation costs - especially for dynamic charging systems.
• Lack of standards - a few communication and hardware safety standards are being developed,but none have been completed yet.
Wireless charging is still in the early development stages, but it is already considered a future ofe-mobility. Additionally, it is investigated if static bidirectional wireless charging could be used toprovide grid services [35–37].
3.2 Communication in e-mobility
E-mobility is a very broad term that includes all of the electric transportation means. In thiswork, e-mobility is focusing on the particular type of electric vehicle - electric car. First chargingpoints for EVs were mostly stand alone, later on with the advent of public charging infrastructurescharging point operators came into play. Maintenance and control of large, spread out charginginfrastructure required communication channels to each charging point. This development in thecharging infrastructure also brought opportunities for integration between EVs and the powergrid. Therefore, communication in e-mobility is becoming a very important topic.
3.2.1 E-mobility architecture
Figure 3.10 shows the e-mobility architecture inspired by the results of the COTEVOS project[38]. In the figure, e-mobility infrastructure and high level actors are depicted in blue and greenrespectively. The power grid and energy market related actors are depicted in grey and orangerespectively. The hexagonal shapes represent the physical actors e.g. EV, EVSE and grid.
The diagram shows the communication and interaction links between the individual actors. Thehighlighted part in red shows the essential e-mobility structure for grid integration of EVs. Herethe EV and EVSE pair is the device providing a grid service. The CPO and EMSP in this caseoperate and facilitate the aggregation of the vehicles as well as interface to the grid operator.
3.2.2 Actors in e-mobility architecture
As shown in the Figure 3.10, there are many actors in e-mobility architecture. The roles of theseactors are described below.
EV, OEM and User
Perhaps the most important actor in the whole infrastructure is the electric vehicle together withthe user. The EV provides transportation to the user and potential service to the grid. The servicesare enabled by the flexibility of the user coming from his/hers daily habits. The Original EquipmentManufacturer (OEM) of the vehicle plays important role as a technology enabler. The OEM ismaking and servicing the machine that is both comfortable to use and including the features thatcould aid the grid.

3.2. COMMUNICATION IN E-MOBILITY 23
Figure 3.10: E-mobility architecture.
EVSE
Electric Vehicle Supply Equipment (EVSE) plays the role of the physical interface between theEV and the power grid. It also often includes a communication channel to the CPO and a gridoperator.
CPO
The role of the Charge Point Operator (CPO) is to operate and maintain a network of chargingpoints.
EMSP
While a CPO and E-Mobility Service Provider (EMSP) is often the same entity in the currente-mobility applications, it is important to distinguish their difference. EMSP is meant to handlecommunication and billing towards the EV user and clearing house.
Clearing House
The role of the Clearing House is to facilitate automatic clearing of billing processes producedby charging at different charging service providers. The actor is inspired by the clearing housepresent in mobile telecommunication industry.
Energy Market
Energy market is a commodity market where energy trading is happening. In the context ofe-mobility, it refers to electricity market.

24CHAPTER 3. ENABLING TECHNOLOGIES: HARDWARE, COMMUNICATION AND
CONTROL
Energy Provider
Also known as energy supplier or energy utility, it often shares the responsibility as a local gridoperator.
Grid Operator, Generation and Grid
The entity that operates and maintains the grid. Transmission grids and grid stability are usuallymaintained by a TSO, whereas local distribution grid and power quality is usually maintained bya DSO.
Aggregator
An actor that is not explicitly shown on the e-mobility architecture, but is very important forintegration between EVs and the grid. EV aggregator is responsible for aggregating large numbersof EVs, into a virtual power plant or virtual battery, to provide grid services.
3.2.3 Communication in e-mobility architecture
As mentioned before, a vital technical requirement for EV integration in a distributed smart grid iscommunication. All the communication links between e-mobility and grid operation actors werepresented in Figure 3.10. There are a few mainstream communication standards and specificationsthat enable EV integration as a DER [39]. These standards/specifications are reviewed for relevantcommunication links shown in the e-mobility architecture. Figure 3.11 shows only the main actorsof e-mobility architecture with communication protocols between them.
Figure 3.11: Main e-mobility architecture with communication protocols.
The diagram highlights the main areas of the communication protocol analysis:
EV-EVSE - communication between the vehicle and the charging point.
EVSE-CPO - communication between the charging point and the charge point operator.

3.2. COMMUNICATION IN E-MOBILITY 25
Roaming - communication protocols enabling roaming services for EV users. Involved actors are:EMSP, Clearing House and CPO.
Grid service communication - communication protocols essential for grid service provision,focusing on grid operator and aggregator communication. Involved actors: EV, EVSE, CPO,Aggregator, Grid Operator.
As can be seen in the diagram, an EV aggregator has been added to the picture to clarify its locationand communication links.
3.2.4 Communication requirements
For implementation of intelligent control (for grid services or smart charging) the aggregator needsto gather as much information as possible from individual EVs. The parameters can be dividedinto three groups: essential, quality-improving and optional parameters. The essential parametersare necessary to provide any kind of grid service. Essential parameters are:
(Dis)Charging power limits - in kW usually the numbers are symmetrical in V2G case
Available energy in the battery - in kWh or state of charge in % could also work if the batterysize is known
Indication of plugged-in car - helps determining if the charging point is occupied
Vehicle Identification Number - or any other unique user/vehicle identification
Quality-improving parameters mostly improve the user experience and service availabilitypredictions of the aggregator. Quality-improving parameters are:
Required energy for driving - essential parameter for user comfort and flexibility estimation
Departure time - greatly improves available flexibility estimation
Optional parameters are could be to enable future functionality like driving pattern prediction orbattery degradation estimation. Optional parameters are:
Car make and model - useful in estimating battery size and charging power limitations
Odometer reading - for driving pattern identification
Battery temperature - for minimizing battery degradation
Additionally, to provide grid services an aggregator needs information about the local grid, thatservice providing EVs are connected to:
Voltage - at the EVSE, preferably with knowledge of the EVSE location on the feeder
Charging current - actual charging current of the EV for a feedback loop
Line current limit - essential for providing congestion management
Frequency - as input for a frequency regulation service, could be measured by a centralizedmeasurement device as long as all the vehicle are in the same synchronous area
Now the communication protocols for each area will be described and analyzed for fulfillment ofcommunication requirements.

26CHAPTER 3. ENABLING TECHNOLOGIES: HARDWARE, COMMUNICATION AND
CONTROL
3.2.5 EV to EVSE communication
While the history of modern EVs is just over a decade old, multiple disagreements about chargingplug design also led to quite a few communication standards between EV and EVSE.
IEC 61851
The IEC 61851 is considered to be the main EV to EVSE communication standard for AC charging,the US counterpart of this standard is called SAE J1772. It defines the basic physical and safetyrequirements to enable EV charging. A typical Type 2 EV connector is shown in Figure 3.12.
Figure 3.12: Type 2 EV plug [40].
This plug contains 3 phase power pins: L1, L2 and L3; a neutral pin N; protective earth pin PE;proximity pilot pin PP for cable identification; and a control pilot pin CP for communication.
The standard uses one pin, called control pilot (CP) to communicate between the vehicle andEVSE. The communication is analog - simple low level pulse width modulation (PWM) signal andvoltage levels. Figure 3.13 illustrates signaling on CP pin between EV and EVSE during a typicalIEC 61851 charging session.
It also shows the relevant events in the sequence and timing constrains for those events.
The sequence of events presented by numbers in Figure 3.13 is described as follows:
1. Before the vehicle is connected, an EVSE sets a +12V constant signal on the pilot pin. Thisstate is called A.
2. After the vehicle has connected, the voltage on the pin drops to 9V due to a resistor in thevehicle, that creates a voltage divider with the EVSE. This state is called B.
3. The EVSE start a PWM signal generator of 12V and 1kHz frequency. The duty cycle of thePWM signal is indicating the maximum charging current in amperes the EV can charge with.
4. Vehicle indicates its readiness to charge by closing a switch S2 which connects another resistorinside an EV, thus dropping the CP signal voltage to 6V. This indicates the transition to stateC. If the voltage drops to 3V, that means the vehicle is requesting ventilation for charging,due to possible fumes coming from the battery. The vehicle ready state with ventilation iscalled state D.

3.2. COMMUNICATION IN E-MOBILITY 27
Figure 3.13: IEC 61851 signaling diagram from [41].
5. EVSE closes the grid contactor, enabling the vehicle to charge. If the vehicle is in state D, thecontactor is only closed once the ventilation is started.
6. The EV starts drawing current from the grid.
7. The charging current limit can be dynamically adjusted by changing the duty cycle of thesignal and the vehicle has to respond within 5 seconds. The conversion between chargingcurrent and duty cycle values is described in Table 3.1.
8. Vehicle finishes charging.
9. Vehicle switches to state B indicating readiness to disconnect from the EVSE.
10. The grid contactor is opened after EVSE detects vehicle request to disconnect (state B).
11. Vehicle is disconnected from the EVSE. The CP signal returns to 12V - state A.
The important timing considerations in the Figure 3.13 are the following:
tACon - beginning of AC power supply top the EV after detecting state C or D, maximum 3 s.
texternaltoEV SE - modification of PWM signal duty cycle in response to an external command tothe EVSE, maximum 10 s
tichange - change of charging current following the change in the duty cycle of the PWM signal onCP line, maximum 5 s.
tACoff - stop charger current draw, maximum 3 s.

28CHAPTER 3. ENABLING TECHNOLOGIES: HARDWARE, COMMUNICATION AND
CONTROL
Table 3.1: Maximum charging current conversion table
Duty cycle Maximum currentValue < 3% Not allowed
3% ≤ value ≤ 7% Digital communication7% < value < 8% Not Allowed
8% ≤ value < 10% 6A10% ≤ value ≤ 85% Current = value x 0.6A85% < value ≤ 96% Current = (value - 64) x 2.5A96% < value ≤ 97% 80A
Value > 97 % Not Allowed
Other timing constrains are not considered as most of them have no maximum limit and are notimportant to EV charging process from grid service perspective.
Figure 3.14 illustrates a visual representation of a PWM duty cycle conversion to a maximumcharging current described in Table 3.1.
Figure 3.14: IEC 61851 PWM duty cycle to maximum charging current conversion graph [41].
The pin in the charging cable indicating the presence of the plug - it is called plug present (PP)pin. This pin contains a resistor connecting to protective earth (PE) pin. The value of this resistorindicates the maximum current rating for that cable e.g. 16A, 20A, 32A or 63A.
Initial design of the standard did not enable high level digital communication, an extension of thisstandard was made - IEC 61815-1 Edition 3 Annex-D. This annex extends the physical layer of thestandard on EV and EVSE sides and adds minimal higher level communication descriptions [42].
IEC 61851 has been described in such detail due to its importance in the implementations ofexperimental validations presented in Chapter 4.
ISO/IEC 15118
The need for proper high level communication standard for EV to EVSE communications hasfueled the development of IEC 15118 standard. It closes the gap in communication requirements

3.2. COMMUNICATION IN E-MOBILITY 29
between EV and EVSE, creating a digital information transfer channel between EV and EVSE. Thestandard builds on top of the IEC 61851, which is used as a fallback option if either party does notsupport the new protocol. A major part of the IEC 15118 is based on, and is interoperable withthe German DIN 70121 specification. The support for digital communication is indicated by theEVSE with 5 % duty cycle in the IEC 61851 initialization state. The communication link is thenestablished using powerline communication (PLC) on top of the PWM signal running on the CPpin [43]. This enables high level communication to take place, which is based on TCP/IP networksetup with possible security features like transport layer security (TLS). The standard enables aplug and charge mode, which does not require user interaction with the charging spot, besides justplugging in the vehicle.
Figure 3.15 shows the 5 layers of the standard.
Figure 3.15: IEC 15118 layers [44].
As can be seen in Figure 3.15, the physical layer of the standard (described in IEC 15118-3) is basedon HomePlug Green PHY specification used in household range extending WiFi power sockets[45], [46]. On top of the physical layers lies a fairly common IP network stack with options forsecure communication i.e. TLS encryption. Finally, topmost is the application layer (described in15118-2) that enables the main functionality of the standard (described in 15118-1) [47, 48]. IEC15118 application layer includes the exchange of many information objects that are missing fromother communication protocols e.g. state of charge. Although many of them are optional, they havepotential to support existing and future e-mobility and grid services. Current implementationsof the standard include such features as charging scheduling and identification for automatedbilling. Use cases of the standard (described in 15118-1) describe important features for grid serviceprovision such as reactive power compensation and V2G support, to be implemented in the futurerevisions of the standard.
Figure 3.16 shows the typical message exchange between an EV and EVSE during a normalcharging session.

30CHAPTER 3. ENABLING TECHNOLOGIES: HARDWARE, COMMUNICATION AND
CONTROL
Figure 3.16: IEC 15118 messages during a normal charging session [44].
As seen in the sequence diagram, every interaction is initiated by the EVCC. Such communicationparadigm, combined with the relatively long timing limits between rescheduling requests create abarrier for using IEC 15118 for time sensitive grid service provision.
Figure 3.17 shows the design schematics for IEC15118 testing and development system.
Figure 3.17: IEC 15118 testing hardware schematics.
It closely resembles a typical IEC 61851 based AC charging setup presented earlier.
The DTU IEC 15118 development system is based on INSYS Powerline GP PLC modems thatuse Qualcomm QCA7000 chip that enables PLC link. The EVSE box contains Phoenix Contact

3.2. COMMUNICATION IN E-MOBILITY 31
EVSE controller that is set to digital communication mode. This means that on vehicle plug in andcharge initialization, it indicates to the EV that digital communication is available by 5 % PWMsignal on CP pin. Each INSYS PLC modem is connected to a Beaglebone black microcomputervia ethernet cable. The microcomputer runs the IP network stack and IEC 15118 application layerimplementation based on OpenV2G platform [49]. The developed software is freely availableonline [50].
Figure 3.18 shows the IEC15118 development system, based on two boxes (EV and EVSE), madeby following the schematics from Figure 3.17.
Figure 3.18: IEC 15118 development and testing kit made for COTEVOS project - EVSE (left) andEV (right).
The test system was put to test, by the author, at the IEC 15118 testival in TU Dortmund and atCOTEVOS V2G plug-test event against other IEC 15118 implementations.
All in all, IEC 15118 use cases promise a lot of new and necessary functionality for grid integration[48]. However, current edition of the standard does not implement some of the grid service relateduse cases into the specification, making it difficult to use IEC 15118 for EV to grid integration.
CHAdeMO
Another charging specification developed in Japan for DC fast charging of EVs is CHAdeMO. Thechargers supporting this specification can charge compatible vehicle at powers up to 150 kW. Thisspecification is currently the most widely deployed DC (charging mode 4) fast charging protocol inthe world [51]. The communication according to this specification is done using a commonly usedin automotive industry control area network (CAN) bus. Updated CHAdeMO v2.0 specificationrecently added a possibility for bidirectional power transfer also known as V2G support. Thechargers with CHAdeMO V2G support are already produced and most of the latest CHAdeMOcompatible vehicles also support bidirectional power flow from their batteries to the grid.

32CHAPTER 3. ENABLING TECHNOLOGIES: HARDWARE, COMMUNICATION AND
CONTROL
While CHAdeMO is a proprietary specification, main requirements for its implementation areoutlined in IEC61851-23 and IEC61851-24 [52], [53].
As IEC 61851 was originally designed to just enable safe operation of EVs and EVSE while charging,it is only able to dynamically indicate the maximum limit of the charging current from EVSE to theEV. CHAdeMO CAN bus support allows for bidirectional high level communication, which enablesall the necessary information exchange to ensure charging safety and extended features for gridservice provision. Specifically, CHAdeMO protocol allows for exchange of a mandatory chargingparameter that enables charging flexibility assessment, namely State Of Charge (SOC), chargingpower limit and indication of the plugged in vehicle. While that is a big step forward comparedto other EV-EVSE communication protocols, CHAdeMO still lacks identification (e.g. VIN) andsecure communication features as well as all the quality improving parameters. These findingswere communicated to representatives of CHAdeMO association, so the technical implementationof these features is currently under consideration. Meanwhile, the future version of IEC/ISO 15118are also promised to be expanded with the same functionality. Finally, all these features should bematched by the communication links in the higher layers of the e-mobility architecture.
3.2.6 EVSE to CPO communication
Although EV charging points exist as long as modern EVs the communication between the chargingpoint and charging point operator (CPO) is not standardized yet. However, a de-facto industrystandard this communication link exists.
OCPP
It is called open charging point protocol (OCPP), and is currently a most popular specification forEVSE to CPO communication link. OCPP specification is developed by Open Charge Alliance(OCA) [54]. The specification is primarily developed for charging point maintenance and operation.Early editions of the specification were based on well established Extensible Markup Language(XML) and Simple Object Access Protocol (SOAP) for data encoding and transfer. Latest editionv1.6 adds more modern JavaScript Object Notation (JSON) and Websocket support.
The main functionality of the OCPP specification is:
Charging session authorization - allows a EV user to charge at the charging point after identifica-tion.
Collecting billing information - provides charge detail records for billing of EV user.
Grid management - allows to adjust charging according load signal, enabled by charging sched-ules.
CP operation - upgrading firmware, setting the state to available or unavailable or reserved,configuring charge points, reading and repairing errors.
CP Reservation - functionality needed for EV user to reserve a charging spot e.g. setting chargingpoint to reserved state
Smart charging - adjustment of charging pattern, enabled by charging schedules

3.2. COMMUNICATION IN E-MOBILITY 33
Figure 3.19: OCPP sequence diagram for smart charging using central system controller [55]
Figure 3.19 shows a sequence diagram and a message exchange between the charging point andthe CPO while performing smart charging.
Here the charging session between EV and EVSE is already initialized and EV has startedcharging. Then EVSE initializes new charging session communication with a CPO using OCPPstart transaction request. Firstly, transaction details such as user id, start time and transaction idare exchanged. Afterwards a charging schedule is sent to the EVSE. If EVSE accepts the schedule itnotifies the CPO and starts following it by adjusting charging current limit for the EV. If the gridsituation changes, a new charging schedule could be sent in from the CPO. While the chargingsession is running, EVSE sends energy meter reading to the CPO at predefined intervals. Finally,once the charging is finished, EVSE sends a stop transaction request with the final energy meterreading for billing. Overall, the specification is missing such essential parameters as vehicleidentification and SOC as well as security features.
IEC 63110
Recently, it was decided to standardize the communication between EVSE and CPO [56]. A newlyemerging standard that is supposed to take place of OCPP is being developed by IEC, and calledIEC 63110. The development of this standard will be based on OCPP v2.0 and aligned with IEC15118.

34CHAPTER 3. ENABLING TECHNOLOGIES: HARDWARE, COMMUNICATION AND
CONTROL
3.2.7 Grid Service Communication
This section addresses the communication links in e-mobility infrastructure that are relevantto providing grid services and not covered by previous sections. As was shown in Figure 3.11these communication links are mostly related to grid operator and aggregator communication.Communication between EV aggregators/charging point operators and grid operators is a relativelynew link, not yet covered by a standard.
OpenADR
Similarly to OCPP, one of the de-facto standards in the area of DER communications is Open Auto-mated Demand Response (OpenADR) [57]. The purpose of OpenADR is to provide standardizedcommunication protocol between grid operators and demand response (DR) providers to facilitateautomated demand response. While, it is not specifically designed for applications in e-mobility, itis generic enough to support a variety of DR resources, including EVs.
Functionality of the OpenADR specification:
Handle registrations - addition of new DER units to the aggregated nodes
Manage the grid - adjust charging according load signal
Smart charging - adjust charging according to price
Sending price and load control signals - for controlling the power consumption of the DER
Reporting - the metering data and usage times to the grid operator or an aggregator
As the protocol is designed with provision of demand response in mind it has the essential featuresfor supporting grid integration of large aggregated EV fleets as virtual power plants.
OSCP
Open Smart Charging Protocol (OSCP) is also developed by OCA and is one of the first specificationsthat define the communication between CSO and grid operator e.g. distribution system operator(DSO). The DSO indicates the available grid capacity as a 24 hour prediction to the Charging PointOperator, which then distributes it by adjusting the charging rates. The main functionality ofOSCP includes:
Handling capacity budgets
Managing grid capacity
Smart charging using capacity forecasts
It is quite obvious that OpenADR and OSCP overlap. Where OSCP is solely targeted at reducingfeeder congestion, OpenADR covers much broader area allowing for applications with variousgrid services.

3.2. COMMUNICATION IN E-MOBILITY 35
IEC 61850-90-8
An extension of a substation automation standard IEC 61850, that defines the additional informationobjects necessary to control EV charging via the EVSE [58]. A part of IEC 61850 and IEC 61850-7-420already covers e-mobility domain. The IEC 61850-90-8 brings missing information objects suchas EV and the EVSE nodes and means for charging scheduling. The main functionality of theIEC 61850-90-8 is an ability to directly control the charging point by the grid operator [59]. Thisfunctionality overlaps with OCPP [60]. However, the extended function set of OCPP is meant forCPOs and technically sharp IEC 61850-90-8 information model is designed for direct grid operatorcontrol of EVSEs in abnormal grid conditions.
3.2.8 Roaming communications
A big area in e-mobility communication that is on the side of the essential grid service enablingcommunication is roaming. Although not directly relevant for grid service provision, but describedfor completeness of e-mobility architecture. Roaming in e-mobility is very similar to the one intelecommunications, it ideally allows EV users to charge their vehicles at any charging serviceprovider. To enable such functionality communication links and protocols have to be establishedbetween Charge Point Operators (CPOs), E-Mobility Service Providers (EMSPs) and clearinghouses. Multiple specifications are emerging to cover those missing links in e-mobility back-endcommunications.
OCPI
Open Charge Point Interface (OCPI) protocol is developed for exchanging information aboutcharging points between CPO and EMSP [61].
The main functionality of OCPI includes:
Authorizing charging sessions - involves allowing a user/EV to charge at the charging point afteridentification
Billing - providing charge detail records for billing of EV user
Providing charge point information - static and dynamic charge point information e.g. location,availability, tariff
Reservation - functionality needed for EV user to reserve a charging spot
Handle registrations - adding new users to a EMSP
Roaming - information exchange enabling EV user to charge at multiple charging points using asingle identification token
OICP
Open InterCharge Protocol (OICP) is also meant for CPO to EMSP communication [62]. It ismeant for roaming application e.g. to communicate with Hubject B2B Service Platform. The mainfunctionality of OICP includes:
Authorizing charging sessions - involves allowing a user/EV to charge at the charging point afteridentification

36CHAPTER 3. ENABLING TECHNOLOGIES: HARDWARE, COMMUNICATION AND
CONTROL
Billing - providing charge detail records for billing of EV user
Providing charge point information - static and dynamic charge point information e.g. location,availability, tariff
Reservation - functionality needed for EV user to reserve a charging spot
Roaming - information exchange enabling EV user to charge at multiple charging points using asingle identification token
OCHP
Open Clearing House Protocol (OCHP) is meant for exchanging charging information relevant toreservation and billing between CPO, EMSP and Clearing House for roaming purposes [63]. Themain functionality of OCHP includes:
Authorizing charging sessions - involves allowing a user/EV to charge at the charging point afteridentification
Billing - providing charge detail records for billing of EV user
Providing charge point information - static and dynamic charge point information e.g. location,availability, tariff
Reservation - functionality needed for EV user to reserve a charging spot
Roaming - information exchange enabling EV user to charge at multiple charging points using asingle identification token
Smart Charging (only in OCHPdirect) - only meant for setting limits but not for dynamic smartcharging
OCHP is the only notable communication protocol for communicating with e-mobility clearinghouses.
3.2.9 Gaps in communication protocols
Over the course of this study, many gaps in communication protocols have been closed bynew/updated specifications, thus covering most normal charging scenarios. However, a few issuesstill remain:
Timing delays - only a few communication standards define the timing requirements for theircommunication
Missing information objects - majority of the communication protocols are well suited to supportnormal charging operation. However, grid services require additional information objects(mostly SOC and vehicle identification), outlined in 3.2.4 to be communicated from the EVall the way to the aggregator.
Security risks - only one communication protocol proposes establishment of a secure commu-nication link - IEC 15118 plug and charge mode using TLS. While OCPP is promising toimprove the cyber security reqirements in the upcoming OCPP version 2.0 [64]. Almost alldiscussed communication protocols do not require any security measures, thus allowing formonitoring and possible man in the middle attacks.

3.3. CONTROL 37
3.2.10 Future standards
Current communication standards and specifications have already evolved to the level supportingbasic grid services. CHAdeMO and IEC15118 have already implemented some of the featuresdesigned to support smart grid applications such as V2G support and required information objects.Formation of IEC 63110 standard to replace OCPP in alignment with IEC 15118 development,and recent developments in all of the e-mobility communications shows adjustment of thestandardization area towards better grid integration. The support of the communication standardsis crucial, as they are a backbone of the e-mobility control architecture.
3.3 Control
Hardware, e-mobility actors and communication standards are essential building blocks of thecontrol architecture that enables grid service provision using electric vehicles. The final technicalrequirement for grid integration once hardware is in place and appropriate communication linksare available is a controller.
3.3.1 Aggregators
While an EV is a biggest electrical load in the household, a single EV has a very little impact onthe power grid. Once aggregated in tens, hundreds and thousands, a real impact on distributionand transmission grids can be established. Such combination of single EVs is enabled by usingEV aggregators [65–67]. However, different services could benefit from different kinds of controlstrategies i.e. centralized, distributed or mixed [68].
3.3.2 Control architecture
Figure 3.20 shows a first version of the control architecture, developed by the author and used inmost experiments in NIKOLA project. This experimental architecture is applied in most of theexperimental activities described in Chapter 4.
Here, the controller plays multiple roles of: aggregator and a grid operator. The control architectureconsists of the software and hardware components as follows:
Controller - contains the main controller logic - control algorithm that actuates the charging of theEVs according to data from measurement devices. Implemented control algorithms include:droop control based frequency and voltage regulation, congestion limiting, secondaryfrequency regulation, synthetic inertia control. The controller also includes data logging andvisualization interface.
ZMQ message bus - a messaging bus implemented using ZeroMQ publish-subscribe patternto enable communication between multiple components of the controller (mostly as datachannel from sensors to the controller and logger) in the control architecture [69].
EVSE interface - communication interface to the Phoenix Contact EVSE controller, implementedusing push-pull pattern in ZeroMQ.
SGU poller - communication interface to the smart grid unit measurement device.
MTR3 poller - communication interface to the DEIF MTR3 frequency measurement device.

38CHAPTER 3. ENABLING TECHNOLOGIES: HARDWARE, COMMUNICATION AND
CONTROL
Figure 3.20: Control architecture used in experimental validations.
MIC-2 poller - communication interface to the DEIF MIC-2 multi-instrument measurement device.
SGU - smart grid unit, a measurement device mounted in the MV/LV transformer to measurevoltage, current and frequency on LV and MV sides.
DEIF MTR3 - multi-instrument measurement device used for frequency measurements due to itsprecision to 10mHz as specified by ancillary service provision requirements [16]
DEIF MIC-2 - multi-instrument measurement device used for voltage, current and power qualitymeasurements.
Charging point - a charging point that includes 3 EVSEs.
EVSE - based on Phoenix Contact EVSE controller, implements IEC 61851 support for EV charging.
EV - usually unmodified OEM vehicles: Nissan eNV200/Leaf, Peugeot iOn or Renault Kangoo.
As can be seen from in the figure the controller represents a CPO and an aggregator at the sametime. The purpose of this control architecture is to test the technical specifications of the potentialgrid services. This means that the controller is not designed to include EV user requirements, suchas departure time and desired state of charge.
To include real EV users in the testing of the EV grid services, the technical implementation hasbeen redesigned to incorporate user services. The author has developed the second iteration of thecontrol architecture to be implemented in future experiments. The experimental architecture fromFigure 3.20 has been expanded to fit into e-mobility architecture from Figure 3.10. The result is adetailed control architecture for e-mobility and grid integration developed at DTU based on open

3.3. CONTROL 39
standards, shown in Figure 3.21. Here, the software controllers are depicted in light green andsoftware interfaces to hardware devices in purple.
Figure 3.21: Control architecture for commercial applications based on open standards
As seen in the figure, custom communication to the charging spot has been replaced by OCPP,thus enabling interoperability between a CPO and different EVSEs.
The following communication standards are used in the implementation:
IEC 61851 - for EV to EVSE link - used as unmodified OEM vehicles, which at the time of writing,only support IEC61851 standard for AC charging. The IEC61851 on the EVSE side isimplemented by using Phoenix Contact EVSE controller.
OCPP 1.6 - for EVSE to CPO link - used as it is a de-facto standard for this link. Implementedin the microcomputer mounted inside the EVSE. It will be replaced by OCPP 2.0, once it isavailable.
OCPI 2.1 - for CPO to EMSP link - chosen for the openness and maturity of the specification thatcovers the needs of the communication link. Implemented in the dedicated server, that alsoprovides web interface for authorized EV users to login and enable the charging spot.
OpenADR 2.0b - for CPO to Aggregator link - chosen for maturity, openness and genericapplication capability. This allows for the aggregator to potentially combine EVs with otherDERs to provide larger and more diverse grid services. The aggregator implements therole of the virtual top node (VTN) and the CPO implements the virtual end node (VEN).Another specification potentially fitting this link is Open Smart Charging Protocol (OSCP)[70]. However, it is mostly targeted at feeder capacity control thus limiting its application forother grid services.

40CHAPTER 3. ENABLING TECHNOLOGIES: HARDWARE, COMMUNICATION AND
CONTROL
Additionally, the CPO and EV aggregator roles have been separated and EMSP role has beenadded. The EMSP enables public DTU EVSEs to be reserved and require charging authorizationfor the EV user. Such communication scheme allows for identification of the user and possibly themodel of the vehicle by user input via web interface. The interface is accessed by scanning a QRcode on the charging point.
3.4 ConclusionThe chapter outlined and explored the three main technologies for EV integration into the smartgrid: hardware, communication and control mechanisms. Controllable hardware has been availablealready for a number of years, and the recent introduction of modern V2G chargers only makesit better. While gaps in the communication protocols still exist, they are covered by alternativesolutions and new revisions of the protocols. However, there is still some way to go to achievewidespread adoption of aggregated EVs as ancillary service providers. As seen in the currentlyused and proposed e-mobility architectures there is a difference in design and implementation. Theroles of the e-mobility actors are fairly new and are not yet firmly established. This leads to mergingof actor e.g. CPO and EMSP, CPO and aggregator and possible rearrangement of communicationlinks in the e-mobility architecture. That however does not stop the development of differente-mobility control architectures. All in all, most technical requirements for EV integration intosmart grid are being implemented, as shown in developed control architectures that are employedin experimentally validating actual grid services in Chapter 4. Furthermore, a pilot demonstrationproject, inspired by the findings of the NIKOLA project, is already providing actual grid servicesto real grid operators.
3.5 Contribution summaryThe author has identified technical and communication requirements for EV grid integration.Actors, from e-mobility architecture developed in COTEVOS project, necessary for supportingEV grid integration were studied. Existing communication standards and specifications betweenthe actors were analyzed for ability to support grid services. A smart charging controller wasdeveloped to enable the implementation of the grid services using OEM EVs. It was used inexperimental validation of grid services presented in Chapter 4. The controller was expandedand converted into a system resembling a part of the e-mobility architecture. The implementationis based on the open standards thus providing maximum interoperability with potential futurecommercial partners. That allows for implementation of grid service provision in real life likeconditions with 3rd party EVs and interaction with EV users. It should be noted that the fullimplementation of the developed control architecture is still work in progress.
3.6 List of publicationsThe relevant publications are listed as follows:
A S. Martinenas, S. Vandael, P.B. Andersen, B. Christensen, ”Standards for EV charging andtheir usability for providing V2G services in the primary reserve market,” in Proceedingsof International Battery, Hybrid and Fuel Cell Electric Vehicle Symposium (EVS29), Montreal,Canada, IEEE, Jun. 2016.
B S. Martinenas, ”Implementation of E-mobility architecture for providing Smart Grid servicesusing EVs,” in International Battery, Hybrid and Fuel Cell Electric Vehicle Symposium (EVS30),Stuttgart, Germany, 2017.

Chapter 4Grid service applications
This chapter describes the implementations of grid services EVs could provide. In addition totheoretical description, an experimental validation of each service is presented and analyzed. Mostof the experimental results presented in this section are made as contributions to a Danish researchprojects NIKOLA and Parker focusing on the integration of EVs into contemporary and futurepower systems [25] [71]. The experiments were performed in SYSLAB (part of PowerLabDK) whichis a flexible laboratory for distributed energy resources, that consists of real power componentsparalleled with communication infrastructure and control nodes in a dedicated network [72]. Allof the work presented in this chapter is original and based on the authors publications.
Typically, two levels of grid services are considered, they correspond to transmission and distribu-tion grid operation areas also known as system wide and local. Firstly, the applications of systemwide services are presented namely frequency regulation and synthetic inertia. This is followed bythe distribution grid service for local power quality improvement. Finally, smart charging servicethat takes user comfort into account is shown. All of these services are enabled by the technicalrequirements presented in Chapter 3.
4.1 Frequency services
In multiple experimental validations mostly primary and normal reserves from DK1 and DK2as well as adjusted versions for microgrid control were implemented and tested. These serviceswere chosen for implementation due to: ease of acquiring the control signal i.e. measured gridfrequency deviation; low energy use with short duration and quick required response time that isideal for fast inverter based EV chargers. The experimental validation for system-wide services ispresented in steps from proof of concept, through microgrid validation, all the way to the pilotproject.
Proof of concept
Firstly the DK1 primary reserve was implemented as a proof of concept. It was tested using ACV2G capable EV - AC Propulsion eBox connected via 32A charging point to the Danish grid.
The controller is running with the following frequency regulation algorithm:
The droop controller was designed by following the technical specification of tender conditions forancillary services in Danish power grid, see [16].
Firstly, the grid frequency is measured and the deviation from nominal frequency is calculated:
41

42 CHAPTER 4. GRID SERVICE APPLICATIONS
while true dof = measure grid frequency;e = calculate the frequency error;Pout = calculate corresponding output power using preset droop;actuate the power for the EV
(Pout
);
wait for the next frequency measurementend
Algorithm 1: Frequency Droop Control
e = fnom − fm. (4.1)
Here the e is the frequency deviation i.e. the difference between nominal and measured frequencyvalues. fnom is a nominal grid frequency in Europe, equal to 50.00Hz. The fm is the measuredgrid frequency, with 10mHz accuracy. The power output of the droop controller is calculated asshown in (Equation 4.2).
Pout =
0 , |e| < ∆fdb
Pmax · e ·100dpct
, ∆fmax > |e| > ∆fdb
Pmax , |e| > ∆fmax
(4.2)
Here Pout is output power of the vehicle to the grid. Pmax is the maximum (dis)charging power ofthe vehicle, for a 32A charging point at one phase it is 7kW . ∆fdb is a deadband width used, inthis case 20mHz. dpct is a droop value in percent. ∆fmax is a maximum frequency deviation, atwhich the maximum power should be output to the grid, in this case it is 200mHz. The resultingdroop control curve is shown in Figure 4.1.
49.7 49.8 49.9 50.0 50.1 50.2 50.3
Frequency (Hz)
8
6
4
2
0
2
4
6
8
Pow
er
(kW
)
Droop Curve with Deadband
Figure 4.1: Droop curve with deadband (DK1 primary regulation) used in proof of conceptfrequency regulation experiments
Once the control algorithm was implemented in the controller, a longer experiment was alsoperformed with frequency regulation being active for 22 hours. The results are shown in Figure 4.2.
The average frequency value for the test period was 49.997Hz. This indicates that the frequencywas almost symmetric. The SOC of the vehicle changed from 85% at the start, to around 53% atthe end of the test. Such large SOC change can not be explained by slight bias of the frequency,

4.1. FREQUENCY SERVICES 43
14:00 16:00 18:00 20:00 22:00 00:00 02:00 04:00 06:00 08:00 10:00Time
49.85
49.90
49.95
50.00
50.05
50.10
50.15
Frequency
(H
z)
25
20
15
10
5
0
5
10
15
20
Curr
ent
(A)
45
50
55
60
65
70
75
80
85
90
SO
C (
%)
Frequency
Actual Amps
SOC
Figure 4.2: Frequency regulation results for 22 hours
but is mainly caused by the V2G inverter roundtrip efficiency. The measured efficiency of vehiclePEU in V2G mode at these low current values is around 0.8, this makes roundtrip efficiency to bearound 0.64. That closely matches the ratio of the end to start value of battery SOC in the examplefrom Figure 4.2.
The close up from the 22 hour frequency regulation process is shown in Figure 4.3.
Figure 4.3: Frequency regulation results close up with response delay
Here the delay between the frequency measurement and response by the vehicle can be appreciated.Generally, the vehicle is able to respond to the frequency event in about 5 to 6 s. The delay can beapproximately decomposed into the following components: <1 s delay for frequency sampling

44 CHAPTER 4. GRID SERVICE APPLICATIONS
time and control action in the controller, <1 s delay for communication and control parameterupdate in the controller, 3 to 4 s for PEU ramping time and <1 s delay for response data samplingin the measurement device.
Experimental validation in a microgrid
After the proof of concept setup was successfully tested, contemporary unmodified OEM vehicleswere selected for testing in a microgrid scenario to better asses their performance. Microgridenvironment allows for the scale where the impact of the regulation provided by EVs is tangible.
No contemporary OEM vehicle is able to provide V2G without external charger. Therefore,experimental validation had to rely on unidirectional chargers. To provide the up and downregulation the neutral charging setpoint is set to the middle of the charging rate range.
The connection diagram of the experimental setup is shown in Figure 4.4.
Figure 4.4: Experimental setup for primary frequency regulation in a microgrid scenario
The microgrid experimental setup consisted of:
Diesel generator - base power generator and main inertia source in the microgrid.
Vanadium battery - main and variable load in the microgrid.
AirCon wind turbine - stochastic generation which EVs should balance out when providingfrequency regulation service.
Charging Point - charging point with 3x 16 A EVSEs.
EV - 3x Nissan Leaf EVs used as a primary frequency regulation load. Such number of EVs wasrequired as the microgrid is 3 phase and each EV has only a single phase charger.
Grid - use to setup and establish the microgrid, then disconnected once the microgrid was balancedand ready for the experiment, thus not shown in the figure.
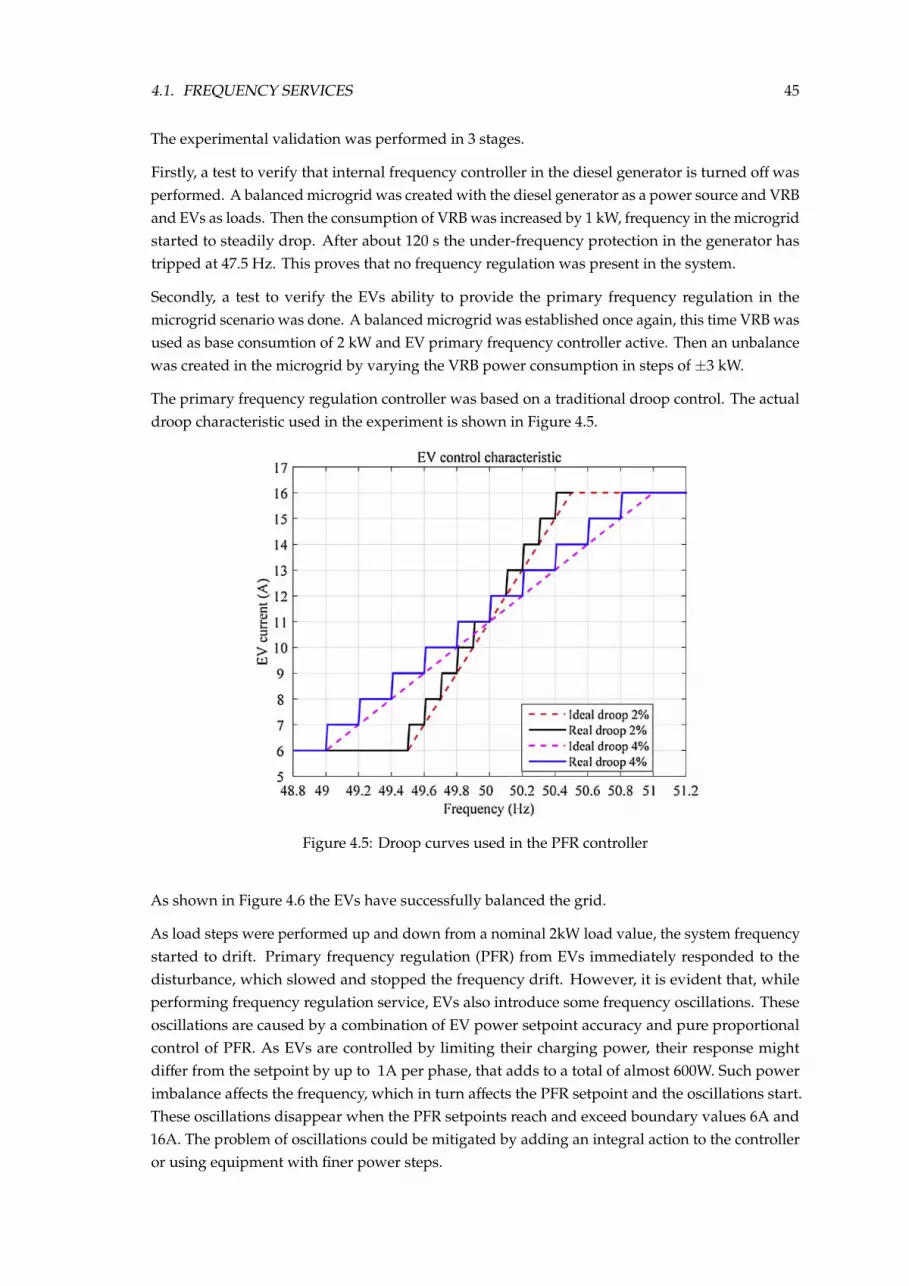
4.1. FREQUENCY SERVICES 45
The experimental validation was performed in 3 stages.
Firstly, a test to verify that internal frequency controller in the diesel generator is turned off wasperformed. A balanced microgrid was created with the diesel generator as a power source and VRBand EVs as loads. Then the consumption of VRB was increased by 1 kW, frequency in the microgridstarted to steadily drop. After about 120 s the under-frequency protection in the generator hastripped at 47.5 Hz. This proves that no frequency regulation was present in the system.
Secondly, a test to verify the EVs ability to provide the primary frequency regulation in themicrogrid scenario was done. A balanced microgrid was established once again, this time VRB wasused as base consumtion of 2 kW and EV primary frequency controller active. Then an unbalancewas created in the microgrid by varying the VRB power consumption in steps of ±3 kW.
The primary frequency regulation controller was based on a traditional droop control. The actualdroop characteristic used in the experiment is shown in Figure 4.5.
Figure 4.5: Droop curves used in the PFR controller
As shown in Figure 4.6 the EVs have successfully balanced the grid.
As load steps were performed up and down from a nominal 2kW load value, the system frequencystarted to drift. Primary frequency regulation (PFR) from EVs immediately responded to thedisturbance, which slowed and stopped the frequency drift. However, it is evident that, whileperforming frequency regulation service, EVs also introduce some frequency oscillations. Theseoscillations are caused by a combination of EV power setpoint accuracy and pure proportionalcontrol of PFR. As EVs are controlled by limiting their charging power, their response mightdiffer from the setpoint by up to 1A per phase, that adds to a total of almost 600W. Such powerimbalance affects the frequency, which in turn affects the PFR setpoint and the oscillations start.These oscillations disappear when the PFR setpoints reach and exceed boundary values 6A and16A. The problem of oscillations could be mitigated by adding an integral action to the controlleror using equipment with finer power steps.

46 CHAPTER 4. GRID SERVICE APPLICATIONS
Figure 4.6: Power flow and measured frequency when performing ±3 kW steps with VRB with EVPFR enabled
Lastly, a test where EVs would provide frequency regulation to the microgrid with stochasticpower generation was performed. Again a balanced microgrid was established, but this time anadditional power source was connected - AirCon wind turbine. VRB power consumption wasincreased to 4 kW to account for average power production of the wind turbine. However, thewind power production was fluctuating from 4 kW to 7 kW. Therefore, the EV primary frequencyregulation was enabled to stabilize the microgrid.
As shown in Figure 4.7 the EVs have successfully balanced the microgrid with an intermittentenergy resource.
Here, EVs have precisely followed the fluctuating power output from the AirCon wind turbine,thus not allowing the system frequency to run off. Such challenging balancing scenario was enabledby the very fast response of EVs <3 s. Additionally, the base load setpoint has been appropriatelyadjusted so that EVs could approximately balance out the predicted amount of power producedby the wind turbine. Overall, even in a such demanding scenario and without V2G capability, theEVs are capable of stabilizing the frequency deviations in the microgrid.
During experimental validations of frequency regulation services, it has been noticed that EVs ingeneral are fast to respond to the control signals. It has been decided to investigate the timing ofthe EV response to an external stimulus.
4.1.1 EV charging controllability
The typical timing sequence in the control loop for a frequency regulation service is shown inFigure 4.8.
In this figure the different segments are the following:

4.1. FREQUENCY SERVICES 47
Figure 4.7: Power flow and measured frequency when EV PFR is used to balance stochastic windturbine power production
Figure 4.8: Timing sequence for a
1. Measurement acquisition at the frequency measurement device
2. Communication between measurement device and aggregator
3. Aggregator calculating the control response
4. Communication delay between aggregator and EVSE
5. Processing time in the EVSE
6. Communication delay between EVSE and EV
7. Processing and ramping time in the EV charger
Typically, the slowest part of the whole communication-control loop is the EV power responsetime. In most modern EVs, communication between a vehicle and a charging point is definedby IEC 61851 standard. The standard states that in case a charging current limit is changed, the

48 CHAPTER 4. GRID SERVICE APPLICATIONS
vehicle should respond within 3 seconds. Additionally, the standard specifies the lowest currentlimit is 6A with a step of 1A, while upper current limit is defined by a minimum function of thecharging cable and the fuse rating of the EVSE.
The charging power adjustment response time and precision of multiple commercially availableEVs are compared. The EVs used in the test are EV I - Peugeot Ion (2011 model), EV II - Nissan Leaf(2015 model), and EV III - Renault Kangoo (2012 model). All of these EVs are equipped with 3.7kW AC chargers which can be controlled between 6 to 16A - providing a 2.3kW flexibility window.This window is split in half, by setting nominal EV charging rate to 11A at the frequency of 50.00Hz.This way EVs can provide symmetrical up and down regulation as detailed in Section 4.1.As thegrid frequency from real grid is rather stable, a symmetrical, randomized input frequency wasdesigned that would force the controller to change the set-point at each iteration. This way thecontrollability of each EV is pushed to the limit and the ramping rates can be assessed.
Here the response of the full control loop, with focus on EV power adjustment time and precision areevaluated and compared. Technically, response time is the major factor for grid service provision asresponse precision always improves with aggregation of multiple vehicles. Typical inaccuracy ofthe response from each charger is less than the step of 1A, which only corresponds to approximately200W in power per EV. Such error is below the accuracy limit of typical multi-hundred kilowattresponse power for an ancillary service and can be easily corrected by adjusting the chargingcurrent for the part of the aggregated EVs.
The control signal and response of the vehicle to the changes in the charging current limits areshown in Figure 4.9, Figure 4.10 and Figure 4.11. The graphs are showing only the first 2 minutesof the experimental data to better appreciate the difference between the control and response.
22:10:02
22:10:17
22:10:32
22:10:47
22:11:02
22:11:17
22:11:32
22:11:47
Time
6
8
10
12
14
16
Curr
ent
[A]
Phase_1_Control_Signal
I_1
Figure 4.9: Response precision and timing of EV I
As can be seen in Figure 4.9, ramping speeds of the EV I on phase 1 are different for up and downmodulation. While increasing the charging current to the new higher limit might take up to 2seconds, decreasing the charging current to the lowered limit only takes up to 1 second.
As shown in Figure 4.10, the EV II on phase 2 has much faster ramping rates. Both up and downmodulation of charging current is performed in less than around 0.5 seconds.
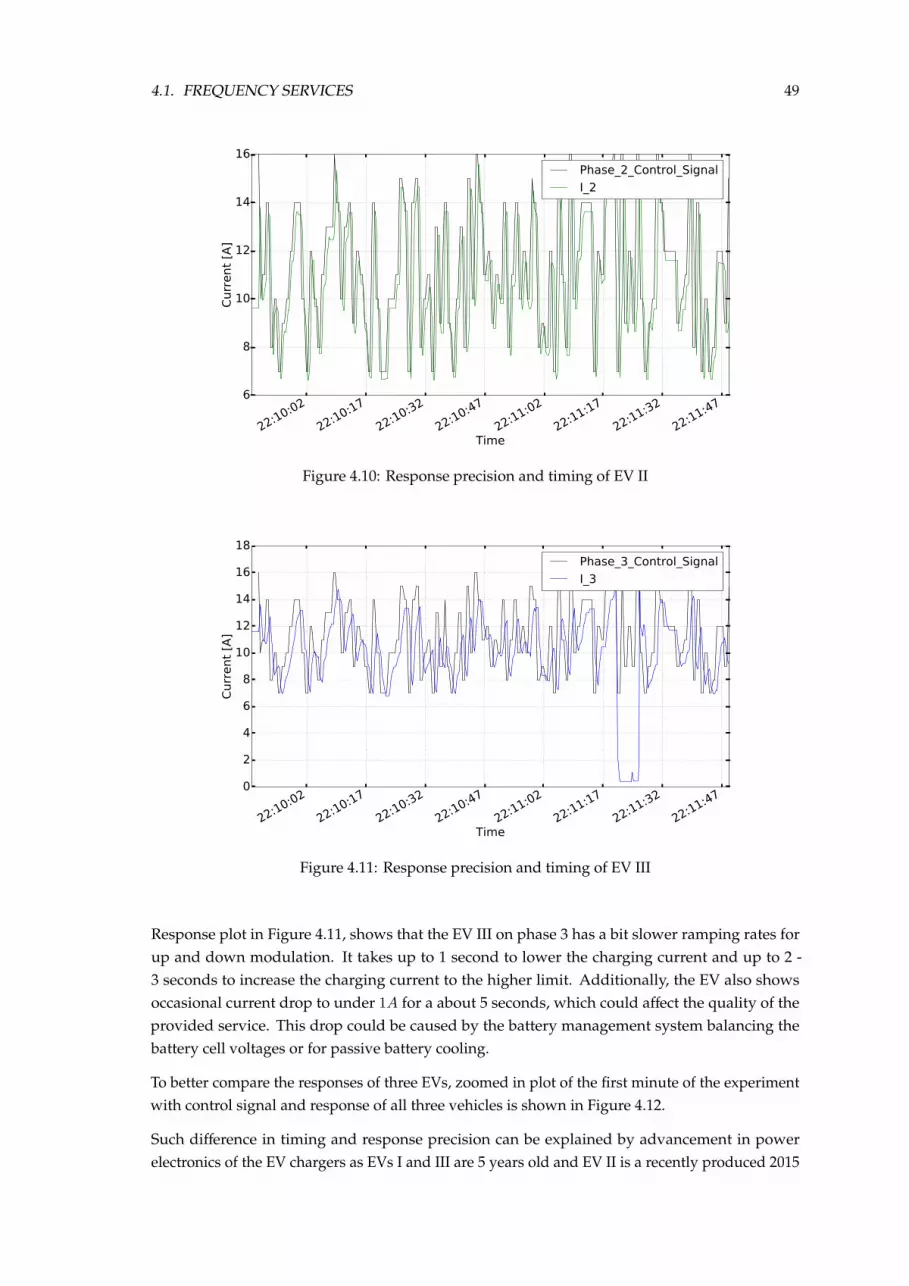
4.1. FREQUENCY SERVICES 49
22:10:02
22:10:17
22:10:32
22:10:47
22:11:02
22:11:17
22:11:32
22:11:47
Time
6
8
10
12
14
16
Curr
ent
[A]
Phase_2_Control_Signal
I_2
Figure 4.10: Response precision and timing of EV II
22:10:02
22:10:17
22:10:32
22:10:47
22:11:02
22:11:17
22:11:32
22:11:47
Time
0
2
4
6
8
10
12
14
16
18
Curr
ent
[A]
Phase_3_Control_Signal
I_3
Figure 4.11: Response precision and timing of EV III
Response plot in Figure 4.11, shows that the EV III on phase 3 has a bit slower ramping rates forup and down modulation. It takes up to 1 second to lower the charging current and up to 2 -3 seconds to increase the charging current to the higher limit. Additionally, the EV also showsoccasional current drop to under 1A for a about 5 seconds, which could affect the quality of theprovided service. This drop could be caused by the battery management system balancing thebattery cell voltages or for passive battery cooling.
To better compare the responses of three EVs, zoomed in plot of the first minute of the experimentwith control signal and response of all three vehicles is shown in Figure 4.12.
Such difference in timing and response precision can be explained by advancement in powerelectronics of the EV chargers as EVs I and III are 5 years old and EV II is a recently produced 2015

50 CHAPTER 4. GRID SERVICE APPLICATIONS
22:09:57
22:10:07
22:10:17
22:10:27
22:10:37
22:10:47
Time
6
8
10
12
14
16
Curr
ent
[A]
Control_Signal
I_1
I_2
I_3
Figure 4.12: Control and response comparison of all three EVs
model.
The timing performance and response precision of the three EVs is summarized in Table 4.1.
Table 4.1: Summary of EV response timing and precision
EV nr.Minimum
delayAverage
delayMaximum
delay
AverageResponse
ErrorI 0.4 s 1.1 s 2.0 s 0.8 AII 0.2 s 0.3 s 0.6 s 0.4 AIII 0.5 s 1.5 s 2.5 s 1.0 A
While all EVs are well within the timing limits of the IEC 61851 standard for charging currentregulation, EV I and III have similar response times closer to a few seconds, where EV II stands outby having sub-second response time.
This sub-second response enables the EV II to potentially provide synthetic inertia [73]. Thereforeit was decided to conduct an experimental validation of a synthetic inertia service. The validationwas done using 3 EVs from 2015 and 2016 models each capable with responding to a changingcontrol signal at sub-second rates.
4.1.2 Fast frequency regulation and synthetic inertia
Since synthetic inertia is a new potential service, it was decided to compare its effects to a fastfrequency regulation service, based on primary frequency regulation service presented earlier. Thefast frequency control and sythetic inertia are both using droop controllers shown in Figure 4.13.
The fast frequency regulation droop is identical to the one used in experimental validation ofprimary frequency regulation service. The synthetic inertia droop curve has a wide deadband

4.1. FREQUENCY SERVICES 51
Figure 4.13: Droop curves used in the controllers: a) Fast frequency regulation droop; b) Syntheticinertia droop
to avoid trigerring the synthetic inertia response on minor rate of change of frequency (RoCoF)events.
While frequency regulation service uses the frequency as an input to the controller, synthetic inertiadroop controller is based on RoCoF. This makes the synthetic inertia an equivalent of differentialcomponent in the PID control. It should be noted, that a minor improvement in the charging pointcontroller has been done to enable faster system response.
The experimental setup used for this comparison is shown in Figure 4.14.
Figure 4.14: Experimental setup for fast frequency regulation vs synthetic inertia comparison
The microgrid experimental setup consists of:

52 CHAPTER 4. GRID SERVICE APPLICATIONS
Diesel generator - used as a base power generator and main inertia source in the microgrid.
Vanadium battery - used as a main and variable load in the microgrid.
Dumpload - a resistor load bank
AirCon wind turbine - used as a stochastic generation which EVs should balance out whenproviding frequency regulation service.
Charging Point - a charging point with 3x 16 A EVSEs.
EV - 3x EVs: 2016 Nissan Leaf, 2014 Nissan eNV200, 2015 eNV200, used to provide fast frequencyregulation and synthetic inertia. Such number of EVs was required as the microgrid is 3phase and each EV has only a single phase charger.
A dumpload has been added as a main source of the variable load for its pure resistive properties.
The same scenarios have been tested in this comparison study: response to a load step andbalancing of the stochastic power generation from a wind turbine.
Figure 4.15 shows a closer look on the RoCoF and current response of each controller to a load step.
Figure 4.15: Comparison of Fast Frequency control and synthetic inertia: frequency and current
As expected, synthetic inertia controller curtails the RoCoF at the frequency event, slowing downthe frequency offset. Meanwhile, fast frequency regulation controller amplifies the initial RoCoFbut reduces the frequency offset.
These controllers should be merged and tested together as a single PD controller, thus potentiallyimproving both RoCoF and frequency offset.

4.1. FREQUENCY SERVICES 53
4.1.3 Pilot project
It is proven that using V2G capability, EVs could provide ancillary services with higher power andfor much longer periods of time, thus increasing the value of the provided service [74]. Therefore,OEM vehicles compatible with bi-directional DC chargers were selected for the real trial. A fleet of10x EVs are aggregated using 10x bi-directional CHAdeMO chargers with ±10kW active powercontrol capability in 1A steps. These aggregated units are used to provide normal frequencyregulation service for Energinet.dk under standard tender conditions.
Figure 4.16 shows an existing control architecture for FCR-N ancillary service provision in DK2used with DC V2G chargers in Parker project.
Figure 4.16: Control architecture used in Parker project for frequency regulation - normal, ancillaryservice provision in DK2 grid area
In this architecture an EV is connected to the grid through a V2G capable EVSE via CHAdeMODC charging connector. As shown in the diagram EVSE acts as a bidirectional AC/DC converterconnecting directly to EV battery. EVSE and EV are communicating using CHAdeMO v2.0 protocol.VSL agent is installed on the EVSE control computer. It receives data and sends control commandsto CHAdeMO controller that controls the power electronics. VSL also reads data from the powermeter and processes UI start/stop commands. The agent communicates to the EV aggregator usingproprietary OCPP inspired protocol. In this case CPO, EMSP and aggregator roles are all mergedand provided by a single server. Such implementation reduces the communication overhead and

54 CHAPTER 4. GRID SERVICE APPLICATIONS
potential interoperability issues between multiple actors. However, such monolithic structuremakes possible integration with other CPOs and EMSPs much more difficult.
Figure 4.17 shows an example aggregator interface. In this case it shows the NUVVE aggregatorused in Parker project.
Figure 4.17: NUVVE EV aggregator interface
The graphs show aggregated (left) and individual vehicle (right) response power response to acontrol signal. Below the graphs, the operator sees a list of aggregated vehicles with their actualstatus parameters.
4.2 Voltage quality in low voltage networks
EVs can not only support system wide TSO services like frequency regulation but also help localDSO grid by improving local power quality [75–78]. The modern three-phase distribution systemssupply a great diversity of customers creating a permanent unbalanced running state. Contrary toother disturbances in the power system which have immediate effects on the ordinary customers,voltage unbalance belongs to those disturbances whose perceptible effects are mostly produced inthe long run. Unsymmetrical consumption and production lead to voltage and current unbalanceswhich imply greater system power losses, interference with the protection systems, components’performance degradation and possible overheating to the point-of-burnout [79].
The acceptable limits for the several grid parameters, including voltage unbalances, is defined inthe European standard EN50160 [17]. The standard defines root mean square (RMS) limits forphase-to-neutral voltage magnitude |Upn| and the VUF as follows:
0.9 Unom ≤ |Upn| ≤ 1.1 Unom (4.3)
V UF ≤ 2%, (4.4)
for > 95% of all weekly 10 minute intervals, and
0.85 Unom ≤ |Upn| ≤ 0.9 Unom, (4.5)
for < 5% of all weekly 10 minute intervals. In addition, the standard defines the VUF as:
V UF [%] = |Uinverse||Udirect|
× 100. (4.6)

4.2. VOLTAGE QUALITY IN LOW VOLTAGE NETWORKS 55
where |Udirect|, and |Uinverse| are the direct (positive) and the inverse (negative) voltage symmetricalcomponent respectively. Since the definition described in (4.6) involves voltage magnitudes andangles, i.e., complex algebra for calculating the positive and negative components, equations (4.7)and (4.8) give a good approximation while avoiding the use of complex algebra [80].
V UF [%] = max∆|U ia|,∆|U i
b |,∆|U ic |
|U iavg|
× 100 (4.7)
|Uavg| =|U i
an|+ |U ibn|+ |U i
cn|3 , (4.8)
where ∆|Ua|,∆|Ub|,∆|Uc| are deviations of the respective phase-to-neutral voltage magnitudesfrom the average phase-to-neutral voltage magnitude |Uavg|, for the observed time window i.These equations will be used later on for assessing the voltage unbalances in the tested study case.
The used droop controllers have been inspired by the aforementioned standard [81]. Firstly, anupper threshold for the droop controlled voltage is set to 0.95 Unom, above which EVs charge atthe maximum current Imax of 16 A. Secondly, they can either charge at minimum current Imin of 6A or stop the charging process if the voltage drops below 0.9 Unom, corresponding respectively tothe real droop 1 and real droop 2 seen in Figure 4.18a. The values in-between the EV charging limitswould ideally be linear according to the voltage measurement. However, the current controller hasthe minimum charging current limit of 6 A and the steps of 1 A as defined in the IEC 61851[41].Therefore using a typical 3.7 kW EV charger, there are 10 current steps in total. In the implementedcontroller, these steps are equally distributed between 0.9 and 0.95 Unom. In addition, a steeperdroop control corresponding to real droop 3 in Figure 4.18b has also been tested. Similarly to thefirst droop control, this control also has 10 current steps equally distributed between the charginglimits, but the lower voltage limit is set to 0.925 Unom.
Defining an exact droop value for EVs or loads in general, may not be straightforward as it maynot be clear what is the nominal power of the load. In this case, it has been considered that theavailable range of regulating power (i.e., 2.3 kW) is equal to the EV’s nominal power instead of theoverall EV charging power which amounts to 3.7 kW. The following parameters have been definedfor the described droop controls, i.e., (Equation 4.9) for the droop control seen in Figure 4.18a and(Equation 4.10) for the droop control seen in Figure 4.18b:
∆U = 11.5V ;Unom = 230V
∆P = 2.3kW ;Pnom = 2.3kW
kdroop =∆U/Unom
∆P/Pnom
= 5%
(4.9)
∆U = 5.75V ;Unom = 230V
∆P = 2.3kW ;Pnom = 2.3kW
kdroop =∆U/Unom
∆P/Pnom
= 2.5%
(4.10)
Droop controller calculates the EV charging current limit Idroop using the following formula:
Idroop = (Umeas − Unom) ∗ (Imax − Imin)(Unom ∗ kdroop) + Ibase (4.11)

56 CHAPTER 4. GRID SERVICE APPLICATIONS
0.89 0.9 0.91 0.92 0.93 0.94 0.95 0.96 0.97 0.98 0.99 102468
1012141618
Phase-to-neutral voltage (pu)
EVcu
rren
t(A
) Ideal droopReal droop 1Real droop 2
(a)
0.89 0.9 0.91 0.92 0.93 0.94 0.95 0.96 0.97 0.98 0.99 102468
1012141618
Phase-to-neutral voltage (pu)
EVcu
rren
t(A
) Ideal droopReal droop 3
(b)
Figure 4.18: Implemented droop controls: (a) k=5%, and (b) k=2.5%
where Umeas is the actual voltage measurement and Ibase is a base EV charging current whenvoltage is at the nominal value and corresponds to 11A.
IEV =
Idroop, Imin ≤ Idroop ≤ Imax
Imax, Idroop > Imax
Imin, Idroop < Imin
(4.12)
Imax value represents the available power connection current rating at the consumer site, which istypically 16A, and can be further upgraded to 32A or higher. While Imin is chosen from lowercharging current limit from IEC 61851 standard.
To validate the previously described controller in real EV charging processes, typical low voltagedistribution feeder has been recreated in a laboratory environment. The feeder is grid connectedthrough a typical MV/LV 200 kVA distribution transformer, whereas the EVs are connected inthe end of the feeder next to the resistive load, representing a common home charging setup.Additionally, the feeder includes a set of renewable sources such as a wind turbine along with acontrollable resistive load capable of modulating the consumption independently per phase.
The EV voltage support can theoretically be done by modulating the active and/or the reactivepower. However, since the reactive power control is currently not available in commercial EVs,this experiment focuses on active power control for voltage support. Each electric vehicle supply

4.2. VOLTAGE QUALITY IN LOW VOLTAGE NETWORKS 57
equipment (EVSE) is equipped with a local smart charging controller which adjusts the EV chargingpower according to the droop control described above. Since the controller is independent for eachvehicle, the charging current is calculated based only on local voltage measurement meaning thatthe EVs connected to different phases will react differently. Therefore, the vehicles connected toheavy loaded phases will provide more voltage support due to lower measured voltages resultingin being a less burden to the already unbalanced grid.
The complete test setup is distributed over the SYSLAB grid at the Risø Campus of TechnicalUniversity of Denmark. The studied experimental setup is depicted in Figure 4.19.
Figure 4.19: Schematic overview of the experimental setup
As seen in the figure, the setup consists of the following components:
• 3 commercially available EVs (Nissan Leaf) with single phase 16 A (230 V ) charger and24 kWh Li-Ion battery.
• 2-blade wind turbine Gaia with rated power Pn = 11 kW .
• 45 kW resistive load (15 kW per phase) controllable per single-phase in 1 kW steps.
• set of Al 240 mm2 underground cables approximately 1.95 km in length with AC resistanceat 45oC RAC = 0.14Ω/km and series reactance X = 0.078Ω/km
• 75 m of Cu 16 mm2 cable with AC resistance at 45oC RAC = 1.26Ω/km and series reactanceX = 0.076Ω/km
• 10/0.4 kV, 200 kV A transformer.
The wind turbine connected to the test grid, although not significantly large as active power source,provides stochastic active and reactive power variation to the system. Additionally, it makes thetest grid closer to a possible realistic distribution grid with more diverse components than justpure resistive loads.
From the line parameters above, the X/R ratio is calculated to highlight the impedance characteristicof the grid: X/R equals to 0.43. The X/R ratio of the test system is quite low i.e., in the range of thetypical LV system and is comparable to CIGRE network [82] as well as other benchmark systems.

58 CHAPTER 4. GRID SERVICE APPLICATIONS
Therefore, active power modulation is the most effective way to control voltage levels althoughreactive power control could also be effective to a certain extent as shown in reference [21].
Firstly, the droop controller with a 5% droop and minimum charging current of 6 A, shown as realdroop 1 in Figure 4.18a, is applied to the EV charging. Measured voltage at the EVSE, load increasesteps and corresponding EV charging currents can be seen in Figure 4.20, whereas Figure 4.21shows the correlation between the measured phase-to-neutral voltage and the measured EVresponse for each of the phases. The correlation plot closely resembles the droop characteristicshown in Figure 4.18a.
195200205210215220225230235240
Volt
age [
V]
Phase A Phase B Phase C
0
10
20
30
40
50
60
Curr
ent
[A]
15:04 15:06 15:08 15:10 15:12 15:14Time
468
1012141618
Curr
ent
[A]
Figure 4.20: Voltage, load and charging current measurements for EV smart charging test scenarios:II - 15:03 to 15:08, III - 15:08 to 15:12 and IV - 15:12 to 15:16
It can be observed that the EVs already start responding at the second load step since the voltageexceeds the droop control boundary of 0.95 Un. Even for the maximum loading, the voltages arekept above 0.9 Un as EVs are reducing the charging currents to a minimum value of 6 A. Anotherinteresting phenomena to notice is that the phase-to-neutral voltage on the unloaded phase isrising when the load is increased on the other phases. That is due to a floating, not grounded,neutral line, which introduces a greater voltage unbalance.
Controlled EV charging according to IEC61851 also has the ability to stop and restart the chargingof the vehicle. This function could potentially further improve the power quality in the system asthe load from the EV could temporarily be removed. Therefore, the same droop controller with 5%slope, but minimum charging current of 0 A is studied. The modification of the droop curve isdone as shown in Figure 4.18a as real droop 2.

4.2. VOLTAGE QUALITY IN LOW VOLTAGE NETWORKS 59
190 200 210 220 230 240 250Voltage [V]
0
2
4
6
8
10
12
14
16
18
Curr
ent
[A]
Phase A
Phase B
Phase C
Figure 4.21: Correlation plot between measured phase-to-neutral voltage and EV current for testscenarios II to V
Similarly to previous scenarios, Figure 4.22 shows the measured voltage at the EVSE, load increasesteps and corresponding EV charging currents.
190
200
210
220
230
240
250
Volt
age [
V]
Phase A Phase B Phase C
0
10
20
30
40
50
60
Curr
ent
[A]
15:20 15:22 15:24 15:26 15:28 15:30 15:32Time
02468
1012141618
Curr
ent
[A]
Figure 4.22: Voltage, load and charging current measurements for EV smart charging test scenarios:V - 15:19 to 15:24, VI - 15:24 to 15:28 and VII 15:28 to 15:33
Figure 4.23 presents the correlation between the controller’s input voltage and the measured EV

60 CHAPTER 4. GRID SERVICE APPLICATIONS
response. The relation pattern is partly resembling the curve shown on Figure 4.18a as real droop 2.Although, unlike in the droop curve two clear drops at 6 and 10 A are present. The second dropappears due to controller induced oscillation, which will be explained further.
190 200 210 220 230 240 250Voltage [V]
0
2
4
6
8
10
12
14
16
18
Curr
ent
[A]
Phase A
Phase B
Phase C
Figure 4.23: Correlation plot between measured voltage and EV current for test scenarios V to VII
Figure 4.22 shows that the system response is almost identical to the test scenarios II to IV, besidesin the maximum loading case. At that point, one can notice oscillations in test scenario V andVII which occur due to the brief voltage dip for the last load step. This step briefly puts thevoltage under 0.9 Un, which triggers the controller to stop the charging of the EVs. As the EVs stopcharging, the voltages rise to about 0.93 Un, which makes the controller restart the EV chargingsince the voltage is now high enough. The restarting process takes about 8 seconds. However,as the EVs restart the charging, the voltage briefly dips under 0.9 Un again making the controllerto stop the charging. This instability repeats as long as the voltage level stays close to 0.9 Un. Inscenario VI, EV on phase a stably mitigates the voltage unbalance by stopping the charge. Atthe same time, EV on phase b also stabilises the charging current at 7 A, right at the lower limitof stopping the charge. The aforementioned oscillation issues could be solved by modifying thecontroller to detect the voltage transients and only react for the steady state voltage measurements.However, this has been omitted from the conducted study and left for future work.
Table 4.2: Maximum VUF, steady state voltage values and voltage drop from grid connection tothe EV connection point
Scenario I II III IV V VI VII VIIILoad 3 phase 3 phase 2 phase 1 phase 3 phase 2 phase 1 phase 3 phase
Droop Control - 5% 5% 5% 5% 5% 5% 2.5%Min EV Current 16A 6A 6A 6A 0A 0A 0A 6A
VUFmax[%] 1.3 0.8 9.0 7.9 0.6 8.4 6.4 1.0Uanmaxloadss [V] 202.8 208.4 203.6 234.5 212.5 208.0 233.0 209.0Ubnmaxloadss [V] 202.6 207.9 209.6 225.7 213.5 207.5 225.0 210.5Ucnmaxloadss [V] 206.6 210.5 235.9 203.5 214.0 235.0 208.5 212.6
∆Uan[V] 33.0 27.4 32.1 1.6 23.5 27.8 3.0 27.0∆Ubn[V] 30.3 25.1 23.1 7.3 20.7 25.4 7.2 22.6∆Ucn[V] 28.3 24.4 -1.2 31.3 19.7 -0.1 27.5 22.3

4.3. PRICE BASED SMART CHARGING 61
Firstly, one should note that smart charging when all 3 phases are evenly loaded (test scenarios I,II, V and VIII) improves the voltage unbalance factor (VUF). Secondly, VUF in heavily unbalancedscenarios is much beyond the standard limit for scenarios III, IV, VI and VII. Here, the controllertries to minimise the unbalance by setting EV charging current to the minimum value specified foreach scenario. However, vehicles alone can not eliminate the unbalance in the case of maximumloading, since controllable EVs represent only 17 % of the total load. This flexibility could beextended to 25 % if the charging is stopped. It should be noted that values of smart chargingscenarios V, and VII were calculated from the measurements of the steady states between theoscillations. Nevertheless, greater controllable power amount results in significant improvementsin power quality for scenarios V to VII.
It has been shown that local smart charging controllers can improve power quality in the distributionsystems even in extreme cases. Consequently, this allows the integration of higher EV amountin the distribution grids without the need for unplanned and costly grid reinforcements. As thecontroller and the supporting infrastructure is made from standardised components, such controlschemes could potentially be integrated in the EVSE with minimal development effort whichmakes such solution economically attractive.
4.3 Price based smart charging
All previous grid services were implemented without regard to EV user comfort i.e. estimation ofavailable EV flexibility was not applied. The available flexibility of an EV could be estimated byknowing actual and desired SOC together with departure time. Charging according to externalcontrol signal while accounting for available flexibility is commonly known as smart charging.
One typical application of smart charging is to minimize the charging cost in the areas whereelectricity prices are dynamic. Here smart charging is implemented according to EcoGrid pricesignal. EcoGrid prices are generated based on the amount of renewable energy production in thearea. As can be seen from Figure 4.24, the controller is getting price updates from a prerecordedprice database. In this interface live price update is emulated by extracting new values from theprice history using the moving window.
Figure 4.24: Smart charging experimental setup
The EcoGrid price stream consists of three prices series:

62 CHAPTER 4. GRID SERVICE APPLICATIONS
• Real-time price - the actual electricity price, used for calculating the electricity bill, updatedevery 5 minutes
• Hour ahead price - a collection of 5 minute electricity price predictions for the next hour,updated once an hour
• Day ahead price - a collection of hourly price predictions for next 24 hours, updated once aday
Figure 4.26 shows a closer view on price update frequency and accuracy of the predicted pricestreams compared to real-time price.
Jan 01 2014 Jan 02 2014 Jan 03 2014 Jan 04 2014 Jan 05 2014 Jan 06 2014 Jan 07 2014 Jan 08 2014 Jan 09 2014Time
50
0
50
100
150
200
250
300
Pri
ce (
DK
K/M
Wh)
Real-time priceHour-ahead priceDay-ahead price
Figure 4.25: EcoGrid price streams
Since the prices are provided for different time slots, the aggregated price for the next 24 hours iscomposed as shown in Figure 4.27.
This way each price occupies the time slot closest to real time.
The smart charging controller is running with the following algorithm:
while true doread and process price stream data;read the actual EV SOC;calculate the optimal charging schedule;actuate charging power for the EV
(Pch
);
wait for 5 minutesend
Algorithm 2: Smart Charging Control
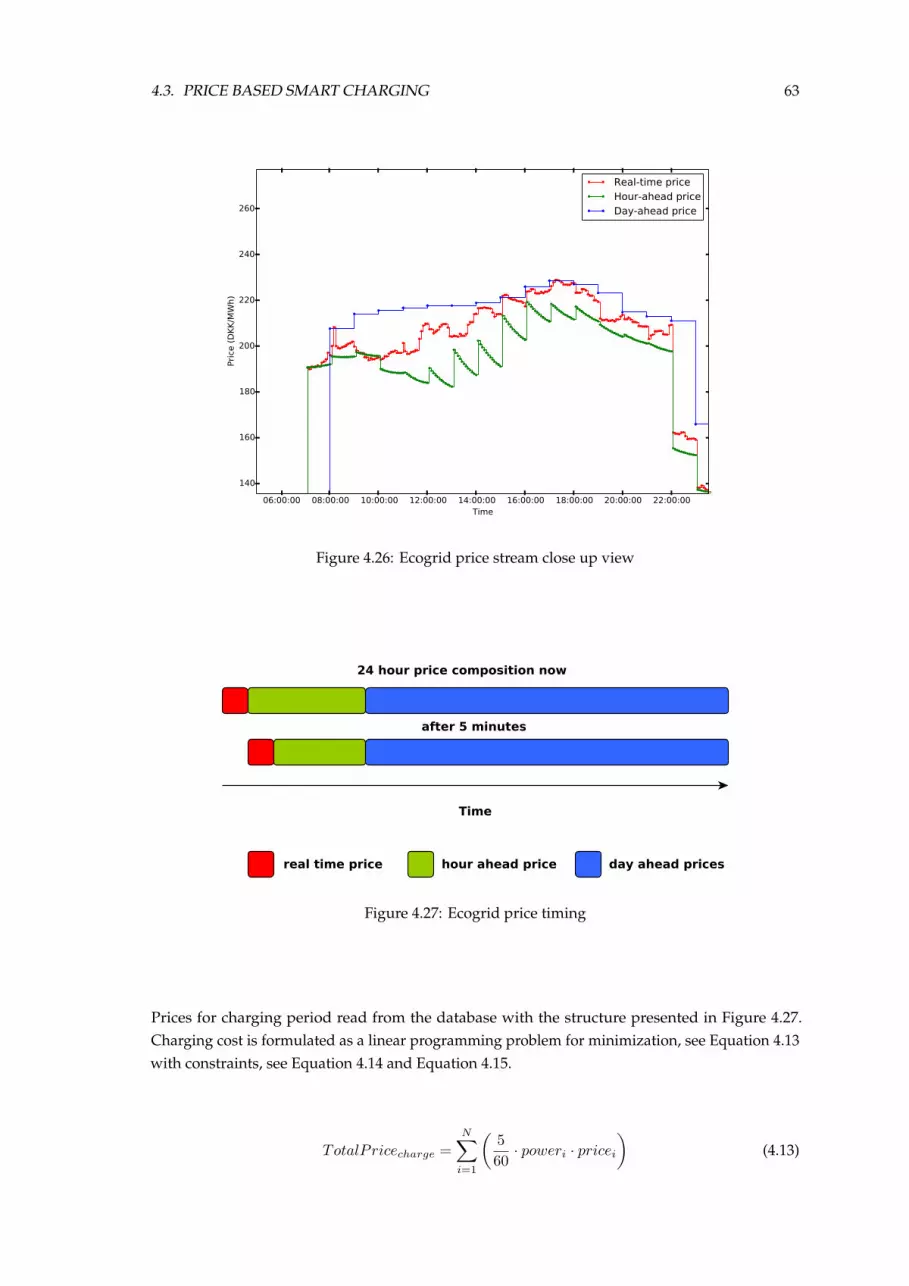
4.3. PRICE BASED SMART CHARGING 63
06:00:00 08:00:00 10:00:00 12:00:00 14:00:00 16:00:00 18:00:00 20:00:00 22:00:00Time
140
160
180
200
220
240
260
Pri
ce (
DK
K/M
Wh)
Real-time priceHour-ahead priceDay-ahead price
Figure 4.26: Ecogrid price stream close up view
Figure 4.27: Ecogrid price timing
Prices for charging period read from the database with the structure presented in Figure 4.27.Charging cost is formulated as a linear programming problem for minimization, see Equation 4.13with constraints, see Equation 4.14 and Equation 4.15.
TotalPricecharge =N∑
i=1
(560 · poweri · pricei
)(4.13)

64 CHAPTER 4. GRID SERVICE APPLICATIONS
Estart +N∑
i=1
(560 · Pi · η
)≤ Ecapacity (4.14)
Eend +N∑
i=1
(560 · Pi · η
)≥ Etarget (4.15)
where Estart and Eend are energy in the battery at the plug-in and plug-out times. Etarget is aenergy target for the battery by plug-out time. Pi is the charging power for the time interval i.N is number of 5 minute intervals from plug-in to plug-out. A linear battery model is used asthe operational state of charge will be from 30 to 90%, in which the battery can be charged withconstant power [83].
23:00:00
00:00:00
01:00:00
02:00:00
03:00:00
04:00:00
05:00:00
06:00:00
07:00:00
08:00:00
Time
0
1
2
3
4
5
6
7
8
Pow
er
(kW
)
0.02
0.04
0.06
0.08
0.10
0.12
0.14
0.16
0.18
0.20
Pri
ce (
DK
K/k
Wh)
Power
Price
SOC
55
60
65
70
75
80
85
90
95
SO
C (
%)
Figure 4.28: Smart Charging simulation results
22:00:00
23:00:00
00:00:00
01:00:00
02:00:00
03:00:00
04:00:00
05:00:00
06:00:00
07:00:00
Time
1
0
1
2
3
4
5
6
7
Pow
er
(kW
)
0.02
0.04
0.06
0.08
0.10
0.12
0.14
0.16
0.18
0.20
Pri
ce (
DK
K/k
Wh)
Power
Price
SOC
50
55
60
65
70
75
80
85
90
95
SO
C (
%)
Figure 4.29: Smart Charging experiment results
In the simulation Figure 4.28 and experiment Figure 4.29, the charging is happening during thecheapest time slots, which closely resembles the simulated case. Meanwhile, in Figure 4.29 thesmall charging peaks present after the vehicle has reached target SOC, is the controller trying

4.4. CONCLUSION 65
to maintain the battery at the target SOC. The reason for the drops, are the same as previouslymentioned regarding PEU idle consumption and active cooling system.
The energy and charging cost results are summarized in the Table 4.3 .
Table 4.3: Smart Charging cost summary
Case Energy Needed Energy Consumed Total Charging CostDumb 13.22 kWh 13.22 kWh 1.060 DKKSmart 13.22 kWh 14.01 kWh 0.556 DKK
The first thing to notice, is that smart charging reduces the cost of charging with more than a factortwo. The other noticeable thing is that charging in general is rather cheap. That is due to the factthat these prices are derived from bulk electricity prices, and therefore do not include various taxes.In Denmark a large part of the electricity price consists of taxes. However, even after adding taxes,the economic benefit of smart charging versus regular charging, would be still noticeable.
This smart charging experiment also serves as a proof of concept. Intelligent integration of gridservice provision into a smart charging process could yield additional benefits to the power gridand the EV user.
4.4 Conclusion
While many previous works have tried to prove EVs ability to provide certain grid services, thereis no better way than to confirm that than experimental validation. The control architecturefrom Chapter 3 has been implemented to enable the experiments. The conducted experimentalvalidations show that EV are more than capable of providing multiple grid services. Activepower adjustment of EV chargers, combined with fast communication links provide superiorperformance to any contemporary frequency regulation specification. Addition of reactive powercontrol to external and on board EV chargers could even further improve its value in the local grid.Unfortunately, due to non existing local grid service markets and thus missing financial incentivessuch devices are not yet manufactured. It is important to note that, to gain user acceptance, all thepractical implementations of the grid services should include incentives and account for availableEV user flexibility.
4.5 Contribution summary
The author has implemented the control architecture, described in Chapter 3, in a laboratoryenvironment to experimentally validate a set of grid services. Frequency regulation services havebeen implemented on many levels: the proof of concept with a single vehicle showed that EVs arecontrollable and fast. Experimental validations in the microgrid showed with significant share ofcontrollable EVs in the grid they could provide even fast frequency regulation services. Similarly,the author used the same control architecture to prove that EVs could also be useful in the local grid,by implementing a decentralized voltage quality controller. Lastly, a proof of concept of electricvehicle smart charging based on the dynamic electricity price signal has also been simulated andexperimentally validated.

66 CHAPTER 4. GRID SERVICE APPLICATIONS
4.6 List of publications
The relevant publications are listed as follows:
C S. Martinenas, M. Marinelli, P.B. Andersen, C. Træholt, ”Implementation and Demonstrationof Grid Frequency Support by V2G Enabled Electric Vehicle,” in Proceedings of the 49thInternational Universities Power Engineering Conference (UPEC) 2014, Cluj-Napoca, Romania,Sep. 2014.
D M. Marinelli, S. Martinenas, K. Knezovic, P.B. Andersen, ”Validating a centralized approachto primary frequency control with series-produced electric vehicles,” in Journal of EnergyStorage, Vol. 7, 2016, p. 63–73.
E S. Martinenas, M. Marinelli, P.B. Andersen, C. Træholt, ”Evaluation of Electric VehicleCharging Controllability for Provision of Time Critical Grid Services,” in Proceedings of the51st International Universities Power Engineering Conference (UPEC) 2016, Coimbra, Portugal,Sep. 2016.
F M. Rezkalla, A. Zecchino, S. Martinenas, A. Prostejovsky, M. Marinelli, ”Comparison betweenSynthetic Inertia and Fast Frequency Containment Control Based on Single Phase EVs in aMicrogrid,” in Applied Energy, 2017.
G S. Martinenas, K. Knezovic, M. Marinelli, ”Management of Power Quality Issues in LowVoltage Networks using Electric Vehicles: Experimental Validation,” in IEEE Transactions onPower Delivery, IEEE, 2016.
H S. Martinenas, A.B. Pedersen, M. Marinelli, P.B. Andersen, C. Træholt, ”Electric Vehicle SmartCharging using Dynamic Price Signal,” in Proceedings of IEEE International Electric VehicleConference (IEVC) 2014, Florence, Italy, Dec. 2014.

Chapter 5Interoperability issues and integration
challenges
This chapter focuses on the concept of interoperability applied in the field of e-mobility. The worklooks deeper into the existing and potential interoperability issues in e-mobility infrastructure andpossible solutions for it. Most of the work is based on findings and results of the COTEVOS projectthat the author participated in [38].
5.1 What is interoperability and why is it needed?
Interoperability is the characteristic of the system to be able to function when system componentsare changed. In the field of e-mobility, fully interoperable charging systems would enable seamlesscharging of any electric vehicle with any charging station.
A few reasons to have interoperable systems in e-mobility are:
• User comfort - allow users to charge anywhere, enabling seamless roaming across large areas.
• Economic benefits - interoperable systems are much easier to maintain, as operation costs arereduced by lack of conflicts and smaller integration overhead.
• Larger fleet availability for grid service provision - more vehicles could provide the sameservices, thus increasing redundancy and flexibility.
5.2 What interoperability problems exist in e-mobility?
While e-mobility is a relatively young field, it is already plagued by the interoperability issues [84].Current interoperability problems in e-mobility are:
• Mismatch of the hardware interfaces
• Multiple versions of different protocols that cover the same communication link
• Low level of standardization between high level actors
67

68 CHAPTER 5. INTEROPERABILITY ISSUES AND INTEGRATION CHALLENGES
Figure 5.1: Different EV plug types for AC and DC charging [85].
Mismatch of the hardware interfaces is perhaps the most evident problem in e-mobility. Every EVowner is familiar with the issue of the charging spot plug not fitting their EV socket because ofdifferent plug type.
An overview of all the common AC and DC charging plugs for EVs is shown in Figure 5.1.
It should be noted that Tesla vehicles in USA use a proprietary Tesla Supercharger plug, but inEurope, due to regulation, they have to use the Type 2 plug. All Tesla Superchargers in Europe usethe same Type 2 plug. Engineering decisions by Tesla have maximized the utility of the Type 2plug to support both AC and DC charging without the need for adding extra pins, such as in Type2 CCS plug. The way, that Tesla has managed to utilize the simple Type 2 plug, is by using 2 of thepower pins (L1 and L2) for + (positive side) and two other power pins (L3 and N) for - (negativeside) of the DC connection, when the car is charging at the Tesla Supercharger. The problem ofhigh current running trough the Type 2 plug (AC charging station are rated up to 80A, whereasDC fast chargers could reach around 300A) was solved by making the pins in the plug a bit longer,thus increasing the contact area, while maintaining backwards compatibility with Type 2 plugsused in common AC charging stations.
Looking at some of the most popular EVs on the market, one can notice a variety of supportedcharging standards, shown in Table 5.1.
It is evident that Japanese manufactured vehicles are all supporting type 1 plugs for AC chargingand CHAdeMO standard for DC. On other hand, European vehicles are mostly made with type 2
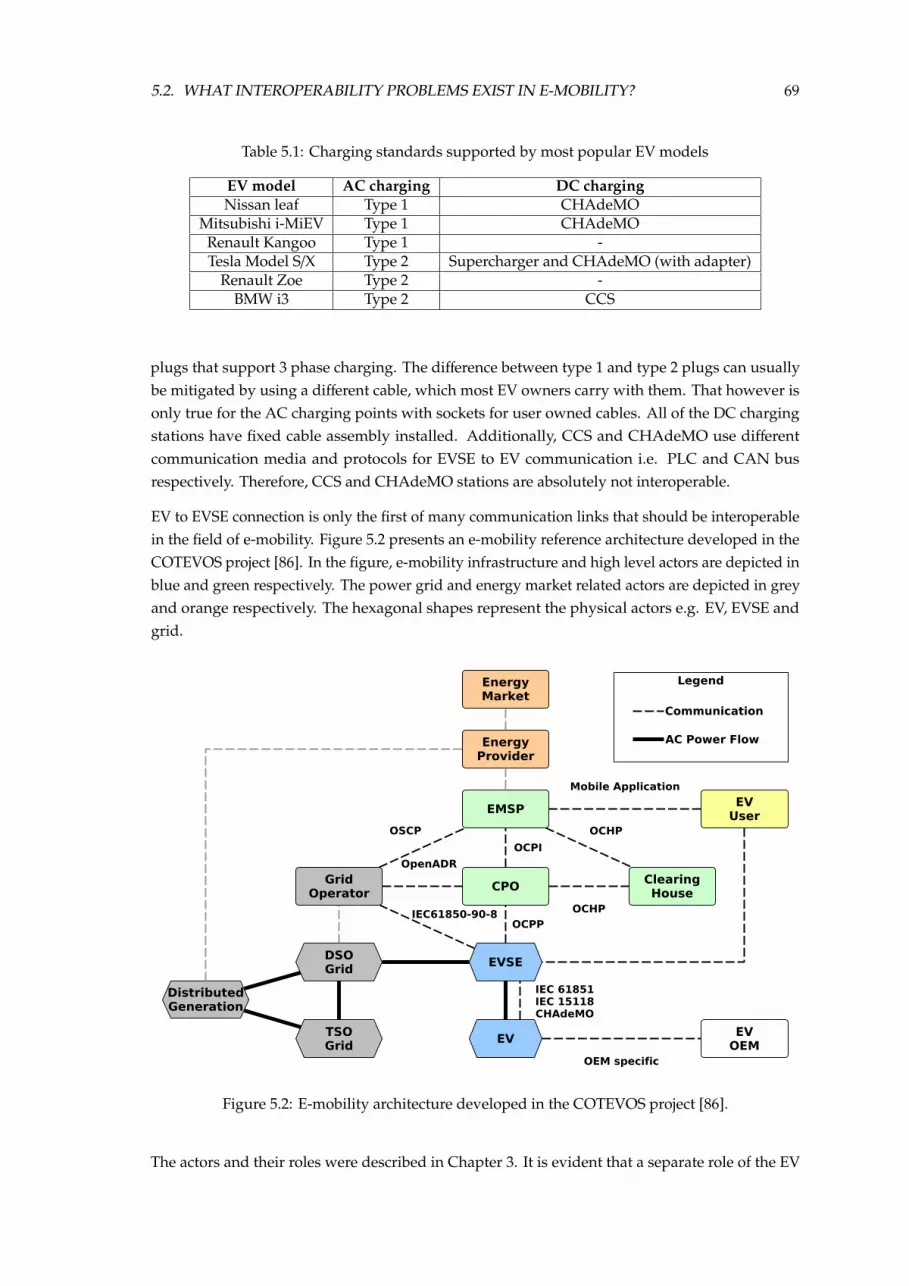
5.2. WHAT INTEROPERABILITY PROBLEMS EXIST IN E-MOBILITY? 69
Table 5.1: Charging standards supported by most popular EV models
EV model AC charging DC chargingNissan leaf Type 1 CHAdeMO
Mitsubishi i-MiEV Type 1 CHAdeMORenault Kangoo Type 1 -Tesla Model S/X Type 2 Supercharger and CHAdeMO (with adapter)
Renault Zoe Type 2 -BMW i3 Type 2 CCS
plugs that support 3 phase charging. The difference between type 1 and type 2 plugs can usuallybe mitigated by using a different cable, which most EV owners carry with them. That however isonly true for the AC charging points with sockets for user owned cables. All of the DC chargingstations have fixed cable assembly installed. Additionally, CCS and CHAdeMO use differentcommunication media and protocols for EVSE to EV communication i.e. PLC and CAN busrespectively. Therefore, CCS and CHAdeMO stations are absolutely not interoperable.
EV to EVSE connection is only the first of many communication links that should be interoperablein the field of e-mobility. Figure 5.2 presents an e-mobility reference architecture developed in theCOTEVOS project [86]. In the figure, e-mobility infrastructure and high level actors are depicted inblue and green respectively. The power grid and energy market related actors are depicted in greyand orange respectively. The hexagonal shapes represent the physical actors e.g. EV, EVSE andgrid.
Figure 5.2: E-mobility architecture developed in the COTEVOS project [86].
The actors and their roles were described in Chapter 3. It is evident that a separate role of the EV

70 CHAPTER 5. INTEROPERABILITY ISSUES AND INTEGRATION CHALLENGES
aggregator is missing from this architecture, instead it is distributed between grid operator, EMSPand CPO.
In the COTEVOS project all the communication links between actors were divided into thefollowing groups:
EV charging and operation - focusing on testing the interoperability between EV and EVSE.
EVSE operation - focusing on interoperability between EVSE and CPO back-end.
EV/EVSE user services - meant for testing interoperability issues that directly involve the user.
EMSP-CPO services - meant for testing interoperability between different CPOs and EMSPs.
Adaptive charging - meant for testing interoperability issues in adaptive charging scenarios.
V2X and grid services - meant for testing interoperability issues in grid service provision scenarios.
Wireless charging - focusing on testing the interoperability between EV and EVSE when usingwireless charging.
5.3 How is interoperability ensured?
Interoperability could be ensured by creating a testing framework [87]. The COTEVOS projectattempted to create interoperability testing procedures for entire e-mobility architecture. Whilethis seems like a good idea, such task is too large to comprehensively cover all the interfaces of thearchitecture in one project. However, firstly all the use cases for the e-mobility operation werewritten up. Then all of these use cases were converted into test procedures presented in the fullversion of Pub. I. The full version of Pub. I is 462 pages long as it contains all the test proceduresin its appendix. Therefore only a summary and table of contents of this deliverable is attached tothe thesis, the full publication can be found online here [88].
5.3.1 Interoperability testing
An example of test procedure from EV charging and operation group can be seen in Table 5.2. Theexample is filled in with realistic test data that would result from a test performed in the laboratory,presented in italic. Each test procedure is structured in three main parts. Firstly, a brief summaryof the procedure is presented on the top. It contains name, test group, short description, objectiveand relevant standards. Secondly, the fields to be filled with testing equipment specifications arein the middle. Lastly, the steps for the procedure with expected outcome and comment fields ,to befilled, are in the bottom.
As can be seen in the procedure, the test case is closely following the charging process defined inIEC 61851-1. The vehicle under test is the Nissan Leaf EV which supports this standard, thus thetest results in nominal performance as expected.
Most testing procedures like the one shown in Table 5.2 are based on the existing standard orspecification that covers that link. However, some test cases especially in the higher levels of thereference architecture were quite generic as shown in Table 5.3.
As can be seen here the test case is based on a generic frequency regulation service, thus testing thewhole communication chain from the grid operator, trough the e-mobility infrastructure all the

5.3. HOW IS INTEROPERABILITY ENSURED? 71
Table 5.2: Test procedure from EV charging and operation group.
Author Version DateDTU 1.1 2015-04-08
Test Group EV charging and operationTest Case EV Charging using IEC61851Test ID TC-1.3-EV-001
Description EV charging using IEC61851 compatible EVSEObjective Charge the EV using IEC61851 standardRelevantstandards IEC61851
Equipment specifications
EV
Model: Nissan LeafBattery size: 24kWhPhases: 1Max charging current per phase: 16A
EVSEModel: DTU EVSEPhases: 3Maximum current per phase: 32A
Cable Rated current: 16ATest procedure
Nr Action ExpectedResult
ActualResult
Preconditions EV SOC below 50% <50% 48%1 Plug cable into the EVSE true true2 Plug cable into the EV true true3 Observe CP line state change from B to C true true4 Enable PWM true true5 CP line PWM set to 16A true true6 Close the EVSE contactor true true7 EV charging starts true true8 Charging voltage at EVSE value 225.7V9 Charging current at EVSE value 15.4A
10 End charge - unplug cable true true11 Charging SOC at start/end % value/value 48%/51%
Post conditions -Comments Test for 16A, 32A, 63A and a chosen current limit setting in between
way to the EV. In the example case an unmodified unidirectional EV has been used to provide aprimary frequency regulation service just like one presented in Chapter 4. The test case is standardagnostic and allows for testing almost any functional grid service setup based on e.g. IEC 61851or IEC 15118 or CHAdeMO. Additionally, it relies on the compatible communication links in thehigher layers of e-mobility infrastructure e.g. OCPP, IEC61850-90-8 or OpenADR.
5.3.2 Recommendations for ensuring interoperability
To ensure interoperability in the e-mobility infrastructure, the following recommendations areidentified:
• Harmonization of charging plugs - currently multiple types of charging plugs exist for ACand DC charging, which sometimes creates a problem for EV users to find a compatiblecharging station.

72 CHAPTER 5. INTEROPERABILITY ISSUES AND INTEGRATION CHALLENGES
Table 5.3: Test procedure from V2X and grid services group.
Author Version DateDTU 1.0 2015-08-04
Test Group V2X and Grid ServicesTest Case Primary Frequency RegulationTest ID TC-6.1-EV-001
Description Primary frequency regulation using an EVObjective Testing EV ability to provide grid frequency regulation serviceRelevantstandards IEC61851, IEC15118, IEC61850-90-8, OCPP
Equipment specifications
EV
Model: Nissan LeafBattery size: 24kWhPhases: 1Max charging current per phase: 16A
EVSEModel: DTU EVSEPhases: 3Maximum current per phase: 32A
Cable Rated current: 16ATest procedure
Nr Action ExpectedResult
ActualResult
Preconditions
V2X is supported by the EV and EVSEEV is connected to the EVSECharging session is initiatedNeutral current setpoint is set
truetruetrue0kW
falsetruetrue11A
1 Aggregator measures grid frequency value 50.2Hz2 Aggregator calculates the power setpoint value 16A3 Setpoint is sent from aggregator to CPO true true4 Setpoint is sent from CPO to EVSE true true5 EVSE and EV renegotiate the charging schedule true NA6 EV accepts the new charging schedule true NA7 EV (dis)charging power changes value 16A
Post conditions EV power is corresponding to the setpoint set by the aggregatorComments EV with IEC61851 is used, no V2G support
• Open and easily accessible specifications/standards - the process of acquiring a copy of thespecification and a possibility to give feedback should be straight forward.
• Strict protocols with detailed and clear communication description - concrete definitions inthe protocol design, that do not leave room for misinterpretation, are a key component ofinteroperable communication protocol.
• Available testing tools - the implementations should be tested with testing tool approved ordeveloped by the organization that is developing the standard/specification.
• Establishment of certification bodies - while testing tools should provide a basic level ofinteroperability, each implementation should be fully tested by an official certification bodythat ensures same level of testing for each implementation, providing consistency.

5.4. CONCLUSION 73
• Application workshops and testing symposiums - just like IEC15118 testing symposiums,such workshops would not only help companies to improve their implementations but alsoprovide feedback to standardization bodies on the needs for future improvements in thestandard.
• One link, one specification - each communication link in the e-mobility infrastructure shouldpreferably be covered by one specification/standard avoiding overlap or a gap.
5.4 Conclusion
Although, it might be difficult to fit the study on the interoperability issues into academic context,the practical application of this work is immediate. At the start of the work on assessing andensuring the interoperability in e-mobility infrastructure very few standards/specifications existed.During past few years, the gaps in the communication links were covered by one or morespecifications. Most of these specifications do follow the recommendations identified in the projectand thus are highly interoperable. However, there is still a long way to go to ensure the fullinteroperability of each communication link in the e-mobility architecture. The main findings ofthe COTEVOS project were summarized by project participants in the white book on “BusinessOpportunities for Interoperability Assessment of EV Integration“ [89].
5.5 Contribution summary
Most results in this chapter are building on top of the work performed in the COTEVOS project, thatthe author has participated in. The main contributions of the author in the topic of e-mobility arethreefold. Firstly, survey of the current state in interoperability issues. Secondly, development andcoordination of the test procedures and their execution. Lastly, formulation of the recommendationsto ensure interoperability.
5.6 List of publications
The relevant publications are listed as follows:
I T.M. Sørensen, M.B. Jensen, S. Martinenas, ”Analysis of needs for on-going or incipientstandards. Design of Round Robin tests and results of the performed tests. Recommendationsfor existing standards” in COTEVOS project deliverable, Feb. 2016


Chapter 6Conclusion
This chapter summarizes the presented thesis by reflecting on the formulated research questions.Additionally, different e-mobility development perspectives are elaborated on and outline of thefuture work is presented.
6.1 Research conclusions
The main motivation for EV integration into the smart grid is their potential ability to providegrid services as distributed energy resources. The work focused on answering the question:Whatis technically required to use an EV as a smart mobile distributed energy resource? This mainquestion was divided into sub-questions, here are the answers to the those questions:
• What grid services could EVs provide?In Chapter 2 the arguments for grid integration of EVs and their potential benefit for thegrid services were outlined: EVs could provide a variety of grid services on distributionand transmission levels. These arguments then were experimentally proven in Chapter 4 byshowing that EVs could provide different grid services such as fast frequency regulation,local power quality improvement and smart charging. Even though the frequency regulationservice has been experimentally validated just two years ago, it is already implementedin a pilot project in Copenhagen [90]. Possible future services such as very fast frequencyregulation or even synthetic inertia are definitely achievable as inverter based chargershave an almost instantaneous response, that is only limited by the controllers. Local gridpower quality improvement services i.e. voltage and congestion control were proven to bealso feasible. However, clear regulation and compensation schemes for such local servicesshould be established. The grid regulation could be inspired by the solutions from localPV integration experience. Finally, while providing grid services, user comfort should notbe forgotten. Therefore, smart charging should be incorporated as part of the grid serviceprovision to ensure maximum benefit for the grid and the EV user.
• What are ICT requirements for EV aggregation?EV aggregators are becoming an integral part of e-mobility infrastructure. Therefore, clearinformation exchange models all the way from EV to the aggregator should be established.In the process of this study essential, quality improving and optional parameters have beenidentified. These can be further divided into dynamic and static information objects. Theessential dynamic information objects passed on are: SOC, power set-point, identification, gridparameters (frequency, voltage). Quality improving dynamic information objects: departure
75

76 CHAPTER 6. CONCLUSION
time and desired SOC (defining available flexibility). The essential static information is:nominal battery capacity, power connection limitation, location on the grid. All of thementioned parameters are essential to be implemented in the communication links from theEV, trough the e-mobility infrastructure, to the aggregator.
• What is current EV technology development status in relation to grid integration?The survey of e-mobility technologies in Chapter 3 has shown that EVs are technically readyto integrate into the grid. The charging hardware devices are controllable, while batterydegradation arising from V2G activities, investigated in the PhD study, is acceptable due tolow cycling of the battery and much lower power levels compared to driving duties [91–93].Contemporary standards and communication protocols are largely ready to support the EVgrid integration requirements and are constantly developing in that direction. More specificimprovements that standardization bodies should focus on are: adding missing informationobjects, stricter requirements for communication timing and implementation communicationsecurity requirements. These improvements are essential to make EVs an active part of thesmart grid.
• What technical challenges are still present for EV integration?Most major technical problems seem to be solved and multiple demonstration projects arealready successfully integrating EVs to provide grid services and alleviate congestion issues.However, some minor issues still remain, such as e-mobility communication standards,that are lacking behind by not including vital information objects for EV grid integrationin their current versions. Meanwhile, these missing information objects are acquired usingalternative methods and custom extensions to the protocols. This methodology, increasesfragmentation of standard implementations and could bring severe interoperability issuesin the future. Most organizations behind the standards/specifications are promising theinclusion of needed features in the next releases. Perhaps the biggest barriers to the active EVspread and integration into the grid are not technical, but outdated regulations and policiesthat were developed for conventional power sources. This is slowly changing, as some gridoperators are starting pilot projects with relaxed regulatory entry conditions to investigatethe services, that various DERs could provide, for the future power grid. Additionally, lackof incentives does not allow for proper acceleration of the technological innovation in EVgrid integration e.g. missing chargers with reactive power control.
• What are prerequisites and current state of EV interoperability?In Chapter 5 current interoperability problems in e-mobility field are identified and theirsolutions are proposed. These findings are largely based on the work that the author hasperformed during the COTEVOS project. The main problems with EV interoperabilityremain in the physical variety of charging plugs. AC charging of EVs has been largely unifiedbesides the minor issue of 1 phase vs 3 phase connector. DC charging still remains an activebattleground where two big standards are competing: CHAdeMO and CCS. Meanwhilethe third contender seems to stay out and develop their own solution - Tesla Supercharger.Current remedies for existing market division into different charging standards are adaptorcables and multi-standard plug EVSEs.
The prerequisites for fully interoperable charging experience are unified charging interfacesfor AC and DC charging and compatible roaming protocols in e-mobility back-ends. This allcan be ensured by extensive OEM testing and certification at regular test events. The first

6.2. E-MOBILITY DEVELOPMENT PERSPECTIVE 77
interoperability testing procedures have been developed for entire e-mobility architecture inPub. I.
6.2 E-mobility development perspective
This work has analyzed current trends in the field e-mobility with regards to integration with thesmart grid. Meanwhile, seemingly unrelated social, economic and some technical developmenttrends have not been accounted for. The purpose of this section is to try to identify those trendsand predict/speculate their impact on grid integration of EVs.
An important trend currently developing in bigger cities is ride and car sharing also known asmobility as a service. This enables anyone with a right membership to have a vehicle at anytime of the day without a need to pay for parking, fuel, vehicle registration fees and other taxesrelated to vehicle ownership. That plays well together with the needs of current generations of citydwellers, who just want mobility without the hassles of vehicle ownership. An important trend inautomotive industry that could have big effects on the way cars are used today is autonomousvehicle. This trend, together with car sharing, could eliminate the need for car ownership asa vehicle could be immediately available on request. This way most vehicles would be almostconstantly moving on the road thus greatly reducing the current trend of vehicles just standingaround 95% of the time [94]. That would greatly decrease the flexibility, needed for grid serviceprovision, expected from electrification of personal transportation.
Decreasing battery prices, resulting from technology development for transportation electrification,would make the large battery storage facilities for backup power and grid services much morecommon. These stationary battery solutions would be the biggest competitor to EVs in the gridservice provision market.
Current overall need for the primary frequency regulation reserves in continental Europe is around± 3000MW. Considering current state of the art V2G chargers or ± 10kW, theoretically already300000 EVs connected to those bidirectional chargers could saturate the market. If industrial scalebatteries and other large DERs also enter this market, EVs are facing some serious competition.This raises a question, are EVs really the best solution for providing grid services? In the shortterm, probably yes, as current state of technology and user behavior allows for enough flexibilityto provide grid services using EVs. However, this could change by the time personal transport isfully electrified. Therefore, we will have to see about the role of e-mobility in grid operation in along term.
6.3 Future work
Further research topics and possible upgrades to the developed experimental systems are:
• While bidirectional chargers are already used in a primary frequency regulation service,their design might not be most optimal. Therefore, deeper research into charging hardwaretechnologies should be done. One way to implement it is to build custom V2G chargers withactive, reactive power support and possible integrated battery. This would also allow theirimmediate testing in the laboratory conditions without the need for long waiting times ofOEMs to produce and test their hardware.

78 CHAPTER 6. CONCLUSION
• There are many electric vehicles from different manufacturers in the field. Each model ofthe vehicle usually has different power electronic components which result in a differentpower response to a control signal. Therefore, a response from a hybrid set of vehicles wherepower electronic unit response patterns are mixed should be investigated. Additionally, theresearch could be expanded with differences in response from a single (small set) and largeaggregated set of vehicles.
• Autonomous vehicles could take over the mobility market faster than expected. Therefore,to future proof current research activities, the use cases of autonomous EV for grid serviceprovision should already be considered. Furthermore, a study into aggregation of autonomousvehicles for grid service provision should investigate if the flexibility/availability of theservice would be reduced by such vehicles.
• Wireless charging is likely a de-facto charging mode of the future EVs. Therefore, a possibilityof providing grid services using bi-directional wireless charging should be investigated. Thistopic presents mostly a technical and regulatory challenge to develop an efficient bidirectionalwireless charger.
• While some grid services have a predefined control behavior e.g. frequency regulation usingdroop control, more advanced versions involving PID, MPC, etc. should be investigated fornewly identified services as they could bring improved performance. Application of moreadvanced control strategies for grid services should be researched, especially for undefinedservices like local power quality improvement and synthetic inertia.
• The second iteration of the control architecture for grid service provision, based on opene-mobility standards, is developed. However, the implementation of this architecture is notyet finalized and tested with real grid services. This is the most immediate future work task.
• Many grid services were experimentally demonstrated in this work. However, most of themwere only focusing on the grid relevant aspects of the service. In the real world conditions,the service would likely be provided using a vehicle owned by an individual. Therefore,embedding of smart charging control algorithms into the grid service provision controllersshould be investigated to provide a realistic and user friendly service.

Bibliography
[1] Installed wind power capacity in Europe, 2016. https://windeurope.org/about-wind/statistics/.
[2] Installed global wind power capacity, 2016. http://www.gwec.net/publications/global-wind-report-2/global-wind-report-2016/.
[3] IEA PVPS annual report 2016. http://www.iea-pvps.org/index.php?id=6&eID=dam_frontend_push&docID=3951.
[4] Smart grid concept diagram. http://www.ecnmag.com/sites/ecnmag.com/files/legacyimages/ECN/Articles/2011/04/SmartGridDiagram-web.jpg.
[5] Airbus e-fan electric aircraft. http://company.airbus.com/responsibility/airbus-e-fan-the-future-of-electric-aircraft.html.
[6] EV sales in Norway in 2016. http://insideevs.com/ev-sales-norway-2016/.
[7] Volvo Cars to go all electric. https://www.media.volvocars.com/global/en-gb/media/pressreleases/210058/volvo-cars-to-go-all-electric.
[8] IPCC. Climate Change 2014: Mitigation of Climate Change. https://www.ipcc.ch/report/ar5/wg3/.
[9] Dansk Energi, Dong Energy, and Energinet.dk. Analysis no. 5 – Scenarios for the deploymentof electric vehicles (in Danish). Technical report, 2013.
[10] W. Kempton and J. Tomic. Vehicle-to-grid power implementation: From stabilizing the gridto supporting large-scale renewable energy. Journal of Power Sources, 2005.
[11] J. A Peças Lopes, F. J. Soares, and P. M. R. Almeida. Integration of electric vehicles in theelectric power system. Proc. IEEE, 99(1):168–183, 2011.
[12] C. Madina, E. Zabala, R. Rodríguez-Sánchez, E. Turienzo, J. Antonio López, et al. EconomicImpact of Distribution Grid Operation Scenarios for the Integration of Electric Vehicles. 2014.
[13] K. Knezovic, M. Marinelli, P. Codani, and Y. Perez. Distribution grid services and flexibilityprovision by electric vehicles: A review of options. In Power Engineering Conference (UPEC),2015 50th International Universities, pages 1–6. IEEE, 2015.
[14] Final report on the August 14, 2003 blackout in the United States and Canada. Technicalreport, U.S.-Canada Power System Outage Task Force , 2008. http://energy.gov/oe/.
[15] V. Lakshmanan, M. Marinelli, J. Hu, and H. W. Bindner. Provision of secondary frequencycontrol via demand response activation on thermostatically controlled loads: Solutions andexperiences from Denmark. Applied Energy, 173:470–480, 2016.
79

80 BIBLIOGRAPHY
[16] Ancillary services to be delivered in Denmark Tender conditions. Technical Report October,2012.
[17] European Committee for Electrotechnical Standardization. EN50160:Voltage characteristics ofelectricity supplied by public electricity networks, 2010.
[18] K. Knezovic, C. Træholt, M. Marinelli, and P. B. Andersen. Active integration of electric vehiclesin the distribution network - theory, modelling and practice. PhD thesis, 2017.
[19] J. García Villalobos. Optimized charging control method for plug-in electric vehicles in LV distributionnetworks. PhD thesis, 2016.
[20] J. García-Villalobos, I. Zamora, J. I. San Martín, F. J. Asensio, and V. Aperribay. Plug-in electricvehicles in electric distribution networks: A review of smart charging approaches. Renewableand Sustainable Energy Reviews, 38:717–731, 2014.
[21] K. Knezovic, M. Marinelli, R.J. Moller, P.B. Andersen, C. Treaholt, and F. Sossan. Analysis ofvoltage support by electric vehicles and photovoltaic in a real Danish low voltage network.Power Engineering Conference (UPEC), 2014 49th International Universities, pages 1–6, Sept 2014.
[22] Z. Wang and S. Wang. Grid power peak shaving and valley filling using vehicle-to-gridsystems. Power Delivery, IEEE Transactions on, 28(3):1822–1829, July 2013.
[23] S. Mocci, N. Natale, F. Pilo and S. Ruggeri. Demand side integration in LV smart grids withmulti-agent control system. Electric Power Systems Research, 125:23 – 33, 2015.
[24] G. A. Putrus, P. Suwanapingkarl, D. Johnston, E. C. Bentley, and M. Narayana. Impact ofelectric vehicles on power distribution networks. In 2009 IEEE Vehicle Power and PropulsionConference, pages 827–831, Sept 2009.
[25] NIKOLA project website. http://www.nikola.droppages.com/.
[26] P.B. Andersen, M. Marinelli, O.J. Olesen, C.A. Andersen, G. Poilasne, B. Christensen, andO. Alm. The Nikola project Intelligent electric vehicle integration. Innovative Smart GridTechnologies Conference Europe (ISGT-Europe), 2014 IEEE PES, pages 1–6, Oct 2014.
[27] Charged EVs magazine. Tesla’s batteries – past, present and future. https://chargedevs.com/features/teslas-batteries-past-present-and-future/.
[28] AC Propulsion: Vehicle to Grid Power. http://www.acpropulsion.com/products-v2g.html.
[29] W. Kempton, V. Udo, K. Huber, K. Komara, S. Letendre, S. Baker, D. Brunner, and N. Pearre.A Test of Vehicle-to-Grid (V2G) for Energy Storage and Frequency Regulation in the PJMSystem. Technical report, 2008.
[30] CHAdeMO V2X technology. https://www.chademo.com/technology/v2x/.
[31] A. Kieldsen, A. Thingvad, S. Martinenas, and T. M. Sørensen. Efficiency Test Method for ElectricVehicle Chargers. 2016.
[32] Qualcomm Demonstrates Dynamic Electric Vehicle Charging. https://www.qualcomm.com/news/releases/2017/05/18/qualcomm-demonstrates-dynamic-electric-vehicle-charging.
[33] Qualcomm Halo Wireless Charging. https://www.qualcomm.com/products/halo.

BIBLIOGRAPHY 81
[34] C. Liu, C. Jiang, and C. Qiu. Overview of coil designs for wireless charging of electric vehicle.In 2017 IEEE PELS Workshop on Emerging Technologies: Wireless Power Transfer (WoW), pages1–6, May 2017.
[35] D. J. Thrimawithana, U. K. Madawala, and Yu Shi. Design of a bi-directional inverter for awireless V2G system. In 2010 IEEE International Conference on Sustainable Energy Technologies(ICSET), pages 1–5, Dec 2010.
[36] A. A. S. Mohamed, A. Berzoy, and O. Mohammed. Power Flow Modeling of Wireless PowerTransfer for EVs Charging and Discharging in V2G Applications. In 2015 IEEE Vehicle Powerand Propulsion Conference (VPPC), pages 1–6, Oct 2015.
[37] U. K. Madawala and D. J. Thrimawithana. A Bidirectional Inductive Power Interface forElectric Vehicles in V2G Systems. IEEE Trans. Industrial Electronics, 58(10):4789–4796, 2011.
[38] COTEVOS project website. http://www.cotevos.eu/.
[39] ElaadNL. EV Related Protocol Study v1.0, 2017.
[40] EV Connectors and EV Charging Cables. https://www.evse.com.au/ev-charging-cables-leads/.
[41] International Electrotechnical Commission. IEC 61851-1 ed2.0: Electric vehicle conductivecharging system - Part 1: General requirements, 2010.
[42] International Electrotechnical Commission. IEC 61851-1:2017 Electric vehicle conductivecharging system - Part 1: General requirements, 2017.
[43] C. Lewandowski, S. Gröning, J. Schmutzler, and C. Wietfeld. Interference analyses of ElectricVehicle charging using PLC on the Control Pilot. In 2012 IEEE International Symposium onPower Line Communications and Its Applications, pages 350–355, March 2012.
[44] S. Ruthe, J. Schmutzler, C. Rehtanz, and C. Wietfeld. Study on V2G Protocols against theBackground of Demand Side Management. In IBIS - Interoperability in Business InformationSystems, volume Issue 1, 2011.
[45] ISO/IEC. ISO/IEC DIS 15118-3: Road vehicles - Vehicle to grid communication interface – Part3: Physical and data link layer requirements, 2012.
[46] HomePlug Green PHY. http://www.homeplug.org/tech-resources/green-phy-iot/.
[47] ISO/IEC. ISO/IEC DIS 15118-2: Road vehicles - Vehicle to grid communication interface – Part2: Network and application protocol requirements, 2012.
[48] ISO/IEC. ISO/IEC DIS 15118-1: Road vehicles - Vehicle to grid communication interface – Part1: General information and use-case definition, 2012.
[49] OpenV2G project. http://openv2g.sourceforge.net/.
[50] C. Blach, S. Martinenas. Open source ISO/IEC 15118 communication implementation. https://github.com/Sergejus/cotevos-v2gstack.
[51] CHAdeMO celebrates 13500 fast chargers worldwide. http://insideevs.com/chademo-association-celebrates-13500-chademos-dc-fast-chargers-worldwide/.

82 BIBLIOGRAPHY
[52] International Electrotechnical Commission. IEC 61851-23: Electric vehicle conductive chargingsystem - Part 23: DC electric vehicle charging station, 2014.
[53] International Electrotechnical Commission. IEC 61851-24: Electric vehicle conductive chargingsystem - Part 24: Digital communication between a d.c. EV charging station and an electricvehicle for control of d.c. charging, 2014.
[54] Open Charge Alliance. http://www.openchargealliance.org.
[55] OCA. Open Charge Point Protocol specification 1.6. http://www.openchargealliance.org/protocols/ocpp/ocpp-16/.
[56] V2G clarity. IEC 63110 - standardizing the management of electricvehicle (dis-)charging infrastructures. https://www.v2g-clarity.com/en/blog/iec-63110-standardizing-management-of-ev-charging-infrastructures/.
[57] OpenADR Alliance. http://www.openadr.org.
[58] International Electrotechnical Commission. IEC 61850-90-8:2016 ECommunication networksand systems for power utility automation - Part 90-8: Object model for E-mobility, 2016.
[59] J. Schmutzler, C. Wietfeld, and C. A. Andersen. Distributed energy resource management forelectric vehicles using IEC 61850 and ISO/IEC 15118. In 2012 IEEE Vehicle Power and PropulsionConference, pages 1457–1462, Oct 2012.
[60] J. Schmutzler, C. A. Andersen, and C. Wietfeld. Evaluation of OCPP and IEC 61850 for smartcharging electric vehicles. In 2013 World Electric Vehicle Symposium and Exhibition (EVS27),pages 1–12, Nov 2013.
[61] NKL. Open Charge Point Interface specification 2.1. http://en.nklnederland.nl/projects/our-current-projects/open-charge-point-interface-ocpi/.
[62] Hubject. Open InterCharge Protocol further development. https://www.hubject.com/en/further-development-of-the-eroaming-protocol-oicp-by-hubject-and-the-intercharge-partners/.
[63] e-clearing.net. Open Clearing House Protocol. http://www.ochp.eu/.
[64] OCA. Open Charge Point Protocol 2.0. http://openchargealliance.org/protocols/ocpp/ocpp-20/.
[65] Sachin Kamboj, Nathaniel Pearre, Keith Decker, Keith Trnka, and Colin Kern. Exploring theformation of electric vehicle coalitions for vehicle-to-grid power regulation. In In Proc. 1st Int.Workshop on Agent Technologies for Energy Systems (ATES-2010), co-located with 9th Int. Conf. onAutonomous Agents and Multi-agent Systems (AAMAS-2010), pages 67–74, 2010.
[66] S. Kamboj and W. Kempton. Deploying power grid-integrated electric vehicles as a multi-agentsystem. AAMAS, 2011.
[67] S. Vandael, T. Holvoet, G. Deconinck, S. Kamboj, and W. Kempton. A comparison of twoGIV mechanisms for providing ancillary services at the University of Delaware. In 2013 IEEEInternational Conference on Smart Grid Communications (SmartGridComm), pages 211–216, Oct2013.

BIBLIOGRAPHY 83
[68] X. Han, K. Heussen, O. Gehrke, H. W. Bindner, and B. Kroposki. Taxonomy for evaluation ofdistributed control strategies for distributed energy resources. I E E E Transactions on SmartGrid, 2017. (c) 2017 IEEE. Personal use of this material is permitted. Permission from IEEEmust be obtained for all other users, including reprinting/ republishing this material foradvertising or promotional purposes, creating new collective works for resale or redistributionto servers or lists, or reuse of any copyrighted components of this work in other works.
[69] ZeroMQ. http://zeromq.org/.
[70] OCA. Open Smart Charging Protocol 1.0. http://www.openchargealliance.org/protocols/oscp/oscp-10/.
[71] Parker project website. http://www.parker-project.com.
[72] SYSLAB PowerLabDK. http://www.powerlab.dk/facilities/syslab.aspx.
[73] M. M. N. Rezkalla, A. Zecchino, M. Pertl, and M. Marinelli. Grid Frequency Support bySingle-Phase Electric Vehicles Employing an Innovative Virtual Inertia Controller. IEEE, 2016.
[74] A. Thingvad, S. Martinenas, P. B. Andersen, M. Marinelli, B. E. Christensen, and O. J. Olesen.Economic Comparison of Electric Vehicles Performing Unidirectional and Bidirectional FrequencyControl in Denmark with Practical Validation. IEEE, 2016.
[75] M. Singh, I. Kar, and P. Kumar. Influence of EV on grid power quality and optimizing thecharging schedule to mitigate voltage imbalance and reduce power loss. Power Electronics andMotion Control Conference (EPE/PEMC), 2010 14th International, pages 196–203, Sept 2010.
[76] J.A. Peças Lopes, Silvan A. Polenz, C.L. Moreira, and Rachid Cherkaoui. Identification ofcontrol and management strategies for LV unbalanced microgrids with plugged-in electricvehicles. Electric Power Systems Research, 80(8):898 – 906, 2010.
[77] K. Knezovic and M. Marinelli. Phase-wise enhanced voltage support from electric vehicles ina Danish low-voltage distribution grid. Electric Power Systems Research, 140:274–283, 2016.
[78] K. Knezovic, M. Marinelli, P. B. Andersen, and C. Træholt. Concurrent provision of frequencyregulation and overvoltage support by electric vehicles in a real Danish low voltage network.In Electric Vehicle Conference (IEVC), 2014 IEEE International, pages 1–7. IEEE, 2014.
[79] P. Gnacinski. Windings Temperature and Loss of Life of an Induction Machine Under VoltageUnbalance Combined With Over- or Undervoltages. Energy Conversion, IEEE Transactions on,23(2):363–371, June 2008.
[80] IEEE Recommended Practice for Monitoring Electric Power Quality. IEEE Std 1159-1995, 1995.
[81] H. Markiewicz and A. Klajn. Voltage disturbances standard EN 50160, 2004.
[82] K. Strunz, N. Hatziargyriou, and C. Andrieu. Benchmark systems for network integration ofrenewable and distributed energy resources. Cigre Task Force C, 6:04–02, 2009.
[83] F. Marra, G. Yang, and C Træholt. Demand profile study of battery electric vehicle underdifferent charging options. Power and Energy Society General Meeting, 2012 IEEE, page 1–7,2012.
84 BIBLIOGRAPHY
[84] Deliverable 1.1: Report on the needs for interoperability between EVs and electrical power sys-tem. Technical report, COTEVOS project, 2014-06-30. http://cotevos.eu/wp-content/uploads/2014/08/D1.1-Report-on-the-needs-for-interoperability-between-EVs-and-electrical-power-system.pdf.
[85] New Zealand Electric Car Guide: Car Connectors And Inlets. http://www.cashbackcars.co.nz/electric-information.
[86] F. Lehfuß, M. Nöhrer, E. Werkman, J. A Lópezz, and E. Zabala. Reference architecture forinteroperability testing of Electric Vehicle charging. In Smart Electric Distribution Systems andTechnologies (EDST), 2015 International Symposium on, pages 341–346. IEEE, 2015.
[87] S. Gröning, C. Lewandowski, J. Schmutzler, and C. Wietfeld. Interoperability Testing Basedon TTCN-3 for V2G Communication Interfaces. In 2012 International Conference on ConnectedVehicles and Expo (ICCVE), pages 298–303, Dec 2012.
[88] Deliverable 4.3: Analysis of needs for on-going or incipient standards. Design of Round Robintests and results of the performed tests. Recommendations for existing standards. Technicalreport, COTEVOS project, 2016-02-29. http://cotevos.eu/wp-content/uploads/2016/12/20160229_COTEVOS_IOP_tests_D4.3_v8.pdf.
[89] Business Opportunities for Interoperability Assessment of EV Integration. Tech-nical report, COTEVOS project, 2016. http://cotevos.eu/wp-content/uploads/2016/11/COTEVOS-Whitebook-20161104-v4.0.pdf.
[90] World’s first electric car fleet supplying electricity to the grid. http://www.dtu.dk/english/news/2016/09/worlds-first-electric-car-fleet-supplying-electricity-to-the-grid?id=ed132b88-be87-462e-a447-9843e450b157.
[91] D. Wang, J. Coignard, T. Zeng, C. Zhang, and S. Saxena. Quantifying electric vehicle batterydegradation from driving vs. vehicle-to-grid services. Journal of Power Sources, 332:193 – 203,2016.
[92] S. B. Peterson, J. Apt, and J.F. Whitacre. Lithium-ion battery cell degradation resulting fromrealistic vehicle and vehicle-to-grid utilization. Journal of Power Sources, 195(8):2385 – 2392,2010.
[93] G. Lacey, G. Putrus, and E. Bentley. Smart ev charging schedules: supporting the grid andprotecting battery life. IET Electrical Systems in Transportation, 7(1):84–91, 2017.
[94] "Cars are parked 95% of the time". Let’s check! http://www.reinventingparking.org/2013/02/cars-are-parked-95-of-time-lets-check.html.

Collection of relevant publications
Pub. A S. Martinenas, S. Vandael, P.B. Andersen, B. Christensen, ”Standards for EV charging andtheir usability for providing V2G services in the primary reserve market,” in Proceedingsof International Battery, Hybrid and Fuel Cell Electric Vehicle Symposium (EVS29), Montreal,Canada, IEEE, Jun. 2016.
Pub. B S. Martinenas, ”Implementation of E-mobility architecture for providing Smart Grid servicesusing EVs,” in International Battery, Hybrid and Fuel Cell Electric Vehicle Symposium (EVS30),Stuttgart, Germany, 2017.
Pub. C S. Martinenas, M. Marinelli, P.B. Andersen, C. Træholt, ”Implementation and Demonstrationof Grid Frequency Support by V2G Enabled Electric Vehicle,” in Proceedings of the 49thInternational Universities Power Engineering Conference (UPEC) 2014, Cluj-Napoca, Romania,Sep. 2014.
Pub. D M. Marinelli, S. Martinenas, K. Knezovic, P.B. Andersen, ”Validating a centralized approachto primary frequency control with series-produced electric vehicles,” in Journal of EnergyStorage, Vol. 7, 2016, p. 63–73.
Pub. E S. Martinenas, M. Marinelli, P.B. Andersen, C. Træholt, ”Evaluation of Electric VehicleCharging Controllability for Provision of Time Critical Grid Services,” in Proceedings of the51st International Universities Power Engineering Conference (UPEC) 2016, Coimbra, Portugal,Sep. 2016.
Pub. F M. Rezkalla, A. Zecchino, S. Martinenas, A. Prostejovsky, M. Marinelli, ”Comparison betweenSynthetic Inertia and Fast Frequency Containment Control Based on Single Phase EVs in aMicrogrid,” in Applied Energy, 2017.
Pub. G S. Martinenas, K. Knezovic, M. Marinelli, ”Management of Power Quality Issues in LowVoltage Networks using Electric Vehicles: Experimental Validation,” in IEEE Transactions onPower Delivery, IEEE, 2016.
Pub. H S. Martinenas, A.B. Pedersen, M. Marinelli, P.B. Andersen, C. Træholt, ”Electric Vehicle SmartCharging using Dynamic Price Signal,” in Proceedings of IEEE International Electric VehicleConference (IEVC) 2014, Florence, Italy, Dec. 2014.
Pub. I T.M. Sørensen, M.B. Jensen, S. Martinenas, ”Analysis of needs for on-going or incipientstandards. Design of Round Robin tests and results of the performed tests. Recommendationsfor existing standards” in COTEVOS project deliverable, 2016
85


Pub. A. Standards for EV charging and theirusability for providing V2G services in theprimary reserve market
87

EVS29 Symposium
Montreal, Quebec, Canada, June 19 - 22, 2016
Standards for EV charging and their usability for providingV2G services in the primary reserve market
Sergejus Martinenas1, Stijn Vandael2, Peter Bach Andersen1, Bjoern Christensen3
1Center for Electric Power and Energy, Department of Electrical Engineering, Technical University of Denmark2University of Delaware3NUVVE Corporation
Summary
Transition to sustainable energy and transport is inevitable, which brings new challenges for the existing
power grid. Meanwhile, electric vehicles (EVs) are becoming more widespread and their potential for
grid support services is becoming more evident. However, such intelligent integration of EVs into a
smart grid is highly dependent on infrastructure and communication. This work overviews and analyses
the current state of available standards in the field of eMobility. It particularly focuses on their usability
for enabling V2G services such as primary frequency regulation.
Keywords: smart grid, V2G (vehicle to grid), standardization, electric vehicle, communication
1 IntroductionAs electric vehicles are becoming widespread, the future of transportation is becoming sustainable andemission-less. However, this transition in the transportation sector could create problems of increasedloads in power systems. At the same time, power systems are transitioning to accommodate morestochastic renewable energy sources, which add the need for additional balancing power in the grid.One challenge could be turned into a solution to the other one: if intelligently integrated, EVs can pro-vide solutions to existing and future grid problems, aiding renewable energy integration. EVs couldsupport multiple grid services in both, transmission and distribution level, such as frequency regulationor local network balancing [1][2]. These services are identified and investigated in the NIKOLA project[3]. Some standards have already been analyzed for their ability to be used in grid services such as smartcharging [4][5][6][7]. The goal of this paper is to give an overview of how well existing eMobility stan-dards are suited for providing grid services by looking at the example of primary frequency regulation inDenmark and US. The paper is divided into following sections: firstly, the existing standards and spec-ification in the eMobility infrastructure are introduced in Section 2; secondly, the protocols and imple-mentations of V2G service provision are described in Section 3; thirdly, the V2G services are matchedagainst the eMobility standards and specifications in Section 4; lastly the gaps and improvements areidentified and summarized in the conclusion.
EVS29 International Battery, Hybrid and Fuel Cell Electric Vehicle Symposium 1

2 Standards for eMobility infrastructureWhile active eMobility development has started not too long ago, each communication link in the in-frastructure is already covered by a standard or a specification. This section will introduce and describeall charging related standards and specifications shown in the Figure 1. The figure represents a partof eMobility infrastructure that is relevant for grid service provision i.e. only the actors that are abledirectly influence the charging process. It consists of electric vehicle (EV) connected to the chargingpoint electric vehicle supply equipment (EVSE). An EVSE is electrically connected to the grid and has acommunication link to the charging point operator and aggregator. The role of the aggregator is to com-bine and control (dis)charging of a large number of EVs to provide grid services, while still satisfyingindividual user driving goals.
Figure 1: EV charging infrastructure with communication standards and specifications
2.1 EV to EVSE communicationThe only physical communication link in the eMobility infrastructure is the link between EV and electricvehicle supply equipment (EVSE). It is mainly covered by IEC 61851 standard for AC charging andCHAdeMO specification for fast DC charging. Meanwhile, a new emerging standard called IEC/ISO15118 is covering both AC and DC charging.The IEC 61851 is a basic EV to EVSE communication standard defining the basic physical and safetyrequirements to enable EV charging. The communication according to this standard is done using a lowlevel pulse width modulation (PWM) signal and voltage levels on a control pilot (CP) pin. After thevehicle has connected, the duty cycle of the PWM signal is indicating the maximum charging current inamperes the EV can charge with. This current limit can be dynamically adjusted by changing the dutycycle of the signal and the vehicle has to respond within 3 seconds. Additionally, the cable presence isindicated by plug present (PP) pin, which contains a resistor connecting to protective earth (PE) pin. Thevalue of this resistor indicates the maximum current rating for that cable. It should be noted that thereis an extension of this standard - IEC 61815-1 Edition 3 Annex-D, which extends the physical layer andadds minimal higher level communication descriptions. The US counterpart of this standard is calledSAE J1772.The ISO 15118 standard emerged to close the gap in communication requirements between EV andEVSE, defining the information transfer from EV to EVSE. The standard builds on top of the IEC 61851and uses it as a fallback communication option if either party does not support the new protocol. Thecommunication link is established using powerline communication (PLC) on top of the PWM signalrunning on the CP pin, that is the physical layer of the standard. On top of that an elaborate high levelcommunication takes place, based on TCP/IP network setup with possible security features like transportlayer security (TLS). The application layer of the communication protocol includes many informationobjects for existing and future eMobility services. Current implementations of the standard include suchfeatures as charging scheduling and identification for automated billing. Future implementations willinclude important features for grid service provision such as reactive power compensation and V2Gsupport.CHAdeMO is a protocol for a quick charging for electric vehicles, delivering up to 62.5 kW of high-voltage direct current (DC) via a special electrical connector. This protocol is the most widely deployed
EVS29 International Battery, Hybrid and Fuel Cell Electric Vehicle Symposium 2

DC (charging mode 4) fast charging protocol in the world. The communication is done using a familiarcontrol area network (CAN) bus. Latest edition of the CHAdeMO specification added the possibility forbidirectional power transfer thus allowing V2G support.As IEC 61851 was designed primarily to enable safe operation of EVs and EVSE while charging, it canonly indicate the maximum limit of the charging current. Currently, only CHAdeMO specification ac-tively allows bi-directional power flow thus enabling the use of EV battery for V2G services. Meanwhile,the future version of IEC/ISO 15118 will also expand the protocol to support such services.
2.2 Back-end communicationsCommunication between EVSE and EVSE operator (charging spot operator (CSO)) is not standardizedyet. However, a popular specification called open charging point protocol (OCPP) is becoming a de-facto industry standard for this communication link. Additionally, an extension of a popular smart gridcommunication standard IEC 61850-90-8 has been made to extend a communication link from gridoperators directly to EVSE. Multiple other specifications such as open smart charging protocol (OSCP)and open charge point interface (OCPI) are emerging to cover some missing links in eMobility back-endcommunications.OCPP specification is developed by Open Charge Alliance (OCA) and meant for charging point to charg-ing point operator communication [8]. It is primarily developed for charging point maintenance and oper-ation, thus supporting many features like diagnostics, reservation, charging authorization and scheduling.This analysis is based on OCPP 1.6 specification.A recent extension of a substation automation standard IEC61850 defines the information objects tocontrol EV charging as distributed energy resource. A big part of IEC61850 and IEC61850-7-420 alreadycovers eMobility domain, therefore IEC61850-90-8 mostly brings missing information objects such asEV and the EVSE nodes and means for charging scheduling.As communication between EV aggregators/charging point operators and grid operators is a relativelynew link, it is not yet covered by a standard. OSCP is also developed by OCA and is one of the firstspecifications that define the communication between CSO and grid operator e.g. distribution systemoperator (DSO). The DSO indicates the available grid capacity as a 24 hour prediction to the ChargingPoint Operator, which then distributes it by adjusting the charging rates.Another specification that fits the needs of link is OpenADR [9]. It is developed to provide standardizedcommunication protocol between grid utilities, operators and demand response (DR) providers helpingfacilitate automated demand response. It is not specifically meant for eMobility applications, but isdesigned to be generic enough to support many DR resources.While back-end communications are a relatively new but actively developed area, with the most protocolsbeing produced as specifications and are frequently updated. Such dynamic development allows for easynew feature introduction and bug fixing. Therefore back-end protocols are quickly enabling the featuresneeded for V2G service provision.
3 EVs providing V2G services in Denmark and the US
EV EVSE data flow electrical connection
aggregator
electricity grid
TSO
aggregator
electricity grid
TSO
1 Observe 2 Control
Figure 2: Interactions between aggregator, EVs and grid operator
EVS29 International Battery, Hybrid and Fuel Cell Electric Vehicle Symposium 3

At the University of Delaware (UDel) and Technical University of Denmark (DTU), researchers areproviding regulation as ancillary service for the transmission system operator (TSO) by controlling thebidirectional power transfer between a fleet of EVs and the grid. At DTU the primary frequency reserveis provided in Energinet.DK grid [10]. At University of Delaware the synchronous reserve is providedin the PJM grid. To operate an EV fleet as regulation reserve, an aggregator uses 2 steps: (1) collect datafrom individual EVs and (2) control their (dis)charging power based on a TSO signal, see Figure 2. ThisTSO signal represents the imbalance on the grid, which needs to be restored by up-regulation (chargeless or inject more) or down-regulation (charge more or inject less). At DTU, the TSO signal is a gridfrequency measurement, where a value below 50Hz requires up-regulation, while a value above 50Hzrequires down-regulation.In the rest of this section, each step is described, together with the key properties required from the usedcommunication protocols.
3.1 Collect data from EVsIn order to calculate optimal control signals in step 2, the aggregator needs to gather as much informationas possible from individual EVs. In this paper, we divide EV parameters in three groups: essential,quality-improving and optional parameters. These three categories of parameters are presented below:Essential parameters:
• Min. and max (dis)charging power
• State of charge in kWh
• Indication of plugged-in car
• Vehicle Identification Number
Quality-improving parameters:
• Required energy for driving
• Departure time
Optional parameters
• Car make and model
• Odometer reading
• Battery temperature
Essential parameters are required to provide regulation services. Without these parameters, even a basicoperation is not possible. Quality-improving parameters are parameters that improve the quality of theprovided regulation services. These parameters can improve the quality of service up to 25% [11].Optional parameters are used for improving overall operation of the EV fleet, but have little influence onthe quality of the provided regulation services.
3.2 Control EV (dis)chargingTo control EV (dis)charging, the aggregator calculates control signals based on the information observedin step 1. For each EV a control signal is calculated, which is typically expressed in Watt. The maingoal in this step is transferring the control signal, calculated by the aggregator, to each individual EV ina minimal time interval. In general, this time interval can be expressed as:
τtotal = τ1 + τ2 + τ3 + τ4 (1)
,where:τ1 is the time required for transferring the TSO signal to the aggregator.τ2 is the time required for communicating the EV control signal from aggregator to EVSE.τ3 is the time required for communicating the EV control signal from EVSE to EV.τ4 is the time required for the converter to ramp up or down the EV (dis)charging power.
EVS29 International Battery, Hybrid and Fuel Cell Electric Vehicle Symposium 4

The response delay directly influences the quality of service at both Energinet.DK and PJM. For provid-ing the service at Energinet.DK grid, a response between 15-30 seconds is required. At least half of thereserve needs to be deployed within 15 seconds, while the rest of the reserve can be linearly interpolatedresponse between 15 and 30 seconds Figure 3.
0% 25% 50% 75% 100%
Deployed reserve capacity
0
5
10
15
20
25
30
Ma
x.
resp
on
se
tim
e (
s)
Figure 3: Ramping rate for a primary frequency reserve in DK2
When providing the service in the PJM grid, a performance score is calculated, which is used to measurethe quality of service. This performance score consists of three components:
Correlation Quantifies the correlation between the requested regulation and the response of an EV fleet.
Time delay The time delay between requested regulation and a change in the response of the EV fleet.
Precision The difference between the requested regulation power and the provided regulation power.
The performance score is a scalar in the interval [0..1], calculated every hour by PJM and reportedback to the University of Delaware. At the university, researchers are seeking to have a score above0.9 to maximize their earnings. This entails a highly correlated response, 1-3 seconds delay and 1-5%difference between request and response Figure 4.
18:55:00 18:55:30 18:56:00 18:56:30 18:57:00 18:57:30 18:58:00 18:58:30 18:59:00 18:59:30 19:00:00
Time of Day
-5
-4
-3
-2
-1
0
1
2
3
4
5
Po
we
r (k
W)
Request
Response
Figure 4: Example request and response curve for PJM grid service
EVS29 International Battery, Hybrid and Fuel Cell Electric Vehicle Symposium 5

4 Usage of standards for EV charging to provide V2G services in a pri-mary reserve market
This section describes how the above mentioned standards can be used for providing V2G services ina primary reserve market. An overview of EV to EVSE communication standards with the highlightedfeatures for grid service provision is shown in Table 1 and the same overview for EVSE to Aggregatorin Table 2. Some parameters such as required energy for charging and departure time are implicit as partof the charging schedule feature. The values in brackets indicate that the feature is partially present oroptional. The response times are maximum values taken from the standards.
Table 1: EV to EVSE communication standard/specification overview
Standard/Specification
PowerControl V2G SOC
ChargingSchedule Identification
ResponseTime
IEC61851 + - - - - < 3s
IEC15118 + (+) (+) + + < 60s
CHAdeMO + (+) + - - < 1s
Currently widespread, IEC61851 charging standard is not well suited for providing precise grid servicesas it is missing almost all required features, because most implementations do not include digital com-munication. While IEC15118 appears to be almost ideal for grid service provision, the response timespecifications for most requests in the current revision is way too slow. Additionally, SOC field is onlyoptional, therefore not included in most implementations, and V2G specific fields are still left to bedefined in the future revisions. Similarly, latest CHAdeMO version includes V2G messages allowingbidirectional power flow, which enables it to provide symmetrical power services. However, it is missingsuch important features as build-in vehicle identification, possibility for charging schedule negotiationand communication security. Therefore it heavily relies on the need of user interaction and security ofthe physical connection.
Table 2: EVSE to aggregator communication standard/specification overview
Standard/Specification
PowerControl V2G SOC
ChargingSchedule Identification
OCPP + - - + -IEC61850-90-8 + (+) (+) + -
On the EVSE to aggregator communication side, the protocols are not as mature and developed as inthe EV to EVSE link as this link is relatively new. OCPP was primarily developed by charging stationoperators. Additionally, OCPP is a specification developed by industrial alliance, therefore it is updatedmore often than a standard. Meanwhile, IEC61850-90-8 looks like it was developed to provide electricalservices as it includes many electrical properties and a scheduling possibility.As communication between the grid operators and aggregators is not standardized, in addition to moregeneric OpenADR, the EV specific OSCP was developed as one of the first attempts to make a specifi-cation for this link. Although it primarily covers only grid overload problem it is a good example of howthe rest of grid services could be implemented.
5 ConclusionAs described in this work, most V2G services already provided in the real electricity grid are usingexisting eMobility standards to some extend. However, a unified approach that could incorporate theneeded informational objects while being lightweight is still missing. As shown in Section 4, none of thestandards cover all the required features to provide grid services. This issue is actively addressed in theresearch and demonstration projects like NIKOLA, where the findings are then forwarded to standard-ization committees such as IEC TC69. It should be noted that transition to smart grid and larger shareof renewable energy sources is only starting, therefore current definitions of grid services will change.Meanwhile, it can already be predicted that the services will become more dynamic i.e. requiring faster
EVS29 International Battery, Hybrid and Fuel Cell Electric Vehicle Symposium 6

response and better precision. The analysis of the existing standards shows that only fast DC chargingcurrently has the ability to provide future services. However, slower AC charging should not be dis-missed, while the timing constraints for AC chargers are more relaxed, technically the built-in chargersare able to show the same timing performance as the DC charging systems. Another important issue,that is currently hindering the grid service provision by the EVs, is a lack of V2G protocol support in thecharging communication. However, as noted in this paper, most standards are starting to incorporate themissing information objects in the latest revisions. Additionally to existing solutions from other emerg-ing smart grid technologies like OpenADR, new EV focused specifications are starting to emerge e.g.OSCP and fill the communication gaps in the eMobility infrastructure. Finally, as most communicationprotocols become high level, data security problem arises. So far, only a few standards e.g. IEC15118include security requirements as a part of the protocol specification, where most rely on implicit secu-rity of the communication link, which cannot always be guaranteed. Overall, the provision of existinggrid services using EVs has already started and is largely implemented using current standards and theirmodifications that bridge the existing gaps. However, as the share of renewable energy in the grid willgrow, the regulation services will become more dynamic and the standardization has to lead this change.
AcknowledgmentsThis work is supported by the Danish Research Project “NIKOLA - Intelligent Electric Vehicle Integra-tion” under ForskEL kontrakt nr. 2013-1-12088. More information at www.nikolaproject.info.
References
[1] S. Martinenas, M. Marinelli, P.B. Andersen, C. Træholt, Implementation and Demonstration of Grid Fre-quency Support by V2G Enabled Electric Vehicle, , IEEE UPEC, 2014.
[2] K. Knezovic, M. Marinelli, P.B. Andersen, C. Træholt, Concurrent Provision of Frequency Regulation andOvervoltage Support by Electric Vehicles in a Real Danish Low Voltage Network, IEEE IEVC, 2014.
[3] P.B. Andersen, M. Marinelli, O.J. Olesen, C.A. Andersen, G. Poilasne, B. Christensen, O. Alm, The Nikolaproject - Intelligent Electric Vehicle Integration, IEEE ISGT Europe, 2014.
[4] J. Schmutzler and C. Wietfeld and C. A. Andersen Distributed energy resource management for electricvehicles using IEC 61850 and ISO/IEC 15118, IEEE Vehicle Power and Propulsion Conference (VPPC),2012.
[5] J. Schmutzler and C. A. Andersen and C. Wietfeld Evaluation of OCPP and IEC 61850 for smart chargingelectric vehicles, World Electric Vehicle Symposium and Exhibition (EVS27), 2013.
[6] C. Lewandowski and S. Bcker and C. Wietfeld An ICT solution for integration of Electric Vehicles in gridbalancing services, International Conference on Connected Vehicles and Expo (ICCVE), 2013.
[7] S. Bcker and C. Lewandowski and C. Wietfeld and T. Schlter and C. Rehtanz ICT based performance eval-uation of control reserve provision using electric vehicles, IEEE PES Innovative Smart Grid TechnologiesConference Europe (ISGT-Europe), 2014.
[8] Open Charge Alliance, http://www.openchargealliance.org.
[9] OpenADR Alliance, http://www.openadr.org.
[10] Energinet.DK ancillary services provision, http://www.energinet.dk/EN/El/Systemydelser-for-el/Sider/Systemydelserforel.aspx.
[11] S. Vandael and T. Holvoet and G. Deconinck and S. Kamboj and W. Kempton A comparison of two GIVmechanisms for providing ancillary services at the University of Delaware, IEEE International Conferenceon Smart Grid Communications (SmartGridComm), 2013.
EVS29 International Battery, Hybrid and Fuel Cell Electric Vehicle Symposium 7

AuthorsSergejus Martinenas was born in Elektrenai, Lithuania, in 1989. He received a BSc degree in mecha-tronics engineering from the University of Southern Denmark in 2011, and an MSc degree in elec-trical engineering from the Technical University of Denmark in 2014. He is currently pursuing thePh.D. degree in electrical engineering at DTU.His research focuses on enabling technologies for electric vehicle integration into smart grids.
Stijn Vandael originates from Zonhoven, Belgium. He received the Master degree in industrialengineering from the Katholieke Hogeschool Limburg (KHLim), and the M.Sc. degree from theKatholieke Universiteit Leuven (KU Leuven). He received his PhD degree in 2015 at the departmentof Computer Science (KU Leuven). Currently, he is the principal software engineer in the V2Gproject at the University of Delaware (USA).
Peter Bach Andersen is a Researcher at the Technical University of Denmark (DTU). He holds aPhD from DTU and has participated in numerous EV-related projects and activities. His main focusis the application of informatics for electric vehicle integration. This includes software, communi-cation technology, data analysis and optimization. Peter is currently managing a number of researchprojects and initiatives, including the establishment of the EV Lab, dedicated to this line of research.
Bjoern Christensen is a Chief Strategy Officer (CSO) at Nuvve with the responsibility to developand implement strategies for Nuvves expansion into the world market. He has more than 30 years ofinternational experience in Technology, Marketing, Business Development and Venture Capital.He holds a Master of Science degree from the Technical University of Denmark .
EVS29 International Battery, Hybrid and Fuel Cell Electric Vehicle Symposium 8


Pub. B. Implementation of E-mobilityarchitecture for providing Smart Gridservices using EVs
97

EVS30 SymposiumStuttgart, Germany, October 9 - 11, 2017
Implementation of E-mobility architecture for providingSmart Grid services using EVs
Sergejus Martinenas11Center for Electric Power and Energy, Department of Electrical Engineering, Technical University of Denmark
Kongens Lyngby, [email protected]
Abstract
This paper outlines the implementation and testing of a part of the e-mobility infrastructure relevant forproviding smart grid services. The implementation is made using mainly open standards and protocolsavailable in e-mobility field e.g. IEC61851 and Open Charging Point Protocol (OCPP). Implementationand testing results are described in detail emphasizing the shortcomings and needs for improvement.The testing is done using unmodified OEM vehicles participating in existing power grid services such asfrequency regulation and load balancing.Keywords: smart grid, V2G (vehicle to grid), standardization, electric vehicle, communication
1 IntroductionWhile EVs are largely viewed as additional loads on the transforming power grid, if intelligently inte-grated, they could provide solutions existing and future grid problems, e.g. aiding large scale renewableenergy integration. EVs could provide higher quality grid services on transmission and distribution lev-els, such as faster frequency regulation and local grid balancing [1],[2]. These services were identifiedand implemented in the NIKOLA project [3]. Large scale application are currently being implementedin the Parker project [4]. To provide these grid services, various implementations of e-mobility chargingarchitectures have been introduced. These charging and communication architectures are largely basedon available e-mobility standards and specifications. Previous works have identified potential gaps inmany of the communication standards and specifications for grid service provision [5], [6]. The goal ofthis work is to analyze an implementation of a part of e-mobility architecture using latest available openstandards and specifications. Following the introduction the paper is divided into 4 sections. Section2 presents the e-mobility architecture and discusses the relevant parts of it for implementation. Thenin section 3 the implementation of the architecture is discussed. Section 4 discuses the the gaps in theused communication protocols and the way they are covered. Finally, the findings are summarized in theconcluding section 5.
EVS30 International Battery, Hybrid and Fuel Cell Electric Vehicle Symposium 1

2 E-mobility architectureE-mobility has a quite broad definition as it encompases all of the electric transportation. However, inthe case of this work e-mobility is only concerned with electric vehicles also known as electric cars. Anexample of e-mobility architecture developed in COTEVOS project [7] is shown in Fig.1.
Figure 1: Updated E-mobility reference architecture from COTEVOS project showing actor/interface layer
The relevant part of the architecture for smart grid integration of EVs is highlighted in red. The commu-nication protocols between the actors in the architecture are shown in Fig.2.
Figure 2: E-mobility architecture with communication protocols
The figure is an extension of overview presented in a EV related protocol study [8]. Here one can notice4 main highlighted communication areas: EV to EVSE, EVSE to CPO, roaming related and grid servicecommunication. This work is focusing on the grid service communication protocols. As can be seenin the architecture, most communication links are covered with multiple protocols defined by standards(e.g. IEC61851, IEC15118) or specifications (e.g. OCPP, OSCP, OpenADR). However, these protocolsdo not fully cover all the needed information and control features for the smart grid service provisionusing EVs.The following section describes the implementation details of the grid service relevant part of the e-mobility architecture including component descriptions and communication protocols.
EVS30 International Battery, Hybrid and Fuel Cell Electric Vehicle Symposium 2

3 ImplementationThe detailed implementation diagram can be seen in Fig.3.
Figure 3: Detailed e-mobility architecture implementation diagram
The following actors of the architecture are used and implemented:
EV - Electric Vehicle - unmodified OEM vehicles with AC chargers using IEC61851 standard [9].
EVSE - Electric Vehicle Supply Equipment - custom made chargers assembled from off the shelf in-dustrial components such as charge controller supporting IEC61851, relays and a microcomputerimplementing OCPP version 1.6 support for the communication with CPO [10].
CPO - Charge Point Operator - controls and manages the EVSEs using OCPP protocol.
EMSP - E-mobility Service Provider - implements the actor between the EV user and a CPO, enablingcharging spot reservation and charging authorization using OCPI protocol [11].
Aggregator - takes care of the communication with the grid operator and implements the smart gridservice offered. The aggregator controls the vehicles via communication through CPO using Ope-nADR 2.0b specification [12].
The roles of the CPO, EMSP and the aggregator are split to provide modularity and ability to easilyintegrate with external actor e.g. another CPO.The following communication standards are used in the implementation:IEC 61851 - for EV to EVSE link - used as unmodified OEM vehicles, currently, only support IEC61851
standard for AC charging. The IEC61851 on the EVSE side is implemented by using PhoenixContact EVSE controller.
OCPP 1.6 - for EVSE to CPO link - used as it is a de-facto standard for this link. Implemented in themicrocomputer mounted inside the EVSE.
OCPI 2.1 - for CPO to EMSP link - chosen for the openness and maturity of the specification that coversthe needs of the communication link. Implemented in the dedicated server, that also provides webinterface for authorized EV users to login and enable the charging spot.
OpenADR 2.0b - for CPO to Aggregator link - chosen for maturity, openness and generic applicationcapability. This allows for the aggregator to potentially combine EVs with other DERs to providelarger and more diverse grid services. The aggregator implements the role of the virtual top node(VTN) and the CPO implements the virtual end node (VEN). Another specification potentiallyfitting this link is Open Smart Charging Protocol (OSCP) [14]. However, it is mostly targeted atfeeder capacity control thus limiting its’ application for other grid services.
EVS30 International Battery, Hybrid and Fuel Cell Electric Vehicle Symposium 3

As the OCPI specification is primarily designed for roaming purposes, it is meant to support the commu-nication between CPO and EMSP for providing grid services. Therefore, the CPO - EMSP link mightuse the OCPP message forwarding for communication purposes.This setup will be used to test a few existing grid services.The example smart grid services that are tested with the implementation are:
FCR-N - Frequency Controlled Normal operation Reserve - a DK2 reserve ensures that the equilibriumbetween production and consumption is restored, keeping the frequency close to 50 Hz, similar toprimary frequency regulation [15].
Congestion Management - a modified charging service, used to prevent congestion on the feeder thatEV is connected to.
Smart Charging - a modified charging service, meant for minimizing the charging price by accountingfor actual and near future energy prices.
4 Communication
4.1 Communication requirementsIt has been previously identified that the following information objects are essential for optimal gridservice provision by EVs [5]. These information objects are:
(Dis)charging power limits - for estimation of EV controllability
State of charge - in kWh, for estimation of available flexibility.
Indication of plugged-in car - to determine if the charging point is occupied.
Vehicle Identification Number - or any other unique identifier needed for billing purposes.
Additionally, parameters like required energy for driving and estimated departure time are needed forestimating the available flexibility. This information greatly improves the quality of the service for theEV user.
4.2 Gaps in communicationThe IEC61851 standard does not provide a digital communication link with the EV. It does howeverprovide the indication of the plugged in vehicle and allows the EVSE to dynamically indicate the chargingcurrent limit. This functionality already enables the controllability needed for grid service provision.The lack of digital communication in IEC61851 requires alternative solutions for acquiring high levelinformation from the EV. This functionality is important for reading the state of charge (SOC) and vehicleidentification. The acquisition of the SOC information is solved by accessing it from the OEM backend.However, this feature is only available on the newer and higher end EVs. Vehicle identification is solvedby prompting the user to login to enable the charging point. Vehicle model, battery size and maximumcharging power is provided by the user when registering with the EMSP on the first use of the chargingstation. The quality improving parameters of desired battery SOC and estimated departure time may beimplemented as additional user prompts in the EMSP web interface.Actual charging rate is measured using a DEIF MIC-2 multi instrument device in the EVSE.
5 DiscussionEven though the implementation of the architecture for smart grid services currently requires many smallworkarounds for acquiring the necessary static and dynamic information, it is certainly possible. Thestandard that is posed to improve the situation and abolish the need for these workarounds is IEC15118.It enables high level communication link between the EV and EVSE and includes the majority of the usecases needed to provide grid services. However, the current edition of the standard does not position thenecessary information objects e.g. SOC as a mandatory parameter. Nor does it support the time criticalservices by allowing for too long timeout values in the negotiation of the charging schedule.Flexibility of the OCPP implementation permits for multiple fields in the communication messages to beoptional, such as transaction identification is often a requirement from the EMSP and aggregator side.Moreover, OCPP version 1.6 still lacks the information fields to relay the necessary data from the EV tothe aggregator e.g. SOC.In addition to protocol gaps, current industrial implementations show, in contrast to architecture, no clearboundary between CPO and EMSP actors as their roles are often very much intertwined and performedby the same entity.
EVS30 International Battery, Hybrid and Fuel Cell Electric Vehicle Symposium 4

An important requirement that has not been in focus of this analysis is communication security. Theprotocols for each communication link have recommendations for securing the data exchange betweenthe actors except for IEC61851 and OCPP. Improvements to the security of communication are promisedin the OCPP version 2.0 [13].
AcknowledgmentsThis work is supported by the Danish Research Project “Parker” aimed at applying grid-balancingservices to a fleet of electric vehicles and financed by ForskEL programme. More information atwww.parker-project.com.
References[1] S. Martinenas, M. Marinelli, P.B. Andersen, C. Træholt, Implementation and Demonstration of Grid Fre-
quency Support by V2G Enabled Electric Vehicle, , IEEE UPEC, 2014.
[2] K. Knezovic, M. Marinelli, P.B. Andersen, C. Træholt, Concurrent Provision of Frequency Regulation andOvervoltage Support by Electric Vehicles in a Real Danish Low Voltage Network, IEEE IEVC, 2014.
[3] P.B. Andersen, M. Marinelli, O.J. Olesen, C.A. Andersen, G. Poilasne, B. Christensen, O. Alm, The Nikolaproject - Intelligent Electric Vehicle Integration, IEEE ISGT Europe, 2014.
[4] Parker project website, http://www.parker-project.com accessed on 2017-06-20.
[5] S. Martinenas, S. Vandael, P.B. Andersen, B. Christensen Standards for EV charging and their usability forproviding V2G services in the primary reserve market, , Proceedings of International Battery, Hybrid andFuel Cell Electric Vehicle Symposium (EVS29), 2016.
[6] J. Schmutzler and C. A. Andersen and C. Wietfeld Evaluation of OCPP and IEC 61850 for smart chargingelectric vehicles, World Electric Vehicle Symposium and Exhibition (EVS27), 2013.
[7] F. Lehfuß and M. Nohrer, E. Werkman, J. A. Lopezz, E. Zabala, Reference architecture for interoperabilitytesting of Electric Vehicle charging, International Symposium on Smart Electric Distribution Systems andTechnologies (EDST), 2015.
[8] ElaadNL, EV related protocol study, https://www.elaad.nl/uploads/files/EV related protocol study v1.1.pdfaccessed on 2017-06-27.
[9] International Electrotechnical Commission (IEC), IEC 61851-1 ed2.0: Electric vehicle conductive chargingsystem - Part 1: General requirements, 2010.
[10] Open Charge Alliance (OCA), Open Charge Point Protocol (OCPP) specification 1.6,http://www.openchargealliance.org/protocols/ocpp/ocpp-16/ accessed on 2017-06-17.
[11] The Netherlands Knowledge Platform for Charging Infrastructure (NKL), Open Charging Point In-terface (OCPI) specification 2.1, http://en.nklnederland.nl/projects/our-current-projects/open-charge-point-interface-ocpi/ accessed on 2017-06-17.
[12] OpenADR Alliance, Open Automated Demand Response (OpenADR) specification 2.0b,http://www.openadr.org/specification accessed on 2017-06-27.
[13] Open Charge Alliance (OCA), Open Charge Point Protocol (OCPP) specification 2.0,http://www.openchargealliance.org/protocols/ocpp/ocpp-20/ accessed on 2017-06-27.
[14] Open Charge Alliance (OCA), Open Smart Charging Protocol (OSCP) specification 1.0,http://www.openchargealliance.org/protocols/oscp/oscp-10/ accessed on 2017-06-27.
[15] Energinet.DK, Ancillary services to be delivered in Denmark Tender conditions, Technical Report, 2012.
EVS30 International Battery, Hybrid and Fuel Cell Electric Vehicle Symposium 5

AuthorsSergejus Martinenas was born in Elektrenai, Lithuania, in 1989. He received a B.Sc. degree inmechatronics engineering from the University of Southern Denmark in 2011, and an M.Sc. degreein electrical engineering from the Technical University of Denmark in 2014. He is currently pursuingthe Ph.D. degree in electrical engineering at DTU.His research focuses on analysis and implementation of enabling technologies for electric vehicleintegration into smart grids.
EVS30 International Battery, Hybrid and Fuel Cell Electric Vehicle Symposium 6


Pub. C. Implementation and demonstrationof grid frequency support by V2G enabledelectric vehicle
105

Implementation and Demonstration of GridFrequency Support by V2G Enabled Electric
VehicleSergejus Martinenas Mattia Marinelli, Peter Bach Andersen and Chresten Træholt
Center for Electric Power and Energy, DTU - Technical University of DenmarkContact Person: Sergejus Martinenas, [email protected]
Abstract—Safe operation of the electric power system relies onconventional power stations. In addition to providing electricalenergy to the network, some power stations also provide anumber of ancillary services for the grid stability. These servicescould potentially be provided by the growing number of electricvehicles - faster and with better precision, using Vehicle-to-Gridtechnology. This paper explores the implementation of a systemthat demonstrates the use of the electric vehicles for providingfrequency regulation in the Danish power grid. The system istested with the use case of Primary Frequency Regulation. Theservice is implemented following the technical conditions forancillary services in the Danish grid. The real life system is devel-oped using web-centric communication technologies between thecomponents. Communication and control functions of the systemare validated through experiments. The response of the systemis studied in terms of latency, precision and stability.
Keywords – Vehicle-to-Grid, Smart Grid, Frequency Control,Electric Vehicles, Information and Communication Technology
I. INTRODUCTION
Power system frequency stability relies on the balancebetween power generation and consumption. Today, most ofthe power generation in the grid is provided by conventionalpower plants. Sudden generation losses and unexpected loadincreases require timely actions by the remaining generatingunits or by controllable loads in order to restore the powerbalance. Additionally, conventional generating units are dis-placed by renewable sources, such as wind and photovoltaic,which are not required to provide the same level of ancillaryservices, like the frequency regulation [1]. This leads to anincrease of regulating power obligation among the remainingcontrollable resources.
Growing number of Electric Vehicles (EVs) is typicallyviewed as additional load on the grid from system operatorsperspective [2]. However, EVs are also one of the imminentcandidates for providing grid regulation services. Especially,because most of the time (typically about 90%) they areplugged-in to a charging post and can provide fast regulatingpower in both directions. The ability of the vehicle to providepower back to the grid is called Vehicle-to-Grid (V2G) [3].A noticeable amount of literature has already been written
This work is supported by the Danish Research Project “NIKOLA -Intelligent Electric Vehicle Integration”- under ForskEL kontrakt nr. 2013-1-12088. More information (www.nikolaproject.info).
supporting the use of EVs with V2G capability for ancillaryservices [4], [5]. However, multiple technical challenges arise:the limited power and energy capacity of each individual unitand the need of having simple and effective measurementand control capabilities [6]. These problems are solved byaggregating a large number of V2G enabled vehicles [7] andconnecting the aggregator to the high quality measurementdevice.
This work focuses on the system design and analysis of theissues that may arise when dealing with practical implemen-tation of frequency response such as: communication latency,power and frequency measurements inaccuracies. Therefore,the implementation of the system and communication to theelectric vehicle will be presented in detail.
The paper is organized as follows: Section II providesthe background on grid frequency regulation services, withthe example of Danish grid. Section III gives an overviewon system implementation with focus on the communicationimplemented using a modern web-centric approach. Section IVshows the results of a frequency measurement and frequencyregulation experiments. Section V presents discussion of theresults.
II. FREQUENCY REGULATION SERVICES
Generally, the grid frequency regulation reserves are dividedinto the three categories: primary, secondary and tertiary. TheDanish power grid is located in two separate synchronousregions: DK1 and DK2. Jylland (continental part of Denmark)and island of Fyn are in DK1 region connected to the restof Europe. The islands of Sjælland and Bornholm are inDK2 connected to most of Scandinavia. In each region, thereare multiple levels of reserves providing frequency regulationservices [8]. DK1 region has following frequency regulationreserves:
• Primary Reserve - regulation is restoring balance betweenproduction and consumption, stabilizing the frequencyclose to 50Hz. The regulation is automatic, power outputof the reserve is controlled according to the frequencydeviation, with the small permitted deadband.
• Secondary Reserve - regulation is enabled during majoroperational disturbance. It is used to indirectly restorefrequency to 50.00Hz followed by stabilization by pri-mary reserve. It also serves the purpose of releasing the

activated primary reserve. The regulation is automatic andcontrolled by a signal from Energinet.dk.
• Manual Reserve - manual power regulation used to re-store system balance, acting as a tertiary reserve. It isactivated manually from Energinet.dk’s Control Center.
DK2 region also has corresponding reserves:• Normal Operation Reserve - ensures that production and
consumption equilibrium is restored. The regulation isautomatic and responding to frequency deviation, withoutdeadband.
• Disturbance Reserve - a fast reserve, activated in the eventof major system disturbances. It is started automaticallyin the event of sudden frequency drop under 49.9Hzand remains active until frequency is restored or manualreserve takes over.
• Manual Reserve - manual power regulation used to re-store system balance, acting as a tertiary reserve, manu-ally activated from Energinet.dk’s Control Center.
In this paper the primary reserve from DK1 is implementedand tested. It is chosen for experiments, as the reserve shoulddirectly respond to grid frequency deviations, it has a smalloptional deadband and requires a quick response time.
III. SYSTEM ARCHITECTURE
To implement the frequency regulation service the reservehas to have three main components: a controllable energyresource connected to the grid, fast and precise grid frequencymeasurements and a controller with appropriate control algo-rithm.
A. System Design
The system developed in this project, is split into threelayers, shown in Fig. 1: power flow, data acquisition andintelligence.
Fig. 1. System design for the frequency regulation service
The power layer consists of all the devices that containpower electronics or are used to generate or transmit electricalenergy, e.g. EV battery, inverter, charging cables, breakers,
etc. Data acquisition layer consists of the embedded andexternal measurement devices and their interfaces. The intel-ligence layer contains all the computers running higher levelcommunication and control algorithms e.g. EV computer andcontroller server.
As shown in Fig. 1 the testing platform was build withfollowing components:
• EV - DTU eBox with 35kWh battery and power electron-ics unit (PEU) unit capable of single phase bidirectionalpower transfer up to 20kW. It is controlled by the EVcomputer that interfaces with the PEU using build-invehicle smart link (VSL) [9].
• VSL - an embedded computing interface, used for com-munication to eBox PEU and is located next to it.Additionally the VSL is responsible for handling IEC61851 Control Pilot signal communication, when thevehicle is plugged in to the EVSE.
• EV Computer - build-in EV computer running the eBoxpollserver application. It is connected to the networkusing wireless interface.
• eBox Pollserver - vehicle monitoring/control server withRESTful application programming interface (API). It isimplemented on the vehicle computer and is used forremote and local control.
• EVSE - grid connected, 32A, three phase, custom charg-ing spot with charging cable.
• Frequency Measurement Device - G4500 Power Ana-lyzer from ELSPEC, highly accurate grid analysis unit,primarily used for grid frequency measurement, alsoconnected to communication network.
• Frequency Regulation Controller - running on externalcomputer, connected to network, performing followingfunctions: reading data from measurement devices anddispatching control signals to the EV.
All of the system components have communication interfacesfor control and data exchange.
B. Electric Vehicle Communication
The system layers: grid connected EV, frequency measure-ment device and controller, were distributed in the differentplaces of the SYSLAB1 laboratory and connected to thecommon communication network. The controller and mea-surement device are using wired network connection, the EVcomputer is connected using wireless communication. Thesephysical layers are chosen for its robustness, flexibility andrepresentation of the real field testing conditions. The fullcommunication path from controller to the PEU is shown inFig. 2.
The EV computer is running a pollserver application, whichuses the connection to the VSL board to update the data valuesand control parameters. The pollserver receives and processesthe requests from the controller into updated EV control com-mands or returns measurement data. The VSL is running an
1SYSLAB is laboratory for intelligent distributed power systems at Tech-nical University of Denmark, part of PowerLabDK (www.powerlab.dk).

Fig. 2. Control message path from controller to the PEU
interface application, that sends those commands to the PEUunit. The higher level communication is implemented basedon Hyper Text Transfer Protocol (HTTP). On the embeddedside of the system (on the VSL and below) communicationchanges to serial UART, which is a common component usedin industry for such applications.
As shown in the Fig. 2 high level communication hasbeen implemented for communication with the EV usingRESTful architecture. REpresentational State Transfer (REST)is a software architectural style rather than a communicationprotocol. It has first been described in the PhD thesis ofR.Fielding [10]. REST description consist of a set of archi-tectural constraints applied to components and data elements,within a system. It ignores the implementation details of thecomponent and protocol syntax, focusing on the componentroles, their interaction and interpretation of significant dataelements. RESTful architecture have been used to map theIEC 61850 communication standard to web services [11]. Thecommunication protocol is kept as simple and clear as possibleto ease later expansion and higher level application suchas IEC 15118. The structure of RESTful Unique ResourceIdentifier (URI) request, designed for this work, is shown inFig. 3.
Fig. 3. RESTful URI request structure
Following is the RESTful API communication example: Toread the measurements or parameters of the EV, an HTTPGET request is sent to the URI:
http://ebox:8080/getData/measurements
The response received is formatted in JavaScript Object No-tation (JSON):
"System_Time": 1399382195,"Line_V": 229.000000, "SOC": 67,"Max_C_Amps": 31, "Max_D_Amps": 31,"Requested_Mode": 1, "Actual_Mode": 1,"Requested_Amps": -1.000000,"Actual_Amps": -1.200000, "Error": 0
For setting new control parameters, such as charging currentor operation mode, a HTTP POST or PUT request is sent.For example, to update the charging current to -16A (negativevalues indicate charging, positive values indicate V2G mode,i.e. discharging into the grid), the HTTP POST request is sentto the following URI:
http://ebox:8080/setData/Requested_Amps=-16
To update the operation mode from charging (mode 1) to V2G(mode 2) following HTTP POST request is sent:
http://ebox:8080/setData/Requested_Mode=2
This communication API is used by the controller applica-tion to read the data and control the EV.
C. Primary Frequency Regulation Controller
The frequency regulation controller is running with thefollowing algorithm:
while true dof = read current grid frequency;e = calculate the frequency error;Pout = calculate corresponding output power;actuate V2G power for the EV
(Pout
);
wait for sampling timeend
Algorithm 1: Frequency Droop Control
The Primary Frequency Regulation (PFR) controller wasdesigned by following the technical specification of tenderconditions for ancillary services in Danish power grid, see[8].
First the grid frequency is measured and the deviation fromnominal frequency is calculated:
e = fnom − fm. (1)
Here the e is the deviation i.e. the difference betweennominal and measured frequency values. fnom is a nominalgrid frequency, in Europe it is 50.00Hz. The fm is themomentarily measured grid frequency, with 10mHz accuracy.Droop controller output is calculated as shown in (2).
Pout =
0 , |e| < ∆fdb
Pmax · e · 100dpct
, ∆fmax > |e| > ∆fdb
Pmax , |e| > ∆fmax
(2)

Here Pout is output power of the vehicle to the grid. Pmax isthe maximum output power of the vehicle, for a 32A chargingspot at one phase it is 7kW . ∆fdb is a deadband used, in thiscase 20mHz. ∆fmax is a maximum frequency deviation, atwhich the maximum power should be output to the grid, inthis case it is 200mHz. The resulting droop control curve isshown in Fig. 4.
49.7 49.8 49.9 50.0 50.1 50.2 50.3
Frequency (Hz)
8
6
4
2
0
2
4
6
8
Pow
er
(kW
)
Droop Curve with Deadband
Fig. 4. Droop curve used for frequency regulation experiments
IV. EXPERIMENTAL RESULTS
A. System Frequency Measurements
As specified in the ancillary service conditions, each fre-quency reserve must measure the grid frequency with accuracybetter than 10mHz. Therefore a precise grid power analyzerwas installed at the permanent grid connection in SYSLAB.The data from the measurement equipment was recorded fromApril 2nd to April 30th. All frequency values are plotted inFig. 5.
Fig. 5. Frequency data values plot for April 2 to April 30
Collected frequency data is analyzed with results shown inTable I.
TABLE IFREQUENCY DATA CHARACTERISTICS FOR APRIL
Min Value Max Value Mean Standard Deviation49.664Hz 50.215Hz 50.001Hz 0.0425Hz
This analysis and frequency distribution in Fig. 6 showsthat frequency is highly symmetric over longer periods oftime, thus the amount of energy supplied by the EVs for upregulation should equal to the energy consumed by the vehiclesfor down regulation. However, the experimental example willshow, that the energy taken and received back to the battery isnot equal, due to efficiency of the charger, at lower currentvalues being around 80%, and only up to 92% at highercharging power. This will result in significant drop of thebattery SOC, on the longer symmetric regulation periods.
49.7 49.8 49.9 50.0 50.1 50.2 50.3Frequency value (Hz)
0
20000
40000
60000
80000
100000
120000
140000
Count
Fig. 6. Frequency data value distribution from April 2 to April 30
In the histogram in Fig. 6, the bin width is 4mHz. Most ofthe frequency values - 99.99%, are between 49.8 − 50.2Hz.The symmetrical spikes at bins 49.988 − 49.992Hz and50.008 − 50.012Hz are corresponding to a metering-relateddeadband of some primary frequency regulation controllers.This deadband could occur because of the frequency measure-ment devices used to activate the controllers. The ancillaryservice conditions states, that the accuracy and sensitivityof the frequency meters must be better than ±10mHz [8].Therefore, it may happen that some power units, especiallysmall ones which may be equipped with less sensitive meter-ing devices, are not activated while the frequency is within50.00Hz ± 10mHz.
B. Frequency Regulation
The results of the frequency regulation: each plot shows thegrid frequency values, state of charge (SOC) of the EV batteryand the V2G current from the EV to the grid. The positivecurrent indicates that the vehicle is providing power to thegrid and with the negative current values, EV is consumingpower i.e. charging.

In the first experiment, the vehicle was plugged in overnightproviding primary frequency regulation for 6 hours. Experi-ment result is shown in Fig. 7.
21:00 22:00 23:00 00:00 01:00 02:00Time
49.85
49.90
49.95
50.00
50.05
50.10
50.15
Frequency
(H
z)
20
15
10
5
0
5
10
15
20
Curr
ent
(A)
54
56
58
60
62
64
66
68
70
72
SO
C (
%)
Frequency
Actual Amps
SOC
Fig. 7. Frequency regulation results for 6 night hours
Here one can observe that the frequency (marked in black)is above normal most of the night, thus the vehicle is chargingat up to 20A (marked in red). The SOC of the vehicle (markedin green) is also balancing above the starting value, at the peakreaching 71%. However, at 3am the frequency drops below thenominal value and the vehicle switches to the V2G mode. Atthe end of the experiment the EV has 54% SOC.
A longer experiment was also performed with frequencyregulation being active for 22 hours. The results are shown inFig. 8.
14:00 16:00 18:00 20:00 22:00 00:00 02:00 04:00 06:00 08:00 10:00Time
49.85
49.90
49.95
50.00
50.05
50.10
50.15
Frequency
(H
z)
25
20
15
10
5
0
5
10
15
20
Curr
ent
(A)
45
50
55
60
65
70
75
80
85
90
SO
C (
%)
Frequency
Actual Amps
SOC
Fig. 8. Frequency regulation results for 22 hours
Here the average frequency value for the test period is49.997Hz. This indicates that the frequency is almost symmet-ric, with a slight bias towards the value below nominal. TheSOC of the vehicle changes from 85% at the start to around53% at the end of the test. The change can be explained byslight bias of the frequency and mainly by the V2G converterefficiency. The measured efficiency of vehicle PEU in V2Gmode at these low current values is around 0.8, so the roundtripefficiency results in around 0.64. This corresponds to the ratioof the end to start value of battery SOC in the example fromFig. 8.
Further, the close up from the 22 hour frequency regulationprocess is shown in Fig. 9.
In this plot the delay between the frequency measurementand response by the vehicle can be appreciated. Generally, the
Fig. 9. Frequency regulation results close up with response delay
eBox is able to respond to the frequency change in 5 to 6seconds on average. This delay consists of approximately: 1second delay for frequency sampling time and control action inthe controller, 1 second delay for communication and controlparameter update in the pollserver, 3 to 4 seconds for PEUramping time and 1 second delay for response data samplingin the measurement device.
All tests were performed in SYSLAB - a DTU researchfacility for intelligent, active and distributed power systems.SYSLAB is located at DTU Risø campus and is a part of thePowerLabDK experimental facilities.
V. DISCUSSION
The primary frequency regulation based on an electricvehicle proved successful in operation. Web-centric commu-nication protocols introduce application flexibility, platformindependence and significantly speed up controller implemen-tation. The response of the vehicle to the detected frequencydeviation is much faster than the specified technical conditionsfor regulation: 5-6s versus 15s. This experimentally proves thatbi-directional power exchange with electric vehicles are fastenough for providing this kind of grid support [12]. Even fasterresponse times can be achieved by increasing data samplingand control parameter update frequency, however most ofthe delay is due to the slow ramping rate of the PEU unit.Overall the response delay could be reduced to less than half- around 2-3s. Several improvements are proposed for betterEV integration for grid frequency support: the PEU efficiencyshould be improved to minimize the roundtrip energy losses;the battery degradation should be taken into account andstudied in detail as different studies suggest contradictoryresults [13], [14]. However, it has been proven in multiplestudies, that providing grid services using EVs is economicallybeneficial [15], [16]. Finally, this work has shown, that real-life application of the EV for grid frequency support is feasibleand modern communication technologies help the intelligentintegration of the EV for providing grid services [17].

REFERENCES
[1] M. Marinelli, S. Massucco, A. Mansoldo, and M. Norton, “Analysisof inertial response and primary power-frequency control provision bydoubly fed induction generator wind turbines in a small power system,”Proceedings of the 17th Power Systems Computation Conference, Stock-holm, 22-26 Aug. 2011, 2011.
[2] K. Clement-Nyns, E. Haesen, and J. Driesen, “The impact of chargingplug-in hybrid electric vehicles on a residential distribution grid,” PowerSystems, IEEE Transactions on, vol. 25, no. 1, pp. 371–380, Feb 2010.
[3] W. Kempton and J. Tomic, “Vehicle-to-grid power implementation: Fromstabilizing the grid to supporting large-scale renewable energy,” Journalof Power Sources, vol. 144, no. 1, pp. 280 – 294, 2005.
[4] H. Lund and W. Kempton, “Integration of renewable energy into thetransport and electricity sectors through V2G,” Energy Policy, vol. 36,no. 9, pp. 3578–3587, 2008.
[5] J. Pillai, B. Bak-Jensen, and P. Thogersen, “Electric vehicles to supportlarge wind power penetration in future danish power systems,” in VehiclePower and Propulsion Conference (VPPC), Seoul, 09-12 Oct. 2012IEEE, Oct 2012, pp. 1475–1479.
[6] F. Marra, D. Sacchetti, A. Pedersen, P. Andersen, C. Træholt, andE. Larsen, “Implementation of an electric vehicle test bed controlledby a virtual power plant for contributing to regulating power reserves,”Power and Energy Society General Meeting, 2012 IEEE, no. 081216,pp. 1–7, 2012.
[7] S. Han, S. H. Han, and K. Sezaki, “Design of an optimal aggregator forvehicle-to-grid regulation service,” Innovative Smart Grid Technologies(ISGT), 2010, 2010.
[8] “Ancillary services to be delivered in Denmark Tender conditions,” Tech.Rep. October, 2012.
[9] University of Delaware, “The Grid-Integrated Electric Vehicle,” Tech.Rep.
[10] R. T. Fielding, “Architectural styles and the design of network-basedsoftware architectures,” Ph.D. dissertation, 2000, AAI9980887.
[11] A. Pedersen, E. Hauksson, P. Andersen, B. Poulsen, C. Træholt, andD. Gantenbein, “Facilitating a Generic Communication Interface to Dis-tributed Energy Resources: Mapping IEC 61850 to RESTful Services,”in Smart Grid Communications (SmartGridComm), 2010 First IEEEInternational Conference on, Maryland, 17-20 Oct 2010, pp. 61–66.
[12] J. R. Pillai and B. Bak-Jensen, “Vehicle-to-grid systems for frequencyregulation in an Islanded Danish distribution network,” 2010 IEEEVehicle Power and Propulsion Conference, pp. 1–6, 2010.
[13] S. Peterson, J. Apt, and J. Whitacre, “Lithium-ion battery cell degra-dation resulting from realistic vehicle and vehicle-to-grid utilization,”Journal of Power Sources, vol. 195, no. 8, pp. 2385–2392, Apr. 2010.
[14] S. You, J. Hu, A. Pedersen, P. Andersen, C. Rasmussen, and S.-T.Cha, “Numerical comparison of optimal charging schemes for electricvehicles,” Power and Energy Society General Meeting, 2012 IEEE, pp.1–6, 2012.
[15] W. Kempton and J. Tomic, “Vehicle-to-grid power fundamentals: calcu-lating capacity and net revenue,” Journal of Power Sources, vol. 144,no. 1, pp. 268–279, Jun. 2005.
[16] S. Han and K. Sezaki, “Economic assessment on V2G frequencyregulation regarding the battery degradation,” Innovative Smart GridTechnologies (ISGT), 2012 IEEE PES, pp. 1–6, 2012.
[17] A. Pedersen, P. Andersen, J. Skov Johansen, D. Rua, J. Ruela, andJ. A. Pecas Lopes, ICT Solutions to Support EV Deployment, ser. PowerElectronics and Power Systems. Springer-Verlag, New York, 2013, pp.107–154.


Pub. D. Validating a centralized approachto primary frequency control withseries-produced electric vehicles
113

Validating a centralized approach to primary frequency control withseries-produced electric vehicles
Mattia Marinelli*, Sergejus Martinenas, Katarina Knezovic, Peter Bach Andersen
Centre for Electric Power and Energy, Technical University of Denmark, Risø Campus, Roskilde, Denmark
A R T I C L E I N F O
Article history:
Received 19 March 2016
Received in revised form 16 May 2016
Accepted 17 May 2016
Available online 3 June 2016
Keywords:
Centralized control
Electric vehicles
Frequency control
Islanded systems
Testing
A B S T R A C T
The aim of this work is twofold: on one hand it proposes a centralized approach to primary frequency
control by using electric vehicles as controllable units; on the other hand, it experimentally validates
whether series-produced EVs, adhering to contemporary standards, can be an effective resource for
providing primary frequency control. The validation process is realized in an islanded system with
renewable sources and it relies on verifying that the frequency values are within the desired limits
following severe load steps or wind power fluctuations.
In order to reflect today’s situation, the used EVs, three Nissan Leaf, are not taking advantage of any V2G
capability, but rely solely on the possibility of limiting the charge between 6 A and 16 A. The centralized
approach implies that the frequency is not measured locally as it is a common practice today, but is routed
via the Internet in order to include potential communication delays that would take into account the
presence of different entities for controlling the vehicles, such as aggregators and utilities.
The centralised approach is pursued to support aggregators in participating in current ancillary service
markets. Ultimately, this paper aims to strengthen the applied research within EV integration through the
practical validation of smart grid concepts on original manufactured equipment.
ã 2016 Elsevier Ltd. All rights reserved.
1. Introduction
With conventional units being replaced by renewable resour-
ces, there is an increased demand for additional ancillary services,
such as frequency control. Due to their defining property of being
quick-response high-power units, electric vehicles (EVs) emerge
as a viable actor for providing frequency regulation. A noticeable
amount of research efforts is put nowadays to investigate all
different aspects needed to shift from the traditional power
system, where frequency and voltages are controlled by a
relatively small set of large units, into a futuristic system, where
potentially all power devices can be involved in the controlling
actions. For instance, in the ELECTRA project, innovative control
schemes are being investigated in order to assess whether
conventional frequency and voltage controlling approaches are
still suitable, or which aspects need to be revised for scenarios
with massive amounts of small distributed energy resources [1,2].
It is argued that TSOs alone will not be able to effectively manage
the overall system balance and will have to partially delegate
frequency control responsibility to DSOs as already happens
today for congestions management and volt-reactive power
provision [3–10].
Regardless of who will be responsible for frequency and voltage
control, several technical challenges are ahead. For instance, will
the aggregated provision of thousands of few kVA-units at low
voltage level be as effective as the one of MVA-units response?
Moreover, considering the traditional 3-phase system, will the
response of groups of single-phase devices be as effective as the
response of similar size 3-phase units? With a specific focus on
frequency control, is it reasonable to expect millions of accurate
local frequency measurements to be used for decentralized,
traditional, droop controllers or is it rather better to have a
limited set of centralized controllers, which rely on a few accurate
Abbreviations: DSO, distribution system operator; ENTSO-E, European Network
of Transmission System Operators for Electricity; EV, electric vehicle; EVSE, electric
vehicle supply equipment; FCR, frequency containment reserve; FRR, frequency
restoration reserve; ICT, information and communications technology; OEM,
original equipment manufacturer; OR, Operating reserve; PFC, primary frequency
control; RES, renewable energy sources; RR, Replacement reserve; SOC, state-of-
charge; TSO, transmission system operator; V2G, vehicle to grid.* Corresponding author.
E-mail addresses: [email protected], [email protected]
(M. Marinelli).
http://dx.doi.org/10.1016/j.est.2016.05.008
2352-152X/ã 2016 Elsevier Ltd. All rights reserved.
Journal of Energy Storage 7 (2016) 63–73
Contents lists available at ScienceDirect
Journal of Energy Storage
journa l home page : www.e l sev ier .com/ loca te /est

measurements, sending out power set-points via normal Internet
connection?
1.1. Background and literature analysis
Electric vehicles are one of the imminent candidates for
providing ancillary services. Most of the time (typically about 90%)
they are plugged into a charging post and can, in principle, provide
fast-regulating power in both directions, or just modulate the
charging power. A noticeable amount of literature has already been
written supporting this statement [7–22].
It is argued that EVs with V2G capability can provide
regulation services, and can compete in electricity markets, such
as markets for ancillary services, where there is payment for
available capacity, apart from the payment for the actual dispatch.
Frequency control is one of the services which can be provided by
EVs through this market. More specifically, primary frequency
control (PFC) can be suitably provided by EVs due to their flexible
operating mode and ability to seamlessly alter the consuming/
producing power under the V2G concept [12–14]. The work
described in [15] presents an aggregated PFC model, where a
participation factor, dependent on the state-of-charge (SOC), is
associated with each EV to determine its droop characteristic. It
was shown that EVs can effectively improve the system frequency
response, as well as that V2G-capable vehicles have better power
response, due to more available primary reserves. Furthermore, a
decentralized V2G control for primary frequency regulation is
presented in [16]. The proposed method considers customer
charging demands and adapts the frequency droop control to
maintain or achieve the desired SOC. A comparative study is
performed in [17], in order to evaluate benefits of EVs performing
primary frequency control in an islanded system with high
penetration of renewable resources. The presented study case
argues that system frequency oscillates in a 0.3 Hz band if the EVs
contribute to primary regulation, compared to 1 Hz in the case of
only using available hydro units. Two studies, respectively from
Japan and Great Britain, analyse participation in frequency
control on large systems considering traveling constraints and
including large amount of renewable sources [18,19]. However,
even though the mentioned studies analysed different
strategies for providing primary frequency control, rarely have
they dealt with the experimental validation, but mostly remained
on modelling and simulations. For example, the works described
in [15–21] have implemented different droop controls and shown
that EVs can be effective in primary frequency regulation,
likewise in isolated microgrids and larger systems. Still, they
assume an ideal EV response to the control signals, both in the
reaction time and the provided power, and they omit communi-
cation and control latencies which may greatly impact the
results.
In addition, technical challenges may arise due to the limited
power and energy size of each individual unit, as well as the need
to have simple and effective measuring and controlling capabilities
for primary frequency regulation. Transmission systems operators
may be sceptical about the possibility of having demand
participating in the frequency regulation, mainly because of
response uncertainties and metering inaccuracies. Therefore, an
extensive experimental activity is required to prove the feasibility
of these solutions. The activity described in this paper is carried out
using series-produced vehicles and the universally supported IEC
61851 standard, to prove the applicability of the solution.
1.2. Objective of the manuscript
Most of the literature identified during the literature review
focuses on modeling and simulating the EV primary frequency
control, whereas the experimental validation is rarely touched
upon. Therefore, this paper focuses on the evaluation of EVs’ ability
to provide primary frequency control in a centralized fashion. The
frequency control analysis of three EVs connected to a small
islanded power system is proposed. Having the
system islanded gives the possibility of emulating realistic
frequency events, which could hardly be appreciated if connected
to the national grid. It is important to note that the experiments are
carried out with commercially available vehicles without taking
advantage of any V2G capability, but only with the possibility to
modulate the unidirectional charging current. This limit is part of
internal standards (IEC61851/J1772) for conductive AC charging
and supported by the vast majority of EVs today.
A classical droop control function is utilized. However,
contrary to today’s practice, which relies on local measurement,
the frequency measurement is routed via the Internet to the
controller, which sends the current set-point to the EV. The
authors believe that in the near future, it will be highly unlikely to
equip each EV with a precise measurement device which meets
the TSO requirements. This means that the used technology
resembles that of an operational environment: a fleet of EVs
providing frequency regulation on market terms through an
aggregator who has the certified frequency measurement device.
Such setup allows the inclusion and assessment of potential
communication delays, especially their influence on system
stability. This work does not take in consideration vehicle
unavailability due to owner usage. However it has to be reminded
that, due to the system wide nature of the service, the location of
the resource providing frequency control is not extremely
important. In that sense, it is the aggregator’s best interest to
rely on a higher number of vehicles to account for the plug-in
uncertainties, whilst it is less important to know their exact
location, as long as the utilized vehicles are connected to the grid
and not used for other services.
Ultimately, the research question tackled in this paper is: can
small size, single phase distributed energy resources, such as
commercially available electric vehicles, effectively provide
primary frequency control relying on a centralized controller
which sends out current set-points?
The rest of the paper is structured as follows: Section 2 briefly
recalls how the control of frequency is traditionally organized in
Europe and in Denmark. Section 3 describes the controller
characteristics, the communication architecture and the imple-
mentation in the laboratory. In Section 4 numerical and graphical
results of the experiments are presented and discussed; several
scenarios are investigated from load step, through steady state
analysis to wind power balancing. Section 5 reports conclusions
and lessons learned.
2. Current framework for frequency control in Europe and
Denmark
2.1. Frequency services according to ENTSO-E division
Based on the European Network of Transmission System
Operators for Electricity (ENTSO-E) definitions, reported in the
Network Code and Operation Handbook, frequency control
includes [23]:
Primary frequency control;
Secondary power-frequency control;
Tertiary control.
ENTSO-E refers to the reserves for frequency control as
Operating Reserves (OR), and specifically, indicates the above-
mentioned controls as:
64 M. Marinelli et al. / Journal of Energy Storage 7 (2016) 63–73

Frequency Containment Reserves (FCR);
Frequency Restoration Reserves (FRR);
Replacement Reserves (RR).
The (automatic) primary frequency control aims at achieving
the operational reliability of the synchronous area by stabilizing
the system frequency after a disturbance or an incident at an
acceptable stationary value in the second time frame, typically
within 30 s. The minimum requirement for FCR is based on the
maximum loss of power generation or demand, also called
reference incident: within the Continental European synchronous
area, the reference incident is defined as 3000 MW of generating
capacity. FCR is shared among all control areas. The requirement of
each control area is defined by contribution coefficients, calculated
as the ratio between the energy generated in that area over a year
and the energy generated in the entire synchronous area. The
response has to be maintained for up to 15 min.
The secondary frequency control, which can be either automatic
or manual, aims to restore the system frequency within a few
minutes, typically up to 15 min after incident, by releasing system-
wide activated frequency containment reserves. For large intercon-
nected systems, where a decentralized frequency restoration control
is implemented, frequency restoration also aims at restoring the
balancebetweengenerationandloadforeachTSO,andconsequently,
restores power exchanges between TSOs to their set-point.
The tertiary control, activated manually and centrally at the TSO
control centre, aims to restore the operating reserve, or to
anticipate expected imbalances. Typically, the activation time is
from 15 min up to several hours.
2.2. Frequency services in Denmark
The Danish power system has the particular feature of
belonging to both the Continental European synchronous area
and the Nordic (Scandinavian) power system. Specifically,
Western Denmark (DK1) which comprises Jutland peninsula
and Funen island, has several AC connections to Germany and is
therefore subject to the frequency services mentioned previously
in Section 2.1. With reference to the primary frequency control,
the mandatory share assigned to Western Denmark is equal to 27
MW. Eastern Denmark (DK2) instead has several AC connections
to Sweden and is therefore synchronous to the Scandinavian
Region. In the current framework, there is no automatic
secondary frequency control in the Nordic power system—
although a manual/tertiary reserve is in place and the primary
frequency control is actually split in two separated services:
frequency-controlled normal and frequency-controlled distur-
bance. The interested reader can get a more detailed overview
on how the frequency control is organized in the Nordic system
by consulting ref [24]. For what concerns the work described in
this manuscript, it is interesting to analyse the technical
conditions for providing the frequency-controlled disturbance
service, which is actually rather demanding in term of response
time:
Supply inverse-linear power at frequencies between 49.9 and
49.5 Hz.
Supply 50% of the response within 5 s.
Supply the remaining 50% of the response within an additional
25 s.
Accuracy and sensitivity of frequency measurements must be
better than 10 mHz.
SCADA system resolution must be better than 1 s.
The listed requirements set the basis for benchmarking the
performance of the experimental activity.
3. Controller characteristic and architecture and experimental
layout
3.1. Primary frequency controller characteristics
Commonly, primary frequency control is achieved via droop
controllers, so that synchronous machines operating in parallel can
share the load, according to their power rating. The droop constant
is generally intended as the measure of the machine sensitivity to
frequency changes, and is the value that quantifies its contribution
to primary frequency/power regulation. The frequency variation,
Df (in Hz), referred to the nominal frequency of the system is
therefore given as a function of the relative power change DP
(in W) or current change DI (in A) reported to the nominal machine
power/current:
aÞDf.
f nom¼ kdroop
DP.
Pnom; bÞDf
.
f nom¼ kdroop
DI.
Inomð1Þ
For example, a 5% droop means that a 5% frequency change
(2.5 Hz) causes 100% change in the machine output.
Defining a droop value for loads, on the other hand, may
become less straightforward, as it may not be clear what the
nominal power of the load – or of the set of loads – is. In this case, it
has been considered that the available range of regulating power,
that means 2.3 kW or 10 A per EV, is equal to the unit’s nominal
power, instead of the nominal charging power of 3.7 kW or 16 A per
EV. Therefore, in the experimental setup that will be described in
Section 3.2, the following parameters are used for the EVs’ 4%
droop control:
aÞ
Df ¼ 2Hz; f nom ¼ 50HzDP ¼ 2:3kW; Pnom ¼ 2:3kW
kdroop ¼
Df.
fnom
DP.
Pnom
¼ 4%;
8
>
>
>
>
<
>
>
>
>
:
bÞ
Df ¼ 2Hz; f nom ¼ 50HzDI ¼ 10A; Inom ¼ 10A
kdroop ¼
Df.
fnom
DI.
Inom
¼ 4%
8
>
>
>
>
<
>
>
>
>
:
ð2Þ
Fig. 1 reports the individual EV controlling characteristic, which
means the current set-point in function of the frequency, for two
different droops: 4% and 2%. The 2% droop is realized by simply
reducing the delta frequency to 1 Hz (i.e., 49.5 50.5 Hz). It has to
be reminded that the droop represent the slope of the curve if the
plot reports the frequency in function of the current set-point. It is
the inverse of the slope if the current is function of the frequency.
The ideal droop curves, in dashed red and magenta in Fig. 1, spans
respectively from 49.5 Hz to 50.5 Hz and 49 Hz to 51 Hz, and are
linearly related to all the current values from 6 A to 16 A. The
implemented ones, however, differ because the current values can
be set with a discretization of 1 A. Therefore the ideal curve
becomes quantized, and for every 0.05 Hz or 0.1 Hz, the current
values are increased by 1 A. The minimum and maximum charging
currents, respectively 6 A and 16 A, are maintained once the
thresholds frequency are reached.
This is the first main outcome, since the current standard
IEC61851 only allows 1A-discrete modulation, while Energinet.dk
requirements specify a linear relationship. In case an aggregator
would realize such control strategy, it would be necessary to have a
sufficient pool of cars that, once aggregated, show an equivalent
linear response.
A possible solution, which is left for further investigations,
could be achieved by shifting the reported characteristics so that,
M. Marinelli et al. / Journal of Energy Storage 7 (2016) 63–73 65

for instance, the current step between 6 A and 7 A is not realized for
all the EVs at 49.00, but at 49.01 Hz for a certain set of EVs, at
49.02 Hz for another set and so on. Given the limited set of cars for
the current experiments, the linearity requirement will not be
fulfilled.
The careful reader will also notice that both droop curves are
slightly asymmetric (i.e., the 11 A value is set between 49.8 and
50.0 Hz and not between 49.9 and 50.1 HZ), giving therefore a bit
more controlling capability for the over-frequency situations. As it
will become clearer while presenting the experimental results (see
Section 4.2), this choice was made in order to compensate for
recurring undershooting phenomenon of approximately 0.5 A in
the effective charging current of the EVs.
3.2. Experimental layout
The experiments are executed using the hardware and ICT
infrastructure of SYSLAB, which is a small-scale power system in
the PowerLabDK platform. SYSLAB consists of a number of real
power components interconnected by a three-phase 400 V AC
power grid, and paralleled with communication and control nodes
arranged in a dedicated network. The complete test bed is
distributed (more than 1 km) over the Risø Campus of the
Technical University of Denmark. The system may be connected
to the local grid or can be islanded if desired [25]. The following
components are used for the experiments, with their capabilities
and operating points summarized in Table 1:
Three controllable EVs (Nissan Leaf) each equipped with single
phase 16 A (230 V) charger and 24 kWh lithium battery storage.
The charger does not utilize any V2G capability, which means it is
not allowed to inject power into the grid. The charging level can,
however, be modulated between 6 and 16 A with steps of 1 A.
Positive power means EV charging (i.e., consumption).
Diesel genset equipped with a 60 kVA synchronous generator,
capable of providing an active power output up to 48 kW.
Positive power means generation.
15 kW 190 kWh Vanadium Redox Battery (VRB) storage
system, equipped with an inverter capable of providing up to
15 kW and 12 kVAr. Positive power means battery charging,
therefore consumption.
10 kW Aircon wind turbine equipped with full converter.
Nominal wind speed 11 m/s, active stall power control. Positive
power means generation. The Aircon is connected to the system
only during the last set of experiments.
The diesel genset is used to provide inertia to the system. The
governor of the genset, however, is disabled in order to avoid
automatic frequency control. Frequency events are triggered by
changing the VRB set-points. The three EV inverters are equipped
with the droop controllers described in Section 3.1, and rely on
frequency measurements routed via wired network connection. It
means that the frequency measurement is not used for feeding a
local controller, but is processed remotely, and sent via network to
the computer controlling the charging post.
This aspect is extremely important because it is common
practice for power plants to provide primary frequency control by
using local frequency measurements. Moreover, as mentioned in
Section 2.2, in order to participate in the frequency regulations, the
usage of measurement devices with high accuracy (at least 10
mHz) and high sampling rate (at least 1 value every second) is
required. This feasibility has already been proved in a grid-
connected setup with just few seconds’ latency [14].
The experimental setup, including both power components
and communication architecture, is presented in Fig. 2. Since all
the components are 3-phase except for the EVs, it has been
necessary to create an intermediate phase splitter, shown in
Fig. 3. The phases are permuted cyclically so that each EV is
supplied on a different phase via a standard Mennekes (IEC 62196
Type 2) connector.
The operating set-points of different components are chosen in
order to push the system to the limits. The EVs’ initial charging
level is chosen so that there is room to increase and decrease the
charge level equally.
3.3. Centralized frequency communication architecture
The test setup used in this work consists of 3 electric vehicle
supply equipment (EVSE), each connected to a different phase. The
communication and control setup are shown in Fig. 4.
The control aggregator is connected to each EVSE by Ethernet,
using the MODBUS protocol, and is used to set a maximum EV
charging current. The aggregator is also connected to a measure-
ment unit, also by Ethernet, using the MODBUS protocol, providing
local frequency and power measurements. Each EVSE is connected
to the EV following the IEC 61851 standard.
Table 1
Units’ capabilities overview.
Units Capability
Single Electric Vehicle (single phase charger) 6 16 A per phase (equal to 1.4 3.7 kW)
Set of 3 EVs 4 11 kW
Vanadium Redox Battery 15 15 kW; 12 12 kVAr
Diesel generator 0 48 kW; 20 30 kVAr
Aircon wind turbine 10 kW @11 m/s
Fig. 1. EV ideal (dashed lines) and real (solid lines) control characteristic for 2 droop
values (2% and 4%).
66 M. Marinelli et al. / Journal of Energy Storage 7 (2016) 63–73
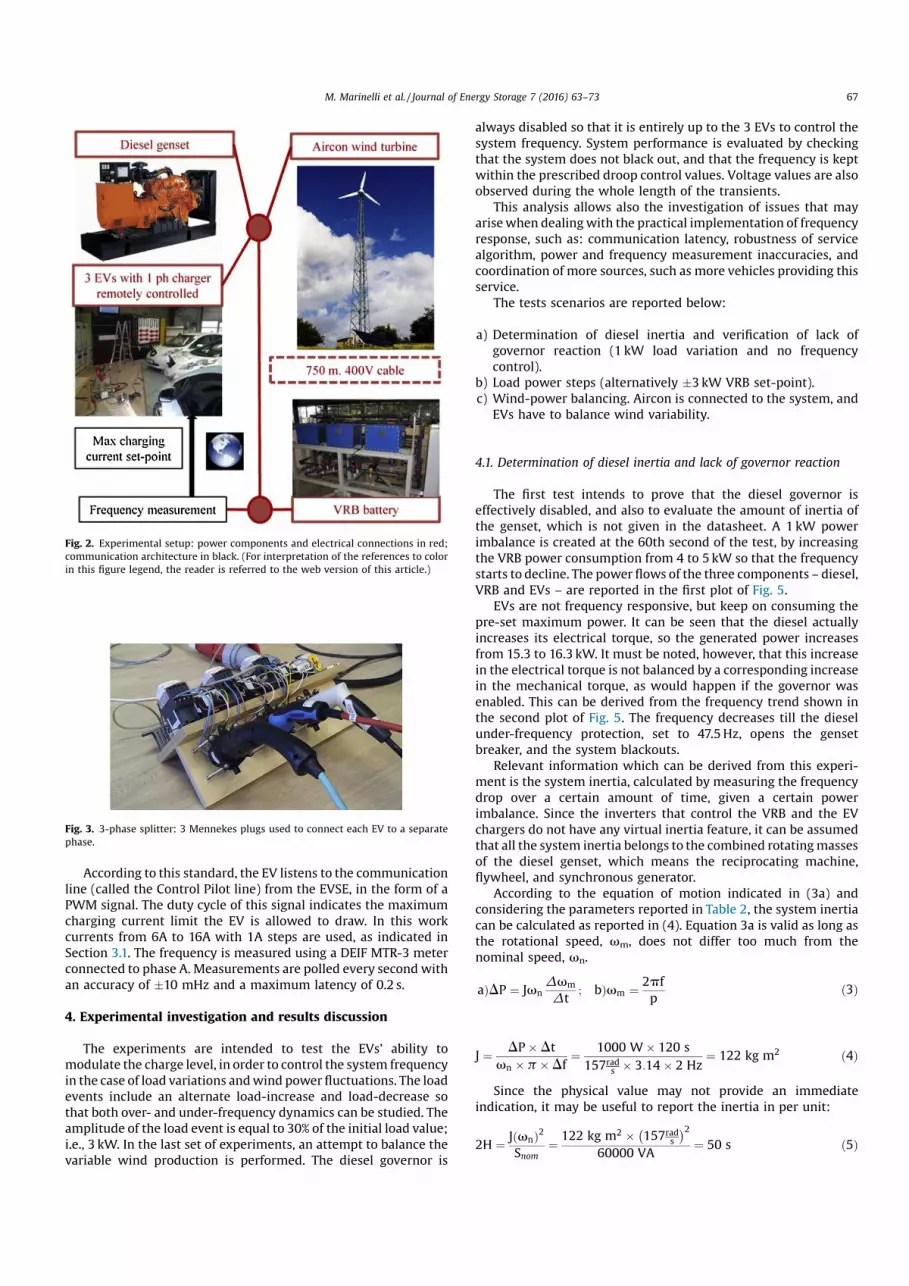
According to this standard, the EV listens to the communication
line (called the Control Pilot line) from the EVSE, in the form of a
PWM signal. The duty cycle of this signal indicates the maximum
charging current limit the EV is allowed to draw. In this work
currents from 6A to 16A with 1A steps are used, as indicated in
Section 3.1. The frequency is measured using a DEIF MTR-3 meter
connected to phase A. Measurements are polled every second with
an accuracy of 10 mHz and a maximum latency of 0.2 s.
4. Experimental investigation and results discussion
The experiments are intended to test the EVs’ ability to
modulate the charge level, in order to control the system frequency
in the case of load variations and wind power fluctuations. The load
events include an alternate load-increase and load-decrease so
that both over- and under-frequency dynamics can be studied. The
amplitude of the load event is equal to 30% of the initial load value;
i.e., 3 kW. In the last set of experiments, an attempt to balance the
variable wind production is performed. The diesel governor is
always disabled so that it is entirely up to the 3 EVs to control the
system frequency. System performance is evaluated by checking
that the system does not black out, and that the frequency is kept
within the prescribed droop control values. Voltage values are also
observed during the whole length of the transients.
This analysis allows also the investigation of issues that may
arise when dealing with the practical implementation of frequency
response, such as: communication latency, robustness of service
algorithm, power and frequency measurement inaccuracies, and
coordination of more sources, such as more vehicles providing this
service.
The tests scenarios are reported below:
a) Determination of diesel inertia and verification of lack of
governor reaction (1 kW load variation and no frequency
control).
b) Load power steps (alternatively 3 kW VRB set-point).
c) Wind-power balancing. Aircon is connected to the system, and
EVs have to balance wind variability.
4.1. Determination of diesel inertia and lack of governor reaction
The first test intends to prove that the diesel governor is
effectively disabled, and also to evaluate the amount of inertia of
the genset, which is not given in the datasheet. A 1 kW power
imbalance is created at the 60th second of the test, by increasing
the VRB power consumption from 4 to 5 kW so that the frequency
starts to decline. The power flows of the three components – diesel,
VRB and EVs – are reported in the first plot of Fig. 5.
EVs are not frequency responsive, but keep on consuming the
pre-set maximum power. It can be seen that the diesel actually
increases its electrical torque, so the generated power increases
from 15.3 to 16.3 kW. It must be noted, however, that this increase
in the electrical torque is not balanced by a corresponding increase
in the mechanical torque, as would happen if the governor was
enabled. This can be derived from the frequency trend shown in
the second plot of Fig. 5. The frequency decreases till the diesel
under-frequency protection, set to 47.5 Hz, opens the genset
breaker, and the system blackouts.
Relevant information which can be derived from this experi-
ment is the system inertia, calculated by measuring the frequency
drop over a certain amount of time, given a certain power
imbalance. Since the inverters that control the VRB and the EV
chargers do not have any virtual inertia feature, it can be assumed
that all the system inertia belongs to the combined rotating masses
of the diesel genset, which means the reciprocating machine,
flywheel, and synchronous generator.
According to the equation of motion indicated in (3a) and
considering the parameters reported in Table 2, the system inertia
can be calculated as reported in (4). Equation 3a is valid as long as
the rotational speed, vm, does not differ too much from the
nominal speed, vn.
aÞDP ¼ JvnDvm
Dt; bÞvm ¼
2pf
pð3Þ
J ¼DP Dt
vn p Df¼
1000 W 120 s
157rads 3:14 2 Hz
¼ 122 kg m2 ð4Þ
Since the physical value may not provide an immediate
indication, it may be useful to report the inertia in per unit:
2H ¼J vnð Þ2
Snom¼
122 kg m2 157rads
2
60000 VA¼ 50 s ð5Þ
Fig. 3. 3-phase splitter: 3 Mennekes plugs used to connect each EV to a separate
phase.
Fig. 2. Experimental setup: power components and electrical connections in red;
communication architecture in black. (For interpretation of the references to color
in this figure legend, the reader is referred to the web version of this article.)
M. Marinelli et al. / Journal of Energy Storage 7 (2016) 63–73 67

The 2H, or acceleration time constant, may seem rather large if
compared to the typical values of conventional power plants,
which generally span from 8 to 12 s [26]. It has to be kept in mind
that this unit is designed for islanded operation, and has a
reciprocating engine which needs proper balancing, in order to
smooth out the natural pistons pulsations.
4.2. Load power steps
The second test is intended to assess whether the EVs can cope
with large load variations, and to verify if their response follows
the predefined droop characteristic illustrated in Fig. 1. The units’
power outputs and the frequency measured at the diesel breaker
are reported in Fig. 6 for the 2% droop controller. The initial
conditions consist in: VRB consuming 2 kW, EVs consuming 7.2 kW
(10.5 A each EV @ 230 V), diesel genset producing 9.6 kW (20%
nominal power) and the rest accounts for system losses. As it will
be better highlighted afterwards, even though the EVs are pre-set
to consume 11 A, they actually draw less current. According to
some discussions with OEM, the reason for this undershooting
resides in the fact that OEM wants to be sure that if the PWM signal
is limiting the charging current, the EV does not cross the set
threshold even for few seconds.
It can be seen immediately in Fig. 6 that, despite the large load
variations, which values around 30% of the initial load, the
frequency is maintained between 49.5 and 50.5 Hz as expected
from the 2% droop controlling characteristic. At the second 5400,
when the first positive load step (VRB power from 2 kW to 5 kW)
happens, the EVs quickly reduce their consumptions, and the
frequency stabilises at around 49.4 Hz. The opposite situation is
experienced at the second 5650, during the negative load step (VRB
power from 2 kW to 1 kW), when the frequency stabilises at
around 50.4 Hz.
Fig. 4. Communication and control setup.
Fig. 5. First plot: Diesel, 3 EVs and VRB active power outputs. Second plot:
frequency measured at Diesel power meter.
Table 2
System values.
DP (power imbalance) Df/Dt (frequency drop
in the time interval)
p (number of pair poles) vn (generator
nominal rotating speed)
1000 W 2 Hz/120 s 2 1500 rpm
68 M. Marinelli et al. / Journal of Energy Storage 7 (2016) 63–73

Naturally, during the triggering events, the large system inertia
plays a relevant role, which helps to slow down the frequency
variations. As it can be seen from the equation of motion, the
frequency variation depends on both the power variation (DP) and
the inertia (J or 2H). Since it is not possible to change the system
inertia, it has been decided to test the most challenging situation
i.e., the largest power step which is equal to 3 kW in the VRB
output. It has to be pointed out that the EV flexibility range, acting
as the primary reserve available in the system, equals to 3450 W
assuming the initial current set-point of 11 A per EV (that is 5 A
per phase under the nominal voltage of 230 V). Frequency
variations caused by a larger power steps, cannot be stabilized
by the 3 EVs.
As mentioned in Section 4.1, the system inertia is around 5
times larger (in term of relative values) compared to the one of
national power systems. However, it has to be noted that the load
variation under test is extremely large, being 30% of the initial load
value. If, for example, the Continental European power system is
taken into consideration, the sizing accident for primary frequency
control is estimated in a power step of around 3 GW. If this number
is compared with the maximum load value, which is roughly 520
GW, the normalized load variation is equal to 0.6%. One could argue
that the diesel used in this experiment also operates in a low-
loaded situation (i.e., 9.6 kW production for a 60 kVA machine), so
the load variation analysed in the test (i.e., 3 kW) should be
referred to the nominal power of the diesel (i.e., 60 kVA). In this
case, the normalized load variation is around 5% (i.e., 3/60), which
is still 8 times larger compared to the value reported for
Continental Europe.
Coming back to the transient behaviour of the system, it is
interesting to observe in Fig. 7 that, when the load is equal to the
initial conditions (i.e., VRB power at 2 kW), the frequency is
oscillating around 50 Hz with a periodicity of around 6 s.
This means an oscillation with a frequency of 0.16 Hz that
belongs to the group of local plant mode instability [27]. This is a
clear indication that the controlling action of the EVs is too intense,
leading the EVs to resonate with the diesel genset, which is
naturally not a desirable operation. The 4% droop characteristic
mentioned in Section 3.1 is investigated as well in order to verify
whether a less intense proportional action would have been better.
The wind balancing results, reported in Section 4.3, will evaluate
system performances with both 2% and 4% droop.
Concerning the analysed load step test, it is also worthwhile
focusing on the transient behaviour of the system right after the
VRB power step. A 20-s time window is reported Fig. 8, where it is
possible to notice the sudden frequency drop right after the 3 kW
increase and the controlling action realised by the 3 EVs.
It can be noted in the third plot that the delay between the set
and the calculated current is always around 1 s, at least in the time
window displayed, while the delay between the measured and the
set current is between 0 and 1 s. It is possible to notice few times
that the measured and the set current are apparently synchro-
nized. This is due to a limitation of the logging system that saves
Fig. 6. First plot: Diesel, 3 EVs and VRB active power outputs (Aircon is
disconnected). Second plot: frequency measured.
Fig. 7. First plot: Diesel, 3 EVs power and set-point and VRB active power outputs.
Second plot: frequency measured.
Fig. 8. First plot: Diesel, 3 EVs power and set-point and VRB active power outputs.
Second plot: frequency measured. Third plot: calculated, set and measured current
for each EV.
M. Marinelli et al. / Journal of Energy Storage 7 (2016) 63–73 69

data every second making it difficult to appreciate faster dynamics:
in this case, it is reasonable to assume that the EV response delay is
within 0.5 s. However, it is possible to claim that most of the times
the whole latency, starting from frequency measurement to EVs
injected current into the grid, is between 2 and 3 s, which is
certainly compatible with the requirements set by Energinet.dk for
frequency controlled disturbance. An extensive and longer
correlation analyses is conducted for the tests involving wind
power balancing in order to support this finding.
Another relevant point concerns the current undershooting: as
mentioned at the beginning of this section, the EVs almost never
draw the current set by the controller, but steadily remain few
decimal of ampere below the set value. This is due to the fact that
the applied standard IEC 61851 defines a current limitation rather
than a precise current set-point; therefore EVs are not required to
follow the value, but just to limit the current. The reader will also
notice that the EV connected to phase C (red line in the third plot of
Fig. 8) is sometimes slightly slower than the other two and a bit
more conservative when it comes to limiting the current drawn.
The reason for this behaviour can be explained by the fact that,
even though all cars are of the same type, the third one is actually
two years older; therefore, the reason for the smaller delay could
reside in a better design of the EV charging system. It has to be
mentioned that the standard IEC 61851 specifies that this delay
should be within 3 s.
4.3. Wind power balancing scenarios
In the final scenario, the effectiveness of EVs in balancing wind-
power production is tested. Both droop characteristics are
investigated in a similar setup, even though it has been necessary
to reduce the VRB set-point during the 4% droop trial due to
reduced wind speed. The initial values for both scenarios are
summarized in Table 3.
Two 20-min time series results are reported in Fig. 9 for the two
scenarios. The first impression is that the frequency is much more
stable with the 4% droop; however, it has to be mentioned that
wind conditions changed during the test and the wind turbine
produced less power during the 4% test. However, in authors’
opinion, this is not significantly impacting the controller’s
performance. In fact, as it was shown in the previous subsection,
the EVs were marginally stable when following the load steps even
without a variable power source in the system. In any case, tuning
the controller is not the most important test objective at this stage,
but rather verifying that EVs are able to sustain the system, and
assessing their response time.
In order to get a more clear evaluation of the response time over
the two tests, a correlation between phase A EV current and
frequency measurements is reported. The left plot of Fig.10 reports
this correlation, highlighting also the applied control characteristic
(red solid curve). The same correlation is moreover obtained by
shifting the measured frequency respectively 1 s (middle plot) and
2 s (right plot) in the future.
A detailed numerical correlation analysis is reported in Table 4,
by considering time shifts between 0 and 4 s and three classes of
correlations are evaluated.
I calculated—I set: correlation between the calculated current
set-point, which is based on the measured frequency and the
current set by the controller. This operation is done in parallel for
all the machines therefore the correlation is the same. It can be
seen that the highest correlation (97.5%) is obtained for 1 s shift,
meaning that it is reasonable to assume this kind of delay
between 0.5 and 1.5 s.
Table 3
System values during the wind power balancing scenarios.
Droop Test
duration
Diesel set-point
(generation)
VRB set-point
(consumption)
EV initial charging value (consumption) Expected wind power (generation)
2% (6 16 A;
49.5 50.5 Hz)
1800 s 9.6 kW (20% nominal power) 7 kW 7.2 kW
(11 A set per EV)
4 7 kW
4% (6 16 A;
49 51 Hz)
1800 s 9.6 kW (20% nominal power) 4 kW 7.2 kW
(11 A set per EV)
2 5 kW
Fig. 9. First plot: Diesel, 3 EVs, VRB and Aircon active power outputs. Second plot: frequency. Dataset shown 20 min. EVs droop controller set to 2% (left plots) and to 4% (right
plots).
70 M. Marinelli et al. / Journal of Energy Storage 7 (2016) 63–73

I set—I measured: correlation between the calculated current
set-point and the current effectively consumed (and measured)
by the EV. The highest correlation can be found in the first
column (0 s shift), although also the second column (1 s shift)
presents quite high correlation values. It is reasonable to assume
that the average response time is within 1 s. It has to be stressed
that this correlation, lower than the previous one, considers also
the mismatching between measured and set current due to the
undershooting phenomena, highlighted in Section 4.2. It can be
also appreciated that the 3rd EV is actually the one presenting
the poorest performance compared to the other two.
I calculated—I measured: this correlation includes the two
presented before and it is calculated in order to assess the overall
EV response time. In this case the third column (2 s shift) is the
one presenting the highest correlation, even though also the
second one is rather large.
It can be concluded that the overall response time (from
frequency measurement to EV current measurement) is between
1.5 and 2.5 s.
The same analysis is also performed for the 4% test case and the
results are displayed in Fig. 11 and are reported analytically in
Fig.10. Correlation between Phase A EV current and frequency measurements. Left plot: no time shift; middle plot: 1 s time shift; right plot: 2 s time shift. 2% droop controller.
Table 4
Correlation between calculated/set/measured phase currents Droop 2% wind balancing data set 1800seconds.
0 s shift 1 s shift 2 s shift 3 s shift 4 s shift
I calculated—I set 77.7% 97.5% 83.1% 57.4% 45.1%
I set—I measured (ph A; ph B; ph C) 91.7% 90.5% 67.4% 50.1% 53.9%
93.3% 86.0% 62.2% 47.8% 57.9%
62.6% 65.0% 53.6% 41.5% 40.9%
I calculated—I measured (ph A; ph B; ph C) 66.9% 90.7% 93.0% 70.0% 50.6%
65.9% 89.9% 93.5% 70.9% 51.0%
41.9% 59.0% 67.0% 58.2% 44.0%
Fig.11. Correlation between Phase A EV current and frequency measurements. Left plot: no time shift; middle plot: 1 s time shift; right plot: 2 s time shift. 4% droop controller.
M. Marinelli et al. / Journal of Energy Storage 7 (2016) 63–73 71

Table 5. The results are consistent with the previous ones and due
to better performances of the controller, it can be appreciated a
higher correlation for the “I calculated—I measured” with 1 s shift
instead of the 2 s shift.
Another important aspect relates to the quality of the frequency
measurements. It is important to have a system robust against
erroneous or missing information. In case faulty frequency
measurements are detected, e.g. 0 Hz, the possibility of considering
the last received frequency measurement as valid could be
implemented, so EV control would be done according to that
measurement. An alternative, although more expensive, could be
the application of the 2 out of 3 logic often used in industrial
processes. In this case it would be necessary for the aggregator to
receive 3 different frequency measurements from separate
instruments, possibly not electrically too far from each other,
and then exclude the faulty one. In any case, similar approaches
would still be cheaper compared than installing frequency meters
in each EVSE.
A final consideration relates to the possibility of applying the
same control structure also for deploying secondary frequency
control. In fact, the EV current limitation set-point could be based
on an integral effect of the frequency error similarly to what is
currently done, where set-points are received by dedicated power
stations. From the aggregator perspective, it could be foreseen that
a certain amount of EVs are allocated to modulate their power
outputs in order to restore frequency errors (in case the secondary
frequency control is used for restoring the frequency) or restoring
power exchanges between TSO control areas. Alternatively, other
energy resources, characterized by slower dynamics, could be used
for providing secondary control. For instance, experimental results
reported in [28] proved the provision of secondary frequency
control by using thermostatic controllable loads, such as domestic
refrigerators. In any case, it is important to properly size the
amount of reserve devoted to primary and secondary frequency
reserve, as well as the frequency activation ranges in order to avoid
lack of regulating power when needed.
5. Conclusions and future activities
The experimental results clearly show that frequency control
from EVs is technically feasible with very fast response time.
Therefore, coming back to the initial question, it is authors’ opinion
that EVs can be a reliable source for this kind of service and that
providing primary frequency control with centralized communi-
cation architecture, relying on decentralized energy resources is
technically feasible. The testing proved that already today, with
existing commercial vehicles and standards without any particular
V2G capability, it is possible to achieve this objective. Naturally,
there is room for improvement and a few points that the authors
think are necessary to tackle are listed.
Given the limited amount of regulating power, the chosen 2%
droop value is rather small, meaning that the EVs’ controlling action
is rather intense, which is one source of oscillations. The less intense
4% controlling action proved better transient performances. The two
new Leafs showed better performances, with the overall response
delay always in the range of 2–3 s, while for the older one, the delay
was sometimes a bit higher and the current undershooting slightly
larger. Moreover, accuracy of the current limitation feature need to
be better exploited in order to compensate the undershooting.
The observed communication delay is limited; therefore
deploying this kind of strategy via the Internet is not seen as an
obstacle to this approach. The granularity of the control, with the
1 A discretization, does not help to obtain a smooth response, as
each EV can change its output with a 10% step. Naturally, this
response could become smoother in the moment that an
aggregated set of EVs is considered (i.e., 10 or more). The controller
is actually setting a pure current reference: future work will also
investigate a voltage-compensation loop, in order to take into
account considerable voltage deviations as well as compensating
for larger than expected undershooting. As a final remark, it was
interesting to appreciate standard EV chargers withstanding
frequency events spanning from 47 up to 52 Hz without any
interruption.
Acknowledgments
This work is supported by the Danish Research Project
“NIKOLAIntelligent Electric Vehicle Integration”-under ForskEL
kontrakt nr. 2013-1-12088. More information: www.nikolaproject.
info.
The authors are grateful to Nissan Denmark for providing 2 of
the 3 Leafs used in the experiments.
References
[1] L. Martini, L. Radaelli, H. Brunner, C. Caerts, A. Morch, S. Hanninen, C. Tornelli,Electra IRP approach to voltage and frequency control for future powersystems with high der penetration, 23rd International Conference onElectricity Distribution CIRED, Lyon, 15–18 June 2015, 2015, pp. 1–5.
[2] K. Visscher, M. Marinelli, A.Z. Morch, S.H. Jakobsen, Identification ofobservables for future grids—The framework developed in the ELECTRAproject, PowerTech, 2015 IEEE Eindhoven, June 29 2015–July 2 2015, 2016, pp.1–6.
[3] M. Rezkalla, K. Heussen, M. Marinelli, J. Hu, H.W. Bindner, Identification ofrequirements for distribution management systems in the smart grid context,Power Engineering Conference (UPEC), 50th International Universities, 1–4Sept. 2015, 2015, pp. 1–6.
[4] A. Zegers, H. Brunner, TSO-DSO interaction: an overview of current interactionbetween transmission and distribution system operators and an assessment oftheir cooperation in Smart Grids, ISGAN (International Smart Grid ActionNetwork) Discussion Paper Annex 6 Power T&D Systems, Task 5, September,2014.
[5] R. Yan, T.K. Saha, N. Modi, N.-A. Masood, M. Mosadeghy, The combined effectsof high penetration of wind and PV on power system frequency response, Appl.Energy 145 (2015) 320–330, doi:http://dx.doi.org/10.1016/j.apenergy.2015.02.044.
[6] J. Fleer, P. Stenzel, Impact analysis of different operation strategies for batteryenergy storage systems providing primary control reserve, J. Energy Storage(2016), doi:http://dx.doi.org/10.1016/j.est.2016.02.003.
[7] E. Kaempf, H. Abele, S. Stepanescu, M. Braun, Reactive power provision bydistribution system operators—optimizing use of available flexibility,Innovative Smart Grid Technologies Conference Europe (ISGT-Europe), IEEEPES, 12–15 Oct. 2014, 2014, pp. 1–5.
[8] J. García-Villalobos, I. Zamora, J.I. San Martín, F.J. Asensio, V. Aperribay, Plug-inelectric vehicles in electric distribution networks: a review of smart charging
Table 5
Correlation between calculated/set/measured phase currents Droop 4% wind balancing data set 1800seconds.
0 s shift 1 s shift 2 s shift 3 s shift 4 s shift
I calculated—I set 67.4% 99.5% 67.4% 56.7% 50.4%
I set—I measured (ph A; ph B; ph C) 89.6% 80.6% 60.9% 54.2% 61.5%
92.1% 79.0% 61.7% 54.3% 62.9%
87.2% 85.6% 67.3% 58.7% 63.1%
I calculated—I measured (ph A; ph B; ph C) 66.0% 89.2% 80.5% 61.0% 54.6%
65.9% 91.2% 79.0% 61.8% 54.7%
64.6% 86.8% 85.4% 67.3% 59.0%
72 M. Marinelli et al. / Journal of Energy Storage 7 (2016) 63–73

approaches, Renew. Sustain. Energy Rev. 38 (2014) 717–731, doi:http://dx.doi.org/10.1016/j.rser.2014.07.040.
[9] J. Hu, S. You, M. Lind, J. Østergaard, Coordinated charging of electric vehicles forcongestion prevention in the distribution grid, IEEE Trans. Smart Grid 5 (2014)703–711, doi:http://dx.doi.org/10.1109/TSG.2013.2279007.
[10] F. Mwasilu, J.J. Justo, E.K. Kim, T.D. Do, J.W. Jung, Electric vehicles and smartgrid interaction: a review on vehicle to grid and renewable energy sourcesintegration, Renew. Sustain. Energy Rev. 34 (2014) 501–516, doi:http://dx.doi.org/10.1016/j.rser.2014.03.031.
[11] K. Knezovic, M. Marinelli, P. Codani, Y. Perez, Distribution grid services andflexibility provision by electric vehicles: a review of options, PowerEngineering Conference (UPEC), 50th International Universities, 1–4 Sept.2015, 2015, pp. 1–6.
[12] C. Gouveia, C.L. Moreira, J.A.P. Lopes, D. Varajao, R.E. Araujo, Microgrid servicerestoration: the role of plugged-in electric vehicles, IEEE Industrial ElectronicsMagazine, vol. 7, no. 4, Dec., 2013, pp. 26–41, doi:http://dx.doi.org/10.1109/MIE.2013.2272337.
[13] W. Kempton, J. Tomic, Vehicle-to-grid power implementation: from stabilizingthe grid to supporting large-scale renewable energy, J. Power Sources 144(2005) 280–294, doi:http://dx.doi.org/10.1016/j.jpowsour.2004.12.022.
[14] S. Martinenas, M. Marinelli, P.B. Andersen, C. Træholt, Implementation anddemonstration of grid frequency support by V2G enabled electric vehicle, Proc49th Int Univ Power Eng Conf IEEE (2014) 1–6, doi:http://dx.doi.org/10.1109/UPEC.2014.6934760.
[15] S. Izadkhast, P. Garcia-Gonzalez, P. Frias, An aggregate model of plug-in electricvehicles for primary frequency control, IEEE Trans. Power Syst. 30 (2015)1475–1482, doi:http://dx.doi.org/10.1109/TPWRS.2014.2337373.
[16] H. Liu, Z. Hu, Y. Song, J. Lin, Decentralized vehicle-to-grid control for primaryfrequency regulation considering charging demands, IEEE Trans. Power Syst.28 (2013) 3480–3489, doi:http://dx.doi.org/10.1109/TPWRS.2013.2252029.
[17] P.M.R. Almeida, J.A.P. Lopes, F.J. Soares, L. Seca, Electric vehicles participating infrequency control: operating islanded systems with large penetration ofrenewable power sources, 2011 IEEE PES Trondheim PowerTech PowerTechnol a Sustain Soc POWERTECH 1 (2011) 5–10, doi:http://dx.doi.org/10.1109/PTC.2011.6019424.
[18] T. Masuta, A. Yokoyama, Supplementary load frequency control by use of anumber of both electric vehicles and heat pump water heaters, IEEE Trans.Smart Grid 3 (2012) 1253–1262, doi:http://dx.doi.org/10.1109/TSG.2012.2194746.
[19] J. Meng, Y. Mu, H. Jia, J. Wu, X. Yu, B. Qu, Dynamic frequency response fromelectric vehicles considering travelling behavior in the Great Britain powersystem, Appl. Energy 162 (2016) 966–979, doi:http://dx.doi.org/10.1016/j.apenergy.2015.10.159.
[20] J. Druitt, W.-G. Früh, Simulation of demand management and grid balancingwith electric vehicles, J. Power Sources 216 (2012) 104–116, doi:http://dx.doi.org/10.1016/j.jpowsour.2012.05.033.
[21] X. Luo, S. Xia, K.W. Chan, A decentralized charging control strategy for plug-inelectric vehicles to mitigate wind farm intermittency and enhance frequencyregulation, J. Power Sources 248 (2014) 604–614, doi:http://dx.doi.org/10.1016/j.jpowsour.2013.09.116.
[22] P.B. Andersen, M. Marinelli, O.J. Olesen, C.A. Andersen, G. Poilasne, B.Christensen, et al., The Nikola project intelligent electric vehicle integration,IEEE PES Innov Smart Grid Technol Eur (2014) 1–6, doi:http://dx.doi.org/10.1109/ISGTEurope.2014.7028765.
[23] ENTSO-E, Continental Europe Operation Handbook. Available: https://www.entsoe.eu/publications/system-operations-reports/operation-handbook/Pages/default.aspx.
[24] Energinet.dk, Ancillary services to be delivered in Denmark—Tenderconditions. Available: https://energinet.dk/EN/Soeg/Sider/Publikationsvisning.aspx?Filter1Value=4812&Filter1Field=Id.
[25] M. Marinelli, F. Sossan, G.T. Costanzo, H.W. Bindner, Testing of a predictivecontrol strategy for balancing renewable sources in a microgrid, Sustain.Energy IEEE Trans. 5 (2014) 1426–1433, doi:http://dx.doi.org/10.1109/TSTE.2013.2294194.
[26] P. Kundur, Power System Stability and Control, McGraw-Hill Education, 1994.[27] L.L. Grigsby, Power System Stability and Control. The Electric Power
Engineering Handbook, CRC Press/IEEE Press, 2001, 2016.[28] V. Lakshmanan, M. Marinelli, J. Hu, H.W. Bindner, Provision of secondary
frequency control via demand response activation on thermostaticallycontrolled loads: solutions and experiences from Denmark, Appl. Energy 173(2016) 470–480, doi:http://dx.doi.org/10.1016/j.apenergy.2016.04.054.
M. Marinelli et al. / Journal of Energy Storage 7 (2016) 63–73 73

Pub. E. Evaluation of Electric VehicleCharging Controllability for Provision ofTime Critical Grid Services
125

Evaluation of Electric Vehicle ChargingControllability for Provision of Time Critical Grid
ServicesSergejus Martinenas, Mattia Marinelli, Peter Bach Andersen, Chresten Træholt
Center for Electric Power and Energy, Department of Electrical Engineering, DTU – Technical University of DenmarkContact Person: Sergejus Martinenas, [email protected]
Abstract—Replacement of conventional generation by morestochastic renewable generation sources leads to reduction ofinertia and controllability in the power system. This introducesthe need for more dynamic regulation services. These fasterservices could potentially be provided by the growing number ofelectric vehicles. EVs are a fast responding energy resource withhigh availability. This work evaluates and experimentally showsthe limits of EV charging controllability using widely supportedIEC 61851 standard. The focus is put on EVs suitability forproviding ancillary grid services with time critical requirements.Three different series produced EVs are tested. The experimentaltesting is done by using charging current controllability of built-in AC charger to provide a primary frequency regulation servicewith very dynamic input frequency. The results show that thecontrollability of most EVs is more than suitable for providingtime critical grid services. Meanwhile, charging current rampingrates of recently produced EVs are potentially suitable to evenprovide synthetic inertia.
Keywords – Electric Vehicles, Charging Stations, Power Control,Smart Grid
I. INTRODUCTION
Year by year the share of renewable generation in thepower system is increasing. This, mostly stochastic energysource and lack of directly coupled rotating machines, leadsto reduced controllability and lower system inertia [1], [2].Such change introduces the need for much faster regulationservices. Current grid services are designed to be providedby conventional generation sources, thus timing requirementsof these services are adhering to ramping rates of thermalpower plants. Transition to more dynamic grid power flowswill require faster regulation services [3].
Simultaneously, the share of a new fast responding, highavailability energy resource - the electric vehicle (EV), israpidly growing. While EVs are viewed as a solution tothe environmental problems in transportation sector, they aretreated as additional loads that will require grid upgrades inthe energy sector. However, with intelligent integration ofthe EV charging infrastructure they become a potential gridbalancing resource [4], [5], [6]. When aggregated in largenumbers, vehicles could provide the services including current
This work is supported by the Danish Research Project “NIKOLA -Intelligent Electric Vehicle Integration”- under ForskEL kontrakt nr. 2013-1-12088. More information (www.nikolaproject.info).
ancillary services defined by grid operators, as well as onesaddressing future issues of the grid, such as defined in theNIKOLA project [7]. EVs could provide a large range of gridservices from local voltage control to system-wide frequencyregulation [8]. This work focuses on the most time criticalservices with tight response time limitations such as primaryfrequency regulation and synthetic inertia.
Technically, service provision is possible by controllingthe charging current limit of the build-in EV charger asdefined by IEC 61851 standard [9]. Meanwhile, additionalparameters such as state of charge (SOC), plug-in and plug-outtimes could improve the quality of the provided service [10].However, the response times and precision for EVs of differentmake or model are not identical even though it is definedby the standard. Depending on the EV model, the speed ofEV response can vary from under a second to few seconds.Such difference in timing, although being small, means thatonly some vehicles could provide time critical services suchas synthetic inertia or very fast frequency regulation. In thiswork three separate vehicles of different brand and model aretested for speed and precision of response.
This work is mainly focusing on AC charging as DCcharging is typically used for short high-power chargingsessions meant to extend the vehicles operational range, thusnot suitable for grid service provision due to short sessionduration. It should be mentioned that vehicle to grid (V2G)technology could greatly improve the grid service provision[11], however at the time of writing it is still in developmentphase and therefore is not considered in this work.
The paper is structured as follows: Section II describespotential grid services that EVs could provide. Section IIIpresents the method and experimental test setup used forassessing EV charging controllability. Section IV shows andanalyses the results of the experimental validation. Section Vsummarizes the conclusions and further discusses the evalua-tion as well as potential alternative solutions.
II. GRID ANCILLARY SERVICES
This work focuses on evaluating the potential of electric ve-hicles to provide different grid support services for the currentand future smart grid. Therefore the grid service definitions aretaken from the Danish Transmission System Operator (TSO)- Energinet.DK ancillary service provision requirements [12]

and NIKOLA project service catalog [7]. The examples ofgrid services considered are primary frequency regulation, veryfast frequency regulation, synthetic inertia, etc. All of theseservices are time critical but have very different response timeconstrains.
The Danish power grid is uniquely split into two separatesynchronous regions: DK1 and DK2. Jylland peninsula andisland of Fyn are in DK1 region connected continental partof Europe. The islands of Sjælland and Bornholm are in DK2region connected Nordic synchronous area.
The definitions of services relevant to primary frequencyregulation ancillary service from Energinet.DK:
• Primary Reserve in DK1 region - restores balancebetween production and consumption, stabilizing the fre-quency at close to, but deviating from 50Hz. The regula-tion is automatic and responding to frequency deviation,with a small permitted dead-band. The first half of theactivated reserve must be supplied within 15 seconds,while the last half must be supplied in full within 30seconds.
• Normal Operation Reserve in DK2 region - ensures thatproduction and consumption equilibrium is restored. Theregulation is automatic and responding to frequency de-viation, without dead-band. The reserve must be suppliedwithin 150 seconds.
• Disturbance Reserve in DK2 region - a fast reserve,activated in the event of major system disturbances. Itis started automatically in the event of sudden frequencydrop under 49.9Hz and remains active until frequencyis restored or manual reserve takes over. The first 50%of the response must be supplied within 5 seconds, theremaining 50% of the response within an additional 25seconds.
In addition to these services the time critical grid servicesdefined in NIKOLA project [7]:
• Fast Frequency Reserve - the time requirements are verysimilar to the one specified for the disturbance reserve inDK2, which is already a rather demanding service, butin this case the full reserve is required to be deployed in10 seconds.
• Synthetic Inertia - the reserve that mimics rotationalinertia of the generations. it requires full deployment ofthe reserve within 1 or 2 seconds. The time is highlyinfluenced by the actual system inertia. The lower isthe equivalent inertia of the system, the higher is thetime criticality of this service. Moreover, what makesthis service even more challenging, is the fact that theequivalent system inertia could change during the day,depending on the amount of inverter driven resources(such as photovoltaic or Type C and D wind turbines)are connected in the system.
It should be noted that different services have varying re-sponse time requirements from milliseconds to tens of seconds.The setup chosen for testing the EV response time is following
the guidelines of primary frequency regulation service withsimple droop control and no dead-band.
III. METHODOLOGY
The response time of the service is dependent on thewhole control loop. Therefore, in this work, a typical controlarchitecture for providing grid services is recreated. It consistsof EV, charging spot, smart charging controller, measurementdevice and grid connection. The experimental test setup isshown in Fig. 1.
Fig. 1. Experimental test system setup
The details of the setup components are outlined here:• Smart charging controller - receives the data from the
measurement devices and sends control signals to theEVSE.
• DEIF MIC-2 - multi-instrument measurement devicefor voltage, current and power measurements with 0.5%accuracy.
• EVSE - Electric Vehicle Supply Equipment, also knownas the charging spot. The maximum charging currentrating is 16A.
• EV - one of the three different electric vehicles tested inthis evaluation.
• Grid - grid connection at the SYSLAB experimentalfacility.
The smart charging controller consists of multiple sub-components described here:
• Controller logic - reads the latest frequency measure-ments from the message bus, calculates the set-points andsends control signals directly to the EVSE controller.
• EVSE controller - acts as an abstraction interface be-tween the physical EVSE and charging controller com-ponents.
• Frequency poller - interface to the frequency measure-ments. Commonly, DEIF MTR-3 measurement instru-
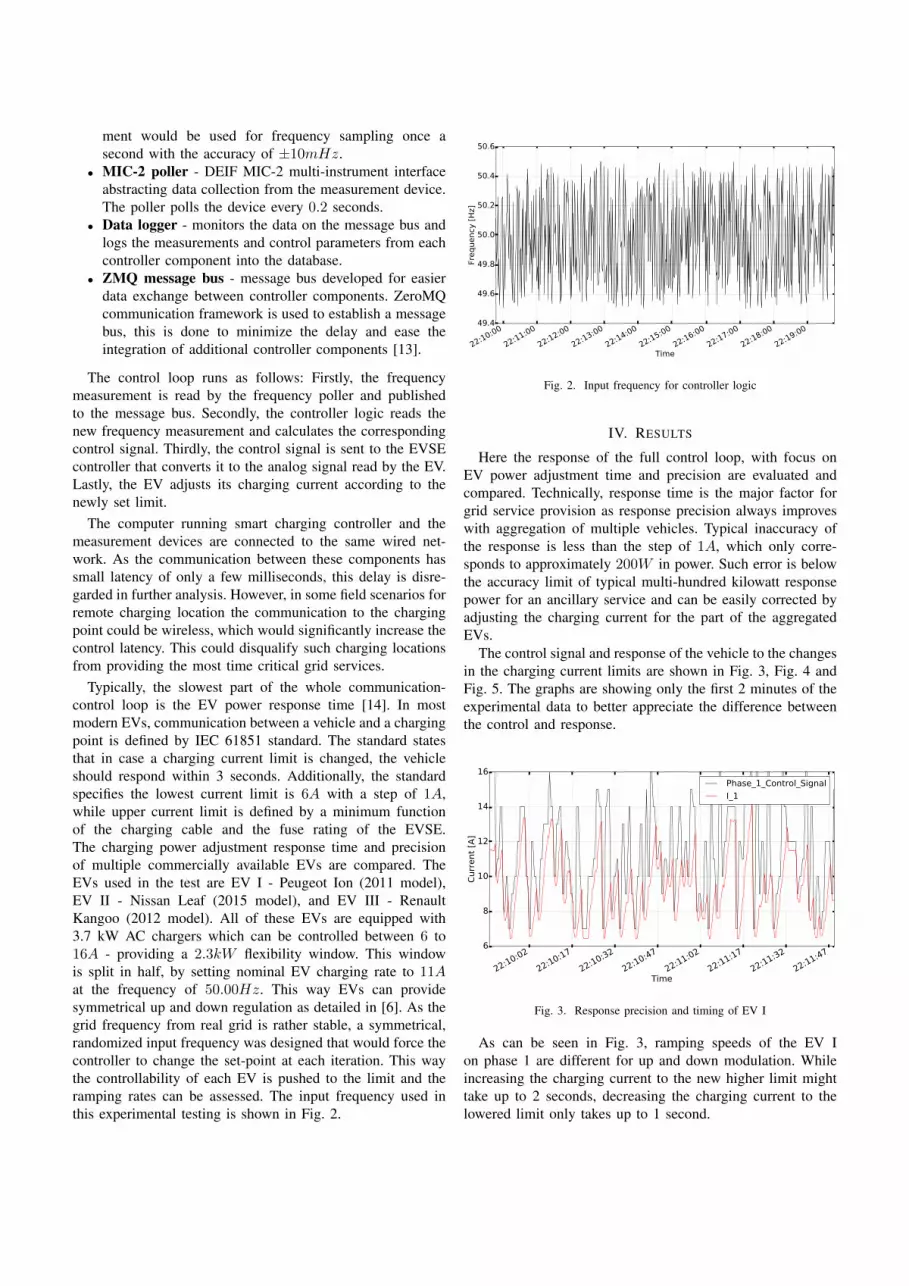
ment would be used for frequency sampling once asecond with the accuracy of ±10mHz.
• MIC-2 poller - DEIF MIC-2 multi-instrument interfaceabstracting data collection from the measurement device.The poller polls the device every 0.2 seconds.
• Data logger - monitors the data on the message bus andlogs the measurements and control parameters from eachcontroller component into the database.
• ZMQ message bus - message bus developed for easierdata exchange between controller components. ZeroMQcommunication framework is used to establish a messagebus, this is done to minimize the delay and ease theintegration of additional controller components [13].
The control loop runs as follows: Firstly, the frequencymeasurement is read by the frequency poller and publishedto the message bus. Secondly, the controller logic reads thenew frequency measurement and calculates the correspondingcontrol signal. Thirdly, the control signal is sent to the EVSEcontroller that converts it to the analog signal read by the EV.Lastly, the EV adjusts its charging current according to thenewly set limit.
The computer running smart charging controller and themeasurement devices are connected to the same wired net-work. As the communication between these components hassmall latency of only a few milliseconds, this delay is disre-garded in further analysis. However, in some field scenarios forremote charging location the communication to the chargingpoint could be wireless, which would significantly increase thecontrol latency. This could disqualify such charging locationsfrom providing the most time critical grid services.
Typically, the slowest part of the whole communication-control loop is the EV power response time [14]. In mostmodern EVs, communication between a vehicle and a chargingpoint is defined by IEC 61851 standard. The standard statesthat in case a charging current limit is changed, the vehicleshould respond within 3 seconds. Additionally, the standardspecifies the lowest current limit is 6A with a step of 1A,while upper current limit is defined by a minimum functionof the charging cable and the fuse rating of the EVSE.The charging power adjustment response time and precisionof multiple commercially available EVs are compared. TheEVs used in the test are EV I - Peugeot Ion (2011 model),EV II - Nissan Leaf (2015 model), and EV III - RenaultKangoo (2012 model). All of these EVs are equipped with3.7 kW AC chargers which can be controlled between 6 to16A - providing a 2.3kW flexibility window. This windowis split in half, by setting nominal EV charging rate to 11Aat the frequency of 50.00Hz. This way EVs can providesymmetrical up and down regulation as detailed in [6]. As thegrid frequency from real grid is rather stable, a symmetrical,randomized input frequency was designed that would force thecontroller to change the set-point at each iteration. This waythe controllability of each EV is pushed to the limit and theramping rates can be assessed. The input frequency used inthis experimental testing is shown in Fig. 2.
22:10:00
22:11:00
22:12:00
22:13:00
22:14:00
22:15:00
22:16:00
22:17:00
22:18:00
22:19:00
Time
49.4
49.6
49.8
50.0
50.2
50.4
50.6
Frequency
[H
z]
Fig. 2. Input frequency for controller logic
IV. RESULTS
Here the response of the full control loop, with focus onEV power adjustment time and precision are evaluated andcompared. Technically, response time is the major factor forgrid service provision as response precision always improveswith aggregation of multiple vehicles. Typical inaccuracy ofthe response is less than the step of 1A, which only corre-sponds to approximately 200W in power. Such error is belowthe accuracy limit of typical multi-hundred kilowatt responsepower for an ancillary service and can be easily corrected byadjusting the charging current for the part of the aggregatedEVs.
The control signal and response of the vehicle to the changesin the charging current limits are shown in Fig. 3, Fig. 4 andFig. 5. The graphs are showing only the first 2 minutes of theexperimental data to better appreciate the difference betweenthe control and response.
22:10:02
22:10:17
22:10:32
22:10:47
22:11:02
22:11:17
22:11:32
22:11:47
Time
6
8
10
12
14
16
Curr
ent
[A]
Phase_1_Control_Signal
I_1
Fig. 3. Response precision and timing of EV I
As can be seen in Fig. 3, ramping speeds of the EV Ion phase 1 are different for up and down modulation. Whileincreasing the charging current to the new higher limit mighttake up to 2 seconds, decreasing the charging current to thelowered limit only takes up to 1 second.
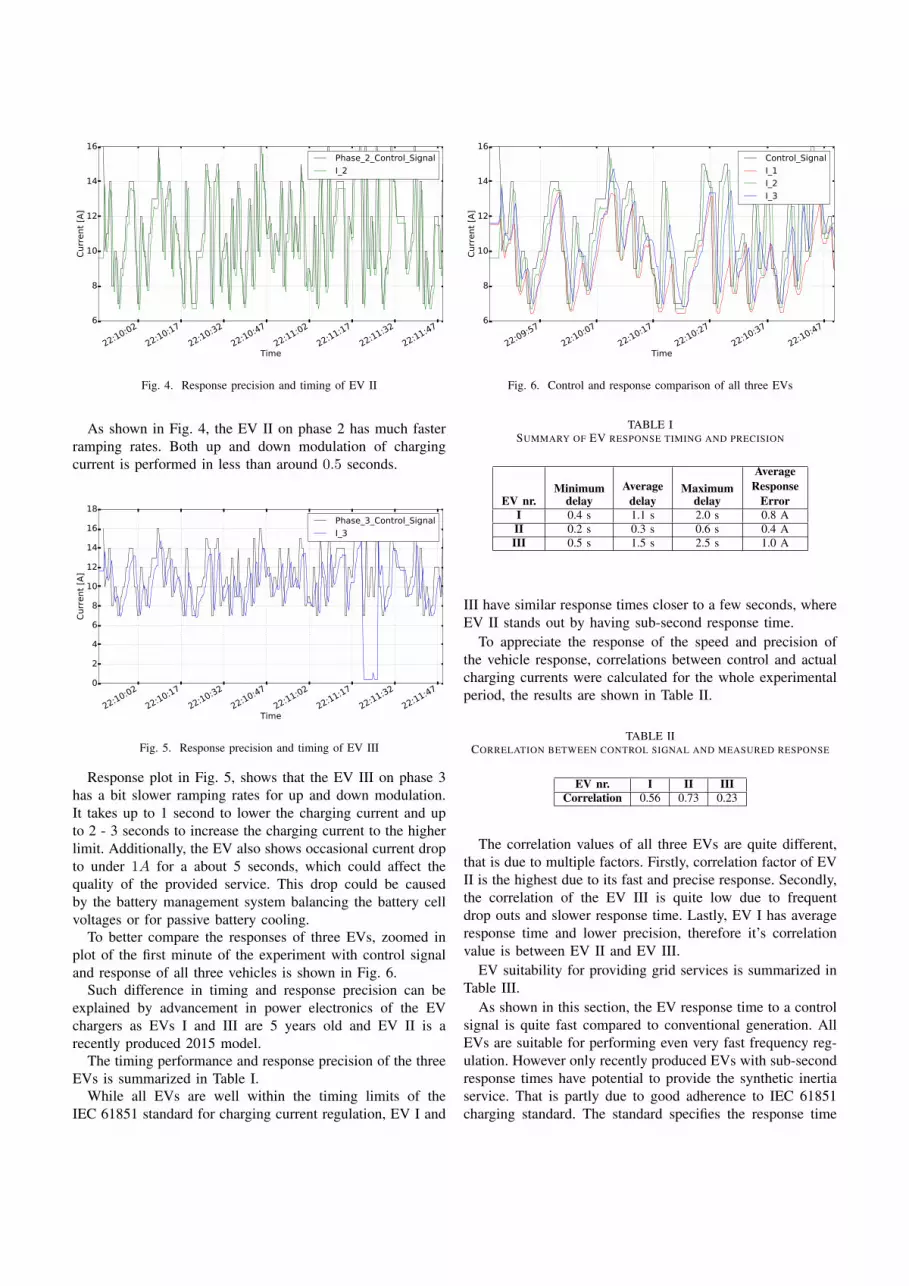
22:10:02
22:10:17
22:10:32
22:10:47
22:11:02
22:11:17
22:11:32
22:11:47
Time
6
8
10
12
14
16
Curr
ent
[A]
Phase_2_Control_Signal
I_2
Fig. 4. Response precision and timing of EV II
As shown in Fig. 4, the EV II on phase 2 has much fasterramping rates. Both up and down modulation of chargingcurrent is performed in less than around 0.5 seconds.
22:10:02
22:10:17
22:10:32
22:10:47
22:11:02
22:11:17
22:11:32
22:11:47
Time
0
2
4
6
8
10
12
14
16
18
Curr
ent
[A]
Phase_3_Control_Signal
I_3
Fig. 5. Response precision and timing of EV III
Response plot in Fig. 5, shows that the EV III on phase 3has a bit slower ramping rates for up and down modulation.It takes up to 1 second to lower the charging current and upto 2 - 3 seconds to increase the charging current to the higherlimit. Additionally, the EV also shows occasional current dropto under 1A for a about 5 seconds, which could affect thequality of the provided service. This drop could be causedby the battery management system balancing the battery cellvoltages or for passive battery cooling.
To better compare the responses of three EVs, zoomed inplot of the first minute of the experiment with control signaland response of all three vehicles is shown in Fig. 6.
Such difference in timing and response precision can beexplained by advancement in power electronics of the EVchargers as EVs I and III are 5 years old and EV II is arecently produced 2015 model.
The timing performance and response precision of the threeEVs is summarized in Table I.
While all EVs are well within the timing limits of theIEC 61851 standard for charging current regulation, EV I and
22:09:57
22:10:07
22:10:17
22:10:27
22:10:37
22:10:47
Time
6
8
10
12
14
16
Curr
ent
[A]
Control_Signal
I_1
I_2
I_3
Fig. 6. Control and response comparison of all three EVs
TABLE ISUMMARY OF EV RESPONSE TIMING AND PRECISION
EV nr.Minimum
delayAverage
delayMaximum
delay
AverageResponse
ErrorI 0.4 s 1.1 s 2.0 s 0.8 AII 0.2 s 0.3 s 0.6 s 0.4 AIII 0.5 s 1.5 s 2.5 s 1.0 A
III have similar response times closer to a few seconds, whereEV II stands out by having sub-second response time.
To appreciate the response of the speed and precision ofthe vehicle response, correlations between control and actualcharging currents were calculated for the whole experimentalperiod, the results are shown in Table II.
TABLE IICORRELATION BETWEEN CONTROL SIGNAL AND MEASURED RESPONSE
EV nr. I II IIICorrelation 0.56 0.73 0.23
The correlation values of all three EVs are quite different,that is due to multiple factors. Firstly, correlation factor of EVII is the highest due to its fast and precise response. Secondly,the correlation of the EV III is quite low due to frequentdrop outs and slower response time. Lastly, EV I has averageresponse time and lower precision, therefore it’s correlationvalue is between EV II and EV III.
EV suitability for providing grid services is summarized inTable III.
As shown in this section, the EV response time to a controlsignal is quite fast compared to conventional generation. AllEVs are suitable for performing even very fast frequency reg-ulation. However only recently produced EVs with sub-secondresponse times have potential to provide the synthetic inertiaservice. That is partly due to good adherence to IEC 61851charging standard. The standard specifies the response time

TABLE IIISUMMARY OF EV ABILITY TO PROVIDE FAST GRID SERVICES
EVnr.
PrimaryReserve(< 15s)
NormalOperation
Reserve(< 150s)
DisturbanceReserve(< 5s)
FastFrequency
Reserve(< 10s)
SyntheticInertia(< 1s)
I + + + + -II + + + + +III + + + + -
to be below 3 seconds, however as shown, recently producedEVs can throttle the charging current in less than a second.
All tests were performed in SYSLAB - a DTU researchfacility for intelligent, active and distributed power systems.SYSLAB is located at DTU Risø campus and is a part of thePowerLabDK experimental facilities.
V. CONCLUSION
This evaluation provides a real analysis of currently avail-able EVs readiness to provide grid services now and in thenear future.
While the response times of the EVs are quite suitableeven for fast grid services, they also have a few problemsthat might influence the quality of the delivered service. Onesuch problem is inability of some EVs to resume the chargingprocess after charging process was interrupted by disablingand re-enabling the charging spot. Some vehicles even requirephysical re-plugging of the charging cable or door openingto continue charging, which interferes with user comfort.Additionally, the speed of re-enabling the charging processis rather slow and takes multiple seconds. Another potentialquality influencing problem is fluctuating undershoot of theEV charging current response to the limit set from the chargingspot, typically the undershooting is up to 1 A.
While proportional control of EV charging according tocontrol input as exemplified in this paper seems to be suit-able for providing grid services it does not account for theefficiency of the EV charger [15]. This can be improvedby charging the bulk of the aggregated EVs at maximumpower and using only a few in proportional control to geta precise aggregated response. Another possible obstacle forgrid service provision is the 6A minimum charging rate asdefined in IEC 61851. If 6A charging rate is too high forsome application, the charging could also be disabled andthen re-enabled when needed. Finally, state of charge (SOC)of the EV should be considered while providing grid servicesfor multiple reasons. Firstly, the charging controller shouldalways allow appropriate time for the EV to charge to thelevel defined by the EV user, before departure time. Secondly,at high values of SOC, typically above 90 % EV batteries startbalancing individual cell voltages, which leads to drop in thecharging current, losing the controllability.
While this work only considered AC charging control,developments are being made to provide grid services usingexternal V2G chargers utilizing the CHAdeMO fast charging
protocol, that was extended to support bidirectional powerflow. In that case the power response depends on the rampingrate of the V2G charger as the EV is only utilized as a battery.Actual barriers for commercial grid service provision, usingAC charging or V2G technology, are incomplete communica-tion protocols that lack information objects or response speedfor this task [10]. An EV communication standard IEC 15118that extends IEC 61851 by adding high level communicationand necessary information objects could enable the EVs toprovide grid services. However, current revisions of the stan-dard specify the response times in tens of seconds, that aretoo slow for providing time critical grid services.
All in all, most EVs are technically capable of provid-ing even most time critical grid services, while commercialapplications still need harmonization in communication andregulatory areas.
REFERENCES
[1] P. Tielens and D. Van Hertem, “Grid inertia and frequency control inpower systems with high penetration of renewables,” Young ResearchersSymposium in Electrical Power Engineering, pp. 1–6, 2012.
[2] A. Ulbig, T. S. Borsche, and G. Andersson, “Impact of low rotationalinertia on power system stability and operation,” IFAC ProceedingsVolumes (ifac-papersonline), Ifac Proceedings Volumes, Ifac Proc. Vol.(ifac-papersonline), vol. 19, pp. 7290–7297, 2014.
[3] G. Delille, B. Francois, and G. Malarange, “Dynamic Frequency ControlSupport by Energy Storage to Reduce the Impact of Wind and SolarGeneration on Isolated Power System’s Inertia,” IEEE Transactions onSustainable Energy, vol. 3, no. 4, pp. 931–939, Oct 2012.
[4] K. Clement-Nyns, E. Haesen, and J. Driesen, “The Impact of ChargingPlug-In Hybrid Electric Vehicles on a Residential Distribution Grid,”Power Systems, IEEE Transactions on, vol. 25, no. 1, pp. 371–380, Feb2010.
[5] W. Kempton and J. Tomic, “Vehicle-to-grid power implementation: Fromstabilizing the grid to supporting large-scale renewable energy,” Journalof Power Sources, vol. 144, no. 1, pp. 280 – 294, 2005.
[6] M. Marinelli, S. Martinenas, K. Knezovic, and P. B. Andersen, “Vali-dating a centralized approach to primary frequency control with series-produced electric vehicles,” Journal of Energy Storage, vol. 7, pp. 63 –73, 2016.
[7] P. Andersen, M. Marinelli, O. Olesen, C. Andersen, G. Poilasne,B. Christensen, and O. Alm, “The nikola project intelligent electricvehicle integration,” Proceedings of ISGT 2014, 2014.
[8] K. Knezovic, M. Marinelli, P. Andersen, and C. Træholt, “Concurrentprovision of frequency regulation and overvoltage support by electricvehicles in a real danish low voltage network,” Proceedings of IEEEInternational Electric Vehicle Conference 2014, 2014.
[9] IEC TC69, “IS 61851-1:2010 Ed. 2.0,” IEC Standard, 2010.[10] S. Martinenas, S. Vandael, P. Andersen, and B. Christensen, “Standards
for EV charging and their usability for providing V2G services in theprimary reserve market,” Proceedings of International Battery, Hybridand Fuel Cell Electric Vehicle Symposium 2016, 2016.
[11] H. Lund and W. Kempton, “Integration of renewable energy into thetransport and electricity sectors through V2G,” Energy Policy, vol. 36,no. 9, pp. 3578 – 3587, 2008.
[12] “Ancillary services to be delivered in Denmark Tender conditions,” Tech.Rep. October, 2012.
[13] P. Hintjens, ZeroMQ: Messaging for Many Applications. O’ReillyMedia, 2013.
[14] S. Martinenas, M. Marinelli, P. Andersen, and C. Træholt, “Implemen-tation and Demonstration of Grid Frequency Support by V2G EnabledElectric Vehicle,” Proceedings of the 49th International UniversitiesPower Engineering Conference (UPEC), 2014, pp. 1–6, 2014.
[15] A. Kieldsen, A. Thingvad, S. Martinenas, and T. Sørensen, “EfficiencyTest Method for Electric Vehicle Chargers,” Proceedings of EVS29 -International Battery, Hybrid and Fuel Cell Electric Vehicle Symposium,2016.

Pub. F. Comparison between SyntheticInertia and Fast Frequency ContainmentControl Based on Single Phase EVs in aMicrogrid
131

Comparison between synthetic inertia and fast frequency containmentcontrol based on single phase EVs in a microgrid
Michel Rezkalla, Antonio Zecchino, Sergejus Martinenas, Alexander M. Prostejovsky, Mattia Marinelli ⇑Center for Electric Power and Energy, Department of Electrical Engineering, Technical University of Denmark, Denmark
h i g h l i g h t s
Enhancing frequency control via small scale distributed energy resources. Analytical interdependency between fast frequency containment and synthetic inertia. System balancing by mean of unidirectional electric vehicles as flexibility resources. Experimental validation of theoretical findings with series produced EVs.
a r t i c l e i n f o
Article history:Received 1 April 2017Received in revised form 1 June 2017Accepted 15 June 2017Available online xxxx
Keywords:Electric vehiclesExperimental validationFrequency containment controlFrequency stabilitySynthetic inertia
a b s t r a c t
The increasing share of distributed and inertia-less resources entails an upsurge in balancing and systemstabilisation services. In particular, the displacement of conventional generation reduces the availablerotational inertia in the power system, leading to high interest in synthetic inertia solutions. The objec-tive of this paper is twofold: first, it aims to implement and validate fast frequency control and synthetic(virtual) inertia control, employing single phase electric vehicles as flexibility resources. Second, it pro-poses a trade-off analysis between the two controllers. The interdependency between frequency contain-ment and synthetic inertia control on the transient frequency variation is shown analytically. Thecapabilities and limits of series produced EVs in providing such services are investigated, first on a sim-ulation based approach and subsequently by using real hardware. The results show that fast frequencycontrol can improve the transient frequency behaviour. However, both on the simulation and on theexperimental level, the implementation of synthetic inertia control is more challenging. In fact, due itsderivative nature and the system dynamics, its performance is limited. Furthermore, the crucial impor-tance of the EVs’ response time for both controllers is highlighted.
2017 Elsevier Ltd. All rights reserved.
1. Introduction
The rising share of inverter-coupled distributed energyresources (DER) raises new challenges in maintaining stable gridoperation. One of the main issues is the reduction of the systeminertia due to the replacement of rotating generators byconverter-connected resources, as well as the expansion of high-voltage direct current (HVDC) connections, which decouples theinertial response between the interconnected areas [1]. Thus, thesystem’s ability to withstand frequency changes by releasing orabsorbing the energy stored in the rotating masses is notablyreduced, leading to faster frequency dynamics [2]. Moreover, thehigh volatility of renewable energy sources (RES) contributes tothe frequency stability issue by changing the grid inertia over time
and increasing the need for better planning due to higheruncertainty.
Inertia is the parameter that represents the capability of rotat-ing machines (including loads, when applicable) to store and injecttheir kinetic energy into the system [3]. The amount of inertiainfluences the frequency gradient, which is generally addressedas the rate of change of frequency (RoCoF) and the transient fre-quency values during a system incident. The RoCoF and the tran-sient frequency values have a fundamental role in maintainingand operating the power system in a secure state. A large RoCoFand/or transient frequency deviations can lead to the automatictripping of conventional generators and DER units [4] because theyare connected to the grid by means of RoCoF or frequency relays[3]. The RoCoF relay limit is established by the grid code, whichvaries among countries.
Several transmission system operators (TSOs) have started toaddress this challenge, recognising the potential value of the
http://dx.doi.org/10.1016/j.apenergy.2017.06.0510306-2619/ 2017 Elsevier Ltd. All rights reserved.
⇑ Corresponding author.E-mail address: [email protected] (M. Marinelli).
Applied Energy xxx (2017) xxx–xxx
Contents lists available at ScienceDirect
Applied Energy
journal homepage: www.elsevier .com/locate /apenergy
Please cite this article in press as: Rezkalla M et al. Comparison between synthetic inertia and fast frequency containment control based on single phaseEVs in a microgrid. Appl Energy (2017), http://dx.doi.org/10.1016/j.apenergy.2017.06.051

inertial response of wind power plants, synchronous condensers,and synthetic inertia [5,6]. One of the main concerns of TSOs isthe RoCoF, which might lead to a cascade tripping of conventionaland DER units connected by means of RoCoF relays [4,7]. Accordingto [8], an RoCoF relay has a typical delay in the range of 50 ms to500 ms.
Further, the growing number of electric vehicles (EVs) has con-cerned distribution system operators (DSOs). The uncertainty of EVdriving patterns, high penetration levels and charging in the distri-bution network could result in new system peaks and negative dis-tribution system impacts, exceeding the load capacities ofdistribution lines and transformers [9,10].
The effects of EVs on future power systems are investigatedin several studies, such as in [11,12]. In [11], the negative effectsof uncoordinated charging of EVs on the power system wasaddressed. The authors presented the impacts that EV chargingcan have in an actual working wholesale electricity market. In[12] it was analysed how a large scale implementation of plug-in hybrid electric vehicles and full electric vehicles would influ-ence the power system. This study shows that smart manage-ment of EVs bidirectional charging can alleviate peak powerdemand.
On the other hand, unscheduled high penetration of EVs mayhave detrimental effects on power system performance. Reliabilityand stability are the aspects of the grid that face the most chal-lenges when EVs are used widely. Consequently, there is an exigentneed to predict the EVs’ customers in order to avoid irreparableeffects, especially for the distribution network. Several studieshave investigated these challenges, such as in [13,14]. In [13] theauthors propose a simultaneous approach for allocation of EV park-ing lots and DRRs in a power distribution network to achieve amore reliable supply of the load demand. A probabilistic modellingof EVs’ charging demand is presented in [14].
A noticeable amount of research has focused on the transitionfrom the traditional system, where frequency is controlled by asmall set of large generating units, to the future where it is con-trolled by a vast amount of small distributed resources [15,16].
Given that EVs are essentially battery storages with a seconds-range response time, the TSO can greatly benefit from EV participa-tion in frequency service provision. As analysed in [17], EV partic-ipation in the ancillary service market appears to be one of themost promising applications because it can offer substantial earn-ings to EV aggregators and EV owners. Ref. [18] concluded thatalthough V2G capable EVs can provide great benefits to the ancil-lary service market, battery degradation may represent a challengefor their viability [19,20].
EVs are able to provide fast regulating power bidirectionallyusing Vehicle-to-Grid or just by modulating the charging power
unidirectionally [21,22]. In this context, EVs can play a fundamen-tal role in the future ancillary service market. Although the poten-tial benefits of exploiting the V2G capability for ancillary serviceswas introduced in [23], this study did not investigate uni-direction EVs charging in providing such services.
Due to the reduced system inertia, various studies have shownthe techno-economic benefits and challenges of primary frequencyprovision from EVs, such as in [24–26]. In [24] the authors presentthe impact of declining system inertia on the primary frequencycontrol (PFC) and future requirements. It also presents the impactof PFC provision from EVs on the system frequency performance. In[25] the authors present the general ability of EV fleets to utilizefluctuating renewable energy sources for charging and their effectson the power system. The authors in [26] summarise the chal-lenges to control a system with low inertia. In this study, unlikein [11,12,23], EVs have been controlled by only modulating thecharging current between 6 and 16 A with steps of 1 A to complywith the technical constraints imposed by the IEC 61851 standard[27,28].
Simultaneously, very few studies have investigated the EV’sability in providing synthetic inertia services. In [29] the authorspresented a single-phase virtual synchronous machine (VSM) andits possible application for providing V2G services from an EV’sbatteries, this work was supported by an experimental setup thatis based on the Opal-RT platform. In contrast, this paper presentsa different approach in providing synthetic inertia services sup-ported by an experimental investigation using series produced EVs.
The scope of this study is twofold: First, the EV’s capabilities asflexibility resources are investigated. In particular, this study looksat synthetic inertia control (SIC) and frequency containment con-trol (FCC) as exemplary services. Second, it analyses and evaluatesthe pros and cons of SIC and FCC on the frequency dynamics (e.g.RoCoF and frequency nadir and zenith). The general objective isto determine if SIC and FCC delivered by converter connectedresources, which are relatively fast compared to conventionalunits, can replace or at least reduce the need for a conventionalinertial response.
Ultimately, the research question that this study addresses is:given the trend of decreasing system inertia, can fast frequency con-tainment compensate or replace the need for synthetic inertia?
The method and the results presented in this study are part ofthe EU-funded project ELECTRA IRP, which proposes novel fre-quency and voltage control concepts to maintain and operate thepower system in a secure state [30]. It considers the grid inertia(i.e. the synchronous and synthetic inertia) to be an active part ofthe frequency control process and it is addressed by inertiaresponse power control (IRPC). In this study, the synthetic inertiais considered to be an active part of the IRPC process.
Nomenclature
TD frequency dependent loadsTFCC electric torque of devices participating in FCCTSIC electric torque of devices participating in SICd electrical rotor angled0 rotor angle at t = 0xe angular velocity of the electrical rotorxm angular velocityx0m rated angular velocityf frequencyH kinetic energy in Watt-per-seconds at rated speedI EV absorbed current
J moment of inertiaKD load damping factorKFCC FCC proportional control coefficientKSIC SIC proportional control coefficientP EV absorbed active powerp number of pole pairsSb generator’s rated powert timeTa acceleration or deceleration torqueTe electrical torqueTm mechanical torque
2 M. Rezkalla et al. / Applied Energy xxx (2017) xxx–xxx
Please cite this article in press as: Rezkalla M et al. Comparison between synthetic inertia and fast frequency containment control based on single phaseEVs in a microgrid. Appl Energy (2017), http://dx.doi.org/10.1016/j.apenergy.2017.06.051

This paper is divided into the following five sections: Section 2presents the frequency control in Europe and the analytical inter-dependency between frequency containment and synthetic inertia.Section 3 presents the frequency containment and the syntheticinertia controllers, the EV dynamic model and the experimentallayout. The simulations and experimental results are shown anddiscussed in Section 4. Lastly, Section 5 presents the conclusionsand it outlines future research points.
2. Frequency control in Europe and analytical formulation
This section presents a summary of the current framework forfrequency control in Europe and it gives an overview of syntheticinertia and frequency assessment.
2.1. Framework for frequency control in Europe
Based on the network code that was defined by the EuropeanNetwork of Transmission System Operators for Electricity(ENTSO-E), frequency control is divided into the following threephases: (i) Primary frequency control, (ii) Secondary power-frequency control, and (iii) Tertiary control. ENTSO-E refers tothe reserves for frequency control as operating reserves, and itspecifically indicates the previously mentioned controls, respec-tively, as: (i) Frequency Containment Reserves (FCR), (ii) FrequencyRestoration Reserves (FRR), and (iii) Replacement Reserves (RR).
The frequency containment stabilises the frequency, after a dis-turbance, at a steady-state value within the permissible maximumsteady-state frequency deviation. This is done by a joint action ofFCR within the synchronous area [31]. The frequency restorationprocess controls the frequency towards its set-point value by acti-vation of FRR and it replaces the activated FCR. The reserve replace-ment process replaces the activated FRR and/or supports the FRRactivation by activation of RR. One can notice that the inertialresponse is considered to be a natural characteristic of the powersystem.
2.2. Analytical interdependency between frequency containment andsynthetic inertia
According to IEEE/CIGRE task force, frequency stability is theability of the power system to maintain steady state frequency fol-lowing a severe system upset, resulting in a significant imbalancebetween generation and load [32]. Frequency stability dependson the system’s ability to restore the equilibrium between genera-tion and load demand.
During any disturbance that causes an imbalance between thetorques acting on the rotor (i.e. active power imbalance betweengeneration and consumption), the net torque causing accelerationor deceleration is Ta ¼ Tm Te, where Tm is the mechanical torqueapplied on the rotor, Te is the electrical torque on the rotor. Thesimplest model of electro-mechanical swings in a power systemis based on the so called swing equation:
Ta ¼ Tm Te ¼ Jdxm
dtð1Þ
where J is the combined moment of inertia of the generator and theturbine (kg m2), and xm is the angular velocity of the rotor (rad/s).
Following an imbalance between the torques (i.e. imbalancebetween generation and demand), the kinetic energy stored inthe rotating masses of the generator and the prime mover isreleased. The kinetic energy at rated speed is expressed asEkin ¼ 1
2 Jx20m, where x0m is the rated angular velocity [33]. By nor-
malising the previous equation in terms of the rated power of the
generator Sb, the inertia constant H can be defined as the kineticenergy in Watt-per-seconds at rated speed:
H ¼ Jx20m
2Sb) J ¼ 2HSb
x20m
ð2Þ
Eq. (1) can be reformulated as:
Tm Te
Sb=x0m¼ 2H
ddt
xm
x0m
ð3Þ
Since SB=x0m is the base torque Tbase, the (3) can be expressed inp.u. as:
Tm Te ¼ 2Hd xr
dtð4Þ
xr ¼ xm
x0m¼ xe=px0=p
¼ xe
x0¼ xe ð5Þ
where xe is the angular velocity of the electrical rotor, x0 is therated one and p is the number of pole pairs.
The previous equations can be reformulated in terms of theelectrical rotor angle. Assuming d as the electrical rotor angle withrespect to a synchronously rotating reference and d0 is the rotorangle at t = 0, d can be formulated as:
d ¼ xet x0t þ d0 ð6ÞTherefore, the first and second derivatives of (6) are:
dddt
¼ xe x0 ¼ Dxe ð7Þd2d
dt2¼ dxe
dt¼ x0
d xr
dtð8Þ
Eq. (1) can be reformulated in terms of the rotor angle:
Tm Te ¼ 2Hx0
d2d
dt2ð9Þ
Reformulating (9) in terms of xe:
Tm Te ¼ 2Hd xe
dtð10Þ
Assuming that Tm is constant and that the frequency regulationis only from the load side, then one can assume that Te is composedby: the frequency dependent loads (TD), devices participating inFCC (TFCC) and devices participating in SIC (TSIC):
Te ¼ TD þ TFCC þ TSIC ð11Þwhere each is composed by a base value and frequency dependentvalue:
TD ¼ TD0 þ KDD xe ð12ÞTFCC ¼ TFCC0 þ KFCCD xe ð13ÞTSIC ¼ TSIC0 þ KSIC
d xe
dtð14Þ
TD0 ;TFCC0 and TSIC0 represent the base electric torques in steady state
and is addressed further as Te0 ¼ TD0 þ TFCC0 þ TSIC0 . KD is a dampingfactor in pu, which considers the electrical loads which change theactive power consumption due to frequency changes.KFCC ¼ KFCCðt t0Þ is the FCC proportional control coefficient.KSIC ¼ KSICðt t0Þ is the SIC proportional control coefficient. KFCC
and KSIC are represented in function of the time to represent thetime required from those devices to get activated (i.e. time delay).Therefore, the swing equation can be formulated as:
Tm Te0 ¼ ð2H þ KSICÞdxe
dtþ ðKD þ KFCCÞD xe ð15Þ
M. Rezkalla et al. / Applied Energy xxx (2017) xxx–xxx 3
Please cite this article in press as: Rezkalla M et al. Comparison between synthetic inertia and fast frequency containment control based on single phaseEVs in a microgrid. Appl Energy (2017), http://dx.doi.org/10.1016/j.apenergy.2017.06.051

Eq. (15) can be expressed as a function of d xedt and D xe:
d xe
dt¼
Tm Te0 ðKD þ KFCCÞD xe
2H þ KSICð16Þ
D xe ¼Tm Te0 ð2H þ KSICÞ d xe
dt
KD þ KFCCð17Þ
From (16), one can notice that FCC and SIC can affect the RoCoFvariation during a transient. Meanwhile, (17) shows that the fre-quency deviation from steady state can be affected by introducingSIC and FCC. In this regard, the following investigation aims toassess the effects of the two controllers on frequency and RoCoF,by means of simulations and experimental validation.
3. Methodology
In this section, the mathematical formulation and characteristicof the implemented controllers as well as the experimental layoutis presented.
3.1. Frequency containment control
Frequency containment control (FCC) is achieved by a jointaction of FCC providing units within the whole synchronous areawith respect to the frequency deviation. Generally, it is achievedusing droop controllers, so that governors operating in parallelcan share the load variation according to their rated power. Thedroop of the generator represents the ratio of frequency deviationto change in power output. The frequency variation, Df , referred tothe nominal frequency of the system and is given as a function ofthe relative power change DP or current change DI reported tothe nominal machine power or current, respectively.
ðaÞ 1KFCC
¼ Df=f nomDP=Pnom
; ðbÞ 1KFCC
¼ Df=f nomDI=Inom
ð18Þ
For example, a 5% droop ( 1KFCC
) means that a 5% frequency devi-
ation causes 100% change in valve position or power output.In this study, EVs are used to provide frequency support in
terms of FCC by modulating the EV’s charging current. Defining adroop value for loads may not be straightforward because thenominal power may not always be determined unequivocally. Tocomply with the IEC 61851 standard, the EV’s charging currentcan be modulated with a granularity of 1 A, and in this casebetween 6 and 16 A. This available range of regulating current of10 A has been assumed as the EV’s Inom [34]. EV charging is con-trolled by charging controller with a 8% frequency-current droopwith frequency limits of 48–52 Hz.
The droop is presented in Fig. 1a, where the dash line representsthe ideal droop and the solid line represents the real droop with1 A granularity. To have an up and down regulation capability of5 A, the EV’s initial current set-point is set at 11 A. Due to the1 A granularity and the established operating point, the EV’s cur-rent set-point oscillated between 11 and 12 A. To avoid this oscil-lation, the droop characteristic was shifted; so that the frequencylimits became 48.2–52.2 Hz. The control diagram for the FCC ispresented in Fig. 2a. Following various experiments, it was noticedthat the EV’s current was under-shooting [22]. To compensate forthis phenomena, it has been used the ceil function for the differentcontrollers instead of the rounding.
3.2. Synthetic inertia control
Although no direct coupling from converter connected genera-tors to the grid is made, a large amount of kinetic energy is storedin these units (e.g. kinetic energy stored in a wind turbine’s bladesand gearbox). Together with different forms of energy storage inother units, this can be used to deliver synthetic inertia. This meansthat these units could mimic synchronous generators by deliveringan active power response that is proportional to the RoCoF [35,36].
A synthetic inertia controller (SIC) is implemented in this study,the control diagram is presented in Fig. 2b. The RoCoF is measuredover 200 ms. This unit controls the EV’s charging current as a func-tion of a RoCoF-current droop characteristic. The droop is shown inFig. 1b, the dashed line represents the ideal droop and the solid linerepresents the 1 A granularity. The droop is implemented by defin-ing the RoCoF’s low and high limits, with zero RoCoF correspondingto 11 A. The deadband of ±0.8 Hz/s was introduced during the tun-ing phase where smaller deadband values have led to frequencyoscillation. Therefore, it results in a very limited contribution fromthe EVs.
3.3. EV dynamic model
To successfully integrate EVs into power systems, it is necessaryto correctly understand and characterise their dynamic behaviour.A detailed model is, therefore, derived considering the EV users’driving requirements, the battery charging and discharging charac-teristics, the battery dynamics (e.g. time response, ramping time,etc.) and the control/communication delays.
Since this study aims to investigate the EV’s capabilities andlimits in providing fast primary control and synthetic inertia con-trol, the battery charge state was neglected. The EV model is pre-sented in Fig. 3. From the dynamic point of view, it is possible toidentify twomain latencies between the set and the actual current:
47 48 49 50 51 52 536
7
8
9
10
11
12
13
14
15
16a)
Frequency (Hz)
EV
current(A
)
Ideal droop
Real droop
−2.5−2−1.5−1−0.5 0 0.5 1 1.5 2 2.56
7
8
9
10
11
12
13
14
15
16b)
RoCoF (Hz/s)
EV
current(A
)
Ideal droop
Real droop
Fig. 1. (a) FCC droop characteristic, (b) SIC droop characteristic.
4 M. Rezkalla et al. / Applied Energy xxx (2017) xxx–xxx
Please cite this article in press as: Rezkalla M et al. Comparison between synthetic inertia and fast frequency containment control based on single phaseEVs in a microgrid. Appl Energy (2017), http://dx.doi.org/10.1016/j.apenergy.2017.06.051

specifically, a communication delay and the EV activation delay,the sum of which varies between 150 ms and 2 s. The communica-tion delay depends mainly on latencies in the IT infrastructure,which is in the range of tens of milliseconds. The EV activationdelay varies among brands and heavily depends on the embeddedpower electronics. The most recent models show a faster responsetime. In any case, the current standard IEC61851 solely requiresthe car to respond within 3 s. The total delay observed in theexperimental trials ranges between 200 and 400 ms. Therefore, inthe simulation study the total delay is considered to be 250 ms.As a final note with respect to the voltage dependency, the EVsare modelled as constant current loads.
3.4. Experimental layout and power components
The experiments are executed in the experimental infrastruc-ture SYSLAB, which is part of the PowerLabDK platform. SYSLABrepresents a small scale low voltage power system. It consists ofa number of real power components that are interconnected by athree-phase 400 V AC power grid, which is distributed over theRisø campus of the Technical University of Denmark [28]. SYSLABis also characterised by its communication and control nodes,which allow a strong controllability over the grid. The systemmay be connected to the utility or it can be islanded if desired.The experimental layout is shown in Fig. 4.
The experimental setup is composed by two busbars that areconnected by 675 m underground cable. The VRB is connected tobusbar 2 and installed in building 2 where the busbar is located.The rest of the components are connected to busbar 1 and theyare installed in the same building as the busbar. The Aircon windturbine is installed around 10 m from building 1. The VRB, the Air-con and the Dump load are controlled through a Matlab/Java inter-face, while the EVs are controlled through a Python interface. Giventhat all of the components are 3-phase except the EVs, it has beennecessary to create an intermediate phase splitter. Each EV is sup-plied on a different phase via a standard Mennekes (IEC 62196Type 2) connector. The three Mennekes plugs are controlled sepa-rately by three different pieces of electric vehicle supply equip-ment (EVSE).
The experiments are executed in an islanded configurationwhere the diesel generator-set acts as the grid forming unit andis the only synchronous inertia device. It also compensates forthe small amount of reactive power drawn by each EV, correspond-ing to 200 VAr each. The different components used during theexperiment are listed in Table 1 where P0 is the base operatingpoint. SC1 and SC2 refer to Study Case 1 and Study Case 2,respectively.
3.5. EV charging controller and communication architecture
Each of the 3 single phase EVs is connected to a different phaseof the grid by means of three EVSE. The control and communicationsetup is shown in Fig. 5.
This consists of the following components:
The smart charging controller – receives the measurementsfrom the multi-instrument, it calculates the response and itsends control signals to the EVSE.
DEIF MIC-2 – is a multi-instrument measurement device thatshows the voltage, current and power measurements with0.5% accuracy. The device is only used for data logging.
DEIF MTR-3 – is a multi-instrument measurement device that isused here for fast frequency measurements, which are polledevery 200 ms.
EVSE – is rated for 16 A EV – is the tested vehicle. Grid – is the grid connection at the SYSLAB experimentalfacility.
a) Δff KFCC
fref
+- EVSEIlimitsGrid ++ΔI
Iref
I = I Imin≤ I≤ImaxI I
fGrid f(t)-f(t-Δt)Δt
= , if 0, otherwise
Δf/Δt KSICΔf/Δt ++
Iref
ΔI
b)
ΔfΔt
ΔfΔtΔf
Δt* *≥ th
EVSEIlimitsI = I Imin≤ I≤ImaxI
Fig. 2. (a) FCC control diagram, (b) SIC control diagram.
Ilimits Ilimits(t-t0)
V
Communication delay
EV activation delay
Voltage measurment
EV
Ilimits(t-t0)Ilimits P = Ilimits*VIlimits
Fig. 3. EV dynamic model.
Fig. 4. Experimental layout.
M. Rezkalla et al. / Applied Energy xxx (2017) xxx–xxx 5
Please cite this article in press as: Rezkalla M et al. Comparison between synthetic inertia and fast frequency containment control based on single phaseEVs in a microgrid. Appl Energy (2017), http://dx.doi.org/10.1016/j.apenergy.2017.06.051

The smart charging controller consists of many sub-components, as follows:
Controller logic – reads the latest frequency measurementsfrom the message bus and calculates the Df /Dt and the Df . Cal-culated set-points are directly sent to the EVSE controller.
EVSE controller – acts as an interface between the physical EVSEand the controller logic.
Frequency poller – acts as an interface to the frequency mea-surement device. In this case DEIF MTR-3 instrument used forfrequency sampling every 0.2 s with accuracy of 10 mHz.
MIC-2 poller – multi instrument device interface. Data logger – monitors the data exchange on the message busand logs it to the database.
ZMQmessage bus – is the message bus that is used to representthe data exchange between the previously mentioned controllercomponents.
The timing of the response is crucial for the provision of syn-thetic inertia. Therefore, the timing of each component in the con-trol loop is important: frequency and RoCoF are measured every200 ms, the controllers’ response is almost instantaneous and com-munication delay (10–20 ms) to each EV/EVSE pair is optimised bycontrolling them independently. It uses multi-threading and eachEVSE only receives a new control signal if the set-point has chan-ged. Finally, the EV’s reaction time is approximately 200–300 ms
and, therefore, the whole control and actuator chain has an overalllatency equal to 400–500 ms. According to this number, it isexpected that the device could positively influence the whole fre-quency dynamic.
4. Results and discussion
This section is composed by two subsections, in which the sim-ulations and experimental validation are presented. Two studycases are analysed. In the first study case (SC1), the system is stud-ied involving a set of load steps. An alternate load-increase andload-decrease are applied, so that both over and under frequencydynamics can be analysed. In the second study case (SC2), windpower generation is added to the system. It adds random powerfluctuations over the tested period and it allows the possibility ofinvestigating the behaviour of the two controllers and the EVs ina more realistic and challenging situation.
The two study cases are each composed of three scenarios: inthe first scenario, the EVs are treated as a constant load; that is,constant current set-point equal to 11 A (Base scenario). In the sec-ond scenario, the EVs participate with a synthetic inertia response;that is, SIC. In the third scenario, the EVs participate with a fast fre-quency response; that is, FCC. An overview of the different scenar-ios is given in Table 2. During the simulation, only SC1 wasanalysed.
4.1. Simulations
In this section a simulation study in DigSilent PowerFactory iscarried out. It aims to investigate the effects of synthetic inertiacontrol and frequency containment control, and it aims to achievepreliminary results before experimentally validating the con-trollers. To explore the effects of the 1 A granularity that isimposed by the standard, a sensitivity analysis of different granu-larity values is conducted.
The same components and grid configuration that are presentedin Fig. 4 have been modelled, with the operating conditions of SC1,as shown in Table 1.
To make this study as realistic as possible, an oscillatory fre-quency has been induced in the system by means of a fictitiouszero-mean variable load by means of fluctuating active powerabsorbed by the three-phase resistive load. In this way, it has been
Table 1Properties of the devices used in the experiments.
Device Capability P0 (kW) SC1 P0 (kW) SC2 Description
Diesel 0–48 kW 24 24 IVECO genset20–30 kVAr S = 60 kVA, 2 pole pairs
Aircon 10 kW @ 11 ms – 4 Wind turbine type 4Battery 15 kW 9 – Vanadium redox battery, 120 kW h
12 kVADumpload 0–78 kW 7 21 Resistor load bankEV1 6–16 A 2.5 2.5 Nissan leaf 2016, 30 kW h lithium battery
(1.4–3.7 kW)EV2 6–16 A 2.5 2.5 Nissan e-NV200 2014, 24 kW h lithium battery
(1.4–3.7 kW)EV3 6–16 A 2.5 2.5 Nissan e-NV200 2015, 24 kW h lithium battery
(1.4–3.7 kW)
Fig. 5. The communication architecture for the implemented smart chargingcontroller.
Table 2Study cases overview.
Study Case 1 Study Case 2
Scenario 1 Base case Base case + WindScenario 2 SIC SIC + WindScenario 3 FCC FCC + Wind
6 M. Rezkalla et al. / Applied Energy xxx (2017) xxx–xxx
Please cite this article in press as: Rezkalla M et al. Comparison between synthetic inertia and fast frequency containment control based on single phaseEVs in a microgrid. Appl Energy (2017), http://dx.doi.org/10.1016/j.apenergy.2017.06.051

possible to emulate the realistic frequency oscillation that the realdiesel synchronous generator would generate in such an islandedgrid configuration.
First, a load event with amplitude of 2 kW (8.7% of the total con-sumption) is applied at t ¼ 10 s and three scenarios are analysed.The first scenario is considered as a base case where the EVs aretreated as a constant load; that is, constant current set-point equalto 11 A. In the second scenario, the EVs participate with a SIC. Inthe third scenario, the EVs are equipped with the FCC controller.Both the SIC and FCC controllers are implemented according tothe control diagrams in Fig. 2, thus applying integer EV currentset-points to assure standard-compliance. Fig. 6 shows the grid fre-quency, the RoCoF and the EVs’ current set-point.
As expected, Fig. 6a shows that FCC improves the frequencybehaviour in terms of frequency nadir and steady state value. Italso shows that SIC ameliorates the frequency slope, which is atypical behaviour of introducing more synchronous and/or syn-thetic inertia into the system. On the other hand, unexpectedly,Fig. 6b shows that FCC has a better performance in terms of RoCoFcompared to SIC.
However, a steeper droop and/or smaller deadband for SICwould have led to better performance regarding the RoCoF andthe frequency slope. To demonstrate this point, the same simula-tions were executed changing the deadband of SIC to 0:5 Hzinstead of 0:8 Hz. The results are presented in Fig. 7.
Fig. 7a shows an improvement regarding the frequency slopecompared to the previous case. On the other hand, Fig. 7b showsa marginal improvement regarding the RoCoF. Compared to theprevious scenario, Fig. 7c shows that the EVs were participatingmore by changing the current set-point.
A sensitivity analysis is performed to better understand theeffects of the 1 A granularity imposed by the standard IEC 61851[27] on the performance of the two controllers. A series of simula-tions are carried out employing different load steps and differentgranularities. Frequency drops have been obtained by increasingthe active power absorbed by the VRB by 20%, 40%, and 60%. Theyrepresent a load event of 8.7%, 15.7% and 23.5% of the total con-sumption, respectively. For the evaluation of the influence of thegranularity, the following values of granularity have been applied,which are expressed as fraction of the actual granularity of 1 A: 1
4 ;12
and 1. Moreover, for the sake of completeness, the case of contin-uous regulation (no granularity) and the uncontrolled case havealso been included in the analysis.
Fig. 8 reports 3D bar plots of the results for all of the performedsimulations. The results are reported by means of standard devia-tions (SD) for both Frequency and RoCoF for FCC and SIC.
As expected, Fig. 8 shows that in all of the cases the standarddeviations depend on the size of the load step. On one hand, theyare mostly constant for the different considered granularity, onthe other hand higher values are found in the uncontrolled cases.Moreover, it is noticeable that beneficial effects on the frequencyare found in case of FCC. As presented in Fig. 6, the EVs’ effectmakes the frequency rise to a higher steady-state value. Mean-while, the SIC controller has an embedded reset logic, which makesthe EV set-point go back to 11 A right after the event. It is of inter-est to highlight that the FCC shows an unexpected better contribu-tion to the RoCoF limitation in comparison to the SIC. This is due tothe limited number of control actions that took place in case of SIC,which is due to the implemented RoCoF deadband (Fig. 1b).Instead, when providing primary regulation via FCC, no deadbandis applied, which activates the controller more often, thus con-tributing more to the RoCoF containment.
This sensitivity analysis shows that, in this islanded microgrid,the granularity does not influence the results. However, one shouldnote that under a certain combination of system attributes (systeminertia and stiffness of the power system) and control units(amount of power involved in the regulation, droop, response/ramp time and granularity of the control actions), the granularitymight lead to system instability or oscillation between two conse-quent set-points, as was experienced during the validation phase.
4.2. Experimental validation
Following the results obtained during the simulations, theauthors investigate the EVs capability to provide synthetic inertiaand frequency containment control in an islanded grid in real cir-cumstances. The experiments are executed in the islanded config-uration that is shown in Fig. 4, where the diesel is the grid formingunit.
48.5
49
49.5
50
50.5
a)
Freq(H
z)
−1.5
−1
−0.5
0
0.5
b)
RoC
oF(H
z/s)
0 2.5 5 7.5 10 12.5 15 17.5 20 22.5 25 27.5 309
10
11
12
c)
Time (s)
Current(A
) Base SIC FCC
Fig. 6. Simulation results obtained by applying ±0.8 Hz/s deadband for SIC: (a) Frequency, (b) RoCoF and (c) EV current set-points for the three analysed scenarios, in case ofgranularity of 1 A.
M. Rezkalla et al. / Applied Energy xxx (2017) xxx–xxx 7
Please cite this article in press as: Rezkalla M et al. Comparison between synthetic inertia and fast frequency containment control based on single phaseEVs in a microgrid. Appl Energy (2017), http://dx.doi.org/10.1016/j.apenergy.2017.06.051

4.3. Study Case 1
In the first study case, the frequency variation is triggered byseveral load steps. A set of load events from the VRB of the sameamplitude is applied ( ±2 kW), namely, 8.7% of the initial installedload. To better investigate the controllers as well as the frequencydynamics, an additional set of load events with a different ampli-tude is applied, specifically ( ±4 kW), 17% of the initial installedload. The grid units as well as the initial conditions are reportedin Table 1.
The three scenarios are characterised by the same initial con-ditions and load steps. The first scenario (S1) is a base case, inwhich the EVs receive a constant current set-point; that is, 11 Aabsorbing around 2.5 kW. In the second scenario (S2), the EVsare controlled by the synthetic inertia controller, which modu-lates the charging level between 6 and 16 A with steps of 1 A infunction of the RoCoF-current droop characteristic presented inFig. 1b. In the third scenario (S3), the EVs are controlled by thefrequency containment controller. The controller modulates theEVs’ charging level between 6 and 16 A with steps of 1 A in
48.549
49.5
50
50.5
Freq
eunc
y (H
z)
a)
-1.5-1
-0.50
0.5R
oCoF
(Hz/
s)
b)
0 2.5 5 7.5 10 12.5 15 17.5 20 22.5 25 27.5 30Time (s)
9
10
11
12
Cur
rent
(A)
c)
Base SIC FCC
Fig. 7. Simulation results obtained by applying ±0.5 Hz/s deadband for SIC: (a) Frequency, (b) RoCoF and (c) EV current set-points for the three analysed scenarios, in case ofgranularity of 1 A.
00.20.40.60.8
No Ctrl
11.2
continuos
1.4
1/4
SD Frequency - SIC
1/260%1 40%
20%
a)
0
0.2
0.4
0.6
0.8
1
1.2
1.4
00.20.40.60.8
No Ctrl
11.2
continuos
1.4
1/4
SD Frequency - FCC
1/260%1 40%
20%
b)
0
0.2
0.4
0.6
0.8
1
1.2
1.4
00.10.20.3
No Ctrl
0.40.5
continuos
0.6
1/4
SD RoCoF - SIC
1/260%1 40%
20%
c)
0
0.1
0.2
0.3
0.4
0.5
0.6
00.10.20.3
No Ctrl
0.40.5
continuos
0.6
1/4
SD RoCoF - FCC
1/260%1 40%
20%
d)
0
0.1
0.2
0.3
0.4
0.5
0.6
Fig. 8. (a) SD of the frequency applying SIC and (b) SD of the frequency applying FCC, (c) SD of the RoCoF applying SIC, (d) SD of the RoCoF applying FCC.
8 M. Rezkalla et al. / Applied Energy xxx (2017) xxx–xxx
Please cite this article in press as: Rezkalla M et al. Comparison between synthetic inertia and fast frequency containment control based on single phaseEVs in a microgrid. Appl Energy (2017), http://dx.doi.org/10.1016/j.apenergy.2017.06.051

function of the frequency-current droop characteristic presentedin Fig. 1a.
The results of the experiments are presented in Fig. 9. Fig. 9ashows the system frequency for the three scenarios. Fig. 9b showsthe RoCoF measured over 200 ms in grey and the filtered signalafter applying the deadband in red (±0.8 Hz/s deadband is consid-ered). In Fig. 9c the controllers’ current setpoint is plotted versusthe EVs’ absorbed current. Since the three EVs act similarly, onlythe current of EV1 is presented.
Fig. 9c shows that the EVs change the absorbed current asdesired by the different controllers. However, due to the 1 A gran-ularity, the implemented droop and the operating point, the 2 kWload event implies the FCC to oscillate between 12 and 13 A, andbetween 9 and 10 A. A 6 kW load event is only introduced for Sce-nario 3, at which a stable operating point was found. In fact, Fig. 9cshows that the EV’s current did not oscillate for this load event(around t = 450 s). However, this oscillation can be reduced byimplementing a hysteresis function.
Fig. 9a shows that FCC limits the maximum frequency deviationcompared to the base case, while the SIC does not have an effect onit. On the other hand, due to the oscillation between the differentset-points in case of FCC, Fig. 9b shows that the RoCoF was outsidethe deadband more frequently when compared to scenario 1 and 2.
Due to the response delay of the EVs and the dynamics of thediesel, which led to a continuous frequency oscillation, it is difficultto perceive a valuable improvement in terms of the RoCoF fromSIC.
To better compare the performance of the two controllers interms of RoCoF and frequency, the standard deviation and theenergy contained in the signal (also addressed as normalisedenergy) is calculated and presented in Table 3. For a discrete signal
xðnÞ, the normalised energy is calculated as 1N
PNn¼1xðnÞ2, where N is
the number of samples taken for computation. It shows that thetwo controllers do not improve the RoCoF when compared to thebase case.
To understand the effects of the SIC on the frequency comparedto the base case, Fig. 10 shows a zoom of the frequency, the RoCoFand the EV’s absorbed current for the three scenarios. In Fig. 10a,one can notice that the SIC has improved the frequency slope asexpected and as experienced during the simulations.
Due to the embedded deadband, the SIC contribution is verylimited. However, since the three EVs are characterised by thesame delay and granularity (i.e. acting simultaneously with steps),one can observe the sharp change in frequency, which will lead toworse RoCoF compared to the base case as shown in Fig. 10b. Toovercome this issue, it might be of interest to study different delaysand droops among the EVs. This might induce a more smooth fre-quency change and, therefore, a better RoCoF. It is of interest tonotice from Table 3, where the SD is reported, and Fig. 10b thatthe FCC has worsened the RoCoF when compared to the SIC andthe base case.
4.4. Study Case 2
In the second study case, the two controllers are analysed dur-ing wind power production. The VRB set-point is set to zero duringthis study case. The same scenarios and droop characteristic as theprevious study case are applied. Due to the random stochasticity ofthe wind generation and the diesel dynamics, the initial andboundary conditions are not exactly identical. Nevertheless, this
48.5
49
49.5
50
50.5
51
51.5
a)
Freq(H
z)
Scenario 1 - Base case
−2−1.5−1
−0.50
0.51
1.52
b)
RoC
oF(H
z/s)
RoCoF Filtred RoCoF
0 100 200 300 400 500 600678910111213141516
c)
Time (s)
Current(A
)
Current Setpoint
Absorbed Current
Scenario 2 - SIC
0 100 200 300 400 500 600
Time (s)
Scenario 3 - FCC
0 100 200 300 400 500 600
Time (s)
Fig. 9. Study Case 1 (load steps) – (a) Frequency, (b) RoCoF, (c) EV1’s set-point vs absorbed current.
Table 3SC1—Standard deviation and normalised energy.
RoCoF Frequency
SD Normalised Energy SD
Base 0.29 0.083 0.77SIC 0.31 0.093 0.79FCC 0.33 0.11 0.48
M. Rezkalla et al. / Applied Energy xxx (2017) xxx–xxx 9
Please cite this article in press as: Rezkalla M et al. Comparison between synthetic inertia and fast frequency containment control based on single phaseEVs in a microgrid. Appl Energy (2017), http://dx.doi.org/10.1016/j.apenergy.2017.06.051

study case aims to investigate the performance of each controllerand the EVs in a more challenging and realistic configuration ratherthan comparing the different scenarios. The results for SC2 are pre-sented in Fig. 11.
Fig. 11a shows the grid frequency for the three scenarios.Fig. 11b shows the RoCoF measured over 200 ms in grey and thefiltered signal after applying the deadband in red. In Fig. 11c thecontrollers’ current set-point is plotted versus the EVs’ absorbedcurrent. Since the three EVs are acting similarly, only the currentof EV1 is presented.
The three scenarios were executed over a total time of 30 min.The average wind production did not differ so much among thethree scenarios: so that the different scenarios are still comparable.Fig. 11a shows that the FCC does have a remarkable effect in lim-iting the maximum frequency deviation. Fig. 11b shows that byapplying the SIC, the RoCoF is outside the deadband morefrequently.
To better compare the three scenarios, mean value and standarddeviation of the wind production together with the standard devi-ation of the frequency and the RoCoF are calculated and presentedin Table 4.
48.5
49.5
50.5
51.5
Freq
uenc
y (H
z)
a)
-2-10123
RoC
oF (
Hz/
s)
b)
365 367 369 371 373 375 377 379 381 383 385Time (s)
789
1011121314
Cur
rent
(A
)
c)
Base SIC FCC
Fig. 10. (a) Frequency, (b) RoCoF, (c) EV1’s absorbed current.
4848.549
49.550
50.551
51.552
a)
Freq(H
z)
Scenario 1 - Base case
−2−1.5−1
−0.50
0.51
1.52
b)
RoC
oF(H
z/s)
RoCoF Filtred RoCoF
0 100 200 300 400 500 600678910111213141516
c)
Time (s)
Current(A
)
Current Setpoint
Absorbed Current
Scenario 2 - SIC
0 100 200 300 400 500 600
Time (s)
Scenario 3 - FCC
0 100 200 300 400 500 600
Time (s)
Fig. 11. Study Case 2 (wind power) – (a) Frequency, (b) RoCoF, (c) EV1’s set-point vs absorbed current.
10 M. Rezkalla et al. / Applied Energy xxx (2017) xxx–xxx
Please cite this article in press as: Rezkalla M et al. Comparison between synthetic inertia and fast frequency containment control based on single phaseEVs in a microgrid. Appl Energy (2017), http://dx.doi.org/10.1016/j.apenergy.2017.06.051

As mentioned previously, due to the random wind productionand the non-replicability of the same conditions, the comparisonis not perfect, especially in terms of RoCoF due to the continuousvariation of the wind profile.
However, the mean value of the wind production among thethree scenarios does not differ excessively, which allows the com-parison of the standard deviation of the frequency among the sce-narios. Table 4 and Fig. 11a show the remarkable positive effect ofFCC on the frequency.
5. Conclusion and future work
Starting from the research question: given the trend of decreas-ing system inertia, can fast frequency containment compensate orreplace the need for synthetic inertia? First, this work analyticallyshowed the interdependence between frequency containment andsynthetic inertia control on the transient frequency variation andthe RoCoF. Second, on the simulation level, it presented the abilityof fast frequency control in improving the frequency in terms ofnadir, steady state value and RoCoF. It also presented the abilityof synthetic inertia control to improve the frequency nadir andslope following an event. While it was acknowledged that EVscould quickly and almost precisely respond to fast changing cur-rent set-points, some technical limitations in employing EVs forsuch services were found. Finally, an experimental validation wasconducted, presenting the capabilities and limitations of the twocontrollers under two different circumstances: following loadevents in both directions and exogenous wind generation profiles.
Employing the FCC, the simulations results showed a remark-able improvement of the frequency nadir and steady state value.It showed also a very limited improvement in terms of RoCoF.The controller did not limit the maximum RoCoF following theevent but it did improve the overall behaviour compared to thebase case. Similarly, the experiments showed the ability of FCC inlimiting the maximum frequency deviation, both following a seriesof load events or considering a wind power generation. Although insimulation the sensitivity analysis showed a very limited effect ofthe granularity, in the experimental phase, due to the 1 A granular-ity, the FCC controller caused the EV absorbed current to oscillatebetween two consecutive set points, worsening the calculatedRoCoF. It should be noted that this oscillation was due the combi-nation of 1 A granularity, the implemented droop and the operat-ing point. However, this effect can be limited by employing anhysteresis-based algorithm.
By applying the SIC, the simulations presented limited fre-quency improvements in terms of frequency nadir and frequencyslope. They also showed that employing a smaller deadbandallowed a better contribution, slightly improving frequency nadirand slope. On the other hand, the smaller deadband worsenedthe RoCoF trend when compared to the base case. However, in bothcases, the controller did not limit the maximum RoCoF value. Asmentioned, the SIC slightly improved the frequency slope butworsened the RoCoF. As interpretation of such unexpected phe-nomena, the authors believe that this might be due to the fact ofusing the same RoCoF signal for both control and examination pur-poses. In other words, the RoCoF used for control purpose should
be calculated over a smaller time window to the one used by theRoCoF relay to detect the variations. Nevertheless, consideringthe derivative characteristic of the SIC, its implementation mighteasily lead to frequency oscillation and this limits the ability toexploit the resource (e.g. large deadband). For the SIC, the experi-ments were conducted for two cases: first, following load events;and second, considering wind power generation. In terms of fre-quency, the SIC effects were negligible for both cases. For the firstcase, even if the EVs were able to follow the desired set points, theSIC did not show a noticeable improvement in terms of RoCoF. Onthe other hand, considering wind power generation, the SIC hadvery remarkable negative effects in terms of RoCoF. It should benoted that this effect might have been limited by employing lesssteep droop parameters; on the other hand, this would have lim-ited the EVs participation (i.e. flexibility margin).
In general, employing faster response devices will allow to bet-ter exploit the resource’s capabilities. For example, this was shownin case of SIC where the smaller time response permitted the use ofa narrower deadband. It can be concluded that the actual seriesproduced EVs are able to provide ancillary services in terms of fastfrequency response and synthetic inertia by solely relying on uni-directional charging. On the other hand, the experiments show thatwith the actual EV’s response time, a large deadband was neededfor the SIC and this limited its contribution. To achieve better per-formance, new requirements in terms of the EV’s response timeneed to be set. In future work, the authors recognise the impor-tance of extending the analytical formulation of the interdepen-dence of the two controllers on the system frequency. Moreover,it is of interest to expand the analysis over a larger number of flex-ible units by employing different control attributes.
Acknowledgments
The work in this paper has been partly supported by the Euro-pean Commission, under the FP7 project ELECTRA (Grant No.:609687) and partly by the Danish research projects Parker (ForskELkontrakt nr. 2016-1-12410) and Electra Top-up (grant:3594756936313). The authors are also grateful to Nissan Denmarkfor providing the two Leafs that were used in the experiments.
References
[1] Adrees A, Papadopoulos PN, Milanovi JV. A framework to assess the effect ofreduction in inertia on system frequency response. Power Energy Soc. Gen.Meet. 2016:1–5. http://dx.doi.org/10.1109/PESGM.2016.7741695.
[2] Ulbig A, Borsche T, Andersson G. Impact of low rotational inertia on powersystem stability and operation. In: The 19th world congress of theinternational federation of automatic control (IFAC14); 2014. p. 1–12.Available from: 1312.6435v2. interrefdoi:10.3182/20140824-6-ZA-1003.02615httphttp://dx.doi.org/10.3182/20140824-6-ZA-1003.02615.
[3] ENTSO-E. Frequency stability evaluation criteria for the synchronous zone ofcontinental Europe. Tech. rep. ENTSOE; 2016.
[4] The commission for energy regulation. Rate of change of frequencymodification to the grid code. Tech. rep. CER; 2014.
[5] Muljadi E, Gevorgian V, Singh M, Santoso S. Understanding inertial andfrequency response of wind power plants. In: 2012 IEEE power electronics andmachines in wind applications; 2012. 1–8. http://dx.doi.org/10.1109/PEMWA.2012.6316361.
[6] Sharma S, Huang SH, Sarma NDR. System inertial frequency responseestimation and impact of renewable resources in ERCOT interconnection. In:
Table 4SC2—Standard deviation and normalised energy.
Wind Generation RoCoF Frequency
Mean SD SD Normalised Energy SD
Base 3.5 kW 1.4 0.31 0.098 0.71SIC 4.6 kW 1.68 0.45 0.2 0.83FCC 3.1 kW 1.28 0.34 0.11
M. Rezkalla et al. / Applied Energy xxx (2017) xxx–xxx 11
Please cite this article in press as: Rezkalla M et al. Comparison between synthetic inertia and fast frequency containment control based on single phaseEVs in a microgrid. Appl Energy (2017), http://dx.doi.org/10.1016/j.apenergy.2017.06.051

IEEE power and energy society general meeting; 2011. p. 1–6. http://dx.doi.org/10.1109/PES.2011.6038993.
[7] Walling RA, Miller NW. Distributed generation islanding implications onpower system dynamic performance. In: Power engineering society summermeeting, Chicago; 2002. p. 92–6. http://dx.doi.org/10.1109/PESS.2002.1043183.
[8] Ten C, Crossley P. Evaluation of ROCOF relay performances on networks withdistributed generation. In: IET 9th international conference on developmentsin power systems protection (DPSP 2008) 2008; 2008. p. 522–7.interrefdoi:10.1049/cp:20080092httphttp://dx.doi.org/10.1049/cp:20080092.
[9] Mu Y, Wu J, Jenkins N, Jia H, Wang C. A spatial-temporal model for grid impactanalysis of plug-in electric vehicles. Appl Energy 2014;114(February):456–65.http://dx.doi.org/10.1016/j.apenergy.2013.10.006.
[10] Pillai JR, Bak-Jensen B. Impacts of electric vehicle loads on power distributionsystems. In: IEEE vehicle power and propulsion conference, VPPC; 2010. p. 6–11. http://dx.doi.org/10.1109/VPPC.2010.5729191.
[11] Foley A, Tyther B, Calnan P, Gallachóir BÓ. Impacts of electric vehicle chargingunder electricity market operations. Appl Energy 2013;101:93–102. http://dx.doi.org/10.1016/j.apenergy.2012.06.052.
[12] Hedegaard K, Ravn H, Juul N, Meibom P. Effects of electric vehicles on powersystems in Northern Europe. Energy 2012;48(1):356–68. http://dx.doi.org/10.1016/j.energy.2012.06.012.
[13] Amini MH, Parsa M, Karabasoglu O. Simultaneous allocation of electricvehicles’ parking lots and distributed renewable resources in smart powerdistribution networks. Sustain Cities Soc 2017;28:332–42. http://dx.doi.org/10.1016/j.scs.2016.10.006.
[14] Amini MH, Moghaddam MP. Probabilistic modelling of electric vehicles’parking lots charging demand. In: Electrical engineering (ICEE), 2013 21stIranian conference; 2013. p. 3–6. http://dx.doi.org/10.1109/IranianCEE.2013.6599716.
[15] Molina-garcía A, Bouffard F, Kirschen DS. Decentralized demand-sidecontribution to primary frequency control. IEEE Trans Power Syst 2011;26(1):411–9. http://dx.doi.org/10.1109/TPWRS.2010.2048223.
[16] Moghadam MRV, Member S, Ma RTB. Distributed frequency control in smartgrids via randomized demand response. IEEE Trans Smart Grid 2014;5(6):2798–809.
[17] Kempton W, Tomic J. Vehicle-to-grid power implementation: from stabilizingthe grid to supporting large-scale renewable energy. J Power Sources 2005;144(1):280–94. http://dx.doi.org/10.1016/j.jpowsour.2004.12.022.
[18] Sortomme E, El-sharkawi MA. Optimal scheduling of vehicle-to-grid energyand ancillary services. IEEE Trans Smart Grid 2012;3(1):351–9. http://dx.doi.org/10.1109/TSG.2011.2164099.
[19] Wang D, Coignard J, Zeng T, Zhang C, Saxena S. Quantifying electric vehiclebattery degradation from driving vs. vehicle-to-grid services. J Power Sources2016;332:193–203. http://dx.doi.org/10.1016/j.jpowsour.2016.09.116.
[20] Knezovic K, Træholt C, Marinelli M, Andersen PB. Active integration of electricvehicles in the distribution network theory, modelling and practice [Phdthesis]. Technical University of Denmark; 2017. <http://orbit.dtu.dk/files/131995291/Knezovic_PhDthesis_final.pdf>.
[21] Mu Y, Wu J, Ekanayake J, Jenkins N, Jia H. Primary frequency response fromelectric vehicles in the Great Britain power system. IEEE Trans Smart Grid2013;4(2):1142–50. http://dx.doi.org/10.1109/TSG.2012.2220867.
[22] Knezovic K, Martinenas S, Andersen PB, Zecchino A, Marinelli M. Enhancing therole of electric vehicles in the power grid: field validation of multiple ancillaryservices. IEEE Trans Transp Electrif 2016;7782(c). http://dx.doi.org/10.1109/TTE.2016.2616864. 1–1.
[23] Kempton W, Tomic J. Vehicle-to-grid power implementation: from stabilizingthe grid to supporting large-scale renewable energy. J Power Sources 2005;144(1):280–94. http://dx.doi.org/10.1016/j.jpowsour.2004.12.022.
[24] Teng F, Mu Y, Jia H, Wu J, Zeng P, Strbac G. Challenges on primary frequencycontrol and potential solution from EVs in the future GB electricity system.Appl Energy 2016;194:353–62. http://dx.doi.org/10.1016/j.apenergy.2016.05.123.
[25] Schuller A, Flath CM, Gottwalt S. Quantifying load flexibility of electric vehiclesfor renewable energy integration. Appl Energy 2015;151:335–44. http://dx.doi.org/10.1016/j.apenergy.2015.04.004.
[26] Tielens P, Hertem DV. The relevance of inertia in power systems. RenewSustain Energy Rev 2016;55:999–1009. http://dx.doi.org/10.1016/j.rser.2015.11.016.
[27] IEC 61851-1:2010. Electric vehicle conductive charging system Part 1: Generalrequirements; 2010.
[28] Marinelli M, Martinenas S, Knezovic K, Andersen PB. Validating a centralizedapproach to primary frequency control with series-produced electric vehicles.Adv Life Course Res 2016;7:63–73. http://dx.doi.org/10.1016/j.est.2016.05.008.
[29] Suul JA, Arco SD, Guidi G. Virtual synchronous machine-based control of asingle-phase bi-directional battery charger for providing vehicle-to-gridservices. IEEE Trans Ind Appl 2016;52(4):3234–44. http://dx.doi.org/10.1109/TIA.2016.2550588.
[30] Martini L, Morch A, Radaelli L, Caerts C, Tornelli C, Hänninen S, et al. Electra IRPapproach to voltage and frequency control for future power systems with highDER penetration. In: 23rd international conference on electricity distributionCIRED; 2015. p. 1–5.
[31] ENTSO-E. ENTSO-E, Continental Europe Operation Handbook. Tech. rep. Cc,ENTSOE; 2009.
[32] Kundur P, Paserba J, Ajjarapu V, Andersson G, Bose A, Canizares C, et al.Definition and Classification of Power System Stability. IEEE Trans. Power Syst.2004;21(3):1387–401. http://dx.doi.org/10.1109/TPWRS.2004.825981.
[33] Kundur P. Power system stability and control. McGraw-Hill; 1994.[34] Zecchino A, Rezkalla M, Marinelli M. Grid Support by single-phase connected
electric vehicles without V2G capability: fast primary frequency control. In:International universities’ power engineering conference – UPEC, Coimbra;2016. p. 6.
[35] Rezkalla M, Martinenas S, Zecchino A, Marinelli M, Rikos E. Implementationand validation of synthetic inertia support employing series produced electricvehicles. In: 24th International conference on electricity distribution CIRED,Glasgow, 14–15 Jun; 2017. p. 1–5.
[36] Rezkalla M, Marinelli M, Pertl M, Heussen K. Trade-off analysis of virtualinertia and fast primary frequency control during frequency transients in aconverter dominated network. In: 2016 IEEE innovative smart gridtechnologies – Asia (ISGT-Asia); 2016. p. 890–5. interrefdoi:10.1109/ISGT-Asia.2016.7796503httphttp://dx.doi.org/10.1109/ISGT-Asia.2016.7796503.
12 M. Rezkalla et al. / Applied Energy xxx (2017) xxx–xxx
Please cite this article in press as: Rezkalla M et al. Comparison between synthetic inertia and fast frequency containment control based on single phaseEVs in a microgrid. Appl Energy (2017), http://dx.doi.org/10.1016/j.apenergy.2017.06.051


Pub. G. Management of Power QualityIssues in Low Voltage Networks usingElectric Vehicles: Experimental Validation
145

IEEE TRANSACTIONS ON POWER DELIVERY 1
Management of Power Quality Issues in LowVoltage Networks using Electric Vehicles:
Experimental ValidationSergejus Martinenas, Student Member, IEEE, Katarina Knezovic, Student Member, IEEE, Mattia
Marinelli, Member, IEEE
Abstract—As Electric Vehicles (EVs) are becoming more widespread, their high power consumption presents challenges forthe residential low voltage networks, especially when connectedto long feeders with unevenly distributed loads. However, ifintelligently integrated, EVs can also partially solve the existingand future power quality problems. One of the main aspectsof the power quality relates to voltage quality. The aim ofthis work is to experimentally analyse whether series-producedEVs, adhering to contemporary standard and without relyingon any V2G capability, can mitigate line voltage drops andvoltage unbalances by a local smart charging algorithm basedon a droop controller. In order to validate this capability, alow-voltage grid with a share of renewable resources is recreatedin SYSLAB PowerLabDK. The experimental results demonstratethe advantages of the intelligent EV charging in improving thepower quality of a highly unbalanced grid.
Index Terms—Electric vehicles, power distribution testing,power quality, unbalanced distribution grids, voltage control.
I. INTRODUCTION
D ISTRIBUTION system operators (DSOs) havehistorically designed and operated their networks in
order to follow a predicted demand with uni-direction powerflows only. Nowadays, due to increased share of renewableenergy resources, DSOs are confronted with changes inthe low-voltage grid operation with even greater systemcomplexity imposed by electric vehicle (EV) integration[1], [2]. Danish Energy Association predicts 47,000 EVs inDenmark by 2020 in a moderate penetration scenario [3],meaning that distribution networks will have to cope withoverall voltage degradation, especially in unbalanced systemswhere voltage quality is already decreased. Unlike in otherEuropean countries, the three-phase connection in Denmarkis not reserved only for industrial consumers, but is alsoavailable for residential customers. Therefore, DistributionSystem Operators (DSOs) experience high voltage unbalancesdue to the lack of regulation for per phase load connection[4]. Uncontrolled EV charging in such grids may resultin large power quality deterioration, i.e., higher voltageunbalances [5], and the rise of neutral-to-ground voltage dueto single-phase charging [6].
As an economic alternative to grid reinforcement, differentEV charging strategies can be used for supporting the
The authors are with the Centre for Electric Power and Energy, Departmentof Electrical Engineering, Technical University of Denmark (DTU),Roskilde, Denmark (e-mail: [email protected]; [email protected];[email protected])
grid and enhancing both the efficiency and the reliabilityof the distribution system [7]. An extensive amount ofresearch shows that intelligent integration, namely smart EVcharging, can be used for lowering the impact on the powersystem or providing different ancillary services [8]–[14]. Inorder to integrate electric vehicles in the distribution grid,both centralised and decentralised charging strategies havebeen explored [15]–[17]. It has been found that centralisedalgorithms lead to the least cost solution and are easilyextended to a hierarchical scheme, but they require greatcommunication infrastructure for information exchange. Onthe other hand, decentralised control provided similar resultsto the centralised one without the complex communicationinfrastructure.
A decentralised voltage dependent charging strategy, whichrequires only local voltage measurements, can be used formitigating the low EV-induced voltages [18], [19]. That is,EV charging power can be modulated in accordance to localvoltage measurements in order to compensate the voltageunbalances and improve the overall power quality [20], [21].However, technical challenges may arise and DSOs maybe sceptical about the possibility of the distributed demandparticipating in the grid regulation. Therefore an extensiveexperimental activity is required for proving the feasibility ofthese solutions.
A. Objectives
As stated in [22], electric power quality is a termthat refers to maintaining the near sinusoidal waveformof power distribution bus voltages and currents at ratedmagnitude and frequency. Thus power quality is often usedto express voltage quality, current quality, reliability ofservice, etc. While frequency regulation is a system wideservice, experimentally addressed in previous work [23],this paper is focusing on the other main aspect of powerquality in LV networks i.e. voltage quality. To the authors’knowledge, most of the literature focuses on modelling theEV voltage support, whereas the experimental validation israrely touched upon. Therefore, this work mainly focuses onthe experimental evaluation of the real EV’s ability to reducevoltage unbalances by modulating their charging currentaccording to local voltage measurements. This autonomouscontrol could partially solve voltage quality issues without theneed for grid upgrades or costly communication infrastructure,

IEEE TRANSACTIONS ON POWER DELIVERY 2
therefore enabling the integration of higher EV numbers in theexisting power network. The experiment is carried out withcommercially available vehicles without any Vehicle-to-Grid(V2G) capability, but with the possibility to modulate thecharging current in steps according to the predefined droopcontrol. Several scenarios differing in load unbalances andimplemented droop controller have been tested in order toassess the influence of EV smart charging on improving powerquality in the low voltage grid.
The paper is organised as follows. Section II briefly recallsthe standards regarding the voltage power quality and themotivation for implemented voltage control. In Section III, theapplied methodology and experimental setup are presented indetails with a description of conducted scenarios. Finally, theresults are discussed in Section IV followed by the conclusionin Section V.
II. VOLTAGE CONTROL
The modern three-phase distribution systems supply a greatdiversity of customers imposing a permanent unbalancedrunning state. Contrary to other disturbances in the powersystem for which the performance is evident for the ordinarycustomers, voltage unbalance belongs to those disturbanceswhose perceptible effects are produced in the long run.Unsymmetrical consumption and production lead to voltageand current unbalances which imply greater system powerlosses, interference with the protection systems, components’performance degradation and overheating possibly to thepoint-of-burnout. Further on, the main effects of unbalancedvoltages are mostly noticeable on the three-phase componentse.g., transformers, synchronous machines and inductionmotors which are designed and manufactured so that all threephase windings are carefully balanced with respect to thenumber of turns, winding placement, and winding resistance[24]. Essentially, the unbalanced voltages are equivalent tothe introduction of a negative sequence component with anopposite rotation to the one of the balanced voltages, resultingin reduced net torque and speed, as well as torque pulsations.In addition, large negative sequence currents introducea complex problem in selecting the proper overloadingprotection. Particularly since devices selected for one set ofunbalanced conditions may be inadequate for others.
To ensure that electric appliances are operated in asafe manner, the European standard EN50160 [25] definesacceptable limits for several grid parameters. More precisely,the standard defines the limits for Root Mean Square (RMS)phase-to-neutral voltage magnitude |Upn| and the VoltageUnbalance Factor (VUF) as follows:
0.9 Unom ≤ |Upn| ≤ 1.1 Unom (1)
V UF ≤ 2%, (2)
for > 95% of all weekly 10 minute intervals, and
0.85 Unom ≤ |Upn| ≤ 0.9 Unom, (3)
for < 5% of all weekly 10 minute intervals. In addition, thestandard defines the VUF as:
V UF [%] =|Uinverse||Udirect|
× 100. (4)
where |Udirect|, and |Uinverse| are the direct (positive)and the inverse (negative) voltage symmetrical componentrespectively. Since the definition described in (4) involvesvoltage magnitudes and angles, i.e., complex algebra forcalculating the positive and negative components, equations(5) and (6) give a good approximation while avoiding the useof complex algebra [26].
V UF [%] =max∆|U i
a|,∆|U ib |,∆|U i
c ||U i
avg|× 100 (5)
|Uavg| =|U i
an|+ |U ibn|+ |U i
cn|3
, (6)
where ∆|Ua|,∆|Ub|,∆|Uc| are deviations of the respectivephase-to-neutral voltage magnitudes from the averagephase-to-neutral voltage magnitude |Uavg|, for the observedtime window i. These equations will be used later on forassessing the voltage unbalances in the tested study case.
A. Voltage controller implemented in the EVs
Generally droop controllers are used in power systems fordistributing the regulation services among multiple machinesregardless of the service purpose: frequency with activepower control, voltage with reactive power control or voltagewith active power control, etc. The chosen droop controllerhas been adjusted to the application needs by choosing thethresholds corresponding to the acceptable voltage limits.Three different threshold pairs have been tested, with twodifferent proportional slope/gain values.
The used droop controllers have been inspired by theaforementioned standard. Firstly, an upper threshold for thedroop controlled voltage is set to 0.95 Unom, above whichEVs charge at the maximum current Imax of 16 A. Secondly,they can either charge at minimum current Imin of 6 A orstop the charging process if the voltage drops below 0.9 Unom,corresponding respectively to the real droop 1 and real droop 2seen in Fig. 1a. The values in-between the EV charging limitswould ideally be linear according to the voltage measurement.However, the current controller has the minimum chargingcurrent limit of 6 A and the steps of 1 A as defined inthe IEC 61851 [27]. Therefore using a typical 3.7 kW EVcharger, there are 10 current steps in total. In the implementedcontroller, these steps are equally distributed between 0.9 and0.95 Unom. In addition, a steeper droop control correspondingto real droop 3 in Fig. 1b has also been tested. Similarly tothe first droop control, this control also has 10 current stepsequally distributed between the charging limits, but the lowervoltage limit is set to 0.925 Unom.
Defining an exact droop value for EVs or loads in general,may not be straightforward as it may not be clear what is thenominal power of the load. In this case, it has been consideredthat the available range of regulating power (i.e., 2.3 kW)is equal to the EV’s nominal power instead of the overallEV charging power which amounts to 3.7 kW. The followingparameters have been defined for the described droop controls,i.e., (7) for the droop control seen in Fig. 1a and (8) for thedroop control seen in Fig. 1b:

IEEE TRANSACTIONS ON POWER DELIVERY 3
∆U = 11.5V ;Unom = 230V
∆P = 2.3kW ;Pnom = 2.3kW
kdroop =∆U/Unom∆P/Pnom
= 5%
(7)
∆U = 5.75V ;Unom = 230V
∆P = 2.3kW ;Pnom = 2.3kW
kdroop =∆U/Unom∆P/Pnom
= 2.5%
(8)
0.89 0.9 0.91 0.92 0.93 0.94 0.95 0.96 0.97 0.98 0.99 102468
1012141618
Phase-to-neutral voltage (pu)
EV
curr
ent
(A)
Ideal droop Real droop 1 Real droop 2
(a)
0.89 0.9 0.91 0.92 0.93 0.94 0.95 0.96 0.97 0.98 0.99 102468
1012141618
Phase-to-neutral voltage (pu)
EV
curr
ent
(A)
Ideal droop Real droop 3
(b)
Fig. 1: Implemented droop controls: (a) k=5%, and (b) k=2.5%
Droop controller calculates the EV charging current limitIdroop using the following formula:
Idroop =(Umeas − Unom) ∗ (Imax − Imin)
(Unom ∗ kdroop)+ Ibase (9)
where Umeas is the actual voltage measurement and Ibaseis a base EV charging current when voltage is at the nominalvalue and corresponds to 11A.
IEV =
Idroop, Imin ≤ Idroop ≤ Imax
Imax, Idroop > Imax
Imin, Idroop < Imin
(10)
Imax value represents the available power connectioncurrent rating at the consumer site, which is typically 16A,and can be further upgraded to 32A or higher. While Imin
is chosen from lower charging current limit from IEC 61851standard.
III. METHODOLOGY AND EXPERIMENTAL PROCEDURE
To validate the previously described controller in real EVcharging processes, typical low voltage distribution feeder has
been recreated in a laboratory environment. The feeder is gridconnected through a typical MV/LV 200 kVA distributiontransformer, whereas the EVs are connected in the end ofthe feeder next to the resistive load, representing a commonhome charging setup. Additionally, the feeder includes aset of renewable sources such as a wind turbine alongwith a controllable resistive load capable of modulating theconsumption independently per phase.
The EV voltage support can theoretically be done bymodulating the active and/or the reactive power. However,since the reactive power control is currently not available incommercial EVs, this experiment focuses on active powercontrol for voltage support. Each electric vehicle supplyequipment (EVSE) is equipped with a local smart chargingcontroller which adjusts the EV charging power according tothe droop control described in II-A. Since the controller isindependent for each vehicle, the charging current is calculatedbased only on local voltage measurement meaning that theEVs connected to different phases will react differently.Therefore, the vehicles connected to heavy loaded phases willprovide more voltage support due to lower measured voltagesresulting in being a less burden to the already unbalanced grid.
A. Experimental setup
The experiments are performed in SYSLAB (part ofPowerLabDK) which is a flexible laboratory for distributedenergy resources consisted of real power componentsparallelled with communication infrastructure and controlnodes in a dedicated network. The complete test setup isdistributed over the Risø Campus of Technical University ofDenmark. The studied experimental setup is depicted in Fig. 2and Fig. 3. As seen in the figures, the setup consists of thefollowing components:
• 3 commercially available EVs (Nissan Leaf) with singlephase 16 A (230 V ) charger and 24 kWh Li-Ion battery.
• 2-blade wind turbine Gaia with rated power Pn =11 kW .
• 45 kW resistive load (15 kW per phase) controllable persingle-phase in 1 kW steps.
• set of Al 240 mm2 underground cables approximately1.95 km in length with AC resistance at 45oC RAC =0.14Ω/km and series reactance X = 0.078Ω/km
• 75 m of Cu 16 mm2 cable with AC resistance at45oC RAC = 1.26Ω/km and series reactance X =0.076Ω/km
• 10/0.4 kV, 200 kV A transformer.The wind turbine connected to the test grid, although not
significantly large as active power source, provides stochasticactive and reactive power variation to the system. Additionally,it makes the test grid closer to a possible realistic distributiongrid with more diverse components than just pure resistiveloads.
From the line parameters above, the X/R ratio is calculatedto highlight the impedance characteristic of the grid: X/Requals to 0.43. The X/R ratio of the test system is quite lowi.e., in the range of the typical LV system and is comparableto CIGRE network [28] as well as other benchmark systems.
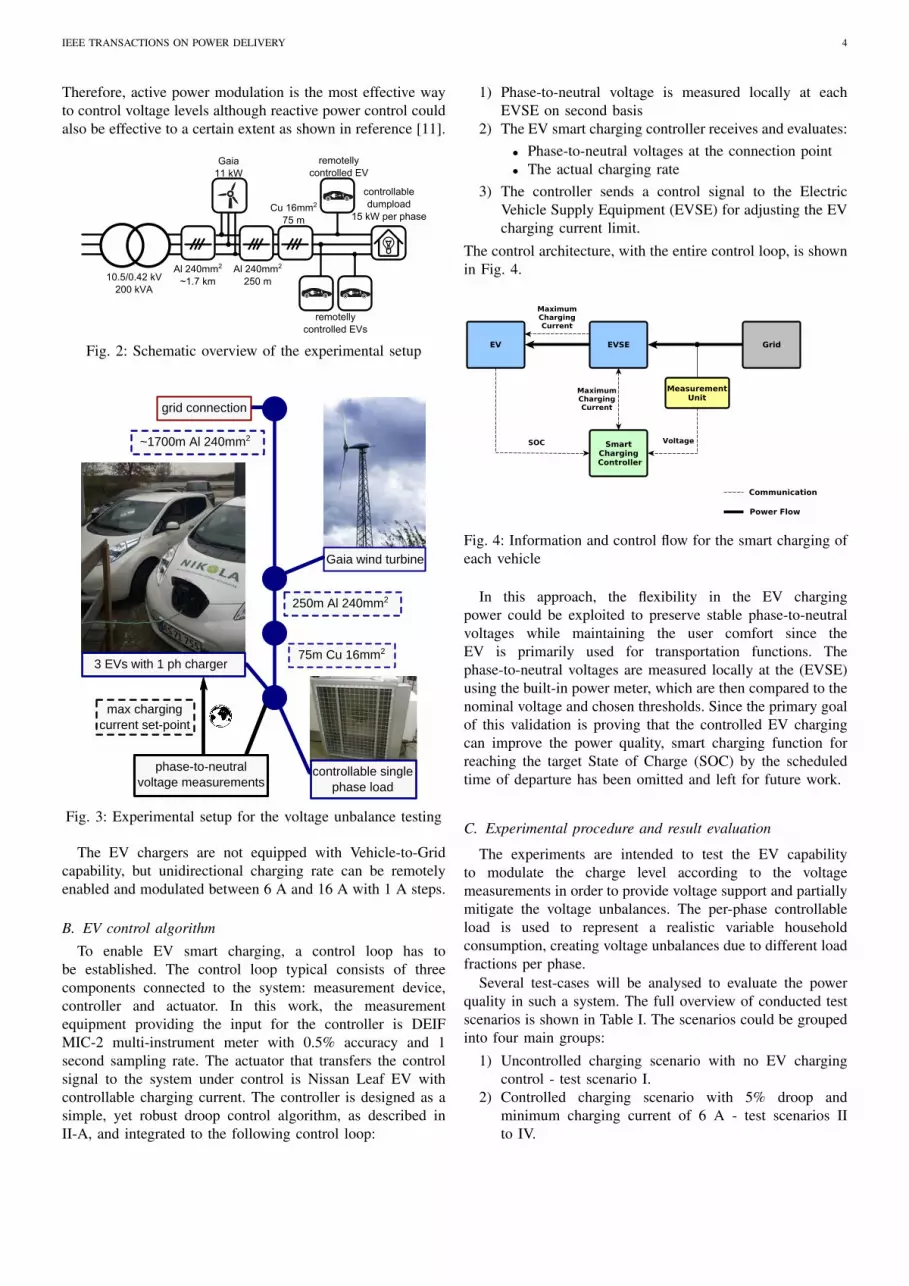
IEEE TRANSACTIONS ON POWER DELIVERY 4
Therefore, active power modulation is the most effective wayto control voltage levels although reactive power control couldalso be effective to a certain extent as shown in reference [11].
controllable
dumpload
15 kW per phase
10.5/0.42 kV
200 kVA
Gaia
11 kW
Cu 16mm2
75 m
Al 240mm2
~1.7 km
remotelly
controlled EV
remotelly
controlled EVs
Al 240mm2
250 m
Fig. 2: Schematic overview of the experimental setup
GaiaCwindCturbine
3CEVsCwithC1CphCchargerC
controllableCsingleCphaseCloadC
~1700mCAlC240mm2
75mCCuC16mm2CC
gridCconnection
phase-to-neutralvoltageCmeasurements
maxCchargingcurrentCset-point
C250mCAlC240mm2CC
Fig. 3: Experimental setup for the voltage unbalance testing
The EV chargers are not equipped with Vehicle-to-Gridcapability, but unidirectional charging rate can be remotelyenabled and modulated between 6 A and 16 A with 1 A steps.
B. EV control algorithm
To enable EV smart charging, a control loop has tobe established. The control loop typical consists of threecomponents connected to the system: measurement device,controller and actuator. In this work, the measurementequipment providing the input for the controller is DEIFMIC-2 multi-instrument meter with 0.5% accuracy and 1second sampling rate. The actuator that transfers the controlsignal to the system under control is Nissan Leaf EV withcontrollable charging current. The controller is designed as asimple, yet robust droop control algorithm, as described inII-A, and integrated to the following control loop:
1) Phase-to-neutral voltage is measured locally at eachEVSE on second basis
2) The EV smart charging controller receives and evaluates:• Phase-to-neutral voltages at the connection point• The actual charging rate
3) The controller sends a control signal to the ElectricVehicle Supply Equipment (EVSE) for adjusting the EVcharging current limit.
The control architecture, with the entire control loop, is shownin Fig. 4.
Fig. 4: Information and control flow for the smart charging ofeach vehicle
In this approach, the flexibility in the EV chargingpower could be exploited to preserve stable phase-to-neutralvoltages while maintaining the user comfort since theEV is primarily used for transportation functions. Thephase-to-neutral voltages are measured locally at the (EVSE)using the built-in power meter, which are then compared to thenominal voltage and chosen thresholds. Since the primary goalof this validation is proving that the controlled EV chargingcan improve the power quality, smart charging function forreaching the target State of Charge (SOC) by the scheduledtime of departure has been omitted and left for future work.
C. Experimental procedure and result evaluation
The experiments are intended to test the EV capabilityto modulate the charge level according to the voltagemeasurements in order to provide voltage support and partiallymitigate the voltage unbalances. The per-phase controllableload is used to represent a realistic variable householdconsumption, creating voltage unbalances due to different loadfractions per phase.
Several test-cases will be analysed to evaluate the powerquality in such a system. The full overview of conducted testscenarios is shown in Table I. The scenarios could be groupedinto four main groups:
1) Uncontrolled charging scenario with no EV chargingcontrol - test scenario I.
2) Controlled charging scenario with 5% droop andminimum charging current of 6 A - test scenarios IIto IV.

IEEE TRANSACTIONS ON POWER DELIVERY 5
3) Controlled charging scenario with 5% droop andminimum charging current of 0 A - test scenarios V- VII.
4) Controlled charging scenario with 2.5% droop andminimum charging current of 6 A - test scenario VIII.
For each test scenario the single-phase load is increased from0 up to 43 A in 5 steps.
The system performance is evaluated by measuring relevantphase-to-neutral voltages as well as VUFs. This analysisallows the investigation of issues arising when dealingwith practical implementation of voltage support, such ascommunication latency, power and voltage measurementinaccuracies, and coordination of more sources. Additionally,it should be noted that the experimental setup is only usingcommunication and control equipment that follows existingindustry standards. Hence, tested control algorithms can beapplied to any real grid operation, ensuring the interoperabilityand minimal integration effort.
IV. RESULTS
To demonstrate the differences between uncontrolled andcontrolled EV charging, test scenarios shown in Table I wereexecuted. Following subsections present the most relevantfindings for each of the conducted scenarios.
A. Voltage quality using uncontrolled EV chargingFirstly, the setup is tested using the most occurring situation
nowadays - uncontrolled EV charging, while the resistiveload at the end of the feeder, representing the domesticconsumption, is gradually increasing. Measured voltages atthe EVSE, load increase steps and corresponding EV chargingcurrents can be seen in Fig. 5.
Clearly, such voltage quality is unsatisfactory asphase-to-neutral voltages drop below 0.9 Un on all phasesfor the maximum load step. Meanwhile, the EVs are steadilycharging at the maximum current regardless of the grid statussince there is no implemented control. It should be noted thatone of the EVs is charging at 17 A even though the same 16A rated current applies to all of the cars. This shows howeven the same EV models differing only in the productionyear can have different impact on the power quality. Similarfindings will be discussed later on for controlled chargingscenarios. In addition, one can notice how the load steps arenot completely synchronised for all three phases which willalso apply to later on scenarios. The reason lies in the lackof automatic control, i.e., the steps had to be manually inputinto the device. However, this fact does not influence the EVbehaviour.
190
200
210
220
230
240
Volt
age [
V]
Phase A Phase B Phase C
10
20
30
40
50
60
Curr
ent
[A]
14:33 14:34 14:35 14:36 14:37 14:38 14:39Time
14.014.515.015.516.016.517.017.5
Curr
ent
[A]
Fig. 5: Voltage and load current measurements for EVuncontrolled charging - test scenario I
B. Voltage quality using EV droop control
Firstly, the droop controller with a 5% droop and minimumcharging current of 6 A, shown as real droop 1 in Fig. 1a,is applied to the EV charging. Measured voltage at theEVSE, load increase steps and corresponding EV chargingcurrents can be seen in Fig. 6, whereas Fig. 7 shows thecorrelation between the measured phase-to-neutral voltageand the measured EV response for each of the phases. Thecorrelation plot closely resembles the droop characteristicshown in Fig. 1a.
It can be observed that the EVs already start respondingat the second load step since the voltage exceeds the droopcontrol boundary of 0.95 Un. Even for the maximum loading,the voltages are kept above 0.9 Un as EVs are reducingthe charging currents to a minimum value of 6 A. Anotherinteresting phenomena to notice is that the phase-to-neutralvoltage on the unloaded phase is rising when the load isincreased on the other phases. That is due to a floating, notgrounded, neutral line, which introduces a greater voltageunbalance.
TABLE I: Overview of conducted scenarios
Scenario I II III IV V VI VII VIIILoad 3 phase 3 phase 2 phase 1 phase 3 phase 2 phase 1 phase 3 phase
Droop Control - 5% 5% 5% 5% 5% 5% 2.5%Min EV Current 16A 6A 6A 6A 0A 0A 0A 6A
Maximum load current on phase a [A] 43 43 43 0 43 43 0 43Maximum load current on phase b [A] 43 43 43 0 43 43 0 43Maximum load current on phase c [A] 43 43 0 43 43 0 43 43

IEEE TRANSACTIONS ON POWER DELIVERY 6
195200205210215220225230235240
Volt
age [
V]
Phase A Phase B Phase C
0
10
20
30
40
50
60
Curr
ent
[A]
15:04 15:06 15:08 15:10 15:12 15:14Time
468
1012141618
Curr
ent
[A]
Fig. 6: Voltage, load and charging current measurements forEV smart charging test scenarios: II - 15:03 to 15:08, III -15:08 to 15:12 and IV - 15:12 to 15:16
190 200 210 220 230 240 250Voltage [V]
0
2
4
6
8
10
12
14
16
18
Curr
ent
[A]
Phase A
Phase B
Phase C
Fig. 7: Correlation plot between measured phase-to-neutralvoltage and EV current for test scenarios II to V
C. Voltage quality using EV droop control with stopping thecharge
Controlled EV charging according to IEC61851 also hasthe ability to stop and restart the charging of the vehicle. Thisfunction could potentially further improve the power qualityin the system as the load from the EV could temporarilybe removed. Therefore, the same droop controller with 5%slope, but minimum charging current of 0 A is studied. Themodification of the droop curve is done as shown in Fig. 1aas real droop 2.
Similarly to previous scenarios, Fig. 8 shows the measuredvoltage at the EVSE, load increase steps and correspondingEV charging currents.
Fig. 9 presents the correlation between the controller’s inputvoltage and the measured EV response. The relation pattern ispartly resembling the curve shown on Fig. 1a as real droop 2.Although, unlike in the droop curve two clear drops at 6 and
190
200
210
220
230
240
250
Volt
age [
V]
Phase A Phase B Phase C
0
10
20
30
40
50
60
Curr
ent
[A]
15:20 15:22 15:24 15:26 15:28 15:30 15:32Time
02468
1012141618
Curr
ent
[A]
Fig. 8: Voltage, load and charging current measurements forEV smart charging test scenarios: V - 15:19 to 15:24, VI -15:24 to 15:28 and VII 15:28 to 15:33
10 A are present. The second drop appears due to controllerinduced oscillation explained further.
190 200 210 220 230 240 250Voltage [V]
0
2
4
6
8
10
12
14
16
18
Curr
ent
[A]
Phase A
Phase B
Phase C
Fig. 9: Correlation plot between measured voltage and EVcurrent for test scenarios V to VII
Fig. 8 shows that the system response is almost identical tothe test scenarios II to IV, besides in the maximum loadingcase. At that point, one can notice oscillations in test scenarioV and VII which occur due to the brief voltage dip for thelast load step. This step briefly puts the voltage under 0.9 Un,which triggers the controller to stop the charging of the EVs.As the EVs stop charging, the voltages rise to about 0.93 Un,which makes the controller restart the EV charging since thevoltage is now high enough. The restarting process takes about8 seconds. However, as the EVs restart the charging, thevoltage briefly dips under 0.9 Un again making the controllerto stop the charging. This instability repeats as long as thevoltage level stays close to 0.9 Un. In scenario VI, EV onphase a stably mitigates the voltage unbalance by stopping thecharge. At the same time, EV on phase b also stabilises the

IEEE TRANSACTIONS ON POWER DELIVERY 7
charging current at 7 A, right at the lower limit of stopping thecharge. The aforementioned oscillation issues could be solvedby modifying the controller to detect the voltage transients andonly react for the steady state voltage measurements. However,this has been omitted from the conducted study and left forfuture work.
D. Voltage quality using EV droop control with steeper droopcharacteristic
The droop control has then been modified, making it moresteep as shown in Fig. 1b. As for the previous scenarios,measured voltage at the EVSE, load increase steps andcorresponding EV charging currents can be seen in Fig. 10,whereas the correlation is depicted in Fig. 11. As the droopcurve used in this scenario is more steep, minor oscillationsare present on phase c due to a slower response of the EV onthis phase.
190
200
210
220
230
240
250
Volt
age [
V]
Phase A Phase B Phase C
0
10
20
30
40
50
60
Curr
ent
[A]
15:41 15:42 15:43 15:44 15:45 15:46Time
468
101214161820
Curr
ent
[A]
Fig. 10: Voltage, load and charging current measurements forEV smart charging - test scenario VIII
190 200 210 220 230 240 250Voltage [V]
0
2
4
6
8
10
12
14
16
18
Curr
ent
[A]
Phase A
Phase B
Phase C
Fig. 11: Correlation plot between measured voltage and EVcurrent for test scenario VIII
6
8
10
12
14
16
18
Curr
ent
[A]
I_c
I_c_control
15:03 15:0815:04 15:05 15:06 15:07Time
6
8
10
12
14
16
18
Curr
ent
[A]
I_aI_a_control
Fig. 12: Sample charging current control signal and measuredvalue for EV smart charging - test scenario II
Moreover, Fig. 12 illustrates the difference between thecontrol and the actual EV charging current. The EVs on phasea and b respond to the control signal in 1 to 2 seconds, whileEV on phase c takes 4 to 5 seconds. The difference is due toa older production year for the EV connected to phase c. It isalso important to note that the control signal sent to the EVis merely an upper limit for the charging current. Hence, theactual charging current of the vehicle should be below the setlimit. However, EV on phase c is violating the set chargingcurrent limit by 1 A. It is an atypical behaviour possibly causedby a recent charger firmware update.
E. Result overview
According to EN50160, the voltage quality is typicallyassessed over a week with 10 minutes average intervals.However, the main reason to focus on a shorter period of timein this paper, is to evaluate the performance of the controller.The limited 10 minute intervals show the system response tothe load event and control actions taken, in this period thevoltage in the system stabilizes to new steady states, thereforethis experimental time window can be extrapolated to longertime periods. Additionally, vehicles are solving the problempartly caused by themselves thus, it is reasonable to experienceless voltage problems if EVs are not charging.
The setup was tested in 8 test scenarios with the resultsummary shown in Table II. Maximum VUF is calculated fromthe values observed at the maximum feeder loading. Steadystate voltage values in the maximum load case are also shownfor each test scenario. Finally, the voltage drops between thegrid and EV connection points at the maximum load case areshown.
Firstly, one should note that smart charging when all 3phases are evenly loaded (test scenarios I, II, V and VIII)improves the VUF. Secondly, VUF in heavily unbalancedscenarios is much beyond the standard limit for scenarios III,

IEEE TRANSACTIONS ON POWER DELIVERY 8
TABLE II: Maximum VUF, steady state voltage values and voltage drop from grid connection to the EV connection point
Scenario I II III IV V VI VII VIIILoad 3 phase 3 phase 2 phase 1 phase 3 phase 2 phase 1 phase 3 phase
Droop Control - 5% 5% 5% 5% 5% 5% 2.5%Min EV Current 16A 6A 6A 6A 0A 0A 0A 6A
VUFmax[%] 1.3 0.8 9.0 7.9 0.6 8.4 6.4 1.0Uanmaxloadss [V] 202.8 208.4 203.6 234.5 212.5 208.0 233.0 209.0Ubnmaxloadss
[V] 202.6 207.9 209.6 225.7 213.5 207.5 225.0 210.5Ucnmaxloadss [V] 206.6 210.5 235.9 203.5 214.0 235.0 208.5 212.6
∆Uan[V] 33.0 27.4 32.1 1.6 23.5 27.8 3.0 27.0∆Ubn[V] 30.3 25.1 23.1 7.3 20.7 25.4 7.2 22.6∆Ucn[V] 28.3 24.4 -1.2 31.3 19.7 -0.1 27.5 22.3
IV, VI and VII. H ere, the controller tries to minimise theunbalance by setting EV charging current to the minimumvalue specified for each scenario. However, vehicles alone cannot eliminate the unbalance in the case of maximum loading,since controllable EVs represent only 17 % of the total load.This flexibility could be extended to 25 % if the chargingis stopped. It should be noted that values of smart chargingscenarios V, and VII were calculated from the measurements ofthe steady states between the oscillations. Nevertheless, greatercontrollable power amount results in significant improvementsin power quality for scenarios V to VII.
V. CONCLUSION
This work presented a method for improving the powerquality of a low voltage network by intelligently controllingEV charging current. The validation showed how uncontrolledEV charging can significantly reduce the power quality oflow voltage networks, especially in unbalanced networks withlong feeder lines. It is shown that EV smart charging, evenwith a simple decentralised autonomous droop controller, cansolve some of the power quality issues. The improvementsinclude reduced voltage drops at the long feeder branchesand potentially reduced VUFs in the cases of unbalancedloading. However, EVs should be integrated carefully, asshown in scenarios V and VII, since large power stepsat the nodes with poor voltage quality could introduceeven more severe problems like large voltage oscillations.Mitigating such problems requires more sophisticated controlwhich accounts for transient voltage drops or introducesinput filters. Nevertheless, it has been shown that localsmart charging controllers can improve power quality in thedistribution systems even in extreme cases. Consequently,this allows the integration of higher EV amount in thedistribution grids without the need for unplanned and costlygrid reinforcements. As the controller and the supportinginfrastructure is made from standardised components, suchcontrol schemes could potentially be integrated in the EVSEwith minimal development effort which makes such solutioneconomically attractive.
Further research will continue to investigate the effects ofthe EV charging on the power quality by expanding the listof test scenarios, implementing more sophisticated controlalgorithms and exploring the effects on other power qualityindicators, such as total harmonic distortion. Another topic
not touched upon in this work is the user comfort. Whilecontrollable charging provides improvements in the powerquality, it could potentially inconvenience the vehicle ownerby not providing required state of charge level when EV isneeded. This issue should be addressed as a part of the smartcharging algorithm allowing the user to have a convenientlycharged vehicle while still providing the voltage supportservice when EV is charging.
ACKNOWLEDGMENT
This work is supported by the Danish Research Project“NIKOLA - Intelligent Electric Vehicle Integration” underForskEL kontrakt nr. 2013-1-12088. More information atwww.nikolaproject.info.
REFERENCES
[1] R. Walling, R. Saint, R. Dugan, J. Burke, and L. Kojovic, “Summaryof distributed resources impact on power delivery systems,” PowerDelivery, IEEE Transactions on, vol. 23, no. 3, pp. 1636–1644, July2008.
[2] K. Clement-Nyns, E. Haesen, and J. Driesen, “The impact ofvehicle-to-grid on the distribution grid,” Electric Power SystemsResearch, vol. 81, no. 1, pp. 185–192, Jan. 2011.
[3] Dansk Energi, Dong Energy, and Energinet.dk, “Analysisno. 5 – Scenarios for the deployment of electricvehicles (in Danish),” Tech. Rep., 2013. [Online]. Available:http://www.danskenergi.dk/Analyse/Analyser/
[4] M. Coppo, R. Turri, M. Marinelli, and X. Han, “Voltage management inunbalanced low voltage networks using a decoupled phase-tap-changertransformer,” Power Engineering Conference (UPEC), 2014 49thInternational Universities, pp. 1–6, Sept 2014.
[5] M. Gray and W. Morsi, “Power quality assessment in distributionsystems embedded with plug-in hybrid and battery electric vehicles,”Power Systems, IEEE Transactions on, vol. 30, no. 2, pp. 663–671,March 2015.
[6] C. Jiang, R. Torquato, D. Salles, and W. Xu, “Method to assess thepower-quality impact of plug-in electric vehicles,” Power Delivery, IEEETransactions on, vol. 29, no. 2, pp. 958–965, April 2014.
[7] P. Andersen, M. Marinelli, O. Olesen, C. Andersen, G. Poilasne,B. Christensen, and O. Alm, “The Nikola project Intelligent electricvehicle integration,” pp. 1–6, Oct 2014.
[8] J. Garcıa-Villalobos, I. Zamora, J. I. San Martın, F. J. Asensio, andV. Aperribay, “Plug-in electric vehicles in electric distribution networks:A review of smart charging approaches,” Renewable and SustainableEnergy Reviews, vol. 38, pp. 717–731, 2014.
[9] W. Kempton and J. Tomic, “Vehicle-to-grid power implementation: Fromstabilizing the grid to supporting large-scale renewable energy,” Journalof Power Sources, vol. 144, pp. 280–294, 2005.
[10] S. Martinenas, A. Pedersen, M. Marinelli, P. Andersen, and C. Treaholt,“Electric vehicle smart charging using dynamic price signal,” ElectricVehicle Conference (IEVC), 2014 IEEE International, pp. 1–6, Dec2014.

IEEE TRANSACTIONS ON POWER DELIVERY 9
[11] K. Knezovic, M. Marinelli, R. Moller, P. Andersen, C. Treaholt,and F. Sossan, “Analysis of voltage support by electric vehicles andphotovoltaic in a real danish low voltage network,” Power EngineeringConference (UPEC), 2014 49th International Universities, pp. 1–6, Sept2014.
[12] K. Knezovic, P. Codani, M. Marinelli, and Y. Perez, “Distributiongrid services and flexibility provision by electric vehicles: a reviewof options,” Power Engineering Conference (UPEC), 2015 50thInternational Universities, pp. 1–6, Sept 2015.
[13] Z. Wang and S. Wang, “Grid power peak shaving and valley fillingusing vehicle-to-grid systems,” Power Delivery, IEEE Transactions on,vol. 28, no. 3, pp. 1822–1829, July 2013.
[14] S. Mocci, N. Natale, F. Pilo and S. Ruggeri, “Demand side integration inLV smart grids with multi-agent control system,” Electric Power SystemsResearch, vol. 125, pp. 23 – 33, 2015.
[15] M. Gonzalez Vaya and G. Andersson, “Centralized and decentralizedapproaches to smart charging of plug-in vehicles,” Power and EnergySociety General Meeting, 2012 IEEE, pp. 1–8, July 2012.
[16] P. Richardson, D. Flynn, and A. Keane, “Local versus centralizedcharging strategies for electric vehicles in low voltage distributionsystems,” Smart Grid, IEEE Transactions on, vol. 3, no. 2, pp.1020–1028, June 2012.
[17] S. Habib, M. Kamran, and U. Rashid, “Impact analysis of vehicle-to-gridtechnology and charging strategies of electric vehicles on distributionnetworks – a review,” Journal of Power Sources, vol. 277, pp. 205 –214, 2015.
[18] M. Singh, I. Kar, and P. Kumar, “Influence of EV on grid power qualityand optimizing the charging schedule to mitigate voltage imbalance andreduce power loss,” Power Electronics and Motion Control Conference(EPE/PEMC), 2010 14th International, pp. 196–203, Sept 2010.
[19] N. Leemput, F. Geth, J. Van Roy, A. Delnooz, J. Buscher, and J. Driesen,“Impact of electric vehicle on-board single-phase charging strategies ona Flemish residential grid,” Smart Grid, IEEE Transactions on, vol. 5,no. 4, pp. 1815–1822, July 2014.
[20] S. Weckx and J. Driesen, “Load balancing with EV chargers and PVinverters in unbalanced distribution grids,” Sustainable Energy, IEEETransactions on, vol. 6, no. 2, pp. 635–643, April 2015.
[21] J. P. Lopes, S. A. Polenz, C. Moreira, and R. Cherkaoui, “Identificationof control and management strategies for LV unbalanced microgrids withplugged-in electric vehicles,” Electric Power Systems Research, vol. 80,no. 8, pp. 898 – 906, 2010.
[22] Chattopadhyay, Surajit. and Mitra, Madhuchhanda. and Sengupta,Samarjit., “Electric power quality,” pp. 1 – 182, 2011.
[23] M. Marinelli, S. Martinenas, K. Knezovic and P. B. Andersen,“Validating a centralized approach to primary frequency control withseries-produced electric vehicles,” Journal of Energy Storage, vol. 7,pp. 63–73, 2016.
[24] P. Gnacinski, “Windings temperature and loss of life of aninduction machine under voltage unbalance combined with over- orundervoltages,” Energy Conversion, IEEE Transactions on, vol. 23,no. 2, pp. 363–371, June 2008.
[25] H. Markiewicz and A. Klajn, “Voltage disturbances standard EN 50160,”pp. 1–16, 2004.
[26] “IEEE Recommended Practice for Monitoring Electric Power Quality,”IEEE Std 1159-1995, 1995.
[27] IEC TC69, “IS 61851-1:2010 Ed. 2.0,” IEC Standard, 2010.[28] K. Strunz, N. Hatziargyriou, and C. Andrieu, “Benchmark systems for
network integration of renewable and distributed energy resources,”Cigre Task Force C, vol. 6, pp. 04–02, 2009.
Sergejus Martinenas (S’14) was born in Elektrenai,Lithuania, in 1989. He received a BSc degree inmechatronics engineering from the University ofSouthern Denmark in 2011, and an MSc degree inelectrical engineering from the Technical Universityof Denmark in 2014. He is currently pursuing thePh.D. degree in electrical engineering at DTU.
His research focuses on enabling technologies forelectric vehicle integration into smart grids.
Katarina Knezovic (S’13) was born in Zagreb,Croatia, in 1989. She has received her BSc and MScdegrees in electrical engineering from the Universityof Zagreb, Croatia, in 2011 and 2013 respectively.She is currently pursuing a Ph.D. degree in electricalengineering at DTU.
Her research interests include power-systemmodeling, distribution networks, grid-coupling ofelectric vehicles, and the services they can provide,both in local and system-wide cases.
Mattia Marinelli (S’10-M’12) was born in Genova,Italy, in 1983. He received BSc and MSc degrees inelectrical engineering from the University of Genovain 2005 and 2007. In March 2011 he achieved theEuropean Ph.D. degree in power systems. SinceSeptember 2012 he has been with the TechnicalUniversity of Denmark (DTU).
His research regards power system integrationstudies, wind and solar data analysis, electricvehicles and distributed energy resources modeling.

Pub. H. Electric Vehicle Smart Chargingusing Dynamic Price Signal
155

Electric Vehicle Smart Charging using DynamicPrice Signal
Sergejus Martinenas, Anders Bro Pedersen, Mattia Marinelli, Peter Bach Andersen and Chresten TræholtCenter for Electric Power and Energy, DTU - Technical University of Denmark
Contact Person: Sergejus Martinenas, [email protected]
Abstract—With yearly increases in Electric Vehicle (EV)sales, the future for electric mobility continues to brighten,and with more vehicles hitting the roads every day, theenergy requirements on the grid will increase, potentiallycausing low-voltage distribution grid congestion. This problemcan, however, be resolved by using intelligent EV chargingstrategies, commonly referred to as ”Smart Charging”. Thebasic approach involves modifying the default vehicle chargingscheme of ”immediate charging”, to a more optimal one thatis derived from insight into the current state of the grid.This work proposed in this paper, involves a real-time controlstrategy for charging the EV using a dynamic price tariff, withthe objective of minimizing the charging cost. Two differentcharging scenario are investigated, and the results are verified byexperiments on a real Electric Vehicle. Finally, the costs of theproposed solutions are compared to the default charging scheme.
Keywords – Smart Charging, Smart Grid, Price Signal, DynamicTariff, Electric Vehicles, Information and Communication Technol-ogy
I. INTRODUCTION
The balance between production and consumption in theelectrical grid has to be maintained at all times.With thenumber of EVs continuing to grow, their charging will keepadding to the load on the grid. To that effect, having too muchuncontrolled charging could have a devastating impact on thegrid balance, potentially increasing the load on the system tothe level of congestion in some time periods. Today’s DanishLow-Voltage 0.4 kV grid infrastructure is only capable of sup-porting only up to 30%-40% of EV penetration when chargingat night [1]. Assuming that EVs are charging on a single phaseand using 16A. Higher charging rates and number of vehicleswould create grid congestion. Two immediate solutions existto aid a higher penetration: to simply reinforce the grid alongwith the increase in load or intelligently integrate EVs bycontrolling their charging power, in order to even out the loadon the grid. The method for modifying Electric Vehicle powerconsumption in response to grid dynamics is similar to themethod, that is commonly used with other electric appliances:this method is known as ”Demand Response” [2] [3]. Arelatively new way to control the electricity demand is by usingdynamic price signals. The price signal is based on the results
This work is supported by the Danish Research Project “NIKOLA -Intelligent Electric Vehicle Integration”- under ForskEL kontrakt nr. 2013-1-12088. More information (www.nikolaproject.info).
of the EcoGrid EU project, that strives to create a real-timeelectricity price market based on actual renewable generationand power consumption. Controllers in the devices react tochanges in a broadcasted electricity price and adjusts theirconsumption accordingly. This approach is especially viablefor EVs, because their consumption is limited by the size ofthe battery and usage patterns are predictable.
This work focuses on the design and testing of a platform,using numerical simulation and real-world EV implementa-tions.
The paper is organized as follows: Section II presents anoverview of all the elements of the smart charging system.Section III describes the test cases used in the work. Section IVpresents the simulation and testing results. Section V discussesthe results as well as the potential commercial applications.
II. SMART CHARGING
Smart Charging is the ability of an EV to be chargedaccording to predefined schedule [4] or in response to anexternal signal e.g. the electricity price. EVs could be chargedin a smart way, taking into account the grid capacity anduser demand. This would solve the biggest problem forEV integration into the power grid - grid congestion, thusallowing higher EV penetration rate. This would be possiblewithout major grid reinforcements, which carries substantialeconomic benefits [5]. There are multiple ways to implementSmart Charging control: either by limiting the charging ratevia the Electric Vehicle Supply Equipment (EVSE), usingthe IEC61851 standard pilot communication or by directlycontrolling the power of the vehicle charger. In this paper, thesmart charging is achieved using direct EV build-in chargerpower control.
A. System Design
To implement the smart charging service, the system needsto include a controllable EV connected to the grid via an EVSEas well as a built-in smart charging controller.
The specific testing platform developed and described inthis paper, was built using following components:
• EV - DTU and UD modified AC Propulsion eBox with35kWh battery and Power Electronics Unit (PEU) capa-ble of single phase bidirectional power transfers of upto 20kW [6]. It is controlled by the EV computer thatinterfaces with the PEU using a small build-in embedded

computer referred to as the Vehicle Smart Link (VSL)[7].
• VSL - an embedded computing interface, used for medi-ating the communication with the eBox PEU, in whichit is housed. Additionally, the VSL is responsible forimplementing IEC 61851 standard, allowing the vehicleto function with a standard EVSE.
• eBox Pollserver - vehicle monitoring/control server withRESTful Application Programming Interface (API). Runson the vehicle computer and is used for remote and localcontrol.
• EVSE - technical term for charging spot, in this casecustom built with a maximum 32A charging current.
• Smart Charging Controller - runs on an external net-work connected computer, which performs the followingfunctions:
– monitoring the price stream and the EV status– calculating and updating the charging schedule– dispatching control signals to the EV
• EcoGrid Price Streams - dynamic tariff based on currentand predicted future grid status. For simplicity, and re-playability, this setup was implemented using a recordingof the price signal streams for last year [8].
The testing system developed in this work, described indetail above, is shown the diagram in Fig. 1.
Fig. 1. Smart charging experimental setup
While not explicitly shown, all of the system componentsdepicted in Fig. 1, have communication interfaces for controland data exchange.
B. EcoGrid Price Signal
Smart charging is implemented according to the EcoGridprice signal [9]. These prices are generated based on the NordPool spot, adjusted using the immediate as well as predictedgrid state. Something which, especially in Denmark, is largelydictated by the wind conditions [10]. As previously stated aswell as depicted in Fig. 1, the controller is getting the priceupdates from a prerecorded price stream. In this interface thelive price update is emulated, by extracting new values fromthe price history using the moving window.
The EcoGrid price stream consists of three price streams:• Real-time price - the actual electricity price, used for
calculating the electricity bill, updated every 5 minutes• Hour ahead price - a collection of 5 minute electricity
price predictions for the next hour, updated once an hour• Day ahead price - a collection of hourly price predictions
for next 24 hours, updated once a daySince the prices are provided for different time slots in three
different streams, the combined price for the next 24 hours iscomposed as shown in Fig. 2. This combined price stream isuseful for determining actual electricity price and predictingits’ variation for next 24 hours.
Fig. 2. EcoGrid price timing
The aggregated price signal consists of available priceinformation from each price stream. As real-time price is onlyavailable and updated every 5 minutes it represents only asmall part in the beginning of the signal. The other two pricestreams are updated once an hour and once a day. The firsthour ahead price is placed right after the real-time price. Thefirst value of a hour-ahead price is substituted by the real-timeprice, producing a combined price signal for following hour.Likewise, the day ahead price is added to the combined pricesignal extending it to the next day. This way each price streamoccupies the time slot closest to real-time. The consumer paysthe electricity bill according to the real-time price.
Figures 3 and 4 show samples of the EcoGrid price stream,from a zoomed out as well as a more detailed view.
Jan 01 2014 Jan 02 2014 Jan 03 2014 Jan 04 2014 Jan 05 2014 Jan 06 2014 Jan 07 2014 Jan 08 2014Time
0
50
100
150
200
250
Pri
ce (
DK
K/M
Wh)
Real-time priceHour-ahead priceDay-ahead price
Fig. 3. EcoGrid price streams
The first trend noticeable in Fig. 3 is the periodic electricityprice fluctuation: it is high during the day, then it falls in

the late evening and stays low until early morning. Anotherunusual detail is that, the electricity price sometimes goesbelow zero twice in the shown time period, specifically onJanuary 2 and January 7. It can be explained by energyoverproduction from renewable resources, particularly windfarms.
04:00:00 06:00:00 08:00:00 10:00:00 12:00:00 14:00:00 16:00:00 18:00:00 20:00:00 22:00:00 00:00:00Time
160
180
200
220
240
260
Pri
ce (
DK
K/M
Wh)
Real-time priceHour-ahead priceDay-ahead price
Fig. 4. EcoGrid price stream close up view
C. Electric Vehicle Communication
The EV computer is running an application, which eitherreturns the measurement upon request or receives and pro-cesses requests from the controller into updated EV chargecommands the VSL board. The VSL in turn is runningan application, which acts as an interface, translating andforwarding those commands to the PEU unit. The higher levelcommunication is implemented based on HyperText TransferProtocol (HTTP). On the embedded side of the system (onthe VSL and below) communication changes to serial UART,which is a common component used in industry for suchapplications.
The full communication path from the controller to the PEUis shown in Fig. 5.
Fig. 5. Control message path from smart charging controller to the PEU
As shown in the Fig. 5, high level communication hasbeen implemented for communication with the EV usingRESTful architecture. REpresentational State Transfer (REST)is a software architectural style rather than a communicationprotocol. It was first described in the PhD thesis of R.Fieldingback in 2000 [11]. The most profound difference betweenREST and other more traditional web services, is that datais presented strictly as a resource and not through a listof functions. It, in other words, ignores the implementationdetails of the component and protocol, focusing on their roles,interaction and interpretation. of significant data elements.RESTful services has successfully been used in power systemarchitectures in the past, mapping existing standards such asIEC61850 [12].
The communication protocol is kept as simple and clear aspossible to ease later expansion and higher level applicationssuch as IEC15118.
The structure of the RESTful Unique Resource Identifier(URI) request, designed for this work, is shown in Fig. 6.
Fig. 6. RESTful URI request structure
Following is the RESTful API communication example: Toread the measurements or parameters of the EV, an HTTPGET request is sent to the URI:
http://ebox:8080/measurements
The response received is formatted in JavaScript ObjectNotation (JSON):
"System_Time": 1399382195,"Line_V": 229.000000, "SOC": 67,"Max_C_Amps": 31, "Max_D_Amps": 31,"Requested_Mode": 1, "Actual_Mode": 1,"Requested_Amps": -1.000000,"Actual_Amps": -1.200000, "Error": 0
For setting new control parameters, such as charging currentor operation mode, a HTTP POST or PUT request is sent.For example, to update the charging current to -16A (negativevalues indicate charging), the HTTP POST request is sent tothe following URI:
http://ebox:8080/Requested_Amps=-16
This RESTful API is used by the controller application toread the data and control the EV.
D. Charging OptimizationThe Smart Charging simulation and experimental opti-
mization code was written in Python using the PuLP linearoptimization library [13].

The basic algorithm used for the smart charging controller,is outlined in Algorithm 1 below:
while true doread and process price stream data;read the actual EV State of Charge (SOC);calculate the optimal charging schedule;actuate charging power for the EV
(Pch
);
wait for 5 minutesend
Algorithm 1: Smart Charging Control
Prices for the charging period are read from the databasewith the structure presented in Fig. 2. The charging cost is thenformulated as a linear programming problem for minimization,as shown in Equation 1. The constraints used are listed inEquations 2 and 3.
TotalPricecharge =
N∑
i=1
(5
60· poweri · pricei
)(1)
Estart +
N∑
i=1
(5
60· Pi · η
)≤ Ecapacity (2)
Eend +N∑
i=1
(5
60· Pi · η
)≥ Etarget (3)
where Estart and Eend represent energy in the battery atthe plug-in and plug-out times respectively. Etarget is theenergy requirement for the battery at the time of plug-out.Pi is the charging power for the time interval i. N is numberof 5 minute intervals from plug-in to plug-out. Because theexperiments were run with a SOC between 30 to 90%, a linearmodel was sufficient, since the battery can be charged withconstant power in that range [14].
III. TEST CASES
The smart charging implementation was tested using twotest cases. The input parameters for the two test cases, consist-ing of simulation and a real-world experiment, are summarizedin Table I.
TABLE ISMART CHARGING TEST PARAMETERS
Case Plug-in Time Plug-out Time Start SOC Target SOC
1 17:00 01:00 60% 90%
2 22:00 08:00 56% 90%
The two cases show smart charging performance for differ-ent time slots. In case one, the charging is done in the lateevening hours and in case two it is done overnight. Similarstarting SOC are used along with the same target SOC of90%.
IV. RESULTS
This section describes test results from the smart charginguse cases. In both cases an optimal charging schedule wasgenerated by the algorithm according to the supplied pricesignal.
A. Simulation
Simulation results for case one, where smart charging wasperformed in the evening, is shown in Fig. 7.
18:00:00
19:00:00
20:00:00
21:00:00
22:00:00
23:00:00
00:00:00
01:00:00
Time
0
1
2
3
4
5
6
7
8
Pow
er
(kW
)
0.08
0.10
0.12
0.14
0.16
0.18
0.20
0.22
0.24
0.26
Pri
ce (
DK
K/k
Wh)
Power
Price
SOC
60
65
70
75
80
85
90
95
SO
C (
%)
Fig. 7. Smart Charging simulation results for case 1
As can be seen from the figure, the vehicle is plugged infor a whole 7 hours and needs around 2 hours to charge tothe target SOC. The smart charging optimization controllerproduced a schedule that charges the vehicle mainly in theend of the plugged-in time slot. That is due to lower electricityprice in that period.
Similar simulation for case two, where smart charging wasperformed overnight, can be seen in Fig. 8.
23:00:00
00:00:00
01:00:00
02:00:00
03:00:00
04:00:00
05:00:00
06:00:00
07:00:00
08:00:00
Time
0
1
2
3
4
5
6
7
8
Pow
er
(kW
)
0.02
0.04
0.06
0.08
0.10
0.12
0.14
0.16
0.18
0.20
Pri
ce (
DK
K/k
Wh)
Power
Price
SOC
55
60
65
70
75
80
85
90
95
SO
C (
%)
Fig. 8. Smart Charging simulation results for case 2
As can be seen form the results in Figures 7 and 8, the EVis being charged primarily at the lower price values. However,it can also be seen that ,for case one, the charging cost isnot absolutely minimal, which is due to the fact that thereal-time price differed from the day ahead- and hour aheadpredictions, resulting in unexpected change to the originalcharging schedule.

B. Experiment
After the simulations were performed, a real-world testbench was set up, using the testing system diagram fromFig. 1.
The results of test case one, the evening charging experi-ment, are plotted in Fig. 9.
17:00:00
18:00:00
19:00:00
20:00:00
21:00:00
22:00:00
23:00:00
00:00:00
Time
1
0
1
2
3
4
5
6
7
Pow
er
(kW
)
0.08
0.10
0.12
0.14
0.16
0.18
0.20
0.22
0.24
0.26
Pri
ce (
DK
K/k
Wh)
Power
Price
SOC
50
55
60
65
70
75
80
85
90
SO
C (
%)
Fig. 9. Smart Charging experiment results for case 1
The final value of SOC in Fig. 9 shows that the vehicle didnot reach the target, by plug-out time. It can be explained bythe fact that charging efficiency of the real charger was notconsidered in the vehicle battery charger model. The chargingpattern closely resembled the simulated case. The initial dropof in SOC before charging begins, can be explained by the idlepower consumption of the PEU as well as the active coolingsystems in the vehicle.
In the case two, the experiment with overnight charging,shown in Fig. 10, displays better results.
22:00:00
23:00:00
00:00:00
01:00:00
02:00:00
03:00:00
04:00:00
05:00:00
06:00:00
07:00:00
Time
1
0
1
2
3
4
5
6
7
Pow
er
(kW
)
0.02
0.04
0.06
0.08
0.10
0.12
0.14
0.16
0.18
0.20
Pri
ce (
DK
K/k
Wh)
Power
Price
SOC
50
55
60
65
70
75
80
85
90
95
SO
C (
%)
Fig. 10. Smart Charging experiment results for case 2
In this case, the battery model was improved to accountfor charger efficiency, which means the vehicle battery suc-cessfully reached the target SOC before plug-out time. Thecharging is happening during the cheapest time slots, whichclosely resembles the simulated case. The small chargingpeaks present after the vehicle has reached target SOC, is thecontroller trying to maintain the battery at the target SOC. Thereason for the drops, are the same as previously mentionedregarding PEU idle consumption and active cooling system.The idle power consumption could be minimized by puttingthe vehicle into sleeping mode once the charging is complete,as well as adjusting the thermal regulation of the battery.
All tests were performed in SYSLAB1 as part of NIKOLAproject.
The energy required and charging cost results are summa-rized in Table II.
TABLE IISMART CHARGING COST SUMMARY
Case Energy Needed Energy Used Charging Cost
S1 11.66 kWh 9.88 kWh 1.043 DKK
S2 13.22 kWh 14.01 kWh 0.556 DKK
D1 11.66 kWh 11.66 kWh 2.682 DKK
D2 13.22 kWh 13.22 kWh 1.060 DKK
The first two rows, marked as S1 and S2, show the chargingcosts of smart charging. The last two lines, marked as D1and D2, show the corresponding costs using the conventional”dumb charging”. The first thing to notice, is that smartcharging reduces the cost of charging with more than a factortwo. The other noticeable thing is that charging in generalis rather cheap. That is due to the fact that these pricesare derived from bulk electricity prices, and therefore do notinclude various taxes. However, even after adding taxes, theeconomic benefit of smart charging versus regular charging,would be still noticeable.
V. DISCUSSION
The results of smart charging have shown that it is possi-ble to effectively regulate EV charging rates, to avoid gridcongestion and achieve lower charging costs compared tonormal charging. At the same time, it is possible to maintainuser comfort i.e., making vehicle ready for the next trip withthe desired SOC at the preferred time. However, as shownin this work, the comfort level can be reached only whenusing accurate estimation models for battery charger and userbehavior [15]. This work brings the smart charging closestto real-commercial application. A few high-end EVs modelsalready have a similar remote control interface for checkingSOC and setting charging power [16].
Further developments of this work would enable this ap-proach to be applied in real-world field tests. Improved chargerand battery models with non-linear components, would allowfor the smart charging of the battery all the way from 0 to100% SOC. Realistic and sophisticated user behavior predic-tion model, would aid accurate prediction of plug-in and plug-out times. Accounting hour and day ahead price predictionquality would make even more optimal charging schedulesand hence cheaper charging.
1SYSLAB is a laboratory for intelligent distributed power systems atTechnical University of Denmark, Risø campus, it is a part of PowerLabDK(www.powerlab.dk).

REFERENCES
[1] F. Marra and M. Jensen, “Power quality issues into a Danish low-voltagegrid with electric vehicles,” Electrical Power Quality and Utilisation(EPQU), 2011 11th International Conference on, pp. 1–6, 2011.
[2] O. Ma, N. Alkadi, P. Cappers, P. Denholm, J. Dudley, S. Goli, M. Hum-mon, S. Kiliccote, J. MacDonald, N. Matson, D. Olsen, C. Rose,M. Sohn, M. Starke, B. Kirby, and M. O’Malley, “Demand responsefor ancillary services,” Smart Grid, IEEE Transactions on, vol. 4, no. 4,pp. 1988–1995, Dec 2013.
[3] F. Sossan and M. Marinelli, “An auto tuning substation peak shavingcontroller for congestion management using flexible demand,” in PowerEngineering Conference (UPEC), 2013 48th International Universities’,Sept 2013, pp. 1–5.
[4] A. Aabrandt, P. Andersen, A. Pedersen, S. You, B. Poulsen,N. O’Connell, and J. Østergaard, “Prediction and optimization methodsfor electric vehicle charging schedules in the edison project,” 2012 IEEEPES Innovative Smart Grid Technologies (ISGT), 2012.
[5] Energinet, “Smart Grid in Denmark,”http://www.energinet.dk/en/forskning/energinet-dks-forskning-og-udvikling/Smart-Grid/Sider/default.aspx, Tech. Rep.
[6] “AC Propulsion eBox,” http://www.futurecars.com/reviews/ebox.html.[7] University of Delaware, “The Grid-Integrated Electric Vehicle,” Tech.
Rep.[8] “EU EcoGrid Project,” http://www.eu-ecogrid.net/.[9] D. Gantenbein, C. Binding, B. Jansen, A. Mishra, and O. Sundstrom,
“EcoGrid EU: An efficient ICT approach for a sustainable powersystem,” in Sustainable Internet and ICT for Sustainability (SustainIT),2012, Oct 2012, pp. 1–6.
[10] Z. Xu, M. Gordon, M. Lind, and J. Ostergaard, “Towards a Danish powersystem with 50% wind - Smart Grids activities in Denmark,” in PowerEnergy Society General Meeting, 2009. PES ’09. IEEE, July 2009, pp.1–8.
[11] R. T. Fielding, “Architectural styles and the design of network-basedsoftware architectures,” Ph.D. dissertation, 2000, AAI9980887.
[12] A. Pedersen, E. Hauksson, P. Andersen, B. Poulsen, C. Træholt, andD. Gantenbein, “Facilitating a Generic Communication Interface to Dis-tributed Energy Resources: Mapping IEC 61850 to RESTful Services,”in Smart Grid Communications (SmartGridComm), 2010 First IEEEInternational Conference on, Maryland, 17-20 Oct 2010, pp. 61–66.
[13] “Python PuLP,” https://code.google.com/p/pulp-or/.[14] F. Marra, G. Yang, and C. Træholt, “Demand profile study of battery
electric vehicle under different charging options,” Power and EnergySociety General Meeting, 2012 IEEE, pp. 1–7, 2012.
[15] J. Iversen and J. Mø ller, “Inhomogeneous Markov Models for Describ-ing Driving Patterns,” 2013.
[16] “Unofficial Tesla Model S JSON REST API,”http://docs.timdorr.apiary.io/.


Pub. I. Analysis of needs for on-going orincipient standards. Design of Round Robintests and results of the performed tests.Recommendations for existing standards
163