Embed Size (px)
Citation preview
General rights Copyright and moral rights for the publications made accessible in the public portal are retained by the authors and/or other copyright owners and it is a condition of accessing publications that users recognise and abide by the legal requirements associated with these rights.
Users may download and print one copy of any publication from the public portal for the purpose of private study or research.
You may not further distribute the material or use it for any profit-making activity or commercial gain
You may freely distribute the URL identifying the publication in the public portal If you believe that this document breaches copyright please contact us providing details, and we will remove access to the work immediately and investigate your claim.
Downloaded from orbit.dtu.dk on: May 30, 2022
Production of methanol/DME from biomassEFP06
Ahrenfeldt, Jesper; Henriksen, Ulrik Birk; Münster-Swendsen, Janus; Fink, Anders; Clausen, LasseRøngaard; Christensen, Jakob Munkholt; Qin, Ke; Lin, Weigang; Jensen, Peter Arendt; Jensen, AnkerDegn
Publication date:2011
Link back to DTU Orbit
Citation (APA):Ahrenfeldt, J., Henriksen, U. B., Münster-Swendsen, J., Fink, A., Clausen, L. R., Christensen, J. M., Qin, K., Lin,W., Jensen, P. A., & Jensen, A. D. (2011). Production of methanol/DME from biomass: EFP06. DanmarksTekniske Universitet, Risø Nationallaboratoriet for Bæredygtig Energi. CHEC No. R1107
2
Table of Contents
Abstract ......................................................................................... 3
Resumé .......................................................................................... 4
Personnel ....................................................................................... 5
Publication list ............................................................................... 5
1. Project background ........................................................... 6
2. Objectives.......................................................................... 8
3. Tasks .................................................................................. 9
4. Summary of results ......................................................... 11
5. Conclusions ..................................................................... 17
Appendix A. Methanol production from gasified biomass ........................................... 18
Appendix B. Methanol/DME production based on the Two-Stage Gasifier ............... 118
Appendix C. DME production based on entrained flow gasification of biomass ....... 135
Appendix D. Modification of the Entrained Flow Reactor for Gasification Experiments ................................................................................................................. 148
Appendix E. Atmospheric pressure entrained flow gasification of biomass .............. 160
Appendix F. Influence of operating conditions on gas composition, soot and tar in entrained flow gasification of biomass ................................................... 226
Appendix G. Synthesis of liquid fuels from biomass in a Danish context ................... 238
3
Abstract In this project the production of DME/methanol from biomass has been investigated. Production of DME/methanol from biomass requires the use of a gasifier to transform the solid fuel to a synthesis gas (syngas) - this syngas can then be catalytically converted to DME/methanol. Two different gasifier types have been investigated in this project: • The Two-Stage Gasifier (Viking Gasifier), designed to produce a very clean gas to be
used in a gas engine, has been connected to a lab-scale methanol plant, to prove that the gas from the gasifier could be used for methanol production with a minimum of gas cleaning. This was proved by experiments. Thermodynamic computer models of DME and methanol plants based on using the Two-Stage Gasification concept were created to show the potential of such plants. The models showed that the potential biomass to DME/methanol + net electricity energy efficiency was 51-58% (LHV). By using waste heat from the plants for district heating, the total energy efficiencies could reach 87-88% (LHV).
• A lab-scale electrically heated entrained flow gasifier has been used to gasify wood and straw. Entrained flow gasifiers are today the preferred gasifier type for commercial coal gasification, but little information exists on using these types of gasifiers for biomass gasification. The experiments performed provided quantitative data on product and gas composition as a function of operation conditions. Biomass can be gasified with less oxygen consumption compared to coal. The organic fraction of the biomass that is not converted to gas appears as soot. Thermodynamic computer models of DME and methanol plants based on using entrained flow gasification were created to show the potential of such plants. These models showed that the potential torrefied biomass to DME/methanol + net electricity energy efficiency was 65-71% (LHV).
Different routes to produce liquid transport fuels from biomass are possible. They include production of RME (rapeseed oil methyl ester), ethanol from fermentation or gasification based synthesis of DME, methanol, Fisher Tropsch fuels etc. A comparison of these different methods to provide biomass based transport fuels has shown that the gasification based route is an attractive and efficient technology.
4
Resumé I dette projekt undersøges produktion af DME/metanol ud fra biomasse. Produktion af DME/metanol ud fra biomasse indbefatter brugen af en forgasser for at transformere det faste biomassebrændsel til en syntesegas (syngas) - denne syngas kan herefter katalytisk konvertes til DME/metanol. To forskellige forgassertyper er blevet undersøgt i dette projekt: • To-trins-forgasseren (Viking Forgasseren), som blev designet til at producere en
meget ren gas til brug i en gas motor, er blevet forbundet til et lab-scale metanolanlæg for at vise, at den rene forgasningsgas kan bruges til metanolproduktion med et minimum af gasrensning. Dette blev eftervist ved eksperimenter. Termodynamiske computermodeller af DME- og metanol-anlæg baseret på at bruge to-trins forgasningsprocessen blev lavet for at undersøge potentialet for sådanne anlæg. Modellerne viste at anlæggene kunne konvertere 51-58% (LHV) af energien i biomassen til DME/metanol + elektricitet (netto). Ved at bruge spildvarmen fra anlæggene til fjernvarmeproduktion, blev der opnået totalvirkningsgrader på 87-88% (LHV).
• En lab-scale elektrisk opvarmet entrained flow forgasser er blevet brugt til forgasning af træ og halm. Entrained flow forgassere er i dag den foretrukne forgassertype til kommerciel kulforgasning, men man har kun begrænset erfaring med brug af denne forgassertype til forgasning af biomasse. De udførte eksperimenter gav kvantitative data om produkt- og gas-sammensætning som funktion af driftbetingelserne. Biomasse kan forgasses med et mindre ilt-forbrug sammenlignet med kul. Den organiske del af biomassen som ikke omdannes til gas omdannes til sod. Termodynamiske computermodeller af DME- og metanol-anlæg baseret på at bruge entrained flow forgasning af biomasse blev lavet for at undersøge potentialet for sådanne anlæg. Modellerne viste at anlæggene kunne konvertere 65-71% (LHV) af energien i torreficeret biomasse til DME/metanol + elektricitet (netto).
Der findes flere forskellige måder hvorpå flydende brændstoffer til transportsektoren kan produceres ud fra biomasse. De omfatter produktion af RME (rapeseed oil methyl ester), etanol produceret ved fermentering, og forgasningsbaserede brændstoffer som DME, metanol og Fisher Tropsch brændsler osv. En sammenligning af disse forskellige metoder har vist, at de forgasningsbasere ruter er attrative og energieffektive.
5
Personnel National Laboratory for Sustainable Energy (Risø DTU) Senior Scientist Jesper Ahrenfeldt Associate professor Ulrik Birk Henriksen Department of Mechanical Engineering (DTU Mekanik - MEK) Student Janus Münster-Swendsen Student Anders Fink PostDoc Lasse Røngaard Clausen Department of Chemical and Biochemical Engineering (DTU Kemiteknik - KT) Student Jakob Munkholt Christensen Ph.D student Ke Qin Associate professor Weigang Lin Associate professor Peter Arendt Jensen Professor Anker Degn Jensen
Publication list (all publications are appended this report) A. Münster-Swendsen J, Fink A. “Methanol production from gasified biomass”.
Bachelor report, Department of Mechanical Engineering, Technical University of Denmark, 2007.
B. Clausen LR, Elmegaard B, Ahrenfeldt J, Henriksen U. “Thermodynamic analysis of small-scale DME and methanol plants based on the efficient Two-stage gasifier”. Submitted to Energy (manuscript number: EGY-D-11-00180), 2011.
C. Clausen LR, Elmegaard B, Houbak N. “Technoeconomic analysis of a low CO2 emission dimethyl ether (DME) plant based on gasification of torrefied biomass”. Energy 2010;35(12):4831-4842.
D. Weigang Lin. Report: Modification of the Entrained Flow Reactor for Gasification Experiments.
E. Ke Qin, Weigang Lin, Peter Arendt Jensen, Anker Degn Jensen. Report: Atmospheric pressure entrained flow gasification of biomass.
F. Ke Qin, Weigang Lin, Peter Arendt Jensen, Anker Degn Jensen, Helge Egsgaard. Conference paper: Influence of operating conditions on gas composition, soot and tar in entrained flow gasification of biomass. International Conference on Polygeneration strategies, Vienna, September 2009.
G. Jakob Munkholt Christensen, Anker Degn Jensen, Peter Arendt Jensen. Report: synthesis of liquid fuels from biomass in a Danish context (Syntese af væskeformige brændsler fra biomasse i en dansk kontekst). (in danish)
6
1. Project background Research in the production of DME/methanol from biomass is promoted by the Danish Energy Agency in they bio-fuel strategy (”Strategi for forskning og udvikling vedr. fremstilling af flydende biobrændsler”). A main research area is the use of the two-stage biomass gasification concept (e.g. the “Viking Gasifier”) for production of syngas that can be used for DME/methanol production. The reason why the Two-Stage Gasifier is suited for DME/methanol production is that the gas is very clean, and that the energy efficiency of the gasifier is very high. The two-stage biomass gasification concept is demonstrated at 70 kWth (the “Viking Gasifier”) and at 700 kWth. Both gasifiers are air-blown and operate at atmospheric pressure. The Viking Gasifier is situated at Risø DTU and has been in operation for over 4000 hours. The two-stage biomass gasification concept could especially be suited for once-through synthesis because of the high content of inerts due to air-blown gasification. In a once-through plnat, the unconverted syngas could be used in a gas engine to produce electricity, and the plant waste heat could be used for district heating. Such a plant could achieve a high total energy efficiency. The ratio between liquid fuel and electricity production can also be changed according to the demand for electricity. A main supplier of technology for DME/methanol synthesis, and of syngas cleaning technology, is Haldor Topsøe. Equipment from Haldor Topsøe is used in a lab-scale methanol synthesis plant situated near the “Viking Gasifier”. This lab-scale methanol plant has been operated on a bottle gas mixture simulating the gas composition from the “Viking Gasifier”. Pressurized entrained flow gasification of biomass can be an important process in a future renewable energy supply system. The technology can be utilized in different concepts, or combination of concepts, to obtain an optimal use of biomass and thereby minimize fossil fuel CO2 emissions. Some possible energy conversion plants that could use the pressurized entrained flow gasification are:
• Plants to produce transport fuels from Biomass. A synthesis gas rich in H2 and CO are produced in the gasifier and the gas is used to make a catalytic based production of methanol, DME or gasoline.
• The technology can be used for electricity production with a high efficiency in an integrated gasification combined cycle plant (IGCC)
• The entrained flow gasifier can be used as a ‘pre-combustion’ technology for CO2 sequestration. The produced gas is led to a shift reactor whereby CO is removed and CO2 and H2 are produced. The CO2 is sequestered and the H2 is used for electricity production using a combustion process that only produces water.

7
The entrained flow gasification technology is normally used in large pressurized oxygen blown units that apply coal as fuel. No commercial large scale biomass entrained flow gasifiers are operated presently. Entrained flow gasifiers have lower energy efficiency than what is achieved with the two-stage biomass gasification concept, but the use of entrained flow gasifiers enable a higher conversion of the syngas to DME/methanol.
8
2. Objectives The objectives were:
• To prove that the gas from the “Viking Gasifier” can be used for DME/methanol production with a minimum of gas cleaning. Eventual problems related to the use of the gas from the “Viking Gasifier” with the synthesis and gas cleaning equipment supplied by Haldor Topsøe were identified.
• To model DME/methanol plants based on: 1. the two-stage biomass gasification concept, and 2. large-scale entrained flow gasification of torrefied biomass. The models were used for prediction of achievable energy efficiencies. The results from the models were compared.
• To investigate the possibilities to make efficient entrained flow gasification of biomass by performing experiments with an atmospheric pressure electrically heated laboratory entrained flow reactor, and investigate how reactor operation conditions influence the composition of the product gas.
• To compare different technologies used for production of transport fuels from biomass by doing a literature review.
9
3. Tasks Task 1: Synthesis of DME/methanol with gas from the “Viking Gasifier” (experimental – Risø/MEK) The exsisting lab-scale methanol synthesis plant located at Risø was used to produce methanol from a syngas generated from bottled gas. Different syngas compositions were tested. The “Viking Gasifier” was then connected to the lab-scale methanol synthesis plant and methanol was produced. The results from the tests were compared, mainly regarding the methanol yield. The effect of adding a CO2 removal step (potassium hydroxide pills) before the methanol synthesis was investigated. Note: The original plan included operation of the methanol plant (“Viking Gasifier“ + methanol synthesis) for more than a 1000 hours, to investigate the long-term effects on the gas cleaning and synthesis equipment (e.g. catalyst deactivation). This was, in agreement with EFP, reduced to short proof-of-concept tests. Task 2: Modeling of DME/methanol plants (MEK/Risø) Numerical models of DME/methanol plants, based on using a two-stage biomass gasifier, were created. The models were used for prediction of the achievable energy efficiencies. The following plant concepts were investigated:
• Once-through methanol synthesis • Once-through DME synthesis • Recycle methanol synthesis • Recycle DME synthesis
The different plant concepts were compared on the methanol/DME yield and on the co-production of electricity and district heating. The results from the modeling of DME/methanol plants based on the two-stage biomass gasification concept were compared with results from numerical models of DME/methanol plants based on entrained flow gasification of biomass. Task 3: Modification of entrained flow reactor (KT) The CHEC high temperature entrained flow reactor was constructed to perform experiments with combustion, ash transformation and pyrolysis of solid fuels in a suspension flow reactor mode. In the present project, the reactor is used to perform experiments on biomass gasification at entrained flow gasifier conditions. Major modifications of the reactor included steam injection, adequate solid and gas sampling of the product gas and modification of the safety system.
10
Task 4: Entrained flow gasification of biomass (experimental - KT) The optimal gasification process on an entrained flow gasifier should provide a gas for liquid fuel synthesis with a high content of CO and H2 and with a minimal content of larger hydrocarbons, tar and soot. Entrained flow gasification of biomass was investigated by performing laboratory experiments and equilibrium calculations. Experiments with gasification of two types of biomass, wood and straw, were performed in the CHEC atmospheric pressure electrically heated entrained flow reactor. Additionally a few experiments with coal gasification were performed. Task 5: Comparison of different methods to produce transport fuels from biomass (KT) Different routes to produce liquid transport fuels from biomass are possible. They include production of RME (rapeseed oil methyl ester), ethanol from fermentation or gasification based synthesis of DME, methanol, Fisher Tropsch fuels etc. The energy efficiency and the CO2 reduction potential of the different technologies have been calculated. This was done by calculation of the possible obtainable transport distance by applying the biomass from one hectare using a specific conversion technology.
11
4. Summary of results Task 1: Synthesis of DME/methanol with gas from the “Viking Gasifier” (experimental – Risø/MEK) The exsisting lab-scale methanol synthesis plant was used to produce methanol from a syngas generated from bottled gas. When using a syngas composition similar to the syngas composition expected from the “Viking Gasifier” - with CO2 removal – 14.6 g of methanol was produced over a period of 30 minutes. When coupling the “Viking Gasifier” to the lab-scale methanol plant, without CO2 removal, 2.9 g of methanol was produced over a period of 30 minutes. The CO2 removal system based on using potassium hydroxide pills did not work probaply. This meant that only 0.3 g of methanol was produced over a period of a few minutes when the CO2 removal system was coupled to the “Viking Gasifier”. These results therefor show that it is possible to produce methanol based on a gas generated by a two-stage gasifier such as the “Viking Gasifier”. The results also show that the methanol yield depends greatly on the CO2 content of the syngas - as expected. The long-term effects of using a gas generated by a two-stage gasifier, on e.g. the methanol catalyst, are however still not known. See Appendix A for further information. Task 2: Modeling of DME/methanol plants (MEK/Risø) Numerical models of small-scale DME/methanol plants, based on the two-stage biomass gasification concept, were created. The plant models showed energy efficiencies from biomass (wood chips) to DME/methanol of 45-58% (LHV). The highest yields were achieved when using recycle synthesis, and the lowest yields when using once-through synthesis. The unconverted syngas was used in a gas engine to produce electricity to cover the on-site electricity consumption and, in the case of the once-through plants, for export to the grid. The biomass to DME/methanol + net electricity efficiencies achieved were 51-58% (LHV). By using waste heat from the plants for district heating, the total energy efficiencies became 87-88%. The difference in energy efficiencies between the methanol plants and the DME plants showed to be very small, but because the DME plants are somewhat more complex due to the use of a refrigeration plant, the methanol plants may be the preffered option. Numerical models of DME plants based on entrained flow gasification of biomass were also created. A commercial large-scale entrained flow gasifier operating on torrefied biomass pellets was modeled. The gasifier was pressurized and oxygen-blown. The plant models showed energy efficiencies from torrefied biomass to DME of 49-66% (LHV). If it is assumed that 10% of the heating value in the biomass is lost in the
12
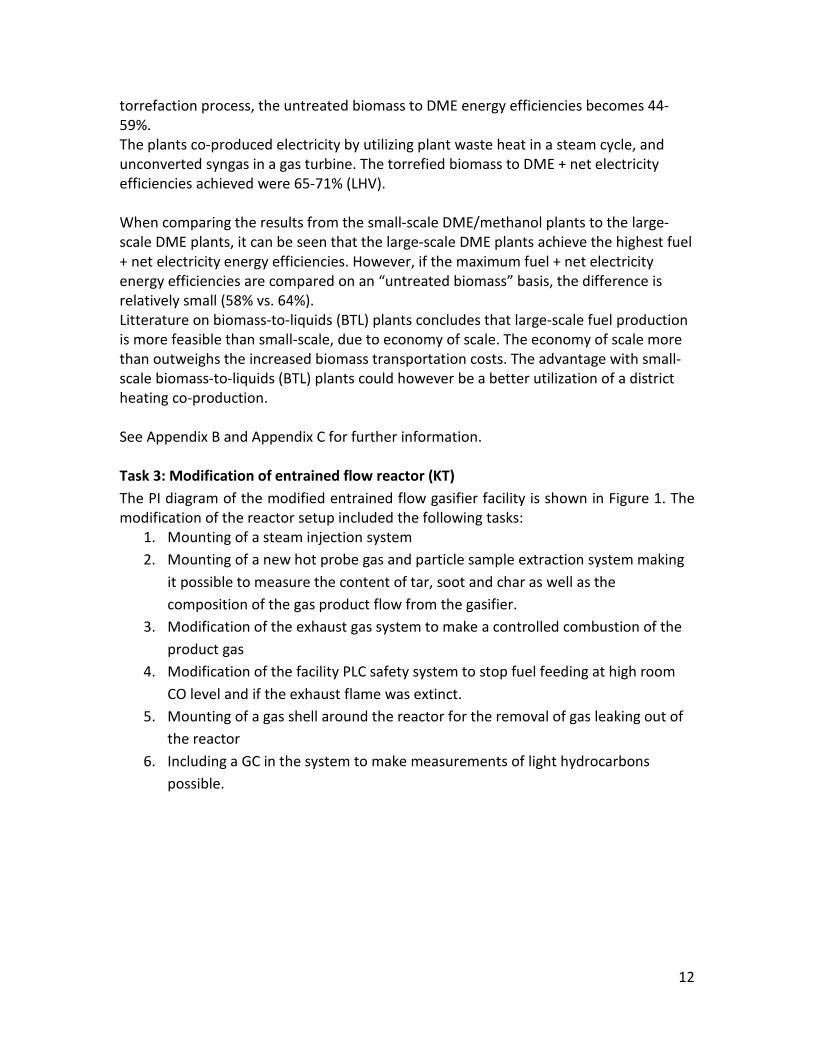
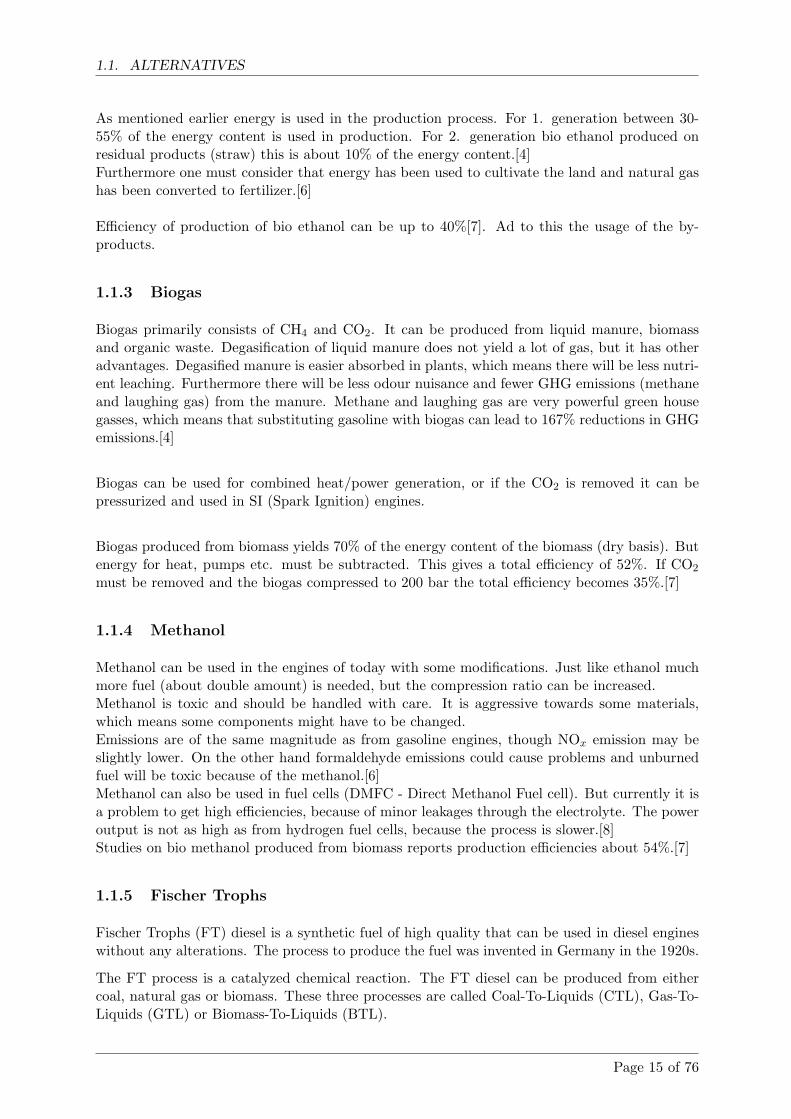
torrefaction process, the untreated biomass to DME energy efficiencies becomes 44-59%. The plants co-produced electricity by utilizing plant waste heat in a steam cycle, and unconverted syngas in a gas turbine. The torrefied biomass to DME + net electricity efficiencies achieved were 65-71% (LHV). When comparing the results from the small-scale DME/methanol plants to the large-scale DME plants, it can be seen that the large-scale DME plants achieve the highest fuel + net electricity energy efficiencies. However, if the maximum fuel + net electricity energy efficiencies are compared on an “untreated biomass” basis, the difference is relatively small (58% vs. 64%). Litterature on biomass-to-liquids (BTL) plants concludes that large-scale fuel production is more feasible than small-scale, due to economy of scale. The economy of scale more than outweighs the increased biomass transportation costs. The advantage with small-scale biomass-to-liquids (BTL) plants could however be a better utilization of a district heating co-production. See Appendix B and Appendix C for further information. Task 3: Modification of entrained flow reactor (KT) The PI diagram of the modified entrained flow gasifier facility is shown in Figure 1. The modification of the reactor setup included the following tasks:
1. Mounting of a steam injection system 2. Mounting of a new hot probe gas and particle sample extraction system making
it possible to measure the content of tar, soot and char as well as the composition of the gas product flow from the gasifier.
3. Modification of the exhaust gas system to make a controlled combustion of the product gas
4. Modification of the facility PLC safety system to stop fuel feeding at high room CO level and if the exhaust flame was extinct.
5. Mounting of a gas shell around the reactor for the removal of gas leaking out of the reactor
6. Including a GC in the system to make measurements of light hydrocarbons possible.
13
Figure 1. PI diagram of the entrained flow gasifier after modification See Appendix D for further information. Task 4: Entrained flow gasification of biomass (experimental - KT) Experiments with gasification of two types of biomass, wood and straw, were performed in the CHEC atmospheric pressure electrically heated entrained flow reactor. The feeding rate of fuel into the reactor was 550 – 1000 g/h, and the gasification process took place in a two meter long ceramic tube with an inner diameter of 8 cm. It was the objective to quantify the influence of reactor operation conditions on the products composition of gas, tar, char and soot. The applied operation range included reactor temperatures of 1000 to 1350°C, oxygen inlet concentrations of 2 to 34 vol % O2, steam carbon molar ratios of 0 – 1,25 H2O/C (steam inlet to fuel carbon molar ratio), and excess air ratios of λ = 0.2-0.9. The obtained reactor residence time was from 2.1 to 4.7 seconds. In all biomass experiments, the fuel was completely converted and no char was found in the reactor outlet products. At reactor temperatures of 1200°C and 1350°C, all carbon mass balance closures were reasonable, typically within ±9%. At 1000°C the carbon mass balance has a large deviation (22 wt %) probably due to a high content of unmeasured tar and larger hydrocarbons in the product gas. The product gas were besides N2 dominated by H2 (0.15-0.7 Nm3/kg fuel), CO (0.35-0.75 Nm3/kg fuel), CO2 (0.15-0.3 Nm3/kg fuel), and a small amount of light hydrocarbons, less than 0.08 Nm3/kg fuel (CH4+C2H4+C3H8). Increasing the reactor temperature from 1000 to 1350°C at otherwise maintained operation conditions led to increased yields of product gas (defined as the sum of H2,
EFR
Feeder
Booster
Open combustor
To vent
Carbon colunm
DP 6
Fla.C23
Water
FC3
Steam generatorair/O2
TC 2
Feeder air
Flue gas cooler
Chimney
Bunsen flame
CH4
FC 10
Gas analyzers
FA4 FC14 MV38 CalibrationGas
Filter
CV1
Gas cooler
Gas conditioningHeatedpipe
Fil. Filter
FC16
T34
MV44F14
GC
MV6
MV30
Free sucked air
PLC
MV3
MV16
MV4
FC 4
High temperature particle sampling
Flame detector
Tar sampling
Needle valve
14
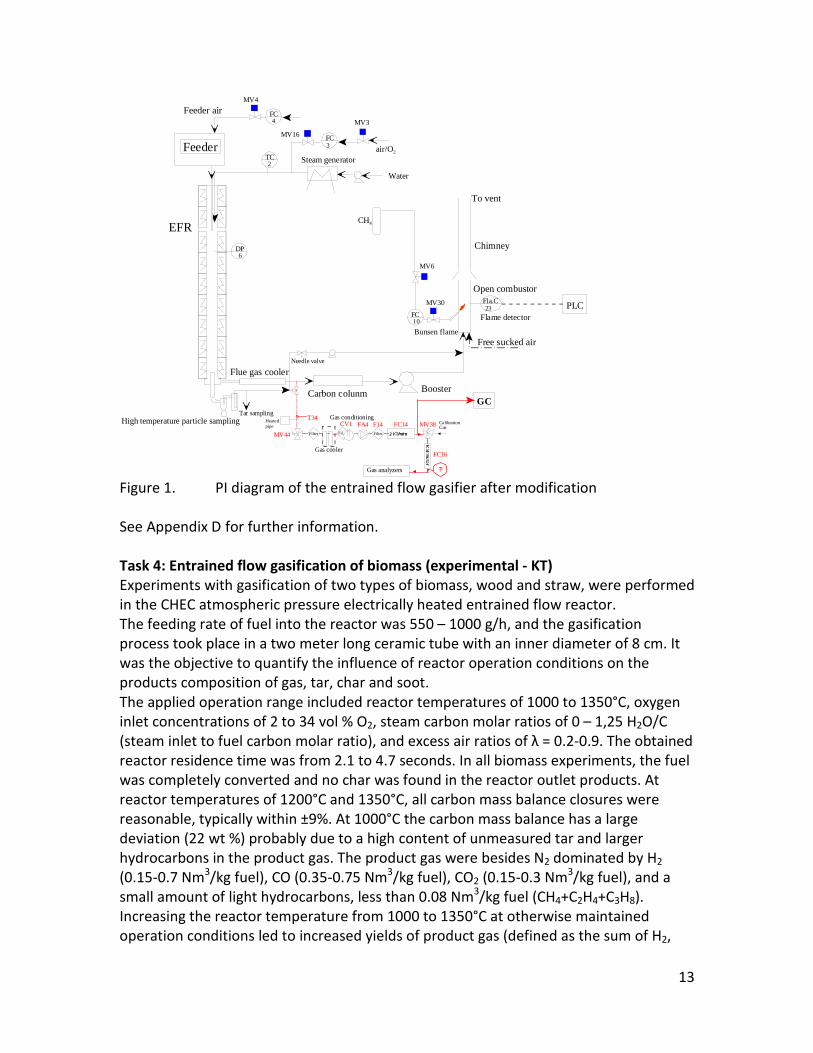
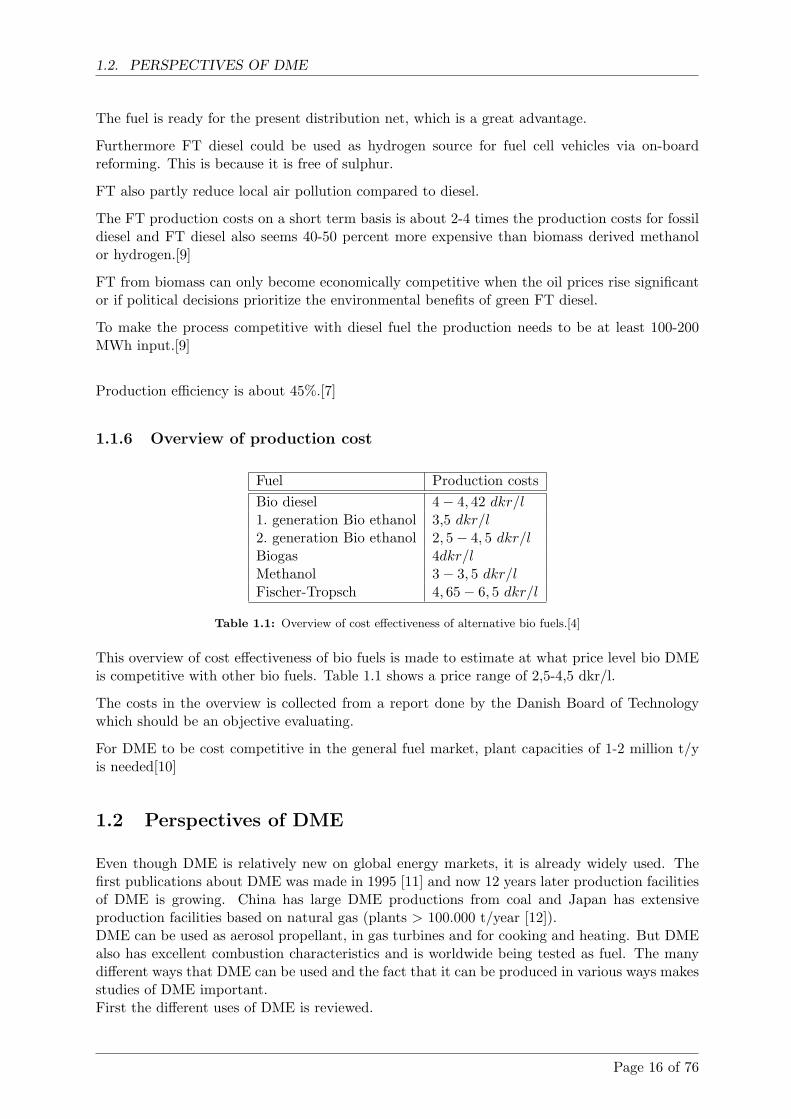
CO, CO2 and CxHy (hydrocarbons up to C3 species)), H2 and CO; and a decreased yield of CO2 and CxHy. As seen on Figure 3 at 1350°C, a significant yield of soot was produced (~40g/kg fuel at λ=0.25, H2O/C=0), while there was nearly no tar formation. Conversely, at 1000°C, the soot yield was lowest, whereas the amount of tar was highest. Thus, there is a tradeoff between soot and tar formation.
Figure 3. Effect of reactor temperature on the soot yield of wood gasification at λ=0.25. The influence of changes in oxygen to fuel ratio was investigated. An increased oxygen to fuel ratio (λ = 0.2-0.9) was obtained by increasing the gas inlet oxygen content from 3 to 17 vol%. The increased oxygen to fuel ratio lead to decreased outlet contents of H2, CO, CxHy and soot, while the CO2 content increased and the gas heating value decreased. The increased amount of oxygen simply caused an oxidation of the H2, CO, CxHy and soot. The influence of increased oxygen inlet concentration with otherwise maintained operation conditions at an excess air ratio of λ=0.25, a reactor temperature of 1350°C and no steam injection were investigated. The increased oxygen concentration was obtained by decreasing the N2 flow to the reactor and this leads to an increased reactor residence time, and probably an increased temperature in the top of the reactor. The soot formation increased from 3 mol/kg fuel at an inlet oxygen concentration of 5 vol% up to 11 mol soot/kg fuel at an inlet oxygen concentration of 34 vol%. The reason for the large soot formation at high oxygen inlet concentrations is presently not known. Increased steam injection and thereby increased reactor H2O/C ratio pushed the water shift reaction towards an increased formation of H2 and CO2. However, even a high amount of water injection (H2O/C ratio changed from 0 to 1) typically caused a H2 dry gas content increase of only 20%. A moderate reduction of the soot formation in the range of 20-50% can be obtained by increasing the steam injection from 0 to H2O/C=1. A comparison of product gas composition when using wood and straw fuel showed similar results. This indicates that the high straw fuel alkali content do not significantly influences the gasification process. Using coal as gasifier fuel showed that at conditions
1000 1100 1200 1300 14000
10
20
30
40
50
60
Soot
yiel
d (g
/kg
fuel)
T (°C)
H2O/C=0.5 H2O/C=0
15
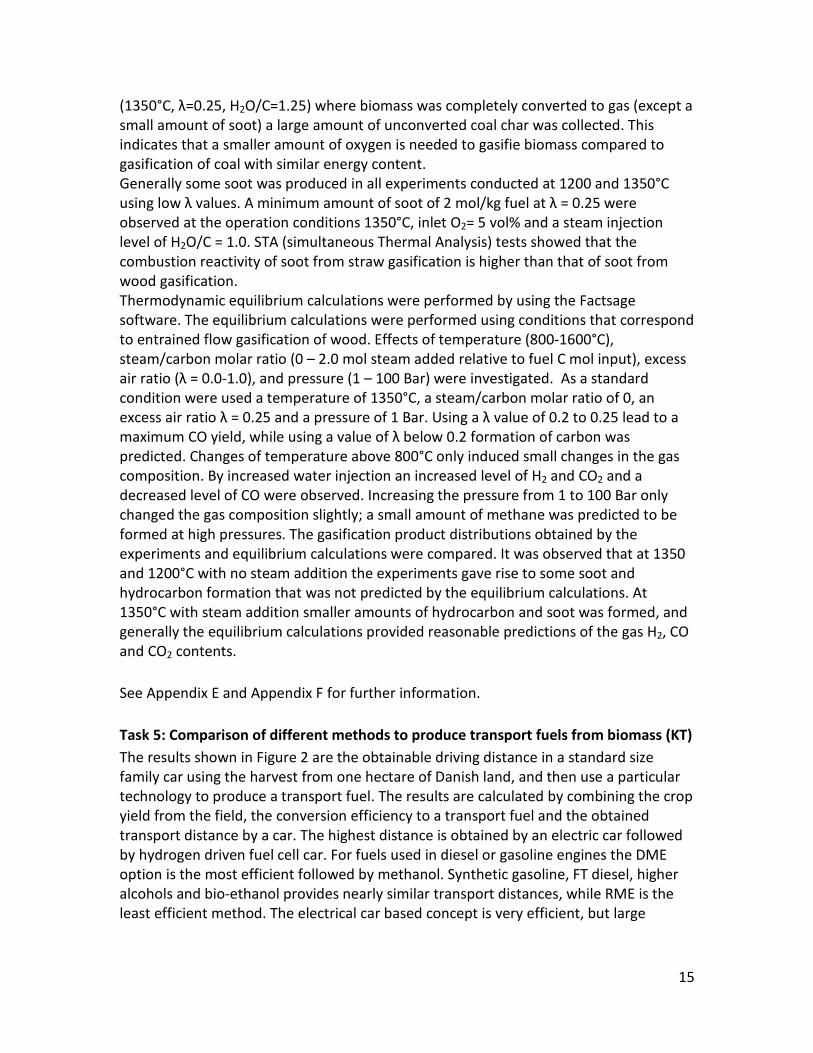
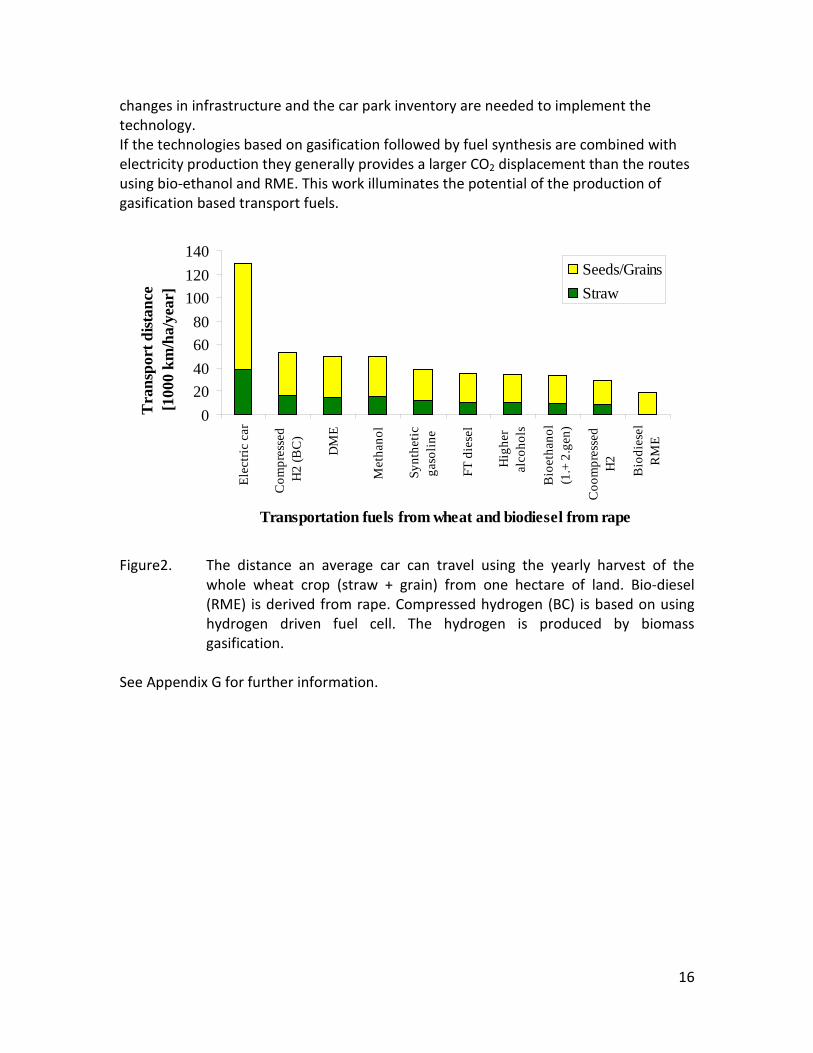
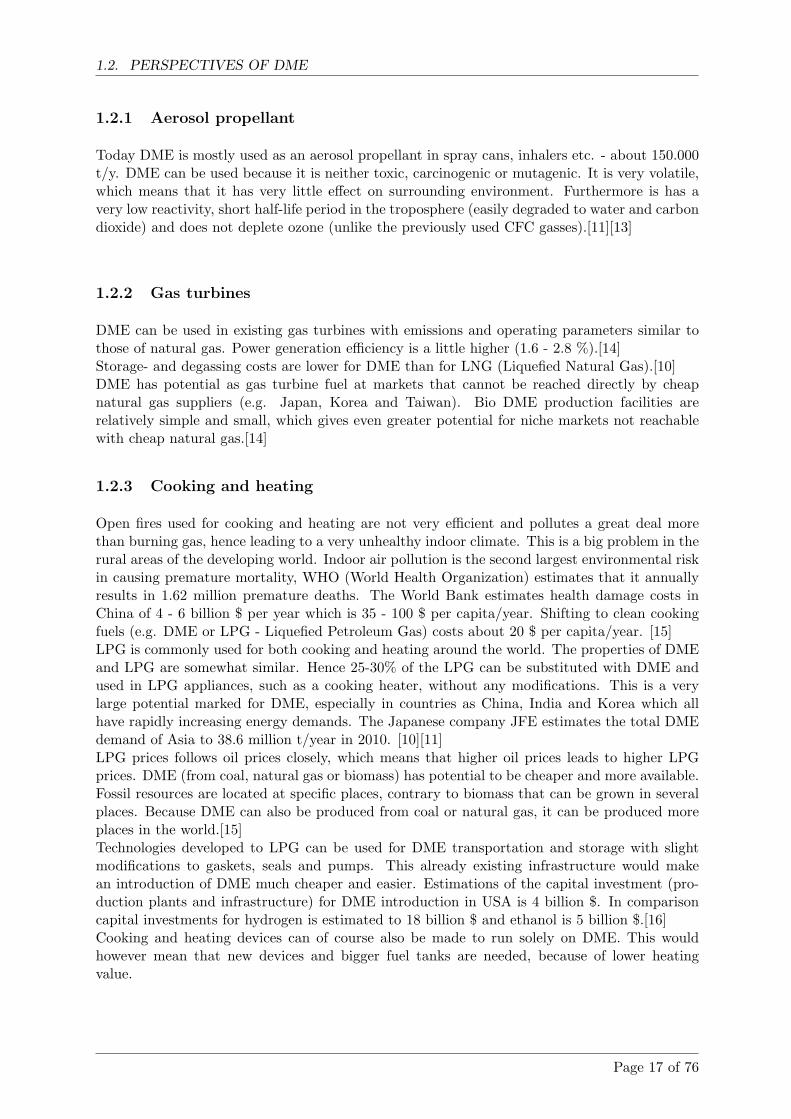
(1350°C, λ=0.25, H2O/C=1.25) where biomass was completely converted to gas (except a small amount of soot) a large amount of unconverted coal char was collected. This indicates that a smaller amount of oxygen is needed to gasifie biomass compared to gasification of coal with similar energy content. Generally some soot was produced in all experiments conducted at 1200 and 1350°C using low λ values. A minimum amount of soot of 2 mol/kg fuel at λ = 0.25 were observed at the operation conditions 1350°C, inlet O2= 5 vol% and a steam injection level of H2O/C = 1.0. STA (simultaneous Thermal Analysis) tests showed that the combustion reactivity of soot from straw gasification is higher than that of soot from wood gasification. Thermodynamic equilibrium calculations were performed by using the Factsage software. The equilibrium calculations were performed using conditions that correspond to entrained flow gasification of wood. Effects of temperature (800-1600°C), steam/carbon molar ratio (0 – 2.0 mol steam added relative to fuel C mol input), excess air ratio (λ = 0.0-1.0), and pressure (1 – 100 Bar) were investigated. As a standard condition were used a temperature of 1350°C, a steam/carbon molar ratio of 0, an excess air ratio λ = 0.25 and a pressure of 1 Bar. Using a λ value of 0.2 to 0.25 lead to a maximum CO yield, while using a value of λ below 0.2 formation of carbon was predicted. Changes of temperature above 800°C only induced small changes in the gas composition. By increased water injection an increased level of H2 and CO2 and a decreased level of CO were observed. Increasing the pressure from 1 to 100 Bar only changed the gas composition slightly; a small amount of methane was predicted to be formed at high pressures. The gasification product distributions obtained by the experiments and equilibrium calculations were compared. It was observed that at 1350 and 1200°C with no steam addition the experiments gave rise to some soot and hydrocarbon formation that was not predicted by the equilibrium calculations. At 1350°C with steam addition smaller amounts of hydrocarbon and soot was formed, and generally the equilibrium calculations provided reasonable predictions of the gas H2, CO and CO2 contents. See Appendix E and Appendix F for further information. Task 5: Comparison of different methods to produce transport fuels from biomass (KT) The results shown in Figure 2 are the obtainable driving distance in a standard size family car using the harvest from one hectare of Danish land, and then use a particular technology to produce a transport fuel. The results are calculated by combining the crop yield from the field, the conversion efficiency to a transport fuel and the obtained transport distance by a car. The highest distance is obtained by an electric car followed by hydrogen driven fuel cell car. For fuels used in diesel or gasoline engines the DME option is the most efficient followed by methanol. Synthetic gasoline, FT diesel, higher alcohols and bio-ethanol provides nearly similar transport distances, while RME is the least efficient method. The electrical car based concept is very efficient, but large
16
changes in infrastructure and the car park inventory are needed to implement the technology. If the technologies based on gasification followed by fuel synthesis are combined with electricity production they generally provides a larger CO2 displacement than the routes using bio-ethanol and RME. This work illuminates the potential of the production of gasification based transport fuels.
Figure2. The distance an average car can travel using the yearly harvest of the
whole wheat crop (straw + grain) from one hectare of land. Bio-diesel (RME) is derived from rape. Compressed hydrogen (BC) is based on using hydrogen driven fuel cell. The hydrogen is produced by biomass gasification.
See Appendix G for further information.
020406080
100120140
Elec
tric
car
Com
pres
sed
H2
(BC
)
DM
E
Met
hano
l
Synt
hetic
gaso
line
FT d
iese
l
Hig
her
alco
hols
Bio
etha
nol
(1.+
2.g
en)
Coo
mpr
esse
dH
2
Bio
dies
elR
ME
Transportation fuels from wheat and biodiesel from rape
Tra
nspo
rt d
istan
ce .
[100
0 km
/ha/
year
] .
Seeds/GrainsStraw
17
5. Conclusions The conclusions are: • It was shown that the gas from the “Viking Gasifier” can be used for DME/methanol
production with a minimum of gas cleaning. The long-term effects on gas cleaning and synthesis equipment were however not investigated.
• Numerical models of DME/methanol plants based on: 1. the two-stage biomass gasification concept, and 2. large-scale entrained flow gasification of torrefied biomass, showed that biomass could be converted to DME/methanol + electricity with an energy efficiencies of 51-71%. The highest efficiencies were achieved by the large scale plants based on entrained flow gasification of torrefied biomass.
• Entrained flow gasification experiments have provided quantitative data on product and gas composition as a function of operation conditions. Biomass can be gasified with less oxygen consumption compared to coal. The organic fraction of the biomass that is not converted to gas appears as soot.
• A comparison of different methods to provide biomass based transport fuels has shown that the gasification based route is an attractive and efficient technology.
Further work regarding entrained flow biomass gasifiers (KT) This study have only dealt with some of the knowledge needed to design reliable and optimized biomass entrained flow gasifiers used to a liquid fuel synthesis processes. Some of the areas needing further studies are:
• Development of computer models describing the gasification process
• Investigations on how to minimize soot formation
• Study of biomass ash behavior in an entrained flow reactor process
• Study of the auto thermal gasification process (without electrical reactor heating) at high inlet oxygen contents (above 35 vol %) and at pressurized conditions
• Further optimization with respect to use of a minimum of oxygen to conduct the gasification process
• Optimization of gas cleaning processes
18
Appendix A. Methanol production from gasified biomass
Bachelor report
Münster-Swendsen J, Fink A. “Methanol production from gasified biomass”. Bachelor report, Department of Mechanical Engineering, Technical University of Denmark, 2007.
METHANOL PRODUCTIONFROM GASIFIED BIOMASS
Janus Munster-Swendsen s042269Anders Fink s041996
Technical University of DenmarkDepartment of Mechanical Engineering
Supervisors: Anker Degn Jensen, Jesper Ahrenfeldt and Ulrik Birk Henriksen19. juni 2007
———————
0.1. SUMMARY
0.1 Summary
0.1.1 Introduction
This report presents a study in methanol and DME (DiMethylEther) production from gasifiedbiomass. The study is done at the section for energy engineering at MEK (Department of Me-chanical Engineering) at the Technical University of Denmark (DTU). This bachelor projecthas been carried out by Anders Fink and Janus Munster-Swendsen, supervised by Anker DegnJensen (Professor), Jesper Ahrenfeldt (Assistant Professor) and Ulrik Birk Henriksen (AssociateProfessor).
The study is based on the work and facility made by Henrik Iversen in his Master Thesisfrom 2006.
This bachelor project is part of a larger research project called EFP (Energy Research Pro-gramme). The purpose with the EFP project is to create productions of methanol and DMEfrom biomass. The participants are MEK (DTU), KT (Department of Chemical Engineering -DTU), Haldor Topsøe and Elsam Engineering.
This report describes production of methanol directly from synthesis gas (syngas) from theViking gasifier. The important parameters for this production will be identified and the possi-bilities to modify the methanol facility to produce DME is evaluated.
0.1.2 Objectives
The purpose of this project is to demonstrate methanol production from gasified biomass andconsider possibilities for DME production from gasified biomass.
The main objectives of the report:
1. A literature study of DME and other alternative bio fuels to evaluate the prospects ofDME.
2. Methanol production by synthesis of syngas from the Viking gasifier. Including implemen-tation of several cleaning devices to remove unwanted components in the syngas.
3. Creating a theoretical correct model of methanol and DME synthesis in order to evaluatethe different parameters in the methanol and DME production.
0.1.3 Conclusions
Conclusions on the established objectives:
1. DME is versatile, it can be used for many different things and can be produced in variousways.
Bio DME (DME produced from biomass) has many interesting properties as diesel en-gine fuel. It has a minimum of emissions, is CO2 neutral and have the best well to wheelefficiency compared with the other alternative bio fuels.
Page 1 of 76
0.2. DANISH SUMMERY – RESUME
There are some problems with implementing DME as a diesel engine fuel. Especiallythe distribution net and engine lubrication are problems that needs to be solved.
2. The experiments showed that it is possible to produce methanol from syngas from theViking gasifier.
The CO2 scrubber with pills of potassium hydroxide did not work as intended.
Experiments showed that chemical equilibrium in the methanol reactor is not reach withflows higher than 0,75 Nm3/h.
The gas composition has large influence on the methanol outcome.
3. The created model has large deviations from the experimental results.
An investigation indicates that it is the measured temperature of the methanol synthesisand not the model, that is the main source of error.
The model uses the ideal gas equation of state which is verified with the theoretic betterSoave-Redlich-Kwong (SRK) equation of state. The ideal gas equation is a good assump-tion for the used gas composition, different operating temperatures and pressures.
Calculations shows that with gas from the Viking gasifier condensation temperatures mustbe below -50 ◦C for more than 80% DME to be condensed. If the amount of DME in thegas increases so does the condensation temperature.
0.2 Danish summery – resume
0.2.1 Introduktion
Denne rapport studerer metanol og DME produktion fra forgasset biomasse. Studiet er fore-taget ved sektionen for energiteknik pa institut for Mekanik, Energi og Konstruktion (MEK) paDTU. Bachelorprojektet er udarbejdet af Anders Fink og Janus Munster-Swendsen og vejledtaf Lektor Anker Degn Jensen, Adjunkt Jesper Ahrenfeldt og Lektor Ulrik Birk Henriksen.
Dette studie er baseret pa Henrik Iversens eksamensprojekt fra 2006 og det anlæg, der blevkonstrueret i forbindelse med dette projekt.
Dette bachelorprojekt er del af et større forskningsprojekt ved navn EFP (Energiforskningspro-grammet). EFP projektet omhandler produktion af methanol og DME fra biomasse. Deltagernei dette projekt er MEK, KT (Kemiteknik - DTU), Haldor Topsøe og Elsam Engineering.
Denne rapport beskriver metanolproduktion direkte fra syntesegas fra Viking forgasseren. Devigtige parametre for denne produktion vil blive identificeret og mulighederne for at modificereanlægget til DME produktion vil blive vurderet.
Page 2 of 76
0.2. DANISH SUMMERY – RESUME
0.2.2 Formal
Formalet med dette projekt er at demonstrere methanol produktion fra forgasset biomasse ogoverveje mulighederne for DME produktion.
De primære formal i rapporten er:
1. Et litteraturstudie af DME og de andre alternative biobrændsler for at vurdere mulighederfor DME.
2. Metanolproduktion ud fra syntesegas fra Viking forgasseren. Herunder implementering afde nødvendige renseenheder til at fjerne uønskede komponenter i syntesegassen.
3. Konstruere en teoretisk korrekt model for metanol og DME for at kunne vurdere de forskel-lige parametre ved metanol og DME produktion.
0.2.3 Konklusion
Konklusioner pa de opstillede formal:
1. DME er alsidigt. Det kan benyttes til mange forskellige formal og kan produceres ud fraforskellige ramaterialer.
BioDME (DME produceret fra biomasse) har mange interessante egenskaber som brænd-stof i en dieselmotor. Det har et minimum af emissioner, er CO2 neutral og har den bedste”well to wheel” effektivitet sammenlignet med de andre alternative biobrændstoffer.
Der er dog nogle problemer med implementering af DME som diesel brændstof. Specieltdistributionsnettet og smøring i motoren er problemer, der skal løses.
2. Forsøgene viste, at det var muligt at producere metanol direkte fra syntesegas fra Vikingforgasseren.
CO2 vaskeren med kaliumhydroxid piller fungerede ikke som forventet.
Forsøg viste, at kemisk ligevægt i methanolreaktoren ikke opnas ved flow over 0,75 Nm3/h.
Gassammensætningen har stor effekt pa methanol udbyttet.
3. Den konstruerede model har store afvigelser fra de eksperimentelle resultater.
En undersøgelse tyder dog pa, at denne afvigelse ikke skyldes modellen, men den maltetemperatur ved methanolsyntesen.
Modellen benytter sig af idealgas tilstandsligningen og denne er sammenlignet med den teo-retisk bedre SRK tilstandsligning. Det kan konkluderes, at idealgasligningen er tilstrække-lig med den givne gassammensætning og de forskellige tryk og temperaturer, der opereresmed til metanol og DME produktion.
Page 3 of 76

0.2. DANISH SUMMERY – RESUME
Beregninger viser at med gas fra Viking forgasseren, skal DME kondenseringstempera-turerne være lavere end -50 ◦C, hvis mere end 80% skal kondenseres. Hvis DME indholdetaf gassen forøges, sa er der mulighed for højere kondenseringstemperaturer.
Page 4 of 76
Contents
0.1 Summary . . . . . . . . . . . . . . . . . . . . . . . . . . . . . . . . . . . . . . . . 1
0.1.1 Introduction . . . . . . . . . . . . . . . . . . . . . . . . . . . . . . . . . . 1
0.1.2 Objectives . . . . . . . . . . . . . . . . . . . . . . . . . . . . . . . . . . . . 1
0.1.3 Conclusions . . . . . . . . . . . . . . . . . . . . . . . . . . . . . . . . . . . 1
0.2 Danish summery – resume . . . . . . . . . . . . . . . . . . . . . . . . . . . . . . . 2
0.2.1 Introduktion . . . . . . . . . . . . . . . . . . . . . . . . . . . . . . . . . . 2
0.2.2 Formal . . . . . . . . . . . . . . . . . . . . . . . . . . . . . . . . . . . . . . 3
0.2.3 Konklusion . . . . . . . . . . . . . . . . . . . . . . . . . . . . . . . . . . . 3
0.3 Preface . . . . . . . . . . . . . . . . . . . . . . . . . . . . . . . . . . . . . . . . . 9
0.4 Introduction . . . . . . . . . . . . . . . . . . . . . . . . . . . . . . . . . . . . . . . 10
0.5 Problem statement . . . . . . . . . . . . . . . . . . . . . . . . . . . . . . . . . . . 11
0.6 Project delimitations . . . . . . . . . . . . . . . . . . . . . . . . . . . . . . . . . . 12
1 Biofuels 13
1.1 Alternatives . . . . . . . . . . . . . . . . . . . . . . . . . . . . . . . . . . . . . . . 13
1.1.1 Bio diesel . . . . . . . . . . . . . . . . . . . . . . . . . . . . . . . . . . . . 14
1.1.2 Bio ethanol . . . . . . . . . . . . . . . . . . . . . . . . . . . . . . . . . . . 14
1.1.3 Biogas . . . . . . . . . . . . . . . . . . . . . . . . . . . . . . . . . . . . . . 15
1.1.4 Methanol . . . . . . . . . . . . . . . . . . . . . . . . . . . . . . . . . . . . 15
1.1.5 Fischer Trophs . . . . . . . . . . . . . . . . . . . . . . . . . . . . . . . . . 15
1.1.6 Overview of production cost . . . . . . . . . . . . . . . . . . . . . . . . . . 16
1.2 Perspectives of DME . . . . . . . . . . . . . . . . . . . . . . . . . . . . . . . . . . 16
1.2.1 Aerosol propellant . . . . . . . . . . . . . . . . . . . . . . . . . . . . . . . 17
1.2.2 Gas turbines . . . . . . . . . . . . . . . . . . . . . . . . . . . . . . . . . . 17
1.2.3 Cooking and heating . . . . . . . . . . . . . . . . . . . . . . . . . . . . . . 17
1.2.4 Engine fuel . . . . . . . . . . . . . . . . . . . . . . . . . . . . . . . . . . . 18
1.2.5 Other markets . . . . . . . . . . . . . . . . . . . . . . . . . . . . . . . . . 20
5
CONTENTS
1.2.6 Advantages . . . . . . . . . . . . . . . . . . . . . . . . . . . . . . . . . . . 20
1.2.7 Problems . . . . . . . . . . . . . . . . . . . . . . . . . . . . . . . . . . . . 21
2 Theoretic model 22
2.1 Introduction . . . . . . . . . . . . . . . . . . . . . . . . . . . . . . . . . . . . . . . 22
2.2 Argumentation for assumptions . . . . . . . . . . . . . . . . . . . . . . . . . . . . 23
2.2.1 Equation of state . . . . . . . . . . . . . . . . . . . . . . . . . . . . . . . . 24
2.2.2 Fugacity . . . . . . . . . . . . . . . . . . . . . . . . . . . . . . . . . . . . . 26
2.2.3 Vapor liquid equilibrium . . . . . . . . . . . . . . . . . . . . . . . . . . . . 28
2.3 The model step by step . . . . . . . . . . . . . . . . . . . . . . . . . . . . . . . . 28
2.3.1 Gas composition . . . . . . . . . . . . . . . . . . . . . . . . . . . . . . . . 28
2.3.2 Compressor . . . . . . . . . . . . . . . . . . . . . . . . . . . . . . . . . . . 29
2.3.3 Synthesis . . . . . . . . . . . . . . . . . . . . . . . . . . . . . . . . . . . . 30
2.3.4 Flows . . . . . . . . . . . . . . . . . . . . . . . . . . . . . . . . . . . . . . 34
2.3.5 Condensation . . . . . . . . . . . . . . . . . . . . . . . . . . . . . . . . . . 34
2.3.6 Yield and selectivity . . . . . . . . . . . . . . . . . . . . . . . . . . . . . . 36
2.3.7 Heating value . . . . . . . . . . . . . . . . . . . . . . . . . . . . . . . . . . 36
2.4 Weaknesses of the model . . . . . . . . . . . . . . . . . . . . . . . . . . . . . . . . 37
2.5 Comparison with literature . . . . . . . . . . . . . . . . . . . . . . . . . . . . . . 38
2.5.1 SRK equation of state . . . . . . . . . . . . . . . . . . . . . . . . . . . . . 38
2.5.2 Activity . . . . . . . . . . . . . . . . . . . . . . . . . . . . . . . . . . . . . 39
2.5.3 Review . . . . . . . . . . . . . . . . . . . . . . . . . . . . . . . . . . . . . 40
3 Experiments 41
3.1 Method of measurements . . . . . . . . . . . . . . . . . . . . . . . . . . . . . . . 41
3.1.1 Gas analysis . . . . . . . . . . . . . . . . . . . . . . . . . . . . . . . . . . . 41
3.1.2 Pressure . . . . . . . . . . . . . . . . . . . . . . . . . . . . . . . . . . . . . 42
3.1.3 Volume . . . . . . . . . . . . . . . . . . . . . . . . . . . . . . . . . . . . . 42
3.1.4 Temperature . . . . . . . . . . . . . . . . . . . . . . . . . . . . . . . . . . 42
3.1.5 Verification of methanol . . . . . . . . . . . . . . . . . . . . . . . . . . . . 44
3.2 Facility Description . . . . . . . . . . . . . . . . . . . . . . . . . . . . . . . . . . . 44
3.2.1 Test run . . . . . . . . . . . . . . . . . . . . . . . . . . . . . . . . . . . . . 45
3.2.2 Short facility description . . . . . . . . . . . . . . . . . . . . . . . . . . . . 45
3.3 Detailed facility description . . . . . . . . . . . . . . . . . . . . . . . . . . . . . . 47
3.3.1 The Viking gasifier . . . . . . . . . . . . . . . . . . . . . . . . . . . . . . . 47
Page 6 of 76
CONTENTS
3.3.2 Cleaning devices . . . . . . . . . . . . . . . . . . . . . . . . . . . . . . . . 48
3.3.3 The CO2 scrubber . . . . . . . . . . . . . . . . . . . . . . . . . . . . . . . 48
3.3.4 The NH3 cleaner . . . . . . . . . . . . . . . . . . . . . . . . . . . . . . . . 48
3.3.5 CO2 adjustment . . . . . . . . . . . . . . . . . . . . . . . . . . . . . . . . 48
3.3.6 Pump and activated carbon filters . . . . . . . . . . . . . . . . . . . . . . 50
3.3.7 Buffer container . . . . . . . . . . . . . . . . . . . . . . . . . . . . . . . . 50
3.3.8 Compressor . . . . . . . . . . . . . . . . . . . . . . . . . . . . . . . . . . . 50
3.3.9 N2 buffer tank . . . . . . . . . . . . . . . . . . . . . . . . . . . . . . . . . 50
3.3.10 Regulating valve . . . . . . . . . . . . . . . . . . . . . . . . . . . . . . . . 51
3.3.11 Safety valve . . . . . . . . . . . . . . . . . . . . . . . . . . . . . . . . . . . 51
3.3.12 The main facility . . . . . . . . . . . . . . . . . . . . . . . . . . . . . . . . 51
3.3.13 Gas mixer . . . . . . . . . . . . . . . . . . . . . . . . . . . . . . . . . . . . 52
3.4 Practical . . . . . . . . . . . . . . . . . . . . . . . . . . . . . . . . . . . . . . . . . 53
3.4.1 DME reactor . . . . . . . . . . . . . . . . . . . . . . . . . . . . . . . . . . 53
3.4.2 DME catalyst pills . . . . . . . . . . . . . . . . . . . . . . . . . . . . . . . 54
3.4.3 The Viking gasifier . . . . . . . . . . . . . . . . . . . . . . . . . . . . . . . 54
3.4.4 Gas pump . . . . . . . . . . . . . . . . . . . . . . . . . . . . . . . . . . . . 55
3.4.5 Cleaning devices . . . . . . . . . . . . . . . . . . . . . . . . . . . . . . . . 55
3.4.6 Carbon monoxide alert . . . . . . . . . . . . . . . . . . . . . . . . . . . . . 56
3.5 Experiments . . . . . . . . . . . . . . . . . . . . . . . . . . . . . . . . . . . . . . . 57
3.5.1 The methanol experiment . . . . . . . . . . . . . . . . . . . . . . . . . . . 57
3.5.2 Flow experiment . . . . . . . . . . . . . . . . . . . . . . . . . . . . . . . . 58
3.5.3 Comparison with model . . . . . . . . . . . . . . . . . . . . . . . . . . . . 60
3.6 Sources of error . . . . . . . . . . . . . . . . . . . . . . . . . . . . . . . . . . . . . 61
3.7 Future solutions . . . . . . . . . . . . . . . . . . . . . . . . . . . . . . . . . . . . . 64
3.7.1 CO2 scrubber . . . . . . . . . . . . . . . . . . . . . . . . . . . . . . . . . . 64
3.7.2 NH3 washing tower . . . . . . . . . . . . . . . . . . . . . . . . . . . . . . . 64
3.7.3 Small gas pump . . . . . . . . . . . . . . . . . . . . . . . . . . . . . . . . 64
3.7.4 Extra buffer tank . . . . . . . . . . . . . . . . . . . . . . . . . . . . . . . . 64
3.7.5 Development of model . . . . . . . . . . . . . . . . . . . . . . . . . . . . . 64
3.7.6 DME production . . . . . . . . . . . . . . . . . . . . . . . . . . . . . . . . 65
3.7.7 The DME condensation column . . . . . . . . . . . . . . . . . . . . . . . . 65
3.7.8 Oxygen enrichment of the Viking gasifier . . . . . . . . . . . . . . . . . . 70
3.8 Future experiments . . . . . . . . . . . . . . . . . . . . . . . . . . . . . . . . . . . 71
Page 7 of 76
CONTENTS
4 Conclusion 73
Appendices
A Biofuels 77
A.0.1 Estimation of bio diesel production efficiency . . . . . . . . . . . . . . . . 77
B Theoretic model 78
B.0.2 SPECS . . . . . . . . . . . . . . . . . . . . . . . . . . . . . . . . . . . . . 78
B.0.3 NASA Verification . . . . . . . . . . . . . . . . . . . . . . . . . . . . . . . 80
B.1 Fugacity coefficients in the condense process at 40 baro . . . . . . . . . . . . . . 82
B.2 Fugacity coefficients in the gaseous phase . . . . . . . . . . . . . . . . . . . . . . 83
B.3 Comparison between SRK and PR equation of state . . . . . . . . . . . . . . . . 84
B.4 Calculation of Carbo V gasifier composition . . . . . . . . . . . . . . . . . . . . . 85
B.5 Calculation of Gussing gasifier composition . . . . . . . . . . . . . . . . . . . . . 86
B.6 Comparison between SRK and the model for methanol condensation . . . . . . . 87
B.7 Methanol condensation process with different pressures . . . . . . . . . . . . . . . 88
B.8 Amount of liquid at different pressures . . . . . . . . . . . . . . . . . . . . . . . . 89
B.9 Condense process with all the components mix 1 . . . . . . . . . . . . . . . . . . 90
B.10 Condense process with all the components mix 2 . . . . . . . . . . . . . . . . . . 91
C Experiments 92
C.1 Test run . . . . . . . . . . . . . . . . . . . . . . . . . . . . . . . . . . . . . . . . . 92
C.1.1 Nitrogen test . . . . . . . . . . . . . . . . . . . . . . . . . . . . . . . . . . 92
C.1.2 Methanol test from bottle gas d. 29/3 . . . . . . . . . . . . . . . . . . . . 92
C.2 Data collection . . . . . . . . . . . . . . . . . . . . . . . . . . . . . . . . . . . . . 94
C.3 Table of thermoelements . . . . . . . . . . . . . . . . . . . . . . . . . . . . . . . . 97
D Source code 98
D.1 Source code for the model . . . . . . . . . . . . . . . . . . . . . . . . . . . . . . . 98
Page 8 of 76
0.3. PREFACE
0.3 Preface
This report is the result of the bachelor project made at the section for energy engineering atMEK, DTU. The project constitutes 15 ECTS points pr student and was made in the period of19 February 2007 to 19 June 2007.
A large group of experts within the different aspects of the subject have assisted in providingvaluable information for the project and for practical implementing of the facility. In this re-gard, we would particularly like to thank Georgios Kontogeorgis (IVC-SEP), Kaj Thomsen (IVC-SEP), Steen Nielsen (Assistant Engineer), Freddy Christensen (Assistant Engineer), Erik Hansen(Technician), Joachim Paul (Professor), Spencer C Sorensen (Docent) and Haldor Topsøe.
Special thanks are given to our project supervisors Anker Degn Jensen (Professor), Jesper Ahren-feldt (Assistant Professor) and Ulrik Birk Henriksen (Associate Professor).
June - 2007
Anders Fink (s041996)
Janus Munster-Swendsen (s042269)
Page 9 of 76
0.4. INTRODUCTION
0.4 Introduction
The idea behind this project is to try to produce DME from biomass so CO2 neutral fuels couldbe an option in the future.
This study is interesting because of the rising demand for renewable and CO2 neutral fuels andbecause DME can be used in many different ways. DME could be advantageous to both thelocal and global environment.
Wednesday the 6. of June a debate program about global warming was aired on DR2 (DanishTelevision). Here different experts, representatives from the press and members from all theparties of the Danish Parliament discussed domestic energy issues and the role of Denmark ininternational energy politic.
The former environment minister Svend Auken and the present environment minister ConnieHedegaard both agreed that global warming is a serious human-induced problem and actionneeds to be taken to stop this tendency.They agree that the solution is more research and development in new technologies and mecha-nisms to transfer these new technologies to underdeveloped parts of the world.
In the program the transport sector was named the Achilles heel of global warming. CO2 isthe main gas responsible for climate change[1]. So far CO2 emissions from the transport sectorhas been rising in Denmark and this tendency will most likely continue because the demandfor cargo and use of cars is rising. As a response, the Danish government express that they areinterested in more research and development in new bio fuels to help reduce the CO2 emissions.
On a global scale, a third of all global greenhouse gasses comes from the transport sector, andthe number of cars will properly increase drastic in the future if the current tendency is con-tinuing. This means that the need for fuel is rising, while the amount of fossil fuel is declining.The increase will especially come from Asia. It has been estimated that from 2000 to 2020 therewill be a 24-factor increase of cars in China while a three to four factor increase of cars in India.[1]
So there is a growing interest in finding efficient and economically feasible ways to produceCO2-neutral automotive fuels, by using biomass as the raw material.[1]
Page 10 of 76
0.5. PROBLEM STATEMENT
0.5 Problem statement
The scope of this project is to produce methanol from biomass and investigate if there is possi-bilities for the facility to produce DME from syngas.
The syngas is provided by DTU´s Viking gasifier. This syngas contains certain components thatneeds to be removed before the syngas is reformed to methanol via catalytic processes.
An existing facility is able to produce methanol from bottled gas. This facility must be devel-oped further to run on syngas from biomass.
The second scope of the project is to create a model based on the valid theory describing theprocess of methanol and DME production and verify this with literature and practical experi-ments.
Furthermore the existing literature will be studied to evaluate the prospects of bio DME contraother bio-fuels.
Page 11 of 76
0.6. PROJECT DELIMITATIONS
0.6 Project delimitations
The literature study is focused on DME and only briefly on other bio fuels. This is becauseDME has interesting perspectives especially when it is produced from biomass. DTU have agreat interest in the development of bio DME. Already DTU has success with the Ecocar andthe success will be even greater, if the Ecocar could run on bio DME. A economic study wasnot possible because this facility is only a demonstration facility and therefore calculations ofeconomic perspectives would not have a solid foundation.
After the literature study it was concluded that there have not been reported production of bioDME. Therefore this was the main focus. But before producing bio DME several other testswas necessary to ensure that the different steps of the facility worked as planned. This part ofthe project is easily affected by external factors, which could alter the practical success criteria.First methanol was to be produced directly from syngas with all the cleaning devices in use andthen change the facility to produce DME. Efficiencies of the facility are not evaluated becauseit is a demonstration facility designed to proof the concept of bio DME production withoutconsidering energy-efficient solutions.
It was prioritized to study the chemistry behind such a production and make a model from theapplicable theoretical background.So far the available models developed on DTU assume ideal gas which seemed incorrect withoperational pressure at 40-50 baro and the condense process with low temperature and highpressure.Therefore a thorough study was made, but it was desired to obtain an equal degree of theoryand practical work. Since this is a bachelor project reaction kinetics has been excluded from thetheoretical model.
Page 12 of 76
Chapter 1
Biofuels
In the following section the different alternative bio fuels are briefly described to evaluate bioDME.In order to estimate an acceptable price level for bio DME, an overview of production prices ofthe other alternatives are summarized.Then follows a thorough analysis of DME, in which the usages, problems and possibilities arereviewed.
1.1 Alternatives
Focus is on fuels that can be produced from biomass. It is important to distinguish between 1.generation bio fuels and 2. generation.
1. generation bio fuels is primary produced from raw material containing starch or sugar such ascorn, sugar beets and sugar canes, which are normally used in the food manufacturing business.2. generation bio fuels is primary produced from by-products from the industry, the silvicultureand the agriculture such as trees, straw, animal fat and plant scrap.
A large advantage with 2. generation bio fuels is that it in general does not grow on culti-vated land. Therefore the food manufacturing business remain unaffected by the production of2. generation bio fuel.The cultivation of the raw material for 2. generation bio fuels (if there is any) can be less in-tensive than for ordinary agricultural crops. The lower intensity of the cultivation will thereforegenerate fewer green house gasses.[2]
None of these new bio fuels can compete in effectiveness with Danish powerplants. But assaid in the introduction, research and development in new alternative fuels is very important,especially on a global scale.
One of the advantages with biomass is the opportunity to make decentralized facilities whichcan help local communities and use raw materials that so far have not been used efficiently inmany places of the world.
13
1.1. ALTERNATIVES
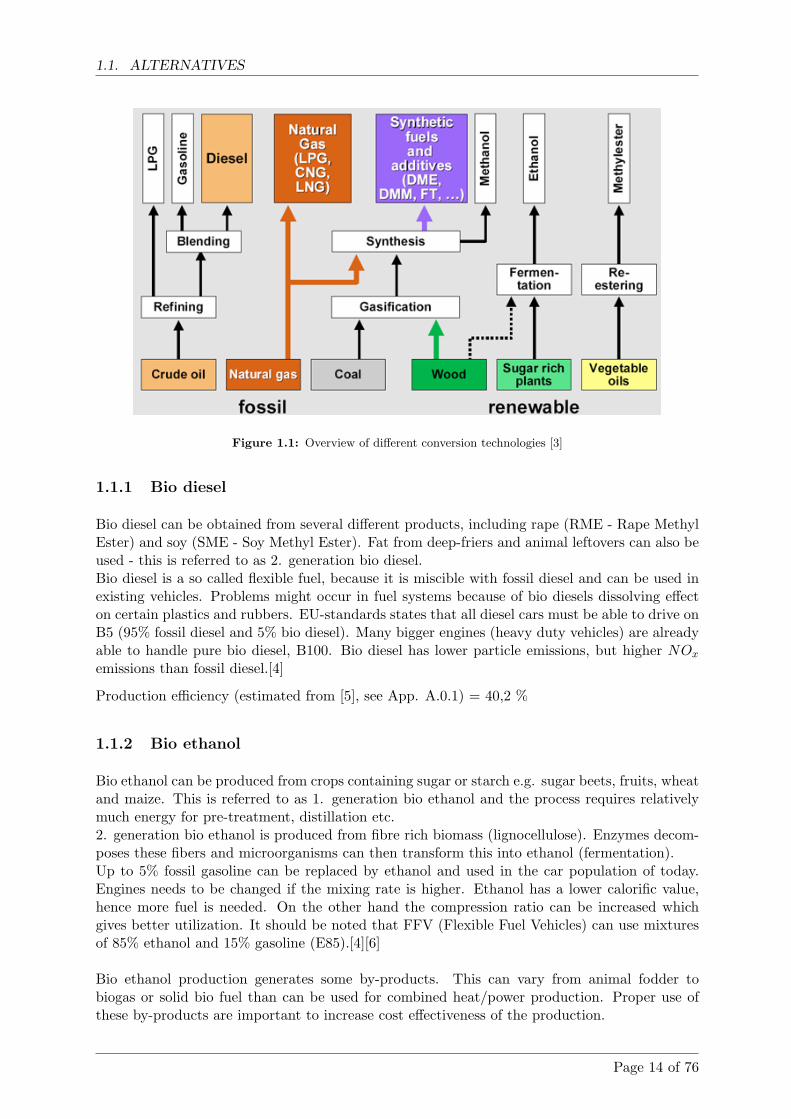
Figure 1.1: Overview of different conversion technologies [3]
1.1.1 Bio diesel
Bio diesel can be obtained from several different products, including rape (RME - Rape MethylEster) and soy (SME - Soy Methyl Ester). Fat from deep-friers and animal leftovers can also beused - this is referred to as 2. generation bio diesel.Bio diesel is a so called flexible fuel, because it is miscible with fossil diesel and can be used inexisting vehicles. Problems might occur in fuel systems because of bio diesels dissolving effecton certain plastics and rubbers. EU-standards states that all diesel cars must be able to drive onB5 (95% fossil diesel and 5% bio diesel). Many bigger engines (heavy duty vehicles) are alreadyable to handle pure bio diesel, B100. Bio diesel has lower particle emissions, but higher NOx
emissions than fossil diesel.[4]
Production efficiency (estimated from [5], see App. A.0.1) = 40,2 %
1.1.2 Bio ethanol
Bio ethanol can be produced from crops containing sugar or starch e.g. sugar beets, fruits, wheatand maize. This is referred to as 1. generation bio ethanol and the process requires relativelymuch energy for pre-treatment, distillation etc.2. generation bio ethanol is produced from fibre rich biomass (lignocellulose). Enzymes decom-poses these fibers and microorganisms can then transform this into ethanol (fermentation).Up to 5% fossil gasoline can be replaced by ethanol and used in the car population of today.Engines needs to be changed if the mixing rate is higher. Ethanol has a lower calorific value,hence more fuel is needed. On the other hand the compression ratio can be increased whichgives better utilization. It should be noted that FFV (Flexible Fuel Vehicles) can use mixturesof 85% ethanol and 15% gasoline (E85).[4][6]
Bio ethanol production generates some by-products. This can vary from animal fodder tobiogas or solid bio fuel than can be used for combined heat/power production. Proper use ofthese by-products are important to increase cost effectiveness of the production.
Page 14 of 76
1.1. ALTERNATIVES
As mentioned earlier energy is used in the production process. For 1. generation between 30-55% of the energy content is used in production. For 2. generation bio ethanol produced onresidual products (straw) this is about 10% of the energy content.[4]Furthermore one must consider that energy has been used to cultivate the land and natural gashas been converted to fertilizer.[6]
Efficiency of production of bio ethanol can be up to 40%[7]. Ad to this the usage of the by-products.
1.1.3 Biogas
Biogas primarily consists of CH4 and CO2. It can be produced from liquid manure, biomassand organic waste. Degasification of liquid manure does not yield a lot of gas, but it has otheradvantages. Degasified manure is easier absorbed in plants, which means there will be less nutri-ent leaching. Furthermore there will be less odour nuisance and fewer GHG emissions (methaneand laughing gas) from the manure. Methane and laughing gas are very powerful green housegasses, which means that substituting gasoline with biogas can lead to 167% reductions in GHGemissions.[4]
Biogas can be used for combined heat/power generation, or if the CO2 is removed it can bepressurized and used in SI (Spark Ignition) engines.
Biogas produced from biomass yields 70% of the energy content of the biomass (dry basis). Butenergy for heat, pumps etc. must be subtracted. This gives a total efficiency of 52%. If CO2
must be removed and the biogas compressed to 200 bar the total efficiency becomes 35%.[7]
1.1.4 Methanol
Methanol can be used in the engines of today with some modifications. Just like ethanol muchmore fuel (about double amount) is needed, but the compression ratio can be increased.Methanol is toxic and should be handled with care. It is aggressive towards some materials,which means some components might have to be changed.Emissions are of the same magnitude as from gasoline engines, though NOx emission may beslightly lower. On the other hand formaldehyde emissions could cause problems and unburnedfuel will be toxic because of the methanol.[6]Methanol can also be used in fuel cells (DMFC - Direct Methanol Fuel cell). But currently it isa problem to get high efficiencies, because of minor leakages through the electrolyte. The poweroutput is not as high as from hydrogen fuel cells, because the process is slower.[8]Studies on bio methanol produced from biomass reports production efficiencies about 54%.[7]
1.1.5 Fischer Trophs
Fischer Trophs (FT) diesel is a synthetic fuel of high quality that can be used in diesel engineswithout any alterations. The process to produce the fuel was invented in Germany in the 1920s.
The FT process is a catalyzed chemical reaction. The FT diesel can be produced from eithercoal, natural gas or biomass. These three processes are called Coal-To-Liquids (CTL), Gas-To-Liquids (GTL) or Biomass-To-Liquids (BTL).
Page 15 of 76
1.2. PERSPECTIVES OF DME
The fuel is ready for the present distribution net, which is a great advantage.
Furthermore FT diesel could be used as hydrogen source for fuel cell vehicles via on-boardreforming. This is because it is free of sulphur.
FT also partly reduce local air pollution compared to diesel.
The FT production costs on a short term basis is about 2-4 times the production costs for fossildiesel and FT diesel also seems 40-50 percent more expensive than biomass derived methanolor hydrogen.[9]
FT from biomass can only become economically competitive when the oil prices rise significantor if political decisions prioritize the environmental benefits of green FT diesel.
To make the process competitive with diesel fuel the production needs to be at least 100-200MWh input.[9]
Production efficiency is about 45%.[7]
1.1.6 Overview of production cost
Fuel Production costsBio diesel 4− 4, 42 dkr/l1. generation Bio ethanol 3,5 dkr/l2. generation Bio ethanol 2, 5− 4, 5 dkr/lBiogas 4dkr/lMethanol 3− 3, 5 dkr/lFischer-Tropsch 4, 65− 6, 5 dkr/l
Table 1.1: Overview of cost effectiveness of alternative bio fuels.[4]
This overview of cost effectiveness of bio fuels is made to estimate at what price level bio DMEis competitive with other bio fuels. Table 1.1 shows a price range of 2,5-4,5 dkr/l.
The costs in the overview is collected from a report done by the Danish Board of Technologywhich should be an objective evaluating.
For DME to be cost competitive in the general fuel market, plant capacities of 1-2 million t/yis needed[10]
1.2 Perspectives of DME
Even though DME is relatively new on global energy markets, it is already widely used. Thefirst publications about DME was made in 1995 [11] and now 12 years later production facilitiesof DME is growing. China has large DME productions from coal and Japan has extensiveproduction facilities based on natural gas (plants > 100.000 t/year [12]).DME can be used as aerosol propellant, in gas turbines and for cooking and heating. But DMEalso has excellent combustion characteristics and is worldwide being tested as fuel. The manydifferent ways that DME can be used and the fact that it can be produced in various ways makesstudies of DME important.First the different uses of DME is reviewed.
Page 16 of 76
1.2. PERSPECTIVES OF DME
1.2.1 Aerosol propellant
Today DME is mostly used as an aerosol propellant in spray cans, inhalers etc. - about 150.000t/y. DME can be used because it is neither toxic, carcinogenic or mutagenic. It is very volatile,which means that it has very little effect on surrounding environment. Furthermore is has avery low reactivity, short half-life period in the troposphere (easily degraded to water and carbondioxide) and does not deplete ozone (unlike the previously used CFC gasses).[11][13]
1.2.2 Gas turbines
DME can be used in existing gas turbines with emissions and operating parameters similar tothose of natural gas. Power generation efficiency is a little higher (1.6 - 2.8 %).[14]Storage- and degassing costs are lower for DME than for LNG (Liquefied Natural Gas).[10]DME has potential as gas turbine fuel at markets that cannot be reached directly by cheapnatural gas suppliers (e.g. Japan, Korea and Taiwan). Bio DME production facilities arerelatively simple and small, which gives even greater potential for niche markets not reachablewith cheap natural gas.[14]
1.2.3 Cooking and heating
Open fires used for cooking and heating are not very efficient and pollutes a great deal morethan burning gas, hence leading to a very unhealthy indoor climate. This is a big problem in therural areas of the developing world. Indoor air pollution is the second largest environmental riskin causing premature mortality, WHO (World Health Organization) estimates that it annuallyresults in 1.62 million premature deaths. The World Bank estimates health damage costs inChina of 4 - 6 billion $ per year which is 35 - 100 $ per capita/year. Shifting to clean cookingfuels (e.g. DME or LPG - Liquefied Petroleum Gas) costs about 20 $ per capita/year. [15]LPG is commonly used for both cooking and heating around the world. The properties of DMEand LPG are somewhat similar. Hence 25-30% of the LPG can be substituted with DME andused in LPG appliances, such as a cooking heater, without any modifications. This is a verylarge potential marked for DME, especially in countries as China, India and Korea which allhave rapidly increasing energy demands. The Japanese company JFE estimates the total DMEdemand of Asia to 38.6 million t/year in 2010. [10][11]LPG prices follows oil prices closely, which means that higher oil prices leads to higher LPGprices. DME (from coal, natural gas or biomass) has potential to be cheaper and more available.Fossil resources are located at specific places, contrary to biomass that can be grown in severalplaces. Because DME can also be produced from coal or natural gas, it can be produced moreplaces in the world.[15]Technologies developed to LPG can be used for DME transportation and storage with slightmodifications to gaskets, seals and pumps. This already existing infrastructure would makean introduction of DME much cheaper and easier. Estimations of the capital investment (pro-duction plants and infrastructure) for DME introduction in USA is 4 billion $. In comparisoncapital investments for hydrogen is estimated to 18 billion $ and ethanol is 5 billion $.[16]Cooking and heating devices can of course also be made to run solely on DME. This wouldhowever mean that new devices and bigger fuel tanks are needed, because of lower heatingvalue.
Page 17 of 76
1.2. PERSPECTIVES OF DME
1.2.4 Engine fuel
Diesel engines (CI engines - Combustion Ignition) operated on DME does not exhaust any smokeand particle emissions are therefore very low. The only particles emitted originates from thelubricating oil of the engine and not the DME. This is of course a great advantage since particlesemitted from diesel engines are a great health concern. The absence of particles enables adjust-ments to minimize NOx emissions, which is another health threat caused by engines. Emissionsfrom diesel operated engines can be reduced with particle filters and NOx absorbers. But withDME these can be spared making the CI engine operated on DME cheaper than a diesel enginewith filters and catalysts, even though the DME fuel system is more expensive.[13]
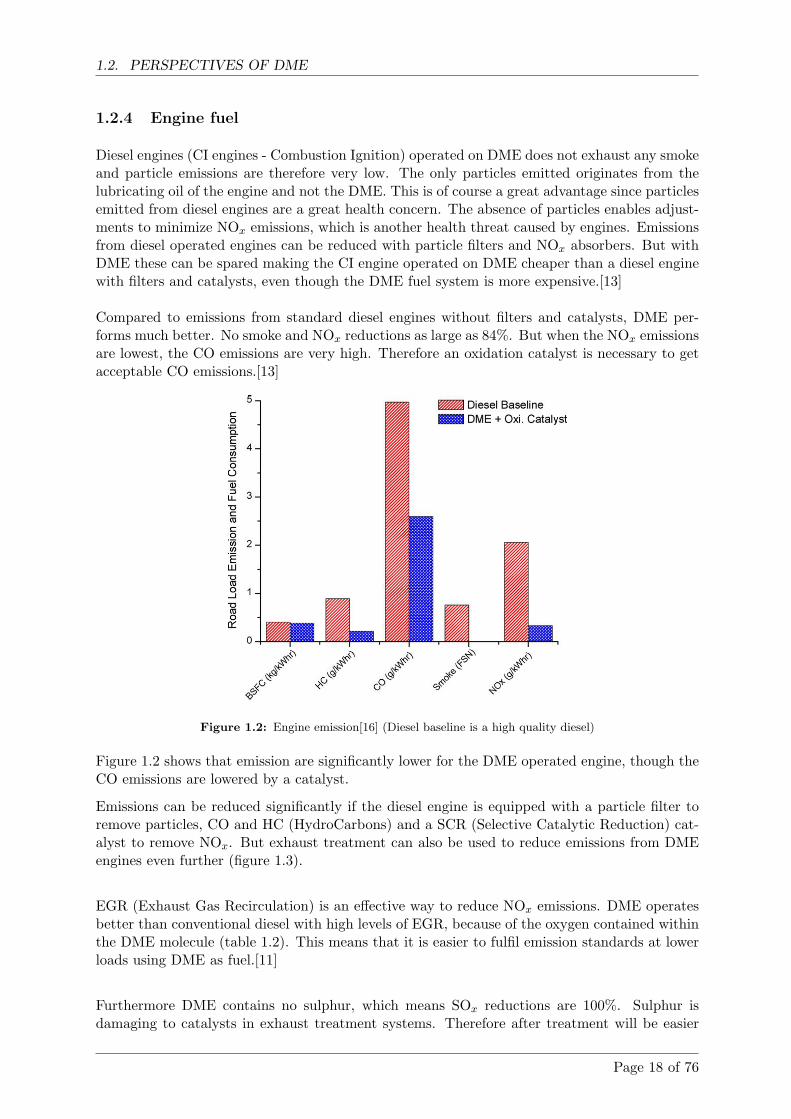
Compared to emissions from standard diesel engines without filters and catalysts, DME per-forms much better. No smoke and NOx reductions as large as 84%. But when the NOx emissionsare lowest, the CO emissions are very high. Therefore an oxidation catalyst is necessary to getacceptable CO emissions.[13]
Figure 1.2: Engine emission[16] (Diesel baseline is a high quality diesel)
Figure 1.2 shows that emission are significantly lower for the DME operated engine, though theCO emissions are lowered by a catalyst.
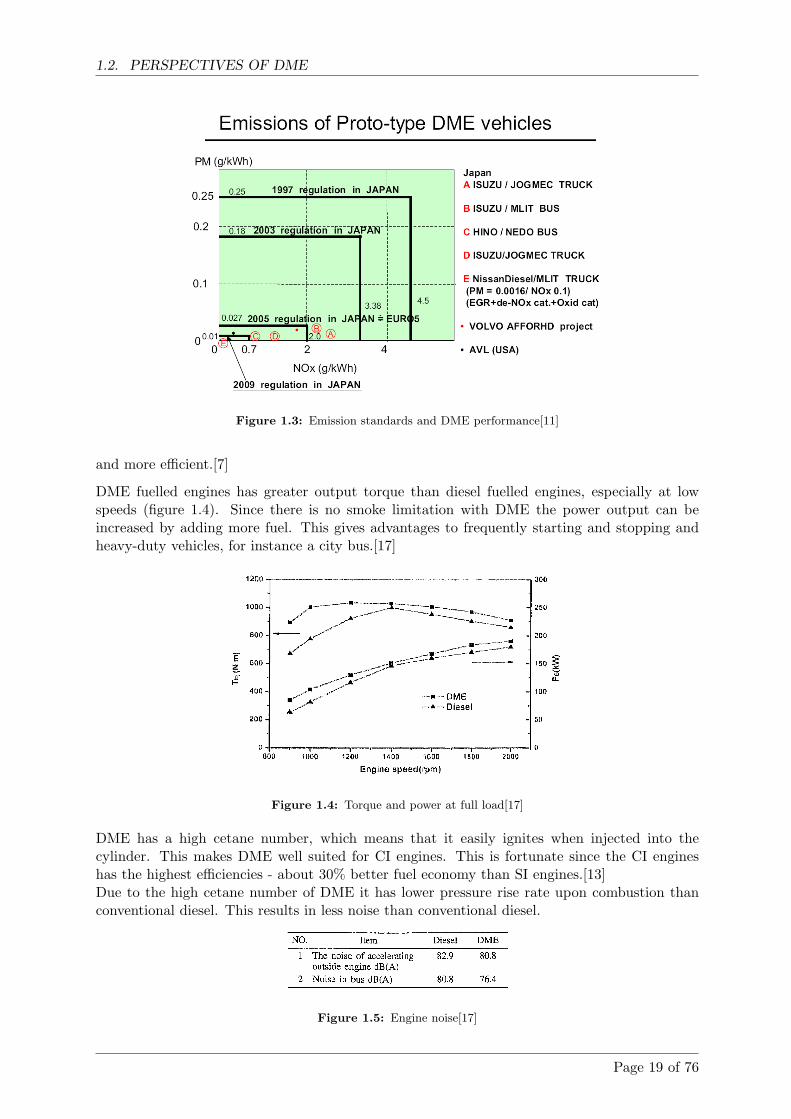
Emissions can be reduced significantly if the diesel engine is equipped with a particle filter toremove particles, CO and HC (HydroCarbons) and a SCR (Selective Catalytic Reduction) cat-alyst to remove NOx. But exhaust treatment can also be used to reduce emissions from DMEengines even further (figure 1.3).
EGR (Exhaust Gas Recirculation) is an effective way to reduce NOx emissions. DME operatesbetter than conventional diesel with high levels of EGR, because of the oxygen contained withinthe DME molecule (table 1.2). This means that it is easier to fulfil emission standards at lowerloads using DME as fuel.[11]
Furthermore DME contains no sulphur, which means SOx reductions are 100%. Sulphur isdamaging to catalysts in exhaust treatment systems. Therefore after treatment will be easier
Page 18 of 76
1.2. PERSPECTIVES OF DME
Figure 1.3: Emission standards and DME performance[11]
and more efficient.[7]
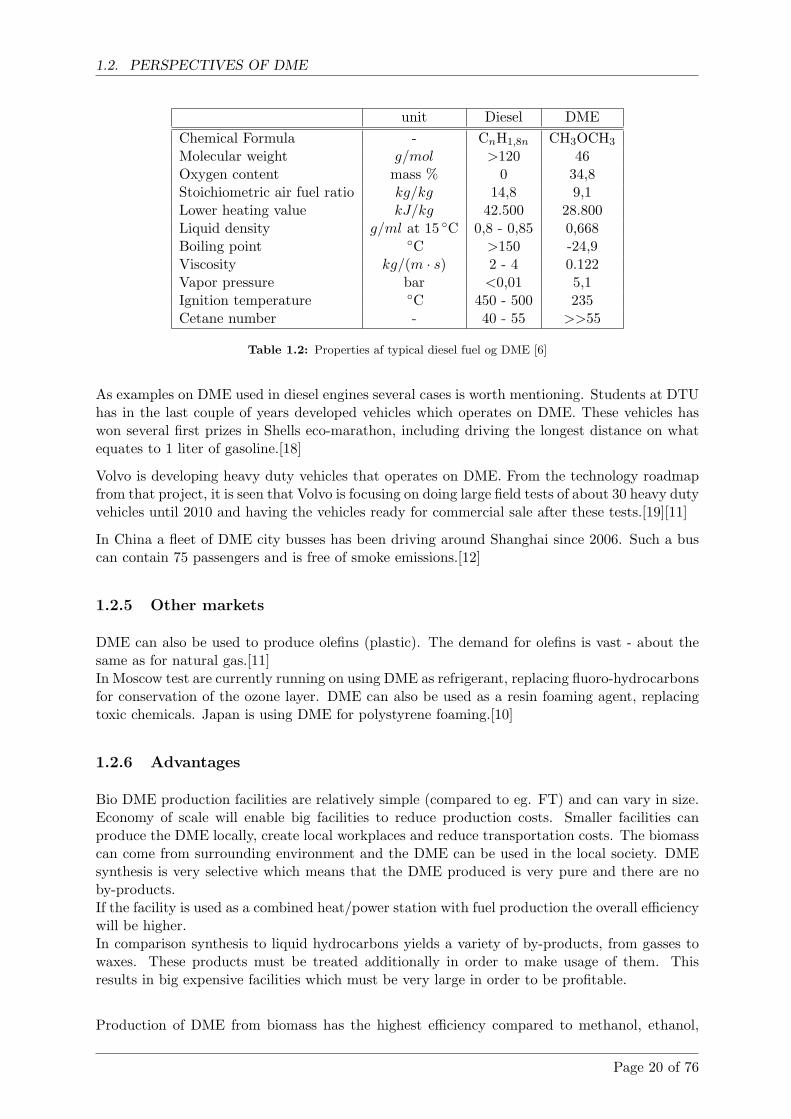
DME fuelled engines has greater output torque than diesel fuelled engines, especially at lowspeeds (figure 1.4). Since there is no smoke limitation with DME the power output can beincreased by adding more fuel. This gives advantages to frequently starting and stopping andheavy-duty vehicles, for instance a city bus.[17]
Figure 1.4: Torque and power at full load[17]
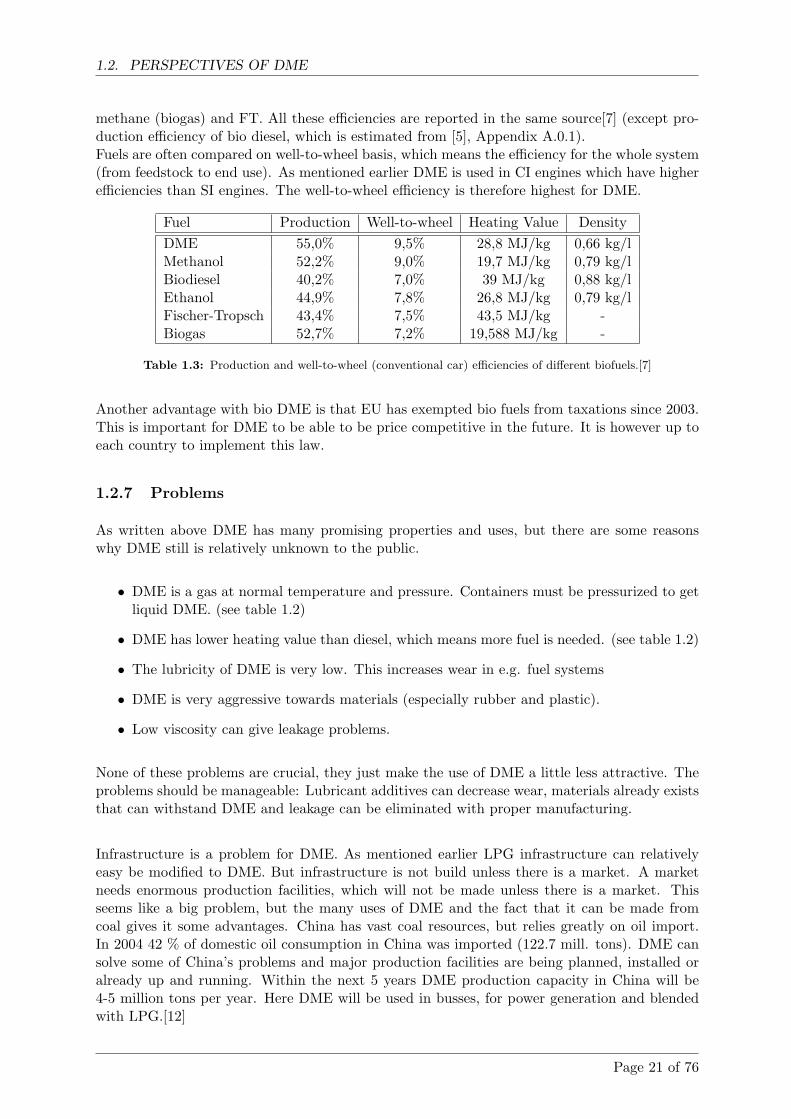
DME has a high cetane number, which means that it easily ignites when injected into thecylinder. This makes DME well suited for CI engines. This is fortunate since the CI engineshas the highest efficiencies - about 30% better fuel economy than SI engines.[13]Due to the high cetane number of DME it has lower pressure rise rate upon combustion thanconventional diesel. This results in less noise than conventional diesel.
Figure 1.5: Engine noise[17]
Page 19 of 76
1.2. PERSPECTIVES OF DME
unit Diesel DMEChemical Formula - CnH1,8n CH3OCH3
Molecular weight g/mol >120 46Oxygen content mass % 0 34,8Stoichiometric air fuel ratio kg/kg 14,8 9,1Lower heating value kJ/kg 42.500 28.800Liquid density g/ml at 15 ◦C 0,8 - 0,85 0,668Boiling point ◦C >150 -24,9Viscosity kg/(m · s) 2 - 4 0.122Vapor pressure bar <0,01 5,1Ignition temperature ◦C 450 - 500 235Cetane number - 40 - 55 >>55
Table 1.2: Properties af typical diesel fuel og DME [6]
As examples on DME used in diesel engines several cases is worth mentioning. Students at DTUhas in the last couple of years developed vehicles which operates on DME. These vehicles haswon several first prizes in Shells eco-marathon, including driving the longest distance on whatequates to 1 liter of gasoline.[18]
Volvo is developing heavy duty vehicles that operates on DME. From the technology roadmapfrom that project, it is seen that Volvo is focusing on doing large field tests of about 30 heavy dutyvehicles until 2010 and having the vehicles ready for commercial sale after these tests.[19][11]
In China a fleet of DME city busses has been driving around Shanghai since 2006. Such a buscan contain 75 passengers and is free of smoke emissions.[12]
1.2.5 Other markets
DME can also be used to produce olefins (plastic). The demand for olefins is vast - about thesame as for natural gas.[11]In Moscow test are currently running on using DME as refrigerant, replacing fluoro-hydrocarbonsfor conservation of the ozone layer. DME can also be used as a resin foaming agent, replacingtoxic chemicals. Japan is using DME for polystyrene foaming.[10]
1.2.6 Advantages
Bio DME production facilities are relatively simple (compared to eg. FT) and can vary in size.Economy of scale will enable big facilities to reduce production costs. Smaller facilities canproduce the DME locally, create local workplaces and reduce transportation costs. The biomasscan come from surrounding environment and the DME can be used in the local society. DMEsynthesis is very selective which means that the DME produced is very pure and there are noby-products.If the facility is used as a combined heat/power station with fuel production the overall efficiencywill be higher.In comparison synthesis to liquid hydrocarbons yields a variety of by-products, from gasses towaxes. These products must be treated additionally in order to make usage of them. Thisresults in big expensive facilities which must be very large in order to be profitable.
Production of DME from biomass has the highest efficiency compared to methanol, ethanol,
Page 20 of 76
1.2. PERSPECTIVES OF DME
methane (biogas) and FT. All these efficiencies are reported in the same source[7] (except pro-duction efficiency of bio diesel, which is estimated from [5], Appendix A.0.1).Fuels are often compared on well-to-wheel basis, which means the efficiency for the whole system(from feedstock to end use). As mentioned earlier DME is used in CI engines which have higherefficiencies than SI engines. The well-to-wheel efficiency is therefore highest for DME.
Fuel Production Well-to-wheel Heating Value DensityDME 55,0% 9,5% 28,8 MJ/kg 0,66 kg/lMethanol 52,2% 9,0% 19,7 MJ/kg 0,79 kg/lBiodiesel 40,2% 7,0% 39 MJ/kg 0,88 kg/lEthanol 44,9% 7,8% 26,8 MJ/kg 0,79 kg/lFischer-Tropsch 43,4% 7,5% 43,5 MJ/kg -Biogas 52,7% 7,2% 19,588 MJ/kg -
Table 1.3: Production and well-to-wheel (conventional car) efficiencies of different biofuels.[7]
Another advantage with bio DME is that EU has exempted bio fuels from taxations since 2003.This is important for DME to be able to be price competitive in the future. It is however up toeach country to implement this law.
1.2.7 Problems
As written above DME has many promising properties and uses, but there are some reasonswhy DME still is relatively unknown to the public.
• DME is a gas at normal temperature and pressure. Containers must be pressurized to getliquid DME. (see table 1.2)
• DME has lower heating value than diesel, which means more fuel is needed. (see table 1.2)
• The lubricity of DME is very low. This increases wear in e.g. fuel systems
• DME is very aggressive towards materials (especially rubber and plastic).
• Low viscosity can give leakage problems.
None of these problems are crucial, they just make the use of DME a little less attractive. Theproblems should be manageable: Lubricant additives can decrease wear, materials already existsthat can withstand DME and leakage can be eliminated with proper manufacturing.
Infrastructure is a problem for DME. As mentioned earlier LPG infrastructure can relativelyeasy be modified to DME. But infrastructure is not build unless there is a market. A marketneeds enormous production facilities, which will not be made unless there is a market. Thisseems like a big problem, but the many uses of DME and the fact that it can be made fromcoal gives it some advantages. China has vast coal resources, but relies greatly on oil import.In 2004 42 % of domestic oil consumption in China was imported (122.7 mill. tons). DME cansolve some of China’s problems and major production facilities are being planned, installed oralready up and running. Within the next 5 years DME production capacity in China will be4-5 million tons per year. Here DME will be used in busses, for power generation and blendedwith LPG.[12]
Page 21 of 76
Chapter 2
Theoretic model
2.1 Introduction
To be able to optimize the configuration of a bio DME facility a model is constructed. Differentparameters can be changed in order to evaluate outcome, yield etc. This model will be com-pared to results from the existing methanol demonstration facility. The model will also play animportant role in the upgrade of the facility from methanol to DME synthesis. The constructionof a DME facility depends on the amount of DME in the gas after synthesis (section 2.3.5).
The model will be constructed in the equation program EES (Engineering Equation Solver).It will be simplified and only consider basic parameters within the facility.EES can solve any number of equations with the same number of unknowns. It is importantto define upper and lower limits of some of the variables in the model. Otherwise EES can getsolutions with negative quantities of components for instance. Therefore all molar fractions arelimited to the interval [0; 1]. Supplying EES with reasonable guesses of certain values can benecessary to get accurate results. EES contains a number of built-in functions to determinede.g. saturated pressure of a component.
The facility is originally designed to produce methanol from bottled gas. The facility has beenupgraded to be able to run on synthesis gas from the Viking gasifier. The model was thereforefirst created for methanol synthesis and tested against experiments made on the facility (seesection 3.5.3).The model was then further developed to describe the DME synthesis. This model will be com-pared with results from the literature, because we had no time to upgrade the facility to DMEproduction.The DME model will be described in the following chapter. Since the methanol model is con-tained in the DME model, the description of the DME model will describe the methanol modelmeanwhile.
There are two different setups to produce DME in the facility.
1. Two reactors with different catalysts pills.
2. One reactor with mixed pills.
A model is created for both, and reviewed in section 2.4
22
2.2. ARGUMENTATION FOR ASSUMPTIONS
These are the two main reactions for producing DME.[20]
3 CO + 3 H2 CH3OCH3 + CO2 (1.1)2 CO + 4 H2 CH3OCH3 + H2O (1.2)
The two different reactions to produce DME uses different amounts of CO and H2. Reaction(1.1) performs best with a H2/CO ratio of 1, while reaction (1.2) prefers a ratio to be 2.DME can be produced either by direct DME synthesis or by methanol dehydration. The cat-alysts used in this facility are for methanol synthesis (eq. 1.3) and methanol dehydration (eq.(1.5)).The two reactions for DME production ((1.1), (1.2)) can be formed from the methanol synthesis,the water-gas-shift (eq. 1.4) and the methanol dehydration. Since the two main reactions arelinear combinations of these three, the model will be based on these reactions.
CO + 2 H2 CH3OH (1.3)CO2 + H2 CO + H2O (1.4)2 CH3OH CH3OCH3 + H2O (1.5)
AssumptionsFollowing assumptions are made in the model.
• Only the three reactions (eq. (1.3)-(1.5)) will be considered.
• Components not occurring in these reactions are inert.
• Stationary conditions.
• Thermal equilibrium
• Chemical equilibrium is assumed in reactors.
• Ideal gas behavior is assumed.
The argumentation for these assumptions are presented in the following section.
2.2 Argumentation for assumptions
The selectivity of the catalysts for methanol and DME synthesis is very high [21]. It is thereforeconsidered unlikely that other reactions should occur.
Conditions in the facility are kept constant. Therefore there is no change in time and sta-tionary conditions can be assumed.
Thermal equilibrium is assumed because heat transfer is not calculated. Temperature of themethanol synthesis is assumed to the same temperature as the gas out of the reactor.
Chemical equilibrium in the reactors must be assumed because the model do not calculate
Page 23 of 76
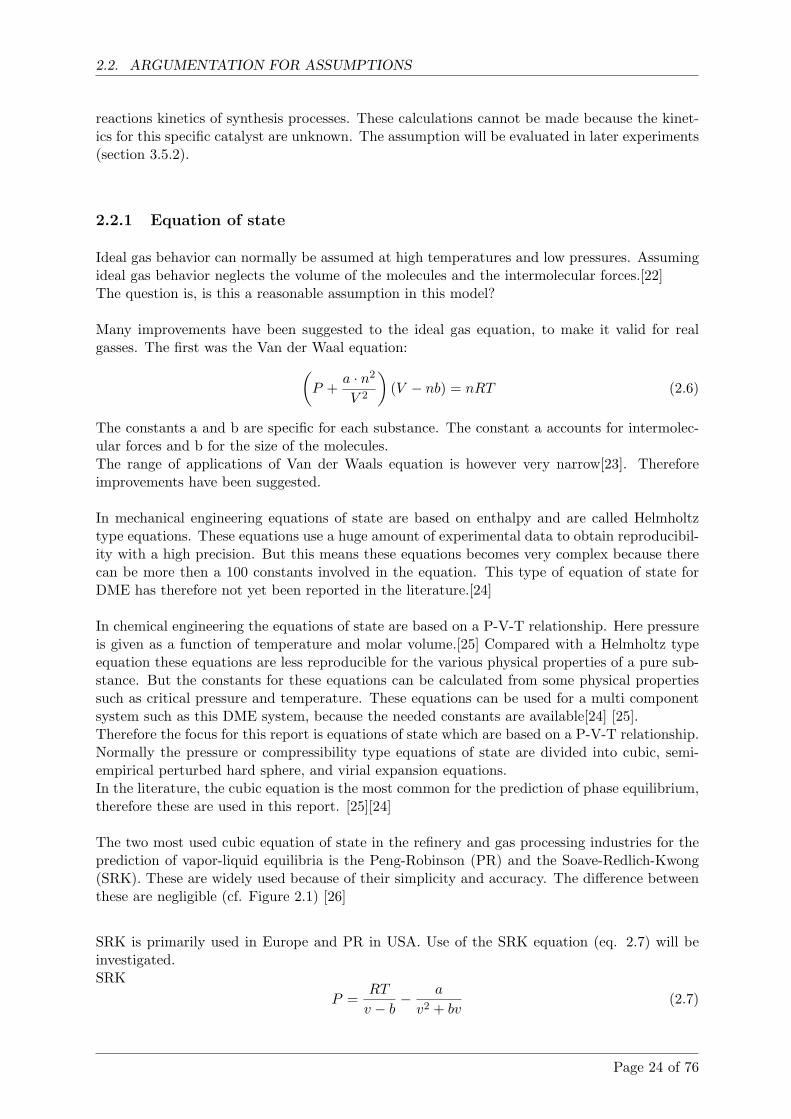
2.2. ARGUMENTATION FOR ASSUMPTIONS
reactions kinetics of synthesis processes. These calculations cannot be made because the kinet-ics for this specific catalyst are unknown. The assumption will be evaluated in later experiments(section 3.5.2).
2.2.1 Equation of state
Ideal gas behavior can normally be assumed at high temperatures and low pressures. Assumingideal gas behavior neglects the volume of the molecules and the intermolecular forces.[22]The question is, is this a reasonable assumption in this model?
Many improvements have been suggested to the ideal gas equation, to make it valid for realgasses. The first was the Van der Waal equation:(
P +a · n2
V 2
)(V − nb) = nRT (2.6)
The constants a and b are specific for each substance. The constant a accounts for intermolec-ular forces and b for the size of the molecules.The range of applications of Van der Waals equation is however very narrow[23]. Thereforeimprovements have been suggested.
In mechanical engineering equations of state are based on enthalpy and are called Helmholtztype equations. These equations use a huge amount of experimental data to obtain reproducibil-ity with a high precision. But this means these equations becomes very complex because therecan be more then a 100 constants involved in the equation. This type of equation of state forDME has therefore not yet been reported in the literature.[24]
In chemical engineering the equations of state are based on a P-V-T relationship. Here pressureis given as a function of temperature and molar volume.[25] Compared with a Helmholtz typeequation these equations are less reproducible for the various physical properties of a pure sub-stance. But the constants for these equations can be calculated from some physical propertiessuch as critical pressure and temperature. These equations can be used for a multi componentsystem such as this DME system, because the needed constants are available[24] [25].Therefore the focus for this report is equations of state which are based on a P-V-T relationship.Normally the pressure or compressibility type equations of state are divided into cubic, semi-empirical perturbed hard sphere, and virial expansion equations.In the literature, the cubic equation is the most common for the prediction of phase equilibrium,therefore these are used in this report. [25][24]
The two most used cubic equation of state in the refinery and gas processing industries for theprediction of vapor-liquid equilibria is the Peng-Robinson (PR) and the Soave-Redlich-Kwong(SRK). These are widely used because of their simplicity and accuracy. The difference betweenthese are negligible (cf. Figure 2.1) [26]
SRK is primarily used in Europe and PR in USA. Use of the SRK equation (eq. 2.7) will beinvestigated.SRK
P =RT
v − b− a
v2 + bv(2.7)
Page 24 of 76
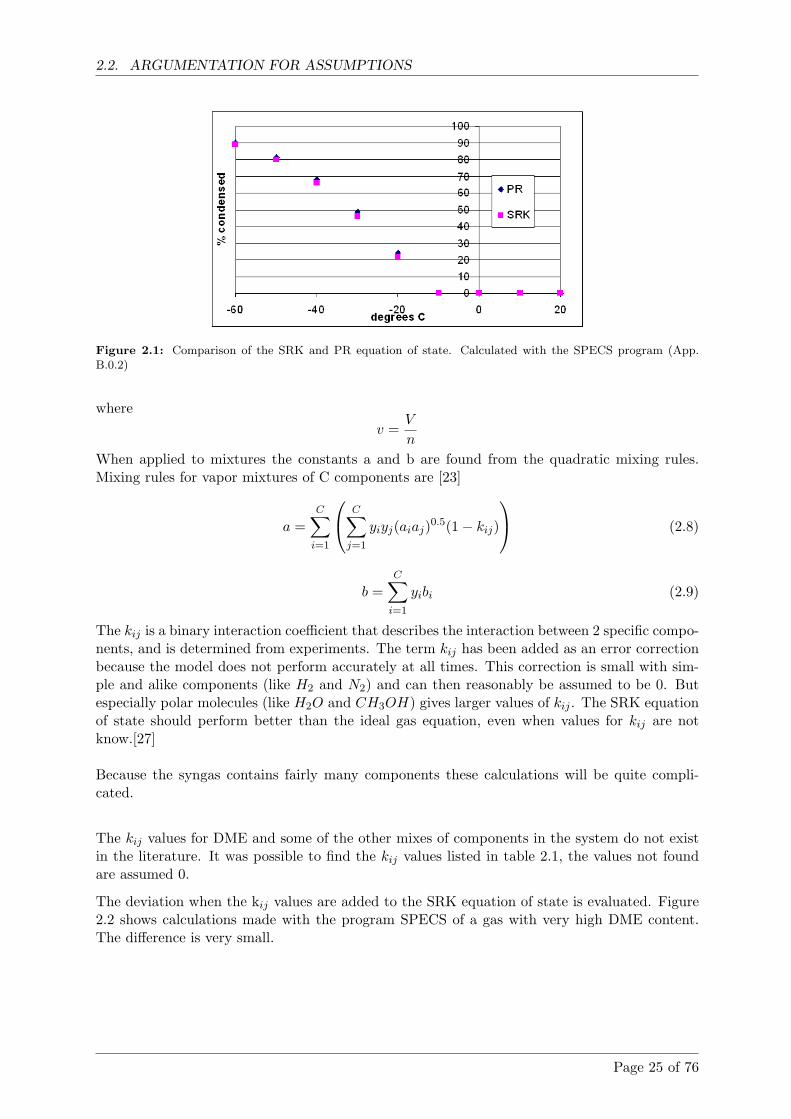
2.2. ARGUMENTATION FOR ASSUMPTIONS
Figure 2.1: Comparison of the SRK and PR equation of state. Calculated with the SPECS program (App.B.0.2)
wherev =
V
n
When applied to mixtures the constants a and b are found from the quadratic mixing rules.Mixing rules for vapor mixtures of C components are [23]
a =C∑
i=1
C∑j=1
yiyj(aiaj)0.5(1− kij)
(2.8)
b =C∑
i=1
yibi (2.9)
The kij is a binary interaction coefficient that describes the interaction between 2 specific compo-nents, and is determined from experiments. The term kij has been added as an error correctionbecause the model does not perform accurately at all times. This correction is small with sim-ple and alike components (like H2 and N2) and can then reasonably be assumed to be 0. Butespecially polar molecules (like H2O and CH3OH) gives larger values of kij . The SRK equationof state should perform better than the ideal gas equation, even when values for kij are notknow.[27]
Because the syngas contains fairly many components these calculations will be quite compli-cated.
The kij values for DME and some of the other mixes of components in the system do not existin the literature. It was possible to find the kij values listed in table 2.1, the values not foundare assumed 0.
The deviation when the kij values are added to the SRK equation of state is evaluated. Figure2.2 shows calculations made with the program SPECS of a gas with very high DME content.The difference is very small.
Page 25 of 76
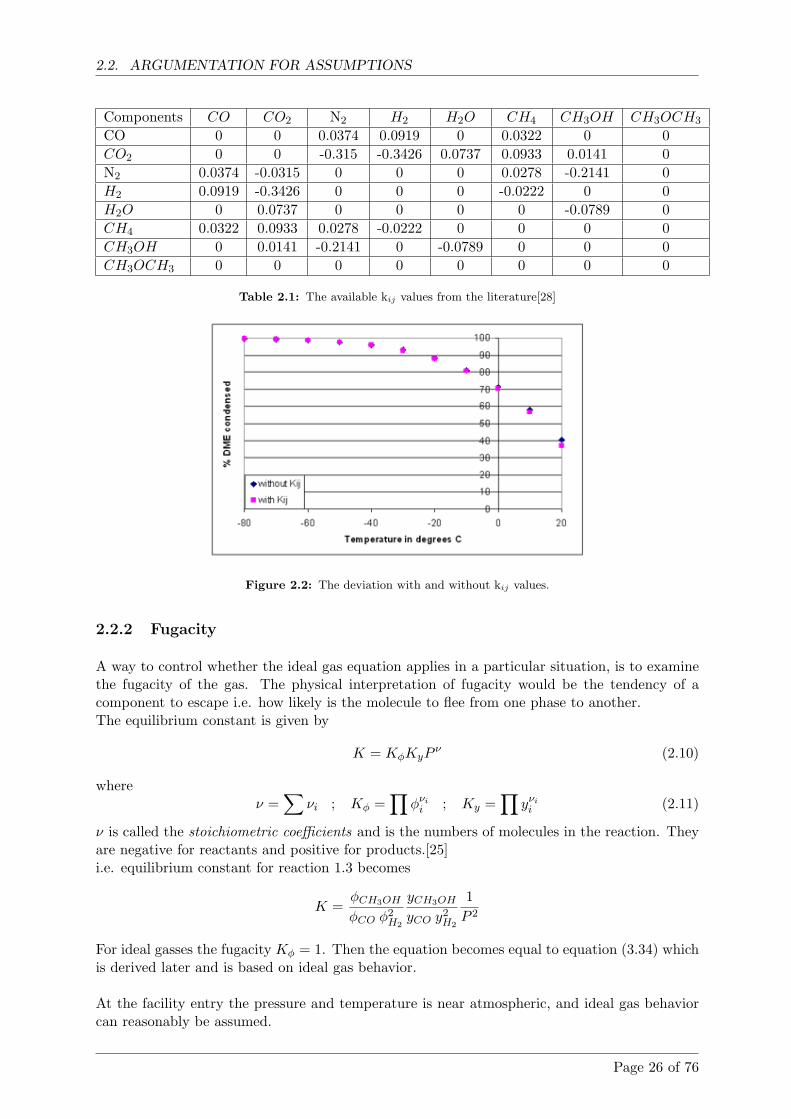
2.2. ARGUMENTATION FOR ASSUMPTIONS
Components CO CO2 N2 H2 H2O CH4 CH3OH CH3OCH3
CO 0 0 0.0374 0.0919 0 0.0322 0 0CO2 0 0 -0.315 -0.3426 0.0737 0.0933 0.0141 0N2 0.0374 -0.0315 0 0 0 0.0278 -0.2141 0H2 0.0919 -0.3426 0 0 0 -0.0222 0 0H2O 0 0.0737 0 0 0 0 -0.0789 0CH4 0.0322 0.0933 0.0278 -0.0222 0 0 0 0CH3OH 0 0.0141 -0.2141 0 -0.0789 0 0 0CH3OCH3 0 0 0 0 0 0 0 0
Table 2.1: The available kij values from the literature[28]
Figure 2.2: The deviation with and without kij values.
2.2.2 Fugacity
A way to control whether the ideal gas equation applies in a particular situation, is to examinethe fugacity of the gas. The physical interpretation of fugacity would be the tendency of acomponent to escape i.e. how likely is the molecule to flee from one phase to another.The equilibrium constant is given by
K = KφKyPν (2.10)
whereν =
∑νi ; Kφ =
∏φνi
i ; Ky =∏
yνii (2.11)
ν is called the stoichiometric coefficients and is the numbers of molecules in the reaction. Theyare negative for reactants and positive for products.[25]i.e. equilibrium constant for reaction 1.3 becomes
K =φCH3OH
φCO φ2H2
yCH3OH
yCO y2H2
1P 2
For ideal gasses the fugacity Kφ = 1. Then the equation becomes equal to equation (3.34) whichis derived later and is based on ideal gas behavior.
At the facility entry the pressure and temperature is near atmospheric, and ideal gas behaviorcan reasonably be assumed.
Page 26 of 76
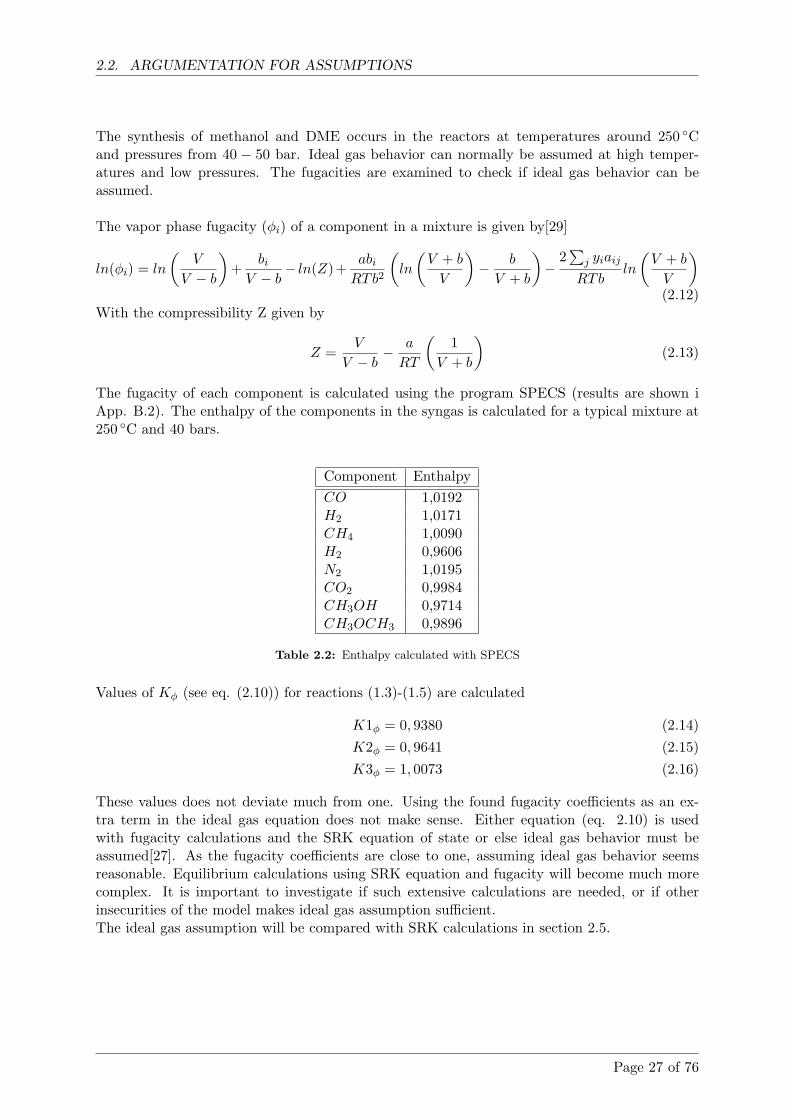
2.2. ARGUMENTATION FOR ASSUMPTIONS
The synthesis of methanol and DME occurs in the reactors at temperatures around 250 ◦Cand pressures from 40 − 50 bar. Ideal gas behavior can normally be assumed at high temper-atures and low pressures. The fugacities are examined to check if ideal gas behavior can beassumed.
The vapor phase fugacity (φi) of a component in a mixture is given by[29]
ln(φi) = ln
(V
V − b
)+
bi
V − b− ln(Z)+
abi
RTb2
(ln
(V + b
V
)− b
V + b
)−
2∑
j yiaij
RTbln
(V + b
V
)(2.12)
With the compressibility Z given by
Z =V
V − b− a
RT
(1
V + b
)(2.13)
The fugacity of each component is calculated using the program SPECS (results are shown iApp. B.2). The enthalpy of the components in the syngas is calculated for a typical mixture at250 ◦C and 40 bars.
Component EnthalpyCO 1,0192H2 1,0171CH4 1,0090H2 0,9606N2 1,0195CO2 0,9984CH3OH 0,9714CH3OCH3 0,9896
Table 2.2: Enthalpy calculated with SPECS
Values of Kφ (see eq. (2.10)) for reactions (1.3)-(1.5) are calculated
K1φ = 0, 9380 (2.14)K2φ = 0, 9641 (2.15)K3φ = 1, 0073 (2.16)
These values does not deviate much from one. Using the found fugacity coefficients as an ex-tra term in the ideal gas equation does not make sense. Either equation (eq. 2.10) is usedwith fugacity calculations and the SRK equation of state or else ideal gas behavior must beassumed[27]. As the fugacity coefficients are close to one, assuming ideal gas behavior seemsreasonable. Equilibrium calculations using SRK equation and fugacity will become much morecomplex. It is important to investigate if such extensive calculations are needed, or if otherinsecurities of the model makes ideal gas assumption sufficient.The ideal gas assumption will be compared with SRK calculations in section 2.5.
Page 27 of 76
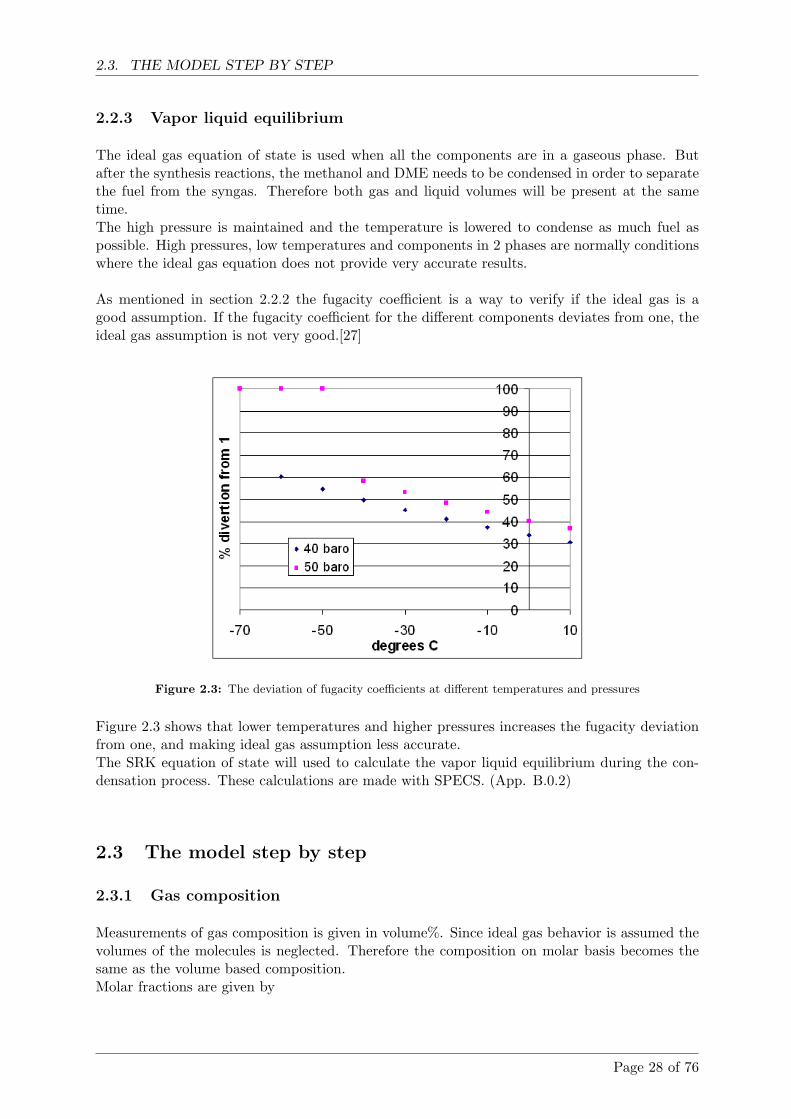
2.3. THE MODEL STEP BY STEP
2.2.3 Vapor liquid equilibrium
The ideal gas equation of state is used when all the components are in a gaseous phase. Butafter the synthesis reactions, the methanol and DME needs to be condensed in order to separatethe fuel from the syngas. Therefore both gas and liquid volumes will be present at the sametime.The high pressure is maintained and the temperature is lowered to condense as much fuel aspossible. High pressures, low temperatures and components in 2 phases are normally conditionswhere the ideal gas equation does not provide very accurate results.
As mentioned in section 2.2.2 the fugacity coefficient is a way to verify if the ideal gas is agood assumption. If the fugacity coefficient for the different components deviates from one, theideal gas assumption is not very good.[27]
Figure 2.3: The deviation of fugacity coefficients at different temperatures and pressures
Figure 2.3 shows that lower temperatures and higher pressures increases the fugacity deviationfrom one, and making ideal gas assumption less accurate.The SRK equation of state will used to calculate the vapor liquid equilibrium during the con-densation process. These calculations are made with SPECS. (App. B.0.2)
2.3 The model step by step
2.3.1 Gas composition
Measurements of gas composition is given in volume%. Since ideal gas behavior is assumed thevolumes of the molecules is neglected. Therefore the composition on molar basis becomes thesame as the volume based composition.Molar fractions are given by
Page 28 of 76
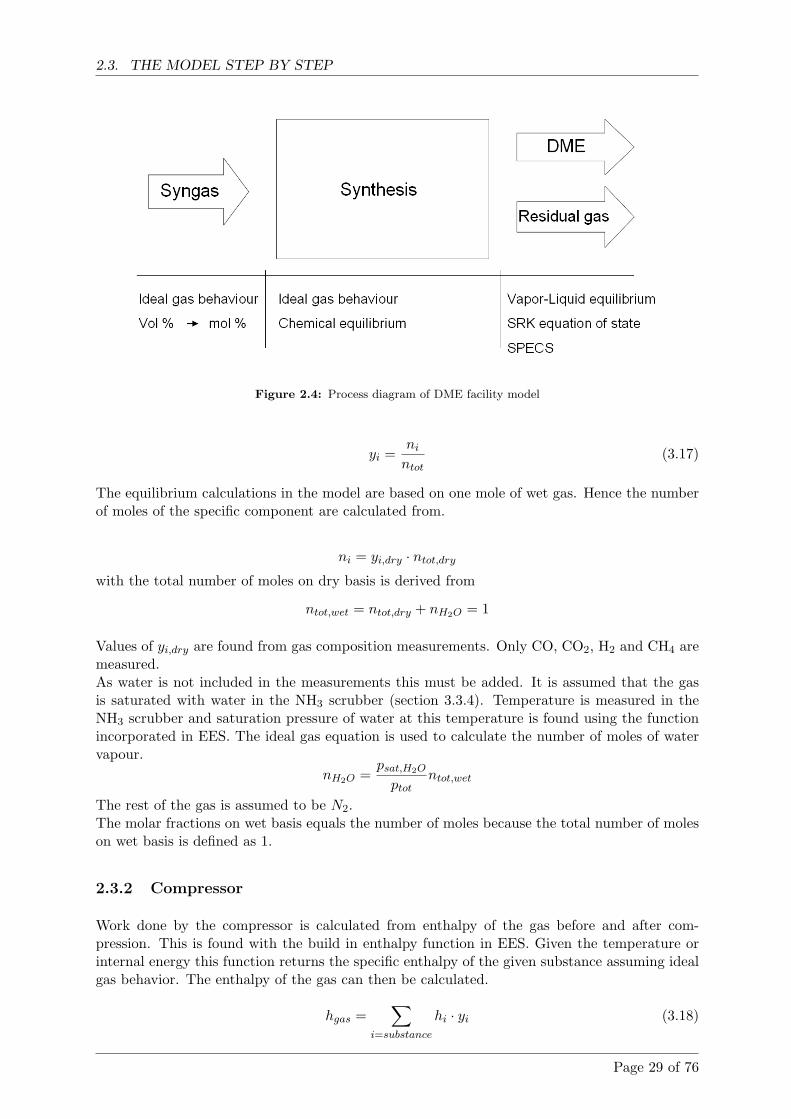
2.3. THE MODEL STEP BY STEP
Figure 2.4: Process diagram of DME facility model
yi =ni
ntot(3.17)
The equilibrium calculations in the model are based on one mole of wet gas. Hence the numberof moles of the specific component are calculated from.
ni = yi,dry · ntot,dry
with the total number of moles on dry basis is derived from
ntot,wet = ntot,dry + nH2O = 1
Values of yi,dry are found from gas composition measurements. Only CO, CO2, H2 and CH4 aremeasured.As water is not included in the measurements this must be added. It is assumed that the gasis saturated with water in the NH3 scrubber (section 3.3.4). Temperature is measured in theNH3 scrubber and saturation pressure of water at this temperature is found using the functionincorporated in EES. The ideal gas equation is used to calculate the number of moles of watervapour.
nH2O =psat,H2O
ptotntot,wet
The rest of the gas is assumed to be N2.The molar fractions on wet basis equals the number of moles because the total number of moleson wet basis is defined as 1.
2.3.2 Compressor
Work done by the compressor is calculated from enthalpy of the gas before and after com-pression. This is found with the build in enthalpy function in EES. Given the temperature orinternal energy this function returns the specific enthalpy of the given substance assuming idealgas behavior. The enthalpy of the gas can then be calculated.
hgas =∑
i=substance
hi · yi (3.18)
Page 29 of 76
2.3. THE MODEL STEP BY STEP
By assuming ideal gas behavior, constant specific heats, the efficiency of the compressor ηc andthe specific heat ratio γ, the temperature after compression can be determined.Isentropic compression gives[30]:
Tafter,s = Tbefore
(pafter
pbefore
) γ−1γ
(3.19)
Tafter = Tbefore +Tafter,s − Tbefore
ηc(3.20)
The enthalpy function can now be used to find the enthalpy after compression with the use ofthe temperature.The first law of thermodynamics can now be used to find the work done by the compressor.Steady state is assumed and kinetic and potential energy is neglected. An adiabatic compressiongives following revised first law[30].
Wc = m(hafter − hbefore) (3.21)
But since EES returns the enthalpy’s in Jmol the equation becomes
Wc = n(hafter − hbefore) (3.22)
2.3.3 Synthesis
As mentioned in section 2.1 the model is based on equilibrium of these three reactions.
Methanol synthesis:
CO + 2H2 CH3OHbefore : nCO nH2 0after : nCO − x nH2 − 2x x
Gas-water shift:
CO2 + H2 CO + H2Obefore : nCO2 nH2 nCO nH2O
after : nCO2 − y nH2 − 2x− y nCO − x + y nH2O + y
DME synthesis:
2CH3OH CH3OCH3 + H2Obefore : x 0 nH2O + yafter : x− 2z z nH2O + y + z
The equilibrium equations (eq. (1.3-1.5)) leads to the following equations
nCO,after = nCO − x + y (3.23)nH2,after = nH2 − 2x− y (3.24)
nCO2,after = nCO2 − y (3.25)nCH3OH,after = x− 2z (3.26)
nH2O,after = nH2O + y + z (3.27)nCH3OCH3,after = z (3.28)
Page 30 of 76
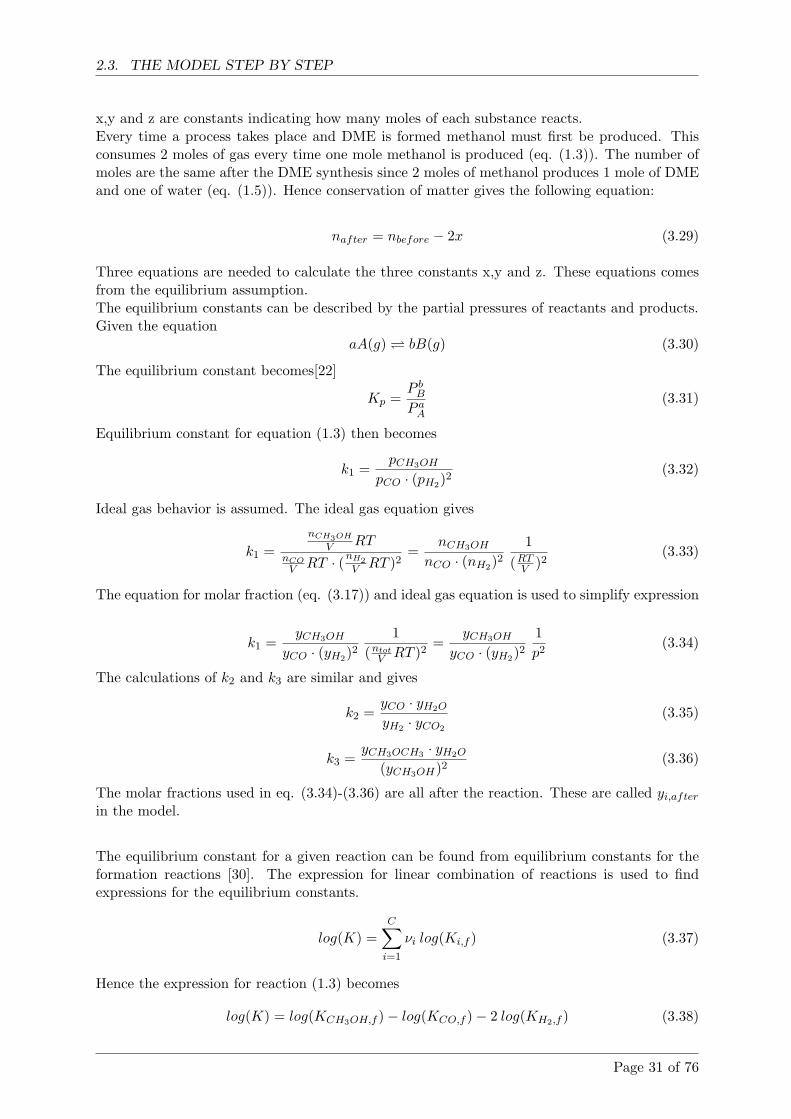
2.3. THE MODEL STEP BY STEP
x,y and z are constants indicating how many moles of each substance reacts.Every time a process takes place and DME is formed methanol must first be produced. Thisconsumes 2 moles of gas every time one mole methanol is produced (eq. (1.3)). The number ofmoles are the same after the DME synthesis since 2 moles of methanol produces 1 mole of DMEand one of water (eq. (1.5)). Hence conservation of matter gives the following equation:
nafter = nbefore − 2x (3.29)
Three equations are needed to calculate the three constants x,y and z. These equations comesfrom the equilibrium assumption.The equilibrium constants can be described by the partial pressures of reactants and products.Given the equation
aA(g) bB(g) (3.30)
The equilibrium constant becomes[22]
Kp =P b
B
P aA
(3.31)
Equilibrium constant for equation (1.3) then becomes
k1 =pCH3OH
pCO · (pH2)2(3.32)
Ideal gas behavior is assumed. The ideal gas equation gives
k1 =nCH3OH
V RTnCOV RT · (nH2
V RT )2=
nCH3OH
nCO · (nH2)21
(RTV )2
(3.33)
The equation for molar fraction (eq. (3.17)) and ideal gas equation is used to simplify expression
k1 =yCH3OH
yCO · (yH2)21
(ntotV RT )2
=yCH3OH
yCO · (yH2)21p2
(3.34)
The calculations of k2 and k3 are similar and gives
k2 =yCO · yH2O
yH2 · yCO2
(3.35)
k3 =yCH3OCH3 · yH2O
(yCH3OH)2(3.36)
The molar fractions used in eq. (3.34)-(3.36) are all after the reaction. These are called yi,after
in the model.
The equilibrium constant for a given reaction can be found from equilibrium constants for theformation reactions [30]. The expression for linear combination of reactions is used to findexpressions for the equilibrium constants.
log(K) =C∑
i=1
νi log(Ki,f ) (3.37)
Hence the expression for reaction (1.3) becomes
log(K) = log(KCH3OH,f )− log(KCO,f )− 2 log(KH2,f ) (3.38)
Page 31 of 76
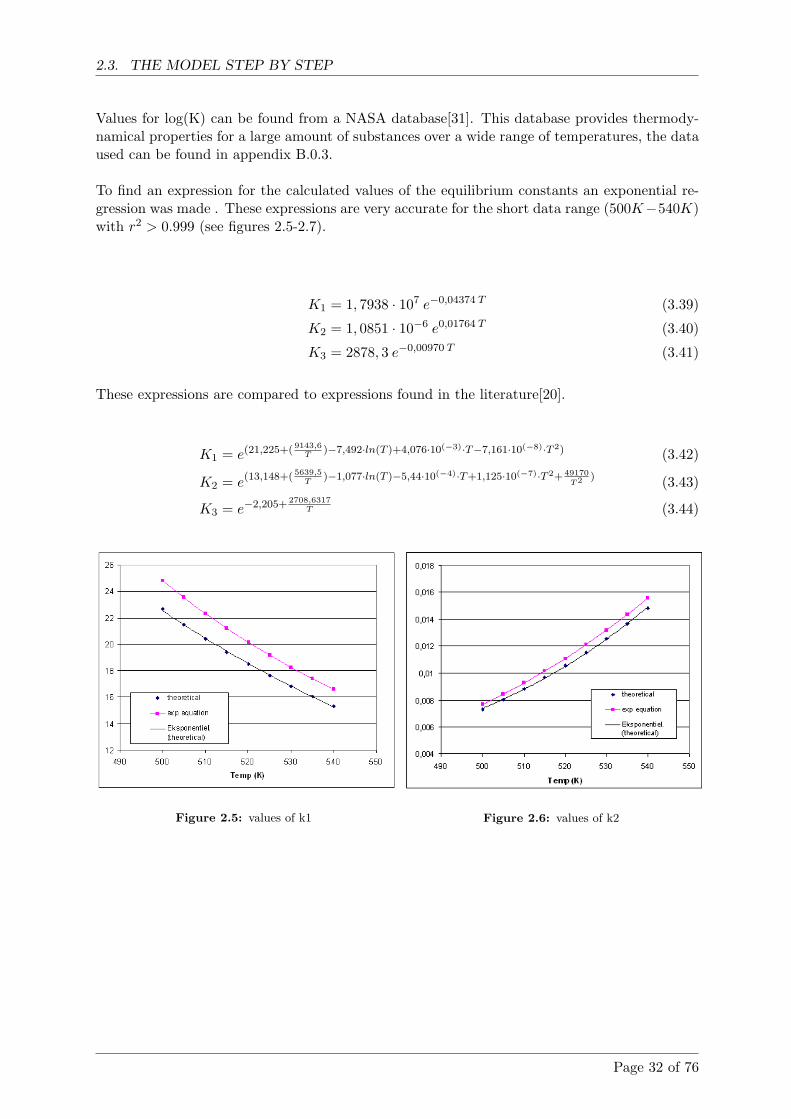
2.3. THE MODEL STEP BY STEP
Values for log(K) can be found from a NASA database[31]. This database provides thermody-namical properties for a large amount of substances over a wide range of temperatures, the dataused can be found in appendix B.0.3.
To find an expression for the calculated values of the equilibrium constants an exponential re-gression was made . These expressions are very accurate for the short data range (500K−540K)with r2 > 0.999 (see figures 2.5-2.7).
K1 = 1, 7938 · 107 e−0,04374 T (3.39)
K2 = 1, 0851 · 10−6 e0,01764 T (3.40)
K3 = 2878, 3 e−0,00970 T (3.41)
These expressions are compared to expressions found in the literature[20].
K1 = e(21,225+( 9143,6T
)−7,492·ln(T )+4,076·10(−3)·T−7,161·10(−8)·T 2) (3.42)
K2 = e(13,148+( 5639,5T
)−1,077·ln(T )−5,44·10(−4)·T+1,125·10(−7)·T 2+ 49170T2 ) (3.43)
K3 = e−2,205+ 2708,6317T (3.44)
Figure 2.5: values of k1 Figure 2.6: values of k2
Page 32 of 76
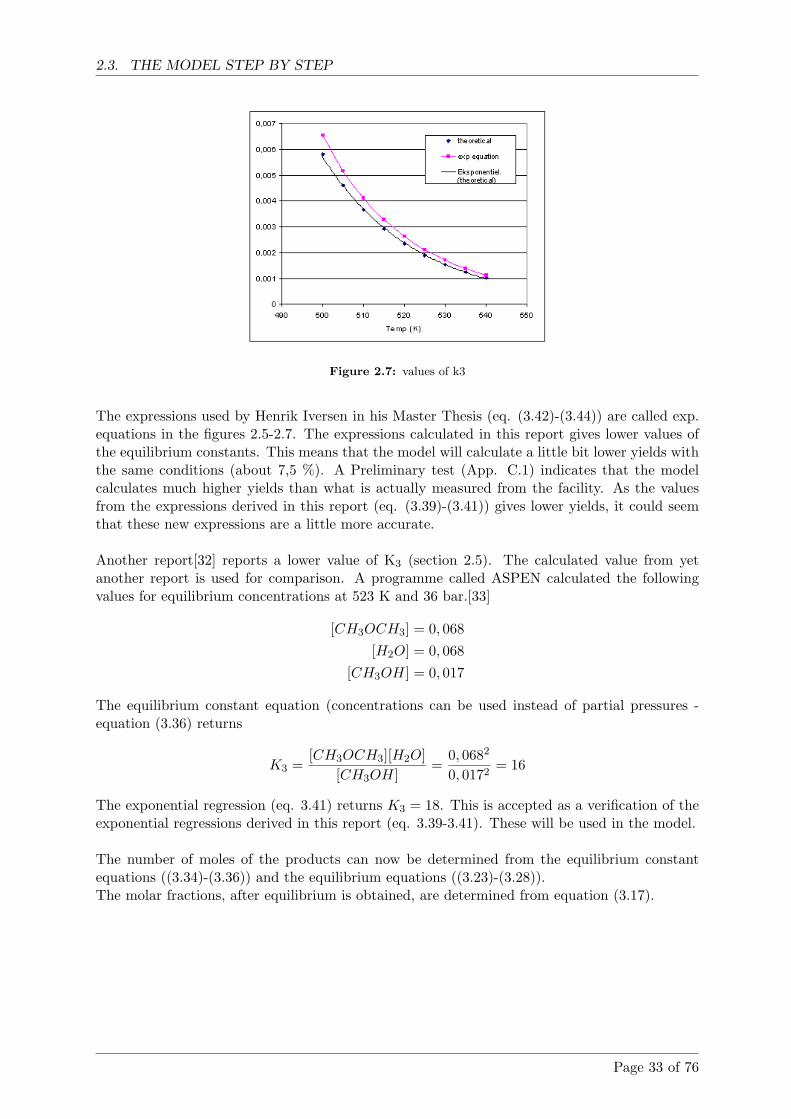
2.3. THE MODEL STEP BY STEP
Figure 2.7: values of k3
The expressions used by Henrik Iversen in his Master Thesis (eq. (3.42)-(3.44)) are called exp.equations in the figures 2.5-2.7. The expressions calculated in this report gives lower values ofthe equilibrium constants. This means that the model will calculate a little bit lower yields withthe same conditions (about 7,5 %). A Preliminary test (App. C.1) indicates that the modelcalculates much higher yields than what is actually measured from the facility. As the valuesfrom the expressions derived in this report (eq. (3.39)-(3.41)) gives lower yields, it could seemthat these new expressions are a little more accurate.
Another report[32] reports a lower value of K3 (section 2.5). The calculated value from yetanother report is used for comparison. A programme called ASPEN calculated the followingvalues for equilibrium concentrations at 523 K and 36 bar.[33]
[CH3OCH3] = 0, 068[H2O] = 0, 068
[CH3OH] = 0, 017
The equilibrium constant equation (concentrations can be used instead of partial pressures -equation (3.36) returns
K3 =[CH3OCH3][H2O]
[CH3OH]=
0, 0682
0, 0172= 16
The exponential regression (eq. 3.41) returns K3 = 18. This is accepted as a verification of theexponential regressions derived in this report (eq. 3.39-3.41). These will be used in the model.
The number of moles of the products can now be determined from the equilibrium constantequations ((3.34)-(3.36)) and the equilibrium equations ((3.23)-(3.28)).The molar fractions, after equilibrium is obtained, are determined from equation (3.17).
Page 33 of 76
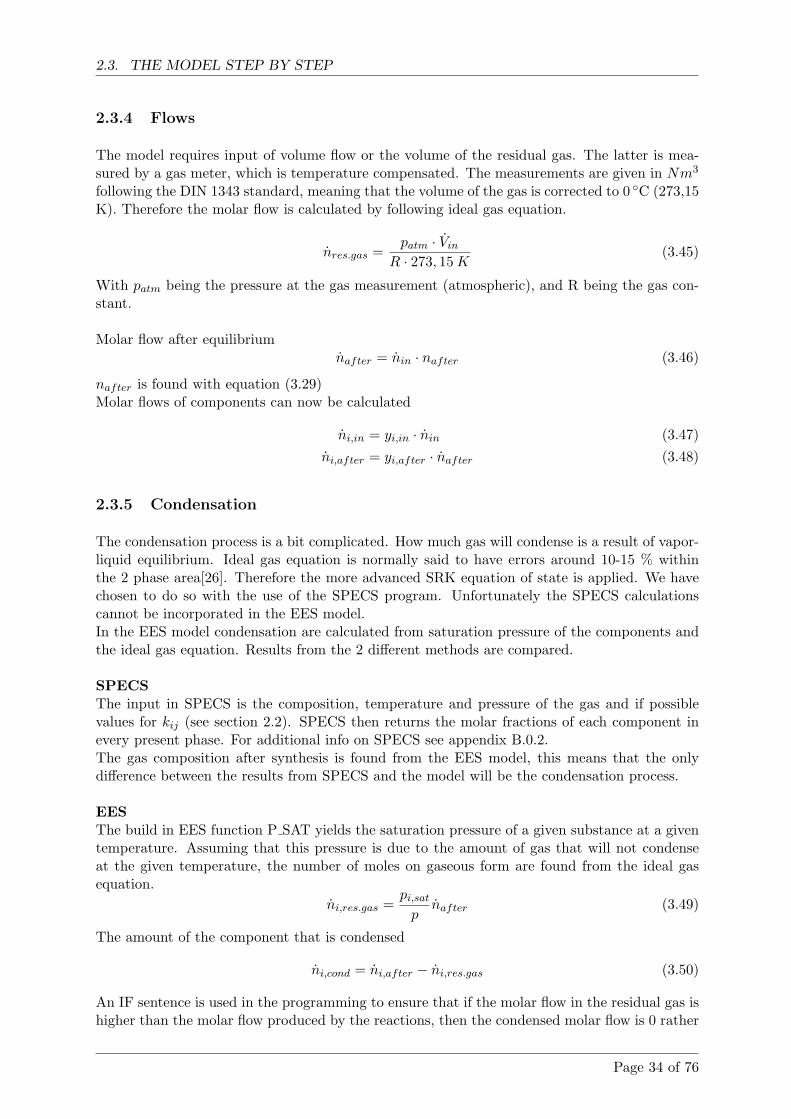
2.3. THE MODEL STEP BY STEP
2.3.4 Flows
The model requires input of volume flow or the volume of the residual gas. The latter is mea-sured by a gas meter, which is temperature compensated. The measurements are given in Nm3
following the DIN 1343 standard, meaning that the volume of the gas is corrected to 0 ◦C (273,15K). Therefore the molar flow is calculated by following ideal gas equation.
nres.gas =patm · Vin
R · 273, 15 K(3.45)
With patm being the pressure at the gas measurement (atmospheric), and R being the gas con-stant.
Molar flow after equilibriumnafter = nin · nafter (3.46)
nafter is found with equation (3.29)Molar flows of components can now be calculated
ni,in = yi,in · nin (3.47)ni,after = yi,after · nafter (3.48)
2.3.5 Condensation
The condensation process is a bit complicated. How much gas will condense is a result of vapor-liquid equilibrium. Ideal gas equation is normally said to have errors around 10-15 % withinthe 2 phase area[26]. Therefore the more advanced SRK equation of state is applied. We havechosen to do so with the use of the SPECS program. Unfortunately the SPECS calculationscannot be incorporated in the EES model.In the EES model condensation are calculated from saturation pressure of the components andthe ideal gas equation. Results from the 2 different methods are compared.
SPECSThe input in SPECS is the composition, temperature and pressure of the gas and if possiblevalues for kij (see section 2.2). SPECS then returns the molar fractions of each component inevery present phase. For additional info on SPECS see appendix B.0.2.The gas composition after synthesis is found from the EES model, this means that the onlydifference between the results from SPECS and the model will be the condensation process.
EESThe build in EES function P SAT yields the saturation pressure of a given substance at a giventemperature. Assuming that this pressure is due to the amount of gas that will not condenseat the given temperature, the number of moles on gaseous form are found from the ideal gasequation.
ni,res.gas =pi,sat
pnafter (3.49)
The amount of the component that is condensed
ni,cond = ni,after − ni,res.gas (3.50)
An IF sentence is used in the programming to ensure that if the molar flow in the residual gas ishigher than the molar flow produced by the reactions, then the condensed molar flow is 0 rather
Page 34 of 76
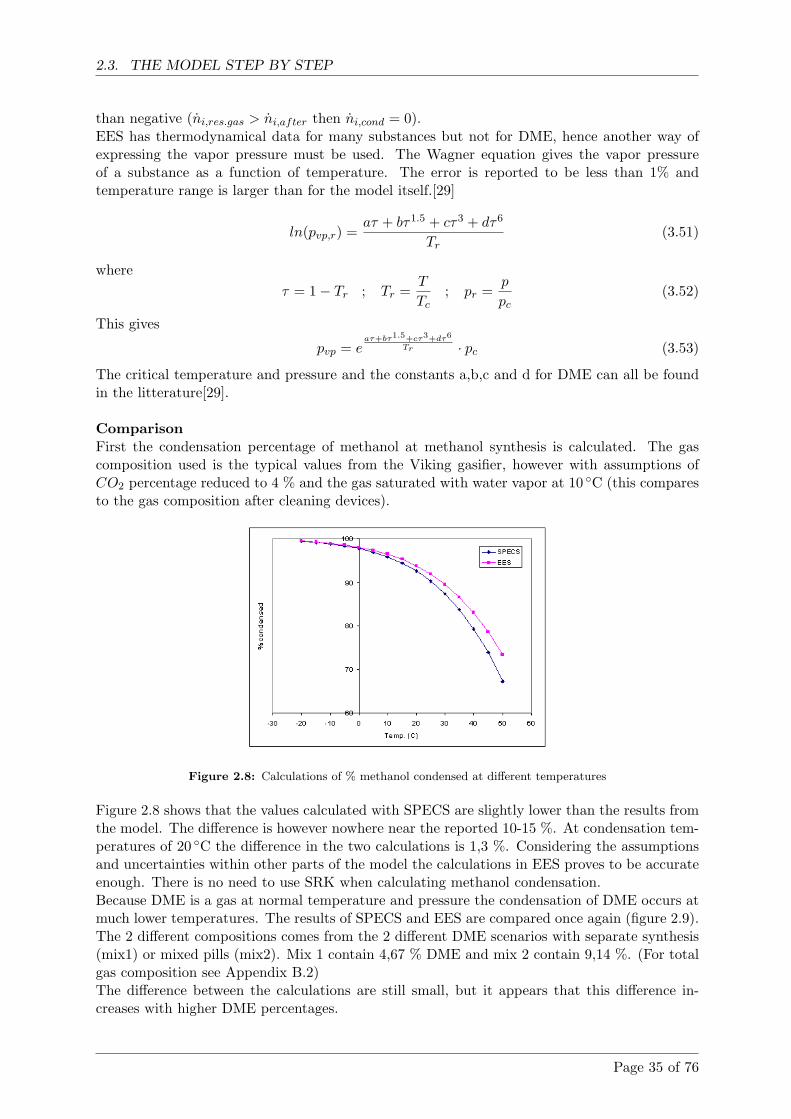
2.3. THE MODEL STEP BY STEP
than negative (ni,res.gas > ni,after then ni,cond = 0).EES has thermodynamical data for many substances but not for DME, hence another way ofexpressing the vapor pressure must be used. The Wagner equation gives the vapor pressureof a substance as a function of temperature. The error is reported to be less than 1% andtemperature range is larger than for the model itself.[29]
ln(pvp,r) =aτ + bτ1.5 + cτ3 + dτ6
Tr(3.51)
whereτ = 1− Tr ; Tr =
T
Tc; pr =
p
pc(3.52)
This gives
pvp = eaτ+bτ1.5+cτ3+dτ6
Tr · pc (3.53)
The critical temperature and pressure and the constants a,b,c and d for DME can all be foundin the litterature[29].
ComparisonFirst the condensation percentage of methanol at methanol synthesis is calculated. The gascomposition used is the typical values from the Viking gasifier, however with assumptions ofCO2 percentage reduced to 4 % and the gas saturated with water vapor at 10 ◦C (this comparesto the gas composition after cleaning devices).
Figure 2.8: Calculations of % methanol condensed at different temperatures
Figure 2.8 shows that the values calculated with SPECS are slightly lower than the results fromthe model. The difference is however nowhere near the reported 10-15 %. At condensation tem-peratures of 20 ◦C the difference in the two calculations is 1,3 %. Considering the assumptionsand uncertainties within other parts of the model the calculations in EES proves to be accurateenough. There is no need to use SRK when calculating methanol condensation.Because DME is a gas at normal temperature and pressure the condensation of DME occurs atmuch lower temperatures. The results of SPECS and EES are compared once again (figure 2.9).The 2 different compositions comes from the 2 different DME scenarios with separate synthesis(mix1) or mixed pills (mix2). Mix 1 contain 4,67 % DME and mix 2 contain 9,14 %. (For totalgas composition see Appendix B.2)The difference between the calculations are still small, but it appears that this difference in-creases with higher DME percentages.
Page 35 of 76
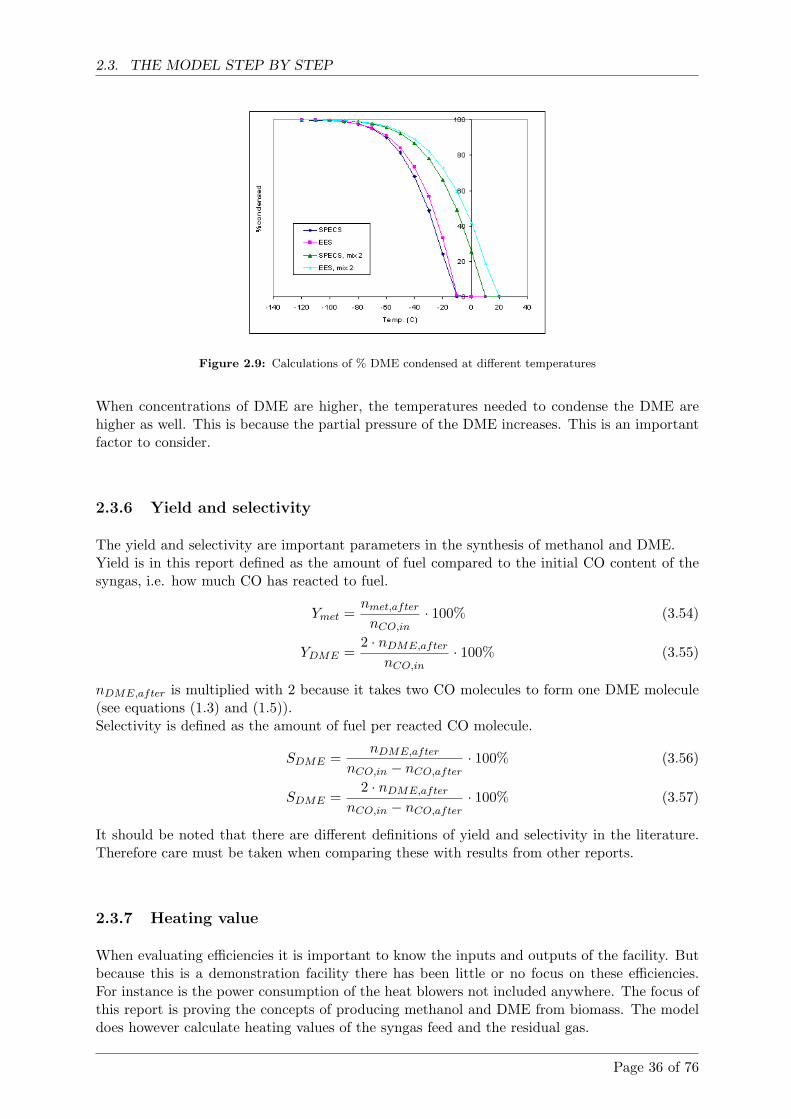
2.3. THE MODEL STEP BY STEP
Figure 2.9: Calculations of % DME condensed at different temperatures
When concentrations of DME are higher, the temperatures needed to condense the DME arehigher as well. This is because the partial pressure of the DME increases. This is an importantfactor to consider.
2.3.6 Yield and selectivity
The yield and selectivity are important parameters in the synthesis of methanol and DME.Yield is in this report defined as the amount of fuel compared to the initial CO content of thesyngas, i.e. how much CO has reacted to fuel.
Ymet =nmet,after
nCO,in· 100% (3.54)
YDME =2 · nDME,after
nCO,in· 100% (3.55)
nDME,after is multiplied with 2 because it takes two CO molecules to form one DME molecule(see equations (1.3) and (1.5)).Selectivity is defined as the amount of fuel per reacted CO molecule.
SDME =nDME,after
nCO,in − nCO,after· 100% (3.56)
SDME =2 · nDME,after
nCO,in − nCO,after· 100% (3.57)
It should be noted that there are different definitions of yield and selectivity in the literature.Therefore care must be taken when comparing these with results from other reports.
2.3.7 Heating value
When evaluating efficiencies it is important to know the inputs and outputs of the facility. Butbecause this is a demonstration facility there has been little or no focus on these efficiencies.For instance is the power consumption of the heat blowers not included anywhere. The focus ofthis report is proving the concepts of producing methanol and DME from biomass. The modeldoes however calculate heating values of the syngas feed and the residual gas.
Page 36 of 76
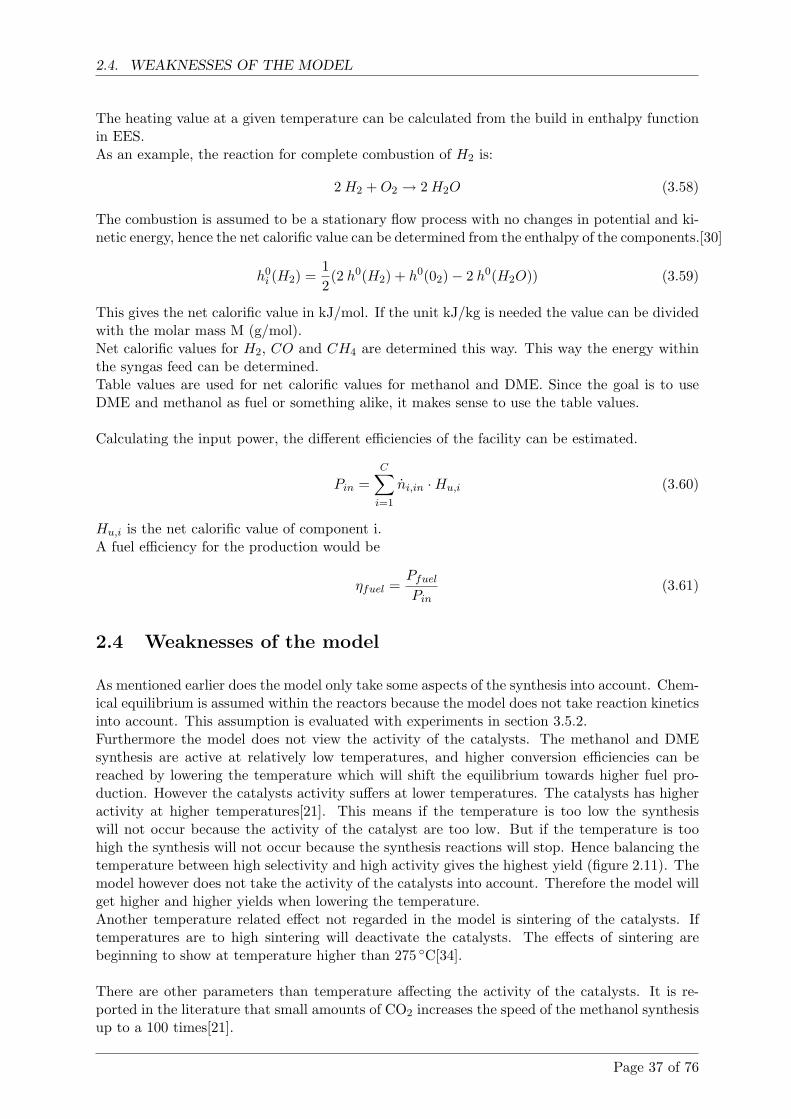
2.4. WEAKNESSES OF THE MODEL
The heating value at a given temperature can be calculated from the build in enthalpy functionin EES.As an example, the reaction for complete combustion of H2 is:
2 H2 + O2 → 2 H2O (3.58)
The combustion is assumed to be a stationary flow process with no changes in potential and ki-netic energy, hence the net calorific value can be determined from the enthalpy of the components.[30]
h0i (H2) =
12(2 h0(H2) + h0(02)− 2 h0(H2O)) (3.59)
This gives the net calorific value in kJ/mol. If the unit kJ/kg is needed the value can be dividedwith the molar mass M (g/mol).Net calorific values for H2, CO and CH4 are determined this way. This way the energy withinthe syngas feed can be determined.Table values are used for net calorific values for methanol and DME. Since the goal is to useDME and methanol as fuel or something alike, it makes sense to use the table values.
Calculating the input power, the different efficiencies of the facility can be estimated.
Pin =C∑
i=1
ni,in ·Hu,i (3.60)
Hu,i is the net calorific value of component i.A fuel efficiency for the production would be
ηfuel =Pfuel
Pin(3.61)
2.4 Weaknesses of the model
As mentioned earlier does the model only take some aspects of the synthesis into account. Chem-ical equilibrium is assumed within the reactors because the model does not take reaction kineticsinto account. This assumption is evaluated with experiments in section 3.5.2.Furthermore the model does not view the activity of the catalysts. The methanol and DMEsynthesis are active at relatively low temperatures, and higher conversion efficiencies can bereached by lowering the temperature which will shift the equilibrium towards higher fuel pro-duction. However the catalysts activity suffers at lower temperatures. The catalysts has higheractivity at higher temperatures[21]. This means if the temperature is too low the synthesiswill not occur because the activity of the catalyst are too low. But if the temperature is toohigh the synthesis will not occur because the synthesis reactions will stop. Hence balancing thetemperature between high selectivity and high activity gives the highest yield (figure 2.11). Themodel however does not take the activity of the catalysts into account. Therefore the model willget higher and higher yields when lowering the temperature.Another temperature related effect not regarded in the model is sintering of the catalysts. Iftemperatures are to high sintering will deactivate the catalysts. The effects of sintering arebeginning to show at temperature higher than 275 ◦C[34].
There are other parameters than temperature affecting the activity of the catalysts. It is re-ported in the literature that small amounts of CO2 increases the speed of the methanol synthesisup to a 100 times[21].
Page 37 of 76
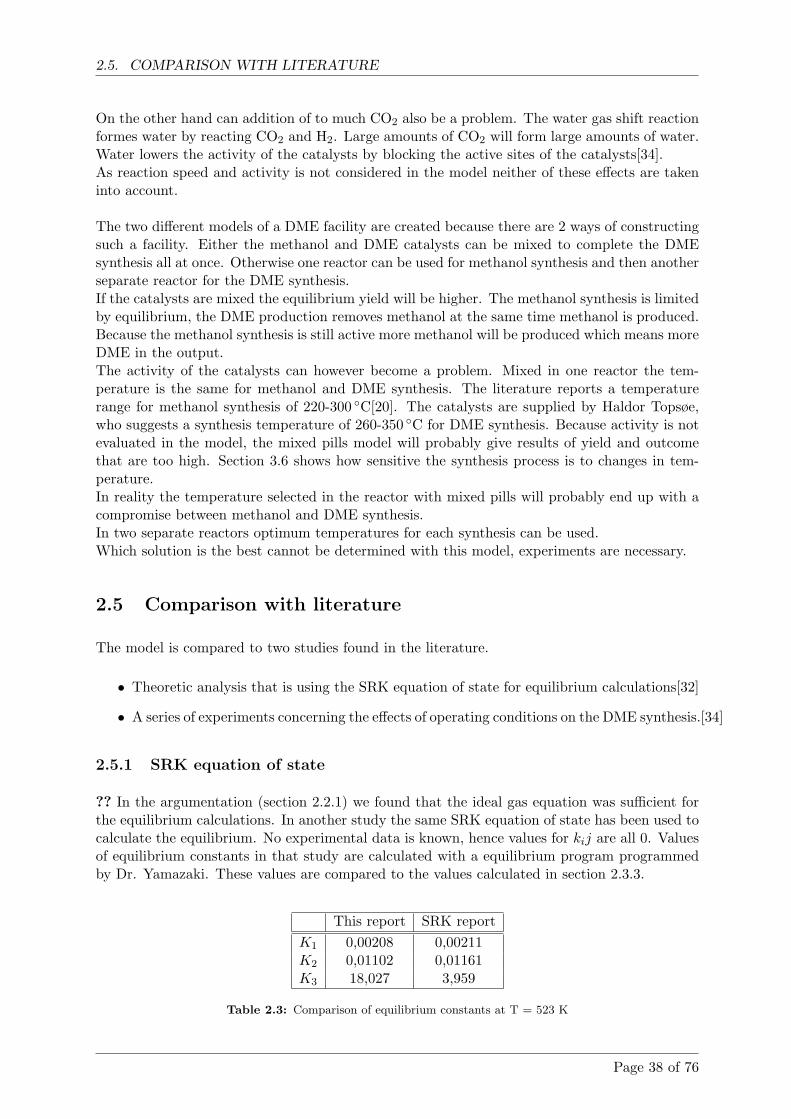
2.5. COMPARISON WITH LITERATURE
On the other hand can addition of to much CO2 also be a problem. The water gas shift reactionformes water by reacting CO2 and H2. Large amounts of CO2 will form large amounts of water.Water lowers the activity of the catalysts by blocking the active sites of the catalysts[34].As reaction speed and activity is not considered in the model neither of these effects are takeninto account.
The two different models of a DME facility are created because there are 2 ways of constructingsuch a facility. Either the methanol and DME catalysts can be mixed to complete the DMEsynthesis all at once. Otherwise one reactor can be used for methanol synthesis and then anotherseparate reactor for the DME synthesis.If the catalysts are mixed the equilibrium yield will be higher. The methanol synthesis is limitedby equilibrium, the DME production removes methanol at the same time methanol is produced.Because the methanol synthesis is still active more methanol will be produced which means moreDME in the output.The activity of the catalysts can however become a problem. Mixed in one reactor the tem-perature is the same for methanol and DME synthesis. The literature reports a temperaturerange for methanol synthesis of 220-300 ◦C[20]. The catalysts are supplied by Haldor Topsøe,who suggests a synthesis temperature of 260-350 ◦C for DME synthesis. Because activity is notevaluated in the model, the mixed pills model will probably give results of yield and outcomethat are too high. Section 3.6 shows how sensitive the synthesis process is to changes in tem-perature.In reality the temperature selected in the reactor with mixed pills will probably end up with acompromise between methanol and DME synthesis.In two separate reactors optimum temperatures for each synthesis can be used.Which solution is the best cannot be determined with this model, experiments are necessary.
2.5 Comparison with literature
The model is compared to two studies found in the literature.
• Theoretic analysis that is using the SRK equation of state for equilibrium calculations[32]
• A series of experiments concerning the effects of operating conditions on the DME synthesis.[34]
2.5.1 SRK equation of state
?? In the argumentation (section 2.2.1) we found that the ideal gas equation was sufficient forthe equilibrium calculations. In another study the same SRK equation of state has been used tocalculate the equilibrium. No experimental data is known, hence values for kij are all 0. Valuesof equilibrium constants in that study are calculated with a equilibrium program programmedby Dr. Yamazaki. These values are compared to the values calculated in section 2.3.3.
This report SRK reportK1 0,00208 0,00211K2 0,01102 0,01161K3 18,027 3,959
Table 2.3: Comparison of equilibrium constants at T = 523 K
Page 38 of 76
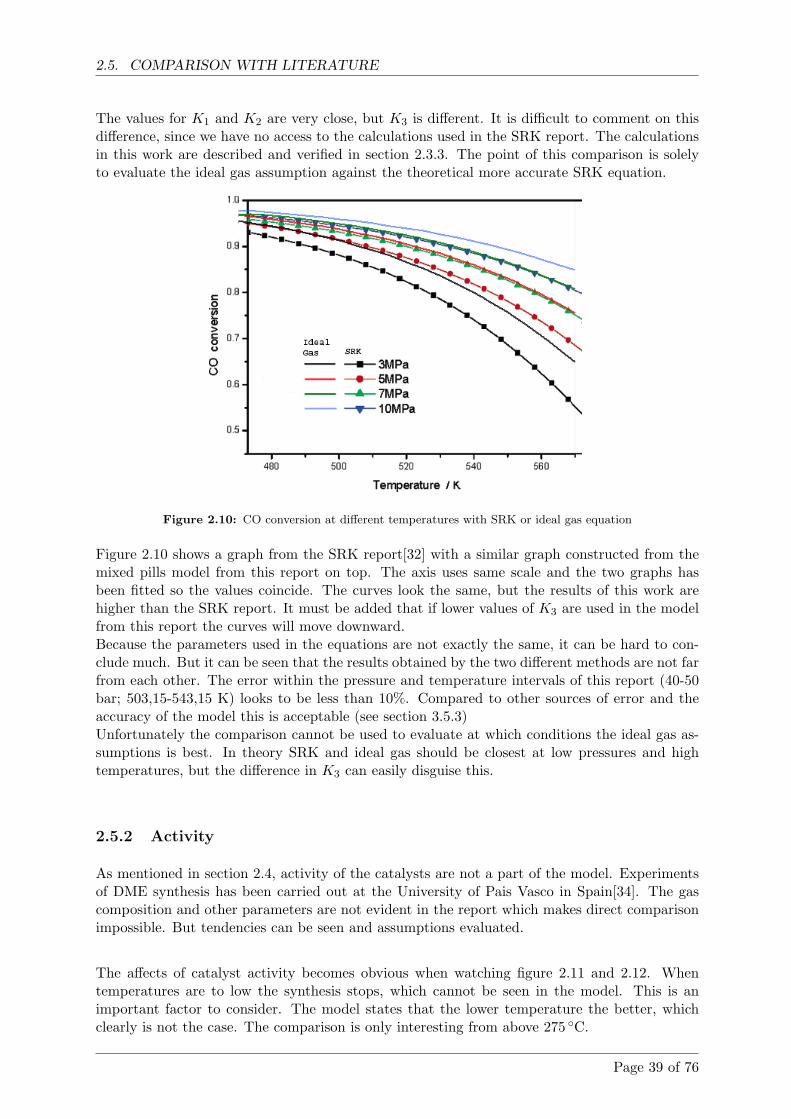
2.5. COMPARISON WITH LITERATURE
The values for K1 and K2 are very close, but K3 is different. It is difficult to comment on thisdifference, since we have no access to the calculations used in the SRK report. The calculationsin this work are described and verified in section 2.3.3. The point of this comparison is solelyto evaluate the ideal gas assumption against the theoretical more accurate SRK equation.
Figure 2.10: CO conversion at different temperatures with SRK or ideal gas equation
Figure 2.10 shows a graph from the SRK report[32] with a similar graph constructed from themixed pills model from this report on top. The axis uses same scale and the two graphs hasbeen fitted so the values coincide. The curves look the same, but the results of this work arehigher than the SRK report. It must be added that if lower values of K3 are used in the modelfrom this report the curves will move downward.Because the parameters used in the equations are not exactly the same, it can be hard to con-clude much. But it can be seen that the results obtained by the two different methods are not farfrom each other. The error within the pressure and temperature intervals of this report (40-50bar; 503,15-543,15 K) looks to be less than 10%. Compared to other sources of error and theaccuracy of the model this is acceptable (see section 3.5.3)Unfortunately the comparison cannot be used to evaluate at which conditions the ideal gas as-sumptions is best. In theory SRK and ideal gas should be closest at low pressures and hightemperatures, but the difference in K3 can easily disguise this.
2.5.2 Activity
As mentioned in section 2.4, activity of the catalysts are not a part of the model. Experimentsof DME synthesis has been carried out at the University of Pais Vasco in Spain[34]. The gascomposition and other parameters are not evident in the report which makes direct comparisonimpossible. But tendencies can be seen and assumptions evaluated.
The affects of catalyst activity becomes obvious when watching figure 2.11 and 2.12. Whentemperatures are to low the synthesis stops, which cannot be seen in the model. This is animportant factor to consider. The model states that the lower temperature the better, whichclearly is not the case. The comparison is only interesting from above 275 ◦C.
Page 39 of 76
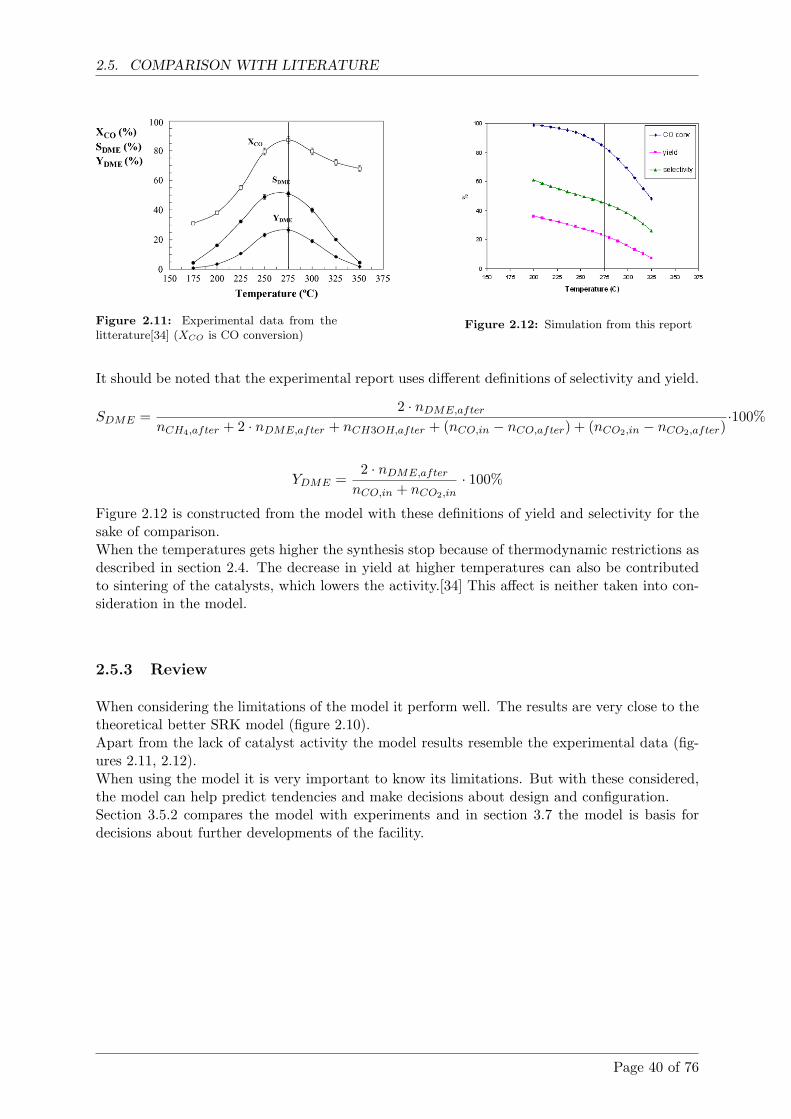
2.5. COMPARISON WITH LITERATURE
Figure 2.11: Experimental data from thelitterature[34] (XCO is CO conversion)
Figure 2.12: Simulation from this report
It should be noted that the experimental report uses different definitions of selectivity and yield.
SDME =2 · nDME,after
nCH4,after + 2 · nDME,after + nCH3OH,after + (nCO,in − nCO,after) + (nCO2,in − nCO2,after)·100%
YDME =2 · nDME,after
nCO,in + nCO2,in· 100%
Figure 2.12 is constructed from the model with these definitions of yield and selectivity for thesake of comparison.When the temperatures gets higher the synthesis stop because of thermodynamic restrictions asdescribed in section 2.4. The decrease in yield at higher temperatures can also be contributedto sintering of the catalysts, which lowers the activity.[34] This affect is neither taken into con-sideration in the model.
2.5.3 Review
When considering the limitations of the model it perform well. The results are very close to thetheoretical better SRK model (figure 2.10).Apart from the lack of catalyst activity the model results resemble the experimental data (fig-ures 2.11, 2.12).When using the model it is very important to know its limitations. But with these considered,the model can help predict tendencies and make decisions about design and configuration.Section 3.5.2 compares the model with experiments and in section 3.7 the model is basis fordecisions about further developments of the facility.
Page 40 of 76
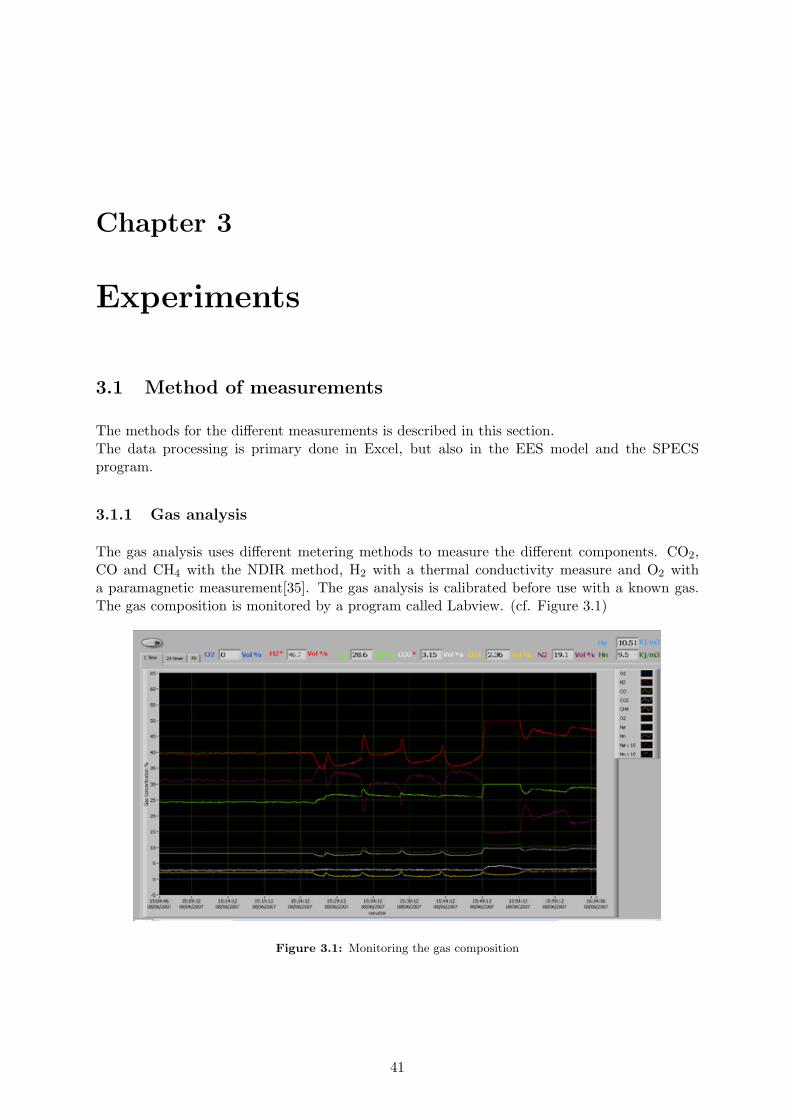
Chapter 3
Experiments
3.1 Method of measurements
The methods for the different measurements is described in this section.The data processing is primary done in Excel, but also in the EES model and the SPECSprogram.
3.1.1 Gas analysis
The gas analysis uses different metering methods to measure the different components. CO2,CO and CH4 with the NDIR method, H2 with a thermal conductivity measure and O2 witha paramagnetic measurement[35]. The gas analysis is calibrated before use with a known gas.The gas composition is monitored by a program called Labview. (cf. Figure 3.1)
Figure 3.1: Monitoring the gas composition
41
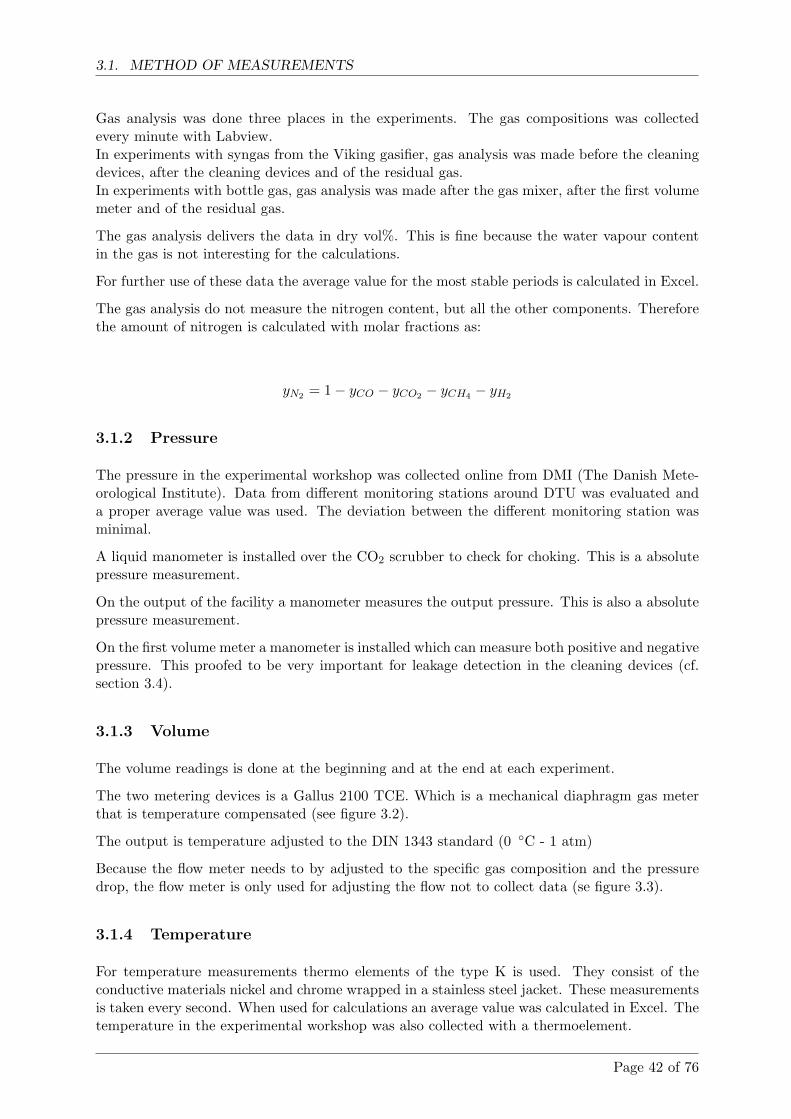
3.1. METHOD OF MEASUREMENTS
Gas analysis was done three places in the experiments. The gas compositions was collectedevery minute with Labview.In experiments with syngas from the Viking gasifier, gas analysis was made before the cleaningdevices, after the cleaning devices and of the residual gas.In experiments with bottle gas, gas analysis was made after the gas mixer, after the first volumemeter and of the residual gas.
The gas analysis delivers the data in dry vol%. This is fine because the water vapour contentin the gas is not interesting for the calculations.
For further use of these data the average value for the most stable periods is calculated in Excel.
The gas analysis do not measure the nitrogen content, but all the other components. Thereforethe amount of nitrogen is calculated with molar fractions as:
yN2 = 1− yCO − yCO2 − yCH4 − yH2
3.1.2 Pressure
The pressure in the experimental workshop was collected online from DMI (The Danish Mete-orological Institute). Data from different monitoring stations around DTU was evaluated anda proper average value was used. The deviation between the different monitoring station wasminimal.
A liquid manometer is installed over the CO2 scrubber to check for choking. This is a absolutepressure measurement.
On the output of the facility a manometer measures the output pressure. This is also a absolutepressure measurement.
On the first volume meter a manometer is installed which can measure both positive and negativepressure. This proofed to be very important for leakage detection in the cleaning devices (cf.section 3.4).
3.1.3 Volume
The volume readings is done at the beginning and at the end at each experiment.
The two metering devices is a Gallus 2100 TCE. Which is a mechanical diaphragm gas meterthat is temperature compensated (see figure 3.2).
The output is temperature adjusted to the DIN 1343 standard (0 ◦C - 1 atm)
Because the flow meter needs to by adjusted to the specific gas composition and the pressuredrop, the flow meter is only used for adjusting the flow not to collect data (se figure 3.3).
3.1.4 Temperature
For temperature measurements thermo elements of the type K is used. They consist of theconductive materials nickel and chrome wrapped in a stainless steel jacket. These measurementsis taken every second. When used for calculations an average value was calculated in Excel. Thetemperature in the experimental workshop was also collected with a thermoelement.
Page 42 of 76
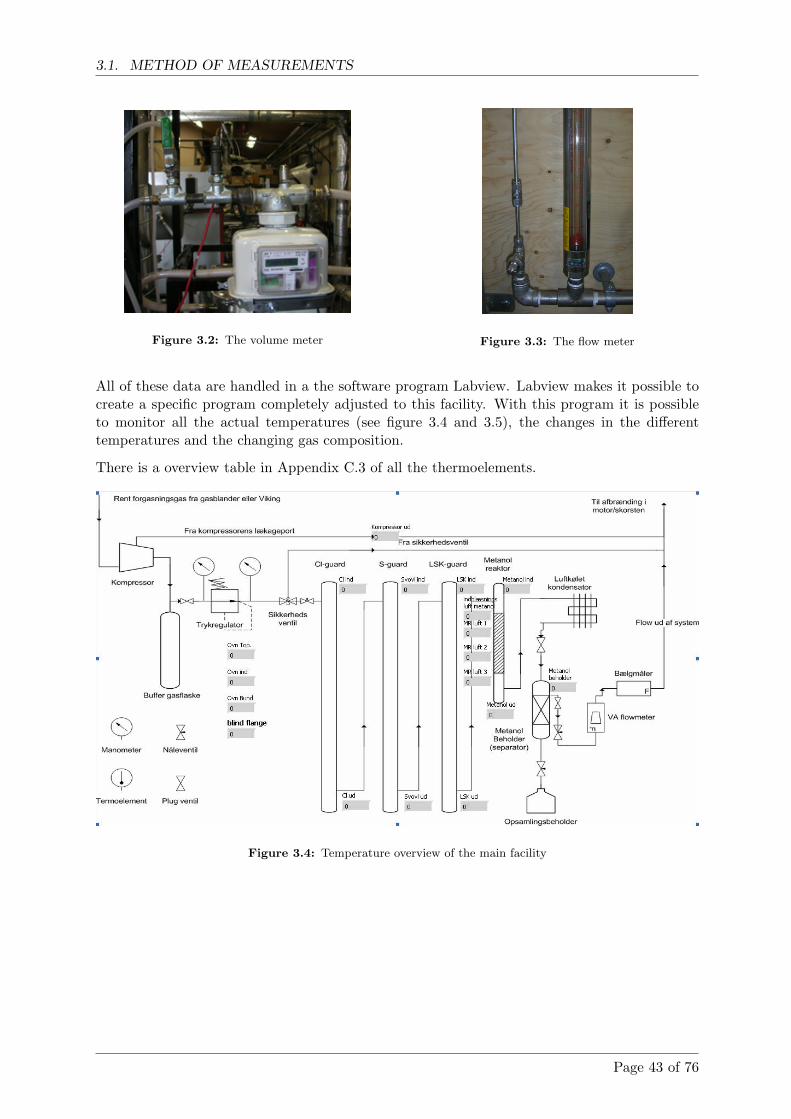
3.1. METHOD OF MEASUREMENTS
Figure 3.2: The volume meter Figure 3.3: The flow meter
All of these data are handled in a the software program Labview. Labview makes it possible tocreate a specific program completely adjusted to this facility. With this program it is possibleto monitor all the actual temperatures (see figure 3.4 and 3.5), the changes in the differenttemperatures and the changing gas composition.
There is a overview table in Appendix C.3 of all the thermoelements.
Figure 3.4: Temperature overview of the main facility
Page 43 of 76
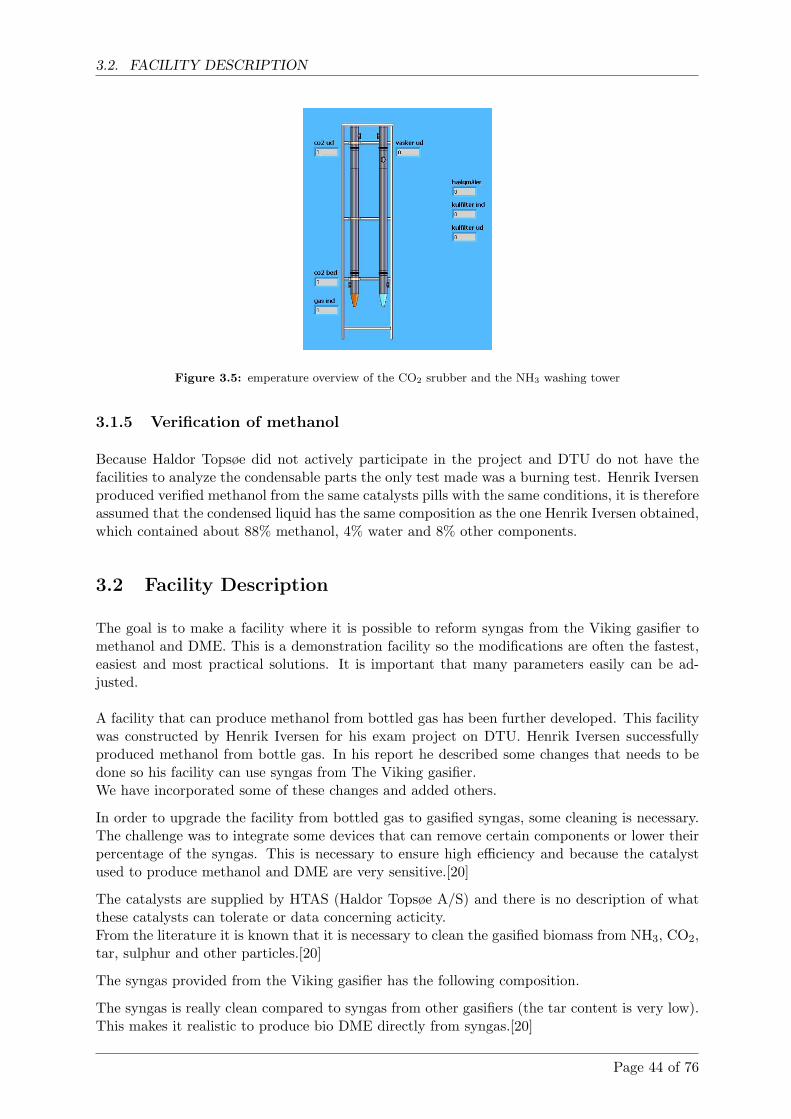
3.2. FACILITY DESCRIPTION
Figure 3.5: emperature overview of the CO2 srubber and the NH3 washing tower
3.1.5 Verification of methanol
Because Haldor Topsøe did not actively participate in the project and DTU do not have thefacilities to analyze the condensable parts the only test made was a burning test. Henrik Iversenproduced verified methanol from the same catalysts pills with the same conditions, it is thereforeassumed that the condensed liquid has the same composition as the one Henrik Iversen obtained,which contained about 88% methanol, 4% water and 8% other components.
3.2 Facility Description
The goal is to make a facility where it is possible to reform syngas from the Viking gasifier tomethanol and DME. This is a demonstration facility so the modifications are often the fastest,easiest and most practical solutions. It is important that many parameters easily can be ad-justed.
A facility that can produce methanol from bottled gas has been further developed. This facilitywas constructed by Henrik Iversen for his exam project on DTU. Henrik Iversen successfullyproduced methanol from bottle gas. In his report he described some changes that needs to bedone so his facility can use syngas from The Viking gasifier.We have incorporated some of these changes and added others.
In order to upgrade the facility from bottled gas to gasified syngas, some cleaning is necessary.The challenge was to integrate some devices that can remove certain components or lower theirpercentage of the syngas. This is necessary to ensure high efficiency and because the catalystused to produce methanol and DME are very sensitive.[20]
The catalysts are supplied by HTAS (Haldor Topsøe A/S) and there is no description of whatthese catalysts can tolerate or data concerning acticity.From the literature it is known that it is necessary to clean the gasified biomass from NH3, CO2,tar, sulphur and other particles.[20]
The syngas provided from the Viking gasifier has the following composition.
The syngas is really clean compared to syngas from other gasifiers (the tar content is very low).This makes it realistic to produce bio DME directly from syngas.[20]
Page 44 of 76
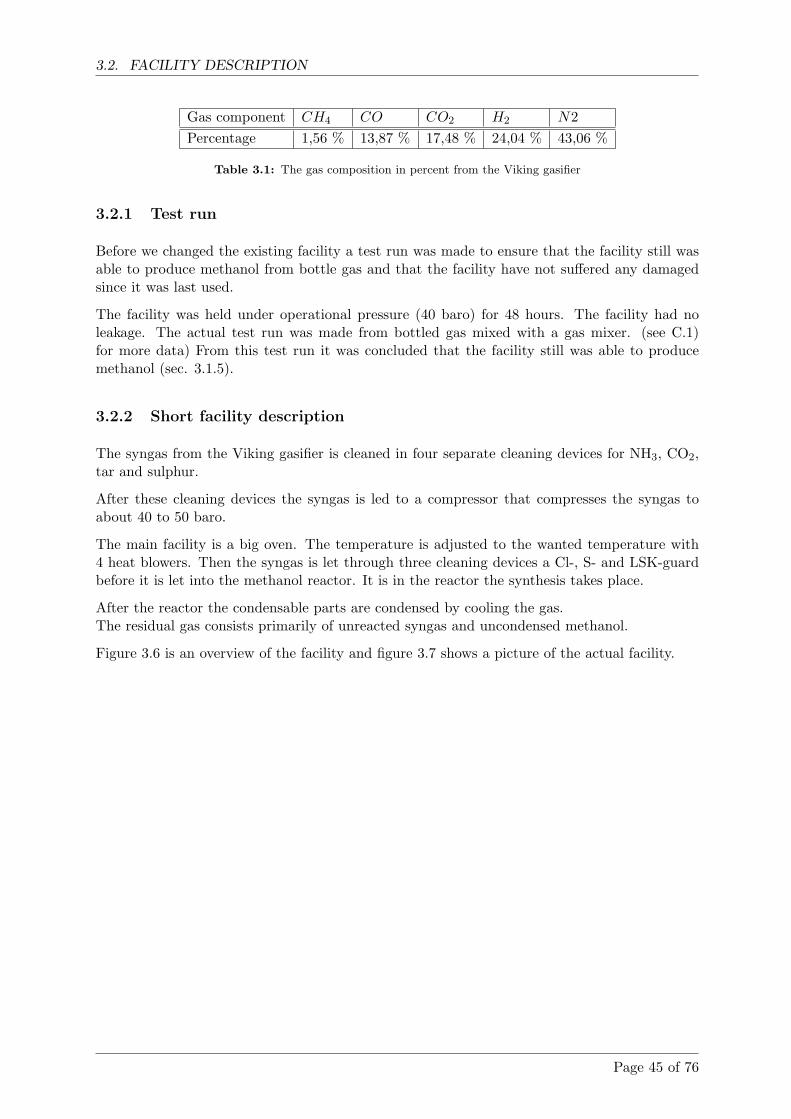
3.2. FACILITY DESCRIPTION
Gas component CH4 CO CO2 H2 N2Percentage 1,56 % 13,87 % 17,48 % 24,04 % 43,06 %
Table 3.1: The gas composition in percent from the Viking gasifier
3.2.1 Test run
Before we changed the existing facility a test run was made to ensure that the facility still wasable to produce methanol from bottle gas and that the facility have not suffered any damagedsince it was last used.
The facility was held under operational pressure (40 baro) for 48 hours. The facility had noleakage. The actual test run was made from bottled gas mixed with a gas mixer. (see C.1)for more data) From this test run it was concluded that the facility still was able to producemethanol (sec. 3.1.5).
3.2.2 Short facility description
The syngas from the Viking gasifier is cleaned in four separate cleaning devices for NH3, CO2,tar and sulphur.
After these cleaning devices the syngas is led to a compressor that compresses the syngas toabout 40 to 50 baro.
The main facility is a big oven. The temperature is adjusted to the wanted temperature with4 heat blowers. Then the syngas is let through three cleaning devices a Cl-, S- and LSK-guardbefore it is let into the methanol reactor. It is in the reactor the synthesis takes place.
After the reactor the condensable parts are condensed by cooling the gas.The residual gas consists primarily of unreacted syngas and uncondensed methanol.
Figure 3.6 is an overview of the facility and figure 3.7 shows a picture of the actual facility.
Page 45 of 76
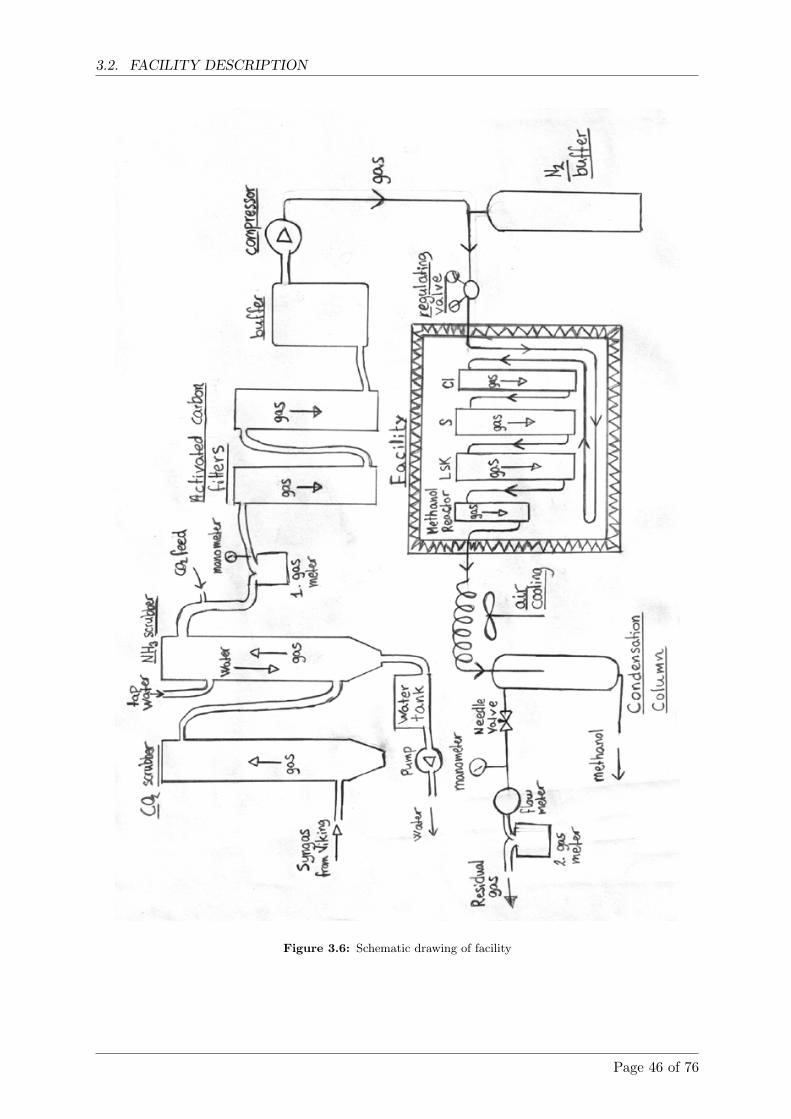
3.2. FACILITY DESCRIPTION
Figure 3.6: Schematic drawing of facility
Page 46 of 76
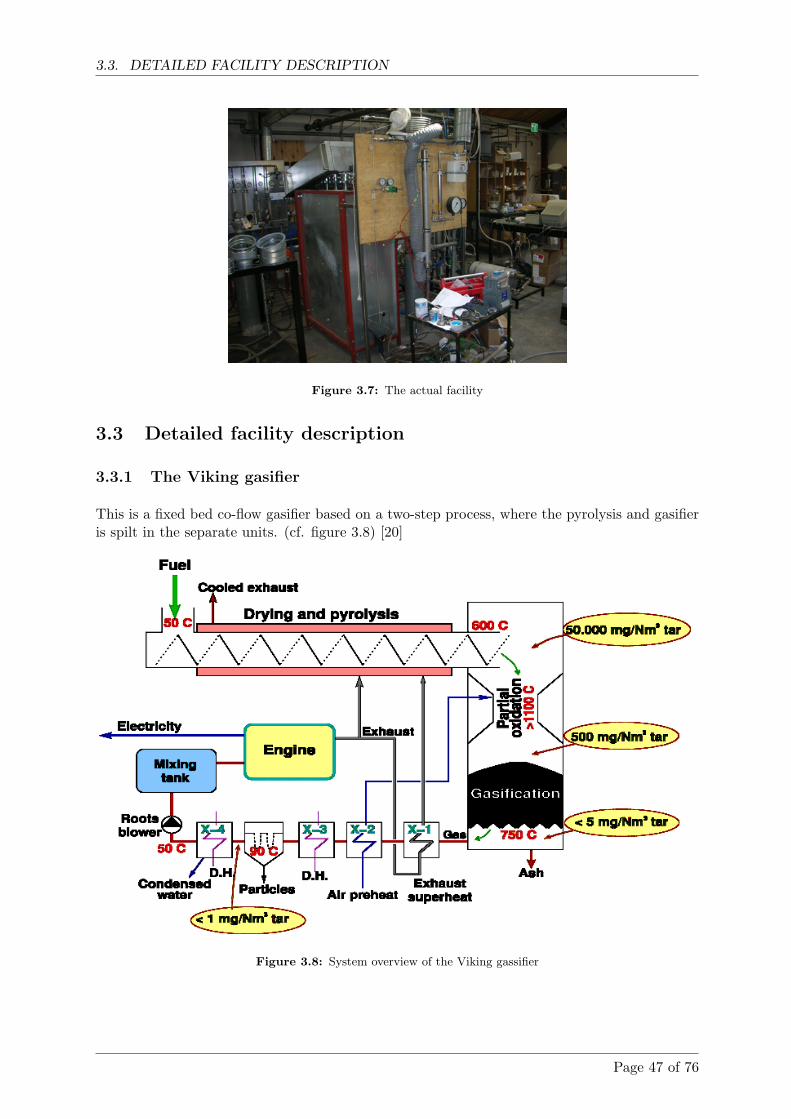
3.3. DETAILED FACILITY DESCRIPTION
Figure 3.7: The actual facility
3.3 Detailed facility description
3.3.1 The Viking gasifier
This is a fixed bed co-flow gasifier based on a two-step process, where the pyrolysis and gasifieris spilt in the separate units. (cf. figure 3.8) [20]
Figure 3.8: System overview of the Viking gassifier
Page 47 of 76
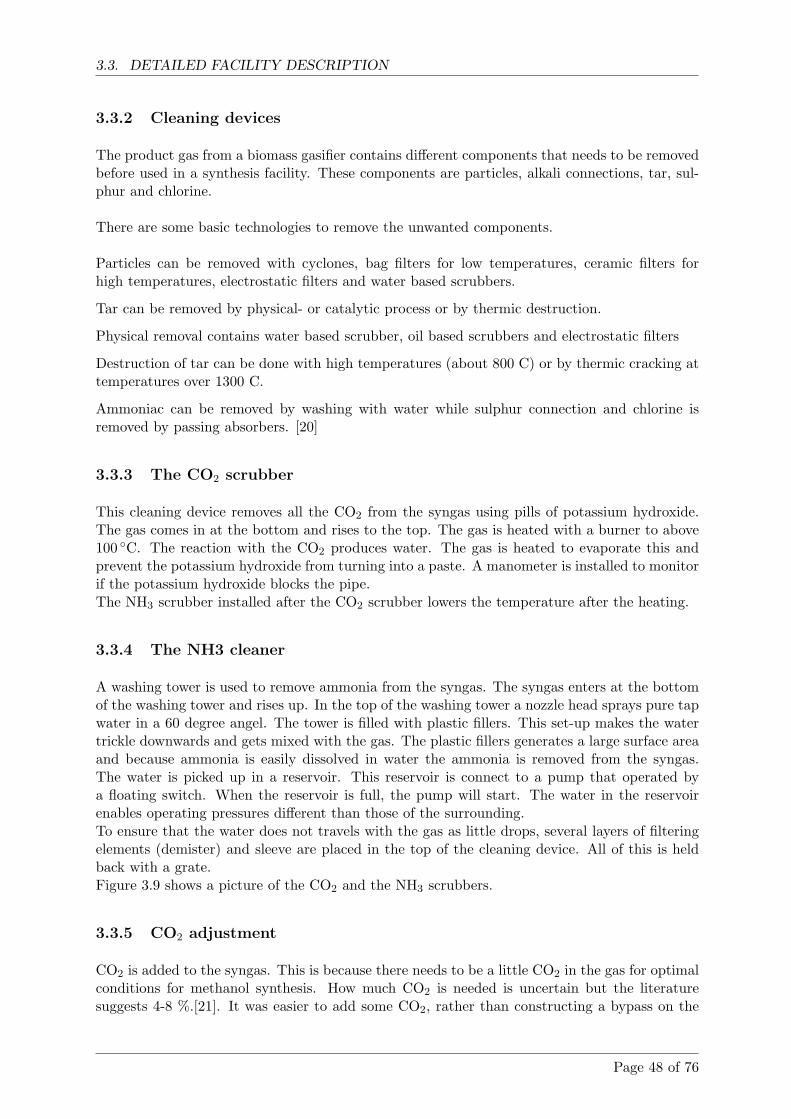
3.3. DETAILED FACILITY DESCRIPTION
3.3.2 Cleaning devices
The product gas from a biomass gasifier contains different components that needs to be removedbefore used in a synthesis facility. These components are particles, alkali connections, tar, sul-phur and chlorine.
There are some basic technologies to remove the unwanted components.
Particles can be removed with cyclones, bag filters for low temperatures, ceramic filters forhigh temperatures, electrostatic filters and water based scrubbers.
Tar can be removed by physical- or catalytic process or by thermic destruction.
Physical removal contains water based scrubber, oil based scrubbers and electrostatic filters
Destruction of tar can be done with high temperatures (about 800 C) or by thermic cracking attemperatures over 1300 C.
Ammoniac can be removed by washing with water while sulphur connection and chlorine isremoved by passing absorbers. [20]
3.3.3 The CO2 scrubber
This cleaning device removes all the CO2 from the syngas using pills of potassium hydroxide.The gas comes in at the bottom and rises to the top. The gas is heated with a burner to above100 ◦C. The reaction with the CO2 produces water. The gas is heated to evaporate this andprevent the potassium hydroxide from turning into a paste. A manometer is installed to monitorif the potassium hydroxide blocks the pipe.The NH3 scrubber installed after the CO2 scrubber lowers the temperature after the heating.
3.3.4 The NH3 cleaner
A washing tower is used to remove ammonia from the syngas. The syngas enters at the bottomof the washing tower and rises up. In the top of the washing tower a nozzle head sprays pure tapwater in a 60 degree angel. The tower is filled with plastic fillers. This set-up makes the watertrickle downwards and gets mixed with the gas. The plastic fillers generates a large surface areaand because ammonia is easily dissolved in water the ammonia is removed from the syngas.The water is picked up in a reservoir. This reservoir is connect to a pump that operated bya floating switch. When the reservoir is full, the pump will start. The water in the reservoirenables operating pressures different than those of the surrounding.To ensure that the water does not travels with the gas as little drops, several layers of filteringelements (demister) and sleeve are placed in the top of the cleaning device. All of this is heldback with a grate.Figure 3.9 shows a picture of the CO2 and the NH3 scrubbers.
3.3.5 CO2 adjustment
CO2 is added to the syngas. This is because there needs to be a little CO2 in the gas for optimalconditions for methanol synthesis. How much CO2 is needed is uncertain but the literaturesuggests 4-8 %.[21]. It was easier to add some CO2, rather than constructing a bypass on the
Page 48 of 76
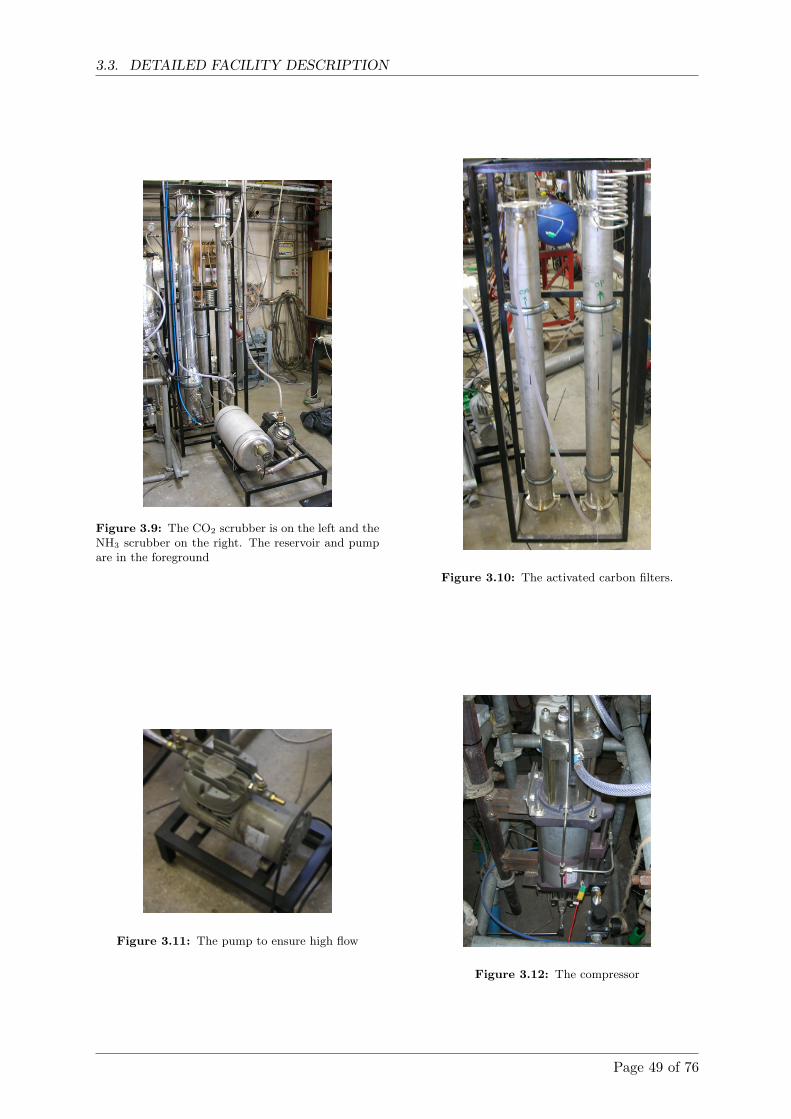
3.3. DETAILED FACILITY DESCRIPTION
Figure 3.9: The CO2 scrubber is on the left and theNH3 scrubber on the right. The reservoir and pumpare in the foreground
Figure 3.10: The activated carbon filters.
Figure 3.11: The pump to ensure high flow
Figure 3.12: The compressor
Page 49 of 76
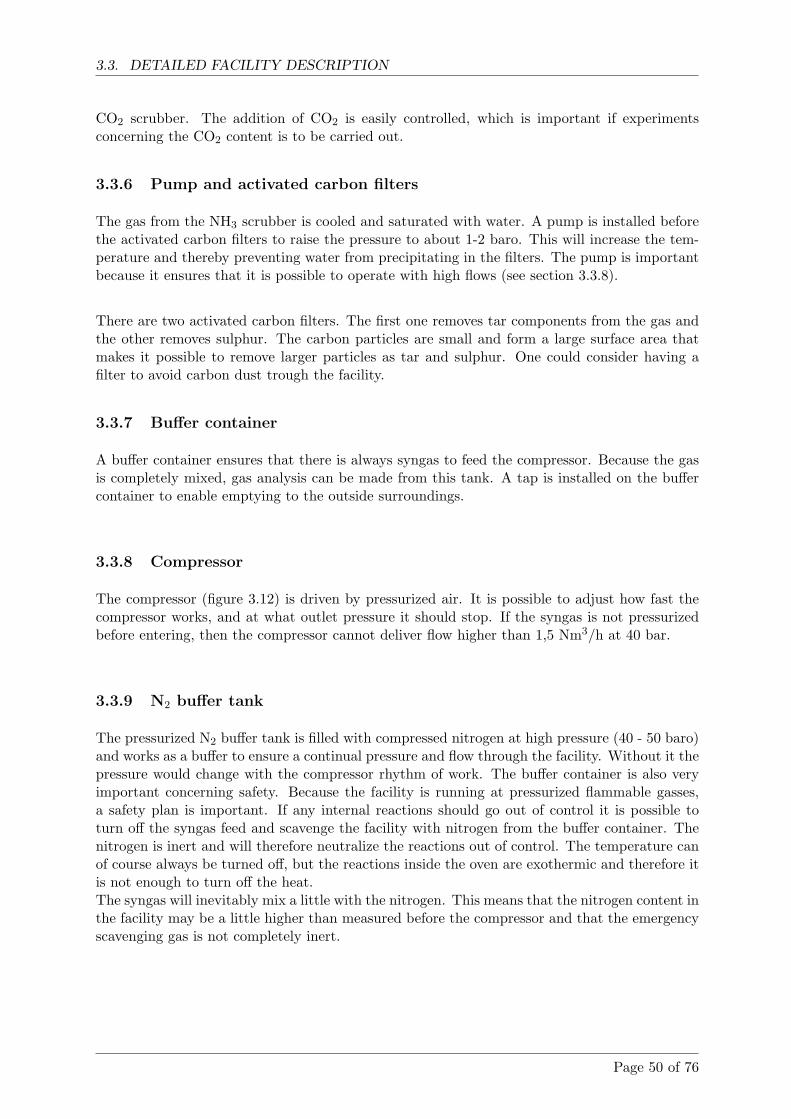
3.3. DETAILED FACILITY DESCRIPTION
CO2 scrubber. The addition of CO2 is easily controlled, which is important if experimentsconcerning the CO2 content is to be carried out.
3.3.6 Pump and activated carbon filters
The gas from the NH3 scrubber is cooled and saturated with water. A pump is installed beforethe activated carbon filters to raise the pressure to about 1-2 baro. This will increase the tem-perature and thereby preventing water from precipitating in the filters. The pump is importantbecause it ensures that it is possible to operate with high flows (see section 3.3.8).
There are two activated carbon filters. The first one removes tar components from the gas andthe other removes sulphur. The carbon particles are small and form a large surface area thatmakes it possible to remove larger particles as tar and sulphur. One could consider having afilter to avoid carbon dust trough the facility.
3.3.7 Buffer container
A buffer container ensures that there is always syngas to feed the compressor. Because the gasis completely mixed, gas analysis can be made from this tank. A tap is installed on the buffercontainer to enable emptying to the outside surroundings.
3.3.8 Compressor
The compressor (figure 3.12) is driven by pressurized air. It is possible to adjust how fast thecompressor works, and at what outlet pressure it should stop. If the syngas is not pressurizedbefore entering, then the compressor cannot deliver flow higher than 1,5 Nm3/h at 40 bar.
3.3.9 N2 buffer tank
The pressurized N2 buffer tank is filled with compressed nitrogen at high pressure (40 - 50 baro)and works as a buffer to ensure a continual pressure and flow through the facility. Without it thepressure would change with the compressor rhythm of work. The buffer container is also veryimportant concerning safety. Because the facility is running at pressurized flammable gasses,a safety plan is important. If any internal reactions should go out of control it is possible toturn off the syngas feed and scavenge the facility with nitrogen from the buffer container. Thenitrogen is inert and will therefore neutralize the reactions out of control. The temperature canof course always be turned off, but the reactions inside the oven are exothermic and therefore itis not enough to turn off the heat.The syngas will inevitably mix a little with the nitrogen. This means that the nitrogen content inthe facility may be a little higher than measured before the compressor and that the emergencyscavenging gas is not completely inert.
Page 50 of 76
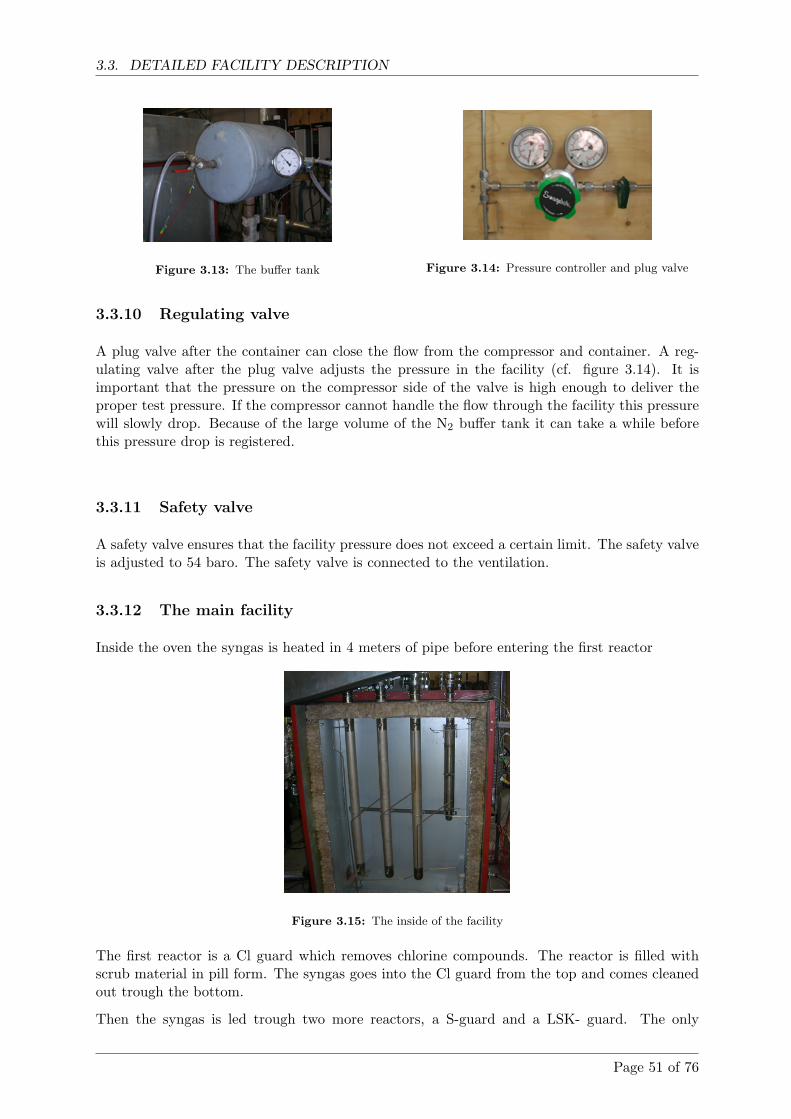
3.3. DETAILED FACILITY DESCRIPTION
Figure 3.13: The buffer tank Figure 3.14: Pressure controller and plug valve
3.3.10 Regulating valve
A plug valve after the container can close the flow from the compressor and container. A reg-ulating valve after the plug valve adjusts the pressure in the facility (cf. figure 3.14). It isimportant that the pressure on the compressor side of the valve is high enough to deliver theproper test pressure. If the compressor cannot handle the flow through the facility this pressurewill slowly drop. Because of the large volume of the N2 buffer tank it can take a while beforethis pressure drop is registered.
3.3.11 Safety valve
A safety valve ensures that the facility pressure does not exceed a certain limit. The safety valveis adjusted to 54 baro. The safety valve is connected to the ventilation.
3.3.12 The main facility
Inside the oven the syngas is heated in 4 meters of pipe before entering the first reactor
Figure 3.15: The inside of the facility
The first reactor is a Cl guard which removes chlorine compounds. The reactor is filled withscrub material in pill form. The syngas goes into the Cl guard from the top and comes cleanedout trough the bottom.
Then the syngas is led trough two more reactors, a S-guard and a LSK- guard. The only
Page 51 of 76
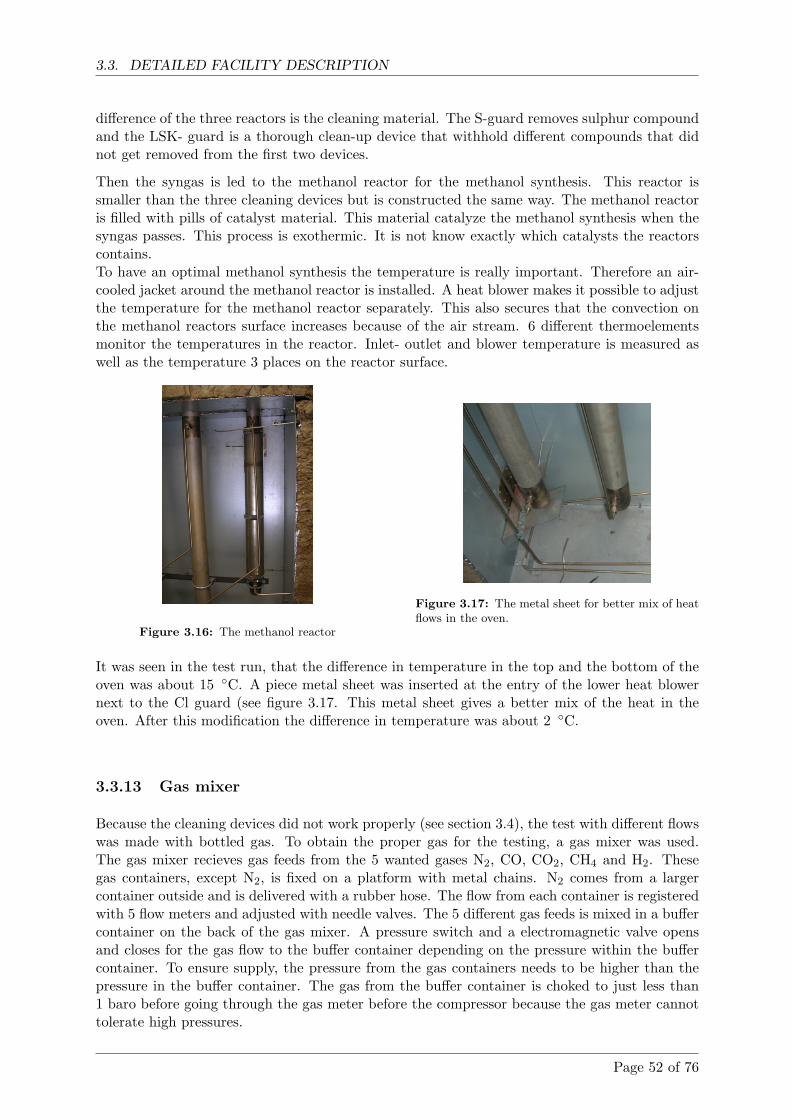
3.3. DETAILED FACILITY DESCRIPTION
difference of the three reactors is the cleaning material. The S-guard removes sulphur compoundand the LSK- guard is a thorough clean-up device that withhold different compounds that didnot get removed from the first two devices.
Then the syngas is led to the methanol reactor for the methanol synthesis. This reactor issmaller than the three cleaning devices but is constructed the same way. The methanol reactoris filled with pills of catalyst material. This material catalyze the methanol synthesis when thesyngas passes. This process is exothermic. It is not know exactly which catalysts the reactorscontains.To have an optimal methanol synthesis the temperature is really important. Therefore an air-cooled jacket around the methanol reactor is installed. A heat blower makes it possible to adjustthe temperature for the methanol reactor separately. This also secures that the convection onthe methanol reactors surface increases because of the air stream. 6 different thermoelementsmonitor the temperatures in the reactor. Inlet- outlet and blower temperature is measured aswell as the temperature 3 places on the reactor surface.
Figure 3.16: The methanol reactor
Figure 3.17: The metal sheet for better mix of heatflows in the oven.
It was seen in the test run, that the difference in temperature in the top and the bottom of theoven was about 15 ◦C. A piece metal sheet was inserted at the entry of the lower heat blowernext to the Cl guard (see figure 3.17. This metal sheet gives a better mix of the heat in theoven. After this modification the difference in temperature was about 2 ◦C.
3.3.13 Gas mixer
Because the cleaning devices did not work properly (see section 3.4), the test with different flowswas made with bottled gas. To obtain the proper gas for the testing, a gas mixer was used.The gas mixer recieves gas feeds from the 5 wanted gases N2, CO, CO2, CH4 and H2. Thesegas containers, except N2, is fixed on a platform with metal chains. N2 comes from a largercontainer outside and is delivered with a rubber hose. The flow from each container is registeredwith 5 flow meters and adjusted with needle valves. The 5 different gas feeds is mixed in a buffercontainer on the back of the gas mixer. A pressure switch and a electromagnetic valve opensand closes for the gas flow to the buffer container depending on the pressure within the buffercontainer. To ensure supply, the pressure from the gas containers needs to be higher than thepressure in the buffer container. The gas from the buffer container is choked to just less than1 baro before going through the gas meter before the compressor because the gas meter cannottolerate high pressures.
Page 52 of 76
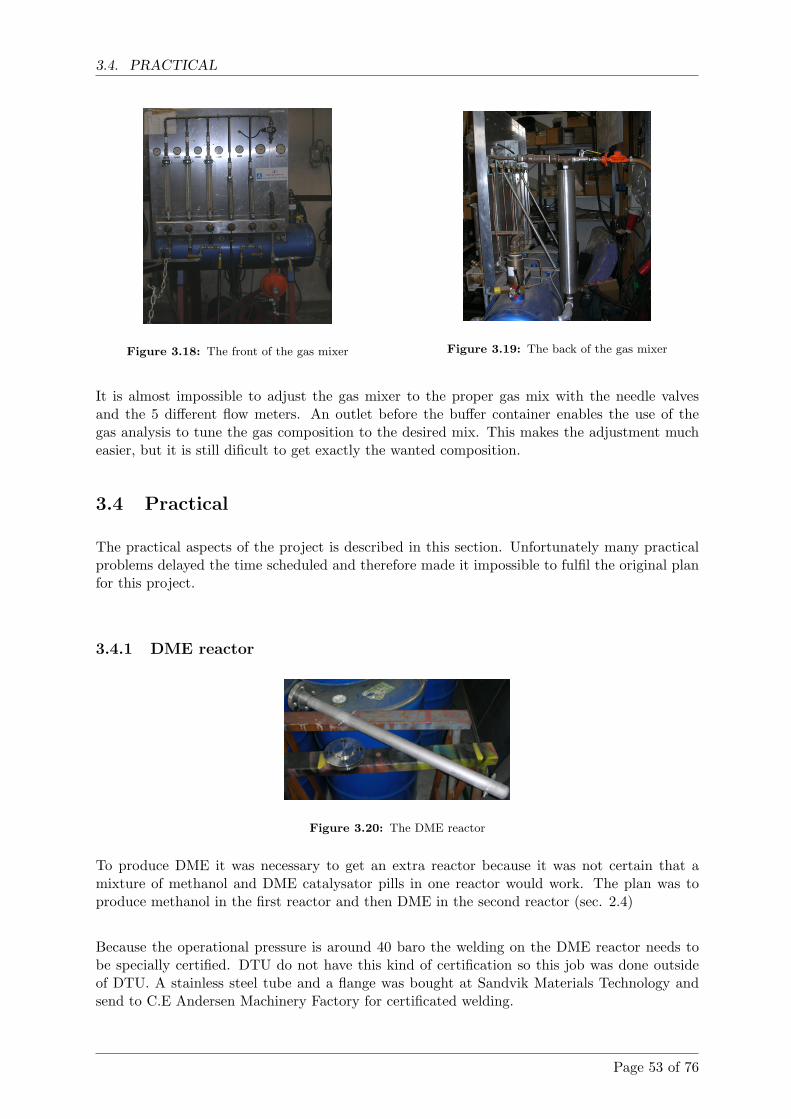
3.4. PRACTICAL
Figure 3.18: The front of the gas mixer Figure 3.19: The back of the gas mixer
It is almost impossible to adjust the gas mixer to the proper gas mix with the needle valvesand the 5 different flow meters. An outlet before the buffer container enables the use of thegas analysis to tune the gas composition to the desired mix. This makes the adjustment mucheasier, but it is still dificult to get exactly the wanted composition.
3.4 Practical
The practical aspects of the project is described in this section. Unfortunately many practicalproblems delayed the time scheduled and therefore made it impossible to fulfil the original planfor this project.
3.4.1 DME reactor
Figure 3.20: The DME reactor
To produce DME it was necessary to get an extra reactor because it was not certain that amixture of methanol and DME catalysator pills in one reactor would work. The plan was toproduce methanol in the first reactor and then DME in the second reactor (sec. 2.4)
Because the operational pressure is around 40 baro the welding on the DME reactor needs tobe specially certified. DTU do not have this kind of certification so this job was done outsideof DTU. A stainless steel tube and a flange was bought at Sandvik Materials Technology andsend to C.E Andersen Machinery Factory for certificated welding.
Page 53 of 76
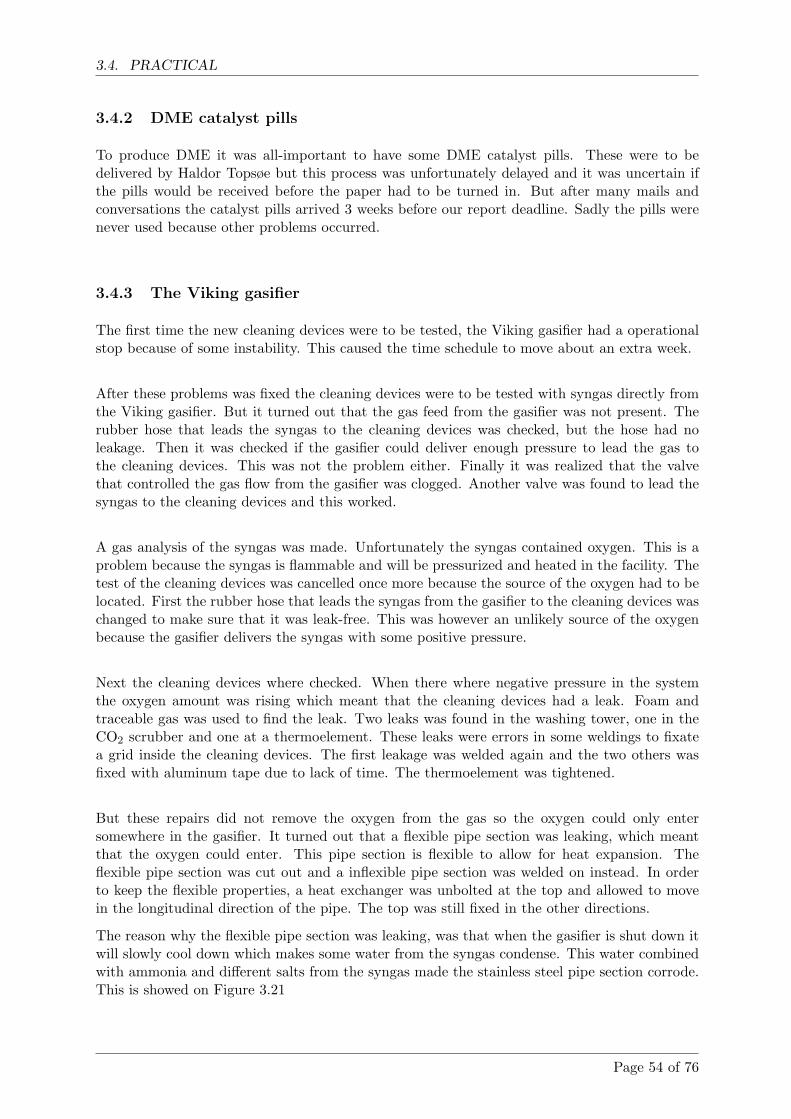
3.4. PRACTICAL
3.4.2 DME catalyst pills
To produce DME it was all-important to have some DME catalyst pills. These were to bedelivered by Haldor Topsøe but this process was unfortunately delayed and it was uncertain ifthe pills would be received before the paper had to be turned in. But after many mails andconversations the catalyst pills arrived 3 weeks before our report deadline. Sadly the pills werenever used because other problems occurred.
3.4.3 The Viking gasifier
The first time the new cleaning devices were to be tested, the Viking gasifier had a operationalstop because of some instability. This caused the time schedule to move about an extra week.
After these problems was fixed the cleaning devices were to be tested with syngas directly fromthe Viking gasifier. But it turned out that the gas feed from the gasifier was not present. Therubber hose that leads the syngas to the cleaning devices was checked, but the hose had noleakage. Then it was checked if the gasifier could deliver enough pressure to lead the gas tothe cleaning devices. This was not the problem either. Finally it was realized that the valvethat controlled the gas flow from the gasifier was clogged. Another valve was found to lead thesyngas to the cleaning devices and this worked.
A gas analysis of the syngas was made. Unfortunately the syngas contained oxygen. This is aproblem because the syngas is flammable and will be pressurized and heated in the facility. Thetest of the cleaning devices was cancelled once more because the source of the oxygen had to belocated. First the rubber hose that leads the syngas from the gasifier to the cleaning devices waschanged to make sure that it was leak-free. This was however an unlikely source of the oxygenbecause the gasifier delivers the syngas with some positive pressure.
Next the cleaning devices where checked. When there where negative pressure in the systemthe oxygen amount was rising which meant that the cleaning devices had a leak. Foam andtraceable gas was used to find the leak. Two leaks was found in the washing tower, one in theCO2 scrubber and one at a thermoelement. These leaks were errors in some weldings to fixatea grid inside the cleaning devices. The first leakage was welded again and the two others wasfixed with aluminum tape due to lack of time. The thermoelement was tightened.
But these repairs did not remove the oxygen from the gas so the oxygen could only entersomewhere in the gasifier. It turned out that a flexible pipe section was leaking, which meantthat the oxygen could enter. This pipe section is flexible to allow for heat expansion. Theflexible pipe section was cut out and a inflexible pipe section was welded on instead. In orderto keep the flexible properties, a heat exchanger was unbolted at the top and allowed to movein the longitudinal direction of the pipe. The top was still fixed in the other directions.
The reason why the flexible pipe section was leaking, was that when the gasifier is shut down itwill slowly cool down which makes some water from the syngas condense. This water combinedwith ammonia and different salts from the syngas made the stainless steel pipe section corrode.This is showed on Figure 3.21
Page 54 of 76
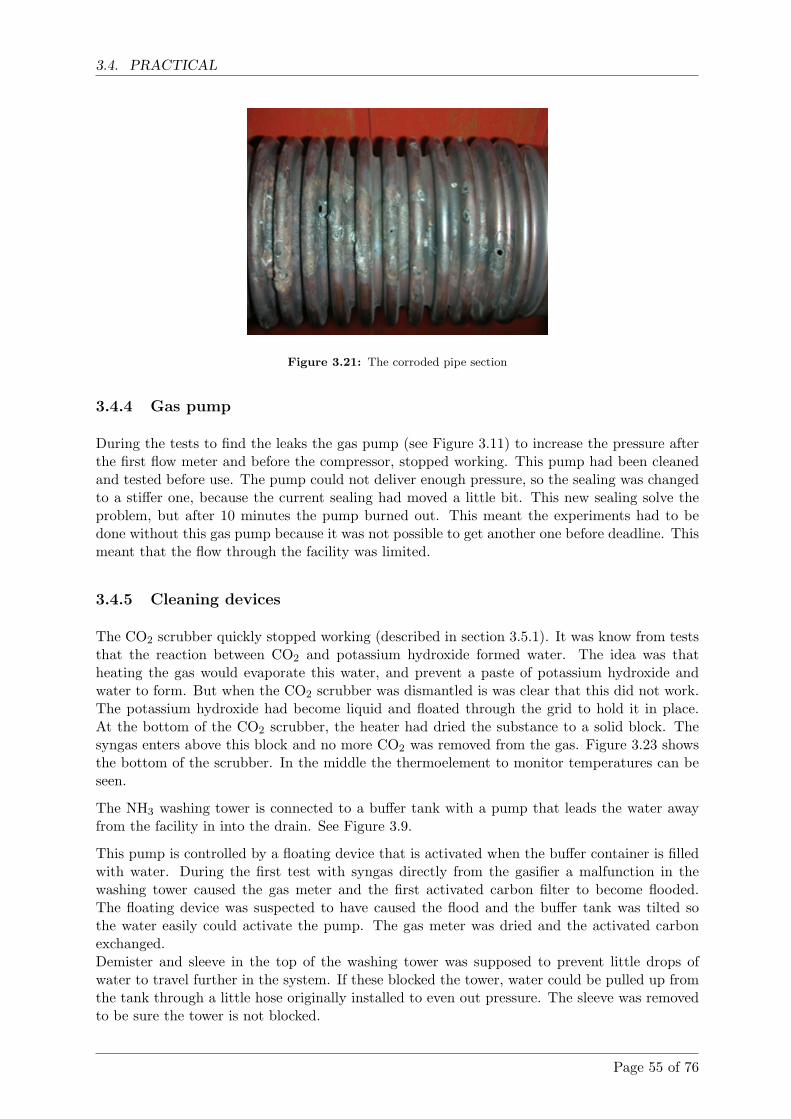
3.4. PRACTICAL
Figure 3.21: The corroded pipe section
3.4.4 Gas pump
During the tests to find the leaks the gas pump (see Figure 3.11) to increase the pressure afterthe first flow meter and before the compressor, stopped working. This pump had been cleanedand tested before use. The pump could not deliver enough pressure, so the sealing was changedto a stiffer one, because the current sealing had moved a little bit. This new sealing solve theproblem, but after 10 minutes the pump burned out. This meant the experiments had to bedone without this gas pump because it was not possible to get another one before deadline. Thismeant that the flow through the facility was limited.
3.4.5 Cleaning devices
The CO2 scrubber quickly stopped working (described in section 3.5.1). It was know from teststhat the reaction between CO2 and potassium hydroxide formed water. The idea was thatheating the gas would evaporate this water, and prevent a paste of potassium hydroxide andwater to form. But when the CO2 scrubber was dismantled is was clear that this did not work.The potassium hydroxide had become liquid and floated through the grid to hold it in place.At the bottom of the CO2 scrubber, the heater had dried the substance to a solid block. Thesyngas enters above this block and no more CO2 was removed from the gas. Figure 3.23 showsthe bottom of the scrubber. In the middle the thermoelement to monitor temperatures can beseen.
The NH3 washing tower is connected to a buffer tank with a pump that leads the water awayfrom the facility in into the drain. See Figure 3.9.
This pump is controlled by a floating device that is activated when the buffer container is filledwith water. During the first test with syngas directly from the gasifier a malfunction in thewashing tower caused the gas meter and the first activated carbon filter to become flooded.The floating device was suspected to have caused the flood and the buffer tank was tilted sothe water easily could activate the pump. The gas meter was dried and the activated carbonexchanged.Demister and sleeve in the top of the washing tower was supposed to prevent little drops ofwater to travel further in the system. If these blocked the tower, water could be pulled up fromthe tank through a little hose originally installed to even out pressure. The sleeve was removedto be sure the tower is not blocked.
Page 55 of 76
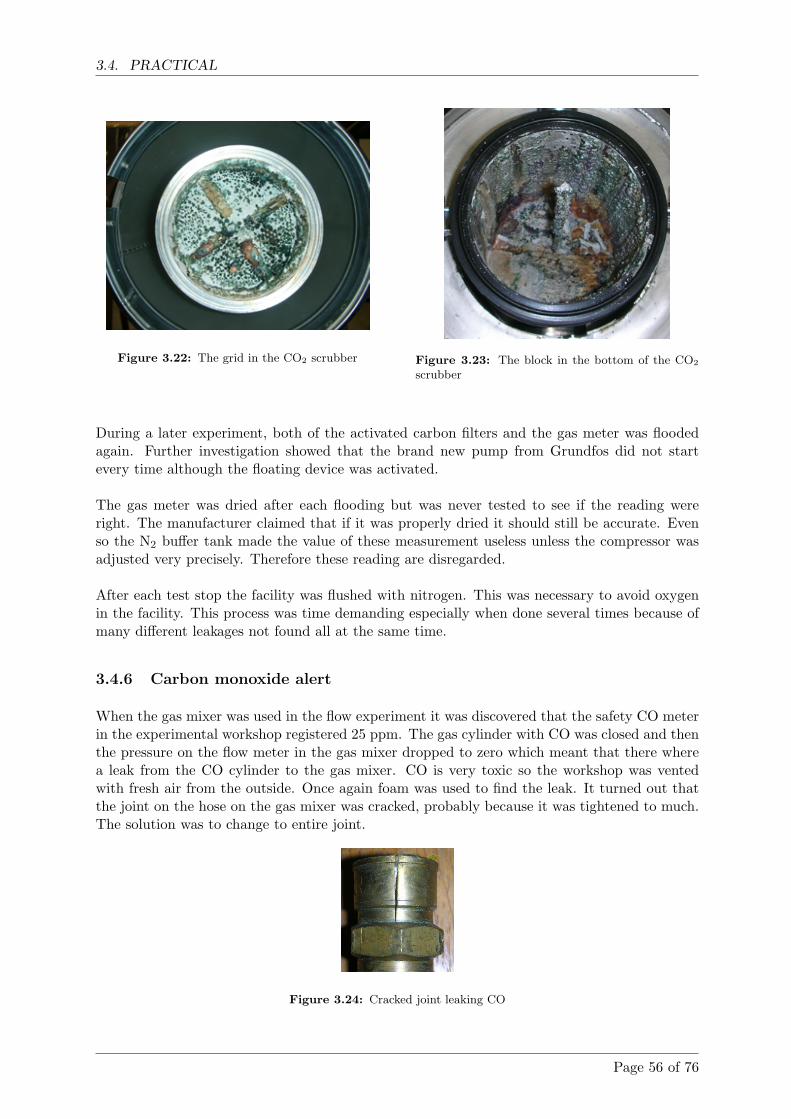
3.4. PRACTICAL
Figure 3.22: The grid in the CO2 scrubber Figure 3.23: The block in the bottom of the CO2
scrubber
During a later experiment, both of the activated carbon filters and the gas meter was floodedagain. Further investigation showed that the brand new pump from Grundfos did not startevery time although the floating device was activated.
The gas meter was dried after each flooding but was never tested to see if the reading wereright. The manufacturer claimed that if it was properly dried it should still be accurate. Evenso the N2 buffer tank made the value of these measurement useless unless the compressor wasadjusted very precisely. Therefore these reading are disregarded.
After each test stop the facility was flushed with nitrogen. This was necessary to avoid oxygenin the facility. This process was time demanding especially when done several times because ofmany different leakages not found all at the same time.
3.4.6 Carbon monoxide alert
When the gas mixer was used in the flow experiment it was discovered that the safety CO meterin the experimental workshop registered 25 ppm. The gas cylinder with CO was closed and thenthe pressure on the flow meter in the gas mixer dropped to zero which meant that there wherea leak from the CO cylinder to the gas mixer. CO is very toxic so the workshop was ventedwith fresh air from the outside. Once again foam was used to find the leak. It turned out thatthe joint on the hose on the gas mixer was cracked, probably because it was tightened to much.The solution was to change to entire joint.
Figure 3.24: Cracked joint leaking CO
Page 56 of 76
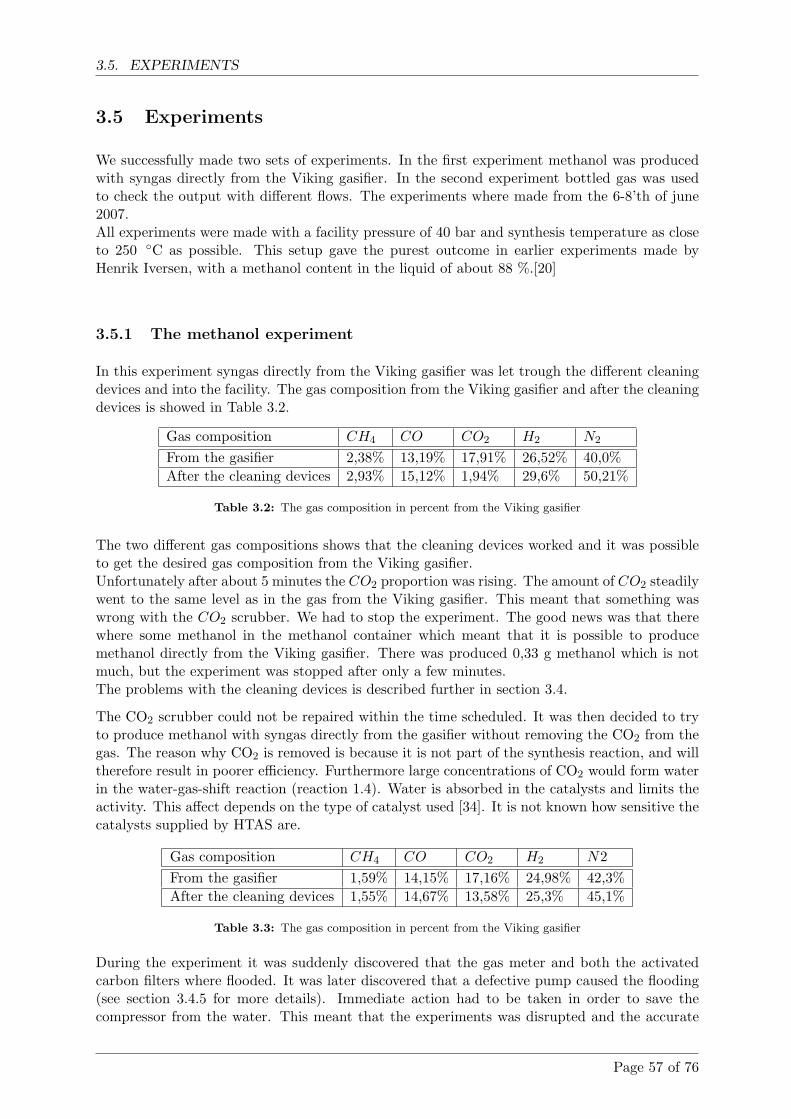
3.5. EXPERIMENTS
3.5 Experiments
We successfully made two sets of experiments. In the first experiment methanol was producedwith syngas directly from the Viking gasifier. In the second experiment bottled gas was usedto check the output with different flows. The experiments where made from the 6-8’th of june2007.All experiments were made with a facility pressure of 40 bar and synthesis temperature as closeto 250 ◦C as possible. This setup gave the purest outcome in earlier experiments made byHenrik Iversen, with a methanol content in the liquid of about 88 %.[20]
3.5.1 The methanol experiment
In this experiment syngas directly from the Viking gasifier was let trough the different cleaningdevices and into the facility. The gas composition from the Viking gasifier and after the cleaningdevices is showed in Table 3.2.
Gas composition CH4 CO CO2 H2 N2
From the gasifier 2,38% 13,19% 17,91% 26,52% 40,0%After the cleaning devices 2,93% 15,12% 1,94% 29,6% 50,21%
Table 3.2: The gas composition in percent from the Viking gasifier
The two different gas compositions shows that the cleaning devices worked and it was possibleto get the desired gas composition from the Viking gasifier.Unfortunately after about 5 minutes the CO2 proportion was rising. The amount of CO2 steadilywent to the same level as in the gas from the Viking gasifier. This meant that something waswrong with the CO2 scrubber. We had to stop the experiment. The good news was that therewhere some methanol in the methanol container which meant that it is possible to producemethanol directly from the Viking gasifier. There was produced 0,33 g methanol which is notmuch, but the experiment was stopped after only a few minutes.The problems with the cleaning devices is described further in section 3.4.
The CO2 scrubber could not be repaired within the time scheduled. It was then decided to tryto produce methanol with syngas directly from the gasifier without removing the CO2 from thegas. The reason why CO2 is removed is because it is not part of the synthesis reaction, and willtherefore result in poorer efficiency. Furthermore large concentrations of CO2 would form waterin the water-gas-shift reaction (reaction 1.4). Water is absorbed in the catalysts and limits theactivity. This affect depends on the type of catalyst used [34]. It is not known how sensitive thecatalysts supplied by HTAS are.
Gas composition CH4 CO CO2 H2 N2From the gasifier 1,59% 14,15% 17,16% 24,98% 42,3%After the cleaning devices 1,55% 14,67% 13,58% 25,3% 45,1%
Table 3.3: The gas composition in percent from the Viking gasifier
During the experiment it was suddenly discovered that the gas meter and both the activatedcarbon filters where flooded. It was later discovered that a defective pump caused the flooding(see section 3.4.5 for more details). Immediate action had to be taken in order to save thecompressor from the water. This meant that the experiments was disrupted and the accurate
Page 57 of 76
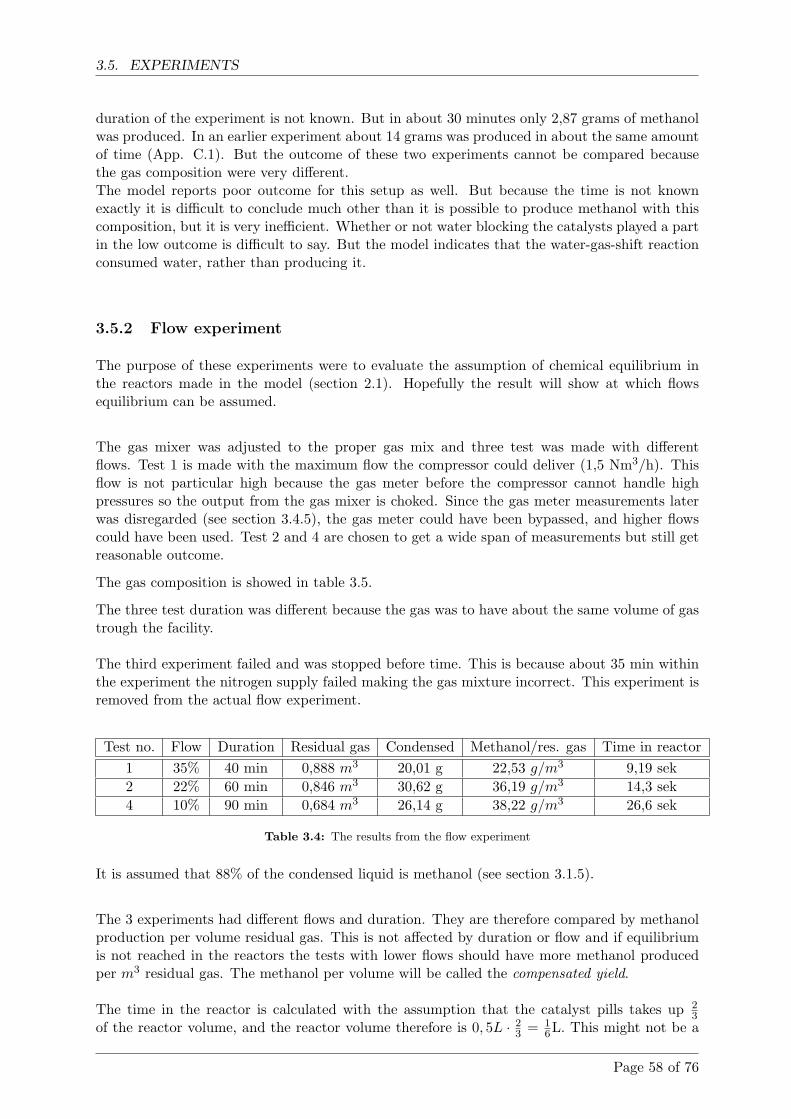
3.5. EXPERIMENTS
duration of the experiment is not known. But in about 30 minutes only 2,87 grams of methanolwas produced. In an earlier experiment about 14 grams was produced in about the same amountof time (App. C.1). But the outcome of these two experiments cannot be compared becausethe gas composition were very different.The model reports poor outcome for this setup as well. But because the time is not knownexactly it is difficult to conclude much other than it is possible to produce methanol with thiscomposition, but it is very inefficient. Whether or not water blocking the catalysts played a partin the low outcome is difficult to say. But the model indicates that the water-gas-shift reactionconsumed water, rather than producing it.
3.5.2 Flow experiment
The purpose of these experiments were to evaluate the assumption of chemical equilibrium inthe reactors made in the model (section 2.1). Hopefully the result will show at which flowsequilibrium can be assumed.
The gas mixer was adjusted to the proper gas mix and three test was made with differentflows. Test 1 is made with the maximum flow the compressor could deliver (1,5 Nm3/h). Thisflow is not particular high because the gas meter before the compressor cannot handle highpressures so the output from the gas mixer is choked. Since the gas meter measurements laterwas disregarded (see section 3.4.5), the gas meter could have been bypassed, and higher flowscould have been used. Test 2 and 4 are chosen to get a wide span of measurements but still getreasonable outcome.
The gas composition is showed in table 3.5.
The three test duration was different because the gas was to have about the same volume of gastrough the facility.
The third experiment failed and was stopped before time. This is because about 35 min withinthe experiment the nitrogen supply failed making the gas mixture incorrect. This experiment isremoved from the actual flow experiment.
Test no. Flow Duration Residual gas Condensed Methanol/res. gas Time in reactor1 35% 40 min 0,888 m3 20,01 g 22,53 g/m3 9,19 sek2 22% 60 min 0,846 m3 30,62 g 36,19 g/m3 14,3 sek4 10% 90 min 0,684 m3 26,14 g 38,22 g/m3 26,6 sek
Table 3.4: The results from the flow experiment
It is assumed that 88% of the condensed liquid is methanol (see section 3.1.5).
The 3 experiments had different flows and duration. They are therefore compared by methanolproduction per volume residual gas. This is not affected by duration or flow and if equilibriumis not reached in the reactors the tests with lower flows should have more methanol producedper m3 residual gas. The methanol per volume will be called the compensated yield.
The time in the reactor is calculated with the assumption that the catalyst pills takes up 23
of the reactor volume, and the reactor volume therefore is 0, 5L · 23 = 1
6L. This might not be a
Page 58 of 76
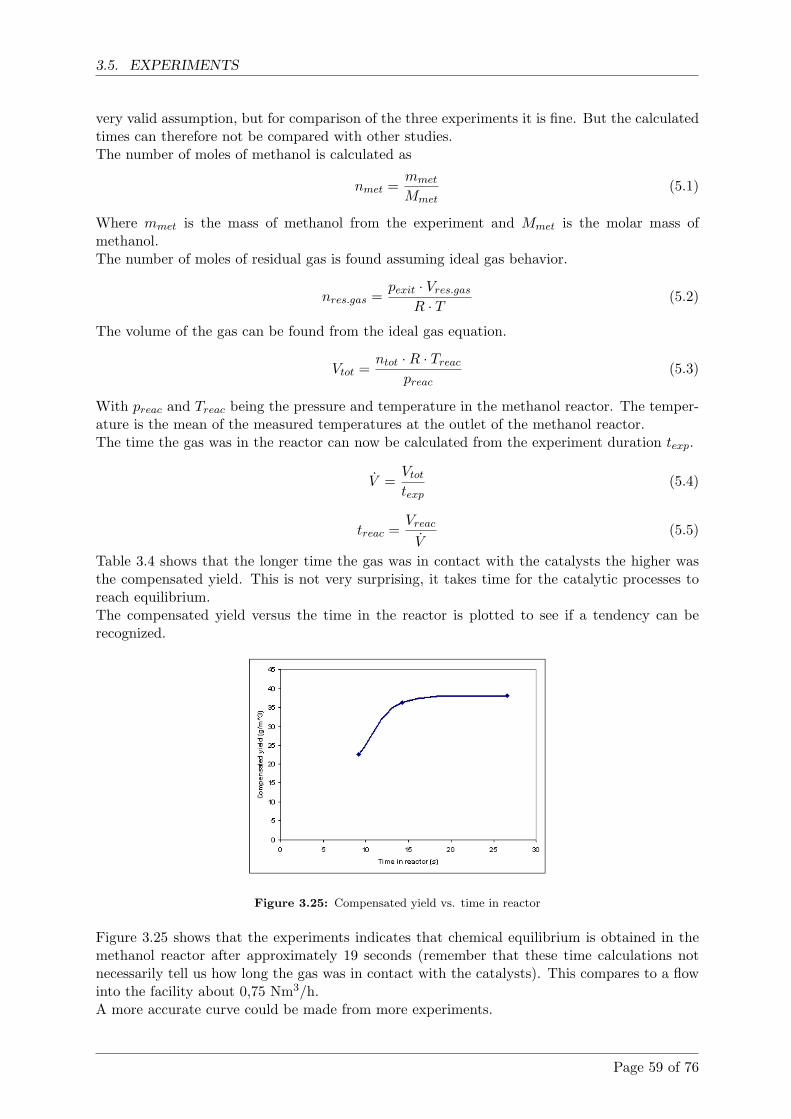
3.5. EXPERIMENTS
very valid assumption, but for comparison of the three experiments it is fine. But the calculatedtimes can therefore not be compared with other studies.The number of moles of methanol is calculated as
nmet =mmet
Mmet(5.1)
Where mmet is the mass of methanol from the experiment and Mmet is the molar mass ofmethanol.The number of moles of residual gas is found assuming ideal gas behavior.
nres.gas =pexit · Vres.gas
R · T(5.2)
The volume of the gas can be found from the ideal gas equation.
Vtot =ntot ·R · Treac
preac(5.3)
With preac and Treac being the pressure and temperature in the methanol reactor. The temper-ature is the mean of the measured temperatures at the outlet of the methanol reactor.The time the gas was in the reactor can now be calculated from the experiment duration texp.
V =Vtot
texp(5.4)
treac =Vreac
V(5.5)
Table 3.4 shows that the longer time the gas was in contact with the catalysts the higher wasthe compensated yield. This is not very surprising, it takes time for the catalytic processes toreach equilibrium.The compensated yield versus the time in the reactor is plotted to see if a tendency can berecognized.
Figure 3.25: Compensated yield vs. time in reactor
Figure 3.25 shows that the experiments indicates that chemical equilibrium is obtained in themethanol reactor after approximately 19 seconds (remember that these time calculations notnecessarily tell us how long the gas was in contact with the catalysts). This compares to a flowinto the facility about 0,75 Nm3/h.A more accurate curve could be made from more experiments.
Page 59 of 76
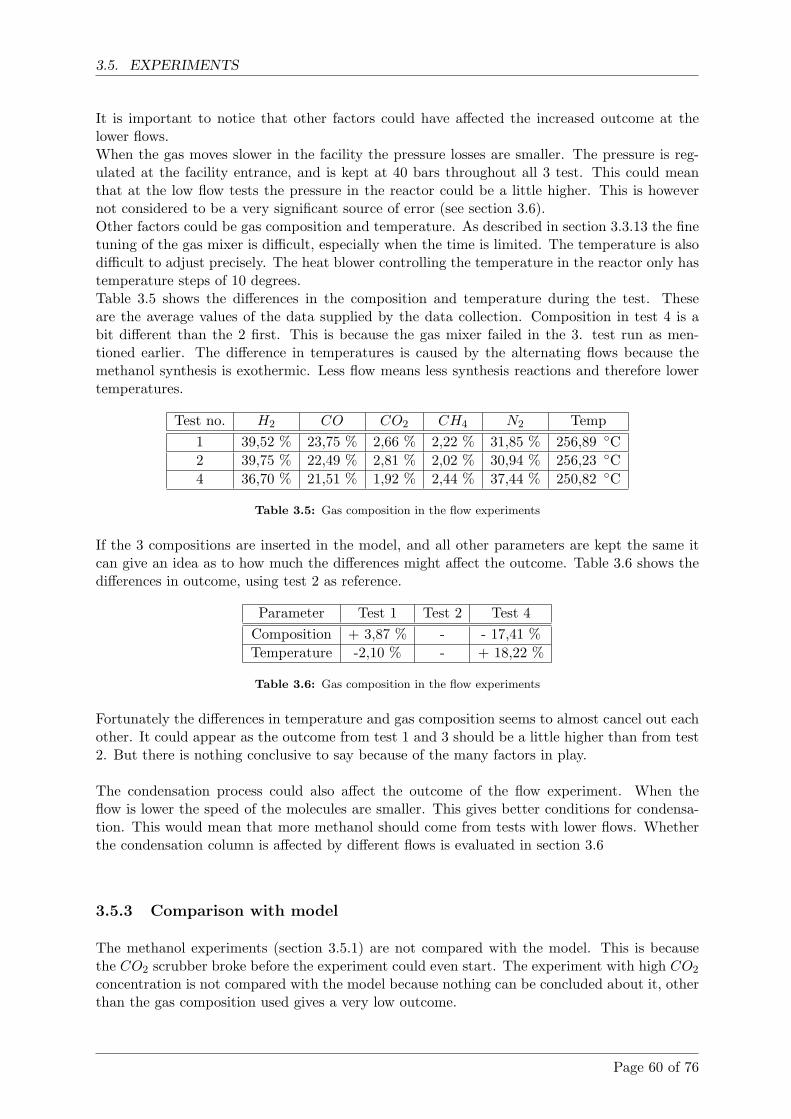
3.5. EXPERIMENTS
It is important to notice that other factors could have affected the increased outcome at thelower flows.When the gas moves slower in the facility the pressure losses are smaller. The pressure is reg-ulated at the facility entrance, and is kept at 40 bars throughout all 3 test. This could meanthat at the low flow tests the pressure in the reactor could be a little higher. This is howevernot considered to be a very significant source of error (see section 3.6).Other factors could be gas composition and temperature. As described in section 3.3.13 the finetuning of the gas mixer is difficult, especially when the time is limited. The temperature is alsodifficult to adjust precisely. The heat blower controlling the temperature in the reactor only hastemperature steps of 10 degrees.Table 3.5 shows the differences in the composition and temperature during the test. Theseare the average values of the data supplied by the data collection. Composition in test 4 is abit different than the 2 first. This is because the gas mixer failed in the 3. test run as men-tioned earlier. The difference in temperatures is caused by the alternating flows because themethanol synthesis is exothermic. Less flow means less synthesis reactions and therefore lowertemperatures.
Test no. H2 CO CO2 CH4 N2 Temp1 39,52 % 23,75 % 2,66 % 2,22 % 31,85 % 256,89 ◦C2 39,75 % 22,49 % 2,81 % 2,02 % 30,94 % 256,23 ◦C4 36,70 % 21,51 % 1,92 % 2,44 % 37,44 % 250,82 ◦C
Table 3.5: Gas composition in the flow experiments
If the 3 compositions are inserted in the model, and all other parameters are kept the same itcan give an idea as to how much the differences might affect the outcome. Table 3.6 shows thedifferences in outcome, using test 2 as reference.
Parameter Test 1 Test 2 Test 4Composition + 3,87 % - - 17,41 %Temperature -2,10 % - + 18,22 %
Table 3.6: Gas composition in the flow experiments
Fortunately the differences in temperature and gas composition seems to almost cancel out eachother. It could appear as the outcome from test 1 and 3 should be a little higher than from test2. But there is nothing conclusive to say because of the many factors in play.
The condensation process could also affect the outcome of the flow experiment. When theflow is lower the speed of the molecules are smaller. This gives better conditions for condensa-tion. This would mean that more methanol should come from tests with lower flows. Whetherthe condensation column is affected by different flows is evaluated in section 3.6
3.5.3 Comparison with model
The methanol experiments (section 3.5.1) are not compared with the model. This is becausethe CO2 scrubber broke before the experiment could even start. The experiment with high CO2
concentration is not compared with the model because nothing can be concluded about it, otherthan the gas composition used gives a very low outcome.
Page 60 of 76
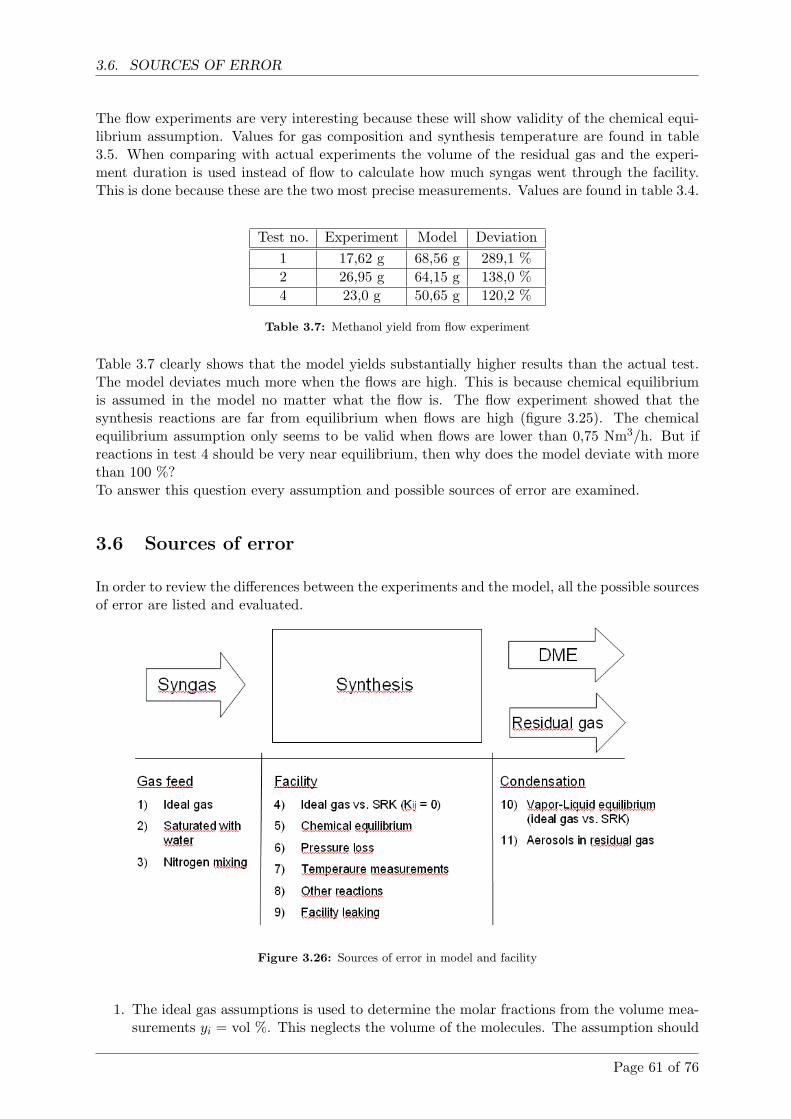
3.6. SOURCES OF ERROR
The flow experiments are very interesting because these will show validity of the chemical equi-librium assumption. Values for gas composition and synthesis temperature are found in table3.5. When comparing with actual experiments the volume of the residual gas and the experi-ment duration is used instead of flow to calculate how much syngas went through the facility.This is done because these are the two most precise measurements. Values are found in table 3.4.
Test no. Experiment Model Deviation1 17,62 g 68,56 g 289,1 %2 26,95 g 64,15 g 138,0 %4 23,0 g 50,65 g 120,2 %
Table 3.7: Methanol yield from flow experiment
Table 3.7 clearly shows that the model yields substantially higher results than the actual test.The model deviates much more when the flows are high. This is because chemical equilibriumis assumed in the model no matter what the flow is. The flow experiment showed that thesynthesis reactions are far from equilibrium when flows are high (figure 3.25). The chemicalequilibrium assumption only seems to be valid when flows are lower than 0,75 Nm3/h. But ifreactions in test 4 should be very near equilibrium, then why does the model deviate with morethan 100 %?To answer this question every assumption and possible sources of error are examined.
3.6 Sources of error
In order to review the differences between the experiments and the model, all the possible sourcesof error are listed and evaluated.
Figure 3.26: Sources of error in model and facility
1. The ideal gas assumptions is used to determine the molar fractions from the volume mea-surements yi = vol %. This neglects the volume of the molecules. The assumption should
Page 61 of 76
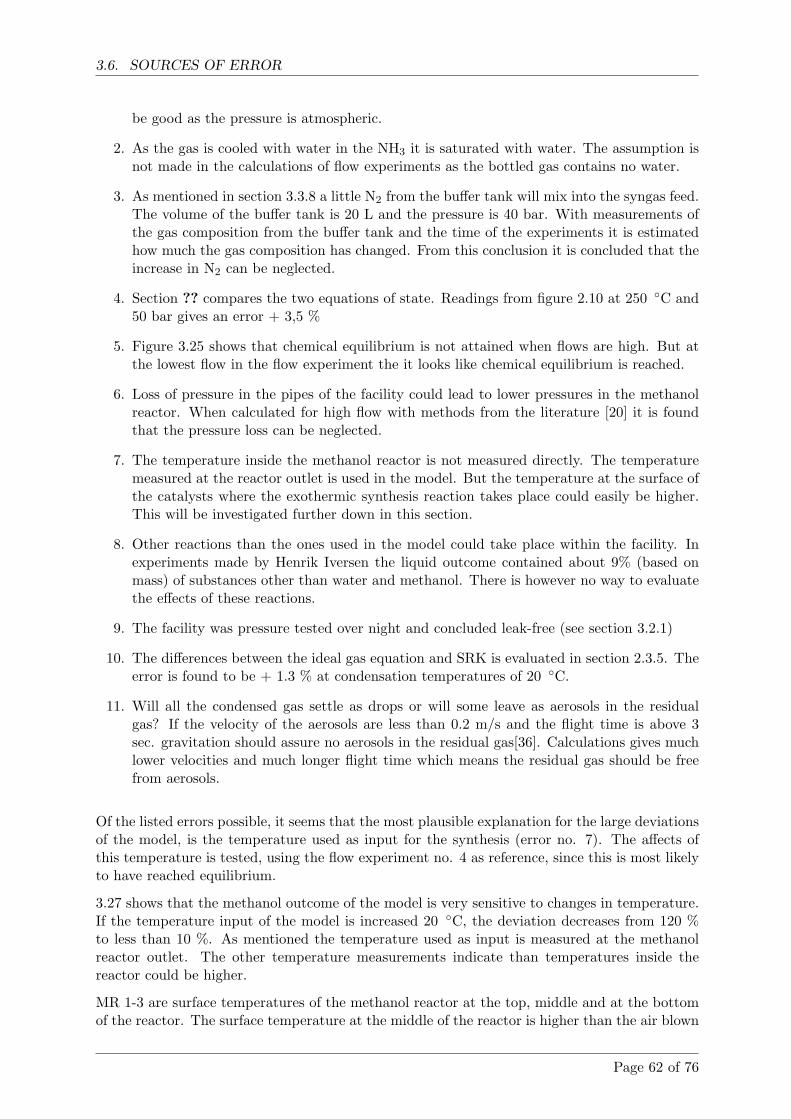
3.6. SOURCES OF ERROR
be good as the pressure is atmospheric.
2. As the gas is cooled with water in the NH3 it is saturated with water. The assumption isnot made in the calculations of flow experiments as the bottled gas contains no water.
3. As mentioned in section 3.3.8 a little N2 from the buffer tank will mix into the syngas feed.The volume of the buffer tank is 20 L and the pressure is 40 bar. With measurements ofthe gas composition from the buffer tank and the time of the experiments it is estimatedhow much the gas composition has changed. From this conclusion it is concluded that theincrease in N2 can be neglected.
4. Section ?? compares the two equations of state. Readings from figure 2.10 at 250 ◦C and50 bar gives an error + 3,5 %
5. Figure 3.25 shows that chemical equilibrium is not attained when flows are high. But atthe lowest flow in the flow experiment the it looks like chemical equilibrium is reached.
6. Loss of pressure in the pipes of the facility could lead to lower pressures in the methanolreactor. When calculated for high flow with methods from the literature [20] it is foundthat the pressure loss can be neglected.
7. The temperature inside the methanol reactor is not measured directly. The temperaturemeasured at the reactor outlet is used in the model. But the temperature at the surface ofthe catalysts where the exothermic synthesis reaction takes place could easily be higher.This will be investigated further down in this section.
8. Other reactions than the ones used in the model could take place within the facility. Inexperiments made by Henrik Iversen the liquid outcome contained about 9% (based onmass) of substances other than water and methanol. There is however no way to evaluatethe effects of these reactions.
9. The facility was pressure tested over night and concluded leak-free (see section 3.2.1)
10. The differences between the ideal gas equation and SRK is evaluated in section 2.3.5. Theerror is found to be + 1.3 % at condensation temperatures of 20 ◦C.
11. Will all the condensed gas settle as drops or will some leave as aerosols in the residualgas? If the velocity of the aerosols are less than 0.2 m/s and the flight time is above 3sec. gravitation should assure no aerosols in the residual gas[36]. Calculations gives muchlower velocities and much longer flight time which means the residual gas should be freefrom aerosols.
Of the listed errors possible, it seems that the most plausible explanation for the large deviationsof the model, is the temperature used as input for the synthesis (error no. 7). The affects ofthis temperature is tested, using the flow experiment no. 4 as reference, since this is most likelyto have reached equilibrium.
3.27 shows that the methanol outcome of the model is very sensitive to changes in temperature.If the temperature input of the model is increased 20 ◦C, the deviation decreases from 120 %to less than 10 %. As mentioned the temperature used as input is measured at the methanolreactor outlet. The other temperature measurements indicate than temperatures inside thereactor could be higher.
MR 1-3 are surface temperatures of the methanol reactor at the top, middle and at the bottomof the reactor. The surface temperature at the middle of the reactor is higher than the air blown
Page 62 of 76
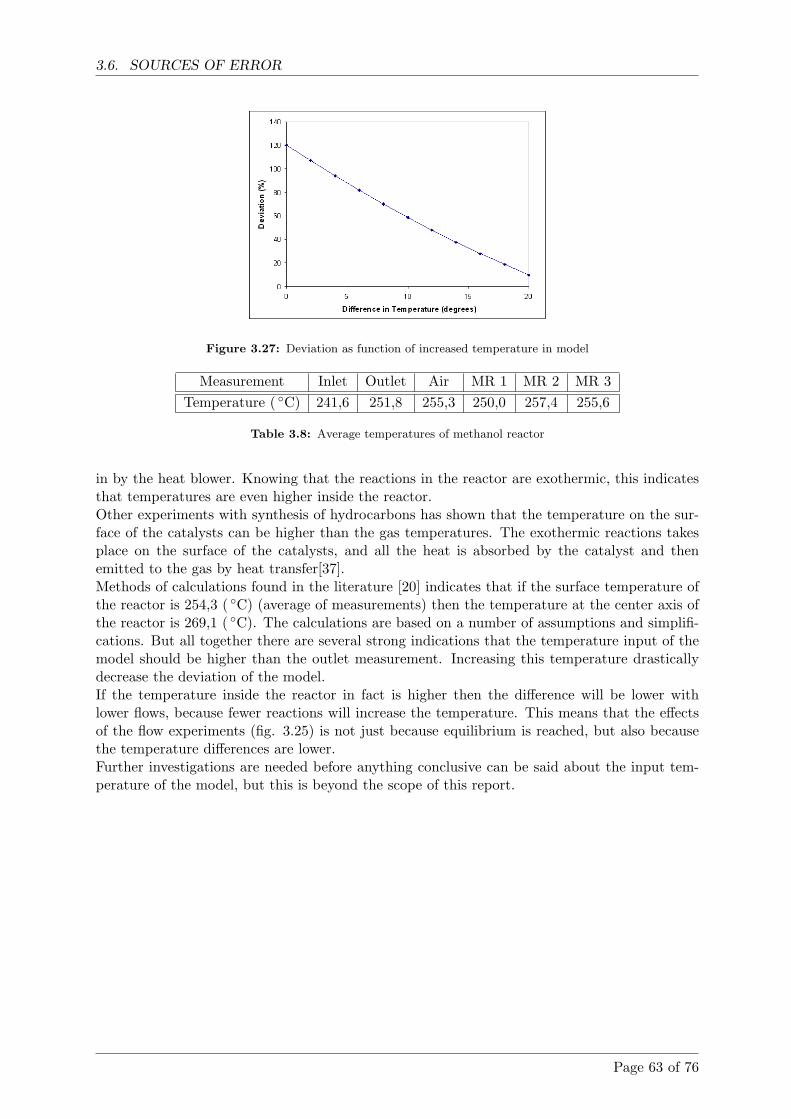
3.6. SOURCES OF ERROR
Figure 3.27: Deviation as function of increased temperature in model
Measurement Inlet Outlet Air MR 1 MR 2 MR 3Temperature ( ◦C) 241,6 251,8 255,3 250,0 257,4 255,6
Table 3.8: Average temperatures of methanol reactor
in by the heat blower. Knowing that the reactions in the reactor are exothermic, this indicatesthat temperatures are even higher inside the reactor.Other experiments with synthesis of hydrocarbons has shown that the temperature on the sur-face of the catalysts can be higher than the gas temperatures. The exothermic reactions takesplace on the surface of the catalysts, and all the heat is absorbed by the catalyst and thenemitted to the gas by heat transfer[37].Methods of calculations found in the literature [20] indicates that if the surface temperature ofthe reactor is 254,3 ( ◦C) (average of measurements) then the temperature at the center axis ofthe reactor is 269,1 ( ◦C). The calculations are based on a number of assumptions and simplifi-cations. But all together there are several strong indications that the temperature input of themodel should be higher than the outlet measurement. Increasing this temperature drasticallydecrease the deviation of the model.If the temperature inside the reactor in fact is higher then the difference will be lower withlower flows, because fewer reactions will increase the temperature. This means that the effectsof the flow experiments (fig. 3.25) is not just because equilibrium is reached, but also becausethe temperature differences are lower.Further investigations are needed before anything conclusive can be said about the input tem-perature of the model, but this is beyond the scope of this report.
Page 63 of 76
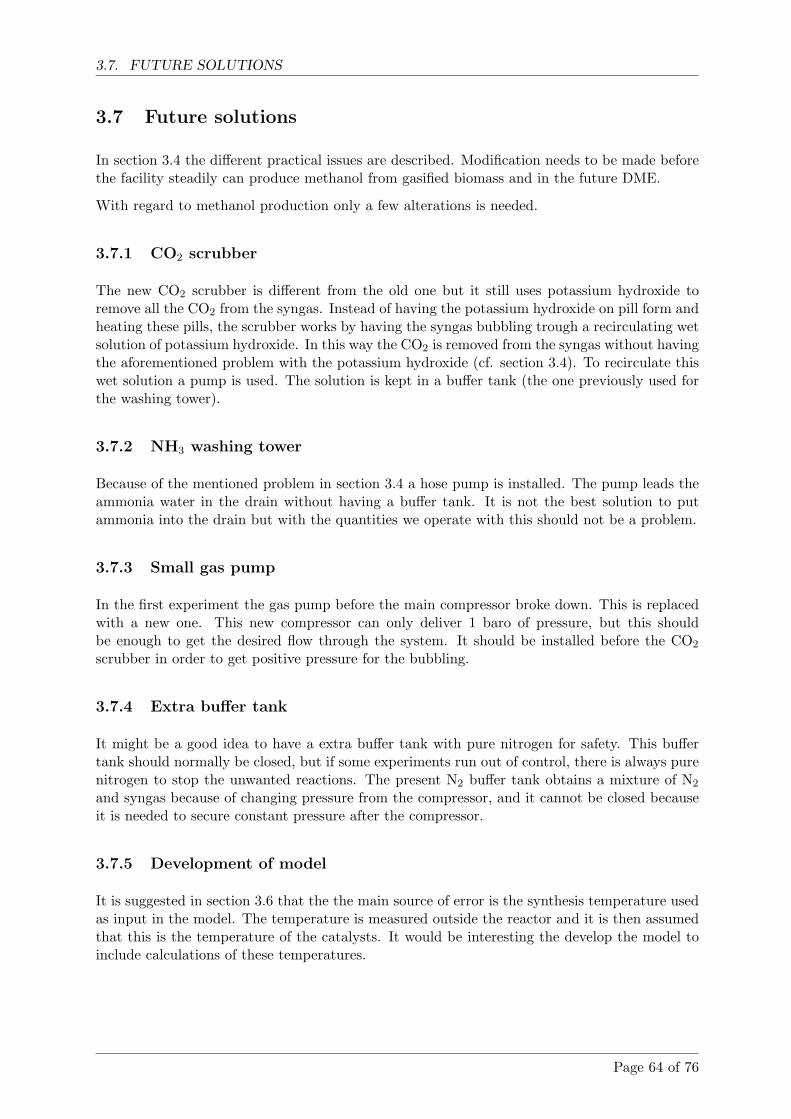
3.7. FUTURE SOLUTIONS
3.7 Future solutions
In section 3.4 the different practical issues are described. Modification needs to be made beforethe facility steadily can produce methanol from gasified biomass and in the future DME.
With regard to methanol production only a few alterations is needed.
3.7.1 CO2 scrubber
The new CO2 scrubber is different from the old one but it still uses potassium hydroxide toremove all the CO2 from the syngas. Instead of having the potassium hydroxide on pill form andheating these pills, the scrubber works by having the syngas bubbling trough a recirculating wetsolution of potassium hydroxide. In this way the CO2 is removed from the syngas without havingthe aforementioned problem with the potassium hydroxide (cf. section 3.4). To recirculate thiswet solution a pump is used. The solution is kept in a buffer tank (the one previously used forthe washing tower).
3.7.2 NH3 washing tower
Because of the mentioned problem in section 3.4 a hose pump is installed. The pump leads theammonia water in the drain without having a buffer tank. It is not the best solution to putammonia into the drain but with the quantities we operate with this should not be a problem.
3.7.3 Small gas pump
In the first experiment the gas pump before the main compressor broke down. This is replacedwith a new one. This new compressor can only deliver 1 baro of pressure, but this shouldbe enough to get the desired flow through the system. It should be installed before the CO2
scrubber in order to get positive pressure for the bubbling.
3.7.4 Extra buffer tank
It might be a good idea to have a extra buffer tank with pure nitrogen for safety. This buffertank should normally be closed, but if some experiments run out of control, there is always purenitrogen to stop the unwanted reactions. The present N2 buffer tank obtains a mixture of N2
and syngas because of changing pressure from the compressor, and it cannot be closed becauseit is needed to secure constant pressure after the compressor.
3.7.5 Development of model
It is suggested in section 3.6 that the the main source of error is the synthesis temperature usedas input in the model. The temperature is measured outside the reactor and it is then assumedthat this is the temperature of the catalysts. It would be interesting the develop the model toinclude calculations of these temperatures.
Page 64 of 76
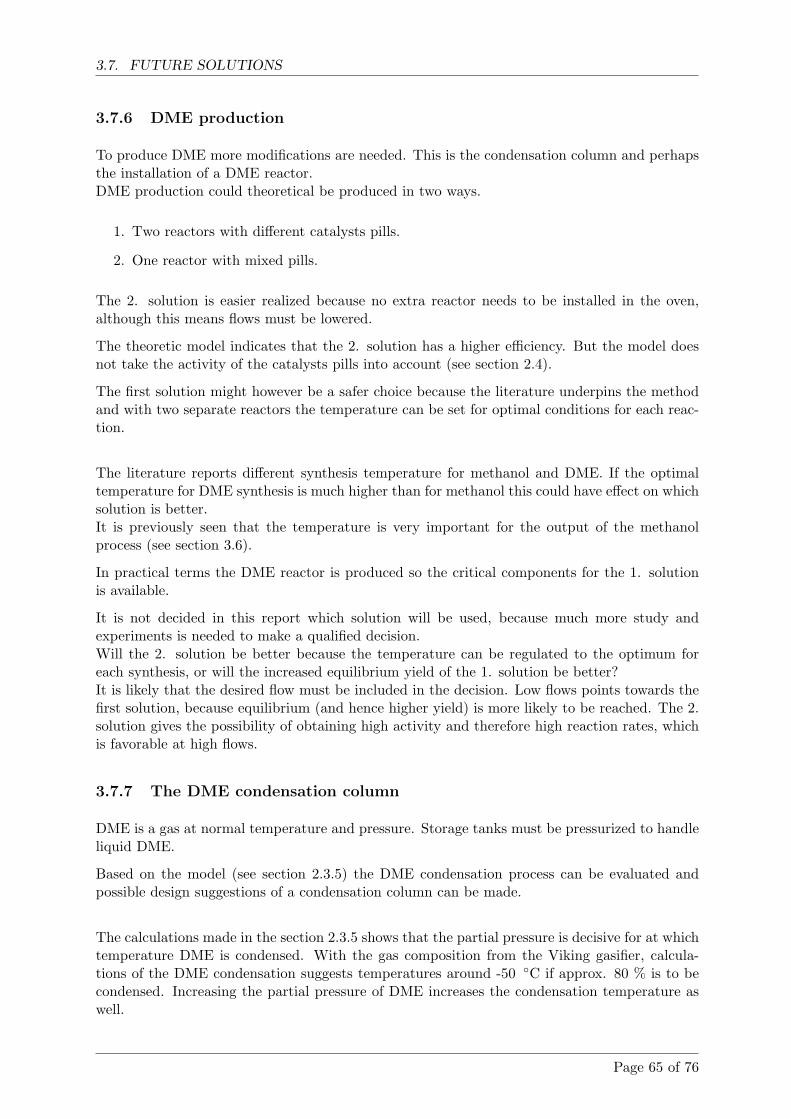
3.7. FUTURE SOLUTIONS
3.7.6 DME production
To produce DME more modifications are needed. This is the condensation column and perhapsthe installation of a DME reactor.DME production could theoretical be produced in two ways.
1. Two reactors with different catalysts pills.
2. One reactor with mixed pills.
The 2. solution is easier realized because no extra reactor needs to be installed in the oven,although this means flows must be lowered.
The theoretic model indicates that the 2. solution has a higher efficiency. But the model doesnot take the activity of the catalysts pills into account (see section 2.4).
The first solution might however be a safer choice because the literature underpins the methodand with two separate reactors the temperature can be set for optimal conditions for each reac-tion.
The literature reports different synthesis temperature for methanol and DME. If the optimaltemperature for DME synthesis is much higher than for methanol this could have effect on whichsolution is better.It is previously seen that the temperature is very important for the output of the methanolprocess (see section 3.6).
In practical terms the DME reactor is produced so the critical components for the 1. solutionis available.
It is not decided in this report which solution will be used, because much more study andexperiments is needed to make a qualified decision.Will the 2. solution be better because the temperature can be regulated to the optimum foreach synthesis, or will the increased equilibrium yield of the 1. solution be better?It is likely that the desired flow must be included in the decision. Low flows points towards thefirst solution, because equilibrium (and hence higher yield) is more likely to be reached. The 2.solution gives the possibility of obtaining high activity and therefore high reaction rates, whichis favorable at high flows.
3.7.7 The DME condensation column
DME is a gas at normal temperature and pressure. Storage tanks must be pressurized to handleliquid DME.
Based on the model (see section 2.3.5) the DME condensation process can be evaluated andpossible design suggestions of a condensation column can be made.
The calculations made in the section 2.3.5 shows that the partial pressure is decisive for at whichtemperature DME is condensed. With the gas composition from the Viking gasifier, calcula-tions of the DME condensation suggests temperatures around -50 ◦C if approx. 80 % is to becondensed. Increasing the partial pressure of DME increases the condensation temperature aswell.
Page 65 of 76
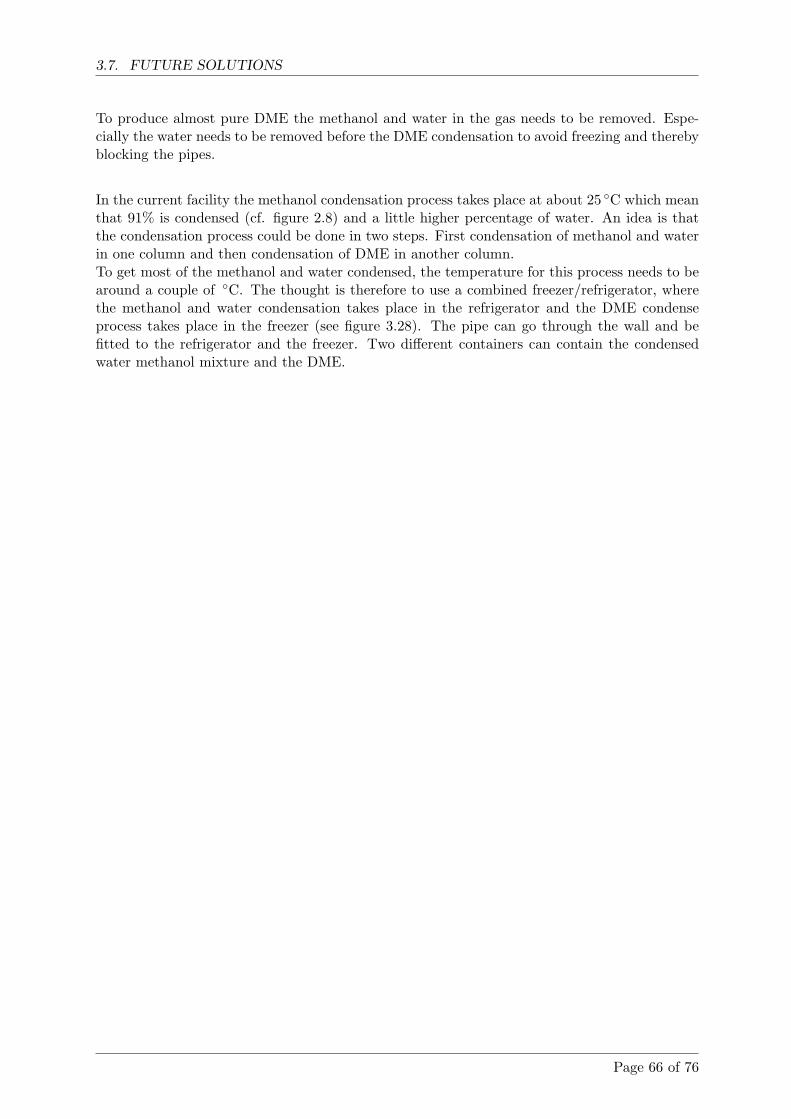
3.7. FUTURE SOLUTIONS
To produce almost pure DME the methanol and water in the gas needs to be removed. Espe-cially the water needs to be removed before the DME condensation to avoid freezing and therebyblocking the pipes.
In the current facility the methanol condensation process takes place at about 25 ◦C which meanthat 91% is condensed (cf. figure 2.8) and a little higher percentage of water. An idea is thatthe condensation process could be done in two steps. First condensation of methanol and waterin one column and then condensation of DME in another column.To get most of the methanol and water condensed, the temperature for this process needs to bearound a couple of ◦C. The thought is therefore to use a combined freezer/refrigerator, wherethe methanol and water condensation takes place in the refrigerator and the DME condenseprocess takes place in the freezer (see figure 3.28). The pipe can go through the wall and befitted to the refrigerator and the freezer. Two different containers can contain the condensedwater methanol mixture and the DME.
Page 66 of 76
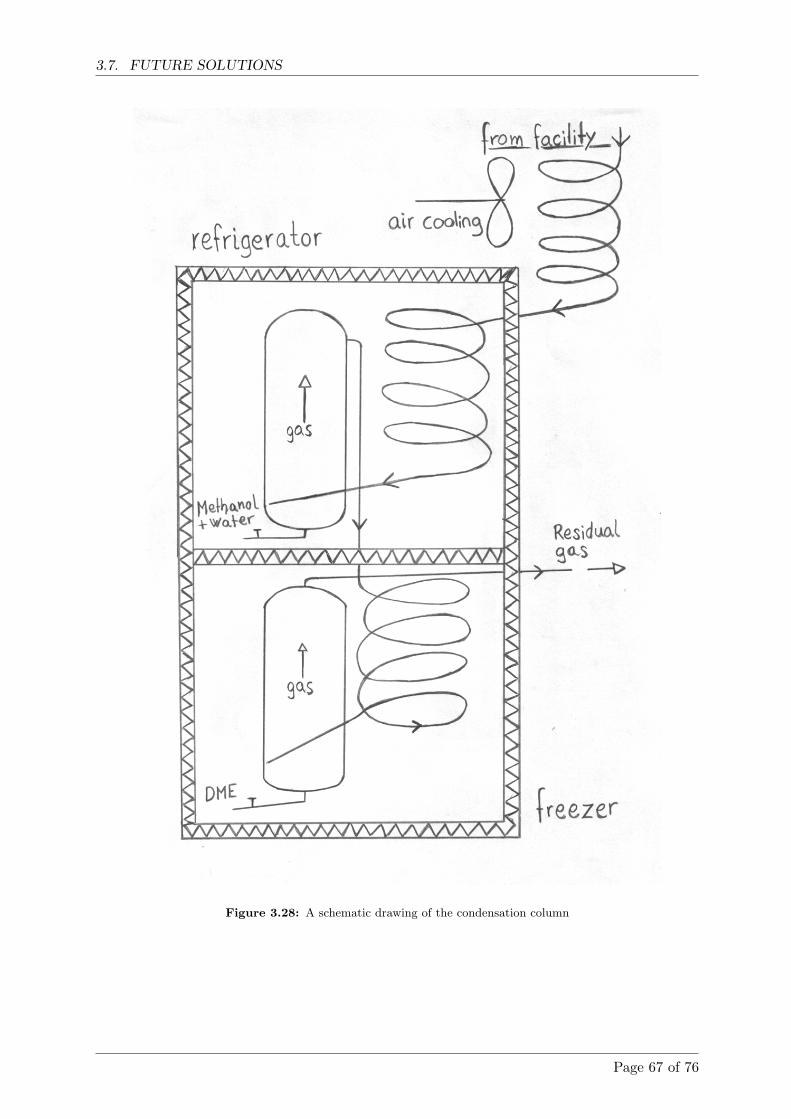
3.7. FUTURE SOLUTIONS
Figure 3.28: A schematic drawing of the condensation column
Page 67 of 76
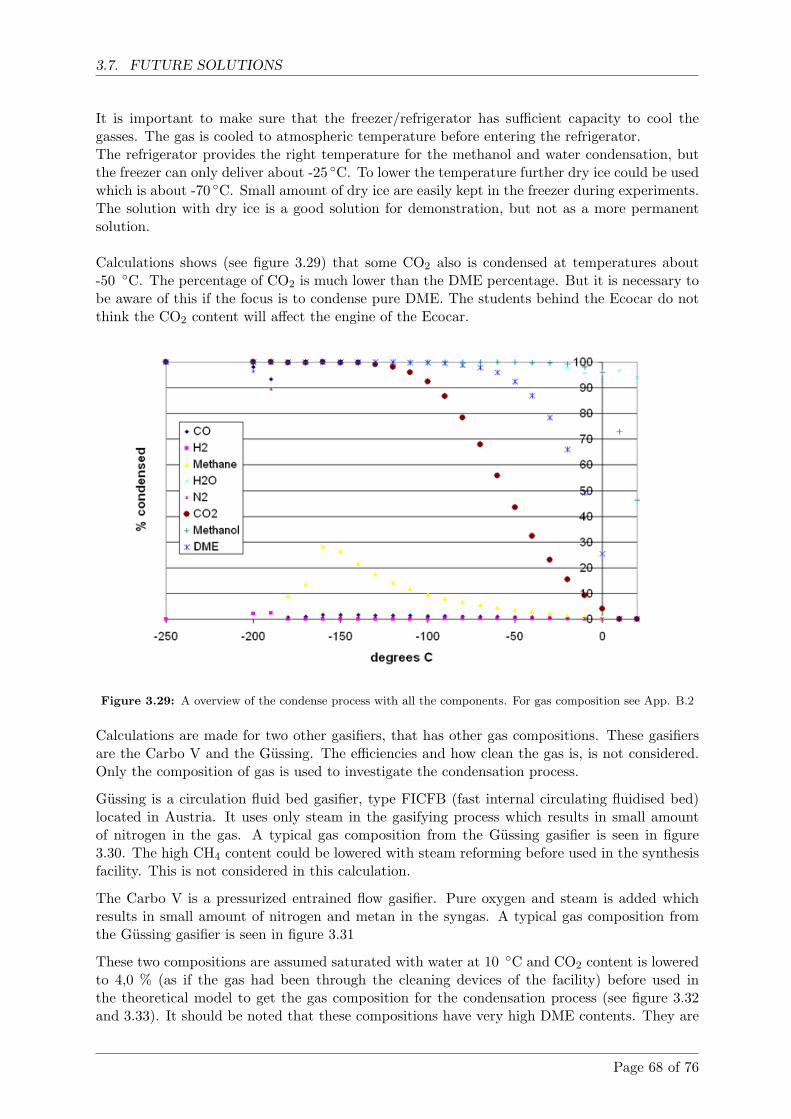
3.7. FUTURE SOLUTIONS
It is important to make sure that the freezer/refrigerator has sufficient capacity to cool thegasses. The gas is cooled to atmospheric temperature before entering the refrigerator.The refrigerator provides the right temperature for the methanol and water condensation, butthe freezer can only deliver about -25 ◦C. To lower the temperature further dry ice could be usedwhich is about -70 ◦C. Small amount of dry ice are easily kept in the freezer during experiments.The solution with dry ice is a good solution for demonstration, but not as a more permanentsolution.
Calculations shows (see figure 3.29) that some CO2 also is condensed at temperatures about-50 ◦C. The percentage of CO2 is much lower than the DME percentage. But it is necessary tobe aware of this if the focus is to condense pure DME. The students behind the Ecocar do notthink the CO2 content will affect the engine of the Ecocar.
Figure 3.29: A overview of the condense process with all the components. For gas composition see App. B.2
Calculations are made for two other gasifiers, that has other gas compositions. These gasifiersare the Carbo V and the Gussing. The efficiencies and how clean the gas is, is not considered.Only the composition of gas is used to investigate the condensation process.
Gussing is a circulation fluid bed gasifier, type FICFB (fast internal circulating fluidised bed)located in Austria. It uses only steam in the gasifying process which results in small amountof nitrogen in the gas. A typical gas composition from the Gussing gasifier is seen in figure3.30. The high CH4 content could be lowered with steam reforming before used in the synthesisfacility. This is not considered in this calculation.
The Carbo V is a pressurized entrained flow gasifier. Pure oxygen and steam is added whichresults in small amount of nitrogen and metan in the syngas. A typical gas composition fromthe Gussing gasifier is seen in figure 3.31
These two compositions are assumed saturated with water at 10 ◦C and CO2 content is loweredto 4,0 % (as if the gas had been through the cleaning devices of the facility) before used inthe theoretical model to get the gas composition for the condensation process (see figure 3.32and 3.33). It should be noted that these compositions have very high DME contents. They are
Page 68 of 76
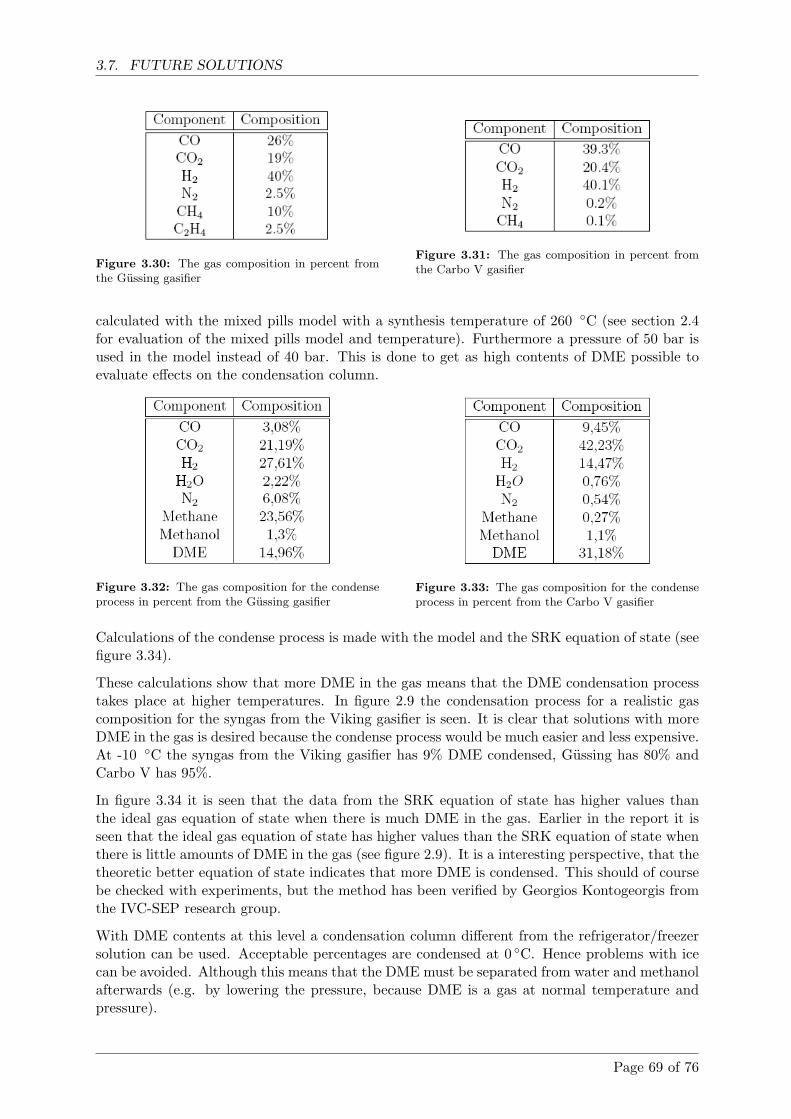
3.7. FUTURE SOLUTIONS
Figure 3.30: The gas composition in percent fromthe Gussing gasifier
Figure 3.31: The gas composition in percent fromthe Carbo V gasifier
calculated with the mixed pills model with a synthesis temperature of 260 ◦C (see section 2.4for evaluation of the mixed pills model and temperature). Furthermore a pressure of 50 bar isused in the model instead of 40 bar. This is done to get as high contents of DME possible toevaluate effects on the condensation column.
Figure 3.32: The gas composition for the condenseprocess in percent from the Gussing gasifier
Figure 3.33: The gas composition for the condenseprocess in percent from the Carbo V gasifier
Calculations of the condense process is made with the model and the SRK equation of state (seefigure 3.34).
These calculations show that more DME in the gas means that the DME condensation processtakes place at higher temperatures. In figure 2.9 the condensation process for a realistic gascomposition for the syngas from the Viking gasifier is seen. It is clear that solutions with moreDME in the gas is desired because the condense process would be much easier and less expensive.At -10 ◦C the syngas from the Viking gasifier has 9% DME condensed, Gussing has 80% andCarbo V has 95%.
In figure 3.34 it is seen that the data from the SRK equation of state has higher values thanthe ideal gas equation of state when there is much DME in the gas. Earlier in the report it isseen that the ideal gas equation of state has higher values than the SRK equation of state whenthere is little amounts of DME in the gas (see figure 2.9). It is a interesting perspective, that thetheoretic better equation of state indicates that more DME is condensed. This should of coursebe checked with experiments, but the method has been verified by Georgios Kontogeorgis fromthe IVC-SEP research group.
With DME contents at this level a condensation column different from the refrigerator/freezersolution can be used. Acceptable percentages are condensed at 0 ◦C. Hence problems with icecan be avoided. Although this means that the DME must be separated from water and methanolafterwards (e.g. by lowering the pressure, because DME is a gas at normal temperature andpressure).
Page 69 of 76
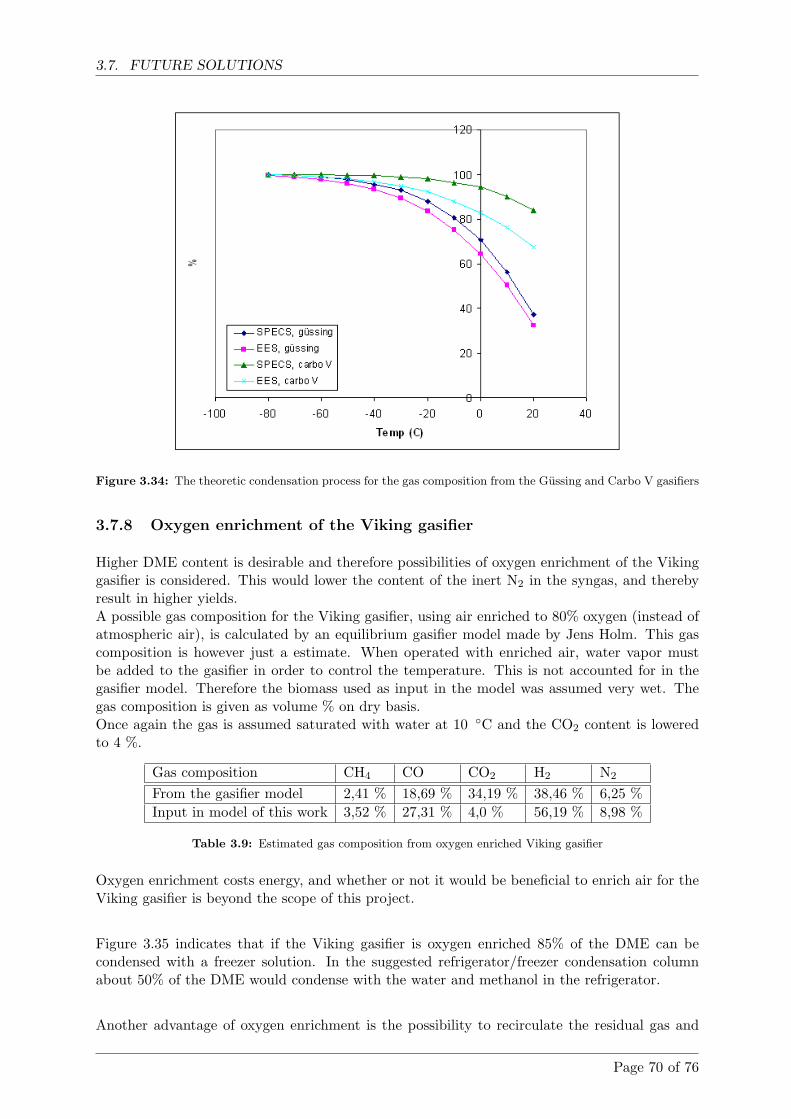
3.7. FUTURE SOLUTIONS
Figure 3.34: The theoretic condensation process for the gas composition from the Gussing and Carbo V gasifiers
3.7.8 Oxygen enrichment of the Viking gasifier
Higher DME content is desirable and therefore possibilities of oxygen enrichment of the Vikinggasifier is considered. This would lower the content of the inert N2 in the syngas, and therebyresult in higher yields.A possible gas composition for the Viking gasifier, using air enriched to 80% oxygen (instead ofatmospheric air), is calculated by an equilibrium gasifier model made by Jens Holm. This gascomposition is however just a estimate. When operated with enriched air, water vapor mustbe added to the gasifier in order to control the temperature. This is not accounted for in thegasifier model. Therefore the biomass used as input in the model was assumed very wet. Thegas composition is given as volume % on dry basis.Once again the gas is assumed saturated with water at 10 ◦C and the CO2 content is loweredto 4 %.
Gas composition CH4 CO CO2 H2 N2
From the gasifier model 2,41 % 18,69 % 34,19 % 38,46 % 6,25 %Input in model of this work 3,52 % 27,31 % 4,0 % 56,19 % 8,98 %
Table 3.9: Estimated gas composition from oxygen enriched Viking gasifier
Oxygen enrichment costs energy, and whether or not it would be beneficial to enrich air for theViking gasifier is beyond the scope of this project.
Figure 3.35 indicates that if the Viking gasifier is oxygen enriched 85% of the DME can becondensed with a freezer solution. In the suggested refrigerator/freezer condensation columnabout 50% of the DME would condense with the water and methanol in the refrigerator.
Another advantage of oxygen enrichment is the possibility to recirculate the residual gas and
Page 70 of 76
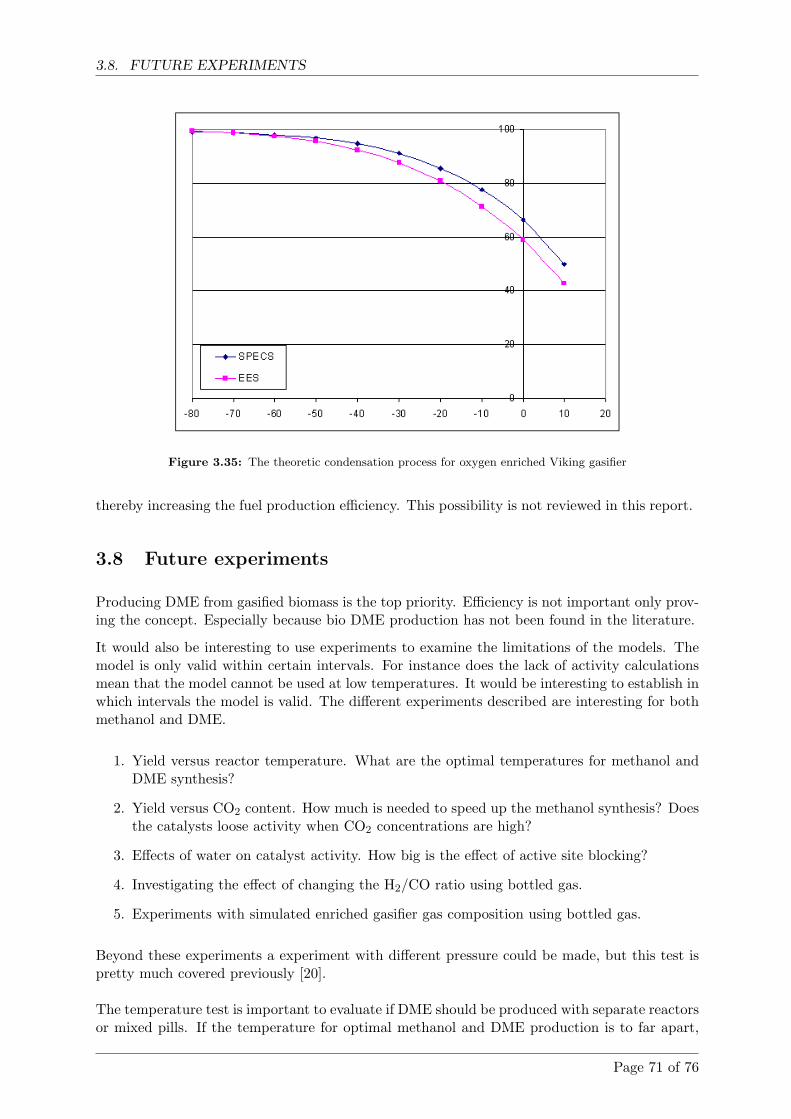
3.8. FUTURE EXPERIMENTS
Figure 3.35: The theoretic condensation process for oxygen enriched Viking gasifier
thereby increasing the fuel production efficiency. This possibility is not reviewed in this report.
3.8 Future experiments
Producing DME from gasified biomass is the top priority. Efficiency is not important only prov-ing the concept. Especially because bio DME production has not been found in the literature.
It would also be interesting to use experiments to examine the limitations of the models. Themodel is only valid within certain intervals. For instance does the lack of activity calculationsmean that the model cannot be used at low temperatures. It would be interesting to establish inwhich intervals the model is valid. The different experiments described are interesting for bothmethanol and DME.
1. Yield versus reactor temperature. What are the optimal temperatures for methanol andDME synthesis?
2. Yield versus CO2 content. How much is needed to speed up the methanol synthesis? Doesthe catalysts loose activity when CO2 concentrations are high?
3. Effects of water on catalyst activity. How big is the effect of active site blocking?
4. Investigating the effect of changing the H2/CO ratio using bottled gas.
5. Experiments with simulated enriched gasifier gas composition using bottled gas.
Beyond these experiments a experiment with different pressure could be made, but this test ispretty much covered previously [20].
The temperature test is important to evaluate if DME should be produced with separate reactorsor mixed pills. If the temperature for optimal methanol and DME production is to far apart,
Page 71 of 76

3.8. FUTURE EXPERIMENTS
the solution with to reactors seems better (cf. section 2.4). But this experiments cannot be donewithout having to reactors, therefore a literature study must decide how large the difference isbetween optimum methanol and DME process temperature. The experiment is however stillinteresting to verify model and literature study.
Calculations has showed that much cooling is needed to condense DME, when the amount ofDME in the gas is small. Therefore solutions towards more DME in the gas is interesting. Butbefore trying to solve this problem it is necessary to make practical tests to ensure the effect onthe condensation process with more DME in the gas. These experiments should be done frombottle gas, because it is fairly easy and then the gas composition could be totally controlled andthe desired parameters could be checked.
Page 72 of 76
Chapter 4
Conclusion
ExperimentsMethanol was successfully produced directly from gasified biomass from the Viking gasifier.DME production was not tested because of practical obstacles and limited time. Improvedcleaning devices and another condensation column is needed to produce DME.
Many practical problems arose during the project. These problems delayed the entire project.This shows that unforeseen things can easily happen during experiments and that externalfactors can affect the time schedule.
The CO2 scrubber with pills of potassium hydroxide did not work as intended. Water is createdin the reaction between the CO2 and the potassium hydroxide. Heating the gas prior to thereaction was supposed to evaporate this water. This did not work. Instead the potassiumhydroxide became liquid and floated to the bottom of the scrubber, where it had no effect.
It is possible to produce methanol without removing the CO2. This is however very ineffective.The production decreases about 80% with 14 % CO2 in the gas instead of 2 %.
Experiments showed that chemical equilibrium in the methanol reactor is not reached with flowshigher than 0,75 Nm3/h.
Theoretic modelThe prevalent theory is basis for the created models of the methanol and DME production. Themodel has been verified by a literature study and compared to practical experiments.The created model has large deviations from the experimental results.
An investigation indicates that it is the measured temperature of the methanol synthesis andnot the model, that is the main source of error.
The model uses the ideal gas equation of state which is verified with the theoretic better Soave-Redlich-Kwong (SRK) equation of state. The ideal gas equation is a good assumption for theused gas composition, different operating temperatures and pressures. Even in the two phasearea the ideal gas equation has acceptable deviation from the SRK equation of state comparedto other sources of error.
LiteratureIt is concluded from the literature study that DME has many interesting perspectives.
DME is versatile, it can be used for many different things and can be produced in various ways.
73
The main purposes for DME is as aerosol propellant, in gas turbines, for cooking, heating, toproduce olefins and as engine fuel.
Bio DME (DME produced from biomass) has many interesting properties as diesel engine fuel. Ithas a minimum of emissions, is CO2 neutral and have the best well to wheel efficiency comparedwith the other alternative bio fuels.
There are some problems with implementing DME as a diesel engine fuel. Especially the distri-bution net and engine lubrication are problems that needs to be solved.
Project perspectivesWith the model and the literature study it has been possible to evaluate the important param-eters in order to further develop the methanol facility to produce DME. The model is used toevaluate the condensation process for DME. The amount of DME in the gas after synthesis isso small that the gas must cooled to below -50 ◦C if more than 80% to be condensed.
Solutions to increase the percentage of DME in the gas is interesting, because then the conden-sation process takes place at higher temperatures.In the literature examples of such solutions was found. Oxygen enrichments of the Viking gasi-fier could lower the amount of nitrogen in the gas and thereby increasing the partial pressure ofDME. If this is practical possible 85% DME could be condensed at -25 ◦C.
Page 74 of 76
Bibliography
[1] Ni Weidou, Tan Lijian, Fang Dewei (Tsinghua University) , Rational Cognition of DMEMarket in China, www.aboutdme.org
[2] Dansk Energi and Cowi, Anvendelse af biomasse i transportsektoren, DTU 2006
[3] D.W. Gill and H. Ofner, DME as an Automotive Fuel, 9 th IEA workshop, 2001
[4] Teknologiradet, Morgendagens transportbrændstoffer. Danske perspektiver, 2006
[5] Nils Elam, Automotive Fuels Survey: Raw Materials and Conversion. vol. 1, IEA/AFIS,1996
[6] Professor Spencer C. Sorenson, Engine Principles and Vehicles, DTU 2006
[7] Peter Ahlvik and Ake Brandberg, WELL-TO-WHEEL EFFICIENCY For alternative fuelsfromnatural gas or biomass, Ecotraffic, Swedish National Road Administration, 2001
[8] Visit at IRD A/S, january 2007
[9] Carlo N. Hamelinck, Andre P.C. Faaij, Herman den Uil and Harold Boerrigter, Productionof FT transportation fuels from biomass; technical options, process analysis and optimisa-tion, and development potential, Sciencedirect 2003
[10] Hubert de Mestier du Bourg, FUTURE PROSPECTIVE OF DME, 23rd World Gas Con-ference, Amsterdam 2006
[11] Totaro Ohno, New Clean Fuel DME, DeWitt Global Methanol and MTBE Conference,2006
[12] HUANG Zhen, An Overview of DME Activities in China, 2nd International DME Confer-ence, 2006
[13] Jim McCandless, DME as an automotive fuel: Technical, Economic and Social perspektives,Energy Frontiers Conference, 2001
[14] Arun Basu, Mike Gradassi, Ron Sills, Theo Fleisch and Raj Puri, Use of DME as a GasTurbine Fuel, BP Exploration, 2001
[15] Robert H. Williams, TOWARD A GLOBAL CLEAN COOKING FUEL INITIATIVE,2nd International DME Conference in London 2006
[16] Troy A. Semelsberger, Rodney L. Borup and Howard L. Greene, Dimethyl ether (DME)as an alternative fuel, Journal of Power Sources - Elsevier, 2005
[17] J. Wu, Z. Huang, X. Qiao, J. Lu, L. Zhang and J. Zhang, Combustion and EmissionCharacteristics of a Turbocharged Diesel Engine Fuelled with Dimethyl Ether, 2006
75
BIBLIOGRAPHY
[18] From the DTU eco cars homepage, http://www.ecocar.dk/, 2007
[19] Henrik Landalv, Volvo Powertrain Corporation, Heavy Duty DME vehicles, 2005
[20] Henrik Laudal Iversen, Produktion af flydende biobrændsler udfra biomasse, DTU 2006
[21] P.L. Spath and D.C. Dayton, Preliminary Screening — Technical and Economic Assess-ment of Synthesis Gas to Fuels and Chemicals with Emphasis on the Potential for Biomass-Derived Syngas, 2003
[22] Raymond Chang, General Chemistry, McGraw-Hill, 2006
[23] J.D. Seader, Ernest J. Henley, SEPARATION PROCESS PRINCIPLES, John Wiley &Sons, INC., 1998
[24] Walas, APhase Equilibria in Chemical Engineering, Betterworth-Heinemann 1985
[25] D.P. Tassios, Applied Chemical Engineering Thermodynamics, Springer-Verlag, 1993
[26] Chorng H. Twu*, John E. Coon, and David Bluck, A Comparison of the Peng-Robinsonand Soave-Redlich-Kwong Equations of State Using a New Zero-Pressure-Based MixingRule for the Prediction of High Pressure and High Temperature Phase Equilibria, Simula-tion Sciences Inc.
[27] Conversations with Kaj Thomsen and Georgios Kontogeorgis , IVC-SEP research groupwitin chemical engineering
[28] H. Knapp, R. Doring, L. Dellrich, U. Plocker, J.M. Prausnite, Vapor - Liquid Equilibriafor mixtures of low boiling substances, Dechema
[29] Robert C. Reid, John M. Prausnitz and Bruce E. Poling, The Properties of Gases andLiquids 4.th edt., 1987
[30] Poul Scheel Larsen, TEKNISK TERMODYNAMIK, DTU-tryk 2005
[31] NASA Thermo build, http://cea.grc.nasa.gov/, 2005
[32] Guangxin Jia, Yisheng Tan and Yizhuo Han, A Comparative Study on the Thermodynamicsof Dimethyl Ether Synthesis from CO Hydrogenation and CO2 Hydrogenation, 2006
[33] C. Mas, E. Dinjus, H. Ederer, E. Henrich and C. Renk, Dehydration of methanol toDimethylether
[34] Javier Erena, Raul Garona, Jose M. Arandes, Andres T. Aguayo, Javier Bilbao, Ef-fect of operating conditions on the synthesis of dimethyl ether over a CuO − ZnO −Al2O3/NaHZSM − 5 bifunctional catalyst, 2005
[35] AIRLOQ notes from FLSmith
[36] Conversation with Joachim Paul, Professor, DTU
[37] Conversations with Anker Degn Jensen, lecturer at DTU and co-supervisor on this project
Page 76 of 76
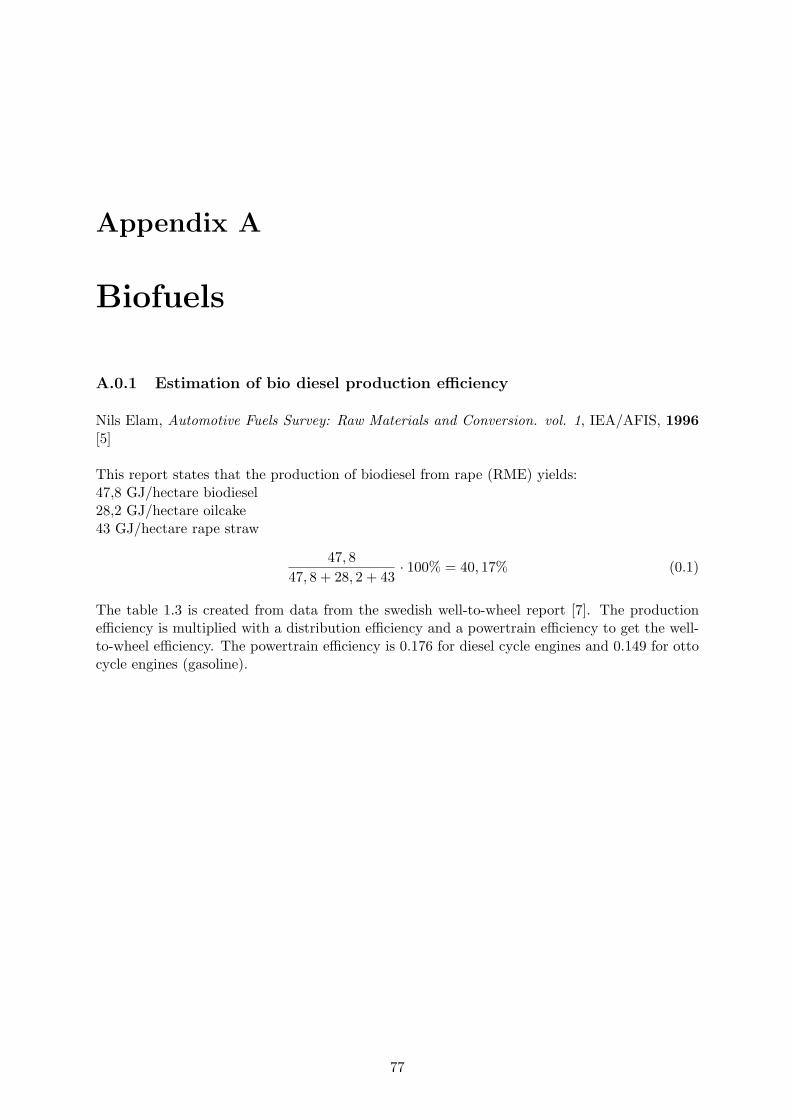
Appendix A
Biofuels
A.0.1 Estimation of bio diesel production efficiency
Nils Elam, Automotive Fuels Survey: Raw Materials and Conversion. vol. 1, IEA/AFIS, 1996[5]
This report states that the production of biodiesel from rape (RME) yields:47,8 GJ/hectare biodiesel28,2 GJ/hectare oilcake43 GJ/hectare rape straw
47, 847, 8 + 28, 2 + 43
· 100% = 40, 17% (0.1)
The table 1.3 is created from data from the swedish well-to-wheel report [7]. The productionefficiency is multiplied with a distribution efficiency and a powertrain efficiency to get the well-to-wheel efficiency. The powertrain efficiency is 0.176 for diesel cycle engines and 0.149 for ottocycle engines (gasoline).
77
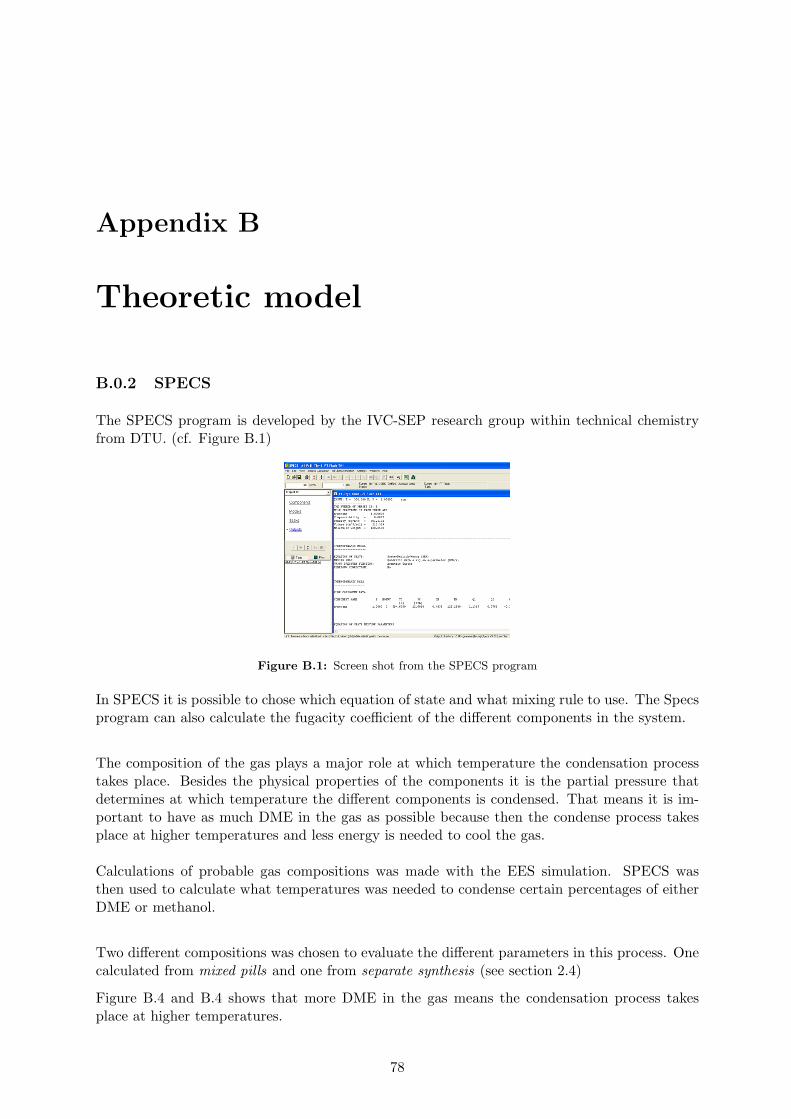
Appendix B
Theoretic model
B.0.2 SPECS
The SPECS program is developed by the IVC-SEP research group within technical chemistryfrom DTU. (cf. Figure B.1)
Figure B.1: Screen shot from the SPECS program
In SPECS it is possible to chose which equation of state and what mixing rule to use. The Specsprogram can also calculate the fugacity coefficient of the different components in the system.
The composition of the gas plays a major role at which temperature the condensation processtakes place. Besides the physical properties of the components it is the partial pressure thatdetermines at which temperature the different components is condensed. That means it is im-portant to have as much DME in the gas as possible because then the condense process takesplace at higher temperatures and less energy is needed to cool the gas.
Calculations of probable gas compositions was made with the EES simulation. SPECS wasthen used to calculate what temperatures was needed to condense certain percentages of eitherDME or methanol.
Two different compositions was chosen to evaluate the different parameters in this process. Onecalculated from mixed pills and one from separate synthesis (see section 2.4)
Figure B.4 and B.4 shows that more DME in the gas means the condensation process takesplace at higher temperatures.
78
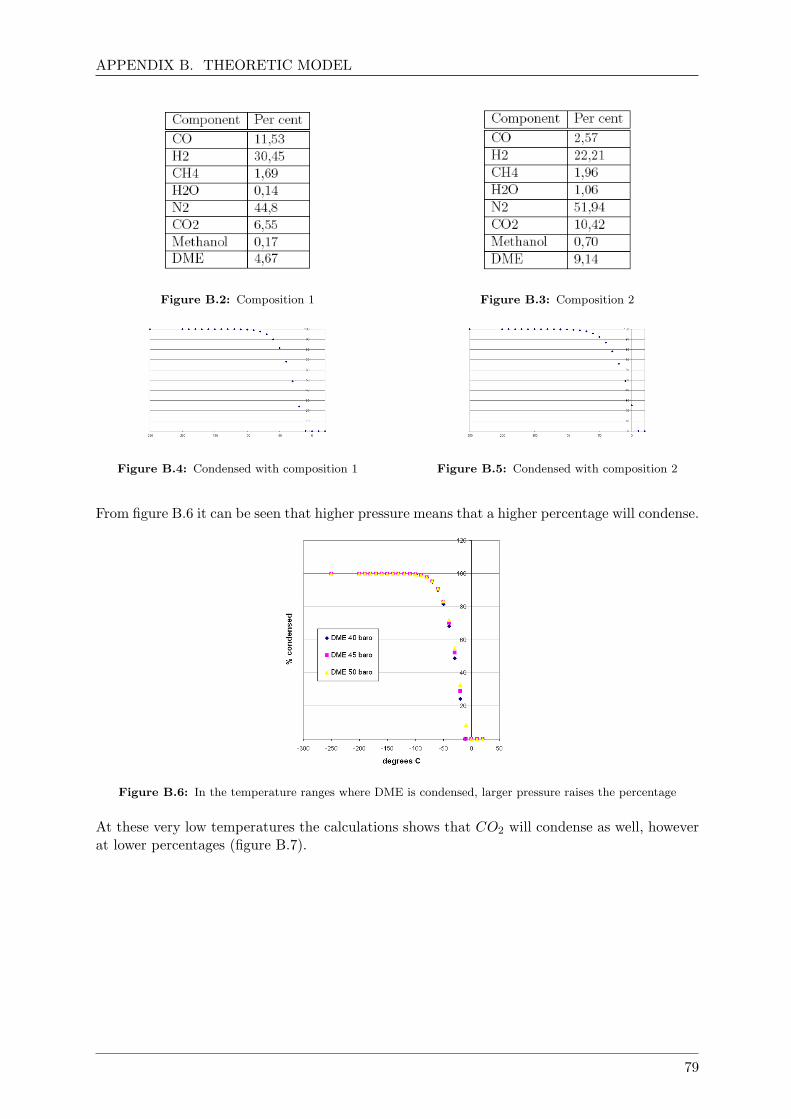
APPENDIX B. THEORETIC MODEL
Figure B.2: Composition 1 Figure B.3: Composition 2
Figure B.4: Condensed with composition 1 Figure B.5: Condensed with composition 2
From figure B.6 it can be seen that higher pressure means that a higher percentage will condense.
Figure B.6: In the temperature ranges where DME is condensed, larger pressure raises the percentage
At these very low temperatures the calculations shows that CO2 will condense as well, howeverat lower percentages (figure B.7).
79
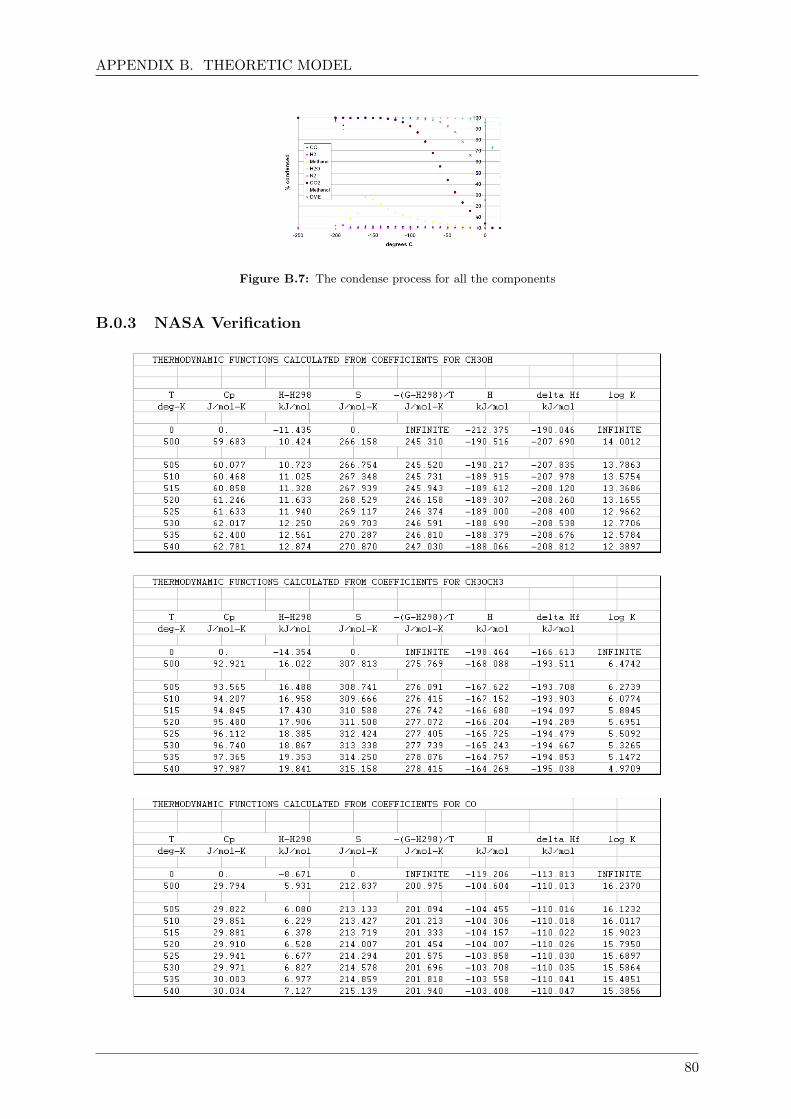
APPENDIX B. THEORETIC MODEL
Figure B.7: The condense process for all the components
B.0.3 NASA Verification
80
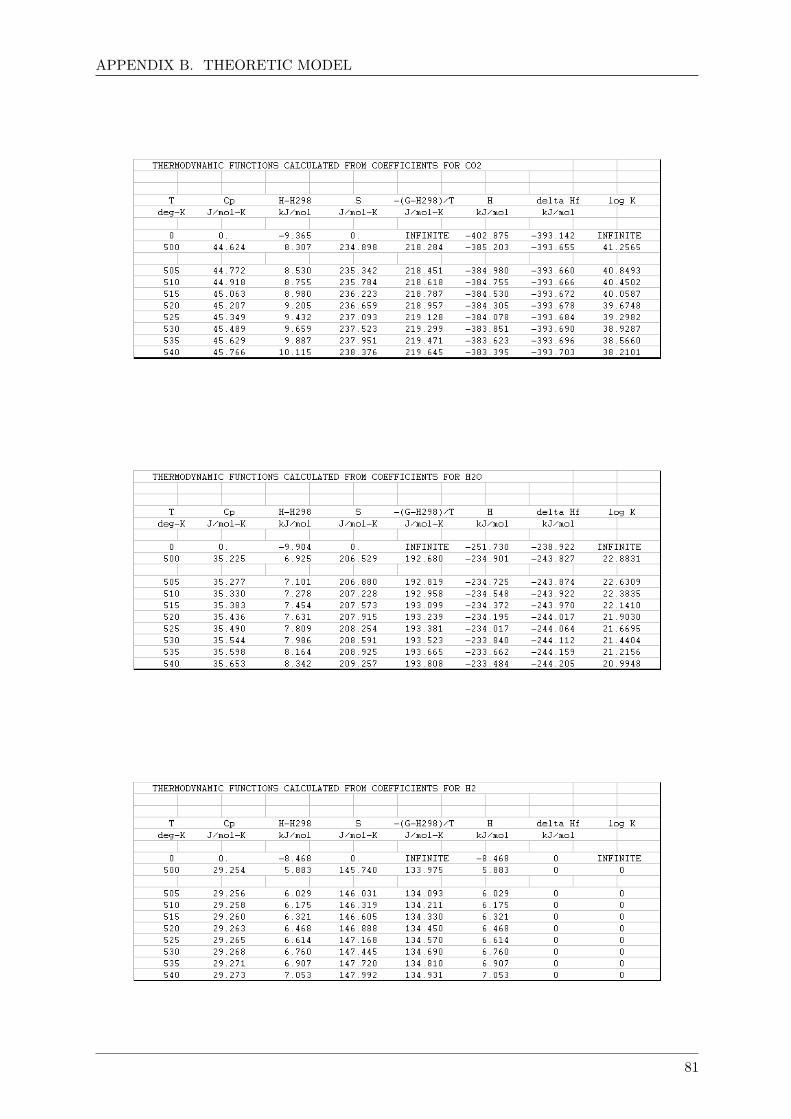
APPENDIX B. THEORETIC MODEL
81
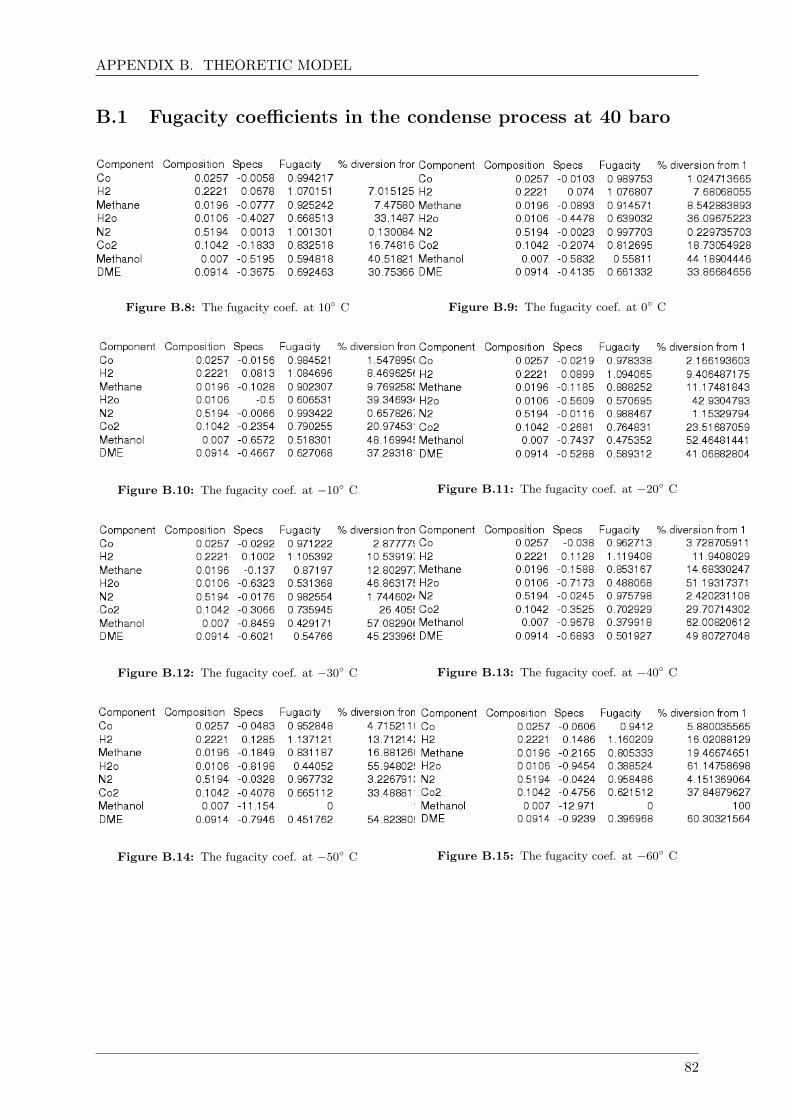
APPENDIX B. THEORETIC MODEL
B.1 Fugacity coefficients in the condense process at 40 baro
Figure B.8: The fugacity coef. at 10◦ C Figure B.9: The fugacity coef. at 0◦ C
Figure B.10: The fugacity coef. at −10◦ C Figure B.11: The fugacity coef. at −20◦ C
Figure B.12: The fugacity coef. at −30◦ C Figure B.13: The fugacity coef. at −40◦ C
Figure B.14: The fugacity coef. at −50◦ C Figure B.15: The fugacity coef. at −60◦ C
82
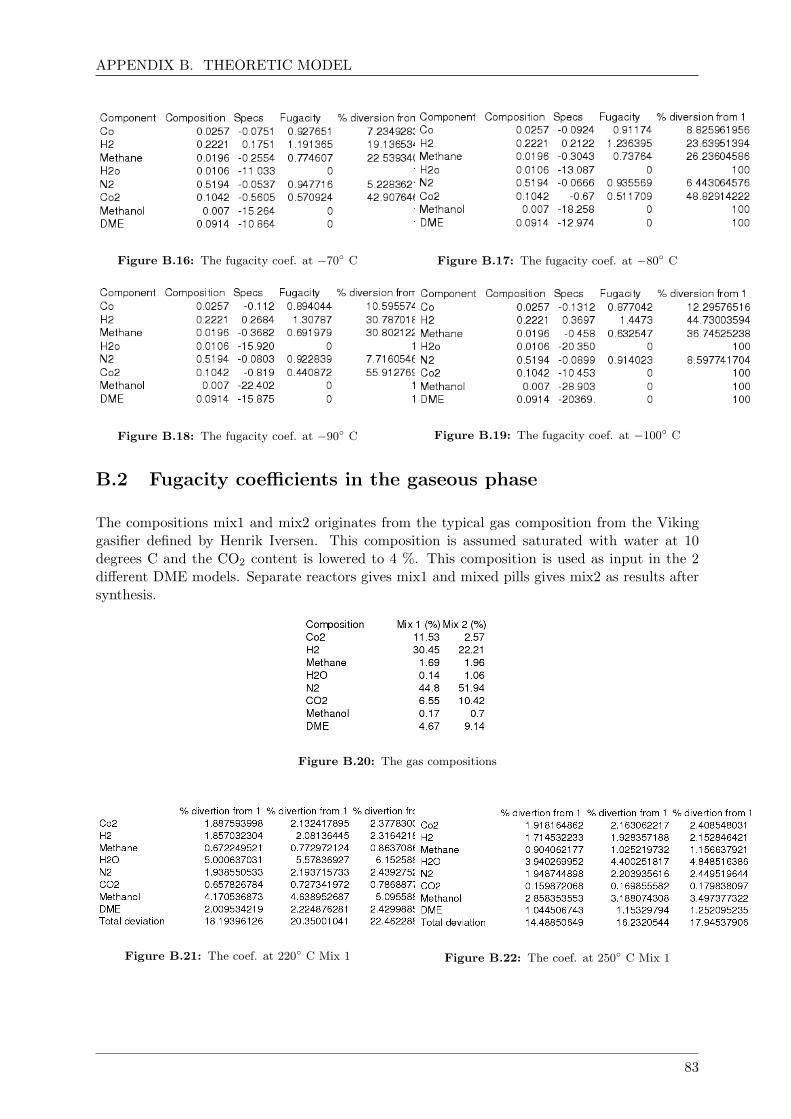
APPENDIX B. THEORETIC MODEL
Figure B.16: The fugacity coef. at −70◦ C Figure B.17: The fugacity coef. at −80◦ C
Figure B.18: The fugacity coef. at −90◦ C Figure B.19: The fugacity coef. at −100◦ C
B.2 Fugacity coefficients in the gaseous phase
The compositions mix1 and mix2 originates from the typical gas composition from the Vikinggasifier defined by Henrik Iversen. This composition is assumed saturated with water at 10degrees C and the CO2 content is lowered to 4 %. This composition is used as input in the 2different DME models. Separate reactors gives mix1 and mixed pills gives mix2 as results aftersynthesis.
Figure B.20: The gas compositions
Figure B.21: The coef. at 220◦ C Mix 1 Figure B.22: The coef. at 250◦ C Mix 1
83
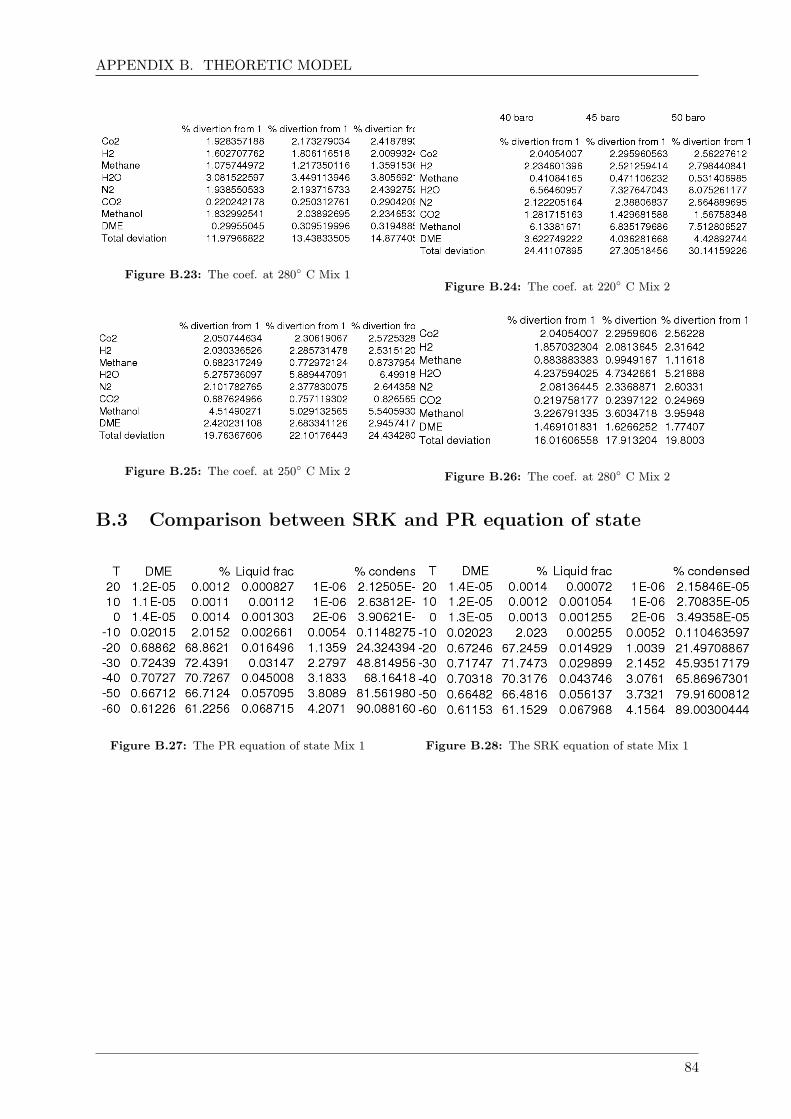
APPENDIX B. THEORETIC MODEL
Figure B.23: The coef. at 280◦ C Mix 1Figure B.24: The coef. at 220◦ C Mix 2
Figure B.25: The coef. at 250◦ C Mix 2 Figure B.26: The coef. at 280◦ C Mix 2
B.3 Comparison between SRK and PR equation of state
Figure B.27: The PR equation of state Mix 1 Figure B.28: The SRK equation of state Mix 1
84
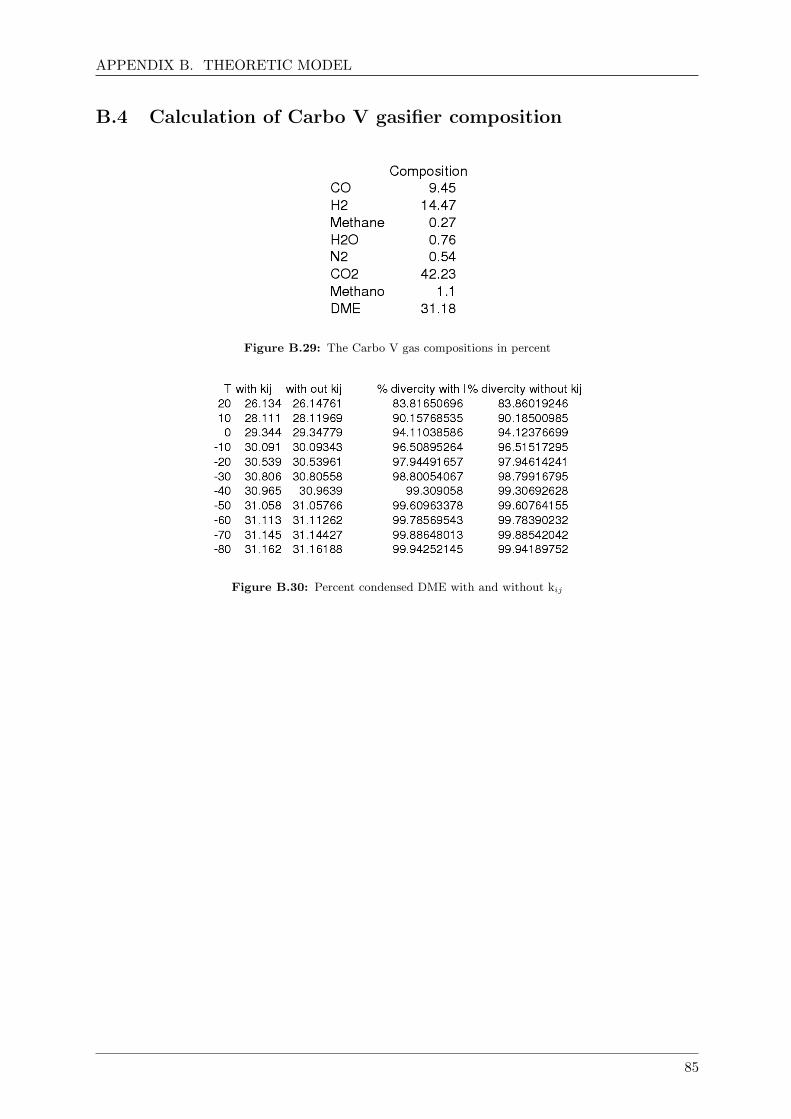
APPENDIX B. THEORETIC MODEL
B.4 Calculation of Carbo V gasifier composition
Figure B.29: The Carbo V gas compositions in percent
Figure B.30: Percent condensed DME with and without kij
85
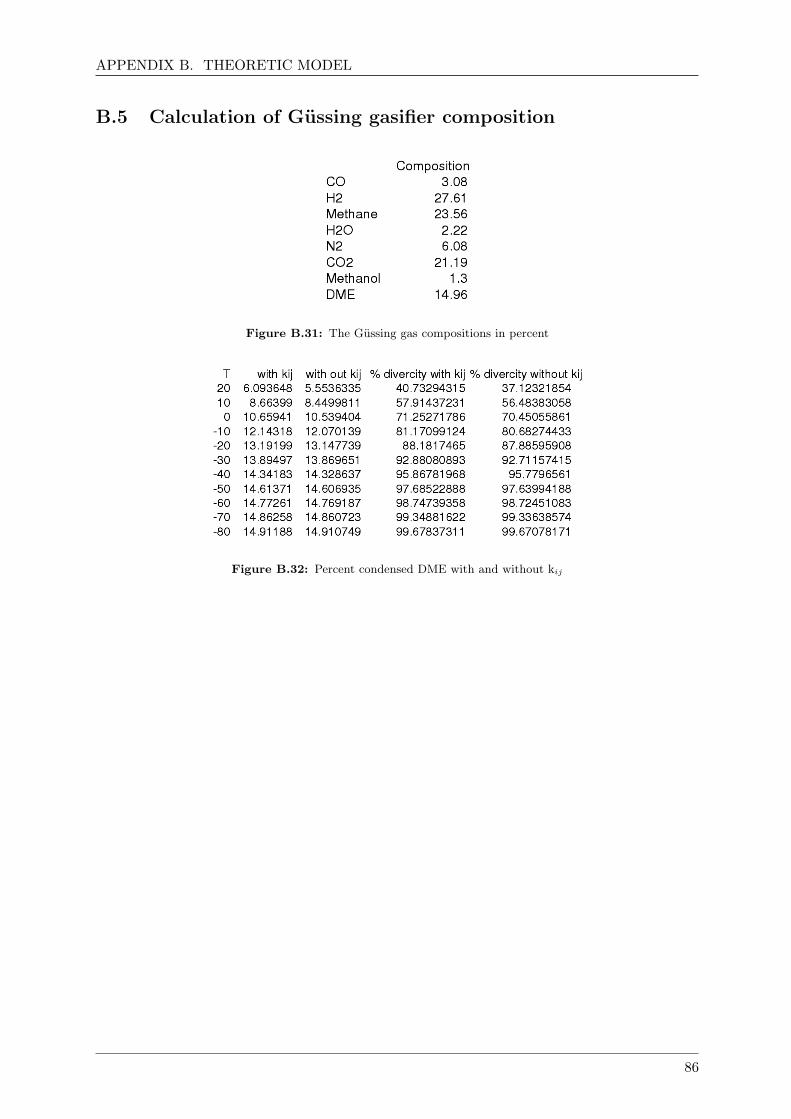
APPENDIX B. THEORETIC MODEL
B.5 Calculation of Gussing gasifier composition
Figure B.31: The Gussing gas compositions in percent
Figure B.32: Percent condensed DME with and without kij
86
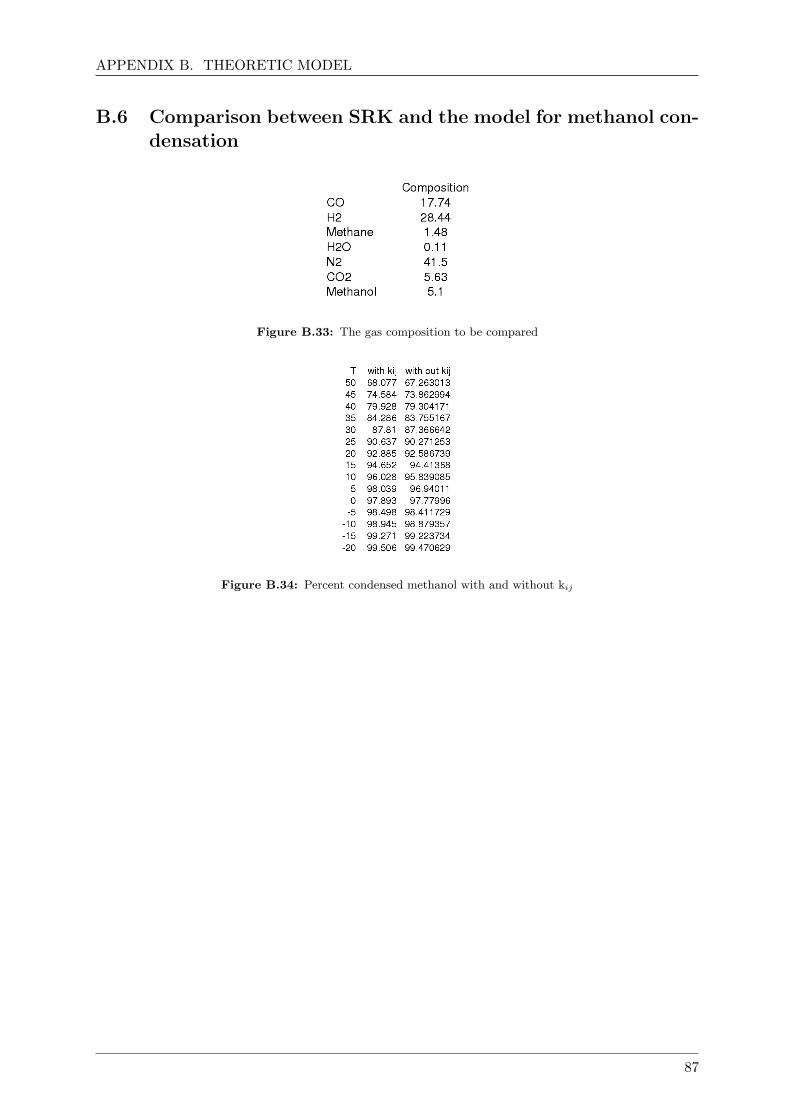
APPENDIX B. THEORETIC MODEL
B.6 Comparison between SRK and the model for methanol con-densation
Figure B.33: The gas composition to be compared
Figure B.34: Percent condensed methanol with and without kij
87
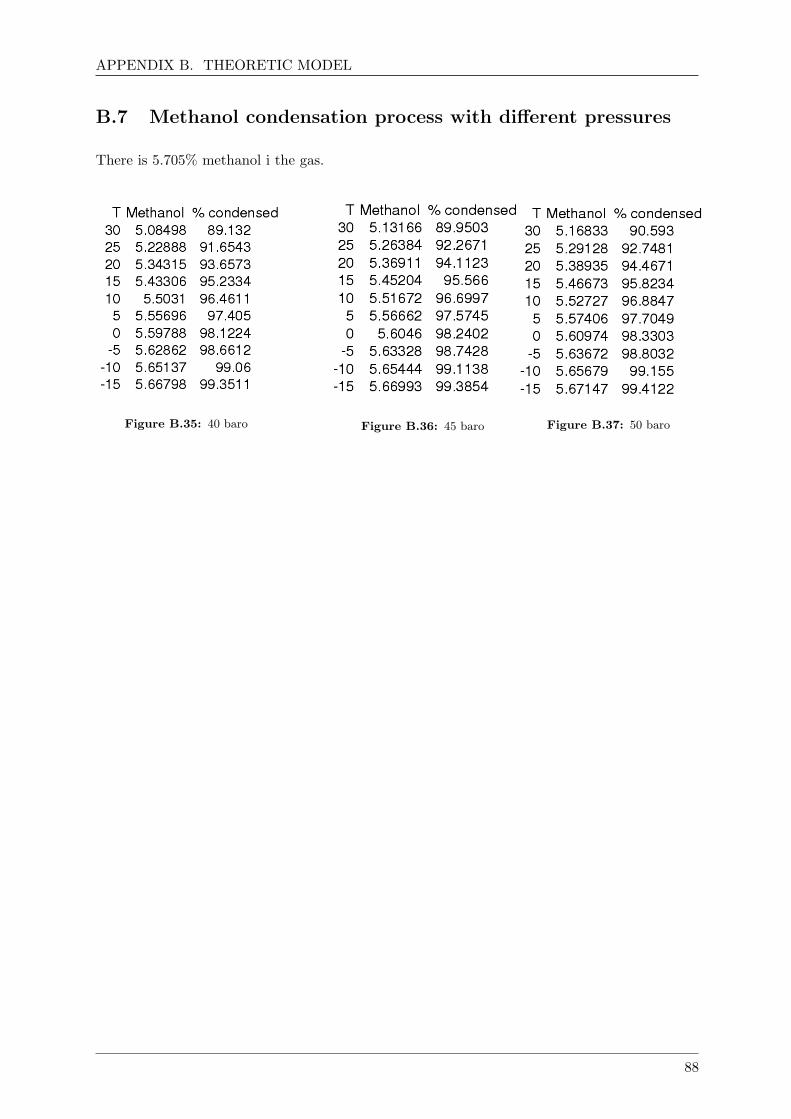
APPENDIX B. THEORETIC MODEL
B.7 Methanol condensation process with different pressures
There is 5.705% methanol i the gas.
Figure B.35: 40 baro Figure B.36: 45 baro Figure B.37: 50 baro
88
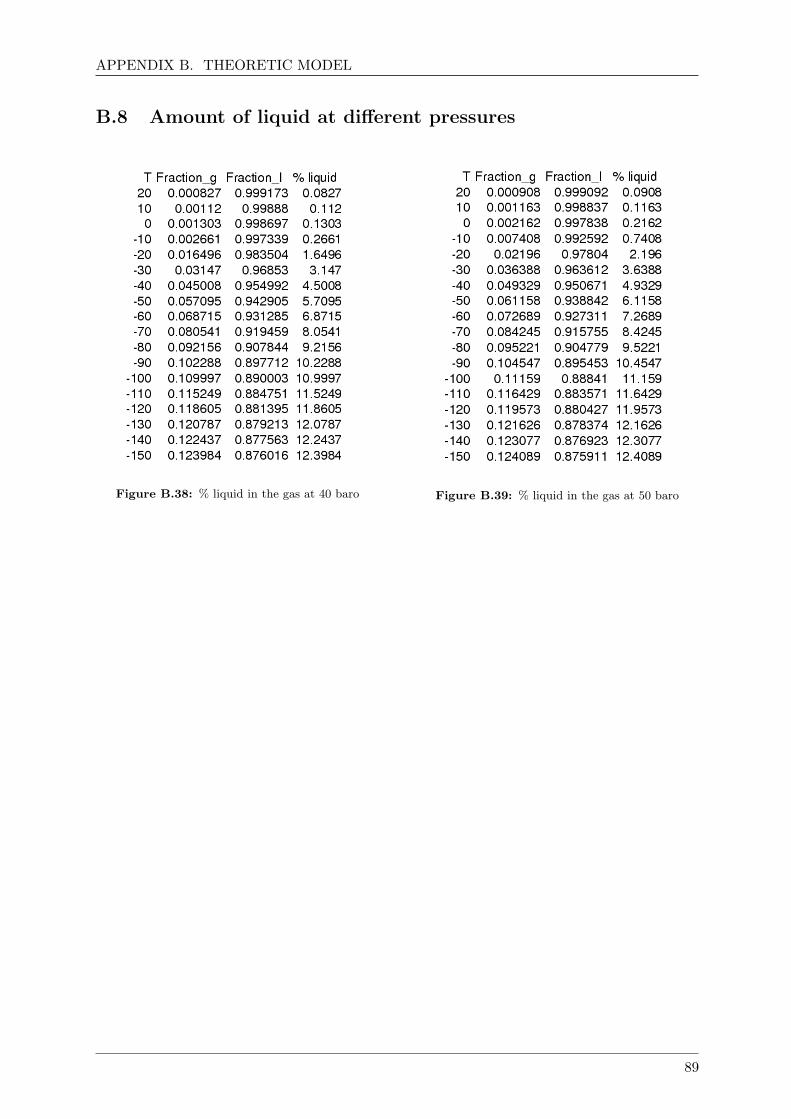
APPENDIX B. THEORETIC MODEL
B.8 Amount of liquid at different pressures
Figure B.38: % liquid in the gas at 40 baro Figure B.39: % liquid in the gas at 50 baro
89
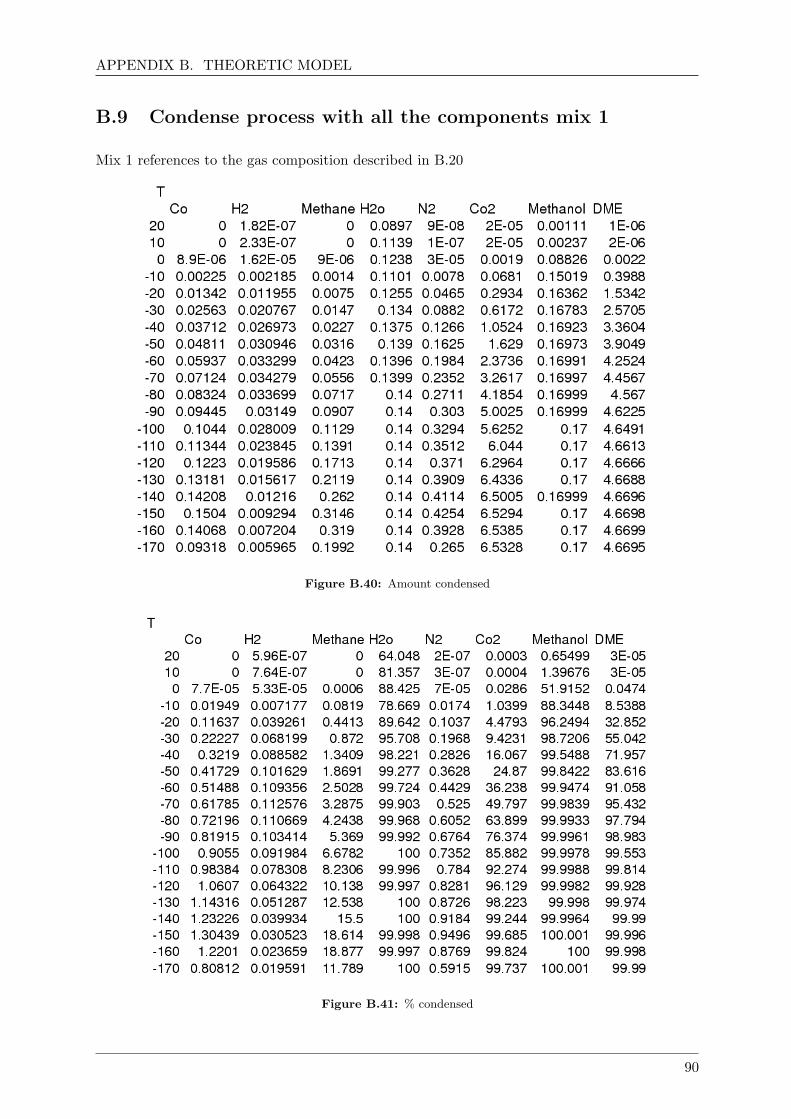
APPENDIX B. THEORETIC MODEL
B.9 Condense process with all the components mix 1
Mix 1 references to the gas composition described in B.20
Figure B.40: Amount condensed
Figure B.41: % condensed
90
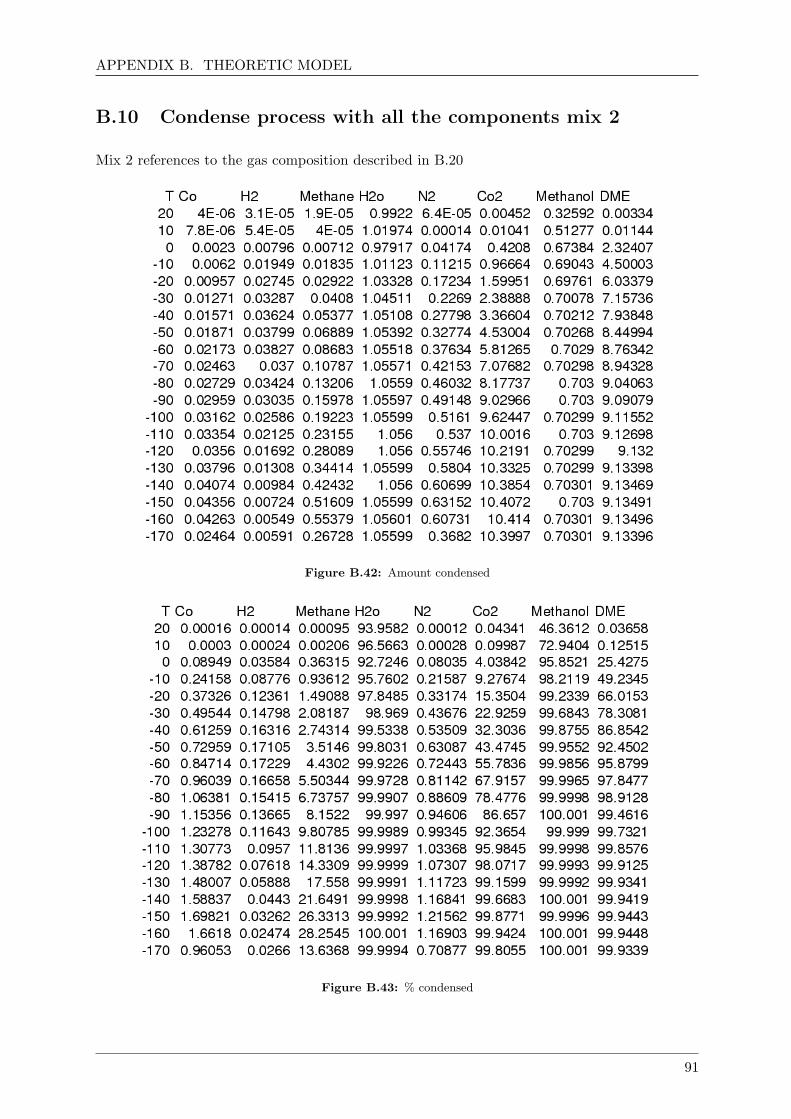
APPENDIX B. THEORETIC MODEL
B.10 Condense process with all the components mix 2
Mix 2 references to the gas composition described in B.20
Figure B.42: Amount condensed
Figure B.43: % condensed
91
Appendix C
Experiments
C.1 Test run
A test run was made to ensure that the facility has no leakages and it still could producemethanol from bottle gas. The output was not analyzed but it was flammable which should begood enough. (cf. brandtest under measuremnets!!!!)
C.1.1 Nitrogen test
Temperature settings: Heat blower in = 370 C, maximum air flow, Heat blower cl = 350 C,maximum air flow Blæser met = 270 C, level 5 air flow, Heat blower lag = 110 C, level 6 air flow
These settings gave the correct temperature for purest methanol production(cf. henriks ind-stillinger!!!!!)
The pressure before the facility was 45 baro.
Facility pressure = 40 bar, T oven 240 C
Flow = 30 p in = 235 mbaro p-out = 0,008 baro
The start of the experiment: Volume meter before the compressor = 6,231 m3, Volume me-ter on the residual gas = 0,771 m3
The end of the experiment: Volume meter before the compressor = 6,714 m3, Volume me-ter on the residual gas = 1,363 m3
Time = 35 min 58,38 sek
C.1.2 Methanol test from bottle gas d. 29/3
Gas composition: CH4 = 1,88 % H2 = 36,0 % CO2 = 1,96 % CO = 22,3 %
Temperature settings: Heat blower ind = 370 C, maximum air flow Blæser cl = 320 C, maxi-
92

APPENDIX C. EXPERIMENTS
mum air flow, Heat blower met = 250 C, maximum air flow, Heat blower lid = 120 C, level 6air flow
The start of the experiment: Volume meter before the compressor = 7,656 m3, Volume me-ter on the residual gas = 2,446 m3
he end of the experiment: Volume meter before the compressor = 8,258 m3, Volume meteron the residual gas = 3,023 m3
Time = 30 min 09,53 sek
Total methanol outcome: 14,60 g
93
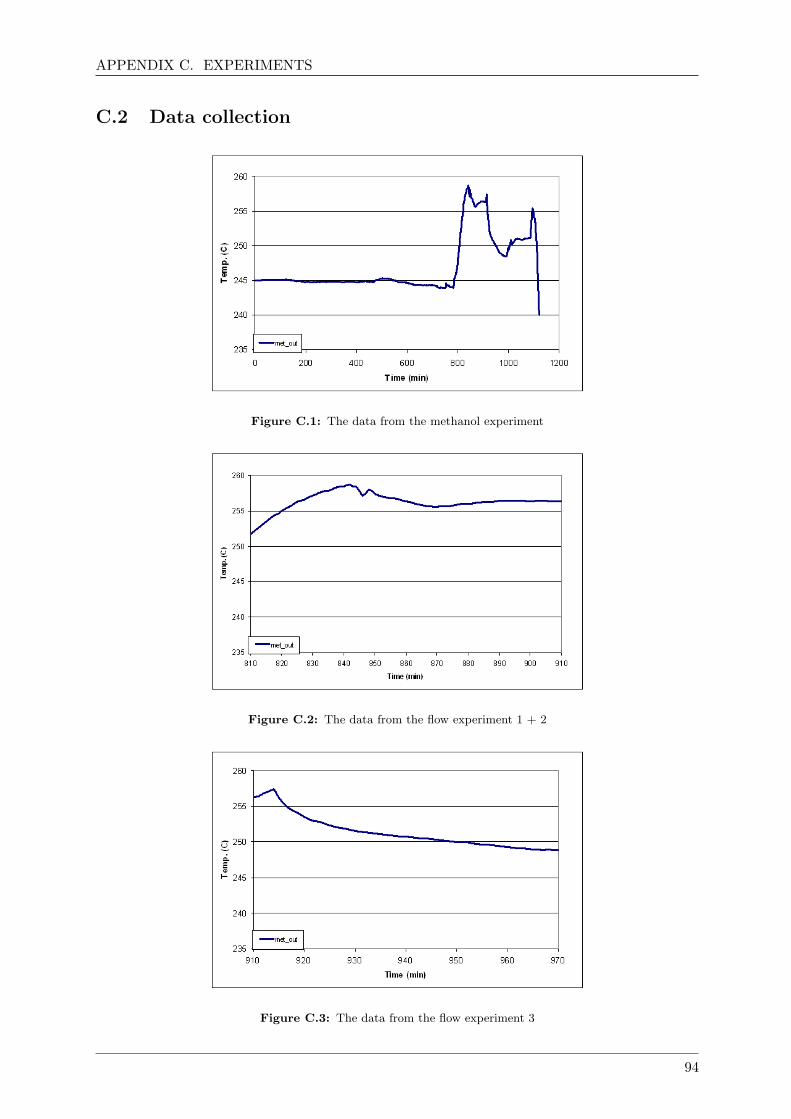
APPENDIX C. EXPERIMENTS
C.2 Data collection
Figure C.1: The data from the methanol experiment
Figure C.2: The data from the flow experiment 1 + 2
Figure C.3: The data from the flow experiment 3
94
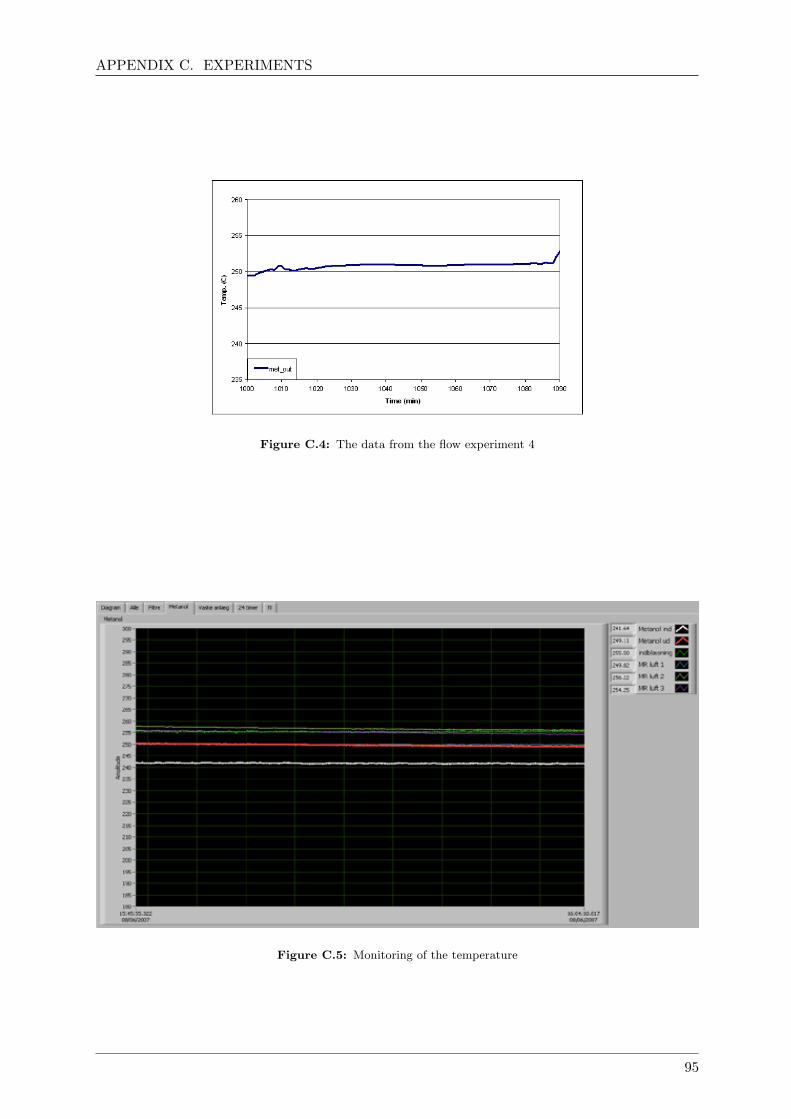
APPENDIX C. EXPERIMENTS
Figure C.4: The data from the flow experiment 4
Figure C.5: Monitoring of the temperature
95
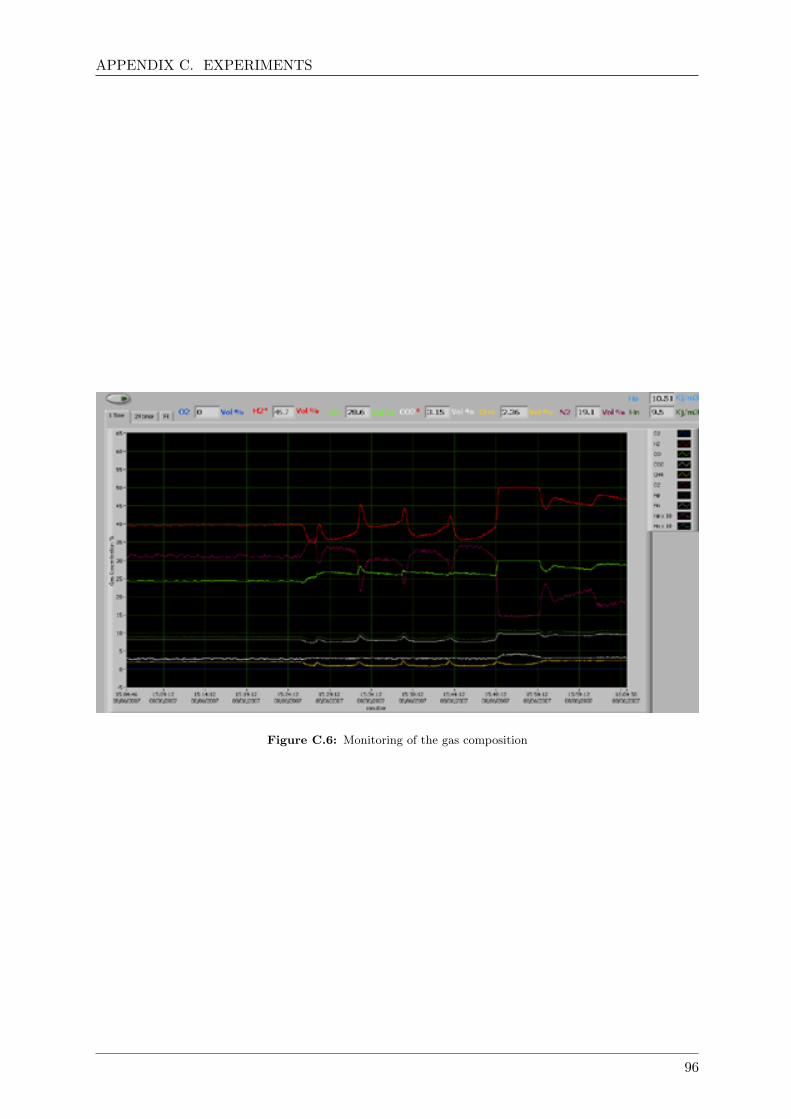
APPENDIX C. EXPERIMENTS
Figure C.6: Monitoring of the gas composition
96
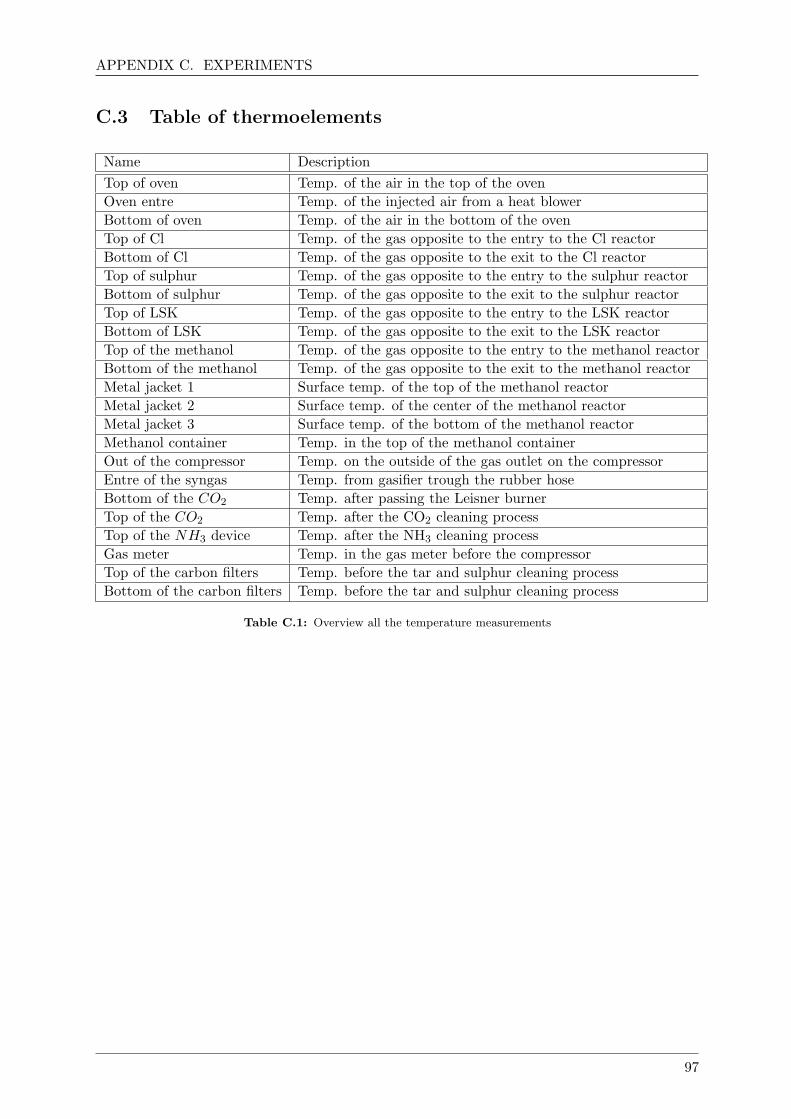
APPENDIX C. EXPERIMENTS
C.3 Table of thermoelements
Name DescriptionTop of oven Temp. of the air in the top of the ovenOven entre Temp. of the injected air from a heat blowerBottom of oven Temp. of the air in the bottom of the ovenTop of Cl Temp. of the gas opposite to the entry to the Cl reactorBottom of Cl Temp. of the gas opposite to the exit to the Cl reactorTop of sulphur Temp. of the gas opposite to the entry to the sulphur reactorBottom of sulphur Temp. of the gas opposite to the exit to the sulphur reactorTop of LSK Temp. of the gas opposite to the entry to the LSK reactorBottom of LSK Temp. of the gas opposite to the exit to the LSK reactorTop of the methanol Temp. of the gas opposite to the entry to the methanol reactorBottom of the methanol Temp. of the gas opposite to the exit to the methanol reactorMetal jacket 1 Surface temp. of the top of the methanol reactorMetal jacket 2 Surface temp. of the center of the methanol reactorMetal jacket 3 Surface temp. of the bottom of the methanol reactorMethanol container Temp. in the top of the methanol containerOut of the compressor Temp. on the outside of the gas outlet on the compressorEntre of the syngas Temp. from gasifier trough the rubber hoseBottom of the CO2 Temp. after passing the Leisner burnerTop of the CO2 Temp. after the CO2 cleaning processTop of the NH3 device Temp. after the NH3 cleaning processGas meter Temp. in the gas meter before the compressorTop of the carbon filters Temp. before the tar and sulphur cleaning processBottom of the carbon filters Temp. before the tar and sulphur cleaning process
Table C.1: Overview all the temperature measurements
97

Appendix D
Source code
D.1 Source code for the model
hej
98
118
Appendix B. Methanol/DME production based on the Two-Stage Gasifier
ISI Journal Paper Clausen LR, Elmegaard B, Ahrenfeldt J, Henriksen U. “Thermodynamic analysis of small-scale DME and methanol plants based on the efficient Two-stage gasifier”. Submitted to Energy (manuscript number: EGY-D-11-00180), 2011.
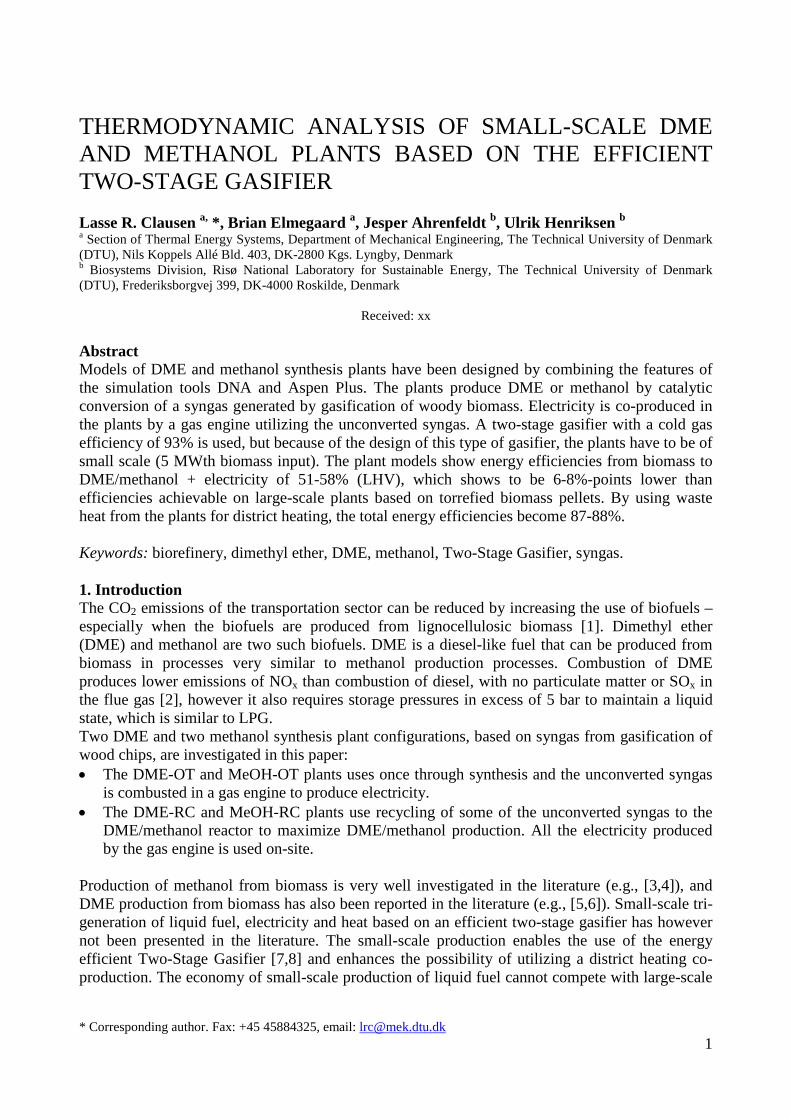
* Corresponding author. Fax: +45 45884325, email: [email protected] 1
THERMODYNAMIC ANALYSIS OF SMALL-SCALE DME AND METHANOL PLANTS BASED ON THE EFFICIENT TWO-STAGE GASIFIER Lasse R. Clausen a, *, Brian Elmegaard a, Jesper Ahrenfeldt b, Ulrik Henriksen b a Section of Thermal Energy Systems, Department of Mechanical Engineering, The Technical University of Denmark (DTU), Nils Koppels Allé Bld. 403, DK-2800 Kgs. Lyngby, Denmark b Biosystems Division, Risø National Laboratory for Sustainable Energy, The Technical University of Denmark (DTU), Frederiksborgvej 399, DK-4000 Roskilde, Denmark
Received: xx Abstract Models of DME and methanol synthesis plants have been designed by combining the features of the simulation tools DNA and Aspen Plus. The plants produce DME or methanol by catalytic conversion of a syngas generated by gasification of woody biomass. Electricity is co-produced in the plants by a gas engine utilizing the unconverted syngas. A two-stage gasifier with a cold gas efficiency of 93% is used, but because of the design of this type of gasifier, the plants have to be of small scale (5 MWth biomass input). The plant models show energy efficiencies from biomass to DME/methanol + electricity of 51-58% (LHV), which shows to be 6-8%-points lower than efficiencies achievable on large-scale plants based on torrefied biomass pellets. By using waste heat from the plants for district heating, the total energy efficiencies become 87-88%. Keywords: biorefinery, dimethyl ether, DME, methanol, Two-Stage Gasifier, syngas. 1. Introduction The CO2 emissions of the transportation sector can be reduced by increasing the use of biofuels – especially when the biofuels are produced from lignocellulosic biomass [1]. Dimethyl ether (DME) and methanol are two such biofuels. DME is a diesel-like fuel that can be produced from biomass in processes very similar to methanol production processes. Combustion of DME produces lower emissions of NOx than combustion of diesel, with no particulate matter or SOx in the flue gas [2], however it also requires storage pressures in excess of 5 bar to maintain a liquid state, which is similar to LPG. Two DME and two methanol synthesis plant configurations, based on syngas from gasification of wood chips, are investigated in this paper: • The DME-OT and MeOH-OT plants uses once through synthesis and the unconverted syngas
is combusted in a gas engine to produce electricity. • The DME-RC and MeOH-RC plants use recycling of some of the unconverted syngas to the
DME/methanol reactor to maximize DME/methanol production. All the electricity produced by the gas engine is used on-site.
Production of methanol from biomass is very well investigated in the literature (e.g., [3,4]), and DME production from biomass has also been reported in the literature (e.g., [5,6]). Small-scale tri-generation of liquid fuel, electricity and heat based on an efficient two-stage gasifier has however not been presented in the literature. The small-scale production enables the use of the energy efficient Two-Stage Gasifier [7,8] and enhances the possibility of utilizing a district heating co-production. The economy of small-scale production of liquid fuel cannot compete with large-scale
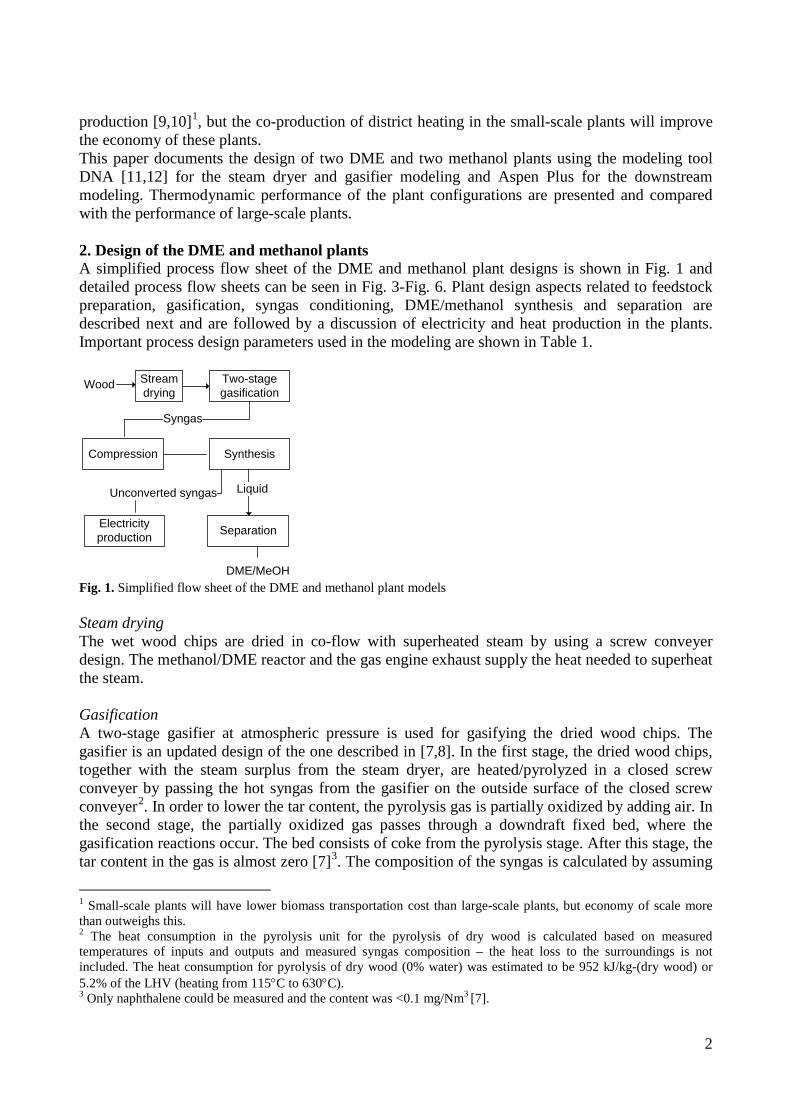
2
production [9,10]1
This paper documents the design of two DME and two methanol plants using the modeling tool DNA
, but the co-production of district heating in the small-scale plants will improve the economy of these plants.
[11,12] for the steam dryer and gasifier modeling and Aspen Plus for the downstream modeling. Thermodynamic performance of the plant configurations are presented and compared with the performance of large-scale plants. 2. Design of the DME and methanol plants A simplified process flow sheet of the DME and methanol plant designs is shown in Fig. 1 and detailed process flow sheets can be seen in Fig. 3-Fig. 6. Plant design aspects related to feedstock preparation, gasification, syngas conditioning, DME/methanol synthesis and separation are described next and are followed by a discussion of electricity and heat production in the plants. Important process design parameters used in the modeling are shown in Table 1.
Fig. 1. Simplified flow sheet of the DME and methanol plant models Steam drying The wet wood chips are dried in co-flow with superheated steam by using a screw conveyer design. The methanol/DME reactor and the gas engine exhaust supply the heat needed to superheat the steam. Gasification A two-stage gasifier at atmospheric pressure is used for gasifying the dried wood chips. The gasifier is an updated design of the one described in [7,8]. In the first stage, the dried wood chips, together with the steam surplus from the steam dryer, are heated/pyrolyzed in a closed screw conveyer by passing the hot syngas from the gasifier on the outside surface of the closed screw conveyer2
[7
. In order to lower the tar content, the pyrolysis gas is partially oxidized by adding air. In the second stage, the partially oxidized gas passes through a downdraft fixed bed, where the gasification reactions occur. The bed consists of coke from the pyrolysis stage. After this stage, the tar content in the gas is almost zero ]3
1 Small-scale plants will have lower biomass transportation cost than large-scale plants, but economy of scale more than outweighs this.
. The composition of the syngas is calculated by assuming
2 The heat consumption in the pyrolysis unit for the pyrolysis of dry wood is calculated based on measured temperatures of inputs and outputs and measured syngas composition – the heat loss to the surroundings is not included. The heat consumption for pyrolysis of dry wood (0% water) was estimated to be 952 kJ/kg-(dry wood) or 5.2% of the LHV (heating from 115°C to 630°C). 3 Only naphthalene could be measured and the content was <0.1 mg/Nm3 [7].
Two-stage gasification
Stream drying
Compression Synthesis
Syngas
Separation
Liquid
Electricity production
Wood
DME/MeOH
Unconverted syngas
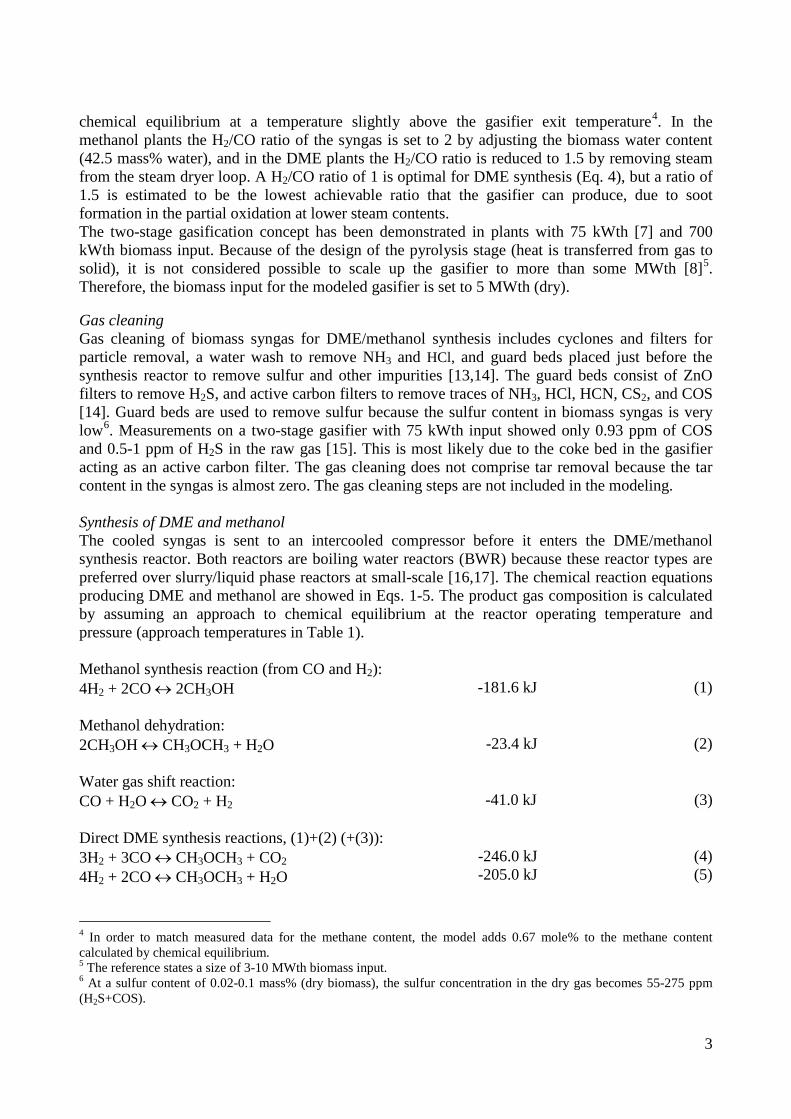
3
chemical equilibrium at a temperature slightly above the gasifier exit temperature4
The two-stage gasification concept has been demonstrated in plants with 75 kWth
. In the methanol plants the H2/CO ratio of the syngas is set to 2 by adjusting the biomass water content (42.5 mass% water), and in the DME plants the H2/CO ratio is reduced to 1.5 by removing steam from the steam dryer loop. A H2/CO ratio of 1 is optimal for DME synthesis (Eq. 4), but a ratio of 1.5 is estimated to be the lowest achievable ratio that the gasifier can produce, due to soot formation in the partial oxidation at lower steam contents.
[7] and 700 kWth biomass input. Because of the design of the pyrolysis stage (heat is transferred from gas to solid), it is not considered possible to scale up the gasifier to more than some MWth [8]5
. Therefore, the biomass input for the modeled gasifier is set to 5 MWth (dry).
Gas cleaning Gas cleaning of biomass syngas for DME/methanol synthesis includes cyclones and filters for particle removal, a water wash to remove NH3 and HCl, and guard beds placed just before the synthesis reactor to remove sulfur and other impurities [13,14]. The guard beds consist of ZnO filters to remove H2S, and active carbon filters to remove traces of NH3, HCl, HCN, CS2, and COS [14]. Guard beds are used to remove sulfur because the sulfur content in biomass syngas is very low6
[15. Measurements on a two-stage gasifier with 75 kWth input showed only 0.93 ppm of COS
and 0.5-1 ppm of H2S in the raw gas ]. This is most likely due to the coke bed in the gasifier acting as an active carbon filter. The gas cleaning does not comprise tar removal because the tar content in the syngas is almost zero. The gas cleaning steps are not included in the modeling. Synthesis of DME and methanol The cooled syngas is sent to an intercooled compressor before it enters the DME/methanol synthesis reactor. Both reactors are boiling water reactors (BWR) because these reactor types are preferred over slurry/liquid phase reactors at small-scale [16,17]. The chemical reaction equations producing DME and methanol are showed in Eqs. 1-5. The product gas composition is calculated by assuming an approach to chemical equilibrium at the reactor operating temperature and pressure (approach temperatures in Table 1). Methanol synthesis reaction (from CO and H2): 4H2 + 2CO ↔ 2CH3OH -181.6 kJ (1) Methanol dehydration: 2CH3OH ↔ CH3OCH3 + H2O -23.4 kJ (2) Water gas shift reaction: CO + H2O ↔ CO2 + H2 -41.0 kJ (3) Direct DME synthesis reactions, (1)+(2) (+(3)): 3H2 + 3CO ↔ CH3OCH3 + CO2 4H2 + 2CO ↔ CH3OCH3 + H2O
-246.0 kJ -205.0 kJ
(4) (5)
4 In order to match measured data for the methane content, the model adds 0.67 mole% to the methane content calculated by chemical equilibrium. 5 The reference states a size of 3-10 MWth biomass input. 6 At a sulfur content of 0.02-0.1 mass% (dry biomass), the sulfur concentration in the dry gas becomes 55-275 ppm (H2S+COS).
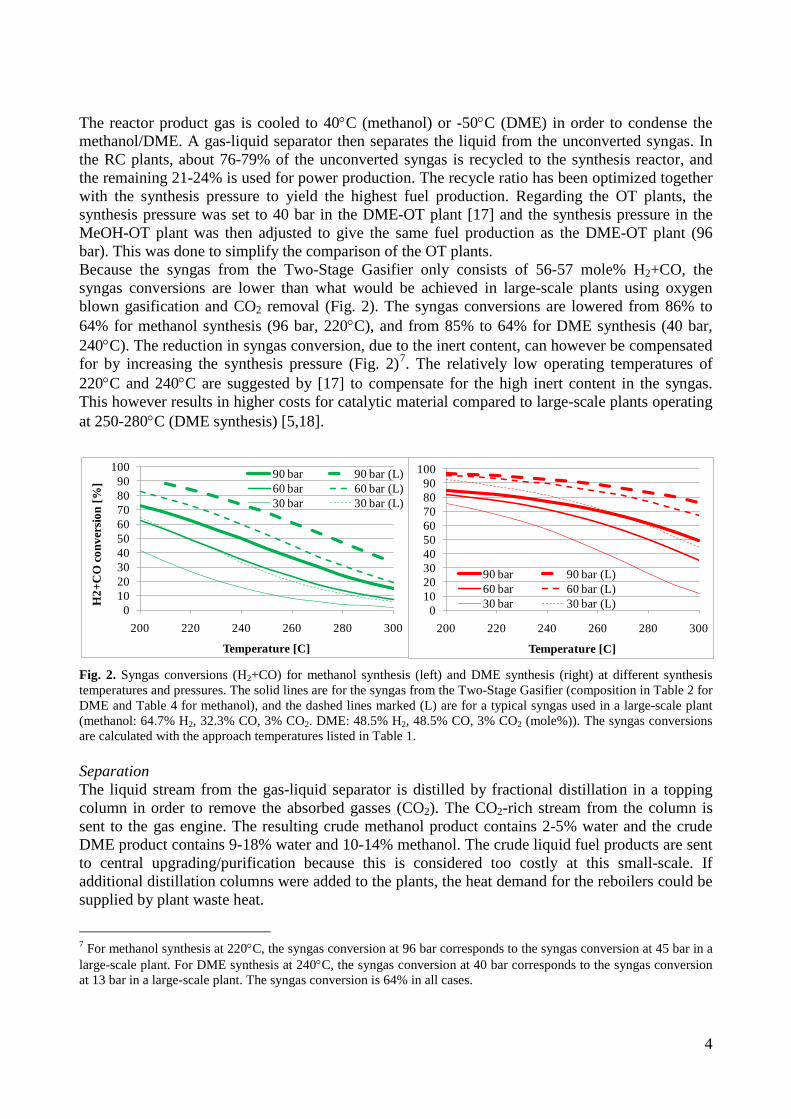
4
The reactor product gas is cooled to 40°C (methanol) or -50°C (DME) in order to condense the methanol/DME. A gas-liquid separator then separates the liquid from the unconverted syngas. In the RC plants, about 76-79% of the unconverted syngas is recycled to the synthesis reactor, and the remaining 21-24% is used for power production. The recycle ratio has been optimized together with the synthesis pressure to yield the highest fuel production. Regarding the OT plants, the synthesis pressure was set to 40 bar in the DME-OT plant [17] and the synthesis pressure in the MeOH-OT plant was then adjusted to give the same fuel production as the DME-OT plant (96 bar). This was done to simplify the comparison of the OT plants. Because the syngas from the Two-Stage Gasifier only consists of 56-57 mole% H2+CO, the syngas conversions are lower than what would be achieved in large-scale plants using oxygen blown gasification and CO2 removal (Fig. 2). The syngas conversions are lowered from 86% to 64% for methanol synthesis (96 bar, 220°C), and from 85% to 64% for DME synthesis (40 bar, 240°C). The reduction in syngas conversion, due to the inert content, can however be compensated for by increasing the synthesis pressure (Fig. 2)7
17. The relatively low operating temperatures of
220°C and 240°C are suggested by [ ] to compensate for the high inert content in the syngas. This however results in higher costs for catalytic material compared to large-scale plants operating at 250-280°C (DME synthesis) [5,18].
Fig. 2. Syngas conversions (H2+CO) for methanol synthesis (left) and DME synthesis (right) at different synthesis temperatures and pressures. The solid lines are for the syngas from the Two-Stage Gasifier (composition in Table 2 for DME and Table 4 for methanol), and the dashed lines marked (L) are for a typical syngas used in a large-scale plant (methanol: 64.7% H2, 32.3% CO, 3% CO2. DME: 48.5% H2, 48.5% CO, 3% CO2 (mole%)). The syngas conversions are calculated with the approach temperatures listed in Table 1. Separation The liquid stream from the gas-liquid separator is distilled by fractional distillation in a topping column in order to remove the absorbed gasses (CO2). The CO2-rich stream from the column is sent to the gas engine. The resulting crude methanol product contains 2-5% water and the crude DME product contains 9-18% water and 10-14% methanol. The crude liquid fuel products are sent to central upgrading/purification because this is considered too costly at this small-scale. If additional distillation columns were added to the plants, the heat demand for the reboilers could be supplied by plant waste heat.
7 For methanol synthesis at 220°C, the syngas conversion at 96 bar corresponds to the syngas conversion at 45 bar in a large-scale plant. For DME synthesis at 240°C, the syngas conversion at 40 bar corresponds to the syngas conversion at 13 bar in a large-scale plant. The syngas conversion is 64% in all cases.
0102030405060708090
100
200 220 240 260 280 300
H2+
CO
conv
ersio
n [%
]
Temperature [C]
90 bar 90 bar (L)60 bar 60 bar (L)30 bar 30 bar (L)
0102030405060708090
100
200 220 240 260 280 300
Temperature [C]
90 bar 90 bar (L)60 bar 60 bar (L)30 bar 30 bar (L)
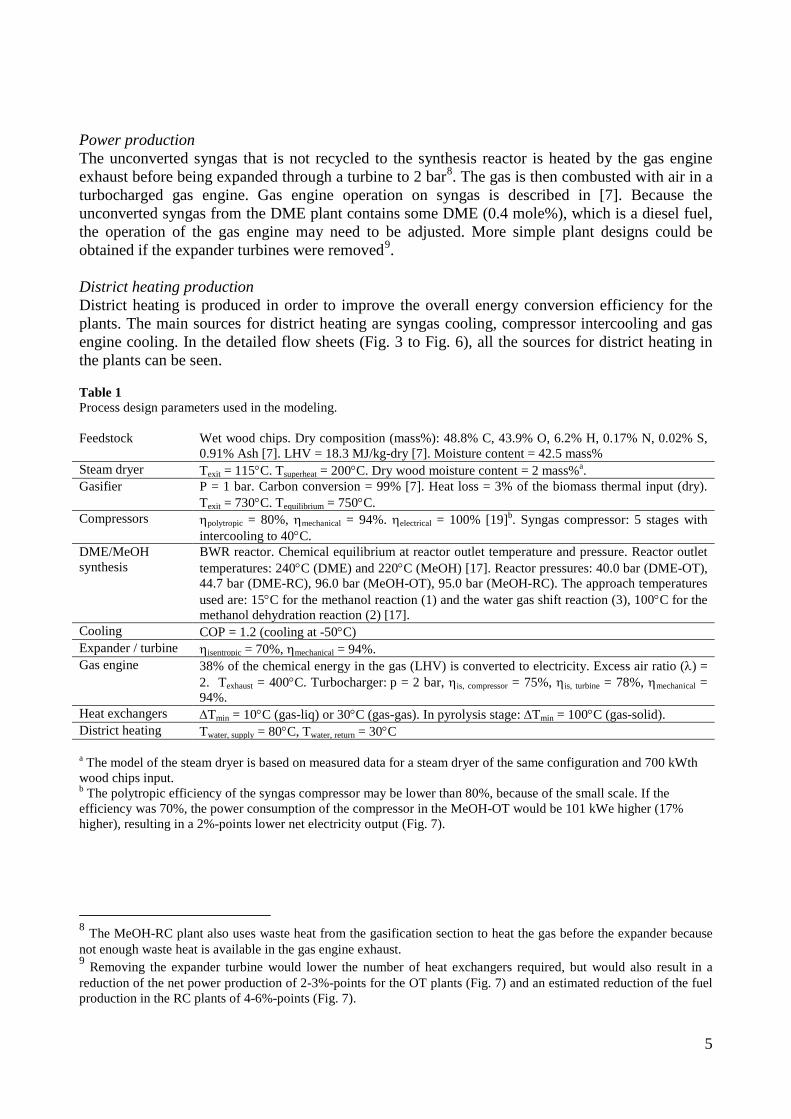
5
Power production The unconverted syngas that is not recycled to the synthesis reactor is heated by the gas engine exhaust before being expanded through a turbine to 2 bar8
[7. The gas is then combusted with air in a
turbocharged gas engine. Gas engine operation on syngas is described in ]. Because the unconverted syngas from the DME plant contains some DME (0.4 mole%), which is a diesel fuel, the operation of the gas engine may need to be adjusted. More simple plant designs could be obtained if the expander turbines were removed9
.
District heating production District heating is produced in order to improve the overall energy conversion efficiency for the plants. The main sources for district heating are syngas cooling, compressor intercooling and gas engine cooling. In the detailed flow sheets (Fig. 3 to Fig. 6), all the sources for district heating in the plants can be seen. Table 1 Process design parameters used in the modeling. Feedstock Wet wood chips. Dry composition (mass%): 48.8% C, 43.9% O, 6.2% H, 0.17% N, 0.02% S,
0.91% Ash [7]. LHV = 18.3 MJ/kg-dry [7]. Moisture content = 42.5 mass% Steam dryer Texit = 115°C. Tsuperheat = 200°C. Dry wood moisture content = 2 mass%a. Gasifier P = 1 bar. Carbon conversion = 99% [7]. Heat loss = 3% of the biomass thermal input (dry).
Texit = 730°C. Tequilibrium = 750°C. Compressors ηpolytropic = 80%, ηmechanical = 94%. ηelectrical = 100% [19]b. Syngas compressor: 5 stages with
intercooling to 40°C. DME/MeOH synthesis
BWR reactor. Chemical equilibrium at reactor outlet temperature and pressure. Reactor outlet temperatures: 240°C (DME) and 220°C (MeOH) [17]. Reactor pressures: 40.0 bar (DME-OT), 44.7 bar (DME-RC), 96.0 bar (MeOH-OT), 95.0 bar (MeOH-RC). The approach temperatures used are: 15°C for the methanol reaction (1) and the water gas shift reaction (3), 100°C for the methanol dehydration reaction (2) [17].
Cooling COP = 1.2 (cooling at -50°C) Expander / turbine ηisentropic = 70%, ηmechanical = 94%. Gas engine 38% of the chemical energy in the gas (LHV) is converted to electricity. Excess air ratio (λ) =
2. Texhaust = 400°C. Turbocharger: p = 2 bar, ηis, compressor = 75%, ηis, turbine = 78%, ηmechanical = 94%.
Heat exchangers ∆Tmin = 10°C (gas-liq) or 30°C (gas-gas). In pyrolysis stage: ∆Tmin = 100°C (gas-solid). District heating Twater, supply = 80°C, Twater, return = 30°C a The model of the steam dryer is based on measured data for a steam dryer of the same configuration and 700 kWth wood chips input. b The polytropic efficiency of the syngas compressor may be lower than 80%, because of the small scale. If the efficiency was 70%, the power consumption of the compressor in the MeOH-OT would be 101 kWe higher (17% higher), resulting in a 2%-points lower net electricity output (Fig. 7).
8 The MeOH-RC plant also uses waste heat from the gasification section to heat the gas before the expander because not enough waste heat is available in the gas engine exhaust. 9 Removing the expander turbine would lower the number of heat exchangers required, but would also result in a reduction of the net power production of 2-3%-points for the OT plants (Fig. 7) and an estimated reduction of the fuel production in the RC plants of 4-6%-points (Fig. 7).
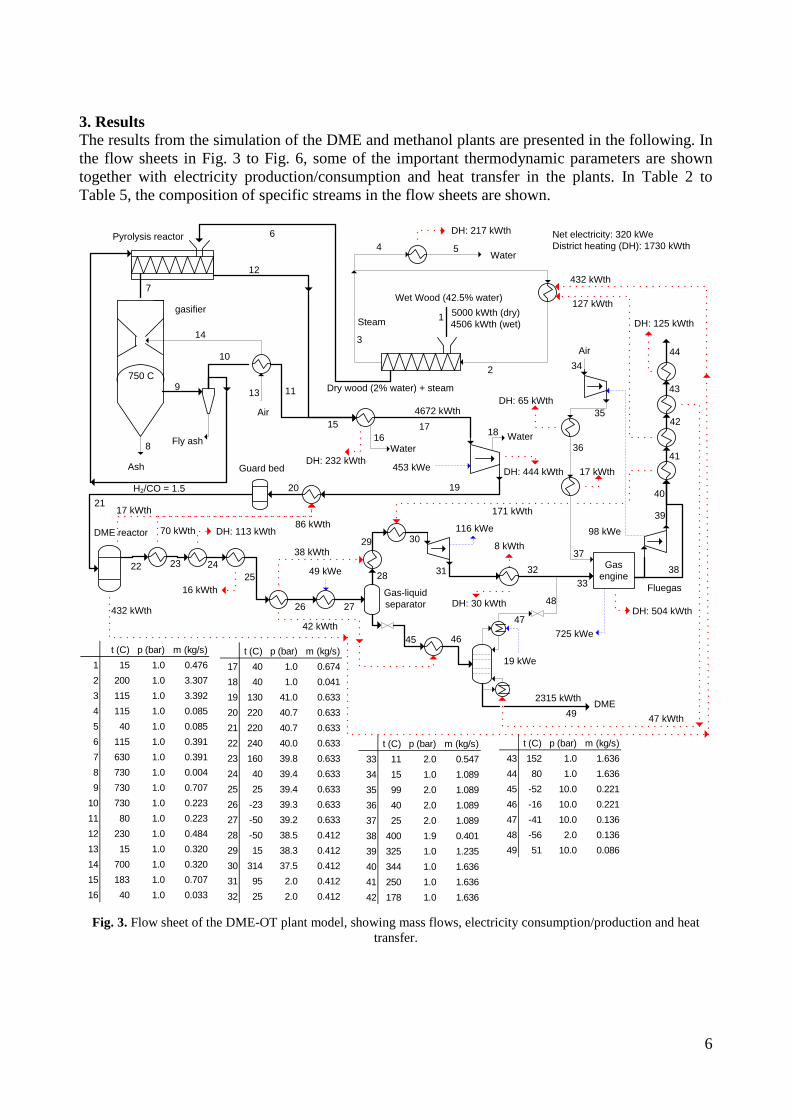
6
3. Results The results from the simulation of the DME and methanol plants are presented in the following. In the flow sheets in Fig. 3 to Fig. 6, some of the important thermodynamic parameters are shown together with electricity production/consumption and heat transfer in the plants. In Table 2 to Table 5, the composition of specific streams in the flow sheets are shown.
Fig. 3. Flow sheet of the DME-OT plant model, showing mass flows, electricity consumption/production and heat
transfer.
Fly ash
Wet Wood (42.5% water)
DME reactor
Gas-liquid separator
22 Gas engine
Air
DME
Fluegas
5000 kWth (dry)4506 kWth (wet)
432 kWth
453 kWeAsh
725 kWe
gasifier
750 C
1
Water
Steam
Dry wood (2% water) + steam
Pyrolysis reactor
Air
11
12
15 17
6
3
7
2
Guard bed
70 kWth
23
DH: 113 kWth
DH: 504 kWth
DH: 444 kWthDH: 232 kWth
33
9
10
14
16
127 kWth
Water18
20
38
Water
DH: 217 kWth
4
27
46
19 kWe
29
28
42 kWth
49 kWe
38 kWth
21
25
26
16 kWth
116 kWe 98 kWe
19
5
8
13
31 32
36
37
39
40
41
42
43
47
48
49
t (C) p (bar) m (kg/s)17 40 1.0 0.67418 40 1.0 0.04119 130 41.0 0.63320 220 40.7 0.63321 220 40.7 0.63322 240 40.0 0.63323 160 39.8 0.63324 40 39.4 0.63325 25 39.4 0.63326 -23 39.3 0.63327 -50 39.2 0.63328 -50 38.5 0.41229 15 38.3 0.41230 314 37.5 0.41231 95 2.0 0.41232 25 2.0 0.412
t (C) p (bar) m (kg/s)43 152 1.0 1.63644 80 1.0 1.63645 -52 10.0 0.22146 -16 10.0 0.22147 -41 10.0 0.13648 -56 2.0 0.13649 51 10.0 0.086
t (C) p (bar) m (kg/s)1 15 1.0 0.4762 200 1.0 3.3073 115 1.0 3.3924 115 1.0 0.0855 40 1.0 0.0856 115 1.0 0.3917 630 1.0 0.3918 730 1.0 0.0049 730 1.0 0.707
10 730 1.0 0.22311 80 1.0 0.22312 230 1.0 0.48413 15 1.0 0.32014 700 1.0 0.32015 183 1.0 0.70716 40 1.0 0.033
t (C) p (bar) m (kg/s)33 11 2.0 0.54734 15 1.0 1.08935 99 2.0 1.08936 40 2.0 1.08937 25 2.0 1.08938 400 1.9 0.40139 325 1.0 1.23540 344 1.0 1.63641 250 1.0 1.63642 178 1.0 1.636
432 kWth
30
44
171 kWth
35
24
47 kWth
8 kWth
DH: 30 kWth
17 kWth
DH: 65 kWth
34
DH: 125 kWth
45
Net electricity: 320 kWeDistrict heating (DH): 1730 kWth
4672 kWth
H2/CO = 1.5
2315 kWth
17 kWth86 kWth
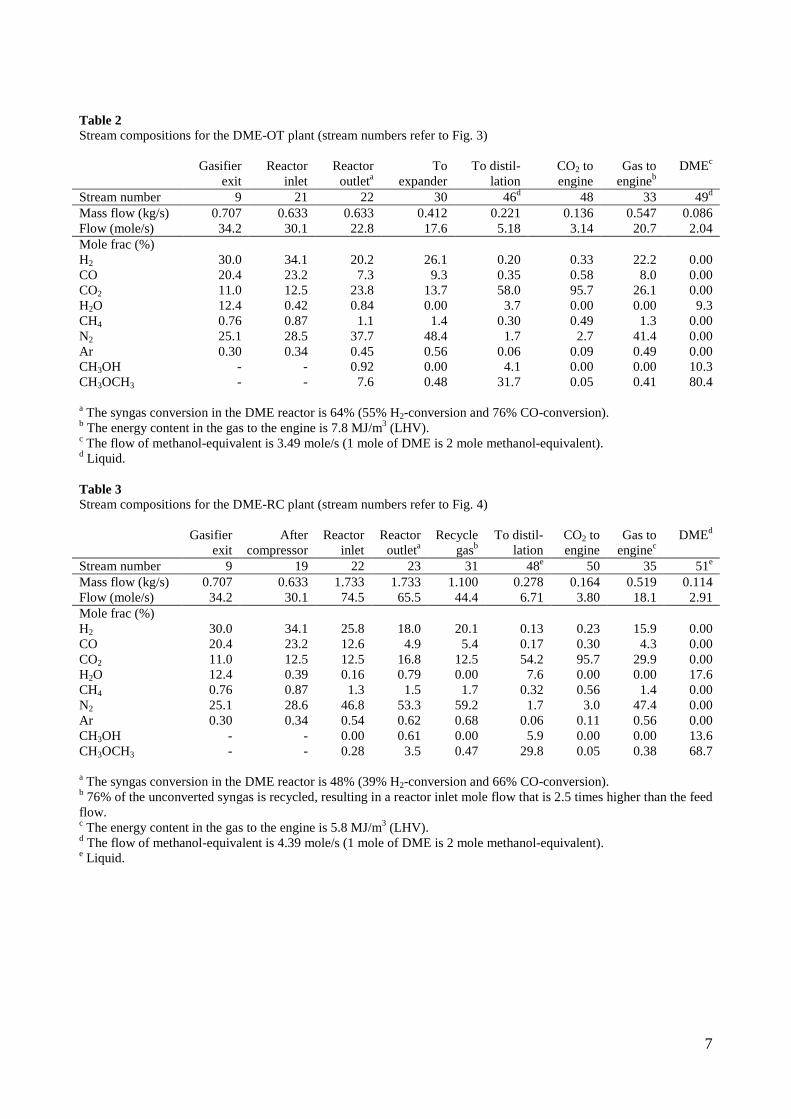
7
Table 2 Stream compositions for the DME-OT plant (stream numbers refer to Fig. 3) Gasifier
exit Reactor
inlet Reactor
outleta To
expander To distil-
lation CO2 to engine
Gas to engineb
DMEc
Stream number 9 21 22 30 46d 48 33 49d Mass flow (kg/s) 0.707 0.633 0.633 0.412 0.221 0.136 0.547 0.086 Flow (mole/s) 34.2 30.1 22.8 17.6 5.18 3.14 20.7 2.04 Mole frac (%) H2 30.0 34.1 20.2 26.1 0.20 0.33 22.2 0.00 CO 20.4 23.2 7.3 9.3 0.35 0.58 8.0 0.00 CO2 11.0 12.5 23.8 13.7 58.0 95.7 26.1 0.00 H2O 12.4 0.42 0.84 0.00 3.7 0.00 0.00 9.3 CH4 0.76 0.87 1.1 1.4 0.30 0.49 1.3 0.00 N2 25.1 28.5 37.7 48.4 1.7 2.7 41.4 0.00 Ar 0.30 0.34 0.45 0.56 0.06 0.09 0.49 0.00 CH3OH - - 0.92 0.00 4.1 0.00 0.00 10.3 CH3OCH3 - - 7.6 0.48 31.7 0.05 0.41 80.4 a The syngas conversion in the DME reactor is 64% (55% H2-conversion and 76% CO-conversion). b The energy content in the gas to the engine is 7.8 MJ/m3 (LHV). c The flow of methanol-equivalent is 3.49 mole/s (1 mole of DME is 2 mole methanol-equivalent). d Liquid. Table 3 Stream compositions for the DME-RC plant (stream numbers refer to Fig. 4) Gasifier
exit After
compressor Reactor
inlet Reactor
outleta Recycle
gasb To distil-
lation CO2 to engine
Gas to enginec
DMEd
Stream number 9 19 22 23 31 48e 50 35 51e Mass flow (kg/s) 0.707 0.633 1.733 1.733 1.100 0.278 0.164 0.519 0.114 Flow (mole/s) 34.2 30.1 74.5 65.5 44.4 6.71 3.80 18.1 2.91 Mole frac (%) H2 30.0 34.1 25.8 18.0 20.1 0.13 0.23 15.9 0.00 CO 20.4 23.2 12.6 4.9 5.4 0.17 0.30 4.3 0.00 CO2 11.0 12.5 12.5 16.8 12.5 54.2 95.7 29.9 0.00 H2O 12.4 0.39 0.16 0.79 0.00 7.6 0.00 0.00 17.6 CH4 0.76 0.87 1.3 1.5 1.7 0.32 0.56 1.4 0.00 N2 25.1 28.6 46.8 53.3 59.2 1.7 3.0 47.4 0.00 Ar 0.30 0.34 0.54 0.62 0.68 0.06 0.11 0.56 0.00 CH3OH - - 0.00 0.61 0.00 5.9 0.00 0.00 13.6 CH3OCH3 - - 0.28 3.5 0.47 29.8 0.05 0.38 68.7 a The syngas conversion in the DME reactor is 48% (39% H2-conversion and 66% CO-conversion). b 76% of the unconverted syngas is recycled, resulting in a reactor inlet mole flow that is 2.5 times higher than the feed flow. c The energy content in the gas to the engine is 5.8 MJ/m3 (LHV). d The flow of methanol-equivalent is 4.39 mole/s (1 mole of DME is 2 mole methanol-equivalent). e Liquid.
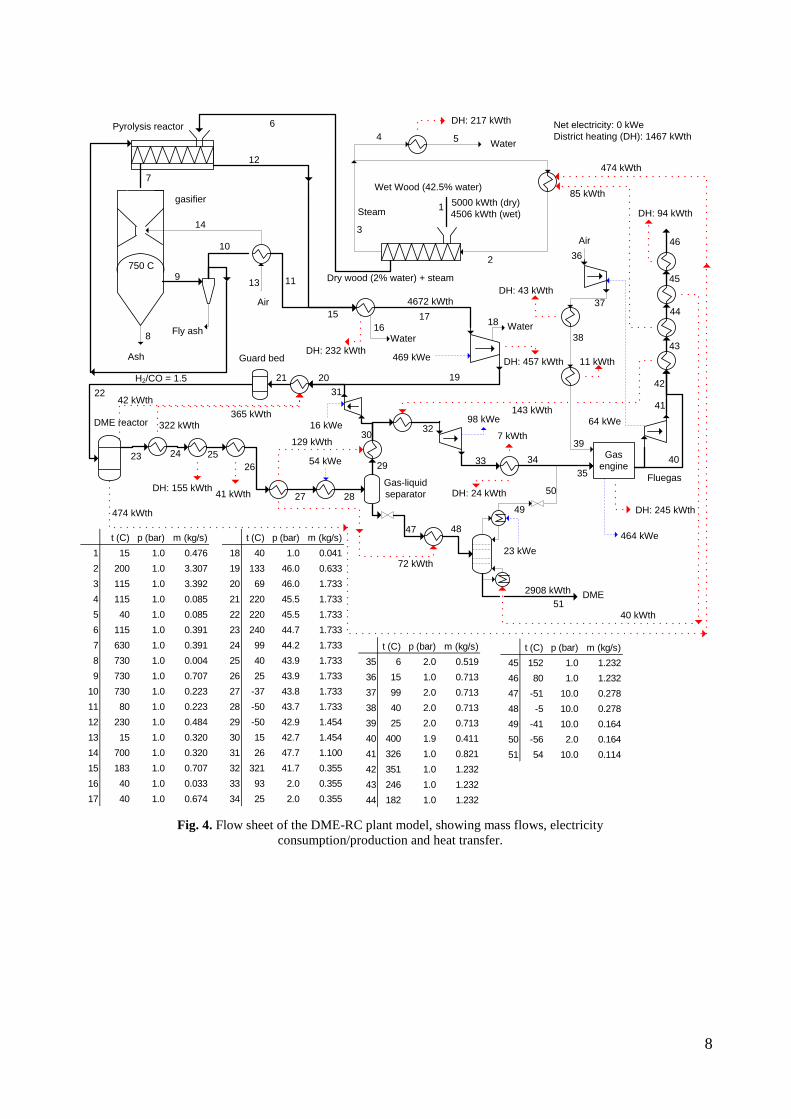
8
Fig. 4. Flow sheet of the DME-RC plant model, showing mass flows, electricity
consumption/production and heat transfer.
Fly ash
Wet Wood (42.5% water)
DME reactor
Gas-liquid separator
23 Gas engine
Air
DME
Fluegas
5000 kWth (dry)4506 kWth (wet)
474 kWth
469 kWeAsh
464 kWe
gasifier
750 C
1
Water
Steam
Dry wood (2% water) + steam
Pyrolysis reactor
Air
11
12
15 17
6
3
7
2
Guard bed
322 kWth
24
DH: 155 kWth
DH: 245 kWth
DH: 457 kWthDH: 232 kWth
35
9
10
14
16
85 kWth
Water18
21
40
Water
DH: 217 kWth
4
28
48
23 kWe
30
29
72 kWth
54 kWe
129 kWth
2022
26
2741 kWth
143 kWth98 kWe 64 kWe
32
19
5
8
13
33 34
38
39
41
42
43
44
45
49
50
51
t (C) p (bar) m (kg/s)18 40 1.0 0.04119 133 46.0 0.63320 69 46.0 1.73321 220 45.5 1.73322 220 45.5 1.73323 240 44.7 1.73324 99 44.2 1.73325 40 43.9 1.73326 25 43.9 1.73327 -37 43.8 1.73328 -50 43.7 1.73329 -50 42.9 1.45430 15 42.7 1.45431 26 47.7 1.10032 321 41.7 0.35533 93 2.0 0.35534 25 2.0 0.355
t (C) p (bar) m (kg/s)45 152 1.0 1.23246 80 1.0 1.23247 -51 10.0 0.27848 -5 10.0 0.27849 -41 10.0 0.16450 -56 2.0 0.16451 54 10.0 0.114
t (C) p (bar) m (kg/s)1 15 1.0 0.4762 200 1.0 3.3073 115 1.0 3.3924 115 1.0 0.0855 40 1.0 0.0856 115 1.0 0.3917 630 1.0 0.3918 730 1.0 0.0049 730 1.0 0.707
10 730 1.0 0.22311 80 1.0 0.22312 230 1.0 0.48413 15 1.0 0.32014 700 1.0 0.32015 183 1.0 0.70716 40 1.0 0.03317 40 1.0 0.674
t (C) p (bar) m (kg/s)35 6 2.0 0.51936 15 1.0 0.71337 99 2.0 0.71338 40 2.0 0.71339 25 2.0 0.71340 400 1.9 0.41141 326 1.0 0.82142 351 1.0 1.23243 246 1.0 1.23244 182 1.0 1.232
474 kWth
46
37
25
40 kWth
7 kWth
DH: 24 kWth
11 kWth
DH: 43 kWth
36
DH: 94 kWth
47
4672 kWth
H2/CO = 1.5
16 kWe
31
2908 kWth
42 kWth365 kWth
Net electricity: 0 kWeDistrict heating (DH): 1467 kWth
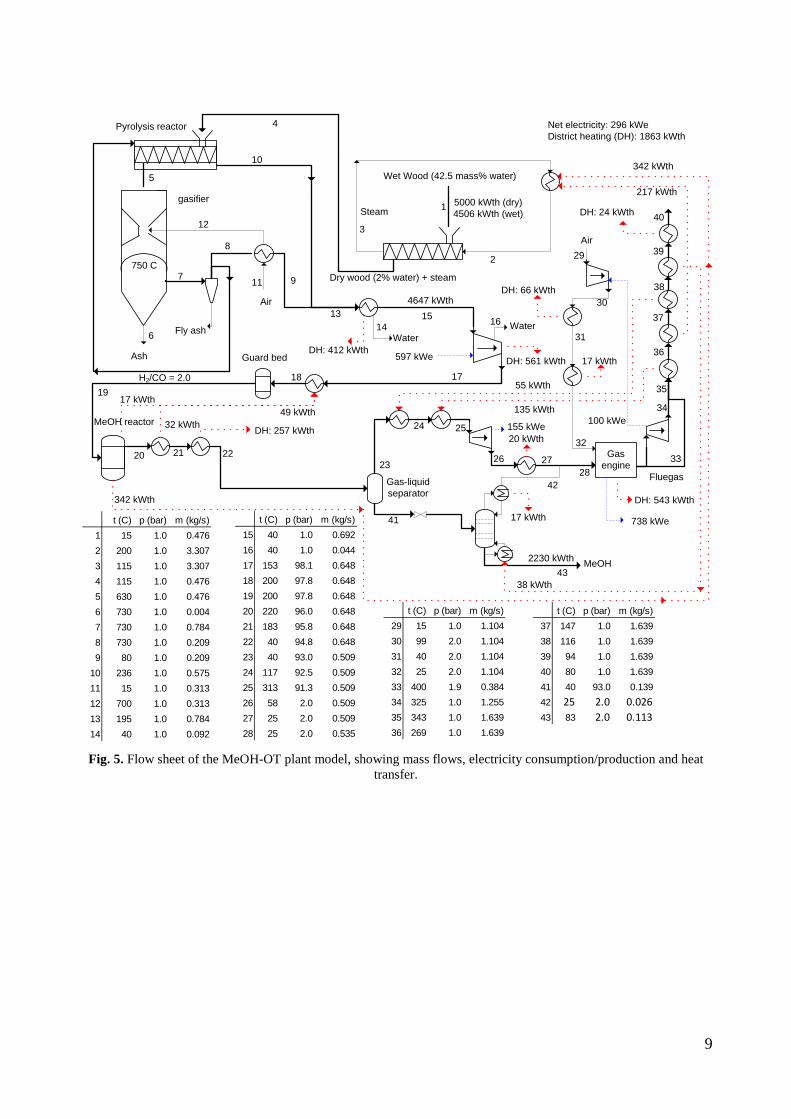
9
Fig. 5. Flow sheet of the MeOH-OT plant model, showing mass flows, electricity consumption/production and heat
transfer.
Fly ash
Wet Wood (42.5 mass% water)
MeOH reactor
Gas-liquid separator
20 Gas engine
Air
MeOH
Fluegas
5000 kWth (dry)4506 kWth (wet)
342 kWth
597 kWeAsh
738 kWe
gasifier
750 C
1
Water
Steam
Dry wood (2% water) + steam
Pyrolysis reactor
Air
9
10
13 15
4
3
5
2
Guard bed
32 kWth
21
DH: 257 kWth
DH: 543 kWth
DH: 561 kWthDH: 412 kWth
28
7
8
12
14
217 kWth
Water16
18
3323
19
155 kWe 100 kWe25
17
6
11
26
31
32
34
35
38
39
42
43
t (C) p (bar) m (kg/s)15 40 1.0 0.69216 40 1.0 0.04417 153 98.1 0.64818 200 97.8 0.64819 200 97.8 0.64820 220 96.0 0.64821 183 95.8 0.64822 40 94.8 0.64823 40 93.0 0.50924 117 92.5 0.50925 313 91.3 0.50926 58 2.0 0.50927 25 2.0 0.50928 25 2.0 0.535
t (C) p (bar) m (kg/s)37 147 1.0 1.63938 116 1.0 1.63939 94 1.0 1.63940 80 1.0 1.63941 40 93.0 0.13942 25 2.0 0.02643 83 2.0 0.113
t (C) p (bar) m (kg/s)1 15 1.0 0.4762 200 1.0 3.3073 115 1.0 3.3074 115 1.0 0.4765 630 1.0 0.4766 730 1.0 0.0047 730 1.0 0.7848 730 1.0 0.2099 80 1.0 0.209
10 236 1.0 0.57511 15 1.0 0.31312 700 1.0 0.31313 195 1.0 0.78414 40 1.0 0.092
t (C) p (bar) m (kg/s)29 15 1.0 1.10430 99 2.0 1.10431 40 2.0 1.10432 25 2.0 1.10433 400 1.9 0.38434 325 1.0 1.25535 343 1.0 1.63936 269 1.0 1.639
342 kWth
40
55 kWth
30
22
38 kWth
17 kWth
DH: 66 kWth
29
DH: 24 kWth
41
2230 kWth
17 kWth
Net electricity: 296 kWeDistrict heating (DH): 1863 kWth
4647 kWth
H2/CO = 2.0
36
37
24
27
20 kWth
135 kWth17 kWth
49 kWth
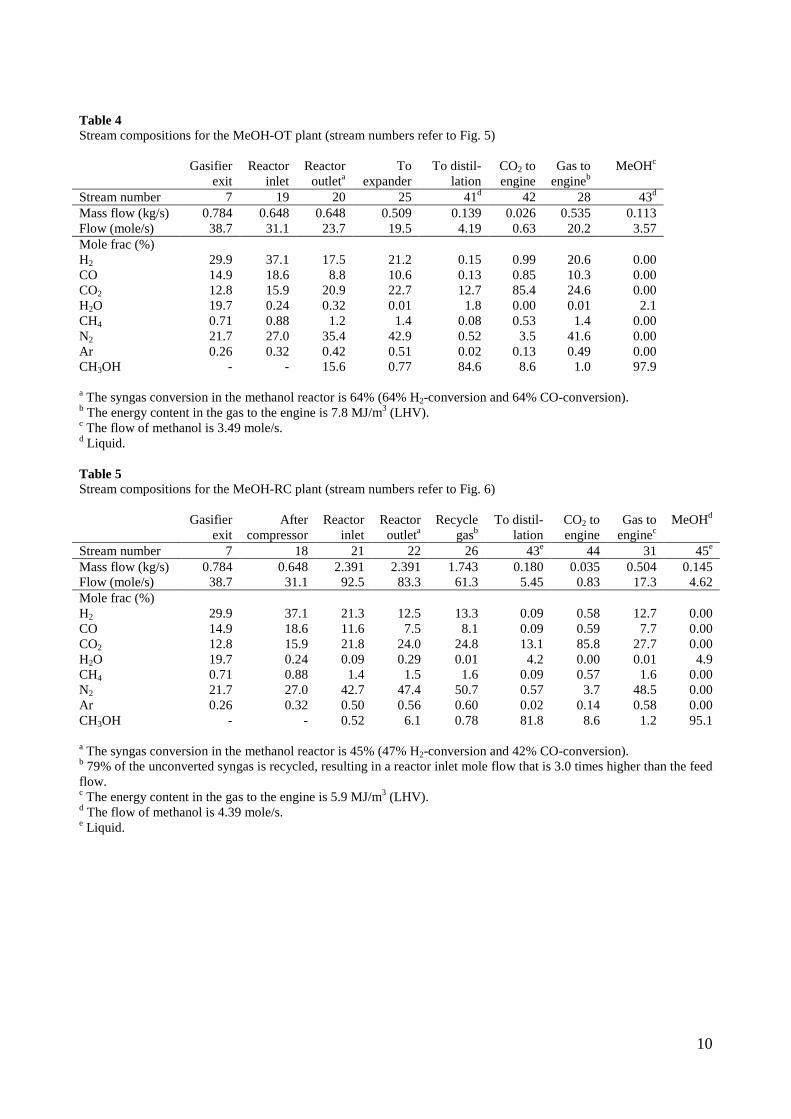
10
Table 4 Stream compositions for the MeOH-OT plant (stream numbers refer to Fig. 5) Gasifier
exit Reactor
inlet Reactor
outleta To
expander To distil-
lation CO2 to engine
Gas to engineb
MeOHc
Stream number 7 19 20 25 41d 42 28 43d Mass flow (kg/s) 0.784 0.648 0.648 0.509 0.139 0.026 0.535 0.113 Flow (mole/s) 38.7 31.1 23.7 19.5 4.19 0.63 20.2 3.57 Mole frac (%) H2 29.9 37.1 17.5 21.2 0.15 0.99 20.6 0.00 CO 14.9 18.6 8.8 10.6 0.13 0.85 10.3 0.00 CO2 12.8 15.9 20.9 22.7 12.7 85.4 24.6 0.00 H2O 19.7 0.24 0.32 0.01 1.8 0.00 0.01 2.1 CH4 0.71 0.88 1.2 1.4 0.08 0.53 1.4 0.00 N2 21.7 27.0 35.4 42.9 0.52 3.5 41.6 0.00 Ar 0.26 0.32 0.42 0.51 0.02 0.13 0.49 0.00 CH3OH - - 15.6 0.77 84.6 8.6 1.0 97.9 a The syngas conversion in the methanol reactor is 64% (64% H2-conversion and 64% CO-conversion). b The energy content in the gas to the engine is 7.8 MJ/m3 (LHV).
c The flow of methanol is 3.49 mole/s. d Liquid. Table 5 Stream compositions for the MeOH-RC plant (stream numbers refer to Fig. 6) Gasifier
exit After
compressor Reactor
inlet Reactor
outleta Recycle
gasb To distil-
lation CO2 to engine
Gas to enginec
MeOHd
Stream number 7 18 21 22 26 43e 44 31 45e Mass flow (kg/s) 0.784 0.648 2.391 2.391 1.743 0.180 0.035 0.504 0.145 Flow (mole/s) 38.7 31.1 92.5 83.3 61.3 5.45 0.83 17.3 4.62 Mole frac (%) H2 29.9 37.1 21.3 12.5 13.3 0.09 0.58 12.7 0.00 CO 14.9 18.6 11.6 7.5 8.1 0.09 0.59 7.7 0.00 CO2 12.8 15.9 21.8 24.0 24.8 13.1 85.8 27.7 0.00 H2O 19.7 0.24 0.09 0.29 0.01 4.2 0.00 0.01 4.9 CH4 0.71 0.88 1.4 1.5 1.6 0.09 0.57 1.6 0.00 N2 21.7 27.0 42.7 47.4 50.7 0.57 3.7 48.5 0.00 Ar 0.26 0.32 0.50 0.56 0.60 0.02 0.14 0.58 0.00 CH3OH - - 0.52 6.1 0.78 81.8 8.6 1.2 95.1 a The syngas conversion in the methanol reactor is 45% (47% H2-conversion and 42% CO-conversion). b 79% of the unconverted syngas is recycled, resulting in a reactor inlet mole flow that is 3.0 times higher than the feed flow. c The energy content in the gas to the engine is 5.9 MJ/m3 (LHV). d The flow of methanol is 4.39 mole/s. e Liquid.
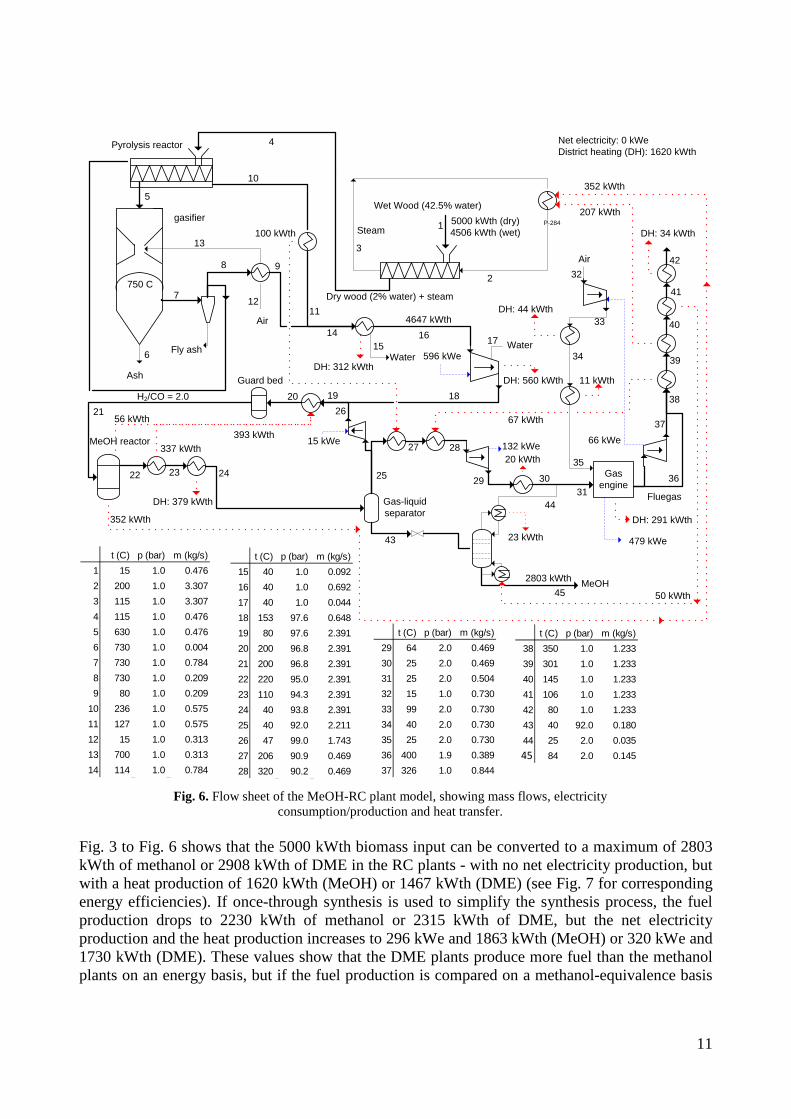
11
Fig. 6. Flow sheet of the MeOH-RC plant model, showing mass flows, electricity
consumption/production and heat transfer. Fig. 3 to Fig. 6 shows that the 5000 kWth biomass input can be converted to a maximum of 2803 kWth of methanol or 2908 kWth of DME in the RC plants - with no net electricity production, but with a heat production of 1620 kWth (MeOH) or 1467 kWth (DME) (see Fig. 7 for corresponding energy efficiencies). If once-through synthesis is used to simplify the synthesis process, the fuel production drops to 2230 kWth of methanol or 2315 kWth of DME, but the net electricity production and the heat production increases to 296 kWe and 1863 kWth (MeOH) or 320 kWe and 1730 kWth (DME). These values show that the DME plants produce more fuel than the methanol plants on an energy basis, but if the fuel production is compared on a methanol-equivalence basis
Fly ash
Wet Wood (42.5% water)
MeOH reactor
Gas-liquid separator
22 Gas engine
Air
MeOH
Fluegas
5000 kWth (dry)4506 kWth (wet)
352 kWth
596 kWe
Ash
479 kWe
gasifier
750 C
1
Water
Steam
Dry wood (2% water) + steam
Pyrolysis reactor
Air
9
10
14 16
4
3
5
2
Guard bed
337 kWth
23
DH: 379 kWth
DH: 291 kWth
DH: 560 kWthDH: 312 kWth
31
7
8
13
15
207 kWth
Water17
20
3625
21
132 kWe 66 kWe28
18
6
12
30
34
35
37
38
39
40
44
45
t (C) p (bar) m (kg/s)15 40 1.0 0.09216 40 1.0 0.69217 40 1.0 0.04418 153 97.6 0.64819 80 97.6 2.39120 200 96.8 2.39121 200 96.8 2.39122 220 95.0 2.39123 110 94.3 2.39124 40 93.8 2.39125 40 92.0 2.21126 47 99.0 1.74327 206 90.9 0.46928 320 90.2 0.469
t (C) p (bar) m (kg/s)38 350 1.0 1.23339 301 1.0 1.23340 145 1.0 1.23341 106 1.0 1.23342 80 1.0 1.23343 40 92.0 0.18044 25 2.0 0.03545 84 2.0 0.145
t (C) p (bar) m (kg/s)1 15 1.0 0.4762 200 1.0 3.3073 115 1.0 3.3074 115 1.0 0.4765 630 1.0 0.4766 730 1.0 0.0047 730 1.0 0.7848 730 1.0 0.2099 80 1.0 0.209
10 236 1.0 0.57511 127 1.0 0.57512 15 1.0 0.31313 700 1.0 0.31314 114 1.0 0.784
t (C) p (bar) m (kg/s)29 64 2.0 0.46930 25 2.0 0.46931 25 2.0 0.50432 15 1.0 0.73033 99 2.0 0.73034 40 2.0 0.73035 25 2.0 0.73036 400 1.9 0.38937 326 1.0 0.844
352 kWth
42
67 kWth
33
24
50 kWth
11 kWth
DH: 44 kWth
32
DH: 34 kWth
43
2803 kWth
23 kWth
2619
Net electricity: 0 kWeDistrict heating (DH): 1620 kWth
4647 kWth
H2/CO = 2.0
27
100 kWthP-284
15 kWe
29
20 kWth
41
11
56 kWth393 kWth
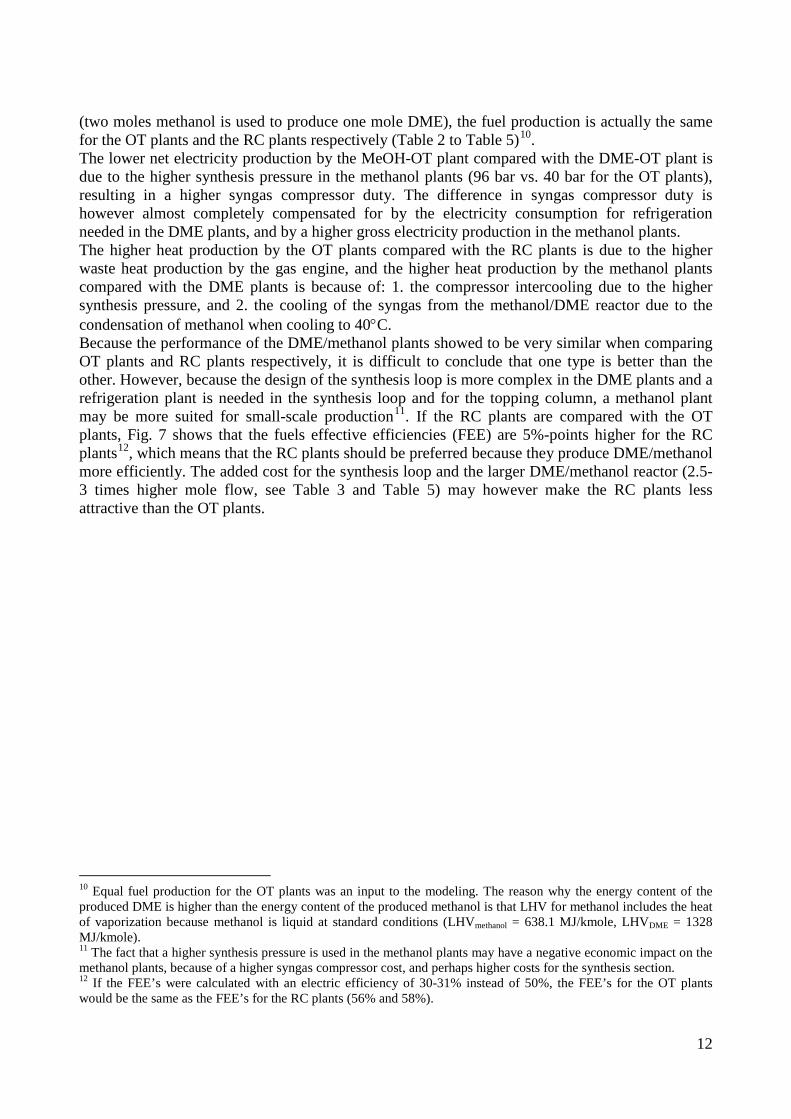
12
(two moles methanol is used to produce one mole DME), the fuel production is actually the same for the OT plants and the RC plants respectively (Table 2 to Table 5)10
The lower net electricity production by the MeOH-OT plant compared with the DME-OT plant is due to the higher synthesis pressure in the methanol plants (96 bar vs. 40 bar for the OT plants), resulting in a higher syngas compressor duty. The difference in syngas compressor duty is however almost completely compensated for by the electricity consumption for refrigeration needed in the DME plants, and by a higher gross electricity production in the methanol plants.
.
The higher heat production by the OT plants compared with the RC plants is due to the higher waste heat production by the gas engine, and the higher heat production by the methanol plants compared with the DME plants is because of: 1. the compressor intercooling due to the higher synthesis pressure, and 2. the cooling of the syngas from the methanol/DME reactor due to the condensation of methanol when cooling to 40°C. Because the performance of the DME/methanol plants showed to be very similar when comparing OT plants and RC plants respectively, it is difficult to conclude that one type is better than the other. However, because the design of the synthesis loop is more complex in the DME plants and a refrigeration plant is needed in the synthesis loop and for the topping column, a methanol plant may be more suited for small-scale production11
Fig. 7. If the RC plants are compared with the OT
plants, shows that the fuels effective efficiencies (FEE) are 5%-points higher for the RC plants12
Table 3
, which means that the RC plants should be preferred because they produce DME/methanol more efficiently. The added cost for the synthesis loop and the larger DME/methanol reactor (2.5-3 times higher mole flow, see and Table 5) may however make the RC plants less attractive than the OT plants.
10 Equal fuel production for the OT plants was an input to the modeling. The reason why the energy content of the produced DME is higher than the energy content of the produced methanol is that LHV for methanol includes the heat of vaporization because methanol is liquid at standard conditions (LHVmethanol = 638.1 MJ/kmole, LHVDME = 1328 MJ/kmole). 11 The fact that a higher synthesis pressure is used in the methanol plants may have a negative economic impact on the methanol plants, because of a higher syngas compressor cost, and perhaps higher costs for the synthesis section. 12 If the FEE’s were calculated with an electric efficiency of 30-31% instead of 50%, the FEE’s for the OT plants would be the same as the FEE’s for the RC plants (56% and 58%).
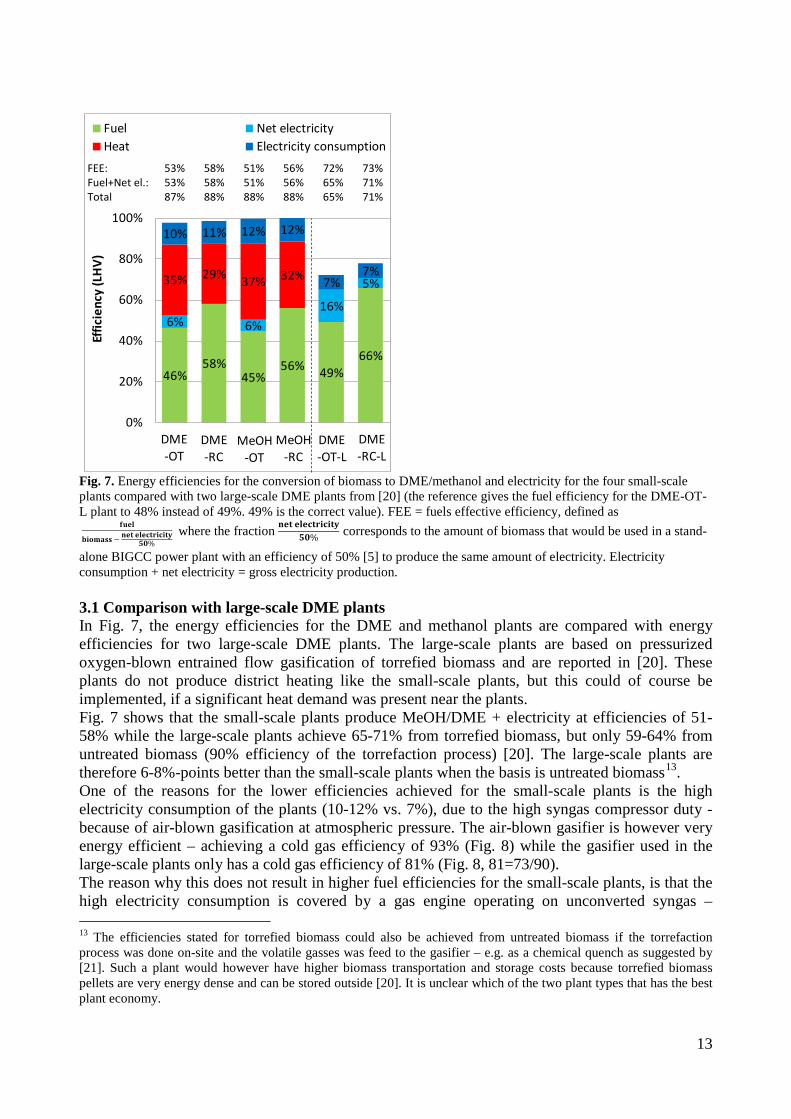
13
Fig. 7. Energy efficiencies for the conversion of biomass to DME/methanol and electricity for the four small-scale plants compared with two large-scale DME plants from [20] (the reference gives the fuel efficiency for the DME-OT-L plant to 48% instead of 49%. 49% is the correct value). FEE = fuels effective efficiency, defined as
where the fraction corresponds to the amount of biomass that would be used in a stand-
alone BIGCC power plant with an efficiency of 50% [5] to produce the same amount of electricity. Electricity consumption + net electricity = gross electricity production. 3.1 Comparison with large-scale DME plants In Fig. 7, the energy efficiencies for the DME and methanol plants are compared with energy efficiencies for two large-scale DME plants. The large-scale plants are based on pressurized oxygen-blown entrained flow gasification of torrefied biomass and are reported in [20]. These plants do not produce district heating like the small-scale plants, but this could of course be implemented, if a significant heat demand was present near the plants. Fig. 7 shows that the small-scale plants produce MeOH/DME + electricity at efficiencies of 51-58% while the large-scale plants achieve 65-71% from torrefied biomass, but only 59-64% from untreated biomass (90% efficiency of the torrefaction process) [20]. The large-scale plants are therefore 6-8%-points better than the small-scale plants when the basis is untreated biomass13
One of the reasons for the lower efficiencies achieved for the small-scale plants is the high electricity consumption of the plants (10-12% vs. 7%), due to the high syngas compressor duty - because of air-blown gasification at atmospheric pressure. The air-blown gasifier is however very energy efficient – achieving a cold gas efficiency of 93% (
.
Fig. 8) while the gasifier used in the large-scale plants only has a cold gas efficiency of 81% (Fig. 8, 81=73/90). The reason why this does not result in higher fuel efficiencies for the small-scale plants, is that the high electricity consumption is covered by a gas engine operating on unconverted syngas – 13 The efficiencies stated for torrefied biomass could also be achieved from untreated biomass if the torrefaction process was done on-site and the volatile gasses was feed to the gasifier – e.g. as a chemical quench as suggested by [21]. Such a plant would however have higher biomass transportation and storage costs because torrefied biomass pellets are very energy dense and can be stored outside [20]. It is unclear which of the two plant types that has the best plant economy.
46%58%
45%56% 49%
66%
6% 6%
16%
5%35% 29% 37% 32%
10% 11% 12% 12%
7%7%
0%
20%
40%
60%
80%
100%
Effic
ienc
y (L
HV
)
Fuel Net electricityHeat Electricity consumption
MeOH-RC
DME-OT
DME-RC
MeOH-OT
DME-RC-L
DME-OT-L
FEE: 53% 58% 51% 56% 72% 73% Fuel+Net el.: 53% 58% 51% 56% 65% 71% Total 87% 88% 88% 88% 65% 71%
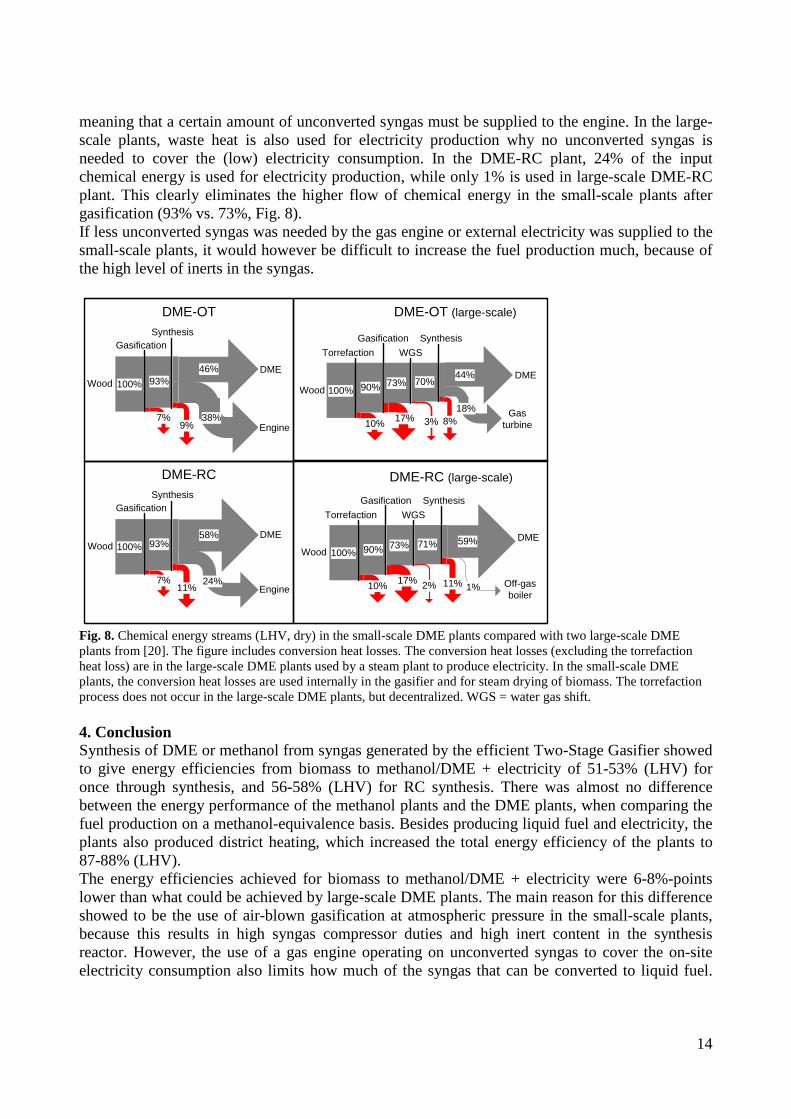
14
meaning that a certain amount of unconverted syngas must be supplied to the engine. In the large-scale plants, waste heat is also used for electricity production why no unconverted syngas is needed to cover the (low) electricity consumption. In the DME-RC plant, 24% of the input chemical energy is used for electricity production, while only 1% is used in large-scale DME-RC plant. This clearly eliminates the higher flow of chemical energy in the small-scale plants after gasification (93% vs. 73%, Fig. 8). If less unconverted syngas was needed by the gas engine or external electricity was supplied to the small-scale plants, it would however be difficult to increase the fuel production much, because of the high level of inerts in the syngas.
Fig. 8. Chemical energy streams (LHV, dry) in the small-scale DME plants compared with two large-scale DME plants from [20]. The figure includes conversion heat losses. The conversion heat losses (excluding the torrefaction heat loss) are in the large-scale DME plants used by a steam plant to produce electricity. In the small-scale DME plants, the conversion heat losses are used internally in the gasifier and for steam drying of biomass. The torrefaction process does not occur in the large-scale DME plants, but decentralized. WGS = water gas shift. 4. Conclusion Synthesis of DME or methanol from syngas generated by the efficient Two-Stage Gasifier showed to give energy efficiencies from biomass to methanol/DME + electricity of 51-53% (LHV) for once through synthesis, and 56-58% (LHV) for RC synthesis. There was almost no difference between the energy performance of the methanol plants and the DME plants, when comparing the fuel production on a methanol-equivalence basis. Besides producing liquid fuel and electricity, the plants also produced district heating, which increased the total energy efficiency of the plants to 87-88% (LHV). The energy efficiencies achieved for biomass to methanol/DME + electricity were 6-8%-points lower than what could be achieved by large-scale DME plants. The main reason for this difference showed to be the use of air-blown gasification at atmospheric pressure in the small-scale plants, because this results in high syngas compressor duties and high inert content in the synthesis reactor. However, the use of a gas engine operating on unconverted syngas to cover the on-site electricity consumption also limits how much of the syngas that can be converted to liquid fuel.
DME-OT
46%100% 93%
DMEWood
7%
GasificationSynthesis
38%Engine9%
DME-RC
58%100% 93%
DMEWood
7%
GasificationSynthesis
24%Engine11%
44%100% 90%
DMEWood
DME-OT (large-scale)
Torrefaction
10%
Gasification
73%
WGS
70%
17%
Synthesis
18% Gas turbine8%3%
59%100% 90%
DMEWood
Torrefaction
10%
Gasification
73%
WGS
71%
17%
Synthesis
1% Off-gas boiler
11%2%
DME-RC (large-scale)
15
The reason why the difference between the small-scale and the large-scale plants showed not to be greater, was the high cold gas efficiency of the gasifier used in the small-scale plants. Acknowledgements For financial support, the authors would like to thank the Danish Energy Research Programme (Energiforskningsprogrammet - EFP). The Danish Energy Research Programme had no influence on the research presented in this article, or the writing of the article. References [1] JRC, Eucar, Concawe. Well-to-wheels analysis of future automotive fuels and powertrains in the European context. Report, version 2C, 2007, http://ies.jrc.ec.europa.eu/jec-research-collaboration/downloads-jec.html, accessed 12/15/2010. [2] International DME association (IDA). DME - Clean Fuel for Transportation. http://www.aboutdme.org/index.asp?bid=219, accessed 12/15/2010. [3] Sues A, Juraščík M, Ptasinski K. Exergetic evaluation of 5 biowastes-to-biofuels routes via gasification. Energy 2010;35(2):996-1007 [4] Hamelinck CN, Faaij APC. Future prospects for production of methanol and hydrogen from biomass, report NWS-E-2001-49. Utrecht, The Netherlands: Utrecht University, Copernicus Institute, 2001. http://www.mtholyoke.edu/courses/tmillett/course/geog_304B/e2001-49.pdf, accessed 12/15/2010. [5] Larson ED, Jin H, Celik FE. Large-scale gasification-based coproduction of fuels and electricity from switchgrass. Biofuels, Biorprod. Bioref. 2009;3:174–194. [6] Pettersson K, Harveya S. CO2 emission balances for different black liquor gasification biorefinery concepts for production of electricity or second-generation liquid biofuels. Energy 2010;35(2):1101-1106. [7] Ahrenfeldt J, Henriksen U, Jensen TK, Gøbel B, Wiese L, Kather A, Egsgaard H. Validation of a Continuous Combined Heat and Power (CHP) Operation of a Two-Stage Biomass Gasifier. Energy & Fuels 2006;20(6):2672-2680. [8] Bentzen JD, Hummelshøj RM, Henriksen U, Gøbel B, Ahrenfelt J, Elmegaard B. Upscale of the two-stage gasification process. In: procedings of 2. World Conference and Technology Exhibition on Biomass for Energy and Industry, Florence & WIP-Munich, Rome, 2004. http://orbit.dtu.dk/getResource?recordId=155745&objectId=1&versionId=1, accessed 12/15/2010. [9] Boerrigter H. Economy of Biomass-to-Liquids (BTL) plants, report: ECN-C--06-019. Petten, The Netherlands: ECN, 2006. http://www.ecn.nl/publications/, accessed 12/15/2010. [10] Larson ED, Williams RH, Jin H. Fuels and electricity from biomass with CO2 capture and storage. In: proceedings of the 8th International Conference on Greenhouse Gas Control Technologies, Trondheim, Norway, June 2006, http://www.princeton.edu/pei/energy/publications/, accessed 12/15/2010. [11] Elmegaard B, Houbak N. DNA – A General Energy System Simulation Tool. In: J. Amundsen et al., editors. SIMS 2005, 46th Conference on Simulation and Modeling, Trondheim, Norway. Tapir Academic Press, 2005. p. 43-52. [12] Homepage of the thermodynamic simulation tool DNA. http://orbit.dtu.dk/query?record=231251. Technical University of Denmark (DTU). Accessed 12/15/2010. [13] van der Drift A, Boerrigter H. Synthesis gas from biomass, report: ECN-C--06-001. Petten, The Netherlands: ECN, 2006. http://www.ecn.nl/publications/, accessed 12/15/2010.
16
[14] Boerrigter H, Calis HP, Slort DJ, Bodenstaff H, Kaandorp AJ, Kaandorp AJ, den Uil H, Rabou LPLM. Gas Cleaning for Integrated Biomass Gasification (BG) and Fischer-Tropsch (FT) Systems, report: ECN-C--04-056. Petten, The Netherlands: ECN, 2006. http://www.ecn.nl/publications/, accessed 12/15/2010. [15] Iversen HL, Henriksen U, Ahrenfeldt J, Bentzen JD. D25 Performance characteristics of SOFC membranes at two stage gasifier (confidential), report (EU project no.: 502759). Technical University of Denmark (DTU), 2006. [16] Hansen JB, Nielsen PEH (Haldor Topsøe). Methanol Synthesis. Section 13.13 in “Handbook of Heterogeneous Catalysis”, Wiley-VCH, 2008, online ISBN: 9783527610044, http://onlinelibrary.wiley.com/doi/10.1002/9783527610044.hetcat0148/abstract, accessed 12/15/2010. [17] Personal communication with John Bøgild Hansen (Senior Scientist & Adviser to Chairman, Company Mangement) and Poul Erik Højlund Nielsen (department manager of science & innovation, R&D) about methanol synthesis, and Finn Joensen about DME synthesis, Haldor Topsøe A/S, 2010. [18] Lee S, Cho W, Song T, Ra Y (R & D Division, Korea Gas Corporation (KOGAS)). Scale up study of DME direct synthesis technology. In: proceedings of the 24th World Gas Conference, 2009, http://www.igu.org/html/wgc2009/papers/docs/wgcFinal00745.pdf, accessed 12/15/2010. [19] Kreutz TG, Larson ED, Liu G, Williams RH. Fischer-Tropsch Fuels from Coal and Biomass, report. Princeton, New Jersey: Princeton Environmental Institute, Princeton University, 2008. http://www.princeton.edu/pei/energy/publications, accessed 12/15/2010. [20] Clausen LR, Elmegaard B, Houbak N. Technoeconomic analysis of a low CO2 emission dimethyl ether (DME) plant based on gasification of torrefied biomass. Energy 2010;35(12):4831-4842. [21] Prins MJ, Ptasinski KJ, Janssen FJJG. More efficient biomass gasification via torrefaction. Energy 2006;31(15):3458–3470.
135
Appendix C. DME production based on entrained flow gasification of biomass
ISI Journal Paper Clausen LR, Elmegaard B, Houbak N. “Technoeconomic analysis of a low CO2 emission dimethyl ether (DME) plant based on gasification of torrefied biomass”. Energy 2010;35(12):4831-4842.
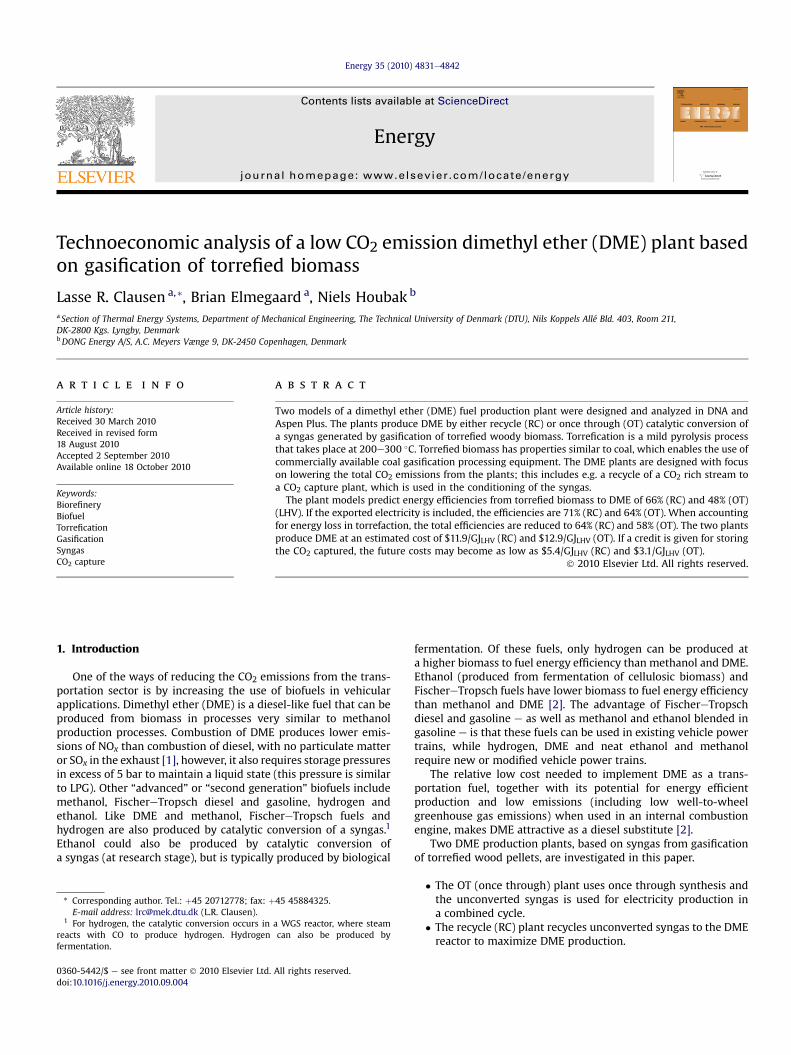
lable at ScienceDirect
Energy 35 (2010) 4831e4842
Contents lists avai
Energy
journal homepage: www.elsevier .com/locate/energy
Technoeconomic analysis of a low CO2 emission dimethyl ether (DME) plant basedon gasification of torrefied biomass
Lasse R. Clausen a,*, Brian Elmegaard a, Niels Houbak b
a Section of Thermal Energy Systems, Department of Mechanical Engineering, The Technical University of Denmark (DTU), Nils Koppels Allé Bld. 403, Room 211,DK-2800 Kgs. Lyngby, DenmarkbDONG Energy A/S, A.C. Meyers Vænge 9, DK-2450 Copenhagen, Denmark
a r t i c l e i n f o
Article history:Received 30 March 2010Received in revised form18 August 2010Accepted 2 September 2010Available online 18 October 2010
Keywords:BiorefineryBiofuelTorreficationGasificationSyngasCO2 capture
* Corresponding author. Tel.: þ45 20712778; fax: þE-mail address: [email protected] (L.R. Clausen).
1 For hydrogen, the catalytic conversion occurs inreacts with CO to produce hydrogen. Hydrogenfermentation.
0360-5442/$ e see front matter � 2010 Elsevier Ltd.doi:10.1016/j.energy.2010.09.004
a b s t r a c t
Two models of a dimethyl ether (DME) fuel production plant were designed and analyzed in DNA andAspen Plus. The plants produce DME by either recycle (RC) or once through (OT) catalytic conversion ofa syngas generated by gasification of torrefied woody biomass. Torrefication is a mild pyrolysis processthat takes place at 200e300 �C. Torrefied biomass has properties similar to coal, which enables the use ofcommercially available coal gasification processing equipment. The DME plants are designed with focuson lowering the total CO2 emissions from the plants; this includes e.g. a recycle of a CO2 rich stream toa CO2 capture plant, which is used in the conditioning of the syngas.
The plant models predict energy efficiencies from torrefied biomass to DME of 66% (RC) and 48% (OT)(LHV). If the exported electricity is included, the efficiencies are 71% (RC) and 64% (OT). When accountingfor energy loss in torrefaction, the total efficiencies are reduced to 64% (RC) and 58% (OT). The two plantsproduce DME at an estimated cost of $11.9/GJLHV (RC) and $12.9/GJLHV (OT). If a credit is given for storingthe CO2 captured, the future costs may become as low as $5.4/GJLHV (RC) and $3.1/GJLHV (OT).
� 2010 Elsevier Ltd. All rights reserved.
1. Introduction
One of the ways of reducing the CO2 emissions from the trans-portation sector is by increasing the use of biofuels in vehicularapplications. Dimethyl ether (DME) is a diesel-like fuel that can beproduced from biomass in processes very similar to methanolproduction processes. Combustion of DME produces lower emis-sions of NOx than combustion of diesel, with no particulate matteror SOx in the exhaust [1], however, it also requires storage pressuresin excess of 5 bar to maintain a liquid state (this pressure is similarto LPG). Other “advanced” or “second generation” biofuels includemethanol, FischereTropsch diesel and gasoline, hydrogen andethanol. Like DME and methanol, FischereTropsch fuels andhydrogen are also produced by catalytic conversion of a syngas.1
Ethanol could also be produced by catalytic conversion ofa syngas (at research stage), but is typically produced by biological
45 45884325.
a WGS reactor, where steamcan also be produced by
All rights reserved.
fermentation. Of these fuels, only hydrogen can be produced ata higher biomass to fuel energy efficiency than methanol and DME.Ethanol (produced from fermentation of cellulosic biomass) andFischereTropsch fuels have lower biomass to fuel energy efficiencythan methanol and DME [2]. The advantage of FischereTropschdiesel and gasoline e as well as methanol and ethanol blended ingasoline e is that these fuels can be used in existing vehicle powertrains, while hydrogen, DME and neat ethanol and methanolrequire new or modified vehicle power trains.
The relative low cost needed to implement DME as a trans-portation fuel, together with its potential for energy efficientproduction and low emissions (including low well-to-wheelgreenhouse gas emissions) when used in an internal combustionengine, makes DME attractive as a diesel substitute [2].
Two DME production plants, based on syngas from gasificationof torrefied wood pellets, are investigated in this paper.
� The OT (once through) plant uses once through synthesis andthe unconverted syngas is used for electricity production ina combined cycle.
� The recycle (RC) plant recycles unconverted syngas to the DMEreactor to maximize DME production.
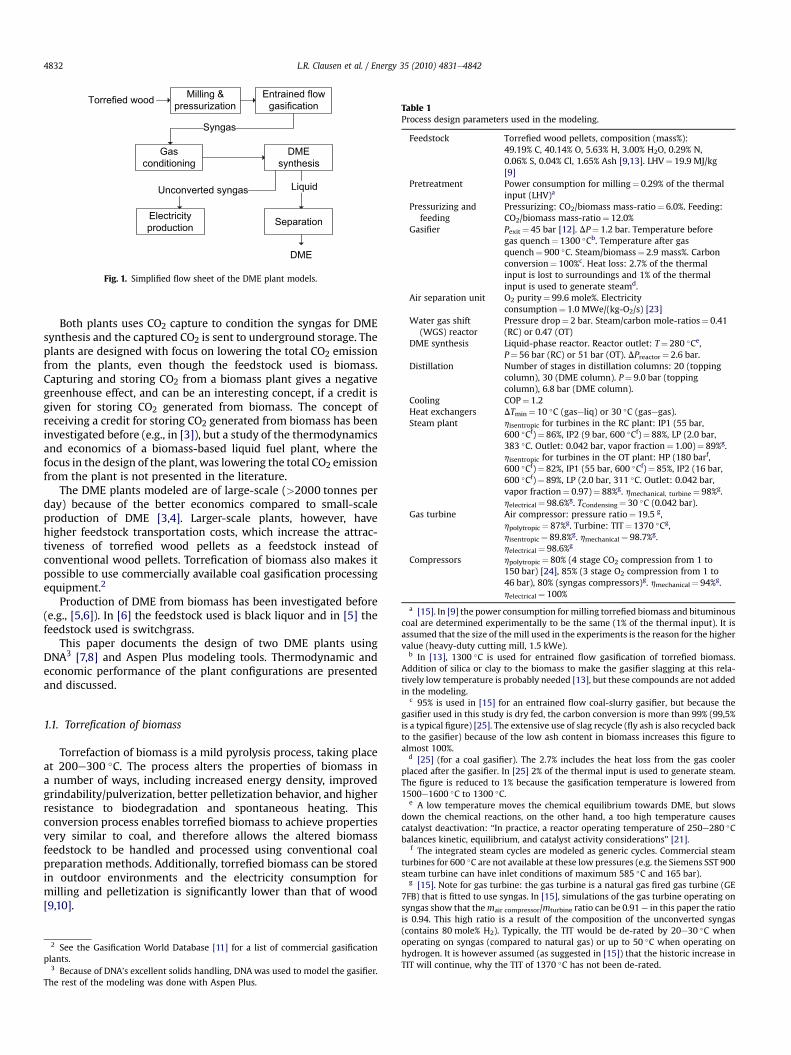
Table 1Process design parameters used in the modeling.
Feedstock Torrefied wood pellets, composition (mass%):49.19% C, 40.14% O, 5.63% H, 3.00% H2O, 0.29% N,0.06% S, 0.04% Cl, 1.65% Ash [9,13]. LHV¼ 19.9 MJ/kg[9]
Pretreatment Power consumption for milling¼ 0.29% of the thermalinput (LHV)a
Pressurizing andfeeding
Pressurizing: CO2/biomass mass-ratio¼ 6.0%. Feeding:CO2/biomass mass-ratio¼ 12.0%
Gasifier Pexit¼ 45 bar [12]. DP¼ 1.2 bar. Temperature beforegas quench¼ 1300 �Cb. Temperature after gasquench¼ 900 �C. Steam/biomass¼ 2.9 mass%. Carbonconversion¼ 100%c. Heat loss: 2.7% of the thermalinput is lost to surroundings and 1% of the thermalinput is used to generate steamd.
Air separation unit O2 purity¼ 99.6 mole%. Electricityconsumption¼ 1.0 MWe/(kg-O2/s) [23]
Water gas shift(WGS) reactor
Pressure drop¼ 2 bar. Steam/carbon mole-ratios¼ 0.41(RC) or 0.47 (OT)
DME synthesis Liquid-phase reactor. Reactor outlet: T¼ 280 �Ce,P¼ 56 bar (RC) or 51 bar (OT). DPreactor¼ 2.6 bar.
Distillation Number of stages in distillation columns: 20 (toppingcolumn), 30 (DME column). P¼ 9.0 bar (toppingcolumn), 6.8 bar (DME column).
Cooling COP¼ 1.2Heat exchangers DTmin¼ 10 �C (gaseliq) or 30 �C (gasegas).Steam plant hisentropic for turbines in the RC plant: IP1 (55 bar,
600 �Cf)¼ 86%, IP2 (9 bar, 600 �Cf)¼ 88%, LP (2.0 bar,383 �C. Outlet: 0.042 bar, vapor fraction¼ 1.00)¼ 89%g.hisentropic for turbines in the OT plant: HP (180 barf,600 �Cf)¼ 82%, IP1 (55 bar, 600 �Cf)¼ 85%, IP2 (16 bar,600 �Cf)¼ 89%, LP (2.0 bar, 311 �C. Outlet: 0.042 bar,vapor fraction¼ 0.97)¼ 88%g. hmechanical, turbine¼ 98%g.helectrical¼ 98.6%g. TCondensing¼ 30 �C (0.042 bar).
Gas turbine Air compressor: pressure ratio¼ 19.5 g,hpolytropic¼ 87%g. Turbine: TIT¼ 1370 �Cg,hisentropic¼ 89.8%g. hmechanical¼ 98.7%g.helectrical¼ 98.6%g
Compressors hpolytropic¼ 80% (4 stage CO2 compression from 1 to150 bar) [24], 85% (3 stage O2 compression from 1 to46 bar), 80% (syngas compressors)g. hmechanical¼ 94%g.helectrical¼ 100%
a [15]. In [9] the power consumption for milling torrefied biomass and bituminouscoal are determined experimentally to be the same (1% of the thermal input). It isassumed that the size of themill used in the experiments is the reason for the highervalue (heavy-duty cutting mill, 1.5 kWe).
b In [13], 1300 �C is used for entrained flow gasification of torrefied biomass.Addition of silica or clay to the biomass to make the gasifier slagging at this rela-tively low temperature is probably needed [13], but these compounds are not addedin the modeling.
Entrained flow gasification
Milling & pressurization
Gas conditioning
DME synthesis
Syngas
Separation
Liquid
Electricity production
Torrefied wood
DME
Unconverted syngas
Fig. 1. Simplified flow sheet of the DME plant models.
L.R. Clausen et al. / Energy 35 (2010) 4831e48424832
Both plants uses CO2 capture to condition the syngas for DMEsynthesis and the captured CO2 is sent to underground storage. Theplants are designed with focus on lowering the total CO2 emissionfrom the plants, even though the feedstock used is biomass.Capturing and storing CO2 from a biomass plant gives a negativegreenhouse effect, and can be an interesting concept, if a credit isgiven for storing CO2 generated from biomass. The concept ofreceiving a credit for storing CO2 generated from biomass has beeninvestigated before (e.g., in [3]), but a study of the thermodynamicsand economics of a biomass-based liquid fuel plant, where thefocus in the design of the plant, was lowering the total CO2 emissionfrom the plant is not presented in the literature.
The DME plants modeled are of large-scale (>2000 tonnes perday) because of the better economics compared to small-scaleproduction of DME [3,4]. Larger-scale plants, however, havehigher feedstock transportation costs, which increase the attrac-tiveness of torrefied wood pellets as a feedstock instead ofconventional wood pellets. Torrefication of biomass also makes itpossible to use commercially available coal gasification processingequipment.2
Production of DME from biomass has been investigated before(e.g., [5,6]). In [6] the feedstock used is black liquor and in [5] thefeedstock used is switchgrass.
This paper documents the design of two DME plants usingDNA3 [7,8] and Aspen Plus modeling tools. Thermodynamic andeconomic performance of the plant configurations are presentedand discussed.
c 95% is used in [15] for an entrained flow coal-slurry gasifier, but because thegasifier used in this study is dry fed, the carbon conversion is more than 99% (99,5%is a typical figure) [25]. The extensive use of slag recycle (fly ash is also recycled backto the gasifier) because of the low ash content in biomass increases this figure toalmost 100%.
d [25] (for a coal gasifier). The 2.7% includes the heat loss from the gas coolerplaced after the gasifier. In [25] 2% of the thermal input is used to generate steam.The figure is reduced to 1% because the gasification temperature is lowered from1500e1600 �C to 1300 �C.
e A low temperature moves the chemical equilibrium towards DME, but slowsdown the chemical reactions, on the other hand, a too high temperature causescatalyst deactivation: “In practice, a reactor operating temperature of 250e280 �Cbalances kinetic, equilibrium, and catalyst activity considerations” [21].
f The integrated steam cycles are modeled as generic cycles. Commercial steamturbines for 600 �C are not available at these low pressures (e.g. the Siemens SST 900steam turbine can have inlet conditions of maximum 585 �C and 165 bar).
g [15]. Note for gas turbine: the gas turbine is a natural gas fired gas turbine (GE7FB) that is fitted to use syngas. In [15], simulations of the gas turbine operating onsyngas show that themair compressor/mturbine ratio can be 0.91e in this paper the ratio
1.1. Torrefication of biomass
Torrefaction of biomass is a mild pyrolysis process, taking placeat 200e300 �C. The process alters the properties of biomass ina number of ways, including increased energy density, improvedgrindability/pulverization, better pelletization behavior, and higherresistance to biodegradation and spontaneous heating. Thisconversion process enables torrefied biomass to achieve propertiesvery similar to coal, and therefore allows the altered biomassfeedstock to be handled and processed using conventional coalpreparation methods. Additionally, torrefied biomass can be storedin outdoor environments and the electricity consumption formilling and pelletization is significantly lower than that of wood[9,10].
is 0.94. This high ratio is a result of the composition of the unconverted syngas(contains 80 mole% H2). Typically, the TIT would be de-rated by 20e30 �C whenoperating on syngas (compared to natural gas) or up to 50 �C when operating onhydrogen. It is however assumed (as suggested in [15]) that the historic increase inTIT will continue, why the TIT of 1370 �C has not been de-rated.
2 See the Gasification World Database [11] for a list of commercial gasificationplants.
3 Because of DNA’s excellent solids handling, DNA was used to model the gasifier.The rest of the modeling was done with Aspen Plus.
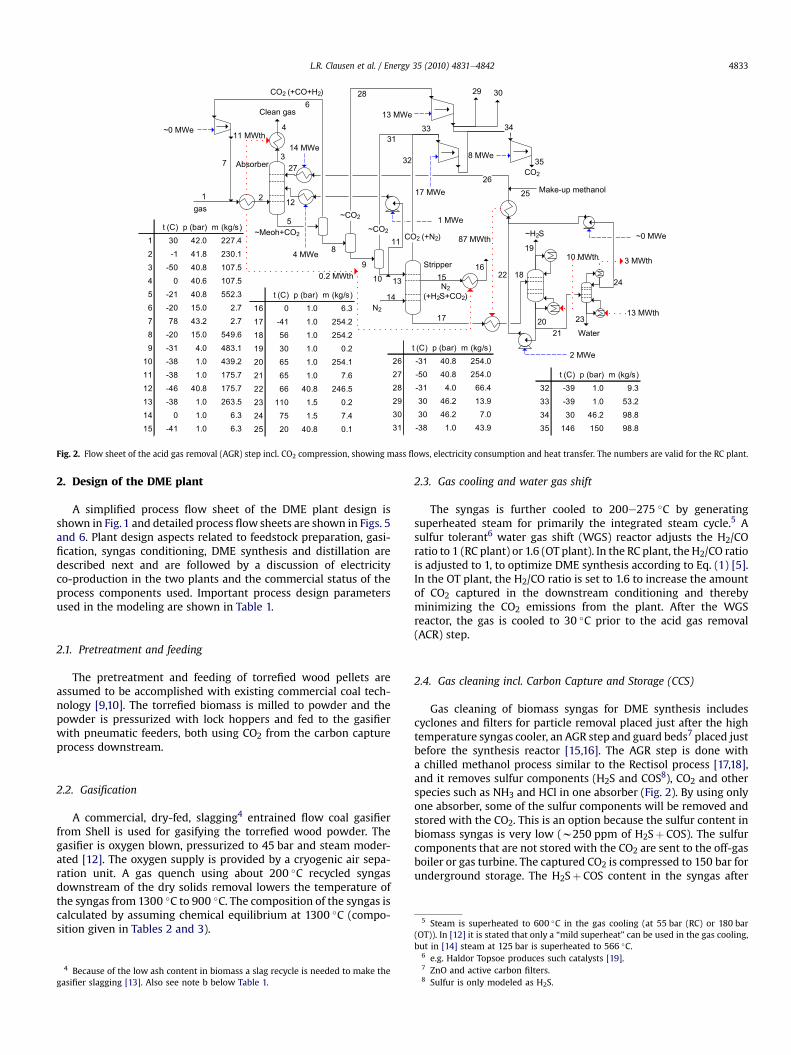
Absorber
5
8
CO2 (+CO+H2)
9
11
273
gas
CO2
7
Stripper
17N2
N2(+H2S+CO2)
CO2 (+N2)
35
344
12
33
32
18
21
19
2320
24
Water
22
25
16
Make-up methanol26
1 MWe
~0 MWe
2 MWe
14 MWe
4 MWe
~0 MWe
8 MWe
17 MWe
13 MWe
11 MWth
87 MWth
10 MWth
13 MWth
3 MWth
0.2 MWth
1 2
6Clean gas
10 13
14
15
28
~H2S
29 30
31
~Meoh+CO2t (C) p (bar) m (kg/s)
1 30 42.0 227.42 -1 41.8 230.13 -50 40.8 107.54 0 40.6 107.55 -21 40.8 552.36 -20 15.0 2.77 78 43.2 2.78 -20 15.0 549.69 -31 4.0 483.1
10 -38 1.0 439.211 -38 1.0 175.712 -46 40.8 175.713 -38 1.0 263.514 0 1.0 6.315 -41 1.0 6.3
t (C) p (bar) m (kg/s)16 0 1.0 6.317 -41 1.0 254.218 56 1.0 254.219 30 1.0 0.220 65 1.0 254.121 65 1.0 7.622 66 40.8 246.523 110 1.5 0.224 75 1.5 7.425 20 40.8 0.1
t (C) p (bar) m (kg/s)26 -31 40.8 254.027 -50 40.8 254.028 -31 4.0 66.429 30 46.2 13.930 30 46.2 7.031 -38 1.0 43.9
t (C) p (bar) m (kg/s)32 -39 1.0 9.333 -39 1.0 53.234 30 46.2 98.835 146 150 98.8
~CO2
~CO2
Fig. 2. Flow sheet of the acid gas removal (AGR) step incl. CO2 compression, showing mass flows, electricity consumption and heat transfer. The numbers are valid for the RC plant.
L.R. Clausen et al. / Energy 35 (2010) 4831e4842 4833
2. Design of the DME plant
A simplified process flow sheet of the DME plant design isshown in Fig.1 and detailed process flow sheets are shown in Figs. 5and 6. Plant design aspects related to feedstock preparation, gasi-fication, syngas conditioning, DME synthesis and distillation aredescribed next and are followed by a discussion of electricityco-production in the two plants and the commercial status of theprocess components used. Important process design parametersused in the modeling are shown in Table 1.
2.1. Pretreatment and feeding
The pretreatment and feeding of torrefied wood pellets areassumed to be accomplished with existing commercial coal tech-nology [9,10]. The torrefied biomass is milled to powder and thepowder is pressurized with lock hoppers and fed to the gasifierwith pneumatic feeders, both using CO2 from the carbon captureprocess downstream.
5 Steam is superheated to 600 �C in the gas cooling (at 55 bar (RC) or 180 bar(OT)). In [12] it is stated that only a “mild superheat” can be used in the gas cooling,
2.2. Gasification
A commercial, dry-fed, slagging4 entrained flow coal gasifierfrom Shell is used for gasifying the torrefied wood powder. Thegasifier is oxygen blown, pressurized to 45 bar and steam moder-ated [12]. The oxygen supply is provided by a cryogenic air sepa-ration unit. A gas quench using about 200 �C recycled syngasdownstream of the dry solids removal lowers the temperature ofthe syngas from 1300 �C to 900 �C. The composition of the syngas iscalculated by assuming chemical equilibrium at 1300 �C (compo-sition given in Tables 2 and 3).
4 Because of the low ash content in biomass a slag recycle is needed to make thegasifier slagging [13]. Also see note b below Table 1.
2.3. Gas cooling and water gas shift
The syngas is further cooled to 200e275 �C by generatingsuperheated steam for primarily the integrated steam cycle.5 Asulfur tolerant6 water gas shift (WGS) reactor adjusts the H2/COratio to 1 (RC plant) or 1.6 (OT plant). In the RC plant, the H2/CO ratiois adjusted to 1, to optimize DME synthesis according to Eq. (1) [5].In the OT plant, the H2/CO ratio is set to 1.6 to increase the amountof CO2 captured in the downstream conditioning and therebyminimizing the CO2 emissions from the plant. After the WGSreactor, the gas is cooled to 30 �C prior to the acid gas removal(ACR) step.
2.4. Gas cleaning incl. Carbon Capture and Storage (CCS)
Gas cleaning of biomass syngas for DME synthesis includescyclones and filters for particle removal placed just after the hightemperature syngas cooler, an AGR step and guard beds7 placed justbefore the synthesis reactor [15,16]. The AGR step is done witha chilled methanol process similar to the Rectisol process [17,18],and it removes sulfur components (H2S and COS8), CO2 and otherspecies such as NH3 and HCl in one absorber (Fig. 2). By using onlyone absorber, some of the sulfur components will be removed andstored with the CO2. This is an option because the sulfur content inbiomass syngas is very low (w250 ppm of H2Sþ COS). The sulfurcomponents that are not stored with the CO2 are sent to the off-gasboiler or gas turbine. The captured CO2 is compressed to 150 bar forunderground storage. The H2Sþ COS content in the syngas after
but in [14] steam at 125 bar is superheated to 566 �C.6 e.g. Haldor Topsoe produces such catalysts [19].7 ZnO and active carbon filters.8 Sulfur is only modeled as H2S.
IP187 MWe
143 MWth
98 MWth Evaporator
17 MWth
WGS reactor
Gas cooler
Condensing heatexchanger
78 MWth 60 MWth 54 MWth
3 MWthWater22 MWth
DME reactor
IP2
Condenser
Gas cleaning
To gas quench
Gasfrom
gasifier
Boiler
LP
Gasifier
Reboiler (in AGR section)
Distillation section
5 MWth
DME synthesis section
Gasifier 23 MWth
Evaporator
278 MWth
31
16
41 MWth
13 MWth
1 2 3 4 5
1314
17
6 78
9
10
11121819
20
23
21
22
24
25
27
32
30
15
t (C) p (bar) m (kg/s)1 900 45.0 287.82 407 44.9 287.83 372 44.8 287.84 200 44.7 287.85 321 42.3 186.86 130 42.1 186.87 40 42.0 175.38 30 42.0 175.19 30 55.0 171.6
t (C) p (bar) m (kg/s)10 57 55.0 39.511 120 55.0 132.112 213 55.0 132.113 177 55.0 168.614 270 55.0 158.315 270 55.0 181.8
t (C) p (bar) m (kg/s)16 270 55.0 10.017 270 55.0 171.818 270 55.0 10.319 270 55.0 182.120 600 55.0 3.121 600 55.0 179.0
t (C) p (bar) m (kg/s)22 344 9.0 179.023 600 9.0 179.024 383 2.0 179.025 383 2.0 4.826 120 2.0 4.827 156 0.24 15.628 66 0.24 15.629 57 55.0 3.030 83 55.0 23.631 270 55.0 23.632 30 0.042 158.533 20 1.0 13.1
Water
29
2628
79 MWe
112 MWe
Water
33
Fig. 3. Flow sheet of the power production part in the RC plant, showing mass flows, electricity production and heat transfer.
L.R. Clausen et al. / Energy 35 (2010) 4831e48424834
AGR is about 0.1 ppm9 [20] and the CO2 content is 0.1 mole% (RC) or3 mole% (OT).10
The energy input for the AGR process is primarily electricity topower a cooling plant, but electricity is also used to run pumps thatpressurize the methanol solvent.
2.5. Synthesis of DME
The syngas is compressed to 55e60 bar before entering thesynthesis reactor. The reactor is modeled as a liquid-phase reactoroperating at 280 �C, where the product gas is assumed to be inchemical equilibrium.11 Besides the production of DME (Eqs. (1)and (2)) in the reactor, methanol is also produced in small quan-tities (Eq. (3)), and promoted by a high H2/CO ratio. The reactoroperating temperature is maintained at 280 �C by a water-jacketedcooler that generates saturated steam at 270 �C (55 bar). Thereactor product gas is cooled to �37 �C (RC)12 or �50 �C (OT) inorder to dissolve most of the CO2 in the liquid DME and a gas-liquidseparator separates the liquid from the unconverted syngas. In theRC plant, 95% of the unconverted syngas is recycled to the synthesisreactor and the remaining 5% is sent to an off-gas boiler thataugments the steam generation for electricity co-production in the
9 The simulations show even lower sulfur content, but it is not known if this iscredible.10 Some CO2 is left in the syngas to ensure catalyst activity in the DME reactor[21]. In the RC plant, the CO2 will be supplied by the recycled unconverted syngas.11 Assuming chemical equilibrium at 280 �C and 56 bar corresponds to a COconversion of 81% (RC plant). In practice, chemical equilibriumwill not be obtained.The Japanese slurry phase reactor (similar to the liquid-phase reactor) by JFE hasachieved 55e64% CO conversion (depending on catalyst loading) at a 100 t/daypilot plant operating at 260 �C and 50 bar and H2/CO¼ 1 [22]. The consequences ofassuming chemical equilibrium are discussed in Section 3.1.12 As mentioned in the paragraph about gas cleaning some CO2 is needed in therecycled unconverted syngas. When the stream is cooled to �37 �C, the rightamount of CO2 is kept in the gas phase.
Rankine power cycle. In the OT plant, the unconverted syngas issent to a combined cycle.
In both the RC and the OT plant, the DME reactor pressure andtemperature, and the cooling temperature before the gas-liquidseparator have been optimized to improve the conversion effi-ciencies of biomass to DME and electricity. In both plants, the DMEreactor temperature is kept as high as possible (280 �C) to ensureamore efficient conversion of thewaste heat to electricity. In the RCplant, the reactor pressure (56 bar) and the cooling temperature(�37 �C) have been optimized to lower the combined electricityconsumption of the syngas compressor and the cooling plant. In theOT plant the cooling temperature is set at �50 �C to dissolve mostof the CO2 in the liquid DME, while the reactor pressure (53 bar) isset so that the right amount of unconverted syngas is available forthe gas turbine (see the section belowabout the power production).
3H2þ 3CO4 CH3OCH3þ CO2 (1)
4H2þ 2CO4 CH3OCH3þH2O (2)
4H2þ 2CO4 2CH3OH (3)
2.6. Distillation
The liquid stream from the gas-liquid separator is distilled byfractional distillation in two columns. The first column isa topping column separating the absorbed gasses from the liquids.The gas from the topping column consisting mainly of CO2 iscompressed and recycled back to the AGR mentioned earlier. Thesecond column separates the water and methanol from the DME.The DME liquid product achieves a purity of 99.99 mole%. Thewater is either sent to waste water treatment or evaporated andinjected into the gasifier. The methanol is in the OT plant sent to
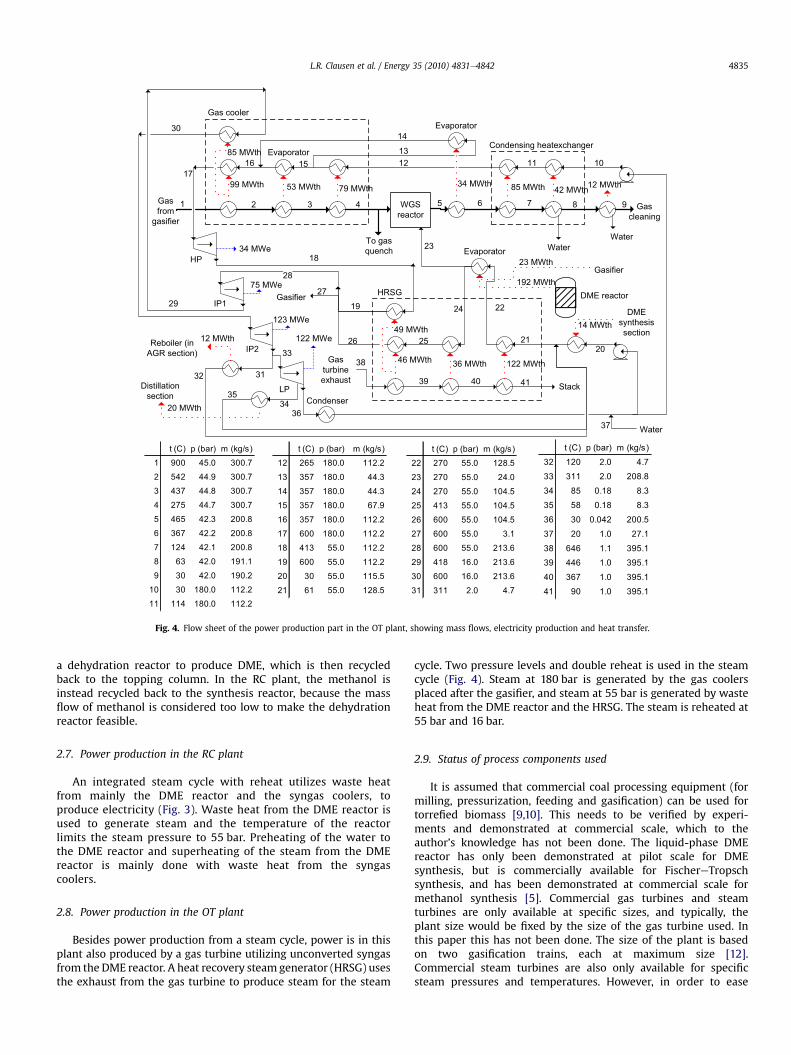
1716
HP 1834 MWe
99 MWth
85 MWth Evaporator
2
53 MWth
3 4 WGS reactor
5
12
Gas cooler
Condensing heatexchanger
11 10
6 7 8
30 Evaporator
13
79 MWth 34 MWth 85 MWth 42 MWth
9
14 MWth
Water
25
46 MWth
49 MWth
39
36 MWth
40
HRSG19
122 MWth
41
DME reactor
Evaporator
192 MWth
IP1
IP2
29
36Condenser
Gas cleaning
To gas quench
Gas from
gasifier
2620
Gas turbine exhaust
Stack
28
37
LP
33
Gasifier
Reboiler (in AGR section)
31
34
Distillation section
Gasifier23 MWth
12 MWth
35
21
32
20 MWth
12 MWth
1
Water
DME synthesis section
t (C) p (bar) m (kg/s)1 900 45.0 300.72 542 44.9 300.73 437 44.8 300.74 275 44.7 300.75 465 42.3 200.86 367 42.2 200.87 124 42.1 200.88 63 42.0 191.19 30 42.0 190.2
10 30 180.0 112.211 114 180.0 112.2
t (C) p (bar) m (kg/s)12 265 180.0 112.213 357 180.0 44.314 357 180.0 44.315 357 180.0 67.916 357 180.0 112.217 600 180.0 112.218 413 55.0 112.219 600 55.0 112.220 30 55.0 115.521 61 55.0 128.5
t (C) p (bar) m (kg/s)22 270 55.0 128.523 270 55.0 24.024 270 55.0 104.525 413 55.0 104.526 600 55.0 104.527 600 55.0 3.128 600 55.0 213.629 418 16.0 213.630 600 16.0 213.631 311 2.0 4.7
t (C) p (bar) m (kg/s)32 120 2.0 4.733 311 2.0 208.834 85 0.18 8.335 58 0.18 8.336 30 0.042 200.537 20 1.0 27.138 646 1.1 395.139 446 1.0 395.140 367 1.0 395.141 90 1.0 395.1
Water
15
14
2224
23
27
38
75 MWe
123 MWe
122 MWe
Fig. 4. Flow sheet of the power production part in the OT plant, showing mass flows, electricity production and heat transfer.
L.R. Clausen et al. / Energy 35 (2010) 4831e4842 4835
a dehydration reactor to produce DME, which is then recycledback to the topping column. In the RC plant, the methanol isinstead recycled back to the synthesis reactor, because the massflow of methanol is considered too low to make the dehydrationreactor feasible.
2.7. Power production in the RC plant
An integrated steam cycle with reheat utilizes waste heatfrom mainly the DME reactor and the syngas coolers, toproduce electricity (Fig. 3). Waste heat from the DME reactor isused to generate steam and the temperature of the reactorlimits the steam pressure to 55 bar. Preheating of the water tothe DME reactor and superheating of the steam from the DMEreactor is mainly done with waste heat from the syngascoolers.
2.8. Power production in the OT plant
Besides power production from a steam cycle, power is in thisplant also produced by a gas turbine utilizing unconverted syngasfrom the DME reactor. A heat recovery steam generator (HRSG) usesthe exhaust from the gas turbine to produce steam for the steam
cycle. Two pressure levels and double reheat is used in the steamcycle (Fig. 4). Steam at 180 bar is generated by the gas coolersplaced after the gasifier, and steam at 55 bar is generated by wasteheat from the DME reactor and the HRSG. The steam is reheated at55 bar and 16 bar.
2.9. Status of process components used
It is assumed that commercial coal processing equipment (formilling, pressurization, feeding and gasification) can be used fortorrefied biomass [9,10]. This needs to be verified by experi-ments and demonstrated at commercial scale, which to theauthor’s knowledge has not been done. The liquid-phase DMEreactor has only been demonstrated at pilot scale for DMEsynthesis, but is commercially available for FischereTropschsynthesis, and has been demonstrated at commercial scale formethanol synthesis [5]. Commercial gas turbines and steamturbines are only available at specific sizes, and typically, theplant size would be fixed by the size of the gas turbine used. Inthis paper this has not been done. The size of the plant is basedon two gasification trains, each at maximum size [12].Commercial steam turbines are also only available for specificsteam pressures and temperatures. However, in order to ease
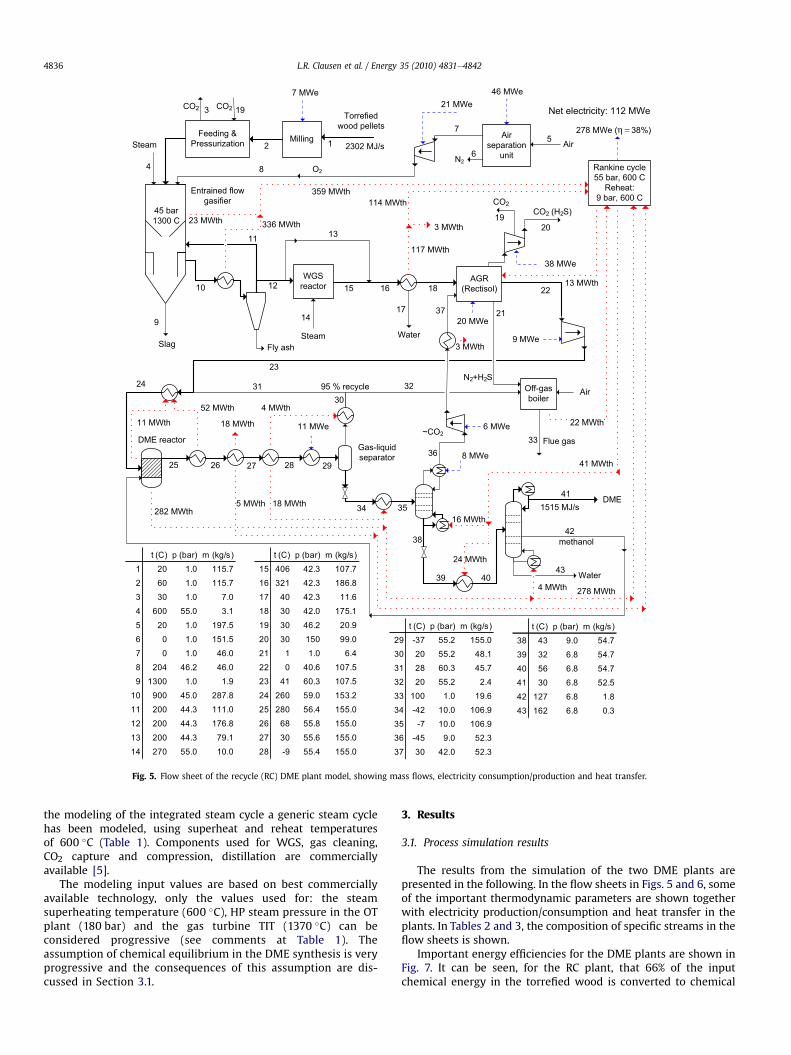
Air separation
unit
Fly ash
Milling
N2
Air
Torrefiedwood pellets
WGSreactor
AGR (Rectisol)12 18
DME reactorGas-liquid separator
29
CO2
Feeding & Pressurization
7 MWe
Off-gas boiler
Air
DME
Water
95 % recycle
Flue gas
N2+H2S
25
1
31
4 8
3
~CO2
23
Water
17
42
Rankine cycle55 bar, 600 C
Reheat: 9 bar, 600 C
336 MWth
22 MWth
117 MWth
278 MWe ( 38%)
282 MWth 1515 MJ/s
CO2 (H2S)
20
46 MWe
38 MWe
7
21 MWe
9 MWe
5 MWth
Slag
9 20 MWe
10
11
Entrained flow gasifier
45 bar1300 C
Steam
41
8 MWe
13
Steam
14
CO2
27
O2
methanol
4 MWth
18 MWth
26
11 MWe11 MWth
52 MWth
4043
278 MWth4 MWth
34 35
39
30
24 MWth
6 MWe
28
24
41 MWth
16 MWth
15 16
18 MWth
36
37
32
1923 MWth
359 MWth
3 MWth
3 MWth
114 MWth
25
6
21
22
33
38
t (C) p (bar) m (kg/s)1 20 1.0 115.72 60 1.0 115.73 30 1.0 7.04 600 55.0 3.15 20 1.0 197.56 0 1.0 151.57 0 1.0 46.08 204 46.2 46.09 1300 1.0 1.9
10 900 45.0 287.811 200 44.3 111.012 200 44.3 176.813 200 44.3 79.114 270 55.0 10.0
t (C) p (bar) m (kg/s)15 406 42.3 107.716 321 42.3 186.817 40 42.3 11.618 30 42.0 175.119 30 46.2 20.920 30 150 99.021 1 1.0 6.422 0 40.6 107.523 41 60.3 107.524 260 59.0 153.225 280 56.4 155.026 68 55.8 155.027 30 55.6 155.028 -9 55.4 155.0
t (C) p (bar) m (kg/s)29 -37 55.2 155.030 20 55.2 48.131 28 60.3 45.732 20 55.2 2.433 100 1.0 19.634 -42 10.0 106.935 -7 10.0 106.936 -45 9.0 52.337 30 42.0 52.3
t (C) p (bar) m (kg/s)38 43 9.0 54.739 32 6.8 54.740 56 6.8 54.741 30 6.8 52.542 127 6.8 1.843 162 6.8 0.3
Net electricity: 112 MWe
2302 MJ/s
13 MWth
CO2 19
Fig. 5. Flow sheet of the recycle (RC) DME plant model, showing mass flows, electricity consumption/production and heat transfer.
L.R. Clausen et al. / Energy 35 (2010) 4831e48424836
the modeling of the integrated steam cycle a generic steam cyclehas been modeled, using superheat and reheat temperaturesof 600 �C (Table 1). Components used for WGS, gas cleaning,CO2 capture and compression, distillation are commerciallyavailable [5].
The modeling input values are based on best commerciallyavailable technology, only the values used for: the steamsuperheating temperature (600 �C), HP steam pressure in the OTplant (180 bar) and the gas turbine TIT (1370 �C) can beconsidered progressive (see comments at Table 1). Theassumption of chemical equilibrium in the DME synthesis is veryprogressive and the consequences of this assumption are dis-cussed in Section 3.1.
3. Results
3.1. Process simulation results
The results from the simulation of the two DME plants arepresented in the following. In the flow sheets in Figs. 5 and 6, someof the important thermodynamic parameters are shown togetherwith electricity production/consumption and heat transfer in theplants. In Tables 2 and 3, the composition of specific streams in theflow sheets is shown.
Important energy efficiencies for the DME plants are shown inFig. 7. It can be seen, for the RC plant, that 66% of the inputchemical energy in the torrefied wood is converted to chemical
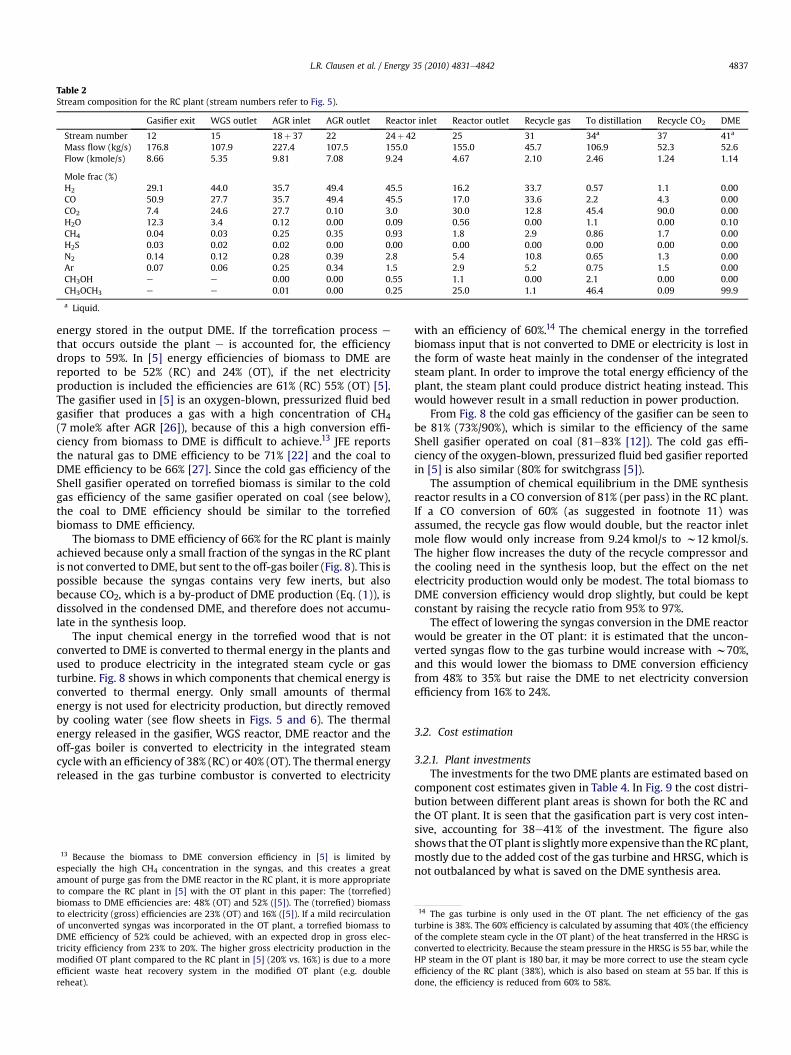
Table 2Stream composition for the RC plant (stream numbers refer to Fig. 5).
Gasifier exit WGS outlet AGR inlet AGR outlet Reactor inlet Reactor outlet Recycle gas To distillation Recycle CO2 DME
Stream number 12 15 18þ 37 22 24þ 42 25 31 34a 37 41a
Mass flow (kg/s) 176.8 107.9 227.4 107.5 155.0 155.0 45.7 106.9 52.3 52.6Flow (kmole/s) 8.66 5.35 9.81 7.08 9.24 4.67 2.10 2.46 1.24 1.14
Mole frac (%)H2 29.1 44.0 35.7 49.4 45.5 16.2 33.7 0.57 1.1 0.00CO 50.9 27.7 35.7 49.4 45.5 17.0 33.6 2.2 4.3 0.00CO2 7.4 24.6 27.7 0.10 3.0 30.0 12.8 45.4 90.0 0.00H2O 12.3 3.4 0.12 0.00 0.09 0.56 0.00 1.1 0.00 0.10CH4 0.04 0.03 0.25 0.35 0.93 1.8 2.9 0.86 1.7 0.00H2S 0.03 0.02 0.02 0.00 0.00 0.00 0.00 0.00 0.00 0.00N2 0.14 0.12 0.28 0.39 2.8 5.4 10.8 0.65 1.3 0.00Ar 0.07 0.06 0.25 0.34 1.5 2.9 5.2 0.75 1.5 0.00CH3OH e e 0.00 0.00 0.55 1.1 0.00 2.1 0.00 0.00CH3OCH3 e e 0.01 0.00 0.25 25.0 1.1 46.4 0.09 99.9
a Liquid.
L.R. Clausen et al. / Energy 35 (2010) 4831e4842 4837
energy stored in the output DME. If the torrefication process e
that occurs outside the plant e is accounted for, the efficiencydrops to 59%. In [5] energy efficiencies of biomass to DME arereported to be 52% (RC) and 24% (OT), if the net electricityproduction is included the efficiencies are 61% (RC) 55% (OT) [5].The gasifier used in [5] is an oxygen-blown, pressurized fluid bedgasifier that produces a gas with a high concentration of CH4(7 mole% after AGR [26]), because of this a high conversion effi-ciency from biomass to DME is difficult to achieve.13 JFE reportsthe natural gas to DME efficiency to be 71% [22] and the coal toDME efficiency to be 66% [27]. Since the cold gas efficiency of theShell gasifier operated on torrefied biomass is similar to the coldgas efficiency of the same gasifier operated on coal (see below),the coal to DME efficiency should be similar to the torrefiedbiomass to DME efficiency.
The biomass to DME efficiency of 66% for the RC plant is mainlyachieved because only a small fraction of the syngas in the RC plantis not converted to DME, but sent to the off-gas boiler (Fig. 8). This ispossible because the syngas contains very few inerts, but alsobecause CO2, which is a by-product of DME production (Eq. (1)), isdissolved in the condensed DME, and therefore does not accumu-late in the synthesis loop.
The input chemical energy in the torrefied wood that is notconverted to DME is converted to thermal energy in the plants andused to produce electricity in the integrated steam cycle or gasturbine. Fig. 8 shows in which components that chemical energy isconverted to thermal energy. Only small amounts of thermalenergy is not used for electricity production, but directly removedby cooling water (see flow sheets in Figs. 5 and 6). The thermalenergy released in the gasifier, WGS reactor, DME reactor and theoff-gas boiler is converted to electricity in the integrated steamcycle with an efficiency of 38% (RC) or 40% (OT). The thermal energyreleased in the gas turbine combustor is converted to electricity
13 Because the biomass to DME conversion efficiency in [5] is limited byespecially the high CH4 concentration in the syngas, and this creates a greatamount of purge gas from the DME reactor in the RC plant, it is more appropriateto compare the RC plant in [5] with the OT plant in this paper: The (torrefied)biomass to DME efficiencies are: 48% (OT) and 52% ([5]). The (torrefied) biomassto electricity (gross) efficiencies are 23% (OT) and 16% ([5]). If a mild recirculationof unconverted syngas was incorporated in the OT plant, a torrefied biomass toDME efficiency of 52% could be achieved, with an expected drop in gross elec-tricity efficiency from 23% to 20%. The higher gross electricity production in themodified OT plant compared to the RC plant in [5] (20% vs. 16%) is due to a moreefficient waste heat recovery system in the modified OT plant (e.g. doublereheat).
with an efficiency of 60%.14 The chemical energy in the torrefiedbiomass input that is not converted to DME or electricity is lost inthe form of waste heat mainly in the condenser of the integratedsteam plant. In order to improve the total energy efficiency of theplant, the steam plant could produce district heating instead. Thiswould however result in a small reduction in power production.
From Fig. 8 the cold gas efficiency of the gasifier can be seen tobe 81% (73%/90%), which is similar to the efficiency of the sameShell gasifier operated on coal (81e83% [12]). The cold gas effi-ciency of the oxygen-blown, pressurized fluid bed gasifier reportedin [5] is also similar (80% for switchgrass [5]).
The assumption of chemical equilibrium in the DME synthesisreactor results in a CO conversion of 81% (per pass) in the RC plant.If a CO conversion of 60% (as suggested in footnote 11) wasassumed, the recycle gas flow would double, but the reactor inletmole flow would only increase from 9.24 kmol/s to w12 kmol/s.The higher flow increases the duty of the recycle compressor andthe cooling need in the synthesis loop, but the effect on the netelectricity production would only be modest. The total biomass toDME conversion efficiency would drop slightly, but could be keptconstant by raising the recycle ratio from 95% to 97%.
The effect of lowering the syngas conversion in the DME reactorwould be greater in the OT plant: it is estimated that the uncon-verted syngas flow to the gas turbine would increase with w70%,and this would lower the biomass to DME conversion efficiencyfrom 48% to 35% but raise the DME to net electricity conversionefficiency from 16% to 24%.
3.2. Cost estimation
3.2.1. Plant investmentsThe investments for the two DME plants are estimated based on
component cost estimates given in Table 4. In Fig. 9 the cost distri-bution between different plant areas is shown for both the RC andthe OT plant. It is seen that the gasification part is very cost inten-sive, accounting for 38e41% of the investment. The figure alsoshows that theOTplant is slightlymore expensive than the RCplant,mostly due to the added cost of the gas turbine and HRSG, which isnot outbalanced by what is saved on the DME synthesis area.
14 The gas turbine is only used in the OT plant. The net efficiency of the gasturbine is 38%. The 60% efficiency is calculated by assuming that 40% (the efficiencyof the complete steam cycle in the OT plant) of the heat transferred in the HRSG isconverted to electricity. Because the steam pressure in the HRSG is 55 bar, while theHP steam in the OT plant is 180 bar, it may be more correct to use the steam cycleefficiency of the RC plant (38%), which is also based on steam at 55 bar. If this isdone, the efficiency is reduced from 60% to 58%.
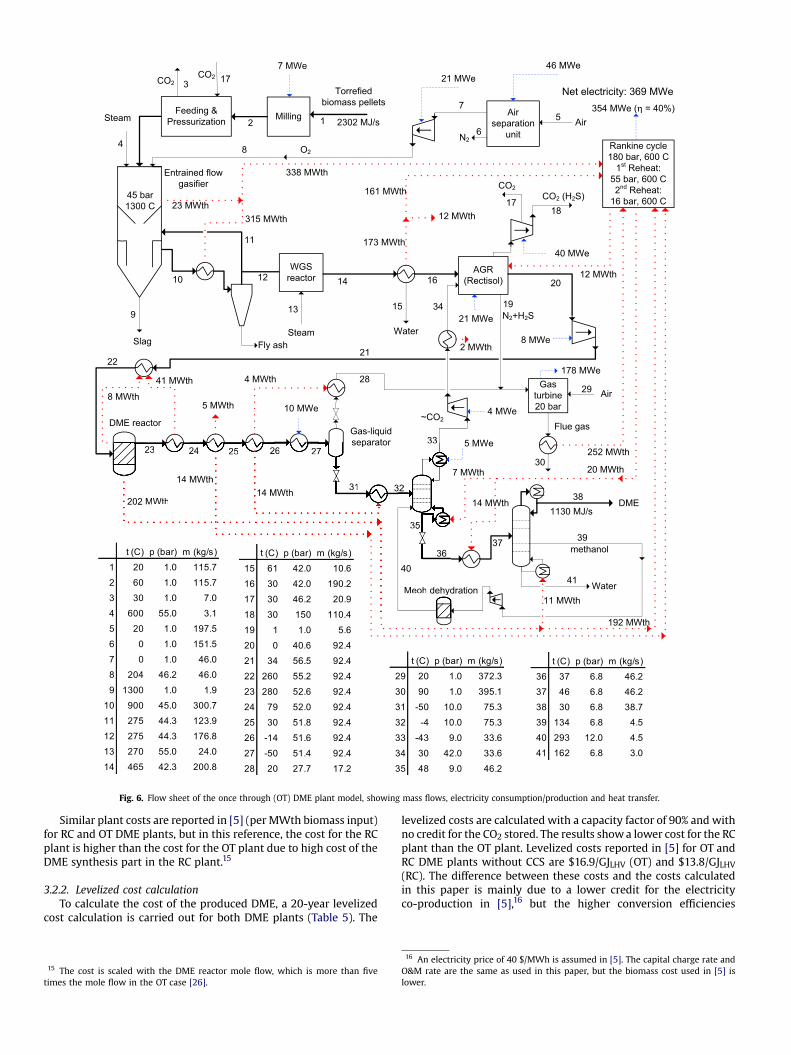
Airseparation
unit
Fly ash
Milling
N2
Air
Torrefiedbiomass pellets
WGSreactor
AGR(Rectisol)12 16
DME reactorGas-liquidseparator
23 27
CO2
Feeding &Pressurization
7 MWe
Gasturbine20 bar
Air
DME
Water
Flue gas
30
1
4 8
17
~CO2
21
Water
15
39
Rankine cycle180 bar, 600 C
1st Reheat:55 bar, 600 C2nd Reheat:
16 bar, 600 C
315 MWth
252 MWth
173 MWth
354 MWe ( = 40%)
202 MWth
20 MWth
1130 MJ/s
CO2 (H2S)18
46 MWe
40 MWe
7
21 MWe
8 MWe
14 MWth
Slag
9 21 MWe
10
11
Entrained flowgasifier
45 bar1300 C
Steam
38
5 MWe
34
Steam
13
CO2
25
O2
methanol
4 MWth
14 MWth 31
24
37
10 MWe8 MWth
41 MWth
41
11 MWth
32
28
4 MWe
26
22
14
5 MWth
33
17
35
178 MWe
192 MWth
Meoh dehydration
separator23 27
202 MWth
14 MWth
25
14 MWth 31
24
32
2633
35
Meoh dehyd
40
20
12 MWth
N2+H2S
23 MWth
2 MWth
161 MWth
36
14 MWth
7 MWth
338 MWth
12 MWth
CO2 3
2 56
19
29
t (C) p (bar) m (kg/s)15 61 42.0 10.616 30 42.0 190.217 30 46.2 20.918 30 150 110.419 1 1.0 5.620 0 40.6 92.421 34 56.5 92.422 260 55.2 92.423 280 52.6 92.424 79 52.0 92.425 30 51.8 92.426 -14 51.6 92.427 -50 51.4 92.428 20 27.7 17.2
t (C) p (bar) m (kg/s)29 20 1.0 372.330 90 1.0 395.131 -50 10.0 75.332 -4 10.0 75.333 -43 9.0 33.634 30 42.0 33.635 48 9.0 46.2
t (C) p (bar) m (kg/s)36 37 6.8 46.237 46 6.8 46.238 30 6.8 38.739 134 6.8 4.540 293 12.0 4.541 162 6.8 3.0
t (C) p (bar) m (kg/s)1 20 1.0 115.72 60 1.0 115.73 30 1.0 7.04 600 55.0 3.15 20 1.0 197.56 0 1.0 151.57 0 1.0 46.08 204 46.2 46.09 1300 1.0 1.9
10 900 45.0 300.711 275 44.3 123.912 275 44.3 176.813 270 55.0 24.014 465 42.3 200.8
Net electricity: 369 MWe
2302 MJ/s
Fig. 6. Flow sheet of the once through (OT) DME plant model, showing mass flows, electricity consumption/production and heat transfer.
Similar plant costs are reported in [5] (per MWth biomass input)for RC and OT DME plants, but in this reference, the cost for the RCplant is higher than the cost for the OT plant due to high cost of theDME synthesis part in the RC plant.15
3.2.2. Levelized cost calculationTo calculate the cost of the produced DME, a 20-year levelized
cost calculation is carried out for both DME plants (Table 5). The
15 The cost is scaled with the DME reactor mole flow, which is more than fivetimes the mole flow in the OT case [26].
levelized costs are calculated with a capacity factor of 90% and withno credit for the CO2 stored. The results showa lower cost for the RCplant than the OT plant. Levelized costs reported in [5] for OT andRC DME plants without CCS are $16.9/GJLHV (OT) and $13.8/GJLHV(RC). The difference between these costs and the costs calculatedin this paper is mainly due to a lower credit for the electricityco-production in [5],16 but the higher conversion efficiencies
16 An electricity price of 40 $/MWh is assumed in [5]. The capital charge rate andO&M rate are the same as used in this paper, but the biomass cost used in [5] islower.
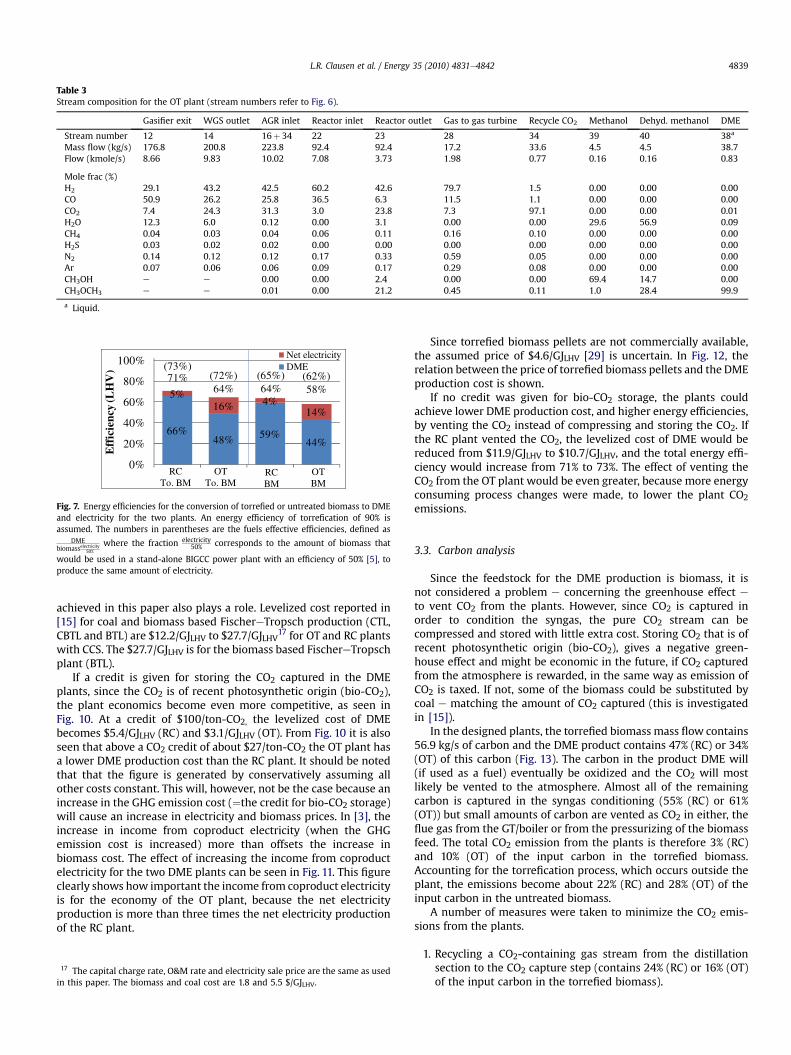
Table 3Stream composition for the OT plant (stream numbers refer to Fig. 6).
Gasifier exit WGS outlet AGR inlet Reactor inlet Reactor outlet Gas to gas turbine Recycle CO2 Methanol Dehyd. methanol DME
Stream number 12 14 16þ 34 22 23 28 34 39 40 38a
Mass flow (kg/s) 176.8 200.8 223.8 92.4 92.4 17.2 33.6 4.5 4.5 38.7Flow (kmole/s) 8.66 9.83 10.02 7.08 3.73 1.98 0.77 0.16 0.16 0.83
Mole frac (%)H2 29.1 43.2 42.5 60.2 42.6 79.7 1.5 0.00 0.00 0.00CO 50.9 26.2 25.8 36.5 6.3 11.5 1.1 0.00 0.00 0.00CO2 7.4 24.3 31.3 3.0 23.8 7.3 97.1 0.00 0.00 0.01H2O 12.3 6.0 0.12 0.00 3.1 0.00 0.00 29.6 56.9 0.09CH4 0.04 0.03 0.04 0.06 0.11 0.16 0.10 0.00 0.00 0.00H2S 0.03 0.02 0.02 0.00 0.00 0.00 0.00 0.00 0.00 0.00N2 0.14 0.12 0.12 0.17 0.33 0.59 0.05 0.00 0.00 0.00Ar 0.07 0.06 0.06 0.09 0.17 0.29 0.08 0.00 0.00 0.00CH3OH e e 0.00 0.00 2.4 0.00 0.00 69.4 14.7 0.00CH3OCH3 e e 0.01 0.00 21.2 0.45 0.11 1.0 28.4 99.9
a Liquid.
66%48% 59%
44%
5%16% 4%
14%
0%
20%
40%
60%
80%
100%
)V
HL(
ycneiciffE
Net electricityDME
RCBM
RCTo. BM
OTTo. BM
71%
OTBM
(62%)58%
(65%)64%
(72%)64%
(73%)
Fig. 7. Energy efficiencies for the conversion of torrefied or untreated biomass to DMEand electricity for the two plants. An energy efficiency of torrefication of 90% isassumed. The numbers in parentheses are the fuels effective efficiencies, defined as
DMEbiomasselectricity50%
where the fraction electricity50% corresponds to the amount of biomass that
would be used in a stand-alone BIGCC power plant with an efficiency of 50% [5], toproduce the same amount of electricity.
L.R. Clausen et al. / Energy 35 (2010) 4831e4842 4839
achieved in this paper also plays a role. Levelized cost reported in[15] for coal and biomass based FischereTropsch production (CTL,CBTL and BTL) are $12.2/GJLHV to $27.7/GJLHV17 for OT and RC plantswith CCS. The $27.7/GJLHV is for the biomass based FischereTropschplant (BTL).
If a credit is given for storing the CO2 captured in the DMEplants, since the CO2 is of recent photosynthetic origin (bio-CO2),the plant economics become even more competitive, as seen inFig. 10. At a credit of $100/ton-CO2, the levelized cost of DMEbecomes $5.4/GJLHV (RC) and $3.1/GJLHV (OT). From Fig. 10 it is alsoseen that above a CO2 credit of about $27/ton-CO2 the OT plant hasa lower DME production cost than the RC plant. It should be notedthat that the figure is generated by conservatively assuming allother costs constant. This will, however, not be the case because anincrease in the GHG emission cost (¼the credit for bio-CO2 storage)will cause an increase in electricity and biomass prices. In [3], theincrease in income from coproduct electricity (when the GHGemission cost is increased) more than offsets the increase inbiomass cost. The effect of increasing the income from coproductelectricity for the two DME plants can be seen in Fig. 11. This figureclearly shows how important the income from coproduct electricityis for the economy of the OT plant, because the net electricityproduction is more than three times the net electricity productionof the RC plant.
17 The capital charge rate, O&M rate and electricity sale price are the same as usedin this paper. The biomass and coal cost are 1.8 and 5.5 $/GJLHV.
Since torrefied biomass pellets are not commercially available,the assumed price of $4.6/GJLHV [29] is uncertain. In Fig. 12, therelation between the price of torrefied biomass pellets and the DMEproduction cost is shown.
If no credit was given for bio-CO2 storage, the plants couldachieve lower DME production cost, and higher energy efficiencies,by venting the CO2 instead of compressing and storing the CO2. Ifthe RC plant vented the CO2, the levelized cost of DME would bereduced from $11.9/GJLHV to $10.7/GJLHV, and the total energy effi-ciency would increase from 71% to 73%. The effect of venting theCO2 from the OT plant would be even greater, because more energyconsuming process changes were made, to lower the plant CO2emissions.
3.3. Carbon analysis
Since the feedstock for the DME production is biomass, it isnot considered a problem e concerning the greenhouse effect e
to vent CO2 from the plants. However, since CO2 is captured inorder to condition the syngas, the pure CO2 stream can becompressed and stored with little extra cost. Storing CO2 that is ofrecent photosynthetic origin (bio-CO2), gives a negative green-house effect and might be economic in the future, if CO2 capturedfrom the atmosphere is rewarded, in the same way as emission ofCO2 is taxed. If not, some of the biomass could be substituted bycoal e matching the amount of CO2 captured (this is investigatedin [15]).
In the designed plants, the torrefied biomass mass flow contains56.9 kg/s of carbon and the DME product contains 47% (RC) or 34%(OT) of this carbon (Fig. 13). The carbon in the product DME will(if used as a fuel) eventually be oxidized and the CO2 will mostlikely be vented to the atmosphere. Almost all of the remainingcarbon is captured in the syngas conditioning (55% (RC) or 61%(OT)) but small amounts of carbon are vented as CO2 in either, theflue gas from the GT/boiler or from the pressurizing of the biomassfeed. The total CO2 emission from the plants is therefore 3% (RC)and 10% (OT) of the input carbon in the torrefied biomass.Accounting for the torrefication process, which occurs outside theplant, the emissions become about 22% (RC) and 28% (OT) of theinput carbon in the untreated biomass.
A number of measures were taken to minimize the CO2 emis-sions from the plants.
1. Recycling a CO2-containing gas stream from the distillationsection to the CO2 capture step (contains 24% (RC) or 16% (OT)of the input carbon in the torrefied biomass).
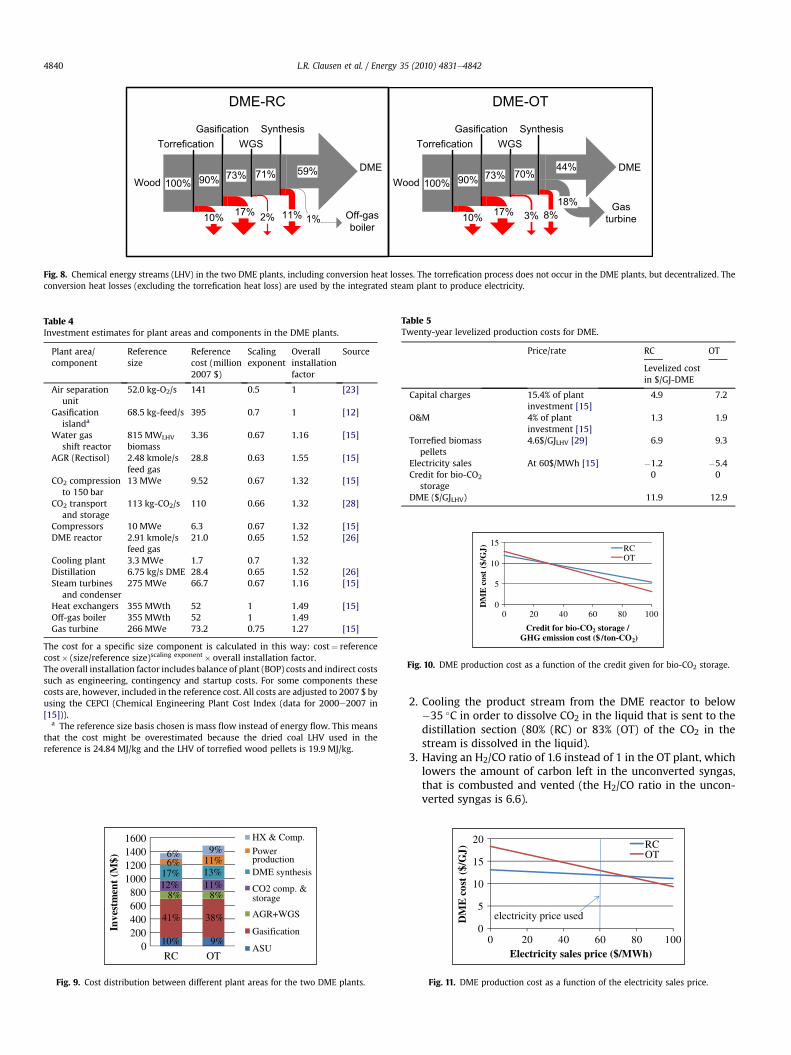
4 4 % 1 0 0 % 9 0 %
D M E W o o d
D M E - R C D M E - O T
T o r r e f i c a t i o n
1 0 %
G a s i f i c a t i o n
7 3 %
W G S
7 0 %
1 7 %
S y n t h e s i s
1 8 % G a s t u r b i n e 8 % 3 %
5 9 % 1 0 0 % 9 0 %
D M E W o o d
T o r r e f i c a t i o n
1 0 %
G a s i f i c a t i o n
7 3 %
W G S
7 1 %
1 7 %
S y n t h e s i s
1 % O f f - g a s b o i l e r
1 1 % 2 %
Fig. 8. Chemical energy streams (LHV) in the two DME plants, including conversion heat losses. The torrefication process does not occur in the DME plants, but decentralized. Theconversion heat losses (excluding the torrefication heat loss) are used by the integrated steam plant to produce electricity.
Table 4Investment estimates for plant areas and components in the DME plants.
Plant area/component
Referencesize
Referencecost (million2007 $)
Scalingexponent
Overallinstallationfactor
Source
Air separationunit
52.0 kg-O2/s 141 0.5 1 [23]
Gasificationislanda
68.5 kg-feed/s 395 0.7 1 [12]
Water gasshift reactor
815 MWLHV
biomass3.36 0.67 1.16 [15]
AGR (Rectisol) 2.48 kmole/sfeed gas
28.8 0.63 1.55 [15]
CO2 compressionto 150 bar
13 MWe 9.52 0.67 1.32 [15]
CO2 transportand storage
113 kg-CO2/s 110 0.66 1.32 [28]
Compressors 10 MWe 6.3 0.67 1.32 [15]DME reactor 2.91 kmole/s
feed gas21.0 0.65 1.52 [26]
Cooling plant 3.3 MWe 1.7 0.7 1.32Distillation 6.75 kg/s DME 28.4 0.65 1.52 [26]Steam turbines
and condenser275 MWe 66.7 0.67 1.16 [15]
Heat exchangers 355 MWth 52 1 1.49 [15]Off-gas boiler 355 MWth 52 1 1.49Gas turbine 266 MWe 73.2 0.75 1.27 [15]
The cost for a specific size component is calculated in this way: cost¼ referencecost� (size/reference size)scaling exponent� overall installation factor.The overall installation factor includes balance of plant (BOP) costs and indirect costssuch as engineering, contingency and startup costs. For some components thesecosts are, however, included in the reference cost. All costs are adjusted to 2007 $ byusing the CEPCI (Chemical Engineering Plant Cost Index (data for 2000e2007 in[15])).
a The reference size basis chosen is mass flow instead of energy flow. This meansthat the cost might be overestimated because the dried coal LHV used in thereference is 24.84 MJ/kg and the LHV of torrefied wood pellets is 19.9 MJ/kg.
0200400600800
1000120014001600
RC OT
)$M(
tnemtsevnI
HX & Comp.
Power productionDME synthesis
CO2 comp. & storage
AGR+WGS
Gasification
ASU10%
41%
8%12%17%
6%6%
9%
38%
8%11%13%11%
9%
Fig. 9. Cost distribution between different plant areas for the two DME plants.
Table 5Twenty-year levelized production costs for DME.
Price/rate RC OT
Levelized costin $/GJ-DME
Capital charges 15.4% of plantinvestment [15]
4.9 7.2
O&M 4% of plantinvestment [15]
1.3 1.9
Torrefied biomasspellets
4.6$/GJLHV [29] 6.9 9.3
Electricity sales At 60$/MWh [15] �1.2 �5.4Credit for bio-CO2
storage0 0
DME ($/GJLHV) 11.9 12.9
0
5
10
15
0 20 40 60 80 100
)JG/$(
tsocE
MD
Credit for bio-CO2 storage /GHG emission cost ($ /ton-CO2)
RCOT
Fig. 10. DME production cost as a function of the credit given for bio-CO2 storage.
L.R. Clausen et al. / Energy 35 (2010) 4831e48424840
2. Cooling the product stream from the DME reactor to below�35 �C in order to dissolve CO2 in the liquid that is sent to thedistillation section (80% (RC) or 83% (OT) of the CO2 in thestream is dissolved in the liquid).
3. Having an H2/CO ratio of 1.6 instead of 1 in the OT plant, whichlowers the amount of carbon left in the unconverted syngas,that is combusted and vented (the H2/CO ratio in the uncon-verted syngas is 6.6).
0
5
10
15
20
0 20 40 60 80 100
)JG/$(
tsocE
MD
Electricity sales price ($/MWh)
RCOT
electricity price used
Fig. 11. DME production cost as a function of the electricity sales price.
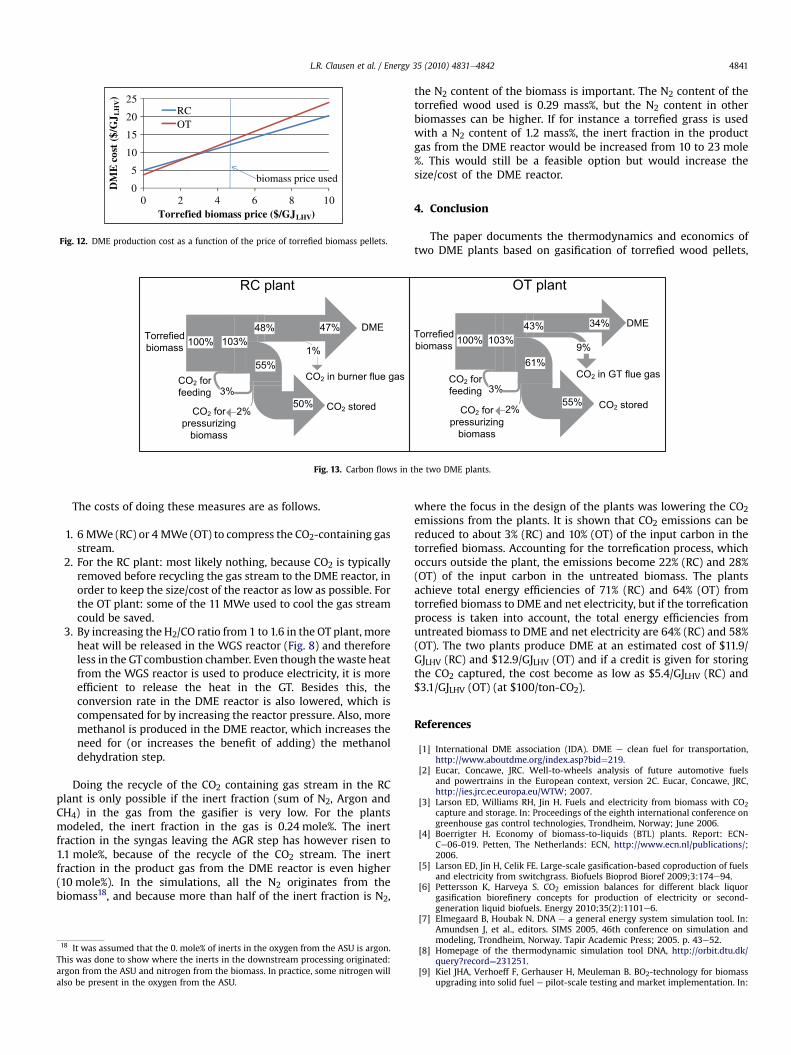
0
5
10
15
20
25
0 2 4 6 8 10
JG/$(
tsocE
MD
VH
L)
Torrefied biomass price ($/GJLHV)
RCOT
biomass price used
Fig. 12. DME production cost as a function of the price of torrefied biomass pellets.
61%
34%
9%
43%
3%
100%
2%55%
103%
DME
CO2 in GT flue gas
CO2 storedCO2 forpressurizing
biomass
CO2 forfeeding
Torrefiedbiomass
55%
47%
1%
48%
3%
100%
2%50%
103%DME
CO2 in burner flue gas
CO2 storedCO2 forpressurizing
biomass
CO2 forfeeding
Torrefiedbiomass
RC plant OT plant
Fig. 13. Carbon flows in the two DME plants.
L.R. Clausen et al. / Energy 35 (2010) 4831e4842 4841
The costs of doing these measures are as follows.
1. 6 MWe (RC) or 4 MWe (OT) to compress the CO2-containing gasstream.
2. For the RC plant: most likely nothing, because CO2 is typicallyremoved before recycling the gas stream to the DME reactor, inorder to keep the size/cost of the reactor as low as possible. Forthe OT plant: some of the 11 MWe used to cool the gas streamcould be saved.
3. By increasing the H2/CO ratio from 1 to 1.6 in the OT plant, moreheat will be released in the WGS reactor (Fig. 8) and thereforeless in the GTcombustion chamber. Even though thewaste heatfrom the WGS reactor is used to produce electricity, it is moreefficient to release the heat in the GT. Besides this, theconversion rate in the DME reactor is also lowered, which iscompensated for by increasing the reactor pressure. Also, moremethanol is produced in the DME reactor, which increases theneed for (or increases the benefit of adding) the methanoldehydration step.
Doing the recycle of the CO2 containing gas stream in the RCplant is only possible if the inert fraction (sum of N2, Argon andCH4) in the gas from the gasifier is very low. For the plantsmodeled, the inert fraction in the gas is 0.24 mole%. The inertfraction in the syngas leaving the AGR step has however risen to1.1 mole%, because of the recycle of the CO2 stream. The inertfraction in the product gas from the DME reactor is even higher(10 mole%). In the simulations, all the N2 originates from thebiomass18, and because more than half of the inert fraction is N2,
18 It was assumed that the 0. mole% of inerts in the oxygen from the ASU is argon.This was done to show where the inerts in the downstream processing originated:argon from the ASU and nitrogen from the biomass. In practice, some nitrogen willalso be present in the oxygen from the ASU.
the N2 content of the biomass is important. The N2 content of thetorrefied wood used is 0.29 mass%, but the N2 content in otherbiomasses can be higher. If for instance a torrefied grass is usedwith a N2 content of 1.2 mass%, the inert fraction in the productgas from the DME reactor would be increased from 10 to 23 mole%. This would still be a feasible option but would increase thesize/cost of the DME reactor.
4. Conclusion
The paper documents the thermodynamics and economics oftwo DME plants based on gasification of torrefied wood pellets,
where the focus in the design of the plants was lowering the CO2emissions from the plants. It is shown that CO2 emissions can bereduced to about 3% (RC) and 10% (OT) of the input carbon in thetorrefied biomass. Accounting for the torrefication process, whichoccurs outside the plant, the emissions become 22% (RC) and 28%(OT) of the input carbon in the untreated biomass. The plantsachieve total energy efficiencies of 71% (RC) and 64% (OT) fromtorrefied biomass to DME and net electricity, but if the torreficationprocess is taken into account, the total energy efficiencies fromuntreated biomass to DME and net electricity are 64% (RC) and 58%(OT). The two plants produce DME at an estimated cost of $11.9/GJLHV (RC) and $12.9/GJLHV (OT) and if a credit is given for storingthe CO2 captured, the cost become as low as $5.4/GJLHV (RC) and$3.1/GJLHV (OT) (at $100/ton-CO2).
References
[1] International DME association (IDA). DME e clean fuel for transportation,http://www.aboutdme.org/index.asp?bid¼219.
[2] Eucar, Concawe, JRC. Well-to-wheels analysis of future automotive fuelsand powertrains in the European context, version 2C. Eucar, Concawe, JRC,http://ies.jrc.ec.europa.eu/WTW; 2007.
[3] Larson ED, Williams RH, Jin H. Fuels and electricity from biomass with CO2capture and storage. In: Proceedings of the eighth international conference ongreenhouse gas control technologies, Trondheim, Norway; June 2006.
[4] Boerrigter H. Economy of biomass-to-liquids (BTL) plants. Report: ECN-Ce06-019. Petten, The Netherlands: ECN, http://www.ecn.nl/publications/;2006.
[5] Larson ED, Jin H, Celik FE. Large-scale gasification-based coproduction of fuelsand electricity from switchgrass. Biofuels Bioprod Bioref 2009;3:174e94.
[6] Pettersson K, Harveya S. CO2 emission balances for different black liquorgasification biorefinery concepts for production of electricity or second-generation liquid biofuels. Energy 2010;35(2):1101e6.
[7] Elmegaard B, Houbak N. DNA e a general energy system simulation tool. In:Amundsen J, et al., editors. SIMS 2005, 46th conference on simulation andmodeling, Trondheim, Norway. Tapir Academic Press; 2005. p. 43e52.
[8] Homepage of the thermodynamic simulation tool DNA, http://orbit.dtu.dk/query?record¼231251.
[9] Kiel JHA, Verhoeff F, Gerhauser H, Meuleman B. BO2-technology for biomassupgrading into solid fuel e pilot-scale testing and market implementation. In:
L.R. Clausen et al. / Energy 35 (2010) 4831e48424842
Proceedings for the 16th European biomass conference and exhibition,Valencia, Spain; 2008, p. 48e53. http://www.ecn.nl/publications/.
[10] Bergman PCA, Boersma AR, Kiel JHA, Prins MJ, Ptasinski KJ, Janssen FJJG.Torrefaction for entrained-flow gasification of biomass. Report: ECN-Ce05-067. Petten, The Netherlands: ECN, http://www.ecn.nl/publications/; 2005.
[11] The National Energy Technology Laboratory (NETL). Gasification WorldDatabase 2007, http://www.netl.doe.gov/technologies/coalpower/gasification/database/database.html; 2007.
[12] van der Ploeg HJ, Chhoa T, Zuideveld PL. The shell coal gasification process forthe US industry. In: Proceedings for the gasification technology conference,Washington DC, USA; 2004.
[13] van der Drift A, Boerrigter H, Coda B, Cieplik MK, Hemmes K. Entrainedflow gasification of biomass; ash behaviour, feeding issues, system analyses.Report: ECN-Ce04-039. Petten, The Netherlands: ECN, http://www.ecn.nl/publications/; 2004.
[14] The National Energy Technology Laboratory (NETL). Shell gasifier IGCC basecases. Report: PED-IGCC-98-002, http://www.netl.doe.gov/technologies/coalpower/gasification/pubs/pdf/system/shell3x_.pdf; 1998 (revised in 2000).
[15] Kreutz TG, Larson ED, Liu G, Williams RH. FischereTropsch fuels from coal andbiomass. Report. Princeton, New Jersey: Princeton Environmental Institute,Princeton University, http://www.princeton.edu/pei/energy/publications;2008.
[16] van der Drift A, Boerrigter H. Synthesis gas from biomass. Report: ECN-C-06-001. Petten, The Netherlands: ECN, http://www.ecn.nl/publications/; 2006.
[17] Linde Engineering. Rectisol wash, http://www.linde-le.com/process_plants/hydrogen_syngas_plants/gas_processing/rectisol_wash.php.
[18] Lurgi GmbH. The rectisol process, http://www.lurgi.com/website/fileadmin/user_upload/1_PDF/1_Broshures_Flyer/englisch/0308e_Rectisol.pdf.
[19] Haldor Topsoe. Sulphur tolerant shift conversion, http://www.topsoe.com/Business_areas/Gasification-based/Processes/Sour_shift.aspx.
[20] Linde Engineering. Rectisol wash, http://www.linde-engineering.com/process_plants/hydrogen_syngas_plants/gas_processing/rectisol_wash.php[accessed 28.01.09].
[21] Larson ED, Tingjin R. Synthetic fuel production by indirect coal liquefaction.Energy Sustain Dev 2003;7(4):79e102.
[22] Yagi H, Ohno Y, Inoue N, Okuyama K, Aoki S. Slurry phase reactor technologyfor DME direct synthesis. Int J Chem React Eng 2010;8:A109.
[23] Andersson K, Johnsson F. Process evaluation of an 865 MWe lignite fired O2/CO2 power plant. Energy Convers Manage 2006;47(18e19):3487e98.
[24] Moore JJ, Nored M, Brun K. Novel concepts for the compression of largevolumes of carbon dioxide. Paper sent to Oil and Gas Journal in 2007, buta published version cannot be found. Southwest Research Institute. http://www.netl.doe.gov/technologies/coalpower/turbines/refshelf/papers/42650%20SwRI%20for%20Oil%20&%20Gas%20Journal.pdf.
[25] Shell. Coal gasification brochure. The shell coal gasification process e forsustainable utilisation of coal, http://www.shell.com/static/globalsolutions/downloads/innovation/coal_gasification_brochure.pdf; 2006.
[26] Larson ED, Jin H, Celik FE. Supporting information to: Large-scale gasifica-tion-based coproduction of fuels and electricity from switchgrass. BiofuelsBioprod Bioref 2009;3:174e94, http://www.princeton.edu/pei/energy/publications.
[27] Ohno Y. New clean fuel DME. Presentation at the DeWitt Global Methanol &MTBE Conference in Bangkok in 2007, http://www.methanol.org/pdf/Ohno_DME_Dev_Co.pdf.
[28] Ogden JM. Conceptual design of optimized fossil energy systems with captureand sequestration of carbon dioxide. Report UCD-ITSRR-04-34. University ofCalifornia Davis, Institute of Transportation Studies; 2004.
[29] Uslu A, Faaij APC, Bergman PCA. Pre-treatment technologies, and their effect oninternational bioenergy supply chain logistics. Techno-economic evaluation oftorrefaction, fast pyrolysis and pelletization. Energy 2008;33(8):1206e23.
148
Appendix D. Modification of the Entrained Flow Reactor for Gasification Experiments
Report
Weigang Lin. Report: Modification of the Entrained Flow Reactor for Gasification Experiments
18th January. 2011, DTU no. 50442
Final report - EFP06 – Produktion af methanol/DME ud fra biomasse
Report: Modification of the Entrained Flow Reactor for Gasification Experiments
Weigang Lin
Department of Chemical and Biochemical Engineering Technical University of Denmark Søltofts Plads, Building 229, DK-2800 Lyngby, Denmark

2
Content
Introduction 3
Implementation of steam injection system 3
Particle and gas sampling system 5
Safety measures 6
Summary 10
References 11
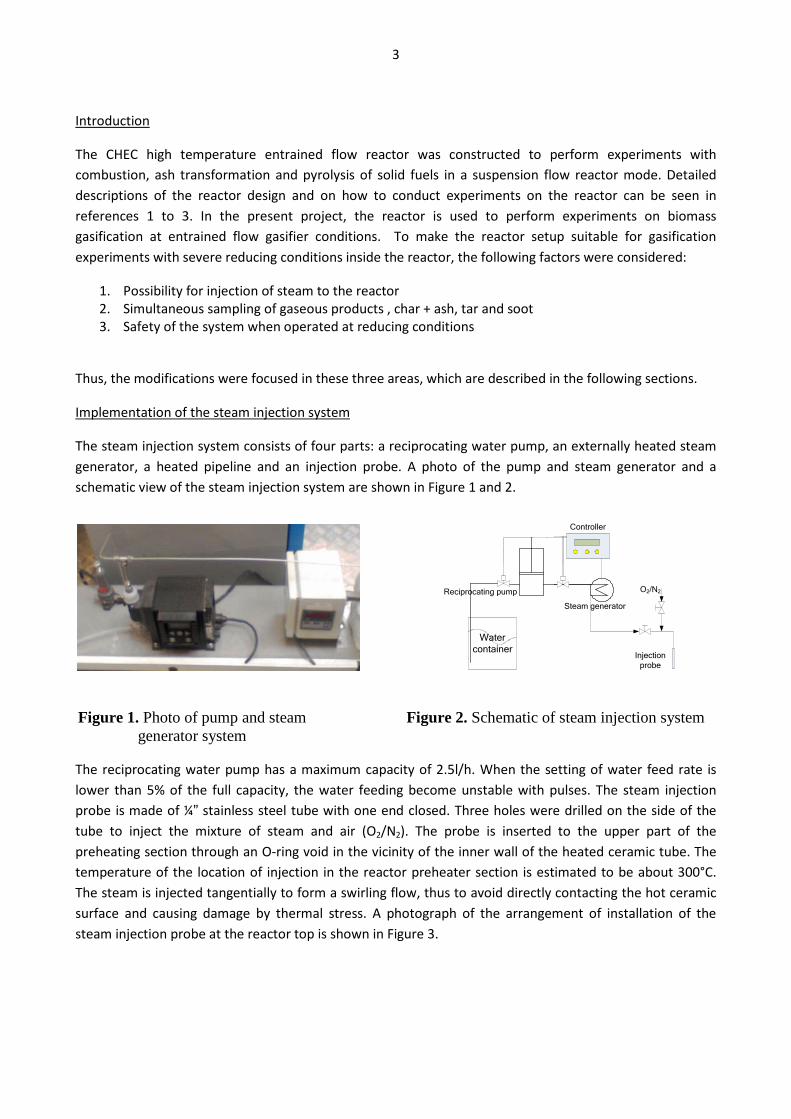
3
Introduction
The CHEC high temperature entrained flow reactor was constructed to perform experiments with combustion, ash transformation and pyrolysis of solid fuels in a suspension flow reactor mode. Detailed descriptions of the reactor design and on how to conduct experiments on the reactor can be seen in references 1 to 3. In the present project, the reactor is used to perform experiments on biomass gasification at entrained flow gasifier conditions. To make the reactor setup suitable for gasification experiments with severe reducing conditions inside the reactor, the following factors were considered:
1. Possibility for injection of steam to the reactor 2. Simultaneous sampling of gaseous products , char + ash, tar and soot 3. Safety of the system when operated at reducing conditions
Thus, the modifications were focused in these three areas, which are described in the following sections.
Implementation of the steam injection system
The steam injection system consists of four parts: a reciprocating water pump, an externally heated steam generator, a heated pipeline and an injection probe. A photo of the pump and steam generator and a schematic view of the steam injection system are shown in Figure 1 and 2.
The reciprocating water pump has a maximum capacity of 2.5l/h. When the setting of water feed rate is lower than 5% of the full capacity, the water feeding become unstable with pulses. The steam injection probe is made of ¼” stainless steel tube with one end closed. Three holes were drilled on the side of the tube to inject the mixture of steam and air (O2/N2). The probe is inserted to the upper part of the preheating section through an O-ring void in the vicinity of the inner wall of the heated ceramic tube. The temperature of the location of injection in the reactor preheater section is estimated to be about 300°C. The steam is injected tangentially to form a swirling flow, thus to avoid directly contacting the hot ceramic surface and causing damage by thermal stress. A photograph of the arrangement of installation of the steam injection probe at the reactor top is shown in Figure 3.
Watercontainer
Reciprocating pump
Controller
Steam generator
Injectionprobe
O2/N2
Figure 2. Schematic of steam injection system Figure 1. Photo of pump and steam generator system
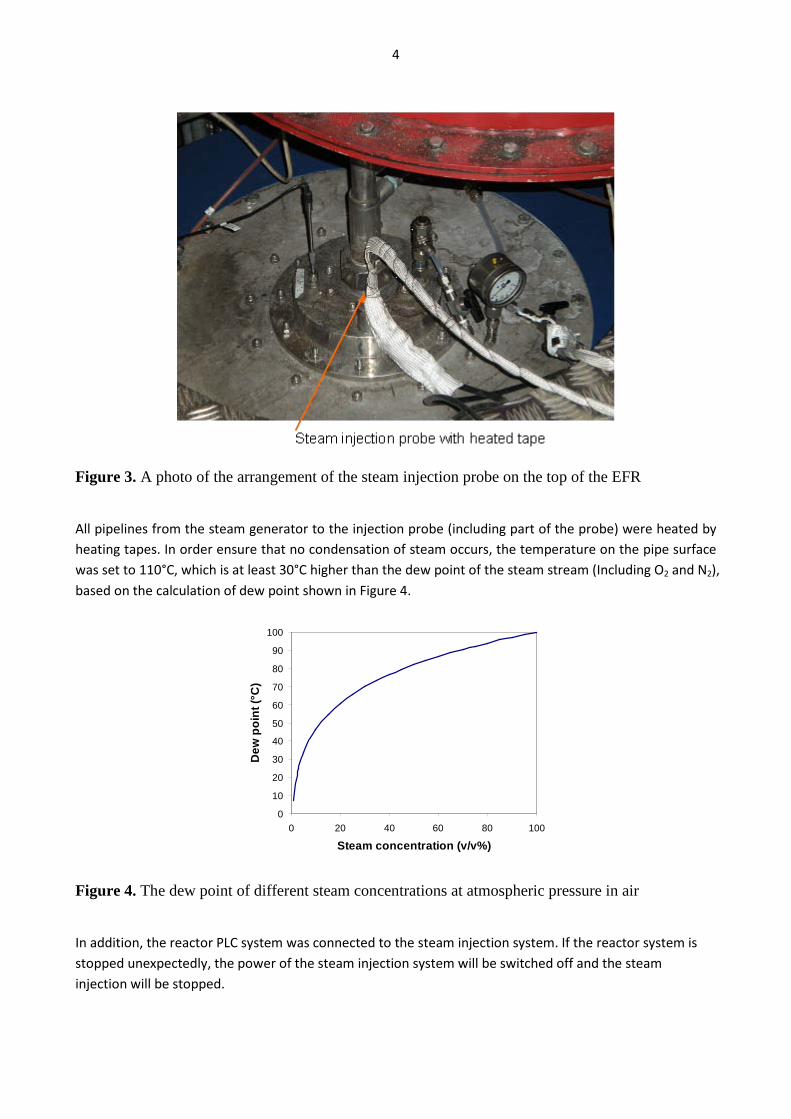
4
Figure 3. A photo of the arrangement of the steam injection probe on the top of the EFR
All pipelines from the steam generator to the injection probe (including part of the probe) were heated by heating tapes. In order ensure that no condensation of steam occurs, the temperature on the pipe surface was set to 110°C, which is at least 30°C higher than the dew point of the steam stream (Including O2 and N2), based on the calculation of dew point shown in Figure 4.
Figure 4. The dew point of different steam concentrations at atmospheric pressure in air
In addition, the reactor PLC system was connected to the steam injection system. If the reactor system is stopped unexpectedly, the power of the steam injection system will be switched off and the steam injection will be stopped.
0
10
20
30
40
50
60
70
80
90
100
0 20 40 60 80 100
Steam concentration (v/v%)
Dew
poi
nt (°
C)
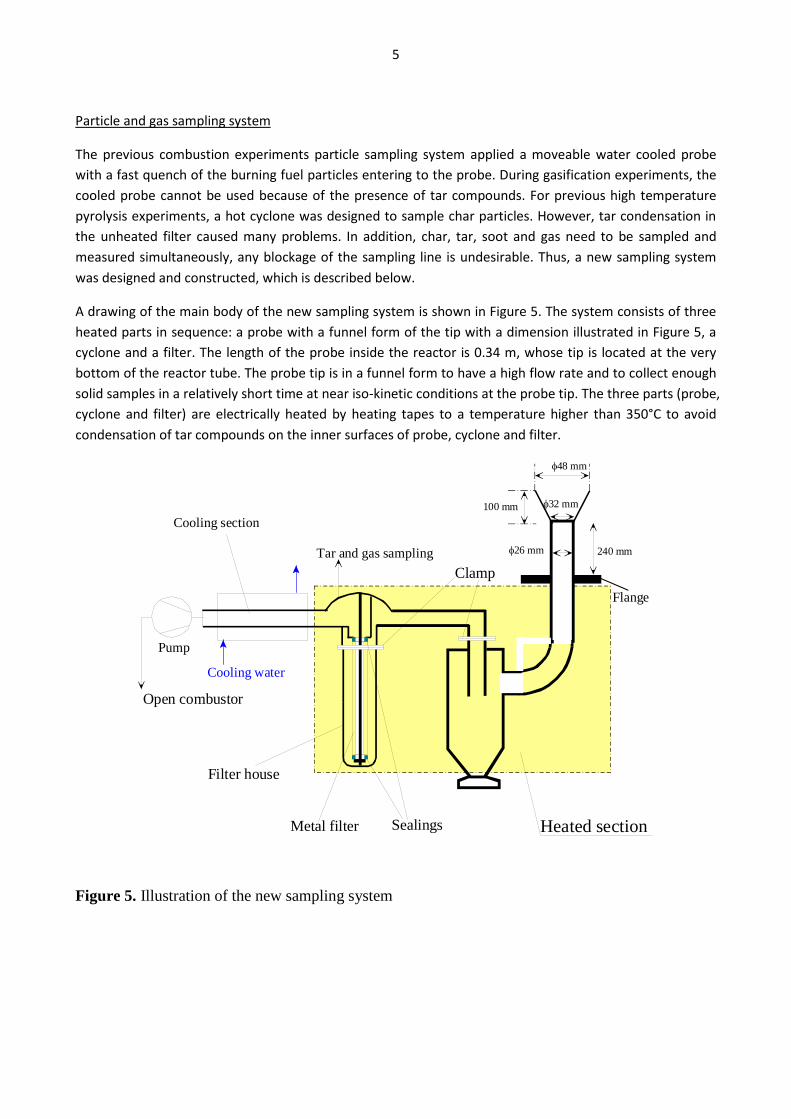
5
Particle and gas sampling system
The previous combustion experiments particle sampling system applied a moveable water cooled probe with a fast quench of the burning fuel particles entering to the probe. During gasification experiments, the cooled probe cannot be used because of the presence of tar compounds. For previous high temperature pyrolysis experiments, a hot cyclone was designed to sample char particles. However, tar condensation in the unheated filter caused many problems. In addition, char, tar, soot and gas need to be sampled and measured simultaneously, any blockage of the sampling line is undesirable. Thus, a new sampling system was designed and constructed, which is described below.
A drawing of the main body of the new sampling system is shown in Figure 5. The system consists of three heated parts in sequence: a probe with a funnel form of the tip with a dimension illustrated in Figure 5, a cyclone and a filter. The length of the probe inside the reactor is 0.34 m, whose tip is located at the very bottom of the reactor tube. The probe tip is in a funnel form to have a high flow rate and to collect enough solid samples in a relatively short time at near iso-kinetic conditions at the probe tip. The three parts (probe, cyclone and filter) are electrically heated by heating tapes to a temperature higher than 350°C to avoid condensation of tar compounds on the inner surfaces of probe, cyclone and filter.
φ26 mm
φ32 mm
240 mm
Pump
Open combustor
Tar and gas sampling
φ48 mm
Heated section
100 mm
Clamp
Metal filter Sealings
Filter house
Cooling section
Cooling water
Flange
Figure 5. Illustration of the new sampling system
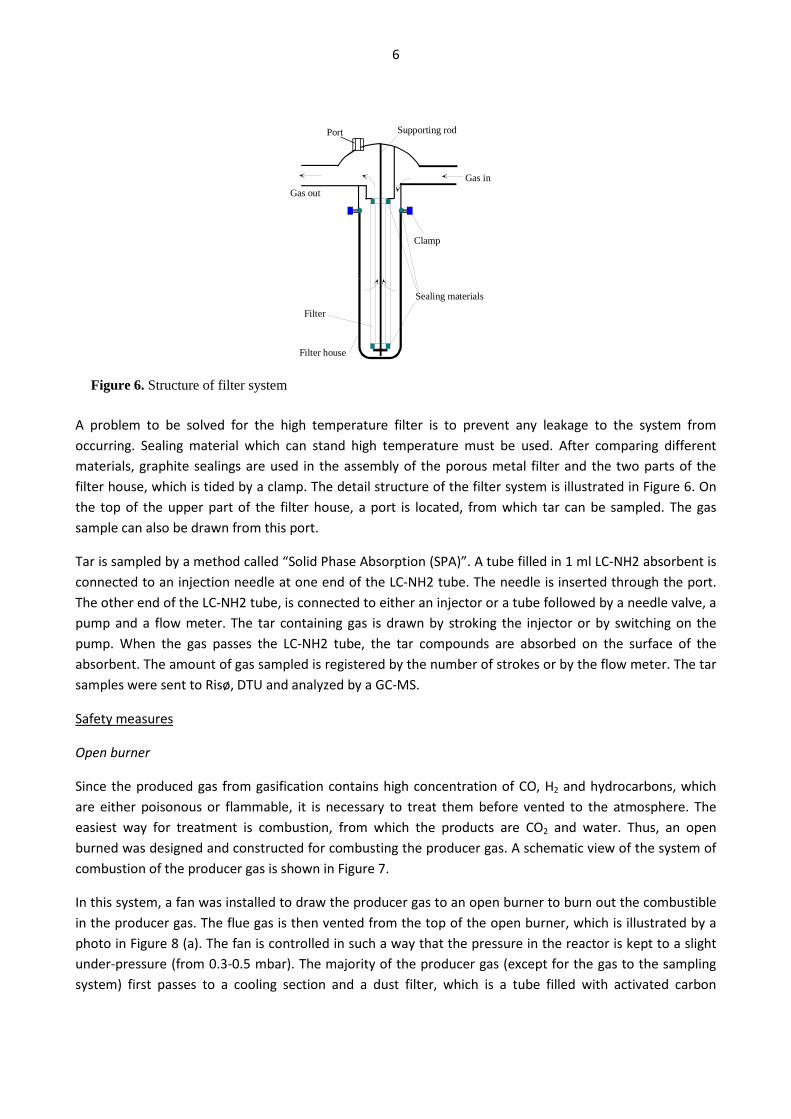
6
A problem to be solved for the high temperature filter is to prevent any leakage to the system from occurring. Sealing material which can stand high temperature must be used. After comparing different materials, graphite sealings are used in the assembly of the porous metal filter and the two parts of the filter house, which is tided by a clamp. The detail structure of the filter system is illustrated in Figure 6. On the top of the upper part of the filter house, a port is located, from which tar can be sampled. The gas sample can also be drawn from this port.
Tar is sampled by a method called “Solid Phase Absorption (SPA)”. A tube filled in 1 ml LC-NH2 absorbent is connected to an injection needle at one end of the LC-NH2 tube. The needle is inserted through the port. The other end of the LC-NH2 tube, is connected to either an injector or a tube followed by a needle valve, a pump and a flow meter. The tar containing gas is drawn by stroking the injector or by switching on the pump. When the gas passes the LC-NH2 tube, the tar compounds are absorbed on the surface of the absorbent. The amount of gas sampled is registered by the number of strokes or by the flow meter. The tar samples were sent to Risø, DTU and analyzed by a GC-MS.
Safety measures
Open burner
Since the produced gas from gasification contains high concentration of CO, H2 and hydrocarbons, which are either poisonous or flammable, it is necessary to treat them before vented to the atmosphere. The easiest way for treatment is combustion, from which the products are CO2 and water. Thus, an open burned was designed and constructed for combusting the producer gas. A schematic view of the system of combustion of the producer gas is shown in Figure 7.
In this system, a fan was installed to draw the producer gas to an open burner to burn out the combustible in the producer gas. The flue gas is then vented from the top of the open burner, which is illustrated by a photo in Figure 8 (a). The fan is controlled in such a way that the pressure in the reactor is kept to a slight under-pressure (from 0.3-0.5 mbar). The majority of the producer gas (except for the gas to the sampling system) first passes to a cooling section and a dust filter, which is a tube filled with activated carbon
Clamp
Filter house
Gas in
Filter
Sealing materials
Gas out
Supporting rodPort
Figure 6. Structure of filter system
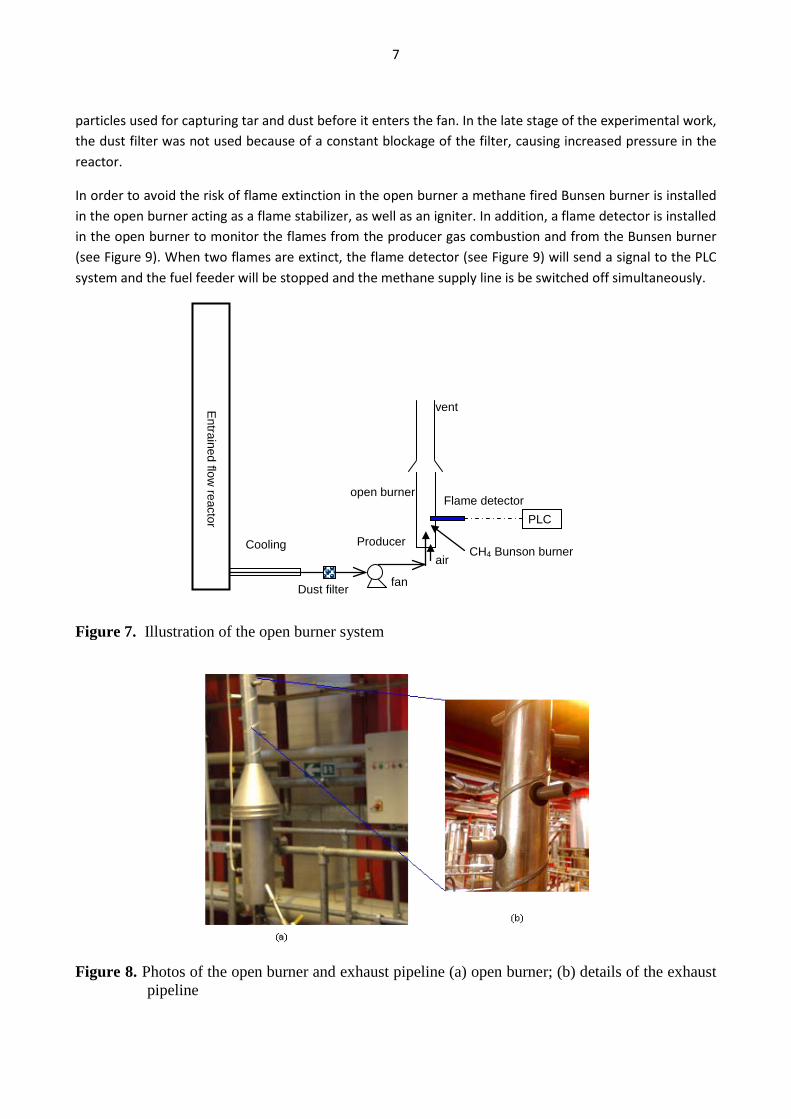
7
Cooling
fan
Producer
E
ntrained flow reactor
open burner
air
vent
Flame detector PLC
CH4 Bunson burner
Dust filter
particles used for capturing tar and dust before it enters the fan. In the late stage of the experimental work, the dust filter was not used because of a constant blockage of the filter, causing increased pressure in the reactor.
In order to avoid the risk of flame extinction in the open burner a methane fired Bunsen burner is installed in the open burner acting as a flame stabilizer, as well as an igniter. In addition, a flame detector is installed in the open burner to monitor the flames from the producer gas combustion and from the Bunsen burner (see Figure 9). When two flames are extinct, the flame detector (see Figure 9) will send a signal to the PLC system and the fuel feeder will be stopped and the methane supply line is be switched off simultaneously.
Figure 8. Photos of the open burner and exhaust pipeline (a) open burner; (b) details of the exhaust pipeline
Figure 7. Illustration of the open burner system
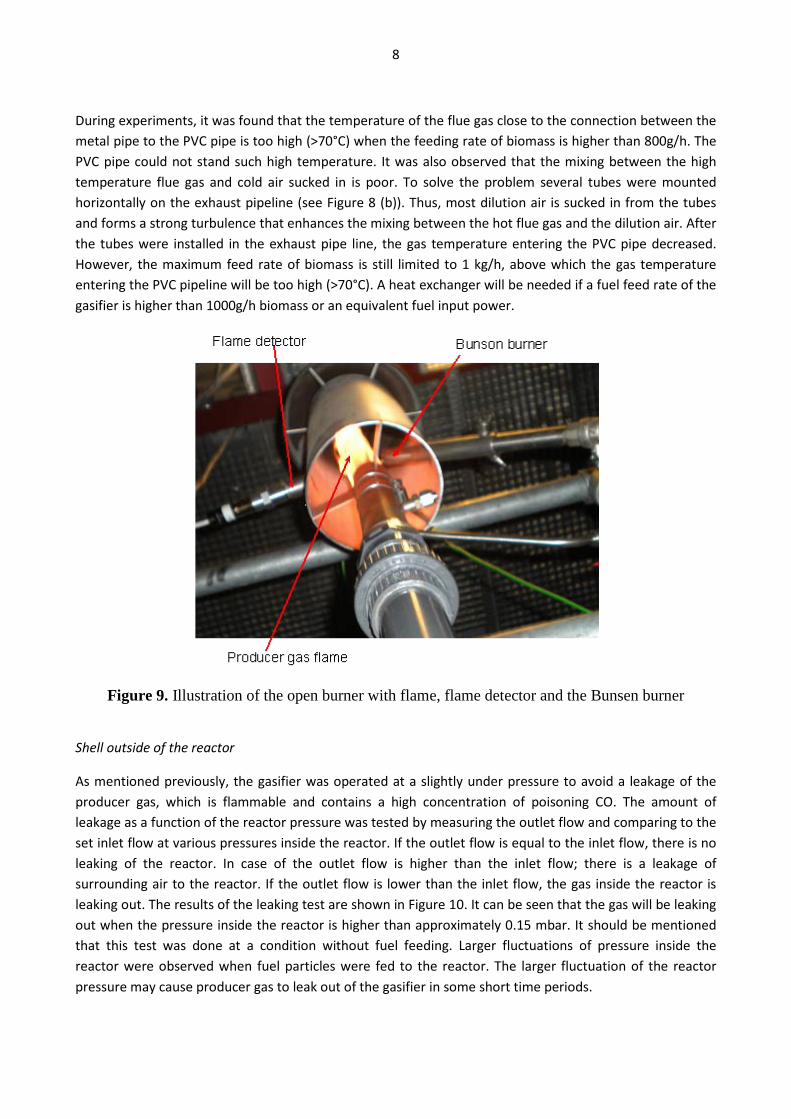
8
During experiments, it was found that the temperature of the flue gas close to the connection between the metal pipe to the PVC pipe is too high (>70°C) when the feeding rate of biomass is higher than 800g/h. The PVC pipe could not stand such high temperature. It was also observed that the mixing between the high temperature flue gas and cold air sucked in is poor. To solve the problem several tubes were mounted horizontally on the exhaust pipeline (see Figure 8 (b)). Thus, most dilution air is sucked in from the tubes and forms a strong turbulence that enhances the mixing between the hot flue gas and the dilution air. After the tubes were installed in the exhaust pipe line, the gas temperature entering the PVC pipe decreased. However, the maximum feed rate of biomass is still limited to 1 kg/h, above which the gas temperature entering the PVC pipeline will be too high (>70°C). A heat exchanger will be needed if a fuel feed rate of the gasifier is higher than 1000g/h biomass or an equivalent fuel input power.
Figure 9. Illustration of the open burner with flame, flame detector and the Bunsen burner
Shell outside of the reactor
As mentioned previously, the gasifier was operated at a slightly under pressure to avoid a leakage of the producer gas, which is flammable and contains a high concentration of poisoning CO. The amount of leakage as a function of the reactor pressure was tested by measuring the outlet flow and comparing to the set inlet flow at various pressures inside the reactor. If the outlet flow is equal to the inlet flow, there is no leaking of the reactor. In case of the outlet flow is higher than the inlet flow; there is a leakage of surrounding air to the reactor. If the outlet flow is lower than the inlet flow, the gas inside the reactor is leaking out. The results of the leaking test are shown in Figure 10. It can be seen that the gas will be leaking out when the pressure inside the reactor is higher than approximately 0.15 mbar. It should be mentioned that this test was done at a condition without fuel feeding. Larger fluctuations of pressure inside the reactor were observed when fuel particles were fed to the reactor. The larger fluctuation of the reactor pressure may cause producer gas to leak out of the gasifier in some short time periods.
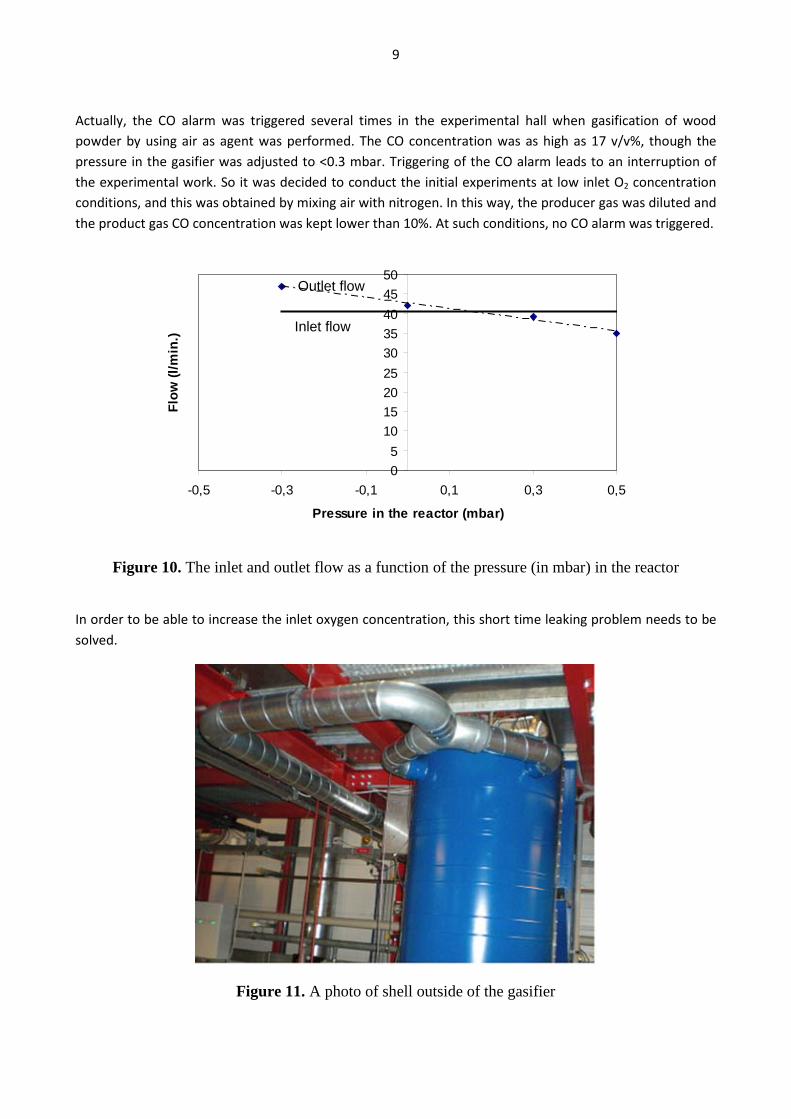
9
Actually, the CO alarm was triggered several times in the experimental hall when gasification of wood powder by using air as agent was performed. The CO concentration was as high as 17 v/v%, though the pressure in the gasifier was adjusted to <0.3 mbar. Triggering of the CO alarm leads to an interruption of the experimental work. So it was decided to conduct the initial experiments at low inlet O2 concentration conditions, and this was obtained by mixing air with nitrogen. In this way, the producer gas was diluted and the product gas CO concentration was kept lower than 10%. At such conditions, no CO alarm was triggered.
Figure 10. The inlet and outlet flow as a function of the pressure (in mbar) in the reactor
In order to be able to increase the inlet oxygen concentration, this short time leaking problem needs to be solved.
Figure 11. A photo of shell outside of the gasifier
05
101520253035404550
-0,5 -0,3 -0,1 0,1 0,3 0,5
Pressure in the reactor (mbar)
Flow
(l/m
in.)
Inlet flow
Outlet flow
05
101520253035404550
-0,5 -0,3 -0,1 0,1 0,3 0,5
Pressure in the reactor (mbar)
Flow
(l/m
in.)
Inlet flow
Outlet flow
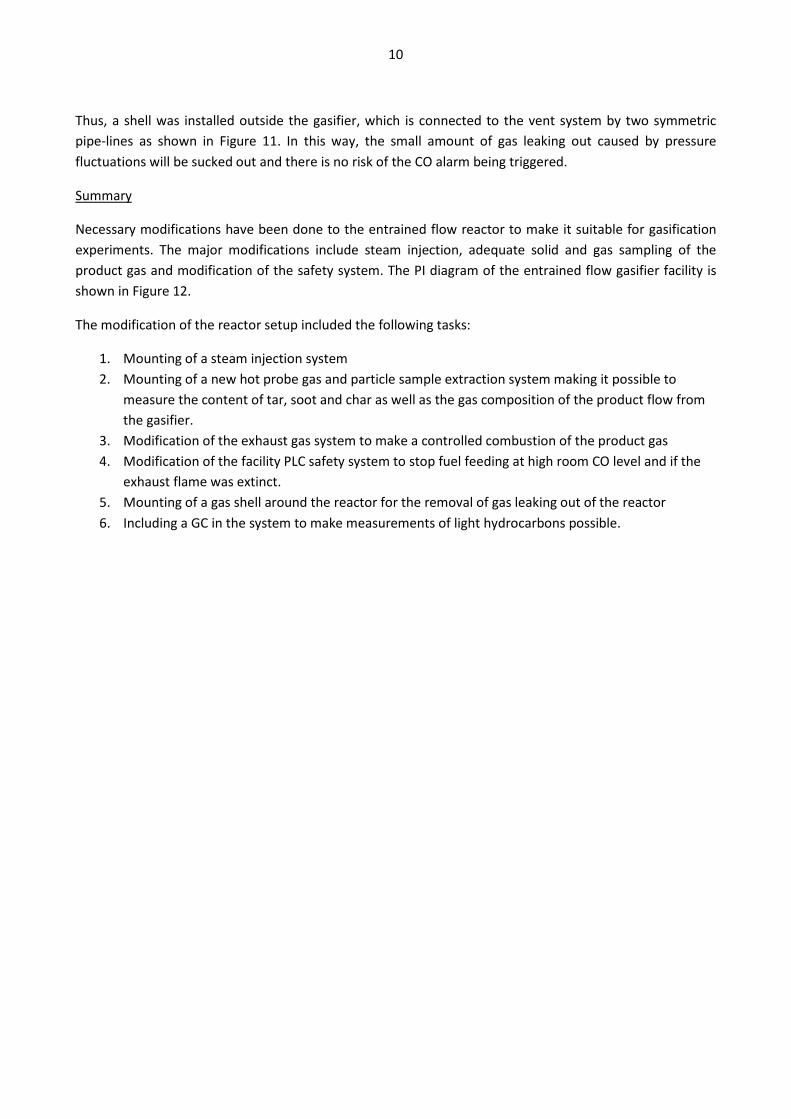
10
Thus, a shell was installed outside the gasifier, which is connected to the vent system by two symmetric pipe-lines as shown in Figure 11. In this way, the small amount of gas leaking out caused by pressure fluctuations will be sucked out and there is no risk of the CO alarm being triggered.
Summary
Necessary modifications have been done to the entrained flow reactor to make it suitable for gasification experiments. The major modifications include steam injection, adequate solid and gas sampling of the product gas and modification of the safety system. The PI diagram of the entrained flow gasifier facility is shown in Figure 12.
The modification of the reactor setup included the following tasks:
1. Mounting of a steam injection system 2. Mounting of a new hot probe gas and particle sample extraction system making it possible to
measure the content of tar, soot and char as well as the gas composition of the product flow from the gasifier.
3. Modification of the exhaust gas system to make a controlled combustion of the product gas 4. Modification of the facility PLC safety system to stop fuel feeding at high room CO level and if the
exhaust flame was extinct. 5. Mounting of a gas shell around the reactor for the removal of gas leaking out of the reactor 6. Including a GC in the system to make measurements of light hydrocarbons possible.
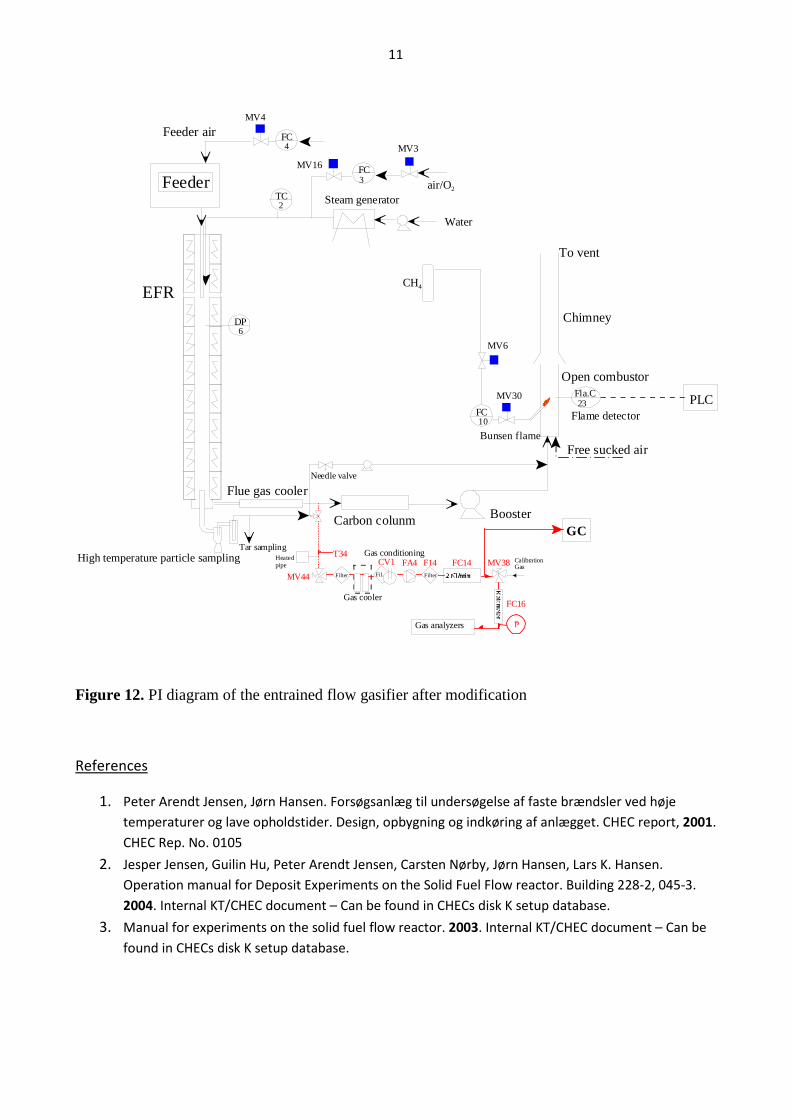
11
Figure 12. PI diagram of the entrained flow gasifier after modification
References
1. Peter Arendt Jensen, Jørn Hansen. Forsøgsanlæg til undersøgelse af faste brændsler ved høje temperaturer og lave opholdstider. Design, opbygning og indkøring af anlægget. CHEC report, 2001. CHEC Rep. No. 0105
2. Jesper Jensen, Guilin Hu, Peter Arendt Jensen, Carsten Nørby, Jørn Hansen, Lars K. Hansen. Operation manual for Deposit Experiments on the Solid Fuel Flow reactor. Building 228-2, 045-3. 2004. Internal KT/CHEC document – Can be found in CHECs disk K setup database.
3. Manual for experiments on the solid fuel flow reactor. 2003. Internal KT/CHEC document – Can be found in CHECs disk K setup database.
EFR
Feeder
Booster
Open combustor
To vent
Carbon colunm
DP 6
Fla.C23
Water
FC3
Steam generatorair/O2
TC 2
Feeder air
Flue gas cooler
Chimney
Bunsen flame
CH4
FC 10
Gas analyzers
FA4 FC14 MV38 CalibrationGas
Filter
CV1
Gas cooler
Gas conditioningHeatedpipe
Fil. Filter
FC16
T34
MV44F14
GC
MV6
MV30
Free sucked air
PLC
MV3
MV16
MV4
FC 4
High temperature particle sampling
Flame detector
Tar sampling
Needle valve
160
Appendix E. Atmospheric pressure entrained flow gasification of biomass
Report Ke Qin, Weigang Lin, Peter Arendt Jensen, Anker Degn Jensen. Report: Atmospheric pressure entrained flow gasification of biomass.
0
2011, DTU no. 50442
Final report - EFP06 – Produktion af methanol/DME ud fra biomasse
Report: Atmospheric pressure entrained flow gasification of biomass
Ke Qin, Weigang Lin, Peter Arendt Jensen, Anker Degn Jensen
Department of Chemical and Biochemical Engineering Technical University of Denmark Søltofts Plads, Building 229, DK-2800 Lyngby, Denmark
1
Content 1 Introduction ............................................................................................................... 2
1.1 Background .......................................................................................................... 2 1.2 Objectives ............................................................................................................. 3
2 Experimental ............................................................................................................. 3 2.1 Apparatus ............................................................................................................. 3 2.2 Fuels ..................................................................................................................... 7 2.3 Conditions ............................................................................................................ 8 2.4 Experimental procedures .................................................................................... 10 2.5 Gasification processes and reactions .................................................................. 11
3 Thermodynamic equilibrium calculation ............................................................. 11 3.1 Effect of excess air ratio on products ................................................................. 12 3.2 Effect of temperature on products ...................................................................... 13 3.3 Effect of steam/carbon molar ratio on products ................................................. 15 3.4 Effect of pressure on products ............................................................................ 17
4 Experiment results and discussion ........................................................................ 18 4.1 Repeatability of experiment ............................................................................... 19 4.2 Mass balance ...................................................................................................... 19 4.3 Soot and tar analysis ........................................................................................... 20
4.3.1 Soot analysis ............................................................................................... 20 4.3.2 Tar analysis ................................................................................................. 22
4.4 The yield and distribution of gasification products ............................................ 23 4.4.1 Effect of excess air ratio on product yield and distribution ........................ 24 4.4.2 Effect of oxygen concentration on product yield and distribution ............. 30 4.4.3 Effect of temperature on product yield and distribution ............................. 32 4.4.4 Effect of steam/carbon molar ratio on product yield and distribution ........ 35 4.4.5 Effect of fuel type on product yield and distribution .................................. 39
4.5 Comparison with thermodynamic equilibrium calculation ................................ 45 4.6 Comparison with gas compositions from the Viking gasifier ............................ 50
5 Conclusion and summery ....................................................................................... 51 Appendix A Calibration method for new micro GC ................................................... 54 Appendix B Calculation method for flow rate of flue gas components ..................... 59 Appendix C Calculation method for the concentration of solid samples in flue gas 61 References ........................................................................................................................ 62
2
1 Introduction 1.1 Background
Among the renewable energy sources biomass has a high potential [1], and biomass
resources are a major component of strategies to mitigate global climate change. Plant
growth “recycles” CO2 from the atmosphere, and the use of biomass resources for energy
and chemicals results in low net emissions of carbon dioxide. There is a world-wide
interest in the use of biomass resources as feedstocks for producing power, fuels and
chemicals [2]. Gasification is one of the key technologies for utilization of biomass,
especially in the field of integrated gasification combined cycle (IGCC) and production
of liquid fuels and chemicals [3][4]. Of several gasification methods, entrained flow
gasifier has the advantage of a high gasification efficiency to produce a gas with low tar
content and with the possibility to run at high pressure, which fits the pressure in a
downstream synthesis process [5].
The present project investigates processes that can be used to produce liquid transport
fuels from biomass [6]. Entrained flow gasification and liquid production integrated with a
power plant has the advantage of a high conversion of fuel to liquid, and the residual
energy can be applied for power and district heating in an IGCC plant. It may be possible
to utilize a combination of coal, biomass and waste as fuel providing a large fuel
flexibility in particular compared to fermentation based processes. It will also be possible
to utilize hydrogen (and oxygen) from surplus windmill power to increase the H2/CO
ratio of the gas and thereby increase the liquid production and at the same time utilize the
oxygen in the gasification process. The concept has a high flexibility, such that if liquid
fuel production is not desired in a certain period, the gas produced can be used for
efficient power production. The surplus CO2 from the process will be provided in a high
concentration stream, so it will also be relatively easy to carry out CO2 sequestration in
such a plant.
3
1.2 Objectives
Although gasification of coal in entrained flow gasifiers been studied extensively,
systematic studies on gasification of biomass in entrained flow gasifier are scarce. In
addition the fundamental processes taking place during biomass gasification at
temperatures relevant to entrained flow gasifiers are not fully understood. In production
of synthetic liquid fuels for transportation from biomass, it is important to control the
syngas quality from gasification with respect to both the H2/CO ratio and the amount of
harmful impurities, such as tar [7][8]. In an entrained flow gasification plant, it is also
important that the solid fuel can be completely converted to gas with a minimum
consumption of oxygen. Gasification of biomass will be investigated under entrained
flow reactor conditions with respect to main syngas composition (CO/CO2/H2),
hydrocarbons, tar and soot, as a function of operating conditions. The measuring data will
provide information on fuel conversion and gas composition as a function of fuel type
and operating conditions such as temperature and oxygen and steam inlet content.
2 Experimental 2.1 Apparatus
All gasification experiments were conducted in the electrically heated entrained flow
reactor placed at the Department of Chemical and Biochemical Engineering at DTU. The
atmospheric pressure entrained flow reactor used for the gasification experiments is
shown schematically in Figure 1. It has an inner diameter of 0.08 meter and a length of 2
meter. The reactor is externally heated by seven independent electric heating elements,
which can be heated to a maximum temperature of 1500°C. A reasonably uniform
temperature in the reactor can be realized, and so the influence of temperature and excess
air ratio on the composition of the syngas can be studied independently. The heating
element of preheater section A and reactor section 6 and 7 were broken, and could not be
heated to the set point temperature. Besides the reactor, the complete facility includes
equipments for fuel particle feeding, gas supply, solid particle sampling, gas sampling
and analysis, liquid sampling, and flue gas treatment. The external high of the facility is 7
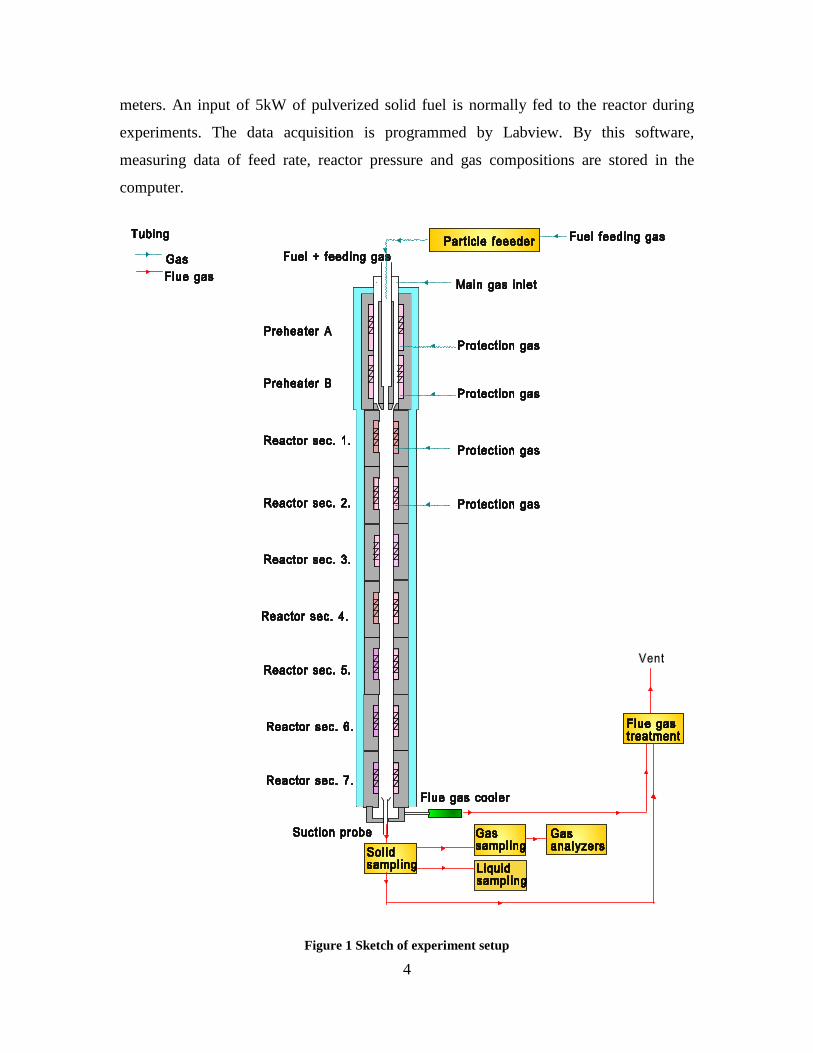
4
meters. An input of 5kW of pulverized solid fuel is normally fed to the reactor during
experiments. The data acquisition is programmed by Labview. By this software,
measuring data of feed rate, reactor pressure and gas compositions are stored in the
computer.
Figure 1 Sketch of experiment setup
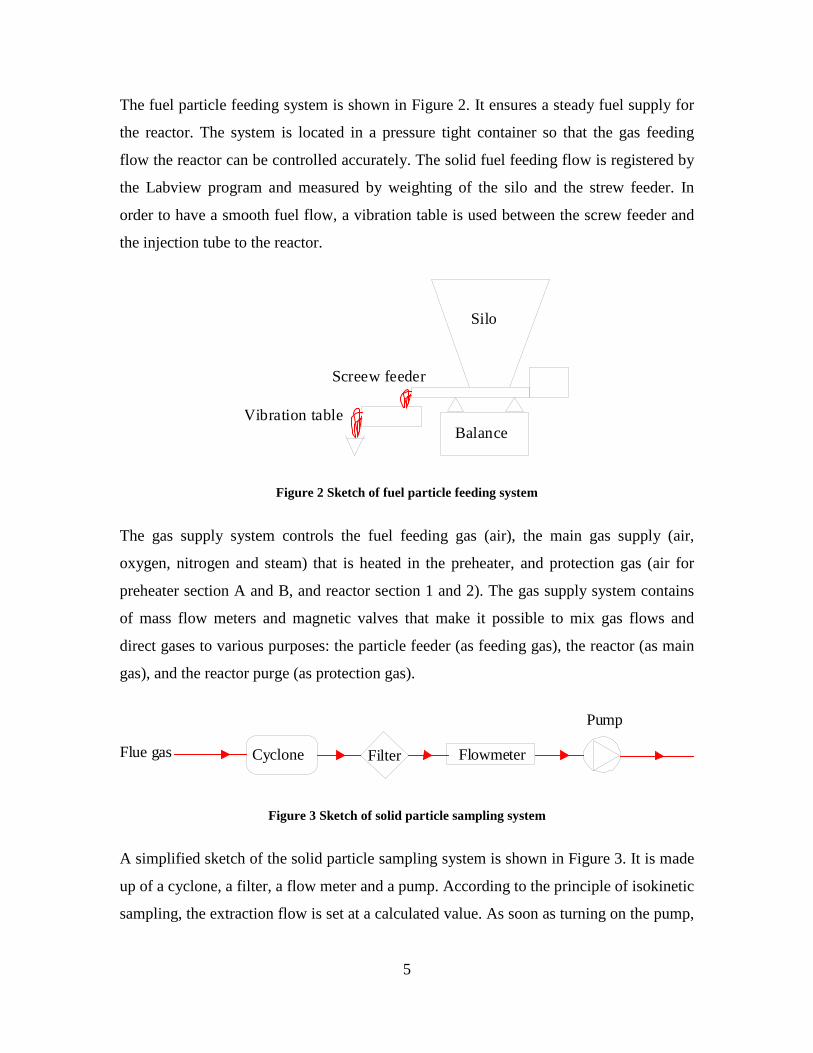
5
The fuel particle feeding system is shown in Figure 2. It ensures a steady fuel supply for
the reactor. The system is located in a pressure tight container so that the gas feeding
flow the reactor can be controlled accurately. The solid fuel feeding flow is registered by
the Labview program and measured by weighting of the silo and the strew feeder. In
order to have a smooth fuel flow, a vibration table is used between the screw feeder and
the injection tube to the reactor.
Vibration table
Screew feeder
Silo
Balance
Figure 2 Sketch of fuel particle feeding system
The gas supply system controls the fuel feeding gas (air), the main gas supply (air,
oxygen, nitrogen and steam) that is heated in the preheater, and protection gas (air for
preheater section A and B, and reactor section 1 and 2). The gas supply system contains
of mass flow meters and magnetic valves that make it possible to mix gas flows and
direct gases to various purposes: the particle feeder (as feeding gas), the reactor (as main
gas), and the reactor purge (as protection gas).
Cyclone Filter Flowmeter
Pump
Flue gas
Figure 3 Sketch of solid particle sampling system
A simplified sketch of the solid particle sampling system is shown in Figure 3. It is made
up of a cyclone, a filter, a flow meter and a pump. According to the principle of isokinetic
sampling, the extraction flow is set at a calculated value. As soon as turning on the pump,
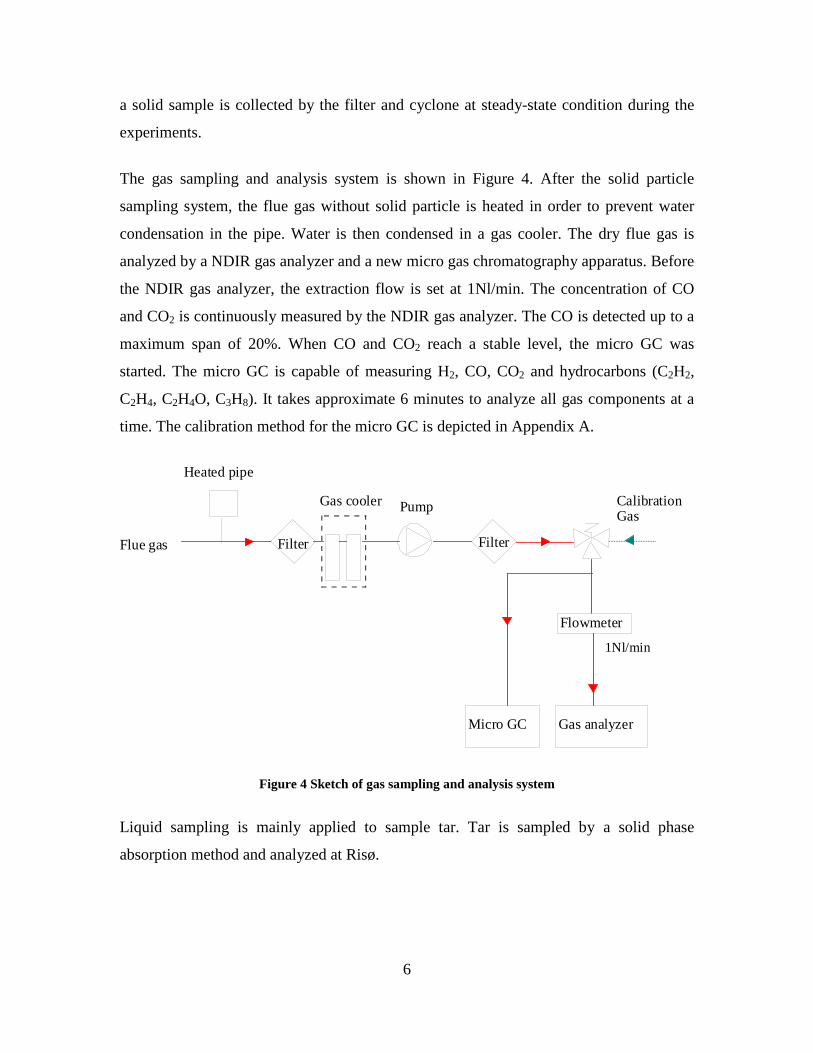
6
a solid sample is collected by the filter and cyclone at steady-state condition during the
experiments.
The gas sampling and analysis system is shown in Figure 4. After the solid particle
sampling system, the flue gas without solid particle is heated in order to prevent water
condensation in the pipe. Water is then condensed in a gas cooler. The dry flue gas is
analyzed by a NDIR gas analyzer and a new micro gas chromatography apparatus. Before
the NDIR gas analyzer, the extraction flow is set at 1Nl/min. The concentration of CO
and CO2 is continuously measured by the NDIR gas analyzer. The CO is detected up to a
maximum span of 20%. When CO and CO2 reach a stable level, the micro GC was
started. The micro GC is capable of measuring H2, CO, CO2 and hydrocarbons (C2H2,
C2H4, C2H4O, C3H8). It takes approximate 6 minutes to analyze all gas components at a
time. The calibration method for the micro GC is depicted in Appendix A.
CalibrationGas
Filter
Gas cooler
Heated pipe
Filter
Gas analyzer
Pump
Micro GC
Flue gas
1Nl/min
Flowmeter
Figure 4 Sketch of gas sampling and analysis system
Liquid sampling is mainly applied to sample tar. Tar is sampled by a solid phase
absorption method and analyzed at Risø.
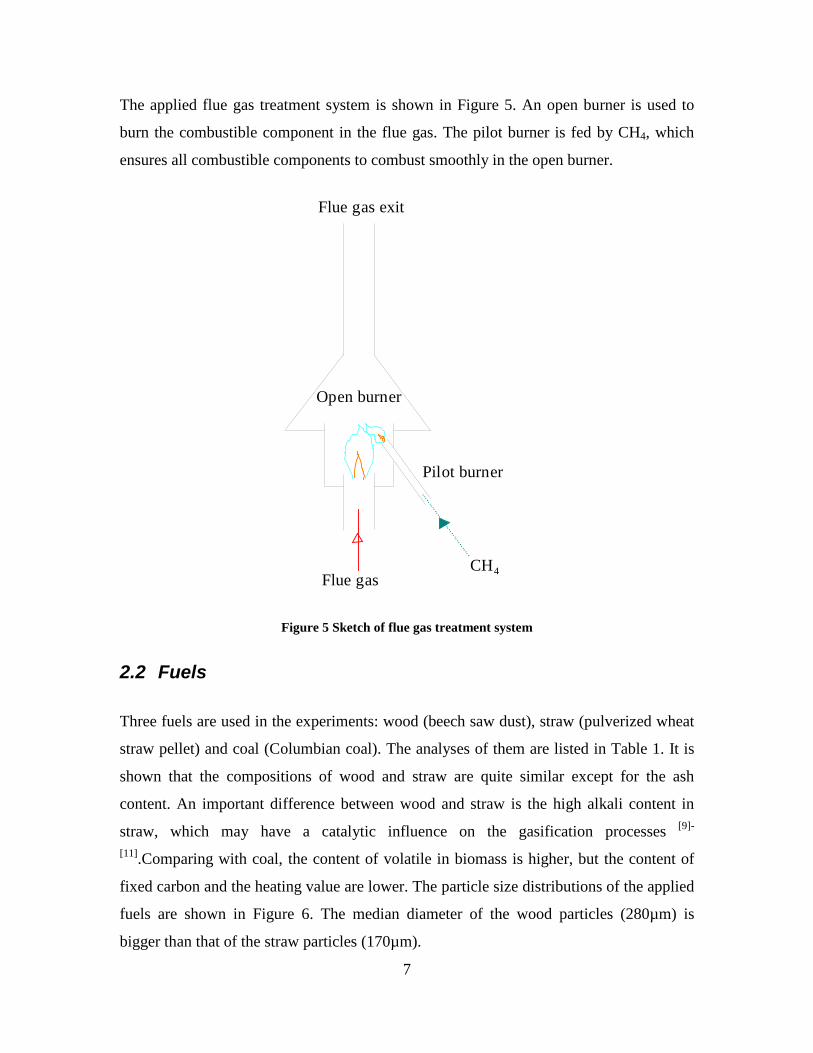
7
The applied flue gas treatment system is shown in Figure 5. An open burner is used to
burn the combustible component in the flue gas. The pilot burner is fed by CH4, which
ensures all combustible components to combust smoothly in the open burner.
Flue gas exit
CH4
Open burner
Pilot burner
Flue gas
Figure 5 Sketch of flue gas treatment system
2.2 Fuels
Three fuels are used in the experiments: wood (beech saw dust), straw (pulverized wheat
straw pellet) and coal (Columbian coal). The analyses of them are listed in Table 1. It is
shown that the compositions of wood and straw are quite similar except for the ash
content. An important difference between wood and straw is the high alkali content in
straw, which may have a catalytic influence on the gasification processes [9]-
[11].Comparing with coal, the content of volatile in biomass is higher, but the content of
fixed carbon and the heating value are lower. The particle size distributions of the applied
fuels are shown in Figure 6. The median diameter of the wood particles (280µm) is
bigger than that of the straw particles (170µm).
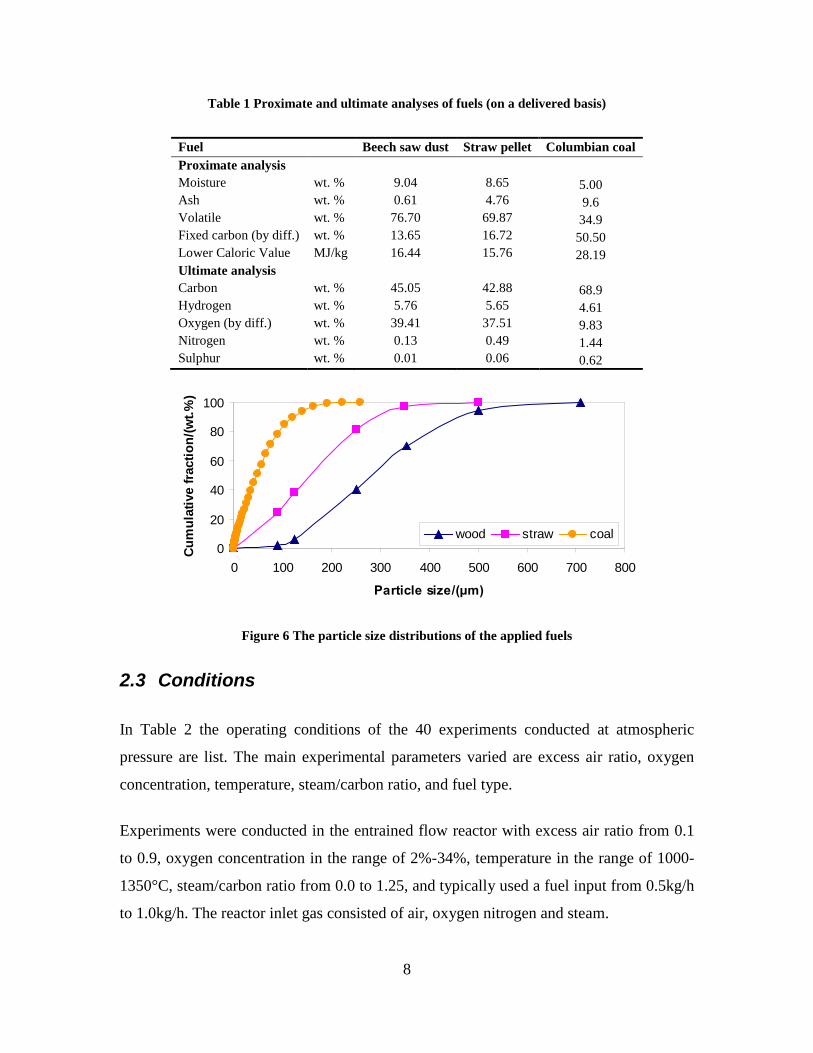
8
Table 1 Proximate and ultimate analyses of fuels (on a delivered basis)
Fuel Beech saw dust Straw pellet Columbian coal Proximate analysis Moisture wt. % 9.04 8.65 5.00 Ash wt. % 0.61 4.76 9.6 Volatile wt. % 76.70 69.87 34.9 Fixed carbon (by diff.) wt. % 13.65 16.72 50.50 Lower Caloric Value MJ/kg 16.44 15.76 28.19 Ultimate analysis Carbon wt. % 45.05 42.88 68.9 Hydrogen wt. % 5.76 5.65 4.61 Oxygen (by diff.) wt. % 39.41 37.51 9.83 Nitrogen wt. % 0.13 0.49 1.44 Sulphur wt. % 0.01 0.06 0.62
0
20
40
60
80
100
0 100 200 300 400 500 600 700 800
Particle size/(μm)
Cum
ulat
ive
fract
ion/
(wt.%
)
wood straw coal
Figure 6 The particle size distributions of the applied fuels
2.3 Conditions
In Table 2 the operating conditions of the 40 experiments conducted at atmospheric
pressure are list. The main experimental parameters varied are excess air ratio, oxygen
concentration, temperature, steam/carbon ratio, and fuel type.
Experiments were conducted in the entrained flow reactor with excess air ratio from 0.1
to 0.9, oxygen concentration in the range of 2%-34%, temperature in the range of 1000-
1350°C, steam/carbon ratio from 0.0 to 1.25, and typically used a fuel input from 0.5kg/h
to 1.0kg/h. The reactor inlet gas consisted of air, oxygen nitrogen and steam.
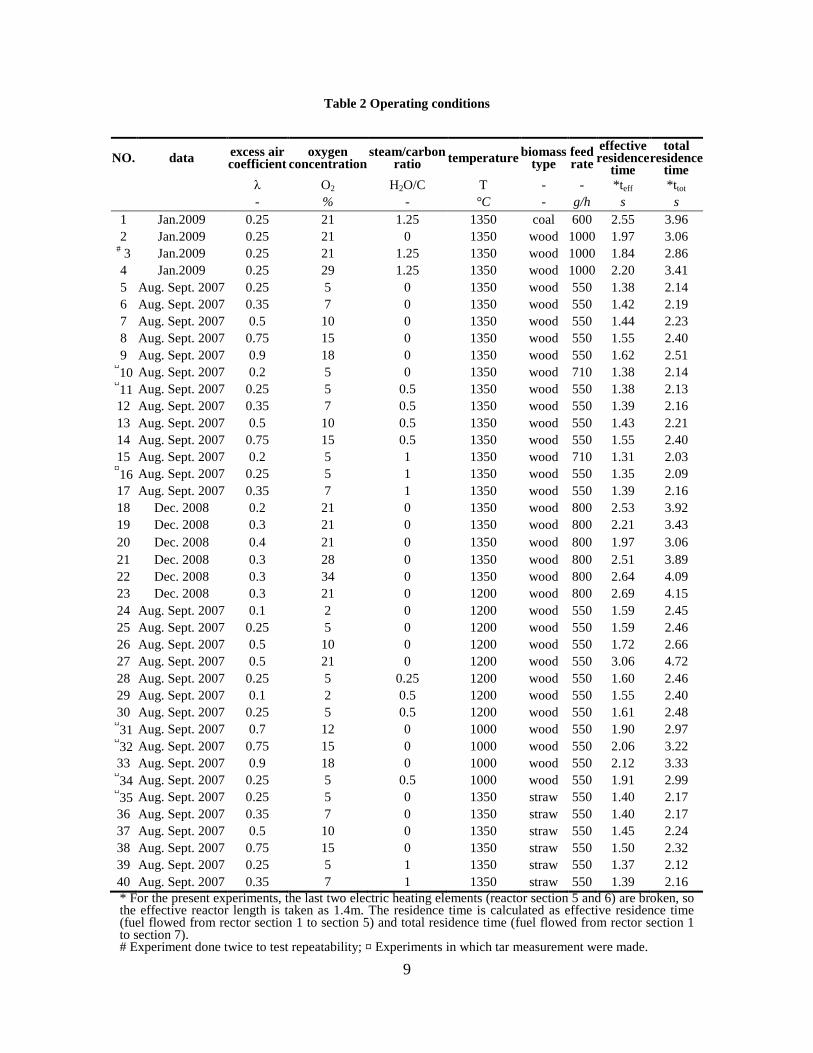
9
Table 2 Operating conditions
NO. data excess air coefficient
oxygen concentration
steam/carbon ratio temperature biomass
type feed rate
effective residence
time
total residence
time λ O2 H2O/C T - - *teff *ttot - % - °C - g/h s s
1 Jan.2009 0.25 21 1.25 1350 coal 600 2.55 3.96 2 Jan.2009 0.25 21 0 1350 wood 1000 1.97 3.06
# 3 Jan.2009 0.25 21 1.25 1350 wood 1000 1.84 2.86 4 Jan.2009 0.25 29 1.25 1350 wood 1000 2.20 3.41 5 Aug. Sept. 2007 0.25 5 0 1350 wood 550 1.38 2.14 6 Aug. Sept. 2007 0.35 7 0 1350 wood 550 1.42 2.19 7 Aug. Sept. 2007 0.5 10 0 1350 wood 550 1.44 2.23 8 Aug. Sept. 2007 0.75 15 0 1350 wood 550 1.55 2.40 9 Aug. Sept. 2007 0.9 18 0 1350 wood 550 1.62 2.51
¤10 Aug. Sept. 2007 0.2 5 0 1350 wood 710 1.38 2.14 ¤11 Aug. Sept. 2007 0.25 5 0.5 1350 wood 550 1.38 2.13 12 Aug. Sept. 2007 0.35 7 0.5 1350 wood 550 1.39 2.16 13 Aug. Sept. 2007 0.5 10 0.5 1350 wood 550 1.43 2.21 14 Aug. Sept. 2007 0.75 15 0.5 1350 wood 550 1.55 2.40 15 Aug. Sept. 2007 0.2 5 1 1350 wood 710 1.31 2.03
¤16 Aug. Sept. 2007 0.25 5 1 1350 wood 550 1.35 2.09 17 Aug. Sept. 2007 0.35 7 1 1350 wood 550 1.39 2.16 18 Dec. 2008 0.2 21 0 1350 wood 800 2.53 3.92 19 Dec. 2008 0.3 21 0 1350 wood 800 2.21 3.43 20 Dec. 2008 0.4 21 0 1350 wood 800 1.97 3.06 21 Dec. 2008 0.3 28 0 1350 wood 800 2.51 3.89 22 Dec. 2008 0.3 34 0 1350 wood 800 2.64 4.09 23 Dec. 2008 0.3 21 0 1200 wood 800 2.69 4.15 24 Aug. Sept. 2007 0.1 2 0 1200 wood 550 1.59 2.45 25 Aug. Sept. 2007 0.25 5 0 1200 wood 550 1.59 2.46 26 Aug. Sept. 2007 0.5 10 0 1200 wood 550 1.72 2.66 27 Aug. Sept. 2007 0.5 21 0 1200 wood 550 3.06 4.72 28 Aug. Sept. 2007 0.25 5 0.25 1200 wood 550 1.60 2.46 29 Aug. Sept. 2007 0.1 2 0.5 1200 wood 550 1.55 2.40 30 Aug. Sept. 2007 0.25 5 0.5 1200 wood 550 1.61 2.48
¤31 Aug. Sept. 2007 0.7 12 0 1000 wood 550 1.90 2.97 ¤32 Aug. Sept. 2007 0.75 15 0 1000 wood 550 2.06 3.22 33 Aug. Sept. 2007 0.9 18 0 1000 wood 550 2.12 3.33
¤34 Aug. Sept. 2007 0.25 5 0.5 1000 wood 550 1.91 2.99 ¤35 Aug. Sept. 2007 0.25 5 0 1350 straw 550 1.40 2.17 36 Aug. Sept. 2007 0.35 7 0 1350 straw 550 1.40 2.17 37 Aug. Sept. 2007 0.5 10 0 1350 straw 550 1.45 2.24 38 Aug. Sept. 2007 0.75 15 0 1350 straw 550 1.50 2.32 39 Aug. Sept. 2007 0.25 5 1 1350 straw 550 1.37 2.12 40 Aug. Sept. 2007 0.35 7 1 1350 straw 550 1.39 2.16 * For the present experiments, the last two electric heating elements (reactor section 5 and 6) are broken, so the effective reactor length is taken as 1.4m. The residence time is calculated as effective residence time (fuel flowed from rector section 1 to section 5) and total residence time (fuel flowed from rector section 1 to section 7). # Experiment done twice to test repeatability; ¤ Experiments in which tar measurement were made.
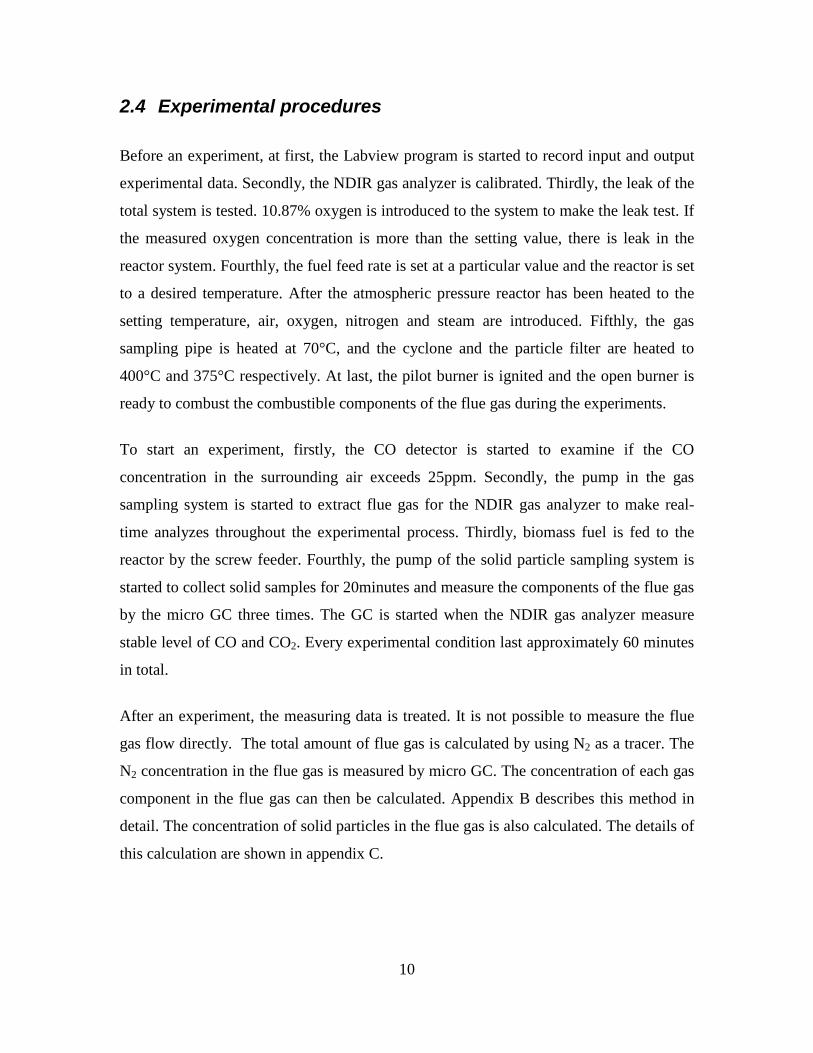
10
2.4 Experimental procedures
Before an experiment, at first, the Labview program is started to record input and output
experimental data. Secondly, the NDIR gas analyzer is calibrated. Thirdly, the leak of the
total system is tested. 10.87% oxygen is introduced to the system to make the leak test. If
the measured oxygen concentration is more than the setting value, there is leak in the
reactor system. Fourthly, the fuel feed rate is set at a particular value and the reactor is set
to a desired temperature. After the atmospheric pressure reactor has been heated to the
setting temperature, air, oxygen, nitrogen and steam are introduced. Fifthly, the gas
sampling pipe is heated at 70°C, and the cyclone and the particle filter are heated to
400°C and 375°C respectively. At last, the pilot burner is ignited and the open burner is
ready to combust the combustible components of the flue gas during the experiments.
To start an experiment, firstly, the CO detector is started to examine if the CO
concentration in the surrounding air exceeds 25ppm. Secondly, the pump in the gas
sampling system is started to extract flue gas for the NDIR gas analyzer to make real-
time analyzes throughout the experimental process. Thirdly, biomass fuel is fed to the
reactor by the screw feeder. Fourthly, the pump of the solid particle sampling system is
started to collect solid samples for 20minutes and measure the components of the flue gas
by the micro GC three times. The GC is started when the NDIR gas analyzer measure
stable level of CO and CO2. Every experimental condition last approximately 60 minutes
in total.
After an experiment, the measuring data is treated. It is not possible to measure the flue
gas flow directly. The total amount of flue gas is calculated by using N2 as a tracer. The
N2 concentration in the flue gas is measured by micro GC. The concentration of each gas
component in the flue gas can then be calculated. Appendix B describes this method in
detail. The concentration of solid particles in the flue gas is also calculated. The details of
this calculation are shown in appendix C.
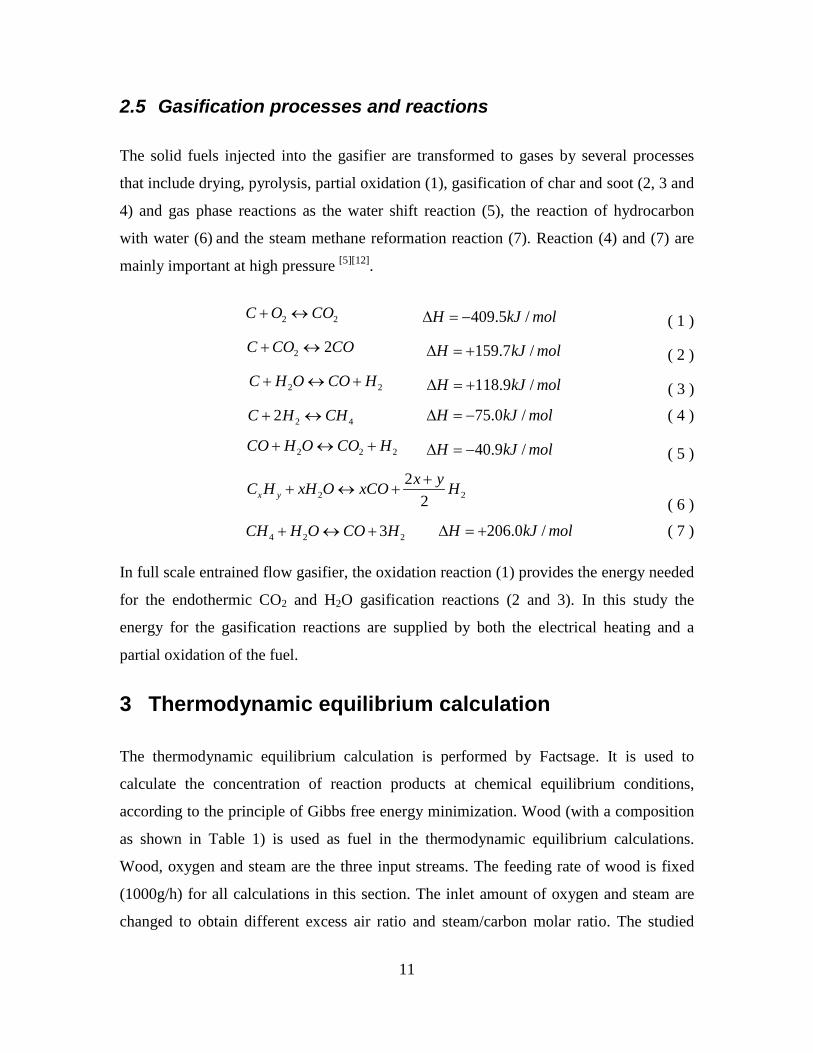
11
2.5 Gasification processes and reactions
The solid fuels injected into the gasifier are transformed to gases by several processes
that include drying, pyrolysis, partial oxidation (1), gasification of char and soot (2, 3 and
4) and gas phase reactions as the water shift reaction (5), the reaction of hydrocarbon
with water (6) and the steam methane reformation reaction (7). Reaction (4) and (7) are
mainly important at high pressure [5][12].
2 2C O CO+ ↔ 409.5 /H kJ mol∆ = − ( 1 )
2 2C CO CO+ ↔ 159.7 /H kJ mol∆ = + ( 2 )
2 2C H O CO H+ ↔ + 118.9 /H kJ mol∆ = + ( 3 )
2 42C H CH+ ↔ 75.0 /H kJ mol∆ = − ( 4 )
2 2 2CO H O CO H+ ↔ + 40.9 /H kJ mol∆ = − ( 5 )
2 2
22x y
x yC H xH O xCO H++ ↔ +
( 6 )
4 2 23CH H O CO H+ ↔ + 206.0 /H kJ mol∆ = + ( 7 )
In full scale entrained flow gasifier, the oxidation reaction (1) provides the energy needed
for the endothermic CO2 and H2O gasification reactions (2 and 3). In this study the
energy for the gasification reactions are supplied by both the electrical heating and a
partial oxidation of the fuel.
3 Thermodynamic equilibrium calculation
The thermodynamic equilibrium calculation is performed by Factsage. It is used to
calculate the concentration of reaction products at chemical equilibrium conditions,
according to the principle of Gibbs free energy minimization. Wood (with a composition
as shown in Table 1) is used as fuel in the thermodynamic equilibrium calculations.
Wood, oxygen and steam are the three input streams. The feeding rate of wood is fixed
(1000g/h) for all calculations in this section. The inlet amount of oxygen and steam are
changed to obtain different excess air ratio and steam/carbon molar ratio. The studied
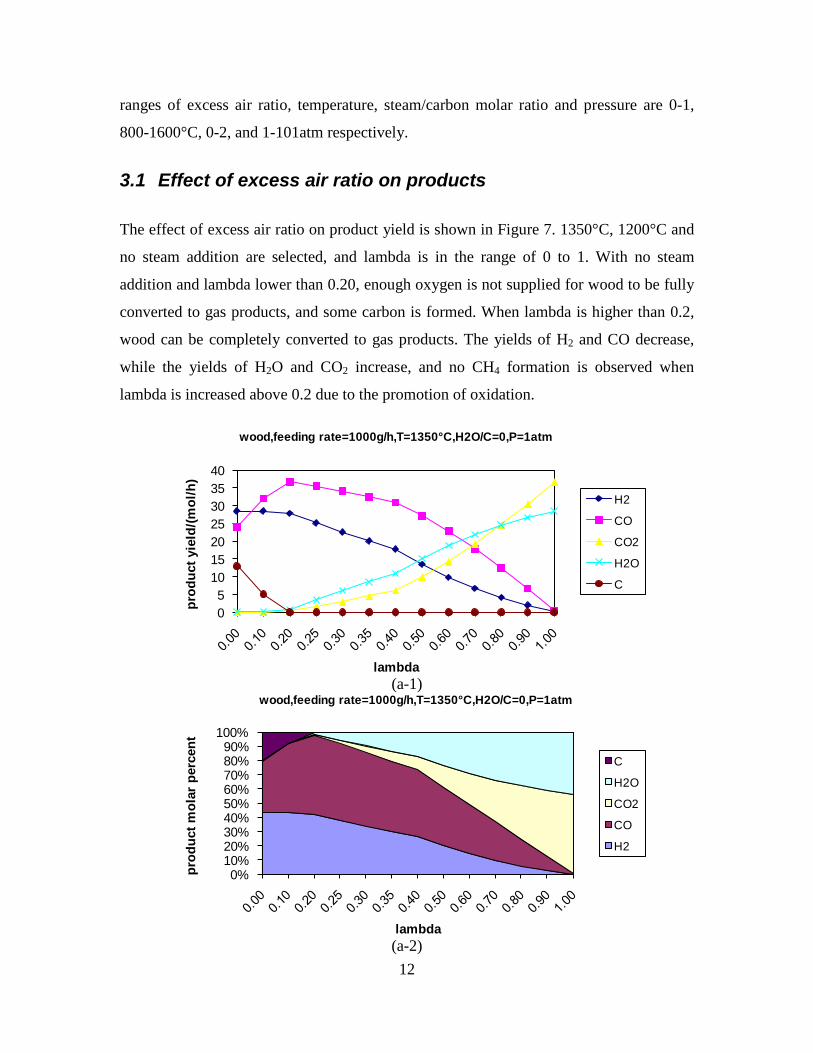
12
ranges of excess air ratio, temperature, steam/carbon molar ratio and pressure are 0-1,
800-1600°C, 0-2, and 1-101atm respectively.
3.1 Effect of excess air ratio on products
The effect of excess air ratio on product yield is shown in Figure 7. 1350°C, 1200°C and
no steam addition are selected, and lambda is in the range of 0 to 1. With no steam
addition and lambda lower than 0.20, enough oxygen is not supplied for wood to be fully
converted to gas products, and some carbon is formed. When lambda is higher than 0.2,
wood can be completely converted to gas products. The yields of H2 and CO decrease,
while the yields of H2O and CO2 increase, and no CH4 formation is observed when
lambda is increased above 0.2 due to the promotion of oxidation.
(a-1)
(a-2)
05
10152025303540
prod
uct y
ield
/(mol
/h)
lambda
wood,feeding rate=1000g/h,T=1350°C,H2O/C=0,P=1atm
H2
CO
CO2
H2O
C
0%10%20%30%40%50%60%70%80%90%
100%
prod
uct m
olar
per
cent
lambda
wood,feeding rate=1000g/h,T=1350°C,H2O/C=0,P=1atm
C
H2O
CO2
CO
H2
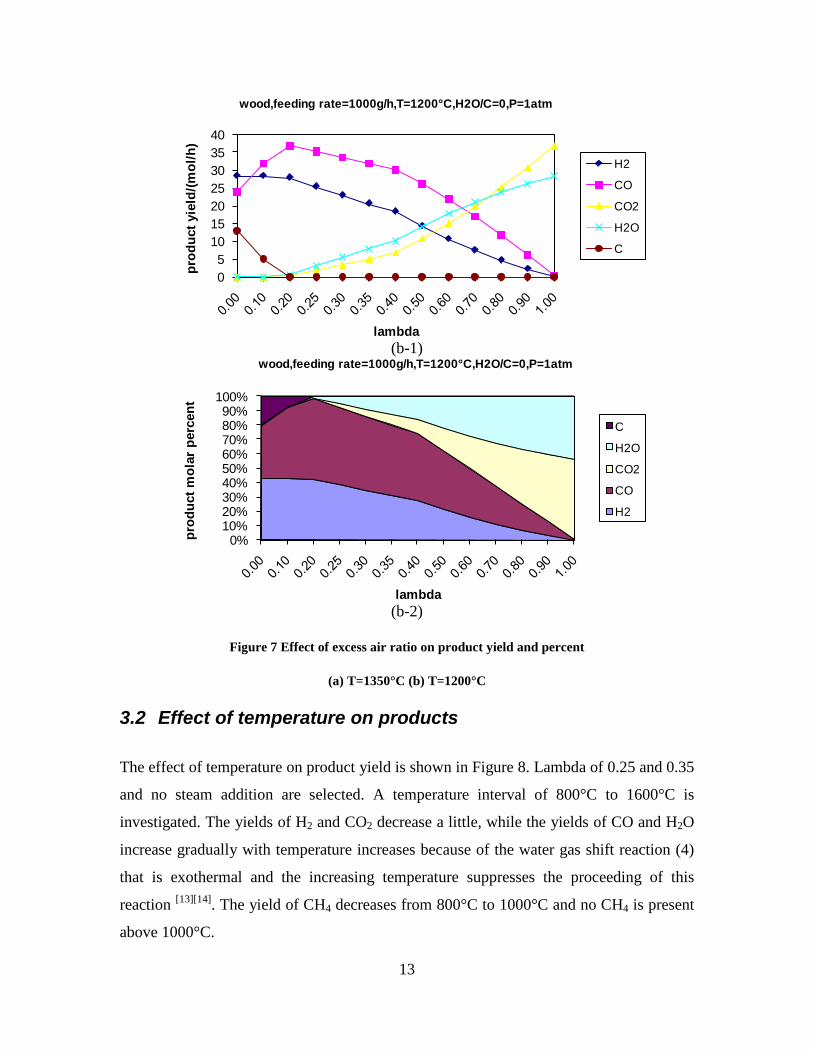
13
(b-1)
(b-2)
Figure 7 Effect of excess air ratio on product yield and percent
(a) T=1350°C (b) T=1200°C
3.2 Effect of temperature on products
The effect of temperature on product yield is shown in Figure 8. Lambda of 0.25 and 0.35
and no steam addition are selected. A temperature interval of 800°C to 1600°C is
investigated. The yields of H2 and CO2 decrease a little, while the yields of CO and H2O
increase gradually with temperature increases because of the water gas shift reaction (4)
that is exothermal and the increasing temperature suppresses the proceeding of this
reaction [13][14]. The yield of CH4 decreases from 800°C to 1000°C and no CH4 is present
above 1000°C.
05
10152025303540
prod
uct y
ield
/(mol
/h)
lambda
wood,feeding rate=1000g/h,T=1200°C,H2O/C=0,P=1atm
H2
CO
CO2
H2O
C
0%10%20%30%40%50%60%70%80%90%
100%
prod
uct m
olar
per
cent
lambda
wood,feeding rate=1000g/h,T=1200°C,H2O/C=0,P=1atm
C
H2O
CO2
CO
H2
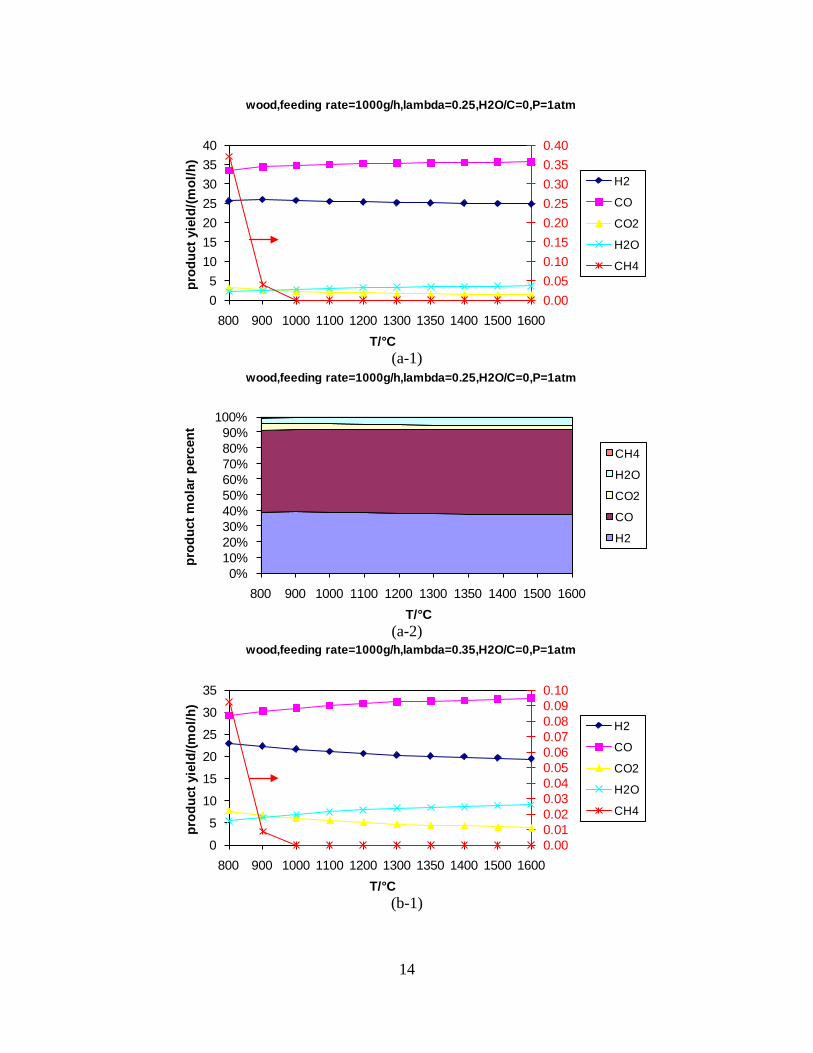
14
(a-1)
(a-2)
(b-1)
0.000.050.100.150.200.250.300.350.40
05
10152025303540
800 900 1000 1100 1200 1300 1350 1400 1500 1600
prod
uct y
ield
/(mol
/h)
T/°C
wood,feeding rate=1000g/h,lambda=0.25,H2O/C=0,P=1atm
H2
CO
CO2
H2O
CH4
0%10%20%30%40%50%60%70%80%90%
100%
800 900 1000 1100 1200 1300 1350 1400 1500 1600
prod
uct m
olar
per
cent
T/°C
wood,feeding rate=1000g/h,lambda=0.25,H2O/C=0,P=1atm
CH4
H2O
CO2
CO
H2
0.000.010.020.030.040.050.060.070.080.090.10
0
5
10
15
20
25
30
35
800 900 1000 1100 1200 1300 1350 1400 1500 1600
prod
uct y
ield
/(mol
/h)
T/°C
wood,feeding rate=1000g/h,lambda=0.35,H2O/C=0,P=1atm
H2
CO
CO2
H2O
CH4
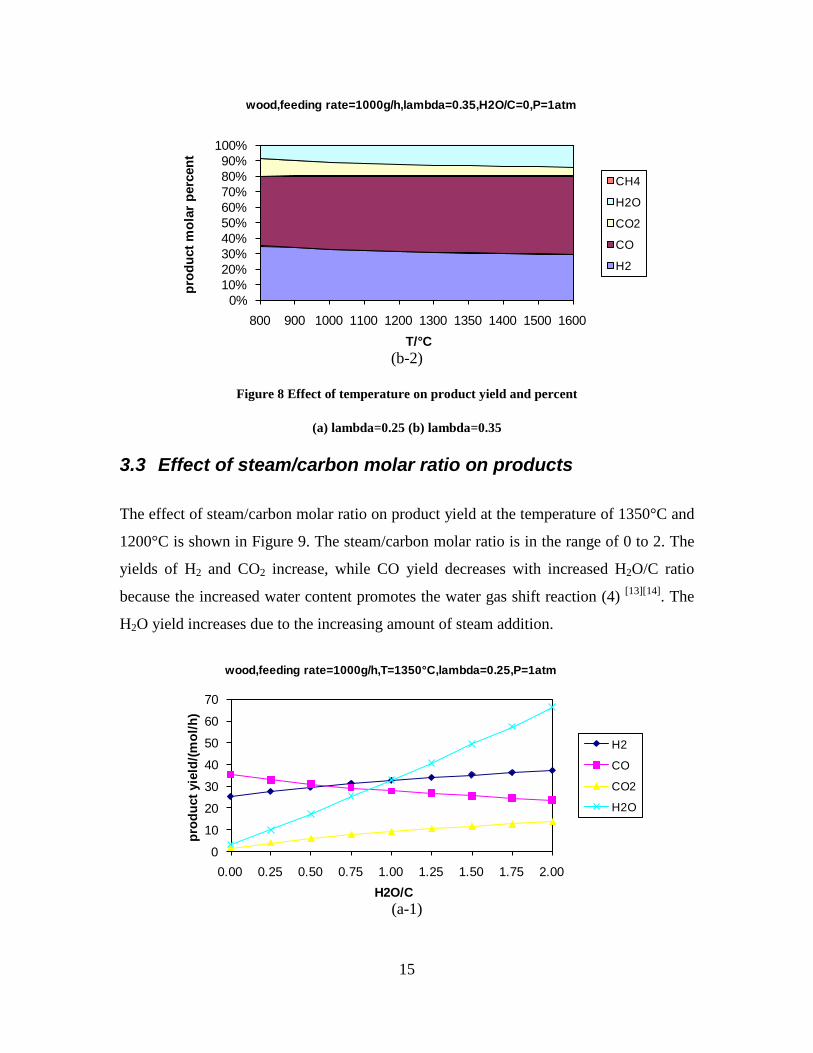
15
(b-2)
Figure 8 Effect of temperature on product yield and percent
(a) lambda=0.25 (b) lambda=0.35
3.3 Effect of steam/carbon molar ratio on products
The effect of steam/carbon molar ratio on product yield at the temperature of 1350°C and
1200°C is shown in Figure 9. The steam/carbon molar ratio is in the range of 0 to 2. The
yields of H2 and CO2 increase, while CO yield decreases with increased H2O/C ratio
because the increased water content promotes the water gas shift reaction (4) [13][14]. The
H2O yield increases due to the increasing amount of steam addition.
(a-1)
0%10%20%30%40%50%60%70%80%90%
100%
800 900 1000 1100 1200 1300 1350 1400 1500 1600
prod
uct m
olar
per
cent
T/°C
wood,feeding rate=1000g/h,lambda=0.35,H2O/C=0,P=1atm
CH4
H2O
CO2
CO
H2
0
10
20
30
40
50
60
70
0.00 0.25 0.50 0.75 1.00 1.25 1.50 1.75 2.00
prod
uct y
ield
/(mol
/h)
H2O/C
wood,feeding rate=1000g/h,T=1350°C,lambda=0.25,P=1atm
H2
CO
CO2
H2O
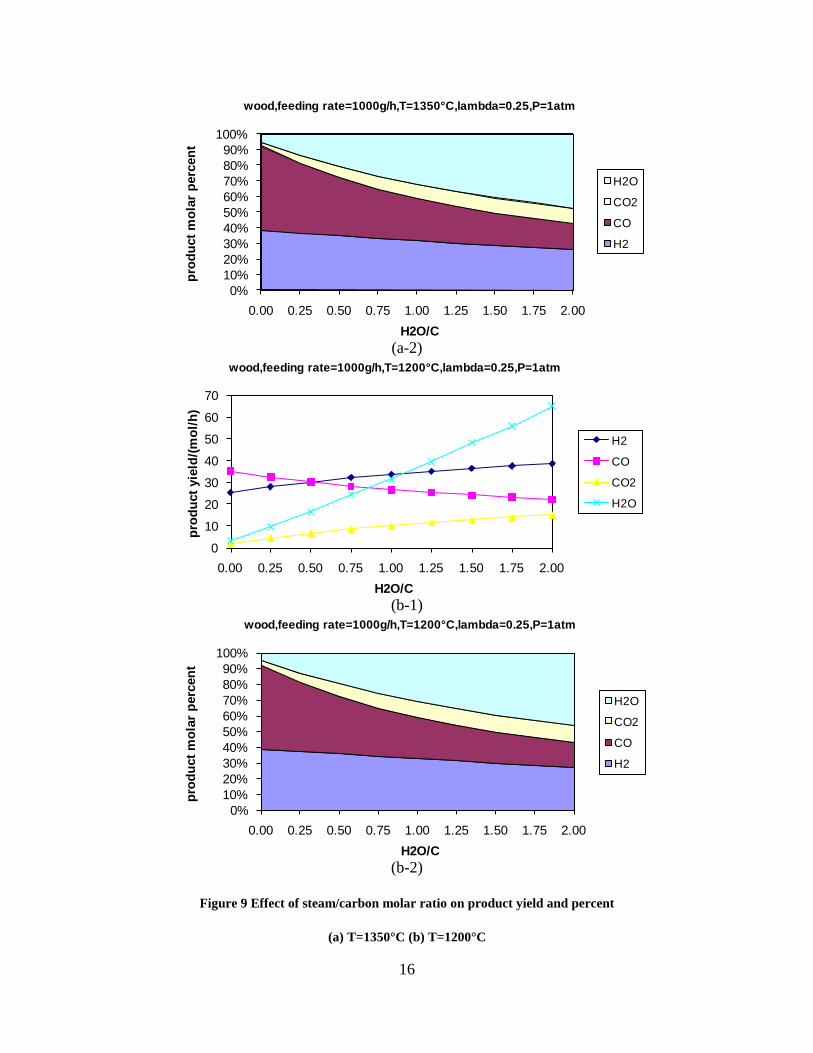
16
(a-2)
(b-1)
(b-2)
Figure 9 Effect of steam/carbon molar ratio on product yield and percent
(a) T=1350°C (b) T=1200°C
0%10%20%30%40%50%60%70%80%90%
100%
0.00 0.25 0.50 0.75 1.00 1.25 1.50 1.75 2.00
prod
uct m
olar
per
cent
H2O/C
wood,feeding rate=1000g/h,T=1350°C,lambda=0.25,P=1atm
H2O
CO2
CO
H2
0
10
20
30
40
50
60
70
0.00 0.25 0.50 0.75 1.00 1.25 1.50 1.75 2.00
prod
uct y
ield
/(mol
/h)
H2O/C
wood,feeding rate=1000g/h,T=1200°C,lambda=0.25,P=1atm
H2
CO
CO2
H2O
0%10%20%30%40%50%60%70%80%90%
100%
0.00 0.25 0.50 0.75 1.00 1.25 1.50 1.75 2.00
prod
uct m
olar
per
cent
H2O/C
wood,feeding rate=1000g/h,T=1200°C,lambda=0.25,P=1atm
H2O
CO2
CO
H2
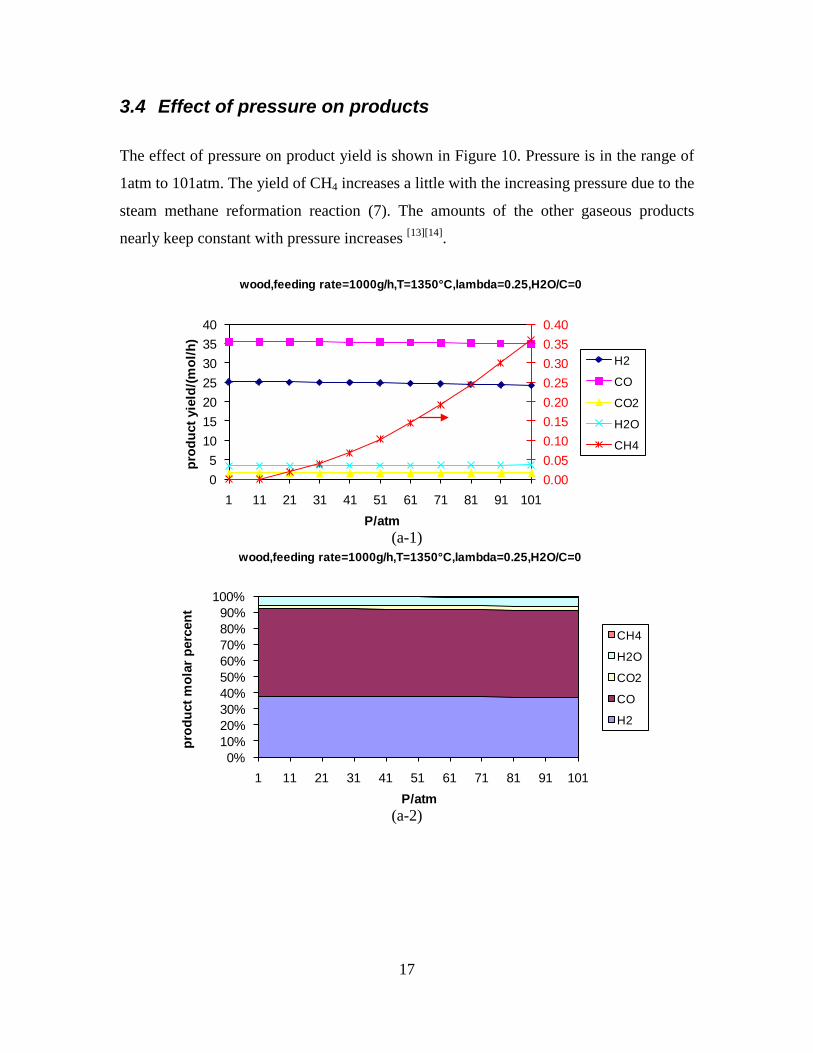
17
3.4 Effect of pressure on products
The effect of pressure on product yield is shown in Figure 10. Pressure is in the range of
1atm to 101atm. The yield of CH4 increases a little with the increasing pressure due to the
steam methane reformation reaction (7). The amounts of the other gaseous products
nearly keep constant with pressure increases [13][14].
(a-1)
(a-2)
0.000.050.100.150.200.250.300.350.40
05
10152025303540
1 11 21 31 41 51 61 71 81 91 101
prod
uct y
ield
/(mol
/h)
P/atm
wood,feeding rate=1000g/h,T=1350°C,lambda=0.25,H2O/C=0
H2
CO
CO2
H2O
CH4
0%10%20%30%40%50%60%70%80%90%
100%
1 11 21 31 41 51 61 71 81 91 101
prod
uct m
olar
per
cent
P/atm
wood,feeding rate=1000g/h,T=1350°C,lambda=0.25,H2O/C=0
CH4
H2O
CO2
CO
H2
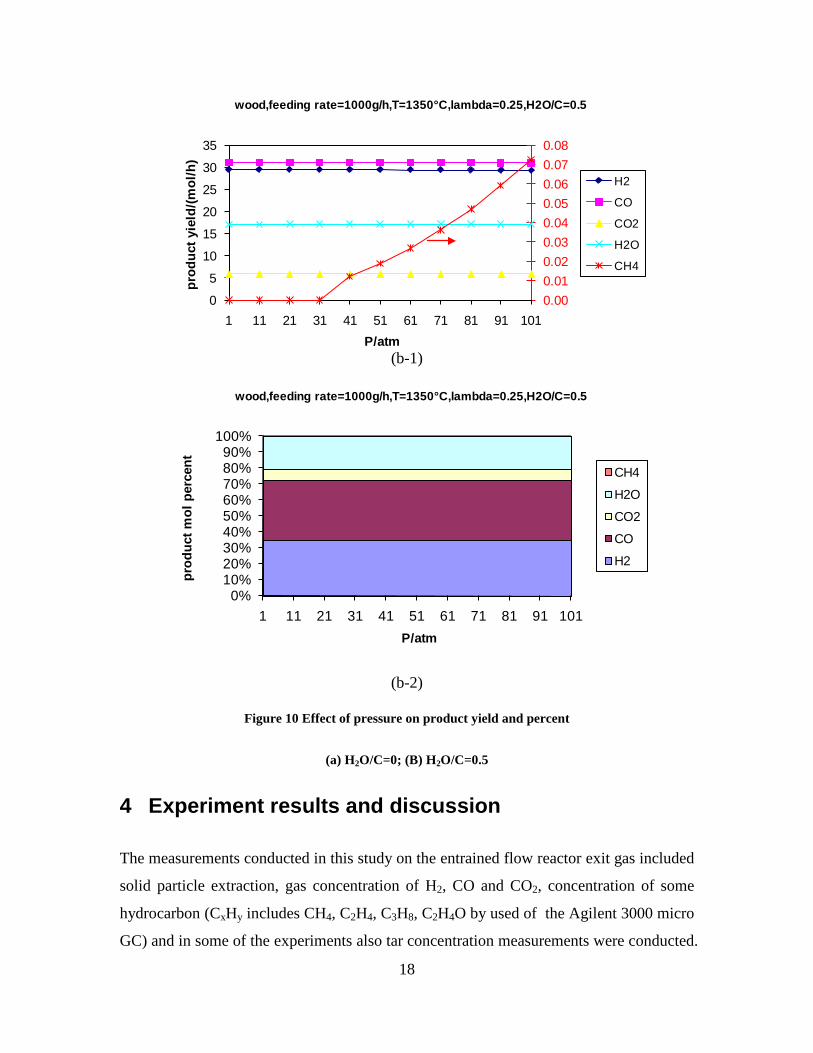
18
(b-1)
(b-2)
Figure 10 Effect of pressure on product yield and percent
(a) H2O/C=0; (B) H2O/C=0.5
4 Experiment results and discussion
The measurements conducted in this study on the entrained flow reactor exit gas included
solid particle extraction, gas concentration of H2, CO and CO2, concentration of some
hydrocarbon (CxHy includes CH4, C2H4, C3H8, C2H4O by used of the Agilent 3000 micro
GC) and in some of the experiments also tar concentration measurements were conducted.
0.000.010.020.030.040.050.060.070.08
0
5
10
15
20
25
30
35
1 11 21 31 41 51 61 71 81 91 101
prod
uct y
ield
/(mol
/h)
P/atm
wood,feeding rate=1000g/h,T=1350°C,lambda=0.25,H2O/C=0.5
H2
CO
CO2
H2O
CH4
0%10%20%30%40%50%60%70%80%90%
100%
1 11 21 31 41 51 61 71 81 91 101
prod
uct m
ol p
erce
nt
P/atm
wood,feeding rate=1000g/h,T=1350°C,lambda=0.25,H2O/C=0.5
CH4
H2O
CO2
CO
H2
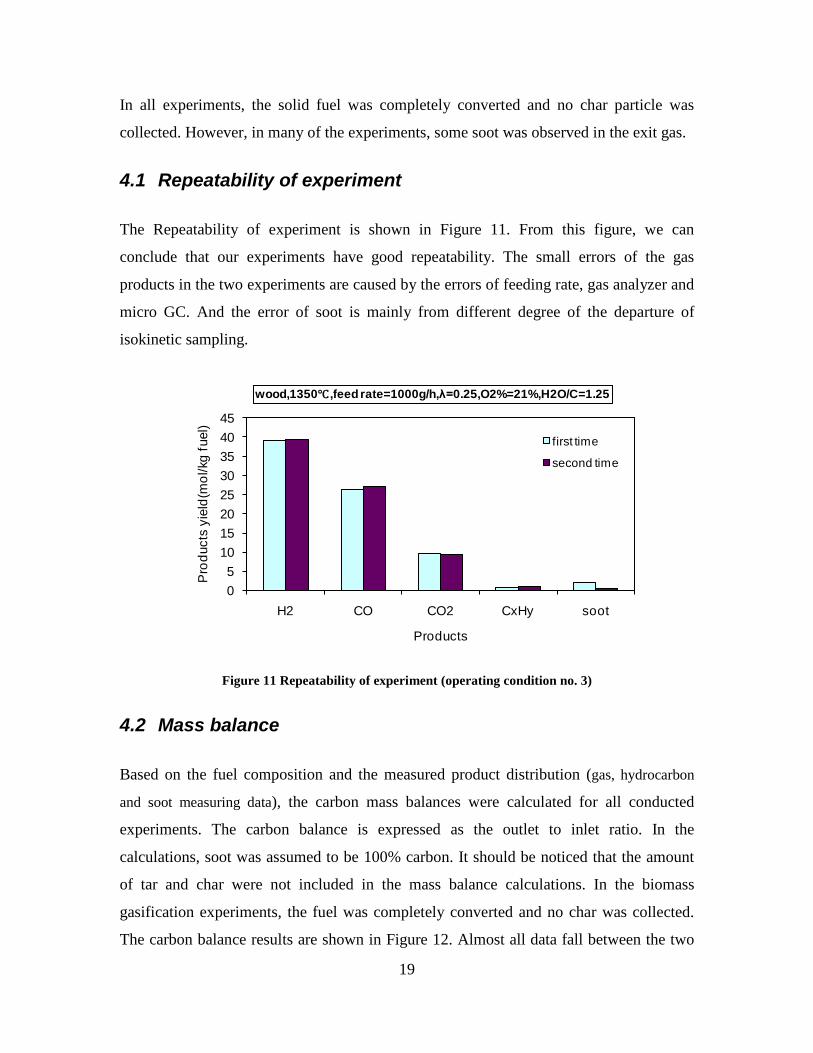
19
In all experiments, the solid fuel was completely converted and no char particle was
collected. However, in many of the experiments, some soot was observed in the exit gas.
4.1 Repeatability of experiment
The Repeatability of experiment is shown in Figure 11. From this figure, we can
conclude that our experiments have good repeatability. The small errors of the gas
products in the two experiments are caused by the errors of feeding rate, gas analyzer and
micro GC. And the error of soot is mainly from different degree of the departure of
isokinetic sampling.
Figure 11 Repeatability of experiment (operating condition no. 3)
4.2 Mass balance
Based on the fuel composition and the measured product distribution (gas, hydrocarbon
and soot measuring data), the carbon mass balances were calculated for all conducted
experiments. The carbon balance is expressed as the outlet to inlet ratio. In the
calculations, soot was assumed to be 100% carbon. It should be noticed that the amount
of tar and char were not included in the mass balance calculations. In the biomass
gasification experiments, the fuel was completely converted and no char was collected.
The carbon balance results are shown in Figure 12. Almost all data fall between the two
05
1015202530354045
H2 CO CO2 CxHy soot
Pro
duct
s yi
eld(
mol
/kg
fuel
)
Products
wood,1350℃ ,feed rate=1000g/h,λ=0.25,O2%=21%,H2O/C=1.25
first time
second time
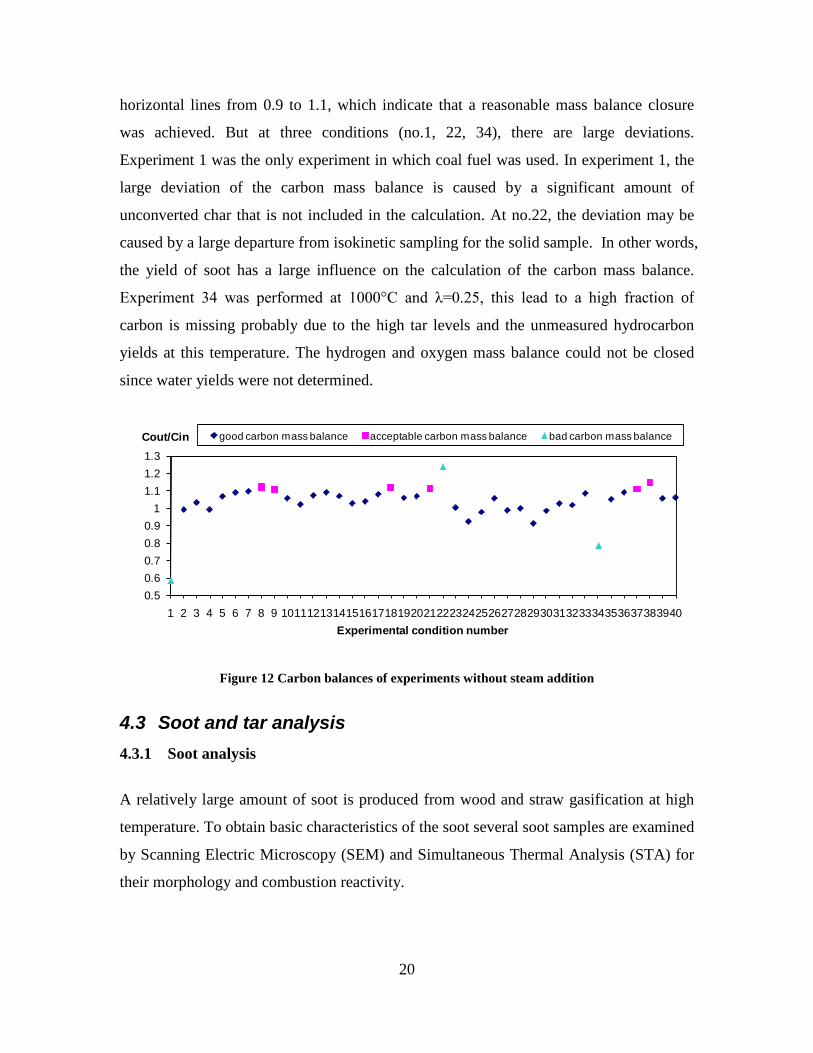
20
horizontal lines from 0.9 to 1.1, which indicate that a reasonable mass balance closure
was achieved. But at three conditions (no.1, 22, 34), there are large deviations.
Experiment 1 was the only experiment in which coal fuel was used. In experiment 1, the
large deviation of the carbon mass balance is caused by a significant amount of
unconverted char that is not included in the calculation. At no.22, the deviation may be
caused by a large departure from isokinetic sampling for the solid sample. In other words,
the yield of soot has a large influence on the calculation of the carbon mass balance.
Experiment 34 was performed at 1000°C and λ=0.25, this lead to a high fraction of
carbon is missing probably due to the high tar levels and the unmeasured hydrocarbon
yields at this temperature. The hydrogen and oxygen mass balance could not be closed
since water yields were not determined.
Figure 12 Carbon balances of experiments without steam addition
4.3 Soot and tar analysis 4.3.1 Soot analysis
A relatively large amount of soot is produced from wood and straw gasification at high
temperature. To obtain basic characteristics of the soot several soot samples are examined
by Scanning Electric Microscopy (SEM) and Simultaneous Thermal Analysis (STA) for
their morphology and combustion reactivity.
0.50.60.70.80.9
11.11.21.3
1 2 3 4 5 6 7 8 9 10111213141516171819202122232425262728293031323334353637383940
Cout/Cin
Experimental condition number
good carbon mass balance acceptable carbon mass balance bad carbon mass balance
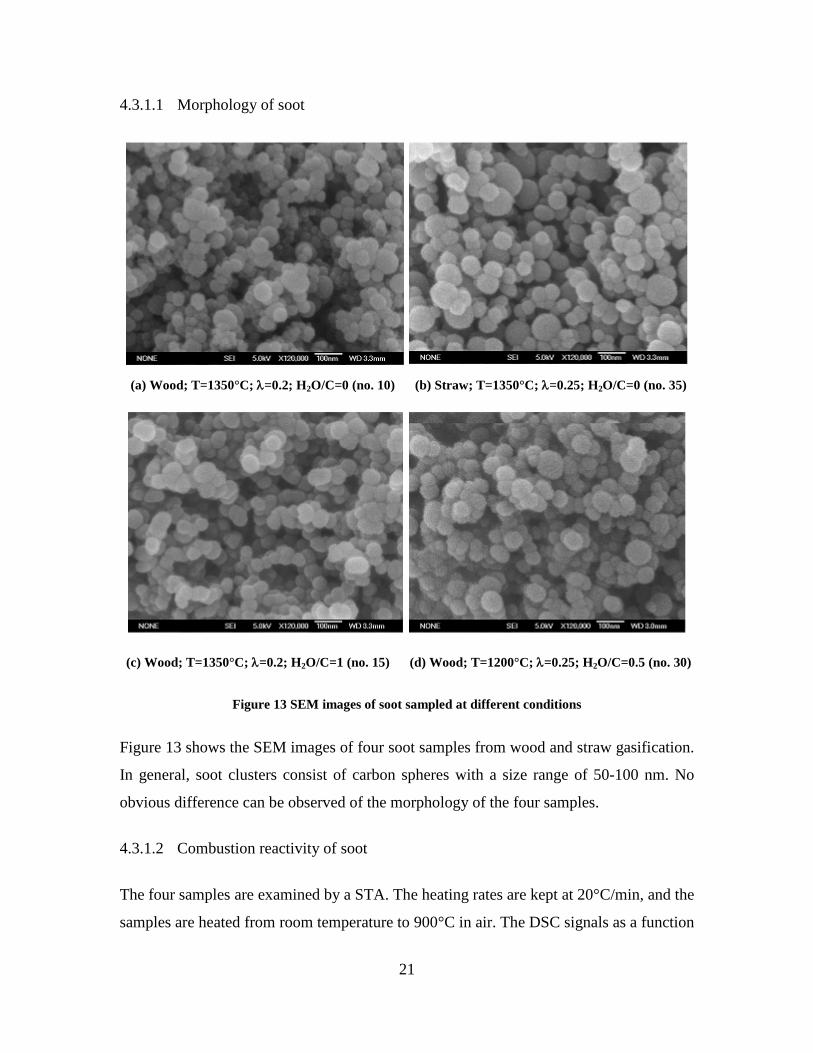
21
4.3.1.1 Morphology of soot
(a) Wood; T=1350°C; λ=0.2; H2O/C=0 (no. 10) (b) Straw; T=1350°C; λ=0.25; H2O/C=0 (no. 35)
(c) Wood; T=1350°C; λ=0.2; H2O/C=1 (no. 15) (d) Wood; T=1200°C; λ=0.25; H2O/C=0.5 (no. 30)
Figure 13 SEM images of soot sampled at different conditions
Figure 13 shows the SEM images of four soot samples from wood and straw gasification.
In general, soot clusters consist of carbon spheres with a size range of 50-100 nm. No
obvious difference can be observed of the morphology of the four samples.
4.3.1.2 Combustion reactivity of soot
The four samples are examined by a STA. The heating rates are kept at 20°C/min, and the
samples are heated from room temperature to 900°C in air. The DSC signals as a function
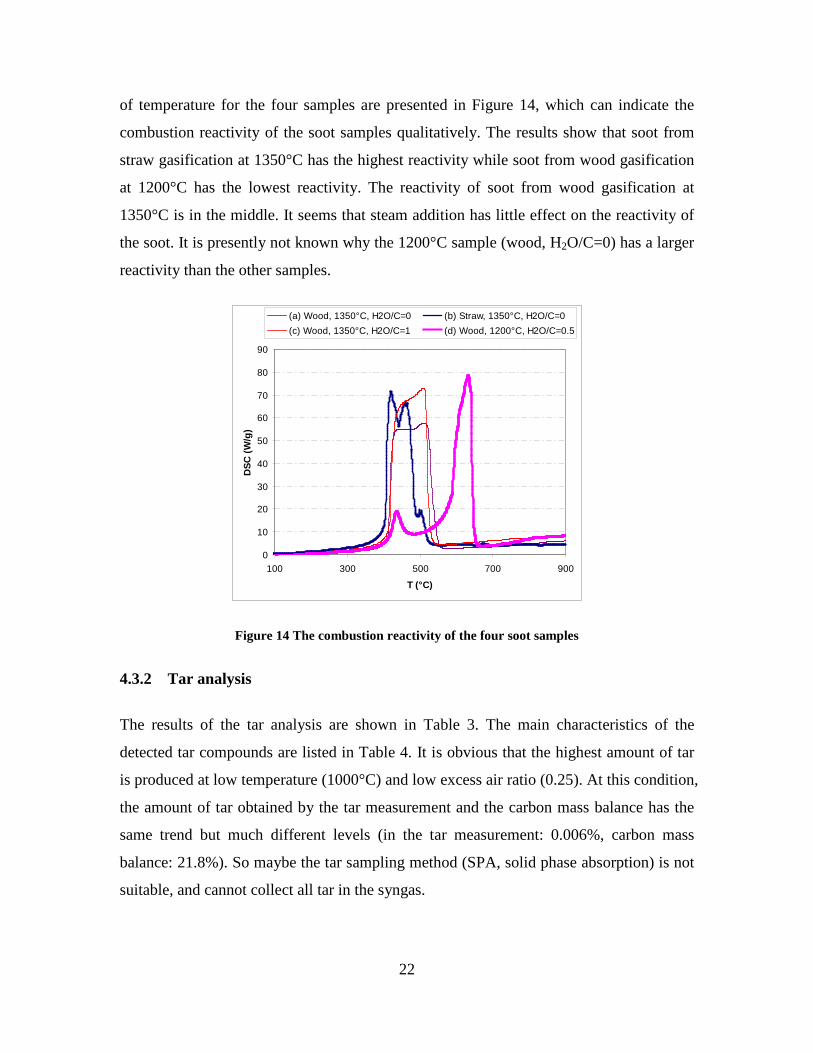
22
of temperature for the four samples are presented in Figure 14, which can indicate the
combustion reactivity of the soot samples qualitatively. The results show that soot from
straw gasification at 1350°C has the highest reactivity while soot from wood gasification
at 1200°C has the lowest reactivity. The reactivity of soot from wood gasification at
1350°C is in the middle. It seems that steam addition has little effect on the reactivity of
the soot. It is presently not known why the 1200°C sample (wood, H2O/C=0) has a larger
reactivity than the other samples.
Figure 14 The combustion reactivity of the four soot samples
4.3.2 Tar analysis
The results of the tar analysis are shown in Table 3. The main characteristics of the
detected tar compounds are listed in Table 4. It is obvious that the highest amount of tar
is produced at low temperature (1000°C) and low excess air ratio (0.25). At this condition,
the amount of tar obtained by the tar measurement and the carbon mass balance has the
same trend but much different levels (in the tar measurement: 0.006%, carbon mass
balance: 21.8%). So maybe the tar sampling method (SPA, solid phase absorption) is not
suitable, and cannot collect all tar in the syngas.
0
10
20
30
40
50
60
70
80
90
100 300 500 700 900
T (°C)
DSC
(W/g
)
(a) Wood, 1350°C, H2O/C=0 (b) Straw, 1350°C, H2O/C=0(c) Wood, 1350°C, H2O/C=1 (d) Wood, 1200°C, H2O/C=0.5
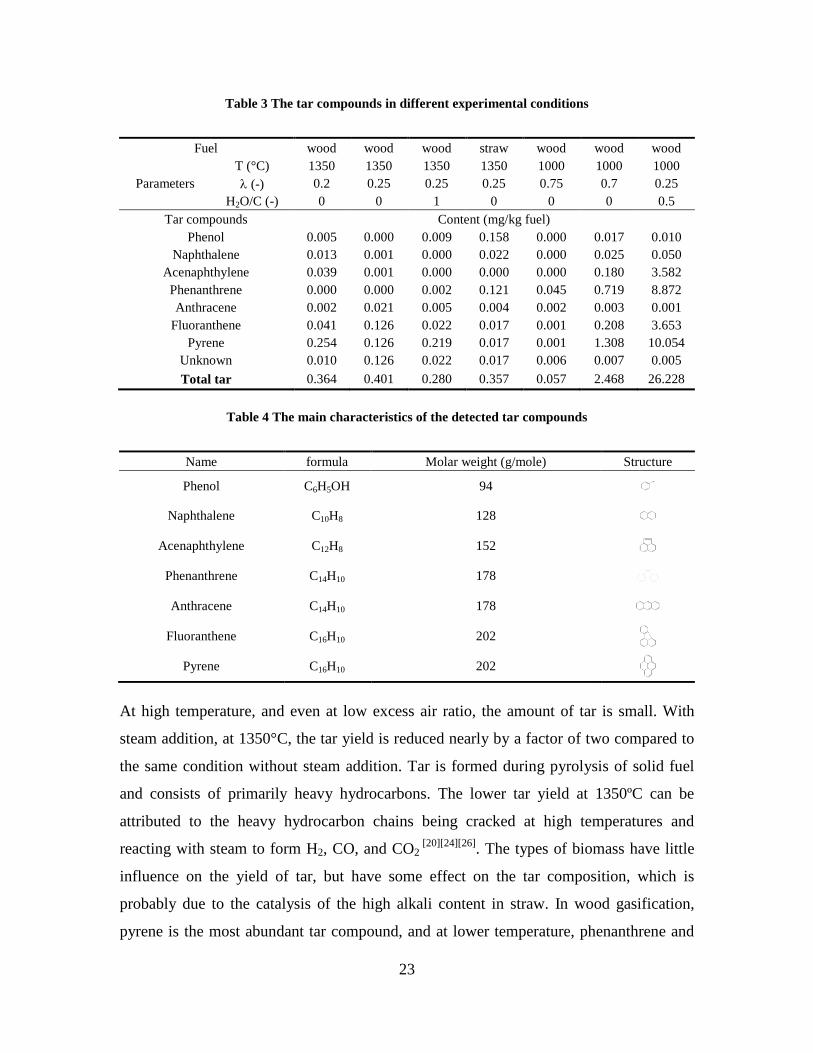
23
Table 3 The tar compounds in different experimental conditions
Fuel wood wood wood straw wood wood wood
Parameters T (°C) 1350 1350 1350 1350 1000 1000 1000 λ (-) 0.2 0.25 0.25 0.25 0.75 0.7 0.25
H2O/C (-) 0 0 1 0 0 0 0.5 Tar compounds Content (mg/kg fuel)
Phenol 0.005 0.000 0.009 0.158 0.000 0.017 0.010 Naphthalene 0.013 0.001 0.000 0.022 0.000 0.025 0.050
Acenaphthylene 0.039 0.001 0.000 0.000 0.000 0.180 3.582 Phenanthrene 0.000 0.000 0.002 0.121 0.045 0.719 8.872 Anthracene 0.002 0.021 0.005 0.004 0.002 0.003 0.001
Fluoranthene 0.041 0.126 0.022 0.017 0.001 0.208 3.653 Pyrene 0.254 0.126 0.219 0.017 0.001 1.308 10.054
Unknown 0.010 0.126 0.022 0.017 0.006 0.007 0.005 Total tar 0.364 0.401 0.280 0.357 0.057 2.468 26.228
Table 4 The main characteristics of the detected tar compounds
Name formula Molar weight (g/mole) Structure
Phenol C6H5OH 94
Naphthalene C10H8 128
Acenaphthylene C12H8 152
Phenanthrene C14H10 178
Anthracene C14H10 178
Fluoranthene C16H10 202
Pyrene C16H10 202
At high temperature, and even at low excess air ratio, the amount of tar is small. With
steam addition, at 1350°C, the tar yield is reduced nearly by a factor of two compared to
the same condition without steam addition. Tar is formed during pyrolysis of solid fuel
and consists of primarily heavy hydrocarbons. The lower tar yield at 1350ºC can be
attributed to the heavy hydrocarbon chains being cracked at high temperatures and
reacting with steam to form H2, CO, and CO2 [20][24][26]. The types of biomass have little
influence on the yield of tar, but have some effect on the tar composition, which is
probably due to the catalysis of the high alkali content in straw. In wood gasification,
pyrene is the most abundant tar compound, and at lower temperature, phenanthrene and
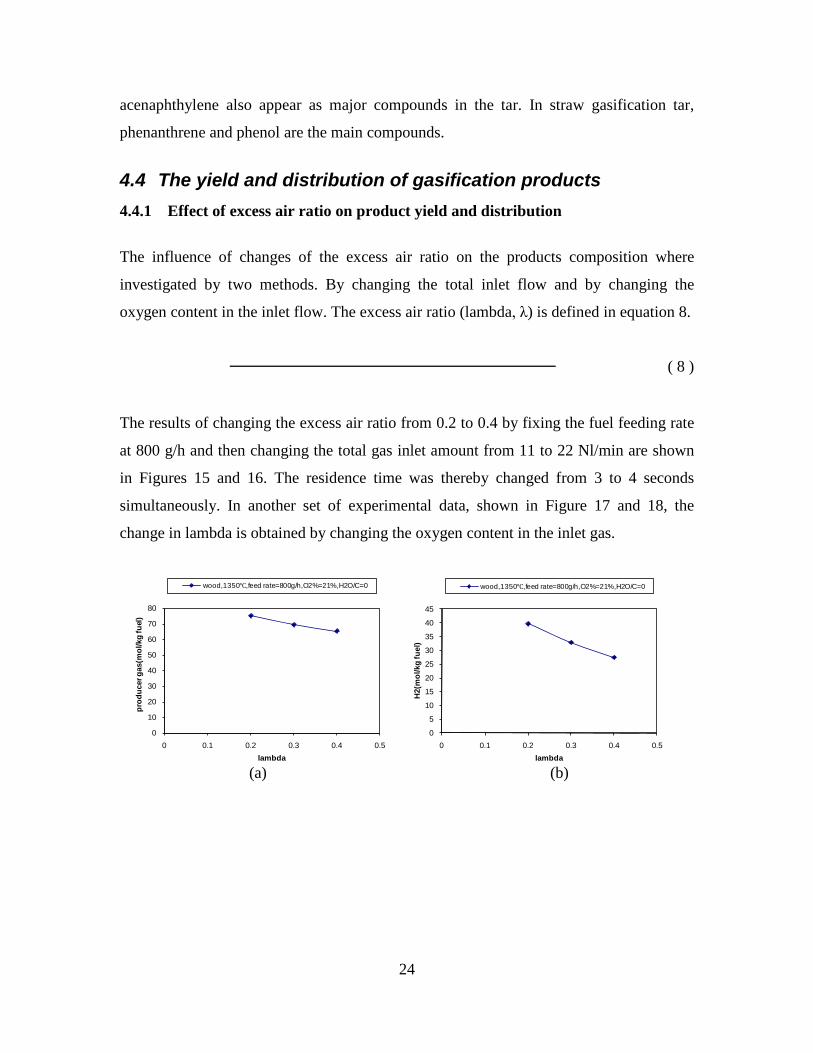
24
acenaphthylene also appear as major compounds in the tar. In straw gasification tar,
phenanthrene and phenol are the main compounds.
4.4 The yield and distribution of gasification products 4.4.1 Effect of excess air ratio on product yield and distribution
The influence of changes of the excess air ratio on the products composition where
investigated by two methods. By changing the total inlet flow and by changing the
oxygen content in the inlet flow. The excess air ratio (lambda, λ) is defined in equation 8.
( 8 )
The results of changing the excess air ratio from 0.2 to 0.4 by fixing the fuel feeding rate
at 800 g/h and then changing the total gas inlet amount from 11 to 22 Nl/min are shown
in Figures 15 and 16. The residence time was thereby changed from 3 to 4 seconds
simultaneously. In another set of experimental data, shown in Figure 17 and 18, the
change in lambda is obtained by changing the oxygen content in the inlet gas.
(a) (b)
0
10
20
30
40
50
60
70
80
0 0.1 0.2 0.3 0.4 0.5
prod
ucer
gas
(mol
/kg
fuel
)
lambda
wood,1350℃,feed rate=800g/h,O2%=21%,H2O/C=0
0
5
10
15
20
25
30
35
40
45
0 0.1 0.2 0.3 0.4 0.5
H2(
mol
/kg
fuel
)
lambda
wood,1350℃,feed rate=800g/h,O2%=21%,H2O/C=0
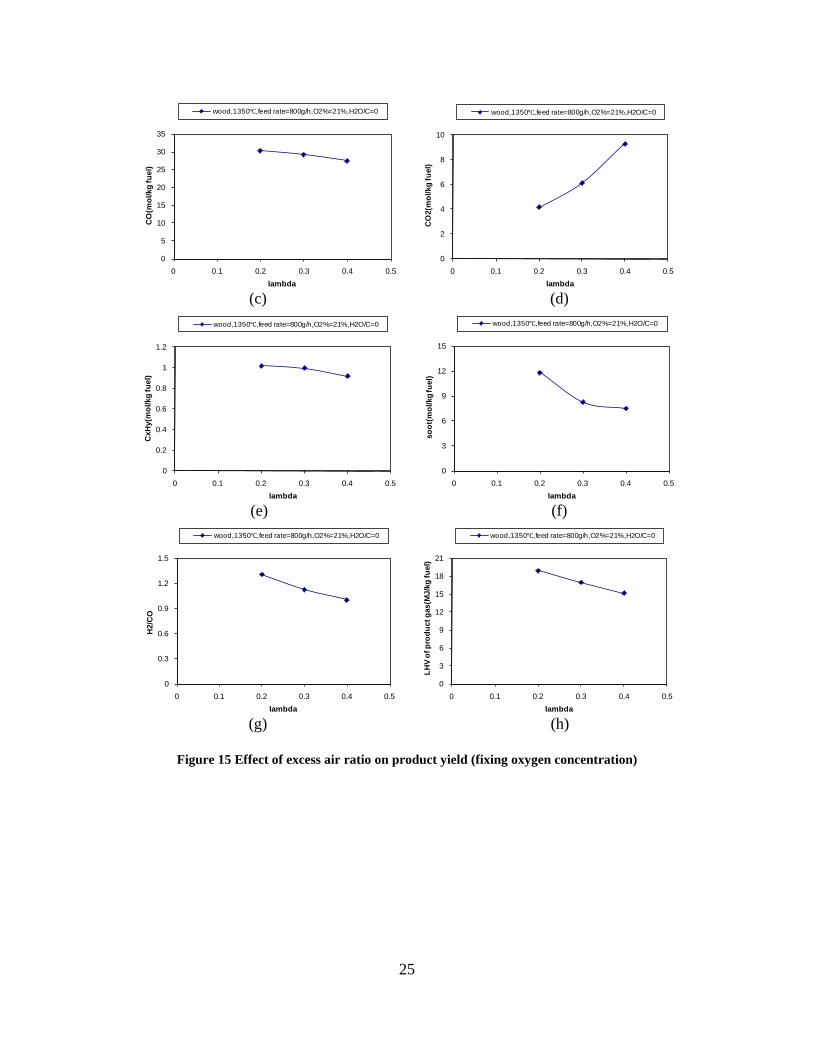
25
(c) (d)
(e) (f)
(g) (h)
Figure 15 Effect of excess air ratio on product yield (fixing oxygen concentration)
0
5
10
15
20
25
30
35
0 0.1 0.2 0.3 0.4 0.5
CO
(mol
/kg
fuel
)
lambda
wood,1350℃,feed rate=800g/h,O2%=21%,H2O/C=0
0
2
4
6
8
10
0 0.1 0.2 0.3 0.4 0.5
CO
2(m
ol/k
g fu
el)
lambda
wood,1350℃,feed rate=800g/h,O2%=21%,H2O/C=0
0
0.2
0.4
0.6
0.8
1
1.2
0 0.1 0.2 0.3 0.4 0.5
CxH
y(m
ol/k
g fu
el)
lambda
wood,1350℃,feed rate=800g/h,O2%=21%,H2O/C=0
0
3
6
9
12
15
0 0.1 0.2 0.3 0.4 0.5
soot
(mol
/kg
fuel
)
lambda
wood,1350℃,feed rate=800g/h,O2%=21%,H2O/C=0
0
0.3
0.6
0.9
1.2
1.5
0 0.1 0.2 0.3 0.4 0.5
H2/
CO
lambda
wood,1350℃,feed rate=800g/h,O2%=21%,H2O/C=0
0
3
6
9
12
15
18
21
0 0.1 0.2 0.3 0.4 0.5
LHV
of p
rodu
ct g
as(M
J/kg
fuel
)
lambda
wood,1350℃,feed rate=800g/h,O2%=21%,H2O/C=0
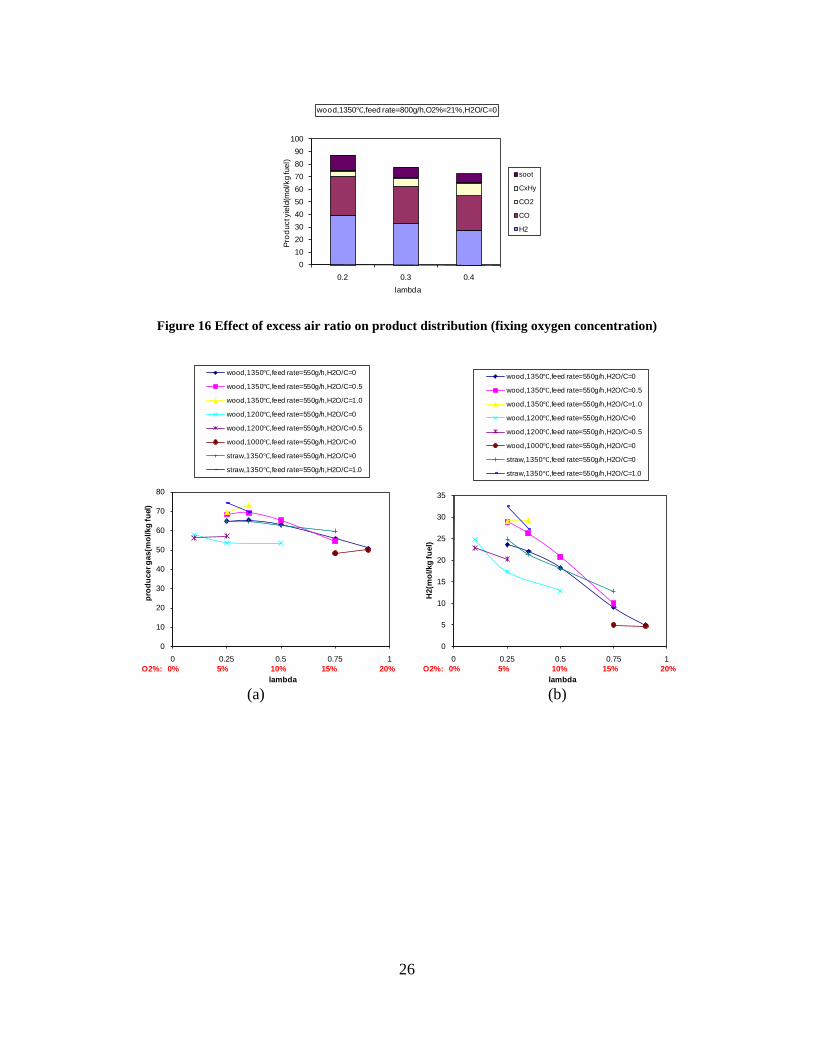
26
Figure 16 Effect of excess air ratio on product distribution (fixing oxygen concentration)
(a) (b)
0102030405060708090
100
0.2 0.3 0.4Pr
oduc
t yie
ld(m
ol/k
g fu
el)
lambda
wood,1350℃,feed rate=800g/h,O2%=21%,H2O/C=0
soot
CxHy
CO2
CO
H2
0
10
20
30
40
50
60
70
80
0 0.25 0.5 0.75 1
prod
ucer
gas
(mol
/kg
fuel
)
lambda
wood,1350℃,feed rate=550g/h,H2O/C=0
wood,1350℃,feed rate=550g/h,H2O/C=0.5
wood,1350℃,feed rate=550g/h,H2O/C=1.0
wood,1200℃,feed rate=550g/h,H2O/C=0
wood,1200℃,feed rate=550g/h,H2O/C=0.5
wood,1000℃,feed rate=550g/h,H2O/C=0
straw,1350℃,feed rate=550g/h,H2O/C=0
straw,1350℃,feed rate=550g/h,H2O/C=1.0
O2%: 0% 5% 10% 15% 20%
0
5
10
15
20
25
30
35
0 0.25 0.5 0.75 1
H2(
mol
/kg
fuel
)
lambda
wood,1350℃,feed rate=550g/h,H2O/C=0
wood,1350℃,feed rate=550g/h,H2O/C=0.5
wood,1350℃,feed rate=550g/h,H2O/C=1.0
wood,1200℃,feed rate=550g/h,H2O/C=0
wood,1200℃,feed rate=550g/h,H2O/C=0.5
wood,1000℃,feed rate=550g/h,H2O/C=0
straw,1350℃,feed rate=550g/h,H2O/C=0
straw,1350℃,feed rate=550g/h,H2O/C=1.0
O2%: 0% 5% 10% 15% 20%
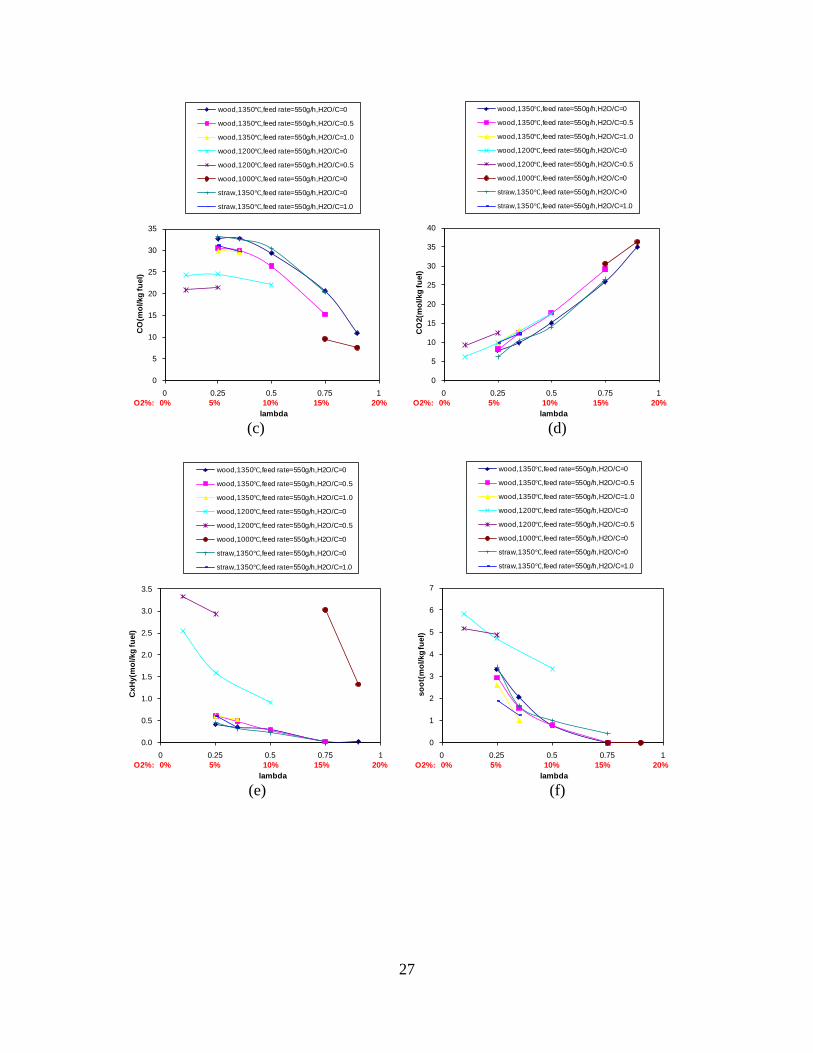
27
(c) (d)
(e) (f)
0
5
10
15
20
25
30
35
0 0.25 0.5 0.75 1
CO
(mol
/kg
fuel
)
lambda
wood,1350℃,feed rate=550g/h,H2O/C=0
wood,1350℃,feed rate=550g/h,H2O/C=0.5
wood,1350℃,feed rate=550g/h,H2O/C=1.0
wood,1200℃,feed rate=550g/h,H2O/C=0
wood,1200℃,feed rate=550g/h,H2O/C=0.5
wood,1000℃,feed rate=550g/h,H2O/C=0
straw,1350℃,feed rate=550g/h,H2O/C=0
straw,1350℃,feed rate=550g/h,H2O/C=1.0
O2%: 0% 5% 10% 15% 20%
0
5
10
15
20
25
30
35
40
0 0.25 0.5 0.75 1
CO
2(m
ol/k
g fu
el)
lambda
wood,1350℃,feed rate=550g/h,H2O/C=0
wood,1350℃,feed rate=550g/h,H2O/C=0.5
wood,1350℃,feed rate=550g/h,H2O/C=1.0
wood,1200℃,feed rate=550g/h,H2O/C=0
wood,1200℃,feed rate=550g/h,H2O/C=0.5
wood,1000℃,feed rate=550g/h,H2O/C=0
straw,1350℃,feed rate=550g/h,H2O/C=0
straw,1350℃,feed rate=550g/h,H2O/C=1.0
O2%: 0% 5% 10% 15% 20%
0.0
0.5
1.0
1.5
2.0
2.5
3.0
3.5
0 0.25 0.5 0.75 1
CxH
y(m
ol/k
g fu
el)
lambda
wood,1350℃,feed rate=550g/h,H2O/C=0
wood,1350℃,feed rate=550g/h,H2O/C=0.5
wood,1350℃,feed rate=550g/h,H2O/C=1.0
wood,1200℃,feed rate=550g/h,H2O/C=0
wood,1200℃,feed rate=550g/h,H2O/C=0.5
wood,1000℃,feed rate=550g/h,H2O/C=0
straw,1350℃,feed rate=550g/h,H2O/C=0
straw,1350℃,feed rate=550g/h,H2O/C=1.0
O2%: 0% 5% 10% 15% 20%
0
1
2
3
4
5
6
7
0 0.25 0.5 0.75 1
soot
(mol
/kg
fuel
)
lambda
wood,1350℃,feed rate=550g/h,H2O/C=0
wood,1350℃,feed rate=550g/h,H2O/C=0.5
wood,1350℃,feed rate=550g/h,H2O/C=1.0
wood,1200℃,feed rate=550g/h,H2O/C=0
wood,1200℃,feed rate=550g/h,H2O/C=0.5
wood,1000℃,feed rate=550g/h,H2O/C=0
straw,1350℃,feed rate=550g/h,H2O/C=0
straw,1350℃,feed rate=550g/h,H2O/C=1.0
O2%: 0% 5% 10% 15% 20%
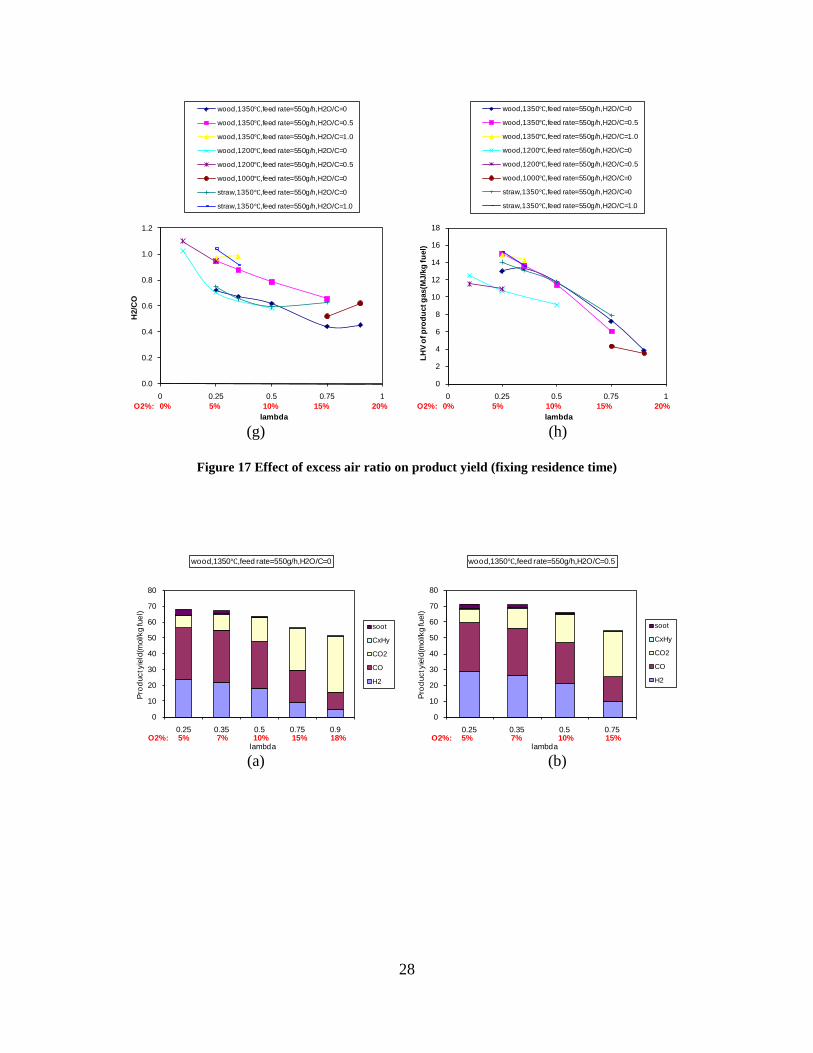
28
(g) (h)
Figure 17 Effect of excess air ratio on product yield (fixing residence time)
(a) (b)
0.0
0.2
0.4
0.6
0.8
1.0
1.2
0 0.25 0.5 0.75 1
H2/
CO
lambda
wood,1350℃,feed rate=550g/h,H2O/C=0
wood,1350℃,feed rate=550g/h,H2O/C=0.5
wood,1350℃,feed rate=550g/h,H2O/C=1.0
wood,1200℃,feed rate=550g/h,H2O/C=0
wood,1200℃,feed rate=550g/h,H2O/C=0.5
wood,1000℃,feed rate=550g/h,H2O/C=0
straw,1350℃,feed rate=550g/h,H2O/C=0
straw,1350℃,feed rate=550g/h,H2O/C=1.0
O2%: 0% 5% 10% 15% 20%
0
2
4
6
8
10
12
14
16
18
0 0.25 0.5 0.75 1
LHV
of p
rodu
ct g
as(M
J/kg
fuel
)lambda
wood,1350℃,feed rate=550g/h,H2O/C=0
wood,1350℃,feed rate=550g/h,H2O/C=0.5
wood,1350℃,feed rate=550g/h,H2O/C=1.0
wood,1200℃,feed rate=550g/h,H2O/C=0
wood,1200℃,feed rate=550g/h,H2O/C=0.5
wood,1000℃,feed rate=550g/h,H2O/C=0
straw,1350℃,feed rate=550g/h,H2O/C=0
straw,1350℃,feed rate=550g/h,H2O/C=1.0
O2%: 0% 5% 10% 15% 20%
0
10
20
30
40
50
60
70
80
0.25 0.35 0.5 0.75 0.9
Prod
uct y
ield
(mol
/kg
fuel
)
lambda
wood,1350℃,feed rate=550g/h,H2O/C=0
soot
CxHy
CO2
CO
H2
O2%: 5% 7% 10% 15% 18%
0
10
20
30
40
50
60
70
80
0.25 0.35 0.5 0.75
Prod
uct y
ield
(mol
/kg
fuel
)
lambda
wood,1350℃,feed rate=550g/h,H2O/C=0.5
soot
CxHy
CO2
CO
H2
O2%: 5% 7% 10% 15%
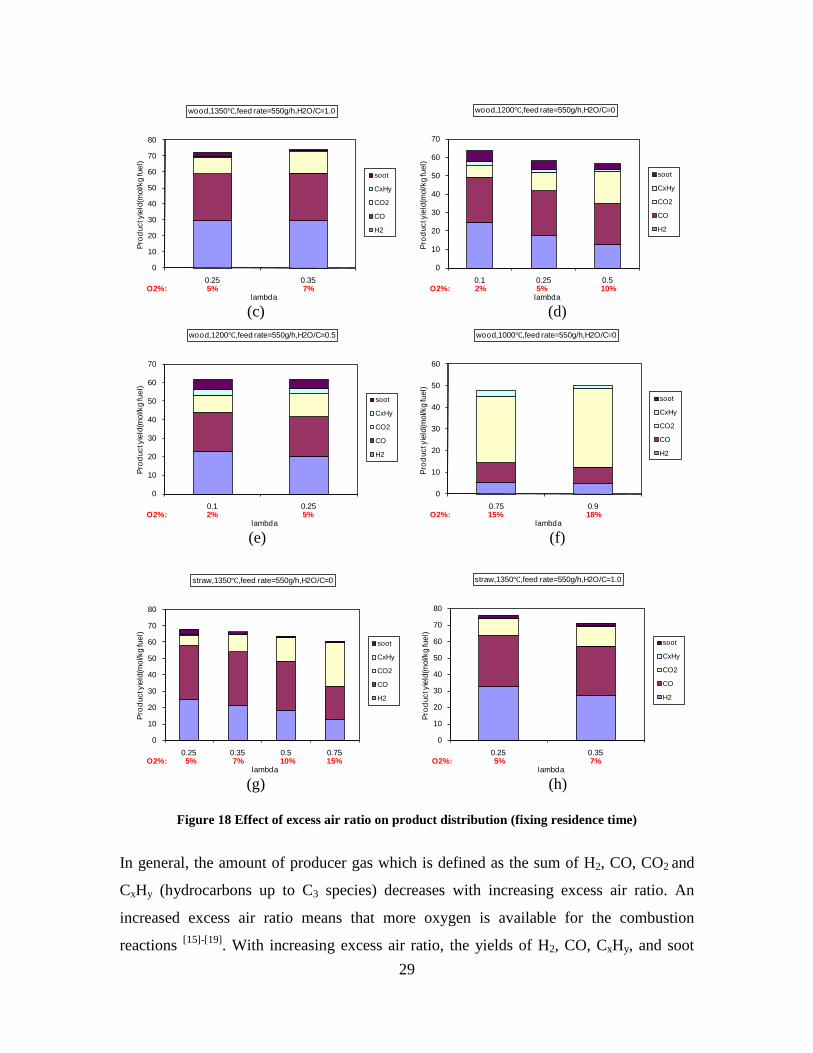
29
(c) (d)
(e) (f)
(g) (h)
Figure 18 Effect of excess air ratio on product distribution (fixing residence time)
In general, the amount of producer gas which is defined as the sum of H2, CO, CO2 and
CxHy (hydrocarbons up to C3 species) decreases with increasing excess air ratio. An
increased excess air ratio means that more oxygen is available for the combustion
reactions [15]-[19]. With increasing excess air ratio, the yields of H2, CO, CxHy, and soot
0
10
20
30
40
50
60
70
80
0.25 0.35
Prod
uct y
ield
(mol
/kg
fuel
)
lambda
wood,1350℃,feed rate=550g/h,H2O/C=1.0
soot
CxHy
CO2
CO
H2
O2%: 5% 7%
0
10
20
30
40
50
60
70
0.1 0.25 0.5
Prod
uct y
ield
(mol
/kg
fuel
)
lambda
wood,1200℃,feed rate=550g/h,H2O/C=0
soot
CxHy
CO2
CO
H2
O2%: 2% 5% 10%
0
10
20
30
40
50
60
70
0.1 0.25
Prod
uct y
ield
(mol
/kg
fuel
)
lambda
wood,1200℃,feed rate=550g/h,H2O/C=0.5
soot
CxHy
CO2
CO
H2
O2%: 2% 5%
0
10
20
30
40
50
60
0.75 0.9
Prod
uct y
ield
(mol
/kg
fuel
)
lambda
wood,1000℃,feed rate=550g/h,H2O/C=0
soot
CxHy
CO2
CO
H2
O2%: 15% 18%
0
10
20
30
40
50
60
70
80
0.25 0.35 0.5 0.75
Prod
uct y
ield
(mol
/kg
fuel
)
lambda
straw,1350℃,feed rate=550g/h,H2O/C=0
soot
CxHy
CO2
CO
H2
O2%: 5% 7% 10% 15%
0
10
20
30
40
50
60
70
80
0.25 0.35
Prod
uct y
ield
(mol
/kg
fuel
)
lambda
straw,1350℃,feed rate=550g/h,H2O/C=1.0
soot
CxHy
CO2
CO
H2
O2%: 5% 7%
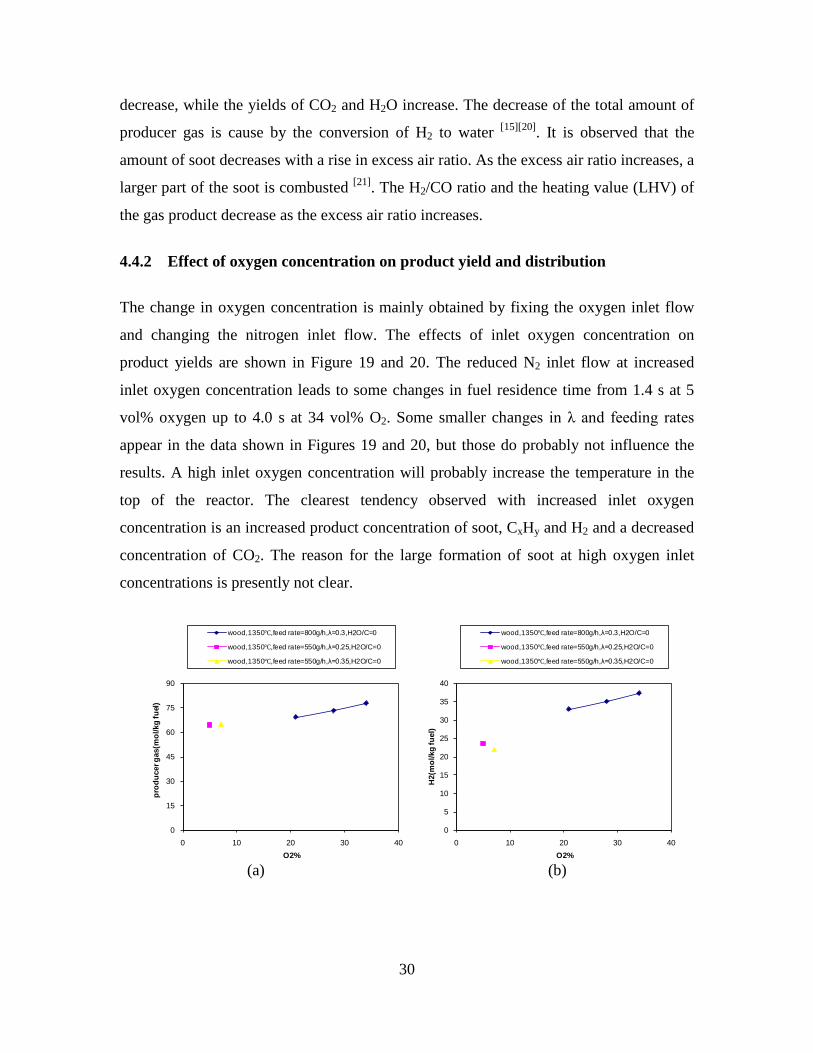
30
decrease, while the yields of CO2 and H2O increase. The decrease of the total amount of
producer gas is cause by the conversion of H2 to water [15][20]. It is observed that the
amount of soot decreases with a rise in excess air ratio. As the excess air ratio increases, a
larger part of the soot is combusted [21]. The H2/CO ratio and the heating value (LHV) of
the gas product decrease as the excess air ratio increases.
4.4.2 Effect of oxygen concentration on product yield and distribution
The change in oxygen concentration is mainly obtained by fixing the oxygen inlet flow
and changing the nitrogen inlet flow. The effects of inlet oxygen concentration on
product yields are shown in Figure 19 and 20. The reduced N2 inlet flow at increased
inlet oxygen concentration leads to some changes in fuel residence time from 1.4 s at 5
vol% oxygen up to 4.0 s at 34 vol% O2. Some smaller changes in λ and feeding rates
appear in the data shown in Figures 19 and 20, but those do probably not influence the
results. A high inlet oxygen concentration will probably increase the temperature in the
top of the reactor. The clearest tendency observed with increased inlet oxygen
concentration is an increased product concentration of soot, CxHy and H2 and a decreased
concentration of CO2. The reason for the large formation of soot at high oxygen inlet
concentrations is presently not clear.
(a) (b)
0
15
30
45
60
75
90
0 10 20 30 40
prod
ucer
gas
(mol
/kg
fuel
)
O2%
wood,1350℃,feed rate=800g/h,λ=0.3,H2O/C=0
wood,1350℃,feed rate=550g/h,λ=0.25,H2O/C=0
wood,1350℃,feed rate=550g/h,λ=0.35,H2O/C=0
0
5
10
15
20
25
30
35
40
0 10 20 30 40
H2(
mol
/kg
fuel
)
O2%
wood,1350℃,feed rate=800g/h,λ=0.3,H2O/C=0
wood,1350℃,feed rate=550g/h,λ=0.25,H2O/C=0
wood,1350℃,feed rate=550g/h,λ=0.35,H2O/C=0
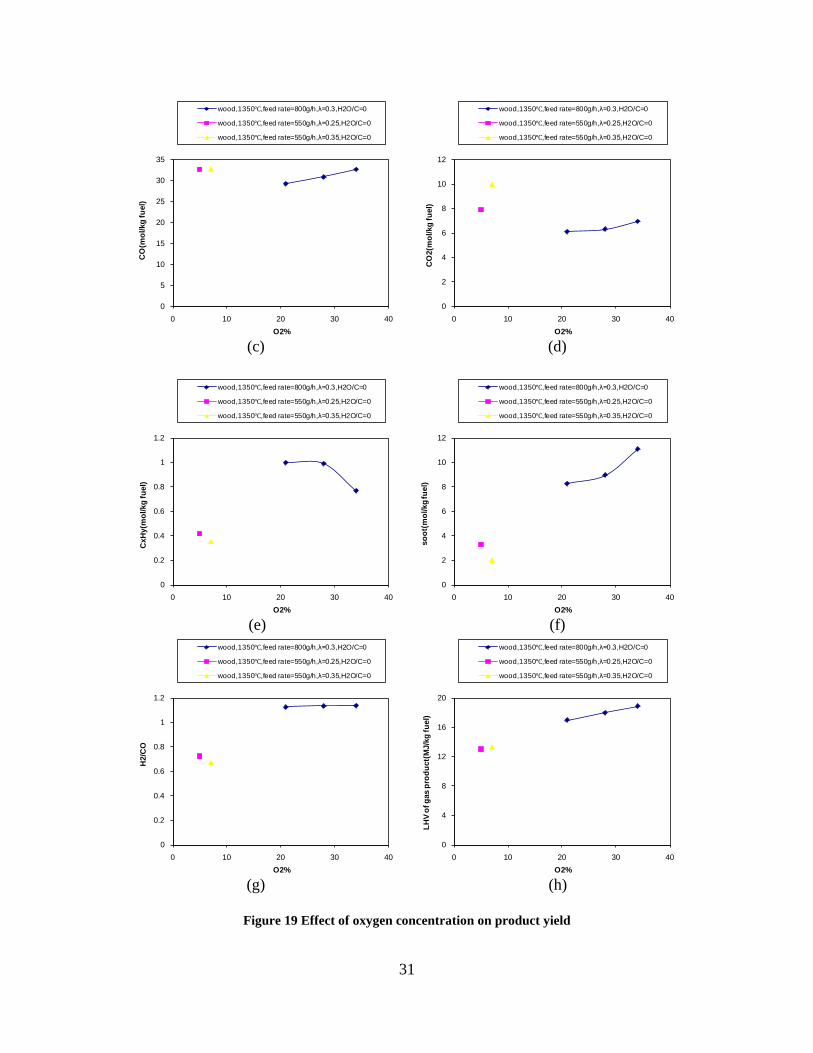
31
(c) (d)
(e) (f)
(g) (h)
Figure 19 Effect of oxygen concentration on product yield
0
5
10
15
20
25
30
35
0 10 20 30 40
CO
(mol
/kg
fuel
)
O2%
wood,1350℃,feed rate=800g/h,λ=0.3,H2O/C=0
wood,1350℃,feed rate=550g/h,λ=0.25,H2O/C=0
wood,1350℃,feed rate=550g/h,λ=0.35,H2O/C=0
0
2
4
6
8
10
12
0 10 20 30 40
CO
2(m
ol/k
g fu
el)
O2%
wood,1350℃,feed rate=800g/h,λ=0.3,H2O/C=0
wood,1350℃,feed rate=550g/h,λ=0.25,H2O/C=0
wood,1350℃,feed rate=550g/h,λ=0.35,H2O/C=0
0
0.2
0.4
0.6
0.8
1
1.2
0 10 20 30 40
CxH
y(m
ol/k
g fu
el)
O2%
wood,1350℃,feed rate=800g/h,λ=0.3,H2O/C=0
wood,1350℃,feed rate=550g/h,λ=0.25,H2O/C=0
wood,1350℃,feed rate=550g/h,λ=0.35,H2O/C=0
0
2
4
6
8
10
12
0 10 20 30 40
soot
(mol
/kg
fuel
)
O2%
wood,1350℃,feed rate=800g/h,λ=0.3,H2O/C=0
wood,1350℃,feed rate=550g/h,λ=0.25,H2O/C=0
wood,1350℃,feed rate=550g/h,λ=0.35,H2O/C=0
0
0.2
0.4
0.6
0.8
1
1.2
0 10 20 30 40
H2/
CO
O2%
wood,1350℃,feed rate=800g/h,λ=0.3,H2O/C=0
wood,1350℃,feed rate=550g/h,λ=0.25,H2O/C=0
wood,1350℃,feed rate=550g/h,λ=0.35,H2O/C=0
0
4
8
12
16
20
0 10 20 30 40
LHV
of g
as p
rodu
ct(M
J/kg
fuel
)
O2%
wood,1350℃,feed rate=800g/h,λ=0.3,H2O/C=0
wood,1350℃,feed rate=550g/h,λ=0.25,H2O/C=0
wood,1350℃,feed rate=550g/h,λ=0.35,H2O/C=0
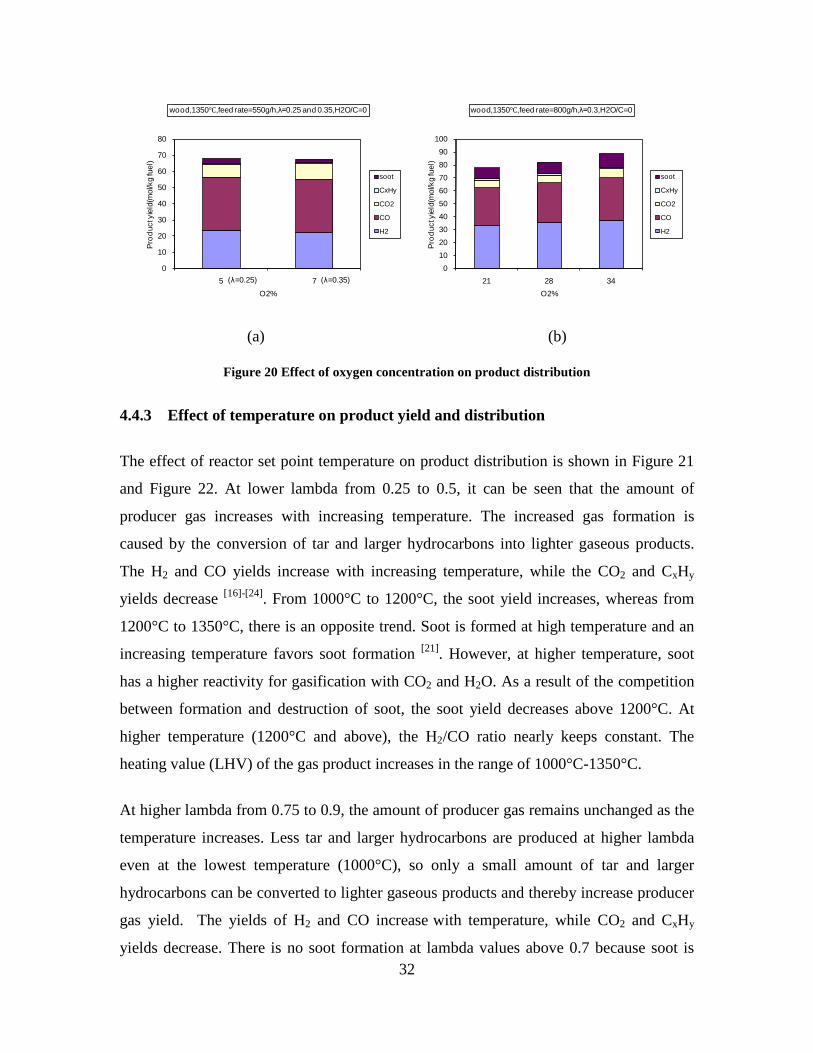
32
(a) (b)
Figure 20 Effect of oxygen concentration on product distribution
4.4.3 Effect of temperature on product yield and distribution
The effect of reactor set point temperature on product distribution is shown in Figure 21
and Figure 22. At lower lambda from 0.25 to 0.5, it can be seen that the amount of
producer gas increases with increasing temperature. The increased gas formation is
caused by the conversion of tar and larger hydrocarbons into lighter gaseous products.
The H2 and CO yields increase with increasing temperature, while the CO2 and CxHy
yields decrease [16]-[24]. From 1000°C to 1200°C, the soot yield increases, whereas from
1200°C to 1350°C, there is an opposite trend. Soot is formed at high temperature and an
increasing temperature favors soot formation [21]. However, at higher temperature, soot
has a higher reactivity for gasification with CO2 and H2O. As a result of the competition
between formation and destruction of soot, the soot yield decreases above 1200°C. At
higher temperature (1200°C and above), the H2/CO ratio nearly keeps constant. The
heating value (LHV) of the gas product increases in the range of 1000°C-1350°C.
At higher lambda from 0.75 to 0.9, the amount of producer gas remains unchanged as the
temperature increases. Less tar and larger hydrocarbons are produced at higher lambda
even at the lowest temperature (1000°C), so only a small amount of tar and larger
hydrocarbons can be converted to lighter gaseous products and thereby increase producer
gas yield. The yields of H2 and CO increase with temperature, while CO2 and CxHy
yields decrease. There is no soot formation at lambda values above 0.7 because soot is
0
10
20
30
40
50
60
70
80
5 7
Prod
uct y
ield
(mol
/kg
fuel
)
O2%
wood,1350℃,feed rate=550g/h,λ=0.25 and 0.35,H2O/C=0
soot
CxHy
CO2
CO
H2
(λ=0.25) (λ=0.35)0
102030405060708090
100
21 28 34
Prod
uct y
ield
(mol
/kg
fuel
)
O2%
wood,1350℃,feed rate=800g/h,λ=0.3,H2O/C=0
soot
CxHy
CO2
CO
H2
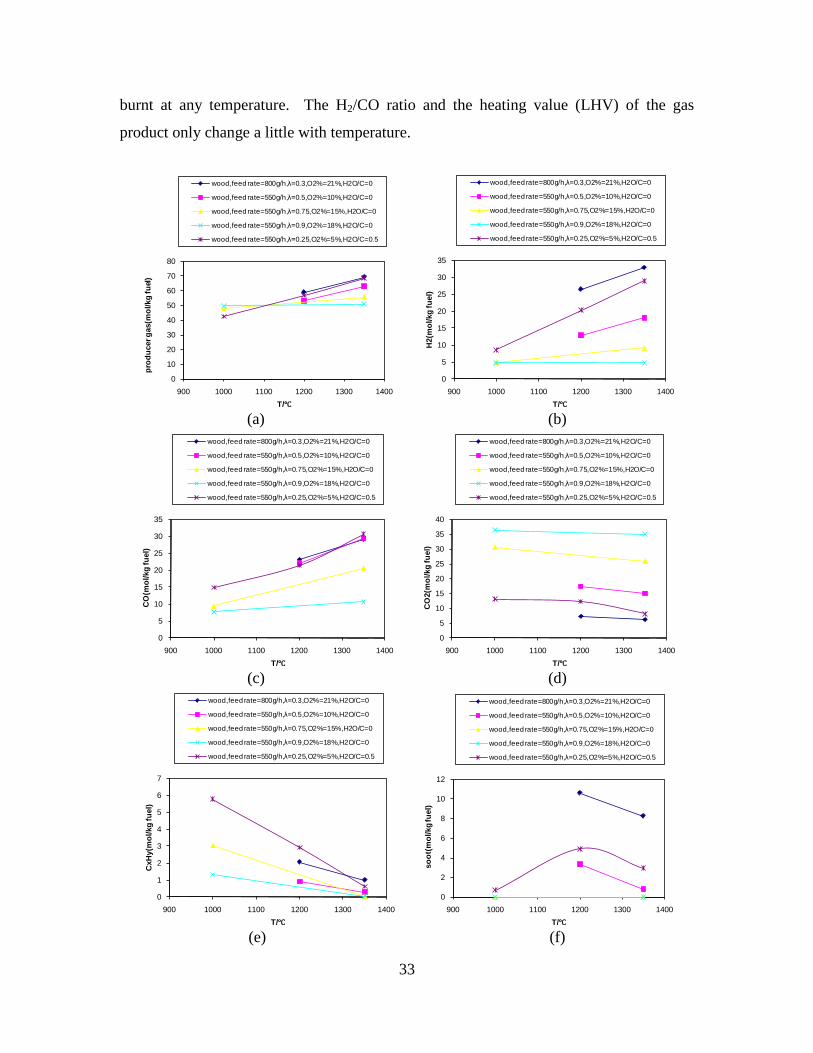
33
burnt at any temperature. The H2/CO ratio and the heating value (LHV) of the gas
product only change a little with temperature.
(a) (b)
(c) (d)
(e) (f)
0
10
20
30
40
50
60
70
80
900 1000 1100 1200 1300 1400
prod
ucer
gas
(mol
/kg
fuel
)
T/℃
wood,feed rate=800g/h,λ=0.3,O2%=21%,H2O/C=0
wood,feed rate=550g/h,λ=0.5,O2%=10%,H2O/C=0
wood,feed rate=550g/h,λ=0.75,O2%=15%,H2O/C=0
wood,feed rate=550g/h,λ=0.9,O2%=18%,H2O/C=0
wood,feed rate=550g/h,λ=0.25,O2%=5%,H2O/C=0.5
0
5
10
15
20
25
30
35
900 1000 1100 1200 1300 1400
H2(
mol
/kg
fuel
)
T/℃
wood,feed rate=800g/h,λ=0.3,O2%=21%,H2O/C=0
wood,feed rate=550g/h,λ=0.5,O2%=10%,H2O/C=0
wood,feed rate=550g/h,λ=0.75,O2%=15%,H2O/C=0
wood,feed rate=550g/h,λ=0.9,O2%=18%,H2O/C=0
wood,feed rate=550g/h,λ=0.25,O2%=5%,H2O/C=0.5
0
5
10
15
20
25
30
35
900 1000 1100 1200 1300 1400
CO
(mol
/kg
fuel
)
T/℃
wood,feed rate=800g/h,λ=0.3,O2%=21%,H2O/C=0
wood,feed rate=550g/h,λ=0.5,O2%=10%,H2O/C=0
wood,feed rate=550g/h,λ=0.75,O2%=15%,H2O/C=0
wood,feed rate=550g/h,λ=0.9,O2%=18%,H2O/C=0
wood,feed rate=550g/h,λ=0.25,O2%=5%,H2O/C=0.5
0
5
10
15
20
25
30
35
40
900 1000 1100 1200 1300 1400
CO
2(m
ol/k
g fu
el)
T/℃
wood,feed rate=800g/h,λ=0.3,O2%=21%,H2O/C=0
wood,feed rate=550g/h,λ=0.5,O2%=10%,H2O/C=0
wood,feed rate=550g/h,λ=0.75,O2%=15%,H2O/C=0
wood,feed rate=550g/h,λ=0.9,O2%=18%,H2O/C=0
wood,feed rate=550g/h,λ=0.25,O2%=5%,H2O/C=0.5
0
1
2
3
4
5
6
7
900 1000 1100 1200 1300 1400
CxH
y(m
ol/k
g fu
el)
T/℃
wood,feed rate=800g/h,λ=0.3,O2%=21%,H2O/C=0
wood,feed rate=550g/h,λ=0.5,O2%=10%,H2O/C=0
wood,feed rate=550g/h,λ=0.75,O2%=15%,H2O/C=0
wood,feed rate=550g/h,λ=0.9,O2%=18%,H2O/C=0
wood,feed rate=550g/h,λ=0.25,O2%=5%,H2O/C=0.5
0
2
4
6
8
10
12
900 1000 1100 1200 1300 1400
soot
(mol
/kg
fuel
)
T/℃
wood,feed rate=800g/h,λ=0.3,O2%=21%,H2O/C=0
wood,feed rate=550g/h,λ=0.5,O2%=10%,H2O/C=0
wood,feed rate=550g/h,λ=0.75,O2%=15%,H2O/C=0
wood,feed rate=550g/h,λ=0.9,O2%=18%,H2O/C=0
wood,feed rate=550g/h,λ=0.25,O2%=5%,H2O/C=0.5
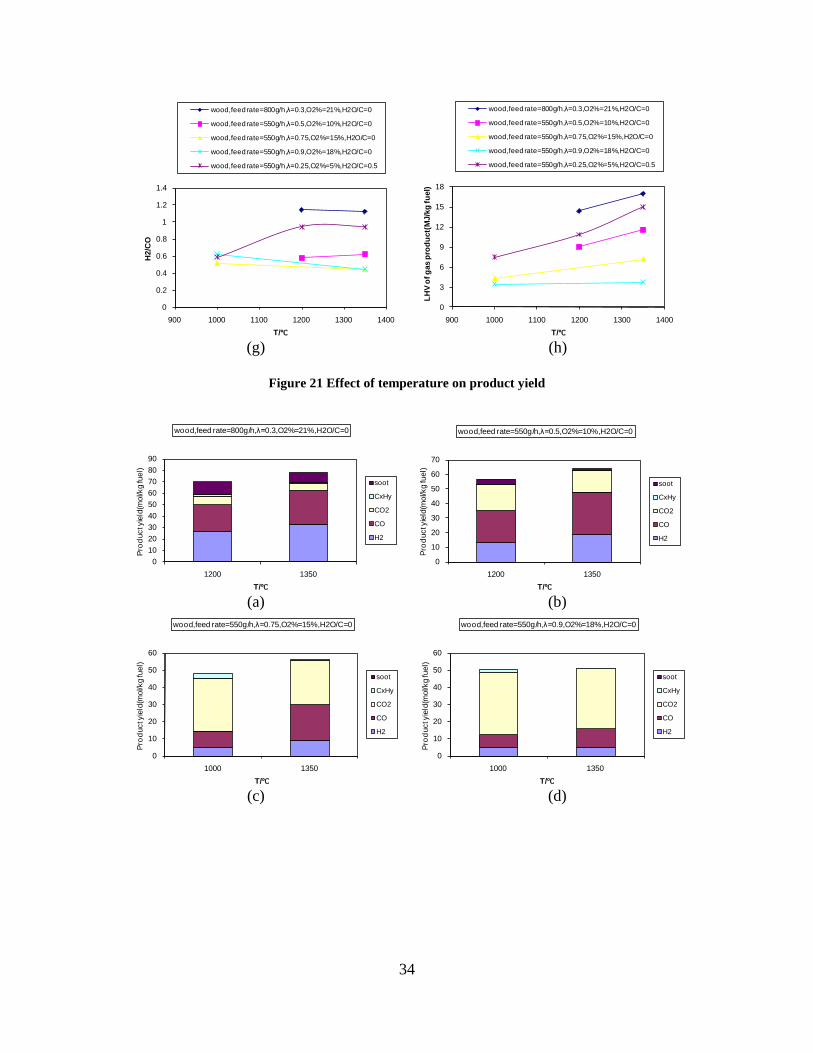
34
(g) (h)
Figure 21 Effect of temperature on product yield
(a) (b)
(c) (d)
0
0.2
0.4
0.6
0.8
1
1.2
1.4
900 1000 1100 1200 1300 1400
H2/
CO
T/℃
wood,feed rate=800g/h,λ=0.3,O2%=21%,H2O/C=0
wood,feed rate=550g/h,λ=0.5,O2%=10%,H2O/C=0
wood,feed rate=550g/h,λ=0.75,O2%=15%,H2O/C=0
wood,feed rate=550g/h,λ=0.9,O2%=18%,H2O/C=0
wood,feed rate=550g/h,λ=0.25,O2%=5%,H2O/C=0.5
0
3
6
9
12
15
18
900 1000 1100 1200 1300 1400
LHV
of g
as p
rodu
ct(M
J/kg
fuel
)
T/℃
wood,feed rate=800g/h,λ=0.3,O2%=21%,H2O/C=0
wood,feed rate=550g/h,λ=0.5,O2%=10%,H2O/C=0
wood,feed rate=550g/h,λ=0.75,O2%=15%,H2O/C=0
wood,feed rate=550g/h,λ=0.9,O2%=18%,H2O/C=0
wood,feed rate=550g/h,λ=0.25,O2%=5%,H2O/C=0.5
0102030405060708090
1200 1350
Prod
uct y
ield
(mol
/kg
fuel
)
T/℃
wood,feed rate=800g/h,λ=0.3,O2%=21%,H2O/C=0
soot
CxHy
CO2
CO
H2
0
10
20
30
40
50
60
70
1200 1350
Prod
uct y
ield
(mol
/kg
fuel
)
T/℃
wood,feed rate=550g/h,λ=0.5,O2%=10%,H2O/C=0
soot
CxHy
CO2
CO
H2
0
10
20
30
40
50
60
1000 1350
Prod
uct y
ield
(mol
/kg
fuel
)
T/℃
wood,feed rate=550g/h,λ=0.75,O2%=15%,H2O/C=0
soot
CxHy
CO2
CO
H2
0
10
20
30
40
50
60
1000 1350
Prod
uct y
ield
(mol
/kg
fuel
)
T/℃
wood,feed rate=550g/h,λ=0.9,O2%=18%,H2O/C=0
soot
CxHy
CO2
CO
H2
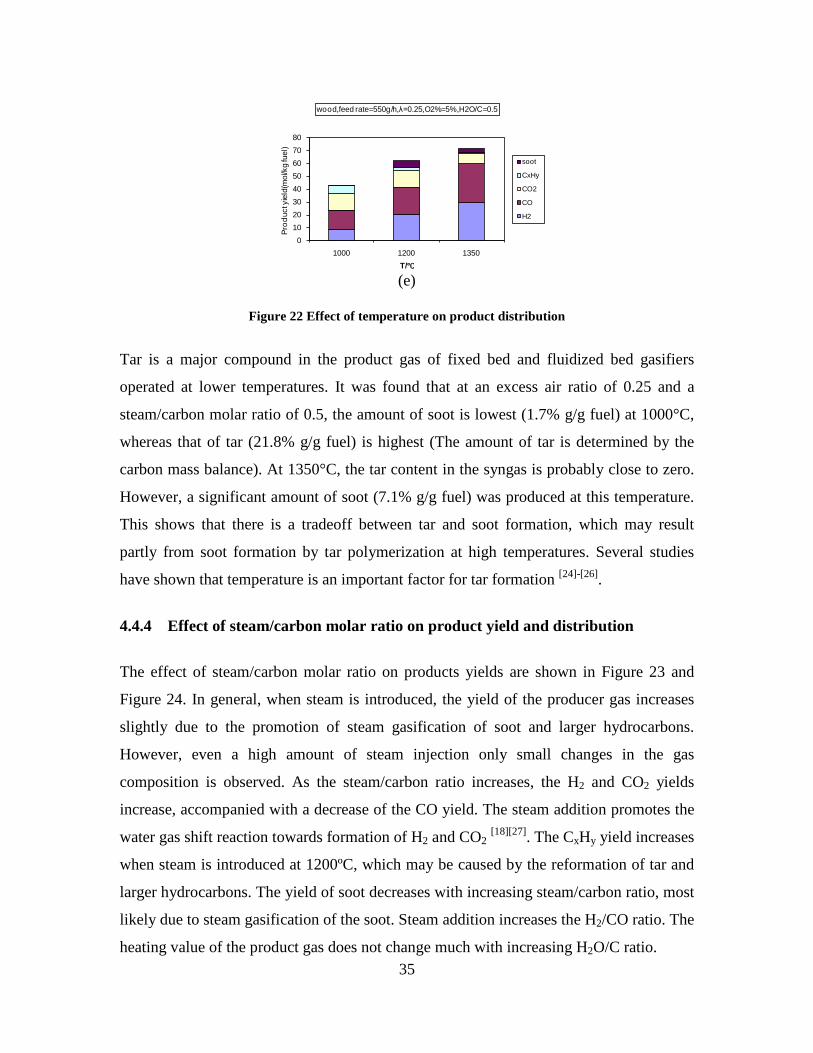
35
(e)
Figure 22 Effect of temperature on product distribution
Tar is a major compound in the product gas of fixed bed and fluidized bed gasifiers
operated at lower temperatures. It was found that at an excess air ratio of 0.25 and a
steam/carbon molar ratio of 0.5, the amount of soot is lowest (1.7% g/g fuel) at 1000°C,
whereas that of tar (21.8% g/g fuel) is highest (The amount of tar is determined by the
carbon mass balance). At 1350°C, the tar content in the syngas is probably close to zero.
However, a significant amount of soot (7.1% g/g fuel) was produced at this temperature.
This shows that there is a tradeoff between tar and soot formation, which may result
partly from soot formation by tar polymerization at high temperatures. Several studies
have shown that temperature is an important factor for tar formation [24]-[26].
4.4.4 Effect of steam/carbon molar ratio on product yield and distribution
The effect of steam/carbon molar ratio on products yields are shown in Figure 23 and
Figure 24. In general, when steam is introduced, the yield of the producer gas increases
slightly due to the promotion of steam gasification of soot and larger hydrocarbons.
However, even a high amount of steam injection only small changes in the gas
composition is observed. As the steam/carbon ratio increases, the H2 and CO2 yields
increase, accompanied with a decrease of the CO yield. The steam addition promotes the
water gas shift reaction towards formation of H2 and CO2 [18][27]. The CxHy yield increases
when steam is introduced at 1200ºC, which may be caused by the reformation of tar and
larger hydrocarbons. The yield of soot decreases with increasing steam/carbon ratio, most
likely due to steam gasification of the soot. Steam addition increases the H2/CO ratio. The
heating value of the product gas does not change much with increasing H2O/C ratio.
01020304050607080
1000 1200 1350
Prod
uct y
ield
(mol
/kg
fuel
)
T/℃
wood,feed rate=550g/h,λ=0.25,O2%=5%,H2O/C=0.5
soot
CxHy
CO2
CO
H2
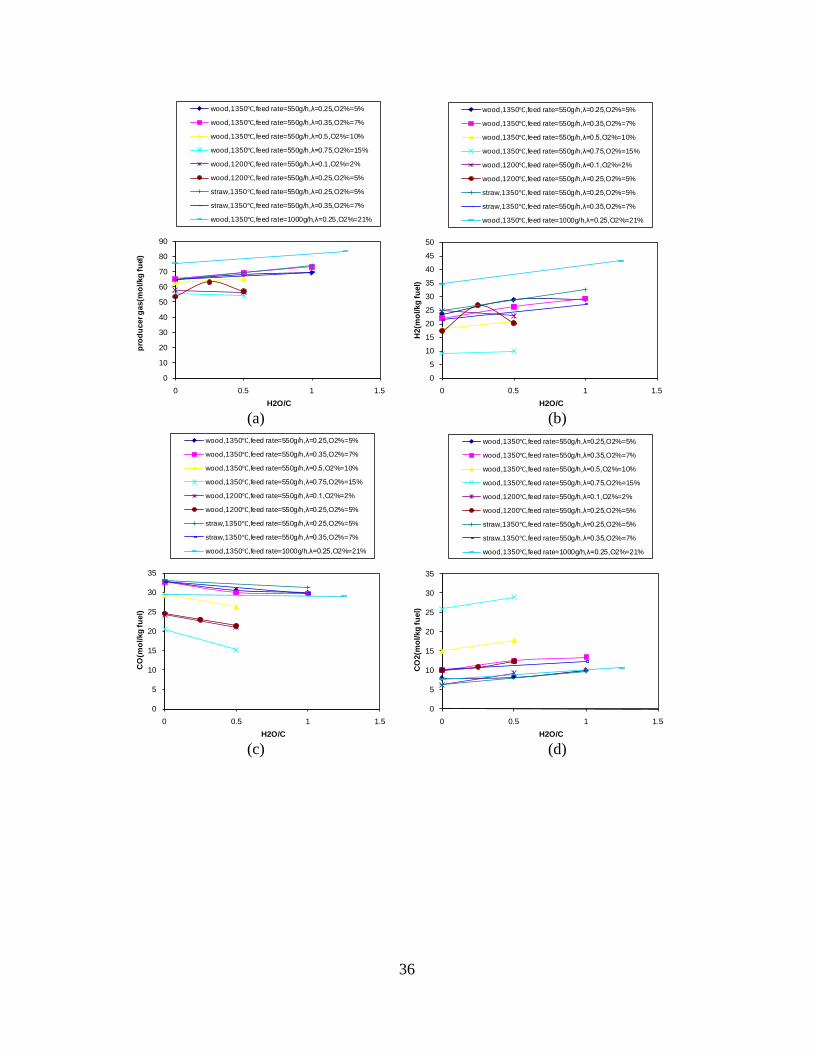
36
(a) (b)
(c) (d)
0
10
20
30
40
50
60
70
80
90
0 0.5 1 1.5
prod
ucer
gas
(mol
/kg
fuel
)
H2O/C
wood,1350℃,feed rate=550g/h,λ=0.25,O2%=5%
wood,1350℃,feed rate=550g/h,λ=0.35,O2%=7%
wood,1350℃,feed rate=550g/h,λ=0.5,O2%=10%
wood,1350℃,feed rate=550g/h,λ=0.75,O2%=15%
wood,1200℃,feed rate=550g/h,λ=0.1,O2%=2%
wood,1200℃,feed rate=550g/h,λ=0.25,O2%=5%
straw,1350℃,feed rate=550g/h,λ=0.25,O2%=5%
straw,1350℃,feed rate=550g/h,λ=0.35,O2%=7%
wood,1350℃,feed rate=1000g/h,λ=0.25,O2%=21%
0
5
10
15
20
25
30
35
40
45
50
0 0.5 1 1.5
H2(
mol
/kg
fuel
)H2O/C
wood,1350℃,feed rate=550g/h,λ=0.25,O2%=5%
wood,1350℃,feed rate=550g/h,λ=0.35,O2%=7%
wood,1350℃,feed rate=550g/h,λ=0.5,O2%=10%
wood,1350℃,feed rate=550g/h,λ=0.75,O2%=15%
wood,1200℃,feed rate=550g/h,λ=0.1,O2%=2%
wood,1200℃,feed rate=550g/h,λ=0.25,O2%=5%
straw,1350℃,feed rate=550g/h,λ=0.25,O2%=5%
straw,1350℃,feed rate=550g/h,λ=0.35,O2%=7%
wood,1350℃,feed rate=1000g/h,λ=0.25,O2%=21%
0
5
10
15
20
25
30
35
0 0.5 1 1.5
CO
(mol
/kg
fuel
)
H2O/C
wood,1350℃,feed rate=550g/h,λ=0.25,O2%=5%
wood,1350℃,feed rate=550g/h,λ=0.35,O2%=7%
wood,1350℃,feed rate=550g/h,λ=0.5,O2%=10%
wood,1350℃,feed rate=550g/h,λ=0.75,O2%=15%
wood,1200℃,feed rate=550g/h,λ=0.1,O2%=2%
wood,1200℃,feed rate=550g/h,λ=0.25,O2%=5%
straw,1350℃,feed rate=550g/h,λ=0.25,O2%=5%
straw,1350℃,feed rate=550g/h,λ=0.35,O2%=7%
wood,1350℃,feed rate=1000g/h,λ=0.25,O2%=21%
0
5
10
15
20
25
30
35
0 0.5 1 1.5
CO
2(m
ol/k
g fu
el)
H2O/C
wood,1350℃,feed rate=550g/h,λ=0.25,O2%=5%
wood,1350℃,feed rate=550g/h,λ=0.35,O2%=7%
wood,1350℃,feed rate=550g/h,λ=0.5,O2%=10%
wood,1350℃,feed rate=550g/h,λ=0.75,O2%=15%
wood,1200℃,feed rate=550g/h,λ=0.1,O2%=2%
wood,1200℃,feed rate=550g/h,λ=0.25,O2%=5%
straw,1350℃,feed rate=550g/h,λ=0.25,O2%=5%
straw,1350℃,feed rate=550g/h,λ=0.35,O2%=7%
wood,1350℃,feed rate=1000g/h,λ=0.25,O2%=21%
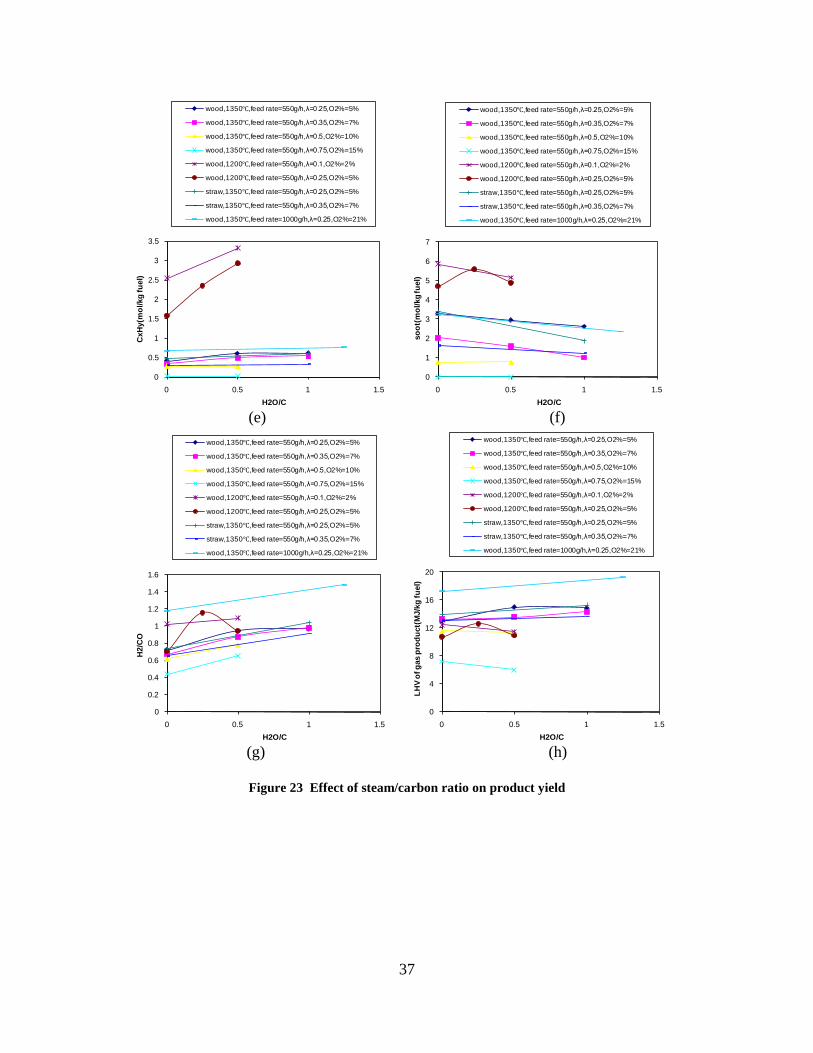
37
(e) (f)
(g) (h)
Figure 23 Effect of steam/carbon ratio on product yield
0
0.5
1
1.5
2
2.5
3
3.5
0 0.5 1 1.5
CxH
y(m
ol/k
g fu
el)
H2O/C
wood,1350℃,feed rate=550g/h,λ=0.25,O2%=5%
wood,1350℃,feed rate=550g/h,λ=0.35,O2%=7%
wood,1350℃,feed rate=550g/h,λ=0.5,O2%=10%
wood,1350℃,feed rate=550g/h,λ=0.75,O2%=15%
wood,1200℃,feed rate=550g/h,λ=0.1,O2%=2%
wood,1200℃,feed rate=550g/h,λ=0.25,O2%=5%
straw,1350℃,feed rate=550g/h,λ=0.25,O2%=5%
straw,1350℃,feed rate=550g/h,λ=0.35,O2%=7%
wood,1350℃,feed rate=1000g/h,λ=0.25,O2%=21%
0
1
2
3
4
5
6
7
0 0.5 1 1.5
soot
(mol
/kg
fuel
)
H2O/C
wood,1350℃,feed rate=550g/h,λ=0.25,O2%=5%
wood,1350℃,feed rate=550g/h,λ=0.35,O2%=7%
wood,1350℃,feed rate=550g/h,λ=0.5,O2%=10%
wood,1350℃,feed rate=550g/h,λ=0.75,O2%=15%
wood,1200℃,feed rate=550g/h,λ=0.1,O2%=2%
wood,1200℃,feed rate=550g/h,λ=0.25,O2%=5%
straw,1350℃,feed rate=550g/h,λ=0.25,O2%=5%
straw,1350℃,feed rate=550g/h,λ=0.35,O2%=7%
wood,1350℃,feed rate=1000g/h,λ=0.25,O2%=21%
0
0.2
0.4
0.6
0.8
1
1.2
1.4
1.6
0 0.5 1 1.5
H2/
CO
H2O/C
wood,1350℃,feed rate=550g/h,λ=0.25,O2%=5%
wood,1350℃,feed rate=550g/h,λ=0.35,O2%=7%
wood,1350℃,feed rate=550g/h,λ=0.5,O2%=10%
wood,1350℃,feed rate=550g/h,λ=0.75,O2%=15%
wood,1200℃,feed rate=550g/h,λ=0.1,O2%=2%
wood,1200℃,feed rate=550g/h,λ=0.25,O2%=5%
straw,1350℃,feed rate=550g/h,λ=0.25,O2%=5%
straw,1350℃,feed rate=550g/h,λ=0.35,O2%=7%
wood,1350℃,feed rate=1000g/h,λ=0.25,O2%=21%
0
4
8
12
16
20
0 0.5 1 1.5
LHV
of g
as p
rodu
ct(M
J/kg
fuel
)
H2O/C
wood,1350℃,feed rate=550g/h,λ=0.25,O2%=5%
wood,1350℃,feed rate=550g/h,λ=0.35,O2%=7%
wood,1350℃,feed rate=550g/h,λ=0.5,O2%=10%
wood,1350℃,feed rate=550g/h,λ=0.75,O2%=15%
wood,1200℃,feed rate=550g/h,λ=0.1,O2%=2%
wood,1200℃,feed rate=550g/h,λ=0.25,O2%=5%
straw,1350℃,feed rate=550g/h,λ=0.25,O2%=5%
straw,1350℃,feed rate=550g/h,λ=0.35,O2%=7%
wood,1350℃,feed rate=1000g/h,λ=0.25,O2%=21%
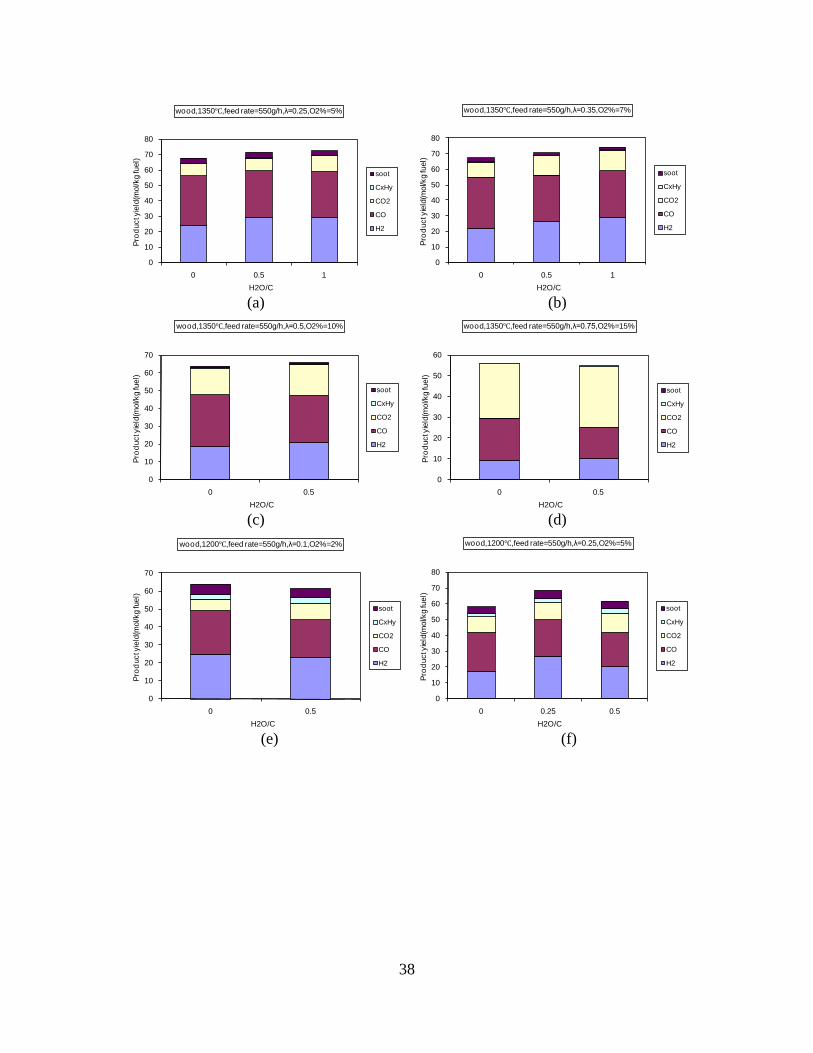
38
(a) (b)
(c) (d)
(e) (f)
0
10
20
30
40
50
60
70
80
0 0.5 1
Prod
uct y
ield
(mol
/kg
fuel
)
H2O/C
wood,1350℃,feed rate=550g/h,λ=0.25,O2%=5%
soot
CxHy
CO2
CO
H2
0
10
20
30
40
50
60
70
80
0 0.5 1
Prod
uct y
ield
(mol
/kg
fuel
)
H2O/C
wood,1350℃,feed rate=550g/h,λ=0.35,O2%=7%
soot
CxHy
CO2
CO
H2
0
10
20
30
40
50
60
70
0 0.5
Prod
uct y
ield
(mol
/kg
fuel
)
H2O/C
wood,1350℃,feed rate=550g/h,λ=0.5,O2%=10%
soot
CxHy
CO2
CO
H2
0
10
20
30
40
50
60
0 0.5
Prod
uct y
ield
(mol
/kg
fuel
)
H2O/C
wood,1350℃,feed rate=550g/h,λ=0.75,O2%=15%
soot
CxHy
CO2
CO
H2
0
10
20
30
40
50
60
70
0 0.5
Prod
uct y
ield
(mol
/kg
fuel
)
H2O/C
wood,1200℃,feed rate=550g/h,λ=0.1,O2%=2%
soot
CxHy
CO2
CO
H2
0
10
20
30
40
50
60
70
80
0 0.25 0.5
Prod
uct y
ield
(mol
/kg
fuel
)
H2O/C
wood,1200℃,feed rate=550g/h,λ=0.25,O2%=5%
soot
CxHy
CO2
CO
H2
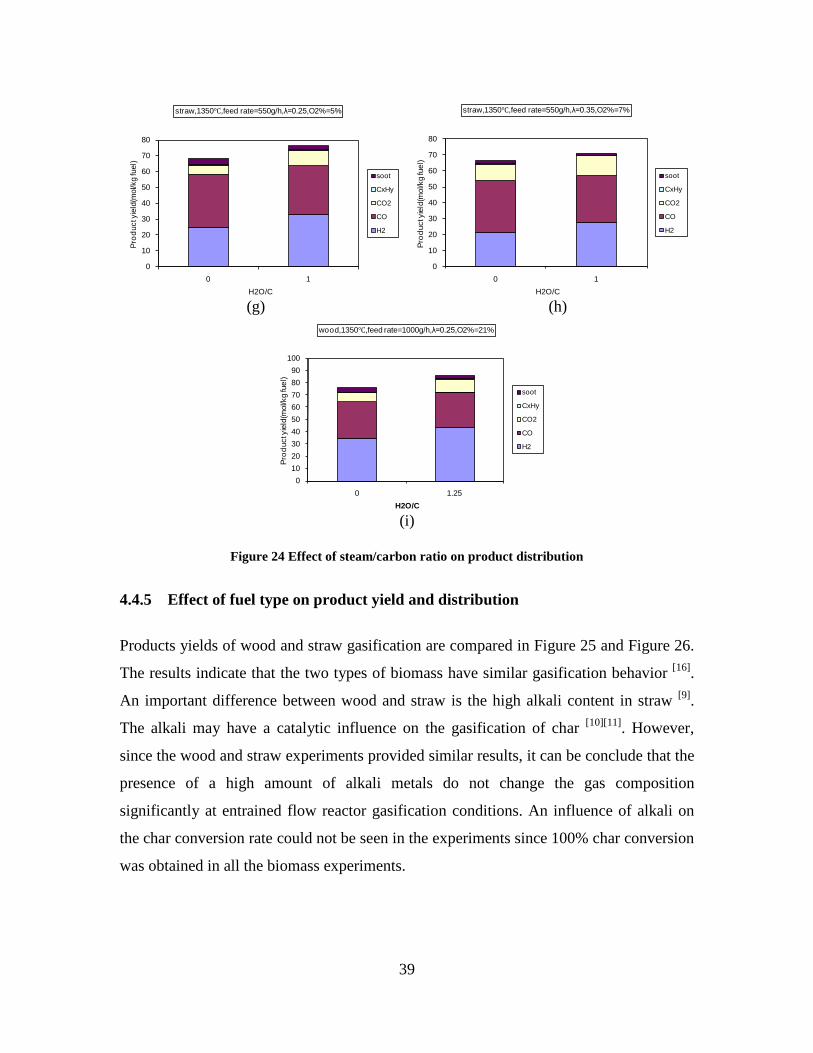
39
(g) (h)
(i)
Figure 24 Effect of steam/carbon ratio on product distribution
4.4.5 Effect of fuel type on product yield and distribution
Products yields of wood and straw gasification are compared in Figure 25 and Figure 26.
The results indicate that the two types of biomass have similar gasification behavior [16].
An important difference between wood and straw is the high alkali content in straw [9].
The alkali may have a catalytic influence on the gasification of char [10][11]. However,
since the wood and straw experiments provided similar results, it can be conclude that the
presence of a high amount of alkali metals do not change the gas composition
significantly at entrained flow reactor gasification conditions. An influence of alkali on
the char conversion rate could not be seen in the experiments since 100% char conversion
was obtained in all the biomass experiments.
0
10
20
30
40
50
60
70
80
0 1
Prod
uct y
ield
(mol
/kg
fuel
)
H2O/C
straw,1350℃,feed rate=550g/h,λ=0.25,O2%=5%
soot
CxHy
CO2
CO
H2
0
10
20
30
40
50
60
70
80
0 1
Prod
uct y
ield
(mol
/kg
fuel
)
H2O/C
straw,1350℃,feed rate=550g/h,λ=0.35,O2%=7%
soot
CxHy
CO2
CO
H2
0102030405060708090
100
0 1.25
Prod
uct y
ield
(mol
/kg
fuel
)
H2O/C
wood,1350℃,feed rate=1000g/h,λ=0.25,O2%=21%
soot
CxHy
CO2
CO
H2
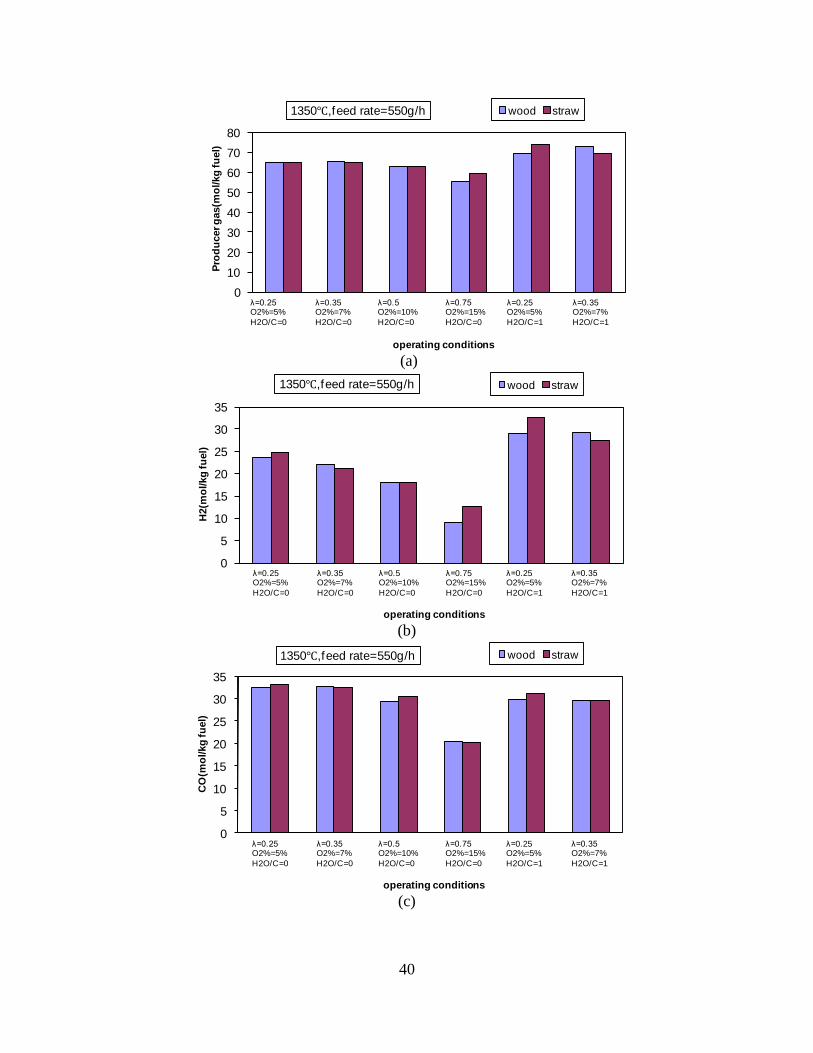
40
(a)
(b)
(c)
01020304050607080
Prod
ucer
gas
(mol
/kg
fuel
)
operating conditions
1350℃,feed rate=550g/h wood straw
λ=0.25O2%=5%H2O/C=0
λ=0.35O2%=7%H2O/C=0
λ=0.5O2%=10%H2O/C=0
λ=0.75O2%=15%H2O/C=0
λ=0.25O2%=5%H2O/C=1
λ=0.35O2%=7%H2O/C=1
0
5
10
15
20
25
30
35
H2(
mol
/kg
fuel
)
operating conditions
1350℃,feed rate=550g/h wood straw
λ=0.25O2%=5%H2O/C=0
λ=0.35O2%=7%H2O/C=0
λ=0.5O2%=10%H2O/C=0
λ=0.75O2%=15%H2O/C=0
λ=0.25O2%=5%H2O/C=1
λ=0.35O2%=7%H2O/C=1
0
5
10
15
20
25
30
35
CO
(mol
/kg
fuel
)
operating conditions
1350℃,feed rate=550g/h wood straw
λ=0.25O2%=5%H2O/C=0
λ=0.35O2%=7%H2O/C=0
λ=0.5O2%=10%H2O/C=0
λ=0.75O2%=15%H2O/C=0
λ=0.25O2%=5%H2O/C=1
λ=0.35O2%=7%H2O/C=1
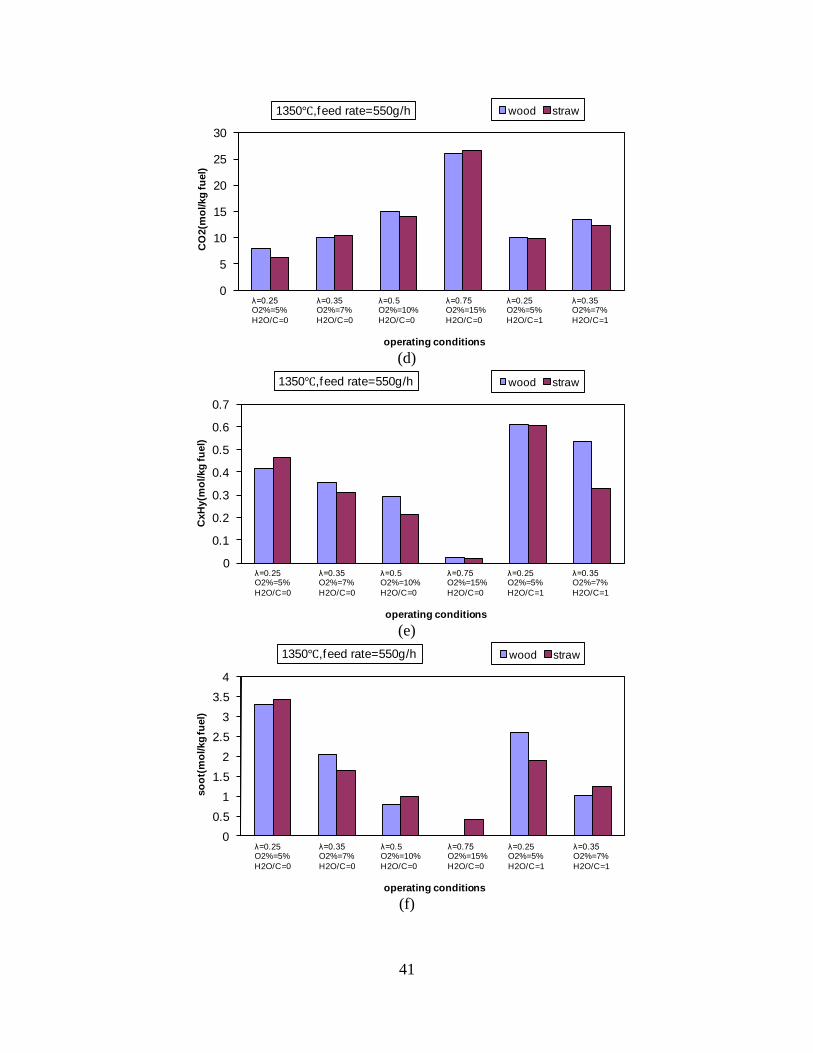
41
(d)
(e)
(f)
0
5
10
15
20
25
30
CO
2(m
ol/k
g fu
el)
operating conditions
1350℃,feed rate=550g/h wood straw
λ=0.25O2%=5%H2O/C=0
λ=0.35O2%=7%H2O/C=0
λ=0.5O2%=10%H2O/C=0
λ=0.75O2%=15%H2O/C=0
λ=0.25O2%=5%H2O/C=1
λ=0.35O2%=7%H2O/C=1
0
0.1
0.2
0.3
0.4
0.5
0.6
0.7
CxH
y(m
ol/k
g fu
el)
operating conditions
1350℃,feed rate=550g/h wood straw
λ=0.25O2%=5%H2O/C=0
λ=0.35O2%=7%H2O/C=0
λ=0.5O2%=10%H2O/C=0
λ=0.75O2%=15%H2O/C=0
λ=0.25O2%=5%H2O/C=1
λ=0.35O2%=7%H2O/C=1
00.5
11.5
22.5
33.5
4
soot
(mol
/kg
fuel
)
operating conditions
1350℃,feed rate=550g/h wood straw
λ=0.25O2%=5%H2O/C=0
λ=0.35O2%=7%H2O/C=0
λ=0.5O2%=10%H2O/C=0
λ=0.75O2%=15%H2O/C=0
λ=0.25O2%=5%H2O/C=1
λ=0.35O2%=7%H2O/C=1
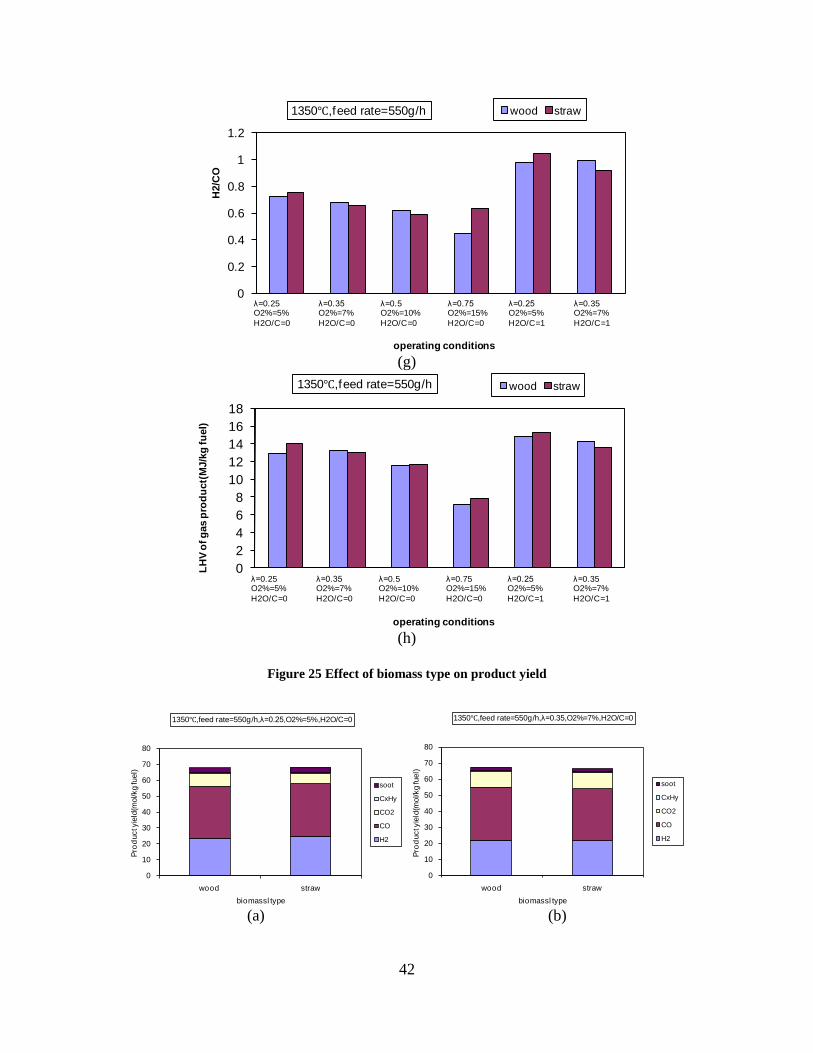
42
(g)
(h)
Figure 25 Effect of biomass type on product yield
(a) (b)
0
0.2
0.4
0.6
0.8
1
1.2
H2/
CO
operating conditions
1350℃,feed rate=550g/h wood straw
λ=0.25O2%=5%H2O/C=0
λ=0.35O2%=7%H2O/C=0
λ=0.5O2%=10%H2O/C=0
λ=0.75O2%=15%H2O/C=0
λ=0.25O2%=5%H2O/C=1
λ=0.35O2%=7%H2O/C=1
02468
1012141618
LHV
of g
as p
rodu
ct(M
J/kg
fuel
)
operating conditions
1350℃,feed rate=550g/h wood straw
λ=0.25O2%=5%H2O/C=0
λ=0.35O2%=7%H2O/C=0
λ=0.5O2%=10%H2O/C=0
λ=0.75O2%=15%H2O/C=0
λ=0.25O2%=5%H2O/C=1
λ=0.35O2%=7%H2O/C=1
0
10
20
30
40
50
60
70
80
wood straw
Prod
uct y
ield
(mol
/kg
fuel
)
biomassl type
1350℃,feed rate=550g/h,λ=0.25,O2%=5%,H2O/C=0
soot
CxHy
CO2
CO
H2
0
10
20
30
40
50
60
70
80
wood straw
Prod
uct y
ield
(mol
/kg
fuel
)
biomassl type
1350℃,feed rate=550g/h,λ=0.35,O2%=7%,H2O/C=0
soot
CxHy
CO2
CO
H2
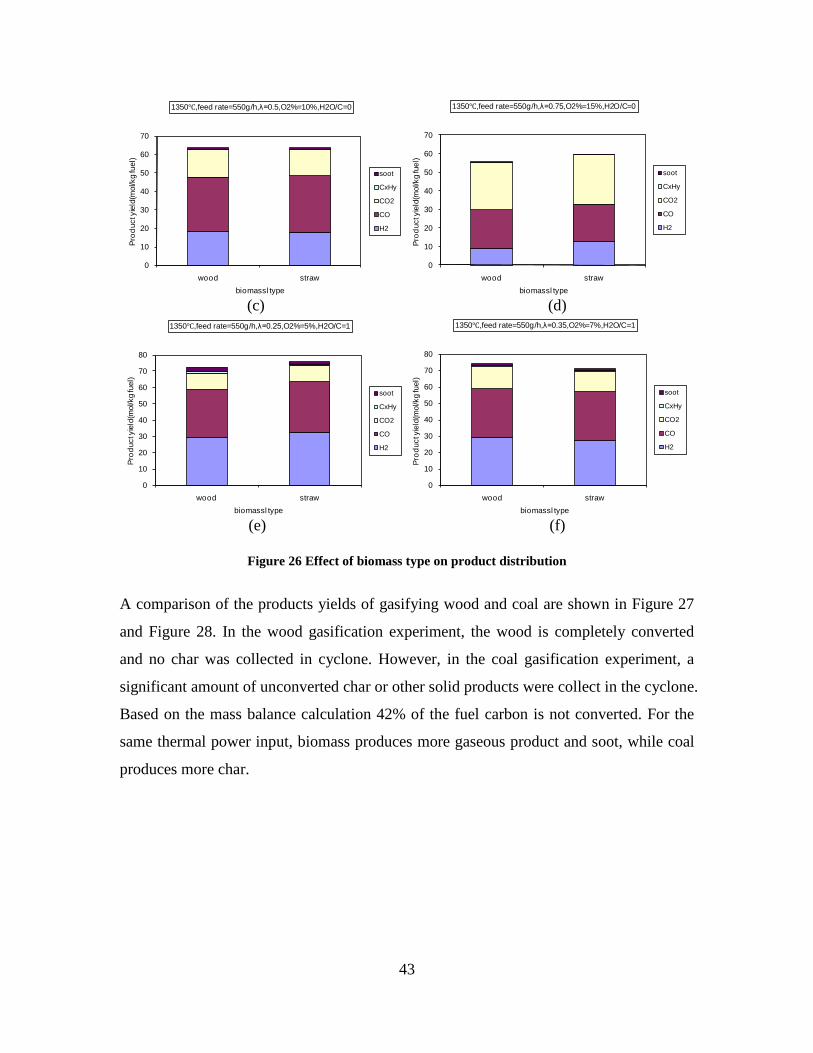
43
(c) (d)
(e) (f)
Figure 26 Effect of biomass type on product distribution
A comparison of the products yields of gasifying wood and coal are shown in Figure 27
and Figure 28. In the wood gasification experiment, the wood is completely converted
and no char was collected in cyclone. However, in the coal gasification experiment, a
significant amount of unconverted char or other solid products were collect in the cyclone.
Based on the mass balance calculation 42% of the fuel carbon is not converted. For the
same thermal power input, biomass produces more gaseous product and soot, while coal
produces more char.
0
10
20
30
40
50
60
70
wood straw
Prod
uct y
ield
(mol
/kg
fuel
)
biomassl type
1350℃,feed rate=550g/h,λ=0.5,O2%=10%,H2O/C=0
soot
CxHy
CO2
CO
H2
0
10
20
30
40
50
60
70
wood straw
Prod
uct y
ield
(mol
/kg
fuel
)
biomassl type
1350℃,feed rate=550g/h,λ=0.75,O2%=15%,H2O/C=0
soot
CxHy
CO2
CO
H2
0
10
20
30
40
50
60
70
80
wood straw
Prod
uct y
ield
(mol
/kg
fuel
)
biomassl type
1350℃,feed rate=550g/h,λ=0.25,O2%=5%,H2O/C=1
soot
CxHy
CO2
CO
H2
0
10
20
30
40
50
60
70
80
wood straw
Prod
uct y
ield
(mol
/kg
fuel
)
biomassl type
1350℃,feed rate=550g/h,λ=0.35,O2%=7%,H2O/C=1
soot
CxHy
CO2
CO
H2
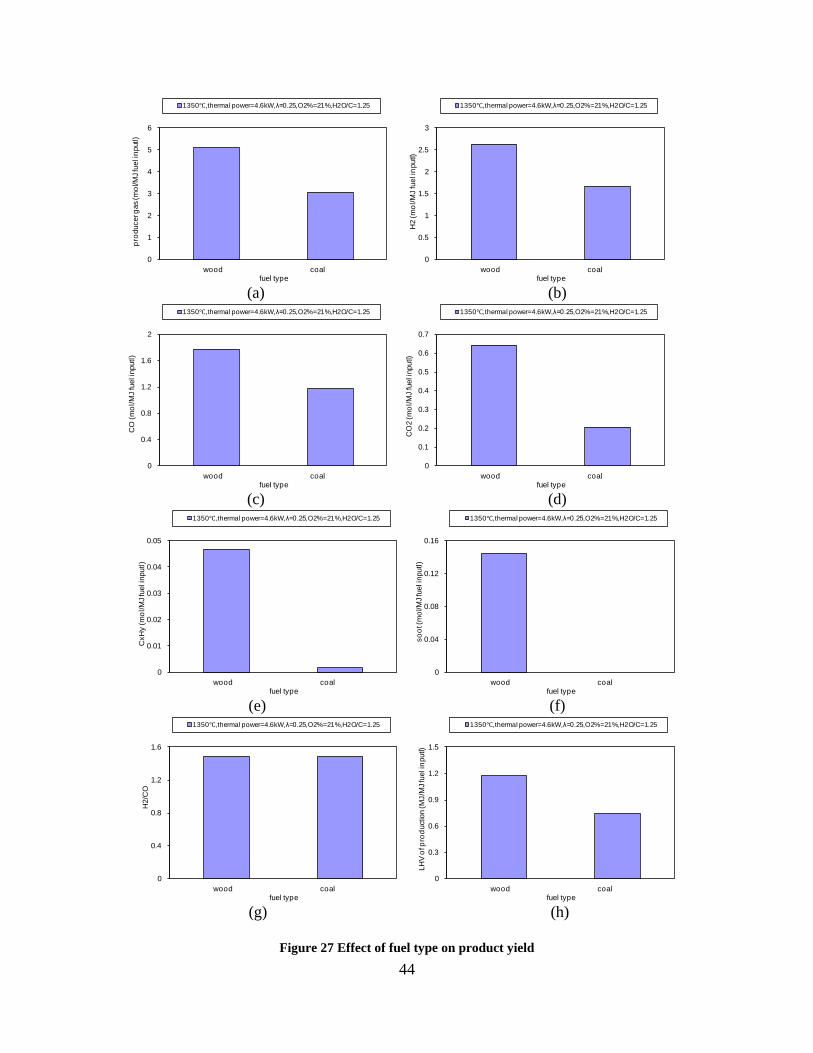
44
(a) (b)
(c) (d)
(e) (f)
(g) (h)
Figure 27 Effect of fuel type on product yield
0
1
2
3
4
5
6pr
oduc
er g
as (m
ol/M
J fue
l inp
utl)
fuel type
1350℃,thermal power=4.6kW,λ=0.25,O2%=21%,H2O/C=1.25
wood coal 0
0.5
1
1.5
2
2.5
3
H2
(mol
/MJ
fuel
inpu
tl)
fuel type
1350℃,thermal power=4.6kW,λ=0.25,O2%=21%,H2O/C=1.25
wood coal
0
0.4
0.8
1.2
1.6
2
CO
(mol
/MJ
fuel
inpu
tl)
fuel type
1350℃,thermal power=4.6kW,λ=0.25,O2%=21%,H2O/C=1.25
wood coal 0
0.1
0.2
0.3
0.4
0.5
0.6
0.7
CO
2 (m
ol/M
J fu
el in
putl)
fuel type
1350℃,thermal power=4.6kW,λ=0.25,O2%=21%,H2O/C=1.25
wood coal
0
0.01
0.02
0.03
0.04
0.05
CxH
y (m
ol/M
J fue
l inp
utl)
fuel type
1350℃,thermal power=4.6kW,λ=0.25,O2%=21%,H2O/C=1.25
wood coal 0
0.04
0.08
0.12
0.16
soot
(mol
/MJ f
uel i
nput
l)
fuel type
1350℃,thermal power=4.6kW,λ=0.25,O2%=21%,H2O/C=1.25
wood coal
0
0.4
0.8
1.2
1.6
H2/
CO
fuel type
1350℃,thermal power=4.6kW,λ=0.25,O2%=21%,H2O/C=1.25
wood coal 0
0.3
0.6
0.9
1.2
1.5
LHV
of p
rodu
ctio
n (M
J/M
J fue
l inp
utl)
fuel type
1350℃,thermal power=4.6kW,λ=0.25,O2%=21%,H2O/C=1.25
wood coal
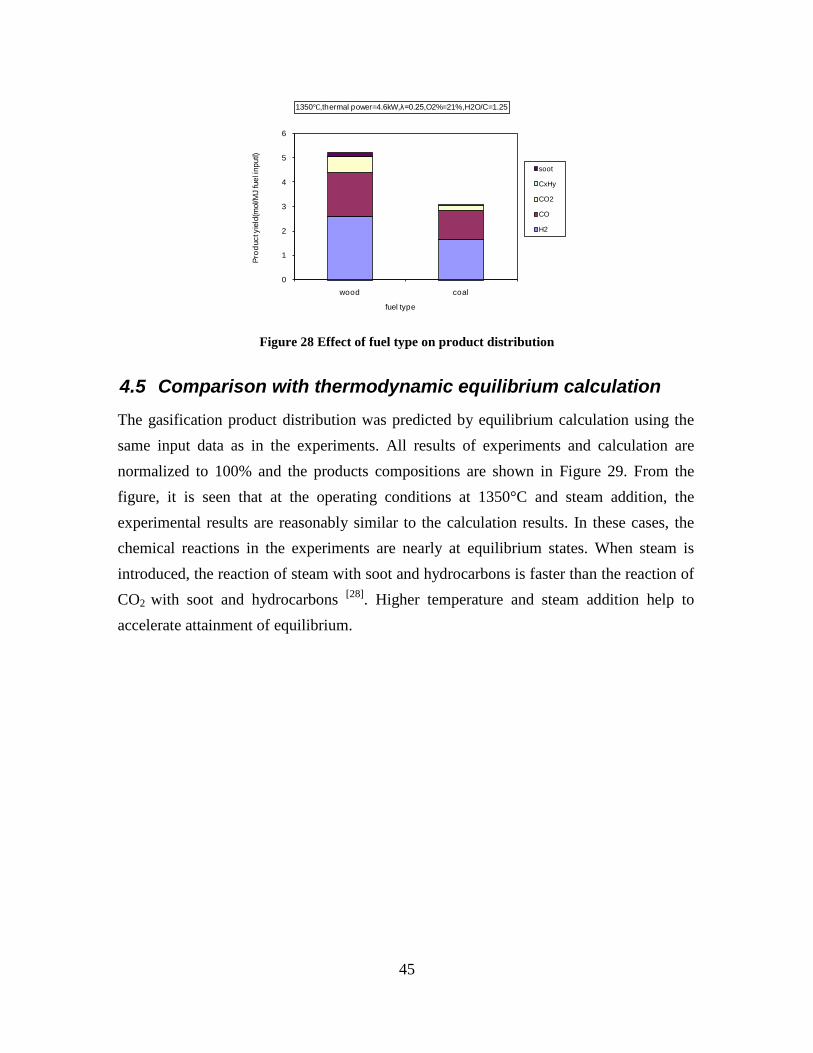
45
Figure 28 Effect of fuel type on product distribution
4.5 Comparison with thermodynamic equilibrium calculation
The gasification product distribution was predicted by equilibrium calculation using the same input data as in the experiments. All results of experiments and calculation are normalized to 100% and the products compositions are shown in Figure 29. From the figure, it is seen that at the operating conditions at 1350°C and steam addition, the experimental results are reasonably similar to the calculation results. In these cases, the chemical reactions in the experiments are nearly at equilibrium states. When steam is introduced, the reaction of steam with soot and hydrocarbons is faster than the reaction of CO2 with soot and hydrocarbons [28]. Higher temperature and steam addition help to accelerate attainment of equilibrium.
0
1
2
3
4
5
6
wood coal
Prod
uct y
ield
(mol
/MJ
fuel
inpu
tl)
fuel type
1350℃,thermal power=4.6kW,λ=0.25,O2%=21%,H2O/C=1.25
soot
CxHy
CO2
CO
H2
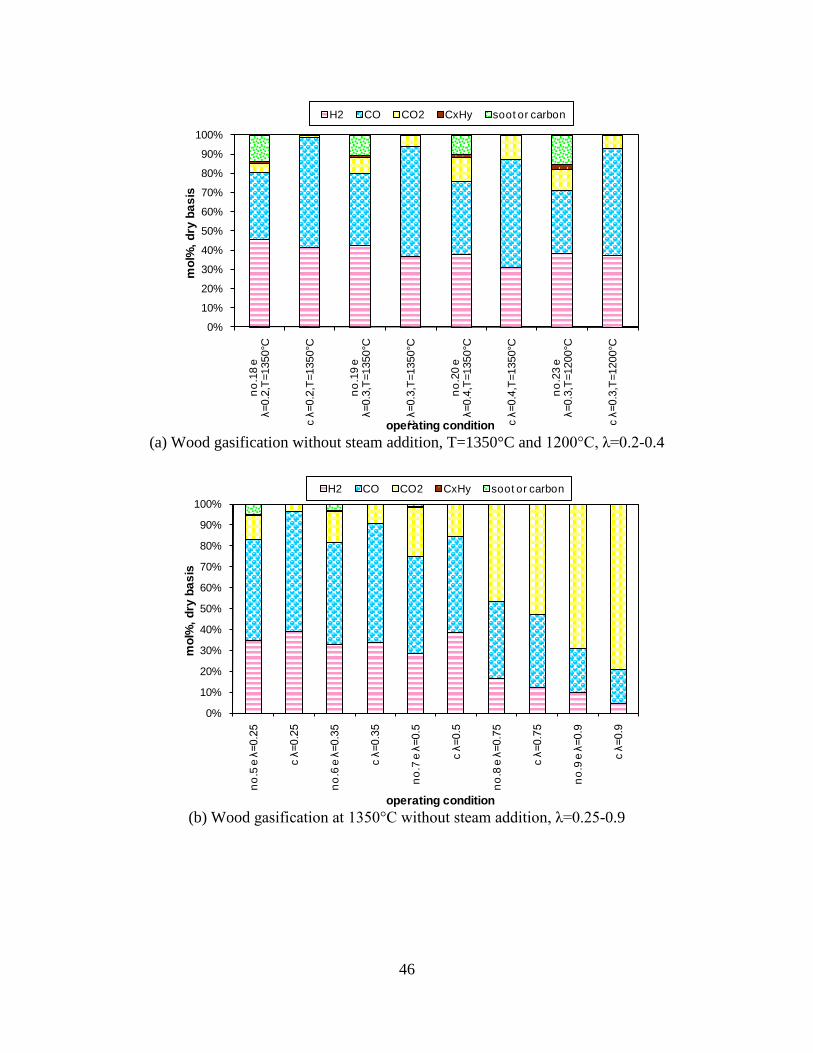
46
(a) Wood gasification without steam addition, T=1350°C and 1200°C, λ=0.2-0.4
(b) Wood gasification at 1350°C without steam addition, λ=0.25-0.9
0%
10%
20%
30%
40%
50%
60%
70%
80%
90%
100%
no.1
8 e
λ=0.2,
T=13
50°C
c λ=0.2,
T=13
50°C
no.1
9 e
λ=0.3,
T=13
50°C
c λ=0.3,
T=13
50°C
no.2
0 e
λ=0.4,
T=13
50°C
c λ=0.4,
T=13
50°C
no.2
3 e
λ=0.3,
T=12
00° C
c λ=0.3,
T=12
00°C
mol
%, d
ry b
asis
operating condition
H2 CO CO2 CxHy soot or carbon
0%
10%
20%
30%
40%
50%
60%
70%
80%
90%
100%
no.5
e λ=0.25
c λ=0.25
no.6
e λ=0.35
c λ=0.35
no.7
e λ=0.5
c λ=0.5
no.8
e λ=0.75
c λ=0.75
no.9
e λ=0.9
c λ=0.9
mol
%, d
ry b
asis
operating condition
H2 CO CO2 CxHy soot or carbon
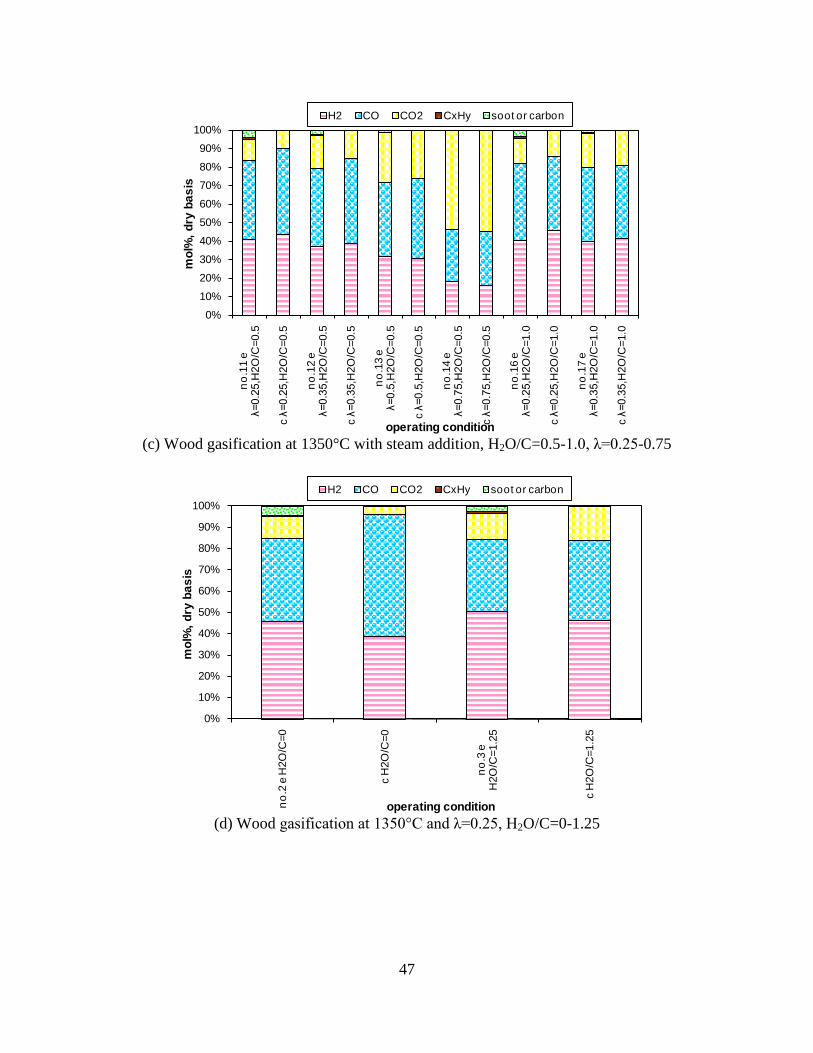
47
(c) Wood gasification at 1350°C with steam addition, H2O/C=0.5-1.0, λ=0.25-0.75
(d) Wood gasification at 1350°C and λ=0.25, H2O/C=0-1.25
0%
10%
20%
30%
40%
50%
60%
70%
80%
90%
100%
no.1
1 e
λ=0.25,H
2O/C
=0.5
c λ=0.25,H
2O/C
=0.5
no.1
2 e
λ=0.35,H
2O/C
=0.5
c λ=0.35,H
2O/C
=0.5
no.1
3 e
λ=0.5,
H2O
/C=0
.5
c λ=0.5,
H2O
/C=0
.5
no.1
4 e
λ=0.75,H
2O/C
=0.5
c λ=0.75,H
2O/C
=0.5
no.1
6 e
λ=0.25,H
2O/C
=1.0
c λ=0.25,H
2O/C
=1.0
no.1
7 e
λ=0.35,H
2O/C
=1.0
c λ=0.35,H
2O/C
=1.0
mol
%, d
ry b
asis
operating condition
H2 CO CO2 CxHy soot or carbon
0%
10%
20%
30%
40%
50%
60%
70%
80%
90%
100%
no.2
e H
2O/C
=0
c H
2O/C
=0
no.3
e
H2O
/C=1
.25
c H
2O/C
=1.2
5
mol
%, d
ry b
asis
operating condition
H2 CO CO2 CxHy soot or carbon
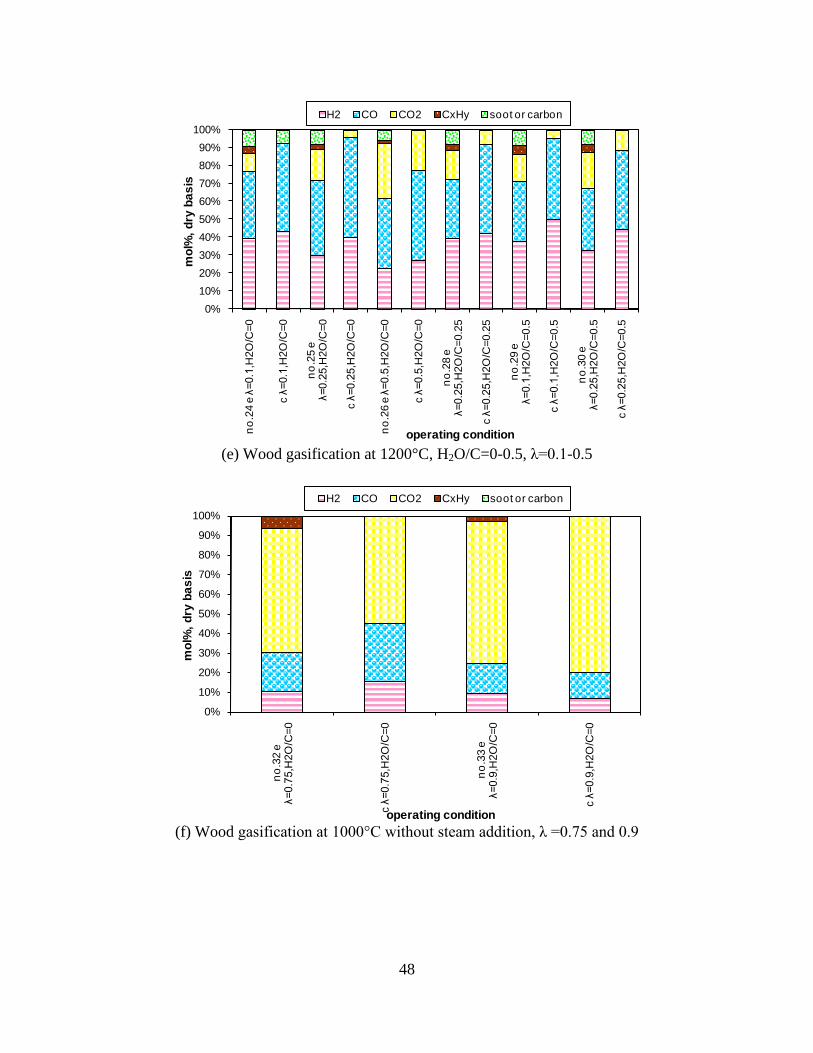
48
(e) Wood gasification at 1200°C, H2O/C=0-0.5, λ=0.1-0.5
(f) Wood gasification at 1000°C without steam addition, λ =0.75 and 0.9
0%10%20%30%40%50%60%70%80%90%
100%
no.2
4 e λ=0.1,
H2O
/C=0
c λ=0.1,
H2O
/C=0
no.2
5 e
λ=0.25,H
2O/C
=0
c λ=0.25, H
2O/C
=0
no.2
6 e λ=0.5,
H2O
/C=0
c λ=0.5,
H2O
/C=0
no.2
8 e
λ=0.25,H
2O/C
=0.2
5
c λ=0.25,H
2O/C
=0.2
5
no.2
9 e
λ=0.1,
H2O
/C=0
.5
c λ=0.1,
H2O
/C=0
.5
no.3
0 e
λ=0.25,H
2O/C
=0.5
c λ=0.25,H
2O/C
=0.5
mol
%, d
ry b
asis
operating condition
H2 CO CO2 CxHy soot or carbon
0%
10%
20%
30%
40%
50%
60%
70%
80%
90%
100%
no.3
2 e
λ=0.75,H
2O/C
=0
c λ=0.75,H
2O/C
=0
no.3
3 e
λ=0.9,
H2O
/C=0
c λ=0.9,
H2O
/C=0
mol
%, d
ry b
asis
operating condition
H2 CO CO2 CxHy soot or carbon
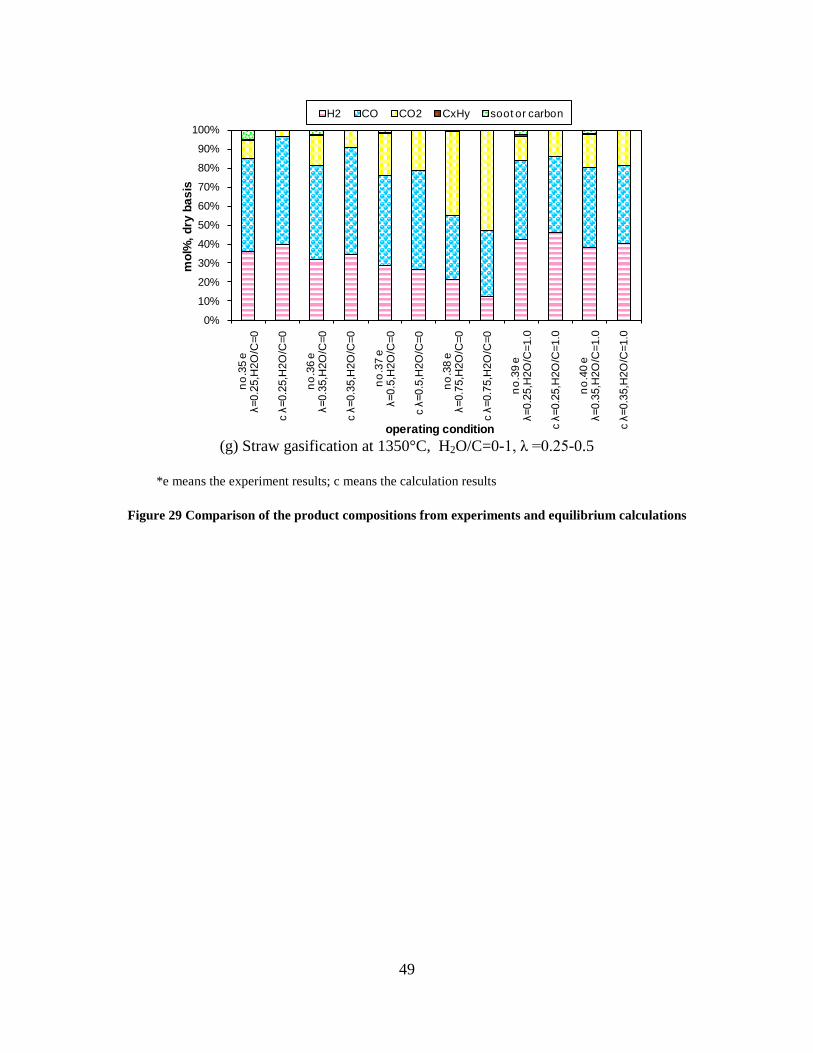
49
(g) Straw gasification at 1350°C, H2O/C=0-1, λ =0.25-0.5
*e means the experiment results; c means the calculation results
Figure 29 Comparison of the product compositions from experiments and equilibrium calculations
0%
10%
20%
30%
40%
50%
60%
70%
80%
90%
100%
no.3
5 e
λ=0.25,H
2O/C
=0
c λ=0.25,H
2O/C
=0
no.3
6 e
λ=0.35,H
2O/C
=0
c λ=0.35,H
2O/C
=0
no.3
7 e
λ=0.5,
H2O
/C=0
c λ=0.5,
H2O
/C=0
no.3
8 e
λ=0.75,H
2O/C
=0
c λ=0.75,H
2O/C
=0
no.3
9 e
λ=0.25,H
2O/C
=1.0
c λ=0.25,H
2O/C
=1.0
no.4
0 e
λ=0.35,H
2O/C
=1.0
c λ=0.35,H
2O/C
=1.0
mol
%, d
ry b
asis
operating condition
H2 CO CO2 CxHy soot or carbon
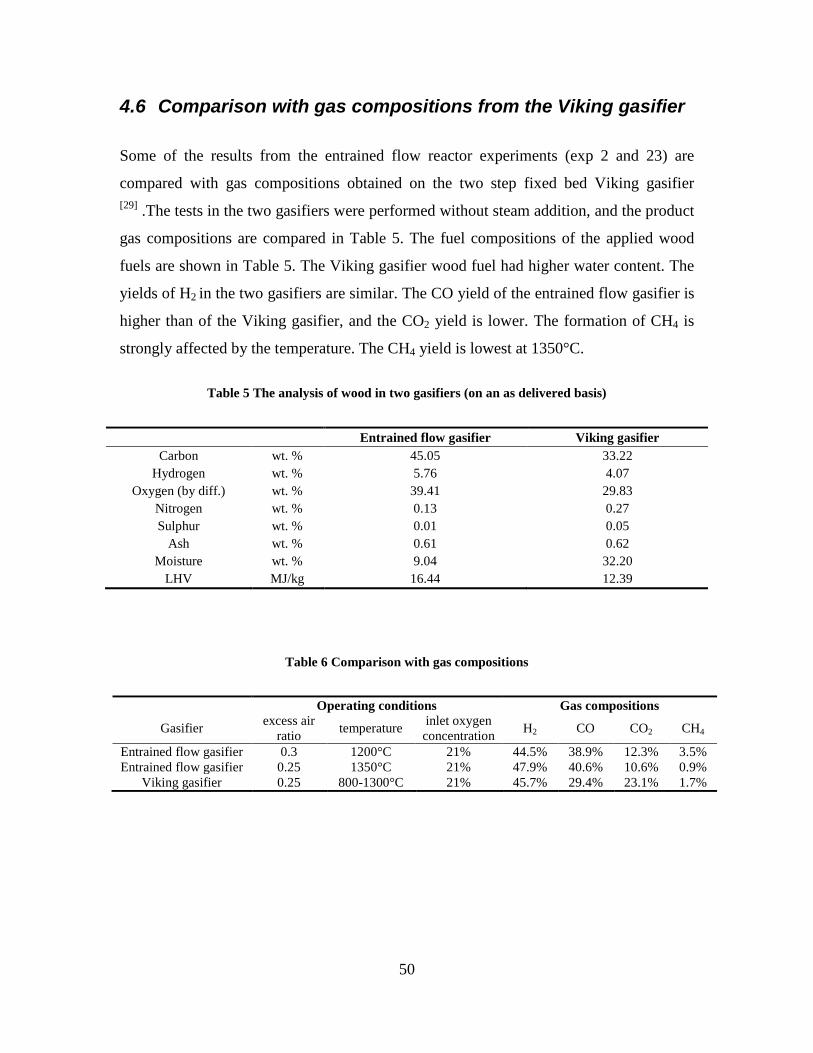
50
4.6 Comparison with gas compositions from the Viking gasifier
Some of the results from the entrained flow reactor experiments (exp 2 and 23) are
compared with gas compositions obtained on the two step fixed bed Viking gasifier [29] .The tests in the two gasifiers were performed without steam addition, and the product
gas compositions are compared in Table 5. The fuel compositions of the applied wood
fuels are shown in Table 5. The Viking gasifier wood fuel had higher water content. The
yields of H2 in the two gasifiers are similar. The CO yield of the entrained flow gasifier is
higher than of the Viking gasifier, and the CO2 yield is lower. The formation of CH4 is
strongly affected by the temperature. The CH4 yield is lowest at 1350°C.
Table 5 The analysis of wood in two gasifiers (on an as delivered basis)
Entrained flow gasifier Viking gasifier Carbon wt. % 45.05 33.22
Hydrogen wt. % 5.76 4.07 Oxygen (by diff.) wt. % 39.41 29.83
Nitrogen wt. % 0.13 0.27 Sulphur wt. % 0.01 0.05
Ash wt. % 0.61 0.62 Moisture wt. % 9.04 32.20
LHV MJ/kg 16.44 12.39
Table 6 Comparison with gas compositions
Operating conditions Gas compositions
Gasifier excess air ratio temperature inlet oxygen
concentration H2 CO CO2 CH4
Entrained flow gasifier 0.3 1200°C 21% 44.5% 38.9% 12.3% 3.5% Entrained flow gasifier 0.25 1350°C 21% 47.9% 40.6% 10.6% 0.9%
Viking gasifier 0.25 800-1300°C 21% 45.7% 29.4% 23.1% 1.7%
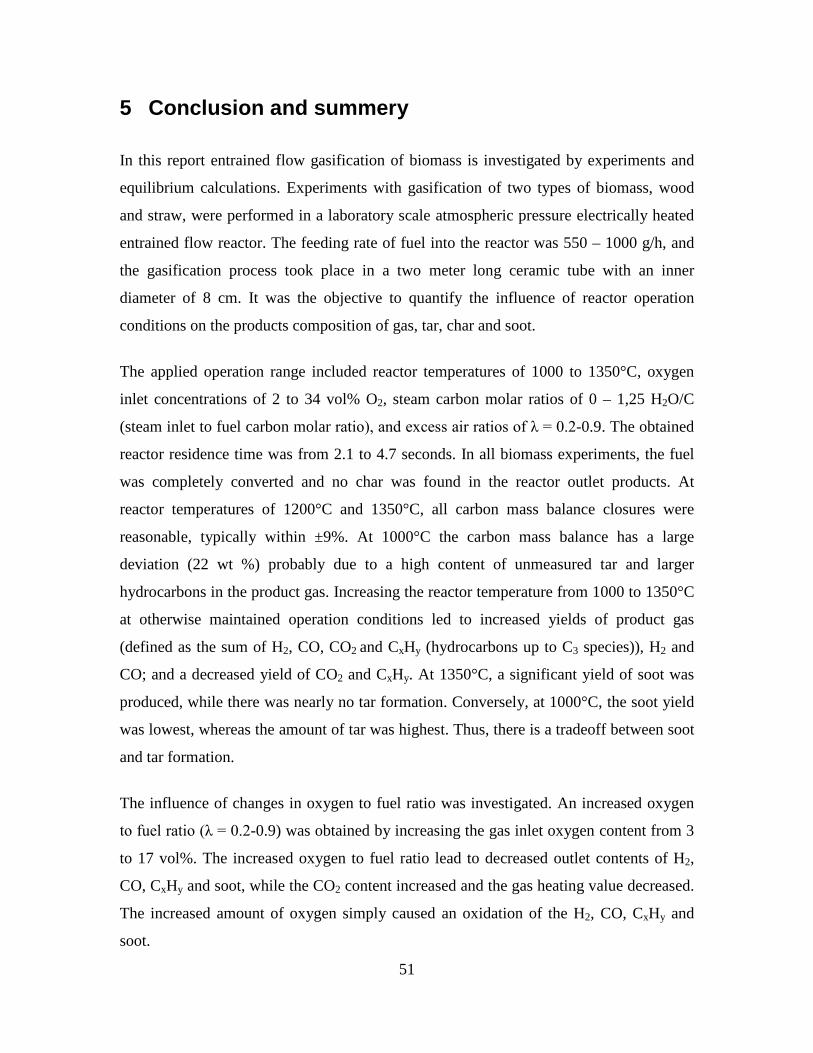
51
5 Conclusion and summery
In this report entrained flow gasification of biomass is investigated by experiments and
equilibrium calculations. Experiments with gasification of two types of biomass, wood
and straw, were performed in a laboratory scale atmospheric pressure electrically heated
entrained flow reactor. The feeding rate of fuel into the reactor was 550 – 1000 g/h, and
the gasification process took place in a two meter long ceramic tube with an inner
diameter of 8 cm. It was the objective to quantify the influence of reactor operation
conditions on the products composition of gas, tar, char and soot.
The applied operation range included reactor temperatures of 1000 to 1350°C, oxygen
inlet concentrations of 2 to 34 vol% O2, steam carbon molar ratios of 0 – 1,25 H2O/C
(steam inlet to fuel carbon molar ratio), and excess air ratios of λ = 0.2-0.9. The obtained
reactor residence time was from 2.1 to 4.7 seconds. In all biomass experiments, the fuel
was completely converted and no char was found in the reactor outlet products. At
reactor temperatures of 1200°C and 1350°C, all carbon mass balance closures were
reasonable, typically within ±9%. At 1000°C the carbon mass balance has a large
deviation (22 wt %) probably due to a high content of unmeasured tar and larger
hydrocarbons in the product gas. Increasing the reactor temperature from 1000 to 1350°C
at otherwise maintained operation conditions led to increased yields of product gas
(defined as the sum of H2, CO, CO2 and CxHy (hydrocarbons up to C3 species)), H2 and
CO; and a decreased yield of CO2 and CxHy. At 1350°C, a significant yield of soot was
produced, while there was nearly no tar formation. Conversely, at 1000°C, the soot yield
was lowest, whereas the amount of tar was highest. Thus, there is a tradeoff between soot
and tar formation.
The influence of changes in oxygen to fuel ratio was investigated. An increased oxygen
to fuel ratio (λ = 0.2-0.9) was obtained by increasing the gas inlet oxygen content from 3
to 17 vol%. The increased oxygen to fuel ratio lead to decreased outlet contents of H2,
CO, CxHy and soot, while the CO2 content increased and the gas heating value decreased.
The increased amount of oxygen simply caused an oxidation of the H2, CO, CxHy and
soot.
52
The influence of increased oxygen inlet concentration with otherwise maintained
operation conditions at an excess air ratio of λ=0.25, a reactor temperature of 1350°C and
no steam injection were investigated. The increased oxygen concentration was obtained
by decreasing the N2 flow to the reactor and this leads to an increased reactor residence
time, and probably an increased temperature in the top of the reactor. The soot formation
increased from 3 mol/kg fuel at an inlet oxygen concentration of 5 vol% up to 11 mol/kg
fuel at an inlet oxygen concentration of 34 vol%. The reason for the large soot formation
at high oxygen inlet concentrations is presently not known.
Increased steam injection and thereby increased reactor H2O/C ratio pushed the water
shift reaction towards an increased formation of H2 and CO2. However, even a high
amount of water injection (H2O/C ratio changed from 0 to 1) typically caused a H2 dry
gas content increase of only 20%. A moderate reduction of the soot formation was
observed with steam injection.
A comparison of product gas composition when using wood and straw fuel showed
similar results. This indicates that the high straw fuel alkali content do not significantly
influences the gasification process.
Generally some soot was produced in all experiments conducted at 1200 and 1350°C
using low λ values. A minimum amount of soot of 2 mol/kg fuel at λ = 0.25 were
observed at the operation conditions 1350°C, inlet O2= 5 vol% and a steam injection level
of H2O/C = 1.0. STA (simultaneous Thermal Analysis) tests showed that the combustion
reactivity of soot from straw gasification is higher than that of soot from wood
gasification.
Thermodynamic equilibrium calculations were performed by using the Factsage software.
The equilibrium calculations were performed using conditions that correspond to
entrained flow gasification of wood. Effects of temperature (800-1600°C), steam/carbon
molar ratio (0 – 2.0 mol steam added relative to fuel C mol input), excess air ratio (λ =
0.0-1.0), and pressure (1 – 100 Bar) were investigated. As a standard condition were
used a temperature of 1350°C, a steam/carbon molar ratio of 0, an excess air ratio λ =
53
0.25 and pressure of 1 Bar. Using a λ value of 0.2 to 0.25 lead to a maximum CO yield,
while using a value of λ bellow 0.2 formation of carbon was predicted. Changes of
temperature above 800°C only induced small changes in the gas composition. By
increased water injection an increased level of H2 and CO2 and a decreased level of CO
were observed. Increasing the pressure from 1 to 100 Bar only changed the gas
composition slightly; a small amount of methane was predicted to be formed. The
gasification product distributions obtained by the experiments and equilibrium
calculations were compared. It was observed that at 1350 and 1200°C with no steam
addition the experiments gave rise to some soot and hydrocarbon formation that was not
predicted by the equilibrium calculations. At 1350 with steam addition smaller amounts
of hydrocarbon and soot was formed, and generally the equilibrium calculations provided
reasonable predictions of the gas H2, CO and CO2 contents.
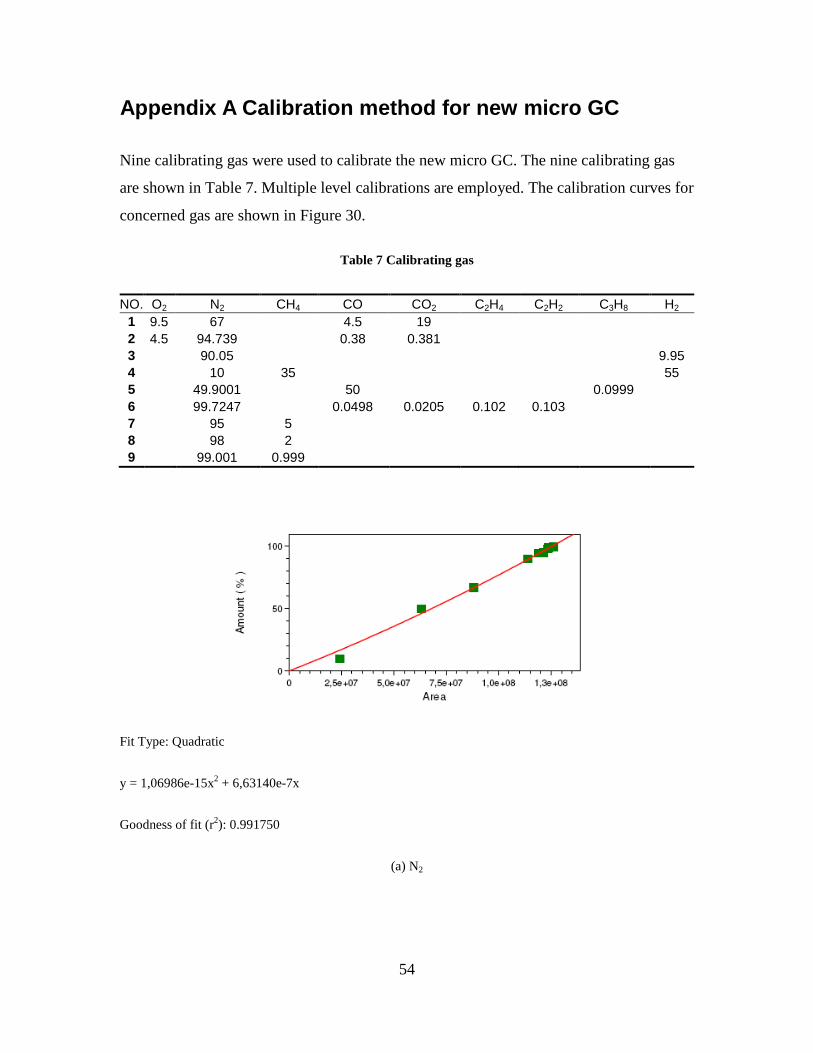
54
Appendix A Calibration method for new micro GC
Nine calibrating gas were used to calibrate the new micro GC. The nine calibrating gas
are shown in Table 7. Multiple level calibrations are employed. The calibration curves for
concerned gas are shown in Figure 30.
Table 7 Calibrating gas
NO. O2 N2 CH4 CO CO2 C2H4 C2H2 C3H8 H2 1 9.5 67 4.5 19 2 4.5 94.739 0.38 0.381 3 90.05 9.95 4 10 35 55 5 49.9001 50 0.0999 6 99.7247 0.0498 0.0205 0.102 0.103 7 95 5 8 98 2 9 99.001 0.999
Fit Type: Quadratic
y = 1,06986e-15x2 + 6,63140e-7x
Goodness of fit (r2): 0.991750
(a) N2
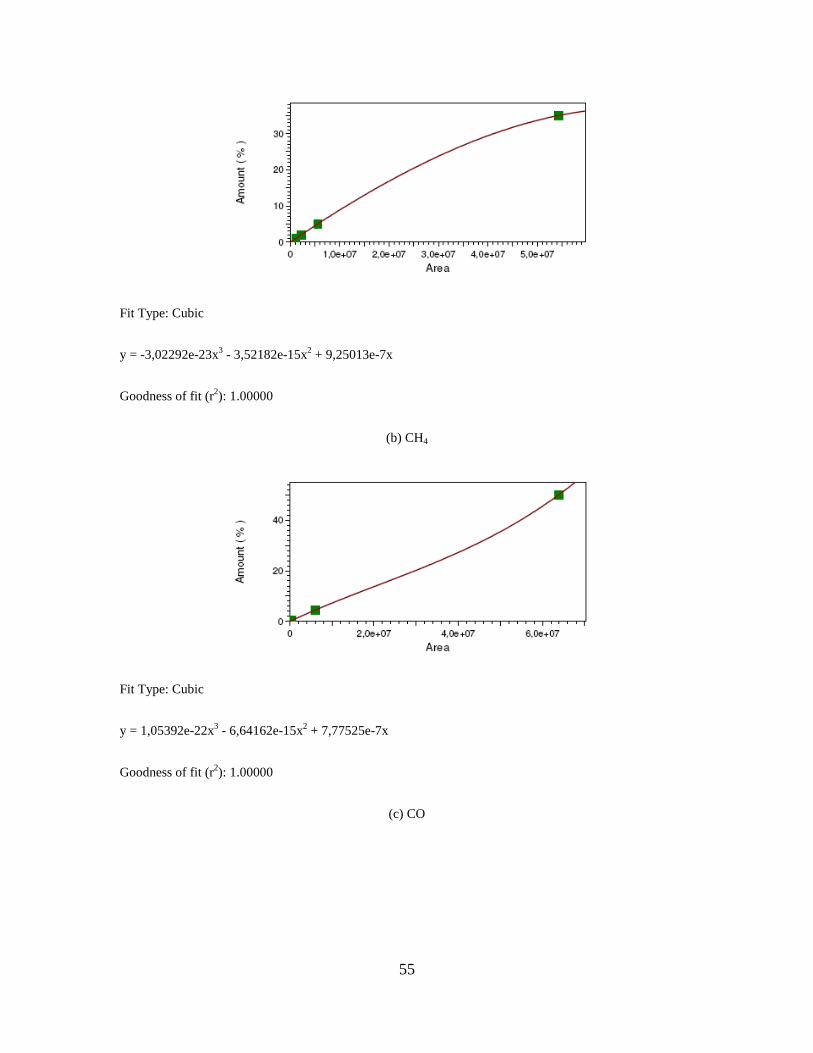
55
Fit Type: Cubic
y = -3,02292e-23x3 - 3,52182e-15x2 + 9,25013e-7x
Goodness of fit (r2): 1.00000
(b) CH4
Fit Type: Cubic
y = 1,05392e-22x3 - 6,64162e-15x2 + 7,77525e-7x
Goodness of fit (r2): 1.00000
(c) CO
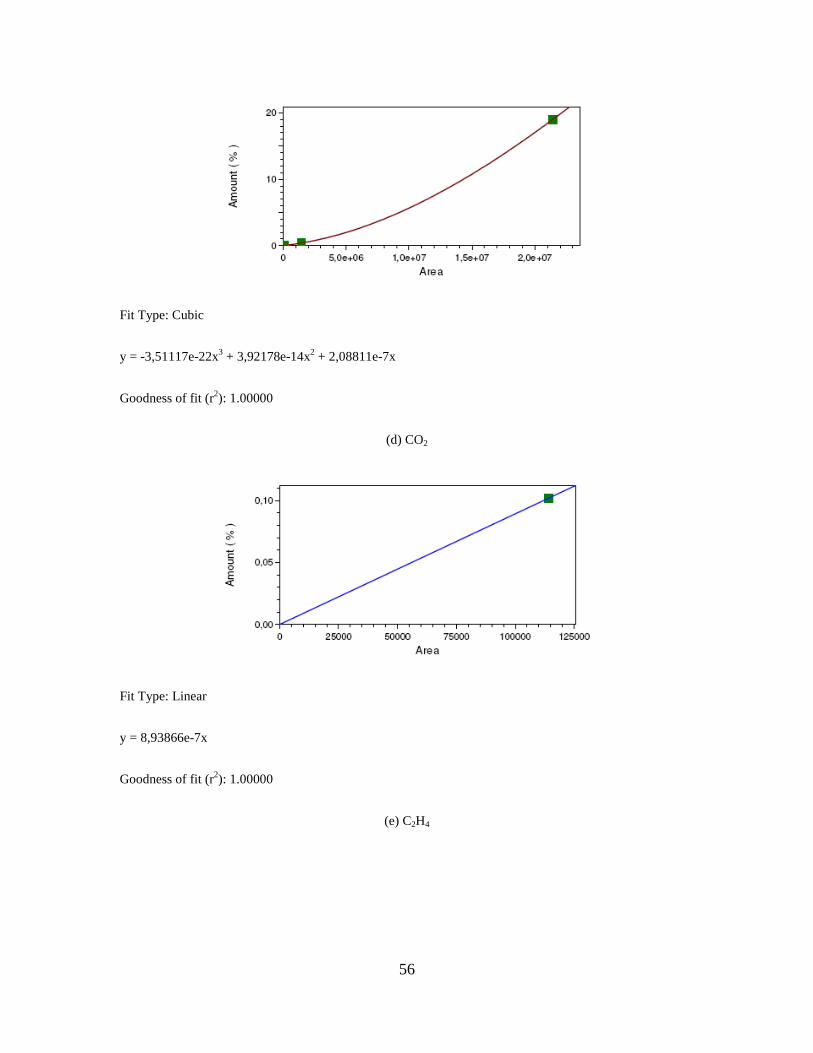
56
Fit Type: Cubic
y = -3,51117e-22x3 + 3,92178e-14x2 + 2,08811e-7x
Goodness of fit (r2): 1.00000
(d) CO2
Fit Type: Linear
y = 8,93866e-7x
Goodness of fit (r2): 1.00000
(e) C2H4
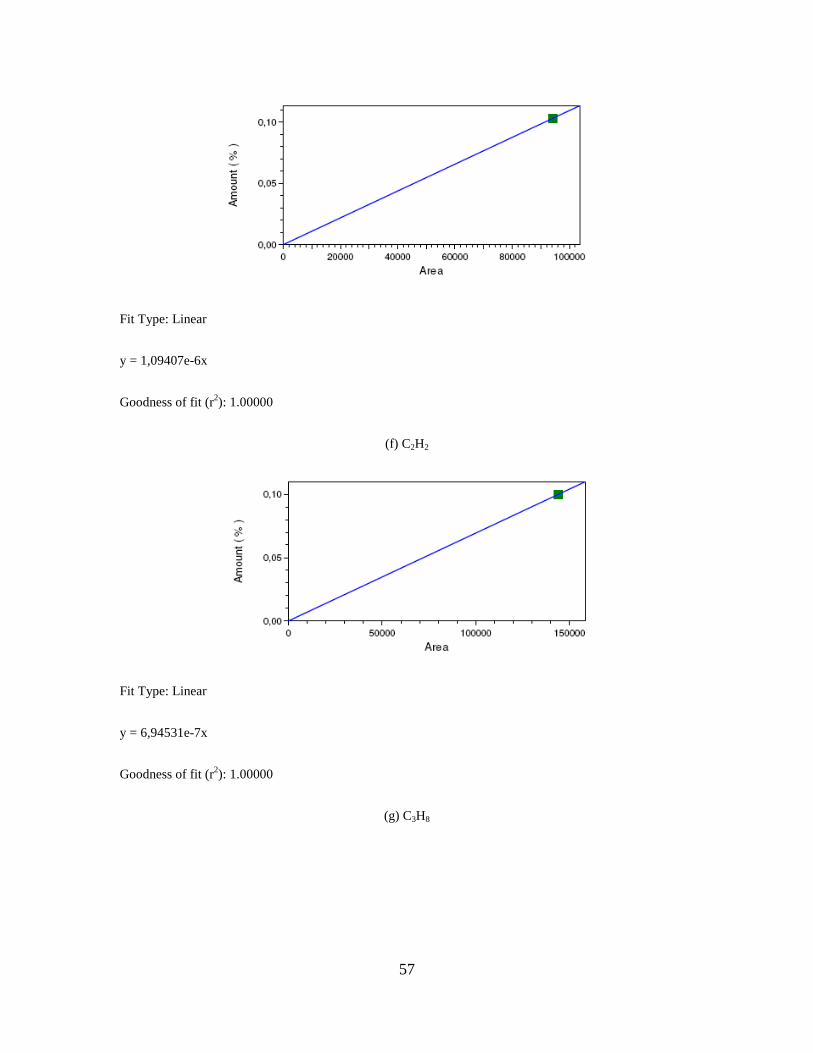
57
Fit Type: Linear
y = 1,09407e-6x
Goodness of fit (r2): 1.00000
(f) C2H2
Fit Type: Linear
y = 6,94531e-7x
Goodness of fit (r2): 1.00000
(g) C3H8
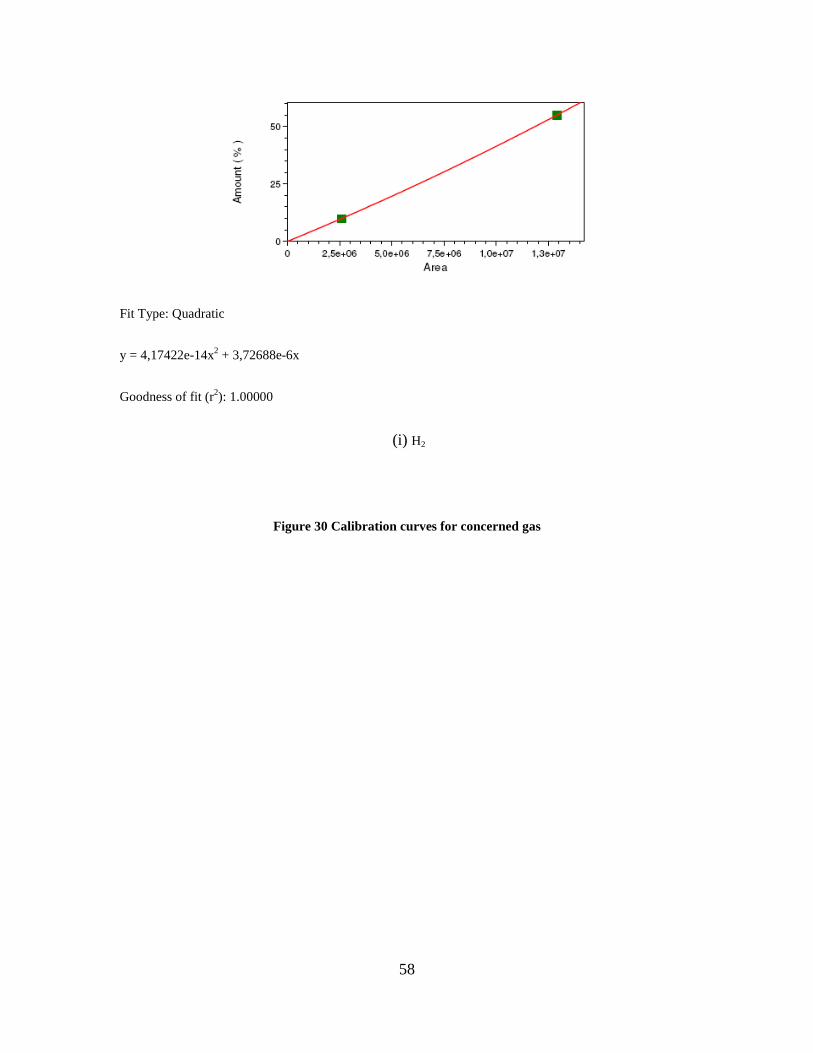
58
Fit Type: Quadratic
y = 4,17422e-14x2 + 3,72688e-6x
Goodness of fit (r2): 1.00000
(i) H2
Figure 30 Calibration curves for concerned gas
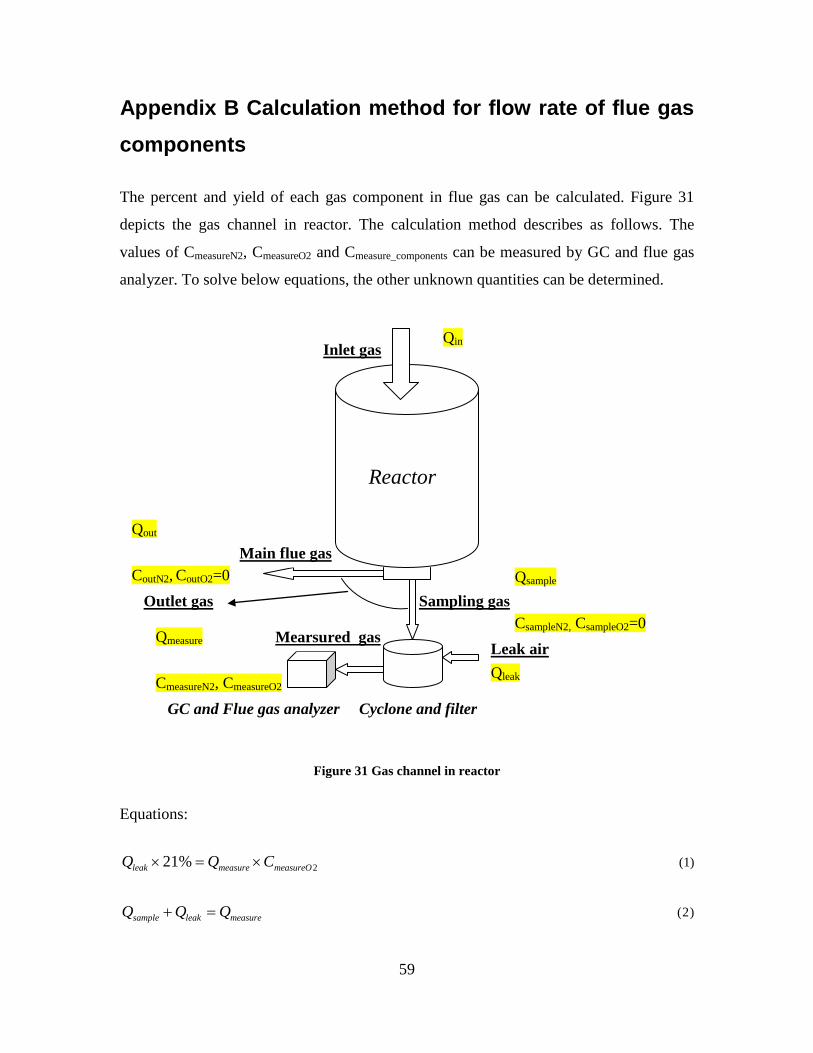
59
Appendix B Calculation method for flow rate of flue gas components
The percent and yield of each gas component in flue gas can be calculated. Figure 31
depicts the gas channel in reactor. The calculation method describes as follows. The
values of CmeasureN2, CmeasureO2 and Cmeasure_components can be measured by GC and flue gas
analyzer. To solve below equations, the other unknown quantities can be determined.
Figure 31 Gas channel in reactor
Equations:
221%leak measure measureOQ Q C× = × (1)
sample leak measureQ Q Q+ = (2)
Reactor
Qin
Qsample
CsampleN2, CsampleO2=0
Main flue gas
Sampling gas
GC and Flue gas analyzer Cyclone and filter
Qleak
Qmeasure
CmeasureN2, CmeasureO2
Qout
CoutN2, CoutO2=0
Inlet gas
Leak air
Outlet gas
Mearsured gas
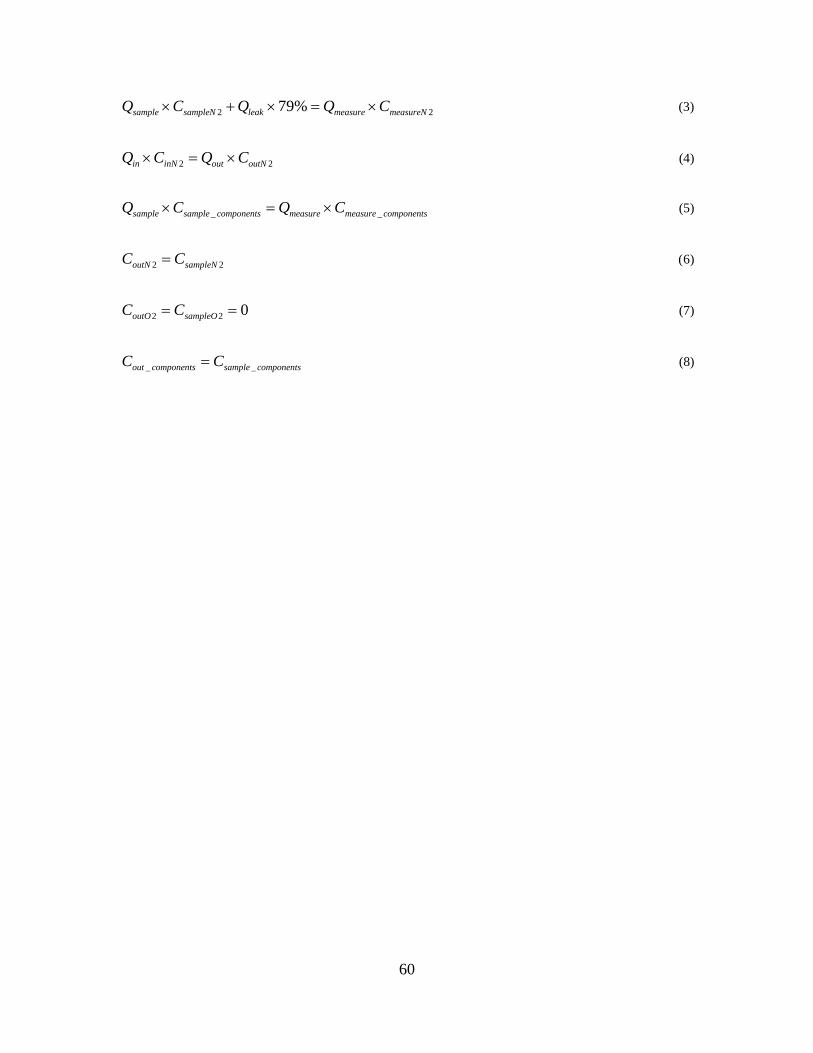
60
2 279%sample sampleN leak measure measureNQ C Q Q C× + × = × (3)
2 2in inN out outNQ C Q C× = × (4)
_ _sample sample components measure measure componentsQ C Q C× = × (5)
2 2outN sampleNC C= (6)
2 2 0outO sampleOC C= = (7)
_ _out components sample componentsC C= (8)
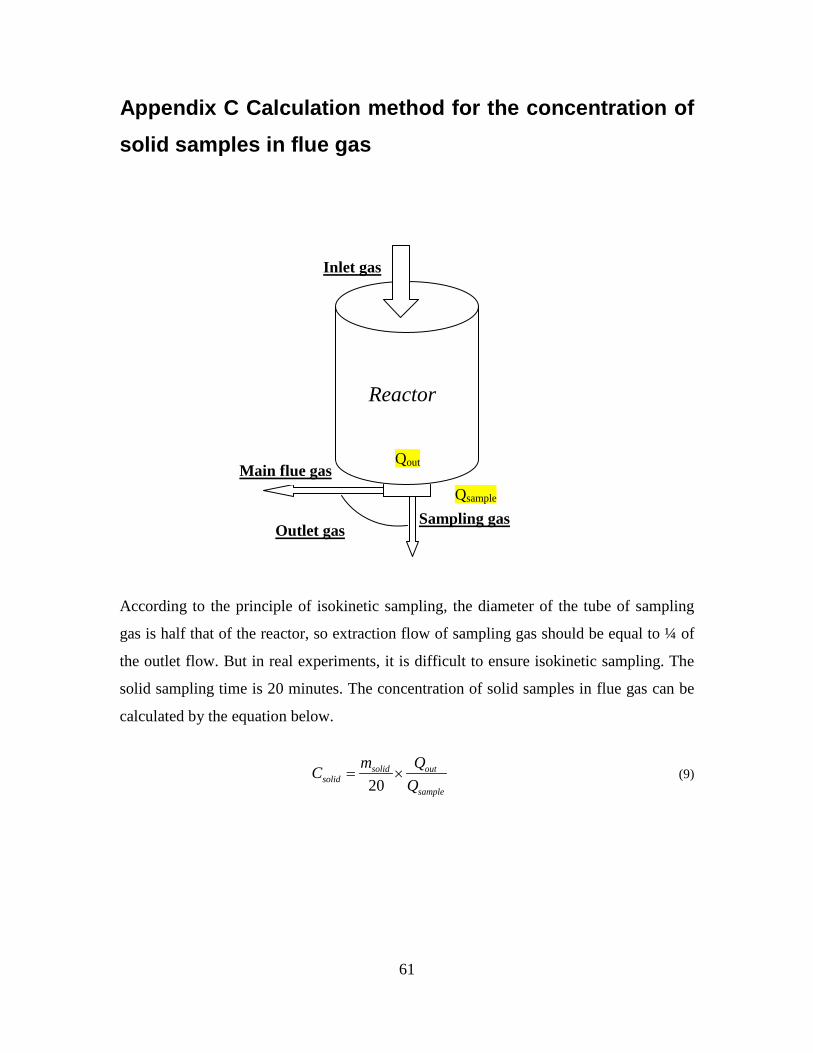
61
Appendix C Calculation method for the concentration of solid samples in flue gas
According to the principle of isokinetic sampling, the diameter of the tube of sampling
gas is half that of the reactor, so extraction flow of sampling gas should be equal to ¼ of
the outlet flow. But in real experiments, it is difficult to ensure isokinetic sampling. The
solid sampling time is 20 minutes. The concentration of solid samples in flue gas can be
calculated by the equation below.
20solid out
solidsample
m QCQ
= × (9)
Reactor
Qsample
Main flue gas
Sampling gas
Inlet gas
Outlet gas
Qout
62
References
[1] World Energy Outlook 2004
[2] Chum HL, Overend RP. Biomass and renewable fuels. Fuel Processing
Technology 71(2001): 187-195
[3] Joshi MM, Lee S. Integrated gasification combined cycle - a review of IGCC
technology. Energy Sources 18(1996): 537-568
[4] Stiegel GJ, Maxwell RC. Gasification technologies: the path to clean, affordable
energy in the 21st century. Fuel Processing Technology 71(2001): 79-97
[5] Higman C, van der Burgt M. Gasification. America, 2003
[6] Hamelinck CN, Faaij APC, den Uil H, Boerrigter H. Production of FT
transportation fuels from biomass; technical options, process analysis and
optimisation, and development potential. Energy 29(2004): 1743-1771
[7] Shen J, Schmetz E, Kawalkin GJ. Commercial deployment of Fischer-Tropsch
synthesis: the coproduction option. Topics in Catalysis 26(2003): 13-20
[8] Zwart RWR, Boerrigter H. High efficiency co-production of synthetic natural gas
(SNG) and Fischer-Tropsch (FT) transportation fuels from biomass. Energy &
Fuels 19(2005): 591-597
[9] Capablo J, Jensen PA, Pedersen KH, Hjuler K, Nikolaisen L, Backman R,
Frandsen F. Ash properties of alternative biomass. Energy & Fuels 23(2009):
1965-1976
[10] Pang KL, Xiang WG, Liang C, Zhao CS, Xi B, Liu DJ. Gasification reaction of
coal char with CO2 under the catalytic Action of alkali metals. Journal of power
engineering 26(2006): 141-144
[11] Wei XF, Huang JJ, Fang YT, Wang Y. Effect of alkali metal on the lignite
gasification reactivity. Coal conversion 30(2007): 38-42
[12] Schilling H, Bonn B, Krauss U. Coal gasification: Existing process and new
developments. London, 1981
[13] Wang ZH, Zhou JH, Wang QH, Fan JR, Cen KF. Thermodynamic equilibrium
analysis of hydrogen production by coal based on Coal/CaO/H2Ogasification
system. International Journal of Hydrogen Energy 31 (2006): 945 – 952
63
[14] Guan J, Wang QH, Li XM, Luo ZY, Cen KF. Thermodynamic analysis of a
biomass anaerobic gasification process for hydrogen production with sufficient
CaO. Renewable Energy 32 (2007): 2502–2515
[15] Crnomarkovic N, Repic B, Mladenovic R, Neskovic O, Veljkovic M.
Experimental investigation of role of steam in entrained flow coal gasification.
Fuel 86(2007):194-202
[16] Lapuerta M, Hernandez JJ, Pazo A. Gasification and co-gasification of biomass
wastes: effect of the biomass origin and the gasifier operating conditions. Fuel
processing technology 89(2008): 828-837
[17] Kim YJ, Lee JM, Kim SD. Coal gasification characteristics in an internally
circulating fluidized bed with draught tube. Fuel 76(1997): 1067-1073
[18] Lee JG, Kim JH, Lee HJ, Park TJ, Kim SD. Characteristics of entrained flow coal
gasification in a drop tube reactor. Fuel 75(1996): 1035-1042
[19] Na JI, Park SJ, Kim YK, Lee JG, Kim JH. Characteristics of oxygen-blown
gasification for combustible waste in a fixed-bed gasifier. Applied energy
75(2003): 275-285
[20] Gil J, Corella J, Aznar PA, Caballero AM. Biomass gasification in atmosphere
and bubbling fluidized bed: effect of the type of gasifying agent on the product
distribution. Biomass and bioenergy 17(1999): 389-403
[21] Indarto A. Soot growing mechanism from polyynes: a review. Environmental
engineering science 26(2009): 1-7
[22] Choi JH, Fujita O, Tsuiki T, Kim J, Chung SH. A study of the effect of oxygen
concentration on the soot deposition process in a diffusion flame along a solid
wall by in-situ observations in microgravity. JSME International journal 48(2005):
839-848
[23] Xie YR, Shen LH, Xiao J. Experimental research in biomass gasification and
reforming to produce hydrogen-rich gas. Journal of xi’an jiaotong university
42(2008): 634-638
[24] Kriengsak SN, Buczynski R, Gmurczyk J, Gupta AK. Hydrogen production by
high-temperature steam gasification of biomass and coal. Environmental
engineering science 26(2009): 739-744
64
[25] Lucas C, Szewczyk D, Blasiak W. High-temperature air and steam gasification of
densified biofuels. Biomass and bioenergy 27(2004): 563-575
[26] Wei LG, Xu SP, Zhang L, Liu CH, Zhu H, Liu SQ. Steam gasification of biomass
for hydrogen-rich gas in a free-fall reactor. International journal of hydrogen
energy 32(2007): 24-31
[27] Gil J, Corella J, Aznar PA, Caballero AM. Biomass gasification in atmosphere
and bubbling fluidized bed: effect of the type of gasifying agent on the product
distribution. Biomass and bioenergy 17(1999): 389-403
[28] Klose W, Wolki M. On the intrinsic reaction rate of biomass char gasification
with carbon dioxide and steam. Fuel 84(2005): 885-892
[29] Ahrenfeldt J, Henriksen U, Jensen TK, Gøbel B, Wiese L, Kather A, Egsgaard H.
Validation of continuous combined heat and power (CHP) operation of a two-
stage biomass gasifier. Energy & Fuels 20(2006): 2672-2680
[30] Hindsgaul G, Schramm J, Gratz L, Henriksen U, Bentzen JD. Physical and
chemical characterization of particles in producer gas from wood chips.
Bioresource technology 73(2000): 147-155
226
Appendix F. Influence of operating conditions on gas composition, soot and tar in entrained flow gasification of biomass
Conference paper Ke Qin, Weigang Lin, Peter Arendt Jensen, Anker Degn Jensen, Helge Egsgaard. Conference paper: Influence of operating conditions on gas composition, soot and tar in entrained flow gasification of biomass. International Conference on Polygeneration strategies, Vienna, September 2009.
1
2010, DTU no. 50442
Final report - EFP06 – Produktion af methanol/DME ud fra biomasse
Conference paper: Influence of operating conditions on gas composition, soot and tar in entrained flow gasification of
biomass. International Conference on Polygeneration strategies, Vienna, September 2009
Ke Qin*, Weigang Lin*, Peter Arendt Jensen*, Anker Degn Jensen*, Helge Egsgaard**
*) Department of Chemical and Biochemical Engineering Technical University of Denmark Søltofts Plads, Building 229, DK-2800 Lyngby, Denmark **Biosystems Department, Risø National Laboratory, Technical University of Denmark, Roskilde, 4000, Denmark
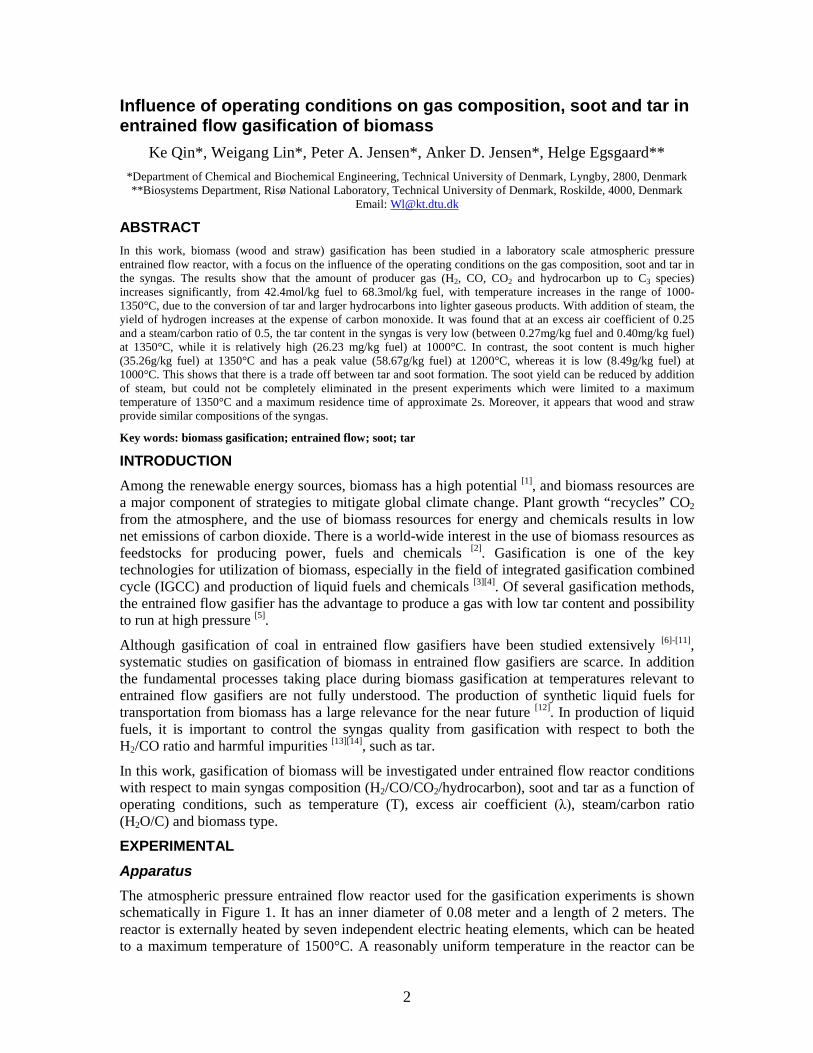
2
Influence of operating conditions on gas composition, soot and tar in entrained flow gasification of biomass
Ke Qin*, Weigang Lin*, Peter A. Jensen*, Anker D. Jensen*, Helge Egsgaard** *Department of Chemical and Biochemical Engineering, Technical University of Denmark, Lyngby, 2800, Denmark **Biosystems Department, Risø National Laboratory, Technical University of Denmark, Roskilde, 4000, Denmark
Email: [email protected]
ABSTRACT In this work, biomass (wood and straw) gasification has been studied in a laboratory scale atmospheric pressure entrained flow reactor, with a focus on the influence of the operating conditions on the gas composition, soot and tar in the syngas. The results show that the amount of producer gas (H2, CO, CO2 and hydrocarbon up to C3 species) increases significantly, from 42.4mol/kg fuel to 68.3mol/kg fuel, with temperature increases in the range of 1000-1350°C, due to the conversion of tar and larger hydrocarbons into lighter gaseous products. With addition of steam, the yield of hydrogen increases at the expense of carbon monoxide. It was found that at an excess air coefficient of 0.25 and a steam/carbon ratio of 0.5, the tar content in the syngas is very low (between 0.27mg/kg fuel and 0.40mg/kg fuel) at 1350°C, while it is relatively high (26.23 mg/kg fuel) at 1000°C. In contrast, the soot content is much higher (35.26g/kg fuel) at 1350°C and has a peak value (58.67g/kg fuel) at 1200°C, whereas it is low (8.49g/kg fuel) at 1000°C. This shows that there is a trade off between tar and soot formation. The soot yield can be reduced by addition of steam, but could not be completely eliminated in the present experiments which were limited to a maximum temperature of 1350°C and a maximum residence time of approximate 2s. Moreover, it appears that wood and straw provide similar compositions of the syngas.
Key words: biomass gasification; entrained flow; soot; tar
INTRODUCTION Among the renewable energy sources, biomass has a high potential [1], and biomass resources are a major component of strategies to mitigate global climate change. Plant growth “recycles” CO2 from the atmosphere, and the use of biomass resources for energy and chemicals results in low net emissions of carbon dioxide. There is a world-wide interest in the use of biomass resources as feedstocks for producing power, fuels and chemicals [2]. Gasification is one of the key technologies for utilization of biomass, especially in the field of integrated gasification combined cycle (IGCC) and production of liquid fuels and chemicals [3][4]. Of several gasification methods, the entrained flow gasifier has the advantage to produce a gas with low tar content and possibility to run at high pressure [5].
Although gasification of coal in entrained flow gasifiers have been studied extensively [6]-[11], systematic studies on gasification of biomass in entrained flow gasifiers are scarce. In addition the fundamental processes taking place during biomass gasification at temperatures relevant to entrained flow gasifiers are not fully understood. The production of synthetic liquid fuels for transportation from biomass has a large relevance for the near future [12]. In production of liquid fuels, it is important to control the syngas quality from gasification with respect to both the H2/CO ratio and harmful impurities [13][14], such as tar.
In this work, gasification of biomass will be investigated under entrained flow reactor conditions with respect to main syngas composition (H2/CO/CO2/hydrocarbon), soot and tar as a function of operating conditions, such as temperature (T), excess air coefficient (λ), steam/carbon ratio (H2O/C) and biomass type.
EXPERIMENTAL Apparatus The atmospheric pressure entrained flow reactor used for the gasification experiments is shown schematically in Figure 1. It has an inner diameter of 0.08 meter and a length of 2 meters. The reactor is externally heated by seven independent electric heating elements, which can be heated to a maximum temperature of 1500°C. A reasonably uniform temperature in the reactor can be
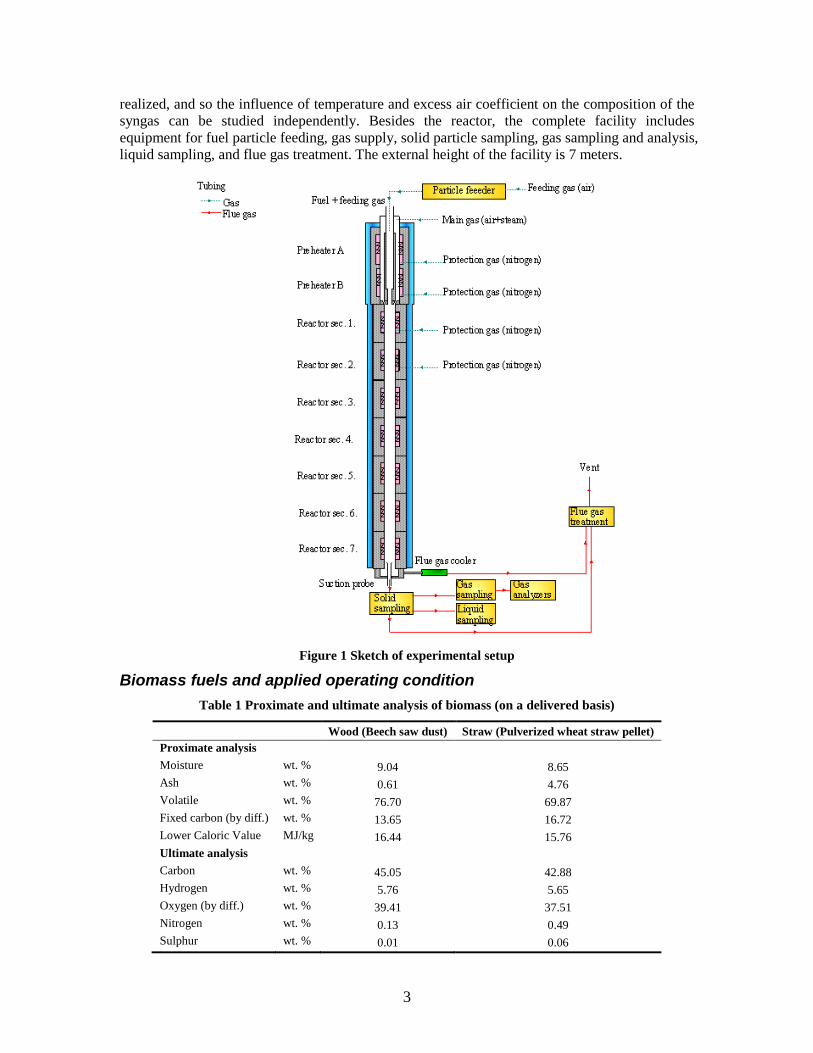
3
realized, and so the influence of temperature and excess air coefficient on the composition of the syngas can be studied independently. Besides the reactor, the complete facility includes equipment for fuel particle feeding, gas supply, solid particle sampling, gas sampling and analysis, liquid sampling, and flue gas treatment. The external height of the facility is 7 meters.
Figure 1 Sketch of experimental setup
Biomass fuels and applied operating condition Table 1 Proximate and ultimate analysis of biomass (on a delivered basis)
Wood (Beech saw dust) Straw (Pulverized wheat straw pellet) Proximate analysis Moisture wt. % 9.04 8.65 Ash wt. % 0.61 4.76 Volatile wt. % 76.70 69.87 Fixed carbon (by diff.) wt. % 13.65 16.72 Lower Caloric Value MJ/kg 16.44 15.76 Ultimate analysis Carbon wt. % 45.05 42.88 Hydrogen wt. % 5.76 5.65 Oxygen (by diff.) wt. % 39.41 37.51 Nitrogen wt. % 0.13 0.49 Sulphur wt. % 0.01 0.06
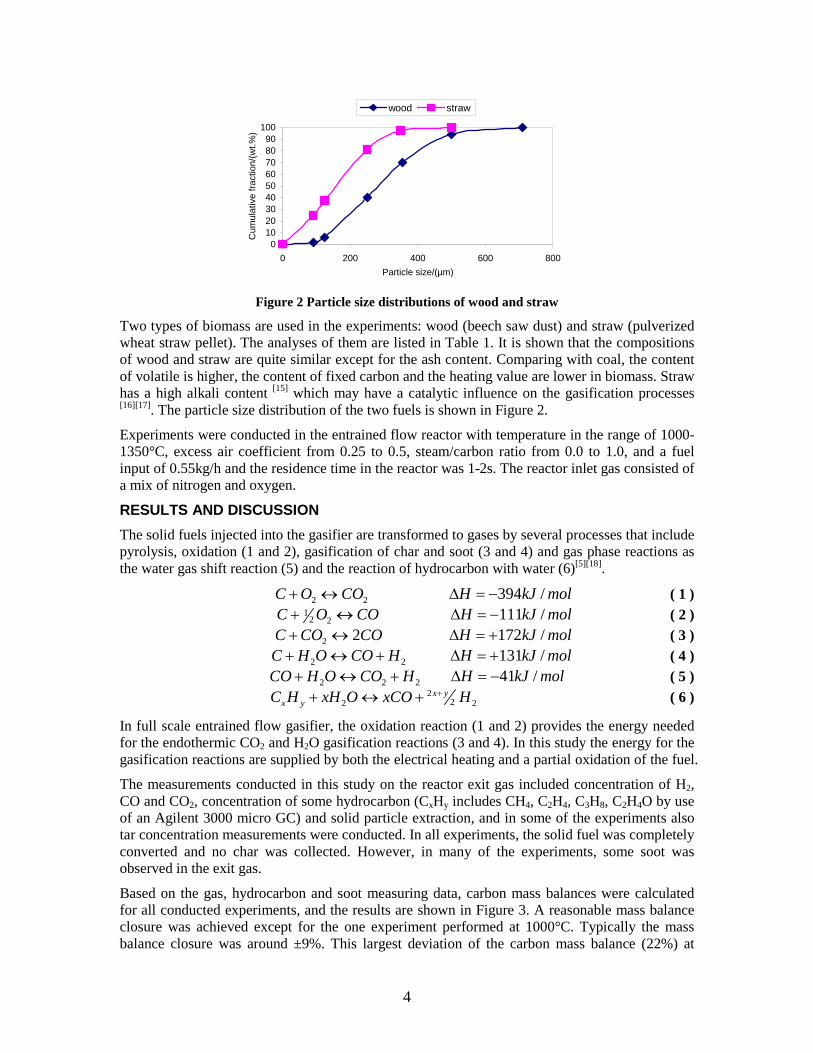
4
0102030405060708090
100
0 200 400 600 800Particle size/(µm)
Cum
ulat
ive
fract
ion/
(wt.%
)
wood straw
Figure 2 Particle size distributions of wood and straw
Two types of biomass are used in the experiments: wood (beech saw dust) and straw (pulverized wheat straw pellet). The analyses of them are listed in Table 1. It is shown that the compositions of wood and straw are quite similar except for the ash content. Comparing with coal, the content of volatile is higher, the content of fixed carbon and the heating value are lower in biomass. Straw has a high alkali content [15] which may have a catalytic influence on the gasification processes [16][17]. The particle size distribution of the two fuels is shown in Figure 2.
Experiments were conducted in the entrained flow reactor with temperature in the range of 1000-1350°C, excess air coefficient from 0.25 to 0.5, steam/carbon ratio from 0.0 to 1.0, and a fuel input of 0.55kg/h and the residence time in the reactor was 1-2s. The reactor inlet gas consisted of a mix of nitrogen and oxygen.
RESULTS AND DISCUSSION The solid fuels injected into the gasifier are transformed to gases by several processes that include pyrolysis, oxidation (1 and 2), gasification of char and soot (3 and 4) and gas phase reactions as the water gas shift reaction (5) and the reaction of hydrocarbon with water (6)[5][18].
2 2C O CO+ ↔ 394 /H kJ mol∆ = − ( 1 ) 1
2 2C O CO+ ↔ 111 /H kJ mol∆ = − ( 2 )
2 2C CO CO+ ↔ 172 /H kJ mol∆ = + ( 3 )
2 2C H O CO H+ ↔ + 131 /H kJ mol∆ = + ( 4 )
2 2 2CO H O CO H+ ↔ + 41 /H kJ mol∆ = − ( 5 ) 2
22 2x y
x yC H xH O xCO H++ ↔ + ( 6 )
In full scale entrained flow gasifier, the oxidation reaction (1 and 2) provides the energy needed for the endothermic CO2 and H2O gasification reactions (3 and 4). In this study the energy for the gasification reactions are supplied by both the electrical heating and a partial oxidation of the fuel.
The measurements conducted in this study on the reactor exit gas included concentration of H2, CO and CO2, concentration of some hydrocarbon (CxHy includes CH4, C2H4, C3H8, C2H4O by use of an Agilent 3000 micro GC) and solid particle extraction, and in some of the experiments also tar concentration measurements were conducted. In all experiments, the solid fuel was completely converted and no char was collected. However, in many of the experiments, some soot was observed in the exit gas.
Based on the gas, hydrocarbon and soot measuring data, carbon mass balances were calculated for all conducted experiments, and the results are shown in Figure 3. A reasonable mass balance closure was achieved except for the one experiment performed at 1000°C. Typically the mass balance closure was around ±9%. This largest deviation of the carbon mass balance (22%) at
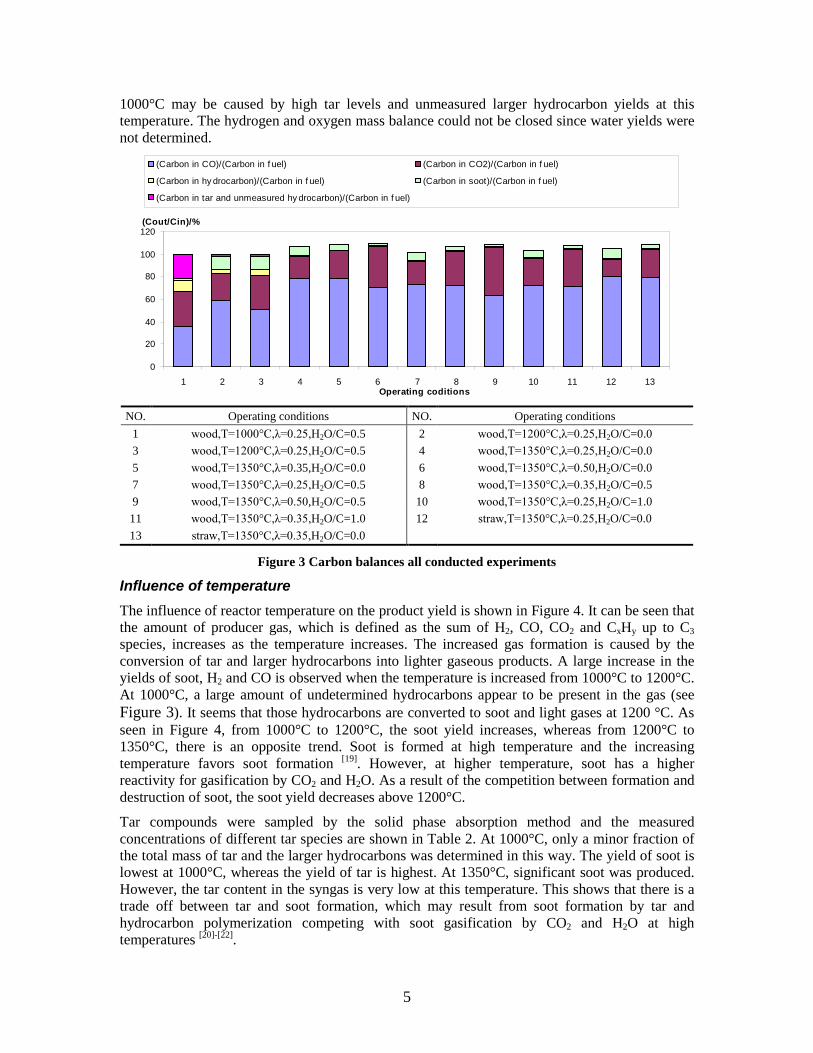
5
1000°C may be caused by high tar levels and unmeasured larger hydrocarbon yields at this temperature. The hydrogen and oxygen mass balance could not be closed since water yields were not determined.
0
20
40
60
80
100
120
1 2 3 4 5 6 7 8 9 10 11 12 13Operating coditions
(Cout/Cin)/%
(Carbon in CO)/(Carbon in f uel) (Carbon in CO2)/(Carbon in f uel)
(Carbon in hy drocarbon)/(Carbon in f uel) (Carbon in soot)/(Carbon in f uel)
(Carbon in tar and unmeasured hy drocarbon)/(Carbon in f uel)
NO. Operating conditions NO. Operating conditions
1 wood,T=1000°C,λ=0.25,H2O/C=0.5 2 wood,T=1200°C,λ=0.25,H2O/C=0.0 3 wood,T=1200°C,λ=0.25,H2O/C=0.5 4 wood,T=1350°C,λ=0.25,H2O/C=0.0 5 wood,T=1350°C,λ=0.35,H2O/C=0.0 6 wood,T=1350°C,λ=0.50,H2O/C=0.0 7 wood,T=1350°C,λ=0.25,H2O/C=0.5 8 wood,T=1350°C,λ=0.35,H2O/C=0.5 9 wood,T=1350°C,λ=0.50,H2O/C=0.5 10 wood,T=1350°C,λ=0.25,H2O/C=1.0 11 wood,T=1350°C,λ=0.35,H2O/C=1.0 12 straw,T=1350°C,λ=0.25,H2O/C=0.0 13 straw,T=1350°C,λ=0.35,H2O/C=0.0
Figure 3 Carbon balances all conducted experiments
Influence of temperature The influence of reactor temperature on the product yield is shown in Figure 4. It can be seen that the amount of producer gas, which is defined as the sum of H2, CO, CO2 and CxHy up to C3 species, increases as the temperature increases. The increased gas formation is caused by the conversion of tar and larger hydrocarbons into lighter gaseous products. A large increase in the yields of soot, H2 and CO is observed when the temperature is increased from 1000°C to 1200°C. At 1000°C, a large amount of undetermined hydrocarbons appear to be present in the gas (see Figure 3). It seems that those hydrocarbons are converted to soot and light gases at 1200 °C. As seen in Figure 4, from 1000°C to 1200°C, the soot yield increases, whereas from 1200°C to 1350°C, there is an opposite trend. Soot is formed at high temperature and the increasing temperature favors soot formation [19]. However, at higher temperature, soot has a higher reactivity for gasification by CO2 and H2O. As a result of the competition between formation and destruction of soot, the soot yield decreases above 1200°C.
Tar compounds were sampled by the solid phase absorption method and the measured concentrations of different tar species are shown in Table 2. At 1000°C, only a minor fraction of the total mass of tar and the larger hydrocarbons was determined in this way. The yield of soot is lowest at 1000°C, whereas the yield of tar is highest. At 1350°C, significant soot was produced. However, the tar content in the syngas is very low at this temperature. This shows that there is a trade off between tar and soot formation, which may result from soot formation by tar and hydrocarbon polymerization competing with soot gasification by CO2 and H2O at high temperatures [20]-[22].
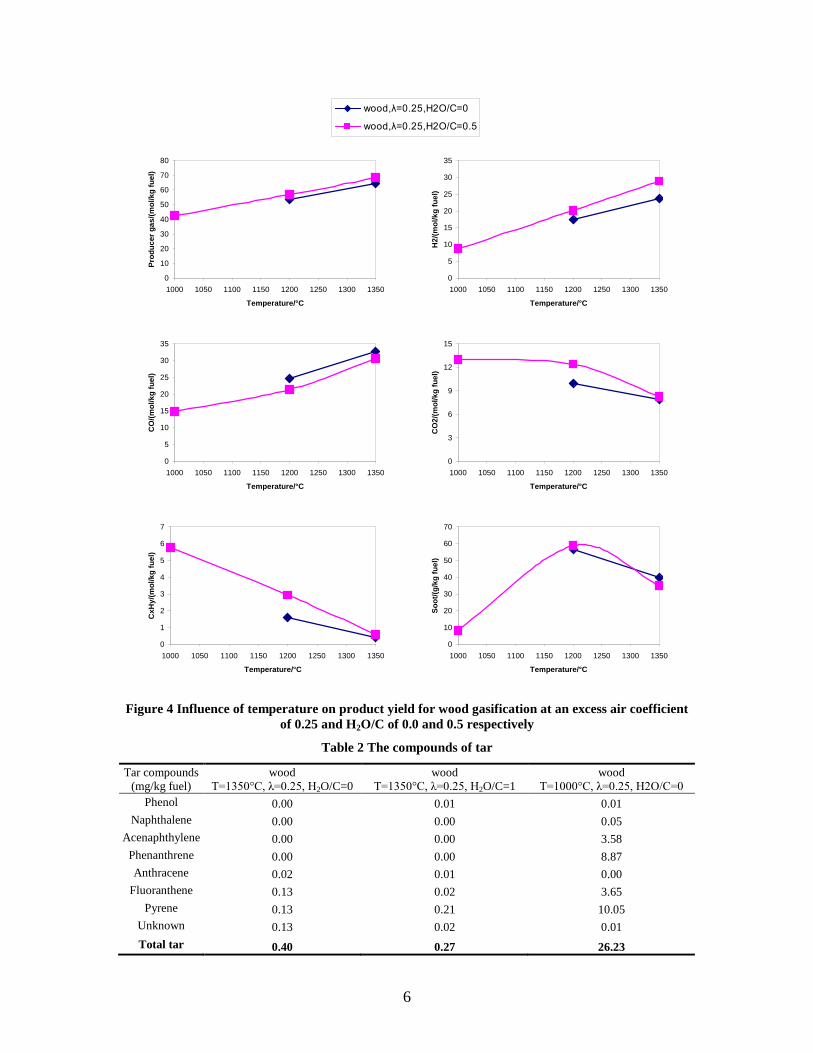
6
wood,λ=0.25,H2O/C=0
wood,λ=0.25,H2O/C=0.5
0
10
20
30
40
50
60
70
80
1000 1050 1100 1150 1200 1250 1300 1350
Temperature/°C
Prod
ucer
gas
/(mol
/kg
fuel
)
0
5
10
15
20
25
30
35
1000 1050 1100 1150 1200 1250 1300 1350
Temperature/°C
H2/
(mol
/kg
fuel
)
0
5
10
15
20
25
30
35
1000 1050 1100 1150 1200 1250 1300 1350
Temperature/°C
CO
/(mol
/kg
fuel
)
0
3
6
9
12
15
1000 1050 1100 1150 1200 1250 1300 1350
Temperature/°C
CO
2/(m
ol/k
g fu
el)
0
1
2
3
4
5
6
7
1000 1050 1100 1150 1200 1250 1300 1350
Temperature/°C
CxH
y/(m
ol/k
g fu
el)
0
10
20
30
40
50
60
70
1000 1050 1100 1150 1200 1250 1300 1350
Temperature/°C
Soot
/(g/k
g fu
el)
Figure 4 Influence of temperature on product yield for wood gasification at an excess air coefficient
of 0.25 and H2O/C of 0.0 and 0.5 respectively
Table 2 The compounds of tar
Tar compounds (mg/kg fuel)
wood T=1350°C, λ=0.25, H2O/C=0
wood T=1350°C, λ=0.25, H2O/C=1
wood T=1000°C, λ=0.25, H2O/C=0
Phenol 0.00 0.01 0.01 Naphthalene 0.00 0.00 0.05
Acenaphthylene 0.00 0.00 3.58 Phenanthrene 0.00 0.00 8.87 Anthracene 0.02 0.01 0.00
Fluoranthene 0.13 0.02 3.65 Pyrene 0.13 0.21 10.05
Unknown 0.13 0.02 0.01 Total tar 0.40 0.27 26.23
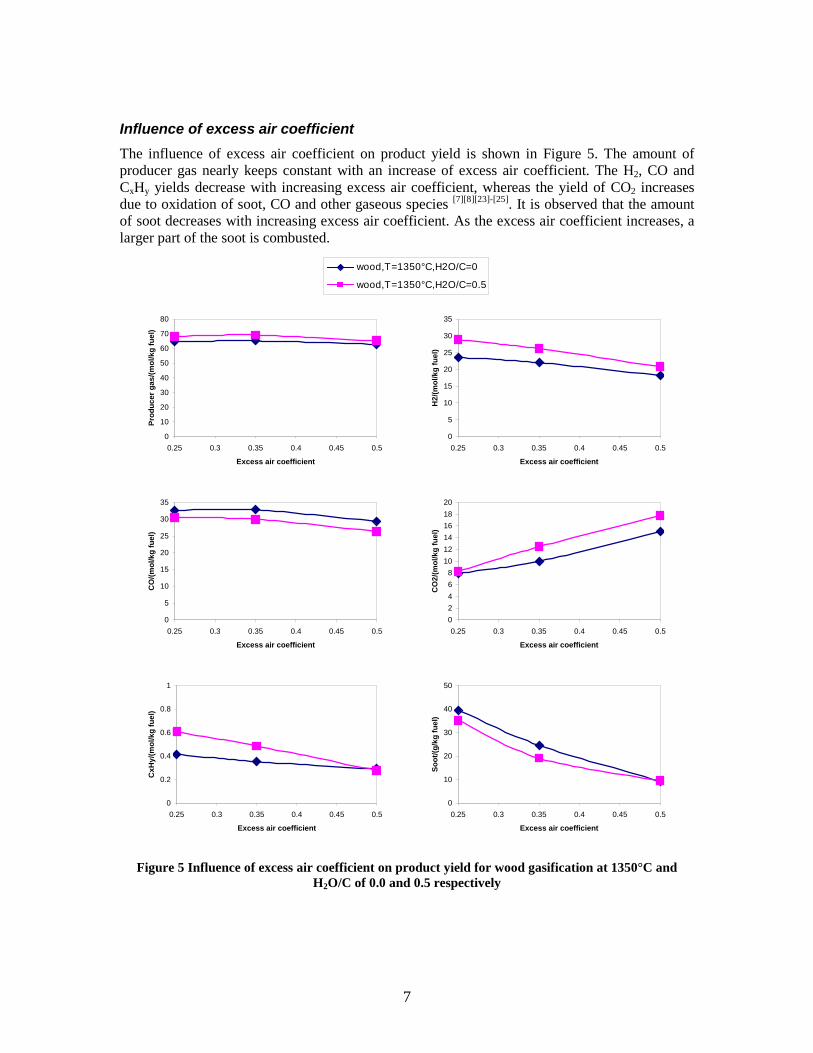
7
Influence of excess air coefficient The influence of excess air coefficient on product yield is shown in Figure 5. The amount of producer gas nearly keeps constant with an increase of excess air coefficient. The H2, CO and CxHy yields decrease with increasing excess air coefficient, whereas the yield of CO2 increases due to oxidation of soot, CO and other gaseous species [7][8][23]-[25]. It is observed that the amount of soot decreases with increasing excess air coefficient. As the excess air coefficient increases, a larger part of the soot is combusted.
wood,T=1350°C,H2O/C=0
wood,T=1350°C,H2O/C=0.5
0
10
20
30
40
50
60
70
80
0.25 0.3 0.35 0.4 0.45 0.5
Excess air coefficient
Prod
ucer
gas
/(mol
/kg
fuel
)
0
5
10
15
20
25
30
35
0.25 0.3 0.35 0.4 0.45 0.5
Excess air coefficient
H2/
(mol
/kg
fuel
)
0
5
10
15
20
25
30
35
0.25 0.3 0.35 0.4 0.45 0.5
Excess air coefficient
CO
/(mol
/kg
fuel
)
02468
101214161820
0.25 0.3 0.35 0.4 0.45 0.5
Excess air coefficient
CO
2/(m
ol/k
g fu
el)
0
0.2
0.4
0.6
0.8
1
0.25 0.3 0.35 0.4 0.45 0.5
Excess air coefficient
CxH
y/(m
ol/k
g fu
el)
0
10
20
30
40
50
0.25 0.3 0.35 0.4 0.45 0.5
Excess air coefficient
Soot
/(g/k
g fu
el)
Figure 5 Influence of excess air coefficient on product yield for wood gasification at 1350°C and
H2O/C of 0.0 and 0.5 respectively
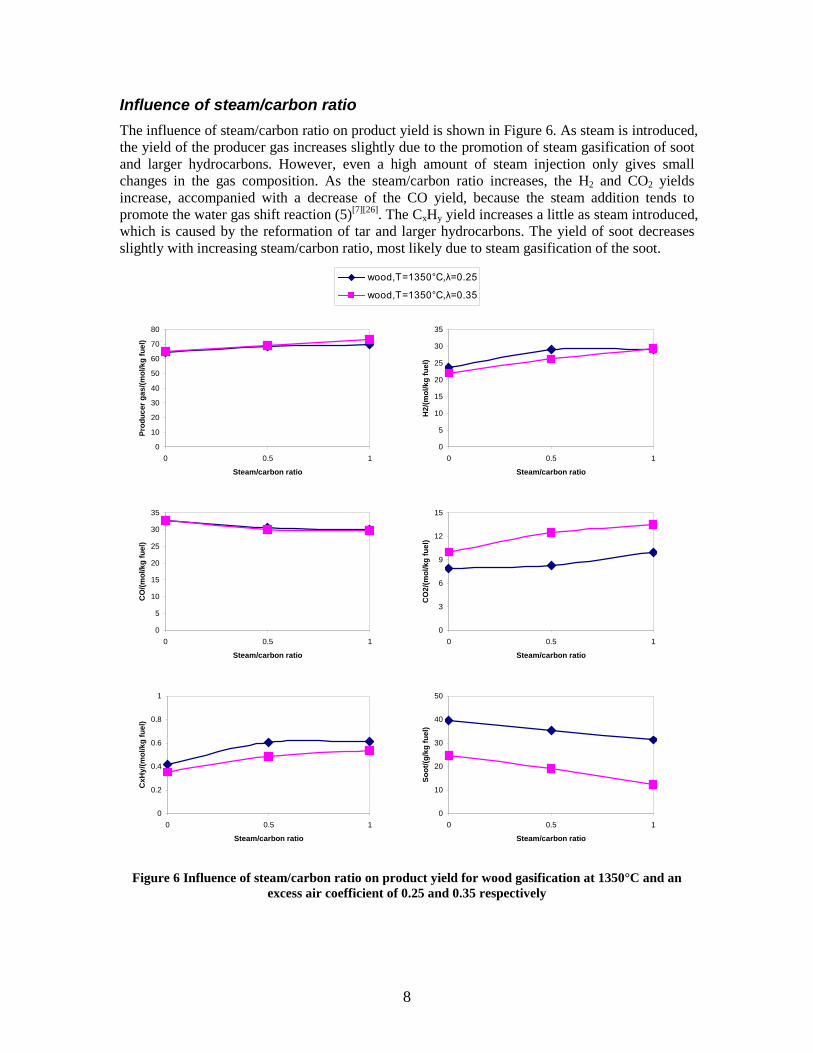
8
Influence of steam/carbon ratio The influence of steam/carbon ratio on product yield is shown in Figure 6. As steam is introduced, the yield of the producer gas increases slightly due to the promotion of steam gasification of soot and larger hydrocarbons. However, even a high amount of steam injection only gives small changes in the gas composition. As the steam/carbon ratio increases, the H2 and CO2 yields increase, accompanied with a decrease of the CO yield, because the steam addition tends to promote the water gas shift reaction (5)[7][26]. The CxHy yield increases a little as steam introduced, which is caused by the reformation of tar and larger hydrocarbons. The yield of soot decreases slightly with increasing steam/carbon ratio, most likely due to steam gasification of the soot.
wood,T=1350°C,λ=0.25
wood,T=1350°C,λ=0.35
0
10
20
30
40
50
60
70
80
0 0.5 1
Steam/carbon ratio
Prod
ucer
gas
/(mol
/kg
fuel
)
0
5
10
15
20
25
30
35
0 0.5 1
Steam/carbon ratio
H2/
(mol
/kg
fuel
)
0
5
10
15
20
25
30
35
0 0.5 1
Steam/carbon ratio
CO
/(mol
/kg
fuel
)
0
3
6
9
12
15
0 0.5 1
Steam/carbon ratio
CO
2/(m
ol/k
g fu
el)
0
0.2
0.4
0.6
0.8
1
0 0.5 1
Steam/carbon ratio
CxH
y/(m
ol/k
g fu
el)
0
10
20
30
40
50
0 0.5 1
Steam/carbon ratio
Soot
/(g/k
g fu
el)
Figure 6 Influence of steam/carbon ratio on product yield for wood gasification at 1350°C and an
excess air coefficient of 0.25 and 0.35 respectively
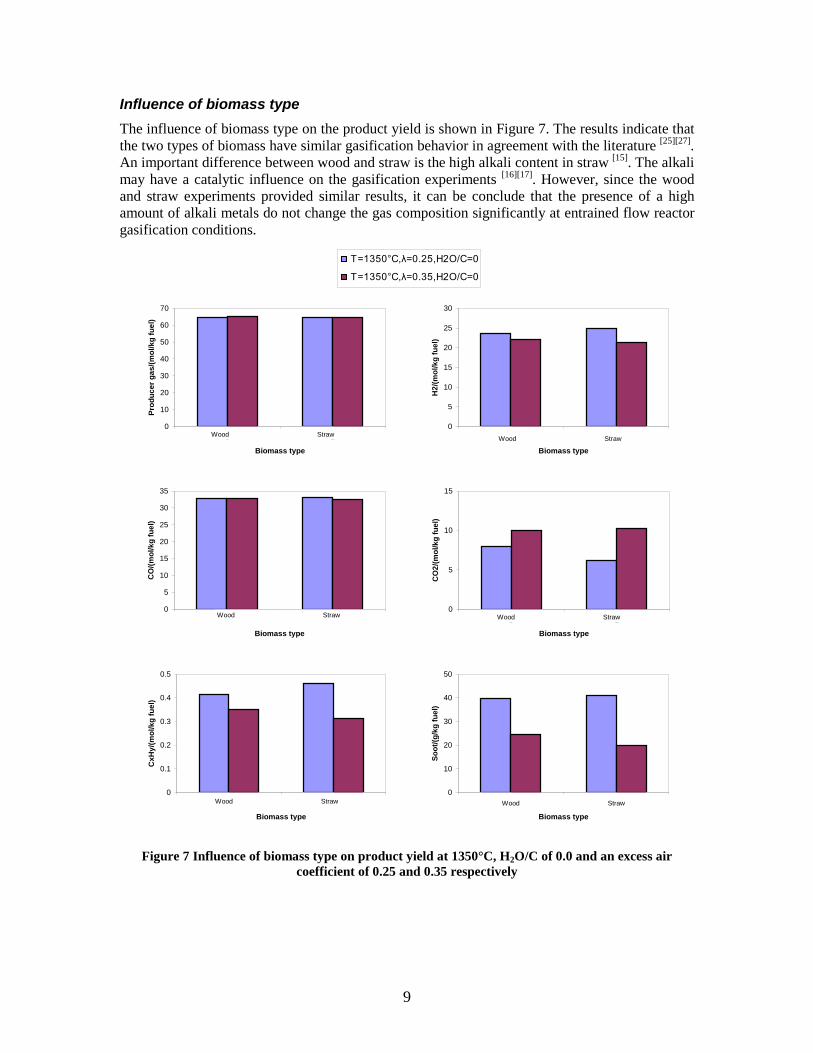
9
Influence of biomass type The influence of biomass type on the product yield is shown in Figure 7. The results indicate that the two types of biomass have similar gasification behavior in agreement with the literature [25][27]. An important difference between wood and straw is the high alkali content in straw [15]. The alkali may have a catalytic influence on the gasification experiments [16][17]. However, since the wood and straw experiments provided similar results, it can be conclude that the presence of a high amount of alkali metals do not change the gas composition significantly at entrained flow reactor gasification conditions.
T=1350°C,λ=0.25,H2O/C=0
T=1350°C,λ=0.35,H2O/C=0
0
10
20
30
40
50
60
70
0 1
Biomass type
Prod
ucer
gas
/(mol
/kg
fuel
)
Wood Straw
0
5
10
15
20
25
30
0 1
Biomass type
H2/
(mol
/kg
fuel
)Wood Straw
0
5
10
15
20
25
30
35
0 1
Biomass type
CO
/(mol
/kg
fuel
)
Wood Straw
0
5
10
15
0 1
Biomass type
CO
2/(m
ol/k
g fu
el)
Wood Straw
0
0.1
0.2
0.3
0.4
0.5
0 1
Biomass type
CxH
y/(m
ol/k
g fu
el)
Wood Straw
0
10
20
30
40
50
0 1
Biomass type
Soot
/(g/k
g fu
el)
Wood Straw
Figure 7 Influence of biomass type on product yield at 1350°C, H2O/C of 0.0 and an excess air
coefficient of 0.25 and 0.35 respectively
10
CONCLUSIONS Gasification of two types of biomass, wood and straw, has been investigated in a laboratory scale atmospheric pressure entrained flow reactor. In all experiments, the char was completely converted. The amount of producer gas (defined as H2, CO, CO2 and hydrocarbon up to C3 species) increases significantly, from 42.4mol/kg fuel to 68.3mol/kg fuel, when the temperature is increased from 1000°C to 1350°C. This is caused by the conversion of tar and larger hydrocarbons into lighter gaseous. The yields of hydrogen and carbon monoxide increase as the temperature is increased. It was found that at an excess air coefficient of 0.25 and a steam/carbon ratio of 0.5, the tar content in the syngas is very low (between 0.27mg/kg fuel and 0.40mg/kg fuel) at 1350°C. However, a significant level of soot (35.26g/kg fuel) was produced at this temperature. At 1000°C, the yield of tar is highest (26.23mg/kg fuel), whereas the yield of soot is lowest (8.49g/kg fuel). This trade off between tar and soot formation may result from the competition between soot formation by tar and hydrocarbon polymerization and soot oxidation at high temperatures. The yields of hydrogen and carbon monoxide decrease with increasing excess air coefficient. With addition of steam, the hydrogen yield increases while the carbon monoxide yield decreases due to the water gas shift reaction. The soot yield can be slightly reduced by addition of steam. The applied biomass type has little influence on the composition of the syngas.
REFERENCES
[1] World Energy Outlook 2004 [2] Chum HL, Overend RP. Biomass and renewable fuels. Fuel Processing Technology 71(2001): 187-195 [3] Joshi MM, Lee S. Integrated gasification combined cycle - a review of IGCC technology. Energy Sources
18(1996): 537-568 [4] Stiegel GJ, Maxwell RC. Gasification technologies: the path to clean, affordable energy in the 21st century. Fuel
Processing Technology 71(2001): 79-97 [5] Higman C, van der Burgt M. Gasification. America, 2003 [6] Guo XL, Dai ZH, Gong X, Chen XL, Liu HF, Wang FC, Yu ZH. Performance of an entrained-flow gasification
technology of pulverized coal in pilot-scale plant. Fuel processing technology 88(2007): 451-459 [7] Lee JG, Kim JH, Lee HJ, Park TJ, Kim SD. Characteristics of entrained flow coal gasification in a drop tube
reactor. Fuel 75(1996): 1035-1042 [8] Crnomarkovic N, Repic B, Mladenovic R, Neskovic O, Veljkovic M. Experimental investigation of role of
steam in entrained flow coal gasification. Fuel 86(2007): 194-202 [9] Brown BW, Smoot LD, Hedman PO. Effect of coal type on entrained gasification. Fuel 65(1986): 673-678 [10] Azuhata S, Hedman PO, Smoot LD, Sowa WA, Effects of flame type and pressure on entrained coal gasification.
Fuel 65(1986): 1511-1515 [11] Harris DJ, Roberts DG, Henderson DG. Gasification behavior of Australian coals at high temperature and
pressure. Fuel 85(2006): 134-142 [12] Hamelinck CN, Faaij APC, den Uil H, Boerrigter H. Production of FT transportation fuels from biomass;
technical options, process analysis and optimisation, and development potential. Energy 29(2004): 1743-1771 [13] Shen J, Schmetz E, Kawalkin GJ. Commercial deployment of Fischer-Tropsch synthesis: the coproduction
option. Topics in Catalysis 26(2003): 13-20 [14] Zwart RWR, Boerrigter H. High efficiency co-production of synthetic natural gas (SNG) and Fischer-Tropsch
(FT) transportation fuels from biomass. Energy & Fuels 19(2005): 591-597 [15] Capablo J, Jensen PA, Pedersen KH, Hjuler K, Nikolaisen L, Backman R, Frandsen F. Ash properties of
alternative biomass. Energy & Fuels 23(2009): 1965-1976 [16] Pang KL, Xiang WG, Liang C, Zhao CS, Xi B, Liu DJ. Gasification reaction of coal char with CO2 under the
catalytic Action of alkali metals. Journal of power engineering 26(2006): 141-144 [17] Wei XF, Huang JJ, Fang YT, Wang Y. Effect of alkali metal on the lignite gasification reactivity. Coal
conversion 30(2007): 38-42 [18] Schilling H, Bonn B, Krauss U. Coal gasification: Existing process and new developments. London, 1981 [19] Indarto A. Soot growing mechanism from polyynes: a review. Environmental engineering science 26(2009): 1-7
11
[20] Kriengsak SN, Buczynski R, Gmurczyk J, Gupta AK. Hydrogen production by high-temperature steam gasification of biomass and coal. Environmental engineering science 26(2009): 739-744
[21] Lucas C, Szewczyk D, Blasiak W. High-temperature air and steam gasification of densified biofuels. Biomass and bioenergy 27(2004): 563-575
[22] Wei LG, Xu SP, Zhang L, Liu CH, Zhu H, Liu SQ. Steam gasification of biomass for hydrogen-rich gas in a free-fall reactor. International journal of hydrogen energy 32(2007): 24-31
[23] Kim YJ, Lee JM, Kim SD. Coal gasification characteristics in an internally circulating fluidized bed with draught tube. Fuel 76(1997): 1067-1073
[24] Na JI, Park SJ, Kim YK, Lee JG, Kim JH. Characteristics of oxygen-blown gasification for combustible waste in a fixed-bed gasifier. Applied energy 75(2003): 275-285
[25] Lapuerta M, Hernandez JJ, Pazo A. {{49 Kim, Y.J. 1997; 27 Lapuerta, M. 2008; 19 Crnomarkovic, N. 2007; 18 Lee, J.G. 1996}}Gasification and co-gasification of biomass wastes: effect of the biomass origin and the gasifier operating conditions. Fuel processing technology 89(2008): 828-837
[26] Gil J, Corella J, Aznar PA, Caballero AM. Biomass gasification in atmosphere and bubbling fluidized bed: effect of the type of gasifying agent on the product distribution. Biomass and bioenergy 17(1999): 389-403
[27] Lu YJ, Ji CM, Guo LJ. Experimental investigation on hydrogen production by agricultural biomass gasification in supercritical water. Journal of xi’an jiaotong university 39(2005): 238-242
238
Appendix G. Synthesis of liquid fuels from biomass in a Danish context
Report Jakob Munkholt Christensen, Anker Degn Jensen, Peter Arendt Jensen. Report: synthesis of liquid fuels from biomass in a Danish context (Syntese af væskeformige brændsler fra biomasse i en dansk kontekst). (in danish)
2009, DTU no. 50442
Final report - EFP06 – Produktion af methanol/DME ud fra biomasse
Rapport: Syntese af væskeformige brændsler fra biomasse i en
dansk kontekst
Jakob Munkholt Christensen, Anker Degn Jensen, Peter Arendt Jensen
Department of Chemical and Biochemical Engineering Technical University of Denmark Søltofts Plads, Building 229, DK-2800 Lyngby, Denmark
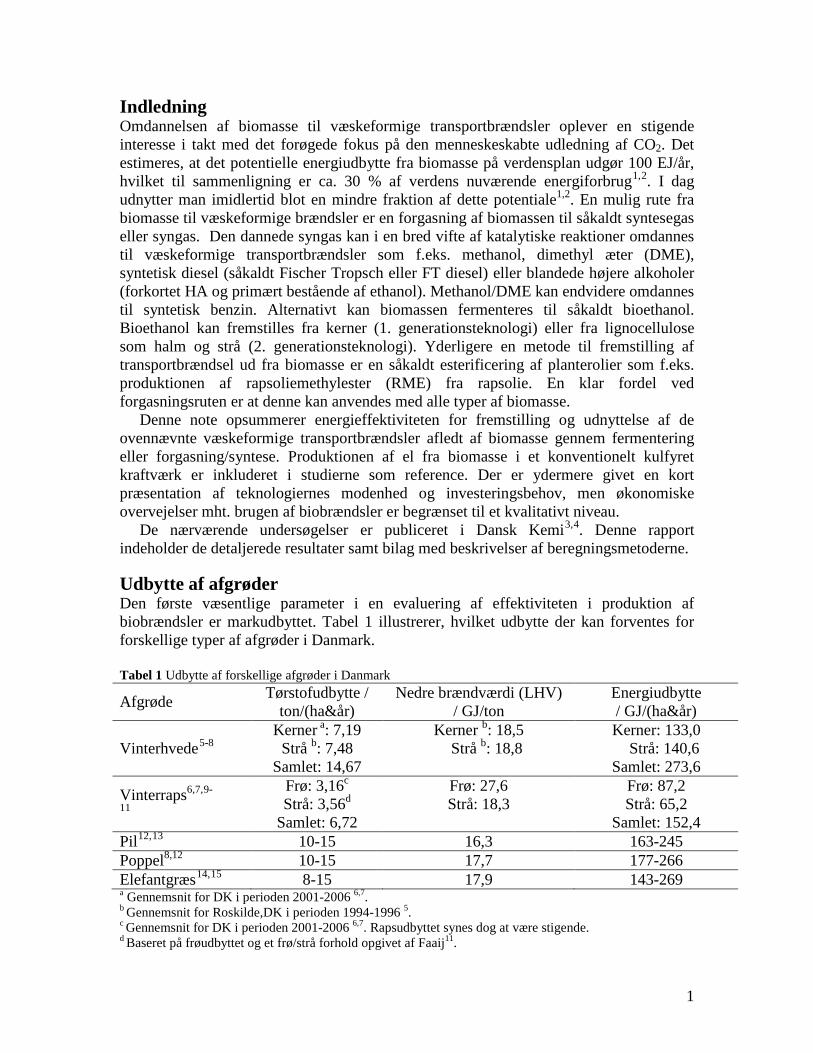
1
Indledning Omdannelsen af biomasse til væskeformige transportbrændsler oplever en stigende interesse i takt med det forøgede fokus på den menneskeskabte udledning af CO2. Det estimeres, at det potentielle energiudbytte fra biomasse på verdensplan udgør 100 EJ/år, hvilket til sammenligning er ca. 30 % af verdens nuværende energiforbrug1,2
1. I dag
udnytter man imidlertid blot en mindre fraktion af dette potentiale ,2. En mulig rute fra biomasse til væskeformige brændsler er en forgasning af biomassen til såkaldt syntesegas eller syngas. Den dannede syngas kan i en bred vifte af katalytiske reaktioner omdannes til væskeformige transportbrændsler som f.eks. methanol, dimethyl æter (DME), syntetisk diesel (såkaldt Fischer Tropsch eller FT diesel) eller blandede højere alkoholer (forkortet HA og primært bestående af ethanol). Methanol/DME kan endvidere omdannes til syntetisk benzin. Alternativt kan biomassen fermenteres til såkaldt bioethanol. Bioethanol kan fremstilles fra kerner (1. generationsteknologi) eller fra lignocellulose som halm og strå (2. generationsteknologi). Yderligere en metode til fremstilling af transportbrændsel ud fra biomasse er en såkaldt esterificering af planterolier som f.eks. produktionen af rapsoliemethylester (RME) fra rapsolie. En klar fordel ved forgasningsruten er at denne kan anvendes med alle typer af biomasse. Denne note opsummerer energieffektiviteten for fremstilling og udnyttelse af de ovennævnte væskeformige transportbrændsler afledt af biomasse gennem fermentering eller forgasning/syntese. Produktionen af el fra biomasse i et konventionelt kulfyret kraftværk er inkluderet i studierne som reference. Der er ydermere givet en kort præsentation af teknologiernes modenhed og investeringsbehov, men økonomiske overvejelser mht. brugen af biobrændsler er begrænset til et kvalitativt niveau. De nærværende undersøgelser er publiceret i Dansk Kemi3,4
. Denne rapport indeholder de detaljerede resultater samt bilag med beskrivelser af beregningsmetoderne.
Udbytte af afgrøder Den første væsentlige parameter i en evaluering af effektiviteten i produktion af biobrændsler er markudbyttet. Tabel 1 illustrerer, hvilket udbytte der kan forventes for forskellige typer af afgrøder i Danmark. Tabel 1 Udbytte af forskellige afgrøder i Danmark Afgrøde Tørstofudbytte /
ton/(ha&år) Nedre brændværdi (LHV)
/ GJ/ton Energiudbytte / GJ/(ha&år)
Vinterhvede5 8- ,6,7,8Kerner a: 7,19
Strå b: 7,48 Samlet: 14,67
Kerner b: 18,5 Strå b: 18,8
Kerner: 133,0 Strå: 140,6 Samlet: 273,6
Vinterraps6,7,9
11
-
,10,11
Frø: 3,16c
Strå: 3,56d Samlet: 6,72
Frø: 27,6 Strå: 18,3
Frø: 87,2 Strå: 65,2
Samlet: 152,4 Pil12,13 10-15 16,3 163-245 Poppel8,12 10-15 17,7 177-266 Elefantgræs14,15 8-15 17,9 143-269 a Gennemsnit for DK i perioden 2001-2006 6,7. b Gennemsnit for Roskilde,DK i perioden 1994-1996 5. c Gennemsnit for DK i perioden 2001-2006 6,7. Rapsudbyttet synes dog at være stigende. d Baseret på frøudbyttet og et frø/strå forhold opgivet af Faaij11.
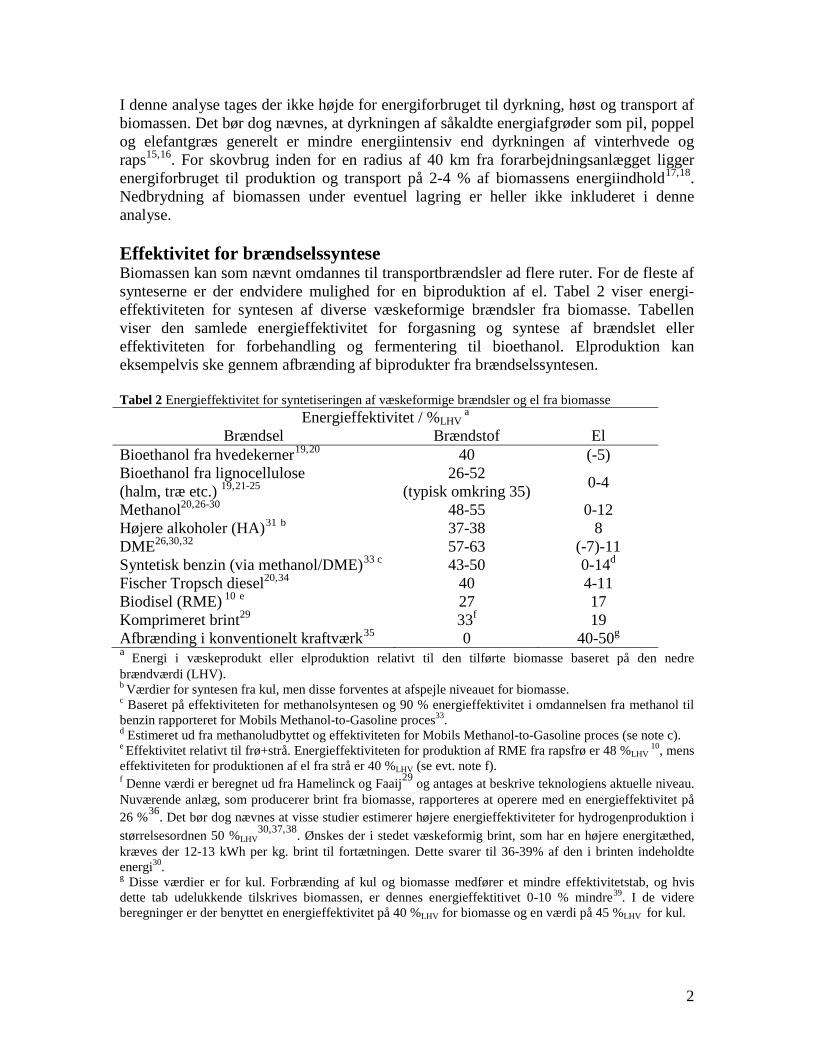
2
I denne analyse tages der ikke højde for energiforbruget til dyrkning, høst og transport af biomassen. Det bør dog nævnes, at dyrkningen af såkaldte energiafgrøder som pil, poppel og elefantgræs generelt er mindre energiintensiv end dyrkningen af vinterhvede og raps15,16. For skovbrug inden for en radius af 40 km fra forarbejdningsanlægget ligger energiforbruget til produktion og transport på 2-4 % af biomassens energiindhold17,18
. Nedbrydning af biomassen under eventuel lagring er heller ikke inkluderet i denne analyse.
Effektivitet for brændselssyntese Biomassen kan som nævnt omdannes til transportbrændsler ad flere ruter. For de fleste af synteserne er der endvidere mulighed for en biproduktion af el. Tabel 2 viser energi-effektiviteten for syntesen af diverse væskeformige brændsler fra biomasse. Tabellen viser den samlede energieffektivitet for forgasning og syntese af brændslet eller effektiviteten for forbehandling og fermentering til bioethanol. Elproduktion kan eksempelvis ske gennem afbrænding af biprodukter fra brændselssyntesen. Tabel 2 Energieffektivitet for syntetiseringen af væskeformige brændsler og el fra biomasse
Energieffektivitet / %LHV a
Brændsel Brændstof El Bioethanol fra hvedekerner19,20 40 (-5) Bioethanol fra lignocellulose (halm, træ etc.) 19,21 25- ,22,23,24,25
26-52 (typisk omkring 35) 0-4
Methanol20,26 30- ,27,28,29,30 48-55 0-12 Højere alkoholer (HA)31 37-38 b 8 DME26,30,32 57-63 (-7)-11 Syntetisk benzin (via methanol/DME)33 43-50 c 0-14d Fischer Tropsch diesel20,34 40 4-11 Biodisel (RME) 10 e 27 17 Komprimeret brint29 33f 19 Afbrænding i konventionelt kraftværk35 0 40-50g a Energi i væskeprodukt eller elproduktion relativt til den tilførte biomasse baseret på den nedre brændværdi (LHV). b Værdier for syntesen fra kul, men disse forventes at afspejle niveauet for biomasse. c Baseret på effektiviteten for methanolsyntesen og 90 % energieffektivitet i omdannelsen fra methanol til benzin rapporteret for Mobils Methanol-to-Gasoline proces33. d Estimeret ud fra methanoludbyttet og effektiviteten for Mobils Methanol-to-Gasoline proces (se note c). e Effektivitet relativt til frø+strå. Energieffektiviteten for produktion af RME fra rapsfrø er 48 %LHV
10, mens effektiviteten for produktionen af el fra strå er 40 %LHV (se evt. note f). f Denne værdi er beregnet ud fra Hamelinck og Faaij29 og antages at beskrive teknologiens aktuelle niveau. Nuværende anlæg, som producerer brint fra biomasse, rapporteres at operere med en energieffektivitet på 26 %36
30. Det bør dog nævnes at visse studier estimerer højere energieffektiviteter for hydrogenproduktion i
størrelsesordnen 50 %LHV,37,38
30
. Ønskes der i stedet væskeformig brint, som har en højere energitæthed, kræves der 12-13 kWh per kg. brint til fortætningen. Dette svarer til 36-39% af den i brinten indeholdte energi . g Disse værdier er for kul. Forbrænding af kul og biomasse medfører et mindre effektivitetstab, og hvis dette tab udelukkende tilskrives biomassen, er dennes energieffektitivet 0-10 % mindre39
. I de videre beregninger er der benyttet en energieffektivitet på 40 %LHV for biomasse og en værdi på 45 %LHV for kul.
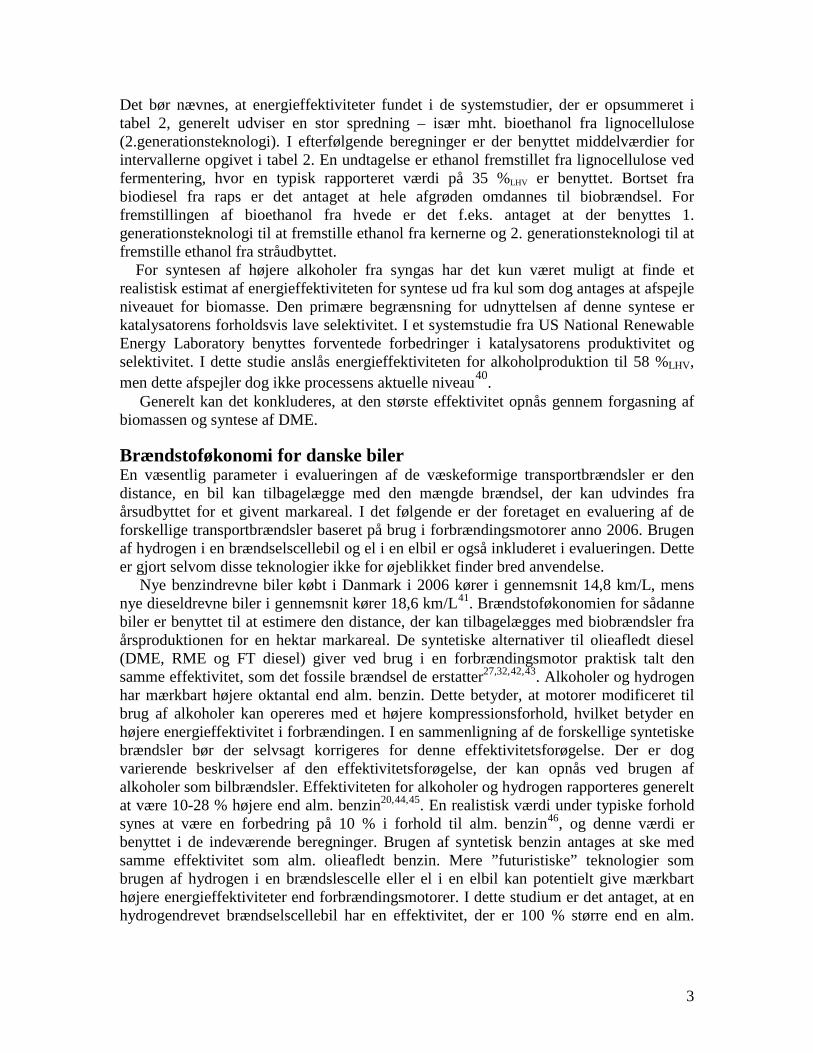
3
Det bør nævnes, at energieffektiviteter fundet i de systemstudier, der er opsummeret i tabel 2, generelt udviser en stor spredning – især mht. bioethanol fra lignocellulose (2.generationsteknologi). I efterfølgende beregninger er der benyttet middelværdier for intervallerne opgivet i tabel 2. En undtagelse er ethanol fremstillet fra lignocellulose ved fermentering, hvor en typisk rapporteret værdi på 35 %LHV er benyttet. Bortset fra biodiesel fra raps er det antaget at hele afgrøden omdannes til biobrændsel. For fremstillingen af bioethanol fra hvede er det f.eks. antaget at der benyttes 1. generationsteknologi til at fremstille ethanol fra kernerne og 2. generationsteknologi til at fremstille ethanol fra stråudbyttet. For syntesen af højere alkoholer fra syngas har det kun været muligt at finde et realistisk estimat af energieffektiviteten for syntese ud fra kul som dog antages at afspejle niveauet for biomasse. Den primære begrænsning for udnyttelsen af denne syntese er katalysatorens forholdsvis lave selektivitet. I et systemstudie fra US National Renewable Energy Laboratory benyttes forventede forbedringer i katalysatorens produktivitet og selektivitet. I dette studie anslås energieffektiviteten for alkoholproduktion til 58 %LHV, men dette afspejler dog ikke processens aktuelle niveau40
Generelt kan det konkluderes, at den største effektivitet opnås gennem forgasning af biomassen og syntese af DME.
.
Brændstoføkonomi for danske biler En væsentlig parameter i evalueringen af de væskeformige transportbrændsler er den distance, en bil kan tilbagelægge med den mængde brændsel, der kan udvindes fra årsudbyttet for et givent markareal. I det følgende er der foretaget en evaluering af de forskellige transportbrændsler baseret på brug i forbrændingsmotorer anno 2006. Brugen af hydrogen i en brændselscellebil og el i en elbil er også inkluderet i evalueringen. Dette er gjort selvom disse teknologier ikke for øjeblikket finder bred anvendelse. Nye benzindrevne biler købt i Danmark i 2006 kører i gennemsnit 14,8 km/L, mens nye dieseldrevne biler i gennemsnit kører 18,6 km/L41
27
. Brændstoføkonomien for sådanne biler er benyttet til at estimere den distance, der kan tilbagelægges med biobrændsler fra årsproduktionen for en hektar markareal. De syntetiske alternativer til olieafledt diesel (DME, RME og FT diesel) giver ved brug i en forbrændingsmotor praktisk talt den samme effektivitet, som det fossile brændsel de erstatter ,32,42,43
20
. Alkoholer og hydrogen har mærkbart højere oktantal end alm. benzin. Dette betyder, at motorer modificeret til brug af alkoholer kan opereres med et højere kompressionsforhold, hvilket betyder en højere energieffektivitet i forbrændingen. I en sammenligning af de forskellige syntetiske brændsler bør der selvsagt korrigeres for denne effektivitetsforøgelse. Der er dog varierende beskrivelser af den effektivitetsforøgelse, der kan opnås ved brugen af alkoholer som bilbrændsler. Effektiviteten for alkoholer og hydrogen rapporteres generelt at være 10-28 % højere end alm. benzin ,44,45. En realistisk værdi under typiske forhold synes at være en forbedring på 10 % i forhold til alm. benzin46, og denne værdi er benyttet i de indeværende beregninger. Brugen af syntetisk benzin antages at ske med samme effektivitet som alm. olieafledt benzin. Mere ”futuristiske” teknologier som brugen af hydrogen i en brændslescelle eller el i en elbil kan potentielt give mærkbart højere energieffektiviteter end forbrændingsmotorer. I dette studium er det antaget, at en hydrogendrevet brændselscellebil har en effektivitet, der er 100 % større end en alm.
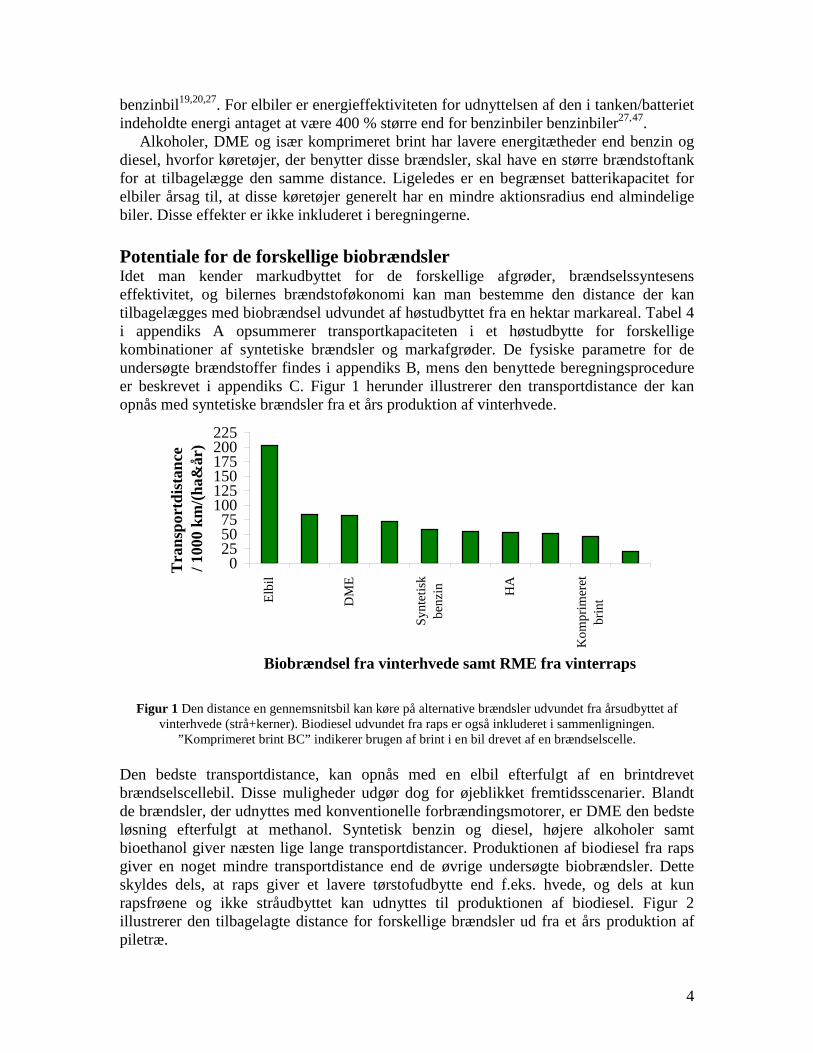
4
benzinbil19,20,27. For elbiler er energieffektiviteten for udnyttelsen af den i tanken/batteriet indeholdte energi antaget at være 400 % større end for benzinbiler benzinbiler27,47
Alkoholer, DME og især komprimeret brint har lavere energitætheder end benzin og diesel, hvorfor køretøjer, der benytter disse brændsler, skal have en større brændstoftank for at tilbagelægge den samme distance. Ligeledes er en begrænset batterikapacitet for elbiler årsag til, at disse køretøjer generelt har en mindre aktionsradius end almindelige biler. Disse effekter er ikke inkluderet i beregningerne.
.
Potentiale for de forskellige biobrændsler Idet man kender markudbyttet for de forskellige afgrøder, brændselssyntesens effektivitet, og bilernes brændstoføkonomi kan man bestemme den distance der kan tilbagelægges med biobrændsel udvundet af høstudbyttet fra en hektar markareal. Tabel 4 i appendiks A opsummerer transportkapaciteten i et høstudbytte for forskellige kombinationer af syntetiske brændsler og markafgrøder. De fysiske parametre for de undersøgte brændstoffer findes i appendiks B, mens den benyttede beregningsprocedure er beskrevet i appendiks C. Figur 1 herunder illustrerer den transportdistance der kan opnås med syntetiske brændsler fra et års produktion af vinterhvede.
0255075
100125150175200225
Elbi
l
DM
E
Synt
etis
kbe
nzin H
A
Kom
prim
eret
brin
t
Biobrændsel fra vinterhvede samt RME fra vinterraps
Tra
nspo
rtdi
stan
ce /
1000
km
/(ha&
år)
Figur 1 Den distance en gennemsnitsbil kan køre på alternative brændsler udvundet fra årsudbyttet af
vinterhvede (strå+kerner). Biodiesel udvundet fra raps er også inkluderet i sammenligningen. ”Komprimeret brint BC” indikerer brugen af brint i en bil drevet af en brændselscelle.
Den bedste transportdistance, kan opnås med en elbil efterfulgt af en brintdrevet brændselscellebil. Disse muligheder udgør dog for øjeblikket fremtidsscenarier. Blandt de brændsler, der udnyttes med konventionelle forbrændingsmotorer, er DME den bedste løsning efterfulgt at methanol. Syntetisk benzin og diesel, højere alkoholer samt bioethanol giver næsten lige lange transportdistancer. Produktionen af biodiesel fra raps giver en noget mindre transportdistance end de øvrige undersøgte biobrændsler. Dette skyldes dels, at raps giver et lavere tørstofudbytte end f.eks. hvede, og dels at kun rapsfrøene og ikke stråudbyttet kan udnyttes til produktionen af biodiesel. Figur 2 illustrerer den tilbagelagte distance for forskellige brændsler ud fra et års produktion af piletræ.
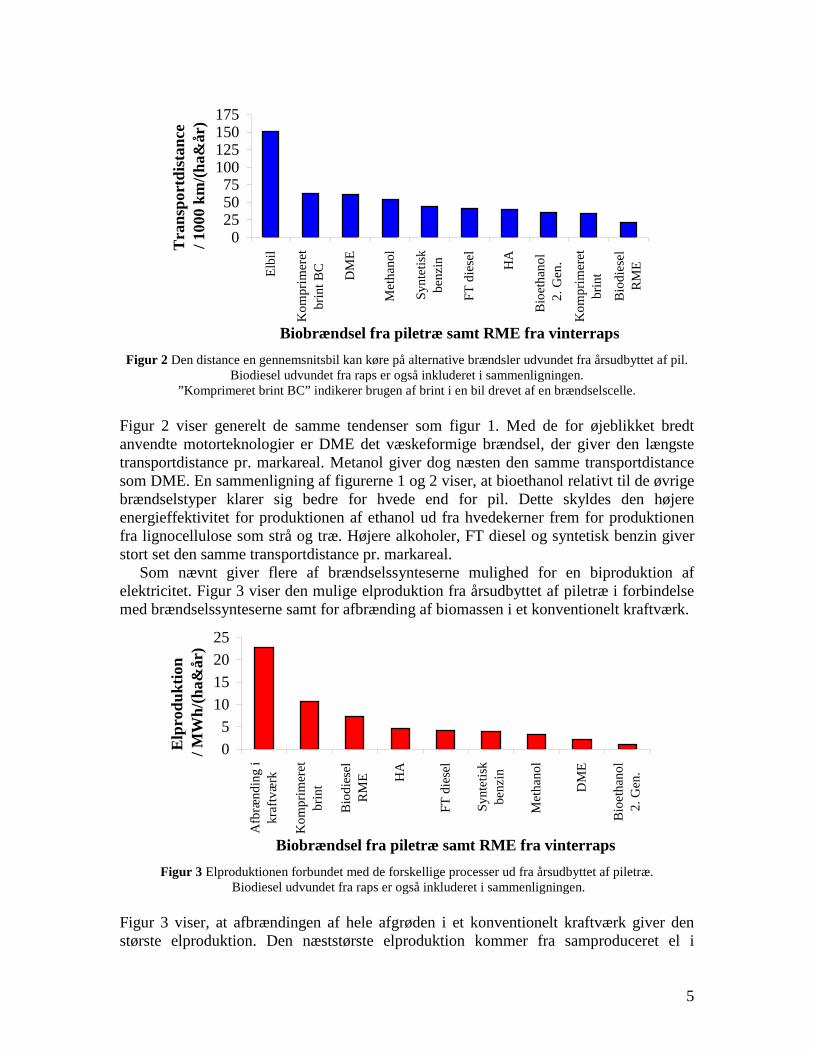
5
0255075
100125150175
Elbi
l
Kom
prim
eret
brin
t BC DM
E
Met
hano
l
Synt
etis
kbe
nzin
FT d
iese
l
HA
Bio
etha
nol
2. G
en.
Kom
prim
eret
brin
t
Bio
dies
elR
ME
Biobrændsel fra piletræ samt RME fra vinterraps
Tra
nspo
rtdi
stan
ce /
1000
km
/(ha&
år)
Figur 2 Den distance en gennemsnitsbil kan køre på alternative brændsler udvundet fra årsudbyttet af pil.
Biodiesel udvundet fra raps er også inkluderet i sammenligningen. ”Komprimeret brint BC” indikerer brugen af brint i en bil drevet af en brændselscelle.
Figur 2 viser generelt de samme tendenser som figur 1. Med de for øjeblikket bredt anvendte motorteknologier er DME det væskeformige brændsel, der giver den længste transportdistance pr. markareal. Metanol giver dog næsten den samme transportdistance som DME. En sammenligning af figurerne 1 og 2 viser, at bioethanol relativt til de øvrige brændselstyper klarer sig bedre for hvede end for pil. Dette skyldes den højere energieffektivitet for produktionen af ethanol ud fra hvedekerner frem for produktionen fra lignocellulose som strå og træ. Højere alkoholer, FT diesel og syntetisk benzin giver stort set den samme transportdistance pr. markareal. Som nævnt giver flere af brændselssynteserne mulighed for en biproduktion af elektricitet. Figur 3 viser den mulige elproduktion fra årsudbyttet af piletræ i forbindelse med brændselssynteserne samt for afbrænding af biomassen i et konventionelt kraftværk.
05
10152025
Afb
rænd
ing
ikr
aftv
ærk
Kom
prim
eret
brin
t
Bio
dies
elR
ME H
A
FT d
iese
l
Synt
etis
kbe
nzin
Met
hano
l
DM
E
Bio
etha
nol
2. G
en.
Biobrændsel fra piletræ samt RME fra vinterraps
Elp
rodu
ktio
n /
MW
h/(h
a&år
)
Figur 3 Elproduktionen forbundet med de forskellige processer ud fra årsudbyttet af piletræ.
Biodiesel udvundet fra raps er også inkluderet i sammenligningen. Figur 3 viser, at afbrændingen af hele afgrøden i et konventionelt kraftværk giver den største elproduktion. Den næststørste elproduktion kommer fra samproduceret el i
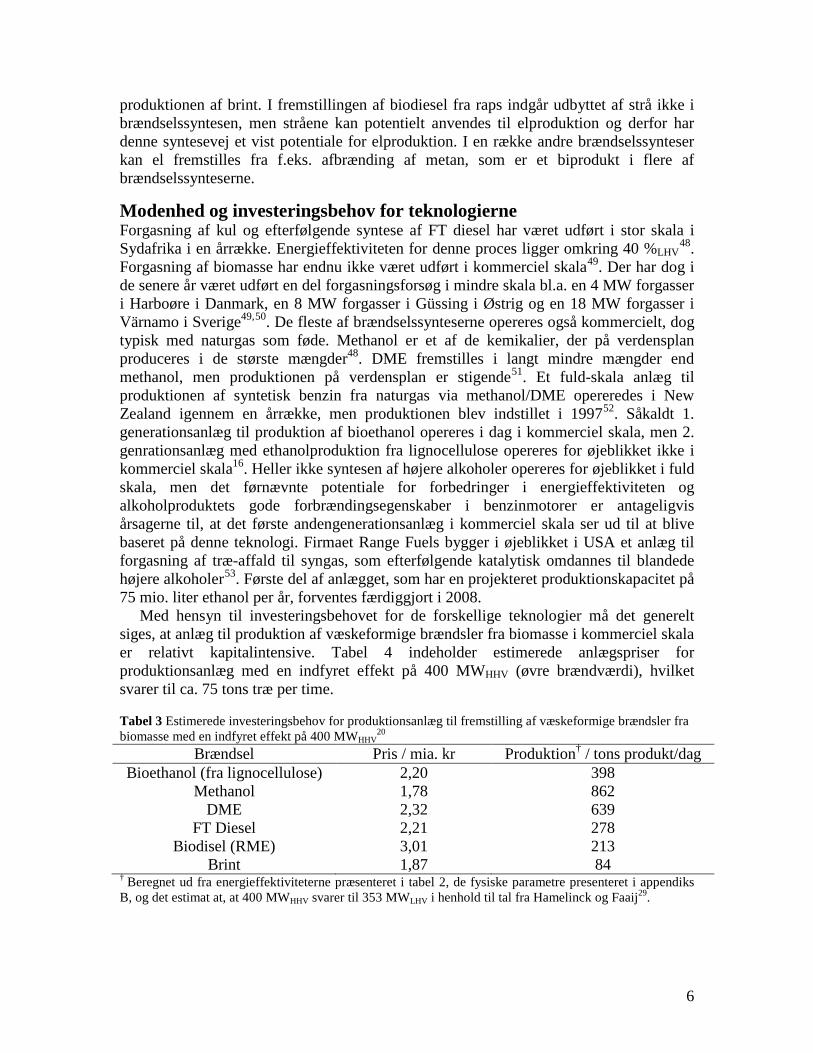
6
produktionen af brint. I fremstillingen af biodiesel fra raps indgår udbyttet af strå ikke i brændselssyntesen, men stråene kan potentielt anvendes til elproduktion og derfor har denne syntesevej et vist potentiale for elproduktion. I en række andre brændselssynteser kan el fremstilles fra f.eks. afbrænding af metan, som er et biprodukt i flere af brændselssynteserne.
Modenhed og investeringsbehov for teknologierne Forgasning af kul og efterfølgende syntese af FT diesel har været udført i stor skala i Sydafrika i en årrække. Energieffektiviteten for denne proces ligger omkring 40 %LHV
48. Forgasning af biomasse har endnu ikke været udført i kommerciel skala49
49
. Der har dog i de senere år været udført en del forgasningsforsøg i mindre skala bl.a. en 4 MW forgasser i Harboøre i Danmark, en 8 MW forgasser i Güssing i Østrig og en 18 MW forgasser i Värnamo i Sverige ,50
48
. De fleste af brændselssynteserne opereres også kommercielt, dog typisk med naturgas som føde. Methanol er et af de kemikalier, der på verdensplan produceres i de største mængder . DME fremstilles i langt mindre mængder end methanol, men produktionen på verdensplan er stigende51. Et fuld-skala anlæg til produktionen af syntetisk benzin fra naturgas via methanol/DME opereredes i New Zealand igennem en årrække, men produktionen blev indstillet i 199752
16
. Såkaldt 1. generationsanlæg til produktion af bioethanol opereres i dag i kommerciel skala, men 2. genrationsanlæg med ethanolproduktion fra lignocellulose opereres for øjeblikket ikke i kommerciel skala . Heller ikke syntesen af højere alkoholer opereres for øjeblikket i fuld skala, men det førnævnte potentiale for forbedringer i energieffektiviteten og alkoholproduktets gode forbrændingsegenskaber i benzinmotorer er antageligvis årsagerne til, at det første andengenerationsanlæg i kommerciel skala ser ud til at blive baseret på denne teknologi. Firmaet Range Fuels bygger i øjeblikket i USA et anlæg til forgasning af træ-affald til syngas, som efterfølgende katalytisk omdannes til blandede højere alkoholer53
Med hensyn til investeringsbehovet for de forskellige teknologier må det generelt siges, at anlæg til produktion af væskeformige brændsler fra biomasse i kommerciel skala er relativt kapitalintensive. Tabel 4 indeholder estimerede anlægspriser for produktionsanlæg med en indfyret effekt på 400 MWHHV (øvre brændværdi), hvilket svarer til ca. 75 tons træ per time.
. Første del af anlægget, som har en projekteret produktionskapacitet på 75 mio. liter ethanol per år, forventes færdiggjort i 2008.
Tabel 3 Estimerede investeringsbehov for produktionsanlæg til fremstilling af væskeformige brændsler fra biomasse med en indfyret effekt på 400 MWHHV
20 Brændsel Pris / mia. kr Produktion† / tons produkt/dag
Bioethanol (fra lignocellulose) 2,20 398 Methanol 1,78 862
DME 2,32 639 FT Diesel 2,21 278
Biodisel (RME) 3,01 213 Brint 1,87 84
† Beregnet ud fra energieffektiviteterne præsenteret i tabel 2, de fysiske parametre presenteret i appendiks B, og det estimat at, at 400 MWHHV svarer til 353 MWLHV i henhold til tal fra Hamelinck og Faaij29.
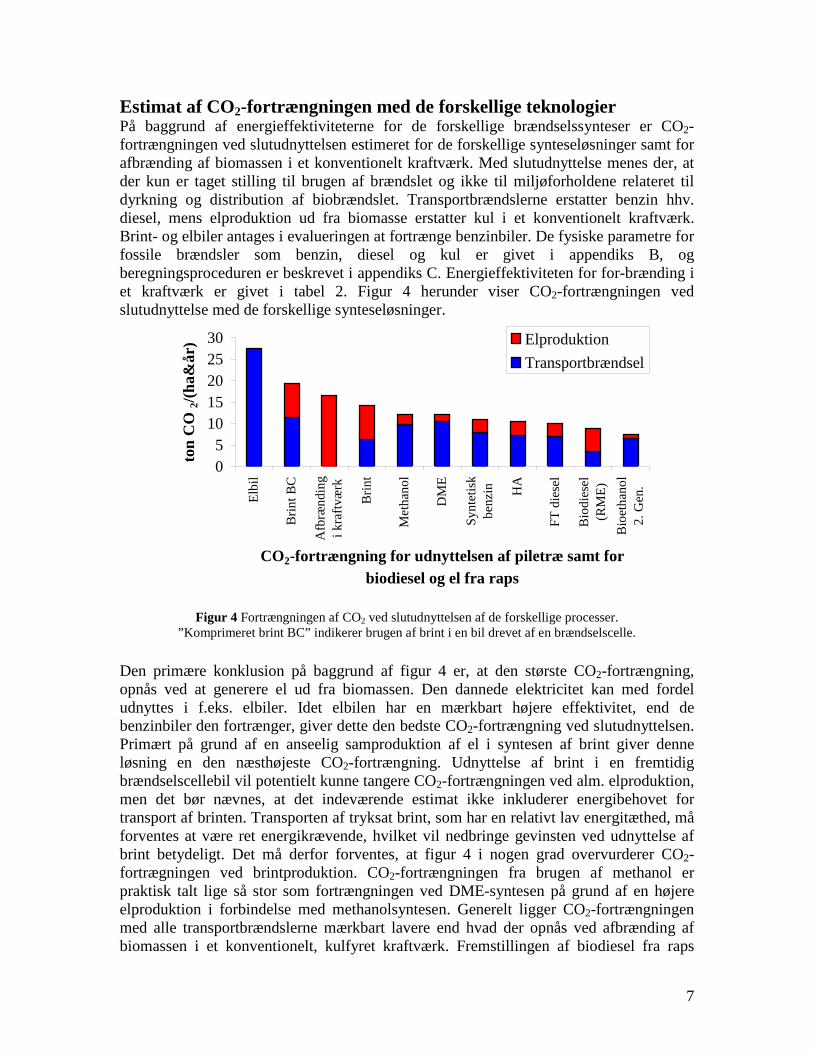
7
Estimat af CO2-fortrængningen med de forskellige teknologier På baggrund af energieffektiviteterne for de forskellige brændselssynteser er CO2- fortrængningen ved slutudnyttelsen estimeret for de forskellige synteseløsninger samt for afbrænding af biomassen i et konventionelt kraftværk. Med slutudnyttelse menes der, at der kun er taget stilling til brugen af brændslet og ikke til miljøforholdene relateret til dyrkning og distribution af biobrændslet. Transportbrændslerne erstatter benzin hhv. diesel, mens elproduktion ud fra biomasse erstatter kul i et konventionelt kraftværk. Brint- og elbiler antages i evalueringen at fortrænge benzinbiler. De fysiske parametre for fossile brændsler som benzin, diesel og kul er givet i appendiks B, og beregningsproceduren er beskrevet i appendiks C. Energieffektiviteten for for-brænding i et kraftværk er givet i tabel 2. Figur 4 herunder viser CO2-fortrængningen ved slutudnyttelse med de forskellige synteseløsninger.
05
1015202530
Elbi
l
Brin
t BC
Afb
rænd
ing
i kra
ftvæ
rk
Brin
t
Met
hano
l
DM
E
Synt
etis
kbe
nzin H
A
FT d
iese
l
Bio
dies
el(R
ME)
Bio
etha
nol
2. G
en.
CO2-fortrængning for udnyttelsen af piletræ samt for biodiesel og el fra raps
ton
CO
2/(h
a&år
) ElproduktionTransportbrændsel
Figur 4 Fortrængningen af CO2 ved slutudnyttelsen af de forskellige processer.
”Komprimeret brint BC” indikerer brugen af brint i en bil drevet af en brændselscelle. Den primære konklusion på baggrund af figur 4 er, at den største CO2-fortrængning, opnås ved at generere el ud fra biomassen. Den dannede elektricitet kan med fordel udnyttes i f.eks. elbiler. Idet elbilen har en mærkbart højere effektivitet, end de benzinbiler den fortrænger, giver dette den bedste CO2-fortrængning ved slutudnyttelsen. Primært på grund af en anseelig samproduktion af el i syntesen af brint giver denne løsning en den næsthøjeste CO2-fortrængning. Udnyttelse af brint i en fremtidig brændselscellebil vil potentielt kunne tangere CO2-fortrængningen ved alm. elproduktion, men det bør nævnes, at det indeværende estimat ikke inkluderer energibehovet for transport af brinten. Transporten af tryksat brint, som har en relativt lav energitæthed, må forventes at være ret energikrævende, hvilket vil nedbringe gevinsten ved udnyttelse af brint betydeligt. Det må derfor forventes, at figur 4 i nogen grad overvurderer CO2-fortrægningen ved brintproduktion. CO2-fortrængningen fra brugen af methanol er praktisk talt lige så stor som fortrængningen ved DME-syntesen på grund af en højere elproduktion i forbindelse med methanolsyntesen. Generelt ligger CO2-fortrængningen med alle transportbrændslerne mærkbart lavere end hvad der opnås ved afbrænding af biomassen i et konventionelt, kulfyret kraftværk. Fremstillingen af biodiesel fra raps
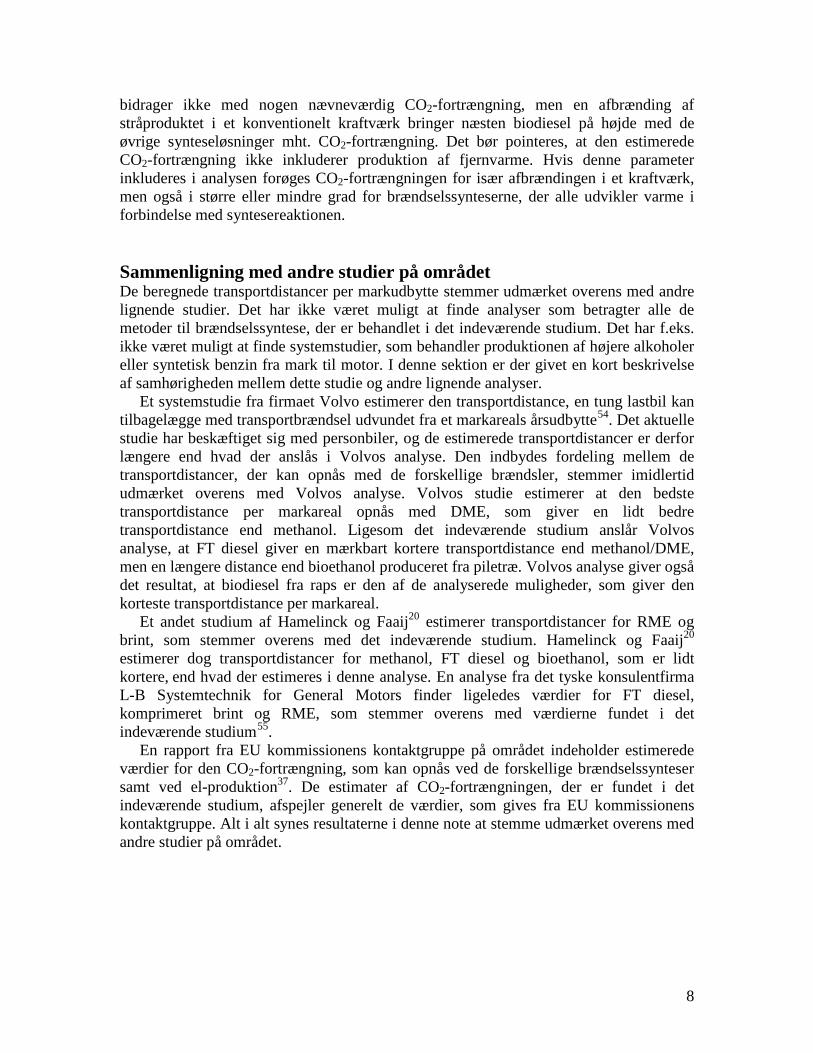
8
bidrager ikke med nogen nævneværdig CO2-fortrængning, men en afbrænding af stråproduktet i et konventionelt kraftværk bringer næsten biodiesel på højde med de øvrige synteseløsninger mht. CO2-fortrængning. Det bør pointeres, at den estimerede CO2-fortrængning ikke inkluderer produktion af fjernvarme. Hvis denne parameter inkluderes i analysen forøges CO2-fortrængningen for især afbrændingen i et kraftværk, men også i større eller mindre grad for brændselssynteserne, der alle udvikler varme i forbindelse med syntesereaktionen. Sammenligning med andre studier på området De beregnede transportdistancer per markudbytte stemmer udmærket overens med andre lignende studier. Det har ikke været muligt at finde analyser som betragter alle de metoder til brændselssyntese, der er behandlet i det indeværende studium. Det har f.eks. ikke været muligt at finde systemstudier, som behandler produktionen af højere alkoholer eller syntetisk benzin fra mark til motor. I denne sektion er der givet en kort beskrivelse af samhørigheden mellem dette studie og andre lignende analyser. Et systemstudie fra firmaet Volvo estimerer den transportdistance, en tung lastbil kan tilbagelægge med transportbrændsel udvundet fra et markareals årsudbytte54
Et andet studium af Hamelinck og Faaij
. Det aktuelle studie har beskæftiget sig med personbiler, og de estimerede transportdistancer er derfor længere end hvad der anslås i Volvos analyse. Den indbydes fordeling mellem de transportdistancer, der kan opnås med de forskellige brændsler, stemmer imidlertid udmærket overens med Volvos analyse. Volvos studie estimerer at den bedste transportdistance per markareal opnås med DME, som giver en lidt bedre transportdistance end methanol. Ligesom det indeværende studium anslår Volvos analyse, at FT diesel giver en mærkbart kortere transportdistance end methanol/DME, men en længere distance end bioethanol produceret fra piletræ. Volvos analyse giver også det resultat, at biodiesel fra raps er den af de analyserede muligheder, som giver den korteste transportdistance per markareal.
20 estimerer transportdistancer for RME og brint, som stemmer overens med det indeværende studium. Hamelinck og Faaij20 estimerer dog transportdistancer for methanol, FT diesel og bioethanol, som er lidt kortere, end hvad der estimeres i denne analyse. En analyse fra det tyske konsulentfirma L-B Systemtechnik for General Motors finder ligeledes værdier for FT diesel, komprimeret brint og RME, som stemmer overens med værdierne fundet i det indeværende studium55
En rapport fra EU kommissionens kontaktgruppe på området indeholder estimerede værdier for den CO2-fortrængning, som kan opnås ved de forskellige brændselssynteser samt ved el-produktion
.
37. De estimater af CO2-fortrængningen, der er fundet i det indeværende studium, afspejler generelt de værdier, som gives fra EU kommissionens kontaktgruppe. Alt i alt synes resultaterne i denne note at stemme udmærket overens med andre studier på området.
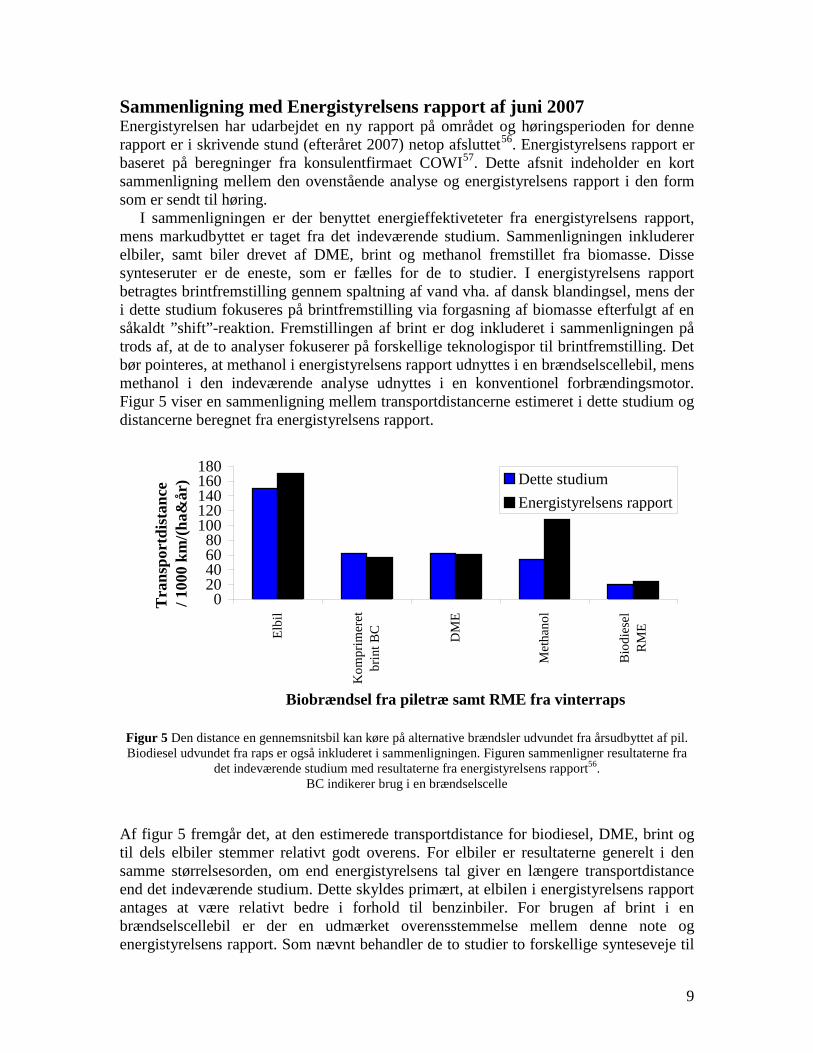
9
Sammenligning med Energistyrelsens rapport af juni 2007 Energistyrelsen har udarbejdet en ny rapport på området og høringsperioden for denne rapport er i skrivende stund (efteråret 2007) netop afsluttet56. Energistyrelsens rapport er baseret på beregninger fra konsulentfirmaet COWI57
I sammenligningen er der benyttet energieffektiveteter fra energistyrelsens rapport, mens markudbyttet er taget fra det indeværende studium. Sammenligningen inkluderer elbiler, samt biler drevet af DME, brint og methanol fremstillet fra biomasse. Disse synteseruter er de eneste, som er fælles for de to studier. I energistyrelsens rapport betragtes brintfremstilling gennem spaltning af vand vha. af dansk blandingsel, mens der i dette studium fokuseres på brintfremstilling via forgasning af biomasse efterfulgt af en såkaldt ”shift”-reaktion. Fremstillingen af brint er dog inkluderet i sammenligningen på trods af, at de to analyser fokuserer på forskellige teknologispor til brintfremstilling. Det bør pointeres, at methanol i energistyrelsens rapport udnyttes i en brændselscellebil, mens methanol i den indeværende analyse udnyttes i en konventionel forbrændingsmotor. Figur 5 viser en sammenligning mellem transportdistancerne estimeret i dette studium og distancerne beregnet fra energistyrelsens rapport.
. Dette afsnit indeholder en kort sammenligning mellem den ovenstående analyse og energistyrelsens rapport i den form som er sendt til høring.
020406080
100120140160180
Elbi
l
Kom
prim
eret
brin
t BC DM
E
Met
hano
l
Bio
dies
elR
ME
Biobrændsel fra piletræ samt RME fra vinterraps
Tra
nspo
rtdi
stan
ce /
1000
km
/(ha&
år) Dette studium
Energistyrelsens rapport
Figur 5 Den distance en gennemsnitsbil kan køre på alternative brændsler udvundet fra årsudbyttet af pil. Biodiesel udvundet fra raps er også inkluderet i sammenligningen. Figuren sammenligner resultaterne fra
det indeværende studium med resultaterne fra energistyrelsens rapport56. BC indikerer brug i en brændselscelle
Af figur 5 fremgår det, at den estimerede transportdistance for biodiesel, DME, brint og til dels elbiler stemmer relativt godt overens. For elbiler er resultaterne generelt i den samme størrelsesorden, om end energistyrelsens tal giver en længere transportdistance end det indeværende studium. Dette skyldes primært, at elbilen i energistyrelsens rapport antages at være relativt bedre i forhold til benzinbiler. For brugen af brint i en brændselscellebil er der en udmærket overensstemmelse mellem denne note og energistyrelsens rapport. Som nævnt behandler de to studier to forskellige synteseveje til
10
brint, hvorfor det er svært at drage en konklusion på basis af den relativt gode overensstemmelse, der observeres. Det fremgår også af figur 5, at methanol i energistyrelsens rapport giver en mærkbart højere transportdistance end estimatet for det indeværende studium. Dette skydes, at methanol i energistyrelsens rapport udnyttes i en brændselscellebil med en relativt høj effektivitet, mens det indeværende studium ser på udnyttelsen i en bil med en almindelig forbrændingsmotor, som opererer med en lavere energieffektivitet. Disse værdier er altså ikke direkte sammenlignelige. Det faktum, at methanol i energistyrelsens rapport udnyttes med en mere ”futuristisk” og mindre veletableret teknologi (brændselsceller), giver også en vis slagside i forhold til sammenligningerne internt i energistyrelsens rapport. For DME og biodiesel (RME) er der, som det fremgår af figur 5, en glimrende overensstemmelse mellem de to studier. Konklusion I de seneste år har der været et stadigt stigende ønske om at nedbringe transportsektorens miljøbelastning og parallelt med dette at opnå en øget uafhængighed af de ofte politiske ustabile olieproducerende lande. Et skridt imod en realisering af disse ønsker er en forøget udnyttelse af biobrændsler i transportsektoren. Denne notes hensigt er ikke at identificere det biobrændsel, som der entydigt bør satses på, men snarere at illustrere de mangfoldige muligheder, der er til stede på området. Udnyttelse af biomassen til elproduktion og brug af den producerede el i el-biler giver generelt den bedste miljøforbedring. Denne løsning vil dog kræve en voldsom forøgelse af elsektoren og synes vanskelig at indfase, hvilket gør, at denne teknologi for øjeblikket snarere ligner ”tusindårsriget” end morgendagens transportsektor. Indtil da er der en række mulige biobrændsler, som kan udnyttes med den i dag vidt udbredte motorteknologi. Hidtil har hovedfokus på dette område været på bioethanol (1. generation) og biodiesel. En forgasning af biomassen til såkaldt syntesegas og en efterfølgende syntetisering af et af flere syntetiske brændsler fra syntesegassen åbner imidlertid op for en direkte udnyttelse af lignocellulose som træ og strå - såkaldt 2. generationsteknologi. Med den aktuelle teknologi kan brændsler som DME, methanol, syntetisk benzin og diesel samt blandede højere alkoholer alle give en miljøforbedring, som modsvarer eller overstiger det niveau, der kan realiseres med de hidtil afsøgte løsninger. Den væsentligste konklusion, der kan drages på baggrund af resultaterne i denne note, er derfor som tidligere nævnt, at man bør udvide sit fokus på området til i høj grad også at omfatte forgasningsruten til biobrændsler frem for blot at se på de mere hyppigt omtalte biobrændsler som bioethanol og biodisel. I denne forbindelse er den ting, som er måske vigtigst at huske, Thomas Edisons ord om at: ”opportunity is missed by most people, because it is dressed in overalls and looks like work”.
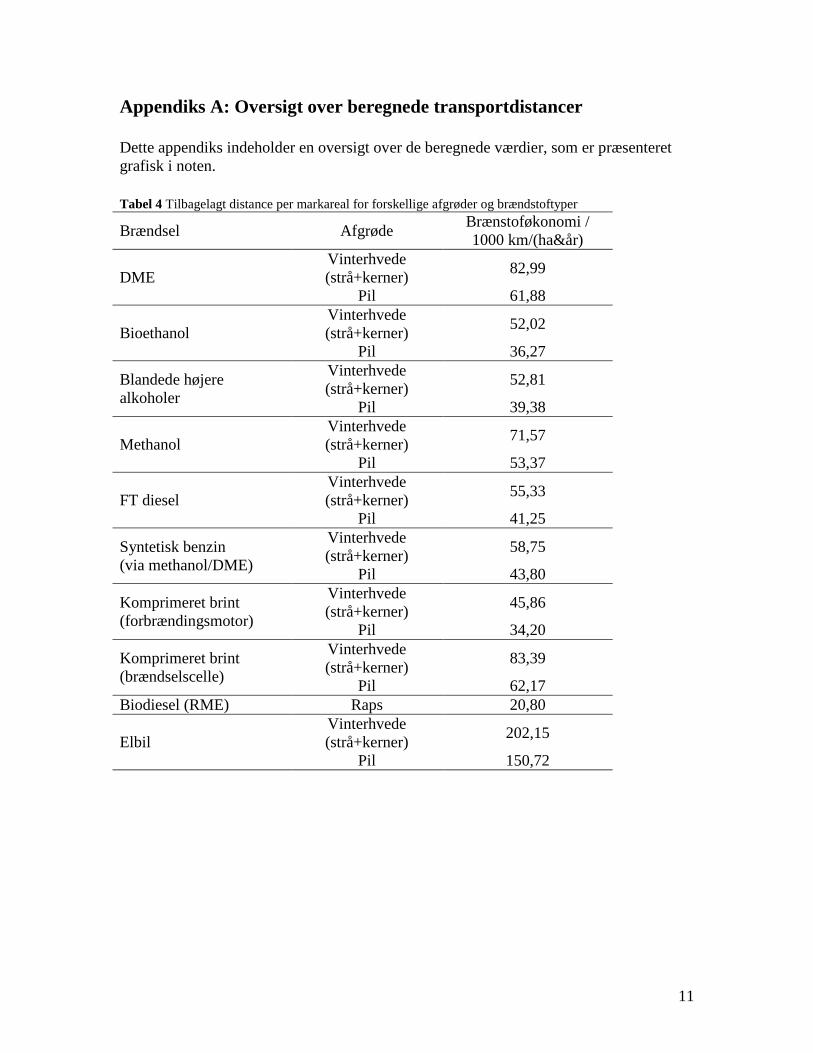
11
Appendiks A: Oversigt over beregnede transportdistancer Dette appendiks indeholder en oversigt over de beregnede værdier, som er præsenteret grafisk i noten. Tabel 4 Tilbagelagt distance per markareal for forskellige afgrøder og brændstoftyper Brændsel Afgrøde Brænstoføkonomi /
1000 km/(ha&år)
DME Vinterhvede (strå+kerner) 82,99
Pil 61,88
Bioethanol Vinterhvede (strå+kerner) 52,02
Pil 36,27
Blandede højere alkoholer
Vinterhvede (strå+kerner) 52,81
Pil 39,38
Methanol Vinterhvede (strå+kerner) 71,57
Pil 53,37
FT diesel Vinterhvede (strå+kerner) 55,33
Pil 41,25
Syntetisk benzin (via methanol/DME)
Vinterhvede (strå+kerner) 58,75
Pil 43,80
Komprimeret brint (forbrændingsmotor)
Vinterhvede (strå+kerner) 45,86
Pil 34,20
Komprimeret brint (brændselscelle)
Vinterhvede (strå+kerner) 83,39
Pil 62,17 Biodiesel (RME) Raps 20,80
Elbil Vinterhvede (strå+kerner) 202,15
Pil 150,72
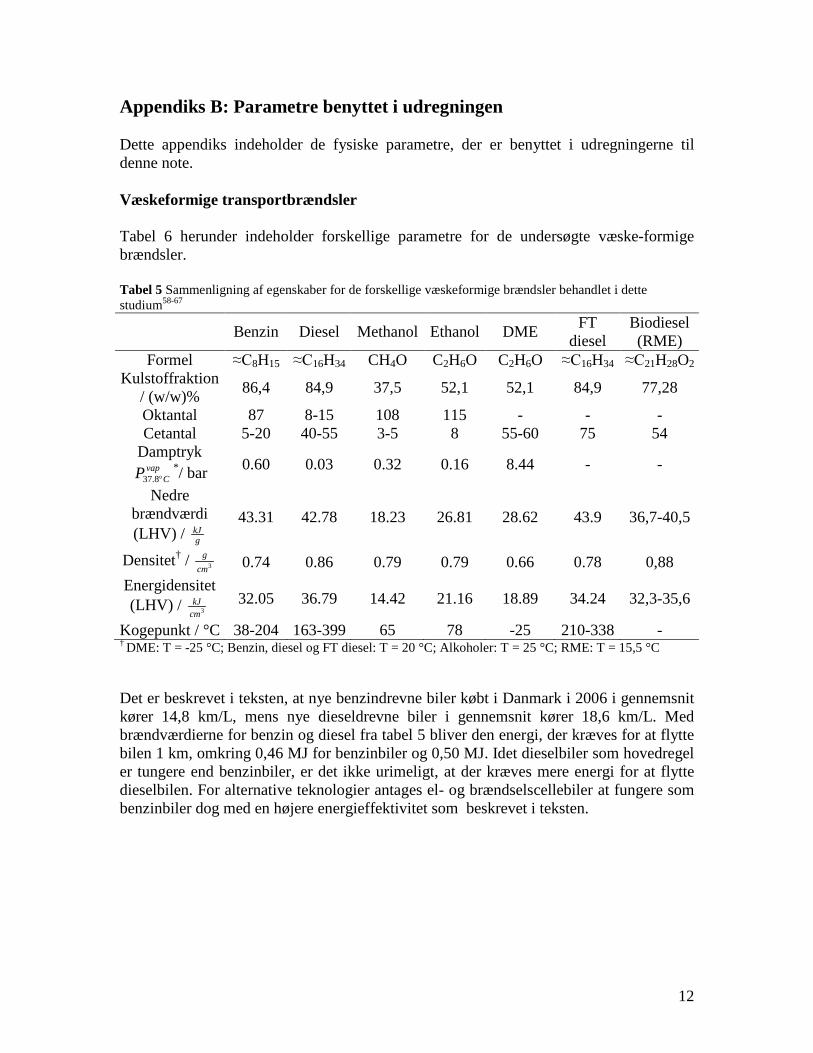
12
Appendiks B: Parametre benyttet i udregningen Dette appendiks indeholder de fysiske parametre, der er benyttet i udregningerne til denne note. Væskeformige transportbrændsler Tabel 6 herunder indeholder forskellige parametre for de undersøgte væske-formige brændsler. Tabel 5 Sammenligning af egenskaber for de forskellige væskeformige brændsler behandlet i dette studium58-67. 58,59,60,61,62,636465,6667
Benzin Diesel Methanol Ethanol DME FT diesel
Biodiesel (RME)
Formel ≈C8H15 ≈C16H34 CH4O C2H6O C2H6O ≈C16H34 ≈C21H28O2 Kulstoffraktion
/ (w/w)% 86,4 84,9 37,5 52,1 52,1 84,9 77,28
Oktantal 87 8-15 108 115 - - - Cetantal 5-20 40-55 3-5 8 55-60 75 54
Damptryk vap
CP °8.37*/ bar 0.60 0.03 0.32 0.16 8.44 - -
Nedre brændværdi (LHV) / g
kJ 43.31 42.78 18.23 26.81 28.62 43.9 36,7-40,5
Densitet† / 3cmg 0.74 0.86 0.79 0.79 0.66 0.78 0,88
Energidensitet (LHV) / 3cm
kJ 32.05 36.79 14.42 21.16 18.89 34.24 32,3-35,6
Kogepunkt / °C 38-204 163-399 65 78 -25 210-338 - † DME: T = -25 °C; Benzin, diesel og FT diesel: T = 20 °C; Alkoholer: T = 25 °C; RME: T = 15,5 °C Det er beskrevet i teksten, at nye benzindrevne biler købt i Danmark i 2006 i gennemsnit kører 14,8 km/L, mens nye dieseldrevne biler i gennemsnit kører 18,6 km/L. Med brændværdierne for benzin og diesel fra tabel 5 bliver den energi, der kræves for at flytte bilen 1 km, omkring 0,46 MJ for benzinbiler og 0,50 MJ. Idet dieselbiler som hovedregel er tungere end benzinbiler, er det ikke urimeligt, at der kræves mere energi for at flytte dieselbilen. For alternative teknologier antages el- og brændselscellebiler at fungere som benzinbiler dog med en højere energieffektivitet som beskrevet i teksten.
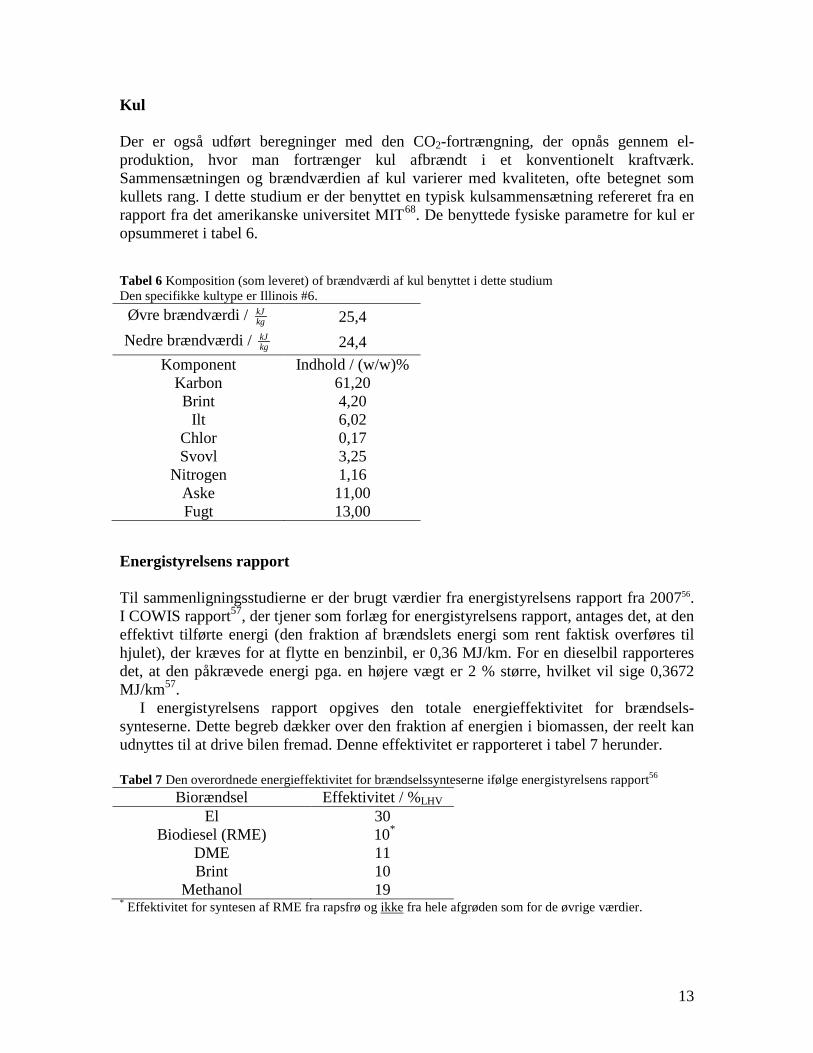
13
Kul Der er også udført beregninger med den CO2-fortrængning, der opnås gennem el-produktion, hvor man fortrænger kul afbrændt i et konventionelt kraftværk. Sammensætningen og brændværdien af kul varierer med kvaliteten, ofte betegnet som kullets rang. I dette studium er der benyttet en typisk kulsammensætning refereret fra en rapport fra det amerikanske universitet MIT68
. De benyttede fysiske parametre for kul er opsummeret i tabel 6.
Tabel 6 Komposition (som leveret) of brændværdi af kul benyttet i dette studium Den specifikke kultype er Illinois #6.
Øvre brændværdi / kJkg 25,4
Nedre brændværdi / kJkg 24,4
Komponent Indhold / (w/w)% Karbon 61,20 Brint 4,20
Ilt 6,02 Chlor 0,17 Svovl 3,25
Nitrogen 1,16 Aske 11,00 Fugt 13,00
Energistyrelsens rapport Til sammenligningsstudierne er der brugt værdier fra energistyrelsens rapport fra 200756. I COWIS rapport57, der tjener som forlæg for energistyrelsens rapport, antages det, at den effektivt tilførte energi (den fraktion af brændslets energi som rent faktisk overføres til hjulet), der kræves for at flytte en benzinbil, er 0,36 MJ/km. For en dieselbil rapporteres det, at den påkrævede energi pga. en højere vægt er 2 % større, hvilket vil sige 0,3672 MJ/km57. I energistyrelsens rapport opgives den totale energieffektivitet for brændsels-synteserne. Dette begreb dækker over den fraktion af energien i biomassen, der reelt kan udnyttes til at drive bilen fremad. Denne effektivitet er rapporteret i tabel 7 herunder. Tabel 7 Den overordnede energieffektivitet for brændselssynteserne ifølge energistyrelsens rapport56
Biorændsel Effektivitet / %LHV El 30
Biodiesel (RME) 10* DME 11 Brint 10
Methanol 19 * Effektivitet for syntesen af RME fra rapsfrø og ikke fra hele afgrøden som for de øvrige værdier.
14
Appendiks C: Beregningsproceduren Den transportdistance (D), der kan opnås med et årsudbytte fra en hektar markareal, er beregnet ud fra energiudbyttet fra marken (E), synteseeffektiviteten (η), brændstof-økonomien for en bil drevet af benzin eller diesel (B), energitætheden af benzin hhv. diesel (ρ) og energieffektiviteten af brændslet relativt til olieafledt benzin eller diesel (α).
[ ][ ]
kmLkm GJ
ha år ha år GJL
BD E η α
ρ⋅ ⋅
= ⋅ ⋅ ⋅
C1
Her er E η⋅ et mål for den energi, som per markareal kan udnyttes i biler, mens parameteren B
ρ α⋅ er et mål for, hvor langt bilen kører på et givent kvantum energi i brændstoffet. Et eksempel kunne være den transportdistance, der opnås med et års produktion af piletræ gennem forgasning og syntese af methanol. Methanol udnyttes i stedet for olieafledt benzin i en forbrændingsmotor modificeret til brugen af methanol. Middelværdien for energiudbyttet for piletræ kan ses af tabel 1 og er 204 GJ
ha årE ⋅= . Rapporterede synteseeffektiviteter for methanol ligger mellem 48 og 55 % med en middelværdi på η = 51,5 %. Grundet et højt oktantal antages methanol at give en 10 % højere energieffektitivet end benzin, hvorfor man har α = 110 %. Methanol benyttes i en ny benzinbil, der med benzin som brændstof har en brændstoføkonomi på B = 14,8 km
L . Energitætheden af benzin er ca. ρ = 0.03205 GJ
L . Indsat i ligning C1 ovenfor giver dette:
14,8204 0,515 1,10 53365,90.03205
kmLkm GJ km
ha år ha år ha årGJL
D ⋅ ⋅ ⋅= ⋅ ⋅ ⋅ = C2
Energien af den med brændslet samproducerede el (P) kan beregnes ud fra markens energiudbytte (E) og energieffektiviteten for samproduktionen af el (ηel), som kan findes i tabel 2:
GJ GJelha år ha årP E η⋅ ⋅= ⋅ C3
For methanol fremstillet fra piletræ har man f.eks. 204 GJ
ha årE ⋅= og ηel = 6 %:
204 0.06 12.24 3400 3,4GJ GJ kWh MWhha år ha år ha år ha årP ⋅ ⋅ ⋅ ⋅= ⋅ = = = C4
Et givent biobrændsel erstatter et tilsvarende fossilt brændsel (benzin eller diesel). Den del af markens energiindhold, som reelt findes i biobrændslet, er ( E η⋅ ). Når denne værdi multipliceres med forholdet mellem effektiviteten for udnyttelse af det syntetiske brændsel og det fortrængte fossile brændsel, α, får man den energi, som ”erstattes” af biobrændslet. Den erstattede energi svarer til massen af fortrængt fossilt brændsel
15
(mbenzin/diesel) ganget med brændværdien af det fossile brændsel (BVbenzin/diesel). Herudfra kan man så isolere den fortrængte masse af fossilt brændsel:
// /
kg benzin diesel GJbenzin diesel benzin dieselha år kgE m BVη α ⋅
⋅ ⋅ = ⋅ ⇔
[ ]//
/
GJkg benzin diesel ha år
benzin diesel ha år GJbenzin diesel kg
Em
BVη α⋅
⋅
⋅ ⋅ =
C5
Når den fortrængte masse af fossilt brændsel er kendt, kan man ud fra sammensætningen af det fossile brændsel, som er givet i tabel 5 i appendiks B, bestemme den fortrængte masse af CO2, da et kulstofatom ved forbrænding giver netop et CO2-molekyle. Efter samme princip beregnes den CO2 produktion, der fortrænges ved brug af den med transportbrændslerne samproducerede elektricitet. Den fortrængte masse af kul (mkul) kan beregnes ud fra brændværdien af kul (BVkul) givet i tabel 6 i appendiks B og energieffektiviteten af kulforbrænding (ηkul) som er opgivet i tabel 2:
kgGJ GJel kul kul kulha år ha år kgE m BVη η⋅ ⋅ ⋅ = ⋅ ⋅ ⇔
[ ]GJkg elha år
kul ha år GJkul kulkg
Em
BVηη
⋅⋅
⋅ = ⋅
C6
Når man kender den fortrængte masse af kul, kan man så beregne den fortrængte masse af CO2 ud fra vægtfraktionen af kulstof i kullet givet i appendiks B. Sammenligningen med energistyrelsens rapport er udført på følgende måde. Den totale energieffektivitet for brændstoffet (ηtot), dvs. den fraktion af markens energi der effektivt går til at flytte bilen, er opgivet i energistyrelsens rapport. Den energi som kræves for at flytte bilen, ε, er givet i COWIS rapport57, der tjener som forlæg, for energistyrelsens rapport. For markens energiudbytte er værdien fundet i denne note benyttet (se tabel 1). Med disse værdier kan man beregne den transportdistance (D), der kan opnås med et årsudbytte fra en hektar markareal:
[ ][ ]
GJtotha årkm
ha år GJkm
ED
ηε
⋅⋅
⋅= C7
Et eksempel kunne være beregningen for DME produceret ud fra piletræ. Som det kan ses i appendiks B er beregningsparametrene fra energistyrelsens rapport ηtot = 6 % og ε = 0,3672 MJ/km. Med 204 GJ
ha årE ⋅= fra denne note har man derfor:
3
204 0,11 6111,10,3672 10
GJha år km
ha årMJ GJkm MJ
D ⋅⋅−
⋅= =
⋅ C8
Til sammenligning er værdien, som er fundet i denne note 61882 kmha år⋅ .
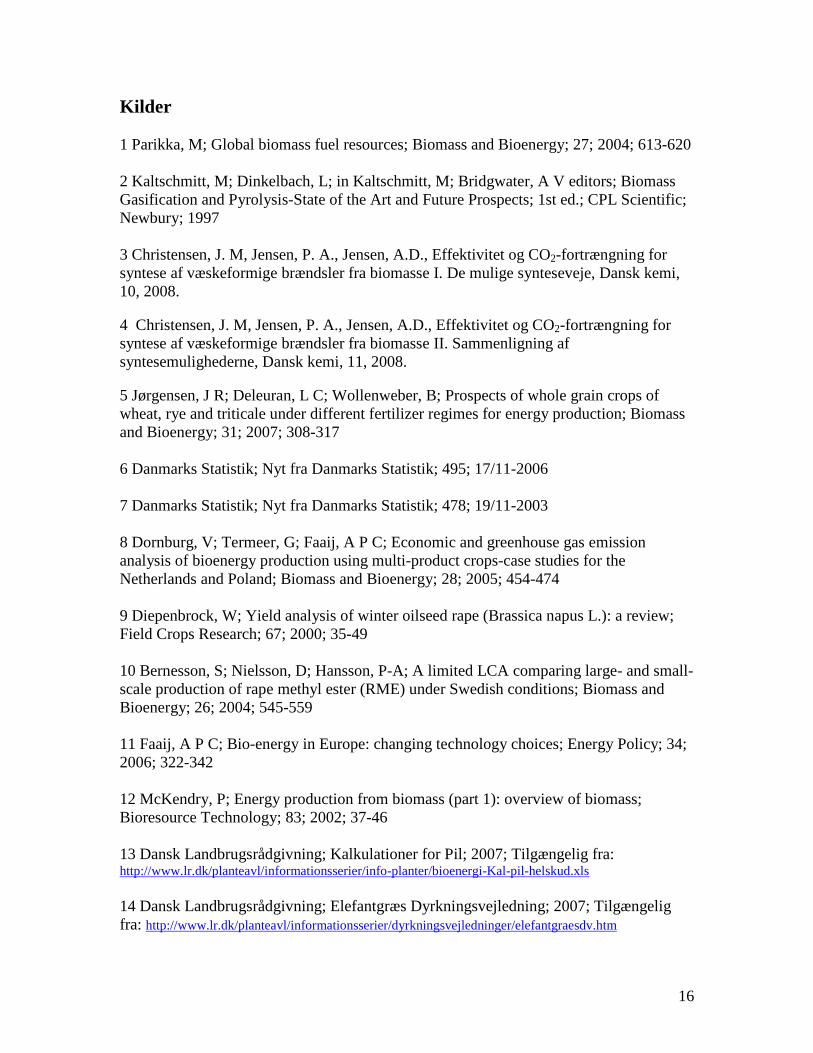
16
Kilder 1 Parikka, M; Global biomass fuel resources; Biomass and Bioenergy; 27; 2004; 613-620 2 Kaltschmitt, M; Dinkelbach, L; in Kaltschmitt, M; Bridgwater, A V editors; Biomass Gasification and Pyrolysis-State of the Art and Future Prospects; 1st ed.; CPL Scientific; Newbury; 1997 3 Christensen, J. M, Jensen, P. A., Jensen, A.D., Effektivitet og CO2-fortrængning for syntese af væskeformige brændsler fra biomasse I. De mulige synteseveje, Dansk kemi, 10, 2008. 4 Christensen, J. M, Jensen, P. A., Jensen, A.D., Effektivitet og CO2-fortrængning for syntese af væskeformige brændsler fra biomasse II. Sammenligning af syntesemulighederne, Dansk kemi, 11, 2008. 5 Jørgensen, J R; Deleuran, L C; Wollenweber, B; Prospects of whole grain crops of wheat, rye and triticale under different fertilizer regimes for energy production; Biomass and Bioenergy; 31; 2007; 308-317 6 Danmarks Statistik; Nyt fra Danmarks Statistik; 495; 17/11-2006 7 Danmarks Statistik; Nyt fra Danmarks Statistik; 478; 19/11-2003 8 Dornburg, V; Termeer, G; Faaij, A P C; Economic and greenhouse gas emission analysis of bioenergy production using multi-product crops-case studies for the Netherlands and Poland; Biomass and Bioenergy; 28; 2005; 454-474 9 Diepenbrock, W; Yield analysis of winter oilseed rape (Brassica napus L.): a review; Field Crops Research; 67; 2000; 35-49 10 Bernesson, S; Nielsson, D; Hansson, P-A; A limited LCA comparing large- and small-scale production of rape methyl ester (RME) under Swedish conditions; Biomass and Bioenergy; 26; 2004; 545-559 11 Faaij, A P C; Bio-energy in Europe: changing technology choices; Energy Policy; 34; 2006; 322-342 12 McKendry, P; Energy production from biomass (part 1): overview of biomass; Bioresource Technology; 83; 2002; 37-46 13 Dansk Landbrugsrådgivning; Kalkulationer for Pil; 2007; Tilgængelig fra: http://www.lr.dk/planteavl/informationsserier/info-planter/bioenergi-Kal-pil-helskud.xls 14 Dansk Landbrugsrådgivning; Elefantgræs Dyrkningsvejledning; 2007; Tilgængelig fra: http://www.lr.dk/planteavl/informationsserier/dyrkningsvejledninger/elefantgraesdv.htm
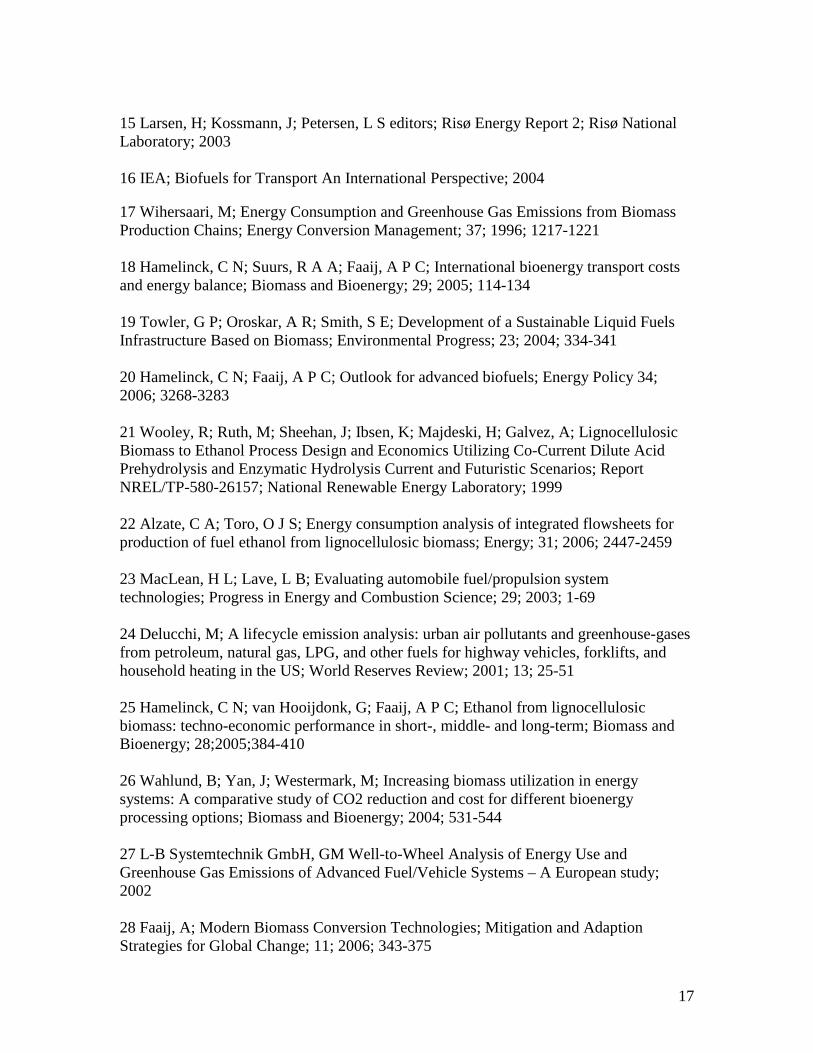
17
15 Larsen, H; Kossmann, J; Petersen, L S editors; Risø Energy Report 2; Risø National Laboratory; 2003 16 IEA; Biofuels for Transport An International Perspective; 2004 17 Wihersaari, M; Energy Consumption and Greenhouse Gas Emissions from Biomass Production Chains; Energy Conversion Management; 37; 1996; 1217-1221 18 Hamelinck, C N; Suurs, R A A; Faaij, A P C; International bioenergy transport costs and energy balance; Biomass and Bioenergy; 29; 2005; 114-134 19 Towler, G P; Oroskar, A R; Smith, S E; Development of a Sustainable Liquid Fuels Infrastructure Based on Biomass; Environmental Progress; 23; 2004; 334-341 20 Hamelinck, C N; Faaij, A P C; Outlook for advanced biofuels; Energy Policy 34; 2006; 3268-3283 21 Wooley, R; Ruth, M; Sheehan, J; Ibsen, K; Majdeski, H; Galvez, A; Lignocellulosic Biomass to Ethanol Process Design and Economics Utilizing Co-Current Dilute Acid Prehydrolysis and Enzymatic Hydrolysis Current and Futuristic Scenarios; Report NREL/TP-580-26157; National Renewable Energy Laboratory; 1999 22 Alzate, C A; Toro, O J S; Energy consumption analysis of integrated flowsheets for production of fuel ethanol from lignocellulosic biomass; Energy; 31; 2006; 2447-2459 23 MacLean, H L; Lave, L B; Evaluating automobile fuel/propulsion system technologies; Progress in Energy and Combustion Science; 29; 2003; 1-69 24 Delucchi, M; A lifecycle emission analysis: urban air pollutants and greenhouse-gases from petroleum, natural gas, LPG, and other fuels for highway vehicles, forklifts, and household heating in the US; World Reserves Review; 2001; 13; 25-51 25 Hamelinck, C N; van Hooijdonk, G; Faaij, A P C; Ethanol from lignocellulosic biomass: techno-economic performance in short-, middle- and long-term; Biomass and Bioenergy; 28;2005;384-410 26 Wahlund, B; Yan, J; Westermark, M; Increasing biomass utilization in energy systems: A comparative study of CO2 reduction and cost for different bioenergy processing options; Biomass and Bioenergy; 2004; 531-544 27 L-B Systemtechnik GmbH, GM Well-to-Wheel Analysis of Energy Use and Greenhouse Gas Emissions of Advanced Fuel/Vehicle Systems – A European study; 2002 28 Faaij, A; Modern Biomass Conversion Technologies; Mitigation and Adaption Strategies for Global Change; 11; 2006; 343-375
18
29 Hamelinck, C N; Faaij, A; Future Prospects for production of methanol and hydrogen from biomass; Journal of Power Sources; 111; 2002; 1-22 30 Ahlvik, P; Brandberg, Å; Well-to-Wheel Efficiency For alternative fuels from natural gas or biomass; Report for the Swedish National Road Administration; 2001 31 Shaeiwitz, J A; Whiting, W B; Turton, R; Torries, F; Saymansky, J; Tandon, M; Maier, R W; Haught, B; Dodd, J; The Economical Production of Alcoholic Fuels from Coal-Derived Synthesis Gas, Chapters 7-14; West Virginia University; 1999 32 Elam, N Project Manager; The bio-DME project Phase 1 (Non-confidential version); Report to the Swedish National Energy Administration; Atrax Energi; Stockholm; 2002 33 Kam, A Y; Schreiner, M; Yurchak, S; in Meyers, R A editor; Handbook of Synfuels Technology; McGraw-Hill; USA; 1984 34 Tijmensen, M J A; Faaij, A P C; Hamelinck, C N; van Hardeveld, M R M; Exploration of the possibilities for production of Fischer Tropsch liquids and power via biomass gasification; Biomass and Bioenergy; 23; 2002; 129-152 35 Bugge, J; Kjær, S; Blum, R; High power coal fired power plants developments and perspectives; Energy; 31; 2006; 1437-1445 36 Olag, G A; Goeppert, A; Prakash, G K S; The Methanol Economy; 1st ed.; Wiley-VCH; Germany; 2006 37 Alternative Fuels Contact Group; Market Development of Alternative Fuels; 2003 38 Spath, P L; Mann, M K; Amos, W A; Update of Hydrogen from Biomass – Determination of the Delivered Cost of Hydrogen Milestone Completion Report; Report NREL/MP-510-33112; National Renewable Energy Laboratory; 2003 39 Baxter, L; Biomass-coal co-combustion: opportunity for affordable renewable enery; Fuel; 84; 2005; 1295-1302 40 Phillips, S; Aden, A; Jechura, J; Dayton, D; Eggeman, T; Thermochemical Ethanol via Indirect Gasification and Mixed Alcohol Synthesis of Lignocellulosic biomass; Report NREL/TP-510-41168; National Renewable Energy Laboratory; 2007 41 Danmarks Statistik; Nyt fra Danmarks Statistik; 418; 22/9-2006 42 Semelsberger, T; Borup, R L; Greene, H L; Dimethyl ether (DME) as an alternative fuel; Journal of Power Sources; 156; 2006; 497-511 43 Agarwal, A K; Biofuels (alcohols and biodiesel) applications as fuels for internal combustion engines; Progress in Energy and Combustion Science; 33; 2007; 233-271
19
44 Lave, L; MacLean, H; Hendrickson, C; Lankey, R; Life-Cycle Analysis of Alternative Automotive Fuel/Propulstion Technologies; Environmental Science and Technology; 34; 2000; 3498-3606 45 Larsen, G; Glejtrup, E redaktører; Morgendagens transportbrændsler Danske perspektiver; Teknologirådet rapport 2006/15; 2006 46 Personal communication with Spencer Sorenson, associate professor at MEK-DTU 47 Delucchi, M A; A Lifecycle Emissions Model(LEM): Lifecycle Emissions from transportation fuels, motor vehicles, transportation modes, electricity use, heating and cooking fuels, and materials; Institute of Transportation Fuels University of California; 2003 48 Wender, I; Reactions of synthesis gas; Fuel Processing Technology; 48; 1996; 189-297 49 Kavalov, B; Peteves, S D; Status and Perspectives of Biomass-to-Liquid Fuels in the European Union; EUR21745EN; Directorate-General Joint Research Centre of the European Commission; 2005 50 Anonymous; Thermal gasification of biomass: success stories; Euroheat and Power; 1; 2005; 18-21 51 Hansen, J B; Syngas Routes to Alternative Fuels Efficiencies and Potential with Update on current projects; SYNBIOS Conference; Stockholm; 2005 52 Fleisch, T H; Sills, R A; Briscoe, M D; 2002 – Emergence of the Gas-to-Liquids Industry: a Review of Global GTL Developments; Journal of Natural Gas Chemistry; 11; 2002; 1-14 53 Anonymous; Range Fuels to build first wood cellulosic ethanol plant in Georgia, USA; Focus on Catalysis; 4; 2007; 5 54 Volvo Truck Corporation; Volvo Trucks and The Environment; 2007 55 Wurster, R; GM Well-to-Wheel Studie – Ergebnisse und Schlüsse sowie Vergleich mit anderen Arbeiten und Ausblick auf Kraftstoffpotentiale und –kosten; L-B Systemtechnik GmBH; 2003 56 Energistyrelsen; Udkast til rapport Alternative drivmidler i transportsektoren (sendt til høring juni 2007); juni 2007 57 COWI; Energistyrelsen Teknologivurdering af alternative drivmidler til transportsektoren rapport; Maj 2007
20
58 Alternative Fuels Data Center; www.eere.energy.gov/afdc; March 2007 59 Herman, R G; Advances in catalytic synthesis and utilization of higher alcohols; Catalysis Today; 55; 2000; 233-245 60 Sie, S T; Senden, M M G; van Wechem, H M H; Conversion of natural gas to transportation fuels via the shell middle distillate synthesis process (SMDS); Catalysis Today; 8; 1991; 371-394 61 Lide, D R editor; Handbook of Chemistry and Physics; 78th ed.; CRC Press; New York; 1997 62 Minteer, S editor; Alcoholic Fuels; CRC Press; 1st ed.; USA; 2006 63 MacLean, H L; Lave, L B; Evaluating automobile fuel/propulsion system technologies; Progress in Energy and Combustion Sciences; 29; 2003; 1-69 64 Ogawa, T; Inoue, N; Shikada, T; Ohno, Y; Direct Dimethyl Ether Synthesis; Journal of Natural Gas Chemistry; 12; 2003; 219-227 65 Peng, X D; Toseland, B A; Tijm, P J A; Kinetic understanding of the chemical synergy under LPDME conditions - once-through applications; Chemical Engineering Science; 54; 1999; 2787-2792 66 Semelsberger, T A; Borup, R L; Greene, H L; Dimethyl ether (DME) as an alternative fuel; Journal of Power Sources; 156; 2006; 497-511 67 Crookes, R J; Bob-Manuel, K D H; RME or DME: A preferred alternative fuel option for future diesel engine operation; Energy Conversion and Management; 48; 2007; 2971-2977 68 Katzer, J Executive Director; The Future of Coal Options for a Carbon-Constrained World; 2007; Massachusetts Institute of Technology; Available from: http://web.mit.edu/coal/