Embed Size (px)
Citation preview

Transforming Urban Mobility
DTU International Energy Report 2019
Edited by Birte Holst Jørgensen, Katrine Krogh Andersen and Otto Anker Nielsen, Technical University of Denmark
DTU International Energy Report 2019Transforming Urban Mobility
October 2019
Edited byBirte Holst Jørgensen, Katrine Krogh Andersen and Otto Anker Nielsen, Technical University of Denmark
Reviewed bySonia Yeh, Chalmers University of Technology (chapters 3, 4, 5, 6, 7)
William D’haeseleer, KU Leuven (chapters 8, 9, 10, 12)
Joel Franklin, KTH Royal Institute of Technology (chapter 11)
Yusak Susilo, KTH Royal Institute of Technology (chapter 11)
DesignStep Print Power
PrintStep Print Power
ISBN 978-87-93458-67-3
DTU International Energy Report 2019
Transforming Urban Mobility
Edited by Birte Holst Jørgensen, Katrine Krogh Andersen and Otto Anker Nielsen, Technical University of Denmark
Reviewed by Sonya Yeh, Chalmers University of Technology, William D’haeseleer, KU Leuven, Joel Franklin and Yusak Susilo, KTH Royal Institute of Technology

Contents Preface . . . . . . . . . . . . . . . . . . . . . . . . . . . . . . . . . . . . . . . . . . . . . . . . . . . . . . . . . . . . . . . . . . . . . . . . . . . . . . . . . . . . . . . . . 7
Chapter 1 Transforming urban mobility: key findings and recommendations . . . . . . . . . . . . . . . . . . . . . . . . . . . . . . . . . . . 8
Chapter 2 Executive summary . . . . . . . . . . . . . . . . . . . . . . . . . . . . . . . . . . . . . . . . . . . . . . . . . . . . . . . . . . . . . . . . . . . . . . . . . . . . .12
Chapter 3 Global outlook for the transport sector in energy scenarios . . . . . . . . . . . . . . . . . . . . . . . . . . . . . . . . . . . . . . . .20
Chapter 4 Mobility in cities in emerging economies: trends and drivers . . . . . . . . . . . . . . . . . . . . . . . . . . . . . . . . . . . . . . .28
Chapter 5 Active transport modes . . . . . . . . . . . . . . . . . . . . . . . . . . . . . . . . . . . . . . . . . . . . . . . . . . . . . . . . . . . . . . . . . . . . . . . . .38
Chapter 6 Smart mobility . . . . . . . . . . . . . . . . . . . . . . . . . . . . . . . . . . . . . . . . . . . . . . . . . . . . . . . . . . . . . . . . . . . . . . . . . . . . . . . . .50
Chapter 7 Freight, logistics and the delivery of goods in cities . . . . . . . . . . . . . . . . . . . . . . . . . . . . . . . . . . . . . . . . . . . . . . .62
Chapter 8 Integrated energy systems and transport electrification . . . . . . . . . . . . . . . . . . . . . . . . . . . . . . . . . . . . . . . . . .72
Chapter 9 Alternative fuels . . . . . . . . . . . . . . . . . . . . . . . . . . . . . . . . . . . . . . . . . . . . . . . . . . . . . . . . . . . . . . . . . . . . . . . . . . . . . . .86
Chapter 10 Environmental sustainability of different transport modes . . . . . . . . . . . . . . . . . . . . . . . . . . . . . . . . . . . . . . . 102
Chapter 11 Urban mobility in transformation: demands on education . . . . . . . . . . . . . . . . . . . . . . . . . . . . . . . . . . . . . . . . 112
Chapter 12 A network view of research and development in sustainable urban mobility . . . . . . . . . . . . . . . . . . . . . . 120
Abbreviations . . . . . . . . . . . . . . . . . . . . . . . . . . . . . . . . . . . . . . . . . . . . . . . . . . . . . . . . . . . . . . . . . . . . . . . . . . . . . . . . 129
DTU International Energy Report 2019 DTU International Energy Report 2019
Contents – Page 5
PrefaceDTU International Energy Report 2019 presents DTU’s perspective on the issue of the transformation of urban mobility . The transport sector connects people across space and enables goods to be exchanged, but it also consumes energy and contributes heavily to CO2 emis-sions and local air pollution, with huge impacts on the human, environmental and economic costs . With more people, and with more of them living in urban areas, cit-ies offer opportunities for transforming urban mobility . The report presents recent research on three interre-lated areas that will be decisive in developing sustain-able urban mobility solutions: how to avoid unnecessary transport, how to shift to eco-efficient transport modes, and how to improve technologies, fuels and infrastruc-ture . The report also describes the future educational needs of urban mobility and presents a network analysis of the areas of research that are influencing urban mobility solutions .
International collaboration is an integral part of DTU’s activities and a prerequisite for its status as an inter-national elite university, a status that is consolidated, and continuously developed, through the work of its researchers, students and administration . Our objective is for DTU to become one of the five leading technical universities in Europe . Our ambition is to attract the best researchers and research students from both Denmark and abroad, as well as to maintain DTU as an attractive collaboration partner for other leading research environ-ments worldwide .
A strong network of partner universities strengthens DTU’s position as an international elite university . DTU is a member of alliances and strategic partnerships with universities from the Nordic countries, Europe and Asia . Furthermore, it also has a number of close collaborators from different parts of the world, covering many of the C40 Cities .
DTU International Energy Report series presents global, regional and national perspectives on current and future
energy issues . The individual chapters in the reports are written by DTU researchers in cooperation with leading
Danish and international experts .
Each report is based on internationally recognized scientific materials and is fully referenced . The reports are also
refereed by independent international experts before being edited, produced and published in accordance with the
highest international quality standards .
The target readership for the report is DTU colleagues, collaborating partners and clients, funding organizations,
institutional investors, ministries and authorities, and international organizations such as the European Union (EU),
International Energy Agency (IEA), International Renewable Energy Agency (IRENA), World Bank, World Energy
Council, C40 Cities, Global Green Growth Institute (GGGI), Partnering for Green Growth and the Global Goals 2030
(P4G) and the United Nations (UN) .
Preface – Page 7
DTU International Energy Report 2019 DTU International Energy Report 2019
connectivity, it is easier for consumers to make more efficient choices when going from A to B – take the cycle or public transport or just select a slower but more energy-efficient route – and thereby influence real-time demand in time and space . Cities can enable greater public transport capacity and efficiency by having a door-to-door perspective in the overall organization, planning and operation of public transport, providing door-to-door mobility information and guidance systems and by facilitating intermodal travel chains .
If individual mobility services can be integrated with public transport systems, the overall efficiency of urban mobility systems can be enhanced, thus helping to avoid unsustainable modes and enable efficient demand man-agement . Although smart mobility may fill the gap be-tween the individual solution and mass transit, thereby impacting on congestion, air pollution, road safety, noise and costs, recent studies show that this is not always done in a resource-efficient way . For example, car-shar-ing subscribers may reduce the individual vehicle mile-age but increase their own weekly mileage .
With regard to freight, logistics and delivery services, digitalization and smart mobility services enable unnec-essary vehicle movements to be avoided by optimiz-ing deliveries, consolidating goods flows and moving towards smaller and lighter freight vehicles . Truck platooning are also relevant for urban freight transport, using semi-automated technology to coordinate traffic flow, infrastructure and the flow of goods to and from the warehouses and terminals . On the down-side, the deployment of new technologies and vehicles will require costly new investments by operators and urban consolidation centers, while the additional handling needed will increase the unit costs of the last mile .
Shift means improving trip efficiency by means of a modal shift from the most energy-consuming transport mode towards more environmentally friendly modes .
The transition towards an advanced multi-modal trans-port system requires the effective optimization of the entire transport network across a number of perfor-mance areas . Active network management and a better orchestration, organization and optimization of traffic flows in the system may play a key role in this process . Information and communication technologies, big data and real-time information on supply and demand may promote such modal shifts efficiently .
A reduction in personal-use and single-occupancy vehi-cles requires adequate options for public transport, other shared forms of transport, cycling and walking . Cities around the world are trying to increase the share of active transport modes, but they are having to face the challenge that this shift is influenced by many factors . Cycling is considered an everyday mode of transport for all age groups and genders in Copenhagen and Amster-dam, while walking is popular in some East European cities . Walkability and bikeability are closely related to accessibility, environmental qualities, safe sidewalks and bike paths for pedestrians and cyclists .
Future mobility is expected to be autonomous, con-nected, electric and shared and to contribute to the efficiency and safety of transport systems . Smart mobility solutions impacts congestion, air pollution, road safety, noise, intermodality and costs, but not always in a resource efficient way . Whether car-sharing is more eco-efficient than individual car ownership is a matter of whether it increases total person transports . Car-sharing in combination with autonomous driving may result in a rebound effect due to possible increases in the number of potential users and the ease and convenience of the system . Smart mobility solutions should be part of a much broader mobility revolution that puts alternative modes of transport to the forefront . Substantial gains in energy consumption and emissions can be achieved through significant demand shifts and integration of the entire smart mobility eco-system where stronger pub-lic-private partnerships may foster multi-modal transport solutions, increase the efficiency of goods transport and shift greater volumes of passenger traffic toward public transport or other shared modes .
Improve focuses on vehicle and fuel efficiency, as well as on better infrastructure .
Transport electrification can substantially contribute to breaking transport’s dependence on oil and to decreas-ing CO2 drastically, as well as emissions of air pollutants . The increasingly decarbonized generation of electric-ity will provide cleaner electricity to propel electric drivetrains and electric vehicles (EVs) and vessels, while electric vehicles will be able to provide storage services to the grid, favoring the further penetration of renew-ables . Urban living labs such as Energylab Nordhavn and Frederiksberg Forsyning, working in close cooperation with university labs, have demonstrated that EVs can effectively provide frequency control to support more renewables entering the power system and even 100% EV penetration, with only limited additional load at peak
Transforming urban mobility is the focus of DTU Inter-national Energy Report 2019 . Urban areas are home to more than 50% of the world’s population and are the site of most of its built assets and economic activities . As more than two billion people are added to the global population in the coming decades and as urban popu-lations continue to grow (70% by 2050), the question arises: how can people and the goods they require be moved more efficiently and effectively than they are today?
The existing transport system faces significant chal-lenges . Traffic congestion, noise, air pollution and traffic accidents impose tremendous human and economic costs on society . Also, transport accounts for more than half of global oil demand, making it a key contributor to climate change . In many places, access to affordable and convenient transport is far from equitable .
Cities will require mobility solutions that are sustain-able, affordable, secure, inclusive and integrated with customer-centric infrastructure and services . This trans-formation rests on the intertwined pillars of mobility and energy, both of which will require radical changes to a low-carbon economy able to cope with increasing populations and economic growth .
This transformation will require a holistic, systemic approach, one that acts in the intersection between technology, infrastructure, multi-mode mobility and behavioral changes and that seeks to achieve significant GHG emissions reductions, reduced energy consumption and less congestion, the ultimate objective being to cre-ate livable and sustainable cities . Research and innova-tion are playing a major role by developing portfolios of low-carbon, cost-efficient, high-performance technolog-ical and non-technological solutions at different scales and time-frames (short-, medium- and long-term) .
Transforming urban mobility and getting transport on track to keep the global increase in average tempera-
tures well below 2 degrees C will require a broad set of
mea-sures, like those analysed in the International Energy Agency’s (IEA) Sustainable Development Scenario (SDS) . This comprehensive strategy can be broken down into three distinct areas:
• Avoid/reduce travel activity• Shift to more efficient modes of transport• Improve transport technology, fuel efficiency and
infrastructure
Avoid/reduce refers to the need to improve the overall efficiency of the transport system and thereby the need to travel .
New economic and technological trends are influencing land-use patterns and people’s lifestyles . Digitalization, on-demand mobility and flexible and cleaner energy production can increase the chances of higher density development and a more balanced mix of land uses (resi-dential, commercial, production, schools, parks), poten-tially reducing the demand for unsustainable modes of travel . This is not a straightforward path for mega-cities in emerging economies such as Beijing, Delhi, São Paulo and Cape Town, each of which has its specific devel-opment trajectory, density and increase in motorized modes of transport . What is interesting, however, is that non-motorized transport seems to have remained stable in cities like Delhi, São Paulo and Cape Town, for underly-ing reasons yet to be explored . Further, car use in Beijing has peaked due to a combination of investment in public transport infrastructure, regulatory constraints and the roll-out of (shared) bicycle concepts and bike paths .
There are numerous bottlenecks within and across transport modes resulting in system-wide capacity constraints, traffic jams and increased levels of envi-ronmental impact . With new digital technologies and
Page 8 – Transforming urban mobility: key findings and recommendations Transforming urban mobility: key findings and recommendations – Page 9
DTU International Energy Report 2019 DTU International Energy Report 2019
Chapter 1
Transforming urban mobility: key findings and recommendationsBirte Holst Jørgensen, Katrine Krogh Andersen and Otto Anker Nielsen, DTU

Recommendations:
• Opt for a mission-driven RD&D approach to transforming and decarbonizing urban mobility.These problem-specific challenges of how to avoid, shift and improve transport can only be solved by workingtogether across all technical, natural science and social science disciplines, as well as across institutions andnational borders, as the interconnectedness of DTU research demonstrates . By definition research does notrecognize boundaries, and as Pasteur’s quadrant illustrates, it is possible to conduct research that contributes toboth the quest for understanding and considerations of use . Such integrated energy and transport solutions arenot a question of picking technological winners but of enabling decision-makers to facilitate, create and shapemarkets so that the best, most eco-efficient and most socially acceptable options are chosen . The prospect ofsmart mobility is raising ethical challenges and cybersecurity concerns, which also need to be addressed byresearchers and practitioners alike .
• Facilitate urban living labs in cities around the world.Urban living labs provide an ideal opportunity to test different aspects of integrated energy and mobility solu-tions, including by allowing regulatory exemptions from the existing legal framework in a sandbox setting . Theyallow the impact for both technologies and frameworks to be evaluated before rolling out regulatory schemesfor the whole country . Across the world, urban living labs are providing a great opportunity for in-depth policylearning, and they can be fed back into decision-making for urban planning, new regulatory frameworks andbusiness models .
• Step up policy support and innovation to reduce the costs of alternative fuels.While future urban mobility may to a large extent be electrified, other parts of the transport sector, such asaviation, shipping and heavy/duty vehicles, will rely on competitive, low-carbon, sustainable fuels .
• Engage actively in matching the supply and demand of skills relevant for future mobility solutions.Insights, together with educational shifts, re- and upskilling, are needed to manage the radical transformation ofurban transport sectors that is required . Education needs to race ahead of technology, not vice versa .
• Strengthen partnerships: engines of change.Transformations of urban mobility are made by and for people, making cities more liveable and sustainable . Theywill need to be co-created by multiple stakeholders by means of dialogue, participatory processes and account-able, engaged and committed partnerships .
times . Living labs generate important knowledge and learning that would otherwise be difficult to obtain, but regulatory and legal constraints may hamper real-life testing and demonstrations of new urban mobility solu-tions . Therefore, urban sandbox experiments, show-case regions and test regions are emerging where not only is the technology tested, new business models and frame-work conditions are exempted from regulations with the consent of the consumers involved .
While battery-electric powertrains are becoming viable options for many vehicles, aviation, waterborne trans-port and certain heavy-duty road vehicles are likely to continue relying largely on combustion engines and liquid fuels in the coming decades, including in cities . Producing such fuels of non-fossil origin will be an important stepping stone to reducing energy intensi-ties in order to decarbonize the whole transport sector . Such green or alternative fuels include synthetic fuels, hydrogen and advanced biofuels, fuel blends and engine optimization . In order to compare the different technol-
ogy and mobility options, life-cycle assessments (LCA) of different transport solutions compare the eco-effi-ciency of products, services and the whole system, thus enabling decision-makers to make informed decisions and choices . For example the economic benefits of a fuel efficient vehicle may be more attractive relative to other transport modes such as public transport .
Cities will play a key role in accelerating the transfor-mation of urban mobility, by unleashing the potential of systemic innovation and the large-scale adoption of new technologies and modes of mobility . Over the past de-cades DTU researchers have contributed to this agenda, often in close cooperation with more than three hundred institutions in more than forty countries . This research is characterized by a deep interconnectedness between energy, policy/regulation, infrastructure, new electric and alternative fuel technologies, system-modelling, the increasing importance of alternative modes of transport, and shifting preferences, attitudes and behavior on the part of mobility users .
Page 10 – Transforming urban mobility: key findings and recommendations Transforming urban mobility: key findings and recommendations – Page 11
DTU International Energy Report 2019 DTU International Energy Report 2019
Transforming urban mobilityDTU International Energy Report 2019 focuses on sustainable mobility and transport systems in cities . The transport sector connects people across space and enables goods to be exchanged, but it also consumes energy, contributes heavily to CO2 emissions and local air
pollution, and imposes tremendous human and economic costs on society . Cities also offer opportunities for transforming urban mobility . Cities will require mobility solutions that are sustainable, affordable, secure, inclu-sive and integrated with the wider urban infrastructure and services, the ultimate objective being to create liveable and sustainable cities . For this to happen, a systemic transformation is needed, which will take place in the intersection between technology, infrastructure, multi-mode mobility and behavioural changes . This is summarized in three interrelated areas: how to avoid unnecessary transport, how to shift to eco-efficient modes of transport, and how to improve technologies, fuels and infrastructure . The report also addresses future educational needs in the area of urban mobility and presents a network analysis of the areas of research that are influencing urban mobility solutions .
Global outlook on transportationThe global energy outlook on transportation addresses the energy- and climate-related challenges in the trans-port sector and analyses two pathways through which the sector can contribute to a low-carbon future . Today
the transport sector accounts for almost one-third of final energy consumption, produces approximately one-third of global energy-related CO2 emissions and
is primarily responsible for urban air pollution . Cities are expected to increase the impact on global energy demand and energy-related emissions . This represents a challenge but also an opportunity in transforming urban mobility . Growing population and income levels, flexible freight transport, e-commerce and digital technologies in cities are key drivers of transport activities . However, thanks to high population densities and travel patterns characterized by shorter distances, cities can be leaders in achieving active transport modes, public transport and the uptake of sustainable transport technologies such as electric vehicles (EVs) . Getting transport on track to keep the rise in average global temperatures to well below 2⁰C requires putting into practice a broad set of “avoid, shift and improve” measures .
In this chapter, the outlook for a low-carbon transport sector is analysed in two scenarios: the New Policies Scenario (NPS) and the Sustainable Development Sce-nario (SDS) . The first scenario (NPS) analyses the out-
look towards 2040, taking into consideration officially declared policy measures and regulations, including Nationally Determined Contributions under the Paris Agreement, and taking known technologies into account . In this scenario, total energy-related CO2 emissions rise by 10% in 2040 compared to 2017, which will result in a temperature increase of 2 .7⁰C . The second scenario (SDS) analyses how the energy and transport sectors can meet the Paris Agreement while also achieving a drastic reduction in air pollution and wider access to energy by means of the large-scale adoption of “avoid/shift/improve” measures in transport . The main mitiga-tion levers include regulations to reduce the frequency of use of and distance travelled by energy-intensive modes of transport, a shift towards more efficient modes of transport, and the adoption of energy-efficient technologies for vehicles and of low-carbon fuels .
Mobility in cities in emerging economiesFuture mobility trends will be determined by how cities in emerging economies address the huge challenges associated with increasing urbanization and growing per capita incomes . This chapter analyses mobility trends and challenges in four megacities in four emerging economy countries in three continents: São Paulo (Bra-zil), Beijing (China), Delhi (India) and Cape Town (South Africa) . These four cities are quite diverse in terms of their demographic and economic characteristics and belong to C40 Cities . The four countries differ in terms of their respective developments, trajectories, mobility choices and impacts . All four cities have historically been densely populated and with time have further densified, except for Beijing .
In terms of mobility trends, Beijing has witnessed a decline in walking and cycling, whereas in other cities mode shares for non⁰motorized transport (NMT) have remained stable . São Paulo has most of its employment heavily concentrated in its central areas, while its low⁰income residents have settled on the peripheries, where a significant proportion of the poor population still walks . The situation in Cape Town is similar, with a large proportion of the population being poor and making many walking trips . Delhi is similar to many Indian cities, with mixed land use and a high share of walking and cycling trips (around 40%) . The shift in modal shares from NMT is mainly to modes of public transport, where available, and to private vehicles .
In fact, the mode shares of private motorized vehicles have shown increasing trends except in São Paulo and Beijing . Beijing has experienced a peak in car use,
Chapter 2
Executive summaryBirte Holst Jørgensen, DTU
Executive summary – Page 13
DTU International Energy Report 2019 DTU International Energy Report 2019
Many different factors play a role in the uptake of cycling and need to be addressed . What is required is an integrated package of complementary interventions that address people differently, taking account of their current travel behaviour and intentions, as well as the existing urban lay-out and infrastructure .
Smart mobilityNew, smart mobility solutions are designed around individual needs, usually with operations using new technology and often with resource-sharing . Smart mobility enables many solutions, ranging from shared on-demand mobility (car-sharing, bike-sharing, ride-hail-ing etc .) to integrated solutions (mobility as a service, apps for informed multimodal trip planning) .
Smart mobility is primarily rooted in recent technological progress and digitalization where sensors, information and communication technology, and developments in computer science define mobility smartness . The sensors constantly monitor the main constituents of a transport system, namely vehicles, infrastructure and people . The sensors in a car monitor the hardware, driving, position and environment . Infrastructure sensors are used for intelligent traffic management systems, environment and parking . Sensors in smart phones and wearable electronics can also be used as personalized mobility services . The totality of digitalization produces a giant digital footprint, which can be used to monitor online transactions and smart-card usage and to predict transport supply and demand . Information and commu-nication technology in this context relies on wireless data collection from vehicles, infrastructure, people, the digital footprint and communication between them . Vehicle-to-everything communication expands the technical options and includes tests on the platooning of trucks and autonomous fleets, as well as facilitating intelligent traffic management, parking assistance, driv-ing assistance and remote diagnostics and positioning . Analysing the vast amounts of data from sensors can support decision-making in respect of smart mobility, including user behaviour, transport demand prediction and autonomous driving .
These technological features are giving rise to four operational features of smart mobility: flexibility, responsiveness, personalization and efficiency . From a traveller’s perspective, flexibility relies on cost-effective gains in terms of modal, spatial and temporal accessi-bility for handling anticipated changes in the operating environment . Responsiveness is achieved through demand prediction, supply optimization and the interplay
between the two . Personalization is achieved through interface design, product offering, payment and other service integration or information provision . Privacy challenges requiring data-processing and complexity are challenges addressed by research . Lastly, efficiency in smart mobility is related to resource allocation, mobility performance, safety, energy and the environment .
New mobility trends are based on rapid technological progress and are rooted in completely new business models . Shared and on-demand mobility are booming in densely populated cities and are particularly popular with the younger generation and medium to high-in-come urban populations . Future mobility is expected to be connected and autonomous, synchronized into fleets and using V2X communication and artificial intelligence . Traditional public-policy instruments such as investment, pricing or regulation can be complemented by nudges that redirect behaviour through slight interventions . Coordination among mobility providers will increase the availability of services, with smooth multi-modal transi-tions and the integration of payment and information .
Smart mobility has impacts on congestion, air pollution, road safety, noise, intermodality and costs, but not always in resource-efficient ways, as shown in recent studies . Nonetheless, substantial gains in energy and emissions can be achieved through significant changes in demand and the integration of the entire smart mobil-ity eco-system, where stronger public-private partner-ships may dramatically impact on modal shifts, mileage, emissions and accessibility .
Freight, logistics and delivery of goodsThe transport of freight and goods in and out of cities spans a wide range of industrial supplies, finished goods and returns . The main challenge is how to minimize operating costs while minimizing the negative effects of urban freight transport . Private, public, commercial and industrial consumers demand goods to be delivered for consumption or further refinement, generating waste and other returns to be sent in the opposite direction . Urban freight and logistics are subject to the unit costs of the last mile due to low or medium fill rates in small- or medium-capacity vehicles operating in congested areas . The sector involves many different stakeholders, ranging from consumers living in the city, commuters and tourists to commercial businesses and industry and transport operators and shippers . Cities face the dilemma of how to make the city liveable with restricted or regulated traffic and access to good infrastructure while also allowing for multiple economic activities .
whereas Cape Town has traditionally been a car⁰based economy, meaning that the share of car trips remains high . Delhi has a better public transport system than other Indian cities, despite which modes of private trans-port account for 36% of all trips, and car ownership has risen 3 .5 times in ten years .
Cities in emerging economies are quite dense and provide opportunities for public transport and for shared and on-demand mobility solutions . Cities are investing in transit systems, mainly rail-based systems, to increase public transport . Although the ridership of these transit systems has increased, the share of public transport has not increased significantly, except for Beijing, which has a higher share of rides, as well as of public transport . China and India are witnessing a transformation towards on-demand transportation, accounting for three-quar-ters of the market for this mobility service . In China, ride-sharing is considered a mode of public transport and is led by the company Didi Chuxing . In India on-demand transportation has become an important mode of trans-port, provided by commercial taxis such as Ola and Uber .
Fuel efficiency has improved across all vehicle sizes, but efficiency in similar vehicle-size categories varies across countries . More fuel-efficient cars are also available in emerging economies, but the impact on overall fuel efficiency is being offset by increasing numbers of medium-sized vehicles . Electric vehicle (EV) policies are now in place in all four countries, but none of them, except for China, has any significant share of EVs . China is at the forefront of EVs, which make up 2 .3% of the home market but 50% of the global EV market . China has implemented policies at all levels, including at city level, placing restrictions on the use of fossil-fuel cars and also providing incentives such as access to bus lanes, free parking, toll exemptions, insurance exemptions and local tax exemptions for electric vehicles .
Active transport modesCities around the world are currently trying to increase their shares of active transport modes, most importantly walking and cycling, in order to make themselves more sustainable and liveable . Social, environmental and in-dividual factors influence when active transport modes are used .
Social factors and status associated with different transport modes vary considerably between countries and regions . The Netherlands and Denmark are the leading cycling countries in Europe, while East European countries like Romania and Bulgaria are dominant in
walking . Walking may reflect economic disadvantages and limitations in alternative modes of transport rather than preferences, but it may also reflect different cultures and traditions . Cycling is considered an every-day mode of transport in Denmark and the Netherlands, while people in other countries may consider it abnormal or associated with a low social status .
Environmental factors are related to urban densities and accessibility as preconditions for shorter travel distances and the use of active travel modes . There is a positive relationship between density, land-use mix and both walking and cycling . Walkability and bikeability are as-sociated with access conditions, environmental qualities and infrastructure for pedestrians and bicycles . Prefer-ences for route choices differ by region; cyclists in Co-penhagen, for example, prefer elevated cycle tracks next to the road, whereas cyclists in Oregon put a relatively high value on off-street cycle paths . More generally, dedicated cycle tracks and sidewalks, separated from motor traffic, are considered a fundamental principle of road safety and active-mode mobility .
Individual factors are context-specific . In high-cycling countries all age groups and genders are well repre-sented, whereas in low-cycling countries women and the elderly are underrepresented, which may be linked to differences in safety perceptions . Household mobility needs may facilitate car use, but bicycles can compete with the car in a city like Copenhagen that facilitates cycling . Travel mode decisions are influenced not only by functional but also by symbolic and affective motives, as well as by social norms . Cycling initiatives such as on-line platforms can fulfil both functional and social roles, while health-related motives also seem to be an important factor in cycling .
Modal shifts from cars to active modes of transport are influenced by “hard” measures such as better infra-structure and car-restrictive policies, as well as “soft” measures such as information provision and awareness campaigns . Infrastructural improvements and mainte-nance are not just about sufficient and safe pavements, but also about cycle tracks and sidewalks that are sepa-rated from motor traffic . Car-restrictive policies and park-ing-management policies are likely to increase the costs and difficulties of travelling by car, thus favouring other modes . Also, the taxation of cars and fuels influences choice of travel mode . In aiming to encourage voluntary changes in mode choice, theory-based interventions that include self-monitoring and intention-formation techniques have shown the most promising results .
Page 14 – Executive summary Executive summary – Page 15
DTU International Energy Report 2019 DTU International Energy Report 2019
replace conventional power plants in supporting the use of renewables in the electric power system . In addition, a 50% EV penetration would not pose a serious threat to the 400V distribution grid . However, to fully leverage the flexibility of EVs, the local grid should be moderately reinforced and smart grids must be expanded .
Other national demonstration projects are currently being undertaken in real-life settings . The Frederiksberg utility and partners are conducting commercial tests focusing on scaling up, real grid support, daily operations and the business aspects of how, when and how much to use EVs to support the electric grid .
These living labs have generated results and enabled learning otherwise difficult to obtain . This includes staging experiments in real-life conditions with real-life interactions and human behaviour . In order to improve technical developments and develop new business mod-els taking note of human behaviour, it may be beneficial to exempt living labs from the ordinary legal and regu-latory frameworks for a limited period . Further research also includes ethical and safety measures related to such smart, integrated energy and mobility systems .
Alternative fuelsAlternative fuels are important building blocks in reducing energy intensities and decarbonizing the transport sector . Liquid hydrocarbons like diesel, jet fuel and gasoline will remain essential fuels for transport, especially for shipping and aviation, and in an urban context especially for heavy transport of goods . For urban transport, candidate fuels are hydrogen, meth-ane, methanol, ethanol, dimethyl ether (DME), synthetic gasoline and bio-diesel . They differ with respect to overall well-to-wheel efficiencies, production facilities, fuelling infrastructure and adaptations of vehicles and engines . Methane and methanol are promising fuels with view to the ease and efficiency of the synthesis while Fischer-Tropsch diesel, biodiesel, methanol to gasoline, upgraded pyrolysis oil and bio-ethanol are promising fuels with view to existing vehicle fleets .
Hydrogen is a promising transport fuel, also being im-portant in alleviating shortages of biomass . Electrolysis is a well-known technology for producing hydrogen from renewable resources . Promising technologies include alkaline electrolysis, which is characterized by low-cost per-unit areas and excellent durability, but also low efficiency and production capacity per unit area . Polymer exchange membrane (PEM) electrolysis has matured
rapidly and has recently been scaled up to ~1MW . It is characterized by high production capacities and rapid response times . Solid oxide electrolysis is still at an early stage, with units of around 50kW and plants of 300 kW under construction . It is characterized by high levels of efficiency and modest cost per area, but improvements are needed in long-term durability and robustness . Improvements in the manufacturing processes of cells, stacks and modules are further needed to bring down overall costs and increase capacity .
Methane, a natural gas, is already widely used in the transport sector and can be produced from biomass via several thermal gasification routes or anaerobic diges-tion . Thermal gasification involves the high-temperature thermochemical conversion of biomass into a calorific product gas . It is scalable, efficient and fuel-flexible, but requires expensive and complex gas cleaning and is still in the demonstration phase . In a recent gasifica-tion-based SNG production project, its efficiency was doubled by integrating electrolysis to let hydrogen con-vert CO2 to methane . Methane can also be produced via the anaerobic digestion processing of organic residues and liquid effluents from the food industry . Pilot-scale development and demonstration are still being under-taken to optimise the process . Not widely applied but very promising is the production of methane through the biological conversion of synthesis gas .
Alcohols and DME (Methanol) are energy-dense liquids . They have been produced commercially for nearly a century, but methanol derived from biomass gasification is still at the development stage . As with SNG, adding hydrogen to the process may boost the production per unit of biomass and thereby double output . Several projects aim at integrating electrolysis into the bio-mass-to-methanol process, as well as finding solutions to the problem of reducing the tar concentration . A full concept demonstration of electrolysis-assisted straw-to-methanol is currently being conducted at DTU . Ethanol is a widely used fuel produced from biomass, mainly sugarcane and corn . Concerns that biofuels may compete with food production have shifted the research effort towards second-generation bioethanol production from lingo-cellulosic residues . Another promising route for bioethanol production from lingo-cellulosic resi-dues is via a syngas platform where high-temperature gasification is combined with downstream fermentation, creating high levels of energy efficiency and a high degree of carbon exploitation .
The freight transport and logistics sector is exposed to an increasing demand for efficiency, availability services and sustainable solutions, while increasing levels of traffic and consumption are making freight logistics in cities even more complex . E-commerce and on-demand delivery impact on freight patterns both positively and negatively . In particular, same-day delivery services may lead to lower vehicle fill rates and more freight move-ments . As the freight logistics sector consists of a rela-tively high number of operators, many delivery vehicles may be servicing neighbourhoods and households, with impacts on congestion, noise, traffic safety and energy consumption . Operators are investing increasingly in new digital solutions such as booking platforms, track and trace features and on-demand services, helping operators deliver goods within strict time limits . New concepts and technologies are giving rise to interesting opportunities: automation facilitating cost-effective last-mile operations, freight delivery drones and even sideway robot drone technology, and highly automated operations in freight terminals and logistics hubs .
Today most freight transport is operated by diesel trucks, but they may be replaced by EVs or alternative fuels such as biofuels, hydrogen etc . Urban freight movements are ideal for deploying such alternatives due to the limited driving ranges and capacities of both the vehicles and urban areas . Semi- or fully automated vehicles likewise offer interesting opportunities to bring down costs and reduce energy consumption and emissions . Truck platooning is relevant not just for long-haul transport, but also for freight transport in cities, by using semi-automated technology to coordinate traffic flows, infrastructure and the flow of goods to and from warehouses and terminals . City logistics based on urban consolidation centres aim to bring down last-mile costs by consolidating goods from various shippers on to the same delivery vehicle .
Regulation plays a key role in making the sector more sustainable and efficient by banning certain vehicle types, favouring environmentally friendly vehicles or im-posing road-charging schemes, all of which may also add to the last-mile costs . The future development of the freight logistics sector may take place in an urban living lab setting where operators invest in green vehicles (EVs and/or alternative fuels) while at the same time utilities, municipalities and others co-fund new infrastructure . In a similar setting, semi- and fully automated vehicles may be tested, providing operators with knowledge about off-hour deliveries . Finally, digitalization facilitates effi-cient planning and management and makes possible the
consolidation and coordination of freight transport and logistics in city transport corridors .
Living lab for integrated energy systemsIn a low-carbon energy society, the power system is con-tinually being challenged by variable power generation and increased demand . This calls for demand response in power consumption and for storage solutions . Although electro-mobility in urban settings represents an increase in electricity demand, it can also be used as a variable storage solution through the integration of EVs into the grid using so-called “vehicle-to-grid” technology (V2G) . Thus EVs are flexible resources and as such offer flexi-bility to the electric power grid . Rapid developments in mobility, particularly urban electro-mobility, have already significantly impacted on the current power system . Autonomous transport, electric bikes and scooters for the last mile, delivery of goods by drones, shared vehicles and mobility as a service may likewise influence the electric power system . At the distribution level, the massive deployment of electric vehicles (EV) may gen-erate local voltage excursions and grid congestion, but if EV charging and de-charging are being controlled, EVs can potentially help mitigate the self-incurred adverse effects .
Models, laboratory tests and proof of concepts are steps required in order eventually to roll out and scale up solutions supporting sustainable developments in urban mobility . In this context, living labs and super-lab settings represent the final step towards industrial and commercial realization . Coupling two or more energy systems and infrastructures is a prerequisite for a future with sustainable urban mobility . EVs and chargers can be used to create a coupling between transportation and the electric grid . Electrification of transportation, customer interactions, the roll-out of charging infrastruc-ture and the integration of EVs are key elements driving achievements in sustainable urban mobility .
EnergyLab Nordhavn addresses multiple facets of new developments . Electro-mobility is one of several interconnected systems being highlighted . Chargers and fast-chargers for EVs have been installed in a multi-sto-rey car park and are closely monitored . PowerLabDK includes a multiple location lab integrated with field testing areas on Risø (SYSLAB) and Test Zone Bornholm . The labs are interconnected through monitoring and con-trol and boast a dedicated EVlab with several chargers and EVs . Various technical solutions for electro-mobil-ity are being tested and validated at different levels of maturity . Results showed that EVs can effectively
Page 16 – Executive summary Executive summary – Page 17
DTU International Energy Report 2019 DTU International Energy Report 2019
count sectorial, occupational and geographical changes and differences, as well as forecasting the medium to long-term demand and availability of workforce and anticipating developments in occupational structures and educational needs . The skills of urban planning professionals are already undergoing change in respect of their analytical, methodological, visionary, creative, social, communicative and inter-cultural skills . Also important is continuous curriculum development in technical engineering skills, planning and process skills, customer skills, and organizational and managerial skills . For transport engineering professionals, mathematical and statistical models and computer-based modelling and simulation tools continue to be important, but are used rather as a tool to embrace the uncertainties within a wider methodological paradigm . Also, a further development of route planning and operation manage-ment is needed to capture the developments of new business models, customer expectations and on-demand deliveries . For both groups of professionals, curriculum development should take stock of the rapid innovations in technologies, business models and business eco-sys-tems, something which also requires life-long learning, upgrading skills and re-skilling .
Examples of key drivers of change in urban mobility im-pacting on critical skills include big data (data collection, analysis and use), artificial intelligence and its implica-tions for restructuring tasks, autonomous and connected vehicles, block chains in financial services, electrification of transport, densification of the built environment with new transport modes and infrastructure, and ensuring the safety and security of digital and power systems against operational disruptions, cyber-attacks etc .
For both groups of professionals, skills in systems design and operations are needed, together with co-working in multi-disciplinary teams and projects, combined with niche knowledge regarding AI, privacy and security, logistics etc . Exploiting the ability to engage local stake-holders in open-data platforms or civic laboratories re-quires enhanced skills and competences in change- and participatory innovation management . Thus, educational shifts, reskilling and upgrading skills are needed to man-age radical transitions in the context of the new promi-nence of urban mobility . Apart from technical skills, this also encompasses ethical and participatory, mediating or governance issues related to the new technologies .
A network view on research and development in sustainable urban mobilityDeveloping solutions for sustainable urban mobility
requires connecting knowledge and technologies from a diverse and large range of actors . Thus, educational shifts require navigating a whole spectrum of multiple research areas that are part of a complex and interde-pendent whole . The ways in which they connect with each other will affect how urban mobility is designed and managed .
The data-driven mapping exercise presented in this chapter provides a representative overview of the con-tent and collaborations of DTU researchers over the last 35 years . For example, DTU researchers have links with more than forty countries and three hundred institutions working on topics related to sustainable urban mobility solutions . Collaborations are geographically dispersed, covering a wide range of organizations . Although most collaborations are in Europe, organizations such as MIT (US) and the University of Queensland (Australia) rank high as well . Furthermore, collaborations with the USA, China and other non-European countries are growing .
Based on a co-occurrence network and cluster analysis, the spectrum of research influencing sustainable urban mobility solutions and how they are linked to each other can be identified . DTU research is clustered analytically into six different topic groups, mostly created by five research communities: 1) synthetic fuels and other alternative fuels; 2) life-cycle assessment and other general sustainability aspects related to transport; 3) energy policy; 4) energy grid, energy storage and energy production; and 5) transport-specific research . Only one of the five research communities can be defined as transport-specific, the energy policy community being a shared interface between the other four communities .
The mapping of key R&D trends reveals that DTU’s contribution is characterized by a topical shift towards sustainability-related areas a more systemic approach with a focus on mobility, human behaviour and design and increasing uncertainties in urban mobility . More-over, alternative fuels, algorithms for decision-support systems, inclusion of the built environment and active transport are among the high-growth, high- occurrence topics .
These findings point towards the deep interconnections between energy, policy, infrastructure, new electric and alternative fuel technologies, system modelling, the increasing importance of new modes of transport, and the shifting preferences, attitudes and behaviour of mobility users .
Higher hydrocarbons and other heavy fuels are fuels with properties close to those of diesel and gasoline . Syngas can be converted into liquid hydrocarbons, for example, diesel by the Fisher-Tropsch process, or to methanol, which then can be converted into gasoline in the methanol-to-gasoline (MTG) process . The large-scale gasification of biomass and syngas clean-up are still at the demonstration level and rely on well-known, down-stream methanol and Fisher-Tropsch technologies . Pyrol-ysis oil is produced in a process in which dry biomass is rapidly heated . It can be catalytically hydro-treated to form hydrocarbons similar to gasoline and diesel, but is challenged by the formation of char and coke . Combining pyrolysis and hydro-treatment in catalytic hydro-pyroly-sis is currently at the demonstration stage . Historically bio-diesel has been produced from plant oils, but it can also be produced from waste oils such as cooking oil and fats . However, due to shortages in the supply of waste oils for bio-diesel, alternative feedstocks have been explored, such as micro-algal and single cell oils .
Environmental sustainability of different transport modesModern society depends on transporting people and goods from A to B, but it comes with substantial nega-tive impacts such as climate change, energy consump-tion, air pollution impacts on human health, chemical pollution and the reduced availability of metal resources . It is crucial to assess these negative impacts when deciding on the development of a sustainable transport future . In order to assess all the impacts of a transport system, a systems perspective is adopted capturing all aspects of the life-cycle of the system’s physical ele-ments – the fuels, vehicles and infrastructure, from the extraction of resources to the end of life .
The life-cycle assessment (LCA) is a tool for comparing the eco-efficiency of products, services and the systems that provide them . For individual transport technolo-gies, the quantitative measures include the number of persons, the weight or volume of goods, the distance over which the transport occurs and the frequency with which it occurs . Person transport is expressed in person .km and freight in ton .km or m3 .km . Qualitative measures include, for person transport comfort, the duration of the trip and the ability to take luggage, while for freight, duration may be an issue for certain goods .
The degree of interdependence between the eco-ef-ficiency of the technology and the level of demand is also assessed . There may be a rebound effect when the economic benefits of a more fuel-efficient car are more
attractive relative to other modes of transport, such as public transport . The implementation of new transport technologies may have unintended consequences, for example, an uptake of EVs sufficiently large that it requires the construction of additional power plants . Therefore the full consequences of changes to the existing transport system should be analysed at the planning and design stage to ensure that all the relevant elements have been assessed .
LCA studies primarily of passenger cars reveal that regional location is a determining factor in the per-formances of EVs . One location-specific factor is the local climate, which impacts on the need for heating or cooling vehicles and cabins .
For internal combustion engine vehicles, the life-cycle environmental impact of the fuel typically predominates over the impacts of the vehicle itself . With regard to vehicles using biofuels, the environmental burden may remain for the vehicle but shift from a climate-change impact to a land-use impact . For EVs, the fuel life-cycle may be as important as the vehicle, depending on the supporting electricity mix . The environmental impacts of infrastructure (e .g . charging stations) seem to be insig-nificant compared to the impacts of any other life-cycle stage of the system . Infrastructure typically has a long life over which it supports a high number of vehicles and thus has a relatively small impact measured as per .km driven at the entire fleet level .
Getting the technology and system right requires car-de-sign strategies aimed at increasing eco-efficiency and improving fuel efficiencies in the use stage and reduced energy use through light-weight constructions . It is not easy to make urban transport modes eco-efficient, and there may be rebound effects in consumption or use . Several top-down approaches to determining absolute environmental sustainability targets at different levels have been proposed .
Urban mobility in transformation: demands on educationThe digitalization and integration of city infrastructure are giving rise to a transformational change in urban transport that will involve fundamental changes to the future skills of urban planning and engineering profes-sionals .
Matching the supply of and demand for skills in the area of urban mobility is a social challenge . Anticipating the development of such skills should take into ac-
Page 18 – Executive summary Executive summary – Page 19
DTU International Energy Report 2019 DTU International Energy Report 2019

Some of the main challenges hindering the sustainable transition of the transport sector are related to the facts that:
• Transport activity is tightly coupled with gross do-mestic product (GDP) and to population and income levels, factors that are increasing in many countries worldwide . By 2050, the global population is ex-pected to have grown by 30% compared to 2015 [2] . In particular, given the increase in the urbanization rate, two-thirds of the global population will be living in cities, the same place where countries’ economies will develop the most, especially in emerging econo-mies . Therefore, due to increases in prosperity, urban populations will potentially be responsible for higher consumption levels of goods and services, more transport activity and greater ownership of private vehicles [2] .
• Sustainable transport technologies are already avail-able on the market, but their high investment costs are slowing their widespread acceptance and thus call for policy support [7] . Moreover, the adoption of low-carbon technologies is being hampered by the slow turnover rate of existing vehicle fleets and the lock-in effect derived from the existing infrastructure .
• The growing demand for flexible freight transport implies a greater utilization of trucks, especially in emerging economies, where the road infrastruc-ture is rapidly expanding, leading to trucks being regarded as among the fastest growing sources of global oil demand [8] .
• The increasing penetration of e-commerce and digital technologies such as Mobility-as-a-Service (MaaS), sharing mobility and autonomous vehicles might result in additional overall transport activity, with potentially negative impacts on energy con-sumption and emissions from transport [9] .
The successful low-carbon transition of the transport sector requires major policy and technology devel-opments and relies on the ability of policy-makers to identify the challenges and to implement an all-encom-passing set of measures aiming at addressing them .
Decarbonization strategy: avoid/shift/improve Getting transport on track to meet global environmental goals such as the Paris Agreement [10] requires putting into practice a broad set of measures, summarized in the International Energy Agency’s slogan Avoid, Shift, Improve . Avoid entails mitigating transport activity by limiting the number of trips and reducing their distances .
Shift consists in limiting the reliance on carbon-intense modes of transport by enhancing the use of public transportation and non-motorised modes of transport . Improve implies enhancing vehicle efficiency by adopt-ing more efficient power trains, replacing oil-based fuels with low-carbon fuels, increasing vehicles’ occupancy and load factors and light weighting . This section describes the main recent developments and trends rela-tive to the three key pillars of transport decarbonization .
AvoidThe measures included in the category Avoid are those that aim at reducing energy consumption and emissions from transport primarily through a reduction in activity (measured in passenger-kilometres or tonne-kilometres) . Such measures enable people to satisfy their daily needs while avoiding taking a trip or limiting its distance and ensuring that goods are delivered while minimizing their overall distance . Urban design is an important driver of transport activity . Compact cities or neighbourhoods that include both residential dwellings and commercial or busi-ness activities enable shorter trips [2] . A wider adoption of intelligent transport systems (ITS) can also reduce total distances travelled by suggesting shorter routes and can mitigate congestion by recommending less busy routes . Teleworking and virtual mobility are increasingly being adopted by companies and have the potential to reduce their employees’ transport activity levels, also resulting in less congested roads and less busy public transport during peak hours . A wider deployment of logistical hubs and the concurrent enhancement of logistical services can improve the overall freight supply chain, resulting in lower freight transport activity .
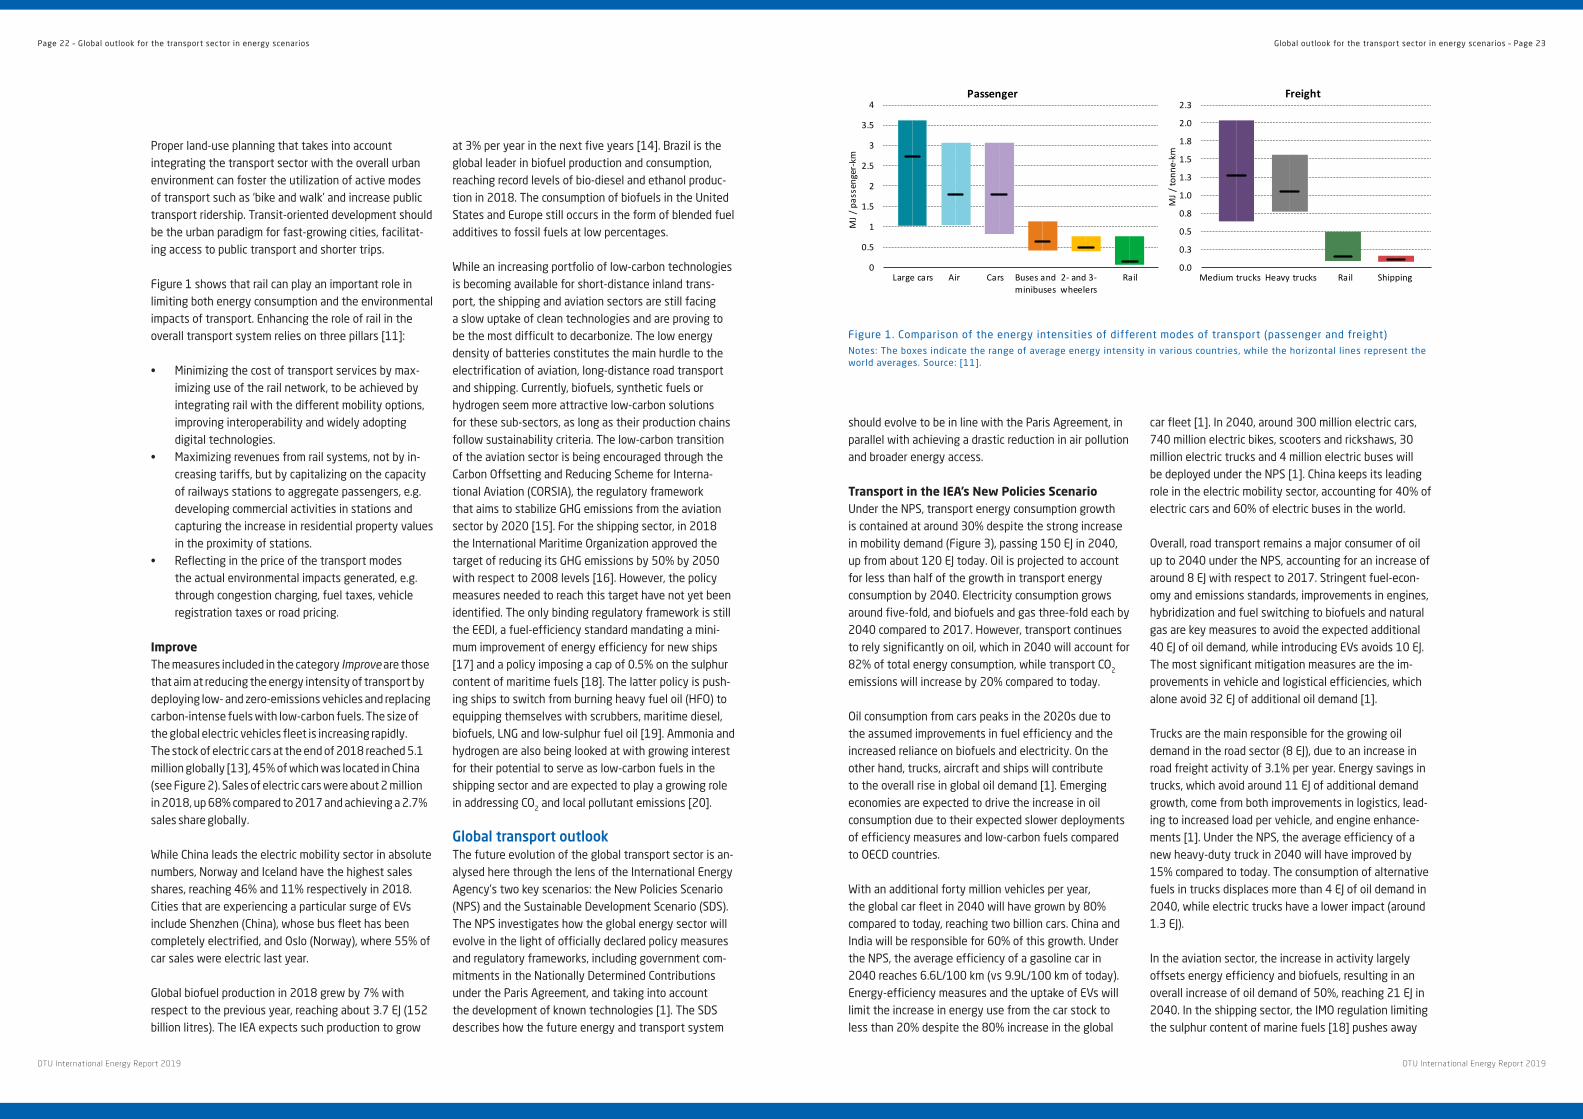
ShiftThe actions grouped under the category Shift aim at reducing transport externalities by replacing carbon-in-tense modes of transport with low-carbon ones . Figure 1 illustrates the rationale behind shift measures: rail has the lowest energy intensity in the passenger transport sector and the second lowest (after shipping) in freight transport [11] . Therefore, shifting transport activity from private modes of transport or aviation to public transport enables energy consumption to be limited significantly .
So far, shift policy levers have mainly been limited to urban areas, as reflected by the several targets on the modal share of public transport in the NDCs of several countries [12] . However, shift policy measures generally do not target as much freight and intercity passenger transport .
Introduction Transport is an important driver of social and economic development, as it connects people across different regions and enables the exchange of goods . However, transport is also responsible for several externalities . Today the transport sector accounts for almost one-third of final energy consumption [1] . It is also a major con-tributor to global warming, accounting for approximately one-third of global energy-related CO2 emissions, and is a primary responsible for urban air pollution . Moreover, the transport sector currently presents the least diver-sified portfolio of energy resources among all energy sectors, relying mainly on oil and accounting for nearly two-thirds of total oil consumption .
Given the increasing rate of urbanization globally, which will lead to two-thirds of the global population living in urban areas by 2050 [2], cities are expected to play a major role in terms of global energy consumption and energy-related environmental emissions . The trend towards urbanization represents both a challenge and an opportunity for the transport sector’s sustainable tran-sition . On the one hand, growing population and income levels in urban areas are key drivers of rising transport activity . On the other hand, thanks to their high pop-ulation densities and urban transport patterns, which are normally characterized by trips of short distances, cities can be leaders in the utilization of non-motorized forms of transport and public transport, as well as in the uptake of sustainable transport technologies such as electric vehicles (EVs) [2] . In addition, cities are often more ambitious than national governments in commit-ting themselves to more ambitious environmental goals [3] . This, for instance, is the case in the Nordic capitals, which are already leaders in terms of sustainable mobil-ity, each one with its own peculiarities: public transport (Stockholm), cycling (Copenhagen), light-duty EVs (Oslo) and EV buses (Helsinki) [4] .
This chapter first sets out the situation in the current global transport sector, highlighting the main challenges related to its sustainable transition and reflecting on which strategies should be put in practice to mitigate the sector’s externalities . Then it describes future outlooks for the global transport sector according to the International Energy Agency (IEA) before concluding by recommending key policies for decarbonizing transport .
Global challenges in transportationGiven the relevance of transport externalities, changing the current transport paradigm is of major importance to the tasks of mitigating climate change, alleviating air pollution and enhancing energy security . However, sev-eral elements suggest that finding a sustainable transi-tion for the transport sector is particularly challenging . Despite the wide set of policy measures implemented globally to reduce transportation carbon intensity and reliance on oil, CO2 emissions from the transport sector increased by about 2% a year from 2010 to 2016 [5] . The continued growth in carbon emissions from the transport sector is attributable to the fact that the growth in transport activity resulting from increasing populations, gross domestic product (GDP) and income levels is proceeding at a faster pace than improvements to the performance of transport technologies . Emissions from the aviation and maritime sectors continue to grow, suggesting that more cooperative international efforts are needed to reverse the trend . At the same time, emissions from all modes of road transport (cars, buses, trucks and two-wheelers) have also kept on rising, attrib-utable in part to the preference of car buyers for bigger and heavier vehicles worldwide [6] . In Europe, this trend sums up to decreasing sales of diesel cars, which have lower CO2 emissions than gasoline cars, but are worse in emitting pollutants . Overall these developments are outweighing the positive effects of rising sales of hybrid and electric cars and in 2018 led to the average fuel economy improvements of light-duty vehicles slowing down to 1 .4% per year, the lowest rate since 2005 [6] .
Global outlook for the transport sector in energy scenarios – Page 21
DTU International Energy Report 2019 DTU International Energy Report 2019
Chapter 3
Global outlook for the transport sector in energy scenariosRaffaele Salvucci, DTU Management Jacopo Tattini, International Energy Agency
should evolve to be in line with the Paris Agreement, in parallel with achieving a drastic reduction in air pollution and broader energy access .
Transport in the IEA’s New Policies ScenarioUnder the NPS, transport energy consumption growth is contained at around 30% despite the strong increase in mobility demand (Figure 3), passing 150 EJ in 2040, up from about 120 EJ today . Oil is projected to account for less than half of the growth in transport energy consumption by 2040 . Electricity consumption grows around five-fold, and biofuels and gas three-fold each by 2040 compared to 2017 . However, transport continues to rely significantly on oil, which in 2040 will account for 82% of total energy consumption, while transport CO2 emissions will increase by 20% compared to today .
Oil consumption from cars peaks in the 2020s due to the assumed improvements in fuel efficiency and the increased reliance on biofuels and electricity . On the other hand, trucks, aircraft and ships will contribute to the overall rise in global oil demand [1] . Emerging economies are expected to drive the increase in oil consumption due to their expected slower deployments of efficiency measures and low-carbon fuels compared to OECD countries .
With an additional forty million vehicles per year, the global car fleet in 2040 will have grown by 80% compared to today, reaching two billion cars . China and India will be responsible for 60% of this growth . Under the NPS, the average efficiency of a gasoline car in 2040 reaches 6 .6L/100 km (vs 9 .9L/100 km of today) . Energy-efficiency measures and the uptake of EVs will limit the increase in energy use from the car stock to less than 20% despite the 80% increase in the global
car fleet [1] . In 2040, around 300 million electric cars, 740 million electric bikes, scooters and rickshaws, 30 million electric trucks and 4 million electric buses will be deployed under the NPS [1] . China keeps its leading role in the electric mobility sector, accounting for 40% of electric cars and 60% of electric buses in the world .
Overall, road transport remains a major consumer of oil up to 2040 under the NPS, accounting for an increase of around 8 EJ with respect to 2017 . Stringent fuel-econ-omy and emissions standards, improvements in engines, hybridization and fuel switching to biofuels and natural gas are key measures to avoid the expected additional 40 EJ of oil demand, while introducing EVs avoids 10 EJ . The most significant mitigation measures are the im-provements in vehicle and logistical efficiencies, which alone avoid 32 EJ of additional oil demand [1] .
Trucks are the main responsible for the growing oil demand in the road sector (8 EJ), due to an increase in road freight activity of 3 .1% per year . Energy savings in trucks, which avoid around 11 EJ of additional demand growth, come from both improvements in logistics, lead-ing to increased load per vehicle, and engine enhance-ments [1] . Under the NPS, the average efficiency of a new heavy-duty truck in 2040 will have improved by 15% compared to today . The consumption of alternative fuels in trucks displaces more than 4 EJ of oil demand in 2040, while electric trucks have a lower impact (around 1 .3 EJ) .
In the aviation sector, the increase in activity largely offsets energy efficiency and biofuels, resulting in an overall increase of oil demand of 50%, reaching 21 EJ in 2040 . In the shipping sector, the IMO regulation limiting the sulphur content of marine fuels [18] pushes away
Proper land-use planning that takes into account integrating the transport sector with the overall urban environment can foster the utilization of active modes of transport such as ‘bike and walk’ and increase public transport ridership . Transit-oriented development should be the urban paradigm for fast-growing cities, facilitat-ing access to public transport and shorter trips .
Figure 1 shows that rail can play an important role in limiting both energy consumption and the environmental impacts of transport . Enhancing the role of rail in the overall transport system relies on three pillars [11]:
• Minimizing the cost of transport services by max-imizing use of the rail network, to be achieved by integrating rail with the different mobility options, improving interoperability and widely adopting digital technologies .
• Maximizing revenues from rail systems, not by in-creasing tariffs, but by capitalizing on the capacity of railways stations to aggregate passengers, e .g . developing commercial activities in stations and capturing the increase in residential property values in the proximity of stations .
• Reflecting in the price of the transport modes the actual environmental impacts generated, e .g . through congestion charging, fuel taxes, vehicle registration taxes or road pricing .
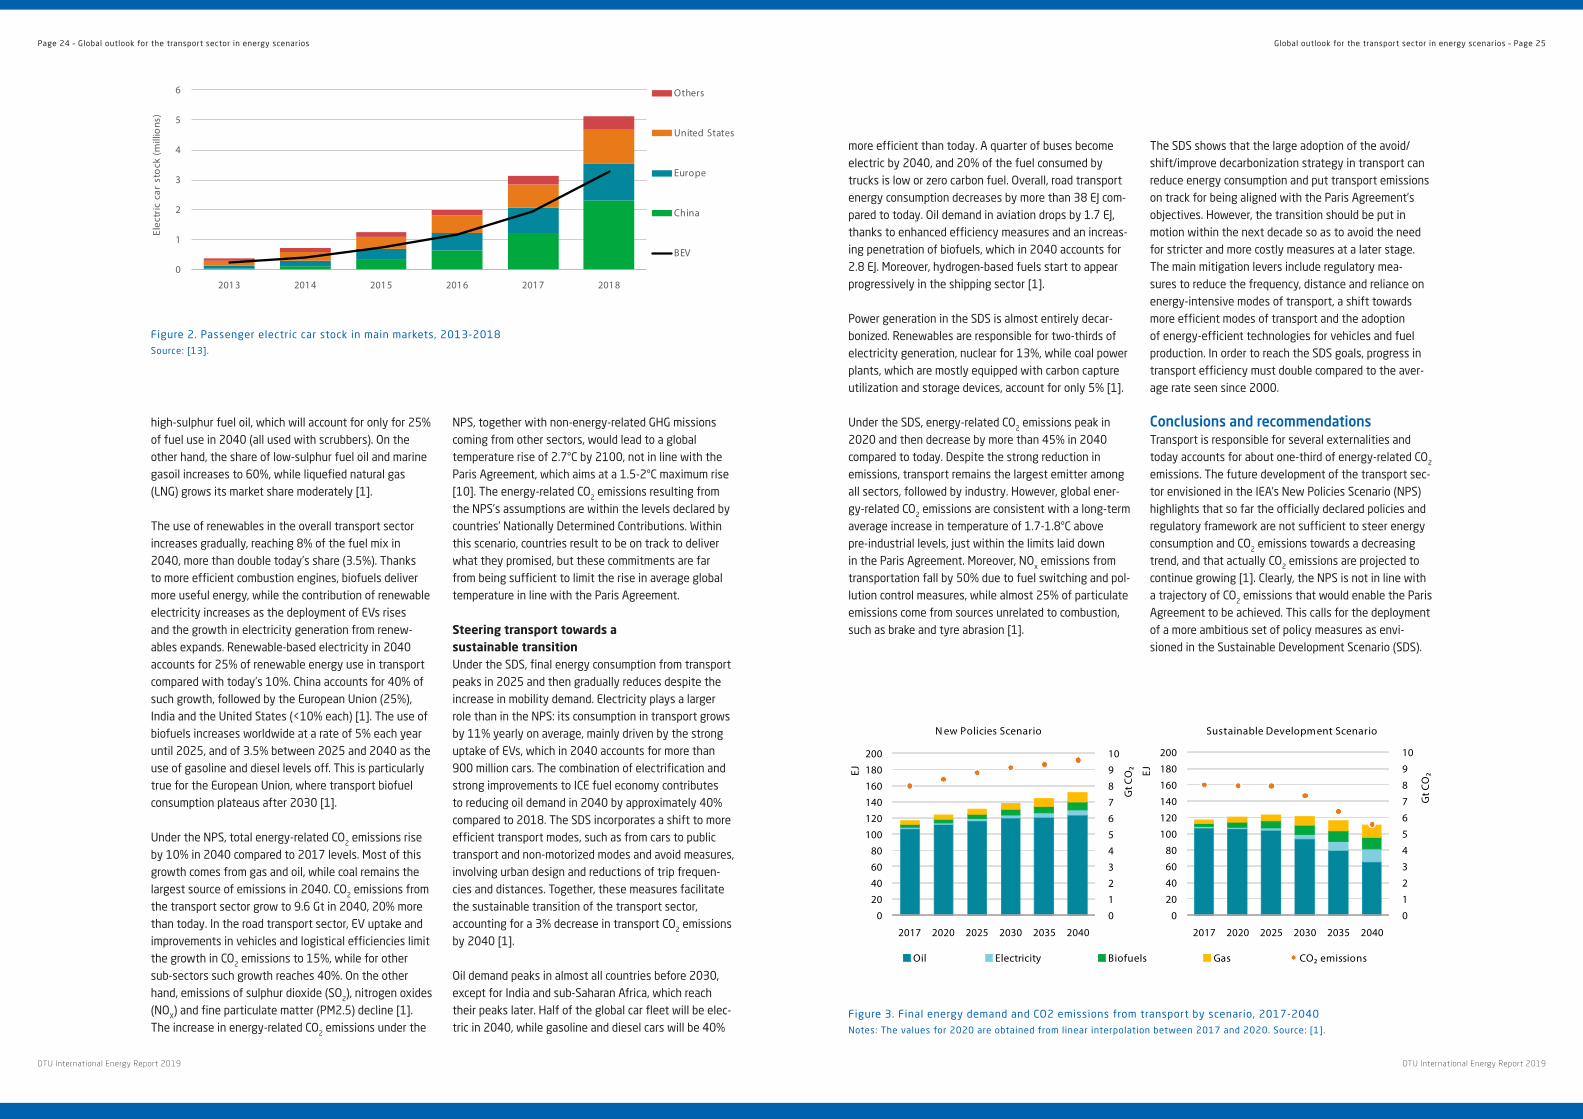
ImproveThe measures included in the category Improve are those that aim at reducing the energy intensity of transport by deploying low- and zero-emissions vehicles and replacing carbon-intense fuels with low-carbon fuels . The size of the global electric vehicles fleet is increasing rapidly . The stock of electric cars at the end of 2018 reached 5 .1 million globally [13], 45% of which was located in China (see Figure 2) . Sales of electric cars were about 2 million in 2018, up 68% compared to 2017 and achieving a 2 .7% sales share globally .
While China leads the electric mobility sector in absolute numbers, Norway and Iceland have the highest sales shares, reaching 46% and 11% respectively in 2018 . Cities that are experiencing a particular surge of EVs include Shenzhen (China), whose bus fleet has been completely electrified, and Oslo (Norway), where 55% of car sales were electric last year .
Global biofuel production in 2018 grew by 7% with respect to the previous year, reaching about 3 .7 EJ (152 billion litres) . The IEA expects such production to grow
at 3% per year in the next five years [14] . Brazil is the global leader in biofuel production and consumption, reaching record levels of bio-diesel and ethanol produc-tion in 2018 . The consumption of biofuels in the United States and Europe still occurs in the form of blended fuel additives to fossil fuels at low percentages .
While an increasing portfolio of low-carbon technologies is becoming available for short-distance inland trans-port, the shipping and aviation sectors are still facing a slow uptake of clean technologies and are proving to be the most difficult to decarbonize . The low energy density of batteries constitutes the main hurdle to the electrification of aviation, long-distance road transport and shipping . Currently, biofuels, synthetic fuels or hydrogen seem more attractive low-carbon solutions for these sub-sectors, as long as their production chains follow sustainability criteria . The low-carbon transition of the aviation sector is being encouraged through the Carbon Offsetting and Reducing Scheme for Interna-tional Aviation (CORSIA), the regulatory framework that aims to stabilize GHG emissions from the aviation sector by 2020 [15] . For the shipping sector, in 2018 the International Maritime Organization approved the target of reducing its GHG emissions by 50% by 2050 with respect to 2008 levels [16] . However, the policy measures needed to reach this target have not yet been identified . The only binding regulatory framework is still the EEDI, a fuel-efficiency standard mandating a mini-mum improvement of energy efficiency for new ships [17] and a policy imposing a cap of 0 .5% on the sulphur content of maritime fuels [18] . The latter policy is push-ing ships to switch from burning heavy fuel oil (HFO) to equipping themselves with scrubbers, maritime diesel, biofuels, LNG and low-sulphur fuel oil [19] . Ammonia and hydrogen are also being looked at with growing interest for their potential to serve as low-carbon fuels in the shipping sector and are expected to play a growing role in addressing CO2 and local pollutant emissions [20] .
Global transport outlookThe future evolution of the global transport sector is an-alysed here through the lens of the International Energy Agency’s two key scenarios: the New Policies Scenario (NPS) and the Sustainable Development Scenario (SDS) . The NPS investigates how the global energy sector will evolve in the light of officially declared policy measures and regulatory frameworks, including government com-mitments in the Nationally Determined Contributions under the Paris Agreement, and taking into account the development of known technologies [1] . The SDS describes how the future energy and transport system
0
0.5
1
1.5
2
2.5
3
3.5
4
Large cars Air Cars Buses andminibuses
2- and 3-wheelers
Rail
MJ /
pas
seng
er-k
m
Passenger
0.0
0.3
0.5
0.8
1.0
1.3
1.5
1.8
2.0
2.3
Medium trucks Heavy trucks Rail Shipping
MJ /
tonn
e-km
Freight
Figure 1 . Comparison of the energy intensities of different modes of transport (passenger and freight)Notes: The boxes indicate the range of average energy intensity in various countries, while the horizontal lines represent the world averages . Source: [11] .
Page 22 – Global outlook for the transport sector in energy scenarios Global outlook for the transport sector in energy scenarios – Page 23
DTU International Energy Report 2019 DTU International Energy Report 2019
more efficient than today . A quarter of buses become electric by 2040, and 20% of the fuel consumed by trucks is low or zero carbon fuel . Overall, road transport energy consumption decreases by more than 38 EJ com-pared to today . Oil demand in aviation drops by 1 .7 EJ, thanks to enhanced efficiency measures and an increas-ing penetration of biofuels, which in 2040 accounts for 2 .8 EJ . Moreover, hydrogen-based fuels start to appear progressively in the shipping sector [1] .
Power generation in the SDS is almost entirely decar-bonized . Renewables are responsible for two-thirds of electricity generation, nuclear for 13%, while coal power plants, which are mostly equipped with carbon capture utilization and storage devices, account for only 5% [1] .
Under the SDS, energy-related CO2 emissions peak in 2020 and then decrease by more than 45% in 2040 compared to today . Despite the strong reduction in emissions, transport remains the largest emitter among all sectors, followed by industry . However, global ener-gy-related CO2 emissions are consistent with a long-term average increase in temperature of 1 .7-1 .8°C above pre-industrial levels, just within the limits laid down in the Paris Agreement . Moreover, NOx emissions from transportation fall by 50% due to fuel switching and pol-lution control measures, while almost 25% of particulate emissions come from sources unrelated to combustion, such as brake and tyre abrasion [1] .
The SDS shows that the large adoption of the avoid/shift/improve decarbonization strategy in transport can reduce energy consumption and put transport emissions on track for being aligned with the Paris Agreement’s objectives . However, the transition should be put in motion within the next decade so as to avoid the need for stricter and more costly measures at a later stage . The main mitigation levers include regulatory mea-sures to reduce the frequency, distance and reliance on energy-intensive modes of transport, a shift towards more efficient modes of transport and the adoption of energy-efficient technologies for vehicles and fuel production . In order to reach the SDS goals, progress in transport efficiency must double compared to the aver-age rate seen since 2000 .
Conclusions and recommendationsTransport is responsible for several externalities and today accounts for about one-third of energy-related CO2 emissions . The future development of the transport sec-tor envisioned in the IEA’s New Policies Scenario (NPS) highlights that so far the officially declared policies and regulatory framework are not sufficient to steer energy consumption and CO2 emissions towards a decreasing trend, and that actually CO2 emissions are projected to continue growing [1] . Clearly, the NPS is not in line with a trajectory of CO2 emissions that would enable the Paris Agreement to be achieved . This calls for the deployment of a more ambitious set of policy measures as envi-sioned in the Sustainable Development Scenario (SDS) .
high-sulphur fuel oil, which will account for only for 25% of fuel use in 2040 (all used with scrubbers) . On the other hand, the share of low-sulphur fuel oil and marine gasoil increases to 60%, while liquefied natural gas (LNG) grows its market share moderately [1] .
The use of renewables in the overall transport sector increases gradually, reaching 8% of the fuel mix in 2040, more than double today’s share (3 .5%) . Thanks to more efficient combustion engines, biofuels deliver more useful energy, while the contribution of renewable electricity increases as the deployment of EVs rises and the growth in electricity generation from renew-ables expands . Renewable-based electricity in 2040 accounts for 25% of renewable energy use in transport compared with today’s 10% . China accounts for 40% of such growth, followed by the European Union (25%), India and the United States (<10% each) [1] . The use of biofuels increases worldwide at a rate of 5% each year until 2025, and of 3 .5% between 2025 and 2040 as the use of gasoline and diesel levels off . This is particularly true for the European Union, where transport biofuel consumption plateaus after 2030 [1] .
Under the NPS, total energy-related CO2 emissions rise by 10% in 2040 compared to 2017 levels . Most of this growth comes from gas and oil, while coal remains the largest source of emissions in 2040 . CO2 emissions from the transport sector grow to 9 .6 Gt in 2040, 20% more than today . In the road transport sector, EV uptake and improvements in vehicles and logistical efficiencies limit the growth in CO2 emissions to 15%, while for other sub-sectors such growth reaches 40% . On the other hand, emissions of sulphur dioxide (SO2), nitrogen oxides (NOX) and fine particulate matter (PM2 .5) decline [1] . The increase in energy-related CO2 emissions under the
NPS, together with non-energy-related GHG missions coming from other sectors, would lead to a global temperature rise of 2 .7°C by 2100, not in line with the Paris Agreement, which aims at a 1 .5-2°C maximum rise [10] . The energy-related CO2 emissions resulting from the NPS’s assumptions are within the levels declared by countries’ Nationally Determined Contributions . Within this scenario, countries result to be on track to deliver what they promised, but these commitments are far from being sufficient to limit the rise in average global temperature in line with the Paris Agreement .
Steering transport towards a sustainable transition Under the SDS, final energy consumption from transport peaks in 2025 and then gradually reduces despite the increase in mobility demand . Electricity plays a larger role than in the NPS: its consumption in transport grows by 11% yearly on average, mainly driven by the strong uptake of EVs, which in 2040 accounts for more than 900 million cars . The combination of electrification and strong improvements to ICE fuel economy contributes to reducing oil demand in 2040 by approximately 40% compared to 2018 . The SDS incorporates a shift to more efficient transport modes, such as from cars to public transport and non-motorized modes and avoid measures, involving urban design and reductions of trip frequen-cies and distances . Together, these measures facilitate the sustainable transition of the transport sector, accounting for a 3% decrease in transport CO2 emissions by 2040 [1] .
Oil demand peaks in almost all countries before 2030, except for India and sub-Saharan Africa, which reach their peaks later . Half of the global car fleet will be elec-tric in 2040, while gasoline and diesel cars will be 40%
0
1
2
3
4
5
6
7
8
9
10
0
20
40
60
80
100
120
140
160
180
200
2017 2020 2025 2030 2035 2040
Gt C
O₂EJ
N ew Policies Scenario
Oil Electricity Biofuels Gas CO₂ emissions
0
1
2
3
4
5
6
7
8
9
10
0
20
40
60
80
100
120
140
160
180
200
2017 2020 2025 2030 2035 2040
Gt C
O₂EJ
Sustainable Development Scenario
Figure 3 . Final energy demand and CO2 emissions from transport by scenario, 2017-2040Notes: The values for 2020 are obtained from linear interpolation between 2017 and 2020 . Source: [1] .
0
1
2
3
4
5
6
2013 2014 2015 2016 2017 2018
Others
United States
Europe
China
BEV
Elec
tric
car
sto
ck (
mill
ions
)
Figure 2 . Passenger electric car stock in main markets, 2013-2018Source: [13] .
Page 24 – Global outlook for the transport sector in energy scenarios Global outlook for the transport sector in energy scenarios – Page 25
DTU International Energy Report 2019 DTU International Energy Report 2019
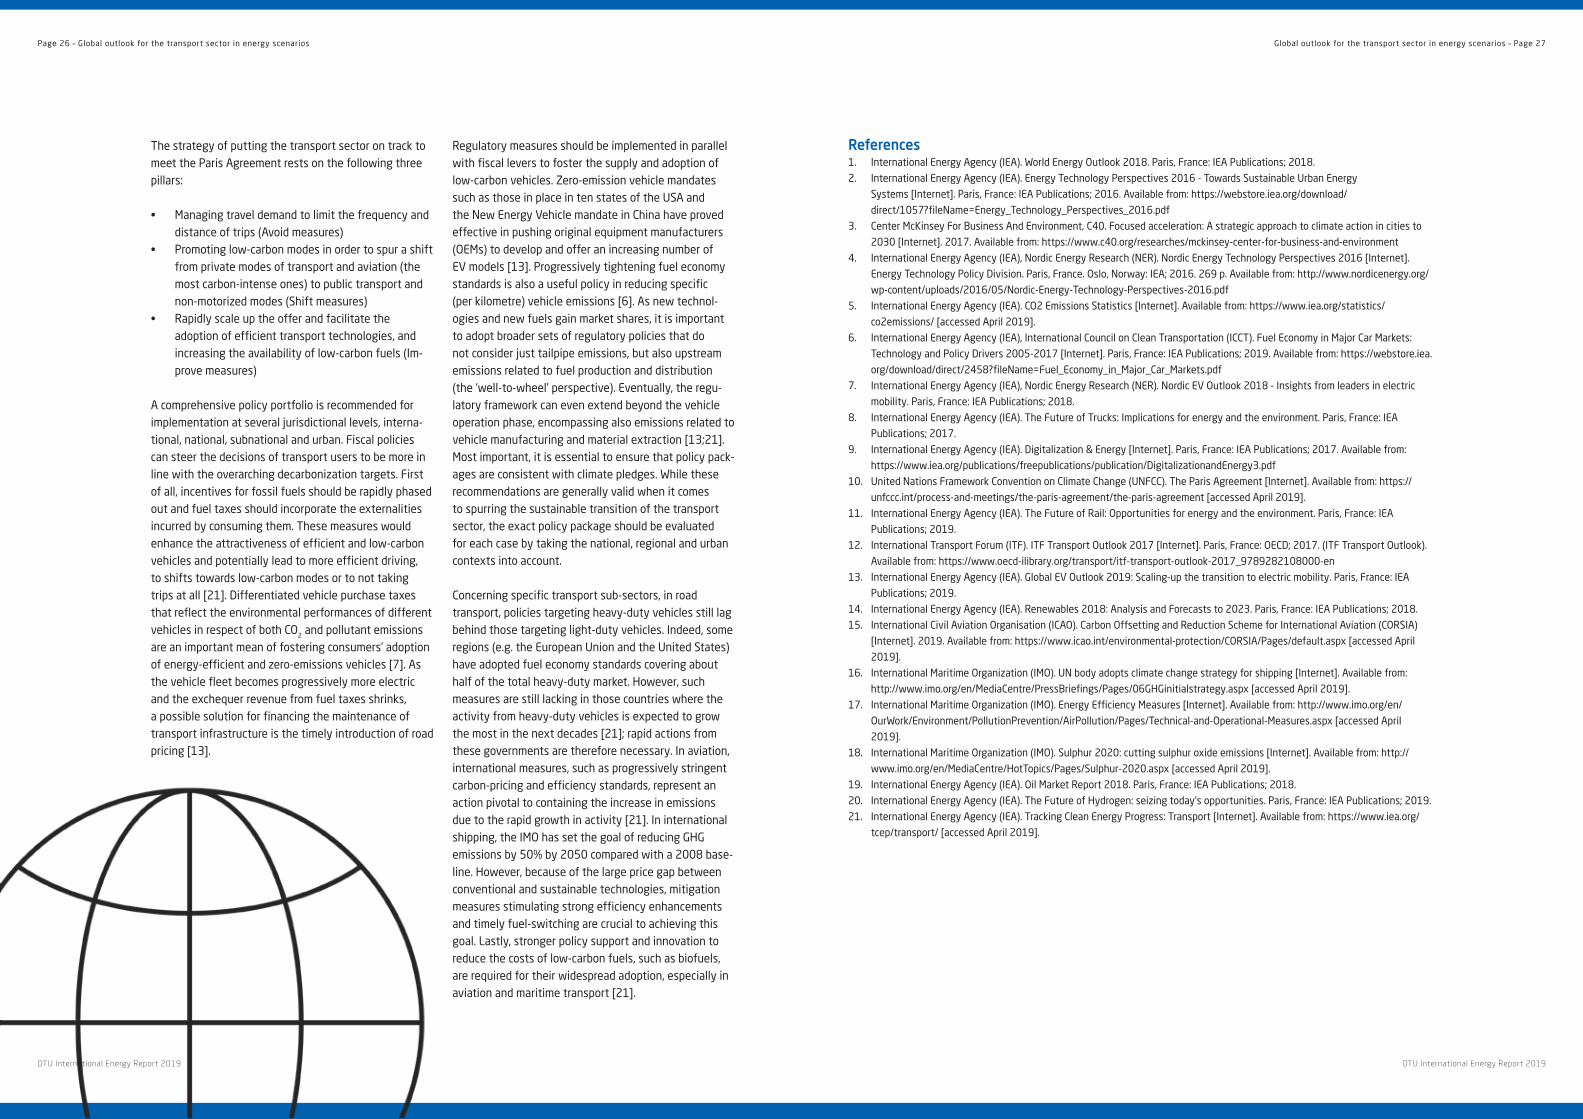
References1 . International Energy Agency (IEA) . World Energy Outlook 2018 . Paris, France: IEA Publications; 2018 .
2 . International Energy Agency (IEA) . Energy Technology Perspectives 2016 - Towards Sustainable Urban Energy
Systems [Internet] . Paris, France: IEA Publications; 2016 . Available from: https://webstore .iea .org/download/
direct/1057?fileName=Energy_Technology_Perspectives_2016 .pdf
3 . Center McKinsey For Business And Environment, C40 . Focused acceleration: A strategic approach to climate action in cities to
2030 [Internet] . 2017 . Available from: https://www .c40 .org/researches/mckinsey-center-for-business-and-environment
4 . International Energy Agency (IEA), Nordic Energy Research (NER) . Nordic Energy Technology Perspectives 2016 [Internet] .
Energy Technology Policy Division . Paris, France . Oslo, Norway: IEA; 2016 . 269 p . Available from: http://www .nordicenergy .org/
wp-content/uploads/2016/05/Nordic-Energy-Technology-Perspectives-2016 .pdf
5 . International Energy Agency (IEA) . CO2 Emissions Statistics [Internet] . Available from: https://www .iea .org/statistics/
co2emissions/ [accessed April 2019] .
6 . International Energy Agency (IEA), International Council on Clean Transportation (ICCT) . Fuel Economy in Major Car Markets:
Technology and Policy Drivers 2005-2017 [Internet] . Paris, France: IEA Publications; 2019 . Available from: https://webstore .iea .
org/download/direct/2458?fileName=Fuel_Economy_in_Major_Car_Markets .pdf
7 . International Energy Agency (IEA), Nordic Energy Research (NER) . Nordic EV Outlook 2018 - Insights from leaders in electric
mobility . Paris, France: IEA Publications; 2018 .
8 . International Energy Agency (IEA) . The Future of Trucks: Implications for energy and the environment . Paris, France: IEA
Publications; 2017 .
9 . International Energy Agency (IEA) . Digitalization & Energy [Internet] . Paris, France: IEA Publications; 2017 . Available from:
https://www .iea .org/publications/freepublications/publication/DigitalizationandEnergy3 .pdf
10 . United Nations Framework Convention on Climate Change (UNFCC) . The Paris Agreement [Internet] . Available from: https://
unfccc .int/process-and-meetings/the-paris-agreement/the-paris-agreement [accessed April 2019] .
11 . International Energy Agency (IEA) . The Future of Rail: Opportunities for energy and the environment . Paris, France: IEA
Publications; 2019 .
12 . International Transport Forum (ITF) . ITF Transport Outlook 2017 [Internet] . Paris, France: OECD; 2017 . (ITF Transport Outlook) .
Available from: https://www .oecd-ilibrary .org/transport/itf-transport-outlook-2017_9789282108000-en
13 . International Energy Agency (IEA) . Global EV Outlook 2019: Scaling-up the transition to electric mobility . Paris, France: IEA
Publications; 2019 .
14 . International Energy Agency (IEA) . Renewables 2018: Analysis and Forecasts to 2023 . Paris, France: IEA Publications; 2018 .
15 . International Civil Aviation Organisation (ICAO) . Carbon Offsetting and Reduction Scheme for International Aviation (CORSIA)
[Internet] . 2019 . Available from: https://www .icao .int/environmental-protection/CORSIA/Pages/default .aspx [accessed April
2019] .
16 . International Maritime Organization (IMO) . UN body adopts climate change strategy for shipping [Internet] . Available from:
http://www .imo .org/en/MediaCentre/PressBriefings/Pages/06GHGinitialstrategy .aspx [accessed April 2019] .
17 . International Maritime Organization (IMO) . Energy Efficiency Measures [Internet] . Available from: http://www .imo .org/en/
OurWork/Environment/PollutionPrevention/AirPollution/Pages/Technical-and-Operational-Measures .aspx [accessed April
2019] .
18 . International Maritime Organization (IMO) . Sulphur 2020: cutting sulphur oxide emissions [Internet] . Available from: http://
www .imo .org/en/MediaCentre/HotTopics/Pages/Sulphur-2020 .aspx [accessed April 2019] .
19 . International Energy Agency (IEA) . Oil Market Report 2018 . Paris, France: IEA Publications; 2018 .
20 . International Energy Agency (IEA) . The Future of Hydrogen: seizing today’s opportunities . Paris, France: IEA Publications; 2019 .
21 . International Energy Agency (IEA) . Tracking Clean Energy Progress: Transport [Internet] . Available from: https://www .iea .org/
tcep/transport/ [accessed April 2019] .
The strategy of putting the transport sector on track to meet the Paris Agreement rests on the following three pillars:
• Managing travel demand to limit the frequency and distance of trips (Avoid measures)
• Promoting low-carbon modes in order to spur a shift from private modes of transport and aviation (the most carbon-intense ones) to public transport and non-motorized modes (Shift measures)
• Rapidly scale up the offer and facilitate the adoption of efficient transport technologies, and increasing the availability of low-carbon fuels (Im-prove measures)
A comprehensive policy portfolio is recommended for implementation at several jurisdictional levels, interna-tional, national, subnational and urban . Fiscal policies can steer the decisions of transport users to be more in line with the overarching decarbonization targets . First of all, incentives for fossil fuels should be rapidly phased out and fuel taxes should incorporate the externalities incurred by consuming them . These measures would enhance the attractiveness of efficient and low-carbon vehicles and potentially lead to more efficient driving, to shifts towards low-carbon modes or to not taking trips at all [21] . Differentiated vehicle purchase taxes that reflect the environmental performances of different vehicles in respect of both CO2 and pollutant emissions are an important mean of fostering consumers’ adoption of energy-efficient and zero-emissions vehicles [7] . As the vehicle fleet becomes progressively more electric and the exchequer revenue from fuel taxes shrinks, a possible solution for financing the maintenance of transport infrastructure is the timely introduction of road pricing [13] .
Regulatory measures should be implemented in parallel with fiscal levers to foster the supply and adoption of low-carbon vehicles . Zero-emission vehicle mandates such as those in place in ten states of the USA and the New Energy Vehicle mandate in China have proved effective in pushing original equipment manufacturers (OEMs) to develop and offer an increasing number of EV models [13] . Progressively tightening fuel economy standards is also a useful policy in reducing specific (per kilometre) vehicle emissions [6] . As new technol-ogies and new fuels gain market shares, it is important to adopt broader sets of regulatory policies that do not consider just tailpipe emissions, but also upstream emissions related to fuel production and distribution (the ‘well-to-wheel’ perspective) . Eventually, the regu-latory framework can even extend beyond the vehicle operation phase, encompassing also emissions related to vehicle manufacturing and material extraction [13;21] . Most important, it is essential to ensure that policy pack-ages are consistent with climate pledges . While these recommendations are generally valid when it comes to spurring the sustainable transition of the transport sector, the exact policy package should be evaluated for each case by taking the national, regional and urban contexts into account .
Concerning specific transport sub-sectors, in road transport, policies targeting heavy-duty vehicles still lag behind those targeting light-duty vehicles . Indeed, some regions (e .g . the European Union and the United States) have adopted fuel economy standards covering about half of the total heavy-duty market . However, such measures are still lacking in those countries where the activity from heavy-duty vehicles is expected to grow the most in the next decades [21]; rapid actions from these governments are therefore necessary . In aviation, international measures, such as progressively stringent carbon-pricing and efficiency standards, represent an action pivotal to containing the increase in emissions due to the rapid growth in activity [21] . In international shipping, the IMO has set the goal of reducing GHG emissions by 50% by 2050 compared with a 2008 base-line . However, because of the large price gap between conventional and sustainable technologies, mitigation measures stimulating strong efficiency enhancements and timely fuel-switching are crucial to achieving this goal . Lastly, stronger policy support and innovation to reduce the costs of low-carbon fuels, such as biofuels, are required for their widespread adoption, especially in aviation and maritime transport [21] .
Page 26 – Global outlook for the transport sector in energy scenarios Global outlook for the transport sector in energy scenarios – Page 27
DTU International Energy Report 2019 DTU International Energy Report 2019

transport (NMT) modes (mostly walking) [21;22] . From 2007 to 2012 daily trips increased by 15%, travel by motorized mode by 18%, by non-motorized modes by 8%, and by public transport by 16% . During the same period, the population grew by 2%, jobs grew by 8% and the motorization rate increased from 184 to 212 private cars per 1000 inhabitants . Thus the growth rates of mo-tor vehicles were much higher in this period compared to the growth in population and jobs [20] . The density of people living in the São Paulo municipal area was 76 .6 persons per hectare in 1996 in the metropolitan region and 85 .5 persons per hectare in 2011 [19;23] .
China has encouraged urbanization, and cities have been its main centres of economic growth . The country’s economic growth has been rapid . Between 1978 and 2013, disposable per-capita income in China increased fifty-fold . Beijing, the capital city, has also undergone significant changes . Its population has increased from 8 .1 million in 2012 to 13 .5 million today [19] . However, the density has fallen from 123 persons per hectare in 1995 to 109 in 2015, mainly due to the development of the city’s outer metropolitan area, though its inner and central areas continued to increase in density [24] . The fall in density because of the city’s expansion into outer areas and its increased per-capita incomes has increased
Introduction Rapid urbanization and growing per capita incomes in emerging economies are taking millions out of poverty and increasing the demand for mobility . Increasing mobility has also increased the demand for motorized modes of transport, resulting in increased energy consumption and CO2 emissions . Emerging economies are characterized by relatively faster economic growth, relatively younger populations, rapid urbanization, more rapid urban growth and higher interest rates for projects compared to developed countries . Collectively these countries will play an important role in determining future trends in mobility .
For this study, we have chosen to compare four coun-tries – Brazil, China, India, and South Africa – by compar-ing drivers of mobility in four megacities: São Paulo, Beijing, Delhi, and Cape Town . Between them, they cover three continents and 40% of the world population . The four countries are also quite diverse in terms of their demographic and economic characteristics and therefore have very different per capita energy and CO2 intensities for the transport sector (Table 1) .
These four economies, especially China, have large and growing markets for vehicles: for instance, 38% of light-duty vehicle sales in 2017 were in these four countries (Table 2) . India has very low ownership of LDVs, and therefore, there is significant potential for vehicle growth here . China has also shown leadership in electric vehicles and accounted for 50% of global sales of electric cars in 2017 .
Drivers of mobility in cities The fundamental driver of the movement of people through space is that it is rarely undertaken for its own sake, but to achieve some objective at the destination that is separated in space from the origin . This physical movement costs money and takes time, both of which are limited; therefore, people like to minimize both time
and money to increase their overall welfare . Trans-port planning has traditionally included incomes, jobs, population densities, city design, public transportation provision, car ownership and road infrastructure as essential drivers of mobility [8] . This section discusses these trends, shows how they have impacted urban mobility and compares them across our four important cities in emerging economies . Based on the published literature, the starting hypothesis is that mobility (espe-cially personal mobility in private vehicles): (a) is linked to per-capita incomes [9-12], but maybe changing as cities adopt new priorities over the value of car use [16]; (b) is inversely related to density [13]; (c) can be reduced through the better design and increasing diversity of land use [14]; and (d) will increase if road space is in-creased as the major priority in managing such mobility [15;16] . Many developed cities, mostly in Europe, have reduced their dependence on cars through a package of complementary transport and land-use policies that have increased both the direct costs (vehicle registration taxes, green taxes) and indirect costs (slower speeds, less parking, congestion) of car use while improving the safety, convenience and feasibility of walking, cycling and public transport [17] . This apparent peak in car use in most developed and some emerging cities has been documented [18] and raises the question of whether fast-developing cities are also likely to follow suit soon . This chapter will provide some basis for assessing this question .
Brazil is the most urbanized country of the four, with the highest per-capita incomes and highest motor vehicle ownership (Table 1) . Over the last decade, 158 cars were owned per 1000 people in Brazil in 2007, rising to 187 in 2015 [2], indicating slow growth in motor vehicle ownership . São Paulo is the largest city in Brazil, where in 2007, of the total number of trips made in the metropolitan region, 27 .4% were by private automobile (mostly car), 41 .5% were made using public transport (mostly bus) and 31 .2 % were made using non-motorized
Table 1 . Socio-demographic characteristics of China, India, Brazil and South Africa
Indicator China India Brazil South Africa
Population in 2000 (Millions) 1 1,270 1,053 176 45
Population in 2015 (Millions) 1 1,397 1,309 206 55
% Compound Annual Growth Rate (CAGR) for Energy 2000-15 0.6% 1.5% 1.1% 1.4%
Share of Urban Population (2015) 1 55 .5% 32 .8% 85 .8% 64 .8%
GDP per capita PPP 2015 (constant international 2011 $) 2 13,319 5,748 14,700 12,378
Transport Energy 2000 (Mtoe) 3 90 32 47 12
Transport Energy 2015 (Mtoe) 4 300 85 84 18
% CAGR Energy 2000-15 8.4% 6.8% 3.9% 2.7%
Transport CO2 Emissions 2015 (Million tCO2) 4 968 265 195 54
Per Capita Energy Intensity transport 2015 (kgoe/person) 215 65 408 326
Per Capita CO2 Emissions transport 2015 (kgCO2/person) 693 202 949 977
Data Source: 1 . [1]; 2 . [2]; 3 . [3]; 4 . [4]
Table 2 . LDV Market Overview for China, India, Brazil and South Africa
Country Passenger Cars per 1000 in 20151
Vehicle sales in 2017
(thousands)2
% of Global Sales
Average fuel consumption in 2017 (liter
of gasoline equiva-
lent/100 km)2
Avg engine power in
2017 (Kw) 2
Electric vehicle vales
in 2017 (thousand)3
% of Global Market Share of
EVs 2
China 102 25,565 31% 7 .6 108 579 .0 50% 2 .3%
India 23 3,424 4% 5 .6 62 2 .0 0% 0 .1%
Brazil 187 2,167 3% 7 .6 86 0 .4 0% 0 .0%
South Africa 120 526 1% 7 .4 97 0 .2 0% 0 .0%
World 83,500 1148 .7
Source : 1 . [5]; 2 . [6]; 3 . [7]
Page 28 – Mobility in cities in emerging economies: trends and drivers Mobility in cities in emerging economies: trends and drivers – Page 29
DTU International Energy Report 2019 DTU International Energy Report 2019
Chapter 4
Mobility in cities in emerging economies: trends and driversSubash Dhar and Talat Munshi, UNEP DTU Partnership Peter Newman and Yuan Gao, Curtin University Sustainability Policy (CUSP) Institute, Curtin University
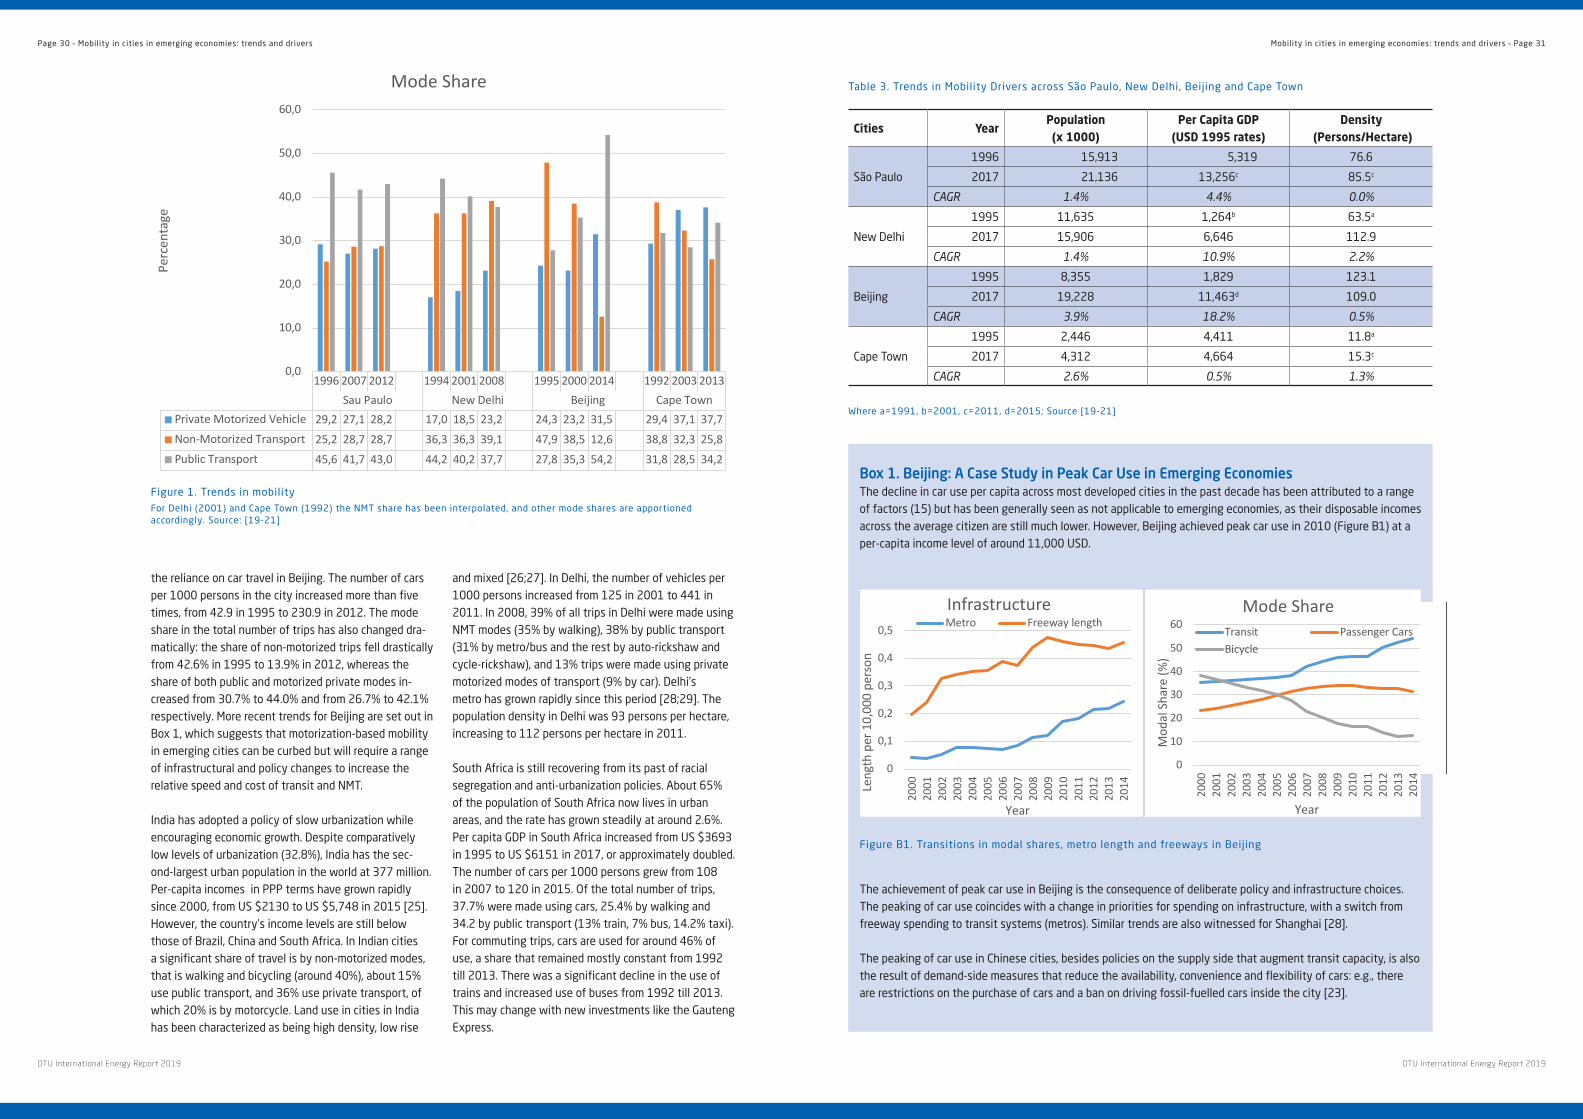
the reliance on car travel in Beijing . The number of cars per 1000 persons in the city increased more than five times, from 42 .9 in 1995 to 230 .9 in 2012 . The mode share in the total number of trips has also changed dra-matically: the share of non-motorized trips fell drastically from 42 .6% in 1995 to 13 .9% in 2012, whereas the share of both public and motorized private modes in-creased from 30 .7% to 44 .0% and from 26 .7% to 42 .1% respectively . More recent trends for Beijing are set out in Box 1, which suggests that motorization-based mobility in emerging cities can be curbed but will require a range of infrastructural and policy changes to increase the relative speed and cost of transit and NMT .
India has adopted a policy of slow urbanization while encouraging economic growth . Despite comparatively low levels of urbanization (32 .8%), India has the sec-ond-largest urban population in the world at 377 million . Per-capita incomes in PPP terms have grown rapidly since 2000, from US $2130 to US $5,748 in 2015 [25] . However, the country’s income levels are still below those of Brazil, China and South Africa . In Indian cities a significant share of travel is by non-motorized modes, that is walking and bicycling (around 40%), about 15% use public transport, and 36% use private transport, of which 20% is by motorcycle . Land use in cities in India has been characterized as being high density, low rise
and mixed [26;27] . In Delhi, the number of vehicles per 1000 persons increased from 125 in 2001 to 441 in 2011 . In 2008, 39% of all trips in Delhi were made using NMT modes (35% by walking), 38% by public transport (31% by metro/bus and the rest by auto-rickshaw and cycle-rickshaw), and 13% trips were made using private motorized modes of transport (9% by car) . Delhi’s metro has grown rapidly since this period [28;29] . The population density in Delhi was 93 persons per hectare, increasing to 112 persons per hectare in 2011 .
South Africa is still recovering from its past of racial segregation and anti-urbanization policies . About 65% of the population of South Africa now lives in urban areas, and the rate has grown steadily at around 2 .6% . Per capita GDP in South Africa increased from US $3693 in 1995 to US $6151 in 2017, or approximately doubled . The number of cars per 1000 persons grew from 108 in 2007 to 120 in 2015 . Of the total number of trips, 37 .7% were made using cars, 25 .4% by walking and 34 .2 by public transport (13% train, 7% bus, 14 .2% taxi) . For commuting trips, cars are used for around 46% of use, a share that remained mostly constant from 1992 till 2013 . There was a significant decline in the use of trains and increased use of buses from 1992 till 2013 . This may change with new investments like the Gauteng Express .
Table 3 . Trends in Mobility Drivers across São Paulo, New Delhi, Beijing and Cape Town
Cities YearPopulation (x 1000)
Per Capita GDP (USD 1995 rates)
Density (Persons/Hectare)
São Paulo
1996 15,913 5,319 76 .6
2017 21,136 13,256c 85 .5c
CAGR 1.4% 4.4% 0.0%
New Delhi
1995 11,635 1,264b 63 .5a
2017 15,906 6,646 112 .9
CAGR 1.4% 10.9% 2.2%
Beijing
1995 8,355 1,829 123 .1
2017 19,228 11,463d 109 .0
CAGR 3.9% 18.2% 0.5%
Cape Town
1995 2,446 4,411 11 .8a
2017 4,312 4,664 15 .3c
CAGR 2.6% 0.5% 1.3%
Where a=1991, b=2001, c=2011, d=2015; Source [19-21]
Figure 1 . Trends in mobilityFor Delhi (2001) and Cape Town (1992) the NMT share has been interpolated, and other mode shares are apportioned accordingly . Source: [19-21]
Box 1. Beijing: A Case Study in Peak Car Use in Emerging EconomiesThe decline in car use per capita across most developed cities in the past decade has been attributed to a range of factors (15) but has been generally seen as not applicable to emerging economies, as their disposable incomes across the average citizen are still much lower . However, Beijing achieved peak car use in 2010 (Figure B1) at a per-capita income level of around 11,000 USD .
Figure B1 . Transitions in modal shares, metro length and freeways in Beijing
The achievement of peak car use in Beijing is the consequence of deliberate policy and infrastructure choices . The peaking of car use coincides with a change in priorities for spending on infrastructure, with a switch from freeway spending to transit systems (metros) . Similar trends are also witnessed for Shanghai [28] .
The peaking of car use in Chinese cities, besides policies on the supply side that augment transit capacity, is also the result of demand-side measures that reduce the availability, convenience and flexibility of cars: e .g ., there are restrictions on the purchase of cars and a ban on driving fossil-fuelled cars inside the city [23] .
Table 3. Trends in Mobility Drivers across São Paulo, New Delhi, Beijing and Cape Town
Cities Year Population (x 1000) Per Capita GDP Density
(USD 1995 rates) (Persons/Hectare)
São Paulo
1996 15,913 5,319 76.6
2017 21,136 13,256c 85.5c
CAGR 1.4% 4.4% 0.0%
New Delhi
1995 11,635 1,264b 63.5a
2017 15,906 6,646 112.9
CAGR 1.4% 10.9% 2.2%
Beijing
1995 8,355 1,829 123.1
2017 19,228 11,463d 109.0
CAGR 3.9% 18.2% 0.5%
Cape Town
1995 2,446 4,411 11.8a
2017 4,312 4,664 15.3c
CAGR 2.6% 0.5% 1.3% Where a=1991, b=2001, c=2011, d=2015; Source [19-21]
Figure 1. Trends in mobility For Delhi (2001) and Cape Town (1992) the NMT share has been interpolated, and other mode shares are apportioned
accordingly. Source: [19-21]
1996 2007 2012 1994 2001 2008 1995 2000 2014 1992 2003 2013Sau Paulo New Delhi Beijing Cape Town
Private Motorized Vehicle 29,2 27,1 28,2 17,0 18,5 23,2 24,3 23,2 31,5 29,4 37,1 37,7Non-Motorized Transport 25,2 28,7 28,7 36,3 36,3 39,1 47,9 38,5 12,6 38,8 32,3 25,8Public Transport 45,6 41,7 43,0 44,2 40,2 37,7 27,8 35,3 54,2 31,8 28,5 34,2
0,0
10,0
20,0
30,0
40,0
50,0
60,0
Perc
enta
ge
Mode Share
The four cities compared here are from different regions and are very different in the manner in which they have experienced physical and economic growth. There is a distinctly high, but mostly declining share of non-motorized transport in cities where population densities have fallen. The decrease in densities and increase in per-capita incomes in Beijing have resulted in reduced NMT trips, whereas an increase in density in Delhi with the increase in incomes has resulted in a stable share of NMT modes. São Paulo has most of its employment heavily concentrated in the central areas, and low-income residents have settled in the peripheries. Thus a significant proportion of the population still walks and uses public transport. Cape Town has traditionally been a car-based economy; therefore, the share of car trips remains high, but as a large portion of the population is still poor, it also has a significant number of walking trips. Mode share of private motorized vehicles (car / 2 wheelers) has shown increasing trends except for São Paulo. However, while in Beijing (see Box 1) the mode share of cars has peaked, given the rates at which these cities are growing (Table 3) overall use is still increasing. Moreover, the shift in modal shares is mainly from the NMT mode to public transport modes, which is also not desired from the perspective of environmental performance. Thus there is a need to use instruments that maintain the share of NMT modes and that encourage shifts from motorized modes towards public transport in these cities.
City of the Future: technology and planning Mobility in emerging economies is happening in a different technological context compared to developed countries. Car ownership is lower than in developed countries, and substantial investments must be made in
Box 1. Beijing: A Case Study in Peak Car Use in Emerging Economies The decline in car use per capita across most developed cities in the past decade has been attributed to a range of factors (15) but has been generally seen as not applicable to emerging economies, as their disposable incomes across the average citizen are still much lower. However, Beijing achieved peak car use in 2010 (Figure B1) at a per-capita income level of around 11,000 USD.
Figure B1. Transitions in modal shares, metro length and freeways in Beijing
The achievement of peak car use in Beijing is the consequence of deliberate policy and infrastructure choices. The peaking of car use coincides with a change in priorities for spending on infrastructure, with a switch from freeway spending to transit systems (metros). Similar trends are also witnessed for Shanghai [28].
The peaking of car use in Chinese cities, besides policies on the supply side that augment transit capacity, is also the result of demand-side measures that reduce the availability, convenience and flexibility of cars: e.g., there are restrictions on the purchase of cars and a ban on driving fossil-fuelled cars inside the city [23].
0
0,1
0,2
0,3
0,4
0,5
2000
2001
2002
2003
2004
2005
2006
2007
2008
2009
2010
2011
2012
2013
2014Le
ngth
per
10,
000
pers
on
Year
InfrastructureMetro Freeway length
0
10
20
30
40
50
60
2000
2001
2002
2003
2004
2005
2006
2007
2008
2009
2010
2011
2012
2013
2014
Mod
al S
hare
(%)
Year
Mode ShareTransit Passenger CarsBicycle
Page 30 – Mobility in cities in emerging economies: trends and drivers Mobility in cities in emerging economies: trends and drivers – Page 31
DTU International Energy Report 2019 DTU International Energy Report 2019
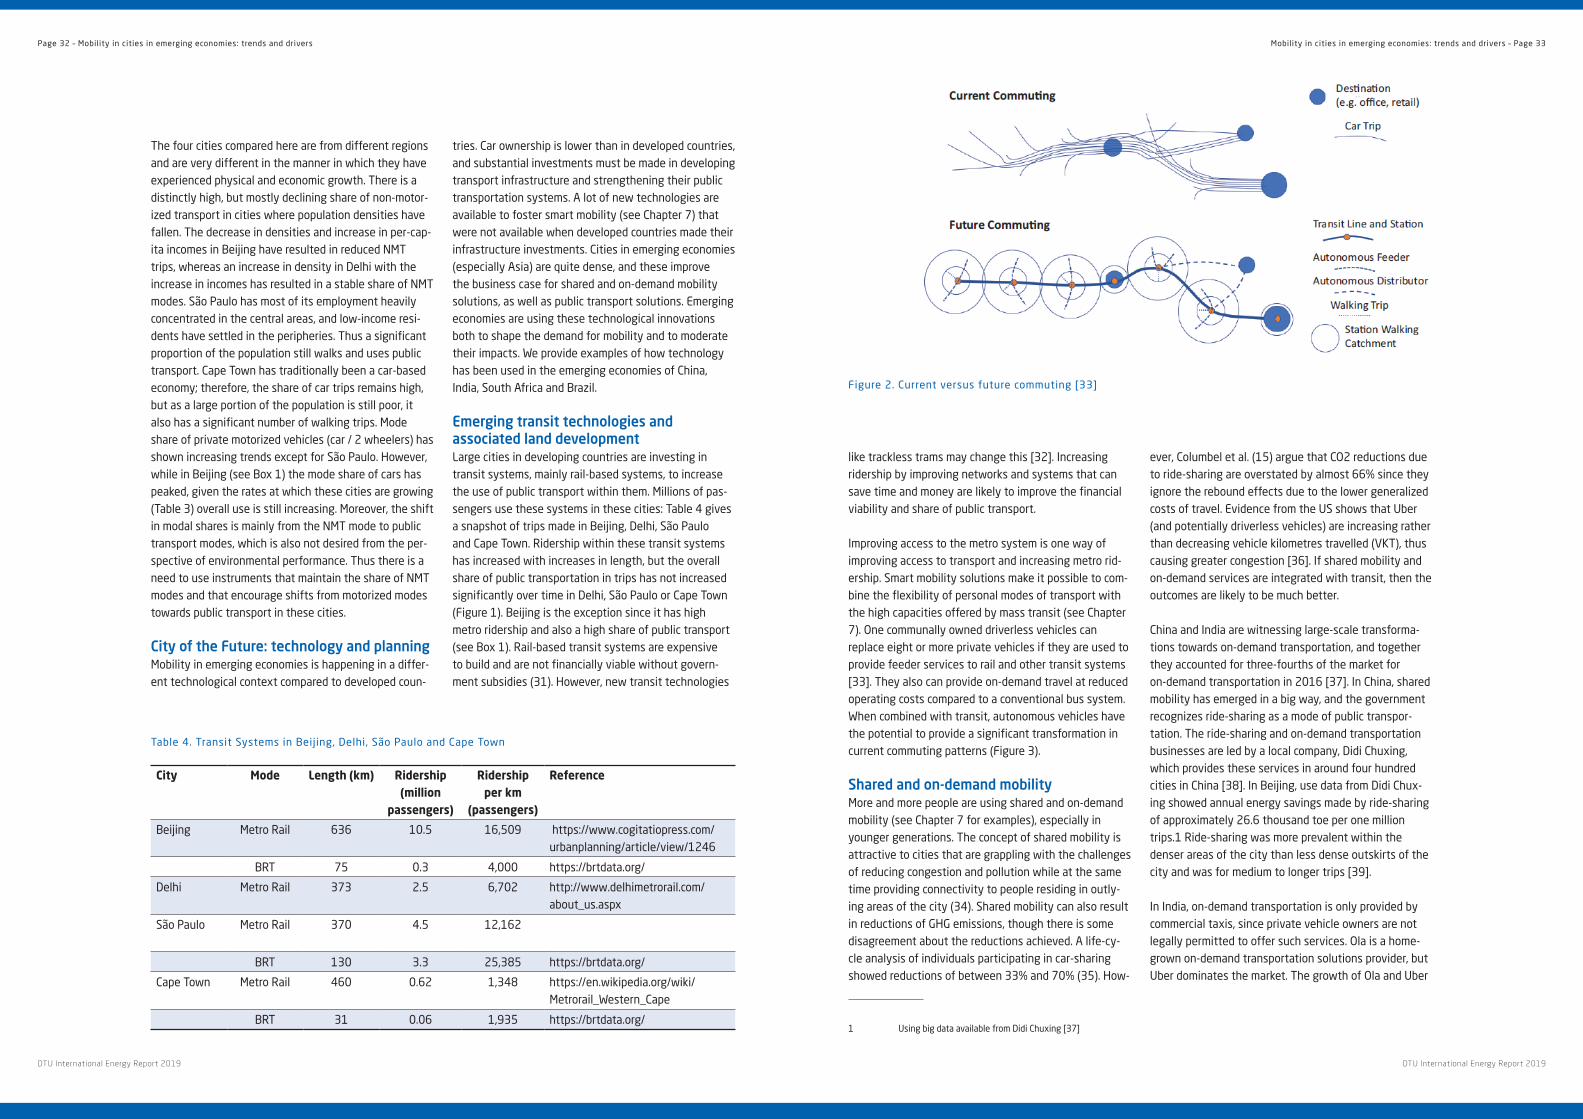
like trackless trams may change this [32] . Increasing ridership by improving networks and systems that can save time and money are likely to improve the financial viability and share of public transport .
Improving access to the metro system is one way of improving access to transport and increasing metro rid-ership . Smart mobility solutions make it possible to com-bine the flexibility of personal modes of transport with the high capacities offered by mass transit (see Chapter 7) . One communally owned driverless vehicles can replace eight or more private vehicles if they are used to provide feeder services to rail and other transit systems [33] . They also can provide on-demand travel at reduced operating costs compared to a conventional bus system . When combined with transit, autonomous vehicles have the potential to provide a significant transformation in current commuting patterns (Figure 3) .
Shared and on-demand mobility More and more people are using shared and on-demand mobility (see Chapter 7 for examples), especially in younger generations . The concept of shared mobility is attractive to cities that are grappling with the challenges of reducing congestion and pollution while at the same time providing connectivity to people residing in outly-ing areas of the city (34) . Shared mobility can also result in reductions of GHG emissions, though there is some disagreement about the reductions achieved . A life-cy-cle analysis of individuals participating in car-sharing showed reductions of between 33% and 70% (35) . How-
1 Using big data available from Didi Chuxing [37]
ever, Columbel et al . (15) argue that CO2 reductions due to ride-sharing are overstated by almost 66% since they ignore the rebound effects due to the lower generalized costs of travel . Evidence from the US shows that Uber (and potentially driverless vehicles) are increasing rather than decreasing vehicle kilometres travelled (VKT), thus causing greater congestion [36] . If shared mobility and on-demand services are integrated with transit, then the outcomes are likely to be much better .
China and India are witnessing large-scale transforma-tions towards on-demand transportation, and together they accounted for three-fourths of the market for on-demand transportation in 2016 [37] . In China, shared mobility has emerged in a big way, and the government recognizes ride-sharing as a mode of public transpor-tation . The ride-sharing and on-demand transportation businesses are led by a local company, Didi Chuxing, which provides these services in around four hundred cities in China [38] . In Beijing, use data from Didi Chux-ing showed annual energy savings made by ride-sharing of approximately 26 .6 thousand toe per one million trips .1 Ride-sharing was more prevalent within the denser areas of the city than less dense outskirts of the city and was for medium to longer trips [39] .
In India, on-demand transportation is only provided by commercial taxis, since private vehicle owners are not legally permitted to offer such services . Ola is a home-grown on-demand transportation solutions provider, but Uber dominates the market . The growth of Ola and Uber
The four cities compared here are from different regions and are very different in the manner in which they have experienced physical and economic growth . There is a distinctly high, but mostly declining share of non-motor-ized transport in cities where population densities have fallen . The decrease in densities and increase in per-cap-ita incomes in Beijing have resulted in reduced NMT trips, whereas an increase in density in Delhi with the increase in incomes has resulted in a stable share of NMT modes . São Paulo has most of its employment heavily concentrated in the central areas, and low-income resi-dents have settled in the peripheries . Thus a significant proportion of the population still walks and uses public transport . Cape Town has traditionally been a car-based economy; therefore, the share of car trips remains high, but as a large portion of the population is still poor, it also has a significant number of walking trips . Mode share of private motorized vehicles (car / 2 wheelers) has shown increasing trends except for São Paulo . However, while in Beijing (see Box 1) the mode share of cars has peaked, given the rates at which these cities are growing (Table 3) overall use is still increasing . Moreover, the shift in modal shares is mainly from the NMT mode to public transport modes, which is also not desired from the per-spective of environmental performance . Thus there is a need to use instruments that maintain the share of NMT modes and that encourage shifts from motorized modes towards public transport in these cities .
City of the Future: technology and planningMobility in emerging economies is happening in a differ-ent technological context compared to developed coun-
tries . Car ownership is lower than in developed countries, and substantial investments must be made in developing transport infrastructure and strengthening their public transportation systems . A lot of new technologies are available to foster smart mobility (see Chapter 7) that were not available when developed countries made their infrastructure investments . Cities in emerging economies (especially Asia) are quite dense, and these improve the business case for shared and on-demand mobility solutions, as well as public transport solutions . Emerging economies are using these technological innovations both to shape the demand for mobility and to moderate their impacts . We provide examples of how technology has been used in the emerging economies of China, India, South Africa and Brazil .
Emerging transit technologies and associated land development Large cities in developing countries are investing in transit systems, mainly rail-based systems, to increase the use of public transport within them . Millions of pas-sengers use these systems in these cities: Table 4 gives a snapshot of trips made in Beijing, Delhi, São Paulo and Cape Town . Ridership within these transit systems has increased with increases in length, but the overall share of public transportation in trips has not increased significantly over time in Delhi, São Paulo or Cape Town (Figure 1) . Beijing is the exception since it has high metro ridership and also a high share of public transport (see Box 1) . Rail-based transit systems are expensive to build and are not financially viable without govern-ment subsidies (31) . However, new transit technologies
Table 4 . Transit Systems in Beijing, Delhi, São Paulo and Cape Town
City Mode Length (km) Ridership (million
passengers)
Ridership per km
(passengers)
Reference
Beijing Metro Rail 636 10 .5 16,509 https://www .cogitatiopress .com/urbanplanning/article/view/1246
BRT 75 0 .3 4,000 https://brtdata .org/
Delhi Metro Rail 373 2 .5 6,702 http://www .delhimetrorail .com/about_us .aspx
São Paulo Metro Rail 370 4 .5 12,162
BRT 130 3 .3 25,385 https://brtdata .org/
Cape Town Metro Rail 460 0 .62 1,348 https://en .wikipedia .org/wiki/ Metrorail_Western_Cape
BRT 31 0 .06 1,935 https://brtdata .org/
Figure 2 . Current versus future commuting [33]
Page 32 – Mobility in cities in emerging economies: trends and drivers Mobility in cities in emerging economies: trends and drivers – Page 33
DTU International Energy Report 2019 DTU International Energy Report 2019
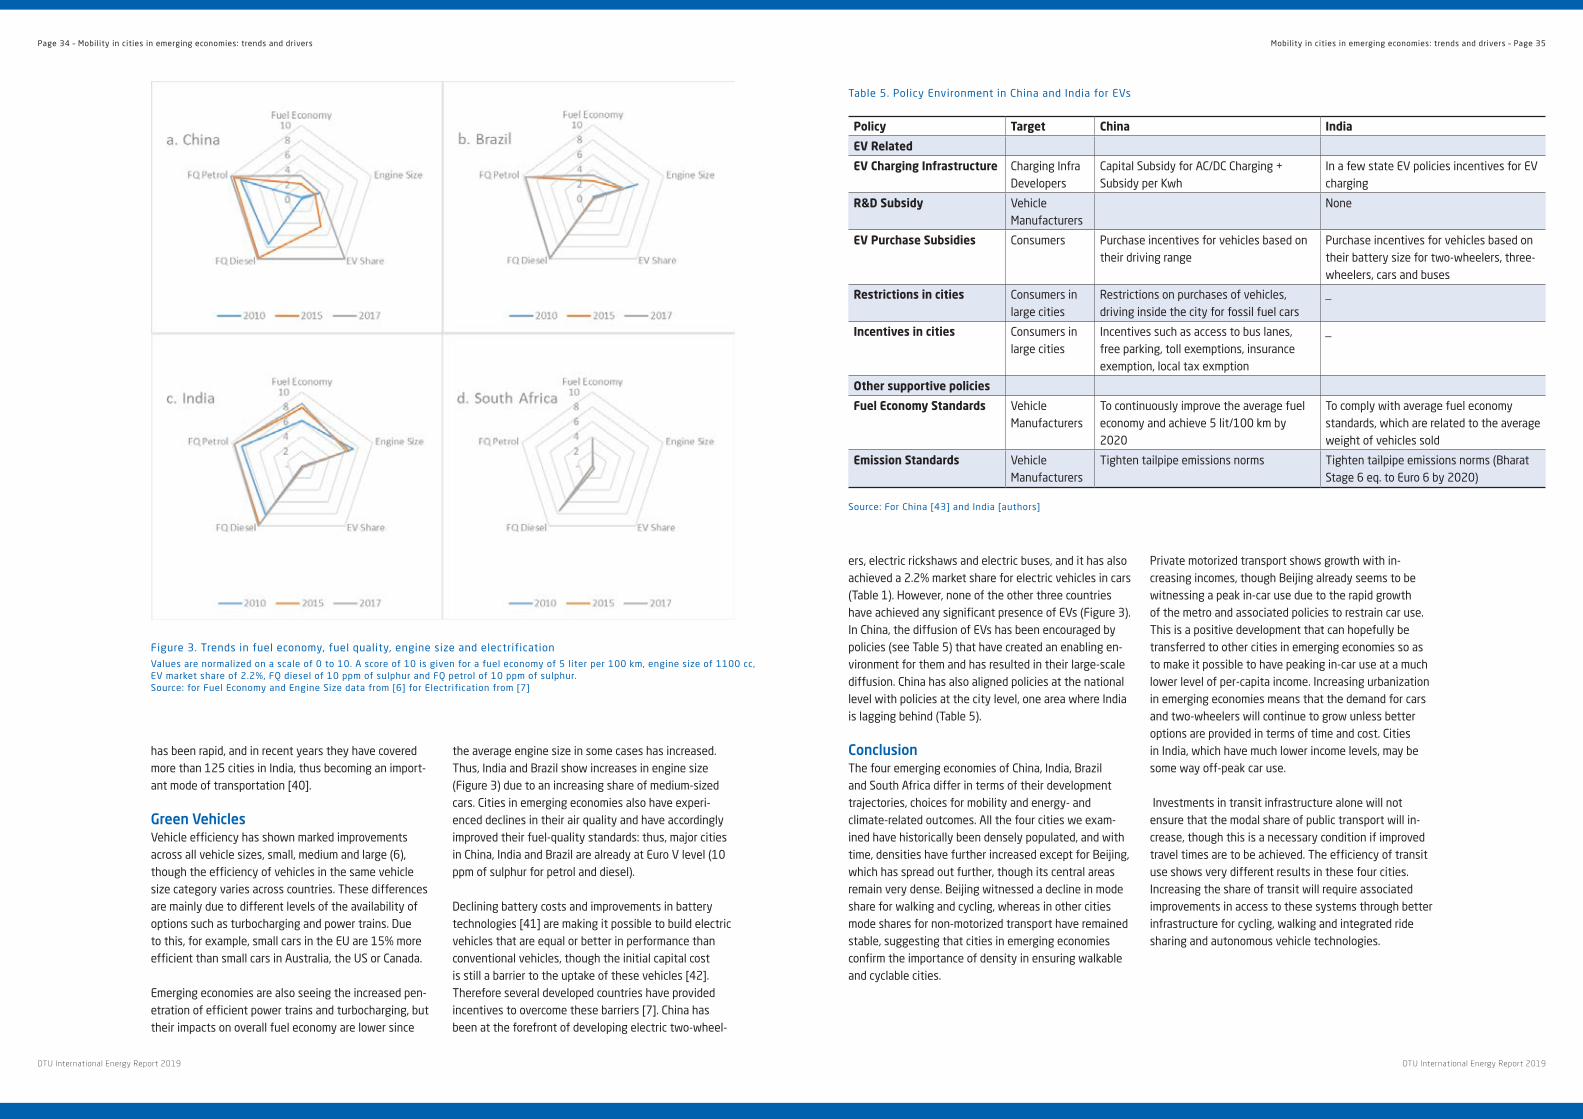
ers, electric rickshaws and electric buses, and it has also achieved a 2 .2% market share for electric vehicles in cars (Table 1) . However, none of the other three countries have achieved any significant presence of EVs (Figure 3) . In China, the diffusion of EVs has been encouraged by policies (see Table 5) that have created an enabling en-vironment for them and has resulted in their large-scale diffusion . China has also aligned policies at the national level with policies at the city level, one area where India is lagging behind (Table 5) .
Conclusion The four emerging economies of China, India, Brazil and South Africa differ in terms of their development trajectories, choices for mobility and energy- and climate-related outcomes . All the four cities we exam-ined have historically been densely populated, and with time, densities have further increased except for Beijing, which has spread out further, though its central areas remain very dense . Beijing witnessed a decline in mode share for walking and cycling, whereas in other cities mode shares for non-motorized transport have remained stable, suggesting that cities in emerging economies confirm the importance of density in ensuring walkable and cyclable cities .
Private motorized transport shows growth with in-creasing incomes, though Beijing already seems to be witnessing a peak in-car use due to the rapid growth of the metro and associated policies to restrain car use . This is a positive development that can hopefully be transferred to other cities in emerging economies so as to make it possible to have peaking in-car use at a much lower level of per-capita income . Increasing urbanization in emerging economies means that the demand for cars and two-wheelers will continue to grow unless better options are provided in terms of time and cost . Cities in India, which have much lower income levels, may be some way off-peak car use .
Investments in transit infrastructure alone will not ensure that the modal share of public transport will in-crease, though this is a necessary condition if improved travel times are to be achieved . The efficiency of transit use shows very different results in these four cities . Increasing the share of transit will require associated improvements in access to these systems through better infrastructure for cycling, walking and integrated ride sharing and autonomous vehicle technologies .
has been rapid, and in recent years they have covered more than 125 cities in India, thus becoming an import-ant mode of transportation [40] .
Green Vehicles Vehicle efficiency has shown marked improvements across all vehicle sizes, small, medium and large (6), though the efficiency of vehicles in the same vehicle size category varies across countries . These differences are mainly due to different levels of the availability of options such as turbocharging and power trains . Due to this, for example, small cars in the EU are 15% more efficient than small cars in Australia, the US or Canada .
Emerging economies are also seeing the increased pen-etration of efficient power trains and turbocharging, but their impacts on overall fuel economy are lower since
the average engine size in some cases has increased . Thus, India and Brazil show increases in engine size (Figure 3) due to an increasing share of medium-sized cars . Cities in emerging economies also have experi-enced declines in their air quality and have accordingly improved their fuel-quality standards: thus, major cities in China, India and Brazil are already at Euro V level (10 ppm of sulphur for petrol and diesel) .
Declining battery costs and improvements in battery technologies [41] are making it possible to build electric vehicles that are equal or better in performance than conventional vehicles, though the initial capital cost is still a barrier to the uptake of these vehicles [42] . Therefore several developed countries have provided incentives to overcome these barriers [7] . China has been at the forefront of developing electric two-wheel-
Figure 3 . Trends in fuel economy, fuel quality, engine size and electrificationValues are normalized on a scale of 0 to 10 . A score of 10 is given for a fuel economy of 5 liter per 100 km, engine size of 1100 cc, EV market share of 2 .2%, FQ diesel of 10 ppm of sulphur and FQ petrol of 10 ppm of sulphur . Source: for Fuel Economy and Engine Size data from [6] for Electrification from [7]
Table 5 . Policy Environment in China and India for EVs
Policy Target China India
EV Related
EV Charging Infrastructure Charging Infra Developers
Capital Subsidy for AC/DC Charging + Subsidy per Kwh
In a few state EV policies incentives for EV charging
R&D Subsidy Vehicle Manufacturers
None
EV Purchase Subsidies Consumers Purchase incentives for vehicles based on their driving range
Purchase incentives for vehicles based on their battery size for two-wheelers, three-wheelers, cars and buses
Restrictions in cities Consumers in large cities
Restrictions on purchases of vehicles, driving inside the city for fossil fuel cars
_
Incentives in cities Consumers in large cities
Incentives such as access to bus lanes, free parking, toll exemptions, insurance exemption, local tax exmption
_
Other supportive policies
Fuel Economy Standards Vehicle Manufacturers
To continuously improve the average fuel economy and achieve 5 lit/100 km by 2020
To comply with average fuel economy standards, which are related to the average weight of vehicles sold
Emission Standards Vehicle Manufacturers
Tighten tailpipe emissions norms Tighten tailpipe emissions norms (Bharat Stage 6 eq . to Euro 6 by 2020)
Source: For China [43] and India [authors]
Page 34 – Mobility in cities in emerging economies: trends and drivers Mobility in cities in emerging economies: trends and drivers – Page 35
DTU International Energy Report 2019 DTU International Energy Report 2019
32 . Newman P, Hargroves K, Davies-Slate S, Conley D, Verschuer M, Mouritz M, et al . The Trackless Tram: Is It the Transit and City
Shaping Catalyst We Have Been Waiting for? Journal Transportation Technologies . 2019;9(1):31-55 .
33 . Glazebrook G, Newman P . The City of the Future . Urban Planning . 2018;3(2):1-20 .
34 . Cohen B, Kietzmann J . Ride On! Mobility Business Models for the Sharing Economy 10 .1177/1086026614546199 .
Organization & Environment . 2014;27(3):279-96 .
35 . Chen TD, Kockelman KM . Carsharing’s life-cycle impacts on energy use and greenhouse gas emissions . Transportation Research
Part D: Transport and Environment . 2016;47:276-84 .
36 . Schaller B . The New Automobility: Lyft, Uber and the Future of American Cities . New York: Schaller Consulting; 2018 .
37 . Shaheen S . Shared Mobility: The Potential of Ridehailing and Pooling . Three Revolutions: Springer; 2018 . p . 55-76 .
38 . Anderson C . Top Ridesharing Companies Worldwide: <https://www .ridester .com/ridesharing-companies-world/>; 2018
39 . Yu B, Ma Y, Xue M, Tang B, Wang B, Yan J, et al . Environmental benefits from ridesharing: A case of Beijing . Applied Energy .
2017;191:141-52 .
40 . Bhattacharya A . Ola vs Uber: The latest score in the great Indian taxi-app game . Quartz India <https://qzcom/india/1545042/
ola-vs-uber-the-latest-score-in-the-great-indian-taxi-app-game/> Downloaded 12 May 2019 . 2019 .
41 . Edelenbosch OY, Hof AF, Nykvist B, Girod B, van Vuuren DP . Transport electrification: the effect of recent battery cost reduction
on future emission scenarios . Climatic Change . 2018;151(2):95-108 .
42 . Kester J, Noel L, Zarazua de Rubens G, Sovacool BK . Policy mechanisms to accelerate electric vehicle adoption: A qualitative
review from the Nordic region . Renewable and Sustainable Energy Reviews . 2018;94:719-31 .
43 . Wang N, Tang L, Zhang W, Guo J . How to face the challenges caused by the abolishment of subsidies for electric vehicles in
China? Energy . 2019;166:359-72 .
References1 . UN . World Urbanization Prospects: The 2018 Revision, Online Edition .: United Nations (UN), Department of Economic and Social
Affiars, Population Division, 22 April 2019 <https://population .un .org/wup/Download/; 2018
2 . WB . World Development Indicators: https://databank .worldbank .org/data/indicator/NY .GDP .PCAP .CD/1ff4a498/Popular-
Indicators; 2019
3 . IEA . World Energy Outlook 2007: China and India Insights . Paris: International Energy Agency; 2007 .
4 . IEA . World Energy Outlook 2017 . Paris: International Energy Agency; 2017 .
5 . IEA . International Comparison of Light Duty Vehicle Fuel Economy 2005-15: Ten years of fuel economy benchmarking . Paris:
International Energy Agency; 2017 .
6 . IEA . Working Paper 19: Fuel Economy in Major Car Markets: Technology and Policy Drivers 2005-2017 . Paris: OECD/IEA
Download on 8 May 2019 <https://www .globalfueleconomy .org/media/418761/wp15-ldv-comparison .pdf>; 2019 .
7 . IEA . Global EV Outlook 2018: Towards cross-modal electrification . Paris: International Energy Agency; 2018 .
8 . Munshi T . Built environment and mode choice relationship for commute travel in the city of Rajkot, India . Transportation
research part D: transport and environment . 2016;44:239-53 .
9 . Schäfer A, Victor D . The past and future of global mobility . Scientific American . 1997:36-9 .
10 . Dargay J, Gately D, Sommer M . Vehicle ownership and income growth, worldwide: 1960-2030 . The Energy Journal .
2007;28(4):143 .
11 . Button K, Ngoe N, Hine J . Modelling vehicle ownership and use in low income countries . Journal of Transport Economics and
Policy . 1993:51-67 .
12 . Button K, Ngoe N, Hine J . Modelling Vehicle Ownership And Use In Low Income Countries . In: The Automobile . Classics in
Transport Analysis . 2003(7) .
13 . Kenworthy JR, Laube FB . Patterns of automobile dependence in cities: an international overview of key physical and economic
dimensions with some implications for urban policy . Transportation Research Part A: Policy and Practice . 1999;33(7-8):691-
723 .
14 . Cervero R . Linking urban transport and land use in developing countries . Journal of Transport and Land Use . 2013;6(1):7-24 .
15 . Coulombel N, Boutueil V, Liu L, Viguie V, Yin B . Substantial rebound effects in urban ridesharing: Simulating travel decisions
in Paris, France . Transportation Research Part D: Transport and Environment . The roles of users in low-carbon transport
innovations: Electrified, automated, and shared mobility . 2019;71:110-26 .
16 . Newman P, Kenworthy J . The end of automobile dependence . The End of Automobile Dependence: Springer; 2015 . p . 201-26 .
17 . Buehler R, Pucher J, Gerike R, Götschi T . Reducing car dependence in the heart of Europe: lessons from Germany, Austria, and
Switzerland . Transport reviews . 2017;37(1):4-28 .
18 . Kenworthy J, Newman P . The End of Automobile Dependence: How Cities are Moving Beyond Car-Based Planning . Island Press;
2015 .
19 . Kenworthy J . Is automobile dependence in emerging cities an irresistible force? Perspectives from São Paulo, Taipei, Prague,
Mumbai, Shanghai, Beijing, and Guangzhou . Sustainability . 2017;9(11):1953 .
20 . MRSP . Mobility Report for teh Metropolitan Region of São paulo . In: Paulo GotSoS, editor . 2012 .
21 . Pojani D, Stead D . The urban transport crisis in emerging economies: Springer; 2017 .
22 . Hagen JX, Pardo C, Valente JB . Motivations for motorcycle use for Urban travel in Latin America: A qualitative study . Transport
Policy . 2016;49:93-104 .
23 . Sandroni P . Socially Sustainable Urban Development: The Case of São Paulo . Megacities: Springer; 2011 . p . 345-71 .
24 . Gao Y, Newman P . Beijing’s Peak Car Transition: Hope for Emerging Cities in the 1 .5 °C Agenda . Urban Planning . 2018;3(2):82-
93 .
25 . Rathi S . India . Urban Book Series2017 . p . 81-106 .
26 . Munshi T . Built form , Travel Behaviour and Low Carbon Develpment in Ahmedabad, India . Enschede, the Netherlands:
University of Twente; 2013 .
27 . Munshi T, Brussel M, Zuidgeest M, Van Maarseveen M . Development of employment sub-centres in the city of Ahmedabad,
India . Environment and urbanization Asia . 2018;9(1):37-51 .
28 . Sharma R . Financing Indian Urban Rail through Land Development: Case Studies and Implications for the Accelerated Reduction
in Oil Associated with 1 .5 °C . Urban Planning . 2018;3(2):21-34 .
29 . Sharma R, Newman P . Urban Rail and Sustainable Development Key Lessons from Hong Kong, New York, London and India for
Emerging Cities . Transportation Research Procedia . Emerging technologies and models for transport and mobility . 2017;26:92-
105 .
30 . Gao Y, Kenworthy JR, Newman P, Gao W . Transport and Mobility Trends in Beijing and Shanghai: Implications for Urban
Passenger Transport Energy Transitions Worldwide . Urban Energy Transition: Elsevier; 2018 . p . 205-23 .
31 . Goel R, Tiwari G . Case Study of Metro Rails in Indian Cities . Copenhagen: UNEP Risoe Centre; 2014 .
Page 36 – Mobility in cities in emerging economies: trends and drivers Mobility in cities in emerging economies: trends and drivers – Page 37
DTU International Energy Report 2019 DTU International Energy Report 2019

Societal factorsThe mode share of cycling and walking varies consid-erably between countries and regions . In Europe, the Netherlands, followed by Denmark, are the leading cycling countries, while eastern European countries, in particular Romania and Bulgaria, are dominant in the use of walking [28] . High shares of walking may often re-flect economic disadvantage rather than preference and go along with restrictions regarding alternative modes of transport . However, higher shares of walking can also simply reflect different cultures and traditions: for ex-ample, in many western (e .g ., UK, Ireland) and southern European countries (e .g ., Spain, Portugal), walking is more common than cycling, while cycling may be popular as a sport but not as a mode of transport (e .g ., France) .
Reasons for the high shares of cycling in Denmark and the Netherlands can be found in the historical devel-opment of these countries and their applied cycling policies, which can be related to the important role the bicycle played in the formation of their respective national identities [22;29;30] . In both countries the bike is considered a mainstream everyday mode of transport, while people in low-cycling Western countries often perceive it as strange or abnormal to cycle as a form of travel [31;32] . In other regions (e .g . some eastern European and Asian countries) it is common to cycle, but in contrast to the car the bike and public transport are associated with low social status [33–36] . With increas-ing wealth, cycling levels are expected to fall in these regions unless existing norms can be changed .
Studies of immigrants’ mobility support the relevance of cultural norms for cycling, as immigrants to high-cycling cultures cycle less than the general population [37–39], while immigrants to low-cycling cultures cycle more [40] . Differences in travel patterns also persist when relevant socio-demographic and infrastructural factors are con-trolled for, indicating that cultural norms inherited from one’s parents and/or one’s country of origin play a role for whether or not cycling is adopted .
Environmental factorsIn relation to environmental factors, urban densities and accessibility are regarded as preconditions for the shorter travel distances that favour cycling [41] . A review of fourteen cities and countries found that for walking, density and the number of parks show curvilin-ear relationships, suggesting the prevalence of optimum values at the higher end of the scale [42] . The same study shows a positive relationship between land-use mixes and both walking and cycling . The concepts of
walkability and bikeability summarize different micro-en-vironmental features that describe areas as more or less “walkable” or “bikeable” based on conditions of access, environmental quality and infrastructure for pedestrians and bicycles respectively [43–45] . Apart from actual bikeability, perceived bikeability has also been related to cycling [46] . Perceptions of the urban environment also play a role in walking as a choice . It has been shown that acceptable walking distances increase with accessible additional destinations, such as shops, and with positive sensory experience of urban environments; by contrast, they decrease with hilliness [47;48] .
Compared to large cities, small cities can offer good opportunities for walking and cycling due to their smaller geographical size and lighter motor traffic levels [49] . Both Denmark and the Netherlands are relatively dense, but their larger cities are of a size that still allows many destinations to be reached by bike . Moreover, both countries are relatively flat and have temperate climates characterized by mild winters, circumstances that are also supportive of cycling [38] .
Research indicates that both the supply and format of bicycle infrastructure have significant effects on cycling [49–54] . A large part of the cycling literature focuses on bicycle-riders’ specific preferences for bicycle infrastructure . Due to a lack of observed data and of bicycle infrastructure in places of interest, studies are often based on stated preference data in relation to preferences based on hypothetical scenarios presented to respondents . For example, [55] used a stated pref-erence survey design to estimate the value placed on the different attributes of four alternative cycle routes under consideration in Bradford, which had one of the lowest cycling rates in the United Kingdom . The study found that in this area cyclists valued safety more highly than time savings . In [56], the authors imagine a future with a more highly elaborated strategic cycle network in Santiago de Chile in order to “reconsider the bicycle as an alternative mode of transport” . Their results indicated that, with such improvements, the bicycle as a mode of transport could capture up to 10% of the trips and on average approximately 5 .8% compared to the current 1 .6% mode split .
More recent studies of route choice behaviour for cy-clists have provided more precise measures for cyclists’ preferences (e .g . number of turns, hilliness, land-use types and type of infrastructure) based on actual trips measured using GPS . Specifically, [57] found that cyclists in Portland, Oregon, USA, put a relatively high
IntroductionActive modes of transport, most importantly walking and cycling, have many advantages compared to other modes for both the individual and society . The bene-fits for the individual include improved health through increased physical activity, such as lower cardiovascular risk [1–4] and the lower risks of obesity [4–6], type 2 dia-betes [7] and psychological stress [8] . It has been shown that the health benefits of the use of active transport modes clearly outweigh the potential risks from greater exposure to air pollution and traffic accidents [9;10] .
The individual health benefits also lead to a reduction in social costs through savings to the health-care system . Other social benefits include the avoidance of air and noise pollution [11] and the lower space consumption of active compared to motorized modes of transport . Copenhagen was most probably the first city to quantify the economic benefits of cycling [12] . A recent European study estimated the total social benefits of cycling and walking at around 0 .18 and 0 .37 Euros per kilometre travelled respectively, resulting in savings of 90 billion Euros in the EU per year [13] . Modal shifts to active transport modes can thus help to solve the social, eco-nomic and environmental problems that many cities face and thereby make them healthier and more liveable .
With regard to e-bikes, it has been found that they not only reduce the use of conventional bikes, but also – though to a lesser extent – car and public transport use [14] . User patterns and related effects differ between sub-groups of users: while older people tend to increase cycling frequencies, younger people tend to increase cycled distances [15] . In addition, e-bikes provide new opportunities for people who would otherwise not cycle [16] . Overall, the gains from physical activity are estimated to be similar for e-bikers and conventional cyclists [17] . However, results with regard to e-bike safety are still inconclusive and may present a different picture with regard to the overall social benefits, as
e-bikes are creating new safety challenges because of their different user groups, types of problems and types of crashes [18–20] .
Cities around the world are currently trying to increase the share of active transport modes [21;22], thereby contributing to UN Sustainable Development Goal 11 to “make cities inclusive, safe, resilient and sustainable“ . London has set itself the goal of increasing the share of cycling by 400% by 2026 compared to a 2001 baseline [23], Paris aims to double the number of kilometres of cycle lanes from 700 km to 1400 km between 2015 and 2020, while Beijing aims to reposition and increase cycling by redeveloping its 3200 km of cycling lanes by 2020 [24] . Copenhagen plans to invest 150 – 240 mil-lion Euros in cycling infrastructure from 2017 to 2025 [25], Berlin 200 million Euros until 2021 [26] .
In this chapter, we first provide an overview of the factors that influence the use of active transport modes and later show how this knowledge can be used to achieve modal shifts . In Denmark, and in Copenhagen in particular, cycling is already a substantial part of everyday mobility . Copenhagen is often regarded as one of the world’s best cycling cities (27), and its existing cycling culture may inspire other cities . Thus, many of the examples referred to in this chapter relate to Copen-hagen .
Understanding the use of active transport modesIn wanting to understand why citizens use or do not use active transport modes and how they can be motivated to extend their use, one can focus on different kinds of influences: societal factors, including existing norms and policies related to mode choice, or the environment, including transport infrastructure, landscape and the weather, and travellers’ individual characteristics, includ-ing demographic and psychological factors .
Chapter 5
Active transport modesSonja Haustein and Anders Fjendbo Jensen, DTU Management Thomas Alexander Sick Nielsen, Danish Road Directorate
Active transport modes – Page 39
DTU International Energy Report 2019 DTU International Energy Report 2019
identity as cyclist . Finally, health-related reasons are apparently becoming an increasingly important factor in cycling and are thus also used in cycling campaigns, besides environmental motives .
Active modes in transport planning modelsSo far, little to no effort has been made to incorporate active transport modes in the strategic transport plan-ning models [58], which are used in most cities in Europe to support mobility policies . The main problems have been that the current level of detail in transport models is often too low to model cyclist or pedestrian behaviour . Furthermore, cyclists and pedestrians behave differently from car drivers in several respects, so the elaborated methods developed for car transport often cannot be adopted directly . While recent studies generally do now provide behavioural parameters for route choice, there are a few examples of actual implementations in strategic transport models that could, for example, be used to decide between investments in routes through traffic-calmed local roads or (probably faster and more expensive) routes on cycle tracks next to busy main streets . The two largest transport models in Denmark are the National Transport Model or NTM [83] and the
Copenhagen Transport Model or OTM [84] . While the NTM does not include a specific model for bicycle rider’s route choice, the latest version of the OTM model has a focus on improving the representation of cycling by implementing a model that takes account of elevation, land-use and type of infrastructure for bicycle trips . Another example, this time from the Netherlands, is the BRUTUS bicycle traffic model used in the province of Utrecht, which is based on the national cycling network maintained by the Dutch Cyclists Federation [85] .
Based on the need for an assessment of intersection designs, the City of Copenhagen has also done work to adapt existing microsimulation software to include cyclists (86) . The microsimulation models are often used to develop the design of large urban intersections where the volume and specific positioning and behaviour of cyclists pose a challenge to the geometry and traffic capacity . For a city with a large number of cyclists, it is also important for all modes to be considered and their “priority” or waiting times to be assessed . To support cost-benefit analyses of proposals, monetary value has also been assigned to cycling and its health benefits . This was initially presented by the city of Copenhagen
value on off-road bike paths, whereas [58] found that cyclists in Copenhagen prefer segregated cycle tracks next to a road to off-road bike paths . Furthermore, [59] found that cyclists in Copenhagen do not prefer routes with cycle lanes (cycle tracks defined by paint on the side of a road) to routes without bicycle infrastructure . A significant preference was only found for elevated cycle tracks next to a road (so that the separation is clearer), the design typically used in Denmark . A disadvantage of results from studies of route-choice modelling is that they only take the preferences of existing cyclists into account and thus cannot provide information about what attributes might attract current non-cyclists .
Individual factorsPrevious research has shown several links between cycling and demographic factors, in particular age and gender . However, the extent to which these factors influence cycling depends on the context . In high-cycling countries, all age groups and genders are well repre-sented among cyclists, while it is typical of low-cycling countries, like Australia, the UK and the US, that women and older people are under-represented among cyclists [60–62] . These differences can partly be explained by safety concerns and risk perceptions that vary with age [63] and gender [64] . For example, it has been shown that women feel more uncomfortable riding against the permitted direction compared to men [59] . Thus, age and gender play a larger role under uncertain cycling conditions . Reasons for safety concerns can be a fear of crime on the one hand [65;66] and the lack of safe cycling infrastructure on the other hand [32;52;67] . In a survey of seventeen European countries, Danes reported the highest degree of perceived safety when cycling [68], which is likely to contribute to the equal gender distribution of cyclists in Denmark . This shows that social, individual and environmental factors are strongly interlinked .
Apart from age and gender, research indicates that household structure [69] and employment status [62] are related to cycling . Accordingly, perceived constraints related to family and household demands (e .g . trans-porting children) and perceived mobility needs have been found to facilitate car use and restrict cycling [32;70;71] . However, here too it has recently been shown that in Copenhagen, high perceived mobility needs actually support the use of both car and bike, while they only hamper public transport use [72] . This indicates that the bicycle can compete with the car in a city that facilitates cycling .
However, decisions regarding travel mode are not only influenced by the functional aspects, such as saving travel time and money, but also by symbolic and affec-tive motives related to the travel mode [33;73–75], as well as social norms . Even if society as a whole does not support cycling, people may perceive social support and recognition from relevant others, or – in contrast – perceive disapproval in more car-oriented sub-groups . For the intention to use a bike, [76] found descriptive norms (i .e . whether one’s important others cycles or not) more relevant than subjective norms (i .e . what import-ant others think about cycling) . Support for the impact of subjective norms comes from a study examining the effect of an online platform sharing information among cycling commuters: it showed that the process of shar-ing information had not only a functional role but also a social one, as perceived in-group membership and high levels of trust within the group supported positive views about cycling and encouraged new cycling commuters [77] .
Affective motives seem to play a particular role in e-bike adoption . People who are excited about the higher speed and acceleration of e-bikes are more likely to re-place car trips by e-bike trips [18], as well as people who are dissatisfied with car commuting [78] .
Apart from social norms and attitudes, empirical evi-dence has so far been presented in particular for the Theory of Planned Behaviour [79] construct of perceived behavioural control (PBC) . In the case of cycling, PBC basically measures how easy or difficult people perceive it to reach their important or regular destinations by bike and whether the choice of cycling is perceived as being purely one’s own [76] . PBC is related to feelings of autonomy when riding a bike and has been shown to influence cycling also when demographic and infrastruc-tural factors were controlled for [27;80] .
With regard to cycling, it also makes a big difference how sensitive people are towards bad weather conditions . Actually, it has been found that weather sensitivity has a higher impact on the likelihood to cycle than actual weather conditions and that this factor can differenti-ate between people who cycle as a leisure activity and those who do so for purposes of transport and commut-ing [81] . The notion that leisure cyclists have a different mind-set than cycling commuters is supported by a study that found bicycle use for sport negatively related to the intention to commute by bicycle [82] . In this study, symbolic and affective motives were also found to play a role in commuting by bicycle, as well as in a social
Page 40 – Active transport modes Active transport modes – Page 41
DTU International Energy Report 2019 DTU International Energy Report 2019
Bamberg [104] integrated constructs of the Theory of Planned Behaviour [79] and the Norm-Activation Model [105] into a “stage model of self-regulated behavioral change”, suggesting that people require different interventions depending on which stage of behaviour change they are currently at . In a phone-based so-cial-marketing campaign (106), it was demonstrated that stage-based interventions led to a reduction in car use and triggered people’s progression to more action-ori-ented stages . Support for the relevance of stage-based interventions also comes from a study by [107], which applied Prochaska’s Thanstheoretical model [108] to the practice of cycling to work . In relation to cycling, stage models suggest, for example, that people who have no intention of starting or increasing cycling, first need to be informed about the potential benefits of cycling (and/or the negative effects of not cycling) . Those who have already formed this intention rather need assistance in formulating specific personal goals and acquiring information on how to achieve them . Finally, those who have already started to increase their cycling frequency need feedback and social support to maintain their new behaviour and turn it into a new habit, as, for example, has been done successfully by online information-shar-ing among cyclists [77] .
Reviewing different behaviour change techniques applied to cycling, [109] concludes that the inclusion of self-monitoring and intention-formation techniques are the most promising . Another review found that inter-ventions that promote cycling specifically rather than general changes in travel behaviour are more successful [110] .
The Danish cycling campaign “Ta’ cyklen Danmark” included several elements that aimed to support people at different stages in the process of changing their behaviour . Here, more general information about cycling and its health benefits were provided through differ-ent media channels and at doctors and health centres aiming to raise awareness among people who had not formed any intention of increasing cycling frequency as yet . For people who did intend to do so, a customised smart-phone application (a “cycling coach”) helped set a realistic goal, while the app also supported goal-achieve-ment by feedback, self-monitoring and social support . DTU evaluated the campaign and concluded that at least 21 million cycling trips were conducted because of its activities [111] . Another cycling campaign in Denmark resulted in a total increase of 35 million cycling trips in the municipality of Odense during the three years it ran [112], while the national “Bike-to-Work” campaign re-
sulted in 29 .5 million kilometres being travelled by bicy-cle by 93,000 participants in 2011 [113] . Based on the campaign costs, an additional bike trip costs between 0 .07 EUR (Ta’ Cyklen), 0 .08 EUR (Odense) and 0 .2 EUR (Bike-to-work), which is below the estimated benefits of cycling . Results from the annual Danish “All Kids Bike” campaign, focusing on getting children to bike to school, indicate a 4-5% increase in the share of children cycling to school on a regular basis [114] .
Conclusion and key messages Compared to other modes of transport, like the car, we still know little about the cultural and psychological di-mensions of cycling and walking and why usage differs so strongly between cities and countries . In the case of cycling, it seems that cultural norms developed over time play a relevant role, as well as policies and infrastructure that support cycling and make people perceive it as a normal and time-efficient behaviour in cycling cultures like Denmark and the Netherlands . Understanding how such cultural norms are transformed into individual social and personal norms and behaviour in childhood and ado-lescents, what role parents, peers and social institutions play in this process, and what aspects of cycling cultures can be transferred to other countries still require further investigation .
While research on pedestrians’ and cyclists’ individual preferences is progressing, more efforts are required to integrate this knowledge into transport planning models .
When looking at ways to increase cycling, [115] suggest that “Substantial increases in bicycling require an integrated package of many different, complementary interventions, including infrastructure provision and pro-bicycle programs, supportive land use planning, and restrictions on car use .” This reflects what has been shown in this review, namely that many different factors play a role in the uptake of cycling and need to be addressed . However, what is relevant in a specific city or country depends greatly on the existing physical environment and mobility culture, for example, what infrastructure is available and what perceptions and practices about cycling predominate . It is highly likely that cycling must be demonstrated to be safe, healthy, modern and efficient if its adoption is to be stimulated while ensuring the support of the general public . How-ever, instead of using standardized approaches, it has been found useful to address people individually, taking into account their current behaviour and intentions, as well as the opportunities provided by existing urban layouts and infrastructure .
[12] and later integrated into the Ministry of Transport’s cost-benefit analysis framework [87] .
How to achieve behavioural change?Measures for how to achieve behavioural shifts from the car to active modes of transport include improvements to infrastructure and car-restrictive policies, such as parking management or road-pricing . In addition to these “hard” measures, “soft” measures have been used to achieve voluntary changes in mode choice, for instance, through information and awareness campaigns . In this section, we present an overview of such measures and their achievable effects .
Improvements to infrastructure and maintenanceImprovements to infrastructure are often regarded as the main measure for achieving modal shifts (88) . While a sufficient pavement is necessary to get to places, today’s challenges for active modes are related much more to fast and heavy motor traffic (89) . In many Euro-pean countries, distinct cycle tracks and sidewalks, both separated from motor traffic, are considered a funda-mental principle of actual and perceived road safety and active-mode mobility . This has led to systematic traffic calming on local streets and a vast network of cycle tracks, especially along the busier streets [49] .
Infrastructural improvements to cycle paths can be made on different levels, ranging from a simple separation through colour via poles to actual separation through kerbs and higher levels of the upgrading of existing infrastructure: for example, upgrading cycling paths to cycle highways, as in the Copenhagen suburbs (54;90) . Specific evaluations were conducted after the opening of radial cycle highways from Copenhagen to the sub-urbs of Farum, Albertslund and Ishøj . While the volume of cyclists could be increased considerably from before to after the enhanced cycling infrastructure was opened, replacing motorized modes has often been limited . Among the cyclists using the three cycle highways after their opening, 9%, 10% and 19% respectively reported being new cyclists who had shifted from a motorized mode of transport [91–94] . The cycling highways also increased active cyclists’ satisfaction and thereby proba-bly prevented them shifting in the future to other modes of travel . Infrastructural improvements will often cover managing conflicts with pedestrians or parked cars along the route, as well as improvements at intersections, where waiting areas (bicycle boxes) or other design changes can increase perceived safety or reduce delays for bicycles [95] . However, there is still a lack of knowl-edge when it comes to explaining success factors and
their efficiency in different geographical and transport contexts . Other infrastructural measures that facilitate cycling include facilities at workplaces, such as parking facilities or changing rooms, and parking facilities at public transport stations [49;96] .
In wanting to increase distances that pedestrians will accept, for example, to reach a transport stop, it has been suggested to provide more pleasant and stim-ulating surroundings instead of boring façades along trafficked streets [97] . Focusing particularly on older people, maintaining the infrastructure and removing snow and ice from pedestrian and cycle paths is another relevant factor, as the fear of falling is one of the most important barriers to older people’s use of active modes or of out-of-home mobility in general [98] . In a Swedish study, older people reported the insufficient prevention of slippery pedestrian paths as the most important risk factor in their outdoor environment [99] . The cycling policy of the City of Copenhagen includes giving a prior-ity to snow-clearing on the main cycle paths in winter . In addition, the concept of cycle highways as implemented in the Copenhagen area includes requirements concern-ing the standard of the surface pavement and lighting as well as snow clearance in order to maintain its attrac-tiveness at all seasons .
Car-restrictive policiesThe most important car-restrictive policies are road-pric-ing [100;101] and parking management policies, which have been implemented in several cities [e .g .102] . Both are likely to increase the costs and difficulties of trav-elling by car and thus increase competition from other modes of transport . In addition, high urban densities with limited on-road or other parking will generally have adverse effects on car use and support the use of other modes . Measures country-wide include taxing cars and motor fuel . Denmark has a high car-registration tax (between 105% and 150%), which is related to a low rate of car ownership [27] . The use of environmental taxation (e .g . by providing lower taxes for smaller, less polluting cars) does not necessarily lead to the desired effects of customers preferring greener cars but can also increase the percentage of people who can afford, and thus buy, a second car .
Psychological interventionsApart from general awareness campaigns and the provision of information, more elaborate intervention studies have been carried out that make use of specific behavioural change techniques derived from psychologi-cal theories . Based on the model of action phases [103],
Page 42 – Active transport modes Active transport modes – Page 43
DTU International Energy Report 2019 DTU International Energy Report 2019
20 . Van Cauwenberg J, De Bourdeaudhuij I, Clarys P, de Geus B, Deforche B . E-bikes among older adults: benefits, disadvantages,
usage and crash characteristics . Transportation (Amst) [Internet] . 2018 Sep; Available from: https://doi .org/10 .1007/s11116-
018-9919-y
21 . Handy S, van Wee B, Kroesen M . Promoting Cycling for Transport: Research Needs and Challenges . Transp Rev [Internet] . 2014
Jan 2 [cited 2019 May 11];34(1):4–24 . Available from: http://www .tandfonline .com/doi/abs/10 .1080/01441647 .2013 .860204
22 . Lanzendorf M, Busch-Geertsema A . The cycling boom in large German cities—Empirical evidence for successful
cycling campaigns . Transp Policy [Internet] . 2014 [cited 2018 Jun 3];36:26–33 . Available from: https://ac .els-cdn .com/
S0967070X14001498/1-s2 .0-S0967070X14001498-main .pdf?_tid=bf0edab2-7070-4c55-bc42-6fbe1aa94e60&acdnat=15
28021395_5dc6840cbb8c79468b908dc07e04152b
23 . London . Cycling Revolution London . 2010 .
24 . Zhao C, Carstensen TA, Nielsen TAS, Olafsson AS . Bicycle-friendly infrastructure planning in Beijing and Copenhagen -
between adapting design solutions and learning local planning cultures . J Transp Geogr [Internet] . 2018 Apr 1 [cited 2019 Jun
9];68:149–59 . Available from: https://www .sciencedirect .com/science/article/abs/pii/S0966692317306099
25 . City of Copenhagen . Bicycle path priority plan 2017-2025 . Cykelstiprioriteringsplan 2017-2025; 2017 .
26 . Reidl A . Verkehrswende in der Hauptstadt . Zeit .de [Internet] . 2017 Aug 25; Available from: https://www .zeit .de/
mobilitaet/2017-08/berliner-mobilitaetsgesetz-volksentscheid-fahrrad-senat/komplettansicht?print
27 . Haustein S, Koglin T, Nielsen TAS, Svensson Å . A comparison of cycling cultures in Stockholm and Copenhagen . Int J Sustain
Transp [Internet] . 2019;0(0):1–14 . Available from: https://doi .org/10 .1080/15568318 .2018 .1547463
28 . Haustein S, Sick Nielsen TA . European mobility cultures: A survey-based cluster analysis across 28 European countries .
JTRG [Internet] . 2016 [cited 2017 May 19];54:173–80 . Available from: http://ac .els-cdn .com/S0966692316302770/1-s2 .0-
S0966692316302770-main .pdf?_tid=8dbcb7b0-3c73-11e7-85db-00000aacb35d&acdnat=1495185445_750cf2556725bc
952ab884e9e27b4fc8
29 . Koglin T . Organisation does matter – planning for cycling in Stockholm and Copenhagen . Transp Policy [Internet] . 2015;39:55–
62 . Available from: http://dx .doi .org/10 .1016/j .tranpol .2015 .02 .003
30 . Carstensen AT, Ebert AK . Cycling Cultures in Northern Europe: From ‘Golden Age’to ‘Renaissance . In: Cycling and sustainability .
Emerald Group Publishing Limited; 2012 . p . 23–58 .
31 . Aldred R . Incompetent or Too Competent? Negotiating Everyday Cycling Identities in a Motor Dominated Society . Mobilities
[Internet] . 2013 May 1;8(2):252–71 . Available from: https://doi .org/10 .1080/17450101 .2012 .696342
32 . Pooley CG, Horton D, Scheldeman G, Mullen C, Jones T, Tight M, et al . Policies for promoting walking and cycling in England : A
view from the street . Transp Policy [Internet] . 2013;27:66–72 . Available from: http://dx .doi .org/10 .1016/j .tranpol .2013 .01 .003
33 . Pojani D, Bakija D, Shkreli E, Corcoran J, Mateo-Babiano I . Do Northwestern and Southeastern Europe Share a Common “Cycling
Mindset”? Comparative Analysis of Beliefs toward Cycling in the Netherlands and the Balkans . EJTIR Issue [Internet] . 2017
[cited 2017 Apr 29];17(171):25–4525 . Available from: http://www .tbm .tudelft .nl/fileadmin/Faculteit/TBM/Onderzoek/EJTIR/
Back_issues/17 .1/2017_01_01 .pdf
34 . Ashmore DP, Pojani D, Thoreau R, Christie N, Tyler NA . Gauging differences in public transport symbolism across national
cultures: implications for policy development and transfer . J Transp Geogr [Internet] . 2019 May 1 [cited 2019 Aug 23];77:26–
38 . Available from: https://www .sciencedirect .com/science/article/pii/S0966692318302023
35 . Belgiawan PF, Schmöcker J-D, Abou-Zeid M, Walker J, Lee T-C, Ettema DF, et al . Car ownership motivations among undergraduate
students in China, Indonesia, Japan, Lebanon, Netherlands, Taiwan, and USA . Transportation (Amst) [Internet] . 2014
Nov;41(6):1227–44 . Available from: https://doi .org/10 .1007/s11116-014-9548-z
36 . Van HT, Choocharukul K, Fujii S . The effect of attitudes toward cars and public transportation on behavioral intention in
commuting mode choice—A comparison across six Asian countries . Transp Res Part A Policy Pract [Internet] . 2014 Nov [cited
2019 May 11];69:36–44 . Available from: https://linkinghub .elsevier .com/retrieve/pii/S0965856414001888
37 . Harms L . Mobility among Ethnic Minorities in the Urban Netherlands [Internet] . 2007 . Available from: https://difu .de/
publikationen/mobility-among-ethnic-minorities-in-the-urban-netherlands .html
38 . Haustein S, Kroesen M, Mulalic I . Cycling culture and socialisation: modelling the effect of immigrant origin on cycling in
Denmark and the Netherlands . Transportation (Amst) [Internet] . 2019 Jan; Available from: https://doi .org/10 .1007/s11116-
019-09978-6
39 . Welsch J, Conrad K, Wittowsky D . Exploring immigrants travel behaviour: empirical findings from Offenbach am Main, Germany .
Transportation (Amst) [Internet] . 2018;45(3):733–50 . Available from: https://doi .org/10 .1007/s11116-016-9748-9
40 . Smart M . US immigrants and bicycling: Two-wheeled in Autopia . 2010 [cited 2019 May 11]; Available from: www .elsevier .com/
locate/tranpol
41 . Nielsen TAS, Olafsson AS, Carstensen TA, Skov-Petersen H . Environmental correlates of cycling: Evaluating urban form
and location effects based on Danish micro-data . Transp Res Part D Transp Environ [Internet] . 2013 Jul 1 [cited 2019 Aug
23];22:40–4 . Available from: https://www .sciencedirect .com/science/article/pii/S136192091300045X
References1 . Blond K, Jensen MK, Rasmussen MG, Overvad K, Tjønneland A, Østergaard L, et al . Prospective Study of Bicycling and Risk of
Coronary Heart Disease in Danish Men and Women . Circulation [Internet] . 2016 Nov [cited 2019 May 9];134(18):1409–11 .
Available from: https://www .ahajournals .org/doi/10 .1161/CIRCULATIONAHA .116 .024651
2 . De Geus B, Van Hoof E, Aerts I, Meeusen R . Cycling to work: influence on indexes of health in untrained men and women in
Flanders . Coronary heart disease and quality of life . Scand J Med Sci Sports [Internet] . 2008;18(4):498–510 . Available from:
https://onlinelibrary .wiley .com/doi/abs/10 .1111/j .1600-0838 .2007 .00729 .x
3 . Laverty AA, Mindell JS, Webb EA, Millett C . Active Travel to Work and Cardiovascular Risk Factors in the United Kingdom . Am
J Prev Med [Internet] . 2013 Sep 1 [cited 2019 May 9];45(3):282–8 . Available from: https://www .sciencedirect .com/science/
article/pii/S0749379713003334
4 . Millett C, Agrawal S, Sullivan R, Vaz M, Kurpad A, Bharathi A V ., et al . Associations between Active Travel to Work and
Overweight, Hypertension, and Diabetes in India: A Cross-Sectional Study . Bhalla K, editor . PLoS Med [Internet] . 2013 Jun 11
[cited 2019 May 9];10(6):e1001459 . Available from: http://dx .plos .org/10 .1371/journal .pmed .1001459
5 . Frank LD, Andresen MA, Schmid TL . Obesity relationships with community design, physical activity, and time spent in cars . Am
J Prev Med [Internet] . 2004 Aug 1 [cited 2019 May 9];27(2):87–96 . Available from: https://www .sciencedirect .com/science/
article/pii/S074937970400087X
6 . Pucher J, Buehler R, Bassett DR, Dannenberg AL . Walking and Cycling to Health: A Comparative Analysis of City, State,
and International Data . Am J Public Health [Internet] . 2010;100(10):1986–92 . Available from: https://doi .org/10 .2105/
AJPH .2009 .189324
7 . Rasmussen MG, Grøntved A, Blond K, Overvad K, Tjønneland A, Jensen MK, et al . Associations between Recreational and
Commuter Cycling, Changes in Cycling, and Type 2 Diabetes Risk: A Cohort Study of Danish Men and Women . PLoS Med
[Internet] . 2016;13(7):1–17 . Available from: http://dx .doi .org/10 .1371%2Fjournal .pmed .1002076
8 . Avila-Palencia I, de Nazelle A, Cole-Hunter T, Donaire-Gonzalez D, Jerrett M, Rodriguez DA, et al . The relationship between
bicycle commuting and perceived stress: a cross-sectional study . BMJ Open [Internet] . 2017 Jun 23 [cited 2019 May
9];7(6):e013542 . Available from: http://bmjopen .bmj .com/lookup/doi/10 .1136/bmjopen-2016-013542
9 . de Hartog JJ, Boogaard H, Nijland H, Hoek G . Do the Health Benefits of Cycling Outweigh the Risks? Environ Health Perspect
[Internet] . 2010 Aug 1 [cited 2018 Apr 30];118(8):1109–16 . Available from: http://ehp .niehs .nih .gov/0901747
10 . Mueller N, Rojas-Rueda D, Cole-Hunter T, de Nazelle A, Dons E, Gerike R, et al . Health impact assessment of active
transportation: A systematic review . Prev Med (Baltim) [Internet] . 2015 Jul 1 [cited 2018 Apr 10];76:103–14 . Available from:
https://www .sciencedirect .com/science/article/pii/S0091743515001164
11 . de Nazelle A, Nieuwenhuijsen MJ, Antó JM, Brauer M, Briggs D, Braun-Fahrlander C, et al . Improving health through policies that
promote active travel: A review of evidence to support integrated health impact assessment . Environ Int [Internet] . 2011 May 1
[cited 2018 Apr 10];37(4):766–77 . Available from: https://www .sciencedirect .com/science/article/pii/S0160412011000341
12 . COWI . Economic evaluation of cycle projects - methodology and unit prices [Internet] . 2009 . Available from: http://www .cycling-
embassy .dk/2010/06/10/economic-evaluation-of-cycle-projects/
13 . Gössling S, Choi A, Dekker K, Metzler D . The Social Cost of Automobility, Cycling and Walking in the European Union . Ecol
Econ [Internet] . 2019 Apr 1 [cited 2019 Jun 9];158:65–74 . Available from: https://www .sciencedirect .com/science/article/pii/
S0921800918308097
14 . Kroesen M . To what extent do e-bikes substitute travel by other modes? Evidence from the Netherlands . Transp Res Part D
Transp Environ [Internet] . 2017 Jun 1 [cited 2019 Jun 9];53:377–87 . Available from: https://www .sciencedirect .com/science/
article/pii/S1361920916304837
15 . Haustein S, Møller M . Age and attitude: Changes in cycling patterns of different e-bike user segments . Int J Sustain Transp
[Internet] . 2016 Oct 20;10(9):836–46 . Available from: https://doi .org/10 .1080/15568318 .2016 .1162881
16 . Jones T, Harms L, Heinen E . Motives, perceptions and experiences of electric bicycle owners and implications for health,
wellbeing and mobility . J Transp Geogr [Internet] . 2016 May 1 [cited 2019 Jun 9];53:41–9 . Available from: https://www .
sciencedirect .com/science/article/pii/S0966692316301934
17 . Castro A, Gaupp-Berghausen M, Dons E, Standaert A, Laeremans M, Clark A, et al . Physical activity of electric bicycle users
compared to conventional bicycle users and non-cyclists: Insights based on health and transport data from an online survey in
seven European cities . Transp Res Interdiscip Perspect [Internet] . 2019 Jun 1 [cited 2019 Aug 20];1:100017 . Available from:
https://www .sciencedirect .com/science/article/pii/S259019821930017X
18 . Haustein S, Møller M . E-bike safety: Individual-level factors and incident characteristics . J Transp Heal [Internet] . 2016 Sep 1
[cited 2019 Aug 20];3(3):386–94 . Available from: https://www .sciencedirect .com/science/article/pii/S2214140516301979
19 . Huertas-Leyva P, Dozza M, Baldanzini N . Investigating cycling kinematics and braking maneuvers in the real world: e-bikes make
cyclists move faster, brake harder, and experience new conflicts . Transp Res Part F Traffic Psychol Behav [Internet] . 2018 Apr 1
[cited 2019 Aug 20];54:211–22 . Available from: https://www .sciencedirect .com/science/article/pii/S1369847817304096
Page 44 – Active transport modes Active transport modes – Page 45
DTU International Energy Report 2019 DTU International Energy Report 2019
68 . Furian G, Brandstätter C, Kaiser S, Witzik A . Subjective safety and risk perception . ESRA thematic report no . 5 . ESRA project
(European Survey of Road users’ safety Attitudes) [Internet] . Vienna; 2016 . Available from: https://www .esranet .eu/storage/
minisites/esra2015thematicreportno5subjectivesafetyandriskperception .pdf .
69 . Sottile E, Sanjust Di Teulada B, Meloni I, Cherchi E . International Journal of Sustainable Transportation Estimation and validation
of hybrid choice models to identify the role of perception in the choice to cycle Estimation and validation of hybrid choice
models to identify the role of perception in the choice to cycle . 2018 [cited 2018 Nov 14]; Available from: http://www .
tandfonline .com/action/journalInformation?journalCode=ujst20
70 . Haustein S, Hunecke M . Reduced Use of Environmentally Friendly Modes of Transportation Caused by Perceived Mobility
Necessities: An Extension of the Theory of Planned Behavior1 . J Appl Soc Psychol [Internet] . 2007;37(8):1856–83 . Available
from: https://onlinelibrary .wiley .com/doi/abs/10 .1111/j .1559-1816 .2007 .00241 .x
71 . Bonham J, Wilson A . Bicycling and the Life Course: The Start-Stop-Start Experiences of Women Cycling . Int J Sustain Transp
[Internet] . 2012;6(4):195–213 . Available from: https://doi .org/10 .1080/15568318 .2011 .585219
72 . Thorhauge M, Kasahun H, Cherchi E, Haustein S . Mobility Needs, activity patterns and activity flexibility: How individuals select
transportation mode . In: 9th International Symposium on Travel Demand Management . Edinburgh; 2019 .
73 . Anable J, Gatersleben B . All work and no play? The role of instrumental and affective factors in work and leisure journeys by
different travel modes . Transp Res Part A Policy Pract [Internet] . 2005 Feb 1 [cited 2019 Aug 20];39(2–3):163–81 . Available
from: https://www .sciencedirect .com/science/article/pii/S096585640400093X
74 . Hunecke M, Haustein S, Grischkat S, Böhler S . Psychological, sociodemographic, and infrastructural factors as determinants of
ecological impact caused by mobility behavior . J Environ Psychol [Internet] . 2007 Dec 1 [cited 2019 Aug 20];27(4):277–92 .
Available from: https://www .sciencedirect .com/science/article/pii/S0272494407000552
75 . Steg L . Car use: lust and must . Instrumental, symbolic and affective motives for car use . Transp Res Part A Policy Pract
[Internet] . 2005 Feb 1 [cited 2019 Aug 20];39(2–3):147–62 . Available from: https://www .sciencedirect .com/science/article/pii/
S0965856404001016
76 . Eriksson L, Forward SE . Is the intention to travel in a pro-environmental manner and the intention to use the car determined
by different factors? Transp Res Part D Transp Environ [Internet] . 2011 Jul 1 [cited 2019 Aug 20];16(5):372–6 . Available from:
https://www .sciencedirect .com/science/article/pii/S1361920911000289
77 . Bartle C, Avineri E, Chatterjee K . Online information-sharing: A qualitative analysis of community, trust and social influence
amongst commuter cyclists in the UK . Transp Res Part F Traffic Psychol Behav [Internet] . 2013 Jan 1 [cited 2019 Aug
23];16:60–72 . Available from: https://www .sciencedirect .com/science/article/pii/S1369847812000848
78 . de Kruijf J, Ettema D, Kamphuis CBM, Dijst M . Evaluation of an incentive program to stimulate the shift from car commuting to
e-cycling in the Netherlands . J Transp Heal [Internet] . 2018 Sep 1 [cited 2019 Aug 23];10:74–83 . Available from: https://www .
sciencedirect .com/science/article/pii/S2214140517306564
79 . Ajzen I . The theory of planned behavior . Organ Behav Hum Decis Process [Internet] . 1991 Dec 1 [cited 2019 Aug
20];50(2):179–211 . Available from: https://www .sciencedirect .com/science/article/pii/074959789190020T
80 . Hunecke M, Haustein S, Böhler S, Grischkat S . Attitude-Based Target Groups to Reduce the Ecological Impact of Daily Mobility
Behavior . Environ Behav [Internet] . 2010;42(1):3–43 . Available from: https://doi .org/10 .1177/0013916508319587
81 . Haustein S, Hunecke M, Manz W . The impact of weather situations and weather resistance on means of transport usage . Int
Verkehrswes . 2007;59(9) .
82 . Lois D, Moriano JA, Rondinella G . Cycle commuting intention: A model based on theory of planned behaviour and social identity .
Transp Res Part F Traffic Psychol Behav [Internet] . 2015 Jul 1 [cited 2019 Jun 9];32:101–13 . Available from: https://www .
sciencedirect .com/science/article/abs/pii/S1369847815000807
83 . Rich J, Hansen C . The Danish national passenger model – Model specification and results . Eur J Transp Infrastruct Res .
2016;4:573–99 .
84 . Vuk G, Hansen CO, Fox J . The Copenhagen Traffic Model and its Application in the Metro City Ring Project . Transp Rev . 2009 Mar
1;29(2):145–61 .
85 . Mobility Modeling . Brutus [Internet] . accessed 23-08-2019 . 2019 . Available from: https://www .mobilitymodeling .com/brutus/
86 . COWI . Micro simulation of cyclists in peak hour traffic [Internet] . Report made for the City of Copenhagen; 2013 . Available from:
http://vision-traffic .ptvgroup .com/en-uk/references/project-references/cowi-cyclists-in-peak-hour-traffic/
87 . Transportministeriet . TERESA 3 .0, Dokumentation, Incentive for Transportministeriet, Copenhagen . 2013 .
88 . Parkin J, Koorey G . Network Planning and Infrastructure Design . In: Glen K, Parkin J, editors . Cycling and Sustainability
[Internet] . Emerald Group Publishing Limited; 2012 . p . 131–60 . (Transport and Sustainability; vol . 1) . Available from: https://doi .
org/10 .1108/S2044-9941(2012)0000001008
89 . Jacobsen PL, Racioppi F, Rutter H . Who owns the roads? How motorised traffic discourages walking and bicycling . Inj Prev
[Internet] . 2009 Dec 1;15(6):369 LP – 373 . Available from: http://injuryprevention .bmj .com/content/15/6/369 .abstract
90 . Vedel SE, Jacobsen JB, Skov-Petersen H . Bicyclists’ preferences for route characteristics and crowding in Copenhagen – A
choice experiment study of commuters . Transp Res Part A Policy Pract [Internet] . 2017 Jun 1 [cited 2019 Aug 20];100:53–64 .
Available from: https://www .sciencedirect .com/science/article/pii/S0965856416305973
42 . Christiansen LB, Cerin E, Badland H, Kerr J, Davey R, Troelsen J, et al . International comparisons of the associations between
objective measures of the built environment and transport-related walking and cycling: IPEN adult study . J Transp Heal
[Internet] . 2016 Dec 1 [cited 2019 Jun 9];3(4):467–78 . Available from: https://www .sciencedirect .com/science/article/pii/
S2214140516000207
43 . Nielsen TAS, Skov-Petersen H . Bikeability – Urban structures supporting cycling . Effects of local, urban and regional scale urban
form factors on cycling from home and workplace locations in Denmark . J Transp Geogr [Internet] . 2018 May 1 [cited 2019 Aug
20];69:36–44 . Available from: https://www .sciencedirect .com/science/article/pii/S0966692317306385
44 . Forsyth A, Krizek K . Urban Design: Is there a Distinctive View from the Bicycle? J Urban Des [Internet] . 2011;16(4):531–49 .
Available from: https://doi .org/10 .1080/13574809 .2011 .586239
45 . Forsyth A . What is a walkable place? The walkability debate in urban design . URBAN Des Int [Internet] . 2015 Dec;20(4):274–92 .
Available from: https://doi .org/10 .1057/udi .2015 .22
46 . Ma L, Dill J . Do people’s perceptions of neighborhood bikeability match "reality"? Source J Transp L Use [Internet] .
2017 [cited 2018 Mar 16];10(1):291–308 . Available from: http://www .jstor .org/stable/26211732
47 . Hillnhütter H . Pedestrian access to public transport . University of Stavanger; 2016 .
48 . Gehl J, Reigstad S, Johansen Käfer L . Nærkontakt med huse - byer til mennesker [Internet] . Arkitektens Forlag; 2004 [cited
2019 Jun 10] . Available from: https://www .forskningsdatabasen .dk/en/catalog/2397929781
49 . Pucher J, Buehler R . City Cycling . MIT press; 2012 .
50 . Buehler R, Dill J . Bikeway Networks: A Review of Effects on Cycling . Transp Rev [Internet] . 2016 Jan 2 [cited 2019 May
12];36(1):9–27 . Available from: http://www .tandfonline .com/doi/full/10 .1080/01441647 .2015 .1069908
51 . Pucher J, Buehler R . Cycling towards a more sustainable transport future . Transp Rev [Internet] . 2017 Nov 2;37(6):689–94 .
Available from: https://doi .org/10 .1080/01441647 .2017 .1340234
52 . Chataway ES, Kaplan S, Nielsen TAS, Prato CG . Safety perceptions and reported behavior related to cycling in mixed traffic: A
comparison between Brisbane and Copenhagen . Transp Res Part F Traffic Psychol Behav [Internet] . 2014 Mar 1 [cited 2019
Aug 20];23:32–43 . Available from: https://www .sciencedirect .com/science/article/pii/S1369847813001502
53 . Dill J, Carr T . Bicycle Commuting and Facilities in Major U .S . Cities: If You Build Them, Commuters Will Use Them . Transp Res Rec
[Internet] . 2003;1828(1):116–23 . Available from: https://doi .org/10 .3141/1828-14
54 . van Goeverden K, Nielsen TS, Harder H, van Nes R . Interventions in Bicycle Infrastructure, Lessons from Dutch and Danish
Cases . Transp Res Procedia [Internet] . 2015 Jan 1 [cited 2019 Aug 20];10:403–12 . Available from: https://www .sciencedirect .
com/science/article/pii/S235214651500277X
55 . Hopkinson P, Wardman M . Evaluating the demand for new cycle facilities . Transp Policy . 1996 Oct 1;3(4):241–9 .
56 . Ortúzar J de D, Iacobelli A, Valeze C . Estimating demand for a cycle-way network . Transp Res Part A Policy Pract .
2000;34(5):353–73 .
57 . Broach J, Dill J, Gliebe J . Where do cyclists ride? A route choice model developed with revealed preference GPS data . Transp Res
Part A Policy Pract [Internet] . 2012 Dec [cited 2014 Oct 15];46(10):1730–40 . Available from: http://www .sciencedirect .com/
science/article/pii/S0965856412001164
58 . Prato CG, Halldórsdóttir K, Nielsen OA . Evaluation of land-use and transport network effects on cyclists’ route choices in the
Copenhagen Region in value-of-distance space . Int J Sustain Transp . 2018 Feb 20;1–12 .
59 . Palao AFP, Jensen AF, Nielsen OA . Cyclists’ route choices in the Copenhagen Region . Master Thesis, Technical University of
Denmark; 2018 .
60 . Aldred R, Woodcock J, Goodman A . Does More Cycling Mean More Diversity in Cycling? 2016 [cited 2018 Mar 16]; Available from:
https://www .tandfonline .com/doi/pdf/10 .1080/01441647 .2015 .1014451
61 . Heesch KC, Sahlqvist S, Garrard J . Gender differences in recreational and transport cycling: a cross-sectional mixed-methods
comparison of cycling patterns, motivators, and constraints . Int J Behav Nutr Phys Act [Internet] . 2012;9(1):106 . Available from:
https://doi .org/10 .1186/1479-5868-9-106
62 . Heinen E, van Wee B, Maat K . Commuting by Bicycle: An Overview of the Literature . Transp Rev [Internet] . 2010;30(1):59–96 .
Available from: http://dx .doi .org/10 .1080/01441640903187001
63 . Finn P, Bragg BWE . Perception of the risk of an accident by young and older drivers . Accid Anal Prev [Internet] . 1986 Aug 1
[cited 2019 Aug 20];18(4):289–98 . Available from: https://www .sciencedirect .com/science/article/pii/0001457586900436
64 . DeJoy DM . An examination of gender differences in traffic accident risk perception . Accid Anal Prev [Internet] . 1992 Jun 1 [cited
2019 Aug 20];24(3):237–46 . Available from: https://www .sciencedirect .com/science/article/pii/0001457592900032
65 . Haustein S, Kemming H . Subjektive sicherheit von senioren im strassenverkehr/perceived danger in road traffic by seniors .
Zeitschrift für Verkehrssicherheit . 2008;54(3) .
66 . Barajas JM . Supplemental infrastructure: how community networks and immigrant identity influence cycling . Transportation
(Amst) [Internet] . 2018 Nov; Available from: https://doi .org/10 .1007/s11116-018-9955-7
67 . Fraser SDS, Lock K . Cycling for transport and public health: a systematic review of the effect of the environment on cycling .
Eur J Public Health [Internet] . 2011 Dec [cited 2018 Apr 30];21(6):738–43 . Available from: https://academic .oup .com/eurpub/
article-lookup/doi/10 .1093/eurpub/ckq145
Page 46 – Active transport modes Active transport modes – Page 47
DTU International Energy Report 2019 DTU International Energy Report 2019

91 . COWI . Albertslundruten, evaluering, Sekretariatet for cykelsuperstier, København . 2012 .
92 . COWI . Farumruten, evaluering, Sekretariatet for supercykelstier, København . 2014 .
93 . COWI . Farumruten, evaluering af etape 1 og 2, Sekretariatet for supercykelstier, København . 2018 .
94 . Via Trafik . Ishøjruten, evaluering, Supercykelstier, København . 2018 .
95 . Zhao C, Carstensen TA, Nielsen TAS, Olafsson AS . Bicycle-friendly infrastructure planning in Beijing and Copenhagen - between
adapting design solutions and learning local planning cultures . J Transp Geogr [Internet] . 2018 Apr 1 [cited 2019 Aug
23];68:149–59 . Available from: https://www .sciencedirect .com/science/article/pii/S0966692317306099
96 . Heinen E, Maat K, van Wee B . The effect of work-related factors on the bicycle commute mode choice in the Netherlands .
Transportation (Amst) [Internet] . 2013 Jan;40(1):23–43 . Available from: https://doi .org/10 .1007/s11116-012-9399-4
97 . Hillnhutter H . Pedestrian Access to Public Transport [Internet] . 2016 [cited 2019 Jun 7] . Available from: https://uis .brage .unit .
no/uis-xmlui/bitstream/handle/11250/2422928/Helge_Hillnhutter .pdf?sequence=1&isAllowed=y
98 . Scheffer AC, Schuurmans MJ, van Dijk N, van der Hooft T, de Rooij SE . Fear of falling: measurement strategy, prevalence, risk
factors and consequences among older persons . Age Ageing [Internet] . 2008 Jan 1;37(1):19–24 . Available from: https://doi .
org/10 .1093/ageing/afm169
99 . Ståhl A, Carlsson G, Hovbrandt P, Iwarsson S . “Let’s go for a walk!”: identification and prioritisation of accessibility and safety
measures involving elderly people in a residential area . Eur J Ageing [Internet] . 2008;5(3):265–73 . Available from: https://doi .
org/10 .1007/s10433-008-0091-7
100 . Börjesson M, Eliasson J, Hugosson MB, Brundell-Freij K . The Stockholm congestion charges—5 years on . Effects, acceptability
and lessons learnt . Transp Policy . 2012 Mar;20:1–12 .
101 . Percoco M . The effect of road pricing on traffic composition: Evidence from a natural experiment in Milan, Italy . Transp Policy
[Internet] . 2014 Jan 1 [cited 2019 Aug 23];31:55–60 . Available from: https://www .sciencedirect .com/science/article/pii/
S0967070X13001741
102 . Buehler R, Pucher J, Gerike R, Götschi T . Reducing car dependence in the heart of Europe: lessons from Germany, Austria, and
Switzerland . Transp Rev . 2017 Jan;37(1):4–28 .
103 . Heckhausen H, Gollwitzer PM . Thought contents and cognitive functioning in motivational versus volitional states of mind .
Motiv Emot [Internet] . 1987 Jun;11(2):101–20 . Available from: https://doi .org/10 .1007/BF00992338
104 . Bamberg S . Changing environmentally harmful behaviors: A stage model of self-regulated behavioral change . J Environ Psychol
[Internet] . 2013 Jun 1 [cited 2019 Aug 20];34:151–9 . Available from: https://www .sciencedirect .com/science/article/pii/
S0272494413000042
105 . Schwartz SH, Howard JA . A normative decision⁰making model of altruism . In: Rushton JP, Sorrentino RM, editors . Altruism and
helping behavior . Hillsdale; 1981 . p . 89–211 .
106 . Bamberg S . Applying the stage model of self-regulated behavioral change in a car use reduction intervention . J Environ Psychol
[Internet] . 2013 Mar 1 [cited 2019 Aug 20];33:68–75 . Available from: https://www .sciencedirect .com/science/article/pii/
S0272494412000655
107 . Gatersleben B, Appleton KM . Contemplating cycling to work: Attitudes and perceptions in different stages of change . Transp
Res Part A Policy Pract [Internet] . 2007 May 1 [cited 2019 Aug 20];41(4):302–12 . Available from: https://www .sciencedirect .
com/science/article/pii/S0965856406001091
108 . Prochaska JO, DiCLemente CC . The Transtheoretical Approach: Crossing Traditional Boundaries of Change . Homewood IL: Dow
Jones/Irwin; 1984 .
109 . Bird EL, Baker G, Mutrie N, Ogilvie D, Sahlqvist S, Powell J . Behavior change techniques used to promote walking and cycling: A
systematic review . Heal Psychol [Internet] . 2013 [cited 2018 Apr 24];32(8):829–38 . Available from: http://dx .doi .org/10 .1037/
a0032078 .supp
110 . Yang L, Sahlqvist S, McMinn A, Griffin SJ, Ogilvie D . Interventions to promote cycling: Systematic review [Internet] . Vol . 341,
BMJ (Online) . 2010 [cited 2018 Apr 10] . p . 870 . Available from: https://www .bmj .com/content/bmj/341/bmj .c5293 .full .pdf
111 . Nielsen TA, Haustein S . Behavioural effects of a health-related cycling campaign in Denmark: Evidence from the national travel
survey and an online survey accompanying the campaign . J Transp Heal [Internet] . 2019 Mar 1 [cited 2019 Aug 20];12:152–
63 . Available from: https://www .sciencedirect .com/science/article/pii/S2214140518304365
112 . Troelsen J . Evaluering af Odense - Danmarks Nationale Cykelby [Internet] . Odense Kommune, Miljø- og Teknikforvaltningen,
Park og Vejafdeling; 2004 [cited 2019 Aug 20] . Available from: https://www .forskningsdatabasen .dk/en/
catalog/2389091919
113 . Willumsen E, Duer H . Samfundsøkonomisk vurdering af”Vi cykler på arbejde”-kampagnen . In: Ålborg Trafikdage . Aalborg; 2012 .
114 . Cyklistforbundet, COWI . EVALUERING AF ABC MED FOKUS PÅ SAMFUNDSØKONOMISKE EFFEKTER [Internet] . 2017 . Available
from: http://www .abc-abc .dk/Om-ABC/~/media/ABC/ABC2017/COWI Evaluering af Alle Børn Cykler - 2016 (2017) .ashx
115 . Pucher J, Dill J, Handy S . Infrastructure, programs, and policies to increase bicycling: An international review . Prev Med (Baltim)
[Internet] . 2010 Jan 1 [cited 2019 Aug 20];50:S106–25 . Available from: https://www .sciencedirect .com/science/article/pii/
S0091743509004344
Page 48 – Active transport modes Active transport modes – Page 49
DTU International Energy Report 2019 DTU International Energy Report 2019

trip planning, etc .) . Although SM can take different forms, it heavily relies on technology and also has a set of non-exclusive operational key features . These two aspects are discussed in the following sections .
Technological featuresThe emergence of SM is primarily rooted in recent technological progress and digitalization . The three main areas that have opened the new mobility era are sensors, information and communication technology, and developments in computer science (data science and artificial intelligence in particular) . These three areas define mobility “smartness”, which can be formulated as “sensing—communicating—analyzing” .
SensingThe first technological pillar of SM is sensors, which constantly monitor the main constituents of a transport system: vehicles, infrastructure and people .
Vehicle sensors. Although cars had practically no sensors back in 1970, four decades later, an average car had from sixty to a hundred sensors on board . The global market for automobile sensors should grow from $35 .4 billion in 2018 to $66 .2 billion by 2023 at a compound annual growth rate of 13 .4% [4], reaching up to two hundred sensors per car . Typical sensors in a car monitor almost all information possible about the hardware (fuel consumption, engine performance, on-board diagnos-
tics), driving (acceleration, braking, turning, speed), position (GPS) and environment (cameras, ultrasonic and radar/lidar in automation, advanced driver-assistance systems, etc .) .
Infrastructure sensors. In general, the price of the Internet of Things (IoT) sensors dropped from $1 .3 in 2004 to $0 .6 in 2013 and is projected to fall further to $0 .38 in 2020 [5] . This significant drop in price, combined with ever-growing technological advances, has led to sensors being found almost everywhere in the transport infrastructure . They are used for intel-ligent traffic-management systems (inductive loops, cameras, radar sensors), the environment (weather, road surface pollution) and parking (free parking lots, parking management) . In this respect, a combination of measure-ments from different sensors – for example, traffic flow and air pollution [6] – is of particular interest .
Individual sensors. Although mobile phones first appeared on the market as early as the late 1970s, the technology was limited mainly to calls and messages . The real smartphone era started in 2007 with the intro-duction of the first iPhone by Apple, Inc . Annual smart-phone shipments worldwide grew from 173 .5M units in 2009 to 1 .4B units in 2018 [7] . Smartphone ownership reaches on average 76% in developed countries and 54% across emerging economies [8] . The wearable electronics industry is also taking off, and now sensors in smartphones and wearable electronics include many that are useful in the mobility context (GPS, Accelerome-ter, Gravity-Motion detection, Gyroscope, Linear Acceler-ation, Magnetic Field, Orientation, Rotation Vector, etc .) . Such data have allowed researchers to improve their understanding of individual choices in transportation never captured before, such as day-to-day variation in travel patterns [9] or the use of individual preferences in service provision such as personalized mobility services [10] .
Digital or “virtual” sensors. The total digitalization of almost all spheres of human life produces a giant digital footprint . Monitoring this footprint can be regarded as “virtual” sensing, where the sensors are not hardware but rather software . This has many applications in mobility, such as monitoring online transactions, smart-card usage and data mined from the internet and social networks for the prediction of transport demand (e .g ., special events [11]) and supply (e .g ., road blockage due to accidents [12]) .
Reshaping the mobility landscapeMobility represents one of the most important aspects of the modern city economy, being one of the main factors defining the quality of life . However, it is also known to have a significant impact on the environment . It alone represents about a quarter of greenhouse gas emissions in Europe [1] and is responsible for significant health risks among Europe’s citizens due to particle emissions [2] . It is clear that, as it stands today, a trans-port system that was gradually developed over centuries is an inappropriate response to our modern and future mobility needs .
Traditional mobility solutions fall into a spectrum within the two extremes of individual transport and mass tran-sit, each playing their own, often complementary role in the transport system . Individual transport typically offers the most flexible solution . However, its indepen-dence and convenience do not come without costs for either owners or society . First, there are basic transport network capacity constraints in accommodating all vehicles . Secondly, it brings with it a well-known set of externalities with regard to its impacts on the envi-ronment and the economy . On the opposite side of the spectrum, mass transit has been designed to serve large volumes of people, with very little deviation from a “one size fits all” principle . In most cases, bus and train lines, schedules and headways are designed based on anal-yses of demand, are then communicated to the public, and remain stable for long periods of time . The costs per traveler can be much lower than with private transport, but they incur high costs associated with initial invest-ments and operations (e .g ., infrastructure and mainte-nance) . The lack of flexibility and the limited reach of mass transit leads to the well-known problem of first/last mile: unless the trip’s origin and destination are both conveniently close to transport hubs, one still has to find transport for the missing legs or a more convenient alternative . From the user’s perspective, the historical answer to the convenience problem lies between these
two alternatives, that is, with traditional on-demand taxi services, which end up being much less used either due to their high costs and/or their availability constraints . However, they ultimately operate as an individual form of transport, thus sharing most of the same (and other operational) inefficiencies .
This status quo has been in place for almost a hundred years in western civilization, and whenever limitations were found, the answer has typically been to increase supply capacity (e .g ., build new roads, buy new vehi-cles) . Ironically, this apparently “simple” solution is often counter-productive (e .g ., the well-known phenomenon of induced demand), leading to the systematically ineffi-cient use of resources (e .g ., when the car is hardly or not used at all during the day [3]) . Also, it has shown not to solve congestion and transport air pollution problems, which can become very severe in modern cities . While electric cars can partially address the pollution prob-lem in the transport sector, coordinated reductions in congestion and emissions will require other targeted strategies .
However, everything changed with the introduction of new disruptive technologies . Smartphones, high-speed mobile internet and the prevalence of sensors allowed existing and new solutions to be adopted that fill the gap between individual transport and mass transit . The solutions bringing these two options together comprise a whole range of products and services that are more flexible and more efficient, bridging the two traditional mobility approaches (Fig . 1) . These new mobility solu-tions and business models, commonly grouped under the umbrella term “Smart Mobility” (SM), are designed around individual needs, usually with operations using new technology, and often sharing resources . The SM ecosystem is diverse and includes many solutions, ranging from shared on-demand mobility (car-sharing, bike-sharing, ride-hailing, etc .) to integrated solutions (mobility-as-a-service, apps for informed multimodal
Chapter 6
Smart mobilityStanislav S. Borysov, Carlos Lima Azevedo, Francisco C. Pereira, DTU Management
Figure 1 . Smart mobility and its features
Smart mobility – Page 51
DTU International Energy Report 2019 DTU International Energy Report 2019
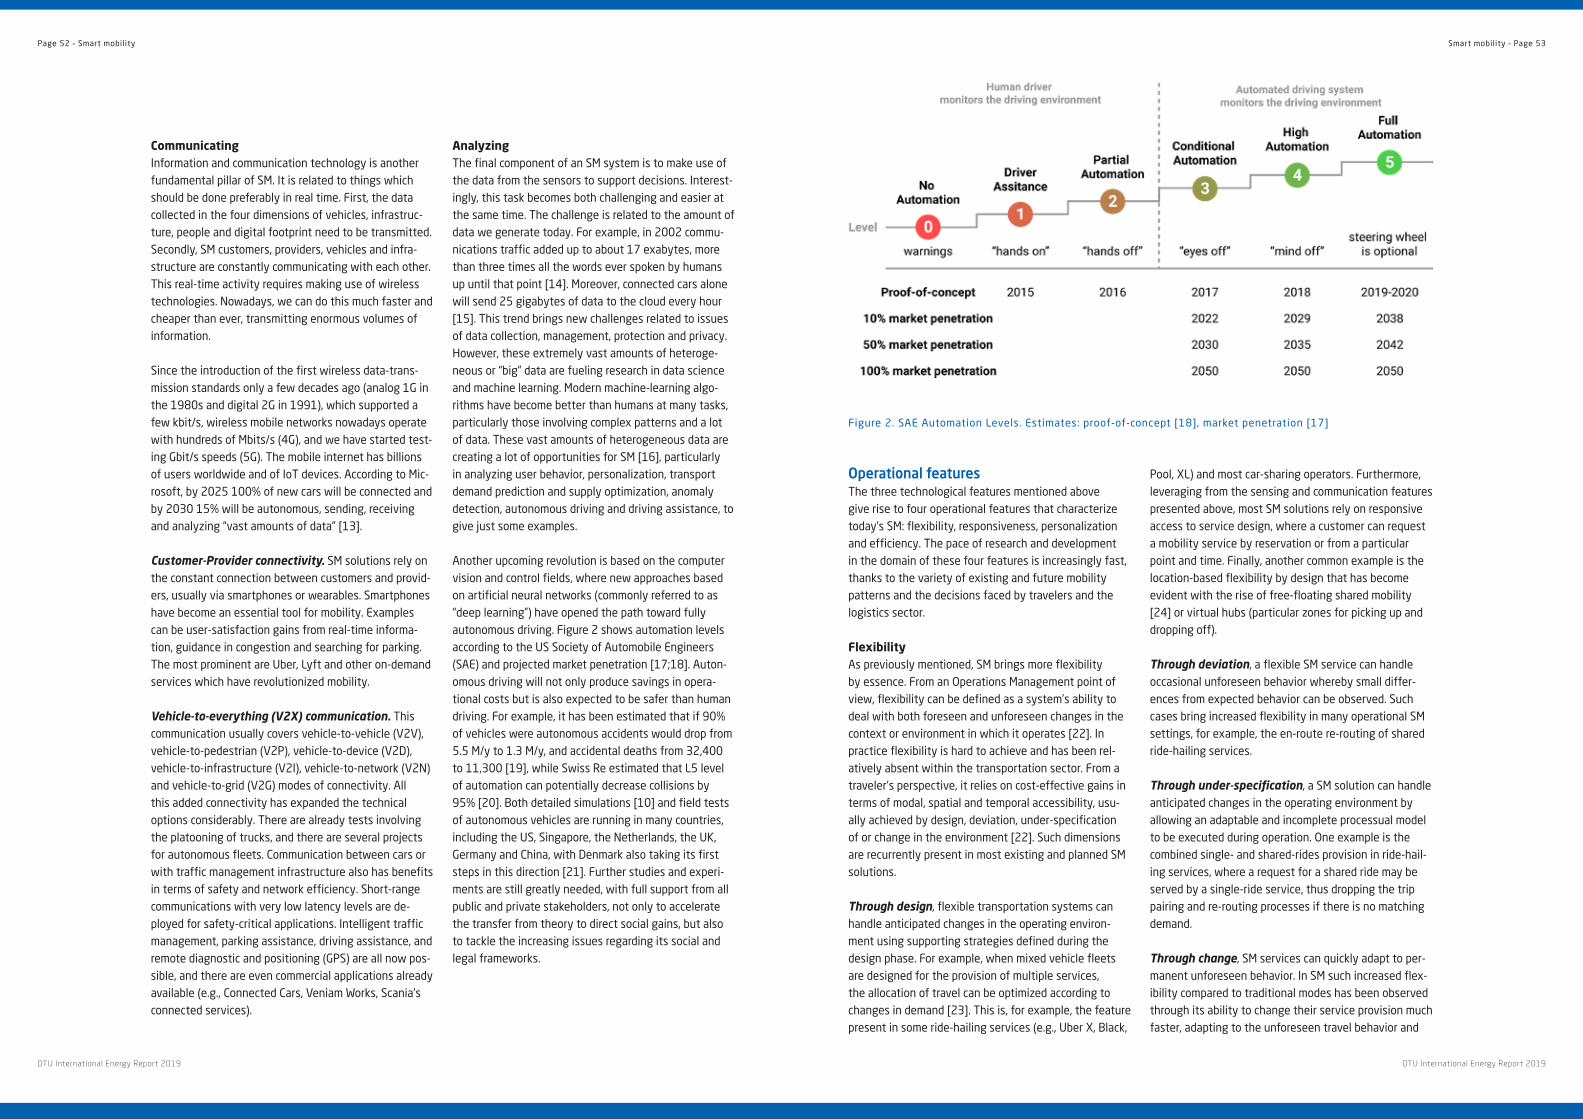
Operational features The three technological features mentioned above give rise to four operational features that characterize today’s SM: flexibility, responsiveness, personalization and efficiency . The pace of research and development in the domain of these four features is increasingly fast, thanks to the variety of existing and future mobility patterns and the decisions faced by travelers and the logistics sector .
FlexibilityAs previously mentioned, SM brings more flexibility by essence . From an Operations Management point of view, flexibility can be defined as a system’s ability to deal with both foreseen and unforeseen changes in the context or environment in which it operates [22] . In practice flexibility is hard to achieve and has been rel-atively absent within the transportation sector . From a traveler’s perspective, it relies on cost-effective gains in terms of modal, spatial and temporal accessibility, usu-ally achieved by design, deviation, under-specification of or change in the environment [22] . Such dimensions are recurrently present in most existing and planned SM solutions .
Through design, flexible transportation systems can handle anticipated changes in the operating environ-ment using supporting strategies defined during the design phase . For example, when mixed vehicle fleets are designed for the provision of multiple services, the allocation of travel can be optimized according to changes in demand [23] . This is, for example, the feature present in some ride-hailing services (e .g ., Uber X, Black,
Pool, XL) and most car-sharing operators . Furthermore, leveraging from the sensing and communication features presented above, most SM solutions rely on responsive access to service design, where a customer can request a mobility service by reservation or from a particular point and time . Finally, another common example is the location-based flexibility by design that has become evident with the rise of free-floating shared mobility [24] or virtual hubs (particular zones for picking up and dropping off) .
Through deviation, a flexible SM service can handle occasional unforeseen behavior whereby small differ-ences from expected behavior can be observed . Such cases bring increased flexibility in many operational SM settings, for example, the en-route re-routing of shared ride-hailing services .
Through under-specification, a SM solution can handle anticipated changes in the operating environment by allowing an adaptable and incomplete processual model to be executed during operation . One example is the combined single- and shared-rides provision in ride-hail-ing services, where a request for a shared ride may be served by a single-ride service, thus dropping the trip pairing and re-routing processes if there is no matching demand .
Through change, SM services can quickly adapt to per-manent unforeseen behavior . In SM such increased flex-ibility compared to traditional modes has been observed through its ability to change their service provision much faster, adapting to the unforeseen travel behavior and
CommunicatingInformation and communication technology is another fundamental pillar of SM . It is related to things which should be done preferably in real time . First, the data collected in the four dimensions of vehicles, infrastruc-ture, people and digital footprint need to be transmitted . Secondly, SM customers, providers, vehicles and infra-structure are constantly communicating with each other . This real-time activity requires making use of wireless technologies . Nowadays, we can do this much faster and cheaper than ever, transmitting enormous volumes of information .
Since the introduction of the first wireless data-trans-mission standards only a few decades ago (analog 1G in the 1980s and digital 2G in 1991), which supported a few kbit/s, wireless mobile networks nowadays operate with hundreds of Mbits/s (4G), and we have started test-ing Gbit/s speeds (5G) . The mobile internet has billions of users worldwide and of IoT devices . According to Mic-rosoft, by 2025 100% of new cars will be connected and by 2030 15% will be autonomous, sending, receiving and analyzing “vast amounts of data” [13] .
Customer-Provider connectivity. SM solutions rely on the constant connection between customers and provid-ers, usually via smartphones or wearables . Smartphones have become an essential tool for mobility . Examples can be user-satisfaction gains from real-time informa-tion, guidance in congestion and searching for parking . The most prominent are Uber, Lyft and other on-demand services which have revolutionized mobility .
Vehicle-to-everything (V2X) communication. This communication usually covers vehicle-to-vehicle (V2V), vehicle-to-pedestrian (V2P), vehicle-to-device (V2D), vehicle-to-infrastructure (V2I), vehicle-to-network (V2N) and vehicle-to-grid (V2G) modes of connectivity . All this added connectivity has expanded the technical options considerably . There are already tests involving the platooning of trucks, and there are several projects for autonomous fleets . Communication between cars or with traffic management infrastructure also has benefits in terms of safety and network efficiency . Short-range communications with very low latency levels are de-ployed for safety-critical applications . Intelligent traffic management, parking assistance, driving assistance, and remote diagnostic and positioning (GPS) are all now pos-sible, and there are even commercial applications already available (e .g ., Connected Cars, Veniam Works, Scania’s connected services) .
AnalyzingThe final component of an SM system is to make use of the data from the sensors to support decisions . Interest-ingly, this task becomes both challenging and easier at the same time . The challenge is related to the amount of data we generate today . For example, in 2002 commu-nications traffic added up to about 17 exabytes, more than three times all the words ever spoken by humans up until that point [14] . Moreover, connected cars alone will send 25 gigabytes of data to the cloud every hour [15] . This trend brings new challenges related to issues of data collection, management, protection and privacy . However, these extremely vast amounts of heteroge-neous or “big” data are fueling research in data science and machine learning . Modern machine-learning algo-rithms have become better than humans at many tasks, particularly those involving complex patterns and a lot of data . These vast amounts of heterogeneous data are creating a lot of opportunities for SM [16], particularly in analyzing user behavior, personalization, transport demand prediction and supply optimization, anomaly detection, autonomous driving and driving assistance, to give just some examples .
Another upcoming revolution is based on the computer vision and control fields, where new approaches based on artificial neural networks (commonly referred to as “deep learning”) have opened the path toward fully autonomous driving . Figure 2 shows automation levels according to the US Society of Automobile Engineers (SAE) and projected market penetration [17;18] . Auton-omous driving will not only produce savings in opera-tional costs but is also expected to be safer than human driving . For example, it has been estimated that if 90% of vehicles were autonomous accidents would drop from 5 .5 M/y to 1 .3 M/y, and accidental deaths from 32,400 to 11,300 [19], while Swiss Re estimated that L5 level of automation can potentially decrease collisions by 95% [20] . Both detailed simulations [10] and field tests of autonomous vehicles are running in many countries, including the US, Singapore, the Netherlands, the UK, Germany and China, with Denmark also taking its first steps in this direction [21] . Further studies and experi-ments are still greatly needed, with full support from all public and private stakeholders, not only to accelerate the transfer from theory to direct social gains, but also to tackle the increasing issues regarding its social and legal frameworks .
Figure 2 . SAE Automation Levels . Estimates: proof-of-concept [18], market penetration [17]
Page 52 – Smart mobility Smart mobility – Page 53
DTU International Energy Report 2019 DTU International Energy Report 2019
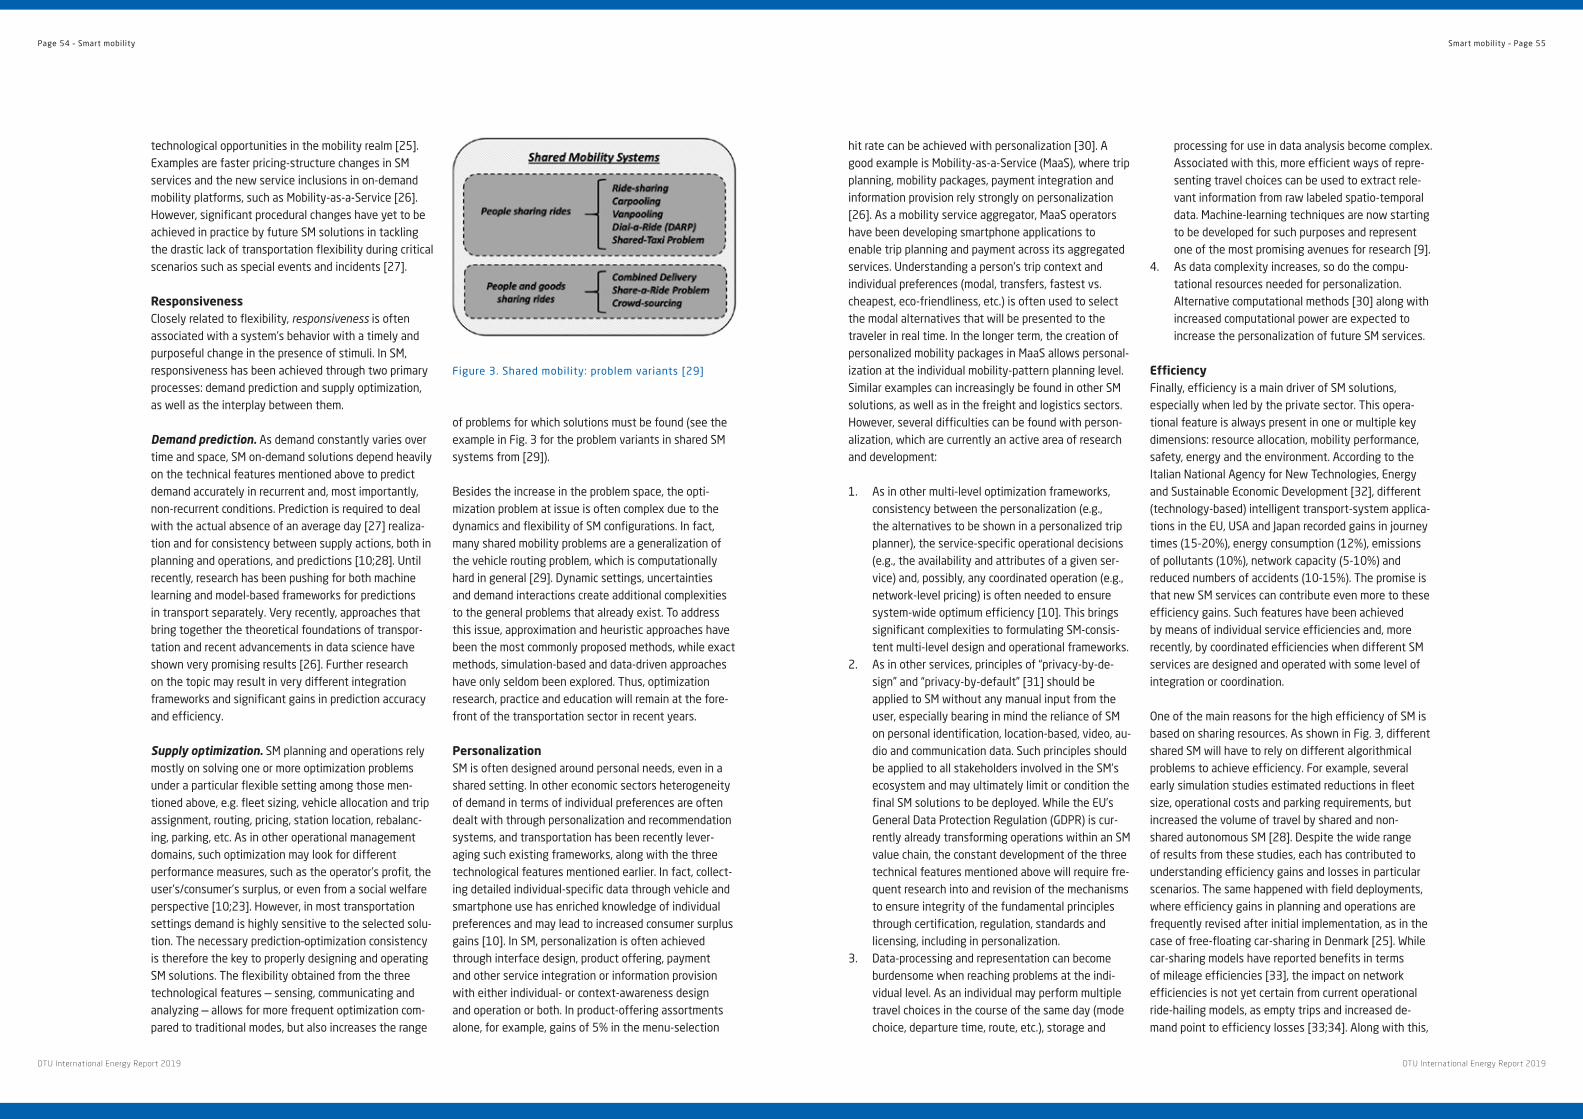
hit rate can be achieved with personalization [30] . A good example is Mobility-as-a-Service (MaaS), where trip planning, mobility packages, payment integration and information provision rely strongly on personalization [26] . As a mobility service aggregator, MaaS operators have been developing smartphone applications to enable trip planning and payment across its aggregated services . Understanding a person’s trip context and individual preferences (modal, transfers, fastest vs . cheapest, eco-friendliness, etc .) is often used to select the modal alternatives that will be presented to the traveler in real time . In the longer term, the creation of personalized mobility packages in MaaS allows personal-ization at the individual mobility-pattern planning level . Similar examples can increasingly be found in other SM solutions, as well as in the freight and logistics sectors . However, several difficulties can be found with person-alization, which are currently an active area of research and development:
1 . As in other multi-level optimization frameworks, consistency between the personalization (e .g ., the alternatives to be shown in a personalized trip planner), the service-specific operational decisions (e .g ., the availability and attributes of a given ser-vice) and, possibly, any coordinated operation (e .g ., network-level pricing) is often needed to ensure system-wide optimum efficiency [10] . This brings significant complexities to formulating SM-consis-tent multi-level design and operational frameworks .
2 . As in other services, principles of “privacy-by-de-sign” and “privacy-by-default” [31] should be applied to SM without any manual input from the user, especially bearing in mind the reliance of SM on personal identification, location-based, video, au-dio and communication data . Such principles should be applied to all stakeholders involved in the SM’s ecosystem and may ultimately limit or condition the final SM solutions to be deployed . While the EU’s General Data Protection Regulation (GDPR) is cur-rently already transforming operations within an SM value chain, the constant development of the three technical features mentioned above will require fre-quent research into and revision of the mechanisms to ensure integrity of the fundamental principles through certification, regulation, standards and licensing, including in personalization .
3 . Data-processing and representation can become burdensome when reaching problems at the indi-vidual level . As an individual may perform multiple travel choices in the course of the same day (mode choice, departure time, route, etc .), storage and
processing for use in data analysis become complex . Associated with this, more efficient ways of repre-senting travel choices can be used to extract rele-vant information from raw labeled spatio-temporal data . Machine-learning techniques are now starting to be developed for such purposes and represent one of the most promising avenues for research [9] .
4 . As data complexity increases, so do the compu-tational resources needed for personalization . Alternative computational methods [30] along with increased computational power are expected to increase the personalization of future SM services .
EfficiencyFinally, efficiency is a main driver of SM solutions, especially when led by the private sector . This opera-tional feature is always present in one or multiple key dimensions: resource allocation, mobility performance, safety, energy and the environment . According to the Italian National Agency for New Technologies, Energy and Sustainable Economic Development [32], different (technology-based) intelligent transport-system applica-tions in the EU, USA and Japan recorded gains in journey times (15-20%), energy consumption (12%), emissions of pollutants (10%), network capacity (5-10%) and reduced numbers of accidents (10-15%) . The promise is that new SM services can contribute even more to these efficiency gains . Such features have been achieved by means of individual service efficiencies and, more recently, by coordinated efficiencies when different SM services are designed and operated with some level of integration or coordination .
One of the main reasons for the high efficiency of SM is based on sharing resources . As shown in Fig . 3, different shared SM will have to rely on different algorithmical problems to achieve efficiency . For example, several early simulation studies estimated reductions in fleet size, operational costs and parking requirements, but increased the volume of travel by shared and non-shared autonomous SM [28] . Despite the wide range of results from these studies, each has contributed to understanding efficiency gains and losses in particular scenarios . The same happened with field deployments, where efficiency gains in planning and operations are frequently revised after initial implementation, as in the case of free-floating car-sharing in Denmark [25] . While car-sharing models have reported benefits in terms of mileage efficiencies [33], the impact on network efficiencies is not yet certain from current operational ride-hailing models, as empty trips and increased de-mand point to efficiency losses [33;34] . Along with this,
technological opportunities in the mobility realm [25] . Examples are faster pricing-structure changes in SM services and the new service inclusions in on-demand mobility platforms, such as Mobility-as-a-Service [26] . However, significant procedural changes have yet to be achieved in practice by future SM solutions in tackling the drastic lack of transportation flexibility during critical scenarios such as special events and incidents [27] .
ResponsivenessClosely related to flexibility, responsiveness is often associated with a system’s behavior with a timely and purposeful change in the presence of stimuli . In SM, responsiveness has been achieved through two primary processes: demand prediction and supply optimization, as well as the interplay between them .
Demand prediction. As demand constantly varies over time and space, SM on-demand solutions depend heavily on the technical features mentioned above to predict demand accurately in recurrent and, most importantly, non-recurrent conditions . Prediction is required to deal with the actual absence of an average day [27] realiza-tion and for consistency between supply actions, both in planning and operations, and predictions [10;28] . Until recently, research has been pushing for both machine learning and model-based frameworks for predictions in transport separately . Very recently, approaches that bring together the theoretical foundations of transpor-tation and recent advancements in data science have shown very promising results [26] . Further research on the topic may result in very different integration frameworks and significant gains in prediction accuracy and efficiency .
Supply optimization. SM planning and operations rely mostly on solving one or more optimization problems under a particular flexible setting among those men-tioned above, e .g . fleet sizing, vehicle allocation and trip assignment, routing, pricing, station location, rebalanc-ing, parking, etc . As in other operational management domains, such optimization may look for different performance measures, such as the operator’s profit, the user’s/consumer’s surplus, or even from a social welfare perspective [10;23] . However, in most transportation settings demand is highly sensitive to the selected solu-tion . The necessary prediction–optimization consistency is therefore the key to properly designing and operating SM solutions . The flexibility obtained from the three technological features — sensing, communicating and analyzing — allows for more frequent optimization com-pared to traditional modes, but also increases the range
of problems for which solutions must be found (see the example in Fig . 3 for the problem variants in shared SM systems from [29]) .
Besides the increase in the problem space, the opti-mization problem at issue is often complex due to the dynamics and flexibility of SM configurations . In fact, many shared mobility problems are a generalization of the vehicle routing problem, which is computationally hard in general [29] . Dynamic settings, uncertainties and demand interactions create additional complexities to the general problems that already exist . To address this issue, approximation and heuristic approaches have been the most commonly proposed methods, while exact methods, simulation-based and data-driven approaches have only seldom been explored . Thus, optimization research, practice and education will remain at the fore-front of the transportation sector in recent years .
PersonalizationSM is often designed around personal needs, even in a shared setting . In other economic sectors heterogeneity of demand in terms of individual preferences are often dealt with through personalization and recommendation systems, and transportation has been recently lever-aging such existing frameworks, along with the three technological features mentioned earlier . In fact, collect-ing detailed individual-specific data through vehicle and smartphone use has enriched knowledge of individual preferences and may lead to increased consumer surplus gains [10] . In SM, personalization is often achieved through interface design, product offering, payment and other service integration or information provision with either individual- or context-awareness design and operation or both . In product-offering assortments alone, for example, gains of 5% in the menu-selection
Figure 3 . Shared mobility: problem variants [29]
Page 54 – Smart mobility Smart mobility – Page 55
DTU International Energy Report 2019 DTU International Energy Report 2019
the individual decision-making process to increase the likelihood that a more efficient choice will be made (e .g ., take public transportation, select a slower but more en-ergy-efficient route, or opt for a greener vehicle) while keeping freedom of choice . Like personalization, through the technological and operational features mentioned above, it is now possible to extract context and indi-vidual behavioral insights that can be directly used in mobility nudging [36] and to refine the interface design, incentive schemes, gamification frameworks or even information provision to arrive at a much more appealing form for the individual traveler . In a project with MIT and DTU researchers, initial results from the simulation of innovative non-monetary personalized incentives in a trip-planning app showed gains of 5% to 10% in overall travel time savings in the center of Boston [10] . Yet, only minimal experimentation in all possible dimensions of nudging in SM has been carried out, and significant research and development are expected in the near future, as technology-based nudging is often an easy complementary policy with powerful behavioral impacts .
Integrated mobility solutionsIntegration is the on-going trend that has the highest potential for increased gains in flexibility and accessi-bility . Coordination among different mobility providers, both at the planning stage and in real-time operations, is now being made easier with the SM features pre-sented above . From a user perspective the gains are immediate and significant, with the potential increased availability of services, smooth multi-modal transitions, information and payment integration, and better supply performance in recurrent and non-recurrent conditions . Traditional mobility service providers can also benefit from coordination with alternative mobility providers, for example, by complementing their operations in significantly sparse urban areas [34] . MaaS has been leading the recent trend towards SM integration from a demand perspective [30] . A MaaS solution can provide monthly mobility packages integrating multiple services, including door-to-door journey planning and booking through multi-modal menus, real-time information and ticketing/payment integration from subscribed mobility providers . In fact, the idea has already attracted several cities and regions, such as Helsinki (with MaaS Global’s Whim2), London (with CityMapper3), Copenhagen and North Jutland (with minRejseplanen4) . Yet the impacts
2 https://whimapp .com/
3 https://citymapper .com/
4 https://play .google .com/store/apps/details?id=de .hafas .android .nt
of such new platforms in city travel patterns have still to be assessed, and methods to optimize the impact of their possible different configurations developed . Finally, while the first steps in demand coordination are being made, integration and coordination on the SM supply side and with other mobility-related systems (energy, land use, etc .) have yet to be explored . Traditional dynamic pricing or access-restriction strategies and implementation solutions used in network (supply) man-agement should be revisited in the face of SM and its new technological paradigm [10;31], bearing in mind not only its system-wide operational performance, but also the implications for all mobility-related externalities .
Impact and challenges SM has quickly revealed its promise in having impacts in several dimensions of the transport sector [32]: conges-tion and pollution reduction, road-safety benefits, noise reduction, increased and more efficient inter-modality, and cost reductions .
A significant amount of existing research and empirical evidence focuses on the design and operational perfor-mance of SM in terms of fleet and infrastructure usage . In a review study carried out in the US, for example [33], several studies were reviewed to assess the perfor-mance of shared SM . Round-trip car-sharing subscribers were observed to have reduced their individual vehicle mileage by 27% on average, including a significant modal shift to other shared and active modes . However, in some cases, car-sharers decreased their use of public transportation . For the majority of one-way car-sharing users, public and active transportation usage was un-changed, and their household vehicle mileage reduction was smaller than for round-trip car-sharing: 6% to 16% . Ride-hailing movements, on the other hand, already es-timated at 20% and 7% of average weekday mileages in 2016 in San Francisco and New York respectively, thus significantly contributed to congestion .
Regarding the SM impacts on energy and emissions, em-pirical evidence and research are behind the state of the art of SM’s operational performance . Future electric ve-hicle adoption rates depend on whether personal vehicle ownership trends continue or whether SM using primar-ily electric vehicles will keep increasing its market share . Positive scenarios still predict that 95% of passenger
energy and emissions performance losses may follow . Depending on the introduction of mobility, energy and environmentally efficient designs and operation are required [33;35], often through electrification or alter-native fuel usage, as discussed in Chapters 9 and 10 . To solve this issue, achieving efficiencies through coordina-tion has recently been targeted as the ultimate goal .
As SM solutions can integrate multiple service (and modal) providers, the potential gains in efficiency from the user, the operator and overall system performance can be significant . For example, in certain settings SM solutions can reach higher efficiencies when they are designed to complement existing public transportation networks [33;34] . On the demand side, MaaS [26] has promised to help balance the demand for different service providers in a region, not only by personaliza-tion but mainly by proposing a single-access, overall demand-management platform (see Section 4 .4 . below) . However, research and practice in coordinating SM with other systems, be it energy or transportation systems, is still far from having properly been explored and is the most urgent need in the urban mobility ecosystem (see, for example, the recent report by the EU Commission [31]) . The associated challenges include performance measurement needs, process coordination, data-shar-ing, regulation and standards, and, more importantly, methodological frameworks for achieving system-wide efficiencies [10] .
Current trendsNowadays, we are witnessing a lot of disruptive mobility trends primarily based on the sheer rapidity of techno-logical progress . The field is being disrupted by com-pletely new business models . Here, we discuss some of the trends .
Shared and on-demand mobilityThe 2010s have been a boom-time, with lots of start-ups in the sphere of on-demand mobility . These com-panies target all mobility ranges: short-range (bicycles, scooters, etc .), medium-range (Uber, Lyft, Car2Go, Green Mobility, ShareNow) and long-range (car2go, blablacar) . The traditional automotive companies, such as BMW, have also become very active in the field by starting their own car-sharing programs (DriveNow/ShareNow), and others are joining . The concept of sharing is even moving into other aspects of mobility, such as parking (pavemint or rover parking) or privately-owned cars
1 https://cities .donkey .bike/bike_share_hub-centric-model/
(SNAPP car) . Shared and on-demand mobility is booming in densely populated city centers, having become partic-ularly popular with the younger generation and medium to high-income urban populations [24] .
The sharing business models have many variations themselves . For example, with bike-sharing alone, we find free-floating (one can pick up or leave the bike anywhere), station-based (bikes are physically attached to the station) and hub-based (bikes can be picked up or dropped off in virtual hub areas, seen on one’s smart-phone) options . The latter is clearly more flexible by combining the best of both worlds . For example, Donkey Republic is an innovative Danish bike-sharing hub-based company1 with low-cost bikes that have a small device that can be locked/unlocked via their app . They are therefore much more easily deployable and scalable than station-based bikes but also create less system unbal-ancing than free-floating ones . As for the impact on the overall system, sharing rides through SM is the on-going trend that has the highest potential for efficiency gains [33] .
Connected and autonomous mobility As mentioned above, the massive communication system we have in place alone has already created new technological solutions, but the true expectation is for its combination with autonomous mobility . When we have autonomous mobility technologies, such as those that are already in place (e .g ., May Mobility, Navya, EasyMile, Local Motors), synchronized into fleets using V2X communication and artificial intelligence, we will finally have reached the technological side of the future mobility vision of many . We believe this to be a grad-ual trend that will stay around for a long time, but the technological challenges will be replaced by policy and city-planning ones . In the future, the expectations of most experts in the field are that such connected auton-omous fleets will first be seen in restricted areas (e .g ., campuses, hospitals, airports, amusement parks), first/last-mile connections and city centers .
NudgingIn transportation, traditional public-policy instruments have been investments, pricing or regulation (mostly through restrictive regulations) . On the other hand, nudges that redirect behavior through slight interven-tions are increasingly being researched, designed and implemented in SM solutions [36] . Such nudges change
Page 56 – Smart mobility Smart mobility – Page 57
DTU International Energy Report 2019 DTU International Energy Report 2019
References1 . “Reducing environmental impacts of transport”, The European Environment Agency (2014)
https://www .eea .europa .eu/media/infographics/reducing-environmental-impacts-of-transport-1/view (accessed on June, 2019)
2 . J . D . Miller, C . Façanha, “The state of clean transport policy: a 2014 synthesis of vehicle and fuel policy developments”, The
International Council on Clean Transportation (2014)
https://www .theicct .org/publications/state-clean-transport-policy-2014-synthesis-vehicle-and-fuel-policy-developments
(accessed on Jun 6, 2019)
3 . “Spaced out: perspectives on parking policy”, The RAC Foundation (2012)
https://www .racfoundation .org/research/mobility/spaced-out-perspectives-on-parking (accessed on Jun 6, 2019)
4 . S . Rajaram, “Global Markets for Automotive Sensor Technologies”, BCC Research, Report IAS018G (2019) https://www .
bccresearch .com/market-research/instrumentation-and-sensors/automotive-sensors-tech-global-markets-report .htm (accessed
on Jun 6, 2019)
5 . “The Internet of Things: Making sense of the next mega-trend”, The Goldman Sachs Group, Inc . (2014)
https://www .goldmansachs .com/insights/pages/internet-of-things/iot-report .pdf (accessed on Jun 6, 2019)
6 . C . G . Nielsen, et al ., “Traffic-flow & Air Quality Experiment”, 25th ITS World Congress, Copenhagen, Denmark (2018)
7 . F . Richter, “Have We Passed the Peak of the Smartphone Era?”, Statista (2019)
https://www .statista .com/chart/12798/global-smartphone-shipments/ (accessed on Jun 6, 2019)
8 . K . Taylor, L . Silver, “Smartphone Ownership Is Growing Rapidly Around the World, but Not Always Equally”, Pew Research Center
(2019)
https://www .pewresearch .org/global/2019/02/05/smartphone-ownership-is-growing-rapidly-around-the-world-but-not-
always-equally/ (accessed on Jun 6, 2019)
9 . F . Zhao, et al ., “Exploratory analysis of a smartphone-based travel survey in Singapore”, Proceedings of the Transportation
Research Record 94th Annual Meeting (2015)
10 . C . L . Azevedo, et al ., “Tripod: Sustainable Travel Incentives with Prediction, Optimization, and Personalization”, Proceedings of
the Transportation Research Record 97th Annual Meeting (2018)
11 . F . Rodrigues, S . S . Borysov, B . Ribeiro, F . C . Pereira, “A Bayesian Additive Model for Understanding Public Transport Usage in
Special Events,” in IEEE Transactions on Pattern Analysis and Machine Intelligence, vol . 39, pp . 2113-2126 (2017)
12 . F . C . Pereira, F . Rodrigues, M . Ben-Akiva, “Text analysis in incident duration prediction”, Transportation Research Part C:
Emerging Technologies, vol . 37, pp . 177-192 (2013)
13 . “How IoT and AI are transforming cars with intelligent mobility”, Microsoft IoT (2017)
https://blogs .microsoft .com/iot/2017/02/09/how-iot-and-ai-are-transforming-cars-with-intelligent-mobility/ (accessed on Jun
6, 2019)
14 . V . Klinkenborg, “Trying to Measure the Amount of Information That Humans Create”, The New York Times Company (2003),
https://www .nytimes .com/2003/11/12/opinion/editorial-observer-trying-measure-amount-information-that-humans-create .
html (accessed on Jun 6, 2019)
15 . “Connected cars will send 25 gigabytes of data to the cloud every hour”, Quartz (2015)
https://qz .com/344466/connected-cars-will-send-25-gigabytes-of-data-to-the-cloud-every-hour/ (accessed on Jun 6, 2019)
16 . C . Antoniou, L . Dimitriou, F . C . Pereira, “Mobility Patterns, Big Data and Transport Analytics: Tools and Applications for Modeling”,
Elsevier Science (2018)
17 . S . A . Beiker, “Deployment of Automated Driving”, Samsung Forum (2018)
https://www .samsung .com/us/ssic/session/deployment-of-automated-driving/
18 . F . M . Favarò, et al ., “Examining accident reports involving autonomous vehicles in California”, PLOS ONE, vol . 12, e0184952
(2017)
19 . D . J . Fagnant, K . M . Knockelman, “Preparing a nation for autonomous vehicles: opportunities, barriers and policy
recommendations”, Transportation Research Part A: Policy and Practice, vol . 77, pp . 167-181 (2015)
20 . “The future of motor insurance”, HERE and Swiss Re white paper (2016) https://media .swissre .com/documents/HERE_
Swiss+Re_white+paper_final .pdf
21 . “The largest test of self-propelled shuttles in Denmark”, The LINC Project, https://lincproject .dk/, (accessed on Jun 6 2019)
22 . H . Schonenberg, et al ., “Towards a Taxonomy of Process Flexibility”, In CAiSE forum, vol . 344, pp . 81-84 (2008)
23 . B . Atasoy, T . Ikeda, M . E . Ben-Akiva, “Optimizing a flexible mobility on demand system”, Transportation Research Record: Journal
of the Transportation Research Board, vol . 2536, pp . 76-85 (2015)
24 . C . A . S . Machado, N . P . M . De Salles Hue, F . T . Berssaneti, J . A . Quintanilha, “An Overview of Shared Mobility”, Sustainability, vol .
10, 4342 (2018)
25 . GreenMobility “GreenMobility fejrer første år med Din Bybil” (GreenMobility celebrates the first year with DinBybil) (2017),
https://www .greenm .dk/media/1170/1-a-r-med-greenmobility .pdf (accessed on 20 Jun 2019)
mileage could occur in shared, electric SM by 2030 and that 80% of shared SM fleets may be electric by 2040, depending on assumptions [33] . Yet, the limited research and empirical evidence available today regarding SM vehicle usage shows very mixed observations [37] . In the US review study mentioned earlier [33], for example, one-way car-sharing reduced individual greenhouse gas emissions by 4% to 18%, on average, while current ride-hailing operations have increased greenhouse gas emissions following their increased mileage in US cities . Furthermore, while improvements in traffic flow (higher speeds) from connected SM reduces the fuel consump-tion of internal combustion engines, the same is not true of electric vehicles [31] . In energy consumption terms, the contribution of electric, connected and automated SM can be even lower than expected, mostly due to the rebound effects from demand and fleet size reductions [31] .
While it is expected that the development of these tech-nological features will bring more energy and environ-mentally efficient solutions to SM, it is crucial to link the four operational features with energy and environmental
targets . The first cases demonstrating, for example, in-creased responsiveness at the vehicle level with vehicle platooning [38], flexibility at the operational level with electric free-floating car-sharing [25], or personalization and efficiency at the demand level with “sustainable” travel incentives [10], have been put in practice . Yet, as mentioned above, the substantial gains in energy and emissions will be achieved through significant demand shifts and the integration and coordination of the entire SM ecosystem . In these early years of SM, its develop-ments are mostly led by the private sector, with most of the development done in-house . Academia, while push-ing mobility research more than ever, still lacks access to privately owned data and, often, access to a more effective bridge to the private sector’s SM deployment setting . Indeed, transportation may shift to increased public–private partnerships in SM operations, which may dramatically impact modal split, mileage, greenhouse gas emissions and accessibility [33] . While knowhow in transportation has relied substantially on cooperation between academia and the public sector in the past, the future will benefit from a new and strong triple-helix collaboration in the direction of efficient smart mobility .
Page 58 – Smart mobility Smart mobility – Page 59
DTU International Energy Report 2019 DTU International Energy Report 2019

26 . M . Kamargianni, M . Matyas, “The business ecosystem of mobility-as-a-service”, Proceedings of the Transportation Research
Record 96th Annual Meeting (2017)
27 . F . C . Pereira, F . Rodrigues, M . Ben-Akiva, “Using Data from the Web to Predict Public Transport Arrivals Under Special Events
Scenarios”, Journal of Intelligent Transportation Systems, vol . 19:3, pp . 273-288 (2015)
28 . C . L . Azevedo, et al ., “Microsimulation of demand and supply of autonomous mobility on demand”, Transportation Research
Record, vol . 2564(1), pp . 21-30 (2016)
29 . A . Mourad, J . Puchinger, C . Chu, “A survey of models and algorithms for optimizing shared mobility”, Transportation Research
Part B: Methodological, vol . 123, pp . 323-346 (2019)
30 . X . Song, M . Danaf, B . Atasoy, M . Ben-Akiva, “Personalized menu optimization with preference updater: a Boston case study”,
Transportation Research Record: Journal of the Transportation Research Board, vol . 2672, pp . 599-607 (2018)
31 . R . M . Alonso, et al ., “The future of road transport”, Publications Office of the European Union, JRC116644 (2019) http://
publications .jrc .ec .europa .eu/repository/handle/JRC116644
32 . C . Benevolo, R . P . Dameri, B . D’Auria, “Smart mobility in smart city”, In Empowering Organizations (pp . 13-28) . Springer, Cham .
(2016)
33 . S . Shaheen, H . Totte, A . Stocker, “Future of Mobility”, White Paper . UC Berkeley: Institute of Transportation Studies (UCB),
(2018) http://dx .doi .org/10 .7922/G2WH2N5D
34 . R . Basu, et al ., “Automated mobility-on-demand vs . mass transit: a multi-modal activity-driven agent-based simulation
approach” . Transportation Research Record: Journal of the Transportation Research Board, vol . 2672, pp . 608-618 (2018)
35 . MIT Energy Initiative, “Mobility of the Future Study: Final report”, Forthcoming (2019) http://energy .mit .edu/research/mobility-
future-study/
36 . S . Ranchordás, “Nudging citizens through technology in smart cities”, International Review of Law, Computers & Technology,
pp .1-23 (2019)
37 . G . D . Erhardt, et al ., “Do transportation network companies decrease or increase congestion?”, Science Advances, vol . 5,
eaau2670 (2019)
38 . M . Muratori, et al ., “Potentials for Platooning in U .S . Highway Freight Transport”, SAE International Journal of Commercial
Vehicles, vol . 10, pp . 45-49 (2017)
Page 60 – Smart mobility Smart mobility – Page 61
DTU International Energy Report 2019 DTU International Energy Report 2019
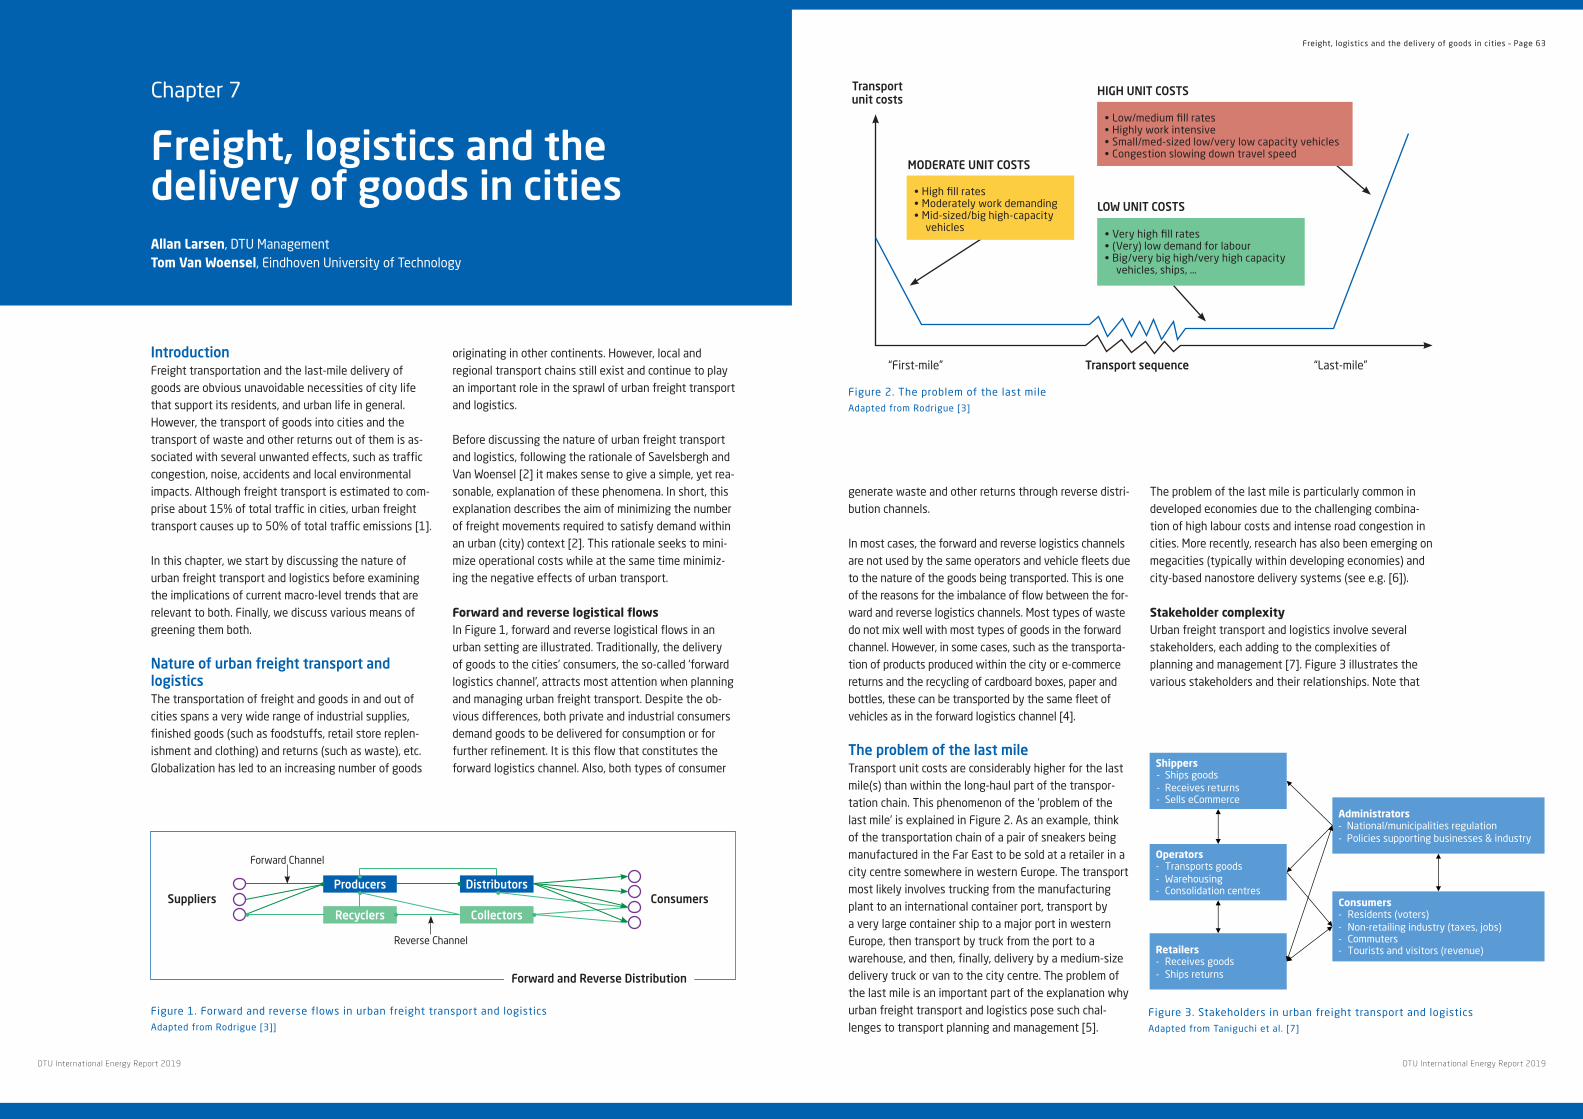
generate waste and other returns through reverse distri-bution channels .
In most cases, the forward and reverse logistics channels are not used by the same operators and vehicle fleets due to the nature of the goods being transported . This is one of the reasons for the imbalance of flow between the for-ward and reverse logistics channels . Most types of waste do not mix well with most types of goods in the forward channel . However, in some cases, such as the transporta-tion of products produced within the city or e-commerce returns and the recycling of cardboard boxes, paper and bottles, these can be transported by the same fleet of vehicles as in the forward logistics channel [4] .
The problem of the last mileTransport unit costs are considerably higher for the last mile(s) than within the long-haul part of the transpor-tation chain . This phenomenon of the ‘problem of the last mile’ is explained in Figure 2 . As an example, think of the transportation chain of a pair of sneakers being manufactured in the Far East to be sold at a retailer in a city centre somewhere in western Europe . The transport most likely involves trucking from the manufacturing plant to an international container port, transport by a very large container ship to a major port in western Europe, then transport by truck from the port to a warehouse, and then, finally, delivery by a medium-size delivery truck or van to the city centre . The problem of the last mile is an important part of the explanation why urban freight transport and logistics pose such chal-lenges to transport planning and management [5] .
The problem of the last mile is particularly common in developed economies due to the challenging combina-tion of high labour costs and intense road congestion in cities . More recently, research has also been emerging on megacities (typically within developing economies) and city-based nanostore delivery systems (see e .g . [6]) .
Stakeholder complexityUrban freight transport and logistics involve several stakeholders, each adding to the complexities of planning and management [7] . Figure 3 illustrates the various stakeholders and their relationships . Note that all the stakeholders described below are interconnected, and that all the actions and decisions any of them take have consequences for all the rest [8] .
IntroductionFreight transportation and the last-mile delivery of goods are obvious unavoidable necessities of city life that support its residents, and urban life in general . However, the transport of goods into cities and the transport of waste and other returns out of them is as-sociated with several unwanted effects, such as traffic congestion, noise, accidents and local environmental impacts . Although freight transport is estimated to com-prise about 15% of total traffic in cities, urban freight transport causes up to 50% of total traffic emissions [1] .
In this chapter, we start by discussing the nature of urban freight transport and logistics before examining the implications of current macro-level trends that are relevant to both . Finally, we discuss various means of greening them both .
Nature of urban freight transport and logisticsThe transportation of freight and goods in and out of cities spans a very wide range of industrial supplies, finished goods (such as foodstuffs, retail store replen-ishment and clothing) and returns (such as waste), etc . Globalization has led to an increasing number of goods
originating in other continents . However, local and regional transport chains still exist and continue to play an important role in the sprawl of urban freight transport and logistics .
Before discussing the nature of urban freight transport and logistics, following the rationale of Savelsbergh and Van Woensel [2] it makes sense to give a simple, yet rea-sonable, explanation of these phenomena . In short, this explanation describes the aim of minimizing the number of freight movements required to satisfy demand within an urban (city) context [2] . This rationale seeks to mini-mize operational costs while at the same time minimiz-ing the negative effects of urban transport .
Forward and reverse logistical flowsIn Figure 1, forward and reverse logistical flows in an urban setting are illustrated . Traditionally, the delivery of goods to the cities’ consumers, the so-called ‘forward logistics channel’, attracts most attention when planning and managing urban freight transport . Despite the ob-vious differences, both private and industrial consumers demand goods to be delivered for consumption or for further refinement . It is this flow that constitutes the forward logistics channel . Also, both types of consumer
Chapter 7
Freight, logistics and the delivery of goods in citiesAllan Larsen, DTU Management Tom Van Woensel, Eindhoven University of Technology
Figure 1 . Forward and reverse flows in urban freight transport and logisticsAdapted from Rodrigue [3]]
Figure 2 . The problem of the last mileAdapted from Rodrigue [3]
Figure 3 . Stakeholders in urban freight transport and logisticsAdapted from Taniguchi et al . [7]
Suppliers Consumers
Forward and Reverse Distribution
Forward Channel
Reverse Channel
Producers Distributors
Recyclers Collectors
Freight, logistics and the delivery of goods in cities – Page 63
DTU International Energy Report 2019 DTU International Energy Report 2019
Shippers- Ships goods- Receives returns- Sells eCommerce
Operators- Transports goods- Warehousing- Consolidation centres
Retailers- Receives goods- Ships returns
Consumers- Residents (voters)- Non-retailing industry (taxes, jobs)- Commuters- Tourists and visitors (revenue)
Administrators- National/municipalities regulation- Policies supporting businesses & industry
MODERATE UNIT COSTS
HIGH UNIT COSTSTransportunit costs
Transport sequence“First-mile” “Last-mile”
LOW UNIT COSTS• High fill rates• Moderately work demanding• Mid-sized/big high-capacity
vehicles• Very high fill rates• (Very) low demand for labour• Big/very big high/very high capacity
vehicles, ships, …
• Low/medium fill rates• Highly work intensive• Small/med-sized low/very low capacity vehicles• Congestion slowing down travel speed
cient and effective planning and management of urban freight transport and logistics .
Over the past decade, the interest of the scientific community in urban freight transport and logistics has increased considerably . Under the term ‘city logistics’, researchers from a wide range of academic backgrounds, such as economics (urban and business economics), engineering (urban and traffic planning), the social sciences, operations research and industrial engineer-ing, have actively been studying this topic (see e .g . [10;2;11;12]) .
Macro-trends influencing urban freight transport and logisticsThe transport and logistics sector is exposed to a number of current global macro-trends, many of which will strongly influence developments in urban freight transport and logistics, as well as energy consumption, over the coming years . In the Logistics Trend Radar report, published by the DHL Research Lab [13], developments in the logistics sector are described as ‘smarter, faster, more customer centric and sustainable’, indicating that attention is being given specifically to the efficiency and availability of service, as well as to sustainable solutions . The DHL trend report was compiled through interviews with logistics industry experts representing shippers, receivers, researchers and start-ups assessing the potential impacts of specific social and technological macro- and micro-trends .
The increasing awareness of climate change may eventually lead to changes in consumer behaviour in the direction of reduced demand or increased demand for near-sourced goods and may also increase the consumer’s willingness to intensify efforts in respect of recycling and waste handling [14;15] . The increased awareness of sustainability, on the other hand, may very well be challenged by the expected growing demand for inbound (as well as outbound) flows of goods to and from the cities due to the effects of more people living in an urban setting and the booming on-demand economy .
Below, we discuss some of the macro-trends that are assumed to be especially relevant to urban freight trans-port and logistics .
Urbanization and increased wealthThe UN estimates that by 2050, 66% of the world population will be living in cities . This growth will inev-itably lead to denser cities, implying growing consumer
demand from their users . Furthermore, increased wealth also adds to growing consumer demand, as well as to an increase in traffic caused by personal mobility . In turn, this leads to more congestion and aggravates the problem of the last mile, as previously discussed . Fran-soo et al . [6] argue that high population densities make mega-cities even more complex to serve logistically than other cities .
Denser cities also mean that city administrators (urban planners) and retail property developers need to strengthen their collaboration, as many new urban areas are not designed for efficient freight transport access, other issues, such as customer access, receiving a higher priority than logistical accessibility .
E-commerce and the on-demand economy The on-demand economy in general, and more spe-cifically the e-commerce market, is currently enjoying a boom . Europe and North America are experiencing annual growth rates of 12%-14% [2] . This growth obviously greatly influences urban freight transport and logistical operations, posing a number of challenges to society . However, the real net effect of e-commerce in terms of vehicle distances driven is difficult to estimate, because although the delivery of goods generates new distribution trips, it also reduces private traffic for shopping purposes . However, other things being equal, having to transport goods to consumers’ private house-holds instead of to traditional retail shops or shopping malls will increase the number of freight movements in the city [2] .
One of the greatest challenges caused by e-commerce is the option of same-day delivery (in some cases even down to one or two hours) offered by many e-tailers . The motivation for offering such services is based on the desire to be competitive, with traditional physical retailers having to provide instant gratification . However, this quest for speed increases freight movements . One example of such a service is Amazon Prime, where the customer is offered free delivery and same-day deliv-eries in some select cities . Again, same-day deliveries
The group of consumers consists of both residents living in the city and businesses and institutions, private as well as public, all of which demand goods and generate returns . The main interest of the consumers is in their ability able to have goods delivered to them or to be available at the retailers whenever they need them . As a result, this demand will generate traffic in the city and may lead to congestion . On the other hand, consumers are also interested in living in and using a city which offers a high degree of ‘liveability’, meaning that they would prefer to avoid having large trucks in the city centre . Conclusively, consumers would like to minimize the negative impacts, such as traffic congestion, noise, air pollution and the risk of accidents, while maximizing both traffic safety and the level of service offered by retailers . This group of consumers may directly impact on policies enforced by the city administrators through their roles as voters and/or tax-payers . In addition, commuters and even tourists visiting the city should be seen as consumers, as they too demand goods in the shops and in their workplaces, hotels etc . Naturally they therefore bring revenue and business to the city, but also add to the traffic and congestion . In contrast to residents and businesses, this group does not directly impact on policies, as they are usually neither voters nor taxpayers in the city in question .
The role of the administrators is, on the one hand, to regulate traffic and access to the city, thus offering an efficient infrastructure enhancing its liveability, while on the other hand ensuring that the city offers a competi-tive supply of housing, shops, offices etc . with respect to both quality and costs . The administrators need to balance these restrictions on the users of the city, whether they are citizens, transport operators, commut-ers or tourists, with the business climate offered to both private companies and public institutions .
The retailers receive the goods from the shippers exe-cuted by the transport operators . The retailers expect timely deliveries to enable their offers to their custom-ers . In recent years, economic developments and con-sumer behaviour have both increased the importance of being able to fulfil customer demands with minimal store inventory levels so as to cope with the rapidly changing types of goods, as seen within, for instance, the apparel industry . Also, the rents paid by shops require retailers to be very efficient in their use of shop space, which presents transport operators with strict requirements for speed of delivery, reliability and flexibility .
The transport operators, in turn, are faced with poli-cy-makers imposing new requirements and regulations, such as bans on diesel vehicles, environmental zones and greenhouse gas emission-reduction targets . How-ever, the freight transport and logistics sector is also experiencing fierce competition, leaving them with only very thin profit margins . This is often given as the rea-son for transport operators being reluctant to embrace and especially to take the lead in implementing new and innovative technological solutions, as they must often bear some of the insecurities and risks, which may, in the worst case, render the transport operator financial unviable . Transport operators often argue that, if the shipper prefers the goods to be shipped in a new and environmentally sustainable manner, this will indeed be possible, but also more costly, leading in turn to higher prices for the final consumer .
Finally, in many cases the shippers are not physically present in the city, typically being national, regional, international or even global producers or wholesalers supplying everything the city needs . In most cases, the shipper decides on the type of transport the goods being transported require . This decision includes choice of transport mode based on characteristics such as cost, flexibility, accessibility, reliability, speed, special re-quirements regarding packaging, etc . The emergence of e-commerce is creating new stakeholder relations with shippers, who in many cases will be in direct communica-tion with the final consumer of their products .
Concerning the planning and management of urban freight transport and logistics, it is important to note that transport operators, whether local small to medium enterprises (SMEs) or global logistics service providers, do fulfil the logistical requirements of the shipper and/or the receiver in the city . This implies that, if consumers or city administrators want to change the behaviour of transport operators, their pathway must go through the shipper and/or final recipient, whereas transport oper-ators in most cases just take on the task of physically transporting and delivering in the city . One example of this could be a city encouraging the climate-friendly delivery of e-commerce packages using electric vans rather than conventional combustion engine vehicles . In this case, transport using an electric van may very well turn out to be more expensive and therefore needs to be justified by a higher transport price for the shipper and/or receiver of the goods .
In conclusion, evidently relationships between stake-holders make up a complex landscape ensuring the effi-
INFO-BOX: Liveability is generally defined as the qualities of a geographical setting (country, region, city, town, etc .) which influences the quality of life perceived by its inhabitants, etc . (see e .g . [9]) .
Page 64 – Freight, logistics and the delivery of goods in cities Freight, logistics and the delivery of goods in cities – Page 65
DTU International Energy Report 2019 DTU International Energy Report 2019

may be relevant to transporting very specific types of goods, those that may benefit from the advantages of drone transport . Another interesting type of drone is the sideway robot technology, whereby trains of driving drones deliver parcels in the city .
Within freight terminals and logistics hubs, we are already experiencing high degrees of automation in operations like, for instance, picking, sorting and packing goods . It must be assumed that the trend to increased automation will continue as the costs of installing and operating automated solutions fall .
In this section, we have discussed several macro-trends that are currently influencing the development of urban freight transport and logistics . Naturally, the above dis-cussion is not exhaustive, nor does it try to be: the list of factors, such as micro-trends, affecting urban freight transport and logistics is even longer . For further discus-sion of such trends and factors, the reader is referred to detailed reports such as DHL’s Logistics Trend Radar
[13] and the Urban Freight Research and Innovation Roadmap [16] .
Towards greening urban freight transport and logisticsAs the majority of the macro-trends mentioned above are expected to lead to an increased number of freight movements, it is imperative to discuss the potential for reducing the number of freight movements and their negative impacts . In parallel with the emergence of new technologies and business models negatively impacting on urban freight transport and logistics, other technol-ogies and initiatives may help to create more efficient operations for the benefit of all stakeholders, including private actors and society at large .
Alternative means of energyToday, most freight transport movements are still operated by trucks driven by conventional combustion engines, typically fuelled by diesel . However, a trans-formation from fossil fuel-based energy to alternative
inevitably lead to lower vehicle fill rates, thereby increasing freight movements [2] .
Furthermore, the frequent e-commerce customer often experiences his or her orders being delivered over sev-eral delivery moments . This practice is caused partially by the desire to be able to deliver the customer’s order as quickly as possible . The various parts of a specific order are not necessarily shipped from the same physical warehouse . Given low transport costs currently, the additional costs matter less than the possible loss in customer goodwill . Again, this phenomenon leads to more freight movements .
Finally, the freight transport and logistics industry is characterized by a relatively high number of transport and logistics operators, which, together with the current low transport costs, implies that shipments most often end up being transported by many different operators, each serving the same geographical area . In other words, the degree of consolidation per area is often rather low, which means that many neighbourhoods and house-holds experience being visited by a considerable number of delivery vehicles every day, each dropping off only a few deliveries per stop .
The increased number of freight movements inevitably contributes to urban traffic congestion and thus drives up the external climate and environmental costs, as well as impacting on noise and traffic safety . Consequently, energy use is directly impacted by the increasing number of freight movements and indirectly impacted by the contribution to the general level of congestion experienced by other traffic infrastructure users (exter-nalities) .
DigitalizationIn freight transport and logistics, many manual and ana-logue processes still exist . Often, the actors in the sector refer to the paper trail associated with freight transport transactions . However, the focus on digitalization is also very much present . Digital solutions for activities such as booking engines and track and trace are gradually being improved, supporting shippers and receivers in operating within the strict time limits of the on-demand economy described above .
Digitalization also brings opportunities such as antici-patory logistics based on sensored or predicted data on user behaviour (from online purchasing and searches), enabling online retailers to make user-specific offers and to physically position their goods in their logistics
networks even before the order is made . Online giants, such as Amazon and Alibaba, excel in this activity, enabling them to respond impressively fast to online orders . In brief, the availability of detailed data provided by digitalization enables more efficient planning, as much more accurate status and positioning information becomes available to the planner . This can lead to more cost-efficient and sustainable planning, but it may also be challenged by the strict expectations the on-demand society user may have . Chapter 6 discusses concepts such as sensing, flexibility and responsiveness in more detail .
AutomationAutomation opens up interesting opportunities for con-ducting last-mile operations more efficiently . There are several reasons for this [2] . First, in a fully automated operation, vehicles may deliver packages and boxes to retailers and even to private households outside peak hours, leading to a more efficient usage of road infra-structure . Off-peak deliveries benefit immensely from fully or semi-automated solutions, as the reliance on the driver is fully or partially removed from the equation . In distribution and reverse logistics, automated solutions are regarded as having great potential for cost and en-ergy savings . In many parts of the western world, truck-ing companies are experiencing difficulties in recruiting skilled drivers who are able to offer the required service to shipper and receivers . As a result, semi- or fully auto-mated solutions are also receiving great interest from such companies .
Multiple concepts for automated distribution systems have appeared in recent years . Chapter 6 provides a discussion of some of the potentials of these concepts . Until now, most of the solutions presented within freight transport and logistics serve to demonstrate the viability of automation . Freight delivery drones is one example of this . From a technical point of view, it is indeed phys-ically feasible to fly a drone into a city even with rela-tively large volumes of goods . However, the downsides to flying drones in most cases completely outweigh the advantages . Obviously, the energy consumption of trans-porting goods in the air is considerably higher compared to on-ground transport . Next, the noise associated with aerial drones should not be underestimated in cases where drone delivery took significant market shares . Finally, the road traffic congestion could easily move into the air, seriously challenging the city’s liveability . In conclusion, it is hard to imagine that airborne drones will take a significant share of the freight transport market . However, the technology is nonetheless interesting and
Page 66 – Freight, logistics and the delivery of goods in cities Freight, logistics and the delivery of goods in cities – Page 67
DTU International Energy Report 2019 DTU International Energy Report 2019
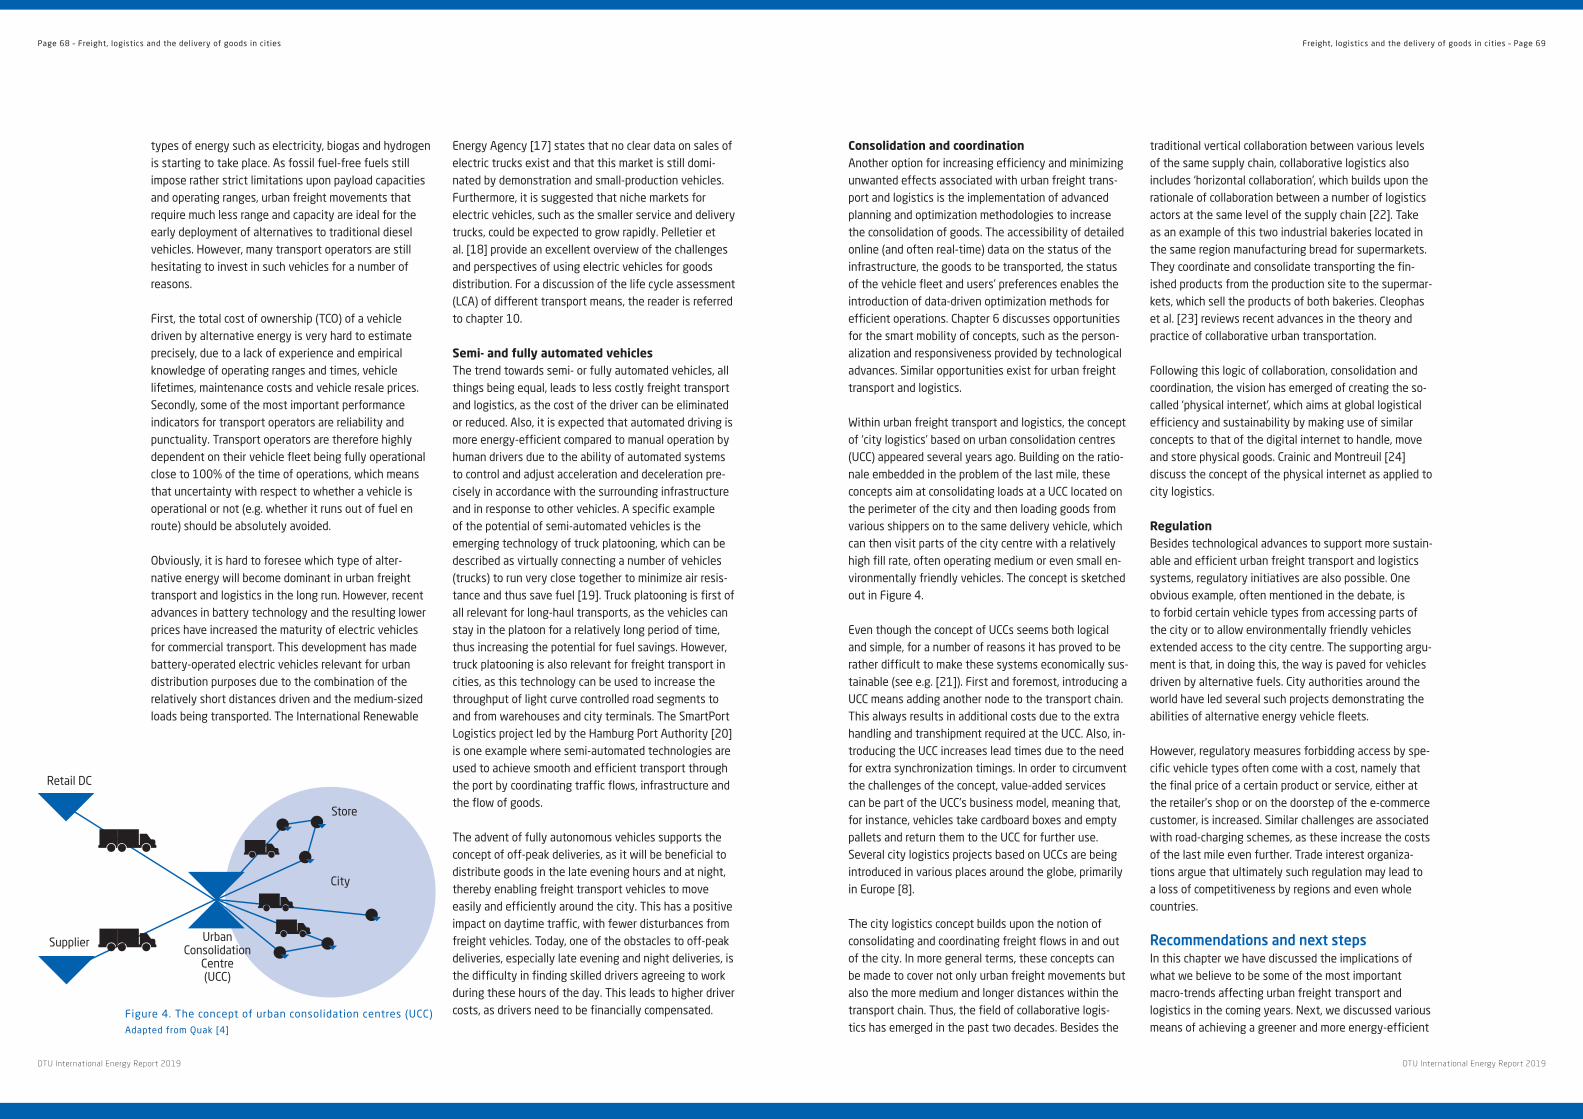
Consolidation and coordinationAnother option for increasing efficiency and minimizing unwanted effects associated with urban freight trans-port and logistics is the implementation of advanced planning and optimization methodologies to increase the consolidation of goods . The accessibility of detailed online (and often real-time) data on the status of the infrastructure, the goods to be transported, the status of the vehicle fleet and users’ preferences enables the introduction of data-driven optimization methods for efficient operations . Chapter 6 discusses opportunities for the smart mobility of concepts, such as the person-alization and responsiveness provided by technological advances . Similar opportunities exist for urban freight transport and logistics .
Within urban freight transport and logistics, the concept of ‘city logistics’ based on urban consolidation centres (UCC) appeared several years ago . Building on the ratio-nale embedded in the problem of the last mile, these concepts aim at consolidating loads at a UCC located on the perimeter of the city and then loading goods from various shippers on to the same delivery vehicle, which can then visit parts of the city centre with a relatively high fill rate, often operating medium or even small en-vironmentally friendly vehicles . The concept is sketched out in Figure 4 .
Even though the concept of UCCs seems both logical and simple, for a number of reasons it has proved to be rather difficult to make these systems economically sus-tainable (see e .g . [21]) . First and foremost, introducing a UCC means adding another node to the transport chain . This always results in additional costs due to the extra handling and transhipment required at the UCC . Also, in-troducing the UCC increases lead times due to the need for extra synchronization timings . In order to circumvent the challenges of the concept, value-added services can be part of the UCC’s business model, meaning that, for instance, vehicles take cardboard boxes and empty pallets and return them to the UCC for further use . Several city logistics projects based on UCCs are being introduced in various places around the globe, primarily in Europe [8] .
The city logistics concept builds upon the notion of consolidating and coordinating freight flows in and out of the city . In more general terms, these concepts can be made to cover not only urban freight movements but also the more medium and longer distances within the transport chain . Thus, the field of collaborative logis-tics has emerged in the past two decades . Besides the
traditional vertical collaboration between various levels of the same supply chain, collaborative logistics also includes ‘horizontal collaboration’, which builds upon the rationale of collaboration between a number of logistics actors at the same level of the supply chain [22] . Take as an example of this two industrial bakeries located in the same region manufacturing bread for supermarkets . They coordinate and consolidate transporting the fin-ished products from the production site to the supermar-kets, which sell the products of both bakeries . Cleophas et al . [23] reviews recent advances in the theory and practice of collaborative urban transportation .
Following this logic of collaboration, consolidation and coordination, the vision has emerged of creating the so-called ‘physical internet’, which aims at global logistical efficiency and sustainability by making use of similar concepts to that of the digital internet to handle, move and store physical goods . Crainic and Montreuil [24] discuss the concept of the physical internet as applied to city logistics .
RegulationBesides technological advances to support more sustain-able and efficient urban freight transport and logistics systems, regulatory initiatives are also possible . One obvious example, often mentioned in the debate, is to forbid certain vehicle types from accessing parts of the city or to allow environmentally friendly vehicles extended access to the city centre . The supporting argu-ment is that, in doing this, the way is paved for vehicles driven by alternative fuels . City authorities around the world have led several such projects demonstrating the abilities of alternative energy vehicle fleets .
However, regulatory measures forbidding access by spe-cific vehicle types often come with a cost, namely that the final price of a certain product or service, either at the retailer’s shop or on the doorstep of the e-commerce customer, is increased . Similar challenges are associated with road-charging schemes, as these increase the costs of the last mile even further . Trade interest organiza-tions argue that ultimately such regulation may lead to a loss of competitiveness by regions and even whole countries .
Recommendations and next stepsIn this chapter we have discussed the implications of what we believe to be some of the most important macro-trends affecting urban freight transport and logistics in the coming years . Next, we discussed various means of achieving a greener and more energy-efficient
types of energy such as electricity, biogas and hydrogen is starting to take place . As fossil fuel-free fuels still impose rather strict limitations upon payload capacities and operating ranges, urban freight movements that require much less range and capacity are ideal for the early deployment of alternatives to traditional diesel vehicles . However, many transport operators are still hesitating to invest in such vehicles for a number of reasons .
First, the total cost of ownership (TCO) of a vehicle driven by alternative energy is very hard to estimate precisely, due to a lack of experience and empirical knowledge of operating ranges and times, vehicle lifetimes, maintenance costs and vehicle resale prices . Secondly, some of the most important performance indicators for transport operators are reliability and punctuality . Transport operators are therefore highly dependent on their vehicle fleet being fully operational close to 100% of the time of operations, which means that uncertainty with respect to whether a vehicle is operational or not (e .g . whether it runs out of fuel en route) should be absolutely avoided .
Obviously, it is hard to foresee which type of alter-native energy will become dominant in urban freight transport and logistics in the long run . However, recent advances in battery technology and the resulting lower prices have increased the maturity of electric vehicles for commercial transport . This development has made battery-operated electric vehicles relevant for urban distribution purposes due to the combination of the relatively short distances driven and the medium-sized loads being transported . The International Renewable
Energy Agency [17] states that no clear data on sales of electric trucks exist and that this market is still domi-nated by demonstration and small-production vehicles . Furthermore, it is suggested that niche markets for electric vehicles, such as the smaller service and delivery trucks, could be expected to grow rapidly . Pelletier et al . [18] provide an excellent overview of the challenges and perspectives of using electric vehicles for goods distribution . For a discussion of the life cycle assessment (LCA) of different transport means, the reader is referred to chapter 10 .
Semi- and fully automated vehicles The trend towards semi- or fully automated vehicles, all things being equal, leads to less costly freight transport and logistics, as the cost of the driver can be eliminated or reduced . Also, it is expected that automated driving is more energy-efficient compared to manual operation by human drivers due to the ability of automated systems to control and adjust acceleration and deceleration pre-cisely in accordance with the surrounding infrastructure and in response to other vehicles . A specific example of the potential of semi-automated vehicles is the emerging technology of truck platooning, which can be described as virtually connecting a number of vehicles (trucks) to run very close together to minimize air resis-tance and thus save fuel [19] . Truck platooning is first of all relevant for long-haul transports, as the vehicles can stay in the platoon for a relatively long period of time, thus increasing the potential for fuel savings . However, truck platooning is also relevant for freight transport in cities, as this technology can be used to increase the throughput of light curve controlled road segments to and from warehouses and city terminals . The SmartPort Logistics project led by the Hamburg Port Authority [20] is one example where semi-automated technologies are used to achieve smooth and efficient transport through the port by coordinating traffic flows, infrastructure and the flow of goods .
The advent of fully autonomous vehicles supports the concept of off-peak deliveries, as it will be beneficial to distribute goods in the late evening hours and at night, thereby enabling freight transport vehicles to move easily and efficiently around the city . This has a positive impact on daytime traffic, with fewer disturbances from freight vehicles . Today, one of the obstacles to off-peak deliveries, especially late evening and night deliveries, is the difficulty in finding skilled drivers agreeing to work during these hours of the day . This leads to higher driver costs, as drivers need to be financially compensated . Figure 4 . The concept of urban consolidation centres (UCC)
Adapted from Quak [4]
Retail DC
Supplier Urban Consolidation
Centre (UCC)
City
Store
Page 68 – Freight, logistics and the delivery of goods in cities Freight, logistics and the delivery of goods in cities – Page 69
DTU International Energy Report 2019 DTU International Energy Report 2019
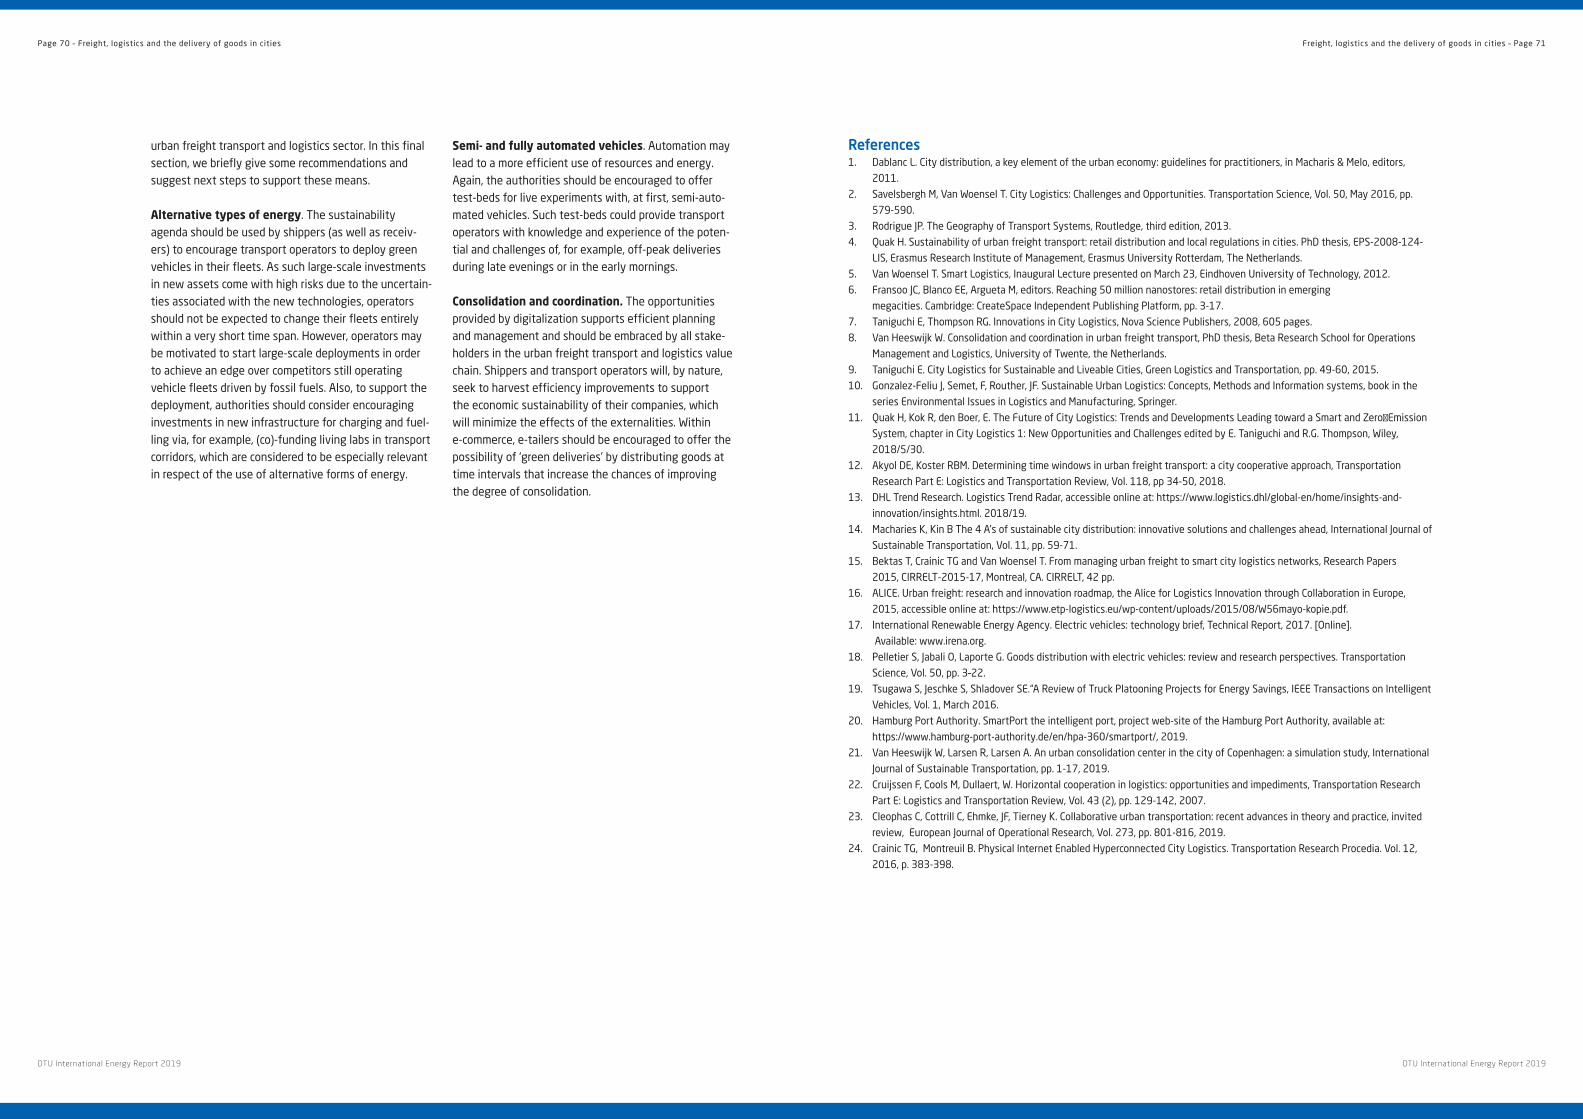
References1 . Dablanc L . City distribution, a key element of the urban economy: guidelines for practitioners, in Macharis & Melo, editors,
2011 .
2 . Savelsbergh M, Van Woensel T . City Logistics: Challenges and Opportunities . Transportation Science, Vol . 50, May 2016, pp .
579-590 .
3 . Rodrigue JP . The Geography of Transport Systems, Routledge, third edition, 2013 .
4 . Quak H . Sustainability of urban freight transport: retail distribution and local regulations in cities . PhD thesis, EPS-2008-124-
LIS, Erasmus Research Institute of Management, Erasmus University Rotterdam, The Netherlands .
5 . Van Woensel T . Smart Logistics, Inaugural Lecture presented on March 23, Eindhoven University of Technology, 2012 .
6 . Fransoo JC, Blanco EE, Argueta M, editors . Reaching 50 million nanostores: retail distribution in emerging
megacities . Cambridge: CreateSpace Independent Publishing Platform, pp . 3-17 .
7 . Taniguchi E, Thompson RG . Innovations in City Logistics, Nova Science Publishers, 2008, 605 pages .
8 . Van Heeswijk W . Consolidation and coordination in urban freight transport, PhD thesis, Beta Research School for Operations
Management and Logistics, University of Twente, the Netherlands .
9 . Taniguchi E . City Logistics for Sustainable and Liveable Cities, Green Logistics and Transportation, pp . 49-60, 2015 .
10 . Gonzalez-Feliu J, Semet, F, Routher, JF . Sustainable Urban Logistics: Concepts, Methods and Information systems, book in the
series Environmental Issues in Logistics and Manufacturing, Springer .
11 . Quak H, Kok R, den Boer, E . The Future of City Logistics: Trends and Developments Leading toward a Smart and Zero⁰Emission
System, chapter in City Logistics 1: New Opportunities and Challenges edited by E . Taniguchi and R .G . Thompson, Wiley,
2018/5/30 .
12 . Akyol DE, Koster RBM . Determining time windows in urban freight transport: a city cooperative approach, Transportation
Research Part E: Logistics and Transportation Review, Vol . 118, pp 34-50, 2018 .
13 . DHL Trend Research . Logistics Trend Radar, accessible online at: https://www .logistics .dhl/global-en/home/insights-and-
innovation/insights .html . 2018/19 .
14 . Macharies K, Kin B The 4 A’s of sustainable city distribution: innovative solutions and challenges ahead, International Journal of
Sustainable Transportation, Vol . 11, pp . 59-71 .
15 . Bektas T, Crainic TG and Van Woensel T . From managing urban freight to smart city logistics networks, Research Papers
2015, CIRRELT-2015-17, Montreal, CA . CIRRELT, 42 pp .
16 . ALICE . Urban freight: research and innovation roadmap, the Alice for Logistics Innovation through Collaboration in Europe,
2015, accessible online at: https://www .etp-logistics .eu/wp-content/uploads/2015/08/W56mayo-kopie .pdf .
17 . International Renewable Energy Agency . Electric vehicles: technology brief, Technical Report, 2017 . [Online] .
Available: www .irena .org .
18 . Pelletier S, Jabali O, Laporte G . Goods distribution with electric vehicles: review and research perspectives . Transportation
Science, Vol . 50, pp . 3–22 .
19 . Tsugawa S, Jeschke S, Shladover SE .“A Review of Truck Platooning Projects for Energy Savings, IEEE Transactions on Intelligent
Vehicles, Vol . 1, March 2016 .
20 . Hamburg Port Authority . SmartPort the intelligent port, project web-site of the Hamburg Port Authority, available at:
https://www .hamburg-port-authority .de/en/hpa-360/smartport/, 2019 .
21 . Van Heeswijk W, Larsen R, Larsen A . An urban consolidation center in the city of Copenhagen: a simulation study, International
Journal of Sustainable Transportation, pp . 1-17, 2019 .
22 . Cruijssen F, Cools M, Dullaert, W . Horizontal cooperation in logistics: opportunities and impediments, Transportation Research
Part E: Logistics and Transportation Review, Vol . 43 (2), pp . 129-142, 2007 .
23 . Cleophas C, Cottrill C, Ehmke, JF, Tierney K . Collaborative urban transportation: recent advances in theory and practice, invited
review, European Journal of Operational Research, Vol . 273, pp . 801-816, 2019 .
24 . Crainic TG, Montreuil B . Physical Internet Enabled Hyperconnected City Logistics . Transportation Research Procedia . Vol . 12,
2016, p . 383-398 .
urban freight transport and logistics sector . In this final section, we briefly give some recommendations and suggest next steps to support these means .
Alternative types of energy . The sustainability agenda should be used by shippers (as well as receiv-ers) to encourage transport operators to deploy green vehicles in their fleets . As such large-scale investments in new assets come with high risks due to the uncertain-ties associated with the new technologies, operators should not be expected to change their fleets entirely within a very short time span . However, operators may be motivated to start large-scale deployments in order to achieve an edge over competitors still operating vehicle fleets driven by fossil fuels . Also, to support the deployment, authorities should consider encouraging investments in new infrastructure for charging and fuel-ling via, for example, (co)-funding living labs in transport corridors, which are considered to be especially relevant in respect of the use of alternative forms of energy .
Semi- and fully automated vehicles . Automation may lead to a more efficient use of resources and energy . Again, the authorities should be encouraged to offer test-beds for live experiments with, at first, semi-auto-mated vehicles . Such test-beds could provide transport operators with knowledge and experience of the poten-tial and challenges of, for example, off-peak deliveries during late evenings or in the early mornings .
Consolidation and coordination. The opportunities provided by digitalization supports efficient planning and management and should be embraced by all stake-holders in the urban freight transport and logistics value chain . Shippers and transport operators will, by nature, seek to harvest efficiency improvements to support the economic sustainability of their companies, which will minimize the effects of the externalities . Within e-commerce, e-tailers should be encouraged to offer the possibility of ‘green deliveries’ by distributing goods at time intervals that increase the chances of improving the degree of consolidation .
Page 70 – Freight, logistics and the delivery of goods in cities Freight, logistics and the delivery of goods in cities – Page 71
DTU International Energy Report 2019 DTU International Energy Report 2019

and flexible electric power system, the battery energy storage solution or BESS, although currently still expen-sive, is an interesting option for balancing the electric power system by providing balancing services, for ex-ample, so-called frequency containment services . At the distribution level, a massive deployment of (charging) electric vehicles may generate local voltage excursions and grid congestion which cannot easily be alleviated by a single grid-connected BESS . However, if EV charging can be controlled or even allowed with the provision of a two-way power flow (charging and discharging), EVs can potentially help mitigate the self-inflicted adverse effects in a similar way to the BESS . In short, this is called vehicle grid integration or VGI, and it encompasses G2V and V2G power flows [4; 19] .
Another way of offering a flexible demand for electric power is to integrate the electric power system with other energy infrastructure such as natural gas, hydro-gen systems and thermal grid (heating and cooling) sys-tems . If other such energy domains are available and can be integrated with the operation of the electric power system, increased flexibility with electric power demand can be achieved through so-called fuel shifts .
New and ambitious targets are being set throughout Europe for transportation electrification – in Denmark a target of a million green cars is proposed by 2030, with a ban on combustion-engine vehicles coming into force the same year . Such targets need to be supported by a sufficient and smart charging infrastructure . As such the EVs and their charging are a proxy (see Figure 8 .2)
of the coupling between the electric power grid and EVs, and thus of transportation electrification and urban mobility, as well as being the paradigm shift needed in electric power system operation . To provide a sufficient infrastructure, the demand for charging in urban areas must be understood by investigating:
• New charging technology (charging power, electric connection, AC vs DC, etc .)
• EV range (battery size, car efficiency)• EV owners’ access to charging options, especially
home charging
Future plug-in and charging behaviour reveals both the impact charging may have on the grid and the potential of EVs to provide flexibility in terms of electric power demand . Labs can help test smart infrastructure allowing early access to smart charging by having open standards connecting EVs, EV supply equipment, EVSE and back-end . Also, it is prudent to make such capabilities readily accessible and useful by promoting simple mechanisms for DSOs to assess the need for load-shaping and access flexibility, for example, brownout signals .
In the following we will show how electro-mobility and living labs accelerate a paradigm shift within the energy and transport sector, thus increasing the liveability and sustainability of cities . Examples will be given of how living labs, super-labs and so-called ‘free zones’ help pro-mote new technologies and solutions by staging tests of technology and solutions and returning data on related to real customers and human behaviour . In principle
Introduction: entangled energy infrastructureThe electric power system is the most versatile and widespread energy infrastructure sustaining human activity, enabling the exchange of electric power and energy between producers and consumers around the clock, and ensuring that a continuous balance is maintained between power input and power output . The electric power system has to be balanced at all times: that is, consumption and generation must be balanced on a time scale of seconds . A lack of balance between generation and consumption is reflected in frequency deviations, hence the need for so-called frequency ser-vices to help stabilize electric power grids . A sustained lack of balance between generation and consumption may eventually lead to the power system collapsing, causing a blackout for an extended period of time . Major blackouts are costly [1; 2] and in the worst case may cause the loss of human lives .
In the context of future energy supply, the electric power system is increasingly being challenged by variable power generation and increased demand . In general, the variability in power generation stems from the increased share of wind and solar PV in the supply portfolio, while future energy demand is anticipated to increase because of thermal-sector coupling and electro-mobility in particular . Variable power genera-tion spurs a quest for demand responses in relation to power consumption and for storage solutions . However, electro-mobility in the urban context, in representing an actual increase in demand, may, in particular cases, be exploited as a variable storage solution (‘grid to vehicle’ or G2V and ‘vehicle to grid’ or V2G) .
Traditional electric power system operation has followed a strategy emphasizing a top-down power flow . Electric power used to be generated by large thermal power plants and transmitted by, and balanced under the vig-ilant eyes of Transmission System Operators (TSO) via
high voltage (>100kV) transmission lines, and finally be-ing distributed at low and medium voltages (10-100kV) through a distribution network (by Distribution System Operators - DSO), and with consumption being extracted at low-voltage terminals (0 .4kV) . In principle generation followed consumption and demand in order to balance electric power . Recently, however, an increased share of so-called distributed and renewable-based genera-tion from wind turbines and solar PV has started being injected at low and medium voltages, as illustrated in Figure 8 .1 [3] – in essence a bottom-up kind of power flow . Renewable-based generation depends on weather conditions and as such requires increased vigilance to maintain the balance in electric power . These new conditions incentivise a situation in which consumption follows generation, resulting in a fluctuating electric power exchange . Flexibility with respect to electric power demand response and storage can potentially alleviate and absorb the fluctuations in generation . In this sense electro-mobility, battery energy storage systems, BESS and couplings with other forms of energy infrastructure are considered viable solutions in urban areas . Simultaneously, urban areas are characterized by a growth in consumption, the electrification of mobility, the concentration of energy infrastructure and poten-tially an increased demand response, that is, flexibility with respect to electricity consumption .
The rapid development within mobility (chapter 3 & 4), and in particular within electro mobility in urban areas, already has a significant impact on the contemporary electric power system . Autonomous transportation, elec-tric bicycles and scooters for the last mile, drone delivery of goods, shared vehicles and mobility as a service are just a few of the developments that may constitute new electric power system challenges and opportunities . In order to adapt to the new forms of consumption, as well as the increases in electricity generation based on variable energy resources, greater flexibility in the elec-tricity system is required . In order to design an adaptable
Chapter 8
Integrated energy systems and transportation electrificationFrida Frost, Mattia Marinelli, Peter Bach Andersen, Christoffer Greisen, Chresten Træholt, DTU Electric Engineering
Figure 1 . Share of electric power generation linked to the distribution grid in Denmark [3]
Integrated energy systems and transportation electrification – Page 73
DTU International Energy Report 2019 DTU International Energy Report 2019
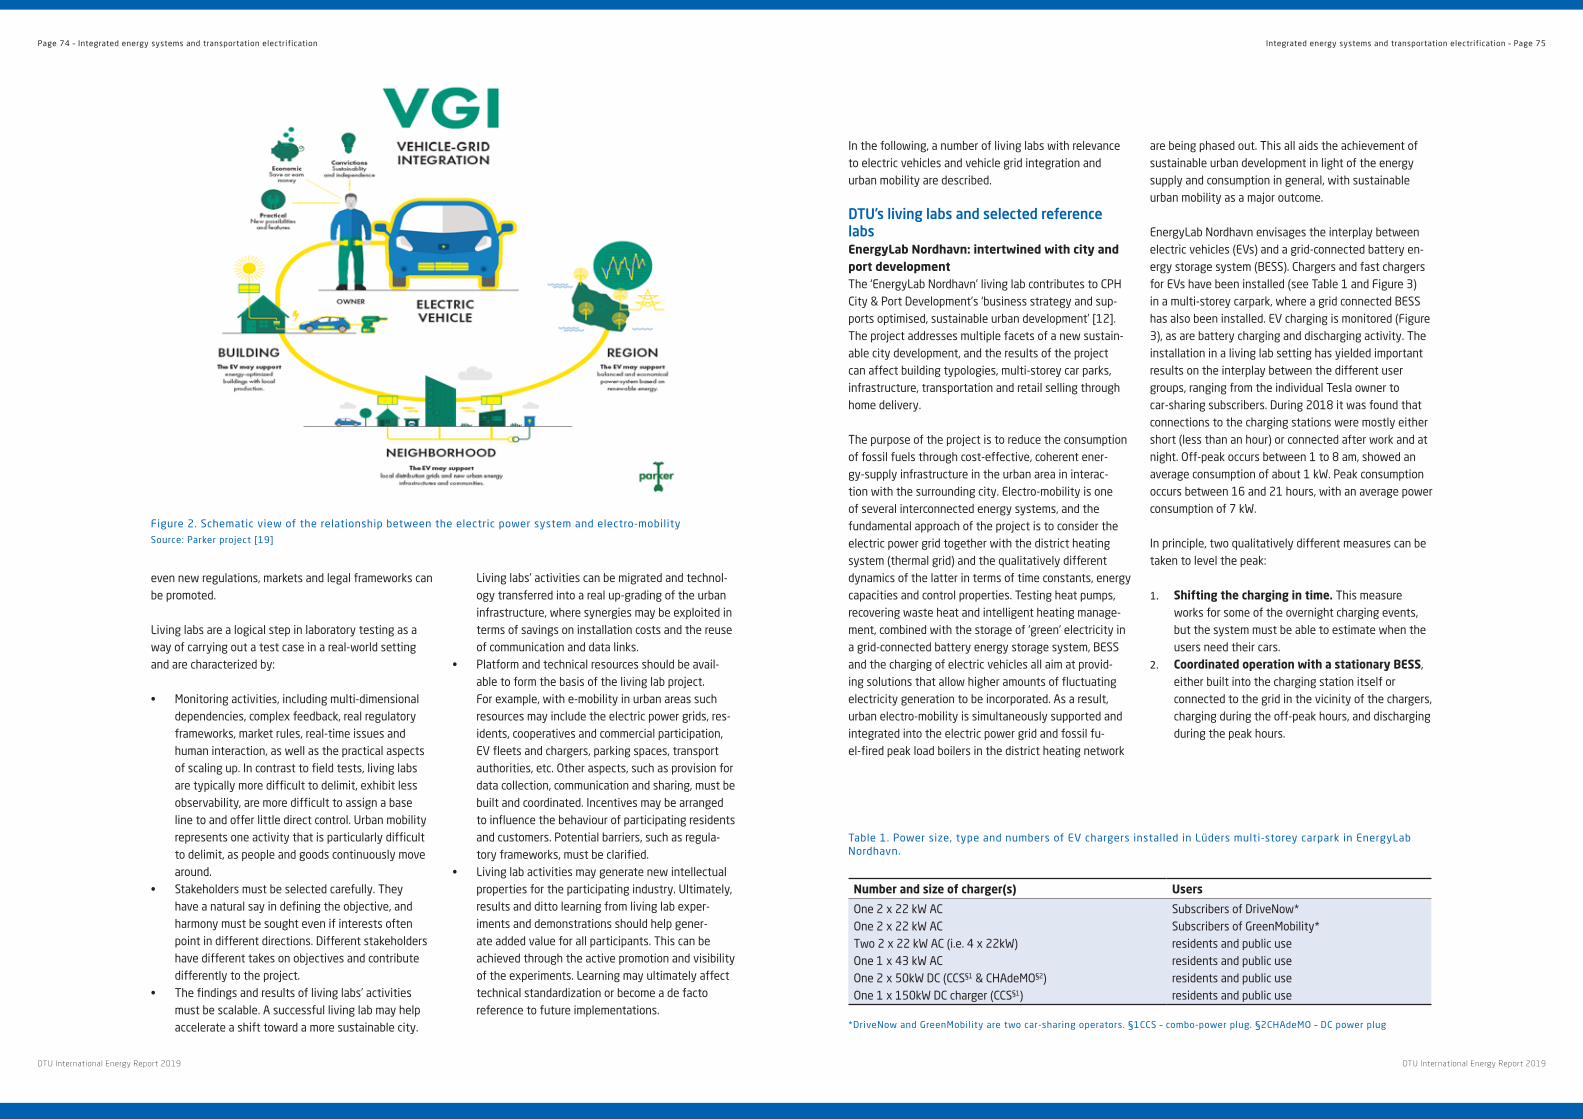
In the following, a number of living labs with relevance to electric vehicles and vehicle grid integration and urban mobility are described .
DTU’s living labs and selected reference labsEnergyLab Nordhavn: intertwined with city and port developmentThe ‘EnergyLab Nordhavn’ living lab contributes to CPH City & Port Development’s ‘business strategy and sup-ports optimised, sustainable urban development’ [12] . The project addresses multiple facets of a new sustain-able city development, and the results of the project can affect building typologies, multi-storey car parks, infrastructure, transportation and retail selling through home delivery .
The purpose of the project is to reduce the consumption of fossil fuels through cost-effective, coherent ener-gy-supply infrastructure in the urban area in interac-tion with the surrounding city . Electro-mobility is one of several interconnected energy systems, and the fundamental approach of the project is to consider the electric power grid together with the district heating system (thermal grid) and the qualitatively different dynamics of the latter in terms of time constants, energy capacities and control properties . Testing heat pumps, recovering waste heat and intelligent heating manage-ment, combined with the storage of ‘green’ electricity in a grid-connected battery energy storage system, BESS and the charging of electric vehicles all aim at provid-ing solutions that allow higher amounts of fluctuating electricity generation to be incorporated . As a result, urban electro-mobility is simultaneously supported and integrated into the electric power grid and fossil fu-el-fired peak load boilers in the district heating network
are being phased out . This all aids the achievement of sustainable urban development in light of the energy supply and consumption in general, with sustainable urban mobility as a major outcome .
EnergyLab Nordhavn envisages the interplay between electric vehicles (EVs) and a grid-connected battery en-ergy storage system (BESS) . Chargers and fast chargers for EVs have been installed (see Table 1 and Figure 3) in a multi-storey carpark, where a grid connected BESS has also been installed . EV charging is monitored (Figure 3), as are battery charging and discharging activity . The installation in a living lab setting has yielded important results on the interplay between the different user groups, ranging from the individual Tesla owner to car-sharing subscribers . During 2018 it was found that connections to the charging stations were mostly either short (less than an hour) or connected after work and at night . Off-peak occurs between 1 to 8 am, showed an average consumption of about 1 kW . Peak consumption occurs between 16 and 21 hours, with an average power consumption of 7 kW .
In principle, two qualitatively different measures can be taken to level the peak:
1. Shifting the charging in time. This measure works for some of the overnight charging events, but the system must be able to estimate when the users need their cars .
2. Coordinated operation with a stationary BESS, either built into the charging station itself or connected to the grid in the vicinity of the chargers, charging during the off-peak hours, and discharging during the peak hours .
even new regulations, markets and legal frameworks can be promoted .
Living labs are a logical step in laboratory testing as a way of carrying out a test case in a real-world setting and are characterized by:
• Monitoring activities, including multi-dimensional dependencies, complex feedback, real regulatory frameworks, market rules, real-time issues and human interaction, as well as the practical aspects of scaling up . In contrast to field tests, living labs are typically more difficult to delimit, exhibit less observability, are more difficult to assign a base line to and offer little direct control . Urban mobility represents one activity that is particularly difficult to delimit, as people and goods continuously move around .
• Stakeholders must be selected carefully . They have a natural say in defining the objective, and harmony must be sought even if interests often point in different directions . Different stakeholders have different takes on objectives and contribute differently to the project .
• The findings and results of living labs’ activities must be scalable . A successful living lab may help accelerate a shift toward a more sustainable city .
Living labs’ activities can be migrated and technol-ogy transferred into a real up-grading of the urban infrastructure, where synergies may be exploited in terms of savings on installation costs and the reuse of communication and data links .
• Platform and technical resources should be avail-able to form the basis of the living lab project . For example, with e-mobility in urban areas such resources may include the electric power grids, res-idents, cooperatives and commercial participation, EV fleets and chargers, parking spaces, transport authorities, etc . Other aspects, such as provision for data collection, communication and sharing, must be built and coordinated . Incentives may be arranged to influence the behaviour of participating residents and customers . Potential barriers, such as regula-tory frameworks, must be clarified .
• Living lab activities may generate new intellectual properties for the participating industry . Ultimately, results and ditto learning from living lab exper-iments and demonstrations should help gener-ate added value for all participants . This can be achieved through the active promotion and visibility of the experiments . Learning may ultimately affect technical standardization or become a de facto reference to future implementations .
Figure 2 . Schematic view of the relationship between the electric power system and electro-mobility Source: Parker project [19]
Table 1 . Power size, type and numbers of EV chargers installed in Lüders multi-storey carpark in EnergyLab Nordhavn .
Number and size of charger(s) Users
One 2 x 22 kW ACOne 2 x 22 kW ACTwo 2 x 22 kW AC (i .e . 4 x 22kW)One 1 x 43 kW ACOne 2 x 50kW DC (CCS§1 & CHAdeMO§2)One 1 x 150kW DC charger (CCS§1)
Subscribers of DriveNow*Subscribers of GreenMobility*residents and public useresidents and public useresidents and public useresidents and public use
*DriveNow and GreenMobility are two car-sharing operators . §1CCS – combo-power plug . §2CHAdeMO – DC power plug
Page 74 – Integrated energy systems and transportation electrification Integrated energy systems and transportation electrification – Page 75
DTU International Energy Report 2019 DTU International Energy Report 2019
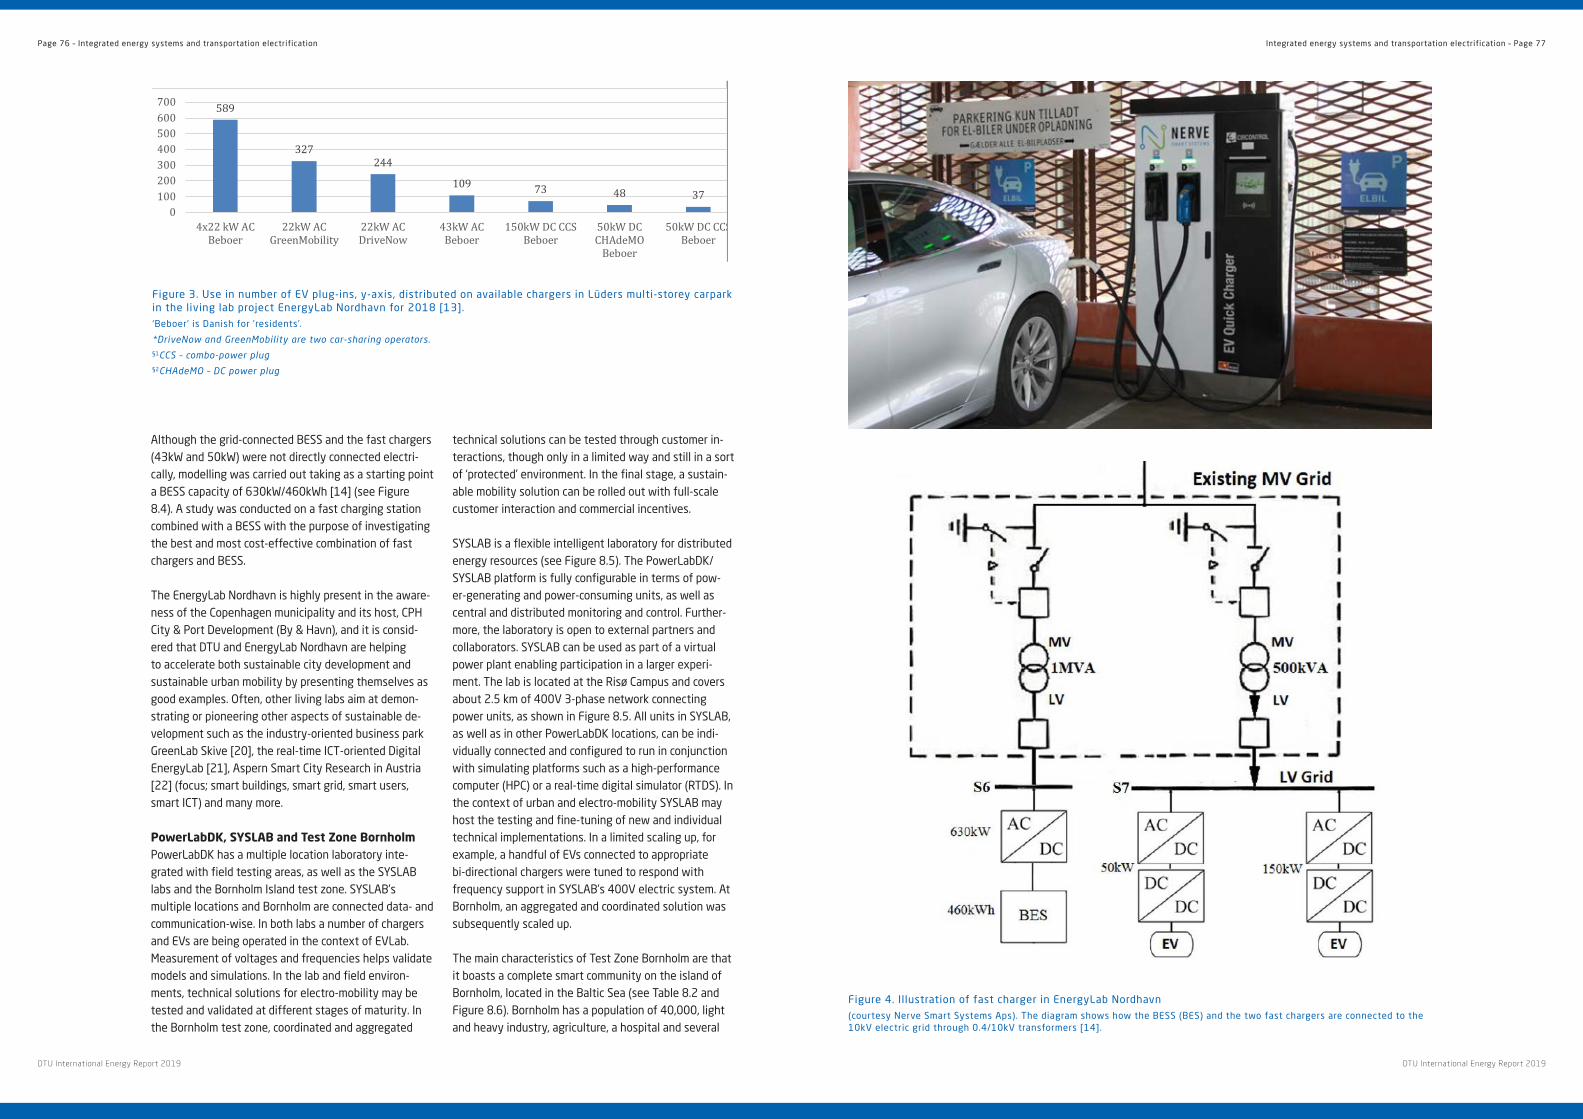
Although the grid-connected BESS and the fast chargers (43kW and 50kW) were not directly connected electri-cally, modelling was carried out taking as a starting point a BESS capacity of 630kW/460kWh [14] (see Figure 8 .4) . A study was conducted on a fast charging station combined with a BESS with the purpose of investigating the best and most cost-effective combination of fast chargers and BESS .
The EnergyLab Nordhavn is highly present in the aware-ness of the Copenhagen municipality and its host, CPH City & Port Development (By & Havn), and it is consid-ered that DTU and EnergyLab Nordhavn are helping to accelerate both sustainable city development and sustainable urban mobility by presenting themselves as good examples . Often, other living labs aim at demon-strating or pioneering other aspects of sustainable de-velopment such as the industry-oriented business park GreenLab Skive [20], the real-time ICT-oriented Digital EnergyLab [21], Aspern Smart City Research in Austria [22] (focus; smart buildings, smart grid, smart users, smart ICT) and many more .
PowerLabDK, SYSLAB and Test Zone BornholmPowerLabDK has a multiple location laboratory inte-grated with field testing areas, as well as the SYSLAB labs and the Bornholm Island test zone . SYSLAB’s multiple locations and Bornholm are connected data- and communication-wise . In both labs a number of chargers and EVs are being operated in the context of EVLab . Measurement of voltages and frequencies helps validate models and simulations . In the lab and field environ-ments, technical solutions for electro-mobility may be tested and validated at different stages of maturity . In the Bornholm test zone, coordinated and aggregated
technical solutions can be tested through customer in-teractions, though only in a limited way and still in a sort of ‘protected’ environment . In the final stage, a sustain-able mobility solution can be rolled out with full-scale customer interaction and commercial incentives .
SYSLAB is a flexible intelligent laboratory for distributed energy resources (see Figure 8 .5) . The PowerLabDK/SYSLAB platform is fully configurable in terms of pow-er-generating and power-consuming units, as well as central and distributed monitoring and control . Further-more, the laboratory is open to external partners and collaborators . SYSLAB can be used as part of a virtual power plant enabling participation in a larger experi-ment . The lab is located at the Risø Campus and covers about 2 .5 km of 400V 3-phase network connecting power units, as shown in Figure 8 .5 . All units in SYSLAB, as well as in other PowerLabDK locations, can be indi-vidually connected and configured to run in conjunction with simulating platforms such as a high-performance computer (HPC) or a real-time digital simulator (RTDS) . In the context of urban and electro-mobility SYSLAB may host the testing and fine-tuning of new and individual technical implementations . In a limited scaling up, for example, a handful of EVs connected to appropriate bi-directional chargers were tuned to respond with frequency support in SYSLAB’s 400V electric system . At Bornholm, an aggregated and coordinated solution was subsequently scaled up .
The main characteristics of Test Zone Bornholm are that it boasts a complete smart community on the island of Bornholm, located in the Baltic Sea (see Table 8 .2 and Figure 8 .6) . Bornholm has a population of 40,000, light and heavy industry, agriculture, a hospital and several
One 1 x 43 kW AC One 2 x 50kW DC (CCS§1 & CHAdeMO§2) One 1 x 150kW DC charger (CCS§1)
residents and public use residents and public use residents and public use
In principle, two qualitatively different measures can be taken to level the peak:
1. Shifting the charging in time. This measure works for some of the overnight charging events, but the system must be able to estimate when the users need their cars.
2. Coordinated operation with a stationary BESS, either built into the charging station itself or connected to the grid in the vicinity of the chargers, charging during the off-peak hours, and discharging during the peak hours.
Although the grid-connected BESS and the fast chargers (43kW and 50kW) were not directly connected electrically, modelling was carried out taking as a starting point a BESS capacity of 630kW/460kWh [14] (see Figure 8.4). A study was conducted on a fast charging station combined with a BESS with the purpose of investigating the best and most cost-effective combination of fast chargers and BESS.
Figure 3. Use in number of EV plug-ins, y-axis, distributed on available chargers in Lüders multi-storey carpark in the living lab project EnergyLab Nordhavn for 2018 [13]. ‘Beboer’ is Danish for ’residents’. *DriveNow and GreenMobility are two car-sharing operators. §1CCS – combo-power plug §2CHAdeMO – DC power plug
589
327244
109 73 48 370
100200300400500600700
4x22kWACBeboer
22kWACGreenMobility
22kWACDriveNow
43kWACBeboer
150kWDCCCSBeboer
50kWDCCHAdeMOBeboer
50kWDCCCSBeboer
Figure 3 . Use in number of EV plug-ins, y-axis, distributed on available chargers in Lüders multi-storey carpark in the living lab project EnergyLab Nordhavn for 2018 [13] . ‘Beboer’ is Danish for ’residents’ .
*DriveNow and GreenMobility are two car-sharing operators.§1CCS – combo-power plug§2CHAdeMO – DC power plug
Figure 4 . Illustration of fast charger in EnergyLab Nordhavn (courtesy Nerve Smart Systems Aps) . The diagram shows how the BESS (BES) and the two fast chargers are connected to the 10kV electric grid through 0 .4/10kV transformers [14] .
Page 76 – Integrated energy systems and transportation electrification Integrated energy systems and transportation electrification – Page 77
DTU International Energy Report 2019 DTU International Energy Report 2019
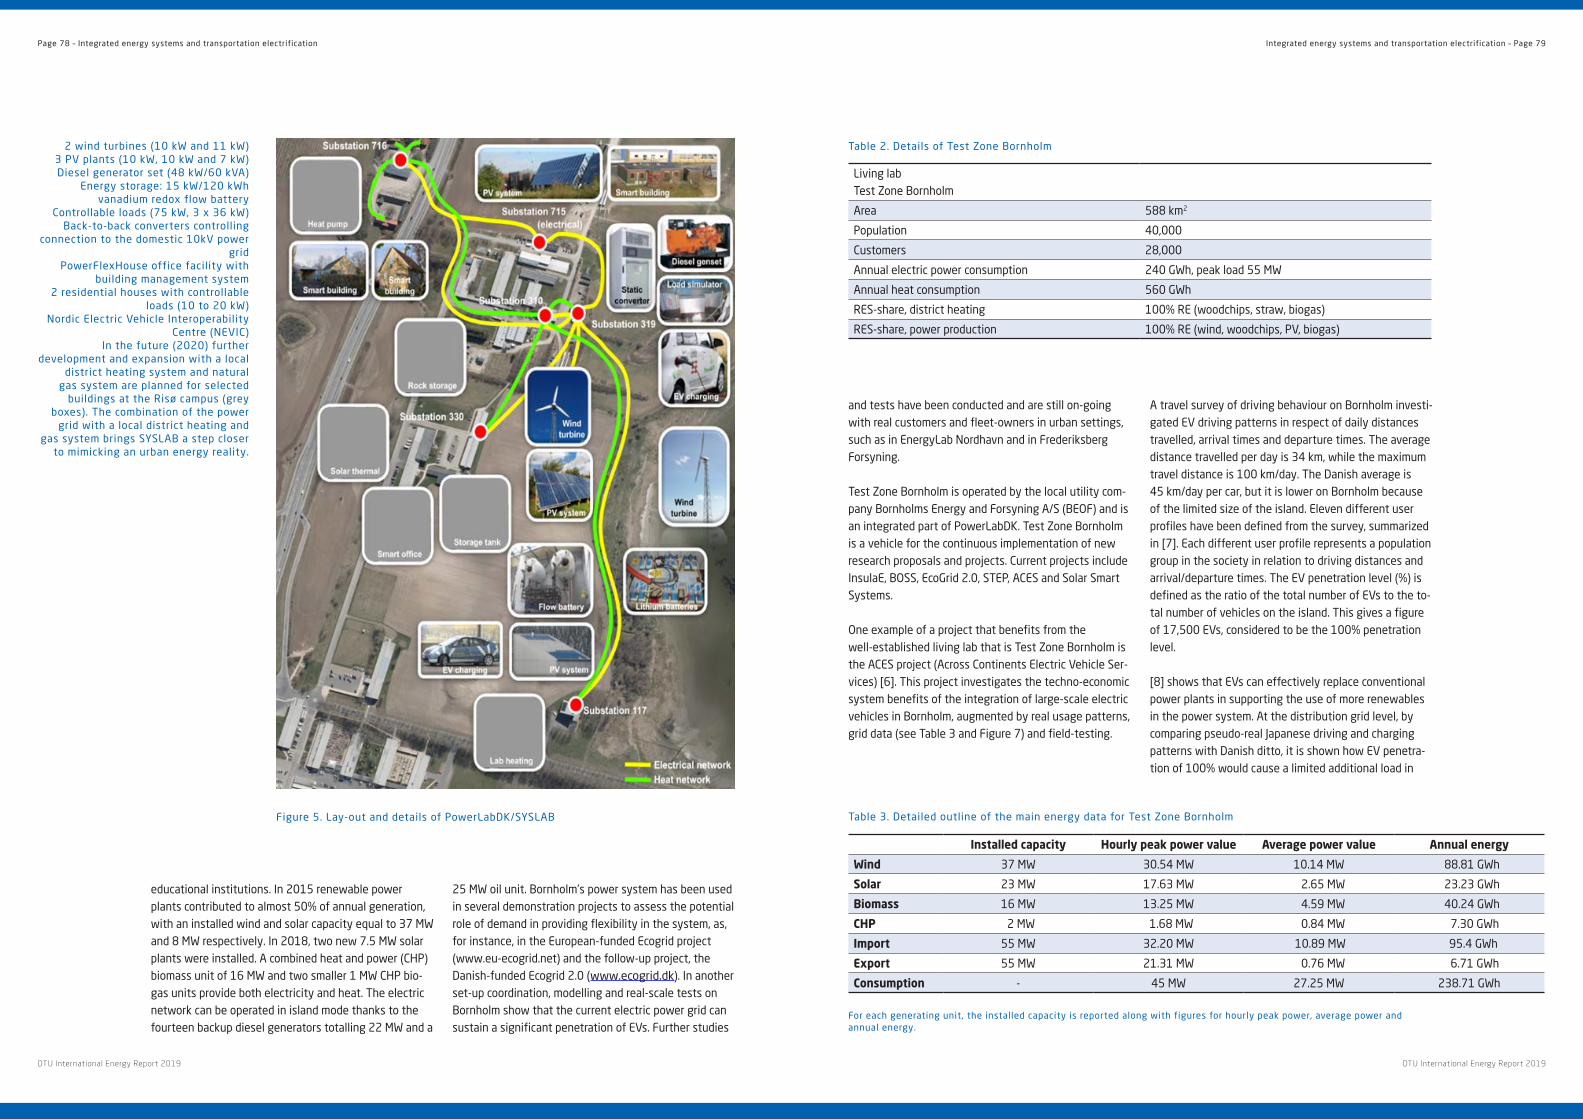
and tests have been conducted and are still on-going with real customers and fleet-owners in urban settings, such as in EnergyLab Nordhavn and in Frederiksberg Forsyning .
Test Zone Bornholm is operated by the local utility com-pany Bornholms Energy and Forsyning A/S (BEOF) and is an integrated part of PowerLabDK . Test Zone Bornholm is a vehicle for the continuous implementation of new research proposals and projects . Current projects include InsulaE, BOSS, EcoGrid 2 .0, STEP, ACES and Solar Smart Systems .
One example of a project that benefits from the well-established living lab that is Test Zone Bornholm is the ACES project (Across Continents Electric Vehicle Ser-vices) [6] . This project investigates the techno-economic system benefits of the integration of large-scale electric vehicles in Bornholm, augmented by real usage patterns, grid data (see Table 3 and Figure 7) and field-testing .
A travel survey of driving behaviour on Bornholm investi-gated EV driving patterns in respect of daily distances travelled, arrival times and departure times . The average distance travelled per day is 34 km, while the maximum travel distance is 100 km/day . The Danish average is 45 km/day per car, but it is lower on Bornholm because of the limited size of the island . Eleven different user profiles have been defined from the survey, summarized in [7] . Each different user profile represents a population group in the society in relation to driving distances and arrival/departure times . The EV penetration level (%) is defined as the ratio of the total number of EVs to the to-tal number of vehicles on the island . This gives a figure of 17,500 EVs, considered to be the 100% penetration level .
[8] shows that EVs can effectively replace conventional power plants in supporting the use of more renewables in the power system . At the distribution grid level, by comparing pseudo-real Japanese driving and charging patterns with Danish ditto, it is shown how EV penetra-tion of 100% would cause a limited additional load in
educational institutions . In 2015 renewable power plants contributed to almost 50% of annual generation, with an installed wind and solar capacity equal to 37 MW and 8 MW respectively . In 2018, two new 7 .5 MW solar plants were installed . A combined heat and power (CHP) biomass unit of 16 MW and two smaller 1 MW CHP bio-gas units provide both electricity and heat . The electric network can be operated in island mode thanks to the fourteen backup diesel generators totalling 22 MW and a
25 MW oil unit . Bornholm’s power system has been used in several demonstration projects to assess the potential role of demand in providing flexibility in the system, as, for instance, in the European-funded Ecogrid project (www .eu-ecogrid .net) and the follow-up project, the Danish-funded Ecogrid 2 .0 (www .ecogrid .dk) . In another set-up coordination, modelling and real-scale tests on Bornholm show that the current electric power grid can sustain a significant penetration of EVs . Further studies
Figure 5 . Lay-out and details of PowerLabDK/SYSLAB
2 wind turbines (10 kW and 11 kW)3 PV plants (10 kW, 10 kW and 7 kW) Diesel generator set (48 kW/60 kVA)
Energy storage: 15 kW/120 kWh vanadium redox flow battery
Controllable loads (75 kW, 3 x 36 kW)Back-to-back converters controlling
connection to the domestic 10kV power grid
PowerFlexHouse office facility with building management system
2 residential houses with controllable loads (10 to 20 kW)
Nordic Electric Vehicle Interoperability Centre (NEVIC)
In the future (2020) further development and expansion with a local
district heating system and natural gas system are planned for selected
buildings at the Risø campus (grey boxes) . The combination of the power
grid with a local district heating and gas system brings SYSLAB a step closer
to mimicking an urban energy reality .
Table 2 . Details of Test Zone Bornholm
Living labTest Zone Bornholm
Area 588 km2
Population 40,000
Customers 28,000
Annual electric power consumption 240 GWh, peak load 55 MW
Annual heat consumption 560 GWh
RES-share, district heating 100% RE (woodchips, straw, biogas)
RES-share, power production 100% RE (wind, woodchips, PV, biogas)
For each generating unit, the installed capacity is reported along with figures for hourly peak power, average power and annual energy .
Installed capacity Hourly peak power value Average power value Annual energy
Wind 37 MW 30 .54 MW 10 .14 MW 88 .81 GWh
Solar 23 MW 17 .63 MW 2 .65 MW 23 .23 GWh
Biomass 16 MW 13 .25 MW 4 .59 MW 40 .24 GWh
CHP 2 MW 1 .68 MW 0 .84 MW 7 .30 GWh
Import 55 MW 32 .20 MW 10 .89 MW 95 .4 GWh
Export 55 MW 21 .31 MW 0 .76 MW 6 .71 GWh
Consumption - 45 MW 27 .25 MW 238 .71 GWh
Table 3 . Detailed outline of the main energy data for Test Zone Bornholm
Page 78 – Integrated energy systems and transportation electrification Integrated energy systems and transportation electrification – Page 79
DTU International Energy Report 2019 DTU International Energy Report 2019
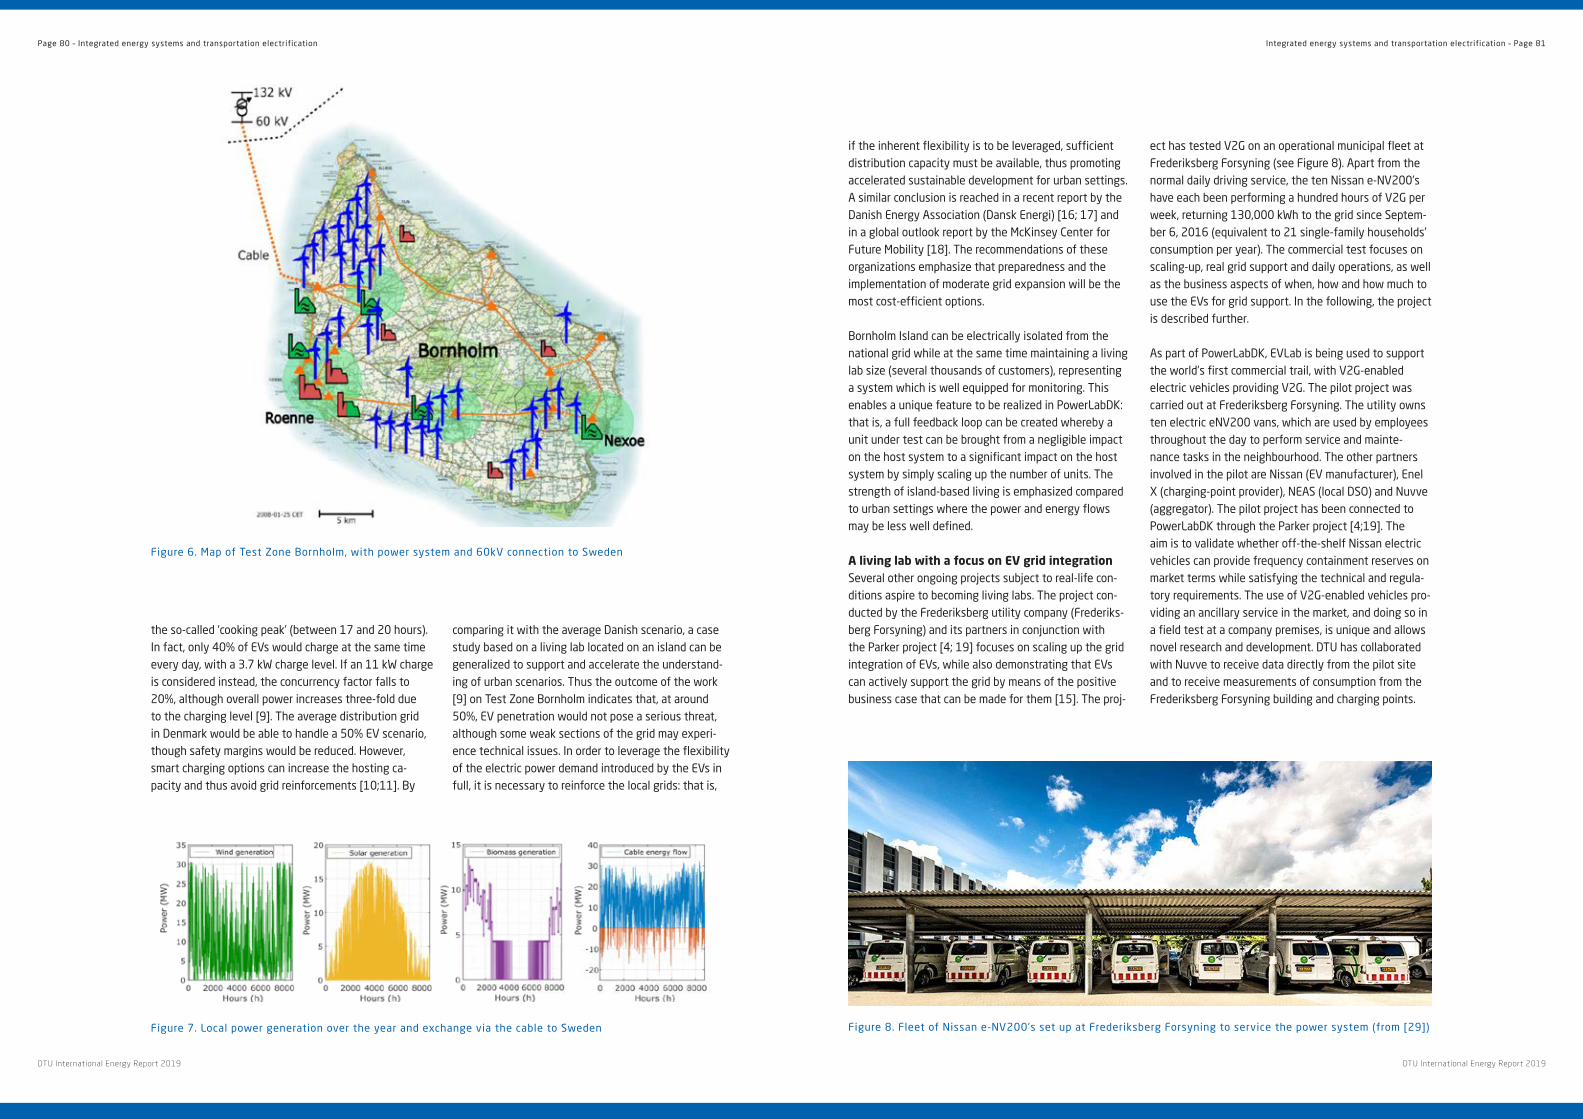
if the inherent flexibility is to be leveraged, sufficient distribution capacity must be available, thus promoting accelerated sustainable development for urban settings . A similar conclusion is reached in a recent report by the Danish Energy Association (Dansk Energi) [16; 17] and in a global outlook report by the McKinsey Center for Future Mobility [18] . The recommendations of these organizations emphasize that preparedness and the implementation of moderate grid expansion will be the most cost-efficient options .
Bornholm Island can be electrically isolated from the national grid while at the same time maintaining a living lab size (several thousands of customers), representing a system which is well equipped for monitoring . This enables a unique feature to be realized in PowerLabDK: that is, a full feedback loop can be created whereby a unit under test can be brought from a negligible impact on the host system to a significant impact on the host system by simply scaling up the number of units . The strength of island-based living is emphasized compared to urban settings where the power and energy flows may be less well defined .
A living lab with a focus on EV grid integrationSeveral other ongoing projects subject to real-life con-ditions aspire to becoming living labs . The project con-ducted by the Frederiksberg utility company (Frederiks-berg Forsyning) and its partners in conjunction with the Parker project [4; 19] focuses on scaling up the grid integration of EVs, while also demonstrating that EVs can actively support the grid by means of the positive business case that can be made for them [15] . The proj-
ect has tested V2G on an operational municipal fleet at Frederiksberg Forsyning (see Figure 8) . Apart from the normal daily driving service, the ten Nissan e-NV200’s have each been performing a hundred hours of V2G per week, returning 130,000 kWh to the grid since Septem-ber 6, 2016 (equivalent to 21 single-family households’ consumption per year) . The commercial test focuses on scaling-up, real grid support and daily operations, as well as the business aspects of when, how and how much to use the EVs for grid support . In the following, the project is described further .
As part of PowerLabDK, EVLab is being used to support the world’s first commercial trail, with V2G-enabled electric vehicles providing V2G . The pilot project was carried out at Frederiksberg Forsyning . The utility owns ten electric eNV200 vans, which are used by employees throughout the day to perform service and mainte-nance tasks in the neighbourhood . The other partners involved in the pilot are Nissan (EV manufacturer), Enel X (charging-point provider), NEAS (local DSO) and Nuvve (aggregator) . The pilot project has been connected to PowerLabDK through the Parker project [4;19] . The aim is to validate whether off-the-shelf Nissan electric vehicles can provide frequency containment reserves on market terms while satisfying the technical and regula-tory requirements . The use of V2G-enabled vehicles pro-viding an ancillary service in the market, and doing so in a field test at a company premises, is unique and allows novel research and development . DTU has collaborated with Nuvve to receive data directly from the pilot site and to receive measurements of consumption from the Frederiksberg Forsyning building and charging points .
the so-called ‘cooking peak’ (between 17 and 20 hours) . In fact, only 40% of EVs would charge at the same time every day, with a 3 .7 kW charge level . If an 11 kW charge is considered instead, the concurrency factor falls to 20%, although overall power increases three-fold due to the charging level [9] . The average distribution grid in Denmark would be able to handle a 50% EV scenario, though safety margins would be reduced . However, smart charging options can increase the hosting ca-pacity and thus avoid grid reinforcements [10;11] . By
comparing it with the average Danish scenario, a case study based on a living lab located on an island can be generalized to support and accelerate the understand-ing of urban scenarios . Thus the outcome of the work [9] on Test Zone Bornholm indicates that, at around 50%, EV penetration would not pose a serious threat, although some weak sections of the grid may experi-ence technical issues . In order to leverage the flexibility of the electric power demand introduced by the EVs in full, it is necessary to reinforce the local grids: that is,
Figure 6 . Map of Test Zone Bornholm, with power system and 60kV connection to Sweden
Figure 7 . Local power generation over the year and exchange via the cable to Sweden Figure 8 . Fleet of Nissan e-NV200’s set up at Frederiksberg Forsyning to service the power system (from [29])
Page 80 – Integrated energy systems and transportation electrification Integrated energy systems and transportation electrification – Page 81
DTU International Energy Report 2019 DTU International Energy Report 2019
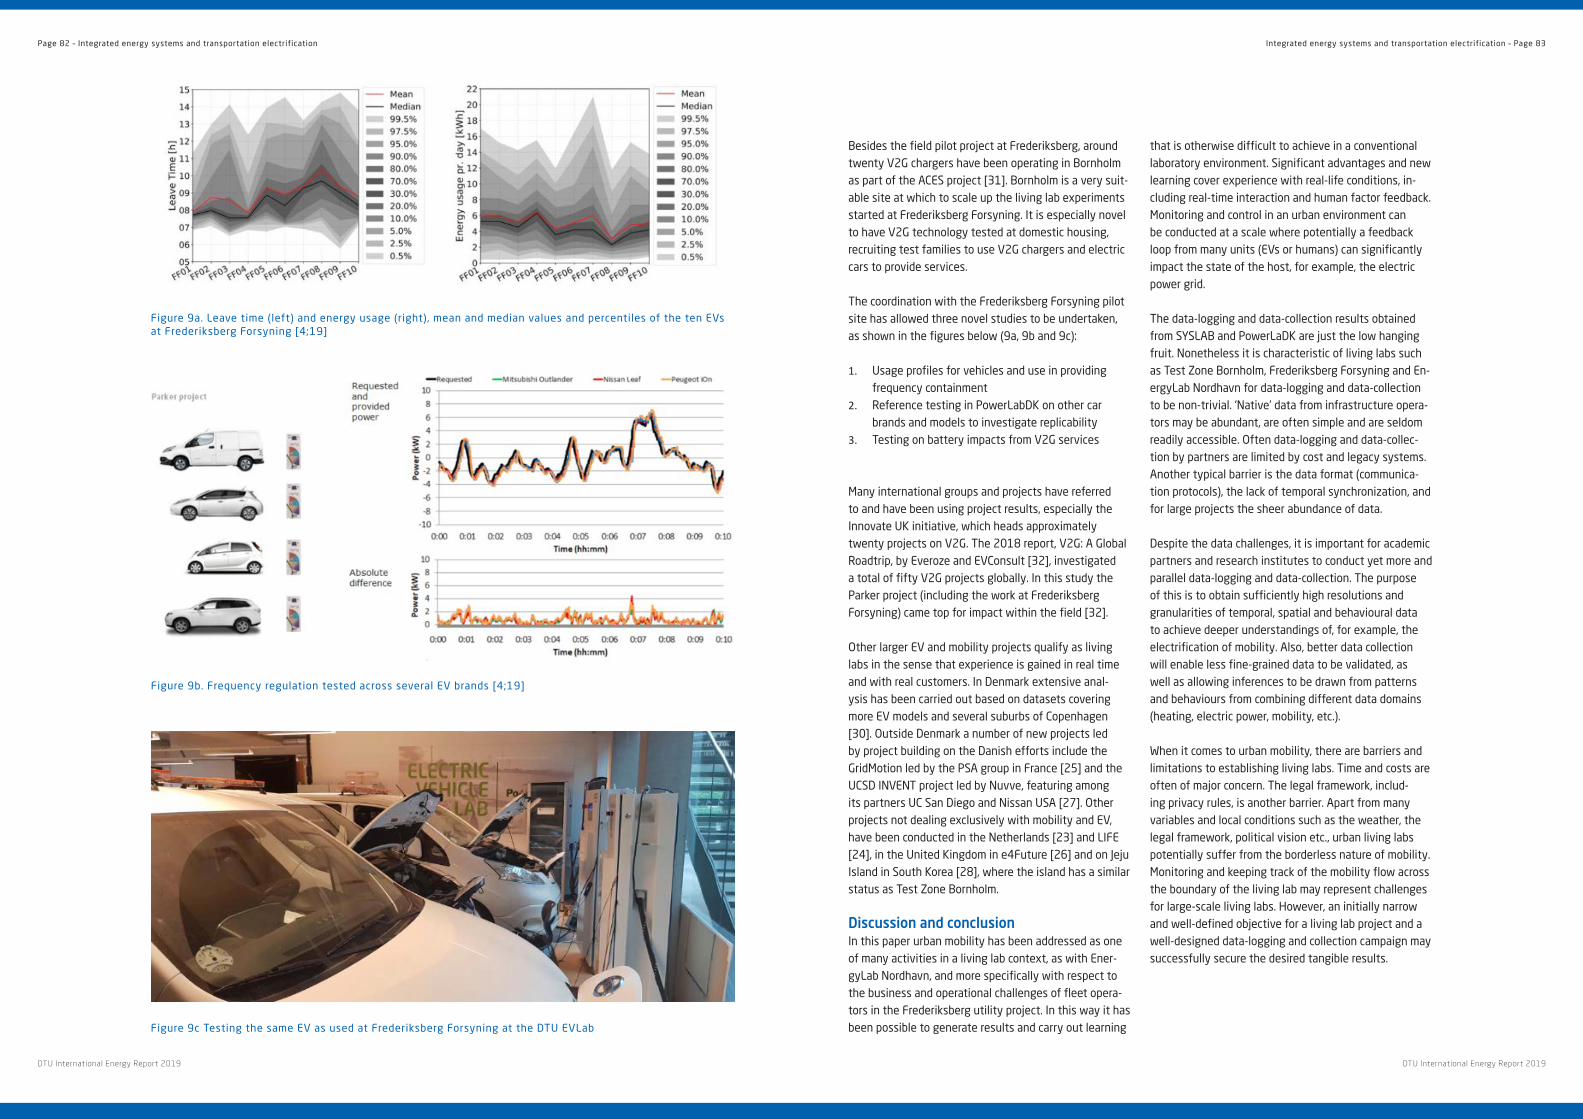
Besides the field pilot project at Frederiksberg, around twenty V2G chargers have been operating in Bornholm as part of the ACES project [31] . Bornholm is a very suit-able site at which to scale up the living lab experiments started at Frederiksberg Forsyning . It is especially novel to have V2G technology tested at domestic housing, recruiting test families to use V2G chargers and electric cars to provide services .
The coordination with the Frederiksberg Forsyning pilot site has allowed three novel studies to be undertaken, as shown in the figures below (9a, 9b and 9c):
1. Usage profiles for vehicles and use in providing frequency containment
2. Reference testing in PowerLabDK on other car brands and models to investigate replicability
3. Testing on battery impacts from V2G services
Many international groups and projects have referred to and have been using project results, especially the Innovate UK initiative, which heads approximately twenty projects on V2G . The 2018 report, V2G: A Global Roadtrip, by Everoze and EVConsult [32], investigated a total of fifty V2G projects globally . In this study the Parker project (including the work at Frederiksberg Forsyning) came top for impact within the field [32] .
Other larger EV and mobility projects qualify as living labs in the sense that experience is gained in real time and with real customers . In Denmark extensive anal-ysis has been carried out based on datasets covering more EV models and several suburbs of Copenhagen [30] . Outside Denmark a number of new projects led by project building on the Danish efforts include the GridMotion led by the PSA group in France [25] and the UCSD INVENT project led by Nuvve, featuring among its partners UC San Diego and Nissan USA [27] . Other projects not dealing exclusively with mobility and EV, have been conducted in the Netherlands [23] and LIFE [24], in the United Kingdom in e4Future [26] and on Jeju Island in South Korea [28], where the island has a similar status as Test Zone Bornholm .
Discussion and conclusionIn this paper urban mobility has been addressed as one of many activities in a living lab context, as with Ener-gyLab Nordhavn, and more specifically with respect to the business and operational challenges of fleet opera-tors in the Frederiksberg utility project . In this way it has been possible to generate results and carry out learning
that is otherwise difficult to achieve in a conventional laboratory environment . Significant advantages and new learning cover experience with real-life conditions, in-cluding real-time interaction and human factor feedback . Monitoring and control in an urban environment can be conducted at a scale where potentially a feedback loop from many units (EVs or humans) can significantly impact the state of the host, for example, the electric power grid .
The data-logging and data-collection results obtained from SYSLAB and PowerLaDK are just the low hanging fruit . Nonetheless it is characteristic of living labs such as Test Zone Bornholm, Frederiksberg Forsyning and En-ergyLab Nordhavn for data-logging and data-collection to be non-trivial . ‘Native’ data from infrastructure opera-tors may be abundant, are often simple and are seldom readily accessible . Often data-logging and data-collec-tion by partners are limited by cost and legacy systems . Another typical barrier is the data format (communica-tion protocols), the lack of temporal synchronization, and for large projects the sheer abundance of data .
Despite the data challenges, it is important for academic partners and research institutes to conduct yet more and parallel data-logging and data-collection . The purpose of this is to obtain sufficiently high resolutions and granularities of temporal, spatial and behavioural data to achieve deeper understandings of, for example, the electrification of mobility . Also, better data collection will enable less fine-grained data to be validated, as well as allowing inferences to be drawn from patterns and behaviours from combining different data domains (heating, electric power, mobility, etc .) .
When it comes to urban mobility, there are barriers and limitations to establishing living labs . Time and costs are often of major concern . The legal framework, includ-ing privacy rules, is another barrier . Apart from many variables and local conditions such as the weather, the legal framework, political vision etc ., urban living labs potentially suffer from the borderless nature of mobility . Monitoring and keeping track of the mobility flow across the boundary of the living lab may represent challenges for large-scale living labs . However, an initially narrow and well-defined objective for a living lab project and a well-designed data-logging and collection campaign may successfully secure the desired tangible results .
Figure 9a . Leave time (left) and energy usage (right), mean and median values and percentiles of the ten EVs at Frederiksberg Forsyning [4;19]
Figure 9b . Frequency regulation tested across several EV brands [4;19]
Figure 9c Testing the same EV as used at Frederiksberg Forsyning at the DTU EVLab
Page 82 – Integrated energy systems and transportation electrification Integrated energy systems and transportation electrification – Page 83
DTU International Energy Report 2019 DTU International Energy Report 2019
References1 . Final Report on the August 14, 2003 Blackout in the United States and Canada: Causes and Recommendations, U .S .-Canada
Power System Outage Task Force, 2004
2 . Final Report System Disturbance on 4 November 2006, union for the co-ordination of transmission of electricity, 2007
3 . Smart Distribution Grids Power Europe’s Transition to Green Energy, Danish Energy Agency, EnerginetDK, State of Green, 2017,
p 24 .
4 . PARKER project “The project core story and the relevant facts”, facts sheet, 2018
5 . SYSLAB, http://www .powerlab .dk/Facilities/SysLab (accessed 2019-07-09 at 12:27 CET), 2019
6 . M . Marinelli, “The ACES Project - Large-scale Integration of Electric Vehicles into the Electric Power System,” in: C . Melero, K .
Mølhave (Eds .), Sustain Conference 2018: Creating Technology for a Sustainable Society, Lyngby, Denmark: Technical University
of Denmark (DTU), 2018 E-6 .
7 . A . González-Garrido, A . Thingvad, H . Gaztañaga, M . Marinelli, “Full-Scale Electric Vehicles Penetration in the Danish Island of
Bornholm – Optimal Scheduling and Battery Degradation under Driving Constraints,” Journal of Energy Storage, vol . 23, pp . 381-
391, June 2019 .
8 . A . Zecchino, A . M . Prostejovsky, C . Ziras, M . Marinelli, “Large-scale Provision of Frequency Control via V2G: the Bornholm Power
System Case,” Electric power system research, vol . 170, pp . 25-34, May 2019 .
9 . L . Calearo, A . Thingvad, K . Suzuki, M . Marinelli, “Grid Loading due to EV Charging Profiles Based on Pseudo-Real Driving Pattern
and User Behaviour,” Transportation Electrification, IEEE Transactions on, in press .
10 . A . Gadea, M . Marinelli, A . Zecchino, “A Market Framework for Enabling Electric Vehicles Flexibility Procurement at the
Distribution Level Considering Grid Constraints,” 20th Power System Computation Conference (PSCC), Dublin, 11-15 Jun . 2018 .
11 . K . Knezovi⁰, M . Marinelli, A . Zecchino, P . B . Andersen, C . Træholt, “Supporting involvement of electric vehicles in distribution
grids: Lowering the barriers for a proactive integration,” Energy, vol . 134, 2017 .
12 . Results posters of EnergyLab Nordhavn, Showroom 2019 .
13 . Public deliverables D7 .2 EV Car Share & D7 .3 Charging Facilities form the living lab project EnergyLab Nordhavn, Nerve Smart
Systems Aps, 2019 .
14 . Gjelaj, Marjan, PhD thesis, 2019 .
15 . Jensen, Rikke Høm; “Electric Vehicles ready to stabilize grid and help green transition”, about the PARKER project and
Frederiksberg Forsyning, https://www .dtu .dk/english/news/nyhed?id=d3f2679e-d333-4b7e-8278-51b6d8cd934c (link
accessed 2019-07-09 at 10:13 CET), Nov . 2018 .
16 . “Elbilerne kommer – det er et politisk valg, hvordan vi sikrer at elnettet bliver klart”, report, Dansk Energi, 2019 .
17 . “Er elnettet klar til elbilerne? – Analyse af effekt- og investeringsbehov i eldistributionsnettet”, report, Dansk Energi, 2019 .
18 . Engel, Hauke; Hensley, Russell; Knupfer, Stefan; Sahdev, Shivika; “The potential impact of electric vehicles on global energy
systems”, report, McKinsey Center for Future Mobility, 2018 .
19 . PARKER project, https://parker-project .com/#about (link accessed 2019-07-09 at 10:21 CET), 2018 .
20 . GreenLab Skive, http://www .greenlabskive .dk/ (link accessed 2019-07-09 at 10:38 CET), 2019 .
21 . Digital EnergyLab, http://www .powerlab .dk/facilities/digitalenergylab (link accessed 2019-07-09 at 12:30 CET), 2019 .
22 . Aspern smart city Research, https://www .ascr .at/en/ (accessed 2019-07-09 at 10:46 CET), 2019 .
23 . We are Holland, a pilot area ready to market e-mobility, leaflet, 2013 .
24 . Van Casteren, Maarten; “LIFE – E-mobility 3 cities NL – Boosting Electromobility Amsterdam - Rotterdam - Utrecht”, LIFE11 ENV/
NL/000793, 2016 .
25 . GridMotion, https://media .groupe-psa .com/en/gridmotion-project-reducing-electric-vehicle-usage-cost-thanks-smart-charging-
process (accessed 2019-07-09 at 11:45 CET), PSA group homepage, 2017 .
26 . e4Future, https://parker-project .com/wp-content/uploads/2018/12/VGI-Summit-Day-2-S2-Projects-V2G-NU-activities_MN .pdf
(accessed 2019-07-09 at 11:35 CET), Newcastle University at the PARKER project end seminar, 2018 .
27 . UCSD INVENT, https://nuvve .com/projects/ucsd-invent/, (accessed 2019-07-09 at 12:07 CET), Nuvve homepage 2019
28 . Baatarbileg, Ankhzaya; Otgongerel, Zulmandakh; Lee, Gae-Myoung; ” Recent status of electric vehicle charging infrastructure in
Jeju Island”, ITEC-ap2019 IEEE conference, Jeju Island, 2019 .
29 . A flagship for green energy transformation, https://nuvve .com/2019/07/09/frederiksberg-forsyning-1/, (accessed 2019-07-09
at 11:58 CET)
30 . Paulsen, Mads; Jensen, Anders Fjendbo; ”Analyser af elbilers driftsøkonomi”, Danish report on operational economy of EVs,
2017 . Also presented in proceedings form the Annual Transport Conference, Aalborg University), ISSN 1603-9696, 2018 and
in “Slutrapport – Analyse af Elbilers Driftsøkonomi” J . nr . 33062-0141, Region Hovedstaden, 2018 .
31 . ACES project: https://sites .google .com/view/aces-bornholm
32 . Report by EVConsult 2018: https://www .evconsult .nl/en/v2g-a-global-roadtrip/
Page 84 – Integrated energy systems and transportation electrification Integrated energy systems and transportation electrification – Page 85
DTU International Energy Report 2019 DTU International Energy Report 2019
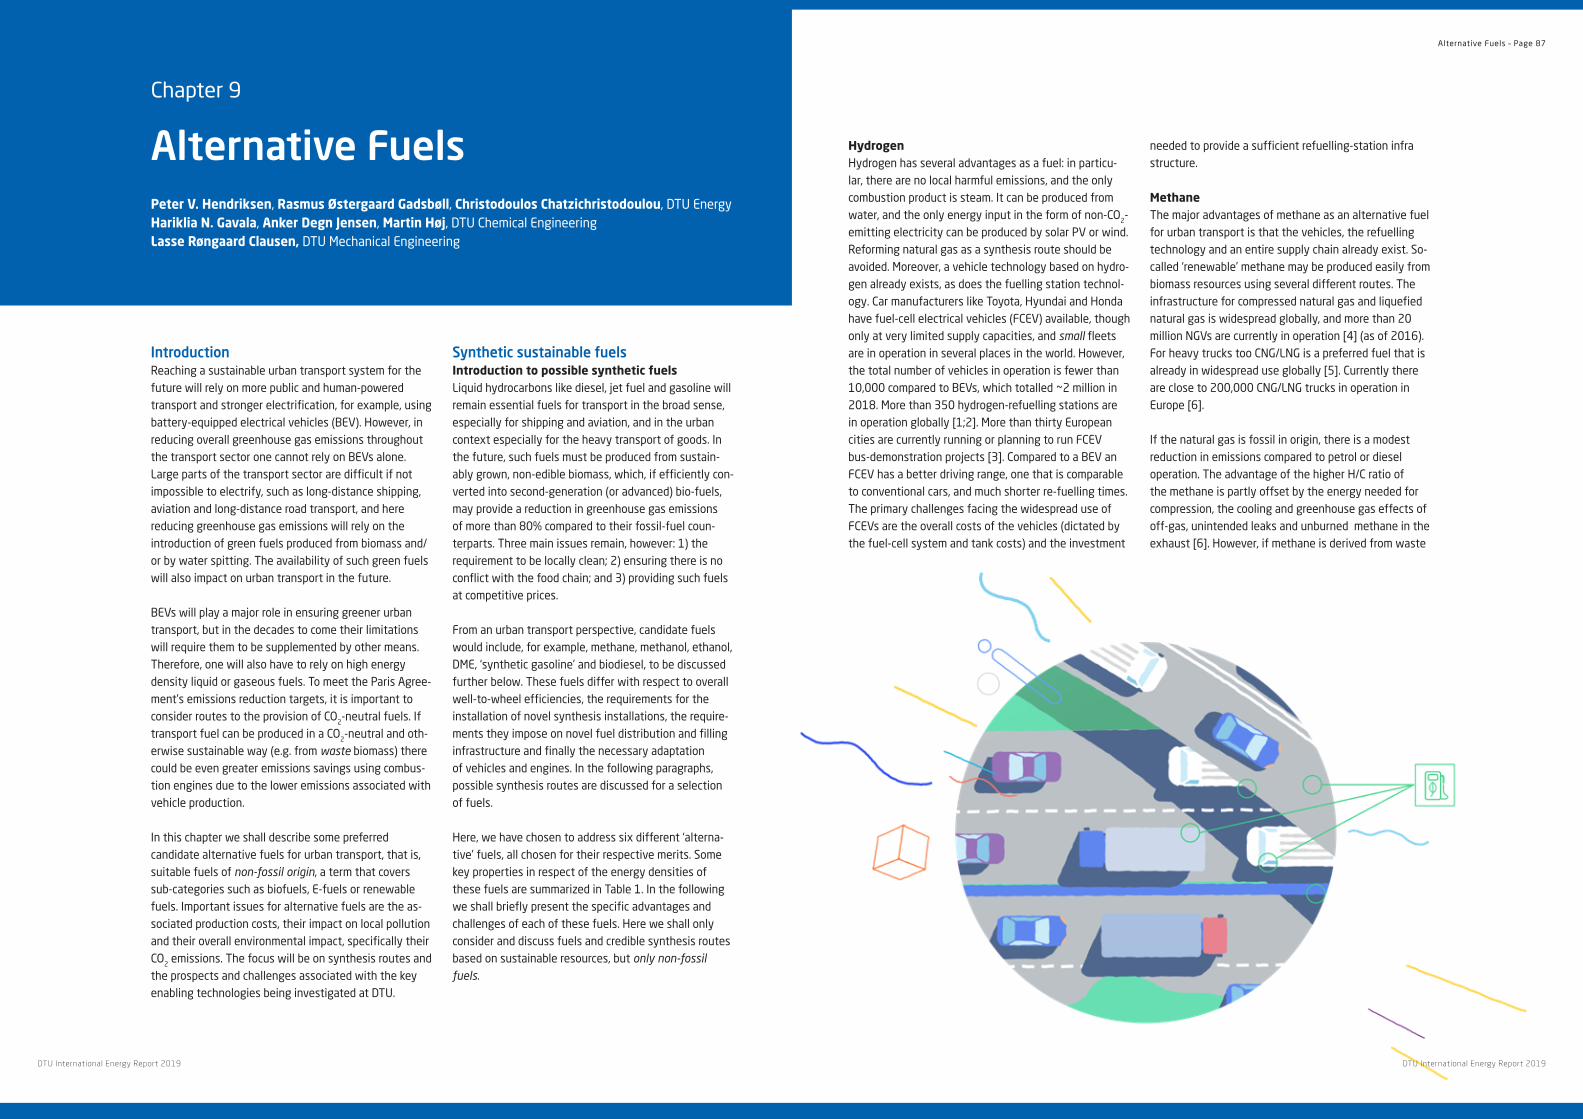
Hydrogen Hydrogen has several advantages as a fuel: in particu-lar, there are no local harmful emissions, and the only combustion product is steam . It can be produced from water, and the only energy input in the form of non-CO2-emitting electricity can be produced by solar PV or wind . Reforming natural gas as a synthesis route should be avoided . Moreover, a vehicle technology based on hydro-gen already exists, as does the fuelling station technol-ogy . Car manufacturers like Toyota, Hyundai and Honda have fuel-cell electrical vehicles (FCEV) available, though only at very limited supply capacities, and small fleets are in operation in several places in the world . However, the total number of vehicles in operation is fewer than 10,000 compared to BEVs, which totalled ~2 million in 2018 . More than 350 hydrogen-refuelling stations are in operation globally [1;2] . More than thirty European cities are currently running or planning to run FCEV bus-demonstration projects [3] . Compared to a BEV an FCEV has a better driving range, one that is comparable to conventional cars, and much shorter re-fuelling times . The primary challenges facing the widespread use of FCEVs are the overall costs of the vehicles (dictated by the fuel-cell system and tank costs) and the investment
needed to provide a sufficient refuelling-station infra structure .
Methane The major advantages of methane as an alternative fuel for urban transport is that the vehicles, the refuelling technology and an entire supply chain already exist . So-called ‘renewable’ methane may be produced easily from biomass resources using several different routes . The infrastructure for compressed natural gas and liquefied natural gas is widespread globally, and more than 20 million NGVs are currently in operation [4] (as of 2016) . For heavy trucks too CNG/LNG is a preferred fuel that is already in widespread use globally [5] . Currently there are close to 200,000 CNG/LNG trucks in operation in Europe [6] .
If the natural gas is fossil in origin, there is a modest reduction in emissions compared to petrol or diesel operation . The advantage of the higher H/C ratio of the methane is partly offset by the energy needed for compression, the cooling and greenhouse gas effects of off-gas, unintended leaks and unburned methane in the exhaust [6] . However, if methane is derived from waste
Introduction Reaching a sustainable urban transport system for the future will rely on more public and human-powered transport and stronger electrification, for example, using battery-equipped electrical vehicles (BEV) . However, in reducing overall greenhouse gas emissions throughout the transport sector one cannot rely on BEVs alone . Large parts of the transport sector are difficult if not impossible to electrify, such as long-distance shipping, aviation and long-distance road transport, and here reducing greenhouse gas emissions will rely on the introduction of green fuels produced from biomass and/or by water spitting . The availability of such green fuels will also impact on urban transport in the future .
BEVs will play a major role in ensuring greener urban transport, but in the decades to come their limitations will require them to be supplemented by other means . Therefore, one will also have to rely on high energy density liquid or gaseous fuels . To meet the Paris Agree-ment’s emissions reduction targets, it is important to consider routes to the provision of CO2-neutral fuels . If transport fuel can be produced in a CO2-neutral and oth-erwise sustainable way (e .g . from waste biomass) there could be even greater emissions savings using combus-tion engines due to the lower emissions associated with vehicle production .
In this chapter we shall describe some preferred candidate alternative fuels for urban transport, that is, suitable fuels of non-fossil origin, a term that covers sub-categories such as biofuels, E-fuels or renewable fuels . Important issues for alternative fuels are the as-sociated production costs, their impact on local pollution and their overall environmental impact, specifically their CO2 emissions . The focus will be on synthesis routes and the prospects and challenges associated with the key enabling technologies being investigated at DTU .
Synthetic sustainable fuelsIntroduction to possible synthetic fuels Liquid hydrocarbons like diesel, jet fuel and gasoline will remain essential fuels for transport in the broad sense, especially for shipping and aviation, and in the urban context especially for the heavy transport of goods . In the future, such fuels must be produced from sustain-ably grown, non-edible biomass, which, if efficiently con-verted into second-generation (or advanced) bio-fuels, may provide a reduction in greenhouse gas emissions of more than 80% compared to their fossil-fuel coun-terparts . Three main issues remain, however: 1) the requirement to be locally clean; 2) ensuring there is no conflict with the food chain; and 3) providing such fuels at competitive prices .
From an urban transport perspective, candidate fuels would include, for example, methane, methanol, ethanol, DME, ‘synthetic gasoline’ and biodiesel, to be discussed further below . These fuels differ with respect to overall well-to-wheel efficiencies, the requirements for the installation of novel synthesis installations, the require-ments they impose on novel fuel distribution and filling infrastructure and finally the necessary adaptation of vehicles and engines . In the following paragraphs, possible synthesis routes are discussed for a selection of fuels .
Here, we have chosen to address six different ‘alterna-tive’ fuels, all chosen for their respective merits . Some key properties in respect of the energy densities of these fuels are summarized in Table 1 . In the following we shall briefly present the specific advantages and challenges of each of these fuels . Here we shall only consider and discuss fuels and credible synthesis routes based on sustainable resources, but only non-fossil fuels .
Chapter 9
Alternative FuelsPeter V. Hendriksen, Rasmus Østergaard Gadsbøll, Christodoulos Chatzichristodoulou, DTU Energy Hariklia N. Gavala, Anker Degn Jensen, Martin Høj, DTU Chemical Engineering Lasse Røngaard Clausen, DTU Mechanical Engineering
Alternative Fuels – Page 87
DTU International Energy Report 2019 DTU International Energy Report 2019

ethanol mixture (global cumulative sales exceed 25 mil-lion) . Hence, the vehicle technology for ethanol exists, and delivery chains and fuel infrastructure are partly in place . Some criticisms have been raised against ethanol as a transport fuel, mostly because of the impacts of the most widespread synthesis routes currently (first-gen-eration bio-ethanol), which use sugars and starch from corn or sugarcane . If synthesized via this route, pro-duction of this fuel is in direct competition with food production by means of crops and land use, which could render it unsustainable one a massive scale [12] . Such concerns have led the EU to strengthen its requirements regarding blend-in for biofuels [13] .
DME Dimethyl ether is a compound that, given its combus-tion properties, could replace diesel in future transport systems . It may be synthesized via methanol or directly from syngas (a mixture of mainly H2 and CO) which could be derived from lignocellulosic biomass, and it could thus be a sustainable fuel with respect to CO2 emissions . Projects based on fully renewable routes to DME have recently been launched in the US [14] . Its refuelling technology has been proven, and small truck fleet demonstrations have reached >500,000 km [15;16] . DME is a gas at ambient pressure and room temperature and requires a mild over-pressure of 5-8 bar (or cooling to below <-25 oC) to ensure high on-board fuel density (see Table 1) .
Synthetic dieselUsing a sequence of catalytic chemical reactions (so-called Fischer-Tropsch reactions), one can also make higher alkanes from synthesis gas . Conditions can be tuned to providing liquid-fuel mixtures with properties close to diesel or petrol . Huge plants exist in Malaysia and Qatar producing petroleum and diesel from natural gas, and recently plants producing diesel from bio-mass-derived synthesis gas have started operation in Finland [17] .
Possible fuels and their physical properties Some of the key properties of liquid and gaseous trans-port fuels for FCEVs and combustion engines are listed in Table 1 below .
For comparison the energy density of a Li-ion battery has been included in the table . The reduced energy den-sity of CNG and methanol (by a factor of 2-3) compared to petrol can be compensated for by larger tank volumes . For hydrogen a benefit is the improved efficiency (by a factor of 2) of the FCEV compared to conventional en-gines . For batteries the huge drop in energy content that can practically be carried on board is only partly com-pensated by the higher (by a factor of 3-4) drive-train efficiency, leading to reduced driving ranges for BEVs .
General requirements for future sustainable fuels (urban perspective) The combustion of fuels in vehicle engines inevitably leads to the formation of harmful compounds such as NOx (NO and NO2), unburned hydrocarbons and carbona-ceous particulates [18], and the transport sector contrib-utes significantly to their emission [19] . To reduce emis-sions, increasingly strict legislation is being imposed on vehicles in most parts of the world . As an example, Table 2 shows the legislative evolution with which new heavy-duty diesel vehicles must comply Europe . Comply-ing with the regulations is achieved mainly by equipping the vehicle itself with flue-gas after-treatment systems . For petrol-driven vehicles, the three-way catalyst (TWC) efficiently reduces emissions of NOx, CO and hydrocar-bons [20], while particulate emissions can be reduced by 60-90 % using a filter [21] . Diesel-engine exhaust after-treatment comprises a series of catalytic units and a filter [22] . Since the exhaust gas is oxygen-lean, a reductant (typically urea) is used to reduce NOx to N2, while an ammonia slip catalyst removes surplus NH3 . The resulting flue gas emitted into the environment is a very clean gas, as indicated in Table 2 .
In addition to the harmful compounds listed in Table 2, a significant future focus will be on zero and low CO2 emis-
biomass (referred to as RNG) or obtained via the Sa-batier route, which involves carbon capture and re-use, stronger reductions in greenhouse gas emissions will be obtained compared to fossil fuels . Due to the ease of synthesis, the already existing fuel-supply chains and vehicle fleets, SNG (or RNG, bio-derived methane) can be an important alternative fuel for future urban transport .
MethanolThe advantages of methanol as an alternative fuel for urban transport are that it is readily synthesized from renewable resources and that it has proven engine technology . In China large vehicle fleets are currently running on fuel blends of 15% of methanol mixed with petrol . Operating on fuel mixtures with up to 85% of methanol has been shown to be perfectly feasible from a technical point of view, with only modest changes to the vehicle . However, early proof-of-concept initiatives during the 1980s and 1990s did not lead to global com-mercial success, and methanol has been overshadowed
by ethanol as the preferred alcohol blend-in fuel globally . However, there are indications from China and India that methanol is being given a second chance [7;8;9] .
Methanol has a lower volumetric energy density than petrol (see Table 1) but can to a large extent re-utilize existing fuel infrastructure routes . It has a large poten-tial to become an important transport fuel in future due to its several advantages, such as its ease of synthesis from biomass, its relatively high on-board power density and the modest cost of refurbishing fuelling-station infrastructure and supply chains for it [10] . The role of methanol as a flexible energy carrier was proposed early by Olah et al . [11] .
EthanolEthanol is today widely used as a blend-in fuel in low concentrations (15%) in many parts of the world . In some regions, notably Brazil, there are large fleets of fuel-flexible vehicles that can operate on any gasoline/
FTD = Fischer-Tropsch Diesel, RME = ~ Rape seed oil methyl ester, DME = ~Dimethyl ether . *E85 (85% ethanol in gasoline)
Energy con-tent (LHV)
Density Energy density
Energy density
(practical)
Remarks Composition Boiling point Tank-to-wheel
efficiency
(MJ/kg) (kg/m3) MJ/l MJ/l (°C) %
Gasoline 42.7 740 31 .6 C5H12,...C8H18.
0-210 15-20
Diesel 43 .1 820 35 .3 ”C12H24” 180-360 20-24
FTD 44 780 34 .3 ”C12H24” 180-320 20-25
Ethanol 28 .4 790 22 .5 C2H6O 78 -
Methanol 19 .5 790 15 .4 CH4O 65 20-25
RME 37 .5 880 33 .0 78%C, 12%H, 10%O
380 -
DME 28 .4 668 19 .0 19 .0 > 6 bar or < -25 oC
C2H6O -25 20-25
Methane 50 0 .81 0 .04 10 .8 250 bar CH4 -162 15-25
Hydrogen 120 0 .081 0 .01 4 .8 700 bar H2 -253 39-45
Formic acid 5.3 1200 6 CH2O2 100 -Ammonia 18.6 0.77 0 .01 12 .7 >10 bar,
<-34 oCNH3 -33 -
Li-ion bat. 0 .4-0 .9 1-2 68-73%
Table 2 . EU steady-state emissions standards for heavy-duty diesel engines [24]
Stage Year introduced
Test cycle CO g/kWh HC g/kWh NOx g/kWh Particulate matter g/kWh
Particulate number #/kWh
Euro I 1992 ECE R-49 4 .5 1 .1 8 .0 0 .612 -
Euro 6 2013 WHSC 1 .5 0 .13 0 .4 0 .010 8∙1011
Table 1 . Characteristic energy densities of a range of candidate fuels for urban transport . Column 4 gives the energy density under ambient conditions (liquid or gaseous state) . For gaseous fuels (ambient conditions) that will be liquefied or compressed for on board storage the achievable density is given in column 5 and the conditions required in column 6 .
Page 88 – Alternative Fuels Alternative Fuels – Page 89
DTU International Energy Report 2019 DTU International Energy Report 2019

trial processes, some as a product of the combustion of sustainable carbon, while others are, or will become, a ‘necessity’ in industry . The former includes CO2 captured from electrical power-plant flue gases (biomass fired or from ‘renewable’ CH4), the latter emissions from cement calcination, fermentation products etc . Such locally con-centrated sources are likely to be economically attractive compared to direct CO2 capture from the air, which, using today’s technology, is very expensive [26] .
Common to all the fuels presented here1, except hydro-gen, is the fact that they are carbon-based . For them to play a significant role in the future, therefore, the source of carbon must be sustainable . A complete sustainabil-ity assessment of possible sources of carbon would be complex and will not be attempted here . Here we focus primarily on biomass as a carbon source, which, under certain requirements, can be sustainable .
As biomass stems from the uptake of atmospheric CO2, the overall carbon flow when combusting it is conceptu-ally CO2-neutral . However, central challenges arise from the global, long-term perspective with regard to, for example, land-use changes and ecosystem management . Some of these concerns about the full-value chain have been addressed in an LCA study of a straw-fired LTCFB gasifier that found that 14-20% of the carbon inputted into the system should be returned to agricultural soils as biochar if the process overall is to be CO2-neutral [27] .
More than half of the biomass currently used for energy purposes globally is fuel wood [28 ], and while forests can be mismanaged and driven unsustainably, forests managed properly and sustainably can provide CO2-neu-tral biomass for energy production [29;30] . Sustainable forestry provides valuable, high-quality stemwood for timber production, and lower-quality wood from residues and thinning products (products related to the density of the forests and crop-rotation principles, such as branches and short-term wood production) that can be used for energy production . Considering an entire well-managed, sustainable forest as a control volume, a certain amount of biomass will be extracted, while a similar amount of biomass will be grown, hence balancing the carbon flows in and out of the system . With the balance in place a few percentages points of the total amount of biomass
1 The reason for focusing on hydro-carbons here is that these are immediately and directly applicable with today’s fuel infrastructure (gas stations) and vehicle technology . Hydrogen requires additional gas-station infrastructure, but the technology exists, as do fuel-cell vehicles . Other interesting ‘mediators’ or ‘transport compounds’ for hydrogen distribution, such as ammonia, has a number of advantages and a huge potential for ship propulsion, but they are unlikely to play a major role in urban transport in the coming decades .
can be extracted yearly, which constitutes a significant energy resource . As touched upon in the paragraph above with regards to straw utilization, it is therefore necessary to be aware of the sustainability risks associ-ated with the use of all biomasses wherever they might originate from . When this is done, biomass is a good flexible renewable CO2 neutral source for energy produc-tion . Especially, waste streams and biomass streams like straw and forestry products, that you have to handle/collect anyway to extract more valuable resources; here the grains and the timber, are attractive for use in the energy sector .
Hydrogen is a special case . It is dealt with in its own right as a transport fuel, but it also represents a valuable addition (see Figure 1) to some hydro-carbon-based fuel-production processes . For the biochemical routes Hydrogen addition may increase the output product yield and similarly for the thermo-chemical routes Hy-drogen may be added to adjust the H/C ratio in the feed to match that of the targeted fuel product . Without the extra hydrogen, one cannot convert all the carbon in the feed to the desired product . From a sustainability point of view, therefore, this addition is essential .
Synthetic fuels for the transport sector should, with a view to their overall sustainability, be produced without infringing on crop land for food production . They should therefore be based primarily on waste biomass and should have a high degree of carbon efficiency overall . If point sources of carbon (from the chemical industry) or of CO2 obtained from air capture are considered further, fuels can be produced without impacting on overall global food production . Common to all the routes to synthetic fuels that have been discussed are that the fuels will be more costly than if they are obtained from fossil-fuel resources . In a detailed study of the cost of producing methanol from biomass through the addition of hydrogen from steam-splitting, a break-even situation with fossil fuels was predicted to require an oil price of 120 US$/barrel [31] . Hence, the routes and options dis-cussed here will only be realized if consumers are willing to pay more, economic incentive structures are brought about politically, or legislation is passed ensuring consis-tency with national emissions reduction targets .
sion vehicles . The EU is aiming at a truck-fleet average CO2 reduction of 30% by 2030 [23] .
Imposing a requirement to comply with such limits on emissions, combined with gradual fleet replacement, is thus a technically simple way of improving air quality in mega-cities . To meet overall greenhouse gas emissions reductions targets, however, liquid fuels should gradu-ally be replaced with sustainable bio-derived fuels .
Possible routes and challenges in the production of the fuels of the futureNon-edible biomass such as wood, straw and other agricultural waste consists mainly of lignin, cellulose and hemicellulose, together called lignocellulose, and minor amounts of other organic structures and inorganic ash . Traditionally, conversion of lignocellulose to liquid fuels follows either thermochemical or biochemical routes, but synergistic routes also exist . The main thermochemical routes from biomass to liquid fuels are illustrated in the upper part of Figure 1, and selected biochemical routes are shown in the lower part ( ‘hydrolysis and fermenta-tion’ and ‘anaerobic digestion’) . Considering the purely thermochemical routes, dry forms of biomass like wood, straw and other agricultural residues may undergo either high-temperature gasification or fast pyrolysis at
moderate temperatures . These two routes for converting biomass into transport fuels are described further below .
Several biochemical routes for the conversion of biomass feed stocks into gasses and liquid fuels also exist (e .g . ‘hydrolysis and fermentation’ and ‘anaerobic digestion’; see Figure 1) . The technology for the biological produc-tion of methane by anaerobic digestion is well-estab-lished . Together with suitable waste pre-treatments it can accommodate lignocellulosic forms of biomass, numerous industrial and agro-industrial effluents that are rich in organic content, sludges from wastewater treatment, plants and animal manure . Besides different types of lignocellulosic biomass, algal biomass has at-tracted increased interest as a sustainable feedstock for fermentation routes . Algal biomass grows more rapidly compared to many terrestrial crops and is not in direct competition with food crops for land [25] . However, as the composition and structure of algal biomass differs from those of lignocellulosic feedstocks, methods and processes developed for the latter cannot be applied to it directly: more research on microbial strains and process development is needed .
Besides biomass, other sources of carbon for future fuel production include CO2 captured from selected indus-
Lignocellulose
Gasification
Pyrolysis
Syn-gas
Pyrolysis oil
MeOH
Fisher-Tropsch
Hydrotreat
Hydrocarbons
MeOH
Hydrocarbons
MTG Hydrocarbons
HTL Bio crude
Fermentation
Methanation
CH4
Alcohols
Pretreatment
Hydrolysis & fermentation
Alcohols
Anaerobic digestion CH4
Reductive fractionation Aromatics
Organic waste/wastewater
Oils
Flue gas CO2
Catalytic hydropyrolysis Hydrocarbons
CH4
Hydrogen
Figure 1 . Main routes from lignocellulosic biomass, liquid organic waste and industrial flue gases to liquid and gaseous fuels suitable for the transport sector . The conversion processes are illustrated in the rectangles, while the rounded shapes indicate compounds or other substances . HTL: hydrothermal liquefaction, MeOH: methanol (synthesis), MTG: methanol to gasoline
Page 90 – Alternative Fuels Alternative Fuels – Page 91
DTU International Energy Report 2019 DTU International Energy Report 2019
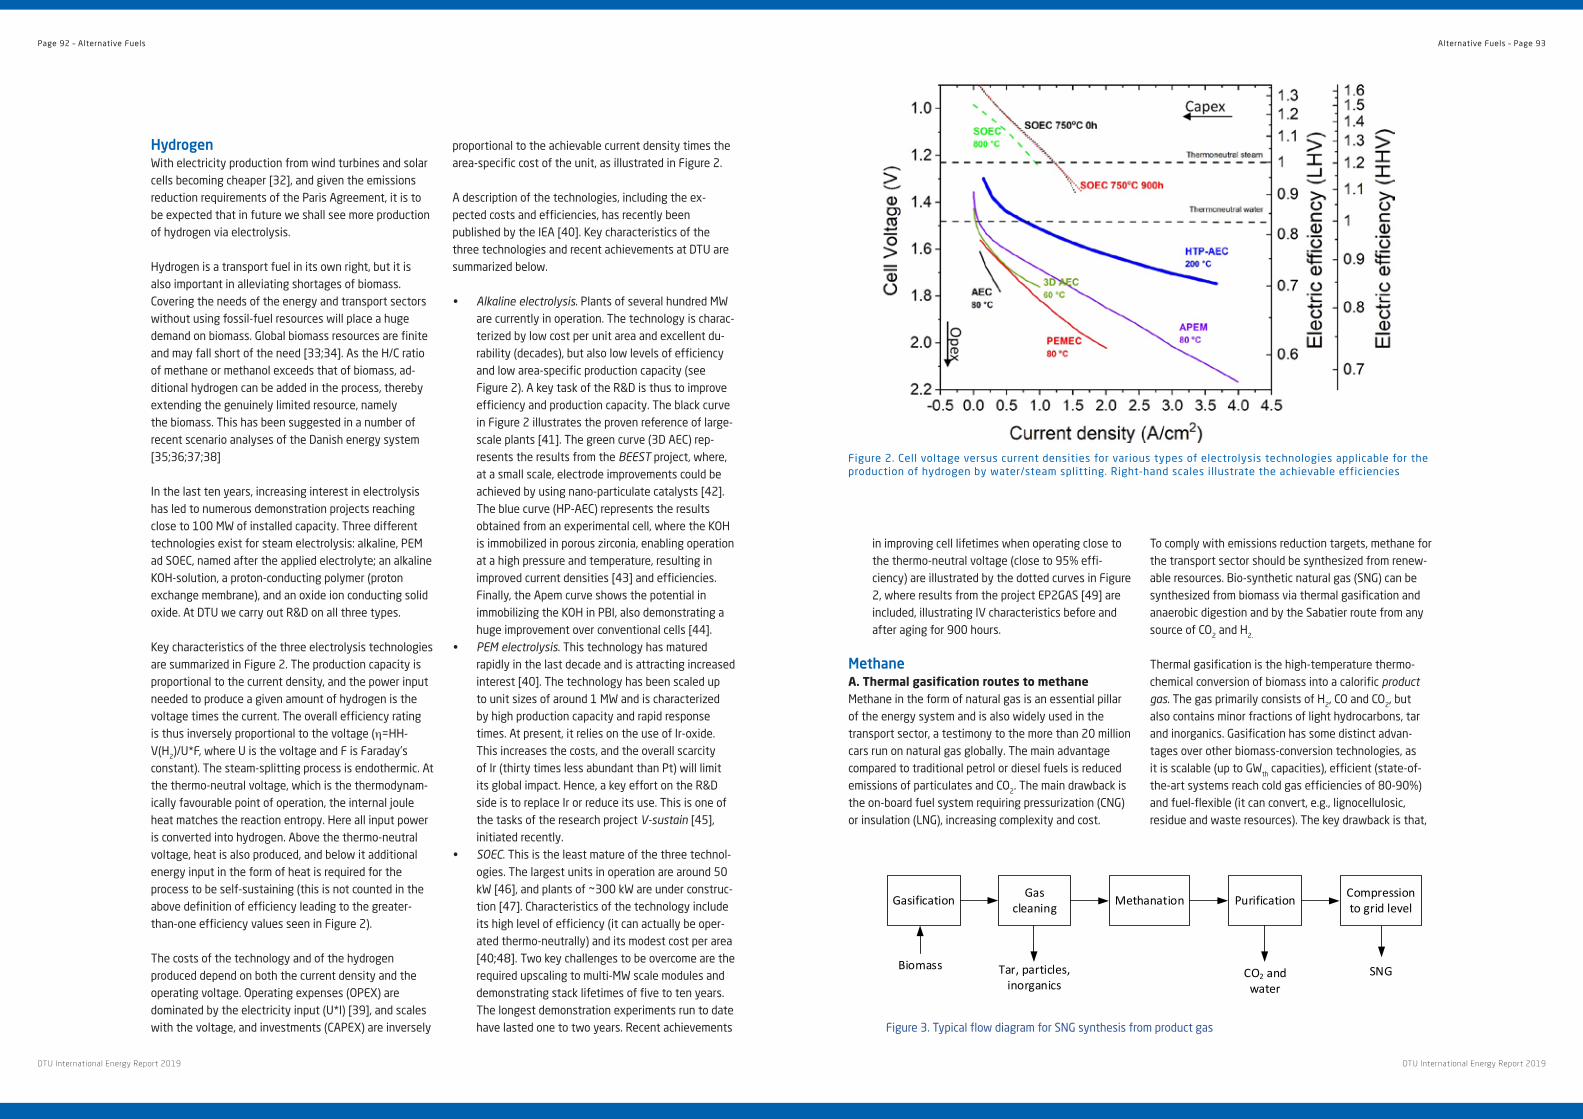
in improving cell lifetimes when operating close to the thermo-neutral voltage (close to 95% effi-ciency) are illustrated by the dotted curves in Figure 2, where results from the project EP2GAS [49] are included, illustrating IV characteristics before and after aging for 900 hours .
Methane A. Thermal gasification routes to methane Methane in the form of natural gas is an essential pillar of the energy system and is also widely used in the transport sector, a testimony to the more than 20 million cars run on natural gas globally . The main advantage compared to traditional petrol or diesel fuels is reduced emissions of particulates and CO2 . The main drawback is the on-board fuel system requiring pressurization (CNG) or insulation (LNG), increasing complexity and cost .
To comply with emissions reduction targets, methane for the transport sector should be synthesized from renew-able resources . Bio-synthetic natural gas (SNG) can be synthesized from biomass via thermal gasification and anaerobic digestion and by the Sabatier route from any source of CO2 and H2 .
Thermal gasification is the high-temperature thermo-chemical conversion of biomass into a calorific product gas . The gas primarily consists of H2, CO and CO2, but also contains minor fractions of light hydrocarbons, tar and inorganics . Gasification has some distinct advan-tages over other biomass-conversion technologies, as it is scalable (up to GWth capacities), efficient (state-of-the-art systems reach cold gas efficiencies of 80-90%) and fuel-flexible (it can convert, e .g ., lignocellulosic, residue and waste resources) . The key drawback is that,
Hydrogen With electricity production from wind turbines and solar cells becoming cheaper [32], and given the emissions reduction requirements of the Paris Agreement, it is to be expected that in future we shall see more production of hydrogen via electrolysis .
Hydrogen is a transport fuel in its own right, but it is also important in alleviating shortages of biomass . Covering the needs of the energy and transport sectors without using fossil-fuel resources will place a huge demand on biomass . Global biomass resources are finite and may fall short of the need [33;34] . As the H/C ratio of methane or methanol exceeds that of biomass, ad-ditional hydrogen can be added in the process, thereby extending the genuinely limited resource, namely the biomass . This has been suggested in a number of recent scenario analyses of the Danish energy system [35;36;37;38]
In the last ten years, increasing interest in electrolysis has led to numerous demonstration projects reaching close to 100 MW of installed capacity . Three different technologies exist for steam electrolysis: alkaline, PEM ad SOEC, named after the applied electrolyte; an alkaline KOH-solution, a proton-conducting polymer (proton exchange membrane), and an oxide ion conducting solid oxide . At DTU we carry out R&D on all three types .
Key characteristics of the three electrolysis technologies are summarized in Figure 2 . The production capacity is proportional to the current density, and the power input needed to produce a given amount of hydrogen is the voltage times the current . The overall efficiency rating is thus inversely proportional to the voltage (h=HH-V(H2)/U*F, where U is the voltage and F is Faraday’s constant) . The steam-splitting process is endothermic . At the thermo-neutral voltage, which is the thermodynam-ically favourable point of operation, the internal joule heat matches the reaction entropy . Here all input power is converted into hydrogen . Above the thermo-neutral voltage, heat is also produced, and below it additional energy input in the form of heat is required for the process to be self-sustaining (this is not counted in the above definition of efficiency leading to the greater-than-one efficiency values seen in Figure 2) .
The costs of the technology and of the hydrogen produced depend on both the current density and the operating voltage . Operating expenses (OPEX) are dominated by the electricity input (U*I) [39], and scales with the voltage, and investments (CAPEX) are inversely
proportional to the achievable current density times the area-specific cost of the unit, as illustrated in Figure 2 .
A description of the technologies, including the ex-pected costs and efficiencies, has recently been published by the IEA [40] . Key characteristics of the three technologies and recent achievements at DTU are summarized below .
• Alkaline electrolysis . Plants of several hundred MW are currently in operation . The technology is charac-terized by low cost per unit area and excellent du-rability (decades), but also low levels of efficiency and low area-specific production capacity (see Figure 2) . A key task of the R&D is thus to improve efficiency and production capacity . The black curve in Figure 2 illustrates the proven reference of large-scale plants [41] . The green curve (3D AEC) rep-resents the results from the BEEST project, where, at a small scale, electrode improvements could be achieved by using nano-particulate catalysts [42] . The blue curve (HP-AEC) represents the results obtained from an experimental cell, where the KOH is immobilized in porous zirconia, enabling operation at a high pressure and temperature, resulting in improved current densities [43] and efficiencies . Finally, the Apem curve shows the potential in immobilizing the KOH in PBI, also demonstrating a huge improvement over conventional cells [44] .
• PEM electrolysis . This technology has matured rapidly in the last decade and is attracting increased interest [40] . The technology has been scaled up to unit sizes of around 1 MW and is characterized by high production capacity and rapid response times . At present, it relies on the use of Ir-oxide . This increases the costs, and the overall scarcity of Ir (thirty times less abundant than Pt) will limit its global impact . Hence, a key effort on the R&D side is to replace Ir or reduce its use . This is one of the tasks of the research project V-sustain [45], initiated recently .
• SOEC . This is the least mature of the three technol-ogies . The largest units in operation are around 50 kW [46], and plants of ~300 kW are under construc-tion [47] . Characteristics of the technology include its high level of efficiency (it can actually be oper-ated thermo-neutrally) and its modest cost per area [40;48] . Two key challenges to be overcome are the required upscaling to multi-MW scale modules and demonstrating stack lifetimes of five to ten years . The longest demonstration experiments run to date have lasted one to two years . Recent achievements
Figure 2 . Cell voltage versus current densities for various types of electrolysis technologies applicable for the production of hydrogen by water/steam splitting . Right-hand scales illustrate the achievable efficiencies
Gas cleaning Purification Methanation
SNGTar, particles, inorganics
CO2 and water
Compression to grid levelGasification
Biomass
Figure 3 . Typical flow diagram for SNG synthesis from product gas
Page 92 – Alternative Fuels Alternative Fuels – Page 93
DTU International Energy Report 2019 DTU International Energy Report 2019
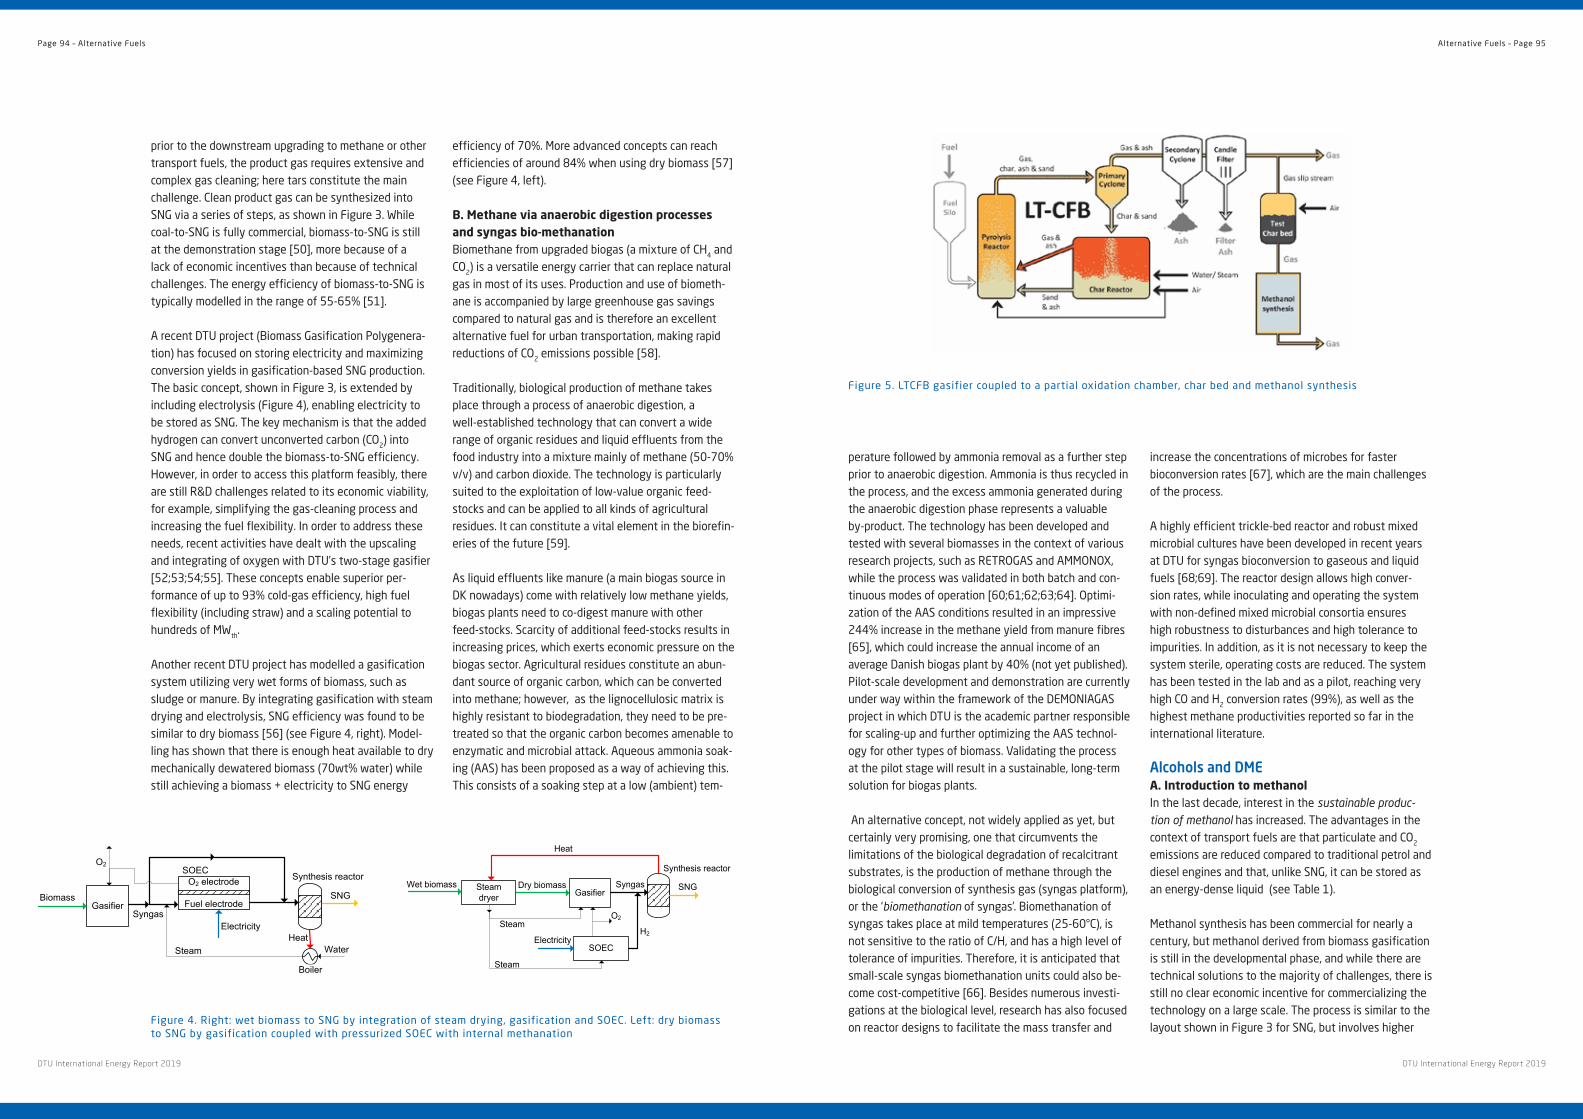
perature followed by ammonia removal as a further step prior to anaerobic digestion . Ammonia is thus recycled in the process, and the excess ammonia generated during the anaerobic digestion phase represents a valuable by-product . The technology has been developed and tested with several biomasses in the context of various research projects, such as RETROGAS and AMMONOX, while the process was validated in both batch and con-tinuous modes of operation [60;61;62;63;64] . Optimi-zation of the AAS conditions resulted in an impressive 244% increase in the methane yield from manure fibres [65], which could increase the annual income of an average Danish biogas plant by 40% (not yet published) . Pilot-scale development and demonstration are currently under way within the framework of the DEMONIAGAS project in which DTU is the academic partner responsible for scaling-up and further optimizing the AAS technol-ogy for other types of biomass . Validating the process at the pilot stage will result in a sustainable, long-term solution for biogas plants .
An alternative concept, not widely applied as yet, but certainly very promising, one that circumvents the limitations of the biological degradation of recalcitrant substrates, is the production of methane through the biological conversion of synthesis gas (syngas platform), or the ‘biomethanation of syngas’ . Biomethanation of syngas takes place at mild temperatures (25-60°C), is not sensitive to the ratio of C/H, and has a high level of tolerance of impurities . Therefore, it is anticipated that small-scale syngas biomethanation units could also be-come cost-competitive [66] . Besides numerous investi-gations at the biological level, research has also focused on reactor designs to facilitate the mass transfer and
increase the concentrations of microbes for faster bioconversion rates [67], which are the main challenges of the process .
A highly efficient trickle-bed reactor and robust mixed microbial cultures have been developed in recent years at DTU for syngas bioconversion to gaseous and liquid fuels [68;69] . The reactor design allows high conver-sion rates, while inoculating and operating the system with non-defined mixed microbial consortia ensures high robustness to disturbances and high tolerance to impurities . In addition, as it is not necessary to keep the system sterile, operating costs are reduced . The system has been tested in the lab and as a pilot, reaching very high CO and H2 conversion rates (99%), as well as the highest methane productivities reported so far in the international literature .
Alcohols and DME A. Introduction to methanol In the last decade, interest in the sustainable produc-tion of methanol has increased . The advantages in the context of transport fuels are that particulate and CO2 emissions are reduced compared to traditional petrol and diesel engines and that, unlike SNG, it can be stored as an energy-dense liquid (see Table 1) .
Methanol synthesis has been commercial for nearly a century, but methanol derived from biomass gasification is still in the developmental phase, and while there are technical solutions to the majority of challenges, there is still no clear economic incentive for commercializing the technology on a large scale . The process is similar to the layout shown in Figure 3 for SNG, but involves higher
prior to the downstream upgrading to methane or other transport fuels, the product gas requires extensive and complex gas cleaning; here tars constitute the main challenge . Clean product gas can be synthesized into SNG via a series of steps, as shown in Figure 3 . While coal-to-SNG is fully commercial, biomass-to-SNG is still at the demonstration stage [50], more because of a lack of economic incentives than because of technical challenges . The energy efficiency of biomass-to-SNG is typically modelled in the range of 55-65% [51] .
A recent DTU project (Biomass Gasification Polygenera-tion) has focused on storing electricity and maximizing conversion yields in gasification-based SNG production . The basic concept, shown in Figure 3, is extended by including electrolysis (Figure 4), enabling electricity to be stored as SNG . The key mechanism is that the added hydrogen can convert unconverted carbon (CO2) into SNG and hence double the biomass-to-SNG efficiency . However, in order to access this platform feasibly, there are still R&D challenges related to its economic viability, for example, simplifying the gas-cleaning process and increasing the fuel flexibility . In order to address these needs, recent activities have dealt with the upscaling and integrating of oxygen with DTU’s two-stage gasifier [52;53;54;55] . These concepts enable superior per-formance of up to 93% cold-gas efficiency, high fuel flexibility (including straw) and a scaling potential to hundreds of MWth .
Another recent DTU project has modelled a gasification system utilizing very wet forms of biomass, such as sludge or manure . By integrating gasification with steam drying and electrolysis, SNG efficiency was found to be similar to dry biomass [56] (see Figure 4, right) . Model-ling has shown that there is enough heat available to dry mechanically dewatered biomass (70wt% water) while still achieving a biomass + electricity to SNG energy
efficiency of 70% . More advanced concepts can reach efficiencies of around 84% when using dry biomass [57] (see Figure 4, left) .
B. Methane via anaerobic digestion processes and syngas bio-methanationBiomethane from upgraded biogas (a mixture of CH4 and CO2) is a versatile energy carrier that can replace natural gas in most of its uses . Production and use of biometh-ane is accompanied by large greenhouse gas savings compared to natural gas and is therefore an excellent alternative fuel for urban transportation, making rapid reductions of CO2 emissions possible [58] .
Traditionally, biological production of methane takes place through a process of anaerobic digestion, a well-established technology that can convert a wide range of organic residues and liquid effluents from the food industry into a mixture mainly of methane (50-70% v/v) and carbon dioxide . The technology is particularly suited to the exploitation of low-value organic feed-stocks and can be applied to all kinds of agricultural residues . It can constitute a vital element in the biorefin-eries of the future [59] .
As liquid effluents like manure (a main biogas source in DK nowadays) come with relatively low methane yields, biogas plants need to co-digest manure with other feed-stocks . Scarcity of additional feed-stocks results in increasing prices, which exerts economic pressure on the biogas sector . Agricultural residues constitute an abun-dant source of organic carbon, which can be converted into methane; however, as the lignocellulosic matrix is highly resistant to biodegradation, they need to be pre-treated so that the organic carbon becomes amenable to enzymatic and microbial attack . Aqueous ammonia soak-ing (AAS) has been proposed as a way of achieving this . This consists of a soaking step at a low (ambient) tem-
Dry biomass
SOEC
H2
Synthesis reactor
SNG
Electricity
Gasifier
Steam
Heat
O2
SyngasSteam dryer
Wet biomass
Steam
Synthesis reactor
SNG
Electricity
GasifierSyngas
Biomass
O2
WaterHeat
SOECO2 electrode
Fuel electrode
Boiler
Steam
Figure 4 . Right: wet biomass to SNG by integration of steam drying, gasification and SOEC . Left: dry biomass to SNG by gasification coupled with pressurized SOEC with internal methanation
Figure 5 . LTCFB gasifier coupled to a partial oxidation chamber, char bed and methanol synthesis
Page 94 – Alternative Fuels Alternative Fuels – Page 95
DTU International Energy Report 2019 DTU International Energy Report 2019
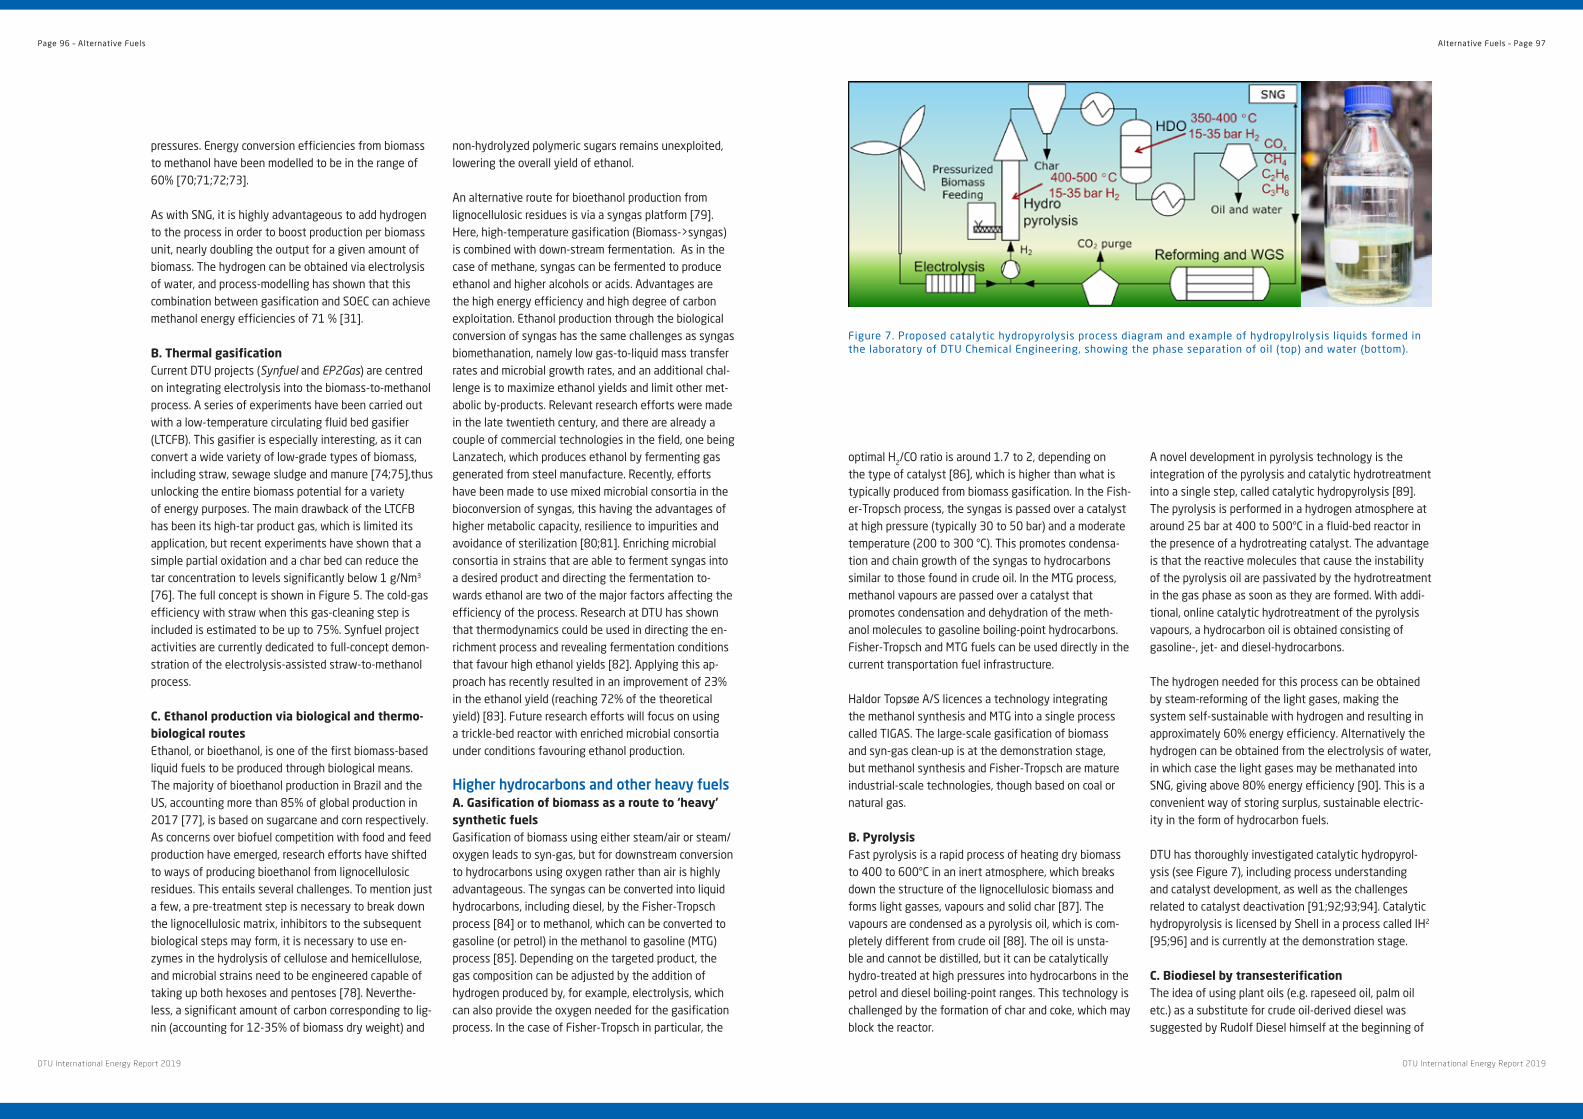
optimal H2/CO ratio is around 1 .7 to 2, depending on the type of catalyst [86], which is higher than what is typically produced from biomass gasification . In the Fish-er-Tropsch process, the syngas is passed over a catalyst at high pressure (typically 30 to 50 bar) and a moderate temperature (200 to 300 °C) . This promotes condensa-tion and chain growth of the syngas to hydrocarbons similar to those found in crude oil . In the MTG process, methanol vapours are passed over a catalyst that promotes condensation and dehydration of the meth-anol molecules to gasoline boiling-point hydrocarbons . Fisher-Tropsch and MTG fuels can be used directly in the current transportation fuel infrastructure .
Haldor Topsøe A/S licences a technology integrating the methanol synthesis and MTG into a single process called TIGAS . The large-scale gasification of biomass and syn-gas clean-up is at the demonstration stage, but methanol synthesis and Fisher-Tropsch are mature industrial-scale technologies, though based on coal or natural gas .
B. PyrolysisFast pyrolysis is a rapid process of heating dry biomass to 400 to 600°C in an inert atmosphere, which breaks down the structure of the lignocellulosic biomass and forms light gasses, vapours and solid char [87] . The vapours are condensed as a pyrolysis oil, which is com-pletely different from crude oil [88] . The oil is unsta-ble and cannot be distilled, but it can be catalytically hydro-treated at high pressures into hydrocarbons in the petrol and diesel boiling-point ranges . This technology is challenged by the formation of char and coke, which may block the reactor .
A novel development in pyrolysis technology is the integration of the pyrolysis and catalytic hydrotreatment into a single step, called catalytic hydropyrolysis [89] . The pyrolysis is performed in a hydrogen atmosphere at around 25 bar at 400 to 500°C in a fluid-bed reactor in the presence of a hydrotreating catalyst . The advantage is that the reactive molecules that cause the instability of the pyrolysis oil are passivated by the hydrotreatment in the gas phase as soon as they are formed . With addi-tional, online catalytic hydrotreatment of the pyrolysis vapours, a hydrocarbon oil is obtained consisting of gasoline-, jet- and diesel-hydrocarbons .
The hydrogen needed for this process can be obtained by steam-reforming of the light gases, making the system self-sustainable with hydrogen and resulting in approximately 60% energy efficiency . Alternatively the hydrogen can be obtained from the electrolysis of water, in which case the light gases may be methanated into SNG, giving above 80% energy efficiency [90] . This is a convenient way of storing surplus, sustainable electric-ity in the form of hydrocarbon fuels .
DTU has thoroughly investigated catalytic hydropyrol-ysis (see Figure 7), including process understanding and catalyst development, as well as the challenges related to catalyst deactivation [91;92;93;94] . Catalytic hydropyrolysis is licensed by Shell in a process called IH2
[95;96] and is currently at the demonstration stage .
C. Biodiesel by transesterificationThe idea of using plant oils (e .g . rapeseed oil, palm oil etc .) as a substitute for crude oil-derived diesel was suggested by Rudolf Diesel himself at the beginning of
pressures . Energy conversion efficiencies from biomass to methanol have been modelled to be in the range of 60% [70;71;72;73] .
As with SNG, it is highly advantageous to add hydrogen to the process in order to boost production per biomass unit, nearly doubling the output for a given amount of biomass . The hydrogen can be obtained via electrolysis of water, and process-modelling has shown that this combination between gasification and SOEC can achieve methanol energy efficiencies of 71 % [31] .
B. Thermal gasificationCurrent DTU projects (Synfuel and EP2Gas) are centred on integrating electrolysis into the biomass-to-methanol process . A series of experiments have been carried out with a low-temperature circulating fluid bed gasifier (LTCFB) . This gasifier is especially interesting, as it can convert a wide variety of low-grade types of biomass, including straw, sewage sludge and manure [74;75],thus unlocking the entire biomass potential for a variety of energy purposes . The main drawback of the LTCFB has been its high-tar product gas, which is limited its application, but recent experiments have shown that a simple partial oxidation and a char bed can reduce the tar concentration to levels significantly below 1 g/Nm3 [76] . The full concept is shown in Figure 5 . The cold-gas efficiency with straw when this gas-cleaning step is included is estimated to be up to 75% . Synfuel project activities are currently dedicated to full-concept demon-stration of the electrolysis-assisted straw-to-methanol process .
C. Ethanol production via biological and thermo-biological routesEthanol, or bioethanol, is one of the first biomass-based liquid fuels to be produced through biological means . The majority of bioethanol production in Brazil and the US, accounting more than 85% of global production in 2017 [77], is based on sugarcane and corn respectively . As concerns over biofuel competition with food and feed production have emerged, research efforts have shifted to ways of producing bioethanol from lignocellulosic residues . This entails several challenges . To mention just a few, a pre-treatment step is necessary to break down the lignocellulosic matrix, inhibitors to the subsequent biological steps may form, it is necessary to use en-zymes in the hydrolysis of cellulose and hemicellulose, and microbial strains need to be engineered capable of taking up both hexoses and pentoses [78] . Neverthe-less, a significant amount of carbon corresponding to lig-nin (accounting for 12-35% of biomass dry weight) and
non-hydrolyzed polymeric sugars remains unexploited, lowering the overall yield of ethanol .
An alternative route for bioethanol production from lignocellulosic residues is via a syngas platform [79] . Here, high-temperature gasification (Biomass->syngas) is combined with down-stream fermentation . As in the case of methane, syngas can be fermented to produce ethanol and higher alcohols or acids . Advantages are the high energy efficiency and high degree of carbon exploitation . Ethanol production through the biological conversion of syngas has the same challenges as syngas biomethanation, namely low gas-to-liquid mass transfer rates and microbial growth rates, and an additional chal-lenge is to maximize ethanol yields and limit other met-abolic by-products . Relevant research efforts were made in the late twentieth century, and there are already a couple of commercial technologies in the field, one being Lanzatech, which produces ethanol by fermenting gas generated from steel manufacture . Recently, efforts have been made to use mixed microbial consortia in the bioconversion of syngas, this having the advantages of higher metabolic capacity, resilience to impurities and avoidance of sterilization [80;81] . Enriching microbial consortia in strains that are able to ferment syngas into a desired product and directing the fermentation to-wards ethanol are two of the major factors affecting the efficiency of the process . Research at DTU has shown that thermodynamics could be used in directing the en-richment process and revealing fermentation conditions that favour high ethanol yields [82] . Applying this ap-proach has recently resulted in an improvement of 23% in the ethanol yield (reaching 72% of the theoretical yield) [83] . Future research efforts will focus on using a trickle-bed reactor with enriched microbial consortia under conditions favouring ethanol production .
Higher hydrocarbons and other heavy fuelsA. Gasification of biomass as a route to ‘heavy’ synthetic fuels Gasification of biomass using either steam/air or steam/oxygen leads to syn-gas, but for downstream conversion to hydrocarbons using oxygen rather than air is highly advantageous . The syngas can be converted into liquid hydrocarbons, including diesel, by the Fisher-Tropsch process [84] or to methanol, which can be converted to gasoline (or petrol) in the methanol to gasoline (MTG) process [85] . Depending on the targeted product, the gas composition can be adjusted by the addition of hydrogen produced by, for example, electrolysis, which can also provide the oxygen needed for the gasification process . In the case of Fisher-Tropsch in particular, the
Figure 7 . Proposed catalytic hydropyrolysis process diagram and example of hydropylrolysis liquids formed in the laboratory of DTU Chemical Engineering, showing the phase separation of oil (top) and water (bottom) .
Page 96 – Alternative Fuels Alternative Fuels – Page 97
DTU International Energy Report 2019 DTU International Energy Report 2019

References1 . https://h2 .live/en/tankstellen
2 . https://www .globenewswire .com/news-release/2019/02/15/1726095/0/en/Highest-increase-of-hydrogen-refuelling-
stations-in-Germany-worldwide-in-2018-again .html
3 . https://www .fuelcellbuses .eu/category/demos-europe
4 . NGV Global; http://www .iangv .org/current-ngv-stats/
5 . CNG Europe; http://cngeurope .com/natural-gas-vehicles/
6 . Jori Sihvonen ,Transport and Environment 2018; https://www .transportenvironment .org/sites/te/files/publications/2018_10_
TE_CNG_and_LNG_for_vehicles_and_ships_the_facts_EN .pdf
7 . Choon Fong Shih, Tao Zhang, Jinghai Li and Chunli Bai, Powering the Future with Liquid Sunshine, Joule 2, 1925 (2018) .
8 . Geely; https://www .chinapev .com/geely/worlds-first-geely-luanched-yuan-cheng-m100-methanol-heavy-truck-lifetime-up-to-
620000-miles-price-starts-at-353000-yuan/
9 . China Daily, http://www .chinadaily .com .cn/a/201902/26/WS5c74788ba3106c65c34eb565 .html
10 . Use of Methanol as a Transportation Fuel, Richard L . Bechtold et al . Prepared for the Methanol Institute, Nov . 2007, http://
www .methanol .org/wp-content/uploads/2016/06/Methanol-Use-in-Transportation .pdf .
11 . George A . Olah (2005) . “Beyond Oil and Gas: The Methanol Economy” . Angewandte Chemie International Edition . 44 (18):
2636–2639
12 . S . Chovau, D . Degrauwe, B . Van der Bruggen, Renewable and Sustainable Energy Reviews, 26, (2013), 307 .
13 . EU-directive 2015/1513; https://theicct .org/sites/default/files/publications/RED%20II_ICCT_Policy-Update_vF_jan2017 .pdf,
or; https://eur-lex .europa .eu/legal-content/DA/TXT/?uri=uriserv%3AOJ .L_ .2015 .239 .01 .0001 .01 .DAN
14 . https://www .greencarcongress .com/2019/06/20190614-oberon .html,
15 . http://www .biodme .eu/work-packages/veichle-field-test/
16 . https://www .aboutdme .org/index .asp,
17 . https://www .upmbiofuels .com/about-upm-biofuels/
18 . Majewski, W . Addy .; Khair, Magdi K .‘Diesel emissions and their control’; SAE International, 2006, ISBN: 0768006740 . 2006 .
19 . European Environment Agency Report No 12/2018, Air quality in Europe - 2018 report, ISSN 1977-8449 .
20 . Jihui Wang, Hong Chen, Zhicheng Hu, Mingfa Yao & Yongdan Li, A Review on the Pd-Based Three-Way Catalyst, Catalysis
Reviews, 2015, 57, 79-144 .
21 . Tak W . Chan, Eric Meloche, Joseph Kubsh, and Rasto Brezny Black; Carbon Emissions in Gasoline Exhaust and a Reduction
Alternative with a Gasoline Particulate Filter, Environ . Sci . Technol . 2014, 48, 6027−6034 .
22 . Walker, Andy; Future Challenges and Incoming Solutions in Emission Control for Heavy Duty Diesel Vehicles .
23 . https://www .dieselnet .com/news/2019/02eu2 .php
24 . https://www .dieselnet .com/standards/eu/hd .php
25 . Clarens AF, Resurreccion EP, White MA, Colosi LM . Environmental life cycle comparison of algae to other bioenergy feedstocks .
Environ Sci Technol [Internet] . 2010 Mar 1;44(5):1813–9 . Available from: http://dx .doi .org/10 .1021/es902838n
26 . S . L . Ebbehøj, Fabrication of Green Hydrocarbon Fuels via Capture and Electrolysis of CO2, PhD Thesis, DTU 2015 .
27 . Sigurjonsson, Hafthor Ægir, Brian Elmegaard, Lasse Røngaard Clausen, and Jesper Ahrenfeldt . 2015 . “Climate Effect of an
Integrated heat Production and Bioenergy System with Low Temperature Circulating Fluidized Bed Gasifier .” Applied Energy
160: 511–20 .
28 . World Energy Council . 2016 . World Energy Resources Bioenergy 2016 . https://books .google .com/
books?id=WLC7CdLOZosC&pgis=1
29 . Danish Council on Climate Change . The Role of Biomass in the Green Transition The Role of Biomass in the Green Transition .
2018 .
30 . IPCC . Climate change and land . 2017 . doi:10 .4337/9781784710644 .
31 . Hansen, John B . et al . 2011 . GreenSynFuels - Final Report EUDP 64010-0011, 2011 .
32 . Renewable Power Generation Costs in 2017, IRENA 2017, https://www .irena .org/-/media/Files/IRENA/Agency/
Publication/2018/Jan/IRENA_2017_Power_Costs_2018 .pdf
33 . K . Hedegaard, K . A . Thyø, H . Wenzel, Environ . Sci . Technol ., 42, 7992-7999 (2008) .
34 . H .Wenzel, ”Breaking the biomass bottleneck of the fossil free society”Concito 2010,http://www .concito .info
35 . B . V . Mathiesen, et al ., ”IDA’s Energy Vision 2050”, Aalborg University, 2015 .
36 . Energinet .dk, “Energikoncept 2030” .
37 . Energistyrelsen . Energiscenarier frem mod 2020, 2035 og 2050, https://ens .dk/sites/ens .dk/files/Basisfremskrivning/
energiscenarier_-_analyse_2014_web .pdf
38 . I . Ridjan, Integrated electrofuels and renewable energy systems, AAU, PhD Thesis 2015 .
39 . C . Graves, S . D . Ebbesen, M . Mogensen, K . S . Lackner, Renewable and Sustainable Energy Reviews 15 (2011) 1–23
40 . IEA report; The future of Hydrogen, June 2019; https://www .iea .org/publications/reports/thefutureofhydrogen/
41 . J . Mergel, M . Carmo, and D . Fritz (2013) ”Status on Technologies for Hydrogen Production by Water Electrolysis”, in D . Stolten
”Transition to Renewable Energy Systems”, Wiley-VCH
the twentieth century . The first generation of biodiesel was derived from plant oils after transesterification mainly with methanol under alkaline or acidic conditions [97] . The debate over biofuels edging out food and feed production triggered the exploitation of waste oils, that is, cooking oils and fats, as feedstock for biodiesel . How-ever, a deficit in waste oils to satisfy the demand for biodiesel created the need to find alternative feedstocks such as microalgal and single-cell oils . Research efforts are currently focused mainly on finding ways to make the production economically competitive by minimiz-ing the raw material costs, to improve productivity by developing suitable production strains, and to develop smart reactor types and sustainable and cost-efficient downstream processes for cell lysis and lipid extraction [98:99] .
Conclusion and key messages This chapter has described a number of preferred candi-date ‘alternative fuels’ for sustainable urban transport in the future . Public transport, self-transport and modes of transport relying on electrical energy should be strongly promoted in future . However, they cannot stand alone . To meet global greenhouse gas emission-reduction targets in a timely fashion, additional parallel efforts are needed to develop cleaner forms of transport based on liquid and gaseous fuels .
More stringent policies should be implemented on local emissions to ensure that air quality is improved and better engine technology is introduced . Several different routes exist for synthesizing transport fuels from waste biomass resources (thus rendering them sustainable from a CO2 emissions perspective) relying on biochemical
routes, catalytic high-temperature routes or combina-tions thereof . As these fuels will be more costly than their fossil-fuel equivalents, policy measures should be promoted and implemented (e .g . blend-in requirements, public support for the necessary refuelling infrastruc-ture, emission tax schemes) to ensure their implementa-tion . It is technically feasible to handle issues with local harmful emissions (NOx, SOx, particulates) with these fuels .
To reduce the demand on land use from this sector, only biomass waste resources and sustainable energy crops grown on non-arable land should be considered, which should be extended as much as possible by adding hydrogen (e .g . derived from water/steam-splitting by electrolysis) to the fuel synthesis .
Methane and methanol are promising fuels for realizing more sustainable urban transport with view to ease and efficiency of their synthesis, but requires reduction of unintended methane emission and slightly modified ve-hicles, respectively . Considering existing vehicle fleets, synthetic diesel and gasoline from Fisher-Tropsch, methanol to gasoline, refined pyrolysis oil, or bio-ethanol (second generation) can provide significant GHG emis-sion reductions in the near future . When benchmarking routes to sustainable urban transport in the future, it will be important to include emissions and resource use in the whole production and consumption chain from ‘well to wheel’ and not only the ‘tank to wheel’ part .
An extended version of this chapter can be found as ‘supplementary material’ at DTU Orbit [100] .
Page 98 – Alternative Fuels Alternative Fuels – Page 99
DTU International Energy Report 2019 DTU International Energy Report 2019

70 . Clausen, Lasse R . 2015 . “Maximizing Biofuel Production in a Thermochemical Biorefinery by Adding Electrolytic Hydrogen and
by Integrating Torrefaction with Entrained Flow Gasification .” Energy 85: 94–104 .
71 . Hansen, John B . et al . 2011 . GreenSynFuels - Final Report .
72 . Puerari, Fabrizio, Barbara Bosio, and Georges Heyen . 2014 . “Energy Efficiency Optimisation in Different Plant Solutions for
Methanol Production from Biomass Gasification .” Chemical Engineering Science 37: 301–6 .
73 . Røngaard Clausen, Lasse . 2011 . Design of Novel DMEmethanol Synthesis Plants Based on Gasification of Biomass .
74 . Ahrenfeldt, Jesper, Tobias P . Thomsen, Ulrik Henriksen, and Lasse R . Clausen . 2013 . “Biomass Gasification Cogeneration – A
Review of State of the Art Technology and near Future Perspectives .” Applied Thermal Engineering 50(2): 1407–17 . http://
linkinghub .elsevier .com/retrieve/pii/S135943111100737X (November 1, 2013) .
75 . Thomsen, Tobias P . et al . 2017 . “Low Temperature Circulating Fluidized Bed Gasification and Co-Gasification of Municipal
Sewage Sludge . Part 1 : Process Performance and Gas Product Characterization .” Waste Management 66: 123–33 . http://dx .doi .
org/10 .1016/j .wasman .2017 .04 .028 .
76 . Ravenni, Giulia . 2018 . “Application of Biomass Char to Tar Conversion and Producer Gas Upgrading to Syngas .” Technical
University of Denmark .
77 . US Department of Energy, Alternative Fuels Data Center (2018) Global ethanol production, https://afdc .energy .gov/data/10331
78 . Rastogi M and Shrivastava S (2017) Recent advances in second and second generation bioethanol production: An insight to
pretreatment, saccharification and fermentation processes . Renewable and Sustainable Energy Reviews, 80, 330-340 .
79 . Kennes D, Abubackar HN, Diaz M, Veiga MC, Kennes C (2016) . Bioethanol production from biomass: carbohydrate vs syngas
fermentation . J Chem Technol Biotechnol . 91, 304–17 .
80 . Liu K, Atiyeh HK, Stevenson BS, Tanner RS, Wilkins MR, Huhnke RL . Mixed culture syngas fermentation and conversion of
carboxylic acids into alcohols . Bioresour Technol . 2014;152:337–46 .
81 . Singla A, Verma D, Lal B, Sarma PM . Enrichment and optimization of anaerobic bacterial mixed culture for conversion of syngas
to ethanol . Bioresour Technol . 2014;172:41–9 .
82 . Grimalt-Alemany A, Lezyk MJ, Lange L, Skiadas IV and Gavala HN (2018) Enrichment of syngas-converting Mixed Microbial
Consortia for ethanol production and thermodynamics-based design of enrichment strategies . Biotechnology for Biofuels,
11:198, https://doi .org/10 .1186/s13068-018-1189-6
83 . Grimalt-Alemany A, Lezyk MJ, Lange L, Skiadas IV and Gavala HN (2018) Enrichment of syngas-converting Mixed Microbial
Consortia for ethanol production and thermodynamics-based design of enrichment strategies . Biotechnology for Biofuels,
11:198, https://doi .org/10 .1186/s13068-018-1189-6
84 . Dry, ME (2002) . The Fischer–Tropsch process: 1950–2000 . Catal Today . 71: 227-241 .
85 . Keil, FJ (1999) . Methanol-to-hydrocarbons: process technology . Microporous Mesoporous Mater . 29:49-66 .
86 . Dry, ME (2002) . The Fischer–Tropsch process: 1950–2000 . Catal Today . 71: 227-241 .
87 . Bridgewater, AV (2004), Biomass fast pyrolysis . Therm . Sci . 8: 21–49 .
88 . Venderbosch, RH (2015) . A Critical View on Catalytic Pyrolysis of Biomass . ChemSusChem 8: 1306–1316 .
89 . Marker TL, Felix LG, Linck MB, and Roberts MJ . (2012) . Integrated Hydropyrolysis and Hydroconversion (IH2) for the
Direct Production of Gasoline and Diesel Fuels or Blending Components from Biomass, Part 1: Proof of Principle Testing .
Environmental Progress & Sustainable Energy 31: 191–199 .
90 . Nguyen TV, and Clausen LR (2018) . Thermodynamic Analysis of Polygeneration Systems Based on Catalytic Hydropyrolysis for
the Production of Bio-Oil and Fuels . Energy Conversion and Management 171: 1617–1638 .
91 . Stummann MZ, Høj M, Schandel CB, Hansen AB, Wiwel P, Gabrielsen J, Jensen PA, Jensen AD (2018) . Hydrogen Assisted Catalytic
Biomass Pyrolysis . Effect of Temperature and Pressure . Biomass and Bioenergy 115: 97–107
92 . Stummann MZ, Hansen AB, Hansen LP, Davidsen D, Rasmussen SB, Wiwel P, Gabrielsen J, Jensen PA, Jensen AD, and Høj M
(2019a) . Catalytic Hydropyrolysis of Biomass Using Molybdenum Sulfide Based Catalyst . Effect of Promoters . Energy & Fuels
33: 1302–1313 .
93 . Stummann MZ, Høj M, Hansen AB, Davidsen B, Wiwel P, Gabrielsen J, Jensen PA, and Jensen AD (2019b) . New Insights into the
Effect of Pressure on Catalytic Hydropyrolysis of Biomass . Fuel Processing Technology 193: 392–403 .
94 . Stummann, MZ, Høj M, Davidsen B, Hansen AB, Hansen LP, Wiwel P, Schandel CB, Gabrielsen J, Jensen PA, and Jensen AD
(2019c) . Effect of the Catalyst in Fluid Bed Catalytic Hydropyrolysis . Catalysis Today, Accepted .
95 . Marker TL, Felix LG, Linck MB, and Roberts MJ, Ortiz-Toral P, and Wangerow J (2014) . Integrated Hydropyrolysis and
Hydroconversion (IH2®) for the Direct Production of Gasoline and Diesel Fuels or Blending Components from Biomass, Part 2:
Continuous Testing . Environmental Progress & Sustainable Energy 33: 762–768 .
96 . Shell (2019): https://www .shell .com/business-customers/catalysts-technologies/licensed-technologies/benefits-of-biofuels/
ih2-technology .html (accessed 16-07-2019)
97 . Drapcho CM, Nhuan NP, Walker TH (2008) Biodiesel In: Biofuels Engineering Process Technology, McGraw Hill, 197-268
98 . Kruger JS et al . (2018) Recovery of Fuel-Precursor Lipids from Oleaginous Yeast . ACS Sustainable Chemistry and Engineering, 6,
2921-2931 .
99 . Shields-Menard SA et al . (2018) A review on microbial lipids as a potential biofuel . Bioresource Technology, 259, 451-460
100 . www .dtu .dk/XXX .
42 . BEEST, EUDP project 64017-0033 . results yet unpublished .
43 . C . Chatzichristodoulou, F . Allebrod, and M . B . Mogensen, High Temperature Alkaline Electrolysis Cells with Metal Foam Based
Gas Diffusion Electrodes, J . Electrochem . Soc ., 163(11): F3036-F3040, 2016
44 . Mikkel R . Kraglund, DTU Phd-thesis 2017 .
45 . V-sustain project, http://www .v-sustain .dtu .dk
46 . Electrical upgrading of biogas, EUDP 12 II, 2018 .
47 . https://www .gasworld .com/co-from-co2-on-site-carbon-monoxide-generation-takes-the-next-step/2011884 .article, HTAS
press release 2019; https://blog .topsoe .com/delille-oxygen-co .-leases-two-ecos-units-for-cost-competitive-onsite-co-
production
48 . Mathiesen, Brian Vad; Ridjan, Iva; Connolly, David; Nielsen, Mads Pagh; Vang Hendriksen, Peter; Bjerg Mogensen, Mogens;
Højgaard Jensen, Søren; Dalgaard Ebbesen, Sune, Technology data for high temperature solid oxide electrolyser cells, alkali and
PEM electrolysers, ISBN 978-87-91404-46-7, 2013 .
49 . Xiaofeng Tong, Simona Ovtar, Karen Brodersen, Peter Vang Hendriksen, and Ming Chen, DOI: 10 .1021/acsami .9b07749, ACS
Appl . Mater . Interfaces 2019
50 . Rönsch, Stefan et al . 2016 . “Review on Methanation - From Fundamentals to Current Projects .” Fuel 166: 276–96 .
51 . van der Meijden, Christiaan M ., Hubert J . Veringa, and Luc P L M Rabou . 2010 . “The Production of Synthetic Natural Gas (SNG):
A Comparison of Three Wood Gasification Systems for Energy Balance and Overall Efficiency .” Biomass and Bioenergy 34(3):
302–11 . http://dx .doi .org/10 .1016/j .biombioe .2009 .11 .001 .
52 . Ahrenfeldt, J . et al . 2006 . “Validation of a Continuous Combined Heat and Power (CHP) Operation of a Two-Stage Biomass
Gasifier .” Energy & Fuels 20: 2672–80 .
53 . Gadsbøll, Rasmus Østergaard . 2018 . “Biomass Gasification Polygeneration .” Technical University of Denmark .
54 . Gadsbøll, Rasmus Østergaard . 2018 . “Oxygen-Blown Operation of the TwoStage Gasifier .” Energy 158: 495–503 .
55 . Gadsbøll, Rasmus Østergaard, Adrian Vivar Garcia, Jesper Ahrenfeldt, and Ulrik Birk Henriksen . 2019 . “Solid Oxide Fuel Cell Stack
Coupled with an Oxygen-Blown TwoStage Gasifier Using Minimal Gas Cleaning .” Renewable Energy 139: 1255–62 . https://
linkinghub .elsevier .com/retrieve/pii/S096014811930343X .
56 . Clausen, Lasse R . 2017 . “Energy Efficient Thermochemical Conversion of Very Wet Biomass to Biofuels by Integration
of Steam Drying, Steam Electrolysis and Gasification .” Energy 125: 327–36 . http://linkinghub .elsevier .com/retrieve/pii/
S0360544217303158 .
57 . Clausen, Lasse R ., Giacomo Butera, and Søren Højgaard Jensen . 2019 . “High Efficiency SNG Production from Biomass and
Electricity by Integrating Gasification with Pressurized Solid Oxide Electrolysis Cells .” Energy 172: 1117–31 . https://doi .
org/10 .1016/j .energy .2019 .02 .039 .
58 . European Biogas Association (2016) Biomethane in transport, http://european-biogas .eu/wp-content/uploads/2016/05/
BiomethInTransport .pdf
59 . Verstraete W and De Vrieze J (2015) . Anaerobic digestion: about beauty and consolation . In: Anaerobic Biotechnology;
Environmental Protection and Resource recovery by Fang HHP and Zhang T (Eds .), Imperial College Press
60 . Jurado E, Skiadas IV and Gavala HN (2013a) Enhanced methane productivity from manure fibers by aqueous ammonia soaking
pretreatment . Applied Energy, 109, 104-111 .
61 . Jurado E, Gavala HN and Skiadas IV (2013b) Enhancement of methane yield from wheat straw, miscanthus and willow using
aqueous ammonia soaking . Environmental Technology, 34(13-14), 2069-2075 .
62 . Lymperatou A, Gavala HN, Esbensen KH and Skiadas IV (2015) . AMMONOX-Ammonia for enhancing biogas yield & reducing
NOx: Towards the optimization of Aqueous Ammonia Soaking . Waste and Biomass Valorization, 6(4), 449-457 .
63 . Jurado E, Antonopoulou G, Lyberatos G, Gavala HN and Skiadas IV (2016) . Continuous anaerobic digestion of swine manure:
ADM1-based modelling and effect of addition of swine manure fibers pretreated with aqueous ammonia soaking . Applied
Energy, 172, 190-198 .
64 . Mirtsou-Xanthopoulou C, Skiadas IV, Gavala HN (2019) On the effect of Aqueous Ammonia Soaking pretreatment on continuous
anaerobic digestion of digested swine manure fibers, Molecules, 24(13), 2469; https://doi .org/10 .3390/molecules24132469
65 . Lymperatou A, Gavala HN and Skiadas IV (2017) . Optimisation of Aqueous Ammonia Soaking of manure fibers by Response
Surface Methodology for unlocking the methane potential of swine manure . Bioresource Technology, 244, 509-516 .
66 . Grimalt-Alemany A, Skiadas IV and Gavala HN (2018) Syngas biomethanation: state-of-the-art review and perspectives .
Biofuels Bioproducts & Biorefining, 12, 139-158 .
67 . Asimakopoulos K, Gavala HN and Skiadas IV (2018) Reactor systems for syngas fermentation processes: a review . Chemical
Engineering Journal, 348, 732-744 .
68 . Asimakopoulos K, Gavala HN and Skiadas IV (2019) Biomethanation of Syngas by Enriched Mixed Anaerobic Consortia in Trickle
Bed Reactors, Waste and Biomass Valorization, https://doi .org/10 .1007/s12649-019-00649-2
69 . Grimalt-Alemany A, Łe⁰yk, Kennes-Veiga DM, Skiadas IV and Gavala HN (2019) Enrichment of mesophilic and thermophilic
mixed microbial consortia for syngas biomethanation: the role of kinetic and thermodynamic competition . Waste and Biomass
Valorization, https://doi .org/10 .1007/s12649-019-00595-z
Page 100 – Alternative Fuels Alternative Fuels – Page 101
DTU International Energy Report 2019 DTU International Energy Report 2019

terials extraction, production and disposal .2 A full life cycle approach prevents such narrow sightedness and gives the full picture regarding the car’s environmental performance . Likewise, in comparative studies aiming to support policies or decisions, such as assessing differ-ent car component alternatives for improved design or performance, only evaluating a limited part of the system’s life cycle can lead to a solution being adopted that decreases the environmental impacts in the life cycle stage(s) that are taken into account while inadver-tently increasing them in other parts of the life cycle . This is called burden-shifting from one life cycle stage to another, and may increase the overall impacts of the product over its entire life cycle . For example, making the car body lighter by using lightweight materials like aluminium or fibre-reinforced polymers instead of steel decreases fuel consumption during the use stage (due to the lower vehicle weight) . However it might increase the environmental impacts during manufacturing due to the much greater amounts of energy used in the production of aluminium or fibre-reinforced composites compared
2 Given an electricity system in the car-producing regions that will be based on renewable energy sources in the future, this distribution of climate change impacts along the life cycle will change, and the overall climate change impacts of the BEV will be strongly reduced .
3 This will also change if future electricity production is based on renewable energy sources that are associated with much lower climate change impacts than the current sources .
with steel production .3 In addition, in the case of the latter, it makes material recycling at the end of the vehi-cle’s life very inefficient [3;4] .
Figure 1 shows the simplified life cycle of a transport system (including vehicles and supporting infrastructure like roads, gas stations, charging stations, etc .), showing how it interacts with the life cycle of the fuels used in the operation of the transport mode (petroleum products for ICEVs or fuels needed for electricity generation) .
Life Cycle Assessment, or LCA, is thus the tool to use for environmental sustainability assessments . The method-ology has been standardized by the International Organi-zation for Standardization [6;7], and international bodies like the European Commission have developed detailed guidelines for LCA and its application [8] .
Broad coverage of environmental impactsLife cycle assessments also apply a broad perspective to environmental problems and attempt to include all the
IntroductionTransport possibilities are essential for our modern societies, and access to cheap transport contributes positively to many of the United Nations’ Sustainable Development Goals [1] . It is, however, also accompanied by substantial negative impacts, not least on ecosys-tems and human health, notably through:
• Releases of greenhouse gases, particles and other air pollutants contributing to climate change, respiratory diseases from particulate matter or pho-tochemical smog, acidification and eutrophication damaging ecosystems, etc .
• Noise problems and occupation of land and space in urban areas .
• Use of non-renewable resources, in particular fossil fuels for internal combustion engine vehicles (ICEVs) and metals for car bodies, powertrains and batteries (in particular for battery electric vehicles, or BEVs) .1
For decision-making on future developments of our transport systems, it is essential to assess and ad-dress these negative impacts in order to ensure more environmentally sustainable forms of transport in the future . But how is the environmental sustainability of transport assessed, what are the important findings of such assessments, what is ultimately the challenge to a sustainable transport and what are the ways forward? These questions are addressed in this chapter .
1 The first two points create external costs that are not covered by the users or operators of transport systems . The loss of non-renewable resources is considered a safeguard subject (together with ecosystem health and human health) due to its implications for the possibility of future generations to meet their needs . In the quantification of external costs, resource and environmental economists often disregard the exhaustion of finite resources since it is expected to be reflected in market prices and hence become an internal cost .
Assessing environmental sustainability Transport has many potential environmental impacts . When assessing the environmental sustainability of transport modes, it is therefore essential to adopt a systems perspective that captures all the impacts, direct and indirect, that these systems may have . The systems perspective means that we need to consider the whole life cycle of the physical elements of the transport sys-tems: the vehicles and their infrastructure in the form of roads, fuel delivery, charging stations, etc .
The life cycle perspectiveThe life cycle of a product or system encompasses its entire value chain, from the extraction of the necessary raw materials and manufacturing over distribution and use up to end-of-life recycling or disposal of the product or its components . It includes all the processes that are involved in these life cycle stages to that allow the sys-tem to function . By considering the whole life cycle, we reduce the risk of overlooking important environmental impacts stemming from specific parts of the value chain . Taking the example of private vehicles, the environ-mental hotspot for climate change impacts, meaning the location in the life cycle where the climate change impacts are the greatest, is typically the manufacturing stage for battery electric vehicles (BEV) if it is assumed that the electricity grid mix that it will use in the future will rely increasingly on renewable technologies, such as wind power [2] . Therefore, if one only considers the operation of the BEVs (= use stage), one may consider BEVs to be nearly climate-neutral, while in fact they are still associated with greenhouse gas emissions in other parts of their value chains, such as raw ma-
Chapter 10
Environmental sustainability of different transport modesMichael Hauschild, Florence Bohnes, Alexis Laurent, DTU Management
Extraction of necessary
materials for all infrastructures
Construction & installation of
infrastructures
Decommissioning and disposal of infrastructures
Extractionof fuels or
resources for fuel prod.
Combustion of fuels
Operation/ useof vehicles &
infrastructures
Life cycleof fuels
Processing and distribution of
fuels
Life cycle of infrastructures, incl. Vehicles/trains/planes, roads, gas/charging stations, etc.
Disposal of slags/spent
fuels
Life cycle of transport system
Figure 1 . Life cycle of transport system, with interacting life cycles of transport infrastructure and fuels (electricity in the case of BEVs), illustrating the life cycle stages of them both, from extraction of resources to their respective end of life (adapted from 5) .
Environmental sustainability of different transport modes – Page 103
DTU International Energy Report 2019 DTU International Energy Report 2019

contribution of the system to the future availability of these resources .
Focus on the functionLCA is frequently used to compare different solutions to a given problem . To ensure a fair and relevant compari-son, it is essential that the alternative solutions deliver the same service . The required service or function must therefore be explicitly defined at the beginning of the analysis, both in quantitative terms (how much is delivered and for how long?) and qualitative terms (how well?) . This definition is called the Functional Unit of the LCA and it is the anchoring point of the comparison, de-termining the reference flows of physical products that are needed for each of the compared alternatives .
In the comparative LCA, the delivered service is fixed, and the environmental impacts associated with deliver-ing it are determined for each of the systems analysed . If we define eco-efficiency as the ratio between the delivered value or service and the environmental impact that is caused (be it climate change, damage to human health, acidification from air pollution or some other rele-vant environmental impact) [12]:
Eco - efficiency = delivered service (Eq. 10.1) caused impact
… then LCA is the tool for comparing the eco-efficiency of products, services or the systems that provide them . Comparing levels of eco-efficiency is a relative sustain-ability assessment, answering the question: is it more sustainable to do A than to do B?
Together with the life cycle perspective and the broad coverage of environmental impacts, the focus on the delivered service through the functional unit is a key characteristic of LCA .
What is the service? The service or function delivered by transport sys-tems and modes is to move goods or persons from one location to another . Moving from the societal level to the level of the individual transport technology in the context of a comparative life cycle assessment, we need to develop a definition of the transport service that ensures a fair comparison between different transport systems or modes . A quantitative description must reflect the quantity (number of persons, weight or volume of goods) that is being transported, the distance over which the transport occurs and the frequency with which it occurs (daily commuting, vacation travelling,
freight transport from suppliers, etc .) . The combination of these three factors typically results in a reference flow that, for person transport, is expressed as the product of the number of people transported and the distance over which they are transported (with the frequency integrated in the latter as a total transport distance) in the metric person .km . For freight transport the reference flow is a product of the quantity of goods (normally expressed as a weight or volume, depending on what is the limiting factor for the transport mode concerned) and the distance, expressed as ton .km (or, for goods of very low density where the limiting capacity of the transport mode becomes the volume, as m3 .km) .
There are also many qualitative aspects that are rele-vant in ensuring a fair comparison between alternative transport solutions in an LCA . For person transport, these include comfort (bicycle, bus and private car have different levels of personal comfort for the user), the duration of the transport (for long transport distances, some transport modes are not relevant here), the possibility of taking luggage along, etc . For freight, the duration in particular may be an issue . To arrive at a fair comparison, it is important to ensure that the solutions being compared are seen as acceptable alternatives by the intended users of the service .
Table 1 shows the climate change impacts of different modes of transport expressed for such metrics .
Larger-scale systemic interactions In the previous section we discussed how to define the function of a mode or system of transport, and how in the end it is determined by the demand or need for a transport service . Focusing the analysis and optimiza-tion on the individual transport service, however, may be misleading when the total picture at the societal level is not just a linear scaling-up from the level of the individual .
Rebound effects One challenge to the comparative sustainability as-sessment of different transport technologies lies in the interdependence between the (eco-)efficiency of the technology and the demand . When a car is re-designed to increase its fuel efficiency, the eco-efficiency is increased because the fuel consumption, and hence the environmental impacts per driven kilometre, are reduced (Eq . 10 .1) . Higher eco-efficiency should mean more envi-ronmentally sustainable transport, but a more fuel-ef-ficient car is also more economic to use and therefore more attractive relative to other transport means (like
environmental impacts that are relevant for the system that is being analysed [9] . Recalling the multiple envi-ronmental impacts that different transport systems can cause, this is essential when analysing which transport solutions are the most environmentally sustainable . It is common to focus narrowly on climate change impacts and energy consumption in studies investigating the environmental sustainability of transport, giving other problems such as air pollution less attention . However, the scientific literature has demonstrated that this nar-row scoping is insufficient, as it overlooks the evolutions of other known environmental problems of relevance to transport, like particulate matter formation impacting on human health, chemical pollution or the reduced avail-ability of metal resources . The fact that some of these problems may not co-vary with climate change impacts or energy consumption means that there is a risk of burden-shifting between environmental impacts if these two issues are addressed in isolation [10] . For example, when comparing BEV and internal combustion engine vehicles (ICEV), climate change impacts may be similar to one another over the total life cycle when the vehicles are operated in locations where the electricity grid mix used is based predominantly on fossil fuels . However, airborne pollutants from electricity production in power plants are typically emitted outside the cities and hence impact on people less than the exhaust pipe emissions from ICEVs that directly impact on urban populations, with their much higher population densities, at ground level, thus potentially leading to worse overall impacts during the use and operation of the vehicles . Likewise, in their operational or use stage, BEVs entail comparatively low emissions of fine particles and negligible noise pollution and no risk of creating urban smog . A one-eyed focus on climate change impacts might miss these potential benefits .
The importance of a multi-impact perspective is illus-trated in Figure 2, adapted from the study by Bohnes and co-workers [2], who compared the environmental im-pacts of BEVs and ICEVs in Copenhagen for medium-size vehicles in 2016 . While climate change impacts are equivalent (due to the Danish electricity mix in 2016, which included a large share of fossil fuels), particulate matter formation is higher for ICEVs (due to high emis-sions from combustion in the use stage), and impacts on human health from toxic chemical emissions are higher for BEVs than for ICEVs (originating in the production stage of the former) . When limiting the assessment to only climate change impacts, the trends in these other relevant impact categories are overlooked and deci-sions based on the results run the risk of increasing the overall environmental burden of the transport system . Of additional relevance to transport systems, one should consider land use impacts, particularly when dealing with systems involving biofuels, where the widespread use of first-generation biofuels (based on crops) entails both direct and indirect changes to land use (i .e . occu-pation of arable land, which may cause land use change somewhere else, e .g . deforestation; [11]), with the po-tential to create additional environmental problems like climate change and loss of biodiversity . The consump-tion of scarce resources is another relevant problem . Manufacturing most means of transport requires the use of different metals, which, given the increasing demand worldwide, puts pressure on the available reserves . In particular, electric transport generally needs batteries for storing electricity, and these batteries are typically based on metals such as lithium or nickel, for which the future availability may not meet the demands of a growing demand for BEVs . The consumption of these resources and their possible end-of-life recycling should therefore be included in the environmental sustainabil-ity assessment to provide an accurate account of the
Figure 2 . Comparison of the impacts from the entire life cycle of internal combustion engine vehicles (ICEV) and battery electric vehicles (BEV) for three impact categories: climate change, particulate matter formation, and toxicity impacts on human health from chemical releases (termed ‘human toxicity, cancer effects’) . Medium-size vehicles for Copenhagen in 2016 for a functional unit of 1 km driven under average conditions . Based on [2] .
therefore be included in the environmental sustainability assessment to provide an accurate account of the contribution of the system to the future availability of these resources.
Figure 2. Comparison of the impacts from the entire life cycle of internal combustion engine vehicles (ICEV) and battery electric vehicles (BEV) for three impact categories: climate change, particulate matter formation, and toxicity impacts on human health from chemical releases (termed ‘human toxicity, cancer effects’). Medium-size vehicles for Copenhagen in 2016 for a functional unit of 1 km driven under average conditions. Based on [2].
Focus on the function LCA is frequently used to compare different solutions to a given problem. To ensure a fair and relevant comparison, it is essential that the alternative solutions deliver the same service. The required service or function must therefore be explicitly defined at the beginning of the analysis, both in quantitative terms (how much is delivered and for how long?) and qualitative terms (how well?). This definition is called the Functional Unit of the LCA and it is the anchoring point of the comparison, determining the reference flows of physical products that are needed for each of the compared alternatives.
In the comparative LCA, the delivered service is fixed, and the environmental impacts associated with delivering it are determined for each of the systems analysed. If we define eco-efficiency as the ratio between the delivered value or service and the environmental impact that is caused (be it climate change, damage to human health, acidification from air pollution or some other relevant environmental impact) [12]:
𝐸𝐸𝐸𝐸𝐸𝐸 − 𝑒𝑒𝑒𝑒𝑒𝑒𝑒𝑒𝐸𝐸𝑒𝑒𝑒𝑒𝑒𝑒𝐸𝐸𝑒𝑒 = ,-./0-1-,2-10/3-3452-,/67438
(Eq. 10.1)
… then LCA is the tool for comparing the eco-efficiency of products, services or the systems that provide them. Comparing levels of eco-efficiency is a relative sustainability assessment, answering the question: is it more sustainable to do A than to do B?
Together with the life cycle perspective and the broad coverage of environmental impacts, the focus on the delivered service through the functional unit is a key characteristic of LCA.
What is the service? The service or function delivered by transport systems and modes is to move goods or persons from one location to another. Moving from the societal level to the level of the individual transport technology in the context of a comparative life cycle assessment, we need to develop a definition of the transport service that ensures a fair comparison between different transport systems or modes. A quantitative description must reflect the quantity (number of persons, weight or volume of goods) that is being transported, the distance over which the transport occurs and the frequency with which it occurs (daily commuting, vacation travelling, freight transport from suppliers, etc.). The combination of these three factors typically results in a reference flow that, for person transport, is expressed as the product of the number of people transported and
Page 104 – Environmental sustainability of different transport modes Environmental sustainability of different transport modes – Page 105
DTU International Energy Report 2019 DTU International Energy Report 2019

LCAs of different transport technologies Multiple studies have analysed and compared the environmental sustainability of various transport modes using LCA over the last twenty years . In this section, we gather a few major lessons that can be drawn from these studies with regard to the environmental sustain-ability of transport systems, with a primary focus on passenger cars .
Regional location is a determining factor in the environmental performance of EVsWhen studying modes of electric transport, it is essential to take the regional location into account, as the electric-grid mixture that supplies the vehicles has different compositions in different countries and regions . The environmental impact of supplying 1 kWh of electricity varies considerably depending on whether that electricity is produced by a coal-fired power plant, via a solar park or from a hydropower plant (see e .g . [5]) . For a country like Norway, where electricity is generated nearly exclusively by hydropower, the per-kWh environ-mental impacts are much lower than those in a country like Germany, whose electricity mix consists mainly of fossils-based energy sources . As a consequence, the environmental impacts associated with using a BEV in Norway and in Germany are completely different . Another influential location-specific factor is the local climate . The need for heating and cooling vehicles, cabins or compartments varies largely depending on the location (e .g . north of Norway vs . south of Spain) and greatly influences the results of the LCAs of transport systems . With a drive-train efficiency of below 40%, the majority of the energy content of the fuel used by ICEVs is converted into heat in the internal combustion engine and is readily available for heating the interior of the car . In contrast, with an efficiency close to 100% BEV engines do not produce any waste heat, so they have to use energy from the battery to produce and provide heat for the vehicle interior . In cold climates, this additional energy requirement can be very significant during large parts of the year . Egede [15] studied the benefits in terms of climate change impacts of using a BEV compared to an ICEV in each country of the world, accounting for differences in both the composition of the electricity mix and different climates . The results of her region-specific comparison of ICEVs and BEVs in the map in Figure 3 shows that, even though the electric-ity mix has a greater influence than local climate on contributions to global warming, the heat requirement has the tendency to shift the overall results in favour of ICEVs in cold regions, like Denmark or Canada, given the electricity mixes that are relevant at the time of writing .
It is important to note, however, that although ICEVs appear to be more attractive than BEVs from a climate change perspective in several countries in the world, the planned transition of the electricity grid mixes towards a higher share of renewables in many parts of the world, and to a lesser extent the foreseen warming of local cli-mates, mean that the map is bound to change in coming years, with increasing number of countries in which EVs would be more advantageous than ICEVs .
Large environmental impacts from fuel life cyclesThe environmental impacts of fuel production and use have been flagged in many studies as being of great im-portance to the overall burden of the transport systems being considered, regardless of the technology in use . Therefore, the full life cycle of the fuel should always be included in the assessments . For ICEVs, the life cycle en-vironmental impacts of fuel production and combustion typically dominate over the impacts from manufacturing the vehicle itself . For vehicles using biofuels instead of petroleum products, the environmental burden may remain in the vehicle’s use stage but shift from one category (climate change) to others (land use, eutrophi-cation from fertilizers) . With regard to BEVs, the ‘fuel’ life cycle may be as important as the vehicle life cycle, depending on the electricity mix supporting operation of the EVs . One way to illustrate the relative contribution of the fuel to the total environmental burden is to perform a breakeven point analysis . An example is given in Fig-ure 4, where one can conceptually estimate the driving distance at which a BEV becomes more environmentally friendly than an ICEV or a hybrid vehicle . The importance of the fuel life cycle can be extended to less mature transport technologies, such as fuel-cell electric vehicles (FCEV), for which hydrogen production may have drasti-cally different impacts, depending on how it is produced (e .g . more than one order of magnitude variation in climate change impacts [16]), or to vehicles driving on biofuels, for which the production of the biofuels may have significant environmental impacts (see Chapter 9) .
Relatively low environmental contribution from infrastructure Many LCAs of transport systems have shown that in-frastructure makes only a negligible contribution to the total environmental burden of the systems . This can be demonstrated by taking into account entire urban sys-tems, where the infrastructure needs are scaled to the transport demand . For example, in their systemic study of Copenhagen’s passenger car fleet over 2016-2030, Bohnes and co-workers [2] concluded that the impacts linked to the construction of new charging infrastructure
public transport or bikes) . The financial savings might thus result in increased consumption, meaning that in the total picture, the result of increased eco-efficiency might become a negligible reduction or even an increase in the environmental impacts of this transport mode . This is an example of a rebound effect that has been observed to accompany eco-efficiency improvements in many technologies [13] . This means that technological improvements in eco-efficiency must be accompanied by other measures with the potential to regulate user be-haviour (such as time-of-use pricing) in order to deliver more environmentally sustainable solutions .
Interactions with other systemsAnother crucial aspect to consider when assessing the sustainability of transport is that any change in the transport system (e .g . implementation of new technol-ogies, changes of materials used in existing cars, buses, trains, etc .) might have unintended consequences due to its strong dependence on and interaction with external systems . These consequences may trigger potentially large environmental impacts, which in some cases might even neutralize the intended impact reductions from the
original change in the assessed system . For example, initiatives leading to a high number of passenger cars being replaced by BEVs may change a country’s or city’s electricity demand to such an extent that it requires the construction of additional electricity production systems [e .g .14] . In this example, the interconnections between the electricity generation system and the transport system and the resulting impacts on ecosystems, human health and natural resources should therefore be accounted for . It is also important to consider which means of transport are being replaced or altered when addressing transport changes . Taking electric scooters as an example, they may significantly decrease the environmental impact when they are used to replace a car with a single passenger . However, if used mainly as a luxury means of replacing biking or walking, they result in increased environmental impacts . Therefore, in mac-ro-level studies (e .g . urban, regional or national scales), it is essential to consider carefully the full consequences of changes to existing transport systems early in the planning and design process to ensure that all relevant elements are included in the system boundaries of the assessment .
Figure 3 . World repartition of countries where petrol-driven internal combustion engine vehicles are advantageous for climate change impacts, compared to electric vehicles with Li-FePo4 batteries . Results have been internally normalized to the best performing region . Taken from [17], reflecting national electricity grid mixtures around 2016 .
Page 106 – Environmental sustainability of different transport modes Environmental sustainability of different transport modes – Page 107
DTU International Energy Report 2019 DTU International Energy Report 2019
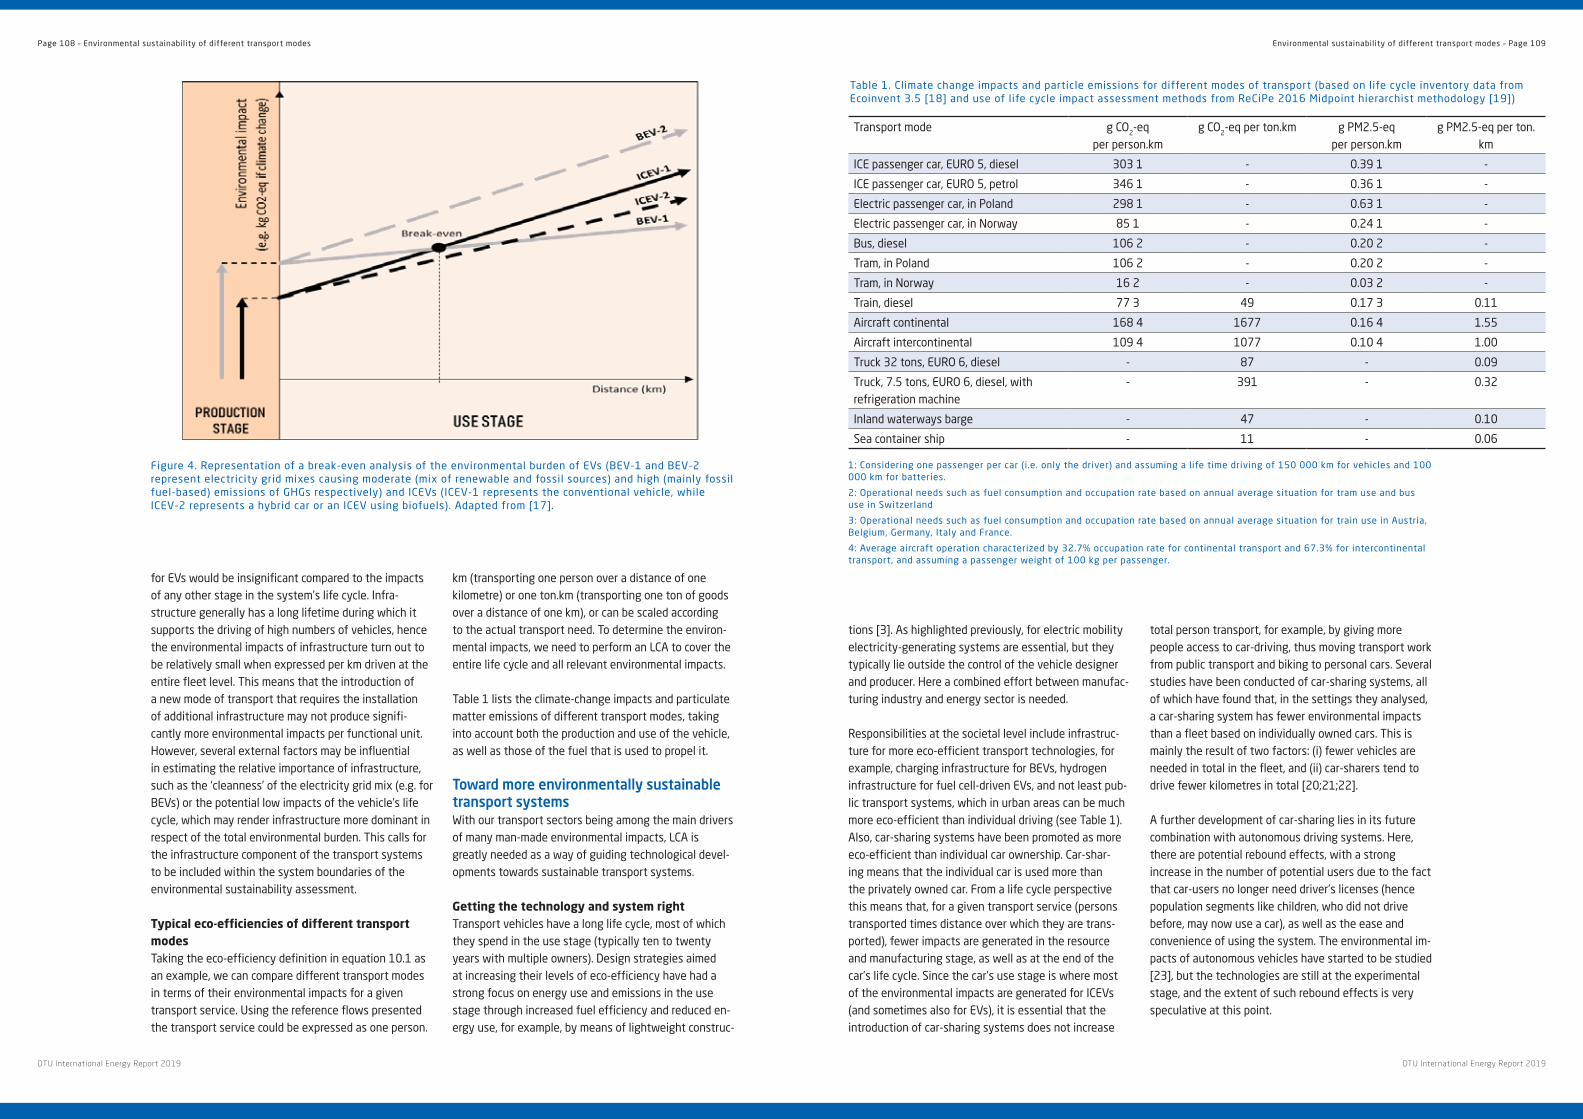
tions [3] . As highlighted previously, for electric mobility electricity-generating systems are essential, but they typically lie outside the control of the vehicle designer and producer . Here a combined effort between manufac-turing industry and energy sector is needed .
Responsibilities at the societal level include infrastruc-ture for more eco-efficient transport technologies, for example, charging infrastructure for BEVs, hydrogen infrastructure for fuel cell-driven EVs, and not least pub-lic transport systems, which in urban areas can be much more eco-efficient than individual driving (see Table 1) . Also, car-sharing systems have been promoted as more eco-efficient than individual car ownership . Car-shar-ing means that the individual car is used more than the privately owned car . From a life cycle perspective this means that, for a given transport service (persons transported times distance over which they are trans-ported), fewer impacts are generated in the resource and manufacturing stage, as well as at the end of the car’s life cycle . Since the car’s use stage is where most of the environmental impacts are generated for ICEVs (and sometimes also for EVs), it is essential that the introduction of car-sharing systems does not increase
total person transport, for example, by giving more people access to car-driving, thus moving transport work from public transport and biking to personal cars . Several studies have been conducted of car-sharing systems, all of which have found that, in the settings they analysed, a car-sharing system has fewer environmental impacts than a fleet based on individually owned cars . This is mainly the result of two factors: (i) fewer vehicles are needed in total in the fleet, and (ii) car-sharers tend to drive fewer kilometres in total [20;21;22] .
A further development of car-sharing lies in its future combination with autonomous driving systems . Here, there are potential rebound effects, with a strong increase in the number of potential users due to the fact that car-users no longer need driver’s licenses (hence population segments like children, who did not drive before, may now use a car), as well as the ease and convenience of using the system . The environmental im-pacts of autonomous vehicles have started to be studied [23], but the technologies are still at the experimental stage, and the extent of such rebound effects is very speculative at this point .
for EVs would be insignificant compared to the impacts of any other stage in the system’s life cycle . Infra-structure generally has a long lifetime during which it supports the driving of high numbers of vehicles, hence the environmental impacts of infrastructure turn out to be relatively small when expressed per km driven at the entire fleet level . This means that the introduction of a new mode of transport that requires the installation of additional infrastructure may not produce signifi-cantly more environmental impacts per functional unit . However, several external factors may be influential in estimating the relative importance of infrastructure, such as the ‘cleanness’ of the electricity grid mix (e .g . for BEVs) or the potential low impacts of the vehicle’s life cycle, which may render infrastructure more dominant in respect of the total environmental burden . This calls for the infrastructure component of the transport systems to be included within the system boundaries of the environmental sustainability assessment .
Typical eco-efficiencies of different transport modesTaking the eco-efficiency definition in equation 10 .1 as an example, we can compare different transport modes in terms of their environmental impacts for a given transport service . Using the reference flows presented the transport service could be expressed as one person .
km (transporting one person over a distance of one kilometre) or one ton .km (transporting one ton of goods over a distance of one km), or can be scaled according to the actual transport need . To determine the environ-mental impacts, we need to perform an LCA to cover the entire life cycle and all relevant environmental impacts .
Table 1 lists the climate-change impacts and particulate matter emissions of different transport modes, taking into account both the production and use of the vehicle, as well as those of the fuel that is used to propel it .
Toward more environmentally sustainable transport systems With our transport sectors being among the main drivers of many man-made environmental impacts, LCA is greatly needed as a way of guiding technological devel-opments towards sustainable transport systems .
Getting the technology and system rightTransport vehicles have a long life cycle, most of which they spend in the use stage (typically ten to twenty years with multiple owners) . Design strategies aimed at increasing their levels of eco-efficiency have had a strong focus on energy use and emissions in the use stage through increased fuel efficiency and reduced en-ergy use, for example, by means of lightweight construc-
Figure 4 . Representation of a break-even analysis of the environmental burden of EVs (BEV-1 and BEV-2 represent electricity grid mixes causing moderate (mix of renewable and fossil sources) and high (mainly fossil fuel-based) emissions of GHGs respectively) and ICEVs (ICEV-1 represents the conventional vehicle, while ICEV-2 represents a hybrid car or an ICEV using biofuels) . Adapted from [17] .
Transport mode g CO2-eq per person .km
g CO2-eq per ton .km g PM2 .5-eq per person .km
g PM2 .5-eq per ton .km
ICE passenger car, EURO 5, diesel 303 1 - 0 .39 1 -
ICE passenger car, EURO 5, petrol 346 1 - 0 .36 1 -
Electric passenger car, in Poland 298 1 - 0 .63 1 -
Electric passenger car, in Norway 85 1 - 0 .24 1 -
Bus, diesel 106 2 - 0 .20 2 -
Tram, in Poland 106 2 - 0 .20 2 -
Tram, in Norway 16 2 - 0 .03 2 -
Train, diesel 77 3 49 0 .17 3 0 .11
Aircraft continental 168 4 1677 0 .16 4 1 .55
Aircraft intercontinental 109 4 1077 0 .10 4 1 .00
Truck 32 tons, EURO 6, diesel - 87 - 0 .09
Truck, 7 .5 tons, EURO 6, diesel, with refrigeration machine
- 391 - 0 .32
Inland waterways barge - 47 - 0 .10
Sea container ship - 11 - 0 .06
1: Considering one passenger per car (i .e . only the driver) and assuming a life time driving of 150 000 km for vehicles and 100 000 km for batteries .
2: Operational needs such as fuel consumption and occupation rate based on annual average situation for tram use and bus use in Switzerland
3: Operational needs such as fuel consumption and occupation rate based on annual average situation for train use in Austria, Belgium, Germany, Italy and France .
4: Average aircraft operation characterized by 32 .7% occupation rate for continental transport and 67 .3% for intercontinental transport, and assuming a passenger weight of 100 kg per passenger .
Table 1 . Climate change impacts and particle emissions for different modes of transport (based on life cycle inventory data from Ecoinvent 3 .5 [18] and use of life cycle impact assessment methods from ReCiPe 2016 Midpoint hierarchist methodology [19])
Page 108 – Environmental sustainability of different transport modes Environmental sustainability of different transport modes – Page 109
DTU International Energy Report 2019 DTU International Energy Report 2019
References1 . UN (2019) United Nations’ Sustainable Development Goals https://www .un .org/sustainabledevelopment/sustainable-development-goals/
(accessed 6 September 2019) .
2 . Bohnes FA, Gregg JS . Laurent A . Environmental Impacts of Future Urban Deployment of Electric Vehicles: Assessment Framework and Case
Study of Copenhagen for 2016–2030 . 2017; Environ Sci Technol; 51:13995–14005 .
3 . Herrmann C, Dewulf W, Hauschild MZ, Kaluza A, Kara S, Skerlos S . Life cycle engineering of lightweight structures . 2018; CIRP Ann-Manuf
Techn 62(2):651-672 .
4 . Lewis AM, Kelly JC, Keoleian GA Vehicle lightweighting vs . electrification: life cycle energy and GHG emissions results for diverse powertrain
vehicles . 2014; Appl Energy 126:13–20 .
5 . Laurent A, Espinosa N, Hauschild MZ . LCA of Energy Systems . In: Hauschild MZ, Rosenbaum RK, Olsen SI, editors . Life Cycle Assessment:
Theory and Practice . Dordrecht, NL: Springer; 2018, pp 633–668 .
6 . Environmental management—life cycle assessment—principles and framework (ISO 14040) . Geneva, Switzerland; ISO, The International
Organization for Standardization; 2006a .
7 . ISO (2006b) Environmental management—life cycle assessment—requirements and guidelines (ISO 14044) . Geneva, Switzerland; ISO, The
International Organization for Standardization; 2006b .
8 . European Commission—Joint Research Centre—Institute for Environment and Sustainability: International Reference Life Cycle Data System
(ILCD) Handbook—General guide for Life Cycle Assessment—Detailed guidance . First edition March 2010 . EUR 24708 EN . Luxembourg .
Publications Office of the European Union .
9 . Hauschild MZ, Rosenbaum RK, Olsen SI, editors . Life Cycle Assessment: Theory and Practice . Dordrecht, NL: Springer; 2018 .
10 . Laurent A, Olsen SI, Hauschild MZ . Limitations of Carbon Footprint as Indicator of Environmental Sustainability . 2012; Environ Sci Technol
46(7):4100–4108 .
11 . Lapola DM, Schaldach R, Alcamo J, Bondeau A, Koch J, Koelking C, Priess JA . Indirect land-use changes can overcome carbon savings from
biofuels in Brazil . 2010; PNAS 107:3388–3393 .
12 . Hauschild MZ . Better – but is it good enough? On the Need to Consider Both Eco-efficiency and Eco-effectiveness to Gauge Industrial
Sustainability . 2015; Procedia CIRP 29:1-7 .
13 . Magee CL, Devezas TC . A simple extension of dematerialization theory: incorporation of technical progress and the rebound effect . 2016;
Technol Forecast Soc 117: 196–205 .
14 . Heinrichs HU, Jochem P . Long-term impacts of battery electric vehicles on the German electricity system . 2016; EPJ ST; 225:583–593 .
15 . Egede P . Environmental Assessment of Lightweight Electric Vehicles . Switzerland: Springer International Publishing AG; 2016, ISBN 978-3-
319-40277-2 .
16 . Cetinkaya E, Dincer I, Naterer GF . Life cycle assessment of various hydrogen production methods . 2012; Int J Hydrogen Energ; 37:2071–
2080 .
17 . Cerdas F, Egede P, Herrmann C . LCA of Electromobility . In: Hauschild MZ, Rosenbaum RK, Olsen SI, editors . Life Cycle Assessment: Theory and
Practice . Dordrecht, NL: Springer; 2018, p 669–693 .
18 . Wernet G, Bauer C, Steubing B, Reinhard J, Moreno-Ruiz E, Weidema B . The ecoinvent database version 3 (part I): overview and methodology .
2016; Int J Life Cycle Assess 21:1218–30 .
19 . Huijbregts MAJ, Steinmann ZJN, Elshout PMF, Stam G, Verones F, Vieira M, Zijp M, Hollander A, van Zelm R . ReCiPe2016: a harmonised life
cycle impact assessment method at midpoint and endpoint level . 2017; Int J Life Cycle Assess 22:138–147 .
20 . Chen TD, Kockelman KM . Carsharing’s life-cycle impacts on energy use and greenhouse gas emissions . 2016; Transport Res D-Tr E; 47:276–
284 .
21 . Nijland H, van Meerkerk J . Mobility and environmental impacts of car sharing in the Netherlands . 2017; Environ Innov Soc Tr 23:84–91 .
22 . Kawaguchi T, Murata H, Fukushige S, Kobayashi H . Scenario Analysis of Car- and Ride-Sharing Services Based on Life Cycle Simulation . 2019;
Procedia CIRP 80:328–333 .
23 . Gawron JH, Keoleian GA, De Kleine RD, Wallington TJ, Kim HC . Life Cycle Assessment of Connected and Automated Vehicles: Sensing and
Computing Subsystem and Vehicle Level Effects . 2018; Environ Sci Technol; 52:3249–3256 .
24 . Steffen W, Richardson K, Rockström J, Cornell S, Fetzer I, Bennett E, Biggs R, Carpenter S .Planetary boundaries: guiding human development
on a changing planet . 2015; Science 347, 6223 .
25 . Global Footprint Network . Ecological Footprint Standards 2009 . Oakland: Global Footprint Network . Available at www .footprintstandards .org .
26 . Bjørn A, Hauschild MZ . Introducing carrying capacity-based normalisation in LCA: framework and development of references at midpoint
level . Int J Life Cycle Assess . 2015; 20:1005–1018 .
27 . UN (2015) United Nations Framework Convention on Climate Change https://treaties .un .org/Pages/ViewDetails .aspx?src=TREATY&mtdsg_
no=XXVII-7-d&chapter=27&lang=_en&clang=_en (accessed 6 Spetember 2019) .
28 . Summary for Policymakers . In: Masson-Delmotte V, Zhai P, Pörtner HO, Roberts D, Skea J, Shukla PR, Pirani A, Moufouma-Okia W, Péan C,
Pidcock R, Connors S, Matthews JBR, Chen Y, Zhou X, Gomis MI, Lonnoy E, Maycock T, Tignor M, Waterfield T . editors . Global warming of 1 .5°C .
An IPCC Special Report on the impacts of global warming of 1 .5°C above pre-industrial levels and related global greenhouse gas emission
pathways, in the context of strengthening the global response to the threat of climate change, sustainable development, and efforts to
eradicate poverty . Geneva, Switzerland; World Meteorological Organization; 2018 .
The absolute sustainability challenge for transportSome of these technological developments have strong potential for improving the environmental performance of transport systems by increasing their levels of eco-ef-ficiency . However, efficiency improvements have a ten-dency to rebound in the form of increases in consump-tion or use . In that sense they are not eco-effective in allowing us to arrive at transport systems and solutions that are sustainable in absolute terms and not just more sustainable than what we are used to . To understand what is needed for sustainable transport systems, we need to relate to absolute boundaries for environmental impacts . Several top-down approaches to determine absolute environmental sustainability targets or bound-aries at the global or regional level have been proposed . These include the Planetary Boundaries framework [24], the Ecological Footprint framework [25] and, with a particular focus on technological assessments, the intro-duction of absolute sustainability targets in LCA [25] .
Absolute sustainability boundaries for climate change impacts have entered the realm of international policy through the international agreement for reductions in climate impact aiming to keep the increase in global average atmospheric temperatures at or below 1 .5 degrees above pre-industrial levels (the Paris Agreement of the United Nations Framework Convention on Climate Change, [27]) . The absolute sustainability frameworks identify the need to reduce environmental impacts and increase eco-efficiency dramatically . For climate change, the requirement is to reduce CO2 emissions by around 80% by 2030 [28] . For local pollution, similar reductions are needed in many major cities . The transport sector needs to deliver eco-efficiency improvements that make such reductions possible, in spite of the growth in global population, the growth in affluence and therefore con-sumption, and increased access to mobility in many parts of the world . Huge challenges thus lie ahead in going from better to good enough, from greener transport to transport systems that are sustainable in absolute terms .
Page 110 – Environmental sustainability of different transport modes Environmental sustainability of different transport modes – Page 111
DTU International Energy Report 2019 DTU International Energy Report 2019
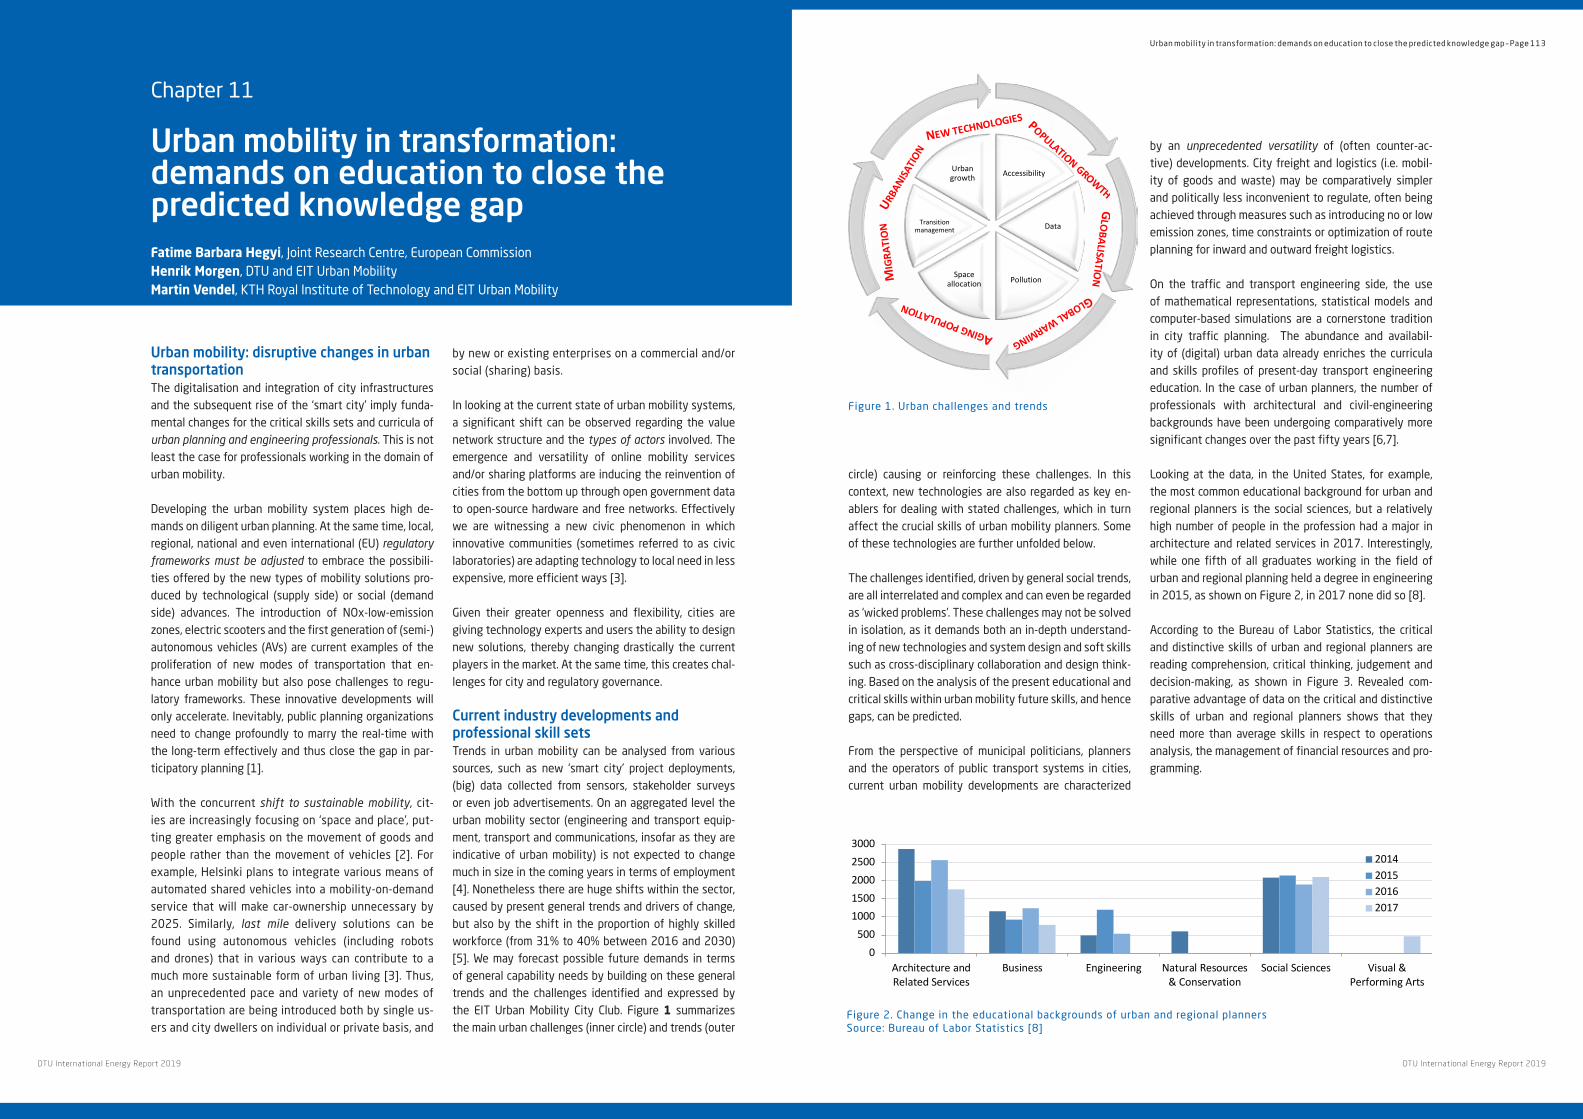
circle) causing or reinforcing these challenges . In this context, new technologies are also regarded as key en-ablers for dealing with stated challenges, which in turn affect the crucial skills of urban mobility planners . Some of these technologies are further unfolded below .
The challenges identified, driven by general social trends, are all interrelated and complex and can even be regarded as ‘wicked problems’ . These challenges may not be solved in isolation, as it demands both an in-depth understand-ing of new technologies and system design and soft skills such as cross-disciplinary collaboration and design think-ing . Based on the analysis of the present educational and critical skills within urban mobility future skills, and hence gaps, can be predicted .
From the perspective of municipal politicians, planners and the operators of public transport systems in cities, current urban mobility developments are characterized
by an unprecedented versatility of (often counter-ac-tive) developments . City freight and logistics (i .e . mobil-ity of goods and waste) may be comparatively simpler and politically less inconvenient to regulate, often being achieved through measures such as introducing no or low emission zones, time constraints or optimization of route planning for inward and outward freight logistics .
On the traffic and transport engineering side, the use of mathematical representations, statistical models and computer-based simulations are a cornerstone tradition in city traffic planning . The abundance and availabil-ity of (digital) urban data already enriches the curricula and skills profiles of present-day transport engineering education . In the case of urban planners, the number of professionals with architectural and civil-engineering backgrounds have been undergoing comparatively more significant changes over the past fifty years [6,7] .
Looking at the data, in the United States, for example, the most common educational background for urban and regional planners is the social sciences, but a relatively high number of people in the profession had a major in architecture and related services in 2017 . Interestingly, while one fifth of all graduates working in the field of urban and regional planning held a degree in engineering in 2015, as shown on Figure 2, in 2017 none did so [8] .
According to the Bureau of Labor Statistics, the critical and distinctive skills of urban and regional planners are reading comprehension, critical thinking, judgement and decision-making, as shown in Figure 3 . Revealed com-parative advantage of data on the critical and distinctive skills of urban and regional planners shows that they need more than average skills in respect to operations analysis, the management of financial resources and pro-gramming .
Urban mobility: disruptive changes in urban transportationThe digitalisation and integration of city infrastructures and the subsequent rise of the ‘smart city’ imply funda-mental changes for the critical skills sets and curricula of urban planning and engineering professionals . This is not least the case for professionals working in the domain of urban mobility .
Developing the urban mobility system places high de-mands on diligent urban planning . At the same time, local, regional, national and even international (EU) regulatory frameworks must be adjusted to embrace the possibili-ties offered by the new types of mobility solutions pro-duced by technological (supply side) or social (demand side) advances . The introduction of NOx-low-emission zones, electric scooters and the first generation of (semi-) autonomous vehicles (AVs) are current examples of the proliferation of new modes of transportation that en-hance urban mobility but also pose challenges to regu-latory frameworks . These innovative developments will only accelerate . Inevitably, public planning organizations need to change profoundly to marry the real-time with the long-term effectively and thus close the gap in par-ticipatory planning [1] .
With the concurrent shift to sustainable mobility, cit-ies are increasingly focusing on ‘space and place’, put-ting greater emphasis on the movement of goods and people rather than the movement of vehicles [2] . For example, Helsinki plans to integrate various means of automated shared vehicles into a mobility-on-demand service that will make car-ownership unnecessary by 2025 . Similarly, last mile delivery solutions can be found using autonomous vehicles (including robots and drones) that in various ways can contribute to a much more sustainable form of urban living [3] . Thus, an unprecedented pace and variety of new modes of transportation are being introduced both by single us-ers and city dwellers on individual or private basis, and
by new or existing enterprises on a commercial and/or social (sharing) basis .
In looking at the current state of urban mobility systems, a significant shift can be observed regarding the value network structure and the types of actors involved . The emergence and versatility of online mobility services and/or sharing platforms are inducing the reinvention of cities from the bottom up through open government data to open-source hardware and free networks . Effectively we are witnessing a new civic phenomenon in which innovative communities (sometimes referred to as civic laboratories) are adapting technology to local need in less expensive, more efficient ways [3] .
Given their greater openness and flexibility, cities are giving technology experts and users the ability to design new solutions, thereby changing drastically the current players in the market . At the same time, this creates chal-lenges for city and regulatory governance .
Current industry developments and professional skill sets Trends in urban mobility can be analysed from various sources, such as new ‘smart city’ project deployments, (big) data collected from sensors, stakeholder surveys or even job advertisements . On an aggregated level the urban mobility sector (engineering and transport equip-ment, transport and communications, insofar as they are indicative of urban mobility) is not expected to change much in size in the coming years in terms of employment [4] . Nonetheless there are huge shifts within the sector, caused by present general trends and drivers of change, but also by the shift in the proportion of highly skilled workforce (from 31% to 40% between 2016 and 2030)[5] . We may forecast possible future demands in terms of general capability needs by building on these general trends and the challenges identified and expressed by the EIT Urban Mobility City Club . Figure 1 summarizes the main urban challenges (inner circle) and trends (outer
Chapter 11
Urban mobility in transformation: demands on education to close the predicted knowledge gapFatime Barbara Hegyi, Joint Research Centre, European Commission Henrik Morgen, DTU and EIT Urban Mobility Martin Vendel, KTH Royal Institute of Technology and EIT Urban Mobility
2
identified and expressed by the EIT Urban Mobility City Club.i Figure 1 summarizes the main urban challenges (inner circle) and trends (outer circle) causing or reinforcing these challenges. In this con-text, new technologies are also regarded as key enablers for dealing with stated challenges, which in turn affect the crucial skills of urban mobility planners. Some of these technologies are further un-folded below.
Figure 1. Urban challenges and trends
The challenges identified, driven by general social trends, are all interrelated and complex and can even be regarded as ‘wicked problems’. These challenges may not be solved in isolation, as it demands both an in-depth understanding of new technologies and system design and soft skills such as cross-disciplinary collaboration and design thinking. Based on the analysis of the present educational and critical skills within urban mobility future skills, and hence gaps, can be predicted.
From the perspective of municipal politicians, planners and the operators of public transport systems in cities, current urban mobility developments are characterized by an unprecedented versatility of (often counter-active) developments. City freight and logistics (i.e. mobility of goods and waste) may be comparatively simpler and politically less inconvenient to regulate, often being achieved through measures such as introducing no or low emission zones, time constraints or optimization of route plan-ning for inward and outward freight logistics.
On the traffic and transport engineering side, the use of mathematical representations, statistical mod-els and computer-based simulations are a cornerstone tradition in city traffic planning. The abundance and availability of (digital) urban data already enriches the curricula and skills profiles of present-day transport engineering education. In the case of urban planners, the number of professionals with ar-chitectural and civil-engineering backgrounds have been undergoing comparatively more significant changes over the past fifty years [6,7].
Looking at the data, in the United States, for example, the most common educational background for urban and regional planners is the social sciences, but a relatively high number of people in the pro-fession had a major in architecture and related services in 2017. Interestingly, while one fifth of all graduates working in the field of urban and regional planning held a degree in engineering in 2015, as shown on Figure 2, in 2017 none did so [8].
i EIT Urban Mobility City Club workshop February 27th 2019, Amsterdam.
Accessibility
Data
PollutionSpace allocation
Transition management
Urban growth
URBAN
ISATI
ON
POPULATION GROWTH
GLOBAL WARMING AGING POPULATION
GLO
BALISATION M
IGRA
TIO
N
NEW TECHNOLOGIES
Figure 1 . Urban challenges and trends
3
Figure 2. Change in the educational backgrounds of urban and regional planners
Source: Bureau of Labor Statistics [8]
According to the Bureau of Labor Statistics, the critical and distinctive skills of urban and regional plan-ners are reading comprehension, critical thinking, judgement and decision-making, as shown in Figure 3. Revealed comparative advantage of data on the critical and distinctive skills of urban and regional planners shows that they need more than average skills in respect to operations analysis, the manage-ment of financial resources and programming.
Figure 3. Critical and distinctive skills of urban and regional planners
Source: Bureau of Labor Statistics [8]
The same set of data shows that transportation and highway engineers also need numerous and ver-satile skills, as shown in Figure 4. The continuous line represents the absolute rating of necessary skills, while the dashed line represents the change in the necessary skills of transportation and highway en-gineers between 2011 and 2017. Looking at the change in critical skills required there is a significant increase in resource management skills, complex problem-solving and technical skills.
0500
10001500200025003000
Architecture andRelated Services
Business Engineering Natural Resources& Conservation
Social Sciences Visual &Performing Arts
2014201520162017
00,5
11,5
22,5
33,5
44,5
Complex Problem SolvingReading Comprehension
WritingSpeaking
Mathematics
Science
Active Listening
Critical Thinking
Active Learning
Learning Strategies
Monitoring
Time Management
Management of Financial…
Management of Material…
Management of Personnel…Social Perceptiveness
CoordinationPersuasionNegotiationInstructingService Orientation
Judgment and Decision Making
Systems Analysis
Systems Evaluation
Operations Analysis
Technology Design
Equipment Selection
Installation
Programming
Operation Monitoring
Operation and Control
Equipment MaintenanceTroubleshooting
RepairingQuality Control Analysis
Figure 2 . Change in the educational backgrounds of urban and regional plannersSource: Bureau of Labor Statistics [8]
Urban mobility in transformation: demands on education to close the predicted knowledge gap – Page 113
DTU International Energy Report 2019 DTU International Energy Report 2019
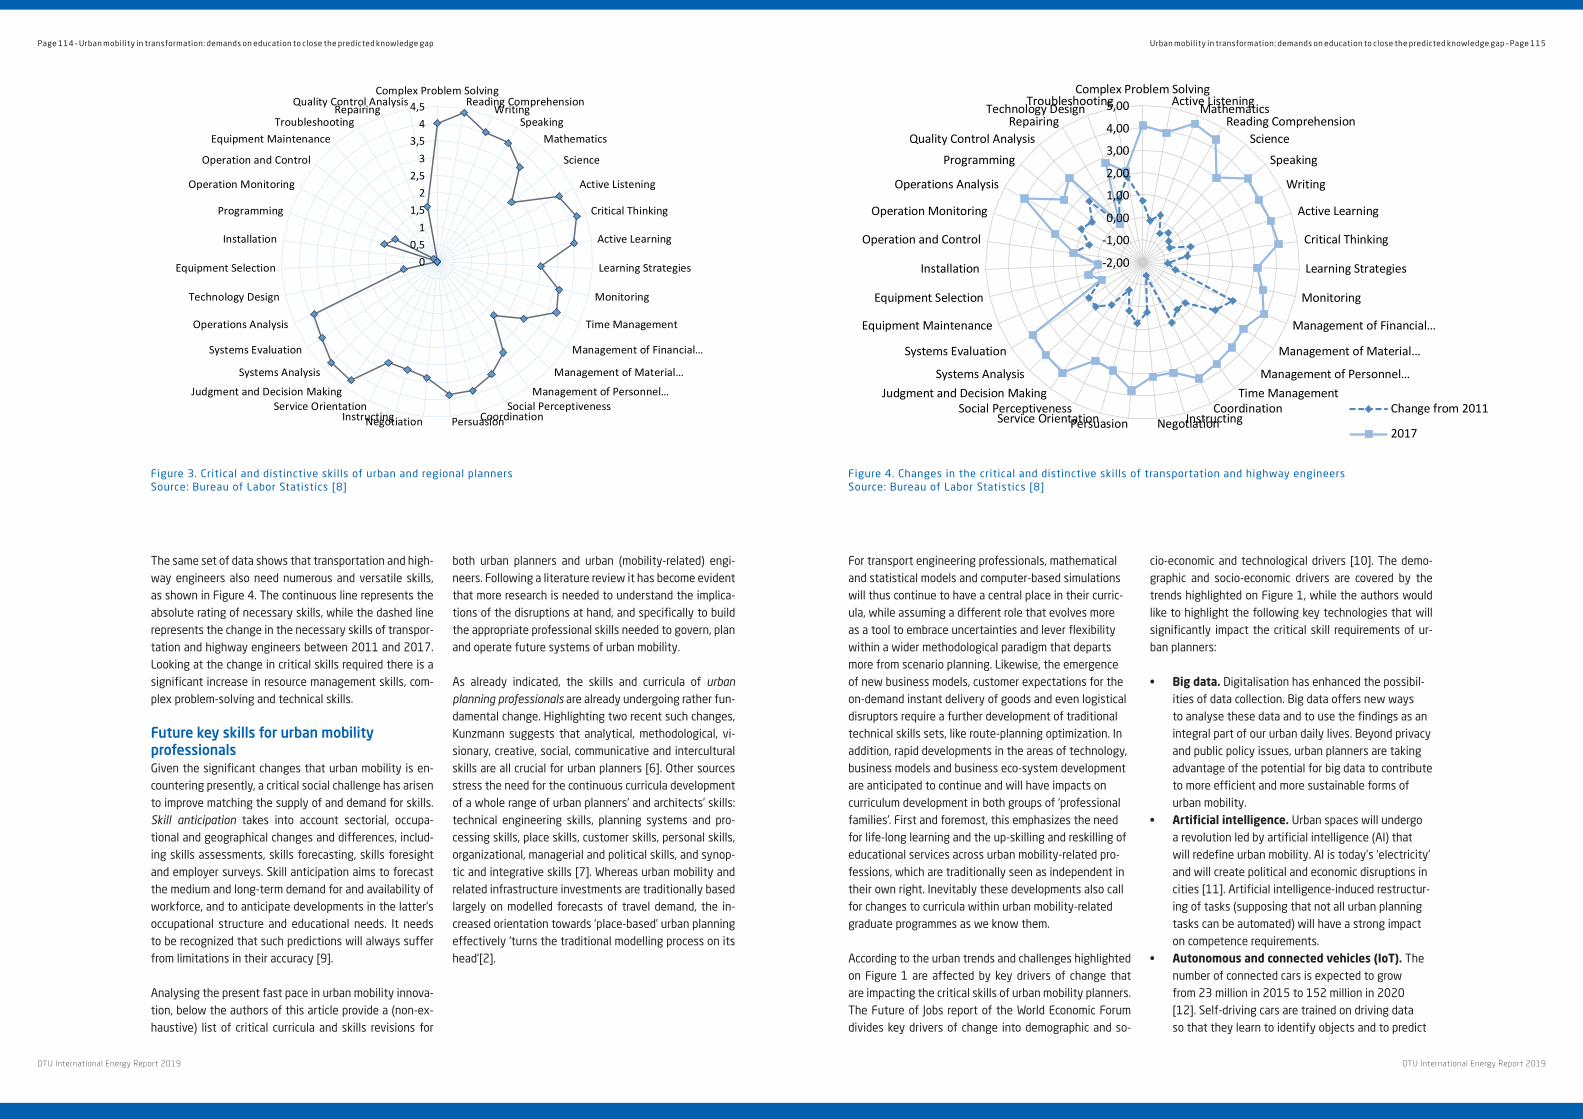
For transport engineering professionals, mathematical and statistical models and computer-based simulations will thus continue to have a central place in their curric-ula, while assuming a different role that evolves more as a tool to embrace uncertainties and lever flexibility within a wider methodological paradigm that departs more from scenario planning . Likewise, the emergence of new business models, customer expectations for the on-demand instant delivery of goods and even logistical disruptors require a further development of traditional technical skills sets, like route-planning optimization . In addition, rapid developments in the areas of technology, business models and business eco-system development are anticipated to continue and will have impacts on curriculum development in both groups of ‘professional families’ . First and foremost, this emphasizes the need for life-long learning and the up-skilling and reskilling of educational services across urban mobility-related pro-fessions, which are traditionally seen as independent in their own right . Inevitably these developments also call for changes to curricula within urban mobility-related graduate programmes as we know them .
According to the urban trends and challenges highlighted on Figure 1 are affected by key drivers of change that are impacting the critical skills of urban mobility planners . The Future of Jobs report of the World Economic Forum divides key drivers of change into demographic and so-
cio-economic and technological drivers [10] . The demo-graphic and socio-economic drivers are covered by the trends highlighted on Figure 1, while the authors would like to highlight the following key technologies that will significantly impact the critical skill requirements of ur-ban planners:
• Big data. Digitalisation has enhanced the possibil-ities of data collection . Big data offers new ways to analyse these data and to use the findings as an integral part of our urban daily lives . Beyond privacy and public policy issues, urban planners are taking advantage of the potential for big data to contribute to more efficient and more sustainable forms of urban mobility .
• Artificial intelligence. Urban spaces will undergo a revolution led by artificial intelligence (AI) that will redefine urban mobility . AI is today’s ‘electricity’ and will create political and economic disruptions in cities [11] . Artificial intelligence-induced restructur-ing of tasks (supposing that not all urban planning tasks can be automated) will have a strong impact on competence requirements .
• Autonomous and connected vehicles (IoT). The number of connected cars is expected to grow from 23 million in 2015 to 152 million in 2020 [12] . Self-driving cars are trained on driving data so that they learn to identify objects and to predict
The same set of data shows that transportation and high-way engineers also need numerous and versatile skills, as shown in Figure 4 . The continuous line represents the absolute rating of necessary skills, while the dashed line represents the change in the necessary skills of transpor-tation and highway engineers between 2011 and 2017 . Looking at the change in critical skills required there is a significant increase in resource management skills, com-plex problem-solving and technical skills .
Future key skills for urban mobility professionalsGiven the significant changes that urban mobility is en-countering presently, a critical social challenge has arisen to improve matching the supply of and demand for skills . Skill anticipation takes into account sectorial, occupa-tional and geographical changes and differences, includ-ing skills assessments, skills forecasting, skills foresight and employer surveys . Skill anticipation aims to forecast the medium and long-term demand for and availability of workforce, and to anticipate developments in the latter’s occupational structure and educational needs . It needs to be recognized that such predictions will always suffer from limitations in their accuracy [9] .
Analysing the present fast pace in urban mobility innova-tion, below the authors of this article provide a (non-ex-haustive) list of critical curricula and skills revisions for
both urban planners and urban (mobility-related) engi-neers . Following a literature review it has become evident that more research is needed to understand the implica-tions of the disruptions at hand, and specifically to build the appropriate professional skills needed to govern, plan and operate future systems of urban mobility .
As already indicated, the skills and curricula of urban planning professionals are already undergoing rather fun-damental change . Highlighting two recent such changes, Kunzmann suggests that analytical, methodological, vi-sionary, creative, social, communicative and intercultural skills are all crucial for urban planners [6] . Other sources stress the need for the continuous curricula development of a whole range of urban planners’ and architects’ skills: technical engineering skills, planning systems and pro-cessing skills, place skills, customer skills, personal skills, organizational, managerial and political skills, and synop-tic and integrative skills [7] . Whereas urban mobility and related infrastructure investments are traditionally based largely on modelled forecasts of travel demand, the in-creased orientation towards ‘place-based’ urban planning effectively ‘turns the traditional modelling process on its head’[2] .
3
Figure 2. Change in the educational backgrounds of urban and regional planners
Source: Bureau of Labor Statistics [8]
According to the Bureau of Labor Statistics, the critical and distinctive skills of urban and regional plan-ners are reading comprehension, critical thinking, judgement and decision-making, as shown in Figure 3. Revealed comparative advantage of data on the critical and distinctive skills of urban and regional planners shows that they need more than average skills in respect to operations analysis, the manage-ment of financial resources and programming.
Figure 3. Critical and distinctive skills of urban and regional planners
Source: Bureau of Labor Statistics [8]
The same set of data shows that transportation and highway engineers also need numerous and ver-satile skills, as shown in Figure 4. The continuous line represents the absolute rating of necessary skills, while the dashed line represents the change in the necessary skills of transportation and highway en-gineers between 2011 and 2017. Looking at the change in critical skills required there is a significant increase in resource management skills, complex problem-solving and technical skills.
0500
10001500200025003000
Architecture andRelated Services
Business Engineering Natural Resources& Conservation
Social Sciences Visual &Performing Arts
2014201520162017
00,5
11,5
22,5
33,5
44,5
Complex Problem SolvingReading Comprehension
WritingSpeaking
Mathematics
Science
Active Listening
Critical Thinking
Active Learning
Learning Strategies
Monitoring
Time Management
Management of Financial…
Management of Material…
Management of Personnel…Social Perceptiveness
CoordinationPersuasionNegotiationInstructingService Orientation
Judgment and Decision Making
Systems Analysis
Systems Evaluation
Operations Analysis
Technology Design
Equipment Selection
Installation
Programming
Operation Monitoring
Operation and Control
Equipment MaintenanceTroubleshooting
RepairingQuality Control Analysis
Figure 3 . Critical and distinctive skills of urban and regional plannersSource: Bureau of Labor Statistics [8]
4
Figure 4. Changes in the critical and distinctive skills of transportation and highway engineers
Source: Bureau of Labor Statistics [8]
Future key skills for urban mobility professionals Given the significant changes that urban mobility is encountering presently, a critical social challenge has arisen to improve matching the supply of and demand for skills. Skill anticipation takes into ac-count sectorial, occupational and geographical changes and differences, including skills assessments, skills forecasting, skills foresight and employer surveys. Skill anticipation aims to forecast the medium and long-term demand for and availability of workforce, and to anticipate developments in the latter’s occupational structure and educational needs. It needs to be recognized that such predictions will al-ways suffer from limitations in their accuracy [9].
Analysing the present fast pace in urban mobility innovation, below the authors of this article provide a (non-exhaustive) list of critical curricula and skills revisions for both urban planners and urban (mo-bility-related) engineers. Following a literature review it has become evident that more research is needed to understand the implications of the disruptions at hand, and specifically to build the appro-priate professional skills needed to govern, plan and operate future systems of urban mobility.
As already indicated, the skills and curricula of urban planning professionals are already undergoing rather fundamental change. Highlighting two recent such changes, Kunzmann suggests that analytical, methodological, visionary, creative, social, communicative and intercultural skills are all crucial for ur-ban planners [6]. Other sources stress the need for the continuous curricula development of a whole range of urban planners’ and architects’ skills: technical engineering skills, planning systems and pro-cessing skills, place skills, customer skills, personal skills, organizational, managerial and political skills, and synoptic and integrative skills [7]. Whereas urban mobility and related infrastructure investments are traditionally based largely on modelled forecasts of travel demand, the increased orientation to-wards ‘place-based’ urban planning effectively ‘turns the traditional modelling process on its head’[2].
-2,00
-1,00
0,00
1,00
2,00
3,00
4,00
5,00Complex Problem Solving
Active ListeningMathematicsReading Comprehension
Science
Speaking
Writing
Active Learning
Critical Thinking
Learning Strategies
Monitoring
Management of Financial…
Management of Material…
Management of Personnel…Time Management
CoordinationInstructingNegotiationPersuasionService Orientation
Social PerceptivenessJudgment and Decision Making
Systems Analysis
Systems Evaluation
Equipment Maintenance
Equipment Selection
Installation
Operation and Control
Operation Monitoring
Operations Analysis
Programming
Quality Control AnalysisRepairing
Technology DesignTroubleshooting
Change from 2011
2017
Figure 4 . Changes in the critical and distinctive skills of transportation and highway engineersSource: Bureau of Labor Statistics [8]
Page 114 – Urban mobility in transformation: demands on education to close the predicted knowledge gap Urban mobility in transformation: demands on education to close the predicted knowledge gap – Page 115
DTU International Energy Report 2019 DTU International Energy Report 2019
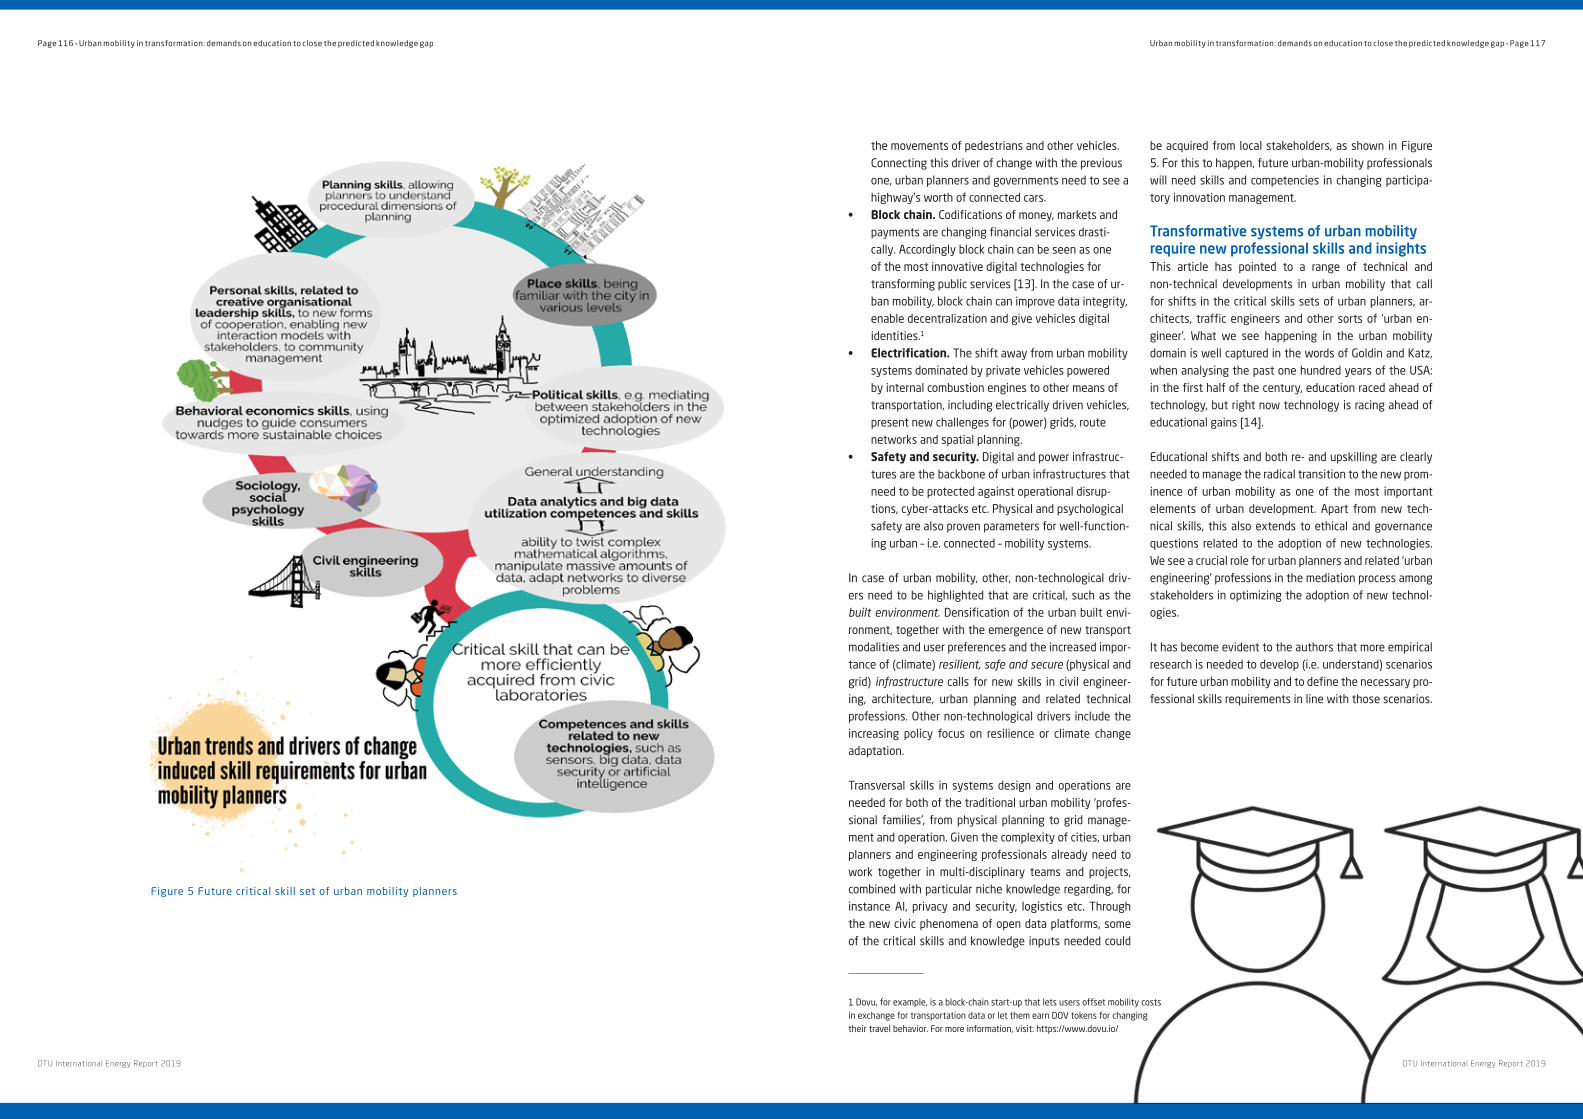
the movements of pedestrians and other vehicles . Connecting this driver of change with the previous one, urban planners and governments need to see a highway’s worth of connected cars .
• Block chain. Codifications of money, markets and payments are changing financial services drasti-cally . Accordingly block chain can be seen as one of the most innovative digital technologies for transforming public services [13] . In the case of ur-ban mobility, block chain can improve data integrity, enable decentralization and give vehicles digital identities .1
• Electrification. The shift away from urban mobility systems dominated by private vehicles powered by internal combustion engines to other means of transportation, including electrically driven vehicles, present new challenges for (power) grids, route networks and spatial planning .
• Safety and security. Digital and power infrastruc-tures are the backbone of urban infrastructures that need to be protected against operational disrup-tions, cyber-attacks etc . Physical and psychological safety are also proven parameters for well-function-ing urban – i .e . connected – mobility systems .
In case of urban mobility, other, non-technological driv-ers need to be highlighted that are critical, such as the built environment. Densification of the urban built envi-ronment, together with the emergence of new transport modalities and user preferences and the increased impor-tance of (climate) resilient, safe and secure (physical and grid) infrastructure calls for new skills in civil engineer-ing, architecture, urban planning and related technical professions . Other non-technological drivers include the increasing policy focus on resilience or climate change adaptation .
Transversal skills in systems design and operations are needed for both of the traditional urban mobility ‘profes-sional families’, from physical planning to grid manage-ment and operation . Given the complexity of cities, urban planners and engineering professionals already need to work together in multi-disciplinary teams and projects, combined with particular niche knowledge regarding, for instance AI, privacy and security, logistics etc . Through the new civic phenomena of open data platforms, some of the critical skills and knowledge inputs needed could
1 Dovu, for example, is a block-chain start-up that lets users offset mobility costs in exchange for transportation data or let them earn DOV tokens for changing their travel behavior . For more information, visit: https://www .dovu .io/
be acquired from local stakeholders, as shown in Figure 5 . For this to happen, future urban-mobility professionals will need skills and competencies in changing participa-tory innovation management .
Transformative systems of urban mobility require new professional skills and insights This article has pointed to a range of technical and non-technical developments in urban mobility that call for shifts in the critical skills sets of urban planners, ar-chitects, traffic engineers and other sorts of ‘urban en-gineer’ . What we see happening in the urban mobility domain is well captured in the words of Goldin and Katz, when analysing the past one hundred years of the USA: in the first half of the century, education raced ahead of technology, but right now technology is racing ahead of educational gains [14] .
Educational shifts and both re- and upskilling are clearly needed to manage the radical transition to the new prom-inence of urban mobility as one of the most important elements of urban development . Apart from new tech-nical skills, this also extends to ethical and governance questions related to the adoption of new technologies . We see a crucial role for urban planners and related ‘urban engineering’ professions in the mediation process among stakeholders in optimizing the adoption of new technol-ogies .
It has become evident to the authors that more empirical research is needed to develop (i .e . understand) scenarios for future urban mobility and to define the necessary pro-fessional skills requirements in line with those scenarios .
Figure 5 Future critical skill set of urban mobility planners
Page 116 – Urban mobility in transformation: demands on education to close the predicted knowledge gap Urban mobility in transformation: demands on education to close the predicted knowledge gap – Page 117
DTU International Energy Report 2019 DTU International Energy Report 2019

References1 . Townsend, A . M . Smart cities: big data, civic hackers, and the quest for a new utopia . New York: WW Norton & Company; 2013 .
2 . Jones, P . Create - Project Summary and Recommendations for Cities . United Kingdom: Landor Links; 2018 .
3 . Vandecasteele I, Baranzelli C, Siragusa A, Aurambout JP, editors . The Future of Cities – Opportunities, challenges and the way
forward . Luxembourg: Publications Office; 2019 .
4 . Cedefop . Skills forecast: trends and challenges to 2030 . Reference series No 108 . Luxembourg: Publications Office; 2018 .
Available from: http://data .europa .eu/doi/10 .2801/4492
5 . Skills Panorama . Skills Forecast: key EU trends to 2030 . 2018 . Available from: https://skillspanorama .cedefop .europa .eu/en/
analytical_highlights/skills-forecast-key-eu-trends-2030
6 . Kunzmann, KR . The Future of Planning Education in Europe . Aesop News, Summer 1997 . 3-6 p .
7 . Kitchen, T . Skills for Planning Practice . Environment, Cities . Basingstoke: Palgrave Macmillan; 2007 .
8 . Bureau of Labor Statistics . Occupational Employment Statistics . 2018 . Available from: https://www .bls .gov/oes/tables .htm
9 . Honkatukia, J . Vattage – a Dynamic, Applied General Equilibrium Model of the Finnish Economy . Helsinki: Government Institute
for Economic Research; 2009 .
10 . World Economic Forum . The Future of Jobs . Employment, Skills and Workforce Strategy for the Fourth Industrial Revolution .
2016 . Available from: http://www3 .weforum .org/docs/WEF_Future_of_Jobs .pdf
11 . Lee, KF . AI Superpowers: China, Silicon Valley, and the New World Order . Boston: Houghton Mifflin Harcourt; 2018 .
12 . Ross, A . The industries of the future . New York: Simon & Schuster; 2016 .
13 . Allessie D, Sobolewski M, Vaccari L, Pignatelli F, editors . Blockchain for digital government . Luxembourg: Publications Office of
the European Union; 2019 .
14 . Goldin C, Katz LF . The Race between Education and Technology . Cambridge: Harvard University Press; 2008 .
Page 118 – Urban mobility in transformation: demands on education to close the predicted knowledge gap Urban mobility in transformation: demands on education to close the predicted knowledge gap – Page 119
DTU International Energy Report 2019 DTU International Energy Report 2019
300 organizations working on topics related to sustain-able urban-mobility solutions . Figure 1 provides a visual summary of the diverse set of regions and organizations that have formed part of DTU’s sustainable urban-mobil-ity R&D ecosystem since 1984 .
Mapping DTU’s landscape of capabilities for sustainable urban-mobility solutionsObjective 1. Overview of worldwide collaborations with specific institutions and geographiesWe first analyse the collaborations with worldwide institutions to map DTU’s interactions in the area of sus-tainable transport solutions and to show how are they distributed geographically and over time .
From Figure 1, we can observe that collaborations are geographically spread, covering a wide range of countries and institutions . Although most collaborations are in Europe, organizations such as the Massachusetts Institute of Technology or MIT (United States) and the University of Queensland (Australia) rank among the collaborations with the highest number of shared out-puts . We also observe that the share of collaborations with the United States, China and other non-European countries is growing, evidence of increasing internation-alization in the collaborations .
Objective 2. Help identify the spectrum of research areas influencing the development of sustainable urban-mobility solutions and how they are connected to each other.To identify and map the clusters that constitute DTU’s ecosystem for sustainable urban-mobility solutions, we performed a network co-occurrence analysis, following the method described by Van Eck and Waltman [5] . In this analysis, DTU’s R&D ecosystem is modelled as two networks: 1) a topic co-occurrence network, where terms are connected if they co-occur in the same research output; and 2) a journal co-occurrence citation network, where research journals are connected based on their citation co-occurrence structures .
The topic co-occurrence network (Figure 2) allows us to understand how the sum of researchers in the ecosys-tem connects topics organically based on their own use of terms . The topics are keywords extracted from the content of each record in our database . In our case, after performing text normalization on the keywords (6), we gathered over 600 terms . The edges between the keywords represent co-occurrence relations, of which we reached over 5000 connections . Here, a connection between two keywords exists if they are mentioned together in at least one record . The more frequently two keywords are mentioned together, the stronger the connection between them .
Introduction: the network of technological capabilities for sustainable urban mobilityDeveloping solutions for sustainable urban mobility requires connecting knowledge and technologies from a diverse and large set of global actors [1;2] . As a result, drawing the boundaries of what is relevant research and development (R&D) into sustainable urban mobility is more a matter of deciding within a spectrum than of choosing upfront what is relevant and what is not .
For example, should R&D on transport to and from cities be included within the boundaries of urban mobility? What about applied R&D on image the recognition tech-nologies used for autonomous navigation, smart electric grids or new electricity storage solutions?
Likewise, R&D on urban mobility can be affected by decisions made in a number of research fields, including energy and transport policy, fuel research, economics, electric energy grids, human behaviour, etc . However, these fields are not just a disconnected set of indepen-dent silos but part of an interdependent whole, and the way in which they are connected to each other affects how urban mobility is designed and managed .
Inspired by the questions above, this chapter offers a quantitative and descriptive analysis of the research and development connected with ‘sustainable urban mobility’ produced at the Technical University of Den-mark (DTU) . Its objectives are 1) to provide an overview of worldwide collaborations with specific institutions and geographies; 2) to help identify the spectrum of research areas that are influencing the development of sustainable urban mobility solutions, as well as how they connect with each other; and 3) to map key R&D trends and thus offer a glimpse into future develop-ments in this area .
The analysis presented here is the result of mining global databases containing patents, scientific publi-
cations and research grants, and of modelling the R&D ecosystem as a complex network of individuals, organi-zations, geographical areas, documents and knowledge areas that evolves over time . The following sections describe the research method used in this study and the research results before providing a discussion of our findings and their implications .
Description of methodsWe have analysed DTU’s outputs related to sustainable urban-mobility solutions through a curated data set of more than 430 scientific publications, 50 patents and 40 EU-funded research projects . All these records have at least one participant from DTU and include content from a wide set of transport-related research fields .
The method for filtering the relevant publications, patents and EU-funded projects consisted in applying a global content filter to each of the three databases (publications, patents, EU projects), followed by a manual screening of the results to discard false positives . In Boolean form, the keyword-based search used for this study was the following:
The process of building this list was iterative and al-lowed both the authors of this report to review and pro-pose new keywords . The search strings used for filtering were selected following a strategy that seeks high recall and precision while recognizing the inherent trade-off between these attributes [3] . The applied method divides the search process into two steps, the first step aimed at maximizing recall (maximum coverage), the second focused on maximizing precision (removing false positives) [3;4]
The results of this search, although not exhaustive, provide us with records from diverse sources and fields, permitting a representative overview of content and collaborations over the last 35 years . In total, these records connect DTU with more than 40 countries and
Chapter 12
A network view of research and devel-opment in sustainable urban mobility
Pedro Parraguez, Dataverz Francesco Rosati, DTU Management
“city logistic*” OR “urban logistic*” OR “urban freight transport” OR “Transport Decarbonization” OR ((transport OR
mobility) AND “mode choice”) OR “transport modal shift” OR “*cycling transport*” OR “active modes of transport*” OR
“bicycling culture” OR “mobility culture” OR ((transport OR mobility) AND “route choice”) OR (“behavi* change” AND
(transport OR mobility)) OR “sustainable transport” OR walkability OR “travel demand” OR “travel socialisa*” OR
bikeability OR (connectivity AND (transport OR mobility)) OR (“on-demand” AND (transport OR mobility)) OR (“mobility
services” AND transport) OR (“travel behavior” AND (transport OR mobility)) OR “flexible modes of transport*” OR
“mobility as a service” OR “Urban Mobility” OR “sustainable mobility” OR “transport systems” OR “Traffic congestion”
OR “vehicle accidents” OR “vehicle pollution” OR “vehicle noise” OR “convenient transport” OR “affordable transport”
OR “mobility solutions” OR “transport infrastructure” OR “congestion and pollution” OR “multi-mode mobility” OR
“efficiency of the transport system” OR “on-demand mobility” OR “public transport” OR “private transport” OR “travel
modes” OR “transport modes” OR “door-to-door mobility” OR “intermodal travel” OR “logistics and delivery” OR “smart
mobility” OR “freight vehicles” OR “transport* network” OR “shared transport” OR “transport technologies” OR
“transport safety” OR “goods transport” OR “transport solution” OR “Transport electrification” OR “electric vehicles”
OR “transport operations” OR “transport sector” OR “congestion management” OR “Autonomous transport” OR
“Collective mobility” OR “delivery of goods” OR “move people” OR “move goods” OR “trip efficiency” OR “intelligent
transport” OR “transport policy” OR “Public Transport” OR “Active Modes of Transport” OR bicycle OR “Smart Mobility”
OR “Intelligent Transport Systems” OR “Transport Psychology” OR “Transport Economics” OR “Transport Modelling” OR
(“Route Choice” AND (transport OR vehicle OR mobility)) OR “Traffic Assignment” OR “Transport Demand” OR “Shared
Mobility” OR “Mobility as a Service” OR (“synthetic fuels” AND (transport OR vehicle OR mobility)) NOT (groundwater
OR aquifer OR nonhuman OR “human cell” OR cerevisiae OR “priority journal”) .
A network view of research and development in sustainable urban mobility – Page 121
DTU International Energy Report 2019 DTU International Energy Report 2019
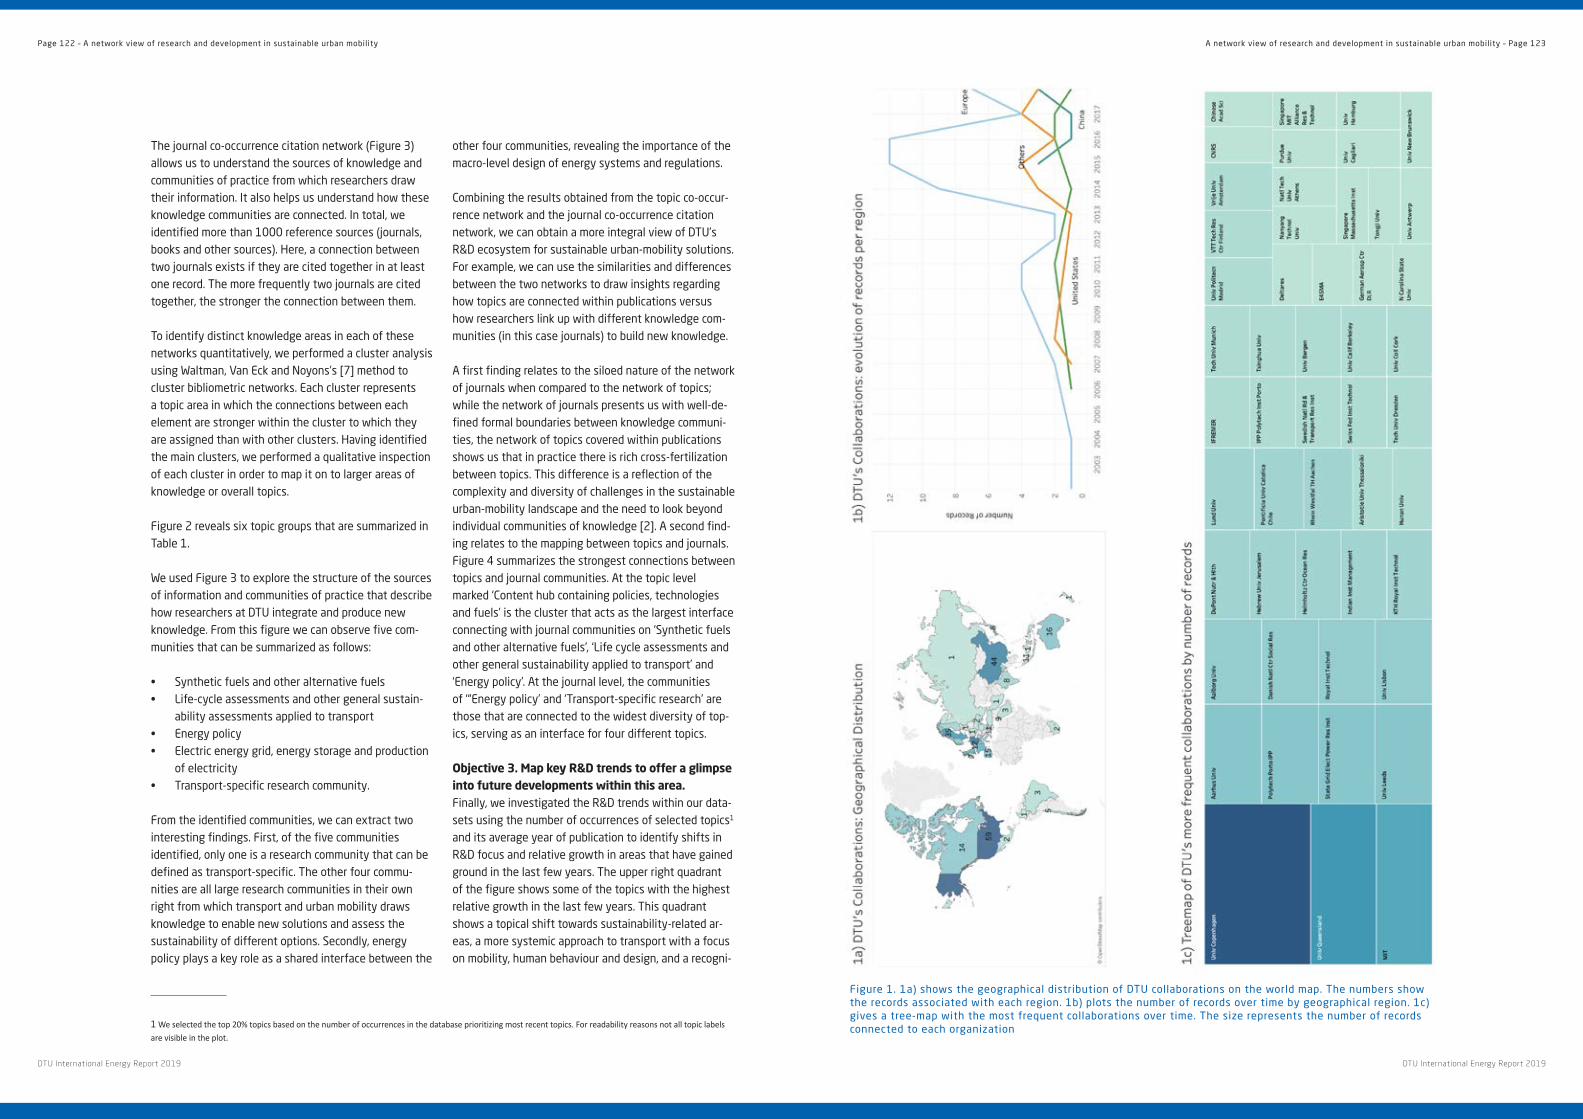
The journal co-occurrence citation network (Figure 3) allows us to understand the sources of knowledge and communities of practice from which researchers draw their information . It also helps us understand how these knowledge communities are connected . In total, we identified more than 1000 reference sources (journals, books and other sources) . Here, a connection between two journals exists if they are cited together in at least one record . The more frequently two journals are cited together, the stronger the connection between them .
To identify distinct knowledge areas in each of these networks quantitatively, we performed a cluster analysis using Waltman, Van Eck and Noyons’s [7] method to cluster bibliometric networks . Each cluster represents a topic area in which the connections between each element are stronger within the cluster to which they are assigned than with other clusters . Having identified the main clusters, we performed a qualitative inspection of each cluster in order to map it on to larger areas of knowledge or overall topics .
Figure 2 reveals six topic groups that are summarized in Table 1 .
We used Figure 3 to explore the structure of the sources of information and communities of practice that describe how researchers at DTU integrate and produce new knowledge . From this figure we can observe five com-munities that can be summarized as follows:
• Synthetic fuels and other alternative fuels• Life-cycle assessments and other general sustain-
ability assessments applied to transport• Energy policy• Electric energy grid, energy storage and production
of electricity• Transport-specific research community .
From the identified communities, we can extract two interesting findings . First, of the five communities identified, only one is a research community that can be defined as transport-specific . The other four commu-nities are all large research communities in their own right from which transport and urban mobility draws knowledge to enable new solutions and assess the sustainability of different options . Secondly, energy policy plays a key role as a shared interface between the
1 We selected the top 20% topics based on the number of occurrences in the database prioritizing most recent topics. For readability reasons not all topic labels are visible in the plot.
other four communities, revealing the importance of the macro-level design of energy systems and regulations .
Combining the results obtained from the topic co-occur-rence network and the journal co-occurrence citation network, we can obtain a more integral view of DTU’s R&D ecosystem for sustainable urban-mobility solutions . For example, we can use the similarities and differences between the two networks to draw insights regarding how topics are connected within publications versus how researchers link up with different knowledge com-munities (in this case journals) to build new knowledge .
A first finding relates to the siloed nature of the network of journals when compared to the network of topics; while the network of journals presents us with well-de-fined formal boundaries between knowledge communi-ties, the network of topics covered within publications shows us that in practice there is rich cross-fertilization between topics . This difference is a reflection of the complexity and diversity of challenges in the sustainable urban-mobility landscape and the need to look beyond individual communities of knowledge [2] . A second find-ing relates to the mapping between topics and journals . Figure 4 summarizes the strongest connections between topics and journal communities . At the topic level marked ‘Content hub containing policies, technologies and fuels’ is the cluster that acts as the largest interface connecting with journal communities on ‘Synthetic fuels and other alternative fuels’, ‘Life cycle assessments and other general sustainability applied to transport’ and ‘Energy policy’ . At the journal level, the communities of ‘“Energy policy’ and ‘Transport-specific research’ are those that are connected to the widest diversity of top-ics, serving as an interface for four different topics .
Objective 3. Map key R&D trends to offer a glimpse into future developments within this area.Finally, we investigated the R&D trends within our data-sets using the number of occurrences of selected topics1 and its average year of publication to identify shifts in R&D focus and relative growth in areas that have gained ground in the last few years . The upper right quadrant of the figure shows some of the topics with the highest relative growth in the last few years . This quadrant shows a topical shift towards sustainability-related ar-eas, a more systemic approach to transport with a focus on mobility, human behaviour and design, and a recogni-
Figure 1 . 1a) shows the geographical distribution of DTU collaborations on the world map . The numbers show the records associated with each region . 1b) plots the number of records over time by geographical region . 1c) gives a tree-map with the most frequent collaborations over time . The size represents the number of records connected to each organization
Page 122 – A network view of research and development in sustainable urban mobility A network view of research and development in sustainable urban mobility – Page 123
DTU International Energy Report 2019 DTU International Energy Report 2019

tion of the increasing uncertainties in the urban mobility field [1] . The lower right quadrant shows the emergence of alternative fuels, including biofuels and hydrogen, as well as battery energy storage and hybridization strat-egies for vehicles . Other interesting topics include the growing use of algorithms for decision-support systems and the inclusion of the built environment and active travel among some of the high-growth, high-occurrence topics .
DiscussionOur analysis has provided a broad description of DTU’s worldwide collaborations, the network of topics and re-search areas influencing the development of new urban mobility solutions, and the key topical trends .
In particular, we first observed that DTU’s collaborations on this topic are geographically spread, covering a wide range of countries, including an increasing share of collaborations with the United States, China and other non-European countries .
Second, we identified the spectrum of research ar-eas that influence the development of sustainable urban mobility solutions and how they are connected with each other . In particular, we observed that DTU’s research on the topic can be clustered into six different topic groups (human behaviour, alternative modes of transport, people’s preferences and attitudes; public
transport modelling; electric-vehicle technologies and their impact; electric grid, energy storage and their connection with electric vehicles; transport infrastruc-ture; and content hub, containing policies, technologies and fuels) . In addition, these were mostly investigated by five research communities (synthetics fuels and other alternative fuels; life-cycle assessments and other general sustainability applied to transport; energy policy; energy grid, energy storage and energy ‘production’; and a transport-specific research community) . Interestingly, out of the five communities identified, only one is a research community that can be defined as transport–specific, with the energy policy community playing a key role as a shared interface between the other four communities .
Finally, we investigated key trends to offer a glimpse into the future of DTU’s contributions to this area . Our analysis reveals a topical shift towards sustainability-re-lated areas, a more systemic approach to transport with a focus on mobility, human behaviour and design, and a recognition of the increasing uncertainties that exist in the urban mobility field . Moreover, we observed the emergence of alternative fuels, including biofuels and hydrogen, as well as battery energy storage and hybrid-ization strategies for vehicles, the growing use of algo-rithms for decision-support systems and the inclusion of the built environment and active travel among some of the high growth, high-occurrence topics .
Group Name Description
A Human behaviour, alter-native modes of transport, people’s preferences and attitudes
Interdisciplinary research integrating social sciences, behavioural economics and the potential of new forms of transport, as well as better means of trans-port to include bicycles and new commuting preferences .
B Public transport modelling Taking as a starting point commuters’ preferences and behaviour, this research area combines the quantitative analysis of large datasets with the design and evaluation of transport models able to describe and predict public transport variables better .
C Electric-vehicle technolo-gies and their impact
Fundamental and applied engineering research to design, develop and deploy electric vehicles . This area also studies the impact of electric vehicles and seeks to predict their effects .
D Electric grid, energy storage and its connection with electric vehicles
Closely linked to the electrification of transport, this area researches the im-pact and solutions that enable the future of electric transport .
E Transport infrastructure This research area focuses on the analysis of large transport infrastructure projects, including cost-benefit analyses and the study of risks, as well as strategies for risk mitigation .
F Content hub containing policies, technologies and fuels
This group acts as a content hub connecting topics that cut across the rest of the identified groups . The main topics explored in this group include transport and energy policies, technological forecasting and alternative fuels such as hydrogen and biofuels .
Table 1 . Description of topic groups
Figure 2 . Network of terms and co-occurrence relations between them . The size of the nodes represents the frequency of each keyword . The colours show the clusters identified by the community detection algorithm
Figure 3 . Network of journals and sources and co-citation relations between them . The size of the nodes represents the frequency of each source . The colours show the clusters identified by the community detection algorithm
Page 124 – A network view of research and development in sustainable urban mobility A network view of research and development in sustainable urban mobility – Page 125
DTU International Energy Report 2019 DTU International Energy Report 2019
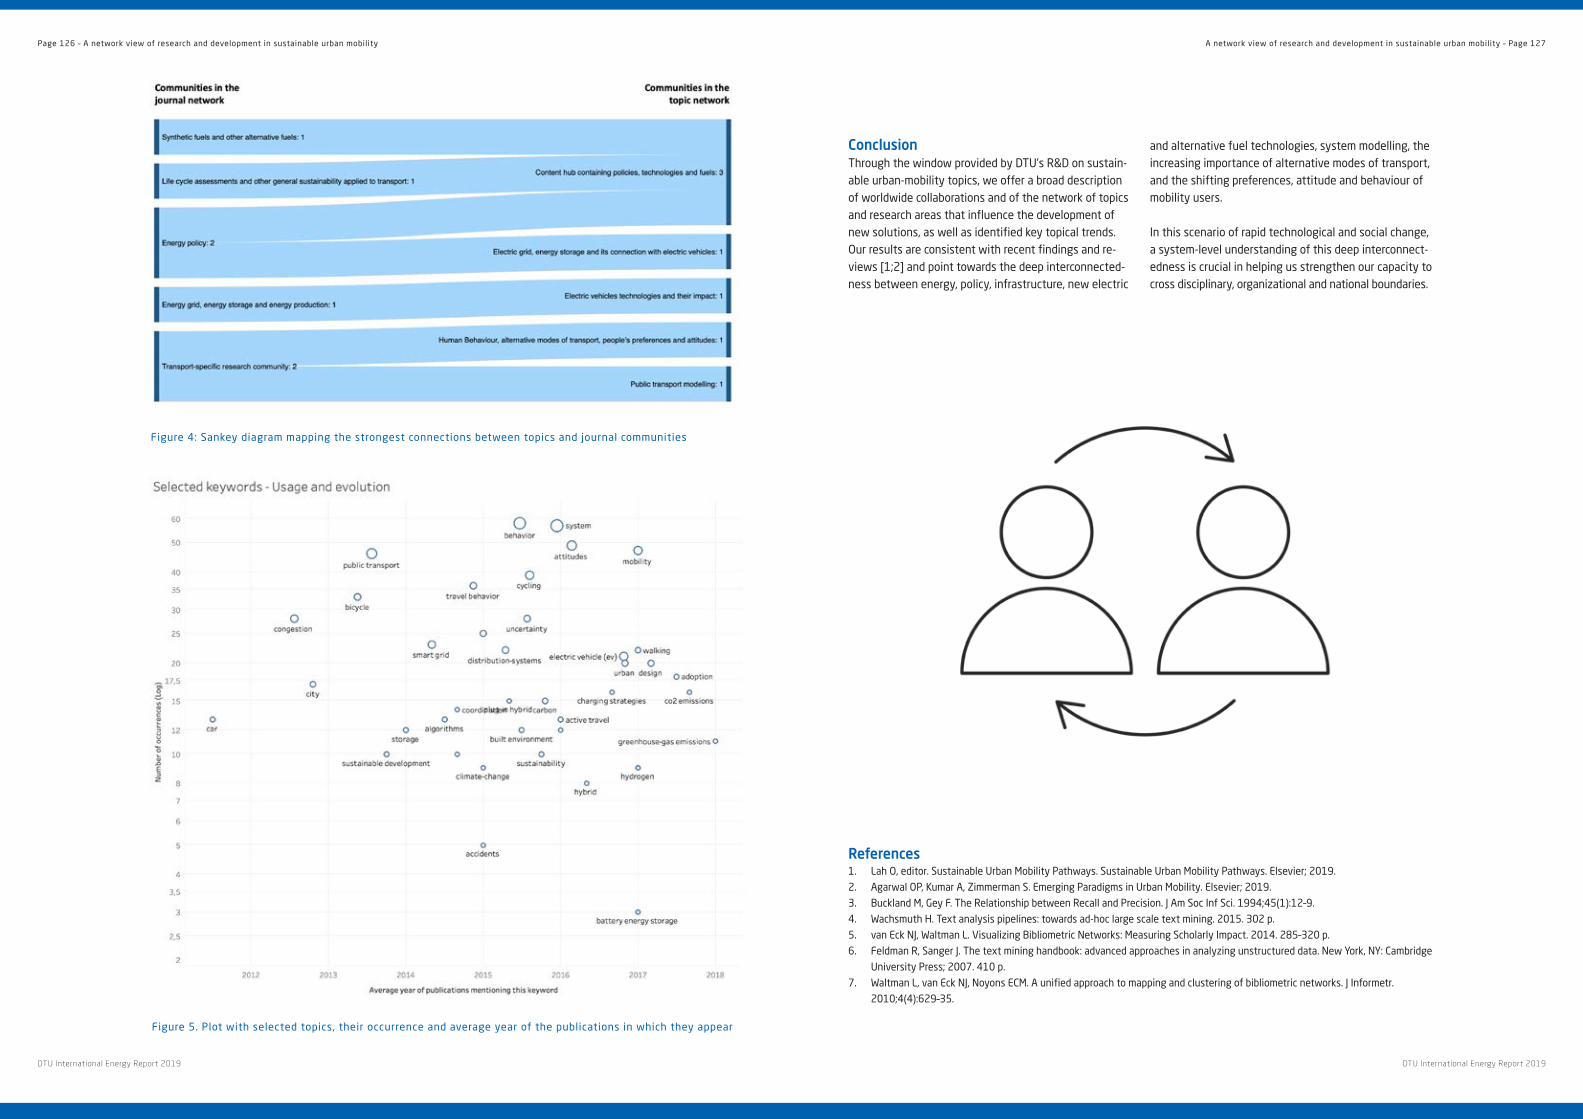
ConclusionThrough the window provided by DTU’s R&D on sustain-able urban-mobility topics, we offer a broad description of worldwide collaborations and of the network of topics and research areas that influence the development of new solutions, as well as identified key topical trends . Our results are consistent with recent findings and re-views [1;2] and point towards the deep interconnected-ness between energy, policy, infrastructure, new electric
and alternative fuel technologies, system modelling, the increasing importance of alternative modes of transport, and the shifting preferences, attitude and behaviour of mobility users .
In this scenario of rapid technological and social change, a system-level understanding of this deep interconnect-edness is crucial in helping us strengthen our capacity to cross disciplinary, organizational and national boundaries .
Figure 4: Sankey diagram mapping the strongest connections between topics and journal communities
Figure 5 . Plot with selected topics, their occurrence and average year of the publications in which they appear
References1 . Lah O, editor . Sustainable Urban Mobility Pathways . Sustainable Urban Mobility Pathways . Elsevier; 2019 .
2 . Agarwal OP, Kumar A, Zimmerman S . Emerging Paradigms in Urban Mobility . Elsevier; 2019 .
3 . Buckland M, Gey F . The Relationship between Recall and Precision . J Am Soc Inf Sci . 1994;45(1):12–9 .
4 . Wachsmuth H . Text analysis pipelines: towards ad-hoc large scale text mining . 2015 . 302 p .
5 . van Eck NJ, Waltman L . Visualizing Bibliometric Networks: Measuring Scholarly Impact . 2014 . 285–320 p .
6 . Feldman R, Sanger J . The text mining handbook: advanced approaches in analyzing unstructured data . New York, NY: Cambridge
University Press; 2007 . 410 p .
7 . Waltman L, van Eck NJ, Noyons ECM . A unified approach to mapping and clustering of bibliometric networks . J Informetr .
2010;4(4):629–35 .
Page 126 – A network view of research and development in sustainable urban mobility A network view of research and development in sustainable urban mobility – Page 127
DTU International Energy Report 2019 DTU International Energy Report 2019

AbbreviationsAC Alternate current
AEC Alcaline electrolysis cell
AI Artificial intelligence
AMD Autonomous Materials Discovery
ARES Autonomous Research system
ASE Atomic Simulation Environment
BESS Battery energy storage solution
BEV Battery electric vehicle
CAPEX Capital expenditure
CCS Carbon Capture and storage
CCUS Carbon Capture Use and Storage
CH4 Methane
CHP Combined heat and power
CMR Computational Materials Repository
CNG Compressed natural gas
CNT Carbon nanotubes
DC Direct current
DME Dimethoxyethane
DSO Distributed system operator
DTU Technical University of Denmark
EV Electric vehicle
FCEV Fuel cell electric vehicle
G2V Grid to vehicle
GDP Gross domestic product
Gt Giga ton
GW Giga watt
HFO Heavy fuel oil
HT High temperature
HTL Hydrothermal liquefaction
HTL Hydrothermal liquefaction
HVDC High voltage direct current
ICEV Internal combustion engine vehicle
IEA International Energy Agency
IL Ionic liquid
LCA Life cycle assessment
LNG Liquid natural gas
LTCFB Low-Temperature Circulating Fluidized Bed System
MaaS Mobility as a service
MTG Methanol to gas
MTO Methanol-To-Olefin
N2 Nitrogen
NDC Nationally determined contribution
NEV New energy vehicle
NEV New energy vehicle
NGO Non Governmental Organisation
NGV Natural gas vehicle
NMT Non-motorized modes
NPS New policy scenario
NTM National transport model
OEM Original equipment manufacturer
OEM Original equipment manufacturer
OPEX Operating expenditure
OTM Copenhagen Transport Model
PEMEC Polymer exchange membrane electrolyser cell
PEMFC Polymer exchange membrane fuel cell
PJ Pico joule
PM Particulate matter
PV Photo voltaic
PV Photo voltaic
R&D Research and development
RD&D Research, development and demonstration
RNG Renewable natural gas
SDG Sustainable Development Goal
SDS Sustainable policy scenario
SM Smart mobility
SNG Synthetic natural gas
SOEC Solid oxide electrolysis cell
TCO Total cost of ownership
TSO Transmission system operator
TWh Terawatt hour
UCC Urban consolidation center
UN United Nations
UNFCCC United Nations Framework Convention on Climate Change
US United States of America
V2D Vehicle to device
V2G Vehicle to grid
V2I Vehicle to infrastructure
V2N Vehicle to network
V2P Vehicle to pedestrian
V2V Vehicle to vehicle
V2X Vehicle to everything
VKT Vehicle kilometres travelled
Abbreviations – Page 129
DTU International Energy Report 2019 DTU International Energy Report 2019


Danmarks Tekniske UniversitetAnker Engelundsvej 12800 Kgs . Lyngby