Embed Size (px)
Citation preview
General rights Copyright and moral rights for the publications made accessible in the public portal are retained by the authors and/or other copyright owners and it is a condition of accessing publications that users recognise and abide by the legal requirements associated with these rights.
Users may download and print one copy of any publication from the public portal for the purpose of private study or research.
You may not further distribute the material or use it for any profit-making activity or commercial gain
You may freely distribute the URL identifying the publication in the public portal If you believe that this document breaches copyright please contact us providing details, and we will remove access to the work immediately and investigate your claim.
Downloaded from orbit.dtu.dk on: Oct 21, 2022
Conversion of Oxygenates over Zeolite Catalysts: Structure-Activity Relations
Holm, Martin Spangsberg
Publication date:2011
Document VersionPublisher's PDF, also known as Version of record
Link back to DTU Orbit
Citation (APA):Holm, M. S. (2011). Conversion of Oxygenates over Zeolite Catalysts: Structure-Activity Relations. TechnicalUniversity of Denmark.

! ! !
Conversion of Oxygenates over Zeolite Catalysts: Structure-Activity
Relations
Martin Spangsberg Holm
Ph.D. Thesis Department of Chemistry
Technical University of Denmark

! ! !

! ! !
Conversion of Oxygenates over
Zeolite Catalysts: Structure-Activity Relations
Martin Spangsberg Holm
February 2011 Ph.D. Thesis
Department of Chemistry Technical University of Denmark

! ! !

Conversion of Oxygenates over Zeolite Catalysts: Structure-Activity Relations !
1!!
0.0 Preface This thesis is submitted in candidacy to the PhD degree from the Technical University of Denmark (DTU). My employment at DTU as a PhD student started in February 2008 under the supervision of Professor Claus Hviid Christensen in the Center for Sustainable and Green Chemistry (CSG). Professor Christensen left DTU in the summer of 2008 and supervision was kindly taken over by Professor Rasmus Fehrmann. My work was therefore finished in the Centre for Catalysis and Sustainable Chemistry (CSC). My PhD study was financed partly by the Danish National Research Foundation, the Department of Chemistry at DTU and Haldor Topsoe A/S. It has undoubtedly been advantageous for my PhD study to be scientifically related to Haldor Topsoe A/S and in particular to senior scientist Finn Joensen. The results presented here have not been accomplished by me alone. The work was done in collaboration with other students and/or scientists and they are recognized in the list of authors on the respective papers included in the thesis. It has been a great pleasure to have PhD student Uffe Vie Mentzel as a colleague. Informal but fruitful scientific discussions were possible on a daily basis and planning and execution of scientific work was done in a humorous yet professional manner. The opportunity to work with Esben Taarning was a truly fortunate turn of events. We entered the project with complementary backgrounds and Esben demonstrated an incredible insight into the organic chemistry related to the project and repeatedly generated brilliant ideas.
Martin Spangsberg Holm, February, 2011

Conversion of Oxygenates over Zeolite Catalysts: Structure-Activity Relations !
2 !
0.1 Abstract English Zeolites have found application within the petrochemical industry for decades. This thesis explores the possibilities of using zeolite catalysts in the emerging bio-refinery field. For fuels and chemicals derived from renewable resources to be able to compete with fossil counterparts the invention of a vast array of transformation processes are needed. This thesis explores the possibilities of using zeolites as catalysts for biomass utilization.
Mesoporosity in zeolites is important to optimize the catalytic performance and the generation of mesoporous catalysts is a research area of increasing interest. We have investigated to what extent mesoporosity can be controlled and maximized by using base treatment, or desilication, in combination with carbon-templating. In addition, we have introduced a novel protocol in which organic bases are used as an alternative to mineral bases. Interestingly, the introduction of mesoporosity by desilication does not only modify the porosity of the sample but also the acidity. By using FT-IR it was possible to follow these acidity changes as a function of desilication severity.
Converting biomass into a suitable liquid usable in the transportation sector (Biomass-to-Liquid) has long been a goal. Bio-oil can be produced by a short heat treatment of lignocellulosic material. The liquid bio-oil is easier to handle than solid material - but is not suitable as a universal energy carrier. To this end, zeolites have been tested in catalytic deoxygenation of bio-oil with the aim of producing hydrocarbons which can be blended into gasoline, however the zeolite catalyst unfortunately deactivates extremely fast. Bio-oil is a complex mixture of more than 300 compounds and it is thus difficult to identify the specific reason for this deactivation. Therefore, we investigated a series of representative model-compounds to rationalize the reactivity of individual species. In relation to this study, we discovered that higher alcohols are in fact better suited than methanol for the zeolite-catalyzed conversion at methanol-to-gasoline (MTG) -like reaction conditions.
The production of commodity chemicals rather than fuels could represent an economically attractive utilization of the strategic biomass resource. By using Lewis acidic zeolite and zeotype catalysts we were able to convert C3-sugars into a potential platform chemical, namely lactic acid (methyl lactate). Dealuminated zeolite Y and Sn-Beta (tin incorporated in zeolite Beta) gave near quantitative yield of methyl lactate from C3-sugars. Sn-Beta further proved applicable in the transformation of hexoses into methyl lactate. A reaction path involving retro aldol- and aldol condensations of the sugars is proposed to rationalize the results.

Conversion of Oxygenates over Zeolite Catalysts: Structure-Activity Relations !
3 !
Dansk Zeolitter er i årtier blevet anvendt som katalysatorer til rafrinering af fossile ressourcer. Megen forskning bliver på nuværende tidspunkt foretaget inden for udnyttelsen af biomasse, der tiltænkes at kunne skabe et alternativ til fossile brændsler. Denne indsats kan beskrives ved fællesbetegnelsen ”bio-refinery”. Hvis kemikalier og brændstoffer lavet fra biomasse skal være i stand til at konkurrere med de fossile analoger, er det nødvendigt at opbygge et helt arsenal af omdannelsesprocesser, nøjagtigt som det er tilfældet i traditionelle rafinaderier. Denne afhandling undersøger muligheden for at bruge zeolitkatalysatorer indenfor biomasse udnyttelse.
Mesoporøsitet i zeolitter er yderst vigtigt for ydeevnen af en zeolit katalysator og dette videnskabelige felt er i rivende udvikling. Vi har undersøgt i hvilken grad mesoporøsitet kan kontrolleres ved at kombinere basebehandling, desilicering, og kulstof-templating. Endvidere, har vi beskrevet en ny protokol til desilicering af zeolitter hvor organiske baser frem for uorganiske er den aktive agent. Denne nye fremgangsmåde rummer både ulemper og fordele, som vi har forsøgt kortlagt. Det viser sig at desilicering ikke kun skaber mesoporøsitet men samtidigt modificerer surheden af katalysatoren. Studier med FT-IR gjorde det muligt, at følge disse ændringer som funktion af behandlingsstyrken. Et af de erklærede mål inden for biomasseudnyttelse er at blive i stand til at omdanne biomasse til et flydende brændsel velegnet til anvendelse i transportsektoren. Halm kan ved en kortvarig varmebehandling omdannes til bio-olie. Bio-olie er ikke en anvendelig energibærer, men det er fordelagtigt at transportere denne frem for det faste materiale. En anvendelsesstrategi for bio-olien er at opgradere denne katalytisk ved hjælp af zeolitter. Produktet er forskellige typer af kulbrinter, som teoretisk set kan blandes i konventionel benzin som et ”grønt” tilsætningsstof. Den zeolit-katalyseret omdannelse deaktiverer dog katalysatoren ekstremt hurtigt og fordi bio-olien indeholder mere end 300 forskellige komponenter er det vanskeligt at afgøre, hvilke der er ansvarlige for dette. For at klarlægge problemet har vi derfor konverteret en serie af repræsentative modelmolekyler som er tilsted i bio-olie. I den forbindelse opdagede vi, at højere alkoholer besidder væsentlige fordele sammenlignet med methanol når omdannet ved reaktionsbetingelser brugt for Methanol-to-Gasoline reaktionen. Brændsler har en forholdsvis lav salgsværdi og det kan derfor være økonomisk attraktivt at omdanne biomassen til kemikalier i stedet. Ved at anvende Lewis sure zeolit-katalysatorer viste vi, at det er muligt at konvertere C3-sukre til mælkesyrederivater. Mælkesyre er et attraktivt molekyle at skabe fordi det har talrige anvendelsesmuligheder både direkte ved tilsætning i kosmetik, mad og lignende men især gennem videre raffinering. De to katalysatorer dealumineret zeolit Y og Sn-Beta (tin inkorporeret i BEA strukturen) producerede mælkesyre-metyl-ester med høj selektivitet. Videre undersøgelser viste at Sn-Beta tilmed var istand til at katalyserede omdannelsen af C6-sukre til mælkesyre derivater. Reaktionsveje involverende retro aldol- og aldol kondenseringsreaktioner er foreslået for at rationalisere observationerne.

Conversion of Oxygenates over Zeolite Catalysts: Structure-Activity Relations !
4 !
0.2 Table of contents 0.0 Preface............................................................................................................................................................ p. 1 0.1 Abstract (English & Dansk)......................................................................................................... p. 2 0.2 Table of contents................................................................................................................................... p. 4 0.3 Aim of thesis............................................................................................................................................. p. 5 0.4 Abbreviations............................................................................................................................................ p. 6 1.0 Introduction and background....................................................................................................... p. 7
1.1 Biomass utilization............. .................................................................................................................. p. 7 1.2 Zeolites.................................................................................................................................................. p. 10 1.3 Desilication........................................................................................................................................... p. 14 1.4 The Methanol-to-Hydrocarbons reaction.............................................................................................. p. 17 1.5 Experimental......................................................................................................................................... p. 20 1.6 References............................................................................................................................................. p. 25
2.0 Results............................................................................................................................................................ p. 28
Part 1 2.1 Aim and idea preceding the studies within desilication........................................................................ p. 28 2.2 Enhancing the Porosity of Mesoporous Carbon-Templated ZSM-5 by Desilication........................... p. 30 2.3 Assessing the acid properties of desilicated ZSM-5 by FTIR using CO and 2,4,6-trimethylpyridine
(collidine) as molecular probes............................................................................................................. p. 36 2.4 ”One-Pot” Ion-Exchange and Mesopore Formation during Desilication............................................. p. 44 2.5 Catalysis with Hierarchical Zeolites..................................................................................................... p. 49
Part 2 2.6 Aim and idea preceding the studies within co-feeding of oxygenates in MTG................................... p. 63 2.7 High Yield of Liquid Olefins Obtained by Converting i-Propanol over Zeolite H-ZSM-5................. p. 65 2.8 Utilization of Biomass: Conversion of Model Compounds to Hydrocarbons over Zeolite H-ZSM-5. p. 70
Part 3 2.9 Aim and idea preceding the studies within lactic acid formation........................................................ p. 79 2.10 Zeolite H-USY for the production of lactic acid and methyl lactate from C3-sugars.......................... p. 81 2.11 Zeolite-Catalyzed Isomerization of Triose Sugars............................................................................... p. 90 2.12 Conversion of Sugars to Lactic Acid Derivatives Using Heterogeneous Zeotype Catalysts............... p.101
3.0 Discussion and future perspectives........................................................................................ p.123
3.1 Desilication........................................................................................................................................... p.123 3.2 Bio-gasoline production....................................................................................................................... p.123 3.3 Synthesis of lactic acid derivatives....................................................................................................... p.125
4.0 Appendix...................................................................................................................................................... p.127 4.1 Publications and patent......................................................................................................................... p.127 4.2 Conference contributions...................................................................................................................... p.128 4.3 Authorship declarations........................................................................................................................ p.129 4.4 Supporting NMR data........................................................................................................................... p.130 4.5 Supporting FT-IR data.......................................................................................................................... p.132

Conversion of Oxygenates over Zeolite Catalysts: Structure-Activity Relations !
5 !
0.3 Aim of thesis The aim of the PhD was to pursue and describe new zeolite modification techniques and find application for zeolites in novel catalytic reactions. Catalysis with zeolites represented the core element of this thesis. My experimental work included zeolite synthesis, characterization and catalytic testing. To individually perform all three aspects was a clear advantage which made it possible to obtain a broad understanding of structure-activity relations within zeolite catalysis. The thesis is organized into three main sections: One, a general introduction to the relevant subjects. Second, the results divided into three parts. Each of these parts are introduced by a description of the more specifically related literature and our initial thoughts and goals prior to the studies. The results are presented in the form of published papers or manuscripts in preparation. The focus of the individual parts is catalyst modification by desilication (Part 1), bio-gasoline production (Part 2) and lactic acid synthesis (Part 3). The third section is a general discussion of the obtained results supplemented by considerations which did not find their way into the respective papers. My specific contributions to the individual studies are stated in the authorship declarations in section 4.3.

Conversion of Oxygenates over Zeolite Catalysts: Structure-Activity Relations !
6 !
0.4 Abbreviations ACI The accessibility index DHA Dihydroxy acetone DME Dimethyl ether DOE Department of Energy (US) EFAL Extra framework aluminum FT-IR Fourier transformed infrared spectroscopy GC-FID Gas chromatography and a flame ionization detector GC-MS Gas chromatography coupled with mass spectrometry GLA Glyceraldehyde HPLC High performance liquid chromatography LHSV Liquid Hourly Space Velocity MPV Meerwein-Ponndorf-Verley MPVO Meerwein-Ponndorf-Verley reduction and Oppenauer oxidation MTG Methanol-to-Gasoline MTH Methanol-to-Hydrocarbons MTO Methanol-to-Olefins MTP Methanol-to-Propylene PE Poly ethylene PET Poly ethylene terephthalate PLA Poly lactic acid SDA Structure directing agent SEM Scanning electron microscopy WHSV Weight hourly space velocity XRPD X-Ray powder diffraction

Conversion of Oxygenates over Zeolite Catalysts: Structure-Activity Relations !
7 !
1.0 Introduction and background
1.1 Biomass utilization
Incentives and scope The incorporation of biomass-derived resources in the supply of energy and chemicals to our modern society has become increasingly important in recent times. Several incentives for biomass utilization exist, with perhaps reduction of CO2 emissions and the desire for independence of foreign oil import being among the most cited reasons.1 Interestingly, we are today reviving strategies for biomass utilization which, at least to some extent, have been invented and/or discussed some thirty years ago when the world experienced the previous energy crisis.2,3,4 Due to decreasing fossil fuels prices compared to biomass derived substrates, such as sugars, the use of biomass was abandoned then. However, the economic balance between fossil resources and biomass is now changing. The tipping economical balance is accompanied by an increased environmental anxiety of the public and renewed political concerns about global warming which altogether results in that utilization of biomass is once again gaining priority. Biomass utilization offers at least a supplementary source of energy and chemicals and can thus relieve the import of fossil resources. One of the advantages of using biomass is that this vast resource is not solely located in specific regions of the world and the implementation strategies can vary depending on local conditions such as weather, demand, wages, soil quality, soil availability as well as local human expertise.
Biomass is currently the only viable non-fossil source for liquid hydrocarbons that can be used as an additive to conventional liquid transportation fuels. One such example produced in large scale is bioethanol which can be obtained through fermentation.5 The potential for biomass utilization is very large, however the practical implementation is technical complex and politically sensitive due to a number of reasons. The most obvious complication is the potential competition of biofuel production versus food production on the same land, but also protection of biodiversity, soil degradation issues, fluctuating price of fossil fuels as well as the willingness to seriously abate CO2 emissions no matter the high expense are important issues.6 The US DOE (Department of Energy) and Department of Agriculture have made an estimate which concludes that more than 1 billion tons/year of lignocellulosic material could be sustainably produced within the US before the mid of this century. This, however, is not enough to meet the fuel requirement and only covers perhaps around 1/3 the need but it could theoretically suffice to replace the fossil compounds used in the production of chemicals.7,8 Similar studies have been conducted in Europe, they predict that biomass utilization can suffice to meet the current goal of bioenergy introduction by 2030 but biomass resources was considered to be insufficient in covering the total energy demand.9 While several important assumptions need to be considered when interpreting these numbers the consumption of transportation fuels in itself equals a demand of such a gigantic magnitude that it is difficult to imagine biomass derived fuels to be more than a modest additive.
It is important to consider that fuels are sold mainly based on their energy content and density. This means that it is difficult for oxygenated biomass to compete with the reduced hydrocarbons. The energy content of dry biomass can be compared to other sources by using the boe (barrels of oil energy equivalents) unit - 1 metric ton of dry biomass equals around 3,15 boe.10 However, if the dry biomass requires multiple complicated conversion steps before it reaches a suitable form usable as

Conversion of Oxygenates over Zeolite Catalysts: Structure-Activity Relations !
8 !
transportation fuel much of this chemical energy will inevitably be lost. Given that chemicals are generally sold on a mass basis this could provide an advantageous strategy for biomass utilization. The production of chemicals which resemble the starting point of biomass with respect to molecular functionalities could perhaps even require fewer processing steps while producing a higher value product.
Composition of biomass Compared to fossil feedstocks biomass is compositionally very different. Oil is a highly stable, reduced and energy dense substance. Even though it consists of numerous components over time a vast processing industry has been created to separate and catalytically convert the individual components into useful starting materials for further upgrading or isolation of applicable liquids such as gasoline.
The most abundant volume of biomass is lignocellulosic material such as wood or straw. Figure 1.1 shows the structure of cellulose, hemicelluloses, and lignin which are the major components of lignocellulose. Cellulose is a linear polysaccharide of D-glucose. The percentage of cellulose in for example wood differs depending of the specific material but typically makes up around 40%. The abundance of hemicellulose is approximately 30% of the matter. Hemicellulose is a branched amorphous polysaccharide made up of several different sugar monomers mainly the hexoses glucose, galactose and mannose and the pentoses xylose and arabinose. Finally lignin is present in amounts around 25%. Lignin is a polymer that consists of branched phenyl propane units predominantly linked by ether bonds. Additionally, minor amounts of extractable organics and inorganic salts are present in lignocellulose.
Figure 1.1. Cellulose polysaccharide (left), monomers in hemicellulose (middle) and lignin (right). Reproduced from Ref. 2.
Through mechanical and/or chemical treatment it is possible to roughly separate the individual three major components based on differences in the rate of hydrolysis by steam explosion, base stability etc. thus allowing for the very different components to be utilized through separate dedicated processes.11 Alternatively crops such as rape, sunflower or sugar cane, and sugar beet can be grown which contain either large amounts of oils or readily available mono- and disaccharides. However, in these cases the risk of utilizing only part of the crop exists while transforming edible fractions into fuels/chemicals. Fast growing energy crops containing only lignocellose are thus projected to be a favored crop for biofuel production.12

Conversion of Oxygenates over Zeolite Catalysts: Structure-Activity Relations !
9 !
Biorefinery concept Much like what is the case for current oil refineries the utilization of biomass will require a dedicated and flexible processing apparatus. In strong contrast to fossil resources biomass is most often highly oxygenated, it has a low energy density and are potentially solid. The challenges of utilizing biomass can be described through the biorefinery concept. A biorefinery uses mechanical, chemical, or biochemical processes to produce value-added products from a biomass resource and can for illustrative reasons conveniently be divided into phase I to III. A phase I biorefinery is able to convert a single biomass-derived resource or class of compounds into a single main product while a phase II biorefinery will be able to produce multiple products though still from a single source. Finally a phase III biorefinery will be able to utilize multiple resources and simultaneously produce a variety of products which could include fuels, power, chemicals and food products.13
The biorefinery-concept brings forward the need to consider whether bulk products such as fuels, commodity chemicals or simply heat and power are optimally produced from a given biomass resource. Since grain, oils, sugar, cellulose or lignin could serve as the starting material numerous strategies could make economical (and chemical) sense. Given the large heterogeneity of biomass derived molecules for example different oxidation levels and functionalizations it is interesting and rather important to discuss where in the value chain biomass derived products could most beneficially be introduced. Undoubtedly, commodity and especially fine chemicals represent high value products in contrast to the simple generation of heat and power through combustion or the production of lower value transportation fuels. Scientific breakthroughs or politically motivated subsidies can change the aim fundamentally. Therefore the invention of a multitude of transformation processes is required in order to be able to utilize the available biomass in a flexible and sensible way.
Direct and indirect “green” substitution The majority of chemicals, which are used in producing the multitude of everyday tools, clothing, wrappings etc. originate from fossil sources. Interestingly, relatively few molecular building blocks including syngas (CO and H2), methanol, ethylene, propylene, butadiene, benzene, toluene and xylene make up the common starting materials in the complicated value chain. If biomass aims to substitute the use of fossil resources a key difference will therefore be whether it is transformed into one of the existing basic building blocks or whether new chemicals are targeted.14 As mentioned, biomass derived compounds generally are highly functionalized and carry little resemblance to the classical fossil building blocks. It is thus important to distinguish between direct and indirect substitution strategies. In a direct strategy biomass is converted into identical chemicals replacing compounds derived from fossil sources whereas an indirect substitution would produce a different chemical which could fulfill the same function as the traditionally fossil derived product. It is clear that both advantages and disadvantages exist when targeting an “old” or alternatively a new platform molecule. If biomass would be converted selectively into for example cumene, a known market already exists including a unit price and therefore the economical potential of the process could be evaluated. It would however also make the production highly vulnerable to price fluctuations of the specific chemical.
Lactic acid as a platform chemical The term “platform chemical” is used to describe a compound which has a suitable chemistry to allow multiple transformations into numerous useful products. Lactic acid (Figure 1.2) is chosen as an example of a platform molecule since it was a target molecule in the studies presented in part 3 of this thesis. Known transformations of lactic acid include dehydration, decarbonylation, reduction etc.

Conversion of Oxygenates over Zeolite Catalysts: Structure-Activity Relations !
10 !
which form useful products that can be further upgraded or sold in a niche application directly.15 Besides being subject to chemical conversions, lactic acid is also used as a direct additive in food and cosmetic products and is already produced on a large scale today.16 In a similar way several other bio derived molecules have been evaluated for potential as platform molecules by the US Department of Energy (DOE).17 Clearly, the potential of a given molecule is a combination of several aspects including substrate/precursor availability and limitations, the current ease of production, toxicity, upgrading possibilities, and marked evaluations. Both chemical and biological conversions are considered and the comprehensive list of molecules reveals that not a single superior compound stands out as an obvious choice.
!"
!"
!
!"
!
!"
!
!
!"#$%&" '"&(
)$#*+&" '"&(
,-./)012'1310
! !
405$(#'2&31
67&('2&31831(019'2&31
!"
!
:0(*"2&31
)#3;'13&" '"&(
!":0(*"2&31
!"
<-,/)#3;'10(&3%!
!"02'%(05$(0
40"'#=31$%'2&31
!
!"
!
>920#&? &"'2&31!%@$% %'"2'20
)3%$A0#&B'2&31
!
!
1
)3%$ C%'"2&" '"&(D Figure 1.2. Known conversion strategies for lactic acid.
A particularly interesting example of the use of bio-molecules is as monomers for polymerization. As shown in Figure 1.2 lactic acid can be polymerized into PLA (poly lactic acid) which has somewhat similar properties to conventional plastics such as PE (polyethylene) and PET (polyethylene terephthalate). The main advantage which has received significant attention is the fact that PLA is non-toxic and biodegradable.18 Replacing conventional plastic with PLA can thus serve to minimize current waste disposal problems and PLA has, in fact, been adopted for use in surgical and pharmaceutical applications where the devices are not intended to be removed.19 This example serves to show that depending on the intended use of PLA products, it can be a superior choice even if it does not outperform conventional products in all property aspects.
1.2 Zeolites
Structure and composition Zeolites are naturally occurring microporous aluminosilicates made up of tetrahedrally coordinated silicon atoms bridged by oxygen which gives the framework an overall composition of SiO2. The

Conversion of Oxygenates over Zeolite Catalysts: Structure-Activity Relations !
11 !
organization of the framework forms pores and channels extending throughout the entire crystal giving rise to the microporosity (actually nanoporosity). The number of “approved” zeolite structures approach 200 which shows the great diversity of frameworks that in fact exists. Continuously, new frameworks are being discovered although some of the structures require sophisticated synthesis conditions to crystallize.20 The zeolite frameworks are conveniently divided into small, medium, and large pore structures with 8, 10 or 12 T-atoms (silicon atoms if pure silicate) in the pore opening. Figure 1.3 shows the framework dimensions of the MFI structure which along with zeolite Beta are the zeolites primarily used in the work presented in this thesis.
Figure 1.3. Framework of the MFI structure. Pore dimensions (left), channel system highlighted (right). From Ref. 20.
The pore dimensions of zeolites are in the range of small organic molecules typically between 4-8 Å. The pore dimensions thus deny access to the interior of the crystal for molecules with a dynamic diameter larger than this. Therefore it is important to distinguish between externally accessible sites versus internal sites and their relative abundance. Naturally this is determined by the framework structure and the crystal size but typically the majority of T-atoms are present within the crystal e.i. “behind” the microporosity. An example would be a MFI crystal with a size of 1 µm where less than 0.5% of the T-positions are located externally.21
Replacement of a silicon atom with trivalent aluminum leads to a charge deficit of the framework which requires compensation by a cation located nearby in the adjacent channel or cavity. If this cation is a proton, the zeolite becomes a strong solid Brønsted acid as schematically shown in Figure 1.4. The strength of the corresponding site depends on the specific zeolite structure.
!Figure 1.4. Schematic presentation of Brønsted acidity in zeolites.

Conversion of Oxygenates over Zeolite Catalysts: Structure-Activity Relations !
12 !
Due to the fact that the majority of the total surface area is present within the zeolite shape selective catalysis arises since only molecules small enough to enter the zeolite pores will be able to reach the catalytically active site.
Channels need not only to progress in one direction within the zeolite. Structures are in addition to the size of pore openings grouped according to the connectivity of their channels making either 1-, 2- or 3- dimensional networks. As one might expect, a channel system connected 3-dimensionally offers far better molecular transport than a framework of lower order. The channels are not always circularly shaped nor do they necessarily run straight through the crystal (a sinusoidal channel shape in the MFI structure can be seen in Figure 1.3) and various types of channel intersections exist. This forms differently shaped cavities (or nanoreactors) within the structure which are indeed important since steric restrictions within the zeolite can direct selectivity and/or can define the lifetime of the catalyst. The crystallinity of the zeolite makes it possible to define unique atom positions within the repeating framework. It is important whether aluminum preferably incorporates in distinct framework positions since the microenvironment around the site will be different depending on whether a site is located in a channel vs. within a cavity. A remarkable difference thus exists between the various zeolite structures (particularly when applied in catalysis) and it is hard to predict specific reactivity, diffusivity, and adsorption behavior of the individual structures.
Application Zeolites have found application within several areas due to their high temperature stability, molecular sieving property, adsorption affinity, ion-exchange ability or the strong acidity of the solid material.22 Depending on the hydrophobicity/hydrophilicity of the zeolite framework drying or purification by for example moisture adsorption or removal of organics by selective adsorption can be done. Per volume, zeolites are mostly used in non-catalytic applications such as laundry detergent; but if considering marked values the catalytic applications are the most important.23. Zeolites constitute the backbone of hydrocarbon conversion in oil refineries where major application of especially zeolite Y (FAU structure) include FCC (fluid catalytic cracking) and hydrocracking of heavy oil fractions.24,25 Although the application of zeolites is predominant within the petrochemical industry new areas are emerging where zeolites are used to study broad aspects of science as cell-adhesion behavior26, drug delivery27 and as hosts for dyes in light harvesting28.
Zeolite synthesis Synthetic zeolites are typically synthesized under hydrothermal conditions i.e. in an aqueous solution at high temperature and pressures. Sources of silicon and aluminum are dissolved or suspended in water along with a structure directing agent (SDA) and an alkali hydroxide is added as a mineralizer to catalyze the breaking and formation of T-O-T bonds. The homogenized zeolite gel is transferred to an autoclave as presented in Figure 1.5. The gel is heated and the zeolite crystallizes from the amorphous substrates typically within days. Frequently, the zeolite product is metastable under the synthesis conditions which means that the nature of the specific product is kinetically controlled. This is the reason why exact synthesis conditions need to be monitored/reported since slight variations can lead to the co-formation of an additional zeolitic phase or simply lead to synthesis failure. Indeed the synthesis of a particular zeolite can include the initial formation of (traces of) a different phase. Alternatively, if the synthesis is not stopped timely (over-run) the zeolite product may transform into a denser phase such as quartz.

Conversion of Oxygenates over Zeolite Catalysts: Structure-Activity Relations !
13 !
Figure 1.5. Schematic presentation of hydrothermal zeolite synthesis. Figure from Ref. 29. The crystallization can be divided into several stages first an induction period; where substrates mix, reorganize and/or dissolution takes place but still no crystalline material can yet be detected. Second the nucleation; here precursor species organize into simple ordered structures that form countless seeds within the gel. Third the growth period, here the zeolite structure increases in size by polymerization condensation reactions that occur on the surface of the seeds. The crystal growth phase continues until all of the amorphous materials are transformed into the crystalline zeolite structure. The division into these three phases is presented in Figure 1.6. Here it can be seen that the initial gel can dissolve and re-precipitate as an equilibrated gel that contains local order directed by the organic SDA cation but lacks the long range ordering of the zeolite framework. Leaving the homogenized gel for a given period of time at a temperature below crystallization temperature is called ageing of the gel. Ageing can have a pronounced effect on the final product. From the assumption that the crystal growth rate is equal for all crystals at all times; the final average crystal size will be dictated by the number of nucleation events. Ageing the gel forming what is described as the equilibrated gel in Figure 1.6 would then be expected to increase the number of nucleations and thus lead to a larger number of smaller crystals.
Figure 1.6. Schematic presentation of the course of zeolite synthesis. Figure from Ref. 29.
Seeding is another common trick which has been used intensively in the synthesis of the catalysts used in this thesis. The aim of seeding is to circumvent the primary nucleation and make crystals grow directly by condensation polymerization on the seeds surfaces. Several fates can undergo seeds when added to a synthesis gel. This include inertness (if the seeds become surface passivated), total dissolution, fragmentation into siliceous building blocks or finally seeding by growth. Typically relatively large amounts of seeds are used perhaps 5 wt.% (based on silicon) simply to see an effect.

Conversion of Oxygenates over Zeolite Catalysts: Structure!
In conclusion, if seeding occurs according to the aim advantage which minimizes “contamination” by other phasesThe mineralizer most commonly used is the hydroxide ion thus dictating that synthesis is conducted at high pH. Interestingly, also the fluorideare formed through the fluoride routeuseful to incorporate hetero atoms which would values. Flouride mediated synthesis Sn-Beta30,31,32 although examples of hydroxide mediated synthesis of SnMEL36 have been published.
1.3 Desilication
Diffusion in zeolites For decades diffusivity or mass transport in zeolite catalysts has been the subject of research since it profoundly affects the applicability of the materials.reactant/adsorbant and the zeolite channels can induce transport typically beyond what could be predicted based on temperature and concentration gradientsFor this reason, the rates of diffusion within a zeolite crystal can be omolecular or Knudsen diffusion and are commonly denoted configurational diffusiondiffusivity of straight chain molecules deviate compared to thethe specific channel size and shape. Additional restraints in diffusion within a zeolite can be casewhere two molecules are unable to pass each other within limits the overall molecular progression.advantage. This can be exemplified zeolite ZSM-5 that forms benzene and xylene. Of the three isomers and since p-xylene has the highest diffusionthe selectivity towards this product. In this way equilibrium controls selectivity.41 Strong restrictions in mass transport can negatively affect caapplication of the zeolite catalyst. Thisis effectively utilized as illustrated in Figure
Figure 1.7. Decreasing utilization of a zeolite crystal as a function of Adapted from Ref. 42.
However, the unique selectivity of zeolites Consequently, it is not desirable to completely the review in section 2.5 a compromise selectivity are often sought. Interestingly,
Conversion of Oxygenates over Zeolite Catalysts: Structure-Activity Relations
14
according to the aim the particular structure can “contamination” by other phases and the crystallization time required
used is the hydroxide ion thus dictating that synthesis is conducted at also the fluoride ion has been proven suitable though typically larger crystal
are formed through the fluoride route. Crystallizing zeolites at neutral or slightly acidic conditions atoms which would otherwise form insoluble precipitates at
Flouride mediated synthesis (near) neutral pH has specifically been the case for synthesis of although examples of hydroxide mediated synthesis of Sn-MFI33,34, Sn-MTW
For decades diffusivity or mass transport in zeolite catalysts has been the subject of research since it profoundly affects the applicability of the materials.37,38 The close resemblance in size of a
and the zeolite channels can induce strong restrictions in intracrystallinebeyond what could be predicted based on temperature and concentration gradients
the rates of diffusion within a zeolite crystal can be orders of magnitude lower than and are commonly denoted configurational diffusion
diffusivity of straight chain molecules deviate compared to their branched isomer again depending on ape. Additional restraints in diffusion within a zeolite can be case
where two molecules are unable to pass each other within a channel (“single-file” diffusion) the overall molecular progression.40 Interestingly, the restricted diffusion can
exemplified by the selectivity obtained from toluene disproportionation over benzene and xylene. Of the three isomers p-xylene is the desired product
xylene has the highest diffusion rate within the zeolite an increase in crystal size increaseselectivity towards this product. In this way diffusion rates rather than the thermodynamic
Strong restrictions in mass transport can negatively affect ca. This leads to the outer most shell is the only part of the crystal
utilized as illustrated in Figure 1.7 by an increasing Thiele modulus.
Decreasing utilization of a zeolite crystal as a function of an increasing Thiele modulus.
he unique selectivity of zeolites is often caused by the narrow pore dimensionsdesirable to completely diminish the shape selectivity. As described in detail in
a compromise that relieves the diffusion restrains while maintaining shape Interestingly, Ryoo and co-workers have recently developed a synthesis
Activity Relations
have a kinetic and the crystallization time required.
used is the hydroxide ion thus dictating that synthesis is conducted at ypically larger crystals
acidic conditions is form insoluble precipitates at high pH
has specifically been the case for synthesis of MTW35 and Sn-
For decades diffusivity or mass transport in zeolite catalysts has been the subject of research since it The close resemblance in size of a
crystalline mass beyond what could be predicted based on temperature and concentration gradients.
rders of magnitude lower than and are commonly denoted configurational diffusion.39 Further,
branched isomer again depending on ape. Additional restraints in diffusion within a zeolite can be cases
file” diffusion) which can be used as an
obtained from toluene disproportionation over xylene is the desired product
rate within the zeolite an increase in crystal size increases the thermodynamic
Strong restrictions in mass transport can negatively affect catalytic of the crystal that
increasing Thiele modulus.
often caused by the narrow pore dimensions. . As described in detail in
the diffusion restrains while maintaining shape workers have recently developed a synthesis

Conversion of Oxygenates over Zeolite Catalysts: Structure-Activity Relations !
15 !
procedure that forms zeolite nanosheets with a thickness of only approximately 1 unit cell. This likely will show very little steric hindrance and could thus open entirely new fields of application or act as an ideal reference since it has no (or marginal) intracrystalline diffusion limitations.43 Nevertheless a potent approach when trying to find a balance between full utilization of the crystal volume while still maintaining satisfactory selectivity is the introduction of mesoporosity into the individual crystals.
Mesoporosity and zeolites Figure 1.8 gives a schematic presentation of a multilevel porosity which can be integrated into zeolites. Mesopores are defined as pores with a diameter between 2-50 nm. and pores larger than 50 nm. are called macropores. Figure 1.8 shows how the inherent microporosity of the zeolite can be supplemented by additional auxiliary pore systems. The preparation of mesoporous zeolites are done through a variety of strategies best described as top-down or bottom-up approaches. These either manipulate the crystallization process (top-down) or treat the crystals after synthesis has terminated (bottom-up). Two widely known examples of the above are carbon-templating of the crystals e.g. letting the material crystallize occluded within a porous matrix or performing a demetalization treatment e.g. dealumination of the crystals post synthesis.42
Figure 1.8. Schematic presentation of the various levels of porosity in a zeolite. Figure from Ref. 39,44.
In section 2.5 numerous examples reporting an improved catalytic performance with respect to selectivity, activity, lifetime, and/or stability of mesoporous zeolites have been reviewed. The beneficial effect arises from improved mass transport through the auxiliary pore system while simultaneously creating additional pore openings and thereby shortening the effective diffusion path length.42,45
Mesoporous zeolites are used in industry today. Probably the prime example is dealuminated Y zeolite forming USY (Ultra Stable Y) which is a workhorse in the petrochemical industry used for cracking large hydrocarbons into the gasoline range. However, also dealumination of mordenite has been studied extensively. During dealumination, aluminium is extracted from the zeolite framework and as a result a new level of porosity appears in the individual crystals. Since each aluminium atom incorporated into the framework gives rise to an acidic site, dealumination will not only lead to the introduction of porosity but also inevitably modifies the acidity of the sample.

Conversion of Oxygenates over Zeolite Catalysts: Structure-Activity Relations !
16 !
Structures and desilication agents Desilication i.e. base treatment is a post synthesis treatment able to form mesoporosity in zeolites. Early examples of “base treatment” of zeolites exist in literature46,47,48 but within the last decade or so greater attention has been dedicated to this post-treatment. This interest correlates with promising results showing significant beneficial catalytic improvements of desilicated samples.49 Yet another attractive thing about desilication is the relative ease with which the treatment can be performed i.e. submersion of the zeolite into dilute sodium hydroxide at moderate temperatures. The simplicity of the treatment along with promising results could pave the road for industrial use of desilciation when compared to many other complex and expensive preparation routes. In effect, silicon is selectively dissolved from the zeolite crystal leading to the formation of an auxiliary mesoporous network within the individual crystals. Figure 1.9 gives a recent example of high resolution STEM (scanning transmission electron microscopy) analysis of mesopores formed in ZSM-5 by desilication. Impressively, the mesopores within the crystals can be clearly seen. But why does the dissolution process form beautiful mesopores instead of simple random crystal degradation?
Figure 1.9. High resolution STEM image of mesoporosity in ZSM-5 obtained by desilication. Figure from Ref. 50.
Aluminium incorporated into the framework carries a negative charge and is therefore believed to direct the desilication process through charge repulsion of the hydroxide ion.51 Consequently, the amount of aluminium present in the zeolite framework is critically important to evaluate the feasibility of desilciation.52 It has been observed that at low Si/Al ratios only very modest desilication occurrs whereas in highly silicious zeolites a pronounced dissolution takes place. A window for optimal desilication for ZSM-5 could thus be defined within Si/Al ratios between 25 and 50.51 This indicates that the rate of hydrolyzation of Si-O bond in the proximity of aluminum is reduced. Alternatively, since hydroxide is (most commonly) used as mineralizer in zeolite synthesis and desilication conditions actually resemble synthesis conditions i.e. a hot, basic aqueous media this could allow for reincorporation of aluminium.51
Several zeolite structures e.g. MFI53,54, BEA55,56, MTW57,58, MEL59, FER60,61, MOR"#,62,CHA63 and even 0-dimensional octadecasil64 can be desilicated using quite similar treatment conditions. Bases other than sodium hydroxide have also been tested and showed that LiOH and KOH are potent for desilciation but NH4OH and hydrofluoric acid lead to poor pore formation or non-selective dissolution, respectively.65 Several examples are known that apply sodium carbonate in desilcation while also organic bases have been investigated66,67,50 including the results presented in section 2.4.68 One would suspect that isomorphous substitution of silicon with other trivalent elements capable of producing Brønsted acidity in zeolites e.g. Ga+3, Fe+3 or B3+ would have similar attributes as aluminium. To some extend this appears to be the case.69

Conversion of Oxygenates over Zeolite Catalysts: Structure-Activity Relations !
17 !
By increasing the base concentration while keeping the volume and mass of treated zeolite constant one can produce zeolites with increasing mesoporosity. Such a sample series is very interesting to study in catalysis in order to isolate the catalytic effect of porosity. Further this approach allows for potential side effects (formation of extra framework aluminium, crystal collapse etc.) to be characterized systematically. Not surprisingly the desilication treatment can be performed too harshly. This is typically seen as a decrease in crystallinity of the treated sample or through low yields of recovered zeolite post treatment. Indeed a relatively large amount (E25%) of the zeolite is commonly dissolved even in a careful desilication. This should be considered when thinking about applicability of desilication.66,70 However, since amorphous silica dissolves before crystalline material this could account for some of the mass loss and could improve sample quality (and hence catalytic performance) without the formation of mesoporosity. Additionally, most reports compare newly prepared mesoporous material to reference samples based on sample weight. A mesoporous sample is likely to take up a larger reactor volume compared to a conventional dense sample. This could to some extend negate parts of the improved performance if reactor volume is the limiting factor rather than catalyst weight.
1.4 The Methanol-to-Hydrocarbons reaction
Discovery of the Methanol-to-Gasoline process The methanol-to-gasoline (MTG) reaction was discovered by serendipity in the 1970’s and published in 1976-77 by researchers employed at Mobil Oil.71,72 The process is able to form long chain hydrocarbons from a single carbon source, namely methanol. This route has received substantial interest for the production of a synthetic fuel since it the only alternative to Fischer-Tropsch diesel. Interestingly, the array of products obtained from MTG includes practically all possible isomers of the C1-C10 hydrocarbons. The shape selectivity of the MFI structure is the reason for the relatively sharp cut off in products at 10 carbon atoms. Conveniently, this product range correlates closely with what is used as conventional gasoline. Steam reforming of natural gas or gasification of coal can produce synthesis gas (CO and H2) which among numerous applications can be used to synthesize methanol. The MTG process, including a methanol synthesis step from syn gas, was chosen over Fischer-Tropsch diesel synthesis for exploitation of vast off shore natural gas resources in New Zealand approximately 30 years ago. A production facility that supplied approximately one third of the gasoline need for the country was thus operating in the mid-1980s. It was eventually taken offline when the oil prices declined after the oil crisis.73 Gasoline is not produced by MTG technology today but by modifying the catalyst and the process conditions the selectivity in methanol conversion can be pushed towards olefins which has led to the commercial processes MTO (Methanol-to-Olefins) and MTP (Methanol-to-Propylene) operated by UOP/Hydro and Lurgi, respectively.74,75 Today, the once again rising oil prices has sparked enhanced interest in the family of methanol conversion processes partly because it can be implemented in a “clean” Coal-to-Liquid strategy where biomass could potentially be co-gasified. However, particularly the production of gasoline is problematic since the percentage of aromatic compounds inevitably present in MTG derived gasoline is rather high compared to current health regulations.76 However, this does not mean that MTG products could not act as a “green” or “domestic” component added to conventional gasoline in the future.77

Conversion of Oxygenates over Zeolite Catalysts: Structure-Activity Relations !
18 !
Process overview The MTH process is comprised of multiple reaction steps including alkylation, oligomerization, aromatization, isomerization, and cracking of the hydrocarbon products all catalyzed by strong Brønsted acidic sites in the zeolite catalyst. Figure 1.10 provides a simplified overview of the selectivity of the process starting with the dehydration of methanol to dimethyl ether (DME) and water.
Figure 1.10. Product selectivity as a function of the reciprocal liquid hourly space velocity (LHSV) (space time). Figure from Ref. 73.
Analyzing Figure 1.10 from left to right (left corresponding to large and right to low feed rates) it can be inferred that initially the acidic zeolite catalyzes the methanol-DME equilibrium and at prolonged contact times olefins start to form. A further increase of the catalyst to methanol ratio leads to the production of paraffins and aromatics at the expense of the olefins. Importantly, no reaction conditions exist where full conversion of methanol/DME is obtained and solely olefins are formed showing that aromatic compounds are inevitably formed.
The key reaction step in the MTH process is the coupling of the C1 specie (methanol) to higher hydrocarbons thus forming new C-C bonds. The mechanism has been intensively discussed in the literature but general consensus now exists that the methanol incorporation proceeds through a “Hydrocarbon Pool Mechanism”. An early presentation of this mechanism is given in Figure 1.11 as published by Dahl et al. They suggested that methanol was added to existing hydrocarbon species present in the zeolite and therefore ruling out (or at least marginalizing) direct methanol-methanol C-C bond forming.78
Figure 1.11. Early schematic presentation of the hydrocarbon pool mechanism. Adapted from Ref. 78.

Conversion of Oxygenates over Zeolite Catalysts: Structure-Activity Relations !
19 !
Later an elegant way of extending the mechanism; “the dual cycle concept” was proposed by Bjørgen et al.79 The aromatic hydrocarbon pool species present within the zeolite are able to split off small olefins after being alkylated by methanol. Olefins are also formed by chain prolongation of a short olefin followed by cracking. From isotopic labeling studies Bjørgen et al. observed a very close similarity in 13C content between ethene and the aromatics which lead them to suggest the grouping of the reactions into the two catalytic cycles presented in Figure 1.12.
Figure 1.12. Methanol incorporation explained through the dual cycle concept. Figure from Ref. 79.
Figure 1.12 shows the two cycles in which methanol alkylates either aromatic methyl benzenes producing poly methyl benzene or alternatively olefins which prolong the carbon chain. The alkylated benzenes dissociate predominantly ethene (and depending on the reaction conditions propene) whereas the higher olefins crack into two shorter (non-ethene) olefins. Since aromatic compounds are a significant product of the reaction the aromatic molecules that escape the zeolite are replenished through cyclization and aromatization of the olefins while simultaneously forming paraffins.
Catalyst deactivation The zeolite catalyst deactivates through gradual carbon deposition (coking) eventually blocking access of the reactants to the acidic sites. Figure 1.13 presents a working MTG catalyst operated in plug flow mode with the reactant entering at the left and products exiting to the right.
Figure 1.13. Schematic presentation of a working ZSM-5 catalyst during methanol conversion. Reproduced from Ref. 80.
The catalyst shown in Figure 1.13 resembles a visual inspection of a ZSM-5 catalyst stopped approximately halfway into deactivation. At the top of the catalyst bed (left) methanol is dehydrated and further down a deactivated black (coked) zone is building. The lower gray part of the catalyst is responsible for secondary reactions. As a function of time the methanol conversion front progresses through the catalyst bed directly below the deactivated zone. This deactivation profile can be compared to a gradual loss of catalytic material which results in a selective change from an initial production of relatively high amounts of paraffinic and aromatic compounds and gradually shifting towards an increased olefin yield. The deactivated zeolite can be regenerated by combustion of the

Conversion of Oxygenates over Zeolite Catalysts: Structure-Activity Relations !
20 !
deposited carbon typically done in a flow of air at temperatures above ~450 °C. Regenerating the catalyst leads to recovery of the initial activity although numerous conversion-regeneration cycles of the catalyst eventually leads to irreversible dealumination of the zeolite i.e. a depletion of the catalytically active acidic sites.81
1.5 Experimental
XRPD X-ray diffraction on zeolites is a convenient tool to identify a zeolite structure and ensure phase purity. More complex applications such as deriving models of unknown frameworks based on a diffraction pattern can also be performed. This makes X-ray diffraction a key analytical technique within zeolite science. Diffraction occurs when an incident radiation interacts with an ordered solid and the wavelength of the electron magnetic radiation (or electrons, neutrons) is in the same order as the distance between the crystal planes d. Most often, the zeolite is analyzed in the form of a powder and the obtained powder X-ray diffractogram can be used as a “fingerprint” unique to the particular crystalline phase.
Figure 1.14. Schematic presentation of diffraction in a solid having a lattice spacing d. Braggs law shows that constructive interference will only happen if the extra distance traveled by the lower incoming beam equals an integer of the wavelength. Figure 1.14 gives this distance as two times l which can be rewritten into 2d sinF.
!" # $% &'( F Different distances (d values) belong to the individual lattice planes and thus each planes will give a characteristic deflection. In the case of a zeolite powder countless orientations of the individual crystals are present and give rise to diffraction rings. The well-known powder diffractograms are obtained as a slice of the ring plotted as the distance from the center and out (2F) versus the intensity. Evidently, the position of the diffractions gives information regarding size and shape of the unit cell while the diffraction intensity is derived from the specific atom and its location within the unit cell.82 N2-sorption A key parameter for any catalyst is the surface area accessible for reactants. A conventional way of measuring this is by low temperature (77 K) adsorption of N2. This technique is based on stepwise adsorption of N2 initially building a submono layer - as the N2 pressure above the sample increases multilayer formation begins. Since the desorption energy of nitrogen desorbing from the surface vs. nitrogen desorbing from a multilayer is different it is possible to derive at which point a monolayer is

Conversion of Oxygenates over Zeolite Catalysts: Structure!
reached. By exploiting that each nitrogen molecule occupies 0.16 nmcan be calculated. However, capillary condensation can complicate the picture since as soon as this occurs a pore volume rather than the surface area For dedicated literature describing gas adsorption in microreferred to expert literature.84 Scanning electron microscopy (SEM)SEM is an analytical technique exploiting directed onto a specimen. Figure 1.15 schematically
Figure 1.15. High energy electron beam hitting a surface and inducing several phenomena. from Ref. 85.
A typical SEM micrograph of a sample can be obtained by systematically scanning the surface with focused e-beam accelerated to 5-20 KeV. the produced secondary or backscatteredsecondary electrons have such a low energy top layer of the sample while backscattered electrons with higher energy can come from further within the material. However, the low escape depth is ideal in order to map surface morphology of a sample.86 Further, depending on the acceleration volume and thus the volume from which electrons can originate simulation showing this is presented in Figure
Figure 1.16. Monte Carlo simulations of high energy electrons interaction with bulk SiOthe scale on Y-axis is identical in the three examples.
Clearly if high resolution SEM is desired electrons accelerated to applied.
Conversion of Oxygenates over Zeolite Catalysts: Structure-Activity Relations
21
. By exploiting that each nitrogen molecule occupies 0.16 nm2, the surface area of the catalyst . However, capillary condensation can complicate the picture since as soon as this
a pore volume rather than the surface area is measured.83 For dedicated literature describing gas adsorption in micro- and mesoporous zeolites the reader is
(SEM) SEM is an analytical technique exploiting the physical events that occur when a beam of electrons
15 schematically shows the various phenomena.
igh energy electron beam hitting a surface and inducing several phenomena.
A typical SEM micrograph of a sample can be obtained by systematically scanning the surface with 20 KeV. A micrograph can be obtained by simultaneously detecting
backscattered electrons. The two images obtained are not identical since secondary electrons have such a low energy (perhaps 10-50 eV.) that they are only able to escape the top layer of the sample while backscattered electrons with higher energy can come from further within
However, the low escape depth is ideal in order to map surface morphology of a Further, depending on the acceleration voltage of the incident electron beam the interaction
and thus the volume from which electrons can originate will increase. A Monte Carlo simulation showing this is presented in Figure 1.16.
Monte Carlo simulations of high energy electrons interaction with bulk SiOaxis is identical in the three examples.
M is desired electrons accelerated to the lowest possible level should be
Activity Relations
the surface area of the catalyst . However, capillary condensation can complicate the picture since as soon as this
and mesoporous zeolites the reader is
occur when a beam of electrons is
igh energy electron beam hitting a surface and inducing several phenomena. Figure
A typical SEM micrograph of a sample can be obtained by systematically scanning the surface with a A micrograph can be obtained by simultaneously detecting
not identical since that they are only able to escape the
top layer of the sample while backscattered electrons with higher energy can come from further within However, the low escape depth is ideal in order to map surface morphology of a
voltage of the incident electron beam the interaction . A Monte Carlo
Monte Carlo simulations of high energy electrons interaction with bulk SiO2. Note that
lowest possible level should be

Conversion of Oxygenates over Zeolite Catalysts: Structure-Activity Relations !
22 !
Characteristic X-rays and Auger electrons produced upon impact can be used to obtain information about the elemental composition of the sample. By using high electron energy (100-200 KeV) and thin specimens the electrons can penetrate the sample and thus operate in transmission mode i.e. move into the vast field of TEM (transmission electron microscopy). Since an electron beam bombards the sample local surface charging can be a problem and for zeolites a conductive coating of for example carbon is required to obtain good SEM images. NH3-temperature programmed desorption Temperature programmed desorption of ammonia is a standard procedure to characterize the acidity of zeolites. The principle behind the analysis is based on the strong acid-base adsorption in-between ammonia and the acidic sites of the zeolite (assuming that the zeolite is in its proton form). If an ammonia saturated sample is gradually heated; ammonia will desorb at a temperature dictated by the strength of the acidic site. If physisorbed ammonia is removed prior to heating the quantity of acidic sites in the sample can be evaluated by assuming that exactly one molecule will desorb from each acidic site. The analysis is composed of three steps. Initially adsorbed species (water, hydrocarbons from the air etc.) in the zeolite are removed in a flow of inert gas at elevated temperature. Next the zeolite is saturated with ammonia and loosely bound ammonia is removed by keeping the sample at for example 100 $C for 2 hours. The analysis itself is initiated by applying a heating ramp which in our case typically was 10 $C/min. Meanwhile the ammonia is quantified as it desorbs. Quantification is conveniently done by a thermal conductivity detector (TCD) but desorbed ammonia could also be collected and titrated. Ammonia does not discriminate between Lewis and Brønsted acidity and usually the resolution of the bands are relatively poor likely due to re-adsorption and transport phenomena within the sample. NH3-TPD however, is an excellent tool to quantify the total acidity of zeolites. The data can then be supplemented by information from other complementary characterization technique such as FT-IR that can provide a Brønsted/Lewis ratio of the total acidity. FT-IR Infrared spectroscopy exploits the electromagnetic radiation (see Figure 1.17) where the energy is sufficient to excite vibrational states of chemical bonds. Bonds that have a dipole moment that can change over time absorb infrared radiation in a quantized process. This means that a particular bond will give rise to only absorptions that match their respective stretching or bending modes of vibration. Infrared spectroscopy is a powerful characterization tool to obtain direct information about the acidity of zeolites. The analysis can be performed in transmission mode where the zeolite is pressed into a self-supporting wafer and the radiation is directed perpendicular to the sample with the detector directly behind. Water and organics from the atmosphere are always adsorbed in the zeolite meaning that the analysis needs to be performed in vacuum (or dried in a flow of inert gas) for the zeolite surface and catalytic sites to be vacant. If this is the case silanol and bridging hydroxyl groups are seen as isolated bands in the 3000-3800 cm-1 region while framework Si-O vibrations are located at lower wavenumbers of typically 600-1200 cm-1. The specific absorption frequencies of the bridging hydroxyls cannot be used to derive information about the acid strength of the sites - for this probe molecules are needed. By allowing a probe molecule to coordinate to a site the acid strength can be indirectly found as the magnitude of the frequency shift in the probe vibration. If the probe molecule is dosed (or desorbed) gradually the affinities towards the individual sites can also be identified.

Conversion of Oxygenates over Zeolite Catalysts: Structure-Activity Relations !
23 !
Figure 1.17. Overview of the grouping of electromagnetic radiation. Figure from Ref. 87.
The detection (strength as well as presence) of Lewis acidity in a zeolite sample is done in a similar way since these sites have on visible bonds. Conveniently, coordination of a probe to a Lewis or Brønsted acidic site induces a characteristic band which makes it possible to derive qualitative information about the sample. By knowing the respective extinction coefficients of these dedicated bands it is possible to calculate a Lewis/Brønsted ratio of the acidity in the sample. Quantification of the acidity in zeolite samples (given as mmol/gzeolite) is rather difficult but it is however possible by careful experimentation. Naturally, various probe molecules can be used depending on the functionality under investigation. In the case of characterizing Sn-Beta samples cyclohexanone proved suitable88 but otherwise pyridine or CO are good choices with a large literature describing thorough experiments.
GC-FID and GC-MS Gas chromatography (GC) was used in almost all aspect of the work presented within this thesis. Gas chromatography separates compounds based on their volatility and retention in a capillary column while a gas serves as the mobile phase. When dealing with small organic reactant and products; gas chromatography is nicely suited for quantification (GC-FID) and identification (GC-MS) but other equipment combinations such as GC-FTIR could serve the same purpose. The detection of the individual compounds eluting are done by combustion in a hydrogen flame in the FID (flame ionization detector) or by electron ionization followed by mass spectrometric analysis in the MS unit. The signal in the FID arises from the ions produced during analyte combustion and hence inorganic compounds will give (almost) no signal. Individual compounds have a unique response factor meaning that a dedicated calibration curve for each is in principle required. High contents of oxygen will lower the sensitivity in the FID but for hydrocarbons the response can be assumed proportional to the carbon content. Compound identification by GC-MS is based on the fragmentation pattern of the molecule after electron ionization. The molecule will undergo characteristic uni-molecular decomposition reaction and the instrument is able to detect the resulting positively charged species. By comparing the “fingerprint” fragmentation pattern to a vast library of known compounds likely molecular structures are identified. This library search is possible because the fragmentation patterns are surprisingly similar independent of variations in-between instruments and laboratory practice. If the molecule is commercially available the gas chromatographic retention time can support the qualified “guess” made from a library search.89

Conversion of Oxygenates over Zeolite Catalysts: Structure-Activity Relations !
24 !
HPLC High Performance Liquid Chromatography is a complementary technique to gas chromatography. The separation principle is similar; expect the mobile phase is liquid in HPLC. The sample is injected into the mobile carrier and separation is based upon selective interaction/retention with a solid column material. HPLC is obviously well suited for analytes which are non-volatile or heat sensitive but columns functionalized with materials ranging from C18-chains to acid functionalities exist and are able to separate almost any analyte. Detection of analytes can be done with a variety of detectors and often HPLC systems are equipped with more than one. Detectors can be designed to complement the weakness of the other or serve as quantification and identification when combined. Common examples for liquid chromatographic systems include UV-VIS, fluorescence, refractive index, electrochemical detection, or an interface to MS. Liquid chromatography can also be operated in preparative scale when the intention is not qualitative sampling but rather complete separation of compounds present in a reaction mixture.
Conversion of Oxygenates over Zeolite Catalysts: Structure-Activity Relations !
25 !
1.6 References
!!!!!!!!!!!!!!!!!!!!!!!!!!!!!!!!!!!!!!!!!!!!!!!!!!!!!!!!!!!!!1 http://tpmlivewire.talkingpointsmemo.com/2010/06/tpmtv-latest-videos-jon-stewart-8-presidents-said-well-
get-off-foreign-oil----fool-me-8-times-am-i-a.php 2 M. Stöcker, Microp. Mesop. Mater., 29, (1999), 3-48. 3 E. S. Lipinsky, Science, 199, (1978), 644-651. 4 E. S. Lipinsky, Science, 212, (1981), 1465-1471. 5 J. R. Regalbuto, Science, 325, (2009), 822-824. 6 D. L. Klass, Biomass for Renewable Energy and Fuels, Encyclopedia of Energy, Volume 1. (2004) Elsevier
Inc. 7 Biomass as Feedstock for a Bioenergy and Bioproducts Industry: The Technical Feasibility of a Billion-Ton
Annual Supply (feedstockreview.ornl.gov/pdf/billion_ton_vision.pdf). 8 D. R. Dodds, R. A. Gross, Science, 318, (2007), 1250-1251. 9 Tobias Wiesenthal, Aphrodite Mourelatou, Jan-Erik Petersen, Peter Taylor, How much bioenergy can Europe
produce without harming the environment?, European Environmental Agency, Report No. 7/2006 10 G. W. Huber, S. Iborra, A. Corma, Chem. Rev., 106, (2006), 4044-4098. 11 K. Olofsson, M. Bertilsson, G. Lidèn, Biotechnology for Biofuels, 1, (2008), 1-14. 12 R. H. Sims, A. Hastings, B. Schlamadinger, G. Taylors, P. Smith, Glob. Change Biol., 12, (2005), 2054-2076. 13 J. H. Clark, F. E. I. Deswarte, Introduction to Chemicals from Biomass, Wiley, (2008). 14 C. H. Christensen, J. Rass-Hansen, C. C. Marsden, E. Taarning, K. Egeblad, ChemSusChem, 1, (2008), 283-
289. 15 Y. Fan, C. Zhou, X. Zhu, Catal. Rev., 51, (2009), 293-324. 16 E. T. H. Vink, K. R. Rabago, D. A. Glassner, P. R. Gruber, Polym. Degrad. Stab., 80, (2003), 403-419. 17 T. Werpy, P. Petersen, Top Value Added Chemicals from Biomass. Volume I: Results of Screening for
Potential Candidates from Sugars and Synthesis Gas (www1.eere.energy.gov/biomass/pdfs/35523.pdf). 18 J. Lunt, Polym. Degrad. Stab., 59, (1998), 145-152. 19 S-H. Hyon, K. Jamshidi, Y. Ikada, Biomaterials, 18, (1997), 1503-1508. 20 http://www.iza-structure.org/databases/ 21 J. P. Gilson, E. G. Derouane, J. Catal., 88, (1984), 538-541. 22 http://www.zeolyst.com 23 J. A. Rabo, M. W. Schoonover, Appl. Catal. A, 222, (2001), 261-275. 24 T. Maesen, Introduction to Zeolite Science and Practice, 3rd revised edition, Chap. 1, 1-12. 25 W. Vermeiren, J-P. Gilson, Top. Catal., 52, (2009), 1131-1161. 26 N. S. Kehr, K. Riehemann, J. El-Gindi, A. Schäfer, H. Fuchs, H-J. Galla, L. de Cola, Adv. Funct. Mater., 20,
(2010), 2248-2254. 27 P. Horcajada, C. Marquez-Alvarez, A. Ramila, J. Perez-pariente, M. Vallet-Regi, Solid State Sci., 8, (2006),
1459-1465. 28 S. Megelski, G. Calzaferri, Adv. Funct. Mater., 1 1, (2001), 277-286. 29 C. S. Cundy, P. A. Cox, Microp. Mesop. Mater., 82, (2005), 1-78.

Conversion of Oxygenates over Zeolite Catalysts: Structure-Activity Relations !
26 !
!!!!!!!!!!!!!!!!!!!!!!!!!!!!!!!!!!!!!!!!!!!!!!!!!!!!!!!!!!!!!!!!!!!!!!!!!!!!!!!!!!!!!!!!!!!!!!!!!!!!!!!!!!!!!!!!!!!!!!!!!!!!!!!!!!!!!!!!!!!!!!!!!!!!!!!!!!!!!!!!!!!!!!!!!!!!!!!!!!!!!!!!!!!!!!30 M. Renz, T. Blasco, A. Corma, V. Fornes, R. Jensen, L. Nemeth, Chem. Eur. J., 8, (2002), 4708-4717. 31 N. K. Mal, A. V. Ramaswamy, Chem. Commun., (1997), 425-426. 32 S. V. Valencia, A. C. Corma, US Patent 6306364, (2001). 33 P. Fejes, J. B. Nagy, K. Kovacs, G. Vanko, Appl. Catal. A, 145, (1996), 155-184. 34 N. K. Mal, V. Ramaswamy, P. R. Rajamohanan, A. V. Ramaswamy, Microporous Mater., 12, (1997), 331-
340. 35 N. K. Mal, A. Bhaumik, V. Ramaswamy, A. A. Belhekar, A. V. Ramaswamy, Stud. Surf. Sci. Catal., 94,
(1995), 317-324. 36 N. K. Mal, V. Ramaswamy, S. Ganapathy, A. V. Ramaswamy, Appl. Catal. A, 125, (1995), 233-245. 37 D. M. Ruthven, Stud. Surf. Sci. Catal., Zeolites: a refined tool for designing catalytic sites, (1995), 223-233. 38 D. M. Ruthven, Introduction to Zeolite Science and Practice, 3rd revised edition, Chap. 21, 737-785. 39 S. van Donk, A. H. Janssen, J. H. Bitter, K. P. de Jong, Catal. Rev., 45, (2003), 297-319. 40 K. Hahn, J. Kärger, V. Kukla, Phys. Rev. Lett., 76, (1996), 2762-2765. 41 N. Y. Chen, W. W. kaeding, F. G. Dwyer, J. Am. Chem. Soc., 101, (1979), 6783-6784. 42 J. Perez-Ramirez, C. H. Christensen, K. Egeblad, C. H. Christensen, J. C. Groen, Chem. Soc. Rev., 37, (2008),
2530-2542. 43 M. Choi, K. Na, J. Kim, Y. Sakamoto, O. Terasaki, R. Ryoo, Nature, 461, (2009), 246-250. 44 R. Mann, Catal. Today, 18, (1993), 509-528. 45 A. Corma, Chem. Rev., (1997), 97, 2373-2419. 46 A. Cizmek, B. Subotic, R. Aiello, F. Crea, A. Nastro, C. Tuoto, Microporous. Mater., 4, (1995), 159-168. 47 R. M. Dessau, E. W. Valyocsik, N. H. Goeke, Zeolites, 12, (1992), 776-779. 48 G. Lietz, K. H. Schnabel, C. Peuker, T. Gross, W. Storek, J. Völter, J. Catal., 148, (1994), 562-568. 49 M. S. Holm, E. Taarning, K. Egeblad, C. H. Christensen, Catal. Today, (2011), accepted. 50 J. Perez-Ramirez, D. Verboekend, A. Bonillo, S. Abello, Adv. Funct. Mater., 19, (2009), 1-8. 51 J. C. Groen, L. A. A. Peffer, J. A. Moulijn, J. Perez-Ramirez, Chem. Eur. J., 11, (2005), 4983-4994. 52 J. C. Groen, J. A. Moulijn, J. Perez-Ramirez, J. Mater. Chem., 16, (2006), 2121-2131. 53 M. Ogura, S. Shinomiya, J. Tateno, Y. Nara, E. Kikuchi, M. Matsukata, Chem. Lett., (2000), 882-883. 54 M. Ogura, S. Shinomiya, Y. Tateno, Y. Nara, M. Nomura, E. Kikuchi, M. Matsakata, Appl. Catal. A., 219,
(2001), 33-43. 55 M. S. Holm, M. K. Hansen, C. H. Christensen, Eur. J. Inorg. Chem., (2009), 1194-1198. 56 J. C. Groen, S. Abello, L. A. Villaescusa, J. Perez-Ramirez, Microp. Mesop. Mater., 114, (2008), 93-102. 57 X. Wei, P. G. Smirniotis, Microp. Mesop. Mater., 97, (2006), 97-106. 58 L. Mokrzycki, B. Sulikowski, Z. Olejniczak, Catal. Lett., 127, (2009), 296-303. 59 X. Li, C. Wang, S. Liu, W. Xin, Y. Wang, S. Xie, L. Xu, J. Mol. Catal. A-Chem, in press. 60 J. C. Groen, L. A. A. Peffer, J. A. Moulijn, J. Perez-Ramirez, Microp. Mesop. Mater., 69, (2004), 29-34. 61 A. Bonilla, D. Baudouin, J. Perez-Ramirez, J. Catal., 265, (2009), 170-180. 62 J. C. groen, T. Sano, J. A. Moulijn, J. Perez-Ramirez, J. Catal., 251, (2007), 21-27. 63 L. Sommer, D. Mores, S. Svelle, M. Stöcker, B. M. Weckhuysen, U. Olsbye, Microp. Mesop. Mater., 132,
(2010), 384-394. 64 J. Perez-Ramirez, S. Abello, L. A. Villaescusa, A. Bonilla, Angew. Chem. Int. Ed., 47, (2008), 7913-7917.

Conversion of Oxygenates over Zeolite Catalysts: Structure-Activity Relations !
27 !
!!!!!!!!!!!!!!!!!!!!!!!!!!!!!!!!!!!!!!!!!!!!!!!!!!!!!!!!!!!!!!!!!!!!!!!!!!!!!!!!!!!!!!!!!!!!!!!!!!!!!!!!!!!!!!!!!!!!!!!!!!!!!!!!!!!!!!!!!!!!!!!!!!!!!!!!!!!!!!!!!!!!!!!!!!!!!!!!!!!!!!!!!!!!!!65 J. C. Groen, J. A. Moulijn, J. Perez-Ramirez, Ind. Eng. Chem. Res., 46, (2007), 4193-4201. 66 C. Doremieux-Morin, A. Ramsaran, R. Le Van Mao, P. Batamack, L. Heeribout, V. Semmer, G. Denes, J.
Fraissard, Catal. Lett., 34, (1995), 139-149. 67 S. Abello, A. Bonilla, J. Perez-Ramirez, Appl. Catal. A., 364, (2009), 191-198. 68 M. S. Holm, M. K. Hansen, C. H. Christensen, Eur. J. Inorg. Chem., (2009), 1194-1198. 69 J. C. Groen, R. Caicedo-Realpe, S. Abello, J. Perez-Ramirez, Mater. Lett., 63, (2009), 1037-1040. 70 R. Chal, C. Gerardin, M. Bultu, S. van Donk, ChemCatChem, 3, (2011), 67-81. 71 C. D. Chang, A. J. Silvestri, J. Catal., 47, (1977), 249-259. 72 S. L. Meisel, J. P. McCullough, C. H. Lechthaler, P. B. Weisz, Chemtech, 6, (1976), 86. 73 M. Stöcker, Microp. Mesop. Mater., 29, (1999), 3-48. 74 www.uop.com 75 T. Mokrani, M. Scurrell, Catal. Rev., 51, (2009), 1-145. 76 Haw J. F.; Marcus, D. M. Nanotechnology in Catalysis; Plenum Publisher: New York, (2004), Vol. 1, Chapter
13. 77 www.nma.org/ 78 I. M. Dahl, S. Kolboe, J. Catal., 149, (1994), 458-464. 79 M. Bjørgen, S. Svelle, F. Joensen, J. nerlov, S. Kolboe, F. Bonino, L. Palumbo, S. Bordiga, U. Olsbye, J.
Catal., 249, (2007), 195-207. 80 U. V. Mentzel, PhD. Dissertation, Towards a methanol economy: Zeolite catalyzed production of synthetic
fuels, (2010), Department of Chemistry, Technical University of Denmark. 81 S. E. Voltz, J. J. Wise, Development studies on conversion of methanol and related oxygenates to gasoline,
Final report, Mobil research and development corporation, Paulsboro, NJ, (1976), US ERDA contract No E (49-
18)-1773. 82 L. E. Smart, E. A. Moore, Solid State Chemistry, 3rd edition, (2005), Taylor & Francis Group 83 I. Chorkendorff, J. W. Niemantsverdriet, Concepts of Modern Catalysis and Kinetics, (2003), Wiley-VCH. 84 J. C. Groen, PhD. Dissertation, Mesoporous Zeolites Obtained by Desilication, Faculty of Applied Sciences,
(2007), Delft University of technology, Netherlands. 85 http://serc.carleton.edu/research_education/geochemsheets/electroninteractions.html (accessed 08-02-2011) 86 P. J. Goodhew, J. Humphreys, R. Beanland, Electron Microscopy and Analysis, 3rd edition, (2001), Taylor &
Francis 87 http://www.chemicalconnection.org.uk/chemistry/topics/view.php?topic=3&headingno=5&lang=en
(accessed 24-02-2011) 88 A. Corma, M. E. Domine, S. Valencia, J. Catal., 215, (2003), 294-304. 89 K. Robards, P. R. Haddad, P. E. Jackson, Principles and Practice of Modern Chromatographic Methods,
(2002), Elsevier Science.

Conversion of Oxygenates over Zeolite Catalysts: Structure-Activity Relations !
28 !
2.0 Results
Part 1 2.1 Aim and idea preceding the studies within desilication
Several strategies can be employed to produce a zeolite catalyst with a hierarchical porosity.1,2 The mesoporous zeolite materials can be categorized into nanosized crystals, widepore zeolites (pore dimensions exceeding 1 nm), composite materials (zeolite regimes in/on an amorphous mesoporous support) and simply mesoporous single crystals.3 Interestingly, by far the majority of reports on mesoporosity shows it is in fact beneficial for a given catalytic test reaction. When this is not the case it can often be explained by thorough characterization of the sample. Still, it is relatively difficult to compare the catalytic performance of two materials prepared in different laboratories even if the catalysts are tested in the same reaction due to variations in reaction conditions (catalyst loading, temperature, acidity etc.). Further, since researchers often emphasize on the material preparation; careful catalytic experimentation can lack priority. The majority of reports that deal with mesoporosity compare a reference sample with a mesoporous counterpart. This key comparison is very important but can suffer from a simplification of the unique mesoporosity in the sample by stating that either a zeolite is mesoporous or not. Mesoporosity in zeolite crystals can be of different nature i) in the form of isolated internal “pockets” not sufficiently interconnected ii) located preferentially in the outer most layers of the crystal or iii) can vary in average size, shape or size/shape distribution or iv) other. Naturally this will affect the effective diffusivity within the zeolite and thereby the catalytic performance of the sample. Inspired by the above considerations, we set out to investigate to which extend the mesoporosity can be controlled/maximized. These results are presented in section 2.2. It is well known that as a function of desilication-severity the formed mesopores increase in average size. By starting with a mesoporous MFI sample prepared by carbon-templating we sought to combine the relatively large mesopores made by this approach with smaller pores originating from a modest desilication. The goal was to create the world’s most mesoporous zeolite (or simply an ultra-porous sample).
It is a challenge within the field of mesoporous zeolites to prepare a suitable reference sample. A reference sample that differs only in the absence of mesoporosity is required to safely claim that the catalytic improvement can in fact be ascribed to porosity. Correspondingly, a series of samples containing increasing levels of mesoporosity can provide excellent information of the diffusivity effect in catalysis but this requires that the introduction of mesoporosity is the only (most significant) change within the series. This prompted us to investigate whether this could in fact be claimed for a series of samples created by desilication. The results are presented in section 2.3. We chose to use FT-IR supplemented by probe molecules (CO and collidine) on a series of desilicated samples which had previously been tested as catalysts in the MTG reaction.

Conversion of Oxygenates over Zeolite Catalysts: Structure-Activity Relations !
29 !
So far the most commonly used bases in desilication are sodium hydroxide or sodium carbonate yielding a mesoporous zeolite in the sodium form. This is a lesser problem if desilication is done on the calcined zeolite directly, because then it is (likely) already in sodium form. However, desilication with an excess of organic base could leave the zeolite charge compensated by the organic cation. The organic cation could then be combusted and thereby tentatively produce the active proton form directly thus circumventing an ion-exchange procedure with for example NH4NO3 that is otherwise required for the sodium analogue. In addition to this overall simplification of the desilication protocol we wanted to understand the versatility of desilication. Section 2.4 presents our results from desilication of zeolite Beta with tetramethyl ammonium hydroxide.
A large number of innovative approaches that produce hierarchical zeolites are published and this area of zeolite research is expanding quickly. The subject of material preparation was recently reviewed.3,4
As discussed in section 1.3, a comparison of catalytic data from various reports can be rather difficult. In addition, since negative results are very seldom published it is challenging to evaluate the limitations for hierarchical zeolite application. Based on this concern we have tried to give an overview of the catalytic reactions in which mesoporous materials have been tested in as of today. The review is presented as section 2.5. The collection of data accompanied by our interpretation and grouping is intended to assist researchers in choosing a suitable catalytic reaction as model reaction whether it is an identical or complementary approach. By doing so, this could allow for a synergistic understanding of the performance of mesoporous materials in catalysis. Hopefully comparing porosities obtained from different protocols will be possible and the effect of mesoporosity in zeolites can reach the ‘next level’ of understanding with respect to selectivity gain, increased conversion capacity, resistance towards deactivation etc.
!!!!!!!!!!!!!!!!!!!!!!!!!!!!!!!!!!!!!!!!!!!!!!!!!!!!!!!!!!!!!1 R. Chal, C. Gerardin, M. Bultu, S. van Donk, ChemCatChem, 3, (2011), 67-81. 2 Y. Tao, H. Kanoh, L. Abrams, K. Kaneko, Chem. Rev., 106, (2006), 896-910. 3 J. Perez-Ramirez, C. H. Christensen, K. Egeblad, C. H. Christensen, J. C. Groen, Chem. Soc. Rev., 37, (2008),
2530-2542. 4 S. van Donk, A. H. Janssen, J. H. Bitter, K. P. De Jong, Catal. Rev., 45, (2003), 297-319.!

SHORT COMMUNICATION
DOI: 10.1002/ejic.200800781
Enhancing the Porosity of Mesoporous Carbon-Templated ZSM-5 byDesilication
Martin S. Holm,[a,b] Kresten Egeblad,[a] Peter N. R. Vennestrøm,[a] Christian G. Hartmann,[a]
Marina Kustova,[b] and Claus H. Christensen*[b]
Keywords: ZSM-5 / Zeolites / Desilication / Carbon-templating / Mesoporous materials
A tunable desilication protocol applied on a mesoporous
ZSM-5 zeolite synthesized by carbon-templating is reported.
The strategy enables a systematic manufacture of zeolite cat-
alysts with moderate to very high mesoporosities. Coupling
carbon-templating and desilication thus allow for more than
a doubling of the original mesopore volume and mesopore
surface area. The porosity effect arising from various treat-
ment times and base amounts in the media has been
Introduction
Zeolites are crystalline microporous aluminosilicates thathave found a multitude of industrial applications as, e.g.sorbents, ion-exchangers, and catalysts. The widespread ap-plication of zeolites in industry can be attributed to the in-herent micropore system of molecular dimensions, whichallows for shape-selective catalysis. Moreover, they are oftenthermally highly stable materials, which possess remarkablyhigh surface areas. These properties make zeolites particu-larly useful for catalytic applications, and the use of zeolitesas catalysts has indeed received significant attention.[1,2]
However, molecular transport to the catalytically activemicropore system in the bulk of the crystals may become alimiting factor for their activity in some catalytic applica-tions.[3] Recently, several preparative strategies have beendeveloped with the aim of producing zeolite materials thatovercome this diffusion limitation.[4,5] The strategies pur-sued so far include increasing the width of the zeolitemicropores,[6–9] decreasing the size of the zeolite crys-tals,[10–14] and the introduction of an auxiliary mesoporesystem in addition to the inherent micropore system.[15–18]
The latter two classes of materials can be classified as hier-archical in terms of porosity because they have bi- or tri-modal pore-size distributions, and the preparation of suchmaterials by use of mesopore templates was reviewed very
[a] Center for Sustainable and Green Chemistry, Department ofChemistry, Technical University of Denmark,Building 206, 2800 Lyngby, Denmark
[b] Haldor Topsoe A/S,Nymøllevej 55, 2800 Lyngby, DenmarkE-mail: [email protected] information for this article is available on theWWW under http://www.eurjic.org or from the author.
Eur. J. Inorg. Chem. 2008, 5185–5189 © 2008 Wiley-VCH Verlag GmbH & Co. KGaA, Weinheim 5185
thoroughly mapped. Initially, small mesopores are created,
and as desilication strength increases the average mesopore
size enhances. Crystallinity of the treated samples is re-
tained, and electron microscopy indicates solely intracrystal-
line mesoporosity.
(© Wiley-VCH Verlag GmbH & Co. KGaA, 69451 Weinheim,
Germany, 2008)
recently.[19] For the preparation of zeolites with intracrystal-line hierarchical porosity, two main approaches appear tobe the most promising,[20] namely carbon-templating[21–23]
and desilication.[24–27]
In carbon-templating, porous zeolite crystals are pro-duced by removal of auxiliary carbon particles encapsulatedin the zeolite crystals during growth. In desilication, con-ventional purely microporous zeolite crystals are treatedwith dilute aqueous base to preferentially dissolve silicaspecies from the zeolite crystals. Here, we show that theporosity of carbon-templated mesoporous zeolite crystalscan be tuned, as well as increased by more than a factor oftwo, by subjecting the already mesoporous material to adesilication procedure. Coupling of these two procedureshave in fact been attempted earlier, however, with limitedsuccess.[28] The process of desilication corresponds to a par-tial dissolution of the zeolite framework. Therefore, it is im-portant either to use a limited amount of a base or to re-strict the time during which the process is allowed to pro-ceed.[29]
Results and Discussion
A mesoporous carbon-templated ZSM-5 zeolite was sub-jected to various desilication treatments as listed in Table 1.
Physico-chemical properties of the resulting materialsfrom N2 physisorption, XRD and NH3-TPD measurementsare included. First of all, it can be seen that the microporos-ity is preserved after desilication since the micropore vol-umes of the samples are not affected by the treatments.Moreover, it can be seen that the parent carbon-templatedsample has a considerable mesopore volume of ca. 0.3 mL/g.
30

C. H. Christensen et al.SHORT COMMUNICATION
Table 1. Textural data from N2 adsorption/desorption experiments on the parent and desilicated samples.[a]
Sample Base amount Time SBET Smeso Vmeso Vmicro D[101][b] Acidity[c]
[mmol/g] [min] [m2/g] [m2/g] [mL/g] [mL/g] [Å] [mmol/g]
Parent – – 408 117 0.30 0.11 677 0.1641 3 30 408 162 0.37 0.11 595 0.1802 5 30 422 195 0.47 0.10 513 0.2063 7.5 30 478 222 0.63 0.11 494 0.2354 10 30 478 232 0.72 0.10 460 0.2725 15 30 503 234 0.75 0.11 386 0.2936 8 5 295 142 0.33 0.06 – –7 8 10 466 241 0.64 0.10 – –8 8 15 443 210 0.66 0.10 – –9 8 20 456 208 0.70 0.11 – –10 8 30 450 201 0.73 0.11 – –11 8 70 445 181 0.65 0.11 – –
[a] Samples 1–5 were desilicated in a 0.1 ! solution and samples 6–11 in a 0.2 ! solution. Vmeso = Vads,P/P0 = 0.99 – Vmicro. Vmicro from t-plot. Smeso from BJH. Surface area of pores 17–3000 Å. [b] Scherrer equation. [c] NH3-TPD. NH3 desorbed at 175 °C for 2 h.
This porosity corresponds to a moderate mesopore surfacearea Smeso of 117 m2/g due to rather large mesopores cen-tered around ca. 20–30 nm. The physisorption isothermsobtained from samples treated with different volumes of0.1 ! NaOH solutions for 30 min (samples 1–5) are shownin Figure 1(a). In Figure 1(a) it can be seen that the meso-pore volume of the samples increases with increasing desil-ication strength. Moreover, closer inspection of Figure 1(a)reveals that a hysteresis loop starts to develop at a relativepressure of 0.45 at low treatment strengths (samples 1 and2). This is attributed to the formation of new smaller meso-pores, initially with a diameter below 10 nm as is evidentfrom the BJH-derived pore-size distribution given in Fig-ure 1(b).
The sizes of the created mesopores are in excellent agree-ment with previously published data on desilication of pu-rely microporous ZSM-5 samples.[30,31] Interestingly, be-cause the mesopores initially formed are smaller than theinherent mesopore system present, these results indicatethat it is possible to create a hierarchical zeolite with amulti-level mesoporosity by coupling the carbon-templatingand desilication protocols. As the desilication strength isincreased, these smaller mesopores grow larger, as can beseen by the disappearance of the mesopores below 10 nm(samples 3 and 4) and simultaneous growth of pore volumeattributed to pores around 15 nm. Thus, the observed in-crease in mesopore volumes apparent from Table 1 does notonly originate from an increase in the pore sizes of alreadyexisting mesopores, but also from newly generated meso-pores. The generation of mesopores can also be tuned byvariation of the reaction time as evident from the physisorp-tion data presented in Table 1 for samples 6–11. It can beseen, that the mesopore volume as well as the mesoporesurface area of the parent mesoporous sample are doubledafter only 10 min (sample 7). Moreover, it can be seen thatfurther extending the desilication time only marginally in-creases the mesopore volume, and an extreme time has adetrimental effect on the mesopore surface area (sam-ple 11). This is attributed to the pore size distribution ex-tending significantly into the macropore region. Key sorp-
www.eurjic.org © 2008 Wiley-VCH Verlag GmbH & Co. KGaA, Weinheim Eur. J. Inorg. Chem. 2008, 5185–51895186
Figure 1. (a) N2 adsorption/desorption isotherms of the parentalong with samples 1–4. Isotherms of samples 1–4 are offset by 150for illustrative reasons. (b) BJH-derived pore-size distributions.
tion isotherms and the respective BJH-derived mesoporediameters are given in the Supporting Information (Fig-ure S1). Figure 2 shows the XRD patterns of the parentsample along with samples 1–5 illustrating the preservedcrystallinity and phase purity of the treated samples. In ac-
31
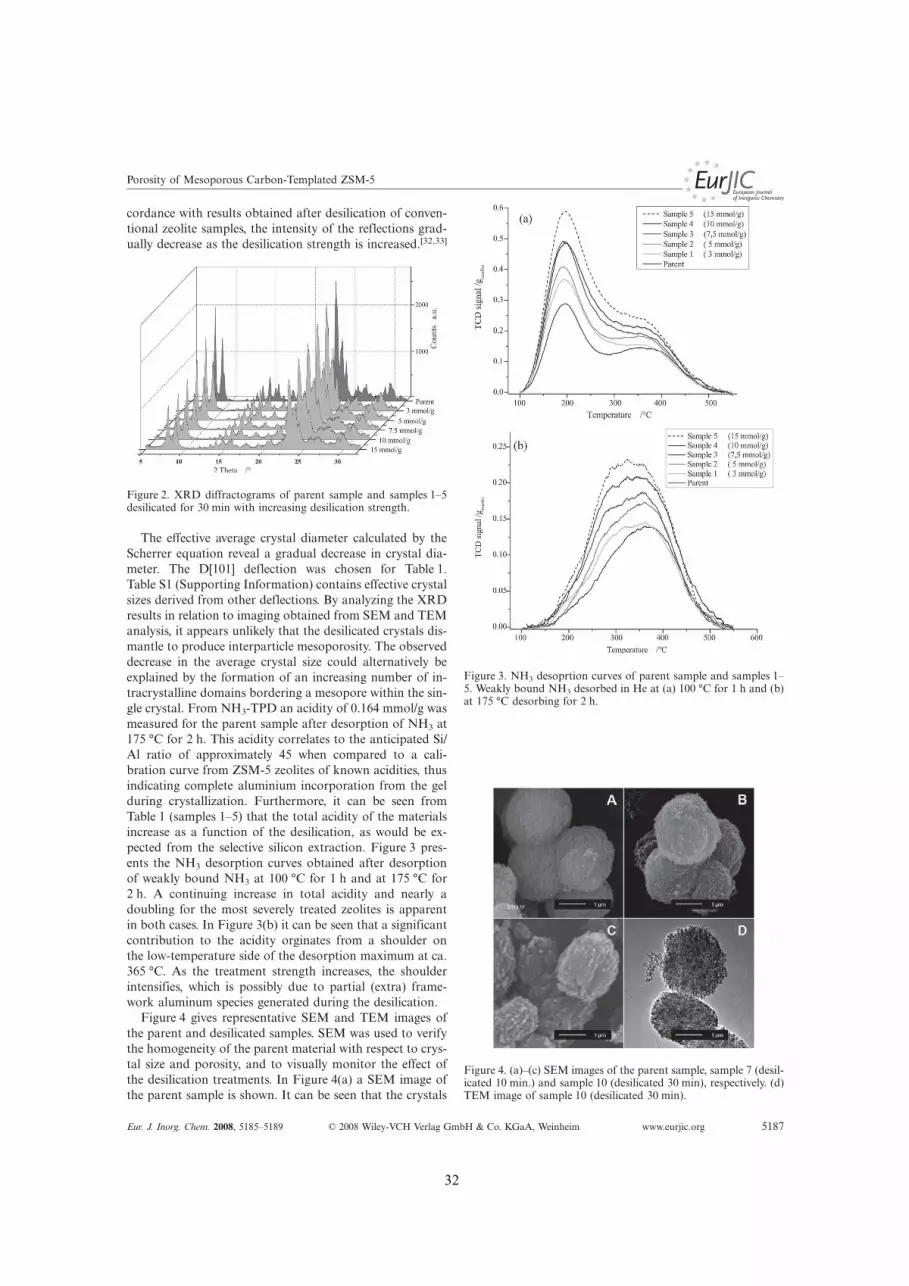
Porosity of Mesoporous Carbon-Templated ZSM-5
cordance with results obtained after desilication of conven-tional zeolite samples, the intensity of the reflections grad-ually decrease as the desilication strength is increased.[32,33]
Figure 2. XRD diffractograms of parent sample and samples 1–5desilicated for 30 min with increasing desilication strength.
The effective average crystal diameter calculated by theScherrer equation reveal a gradual decrease in crystal dia-meter. The D[101] deflection was chosen for Table 1.Table S1 (Supporting Information) contains effective crystalsizes derived from other deflections. By analyzing the XRDresults in relation to imaging obtained from SEM and TEManalysis, it appears unlikely that the desilicated crystals dis-mantle to produce interparticle mesoporosity. The observeddecrease in the average crystal size could alternatively beexplained by the formation of an increasing number of in-tracrystalline domains bordering a mesopore within the sin-gle crystal. From NH3-TPD an acidity of 0.164 mmol/g wasmeasured for the parent sample after desorption of NH3 at175 °C for 2 h. This acidity correlates to the anticipated Si/Al ratio of approximately 45 when compared to a cali-bration curve from ZSM-5 zeolites of known acidities, thusindicating complete aluminium incorporation from the gelduring crystallization. Furthermore, it can be seen fromTable 1 (samples 1–5) that the total acidity of the materialsincrease as a function of the desilication, as would be ex-pected from the selective silicon extraction. Figure 3 pres-ents the NH3 desorption curves obtained after desorptionof weakly bound NH3 at 100 °C for 1 h and at 175 °C for2 h. A continuing increase in total acidity and nearly adoubling for the most severely treated zeolites is apparentin both cases. In Figure 3(b) it can be seen that a significantcontribution to the acidity orginates from a shoulder onthe low-temperature side of the desorption maximum at ca.365 °C. As the treatment strength increases, the shoulderintensifies, which is possibly due to partial (extra) frame-work aluminum species generated during the desilication.
Figure 4 gives representative SEM and TEM images ofthe parent and desilicated samples. SEM was used to verifythe homogeneity of the parent material with respect to crys-tal size and porosity, and to visually monitor the effect ofthe desilication treatments. In Figure 4(a) a SEM image ofthe parent sample is shown. It can be seen that the crystals
Eur. J. Inorg. Chem. 2008, 5185–5189 © 2008 Wiley-VCH Verlag GmbH & Co. KGaA, Weinheim www.eurjic.org 5187
Figure 3. NH3 desoprtion curves of parent sample and samples 1–5. Weakly bound NH3 desorbed in He at (a) 100 °C for 1 h and (b)at 175 °C desorbing for 2 h.
Figure 4. (a)–(c) SEM images of the parent sample, sample 7 (desil-icated 10 min.) and sample 10 (desilicated 30 min), respectively. (d)TEM image of sample 10 (desilicated 30 min).
32

C. H. Christensen et al.SHORT COMMUNICATION
exhibit the well-known sponge-like morphology character-istic of mesoporous carbon-templated MFI zeolites.[34]
Overview images of the parent sample confirmed that thecrystals were similar in size (2–3 µm long) and that the vastmajority of them exhibited this morphology. Figures 4(b)and (c) show SEM images of desilicated samples obtainedafter 10 min (sample 7) and 30 min (sample 10) treatmenttimes, respectively. From these images, it is evident that de-silication leads to a gradual “roughening” of the crystals,which appear to be more and more rugged as the desil-ication time is increased. TEM analyses also revealed thesponge-like morphology of the crystals as evident from thehighly contrasted image of the 30 min desilicated samplesshown in Figure 4(d).
Conclusions
We have shown that the porosity of carbon-templatedmesoporous ZSM-5 may be enhanced by a factor of at leasttwo by desilication of such a sample in terms of mesoporesurface area as well as mesopore volume. Two types of de-silication protocols were applied for tuning the porosity ofthe carbon-templated mesoporous sample: variation in thevolume of hydroxide solution and variation in reactiontime. Pore-size distribution plots revealed that at lower de-silication strengths both newly generated smaller mesopores(initally centered below 10 nm) as well as mesopores alreadypresent in the sample (centered around ca. 20–30 nm) con-tributed to the mesopore volume. With increased desil-ication strength, these smaller mesopores grew larger,eventually, after excessive desilication, into the macroporeregion. The method applied here could easily be extendedto other zeolite structure types, and it therefore provides auseful and easy approach for systematically generatinghighly mesoporous zeolite samples.
Experimental Section
A mesoporous ZSM-5 sample was prepared by carbon-templating
according to a modified literature procedure.[35] A nominal Si/Al
ratio of 45 was used in the gel. Briefly, 2 g of carbon black pearls
2000 was impregnated with a fresh solution of aluminium isopro-
poxide in tetrahydrofuran (0.084 g in 6 mL) and left to dry over-
night. Then the carbonaceous material was impregnated with a
mixture of tetrapropylammonium hydroxide (3.44 g, 40 wt.-%),
aqueous sodium hydroxide (0.1 g in 0.5 g H2O) and ethanol
(3.03 g), and left to dry overnight. The material was impregnated
with tetraethyl orthosilicate (3.87 g) and left to dry overnight before
being crystallized at 180 °C for 5 d. The carbon matrix was re-
moved by calcination at 550 °C in static air for 20 h reached at a
ramp of ca. 2 °C/min. The proton form of the zeolites was obtained
by threefold ion-exchange in a 1 ! NH4NO3 solution and calci-
nation at 550 °C in static air for 4 h. The sample was subjected to
different desilication procedures by immersion of the zeolite sam-
ples in aqueous sodium hydroxide solutions at 65 °C for various
periods of time. After reaction, the desilicated samples were col-
lected by filtration and washed thoroughly with water. Nitrogen
physisorption measurements were conducted with a micromeretics
ASAP 2020. Powder X-ray diffraction (XRD) patterns of the par-
www.eurjic.org © 2008 Wiley-VCH Verlag GmbH & Co. KGaA, Weinheim Eur. J. Inorg. Chem. 2008, 5185–51895188
ent and desilicated samples were recorded with a Bruker AXS pow-
der diffractometer. Scanning electron micrographs (SEM) were re-
corded with a JEOL JSM 5900 equipped with an LaB6 filament.
Prior to measurements, the samples were sputter-coated with Au
for 40 s by using a Polaron SC 7620. Transmission electron micro-
scopy (TEM) images and selected area diffraction (SAD) were re-
corded with a JEM 2000 FX with an accelerating voltage of 300 kV,
as described previously.[36] NH3-TPD measurements were per-
formed with a Micromeritics Autochem II equipped with a TCD
detector. Samples were transformed into proton form prior to
NH3-TPD analysis through a similar procedure as described above
for the parent material. Dry weight of the samples was found after
evacuation at 300 °C for 1 h. Weakly bound ammonia was de-
sorbed prior to measurement at 100 °C in an He flow of 25 mL/
min for 1 h or at 175 °C in an He flow of 50 mL/min for 2 h, respec-
tively.
Supporting Information (see footnote on the first page of this arti-
cle): N2 physisorption isotherms and crystal-size measurements
(calculated by use of the Scherrer equation from X-ray data).
Acknowledgments
The Center for Sustainable and Green Chemistry is sponsored by
the Danish National Research Foundation. The authors thank
Bodil F. Holten for technical assistance.
[1] A. Corma, Chem. Rev. 1995, 95, 559.[2] A. Corma, Chem. Rev. 1997, 97, 2373.[3] M. Hartmann, Angew. Chem. Int. Ed. 2004, 43, 5880.[4] Y. Tao, H. Kanoh, L. Abrams, K. Kaneko, Chem. Rev. 2006,
106, 896.[5] J. C. Groen, C. H. Christensen, K. Egeblad, C. H. Christensen,
J. Pérez-Ramírez, Chem. Soc. Rev. 2008, accepted.[6] M. E. Davis, C. Saldarriaga, C. Montes, J. Garces, C. Crowder,
Nature 1988, 331, 698.[7] C. C. Freyhard, M. Tsapatsis, R. F. Lobo, K. J. Balkus, Nature
1996, 381, 295.[8] T. Wessels, C. Baerlocher, L. B. McCusker, E. J. Creyghton, J.
Am. Chem. Soc. 1999, 121, 6242.[9] A. Corma, M. Diaz-Cabanas, J. Martinez-Triguero, F. Rey, J.
Rius, Nature 1992, 418, 514.[10] L. Tosheva, V. P. Valtchev, Chem. Mater. 2005, 17, 2494.[11] P. A. Jacobs, E. G. Derouane, J. Weitkamp, J. Chem. Soc.,
Chem. Commun. 1981, 591.[12] M. A. Camblor, A. Corma, S. Valencia, Microporous Mesopo-
rous Mater. 1998, 25, 59.[13] C. Madsen, C. J. H. Jacobsen, Chem. Commun. 1999, 673.[14] W.-C. Li, A.-H. Lu, R. Palkovits, W. Schmidt, B. Spliethoff, F.
Schüth, J. Am. Chem. Soc. 2005, 127, 12595.[15] C. J. H. Jacobsen, C. Madsen, J. Houzvicka, I. Schmidt, A.
Carlsson, J. Am. Chem. Soc. 2000, 122, 7116.[16] M. Ogura, S. H. Shinomiya, J. Tateno, Y. Nara, E. Kikuchi,
M. Matsukata, Chem. Lett. 2000, 882.[17] F.-S. Xiao, L. Wang, C. Yin, K. Lin, Y. Di, J. Li, R. Xu, D. S.
Su, R. Schlögl, T. Yokoi, T. Tatsumi, Angew. Chem. Int. Ed.2006, 45, 3090.
[18] H. Wang, T. Pinnavaia, Angew. Chem. Int. Ed. 2006, 45, 7603.[19] K. Egeblad, C. H. Christensen, M. Kustova, C. H. Christensen,
Chem. Mater. 2008, 20, 946.[20] K. Egeblad, C. H. Christensen, M. Kustova, C. H. Christensen,
“Mesoporous Zeolite Crystals”, in Zeolites: From Model Mate-rials to Industrial Catalysts (Eds.: J. Cejka, J. Perez-Pariente,W. J. Roth), Transworld Research Network, Kerala, India,2008, pp. 391–442.
[21] M. Y. Kustova, P. Hasselriis, C. H. Christensen, Catal. Lett.2004, 96, 205.
33

Porosity of Mesoporous Carbon-Templated ZSM-5
[22] X. Wei, P. G. Smirniotis, Microporous Mesoporous Mater. 2005,89, 170.
[23] Y. Tao, H. Kanoh, K. Kaneko, J. Phys. Chem. B 2003, 107,10974.
[24] J. C. Groen, L. A. A. Peffer, J. A. Moulijn, J. Pérez-Ramírez,Chem. Eur. J. 2005, 11, 4983.
[25] J. C. Groen, J. A. Moulijn, J. Pérez-Ramírez, J. Mater. Chem.2006, 16, 2121.
[26] M. Bjørgen, F. Joensen, M. S. Holm, U. Olsbye, K.-P. Lillerud,S. Svelle, Appl. Catal. A 2008, 345, 43.
[27] Y. Tao, H. Kanoh, K. Kaneko, Adsorption 2006, 12, 309.[28] Y. H. Chou, C. S. Cundy, A. A. Garforth, V. L. Zholobenko,
Microporous Mesoporous Mater. 2006, 89, 78.[29] J. C. Groen, L. A. A. Peffer, J. A. Moulijn, J. Pèrez-Ramirez,
Colloids Surf., A 2004, 241, 53.
Eur. J. Inorg. Chem. 2008, 5185–5189 © 2008 Wiley-VCH Verlag GmbH & Co. KGaA, Weinheim www.eurjic.org 5189
[30] J. C. Groen, W. Zhu, S. Brouwer, S. J. Huynink, F. Kapteijn,J. A. Moulijn, J. Pérez-Ramírez, J. Am. Chem. Soc. 2007, 129,355.
[31] M. Ogura, S. Shinomiya, J. Tateno, M. Nomura, E. Kikuchi,M. Matsukata, Appl. Catal. A 2001, 219, 33.
[32] Y. Song, X. Zhu, T. Song, Q. Wang, L. Xu, Appl. Catal. A2006, 302, 69.
[33] J. S. Jung, J. W. Park, G. Seo, Appl. Catal. A 2005, 288, 149.[34] K. Zhu, K. Egeblad, C. H. Christensen, Eur. J. Inorg. Chem.
2007, 3955.[35] M. Y. Kustova, A. L. Kustov, C. H. Christensen, Stud. Surf.
Sci. Catal. 2005, 158, 255.[36] K. Egeblad, M. Kustova, S. K. Klitgaard, K. Zhu, C. H. Chris-
tensen, Microporous Mesoporous Mater. 2007, 101, 214.Received: August 5, 2008
Published Online: October 22, 2008
34

1
Supplementary information for the manuscript:
Enhancing the Porosity of Mesoporous Carbon-templated ZSM-5 by
Desilication
Martin S. Holm, Kresten Egeblad, Peter N. R. Vennestrøm, Christian G. Hartmann, Marina Kustova, Claus H. Christensen
Figure s1. (a) N2-sorption isotherms for sample 6-11. Isotherms moved 400 units respectively for illustrative reasons. (b) BJH derived pore size distributions.
Table S1. Average crystal size calculated from the Scherrer equation.
Sample D[101] (Å)
D[200] (Å)
D[111] (Å)
D[103] (Å)
D[113] (Å)
D[151] (Å)
D[303] (Å)
D[313] (Å)
Parent !""# $%&# '(&&&# !")# )*)# $%(# $+!# $(%#
1 ),)# %+&# '(&&&# $+%# $*(# %%$# $$!# %%"#
2 )(%# %)*# ++)# $)"# $**# *+$# $(*# %(,#
3 $,$# %()# '(&&&# %$,# $+,# *,)# *$*# %*!#
4 $!&# *,%# +()# %"&# )&!# %)*# %,+# %&!#
5 %+!# *+!# %&+# $*$# $("# (%&# %%"# *+,#
35

Assessing the acid properties of desilicated ZSM-5 by FTIR using COand 2,4,6-trimethylpyridine (collidine) as molecular probes
Martin Spangsberg Holm a,b, Stian Svelle c, Finn Joensen b, Pablo Beato b,Claus Hviid Christensen a,b, Silvia Bordiga d, Morten Bjørgen e,*aCenter for Sustainable and Green Chemistry, Department of Chemistry, Building 206, Technical University of Denmark, DK-2800 Lyngby, DenmarkbHaldor Topsøe, Nymøllevej 55, DK-2800 Lyngby, Denmarkc Innovative Natural Gas Processes and Products (inGAP), Department of Chemistry, University of Oslo, P.O. Box 1033 Blindern, N-0315 Oslo, NorwaydDepartment of Inorganic, Physical and Materials Chemistry, NIS Centre of Excellence, and Centro di Riferimento INSTM, University of Turin, I-10125 Torino, ItalyeDepartment of Chemistry, Norwegian University of Science and Technology, N-7491 Trondheim, Norway
1. Introduction
Zeolites are crystalline aluminosilicates built from corner-sharing TO4 tetrahedra, where T represents Al or Si. The zeolitecrystal structures are such that regularly shaped channels, orpores, of molecular dimensions run through the materials. The H-ZSM-5 (MFI structure code) zeolite is a medium sized pore systemwith channel dimensions defined by 10 T-atoms (Si or Al). The poresystem consists of straight channels (5.1 A ! 5.5 A) that areintersected by zig–zag channels (5.3 A ! 5.6 A), thus creating athree-dimensional microporous network [1].
It is the presence of thesemicropores that has paved theway forthe successful application of zeolites in catalysis, but the same poresystem also imposes severe diffusion constraints in catalyticapplications. As outlined in three fairly recent reviews [2–4]several different approaches have been followed to improvecatalyst performance by improving the diffusion properties by theintroduction of mesopores in addition to the micropores inherentto the crystal structures. Among these techniques, we finddealumination with steam and acid leaching [2], various carbontemplating routes [2,4], and post-synthesis treatment of the zeolitecrystals in alkaline media such as NaOH solutions [3].
The potential of the post-synthesis treatments with NaOH, ordesilication, has been highlighted by a series of publications byGroen and co-workers, where the effects of many treatmentparameters, such as NaOH concentration, treatment time,temperature, and elemental composition on the mesoporosity
Applied Catalysis A: General 356 (2009) 23–30
A R T I C L E I N F O
Article history:
Received 31 August 2008Received in revised form 13 November 2008Accepted 26 November 2008Available online 11 December 2008
Keywords:
MFIMTGMTHNaOH treatmentMesoporousLewis acidity
A B S T R A C T
A series of desilicated ZSM-5 catalysts previously shown to have improved catalytic performance in theMTG (methanol-to-gasoline) reaction [M. Bjørgen, F. Joensen, M.S. Holm, U. Olsbye, K.-P. Lillerud, S.Svelle, Appl. Catal. A 345 (2008) 43] was subjected to thorough examination using FTIR. Clearly, defectsrepresented by internal Si-OH sites are removed upon NaOH treatment. In a parallel manner, free Si-OHsites increase in concentration and the results point to a selectivemechanism for formation ofmesoporesas the framework dissolution preferentially takes place at defective sites in the crystallites. The acidproperties of the desilicated materials were investigated by applying CO and collidine (2,4,6-trimethylpyridine) as molecular probes. Monitoring the induced frequency shifts upon CO adsorption atliquid N2 temperature revealed that the desilication procedure did not alter the acid strength of theBrønsted sites significantly. This weakens the explanation linking improved catalytic behaviour, such asincrease in both catalyst activity and hydrogen transfer activity, to modified Brønsted acid strength.Simultaneous to the mesopore formation resulting from the desilication, strong Lewis acid sites weregenerated, presumably from dislodged framework aluminium. Collidine, which is too bulky to enter themicropore system of ZSM-5, could access Lewis acidity, suggesting that these sites were predominantlygenerated on the external surface or in the newly createdmesopores. Additionally, by first saturating thezeolite surface with collidine and subsequently adsorbing CO, we show that barely any Lewis acidity wasuncoordinated post-collidine saturation while the Brønsted acidity continuously was protected behindthe micropore system. It is hypothesized from the present study that the desilication procedure can leadto a slight dealumination of the samples while forming Lewis acidity preferentially at the crystal surface.
! 2008 Elsevier B.V. All rights reserved.
* Corresponding author. Tel.: +47 73 59 48 46; fax: +47 73 55 08 77.E-mail address: [email protected] (M. Bjørgen).
Contents lists available at ScienceDirect
Applied Catalysis A: General
journa l homepage: www.e lsev ier .com/ locate /apcata
0926-860X/$ – see front matter ! 2008 Elsevier B.V. All rights reserved.doi:10.1016/j.apcata.2008.11.033
36

generation have been studied extensively for H-ZSM-5 [5–11]. Inaddition to the reports on H-ZSM-5, Wei and Smirniotis [12]studied the desilication of H-ZSM-12 (MTW) and observed theformation of intracrystalline mesopores and, as a consequence,improved diffusivity of bulky hydrocarbons. Groen et al. investi-gated the effects of NaOH treatment on zeolite H-mordenite (MOR)[13]. For thismaterial, substantialmesopore developmentwas alsofound, along with an improved catalytic performance in benzenealkylation which was attributed to improved mass transport.Interestingly, very recently a desilication study on zeolite beta waspublished. It is revealed that surprisingly mild treatment condi-tions lead to mesopore formation but with a substantial loss ofcrystallinity in the desilicated material [14]. A few other exampleson the effects of desilication on the catalytic properties of thezeolites may be found in the literature [15–21], but as mesoporecreation by zeolite desilication has received increased attentiononly recently, most reports focus on the characterization of thematerials by sorption techniques, X-ray diffraction, and electronmicroscopy, and, in a few cases, diffusion measurements[10,12,15].
FTIR spectroscopy is a commonly used technique for char-acterization of heterogeneous catalysts, and it has proven to bevery useful for the characterization of zeolite catalysts, yet only aminority of the abovementioned reports employ FTIR as acharacterization tool [7,9,12,13,15,19,20]. In most of thesepublications, the spectra covering the OH stretching regions ofthe zeolites are reported and typically reductions in the bandscorresponding to internal silanol groups involved in extensivehydrogen bonding and increases in the bands corresponding toisolated silanol groups are observed (vide infra) [7,9,13,20]. Also,pyridine adsorption has been employed in some cases to quantifythe relative amounts of Brønsted and Lewis acid sites [12,15,19].Hence, the use of FTIR spectroscopy on desilicated zeolites islimited, and in particular, the use of probe molecules, which maygive valuable information, is virtually absent. This report isfocused on spectroscopic characterization of an H-ZSM-5 zeolitethat has been submitted to such post-synthesis treatment indilute NaOH solutions. A catalyst sample with relatively largecrystals of approximately 15 mm and a significant concentrationof crystal defects, and therefore a fairly short catalyst lifetime,wasspecifically chosen in order to monitor structural changesoccurring during a catalytic improvement process. CO wasemployed as a probe molecule to study the acidic properties ofthematerial, and 2,4,6-trimethyl pyridine (collidine), which is toobulky to diffuse into the H-ZSM-5 micropores, was used to studythe mesopore formation and accessibility to active sites. Thisapproach of using molecular probes of different sizes haspreviously been shown to provide valuable information regardingthe location of the catalytically active sites in various zeolites [22].In a previous study [23], we reported the catalytic improvementsof desilicated H-ZSM-5 in the well known and industriallyrelevant methanol-to-gasoline (MTG) reaction [24–26]. Thecatalyst lifetime, quantified as the total conversion capacity,increased by a factor of 3.3 as a result of the NaOH treatment. Alsothe product selecitivites were altered substantially and theselectivity towards the gasoline fraction (C5+ hydrocarbons)was at best increased by a factor of 1.7. Hydrogen transferreactions became faster, leading to more aromatic and paraffinicproducts. In this report, we present extensive spectroscopiccharacterizationof the same catalysts and attempt to correlate thespectroscopywith the improved catalytic properties. By using theabovementioned probe molecules, the formation of mesopores isconfirmed and it is shown that the acid strength of the Brønstedsites is unaltered by the treatment and that Lewis acid sites,mainly located on the external surface of the zeolite crystals, areformed as a consequence of desilication.
2. Experimental
H-ZSM-5 was synthesized and modified by NaOH treatmentaccording to previously given procedures [23]. The obtainedsamples are designated H-ZSM-5-PARENT (parent sample, noNaOH treatment), H-ZSM-5-0.05M (treated with 0.05 M NaOH for2! 4 h at 75 8C), and H-ZSM-5-0.20M (treated with 0.20 M NaOHfor 2! 4 h at 75 8C). These specific samples were transferred intoproton form by threefold ion-exchange in 1 MNH4NO3 followed bycalcination and characterized by N2-sorption, elemental analysis(ICP-AES), NH3-TPD, XRD, FTIR (without probe molecules) and forcatalytic properties in the MTG reaction in the previous study [23].In this study, transmission FTIR spectra of the samples in protonform (compressed into self-supporting wafers) were recorded at2 cm"1 resolution using an in-house designed quartz cell (NaClwindows) for operations down to liquid N2 temperatures (i.e. anominal temperature of "196 8C). Prior to the experiments, thesamples were pretreated for 1 h at 450 8C in vacuum. 2,4,6-trimethylpyridine (collidine) was adsorbed in situ on the samplesat room temperature whereas CO was adsorbed after cooling thesampleholder with liquid N2. The spectra were recorded by aBioRad FTS 80 spectrometer, equipped with a MCT detector. Peakfitting (Fig. 3 only) was performed using the Origin 7.5 peak fittingmodule and Gaussian line shapes. The center of the bands waslocated by second order derivative analysis and a close inspectionof the obtained residuals.
3. Results and discussion
3.1. FTIR spectra of the pretreated zeolites
In our previous work on alkaline treatment of H-ZSM-5, the keyissue was the effects on catalytic properties in the methanol-to-gasoline reaction [23]. A rather thorough physical characterizationof the samples based on powder XRD, DRIFTS, N2 adsorption, andelemental analysis was also reported. In the present contribution,the same set of samples has been studied. The parent zeolite,denoted H-ZSM-5-PARENT, was treated with 0.05 M or 0.20 MNaOH solution giving the samples H-ZSM-5-0.05M and H-ZSM-5-0.20M, respectively. XRD confirmed phase purity and retention ofcrystallinity after alkaline treatment. Elemental analysis (ICP-AES)revealed the following overall Si/Al ratios: 46 (H-ZSM-5-PARENT),39 (H-ZSM-5-0.05M) and 27 (H-ZSM-5-0.20M) which confirm thepreferred silicon extraction occurring during desilication [9]. N2
adsorption measurements showed an increase in BET surface areafrom 313 to 372 (H-ZSM-5-0.05M) and 419 m2/g (H-ZSM-5-0.20M) as a consequence of the NaOH treatment, and theadsorption data also indicated mesopore formation. The catalyticstudies demonstrated that the total conversion capacity of thecatalyst (defined as grams of methanol converted per gram ofcatalyst before complete deactivation) increased by a factor of 3.3for the most severely treated sample (H-ZSM-5-0.20M). Thetreatment also led to higher initial activities and a substantialincrease in the rate of hydrogen transfer reactions, in particular forH-ZSM-5-0.20M. The obtained results can be rationalized byimproved diffusivity resulting from mesopore formation, but thetreatment may well change the acid properties of the catalysts,which in turn also can account for higher initial activities and fasterhydrogen transfer reactions. Possible changes in acid strengthwere not addressed at that time, and detailed acidity character-izations of alkaline treated zeolites have not been presentedearlier.
In our previous contribution on alkaline treatment of H-ZSM-5,DRIFTS (Diffuse Reflectance Infrared Fourier Transform Spectro-scopy) spectra (recorded at room temperature) of the threesamples where presented and discussed [23]. In the present study
M.S. Holm et al. / Applied Catalysis A: General 356 (2009) 23–3024
37

we have chosen to work in transmission mode due to the practicalsimplicity of performing low temperature (liquid N2) experimentswith this set-up. The transmission spectra of the pretreatedzeolites (dehydrated by heating in vacuum) presented here arevery similar to the already published DRIFTS spectra and thedifferent features will only be discussed briefly. Fig. 1 shows then(OH) modes of the three samples (the intensities have beennormalized using the framework overtone at 2010 cm"1). Theparent sample has five well-separated bands with the followingassignments—(i) 3746 cm"1: virtually isolated Si–OH groupslocated on the external surface of the zeolite; (ii) 3728 cm"1:weakly perturbed Si–OH sites predominantly located inside thezeolite structure (vide infra). The distinct separation of this peakfrom the 3746 cm"1 peak is normally not observed and is mostlikely resulting from the relatively large crystal dimensions (anaverage of 15mm) and thus the low contribution from external Si–OH sites (3746 cm"1); (iii) 3692 cm"1: same assignment as (ii); (iv)3613 cm"1: strong Brønsted acid Al(OH)Si sites, hereafter denotedOHBrønsted; (v) 3460 cm"1: a variety of internally located Si–OHgroups involved in relatively strong hydrogen bonds, e.g. so-calledsilanol nests in which dangling oxygens around a T-site vacancyare saturated by protons. Notice that a zeolite crystal completelyfree frombulk defects will only have a Si–OH contribution from theexternal surface where the lattice is terminated (giving the sharpabsorption peak at 3746 cm"1). Thus, the remaining Si–OH
components located at lower frequencies in Fig. 1 representvarious imperfections in the zeolite framework.
As seen from Fig. 1, the NaOH treatment induces some ratherclear changes in the n(OH) region: the 3746 cm"1 band increases inintensity relative to the peak representing the OHBrønsted sites(3613/3610 cm"1). The intensity of this peak has previously beencorrelated with the external surface area and thus the averagecrystal size of the zeolite [27,28]. Based on this statement, onemayclaim that the NaOH treatment leads to a substantial reduction incrystallite size. This can, however, not be the case as the SEMimages showed no change in crystallite size or morphology aftertreatment [23]. It is also clear from Fig. 1 that the different Si–OHcontributions at the lower frequencies, the 3460 cm"1 band inparticular, are substantially reduced, implying that the Si–OH sitesbecome more homogeneous and to a much larger extentunperturbed. This means that the defects either are healed (i.e.dissolved Si or Al species are re-inserted into the vacanciesoriginally creating Si–OH nests) or that the defects simply areeroded by NaOH, thus creating an extensive internal surface (e.g.mesopores) that effectively appears like the ordinary externalsurface with isolated virtually unperturbed Si–OH sites. This latternotion is illustrated in Scheme 1. Scheme 1a represents a crystalliteof the parent sample with several internal Si–OH defects inaddition to the Si–OH groups located on the external surface.Scheme 1b represents a crystal in which mesopores have beenformed and most internal defects have been removed uponalkaline treatment. Thus, Scheme 1 gives a simplified representa-tion of how the number of internal defects may be dramaticallyreduced whereas the number of unperturbed Si–OH groups mayincrease when the zeolite is subjected to NaOH desilication. Thestability of mordenite towards alkali treatment has previouslybeen addressed, though in a different context [29]. Decreased alkaliresistance was observed for defect rich crystals when compared tocrystals with a perfect framework.
The NaOH treatment also generates extra lattice Al–OH groups,giving rise to the rather small component at 3663 cm"1 seen for thetreated samples. The 3746 cm"1 peak of H-ZSM-5-0.20M also has abarely discernible high frequency shoulder around 3780 cm"1
which previously has been associatedwith the 27Al NMR resonanceof octahedral extra framework Al [30]. Others have linked the3780 cm"1 band in the beta zeolite to tri-coordinated Al connectedto the framework [31]. In any case, these observations point toincipient dealumination as a result of the alkaline treatment andbased on elemental analyses of the filtrate and pyridine adsorptionexperiments, Ogura et al. indeed found a minor dealumination ofH-ZSM-5 upon the NaOH treatment [15]. The 3663 cm"1 band isalso known to appear after steam treatment of ZSM-5 [32–34].Extraction of framework Al is often accompanied by generation ofLewis acidity and this will be further elaborated in Section 3.2.
The FTIR spectra of the dehydrated H-ZSM-5 samples arevaluable for following the major changes in surface OH groups anddealumination resulting from the NaOH treatment. The limitationis, however, the complete lack of information concerning possiblechanges in the acid strength, generation of Lewis acidity, the sitelocalization (internally vs. externally) and accessibility. Suchinformation may be decisive for understanding the observedchanges in catalytic behaviour of the samples.
3.2. Acid strength measured by FTIR using CO as molecular probe
The acid strength of zeolites is intimately linked to theircatalytic properties with respect to activity, deactivation rate andproduct selectivity. As alreadymentioned, in our previous work onthe MTG reaction we found that the initial activity and, inparticular, the hydrogen transfer activity could be improvedsubstantially by NaOH treatment. An increased hydrogen transfer
Fig. 1. FTIR spectra (only the n(OH) region shown) of dehydrated H-ZSM-5-PARENT,H-ZSM-5-0.05M and H-ZSM-5-0.20M. For clarity, the spectra have been shiftedalong the ordinate. The spectra were recorded at room temperature.
M.S. Holm et al. / Applied Catalysis A: General 356 (2009) 23–30 25
38

activity gives higher yields of saturated aliphatics and aromatics,and less alkenes in the product stream. Several previous reportshave suggested a link between hydrogen transfer activity andzeolite acid strength [35,36]. Likewise, also cracking reactions aresuggested to be promoted by increasing acid strength [37]. Thus, apossible explanation for our previous observations is an increasedacid strength of the OHBrønsted sites.
The acid strength of solid acids, such as protonated zeolites, hasto be measured indirectly by assessing the interaction strengthbetween an adsorbed basic probe and the solid [38]. For thispurpose, temperature programmed desorption of basic moleculesis routinely employed, but themajor drawbacks are relatively poorresolution and that Brønsted and Lewis sites are indistinguishable.Here, we have studied the relative interaction strengths betweenCO and the acid sites of the three zeolites by FTIR spectroscopy. COis a weakly basic probe molecule which is adsorbed end-onthrough the carbon on polarizing sites that in our case arerepresented by protons. The OH# # #CO acid/base adducts that areformedupon adsorptionwill feature perturbedn(O–H) andn(CBBO)modes and accordingly their vibrational frequencies will beshifted. The O–H bond will be weakened and the vibrationalfrequency will thus shift towards lower frequencies (red-shifted).
On the other hand, the CO triple bond will be strengthened byelectron donation from the slightly antibonding 5s orbital and thevibrational frequency will therefore be blue-shifted. The magni-tude of these frequency shifts is proportional to the OH/COinteraction strength, and thus proportional to the Brønsted acidstrength of the zeolite. As opposed to CO, strongly basic probemolecules such as pyridinewill induce proton transfer from awiderange of OH groups and thus not have the same ability todiscriminate between sites of different acidity.
After having recorded the spectra presented in Fig. 1, thesamples were cooled to liquid N2 temperature ("196 8C nominal)and the CO coverage on the zeolites was changed stepwise. Fig. 2shows the obtained series of spectra 1–11 in the n(OH) region (leftpart) and in the n(CO) region (right part) for the three samples.Spectrum 11 represents the highest CO coverage for all threesamples. The spectra are all presented as difference plots, i.e. thespectra of the corresponding pretreated zeolites have beensubtracted from spectra 1 to 11. Thus, positive contributions inFig. 2 represent peaks that are growing as a result of CO adsorption,whereas negative contributions represent peaks that are reducedin intensity upon CO adsorption. The grey bold-drawn spectrum atintermediate CO loading (spectrum 5 in each series) represents the
Scheme 1. Schematic illustration of a possible route to mesopore formation following desilication. (a) Structural defects distributed throughout the zeolite. (b) Mesoporeformation as a consequence of preferential framework dissolution near crystal defects. Aluminiumbased Lewis acidic sites are detectedmainly inmesopores/external surfacewhere it is accessible to collidine.
M.S. Holm et al. / Applied Catalysis A: General 356 (2009) 23–3026
39

highest CO pressure where the weakly acidic Si-OH sites still arevirtually unperturbed. At this CO pressure, the major part of theOHBrønsted sites have been consumed, i.e. formed adducts with CO.Notice that the sharp positive contribution at the highestfrequency (3750 cm"1 for all three samples) is related to atemperature effect and should not be considered as a featurearising from the interaction between the zeolites and CO. A smallblue-shift upon cooling has also been reported earlier [39].
For all three samples, the strongly acidic OHBrønsted sites areconsumed first (at the lowest CO pressures), giving the negativeband at 3613 cm"1 (3610 cm"1 for H-ZSM-5-0.20M) in Fig. 2. Theformation of OHBrønsted# # #CO adducts leads to a red-shift of then(OH)Brønsted mode to 3300 cm"1 at intermediate CO loadings(spectrum 5) for all three samples. This equals a frequency shift ofaround"310 cm"1. A significant enhancement in acid strength as aresult of the NaOH treatmentwould have increased the red-shift ofthe entire band or generated a downside shoulder below3300 cm"1 if only certain sites were affected. The magnitude ofthis shift (310 cm"1) is representative for H-ZSM-5 [38] and theacid strength distribution of the OHBrønsted sites seems to beunaffected by the increasing NaOH treatment. The high frequencyshoulder around 3450–3400 cm"1 is ascribed to perturbed OHgroups of extra framework Al originally absorbing at 3663 cm"1
(Fig. 1). The OH groups represented by this band have previouslybeen reported to red-shift 220–200 cm"1 upon CO adsorption
[34,35,40]. A further increase in CO pressure (spectra 6–11)progressively shifts the n(OHBrønsted) frequency to 3280–3270 cm"1 due to multilayered CO adsorption [41]. The increasingCO pressure also leads to erosion of the n(OH) vibrations of theweakly acidic Si-OH components at the higher frequencies and forthe parent sample two clearly distinct negative bands appear at3745 and 3728 cm"1 whereas the two corresponding bands withmaxima at 3644 and 3570 cm"1 grow in a parallel manner. Thesefeatures are somewhat similar for the NaOH treated samples, butthe band seen at 3570 cm"1 for the parent sample becomesconsiderably less prominent. This is most likely because the3570 cm"1 band predominantly represents the Si-OH groupsoriginally located in the 3730–3690 cm"1 frequency range (Fig. 1),and as we have seen these sites nearly vanish upon NaOHtreatment.
The spectra representing the n(CO) mode are displayed in theright part of Fig. 2. Starting from the lowest CO coverages, acomponent is clearly visible at 2174 cm"1 for all three samples. Ablue-shift of 36 cm"1 compared to the freemolecule (n(CO) liquid-like 2138 cm"1) confirms the expected strong polarization of CO bythe adsorbing sites. The component at 2174 cm"1 is ascribed to COadsorbed on the OHBrønsted sites, and the blue-shift of the n(CO)mode is identical for the three samples due to their very similaracid strengths. Higher CO pressures lead to interactions betweenCO and Si-OH groups, giving a componentwith amaximumaround2160 cm"1. Finally, the formation of a condensed phase (liquid-likeCO) results in the growth of a strong absorption at 2138 cm"1. Themost severely treated sample (H-ZSM-5-0.20M) also shows arather weak component at 2230 cm"1 not discernible for theparent sample and only barely visible for H-ZSM-5-0.05M uponmagnification. This band is commonly attributed to CO adsorbedon strong Lewis acidic sites. The 2230 cm"1 band is weak, but itshould be kept in mind that the extinction coefficient of CO hasbeen suggested to be diminished by the adsorption on Lewis sitescompared to adsorption on OHBrønsted. This decrease in extinctioncoefficient is explained by the enhanced electron donation fromCOto the Lewis site which in turn will reduce the dynamic dipolemoment and thereby also the extinction of the IR light. The ratiobetween the two extinction coefficients (e(COLewis)/e(COBrønsted))has been reported to be as high as 0.32 [42], and the concentrationof Lewis sites relative to the concentration of Brønsted sites maytherefore not be negligible. Fig. 3 shows amagnification (spectrum5 from H-ZSM-5-0.20) of the peak with a maximum at 2230 cm"1.Obviously, this band is composed of at least two components andpeak fitting suggest two maxima at 2230 and 2220 cm"1. The sumof the two components gives a curvewhich is superimposed on therecorded data (dotted curve). Moreover, neither the residuals northe second order derivative analysis indicated any furthersignificant contributions. Two maxima around 2230 and2220 cm"1 have been reported previously, but their exact assign-ments are still uncertain [33]. It is generally accepted that theLewis sites in zeolites are associated with extra framework Alspecies. It is likely that the presence of such species affects thecatalytic properties of the zeolite. The exact structure of these extraframework Al species is, however unknown, but the neutral speciesAlOOH and Al(OH)3, (Al(OH)3)2 and oxoaluminium cations such asAlO+, Al(OH)2
+ and Al(OH)2+ have been proposed. In our case, weobviously have (at least) two Lewis siteswith a significant differentability to polarize CO (Fig. 3). Based on FTIR and quantum chemicalmodelling, Brand et al. suggested that the bands at 3787 and3666 cm"1 (close to our observed bands at 3782 and 3663 cm"1)can be assigned to terminal and bridging OH groups in dimeric(Al(OH)3)2 species. Also, Fleisher et al. found that the 1H NMRchemical shift of the bridging protons in the (Al(OH)3)2 species is inthe range assigned to OH groups associated with extra frameworkAl species [43].
Fig. 2. FTIR difference spectra of dehydrated H-ZSM-5-PARENT, H-ZSM-5-0.05Mand H-ZSM-5-0.20M following CO adsorption at "196 8C. Left panel: the n(OH)region; right panel: the n(CO) region. The CO coverage increases successively fromspectra 1 to 11 in each series.
M.S. Holm et al. / Applied Catalysis A: General 356 (2009) 23–30 27
40

The exact role of Lewis sites in zeolites is still debated, but it hasbeen claimed for a while that they may increase the Brønstedacidity through so-called Brønsted–Lewis synergisms. Li et al.reported very recently that the preferred Lewis acid sites indealuminated Y zeolite (Al(OH)3 and Al(OH)2+ species) maycoordinate to the oxygen nearest the framework Al and enhancethe Brønsted acidity of the zeolite [44]. In contrast to this, otherrecent works have stated that Lewis sites are not necessarilyincreasing the Brønsted acid strength through the above-men-tioned synergism, but rather by stabilizing the conjugated base(negatively charged deprotonated zeolite) by hydrogen bondingand electrophilic interaction with the framework oxygen atom[45]. Other more subtle effects may also come into play whenreactant molecules are present, and Brunner et al. showed by MASNMR that the enhanced activity for hexane cracking obtained by amild hydrothermal dealumination of ZSM-5 is not due to anenhanced Brønsted acidity, but rather due to the interaction ofhexane with a bridging OH group and extra framework Al species[46]. Thus, apart from possibly increasing the Brønsted acidity, italso seems likely that Lewis sites indeed may facilitate hydrideabstraction and thus promote hydrogen transfer reactions byproviding positive charge. As the NaOH treatment also leads tosome change in overall Si/Al ratio it is, however, difficult toconfidently assess the exact role (if any) of the Lewis sites from thepresent results.
3.3. The localization of acid sites studied by FTIR and 2,4,6-trimethylpyridine (collidine) as molecular probe
The CO experiments have provided information about the acidstrength and the presence of Lewis acid sites in the samples.However, as CO is a small probe molecule it does not give anyinformation about the localization of the different sites in the ZSM-5 samples. Sterically demanding probe molecules, such asalkylated benzenes and pyridines, which are unable to penetratecertain parts of themicroporous system in zeolites, have been usedearlier for probing the accessibility of different sites in zeolites
[47,48]. Due to the sterically restrictivemicro channels of ZSM-5, itis unlikely that traditional polyaromatic coke species can beformed inside these channels and the external surface of H-ZSM-5has previously been suggested to be the culprit for the catalystdeactivation in the MTG reaction [49]. It may therefore be ofinterest to examine the external acidity and the possible changesthereof as a result of NaOH treatment. Furthermore, it is also ofinterest to study the localization of the Lewis acid sites that aregenerated during the NaOH treatment. Thus, we have employedcollidine, which is expected not to enter the internal voids of H-ZSM-5, as a probe molecule in order to characterize the externalsites of the crystals.
Fig. 3. Magnification and peak analysis of the n(CO) band generated frominteraction of CO with the strong Lewis acid sites present in sample H-ZSM-5-0.20M. The dotted curve represents the sum of the two peak components and issuperimposed on the recorded spectrum.
Fig. 4. FTIR spectra of dehydrated H-ZSM-5-PARENT, H-ZSM-5-0.05M and H-ZSM-5-0.20M. Left panel: spectra of the samples in the n(OH) region before (black curves)and after (grey curves) collidine saturation. Right panel: difference spectra of thecollidine saturated samples in the region covering the ring modes of collidine. Thespectra were recorded at room temperature.
M.S. Holm et al. / Applied Catalysis A: General 356 (2009) 23–3028
41

Collidine vapour was allowed to saturate the pretreatedsamples in the FTIR cell at room temperature. Fig. 4 presentsthe spectra of the pretreated zeolites (black spectra) and aftercollidine adsorption (grey spectra) for the three samples. The leftpart of Fig. 4 illustrates the effect of collidine adsorption on then(OH) region, whereas the right part represents the differentvibration modes of collidine (difference spectra). For the parentsample, the 3746 cm"1 band is strongly reduced in intensity uponcollidine dosage. This is in compliancewith previous reports whichhave assigned this band to Si-OH sites located on the externalsurface of the crystals. The remaining bands of the parent sampleare virtually unaffected, implying that the corresponding sites arelocated inside themicropore system. The desilicated samples act ina similar way as the parent sample in the n(OH) region, butinterestingly, a substantial part of the free Si-OH sites (3746 cm"1)is not accessible for collidine. This tendency increases withtreatment strength and is most pronounced for H-ZSM-5-0.20M.This supports our assumption that a significant part of the Si–OHsites that are created by the NaOH treatment is localized inmesopores, and not on the actual external surface where theywould have been accessed by collidine instantaneously (Scheme1). Why some of the sites located in the mesopores are difficult toreach for collidine cannot be confidently assessed. However, onepossibility is that a part of themesoporous system is located insidethe zeolite crystals and is surrounded by a micoporous system,consequentlymaking themunavailable for collidine as indicated inScheme 1. The high frequency n(OH) region of the desilicatedsamples also show that upon collidine dosage, the otherwiseinvisible/hidden peak at 3727 cm"1 appear, proving that thesesites are still present after NaOH treament and that they are themajor cause of the 3746 cm"1 tailing. The collidine experimentscan also give us some information regarding the localization of theextralattice Al–OH species. The 3663 cm"1 band maintains itsintensity and shape after collidine adsorption. From this informa-tion one can naturally not conclude that these sites are notdistributed throughout the crystal with aminor part at the surface,analogue to the ordinary Brønsted sites, but it is clear that thesesites are not only a surface phenomena since the majority of themare not able to interact with collidine.
In the region representing collidine vibrations (right part offigure), the bands at 1619 and 1575 cm"1 represent collidineadsorbed on Si-OH sites. Collidine adsorbed on Brønsted sites givesthe band at 1638 cm"1 [50]. Also here, the three samples behavesomewhat similar but some differences should be underlined. TheH-ZSM-5-0.20M sample shows a distinct low frequency shoulder
to the 1638 cm"1 band. This is most likely due to adsorption onexternal Lewis acid sites, which should give absorption at1633 cm"1 [50]. A further exploration of these Lewis sites wasfacilitated by CO adsorption on the collidine saturated samples.Fig. 5a shows the spectra of the H-ZSM-5-0.20M sample in the COstretching region. CO is adsorbed (at liquid N2 temperature)subsequent to collidine saturation. Fig. 5b is included forcomparison and shows the same region of the H-ZSM-5-0.20Msample after only CO adsorption. Clearly, the 2230 cm"1 band inFig. 5a, representing CO on Lewis acid sites, has virtually vanishedas a consequence of collidine saturation. From the characteristicbands in Fig. 5b, e.g. the Brønsted absorption at 2174 cm"1 it isapparent that CO has full access to the bulk crystal after collidinedosage. These observations allow us to conclude that the Lewisacid sites that are represented by the 2230 cm"1 absorption of COare predominantly generated on the external surface of thedesilicated sample (Scheme 1) where they may be accessed bybulky molecules such as collidine.
The direct effect of surface based Lewis acidity in the MTGreaction is at present unclear. However, this acidity may besignificant since the surface sites are excluded from shape selectiverestraints which in turn could affect product selectivity as well assurface deactivation by coke formation.
4. Conclusions
The improved catalytic activity previously observed for a ZSM-5zeolite treated with NaOH is possibly related to mesoporeformation and changes in acidity occuring during such a treatment.This study shows that the zeolite defects represented by internalSi–OH sites (e.g. silanol nests) are removed upon NaOH treatment.In a parallel manner, free Si–OH sites, typically located on theexternal surface of the zeolite crystals, increase in concentration. Acloser examination, carried out by using a sterically demandingprobe molecule (collidine), suggested that a significant part ofthese sites may be located in mesoporous domains that aresurrounded by a microporous framework, thus making the sitesinaccessible for the sterically demanding probe molecule.Furthermore, our results point to a selective mechanism forformation of mesopores as the framework dissolution preferen-tially takes place at defective sites in the crystallites. It is alsoshown that the acid strength of the ordinary Si(OH)Al Brønstedsites, as measured by FTIR and CO adsorption at liquid N2
temperature, is virtually unaffected by the alkaline leachingprocedure. However, both CO and collidine adsorption reveals
Fig. 5. FTIR difference spectra of CO adsorption at "196 8C on: (a) dehydrated H-ZSM-5-0.20M saturated by collidine, and (b) dehydrated H-ZSM-5-0.20M.
M.S. Holm et al. / Applied Catalysis A: General 356 (2009) 23–30 29
42
incipient dealumination, leading to strong Lewis acidity. Themajorpart of the thus created Lewis sites can be accessed by collidine,implying that the sites are located on the external surface of thezeolite crystals.
The suggested Brønsted–Lewis acid synergism is thus unlikelyto be the cause of the improved lifetime and higher HTI observed inthe desilicated samples.
References
[1] C. Baerlocher, W.M. Meier, D.H. Olson, Atlas of Zeolite Framework Types, Elsevier,Amsterdam, 2001, p. 184.
[2] M. Hartmann, Angew. Chem. Int. Ed. 43 (2004) 5880.[3] J.C. Groen, J.A. Moulijn, J. Perez-Ramırez, J. Mater. Chem. 16 (2006) 2121.[4] K. Egeblad, C.H. Christensen,M. Kustova, C.H. Christensen, Chem.Mater. 20 (2008)
946.[5] J.C. Groen, J.A. Moulijn, J. Perez-Ramırez, Ind. Eng. Chem. Res. 46 (2007) 4193.[6] J.C. Groen, L.A.A. Peffer, J.A. Moulijn, J. Perez-Ramırez, Colloid Surf. A 241 (2004)
53.[7] J.C. Groen, J.C. Jansen, J.A. Moulijn, J. Perez-Ramırez, J. Phys. Chem. B 108 (2004)
13062.[8] J.C. Groen, T. Bach, U. Ziese, A.M. Paulaime-van Donk, K.P. de Jong, J.A. Moulijn, J.
Perez-Ramırez, J. Am. Chem. Soc. 127 (2005) 10792.[9] J.C. Groen, J.A. Moulijn, J. Perez-Ramırez, Micropor. Mesopor. Mater. 87 (2005) 153.
[10] J.C. Groen, W. Zhu, S. Brouwer, S.J. Huynink, F. Kapeijn, J.A. Moulijn, J. Perez-Ramırez, J. Am. Chem. Soc. 129 (2007) 355.
[11] J.C. Groen, L.A.A. Peffer, J.A. Moulijn, J. Perez-Ramırez, Chem. Eur. J. 11 (2005) 4983.[12] X. Wei, P.G. Smirniotis, Micropor. Mesopor. Mater. 97 (2006) 97.[13] J.C. Groen, T. Sano, J.A. Moulijn, J. Perez-Ramırez, J. Catal. 251 (2007) 21.[14] J.C. Groen, S. Abello, L.A. Villaescusa, J. Perez-Ramırez, Micropor. Mesopor. Mater.
114 (2008) 93.[15] M. Ogura, S.-Y. Shinomiya, J. Tateno, Y. Nara,M. Nomura, E. Kikuchi, M.Matsukata,
Appl. Catal. A 219 (2001) 33.[16] L. Su, L. Liu, J. Zhuang, H. Wang, Y. Li, W. Shen, Y. Xu, X. Bao, Catal. Lett. 91 (2003)
155.[17] Y. Song, C. Sun, W. Shen, L. Lin, Catal. Lett. 109 (2006) 21.[18] J.S. Jung, J.W. Park, G. Seo, Appl. Catal. A 288 (2005) 149.[19] Y. Song, X. Zhu, Y. Song, Q. Wang, L. Xu, Appl. Catal. A 302 (2006) 69.[20] G. Lietz, K.H. Schnabel, Ch. Peuker, Th. Gross, W. Storek, J. Vølter, J. Catal. 148
(1994) 562.
[21] D. Ohayon, R. Le Van Mao, D. Ciaravino, H. Hazel, A. Cochennec, N. Rolland, Appl.Catal. A 217 (2001) 241.
[22] T. Montanari, M. Bevilacqua, G. Busca, Appl. Catal. A 307 (2006) 21.[23] M. Bjørgen, F. Joensen, M.S. Holm, U. Olsbye, K.-P. Lillerud, S. Svelle, Appl. Catal. A
345 (2008) 43.[24] C.D. Chang, Catal. Rev. 25 (1983) 1.[25] J. Topp-Jørgensen, Stud. Surf. Sci. Catal. 36 (1988) 293.[26] M. Støcker, Micropor. Mesopor. Mater. 29 (1999) 3.[27] G. Qin, L. Zheng, Y. Xie, C. Wu, J. Catal. 95 (1985) 609.[28] B.-L. Su, V. Norberg, Zeolites 19 (1997) 65.[29] B. Lu, T. Tsuda, Y. Oumi, K. Itabashi, T. Sano, Micropor. Mesopor. Mater. 76 (2004)
1.[30] I. Kiricsi, C. Flego, G. Pazzuconi, W.O. Parker, R. Millini, C. Perego, G. Bellussi, J.
Phys. Chem. 98 (1994) 4627.[31] A. Vimont, F. Thibault-Starzyk, J.C. Lavelley, J. Phys. Chem. B 104 (2000) 286.[32] S.M. Campbell, D.M. Biddy, J.M. Coddington, R.F. Howe, R.H.Meinhold, J. Catal. 161
(1996) 338.[33] H.V. Brand, A. Redondo, P.J. Hay, J. Mol. Catal. A 121 (1997) 45.[34] J. Szanyi, M.T. Paffett, Micropor. Mater. 7 (1996) 201.[35] A. Platon, W.J. Thomson, Catal. Lett. 101 (2005) 15.[36] C.J.A. Mota, P.M. Esteves, M.B. deAmorim, J. Phys. Chem. 100 (1996) 12418.[37] O. Bortnovsky, P. Sazama, B. Wichterlova, Appl. Catal. A 287 (2005) 203.[38] C. Paze, S. Bordiga, C. Lamberti, M. Salvalaggio, A. Zecchina, J. Phys. Chem. B 101
(1997) 4740.[39] S. Bordiga, P. Ugliengo, A. Damin, C. Lamberti, G. Spoto, A. Zecchina, G. Spano, R.
Buzzoni, L. Dalloro, F. Rivetti, Top. Catal. 15 (2001) 43.[40] A. Zecchina, S. Bordiga, G. Spoto, D. Scarano, G. Petrini, G. Leofanti, M. Padovan,
C.O. Arean, J. Chem. Soc., Faraday Trans. 88 (1992) 2959.[41] A. Zecchina, C.O. Arean, G.T. Palomino, F. Geobaldo, C. Lamberti, G. Spoto, S.
Bordiga, Phys. Chem. Chem. Phys. 1 (1999) 1649.[42] F. Wakabayashi, J.N. Kondo, K. Domen, C. Hirose, J. Phys. Chem. 99 (1995) 10573.[43] U. Fleischer, W. Kutzelnigg, A. Bleiber, J. Sauer, J. Am. Chem. Soc. 115 (1993) 7833.[44] S. Li, A. Zheng, Y. Sul, H. Zhang, L. Chen, J. Yang, C. Ye, F. Deng, J. Am. Chem. Soc. 129
(2007) 11161.[45] C.J.A. Mota, D.L. Bhering, N. Rosenbach, Angew. Chem. Int. Ed. 43 (2004) 3050.[46] E. Brunner, H. Ernst, D. Freude, T. Frohlich, M. Hunger, H. Pfeifer, J. Catal. 127
(1991) 34.[47] S.H. Baeck, K.M. Lee, W.Y. Lee, Catal. Lett. 52 (1998) 221.[48] N.S. Nesterenko, F. Thibault-Starzyk, V. Montouilliout, V.V. Yushchenko, C. Fer-
nandez, J.-P. Gilson, F. Fajula, I.I. Ivanova, Kinet. Catal. 47 (2006) 40.[49] M. Bjørgen, S. Svelle, F. Joensen, J. Nerlov, S. Kolboe, F. Bonino, L. Palumbo, S.
Bordiga, U. Olsbye, J. Catal. 249 (2007) 195.[50] F. Thibault-Starzyk, A. Vimont, J.-P. Gilson, Catal. Today 70 (2001) 227.
M.S. Holm et al. / Applied Catalysis A: General 356 (2009) 23–3030
43

FULL PAPER
DOI: 10.1002/ejic.200801194
“One-Pot” Ion-Exchange and Mesopore Formation During Desilication
Martin Spangsberg Holm,*[a,b] Martin Kalmar Hansen,[a] and Claus Hviid Christensen*[b]
Keywords: Zeolites / Mesoporous materials / Desilication / Ion exchange
A desilication protocol using tetramethylammonium hydrox-
ide was applied to zeolite beta. The new route presented
here integrates the desilication and ion-exchange post-treat-
ment steps allowing for a subsequent ion-exchange step to
be avoided. It is shown that the acidic and highly mesoporous
zeolite is obtained directly upon calcination. Thus, careful
Introduction
Zeolites are microporous crystalline materials composedof tetrahedral oxides of silicon and aluminum. The frame-work is formed through corner sharing of the oxygen atomsgiving rise to a multitude of structures.[1] The microporediameters of the zeolite structures are in the range of smallorganic molecules, which cause the molecular sieves abilityand allow for shape selective catalysis. Slow moleculartransport through the microporous channels may howeverlimit the applicability of zeolites as catalysts.[2] Various stra-tegies for introducing mesoporosity are now available toovercome this limitation by producing hierarchical zeolitematerials.[3] Well known protocols include dealumination,[4]
templating[5] and desilication.[6] Recently, several studies inwhich desilication is applied to the widely used high-silicazeolite ZSM-5 have been published.[7] Additional zeolitestructures e.g. beta,[8] ZSM-12[9] and mordenite[10] have alsobeen investigated. Sodium hydroxide and/or sodium car-bonate[11] are the typical bases applied, although lithiumhydroxide and potassium hydroxide have proven useful aswell.[12] Adjustment of temperature, amount of base, andduration of the treatment are effective tools for controllingthe extent of mesopore formation. However, even surpris-ingly mild conditions applied in attempts to desilicate zeo-lite beta with a mineral base were unable to create meso-porosity without seriously deteriorating the crystal struc-ture.[8] In addition, use of mineral bases causes ion-ex-change of the zeolite into the alkali form. This highlightstwo inherent shortcomings of the use of strong inorganicbases in the desilication protocol.Here, we use tetrameth-ylammonium hydroxide (TMAOH in the following) as the
[a] Center for Sustainable and Green Chemistry, Department ofChemistry, Technical University of Denmark,Building 206, 2800 Lyngby, Denmark
[b] Haldor Topsoe A/S,Nymøllevej 55, 2800 Lyngby, DenmarkE-mail: [email protected]
© 2009 Wiley-VCH Verlag GmbH & Co. KGaA, Weinheim Eur. J. Inorg. Chem. 2009, 1194–11981194
choice of base and post-treatment conditions lead to the fab-
rication of a hierarchical meso- and microporous structure
with completely retained crystallinity.
(© Wiley-VCH Verlag GmbH & Co. KGaA, 69451 Weinheim,
Germany, 2009)
desilicating agent, and show that it leads to several interest-ing advantages. A “one-pot” desilication and ion-exchangeprocedure as reported here gives a procedure in which asubsequent ion-exchange step transforming the zeolite intoproton form is avoided. This is possible since the chargecompensating TMA+ ions in the zeolite framework decom-poses during calcination to give the proton form. TMAOHwas specifically chosen as the organic base due to its in-herent strong basicity and the relative small size of theTMA+ cation. Mesopore formation using TMAOH wasstudied as a function of treatment time, temperature, andbase amount. The extent of the simultaneous ion-exchangewas monitored by NH3-TPD and FT-IR.
Results and Discussion
A zeolite beta was synthesized by the fluoride route witha nominal Si/Al ratio of 35. This aluminum content haspreviously been identified as within the optimal range fordesilication of ZSM-5.[13] The crystalline zeolite beta wasinitially ion-exchanged into the sodium form to allow thetransformation from Na-form into H-form to occur duringpost-treatment. The series of desilications were performedaccording to the conditions listed in Table 1. The desil-ication conditions were chosen to investigate the effect onmesopore formation arising from temperature, time andTMAOH amount present.
Figure 1 presents the XRPD diffractograms of the parentsample along with the most severely desilicated sampleschosen from Table 1. The parent sample is identified ashighly crystalline zeolite beta which is also supported by at-plot derived micropore volume of 0.202. Further it is seenfrom Figure 1, that all samples desilicated using TMAOH(samples 4, 7, 11) preserve crystallinity. A mild treatmentusing NaOH as the desilication agent instead of TMAOHwas included for comparison (sample 12). In contrast tosamples 1–11, sample 12 has lost almost all crystallinity as
44

Zeolite Beta Desilication
Table 1. Treatment conditions and physical-chemical data.
Sample TMA media Time Temp. TMA+/Na+ SBET Smeso Vmeso [mL/g] Vmicro Acidity[b] Exchange[mmol/g] [h] [°C] ratio[a] [m2/g] [m2/g] (P0.99 – Vmicro) [mL/g] [mmol/g] level[c]
Parent – – – – 539 66 – 0.202 0.21 –1 10 1/2 65 20 551 93 ! 0 0.205 0.21 0.822 10 2 65 20 561 114 0.076 0.198 0.24 0.913 10 4 65 20 585 125 0.150 0.201 0.24 1.004 10 6 65 20 599 140 0.173 0.197 0.24 1.025 10 2 50 20 531 95 ! 0 0.194 0.22 0.826 10 2 80 20 601 141 0.193 0.196 0.24 1.077 10 2 100 20 696 266 0.364 0.186 0.28 1.108 2.5 2 65 5 540 106 0.034 0.193 0.23 0.979 5 2 65 10 563 118 0.084 0.197 0.23 1.0410 20 2 65 40 560 107 0.083 0.200 0.24 0.8611 50 2 65 100 559 106 0.045 0.203 0.23 0.7112 10 (NaOH) 1/2 65 – 787 489 0.304 0.081 – –
[a] Approximate value assuming one sodium ion per Al atom and a zeolite with Si/Al ratio of 35. [b] NH3-TPD of the ion-exchangedmaterial. [c] Ratio between the integrated area of the NH3-desorption curve before and after ion-exchange.
seen from Figure 1, which is also indicated by a diminishedmicropore volume of only 0.081 mL/g. This is in agreementwith results published recently on desilication of zeolitebeta using NaOH.[8] The mesopore formation usingTMAOH progresses slower than what is typically observedfor desilication using NaOH.[8,14] Extending treatment timefrom 1/2 hour to as much as 6 h allows for continuous me-sopore evolution as can be seen from the textural data inTable 1 (samples 1–4). A gradual increase in the mesoporevolume Vmeso and the mesopore surface area Smeso are thusobserved as a function of treatment time. Isotherms and theBJH-derived pore size distributions for samples parent, 1–4, and 12 are given in Figure 2. Sorption data from sample12 which was desilicated by NaOH are included in Figure 2.The isotherms from sample 12 do neither resemble a type Iisotherm as is typical seen for a microporous materials norone for a combined micro- and mesoporous material as canbe seen for the TMAOH-desilicated samples. This observa-tion correlates well with the results obtained from XRDanalysis indicating that a partial framework collapse occurwhen using NaOH but can be avoided by using TMAOH.
Figure 1. XRPD diffractograms of selected samples from Table 1.Diffractograms are offset by 10000 units for illustrative purposes.
Eur. J. Inorg. Chem. 2009, 1194–1198 © 2009 Wiley-VCH Verlag GmbH & Co. KGaA, Weinheim www.eurjic.org 1195
Figure 2. (a) N2-adsorption/desorption isotherms of samples 1–4and 12. Isotherms are offset by 50 units for illustrative purposes.(b) BJH-derived pore size distributions.
The important experimental parameters with respect tomesopore generation was systematically investigated byvarying the temperature in samples 5–7 and the amount ofTMAOH in samples 8–11. Interestingly, as the temperatureis increased from 50 °C to 100 °C, the mesopore formationaccelerates as illustrated by the isotherms in Figure 3 (a).The BJH-derived pore size distributions are shown in partb of Figure 3. From Figure 3 (b) it can be seen that poresare gradually forming within the mesopore range (2–50 nm)
45

M. S. Holm, M. K. Hansen, C. H. ChristensenFULL PAPER
and that the pore diameter increases as a function of tem-perature. The mesopore volume clearly increases in a sim-ilar way to as much as 0.364 mL/g for sample 7. Furtheranalyzing the sorption data, it is interesting to note that atprolonged desilication times and at high temperatures, weobserve a slight decrease in the micropore volume of up toca. 8% (sample 7, desilicated at 100 °C), which indicate thatcrystallinity of these samples may be slightly reduced. Thisis in line with expectation since previous studies have re-ported similar observations on mesoporous structures.[15]
Samples 2, 8–11 highlight the effect on mesoporosity whenincreasing the amount of TMAOH. This post-treatment pa-rameter is very important in this new desilication protocolsince we aim to quantitatively exchange Na+ as the chargecompensating cation with TMA+ during the treatment. So-dium is present as the charge compensation cation in thestarting material. In Table 1 it is shown that a TMAOHamount of 10 mmol/g leads to an approximate TMA+/Na+
ratio of 20. This ratio is estimated from the theoretical alu-minum density in a framework with an Si/Al ratio of 35 andassuming complete initial charge compensation by sodium.Varying the TMAOH amount between 5 and 20 mmol/gduring desilication (samples 2, 9, and 10) lead only to minorvariations in the mesopore formation. However, a decreaseand surprisingly also an increase by a factor of 4 (samples
Figure 3. N2-adsorption/desorption isotherms. (a) Increasing treat-ment temperature. (b) BJH-derived pore size distributions. Iso-therms in (a) are offset by 50 units in relation to the previous forillustrative purposes.
www.eurjic.org © 2009 Wiley-VCH Verlag GmbH & Co. KGaA, Weinheim Eur. J. Inorg. Chem. 2009, 1194–11981196
8, and 11) both lead to a limited mesopore formation. Themodest mesoporosity formed when as much as 50 mmol/gTMAOH was used could be explained by a structure stabi-lizing ability of the TMA+ ion, since it resembles the tem-plate (TEA+) typically used in the synthesis crystallizingzeolite beta.
NH3-TPD was used to monitor the acidity of the zeo-lites. The acidity of the desilicated samples 1–11 were mea-sured after calcination at 550 °C for 6 h in static air. Follow-ing this measurement the samples were ion-exchanged com-pletely into H-form and the acidity measurements by NH3-TPD were repeated. By comparing the two values, beforeand after ion-exchange, we were able to monitor whetherthe TMAOH desilication followed by calcination directlyproduced the protonic form of the zeolite. Figure 4 showsthe NH3-TPD curves of sample 2 before and after ion-ex-change. We observe two very similar ammonia desorptionsprofiles both with a maximum around 345 °C correspond-ing to ammonia desorbing from the strong Brønsted acidicbridging hydroxy group. The integrated area under thecurve corresponds to a measure of the total acidity. A slightincreased is apparent after the ion-exchange in the case ofsample 2. We interpreted this as the majority of the treatedzeolite being transferred into proton form directly by theTMAOH desilication. However, the difference between thecurves ist likely due to minor amounts of sodium still per-forming the charge compensation. The ratio between theintegrated area of the two NH3-desorption curves is thus ameasure of the level of ion-exchange obtained directly fromthe TMAOH desilication. This ratio for all samples is listedin Table 1. For the most interesting samples, we observevery high exchange levels close to unity. This means thatit is possible to obtain close to complete ion-exchange bycombining the desilication and calcination procedures. Sur-prisingly, some of the most harshly desilicated samples(samples 6, 7 and 9) show an exchange level slightly above1. This could be explained by the formation of extra frame-work aluminum (EFAL) as a consequence of harsh desil-ication which would introduce Lewis acidity.[16] Possibly
Figure 4. NH3-TPD of (a) sample 2 after TMAOH desilication andcalcination and (b) sample 2 ion-exchanged into proton form.
46

Zeolite Beta Desilication
these extra framework aluminum species could solely con-tribute to the acidity before the ion-exchange due to re-moval during the ion-exchange procedure. Importantly, it isseen that increasing the TMAOH amount above 5 mmol/gdecreases not only the mesopore surface area Smeso but alsothe level of ion-exchange obtained. This shows that hugeamounts of TMAOH is not necessarily required to obtaina quantitatively ion-exchange into the proton form. We hy-pothesize that the ion-exchange is positively affected by ahigh affinity of sodium to coordinate to dissolved silicatespecies compared to performing the charge compensation.Further in Table 1, it is summarized that in all cases wheremesoporosity is formed, an increase in total acidity is seen.This is in line with expectations from the selective siliconextraction.[14]
NH3-TPD does not discriminate between Lewis andBrønsted acidity. However, a IR absorption at ca. 3610 cm–1
in the zeolite originates from the Brønsted acidic bridginghydroxy group.[17] Figure 5 presents the FT-IR absorptionspectra of the parent sample in sodium and protonic formalong with sample 3 which was desilicated with TMAOHand subsequently calcined. From Figure 5 it is seen that the3610 cm–1 band is absent in the sodium form (a) but clearlypresent in the protonic form (b) of the parent sample. Afterthe desilication process the band at 3610 cm–1 is reintro-duced in spectrum (c) confirming that the treated zeoliteindeed contains conventional Brønsted acidic sites. This in-formation supports the previous observations that it is pos-sible to perform the ion-exchange and mesopore formationin one synthesis step.
Figure 5. FT-IR absorption spectra of (a) parent sample in sodiumform, (b) parent sample in protonic form and (c) sample 3(TMAOH-desilicated and calcined). Spectra normalized to theframework overtones and offset for illustrative reasons.
Scanning electron microscopy was applied to study mor-phology changes in the material. For the parent zeolite anarrow crystal size distribution centered on 10 µm arefound as can be seen in Figure 6A. Image 6B (sample 3) isan example of how the crystals can be partly deterioratedmainly at the top and bottom of the bipyramidal structureas a function of the desilication.
Image 6C and 6D (samples 6 and 7) reveal how increasedtemperature during treatment affects the crystals. Image 6C
Eur. J. Inorg. Chem. 2009, 1194–1198 © 2009 Wiley-VCH Verlag GmbH & Co. KGaA, Weinheim www.eurjic.org 1197
Figure 6. SEM images of the parent sample (a), sample 3 (b), sam-ple 6 (c) and sample 7 (d).
show the presence of large cracks in the crystals. A furthertemperature increase to 100 °C in 6D leads to a similar be-havior but additionally tends to create more crystal debrisand partly destroy the original crystal morphology. It is,however, unlikely that the crystal debris is amorphous mate-rial since we observe essentially no changes in the dif-fractograms of these samples and only a minor decrease inmicropore volume. Since we are able to introduce meso-porosity as seen in 6C before we observe substantial crystaldismantling, we interpret the micrographs as it is possibleto create intra rystal mesoporosity by desilicating withTMAOH. Contributions to the overall porosity from inter-crystal voids could though be substantial in cases of severedesilication conditions. Interestingly, desilicating zeolitebeta initially in protonic form, i.e. without sodium presentusing TMAOH results only in limited mesopore formation.In this case we know that one equivalent of base is con-sumed to neutralize the solid acid and TMA+ is localizednear the aluminum to charge compensate the framework.However, the results obtained from varying the baseamounts indicate that a slight decrease in total OH– in thesolution is unlikely to be the sole explanation for a differentdegree of mesopore formation. Rather this result indicatesthat Na+ is needed for the hydrolysis of the Si–O–Si bondto proceed effectively, somewhat similar to the mineralizingability during synthesis. One should note the close resem-blance between typical synthesis conditions and the desil-ication conditions used in this study. That is a highly basicaqueous suspension of the zeolite with a tetraalkylammo-nium cation present. Based on this, we hypothesize that theTMA+ ion is able to stabilize the zeolite structure duringdesilication. This could explain why the structure does notcollapse as was seen when using NaOH.[8] Potentially alsoimportant is the fact that without sodium present duringthe desilication the framework will be charge compensatedsolely by the bulky TMA+ ion which could increase dif-fusion restraints and thereby prevent or simply slow thepore formation. Considering we are trying to desilicate astructure containing a relative high amount of aluminum(Si/Al: 35) this could very well be a limiting factor.
47

M. S. Holm, M. K. Hansen, C. H. ChristensenFULL PAPER
Conclusions
In conclusion we have demonstrated how a tetraalkylam-monium base is useful for desilication of zeolite beta. Theprocedure combines the desilication and ion-exchange stepsin the direct preparation of a highly mesoporous and acidiczeolite. Further, mesopore sizes and volumes may to someextend be controlled, though not totally independent fromeach other. The presented study highlights the importanceof proper base choice when introducing mesoporosity intozeolite structures by desilication. It shows that for specificzeolite structures, it is necessary to carefully search for theoptimal base that stabilize the zeolite structure during desil-ication. This approach is expected to be useful for achievinghierarchical forms of other zeolites by the desilication pro-tocol.
Experimental Section
General: Zeolite beta with a nominal Si/Al ratio of 35 was synthe-
sized by the fluoride route using a slightly modified procedure pub-
lished elsewhere.[18]
Preparation of the Synthesis Gel: Solid aluminum was dissolved in
an aqueous solution (40 wt.-%) of tetraethylammonium hydroxide.
After approximately one hour, a clear solution was obtained, and
TEOS was slowly added over 30 min. The mixture was left for ca.
20 h with stirring at room temp. to hydrolyze TEOS and promote
evaporation of ethanol, along with some water, producing a highly
viscous gel. HF (40 wt.-%) was subsequently added dropwise with
rapid stirring. The resulting white rigid gel with a molar oxide com-
position: 1 SiO2/0.0143 Al2O3/0.275 (TEA)2O/0.55 F was transfer-
red to a Teflon® cup and crystallized under static conditions in a
sealed stainless steel autoclave kept at 140 °C for 7 d. The crystal-
line zeolite was isolated by suction filtration and washed twice by
re-dispersion in demineralized water. The organic template was re-
moved by calcination at 550 °C in static air for 12 h using a heating
ramp of 2 °C/min.
Typical Desilication: The zeolite (in sodium form) was suspended
in hot 0.1 ! aqueous TMAOH. The reaction was stopped by cool-
ing the container in an ice bath and subsequently isolating the zeo-
lite by suction filtration. The zeolite was washed thoroughly in de-
mineralised water, dried at 110 °C overnight and calcined in static
air at 550 °C for 6 h using a heating ramp of 2 °C/min. This cal-
cined sample is denoted “before ion-exchange” in the text above.
The proton or sodium form of the zeolite was obtained by threefold
ion-exchange in a 1 ! NH4NO3 or 1 ! NaCl solution, respectively
followed by calcination at 550 °C for 6 h. The proton form ob-
tained this way is denoted “after ion-exchange” in the text above.
The samples were characterized by XRPD, N2-sorption, FT-IR,
NH3-TPD and SEM. XRPD analysis were performed on a Bruker
AXS powder diffractometer. N2-sorption experiments were done
using a Micromeritics ASAP 2020 apparatus. Prior to N2-sorption
the samples were outgassed in vacuo at 200 °C for 4 h. For FT-IR
the zeolites were pressed into self supporting wafers and dehydrated
at 400 °C for 2 h prior to analysis. A BioRad FTS 80 spectrometer
equipped with a MCT detector was used. A Micromeretics Auto-
www.eurjic.org © 2009 Wiley-VCH Verlag GmbH & Co. KGaA, Weinheim Eur. J. Inorg. Chem. 2009, 1194–11981198
chem II equipped with a TCD detector was used for NH3-TPD
experiments. Dry weights of the samples were obtained after out-
gassing in vacuo at 300 °C for 1 h. The NH3 desorption curve was
measured after desorption of physi-sorbed ammonia for 4 h at a
temperature of 150 °C while kept in a He flow of 25 mL/ min. SEM
images of the platinum/palladium-coated samples were obtained
with a Philips XL 30 ESEM-FEG equipment.
Acknowledgments
The Center for Sustainable and Green Chemistry is sponsored by
the Danish National Research Foundation. The authors thank
Bodil F. Holten and Sven Ullmann for technical assistance.
[1] www.iza-structure.org/databases (accessed December 2008).[2] a) Y. Tao, H. Kanoh, L. Abrams, K. Kaneko, Chem. Rev. 2006,
106, 896; b) A. Corma, Chem. Rev. 1997, 97, 2373.[3] J. Cejka, S. Mintova, Catal. Rev. 2007, 49, 457.[4] A. H. Janssen, A. J. Koster, K. P. Jong, J. Phys. Chem. B 2002,
106, 11905.[5] a) H. Wang, T. J. Pinnavaia, Angew. Chem. Int. Ed. 2006, 118,
7765; b) C. J. H. Jacobsen, C. Madsen, J. Houzvicka, I.Schmidt, A. Carlsson, J. Am. Chem. Soc. 2000, 122, 7116; c)K. Egeblad, C. H. Christensen, M. Kustova, C. H. Christensen,Chem. Mater. 2008, 20, 946; d) M. Choi, H. S. Cho, R. Srivas-tava, C. Venkatesan, D.-H. Choi, R. Ryoo, Nat. Mater. 2006,5, 718.
[6] a) R. M. Dessau, E. W. Valyocsik, N. H. Goeke, Zeolites 1992,12, 776; b) G. Lietz, K. H. Schnabel, Ch. Peuker, Th. Gross,W. Storek, J. Völter, J. Catal. 1994, 148, 562; c) D. Ohayon,R. L. V. Mao, D. Ciaravino, H. Hazel, A. Cochennec, N. Rol-land, Appl. Catal. A 2001, 217, 241; d) J. C. Groen, L. A. A.Peffer, J. A. Moulijn, J. Perez-Ramirez, Chem. Eur. J. 2005, 11,4983.
[7] a) M. Bjørgen, F. Joensen, M. S. Holm, U. Olsbye, K.-P. Lil-lerud, S. Svelle, Appl. Catal. A 2008, 345, 43; b) M. Ogura, S.Shinomiya, J. Tateno, M. Nomura, E. Kikuchi, M. Matsukata,Appl. Catal. A 2001, 219, 33.
[8] J. C. Groen, S. Abelló, L. A. Villaescusa, J. Pérez-Ramírez,Microporous Mesoporous Mater. 2008, 114, 93.
[9] X. Wei, P. G. Smirniotis, Microporous Mesoporous Mater. 2006,97, 97.
[10] J. C. Groen, T. Sano, J. A. Moulijn, J. Pérez-Ramírez, J. Catal.2007, 251, 21.
[11] R. L. V. Mao, A. Ramsaran, S. Xiao, J. Yao, V. Semmer, J.Mater. Chem. 1995, 5, 533.
[12] J. C. Groen, J. A. Moulijn, J. Pérez-Ramírez, Ind. Eng. Chem.Res. 2007, 46, 4193.
[13] J. C. Groen, J. C. Jansen, J. A. Moulijn, J. Pérez-Ramírez, J.Phys. Chem. B 2004, 108, 13062.
[14] J. C. Groen, J. A. Moulijn, J. Pérez-Ramírez, MicroporousMicroporous Mater. 2005, 87, 153.
[15] P. Prokesova-Fojtíková, S. Mintova, J. Cejka, N. Zilková, A.Zukal, Microporous Microporous Mater. 2006, 92, 154.
[16] M. S. Holm, S. Svelle, F. Joensen, P. Beato, C. H. Christensen,S. Bordiga, M. Bjørgen, Appl. Catal. A, 2008, in press.
[17] C. Pazé, S. Bordiga, C. Lamberti, M. Salvalaggio, A. Zecchina,J. Phys. Chem. B 1997, 101, 4740.
[18] M. A. Camblor, A. Corma, S. Valencia, J. Mater. Chem. 1998,8, 2137.
Received: December 9, 2008Published Online: February 11, 2009
48

Please cite this article in press as: M.S. Holm, et al., Catalysis with hierarchical zeolites, Catal. Today (2011), doi:10.1016/j.cattod.2011.01.007
ARTICLE IN PRESSG Model
CATTOD-7186; No. of Pages 14
Catalysis Today xxx (2011) xxx–xxx
Contents lists available at ScienceDirect
Catalysis Today
journa l homepage: www.e lsev ier .com/ locate /ca t tod
Catalysis with hierarchical zeolites
Martin Spangsberg Holma,b,c, Esben Taarninga, Kresten Egeblada, Claus Hviid Christensena,!
a Haldor Topsøe A/S, Nymøllevej 55, DK-2800 Lyngby, Denmarkb Center for Sustainable and Green Chemistry, Department of Chemistry, Technical University of Denmark, DK-2800 Lyngby, Denmarkc Centre for Catalysis and Sustainable Chemistry, Department of Chemistry, Technical University of Denmark, Anker Engelundsvej 1, 2800 Kgs, Lyngby, Denmark
a r t i c l e i n f o
Article history:
Received 12 October 2010Received in revised form 9 December 2010Accepted 8 January 2011Available online xxx
Keywords:
Mesoporous zeolitesHierarchical zeolitesCatalysis
a b s t r a c t
Hierarchical (or mesoporous) zeolites have attracted significant attention during the first decade of the21st century, and so far this interest continues to increase. There have already been several reviews givingdetailed accounts of the developments emphasizing different aspects of this research topic. Until now,the main reason for developing hierarchical zeolites has been to achieve heterogeneous catalysts withimproved performance but this particular facet has not yet been reviewed in detail. Thus, the presentpaper summaries and categorizes the catalytic studies utilizing hierarchical zeolites that have beenreported hitherto. Prototypical examples from some of the different categories of catalytic reactionsthat have been studied using hierarchical zeolite catalysts are highlighted. This clearly illustrates thedifferent ways that improved performance can be achieved with this family of zeolite catalysts. Finally,future opportunities for hierarchical zeolite catalysts are discussed, and the virtues of various prepara-tion methods are outlined, including a discussion of possible pitfalls in the evaluation of new, potentialhierarchical zeolite catalysts.
© 2011 Elsevier B.V. All rights reserved.
1. Introduction
During the last decade, the scientific literature on hierachicalzeolites has dramatically increased, and several reviews high-lighting various aspects of the recent developments have alreadyappeared [1–7]. The term hierarchical zeolites refers to zeolites fea-turing at least one additional level of porosity besides the intrinsicmicropore system characteristic of zeolites. In practice the termmost often refers to mesoporous zeolites, i.e. hierarchical zeolitesfeaturing additional porosity in the mesopore size region (porediameters in the range 2–50 nm) because the major impact ofauxiliary porosity on catalysis stems from porosity in this sizeregion. Interestingly, it is difficult to trace the true origin of hier-archical zeolites, and their use as heterogeneous catalysts, sinceit is more or less hidden in the patent literature. However, withthe current knowledge about these materials and their prepara-tion methods there is no doubt that several early patents describemethods for preparing such zeolite materials, and also their useas heterogeneous catalysts in various reactions [8–11]. One reasonthat it is often not trivial to conclude when hierarchical zeoliteswere claimed in the patent literature is that the physical-chemicalcharacterization reported originally does not provide direct evi-dence for the detailed structure of the materials studied. Thus,much of the recent interest in hierarchical zeolites can be ascribed
! Corresponding author.E-mail address: [email protected] (C.H. Christensen).
to improved methods for visualization of the structure of thesematerials, and particularly to the wider availability of sufficientlyelaborate electron microscopy techniques, such as high-resolutionTEM and TEM tomography. With these methods, the structure ofhierarchical zeolite catalysts can de deduced in impressive detail,and the observed catalytic performance can more easily be relatedto their structure. However, it is still necessary also to use vari-ous other physical–chemical characterization methods to establishthat the structural modification of hierarchical zeolites has not leadto significant changes in other catalytically important propertiesof the zeolite, especially with respect to zeolite acidity. Only thisway, reliable structure-activity relationships can be quantitativelyestablished.
Here we present a review of the literature reporting the useof hierarchical zeolites as catalysts for different reaction types.The reactions types are divided into classes comprising alkyla-tion, methanol-to-hydrocarbons (MTH) and olefin aromatization,isomerisation, cracking, condensation and other, more specific,reactions. The alkylation, isomerisation and cracking reactionsshare the same carbenium chemistry and could be viewed together.However, since the size of the substrates used and the operatingtemperature differs widely in these three categories, the effect ofmesopores also differs and they are therefore treated separately.
One of the major limitations for the use of zeolites as cata-lysts is the limited access to the active sites within the individualcrystals. This attribute serves as the material’s strength (allowingfor shape selectivity) as well as a weakness (mass transport lim-itations). It is predicted that mesoporous zeolites can contribute
0920-5861/$ – see front matter © 2011 Elsevier B.V. All rights reserved.
doi:10.1016/j.cattod.2011.01.007
49

Please cite this article in press as: M.S. Holm, et al., Catalysis with hierarchical zeolites, Catal. Today (2011), doi:10.1016/j.cattod.2011.01.007
ARTICLE IN PRESSG Model
CATTOD-7186; No. of Pages 14
2 M.S. Holm et al. / Catalysis Today xxx (2011) xxx–xxx
Table 1
Overview of the different reaction classes and the main effect of mesoporouszeolites.
Reaction type Main observation
Alkylation reactions Higher activityTransalkylation reactions Improved stabilityIsomerisation reactions Higher activityCracking of light substrates No significant improvementCracking of heavy substrates Substantially higher activityMTH and aromatization reactions Longer catalyst lifetimeCondensation reactions Higher activity. Higher selectivity
towards bulky products
to the field of catalysis in either of two ways. These hierarchicalmaterials can potentially increase the number of reactions in whichzeolites are used by allowing acceptable mass transport of largerreactants and products and allowing for reactions catalyzed bystrong acidity to proceed on the mesopore surface and pore mouth.Alternatively mesoporous zeolites can simply serve by improvingexisting reactions/processes currently using zeolite catalysts. It ishere illustrated how examples of both applications exist in liter-ature. A summary of the major trends observed for hierarchicalzeolites categorized by reaction type is shown in Table 1.
2. Alkylation reactions
Alkylations and acylations are important reactions in indus-try for which zeolites find use. Unfortunately, these processes arerarely operated at full potential due to mass transfer limitationswithin the zeolite catalysts; therefore, the advantages of apply-ing mesoporous zeolites as catalysts for these transformationsare obvious. In the literature, several reports are available deal-ing with mesoporous zeolites for such transformations, particularwith alkylation of benzene. The general finding in these reportsis the observation that mesoporous zeolites are more active forthese transformations. This is expected due to shorter diffusionpath length in mesoporous zeolites, however, what is perhaps notso obvious is why also an increased selectivity to monoalkylatedproducts is observed.
2.1. Benzene alkylation
Christensen et al. [12] reported the use of mesoporous ZSM-5prepared by carbon-templating for gas phase alkylation of benzenewith ethylene (Scheme 1).
The authors used a molecular ratio of benzene:ethylene of5.1:1, pressures from 2.5 to 5 bar and temperatures from 583 to643 K. Undesired side reactions include the formation of di- and trialkylated ethyl benzenes as well as numerous alkylated benzenesarising from transalkylation of the product. It was shown, that themesoporous zeolite was significantly more active than the conven-tional zeolite catalyst. Moreover, it was shown that the selectivitytowards ethyl benzene was significantly higher using the meso-porous zeolite and that the effect was even more pronounced athigh conversions. The increased selectivtity towards the monoalky-lated product, ethyl benzene, can be understood by looking at theschematic representation in Fig. 1 of the relative concentration pro-files of benzene, ethylene and ethyl benzene [13].
+
benzene ethyl benzene
Scheme 1.
Fig. 1. Schematic of the relative concentration profiles (disregarding molecularadsorption) of benzene (A), ethylene (B) and ethyl benzene (C) in conventional andmesoporous ZSM-5 during alkylation of benzene with ethylene (figure reproducedfrom Ref. [13]).
The concentration profiles illustrated in Fig. 1 were derived froma classical evaluation of diffusion properties of the benzene, ethy-lene and ethylbenzene under actual operating conditions, showingthat benzene and ethylbenzene are diffusion limited if the crystalsare too large [13]. The concentrations of reactants and products inthe zeolite and in the gas phase are likely different due to adsorp-tion. However, as benzene is consumed in the alkylation reaction,a concentration gradient enriched in ethylbenzene and depletedin benzene is expected to be present in the conventional sam-ple where diffusion restraints are pronounced. It is clear that if arelatively higher concentration of ethylbenzene exists in the inte-rior of the crystal, this must lead to the formation higher levelsof diethylbenzene. In other words, diffusion limitations in conven-tional crystals during alkylation of benzene with ethylene lead tohigher levels of polyalkylated products than desired. On the con-trary, in case of the mesoporous crystal, having a shorter averagediffusion path length, the concentrations of ethylbenzene and ben-zene throughout the crystal will be much closer to the value strictlydetermined by gas phase concentration and adsorption affinity. Ineffect, successive alkylation of ethylbenzene is not as likely to occurin the mesoporous zeolite as in the case of the conventional one,and the monoalkylated product is predominant.
Dealumination of mordenite has been well understood for sev-eral decades but recently also base treatment (desilication) ofmordenite, either alone or in combination with dealumination, hasbeen successfully performed to obtain similar advantages.
In close relation to the previous example Groen et al. [14] com-pared a mesoporous mordenite catalyst obtained by desilicationto a commercial sample with a smaller crystal size and higheracid density in the liquid phase benzene alkylation with ethylene.Despite the advantage with respect to crystal size and acidity, thehierarchical mordenite showed an initial higher activity in com-parison with the commercial mordenite. Much more pronouncedthough was a remarkably slow deactivation of the mesoporoussample coupled with a slightly higher selectivity towards thedesired ethyl benzene. The improved catalytic performance as dis-cussed above was attributed to the enhanced mass transport. Thisreport is a particularly interesting case where the authors chose touse the zeolite in the liquid phase where mass transport limitationspose much greater problems as compared to gas phase reactions.Nevertheless liquid phase reactions represent an interesting areain which mesoporous zeolites can find applications.
Three different commercially available mordenite samples weredesilicated and tested in liquid phase benzene alkylation withpropene producing cumene (iospropylbenzene) in a study by deJong and co-workers [15]. The mordenite samples were outside theoptimal window with respect to Si/Al ratio for desilication [16] butwith an increased concentration of sodium hydroxide mesopore
50

Please cite this article in press as: M.S. Holm, et al., Catalysis with hierarchical zeolites, Catal. Today (2011), doi:10.1016/j.cattod.2011.01.007
ARTICLE IN PRESSG Model
CATTOD-7186; No. of Pages 14
M.S. Holm et al. / Catalysis Today xxx (2011) xxx–xxx 3
formation proved possible. TEM imaging supported by additionalcharacterization led the authors to conclude that the mesoporositywas mostly inter-particle, which lowers mass transport limita-tions between the nanosized particles. Indeed, for the alkylationof benzene with propylene over the alkali treated sample, an ini-tial activity boost in the order of one magnitude was observed,while maintaining a similar cumene selectivity. The same authors[17] also used cumene synthesis to investigate whether a sequen-tial post synthesis treatment using dealumination and desilicationof commercially available mordenite could be advantageous. Acomprehensive series of samples, dealuminated, desilicated orcombinations thereof were prepared and compared to gain insightinto the catalytic effects of Al-content, inter- and intracrystallineporosity, acid strength or the presence of extra-framework alu-minum. Catalytically, the parent mordenite sample performedrelatively poor, having a lower activity and selectivity towardscumene/di-isopropyl benzene as compared to reported literaturevalues. Dealumination improved the performance only slightly,whereas a subsequent optimized desilication treatment resultedin a mesoporous catalyst having a significantly higher activity (upto 27-fold increase). Alas, the higher activity was accompaniedby an increased selectivity towards di- and tri-isopropyl benzene.Interestingly, desilication of the parent sample gave an excellentcombined cumene/di-isopropylenbenzene selectivity of >99% aris-ing from suppressed propylene oligomerization which the authorsattribute to the likely removal of weak Lewis acidic site presenton the external surface. This observation highlights the complex-ity of interpreting catalytic data since mesopore formation occursconcurrently with a modification of the acidity of the samples. Theuse of thorough characterization methods (e.g. electron tomogra-phy, (MAS) NMR or FTIR using molecular probes) are thus neededin order to be able to discuss the full array of changes introducedduring post synthesis treatment.
Commercial mordenite catalysts treated by desilication ordealumination have also been tested in transalkylation of alkyl-benzenes (toluene and 1,2,4-trimethyl benzene) in a recent report[18]. Here an unchanged initial activity was observed; however,desilication was shown to improve the long term stability of thecatalyst significantly. In line with the previous finding Yang et al.[19] tested a hierarchical beta zeolite prepared by dry gel conver-sion in the transalkylation of di-isopropylbenzene with benzene.The mesoporous beta sample showed a slightly lower initial activ-ity compared to a solely microporous reference but deactivatedonly barely within the timeline of testing, in strong contrast to thereference. The improvements were attributed mainly to improvedaccessibility of the active sites and better diffusion properties in thehierarchical material.
Numerous patents from Dow Chemical [20–22] exist on theuse of mesoporous (or 3-DDM) mordenite prepared by dealumi-nation using mineral acids, and a recent review [23] highlightsthe catalytic properties of mesoporous mordenite in alkylation andcracking reactions. With respect to the former, mesoporous mor-denite has been applied in alkylation of aromatic compounds suchas biphenyl or phenol and transalkylation of alkylbenzenes. Aninteresting example from the open literature using mesoporousmordenite obtained by acid leaching is given by Garces and co-workers [24] The authors use the catalyst in the liquid phasealkylation of biphenyl with propylene, preferentially forming thepara isomer 4,4’-diisopropylbiphenyl (DIPB). By performing thedealumination step once or twice, they elegantly introduce increas-ingly strong dealumination (SiO2/Al2O3 ratio up to 2600) alongsidemesopore formation occurring at the expense of the micropores.The best dealuminated catalyst showed a very good para selectivityof 73.5% and also had an improved stability towards deactivation.The authors discuss that the preferential removal of aluminum onthe external surface could be the cause for both phenomena as
+OH
Scheme 2.
non-shape selective isomerization of the products as well as poreblocking from crystal surface reactions were diminished.
In a similar study Kim and co-workers [25] studied the perfor-mance of dealuminated mordenite in the ethylation of biphenyl.Here, only moderate selectivity towards the para isomer could beobserved and the authors attribute this to the lower steric restric-tion of the mordenite framework as compared to isopropylation.
Xiao et al. [26] compared a mesoporous zeolite beta preparedby templating with mesoscale cationic polymers to conventionalbeta with a slightly smaller crystal size in the alkylation of ben-zene with 2-propanol. They operated the reaction at 473 K with abenzene/2-propanol ratio of 4:1. It was shown that the mesoporoussample exhibited higher activity than the conventional, and that theselectivity towards isopropyl benzene was also significantly higher.
Recently Sun and Prins [27] compared a mesoporous ZSM-5prepared using amphiphilic organosilane as mesopore directingagent to a conventional ZSM-5 sample in alkylation of benzenewith benzyl alcohol (Scheme 2). In this case, the mesoporous ZSM-5 exhibited dramatically improved catalytic activity in comparisonwith the conventional ZSM-5 sample.
Li et al. [28] also reported the use of a mesoporous zeolite foralkylation of benzene with benzyl alcohol. In this report, meso-porous mordenite was prepared by a combination of acid and baseleaching procedures. It was shown that the activity of the meso-porous mordenite was much higher than that of the parent sample.To support the data from the benzene alkylation the authors usedthe isomerization of 2-methyl-2-pentene as a model reaction. The2-methyl-2-pentene reaction is commonly used to probe the acid-ity of solid acids by evaluating the ratio of isomers formed. Themodel study identified the acid- and base leached mordenite as themost active catalyst as was found to be the case in the benzenealkylation.
Jin et al. [29] compared a mesoporous ZSM-5 sample obtainedby desilication with a conventionally prepared ZSM-5 sample andshowed that the hierarchical zeolite exhibits higher activity as wellas longer lifetime in the alkylation of 2-methyl naphthalene withmethanol to 2,6-dimethyl naphthalene. The reactants and productsare of a similar size as the channels in the zeolite and there-fore a large improvement in activity increasing from 5.3% to 37%after about 10 h at 673 K was seen. The authors argued that themesoporosity and not a decreasing Si/Al ratio was the deciding fac-tor determining the activity. This was investigated by comparingcatalytic performance of the hierarchical ZSM-5 with that of a nano-sized ZSM-5 having a significantly lower Si/Al ratio. The selectivityexpressed as the ratio of 2,6-dimethyl naphthalene/2,7-dimethylnaphthalene was simultaneously affected. Selectivity towards thedesired less sterically hindered product 2,6-dimethyl naphthalenewas highest in the parent zeolite. From increasing mesoporosity thelimiting mass transport was gradually relieved and the selectivitydecreased for the most strongly desilicated samples. This examplealso illustrates that the activity of the catalyst can come at the costof the selectivity due to partial loss of the shape selective propertiesof the zeolite, indicating that a compromise needs to be identified.In this specific case the authors were however able to address thisproblem using a different subsequent post treatment.
A recent study by Musilova et al. [30] have drawn similar con-clusions with respect to selectivities when comparing a referenceZSM-5 with mesoporous samples prepared by carbon templat-ing after catalytic testing of toluene disproportionation as wellas toluene and p-xylene alkylation with isopropyl alcohol. Inthis study, thorough FTIR characterization was performed using
51

Please cite this article in press as: M.S. Holm, et al., Catalysis with hierarchical zeolites, Catal. Today (2011), doi:10.1016/j.cattod.2011.01.007
ARTICLE IN PRESSG Model
CATTOD-7186; No. of Pages 14
4 M.S. Holm et al. / Catalysis Today xxx (2011) xxx–xxx
+
OH
OHOH
+
OH
Scheme 3.
deuterated acetonitrile, pyridine and 2,6-di-tert-butyl pyridine asmolecular probes. The authors were able to convincingly use a setof parent and mesoporous samples with insignificant differencesin acid strength, concentration and type (Brønsted vs. Lewis) whileshowing that the amount of Brønsted acidic sites located at theexternal surface increased, correlating well with the introducedmesoporosity.
2.2. Alkylation and acylation of other substrates
Xu and co-workers [31] reported the use of a hierarchical ZSM-5prepared by templating with polystyrene colloidal spheres in thealkylation of phenol with t-butanol. The authors investigated theactivity as well as the selectivity towards 4-tert-butyl phenol and2,4-di-tert-butyl phenol (Scheme 3). The hierarchical zeolite wasmuch more active than the conventional sample, and apparently,the selectivity towards the highly bulky 2,4-di-tert-butyl phenolwas also increased.
Nano-sized zeolite beta prepared by confined space synthesisby Derouane et al. was shown to be active for acylation of anisolby acetic anhydride [32]. The authors observed an improved cat-alytic performance at intermediate conversions when using thenano-crystals. This was attributed to the lowered mean diffusionlength allowing for the easier egression of the bulky product p-methoxyacetophenone. Recently, nano-sized ZSM-5 was also usedfor acylation of anisol with acetic anhydride as well as acetyl chlo-ride [33]. Also in this report, the mesoporous zeolite catalyst wasmore active than the conventional one.
3. Methanol to hydrocarbons and aromatization reactions
The methanol to hydrocarbons reaction (MTH) enables the useof gasified coal or biomass to form hydrocarbons and thus couldplay an important role in the future. The MTH reaction is an exampleof a reaction composed of multiple alkylation, cracking and isomer-ization steps, each catalyzed by the same strong Brønsted aciditysites. The aromatization of olefins resembles the MTH reaction to agreat extent and zeolites are active catalysts in both cases. The gen-eral finding when using mesoporous zeolites is that an increasedcatalyst lifetime is observed. This effect could be attributed to anincreased resistance towards coking of the mesoporous zeolites,however observations describing lower rates of coke formation aswell as coke predominantly forming on the external surface havealso been reported.
For the methanol to gasoline reaction Bjørgen et al. [34] and Lietzet al. [35] have tested mesoporous ZSM-5 obtained by desilication.In both studies, an increased lifetime of the mesoporous ZSM-5zeolite compared to the conventional ZSM-5 is reported. Bjørgenand co-workers calculated the total methanol conversion capacity(gmethanol converted/gzeolite extrapolated from 50% deactivation) ofthe parent and the optimally desilicated sample and saw a signifi-cant increase by a factor of 3.3 when introducing mesoporosity. Theinitial activity of the hierarchical zeolite was observed to increaseonly slightly as a function of the desilication but the selectivitytowards the gasoline fraction C5+ was on average improved by afactor of 1.7. Another pronounced difference was seen in a higher C4
hydrogen transfer index (HTI-index) for the mesoporous samples
which identify a more pronounced production of paraffinic and aro-matic compounds. Presumably the high content of alkyl benzenesin the effluent is related to the increased ease with which theselarge compounds escape the mesoporous zeolite crystal. Interest-ingly, the authors also note that the mesopore formation leads to adecreased p-xylene selectivity over o-xylene which is in good cor-relation with other findings described in literature and discussedherein [36].
Recently Ryoo and co-workers published a synthesis approachusing an elegantly designed bi-functional surfactant as the struc-ture directing agent and were able to produce sheets of crystallineMFI with a thickness of only a single unit cell (2 nm) [37]. Thisremarkable material proved temperature stabile and containedconventional strong Brønsted acidity and was tested catalyticallyin several reactions including cracking of high density polyethylene(HDPE) and MTG. The single sheets possess little shape selectivitybut exhibited a superior accessibility to the acidic sites seen by asubstantially improved cracking performance of the large HDPE ascompared to a conventional zeolite with similar Si/Al ratio. Catalyticresults from the MTG reaction showed no initial activity differ-ence due to the small size of methanol, but a significant increasein catalyst lifetime was found. The authors attributed this finding,in part to a slower coke deposition on the mesoporous material,together with the coke deposition predominantly taking place onthe external surface since coke precursors readily could diffuse outof the zeolite. This study convincingly illustrates how the use ofseveral catalytic reactions can be applied to highlight the differentproperties of a newly produced material versus a reference.
Another interesting study, published by the same laboratory,also reports how several mesoporous ZSM-5 samples preparedfrom different protocols were compared catalytically in the MTHreaction [38]. When plotting the external surface area as a func-tion of the lifetime, until 50% conversion is reached, they observea near linear correlation which highlights that mesoporosity canyield significantly higher conversion capacities for MFI catalysts inthe MTH reaction. Further, a pronounced difference between themesoporous and the purely microporous catalyst was seen in thedistribution of the formed coke being located preferentially exter-nally vs. internally, respectively.
For the methanol to propylene reaction, Mei et al. [39] usedmesoporous ZSM-5 with the main findings that the importantpropylene/ethylene ratio as well as the propylene selectivity couldbe significantly increased by introduction of mesoporosity. Theauthors prepared mesoporous ZSM-5 by two different proto-cols, namely desilication and starch templating. Interestingly, theyobserve only an improved catalytic performance when using thedesilicated zeolite. In part the authors attribute this to differencesin the connectivity and location of the mesopores. In the case ofdesilication the mesopores are accessible from the external surfacein contrast to starch templating where the mesopores are randomlydistributed and occluded within the crystals. A mesoporous ZSM-5reported by Sun et al. was also tested in the MTP reaction [40]. Thematerial was prepared by carbonization of a precursor within thepores of SBA-15 followed by dissolution of the SBA-15 material andsubsequently using the nanosized carbon as a hard template. In thisstudy no initial selectivity improvement towards propylene wasobserved; however, a significant lifetime increase could be seen.In a recent study by Sommer et al., [41] SSZ-13 and desilicatedSSZ-13 were compared in the methanol to olefins process. Hereit was found that the desilicated SSZ-13 had a significantly shorterlifetime and contained less coke upon deactivation compared toconventional SSZ-13. The authors suggested that the cause behindthis behavior were alterations in the acidity and surface area whichillustrates that while the introduction of mesoporosity might bebeneficial in some cases, side effects can have detrimental effectsin the catalysis.
52

Please cite this article in press as: M.S. Holm, et al., Catalysis with hierarchical zeolites, Catal. Today (2011), doi:10.1016/j.cattod.2011.01.007
ARTICLE IN PRESSG Model
CATTOD-7186; No. of Pages 14
M.S. Holm et al. / Catalysis Today xxx (2011) xxx–xxx 5
Scheme 4.
Furthermore, mesoporous ZSM-5 has been tested in butene[42] and 1-hexene [43] aromatization. Song et al. [44] investigatedbutene aromatization and the major finding was that the stabilityon stream was dramatically improved in the mesoporous zeoliteobtained by desilication. As the catalysts deactivate, the xylenecomposition changes towards increased p-xylene selectivity in thecase of the parent zeolite, whereas a continual composition closeto the thermodynamic equilibrium was seen for the alkali treatedsamples. The coke deposited onto the zeolites was investigatedand it was concluded that an equal amount of coke having similarproperties was formed on the mesoporous as well as the con-ventional sample. Accessibility to the micropores was maintainedin the mesoporous system which was explained by a significantamount of the coke being located in the mesopores where it is lessdetrimental to mass transport. In addition, the authors found thatcoke located in the mesopores was combusted at a lower temper-ature compared to coke situated in the micropores, as revealed bytemperature programmed oxidation experiments.
In line with the previous report a similar improvement in theresistance towards deactivation by coking was reported in the caseof 1-hexene isomerization and aromatization tested over a meso-porous ZSM-5 zeolite also obtained by desilication. Simultaneously,the relative amount of cracking over the mesoporous zeolite isobserved to deteriorate which is explained by an unhindered accessto the active sites in the micropores and good mass transport, bothof which limits the residence time of the products in the micro-pores. These findings are validated by N2 sorption–desorptionmeasured on samples containing an equal amount of coke. It is seenthat the accessible micropore volume decreases to a much largerextend in the conventional zeolite as compared to the mesoporous.
Upgrading of pyrolysis oil over a zeolite is one way to deoxy-genate it and convert low value oxygenates into hydrocarbons andwater. Park and co-workers have compared the use of ZSM-5 andhierarchical ZSM-5 prepared using organosilane templates for theupgrading of pyrolysis oil vapors [45]. It was found here that themesoporous ZSM-5 was more active than the conventional catalyst.The authors ascribe this to the synergetic effect of the high acidityand high porosity of the mesoporous zeolite.
4. Isomerization reactions
Zeolites are often used to isomerize hydrocarbon substrates intomore valuable products. An important application of this is theupgrading of straight chained naphtha into highly branched prod-ucts with high octane numbers and thus better gasoline properties(Scheme 4).
More than three decades ago, before the field of mesoporos-ity had matured in a field of its own, dealumination [46,47] was aknown procedure to improve the performance of zeolite catalysts.An example is the use of dealuminated mordenite as a catalyst inthe hydroisomerization of small paraffins into their branched iso-mers. In an early study by Koradia et al. [48] a series of Pt-loadedmordenite samples were prepared and dealuminated at varyinglevels and tested in n-pentane isomerization at 533 K. The authorsidentified an optimum dealumination level going from a parentSiO2/Al2O3 ratio of 10.8–17.1. The authors discuss the effects oflower acid density and possible interaction of the loaded metalwith the acidic site without addressing porosity. None the less,a large difference in the product selectivity is apparent and the
optimal selectivity was found to coincide with the highest activitylevel.
Interestingly, with the standardization of characterizationtechniques such as TEM and N2-physisorption, a new level ofunderstanding could be obtained from analyzing dealuminatedmordenite. In relation to the previous report Tromp et al. [49] stud-ied dealuminated mordenite treated to a similar level. The Pt loadedmordenite samples were tested in n-hexane hydroisomerisationand the acid leaching increased the activity and shifted the selec-tivity towards primary products, i.e. mono-branched isomers whilesuppressing cracking. Results from TEM and N2-physisorptionshowed that mesopores and/or cracks in the crystals were indeedformed and decomposition reactions using n- and isopropyl-amineshowed an increased accessibility as a function of the dealumina-tion treatment. Calculating the Thiele modulus concluded that thereaction was diffusion controlled in the parent sample. It was thusrationalized that the introduced mesoporosity effectively reducingresidence time of the products on the catalyst along with betteracid site accessibility were the reasons for the improved catalystperformance. Further, a thorough study regarding the diffusivityin dealumnated samples similar to the ones just described under“live” catalytic conditions have been made by van Donk et al.[50]. Using a tapered element oscillating microbalance (TEOM) theauthors were able to obtain steady state diffusivities and uptakerates in untreated and dealuminated mordenite. Catalytic experi-ments showed a superior performance of the mesoporous sampleand this activity increase could be assigned partly to decreased dif-fusion restrains arising from shorter intracrystal diffusion lengthsas well as an improved intrinsic activity of the individual sites asaluminum is extracted from the framework.
In a recent study by Chao et al. mesoporous MFI was preparedusing a procedure involving base treatment and re-crystallization[51]. This mesoporous MFI material was found to have decreasedn-hexane and 2-methylpentane sorption capacity while the sorp-tion capacity for 2,2-dimethylbutane was increased. This highercapacity for bulky hydrocarbons is also reflected in a higher selec-tivity of the bulky isomers for the isomerisation of n-hexane at600 K when using the platinum modified versions. For the hydroi-somerisation of n-heptane Moushey and Smirniotis [52] comparedthe activity of ZSM-12 and Beta with those of their mesoporousanalogues prepared by carbon templating. In this study, the meso-porous ZMS-12 material was found to exhibit a four times higheractivity than the conventional ZSM-12 zeolite at 533 K. A compari-son of the product selectivity at 593 K shows that the mesoporousZSM-12 gives 86% isomerisation product as compared to 72% forthe conventional ZSM-12 zeolite. A similar trend was observedfor the Beta zeolite. The increased selectivity towards the iso-merisation products is attributed by the authors to the shorterresidence time of the substrate in the mesoporous zeolite crys-tal. In a similar study, the hydroisomerisation of n-octane usingPt/MOR and Pt/Beta as well as their mesoporous analogues wasexamined at 503–523 K [53]. The mesoporosity was introduced bypartially destroying the parent mordenite and Beta zeolites usingsodium hydroxide, followed by a hydrothermal treatment in thepresence of cetyltrimethylammonium bromide. Varying degrees ofmesoporosity are introduced in this way by changing the amount ofsodium hydroxide. The study shows that the mesoporous zeolites inall cases exhibit higher activity than their parent samples (1.3-2 foldincrease).
Isomerisation of larger hydrocarbons has also been studied.Delamination of layered zeolite precursors with the FER-type struc-ture can lead to the ITQ-6 material which contains mesoporosity.In a study by Corma and co-workers, this material was used forthe hydroisomerisation of n-hexadecane at 673 K and comparedto ferrierite [54]. Here it was found that ITQ-6 is more active thanferrierite and gives a higher isomerisation to cracking ratio. In addi-
53
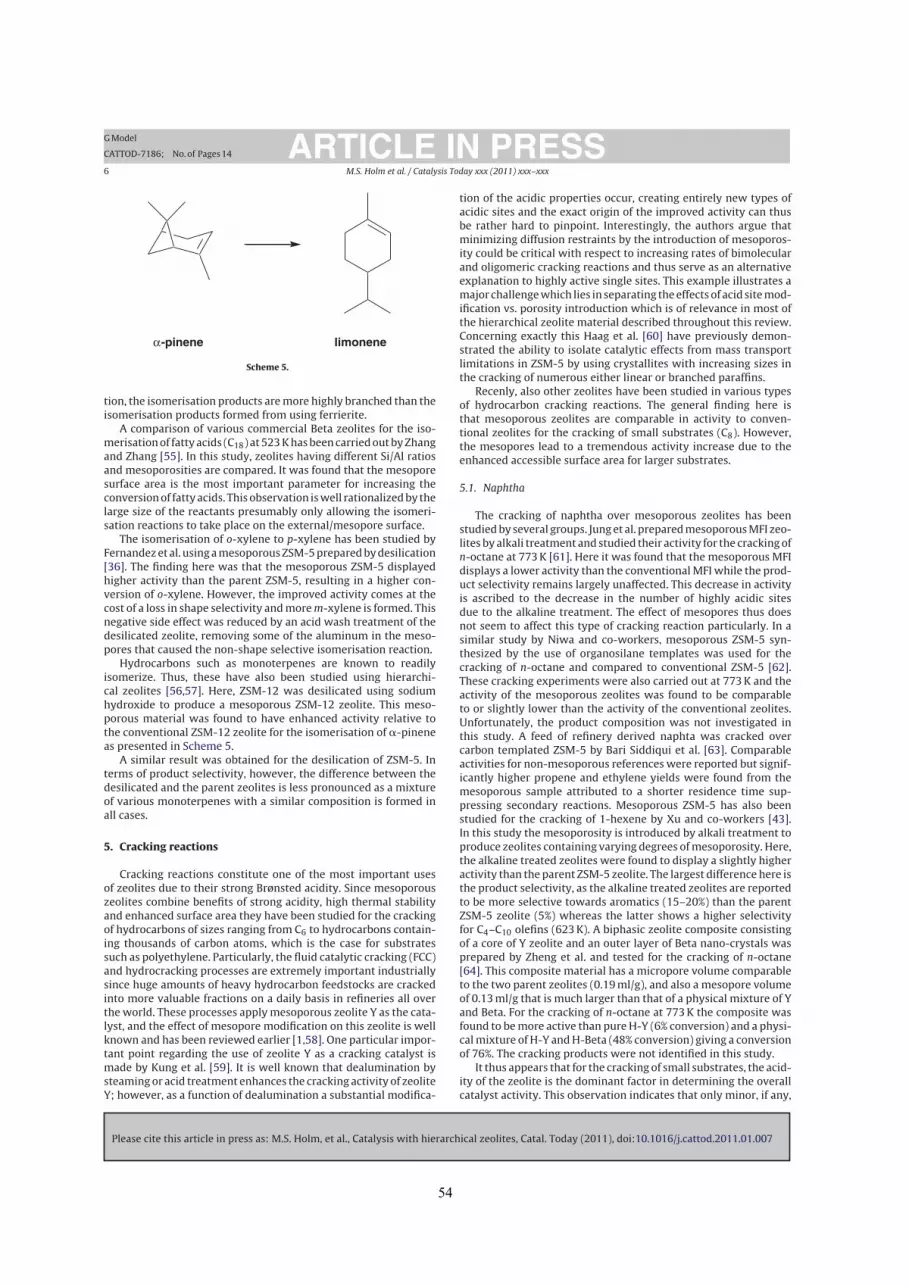
Please cite this article in press as: M.S. Holm, et al., Catalysis with hierarchical zeolites, Catal. Today (2011), doi:10.1016/j.cattod.2011.01.007
ARTICLE IN PRESSG Model
CATTOD-7186; No. of Pages 14
6 M.S. Holm et al. / Catalysis Today xxx (2011) xxx–xxx
!-pinene limonene
Scheme 5.
tion, the isomerisation products are more highly branched than theisomerisation products formed from using ferrierite.
A comparison of various commercial Beta zeolites for the iso-merisation of fatty acids (C18) at 523 K has been carried out by Zhangand Zhang [55]. In this study, zeolites having different Si/Al ratiosand mesoporosities are compared. It was found that the mesoporesurface area is the most important parameter for increasing theconversion of fatty acids. This observation is well rationalized by thelarge size of the reactants presumably only allowing the isomeri-sation reactions to take place on the external/mesopore surface.
The isomerisation of o-xylene to p-xylene has been studied byFernandez et al. using a mesoporous ZSM-5 prepared by desilication[36]. The finding here was that the mesoporous ZSM-5 displayedhigher activity than the parent ZSM-5, resulting in a higher con-version of o-xylene. However, the improved activity comes at thecost of a loss in shape selectivity and more m-xylene is formed. Thisnegative side effect was reduced by an acid wash treatment of thedesilicated zeolite, removing some of the aluminum in the meso-pores that caused the non-shape selective isomerisation reaction.
Hydrocarbons such as monoterpenes are known to readilyisomerize. Thus, these have also been studied using hierarchi-cal zeolites [56,57]. Here, ZSM-12 was desilicated using sodiumhydroxide to produce a mesoporous ZSM-12 zeolite. This meso-porous material was found to have enhanced activity relative tothe conventional ZSM-12 zeolite for the isomerisation of !-pineneas presented in Scheme 5.
A similar result was obtained for the desilication of ZSM-5. Interms of product selectivity, however, the difference between thedesilicated and the parent zeolites is less pronounced as a mixtureof various monoterpenes with a similar composition is formed inall cases.
5. Cracking reactions
Cracking reactions constitute one of the most important usesof zeolites due to their strong Brønsted acidity. Since mesoporouszeolites combine benefits of strong acidity, high thermal stabilityand enhanced surface area they have been studied for the crackingof hydrocarbons of sizes ranging from C6 to hydrocarbons contain-ing thousands of carbon atoms, which is the case for substratessuch as polyethylene. Particularly, the fluid catalytic cracking (FCC)and hydrocracking processes are extremely important industriallysince huge amounts of heavy hydrocarbon feedstocks are crackedinto more valuable fractions on a daily basis in refineries all overthe world. These processes apply mesoporous zeolite Y as the cata-lyst, and the effect of mesopore modification on this zeolite is wellknown and has been reviewed earlier [1,58]. One particular impor-tant point regarding the use of zeolite Y as a cracking catalyst ismade by Kung et al. [59]. It is well known that dealumination bysteaming or acid treatment enhances the cracking activity of zeoliteY; however, as a function of dealumination a substantial modifica-
tion of the acidic properties occur, creating entirely new types ofacidic sites and the exact origin of the improved activity can thusbe rather hard to pinpoint. Interestingly, the authors argue thatminimizing diffusion restraints by the introduction of mesoporos-ity could be critical with respect to increasing rates of bimolecularand oligomeric cracking reactions and thus serve as an alternativeexplanation to highly active single sites. This example illustrates amajor challenge which lies in separating the effects of acid site mod-ification vs. porosity introduction which is of relevance in most ofthe hierarchical zeolite material described throughout this review.Concerning exactly this Haag et al. [60] have previously demon-strated the ability to isolate catalytic effects from mass transportlimitations in ZSM-5 by using crystallites with increasing sizes inthe cracking of numerous either linear or branched paraffins.
Recenly, also other zeolites have been studied in various typesof hydrocarbon cracking reactions. The general finding here isthat mesoporous zeolites are comparable in activity to conven-tional zeolites for the cracking of small substrates (C8). However,the mesopores lead to a tremendous activity increase due to theenhanced accessible surface area for larger substrates.
5.1. Naphtha
The cracking of naphtha over mesoporous zeolites has beenstudied by several groups. Jung et al. prepared mesoporous MFI zeo-lites by alkali treatment and studied their activity for the cracking ofn-octane at 773 K [61]. Here it was found that the mesoporous MFIdisplays a lower activity than the conventional MFI while the prod-uct selectivity remains largely unaffected. This decrease in activityis ascribed to the decrease in the number of highly acidic sitesdue to the alkaline treatment. The effect of mesopores thus doesnot seem to affect this type of cracking reaction particularly. In asimilar study by Niwa and co-workers, mesoporous ZSM-5 syn-thesized by the use of organosilane templates was used for thecracking of n-octane and compared to conventional ZSM-5 [62].These cracking experiments were also carried out at 773 K and theactivity of the mesoporous zeolites was found to be comparableto or slightly lower than the activity of the conventional zeolites.Unfortunately, the product composition was not investigated inthis study. A feed of refinery derived naphta was cracked overcarbon templated ZSM-5 by Bari Siddiqui et al. [63]. Comparableactivities for non-mesoporous references were reported but signif-icantly higher propene and ethylene yields were found from themesoporous sample attributed to a shorter residence time sup-pressing secondary reactions. Mesoporous ZSM-5 has also beenstudied for the cracking of 1-hexene by Xu and co-workers [43].In this study the mesoporosity is introduced by alkali treatment toproduce zeolites containing varying degrees of mesoporosity. Here,the alkaline treated zeolites were found to display a slightly higheractivity than the parent ZSM-5 zeolite. The largest difference here isthe product selectivity, as the alkaline treated zeolites are reportedto be more selective towards aromatics (15–20%) than the parentZSM-5 zeolite (5%) whereas the latter shows a higher selectivityfor C4–C10 olefins (623 K). A biphasic zeolite composite consistingof a core of Y zeolite and an outer layer of Beta nano-crystals wasprepared by Zheng et al. and tested for the cracking of n-octane[64]. This composite material has a micropore volume comparableto the two parent zeolites (0.19 ml/g), and also a mesopore volumeof 0.13 ml/g that is much larger than that of a physical mixture of Yand Beta. For the cracking of n-octane at 773 K the composite wasfound to be more active than pure H-Y (6% conversion) and a physi-cal mixture of H-Y and H-Beta (48% conversion) giving a conversionof 76%. The cracking products were not identified in this study.
It thus appears that for the cracking of small substrates, the acid-ity of the zeolite is the dominant factor in determining the overallcatalyst activity. This observation indicates that only minor, if any,
54
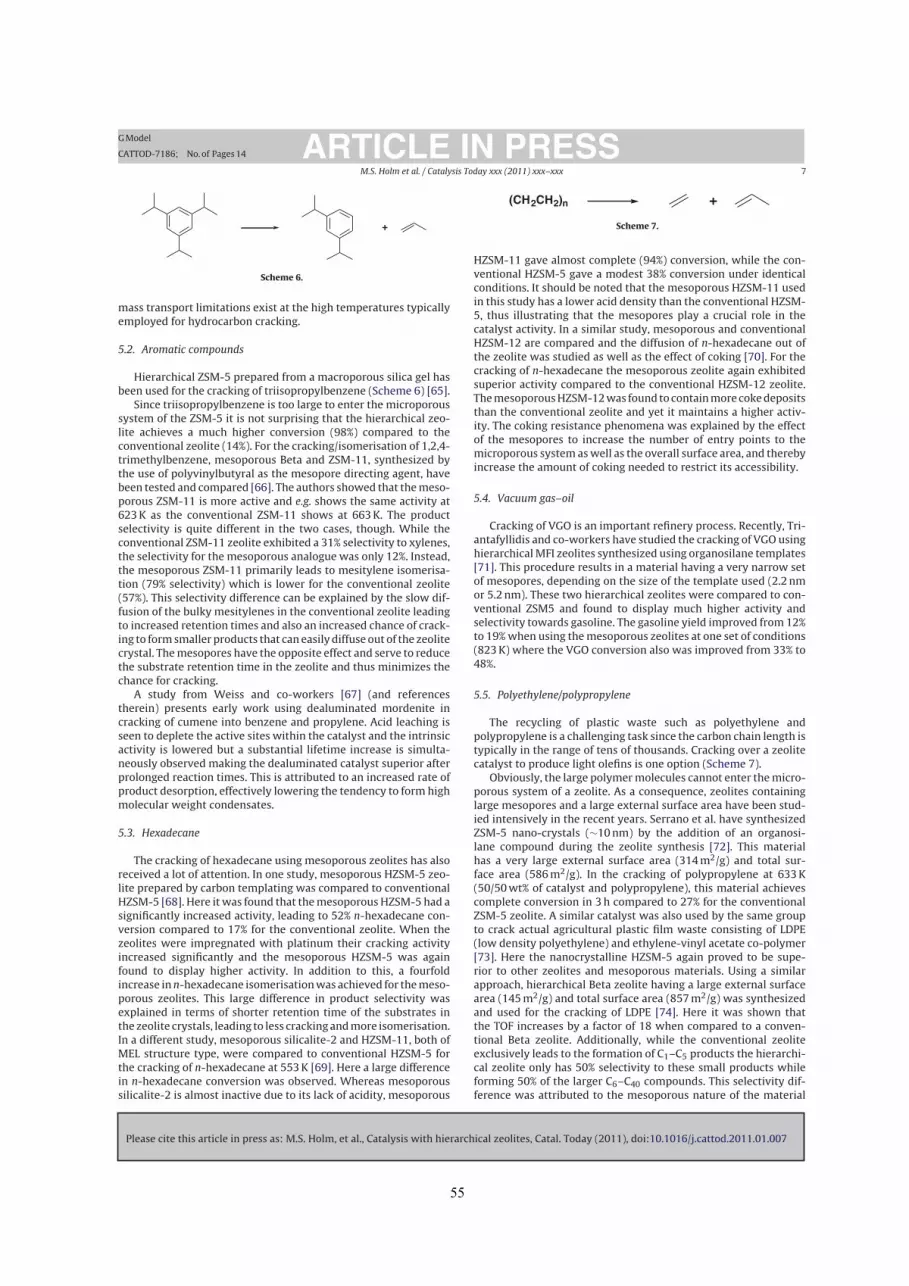
Please cite this article in press as: M.S. Holm, et al., Catalysis with hierarchical zeolites, Catal. Today (2011), doi:10.1016/j.cattod.2011.01.007
ARTICLE IN PRESSG Model
CATTOD-7186; No. of Pages 14
M.S. Holm et al. / Catalysis Today xxx (2011) xxx–xxx 7
+
Scheme 6.
mass transport limitations exist at the high temperatures typicallyemployed for hydrocarbon cracking.
5.2. Aromatic compounds
Hierarchical ZSM-5 prepared from a macroporous silica gel hasbeen used for the cracking of triisopropylbenzene (Scheme 6) [65].
Since triisopropylbenzene is too large to enter the microporoussystem of the ZSM-5 it is not surprising that the hierarchical zeo-lite achieves a much higher conversion (98%) compared to theconventional zeolite (14%). For the cracking/isomerisation of 1,2,4-trimethylbenzene, mesoporous Beta and ZSM-11, synthesized bythe use of polyvinylbutyral as the mesopore directing agent, havebeen tested and compared [66]. The authors showed that the meso-porous ZSM-11 is more active and e.g. shows the same activity at623 K as the conventional ZSM-11 shows at 663 K. The productselectivity is quite different in the two cases, though. While theconventional ZSM-11 zeolite exhibited a 31% selectivity to xylenes,the selectivity for the mesoporous analogue was only 12%. Instead,the mesoporous ZSM-11 primarily leads to mesitylene isomerisa-tion (79% selectivity) which is lower for the conventional zeolite(57%). This selectivity difference can be explained by the slow dif-fusion of the bulky mesitylenes in the conventional zeolite leadingto increased retention times and also an increased chance of crack-ing to form smaller products that can easily diffuse out of the zeolitecrystal. The mesopores have the opposite effect and serve to reducethe substrate retention time in the zeolite and thus minimizes thechance for cracking.
A study from Weiss and co-workers [67] (and referencestherein) presents early work using dealuminated mordenite incracking of cumene into benzene and propylene. Acid leaching isseen to deplete the active sites within the catalyst and the intrinsicactivity is lowered but a substantial lifetime increase is simulta-neously observed making the dealuminated catalyst superior afterprolonged reaction times. This is attributed to an increased rate ofproduct desorption, effectively lowering the tendency to form highmolecular weight condensates.
5.3. Hexadecane
The cracking of hexadecane using mesoporous zeolites has alsoreceived a lot of attention. In one study, mesoporous HZSM-5 zeo-lite prepared by carbon templating was compared to conventionalHZSM-5 [68]. Here it was found that the mesoporous HZSM-5 had asignificantly increased activity, leading to 52% n-hexadecane con-version compared to 17% for the conventional zeolite. When thezeolites were impregnated with platinum their cracking activityincreased significantly and the mesoporous HZSM-5 was againfound to display higher activity. In addition to this, a fourfoldincrease in n-hexadecane isomerisation was achieved for the meso-porous zeolites. This large difference in product selectivity wasexplained in terms of shorter retention time of the substrates inthe zeolite crystals, leading to less cracking and more isomerisation.In a different study, mesoporous silicalite-2 and HZSM-11, both ofMEL structure type, were compared to conventional HZSM-5 forthe cracking of n-hexadecane at 553 K [69]. Here a large differencein n-hexadecane conversion was observed. Whereas mesoporoussilicalite-2 is almost inactive due to its lack of acidity, mesoporous
(CH2CH2)n +
Scheme 7.
HZSM-11 gave almost complete (94%) conversion, while the con-ventional HZSM-5 gave a modest 38% conversion under identicalconditions. It should be noted that the mesoporous HZSM-11 usedin this study has a lower acid density than the conventional HZSM-5, thus illustrating that the mesopores play a crucial role in thecatalyst activity. In a similar study, mesoporous and conventionalHZSM-12 are compared and the diffusion of n-hexadecane out ofthe zeolite was studied as well as the effect of coking [70]. For thecracking of n-hexadecane the mesoporous zeolite again exhibitedsuperior activity compared to the conventional HZSM-12 zeolite.The mesoporous HZSM-12 was found to contain more coke depositsthan the conventional zeolite and yet it maintains a higher activ-ity. The coking resistance phenomena was explained by the effectof the mesopores to increase the number of entry points to themicroporous system as well as the overall surface area, and therebyincrease the amount of coking needed to restrict its accessibility.
5.4. Vacuum gas–oil
Cracking of VGO is an important refinery process. Recently, Tri-antafyllidis and co-workers have studied the cracking of VGO usinghierarchical MFI zeolites synthesized using organosilane templates[71]. This procedure results in a material having a very narrow setof mesopores, depending on the size of the template used (2.2 nmor 5.2 nm). These two hierarchical zeolites were compared to con-ventional ZSM5 and found to display much higher activity andselectivity towards gasoline. The gasoline yield improved from 12%to 19% when using the mesoporous zeolites at one set of conditions(823 K) where the VGO conversion also was improved from 33% to48%.
5.5. Polyethylene/polypropylene
The recycling of plastic waste such as polyethylene andpolypropylene is a challenging task since the carbon chain length istypically in the range of tens of thousands. Cracking over a zeolitecatalyst to produce light olefins is one option (Scheme 7).
Obviously, the large polymer molecules cannot enter the micro-porous system of a zeolite. As a consequence, zeolites containinglarge mesopores and a large external surface area have been stud-ied intensively in the recent years. Serrano et al. have synthesizedZSM-5 nano-crystals ("10 nm) by the addition of an organosi-lane compound during the zeolite synthesis [72]. This materialhas a very large external surface area (314 m2/g) and total sur-face area (586 m2/g). In the cracking of polypropylene at 633 K(50/50 wt% of catalyst and polypropylene), this material achievescomplete conversion in 3 h compared to 27% for the conventionalZSM-5 zeolite. A similar catalyst was also used by the same groupto crack actual agricultural plastic film waste consisting of LDPE(low density polyethylene) and ethylene-vinyl acetate co-polymer[73]. Here the nanocrystalline HZSM-5 again proved to be supe-rior to other zeolites and mesoporous materials. Using a similarapproach, hierarchical Beta zeolite having a large external surfacearea (145 m2/g) and total surface area (857 m2/g) was synthesizedand used for the cracking of LDPE [74]. Here it was shown thatthe TOF increases by a factor of 18 when compared to a conven-tional Beta zeolite. Additionally, while the conventional zeoliteexclusively leads to the formation of C1–C5 products the hierarchi-cal zeolite only has 50% selectivity to these small products whileforming 50% of the larger C6–C40 compounds. This selectivity dif-ference was attributed to the mesoporous nature of the material
55

Please cite this article in press as: M.S. Holm, et al., Catalysis with hierarchical zeolites, Catal. Today (2011), doi:10.1016/j.cattod.2011.01.007
ARTICLE IN PRESSG Model
CATTOD-7186; No. of Pages 14
8 M.S. Holm et al. / Catalysis Today xxx (2011) xxx–xxx
OO
O O
O
+OO
O
O
vesidryl
+R
O
R = n-C5H11
O
jasminal dehyde
+
RO
R
O
R
Scheme 8.
which allows the large products to exit the zeolite before they areconverted into smaller cracking products. In a separate study byPérez-Ramírez et al., the mesoporosity was introduced into Betazeolite by desilication using NaOH [75]. By varying the amount oftemplate still present in the zeolite during desilication, differentdegrees of mesoporosity can be introduced. In this study, the tem-perature needed to reach 50% LDPE conversion was compared forthe various zeolites and the study shows a good trend betweenthe mesopore volume of the zeolite, and the required tempera-ture. For the conventional Beta zeolite, a temperature of 703 K isrequired, whereas a temperature of 623 K is required in one casewhen using a mesoporous sample. This corresponds to a TOF thatis "10 times higher per aluminum for the mesoporous Beta zeo-lite. MFI containing micro/mesoporosity synthesized by the use ofan organosilane surfactant was thoroughly studied by Ryoo andco-workers for the cracking of polyethylene [76]. The hierarchi-cal MFI zeolite was found to display a significantly higher activitythan conventional MFI, achieving an 88% PE conversion opposedto 10% for the conventional at 653 K. In order to substantiate thatthe increase in activity is caused by the mesoporosity of the MFI,selective dealumination of the aluminum in the mesopores wasachieved using tartaric acid. Testing of the mesopore-dealuminatedMFI zeolite revealed an activity comparable to that of the conven-tional MFI zeolite (12% conversion), thus supporting the conclusionthat the mesopores are the source of the increased activity for thePE cracking reaction.
Catalytic testing showing an improved performance is soliddocumentation for relevance of a given protocol introducing meso-porosity. It is however often not enough to comprehensivelydescribe the catalyst. Relatively few reports perform actual dif-fusion or uptake experiments but an example where thoroughcharacterization is coupled with uptake and adsorption data usingseveral probes, as well as catalytic performance is given by Ver-boekend et al. [77]. The 1-dimensionel zeolite ITQ-4 was desilicatedand increasing levels of mesoporosity were introduced as a functionof desilication strength. Cracking of LDPE was chosen as test reac-tion and indeed an optimally desilicated sample was able to operateat lower temperatures; the temperature where a 10% conversionwas reached was lowered by 353 K compared to the parent sam-ple. Elution studies using n-butane and neopentane reveals a fasterdesorption from the mesoporous crystals indicating a faster molec-ular transport within this sample. Interestingly, when adsorbingselected molecules from the gas phase, a pronounced differencebetween the adsorption behavior of propane and propene is seen.
The authors correlate this observation with the introduction ofLewis acidity evidenced by infrared spectroscopy (using pyridineand collidine) and are thus able to discuss the mesoporosity andacidity changes in the proper context.
6. Condensation reactions
Hierarchical zeolites have found application as catalysts for sev-eral different types of acid catalyzed condensation reactions. Theserange from aldol-type reactions, over esterications to protection ofaldehydes and ketones by acetalization. These reactions representillustrative examples of how hierarchical zeolites can be applied inreactions which are traditionally beyond the scope of purely micro-porous zeolites due to the large molecular size of the reactants orproducts compared to the dimensions of the zeolite channels.
6.1. Aldol condensation reactions
An example of the application of hierarchical zeolites for con-densation reactions is in the syntheses of jasminaldehyde andvesidryl reported by Ryoo and co-workers as shown in Scheme 8[78].
Here the reactants are relatively bulky and therefore have diffi-culties in penetrating into the bulk of the crystals. This is evidencedby the low conversion of the substrates when using conventionalZSM-5 as the catalyst, namely 4% in the synthesis of jasminalde-hyde and 3% in the synthesis of vesidryl. However, when usingmesoporous ZSM-5 as the catalyst, conversions of 98% and 60% areobserved, respectively. Thus, here it seems that the added meso-porosity serves to enhance the accessible surface area and therebyincrease the activity of the zeolite catalyst dramatically.
In a recent work, the same authors have also prepared a seriesof nano-sized ZSM-5 zeolites by addition of different alkylalkoxysi-lanes during the synthesis and tested the zeolites in variousreactions [79]. One of these reactions, where a positive effect frommesoporosity can be seen in the conversion, is the condensation ofbenzaldehyde and 2-hydroxyacetophenone yielding a mixture offlavanone and 2-hydroxychalcone (Scheme 9).
6.2. Esterification reactions
Another reaction investigated was the condensation of resorci-nol and ethylacetoacetate to give 7-hydroxy-4-methylcoumarin asthe bulky condensation product (Scheme 10).
56

Please cite this article in press as: M.S. Holm, et al., Catalysis with hierarchical zeolites, Catal. Today (2011), doi:10.1016/j.cattod.2011.01.007
ARTICLE IN PRESSG Model
CATTOD-7186; No. of Pages 14
M.S. Holm et al. / Catalysis Today xxx (2011) xxx–xxx 9
O OH
O
O
O
OH
O
+ +
flavonone 2-hydroxychalcone
24% conv.8% conv.
MFI-mesoMFI
2-hydroxyacetophenone
Scheme 9.
O
O O+
HO OH HO O O
7-hydroxy-4-methylcoumarin
51% yield9% yield
MFI-mesoMFI
Scheme 10.
Here the product yield was reported to increase from 9% to 51%when using the mesoporous MFI zeolite. Again, this exemplifiesthat mesoporous zeolites might find application as catalysts forreactions beyond traditional petrochemical industry.
Condensation of a carboxylic acid and an alcohol giving an esteris another type of condensation reaction which has been carriedout using mesoporous MFI zeolites (Scheme 11) [76,79].
For this reaction, in terms of hexanoic acid conversion, thehierarchical MFI catalyst is more active than a conventional MFIcatalyst as well as an Al-MCM-41-type catalyst. After five experi-mental runs, the hierarchical MFI catalyst still exhibited 78% benzylalcohol conversion whereas the other catalysts were completelydeactivated. This exemplifies that hierarchical zeolites are morestable than amorphous mesoporous materials even though the ini-tial activities of the catalysts, i.e. conversion after a single run, arecomparable. However, this example also illustrates that mesoporescan facilitate undesired effects since the benzyl hexanoate selectiv-ity drops from 100% to 79% when using the mesoporous MFI insteadof the conventional MFI. This decrease in selectivity is caused by theformation of dibenzylether, a bulky by-product which is too largeto be formed in the micropores but which is easily formed in thelarger mesopores. Thus, the increased activity in this case againcomes at the cost of a decrease in shape selectivity.
6.3. Acetalisation reactions
Reactions involving condensation of aldehydes and ketoneswith an alcohol yielding an acetal or a ketal, respectively, have
also been studied using mesoporous zeolites as the catalyst [76].These were reported for the condensation of cyclohexanone withmethanol forming a relatively small condensation product as wellas for the condensation of benzaldehyde with pentaerythritol togive a much bulkier product.
For the condensation of benzaldehyde and pentaerythritol(Scheme 12) using a conventional MFI zeolite, no conversion wasobserved. In contrast, mesoporous MFI as well as MCM-41 weremuch more efficient catalysts, leading to near complete conver-sion under similar conditions (393 K). Both catalysts exhibited highselectivity towards the diacetal product. The reaction was shownto be catalyzed by the exterior acid sites as opposed to the acidsites in the micropores by the observation that no conversion wasseen when a catalyst was subjected to preferential dealuminationof the exterior acid sites by treatment with tartaric acid. The dea-luminated zeolite was inactive for the condensation reaction and itis thus plausible to conclude that the bulky acetal product is pref-erentially formed in the mesopores of the zeolite and not in themicropores. In contrast, the condensation reaction between cyclo-hexanone and methanol was found to be much less affected by theuse of a catalyst containing mesopores [76]. Here, a 50% yield of 1,1-dimethoxycyclohexane was achieved by the use of a conventionalMFI zeolite, while a 58% yield was obtained for the mesoporous ana-logue under identical conditions. Thus, for this reaction involvingsmall molecules there is not much benefit in applying a mesoporousas opposed to a conventional MFI zeolite.
The use of a hierarchical zeolite obtained by desilication andits use as a catalyst in the Chichibabin condensation of formalde-
+OH
O
Ph OH O
O
Ph
75%5%
21%
MFI-mesoMFIMCM-41
79%100%
71%
selectivityconversion
+
21%0%
29%
selectivity
Ph O Ph
Scheme 11.
57

Please cite this article in press as: M.S. Holm, et al., Catalysis with hierarchical zeolites, Catal. Today (2011), doi:10.1016/j.cattod.2011.01.007
ARTICLE IN PRESSG Model
CATTOD-7186; No. of Pages 14
10 M.S. Holm et al. / Catalysis Today xxx (2011) xxx–xxx
O
+ +
100%0%
95%
MFI-mesoMFIMCM-41
95%-
100%
selectivityconversion
5%-
0%
selectivity
OHOH
OH OH
OO
OH OH
PhOO
O O
Ph
Ph
Scheme 12.
hyde, acetaldehyde and ammonia to form pyridine and 3-picolineat 723 K has also been reported [80]. The mesoporous zeolite wasfound to be slightly more stable than the conventional zeolite. How-ever, the yields of pyridine and 3-picoline were comparable for theparent and desilicated zeolite, suggesting that this reaction involv-ing small reactants and products does not benefit significantly fromthe use of a mesoporous zeolite. Additionally, it should be notedthat the desilication treatment was found by FT-IR studies to lead tothe formation of extra framework aluminum species, i.e. the intro-duction of Lewis acidity. Thus it should be kept in mind that theintroduction of mesoporosity by chemical post treatment meth-ods such as desilication inevitably will bring about changes to thezeolite in addition to introducing mesoporosity.
7. Other reactions
Aside from alkylation, isomerisation, cracking and condensationreactions, hierarchical zeolites have also found application as cata-lysts in several other reactions involving organic substrates. Theseinclude the Beckmann rearrangement reaction as well as oxida-tions and epoxidations. In many of these cases, the reactants are toobulky to penetrate into the interior of the crystals, thus the reac-tion takes place in the pore mouths or on the external/mesoporesurface of the zeolite. Although the specific micropore system ofthe zeolite for such applications is perhaps not so important, thereare still good reasons for choosing a zeolite catalyst as opposed toother types of solid acid catalysts. One of the main reasons is theircrystalline nature which makes them more acidic and more stablethan amorphous materials of similar chemical compositions.
7.1. Beckmann rearrangement
The use of hierarchical zeolites have been reported for the Beck-mann rearrangement reactions of cyclohexanone oxime [81,82]and cyclododecanone oxime [83]. For Beckmann rearrangement ofcyclohexanone oxime, silicalite-1 as well as TS-1, i.e. pure silicateMFI and titanosilicate MFI, respectively, were applied as catalysts.The hierarchical silicalite-1 catalyst was made by an approachresembling carbon-templating which involved impregnation ofa zeolite gel onto an organic aerogel followed by crystallizationand carbonization. The zeolite–carbon material was then cal-cined to produce a hierarchical zeolite monolith or subjected toa second impregnation and crystallization step. In both cases,the resulting materials were at least twice as active in terms of(gcaprolactam)/(gcatalyst·h) as compared to a hieararchical zeolite ref-erence sample consisting of nanosized crystals. The same reactionwas studied using nanosized TS-1 samples prepared in the absenceas well as presence of different amounts of crosslinking agent (1,7-dichloro-octamethyl-tetrasiloxane) added to the synthesis gels.
After 1 h reaction time at 553 K the caprolactam productivity interms of (mmolcaprolactam)/(gcatalyst·h) were about the same for thenon-crosslinked nanosized catalyst and the catalyst prepared using0.65 mmol linker. However, after 4 h reaction time, the caprolactamproductivity observed for the non-crosslinked sample decreased by85% whereas it increased by 28% for the sample crosslinked using0.65 mmol linker. Still more active was the sample prepared using1.3 mmol linker, and this catalyst did not even exhibit deactivationafter 30 h on stream at 633 K. Thus, addition of crosslinker in thesynthesis of nanosized TS-1 leads to more active and more stablecatalysts.
Also hierarchical ITQ-2 zeolites made by delamination of MCM-22 were reported active in the Beckmann rearrangement reaction[83]. In this reaction, involving rearrangement of cyclododecanoneoxime, the lactam yield at 403 K was significantly higher whenITQ-2 was applied as catalysts than when either MCM-41 or con-ventional zeolite Beta were used. The lower activity and selectivityof the conventional zeolite Beta catalyst was attributed to the sub-strate being simply too bulky to penetrate into the bulk of thecrystal. Thus, the reaction takes place on the surface where no shapeselectivity is possible. On the other hand, the lower activity of theMCM-41 catalyst was shown to be caused by the material havingfewer sites with weaker acidity.
7.2. Epoxidation and hydroxylation reactions
Hierarchical TS-1 catalysts have also found application ascatalysts for epoxidation and hydroxylation reactions. In fact,epoxidation was one of the first reactions reported in which ahierarchical zeolite was used as catalyst [84]. In the report, acarbon-templated TS-1 catalyst was compared to a conventionalTS-1 catalyst in the epoxidation of 1-octene and cyclohexenewith hydrogen peroxide at a reaction temperature of 313 K. Byplotting the product concentration ratios for the mesoporousand conventional catalysts (Cmesoporous/Cconventional) it was shownthat epoxidation of 1-octene is not diffusion-limited under thereaction conditions, since Cmesoporous/Cconventional is close to unityduring the entire experiment, whereas for the epoxidation ofcyclohexene there is a clearly improved catalytic activity for themesoporous sample. Very recently, epoxidation of cyclohexene wasreported using mesoporous TS-1 prepared by assembly of seeds[85]. Also hierarchical TS-2, i.e. MEL-structured titanosilicate, hasbeen applied for epoxidation reactions [86].
Recently, also nanocrystalline TS-1 was studied as catalyst forthe epoxidation of 1-octene using the bulky organic tertbutylhy-droperoxide as the oxidant [87]. The hierarchical catalysts wereprepared by adding a silanization agent to hinder the growth andagglomeration of zeolitic seeds during crystallization. Comparingthe catalytic performance of a small series of samples with decreas-
58

Please cite this article in press as: M.S. Holm, et al., Catalysis with hierarchical zeolites, Catal. Today (2011), doi:10.1016/j.cattod.2011.01.007
ARTICLE IN PRESSG Model
CATTOD-7186; No. of Pages 14
M.S. Holm et al. / Catalysis Today xxx (2011) xxx–xxx 11
ing crystal size and thus increasing inter-particle porosity it wasobserved that the epoxide selectivity in all cases was 100%. How-ever, large differences, ranging from 6% to 42% conversion at 373 Kafter 3 h were observed. The authors argued that the high externalsurface area and the increased accessibility to the active Ti-siteswere the source of the catalytic improvements.
Hydroxylation of benzene with nitrous oxide forming phenolwas recently reported using hierarchical ZSM-5 catalysts preparedby desilication [88]. The most pronounced difference seen in thecatalytic tests was a dramatic deactivation of the parent zeolitewhich was avoided in the case of the hierarchical zeolite. ICP-OESand EPR measurements showed that the state and amount of iron inthe two samples were similar, thus the improved catalytic perfor-mance is most likely due to the interconnected mesopore system,which effectively lowers the average diffusion length for reactantsand products. Very recently, also hydroxylation of phenol withhydrogen peroxide was reported using carbon-templated meso-porous TS-1 [89]. The mesoporous TS-1 was almost twice as activeas the conventional TS-1.
7.3. Hydrotreating reactions
Hierarchical zeolite supported noble metal catalysts wererecently reported as catalysts for hydrogenation of bulky aro-matic molecules [90,91] as well as for hydrodesulfurization of4,6-dimethyldibenzothiophene [91,92]. Concerning hydrogenationof pyrene, ion exchange of Pd(NH3)4
2+ onto mesoporous zeo-lite Beta afforded a catalyst (Pd/Beta-meso) which was moreactive than similarly prepared conventional Beta, Al-MCM-41 and"-Al2O3 based catalysts. The improved activity of the Pd/Beta-meso sample in comparison with Pd/Al-MCM-41 and Pd/"-Al2O3
was attributed to the higher amount and strength of acid sites.However, the improved activity of the Pd/Beta-meso sample incomparison with Pd/Beta must be attributable to the additionalmesoporosity since the acid amount and strength distribution ofthese samples are quite similar. In addition to exhibiting higherconversion of pyrene, the content of deep hydrogenation products(hexahydro-, decahydro- and perhydropyrenes) in the reaction liq-uids was also considerably higher for Pd/Beta-meso than for theother catalysts. This is important, since it is well known that theintermediately hydrogenated products become increasingly refrac-tory towards further hydrogenation. This observation is apparentfrom a similar hydrogenation study in which it was shown thathydrogenation of naphthalene proceeded with similar activity overPd/Beta-meso and Pd/Al-MCM-41, but where Pd/Beta-meso wasconsiderably more active than Pd/Al-MCM-41 in the hydrogena-tion of tetralin [91]. Moreover, the Pd/Beta-meso catalyst showedmuch greater tolerance than the Pd/Al-MCM-41 sample when car-rying out hydrogenation of naphthalene as well as pyrene in thepresence of 200 ppm thiophene.
Another hydrotreating reaction which has been studied usinghierarchical zeolites recently is hydrodesulfurization of 4,6-dimethyldibenzothiophene [91,92]. This reaction has been studiedusing the Pd/Beta-meso catalyst mentioned above, as well as withmesoporous Pt/ZSM-5, Pd/ZSM-5 and Pt-Pd/ZSM-5 catalysts. In oneof the reports, Pd/Beta-meso was shown to be able to reduce thesulfur content of the reaction liquid more than the Pd/Al-MCM-41catalyst it was compared to [91]. For instance, the sulfur contentafter 3 h at 523 K was 165 ppm using the Pd/Beta-meso catalystin comparison with 226 ppm for the Pd/Al-MCM-41 catalyst. Thisfinding was attributed to the increased acidity of the Beta-mesosupport in comparison with the Al-MCM-41 support. Concerningthe mesoporous ZSM-5 supported catalysts, comparison of Pt andPd samples on these supports with reference catalysts of the samemetals on conventional ZSM-5 and "-Al2O3 showed that meso-porous Pt/ZSM-5 (63%) and, particularly, mesoporous Pd/ZSM-5
(83%) were considerably more active than the reference catalysts[92]. Very recently, mesoporous zeolite L prepared by assemblyof zeolite L nanocrystals was reported as support for more classicCoMo and NiMo type catalysts for hydrodesulphurization (HDS)[93] In this report it was shown, that the mesoporous L materialwas a better support for the active material than purely microp-orous zeolite L as well as the Al2O3. The excellent performancesof the mesoporous zeolite L supported catalysts were attributed tohigh amounts and strengths of acid sites as well as a highly porousstructure.
7.4. Reactions involving inorganic substrates
Hierarchical zeolites have also found application as catalysts forconversion of inorganic molecules such as NO and N2O. Concern-ing these molecules the application of hierarchical zeolite catalystshas proceeded along two different avenues. One strategy is theselective catalytic reduction (SCR) of NO with NH3, another is thedirect decomposition of NO or N2O. At any rate, the key issue is theconversion of NO or N2O to N2 (and H2O/O2).
One strategy for NOx removal in stationary as well as automotiveapplications is the selective catalytic reduction (SCR) of nitrogenoxides with NH3. For this application, conventional Fe and Cu zeo-lites are currently attracting much attention [94]. Also mesoporousiron-containing zeolites have been studied as catalysts for NO SCRwith NH3 [95,96]. It was shown, that mesoporous Fe-ZSM-5 aswell as mesoporous Fe-ZSM-12 catalysts were more active than theconventional analogues at all temperatures in the studied interval(573–773 K) and that they were both more active than the ref-erence 3% V2O5/TiO2 catalyst above 723 K [96]. Moreover, it wasshown that the NO conversion activity is increased when increas-ing the iron loading of the samples until a maximum is reached.For the mesoporous Fe-ZSM-5 sample a maximum of ca. 30% con-version at 623 K is achieved at an iron loading of 6–7%, whereasfor the conventional Fe-ZSM-5 sample, a maximum of ca. 15% isreached at an iron loading of 2–3% [95]. Similarly, a maximum ofca. 60% conversion at ca. 6% loading is reached over mesoporousFe/ZSM-12 in comparison with 35% at 4% loading for the conven-tional Fe/ZSM-12 [96]. This suggests that a better dispersion of theiron species is possible in the mesoporous samples in comparisonwith the conventional samples.
Another strategy for NO removal is the direct decompositionof this molecule to N2 and O2. This reaction has also been stud-ied using mesoporous zeolite catalysts, in this case Cu-ZSM-5and Cu-ZSM-11 [97]. It was shown that both mesoporous Cu-ZSM-11 and mesoporous Cu-ZSM-5 were more active than theirconventional references. These observations were shown to corre-late with the accessibilities of the active Cu species in the zeolitesamples. Moreover, EPR (electron paramagnetic resonance) inves-tigations revealed that mesoporosity in the zeolites facilitate theformation of dimeric or oligomeric Cu-species in contrast to themonomeric Cu-species dominating in the conventional samples.Another observation apparent from the experimental data was thatthe mesoporous Cu-ZSM-11 catalyst was twice as active as themesoporous Cu-ZSM-5 catalyst. This was attributed to preferen-tial formation of active Cu-sites in the straight channels of ZSM-11rather than in the sinusoidal channels of ZSM-5.
Also decomposition of N2O has been studied using hierarchi-cal zeolite catalysts [98–100]. In a thorough study, it was shownthat steam activation of Fe, Ga and “normal” Al-ZSM-5 samplesimproved the catalytic activity in N2O decomposition, whereasmerely calcining the samples prior to the catalytic experimentshad a detrimental effect on the activity [98]. Moreover, the authorsshowed that alkaline treatment of the steam-activated samplesfurther increased their catalytic activity. One reason for this wasfurther touched upon in a more recent report, where it was shown
59
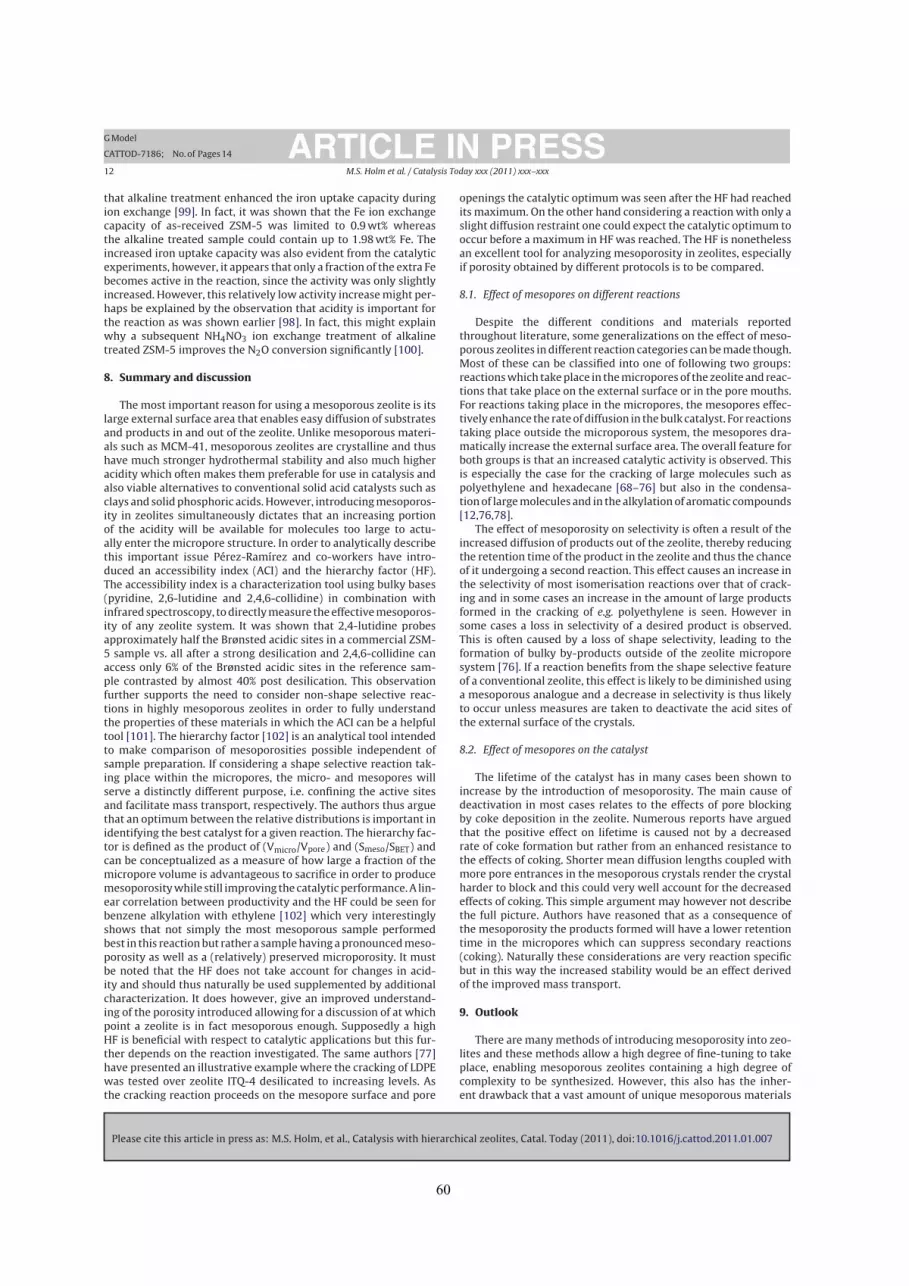
Please cite this article in press as: M.S. Holm, et al., Catalysis with hierarchical zeolites, Catal. Today (2011), doi:10.1016/j.cattod.2011.01.007
ARTICLE IN PRESSG Model
CATTOD-7186; No. of Pages 14
12 M.S. Holm et al. / Catalysis Today xxx (2011) xxx–xxx
that alkaline treatment enhanced the iron uptake capacity duringion exchange [99]. In fact, it was shown that the Fe ion exchangecapacity of as-received ZSM-5 was limited to 0.9 wt% whereasthe alkaline treated sample could contain up to 1.98 wt% Fe. Theincreased iron uptake capacity was also evident from the catalyticexperiments, however, it appears that only a fraction of the extra Febecomes active in the reaction, since the activity was only slightlyincreased. However, this relatively low activity increase might per-haps be explained by the observation that acidity is important forthe reaction as was shown earlier [98]. In fact, this might explainwhy a subsequent NH4NO3 ion exchange treatment of alkalinetreated ZSM-5 improves the N2O conversion significantly [100].
8. Summary and discussion
The most important reason for using a mesoporous zeolite is itslarge external surface area that enables easy diffusion of substratesand products in and out of the zeolite. Unlike mesoporous materi-als such as MCM-41, mesoporous zeolites are crystalline and thushave much stronger hydrothermal stability and also much higheracidity which often makes them preferable for use in catalysis andalso viable alternatives to conventional solid acid catalysts such asclays and solid phosphoric acids. However, introducing mesoporos-ity in zeolites simultaneously dictates that an increasing portionof the acidity will be available for molecules too large to actu-ally enter the micropore structure. In order to analytically describethis important issue Pérez-Ramírez and co-workers have intro-duced an accessibility index (ACI) and the hierarchy factor (HF).The accessibility index is a characterization tool using bulky bases(pyridine, 2,6-lutidine and 2,4,6-collidine) in combination withinfrared spectroscopy, to directly measure the effective mesoporos-ity of any zeolite system. It was shown that 2,4-lutidine probesapproximately half the Brønsted acidic sites in a commercial ZSM-5 sample vs. all after a strong desilication and 2,4,6-collidine canaccess only 6% of the Brønsted acidic sites in the reference sam-ple contrasted by almost 40% post desilication. This observationfurther supports the need to consider non-shape selective reac-tions in highly mesoporous zeolites in order to fully understandthe properties of these materials in which the ACI can be a helpfultool [101]. The hierarchy factor [102] is an analytical tool intendedto make comparison of mesoporosities possible independent ofsample preparation. If considering a shape selective reaction tak-ing place within the micropores, the micro- and mesopores willserve a distinctly different purpose, i.e. confining the active sitesand facilitate mass transport, respectively. The authors thus arguethat an optimum between the relative distributions is important inidentifying the best catalyst for a given reaction. The hierarchy fac-tor is defined as the product of (Vmicro/Vpore) and (Smeso/SBET) andcan be conceptualized as a measure of how large a fraction of themicropore volume is advantageous to sacrifice in order to producemesoporosity while still improving the catalytic performance. A lin-ear correlation between productivity and the HF could be seen forbenzene alkylation with ethylene [102] which very interestinglyshows that not simply the most mesoporous sample performedbest in this reaction but rather a sample having a pronounced meso-porosity as well as a (relatively) preserved microporosity. It mustbe noted that the HF does not take account for changes in acid-ity and should thus naturally be used supplemented by additionalcharacterization. It does however, give an improved understand-ing of the porosity introduced allowing for a discussion of at whichpoint a zeolite is in fact mesoporous enough. Supposedly a highHF is beneficial with respect to catalytic applications but this fur-ther depends on the reaction investigated. The same authors [77]have presented an illustrative example where the cracking of LDPEwas tested over zeolite ITQ-4 desilicated to increasing levels. Asthe cracking reaction proceeds on the mesopore surface and pore
openings the catalytic optimum was seen after the HF had reachedits maximum. On the other hand considering a reaction with only aslight diffusion restraint one could expect the catalytic optimum tooccur before a maximum in HF was reached. The HF is nonethelessan excellent tool for analyzing mesoporosity in zeolites, especiallyif porosity obtained by different protocols is to be compared.
8.1. Effect of mesopores on different reactions
Despite the different conditions and materials reportedthroughout literature, some generalizations on the effect of meso-porous zeolites in different reaction categories can be made though.Most of these can be classified into one of following two groups:reactions which take place in the micropores of the zeolite and reac-tions that take place on the external surface or in the pore mouths.For reactions taking place in the micropores, the mesopores effec-tively enhance the rate of diffusion in the bulk catalyst. For reactionstaking place outside the microporous system, the mesopores dra-matically increase the external surface area. The overall feature forboth groups is that an increased catalytic activity is observed. Thisis especially the case for the cracking of large molecules such aspolyethylene and hexadecane [68–76] but also in the condensa-tion of large molecules and in the alkylation of aromatic compounds[12,76,78].
The effect of mesoporosity on selectivity is often a result of theincreased diffusion of products out of the zeolite, thereby reducingthe retention time of the product in the zeolite and thus the chanceof it undergoing a second reaction. This effect causes an increase inthe selectivity of most isomerisation reactions over that of crack-ing and in some cases an increase in the amount of large productsformed in the cracking of e.g. polyethylene is seen. However insome cases a loss in selectivity of a desired product is observed.This is often caused by a loss of shape selectivity, leading to theformation of bulky by-products outside of the zeolite microporesystem [76]. If a reaction benefits from the shape selective featureof a conventional zeolite, this effect is likely to be diminished usinga mesoporous analogue and a decrease in selectivity is thus likelyto occur unless measures are taken to deactivate the acid sites ofthe external surface of the crystals.
8.2. Effect of mesopores on the catalyst
The lifetime of the catalyst has in many cases been shown toincrease by the introduction of mesoporosity. The main cause ofdeactivation in most cases relates to the effects of pore blockingby coke deposition in the zeolite. Numerous reports have arguedthat the positive effect on lifetime is caused not by a decreasedrate of coke formation but rather from an enhanced resistance tothe effects of coking. Shorter mean diffusion lengths coupled withmore pore entrances in the mesoporous crystals render the crystalharder to block and this could very well account for the decreasedeffects of coking. This simple argument may however not describethe full picture. Authors have reasoned that as a consequence ofthe mesoporosity the products formed will have a lower retentiontime in the micropores which can suppress secondary reactions(coking). Naturally these considerations are very reaction specificbut in this way the increased stability would be an effect derivedof the improved mass transport.
9. Outlook
There are many methods of introducing mesoporosity into zeo-lites and these methods allow a high degree of fine-tuning to takeplace, enabling mesoporous zeolites containing a high degree ofcomplexity to be synthesized. However, this also has the inher-ent drawback that a vast amount of unique mesoporous materials
60

Please cite this article in press as: M.S. Holm, et al., Catalysis with hierarchical zeolites, Catal. Today (2011), doi:10.1016/j.cattod.2011.01.007
ARTICLE IN PRESSG Model
CATTOD-7186; No. of Pages 14
M.S. Holm et al. / Catalysis Today xxx (2011) xxx–xxx 13
are reported in the literature, making comparison across researchgroups a difficult task. Therefore a large proportion of the workeffort related to mesoporous zeolites is spent on material prepa-ration, leaving less room for more thorough characterization andcatalytic testing. However, the use of mesoporous zeolites in cataly-sis is certainly gaining momentum and comparison across researchgroups is now possible as the volume of literature usable forcomparison increases and generalized tools such as the ACI andHF have been introduced. The present review is focused on thecatalytic use of hierarchical zeolites. The field combines multi-ple disciplines bringing together advanced material preparation,sophisticated and equipment-demanding characterization, as wellas careful catalytic testing. From the reviewed literature it isclear that some of the best scholarly studies come from scien-tific groups which are well founded within all three categoriesand have dedicated time to perform in-depth characterization anddemonstrate detailed knowledge of the catalytic reactions tested,while following the general recommendations for catalytic testing[103]. Reports preparing exciting materials but lacking the catalyticaspect have thus not been described in this contribution.
At present it is clear that many reactions indeed can benefit fromthe use of a mesoporous zeolite. A challenge within the field lies inthe evaluation of the level and type of mesoporosity introduced intothe zeolite crystal. Some of the protocols used for manufacturingthe mesoporous zeolites can fairly easily be tuned into generat-ing a series of zeolites with increasing levels of mesoporosity. Thisis especially true for desilication [104] but has also been shownvalid by changing the carbon source in carbon-templating [105],varying the amount of cationic-polymer [26], etc. From compar-ing a series of zeolites with increasing levels of mesoporosity itcould prove possible to extrapolate which level of mesoporosityis sufficient for the specific reaction. In this context it is naturallyvery important to consider whether the reaction is taking placewithin the micropores, in the pore mouths or solely on the exter-nal/mesopore surface. Evidently all three types of reactions willbenefit from introducing mesoporosity into the zeolite. However,for a reaction that is proceeding within the micropores the level ofmesoporosity at which diffusion is no longer a limiting factor is pre-sumably different from a reaction proceeding in the pore mouths oron the mesopore walls. Further, in cases where a balance betweenactivity and shape selectivity is sought, insight into the catalyticevolution using a series of hierarchical samples could contribute tounderstanding the reaction and the effect of mesoporosity in thezeolite catalyst.
Another challenge is connected to the need of comparing thehierarchical zeolite to a zeolite with physical-chemical propertiesdiffering only in the absence of mesoporosity. Indeed zeolites arecomplicated materials and often when a reference material is pro-duced it can be problematic to claim that it is representative ofa perfect non-mesoporous counterpart with exactly similar Si/Alratio, crystal size, elementary distribution, defect density, etc. Thisproblem can be negligible in most cases but for example in the caseof desilication extra-framework aluminum can form on the exter-nal surface during the procedure [42,80,106]. The extra-frameworkaluminum sites thus represent an alien non-shape selective reac-tivity in the otherwise shape selective catalyst. This exemplifieswhy caution should be exercised in the interpretation of the cat-alytic data, since the mesoporosity introduced is presumably themost significant difference between the conventional/parent andthe hierarchical sample, but potentially not the only one.
References
[1] S. van Donk, A.H. Janssen, J.H. Bitter, K.P. de Jong, Catal. Rev. 45 (2003) 297.[2] M. Hartmann, Angew. Chem. Int. Ed. 43 (2004) 5880.[3] Y. Tao, H. Kanoh, L. Abrams, K. Kaneko, Chem. Rev. 106 (2006) 896.
[4] L. Tosheva, V.P. Valtchev, C. R. Chim. 8 (2005) 475.[5] J. Cejka, S. Mintova, Catal. Rev. 49 (2007) 1.[6] K. Egeblad, C.H. Christensen, M. Kustova, C.H. Christensen, Chem. Mater. 20
(2008) 946–960.[7] J. Perez-Ramirez, C.H. Christensen, K. Egeblad, C.H. Christensen, J.C. Groen,
Chem. Soc. Rev. 37 (2008) 2530.[8] C.D. Chang, C.T.W. Chu, US Patent no 4,594,333 (1986).[9] C.D. Chang, C.T.W. Chu, P. Chu, R.M. Dessau, W.E. Garwood, G.H. Kuehl, J.N.
Miale, D.S. Shibabi, US Patent no 4,876,228 (1989).[10] J.M. Garces, D.M. Millar, US Patent 6,017,508 (1998).[11] C.A. Drake, A.H. Wu, US Patent 5,952,259 (1999).[12] C.H. Christensen, K. Johannsen, I. Schmidt, C.H. Christensen, J. Am. Chem. Soc.
125 (2003) 13370–13371.[13] C.H. Christensen, K. Johannsen, E. Törnqvist, I. Schmidt, H. Topsoe, C.H. Chris-
tensen, Catal. Today 128 (2007) 117–122.[14] J.C. Groen, T. Sano, J.A. Moulijn, J. Pérez-Ramirez, J. Catal. 251 (2007) 21–27.[15] A.N.C. van Laak, R.W. Gosselink, S.L. Sagala, J.D. Meeldijk, P.E. de Jongh, K.P.
de Jong, Appl. Catal. A 382 (2010) 65–72.[16] J.C. Groen, J.C. Jansen, J.A. Moulijn, J. Perez-Ramirez, J. Phys. Chem. B 108
(2004) 13062–13065.[17] A.N.C. van Laak, S.L. Sagala, J. Zecevic, H. Friedrich, P.E. de Jongh, K.P. de Jong,
J. Catal. 276 (2010) 170–180.[18] S.-T. Tsai, C.-H. Chen, T.-C. Tsai, Green Chem. 11 (2009) 1349–1356.[19] H. Yang, Z. Liu, H. Gao, Z. Xie, Appl. Catal. A 379 (2010) 166–171.[20] G.-s.J. Lee, J.M. Garces, G.R. Meima, M.J.M. van der Aalst, US Patent 5,243,116
(1993).[21] G.-s.J. Lee, J.M. Garces, J.J. Maj, US Patent 5,015,797 (1991).[22] G.-s.J. Lee, J.M. Garces, D.A. Hucul, T.L. Young, K.A. Burdett, US Patent 5,583,268
(1996).[23] J.M. Garces, M.M. Olken, G.J. Lee, G.R. Meima, P.A. Jacobs, J.A. Martens, Top.
Catal. 52 (2009) 1175–1181.[24] G.S. Lee, J.J. Maj, S.C. Rocke, J.M. Garces, Catal. Lett. 2 (1989) 243–248.[25] X. Tu, M. Matsumoto, T. Maeda, Y. Sugi, T. Matsuzaki, T. Hanaoka, Y. Kubota,
J.-H. Kim, Micropor. Mater. 3 (1995) 593–595.[26] F.-S. Xiao, L. Wang, C. Yin, K. Lin, Y. Di, J. Li, R. Xu, D.S. Su, R. Schlögl, T. Yokoi,
T. Tatsumi, Angew. Chem. Int. Ed. 45 (2006) 3090–3093.[27] Y. Sun, R. Prins, Appl. Catal. A 336 (2008) 11–16.[28] X. Li, R. Prins, J.A. van Bokhoven, J. Catal. 262 (2009) 257–265.[29] L. Jin, X. Zhou, H. Hu, B. Ma, Catal. Commun. 10 (2008) 336–340.[30] Z. Musilova, N. Zilkova, S.-E. Park, J. Cejka, Top. Catal. 53 (2010) 1457–1469.[31] L. Xu, S. Wu, J. Guan, H. Wang, Y. Ma, K. Song, H. Xu, H. Xing, Chen, Xu, Z. Wang,
Q. Kan, Catal. Commun. 9 (2008) 1272–1276.[32] E.G. Derouane, I. Schmidt, H. Lachas, C.J.H. Christensen, Catal. Lett. 95 (1–2)
(2004) 13–17.[33] D.P. Serrano, R.A. Garcia, D. Otero, Appl. Catal. A 359 (2009) 67.[34] M. Bjørgen, F. Joensen, M.S. Holm, U. Olsbye, K.-P. Lillerud, S. Svelle, Appl.
Catal. A 345 (2008) 43–50.[35] G. Lietz, K.H. Schnabel, Ch. Peuker, Th. Gross, W. Storek, J. Völter, J. Catal. 148
(1994) 562–568.[36] C. Fernandez, I. Stan, J.-P. Gilson, K. Thomas, A. Vicente, A. Bonilla, J. Perez-
Ramirez, Chem. Eur. J. 16 (2010) 6224.[37] M. Choi, K. Na, J. Kim, Y. Sakamoto, O. Terasaki, R. Ryoo, Nature 461 (2009)
246–249.[38] J. Kim, M. Choi, R. Ryoo, J. Catal. 269 (2010) 219–228.[39] C. Mei, P. Wen, Z. Liu, H. Liu, Y. Wang, W. Yang, Z. Xie, W. Hua, Z. Gao, J. Catal.
258 (2008) 243–249.[40] C. Sun, J. Du, J. Liu, Y. Yang, N. Ren, W. Shen, H. Xu, Y. Tang, Chem Commun.
46 (2010) 2671–2673.[41] L. Sommer, D. Mores, S. Svelle, M. Stöcker, B.M. Weckhuysen, U. Olsbye, Micro-
por. Mesopor. Mater. 132 (2010) 384–394.[42] Y. Song, X. Zhu, Yi. Song, Q. Wang, L. Xu, Appl. Catal. A 302 (2006) 69–77.[43] Y. Li, S. Liu, Z. Zhang, S. Xie, X. Zhu, L. Xu, Appl. Catal. A 338 (2008) 100–113.[44] Y. Song, X. Zhu, Yi. Song, Q. Wang, L. Xu, Appl. Catal. A 302 (2006) 69.[45] H.J. Park, H.S. Heo, J.-K. Jeon, J. Kim, R. Ryoo, K.-E. Jeong, Y.-K. Park, Appl. Catal.
B 95 (2010) 365.[46] J.R. Kiovsky, W.J. Goyette, US Patent 4,182,692 (1980).[47] A. Voorhies, C.N. Kimberlin, E.M. Gladrow, US Patent 3,480,539 (1969).[48] P.B. Koradia, J.R. Kiovsky, M.Y. Asim, J. Catal. (1980) 290–293.[49] M. Tromp, J.A. van Bokhoven, M.T.G. Oostenbrink, J.H. Bitter, K.P. de Jong, D.C.
Koningsberger, J. Catal. 190 (2000) 209–214.[50] S. van Donk, A. Broersma, O.L.J. Gijzeman, J.A. van Bokhoven, J.H. Bitter, K.P.
de Jong, J. Catal. 204 (2001) 272–280.[51] P.-H. Chao, S.-T. Tsai, S.-L. Chang, I. Wang, T.-C. Tsai, Top. Catal. 53 (2010) 231.[52] D.L. Moushey, P.G. Smirniotis, Catal. Lett. 129 (2009) 20–25.[53] H. Zhu, Z. Liu, D. Kong, Y. Wang, Z. Xie, J. Phys. Chem C 112 (2008)
17257–17264.[54] A. Chica, U. Diaz, V. Fornéz, A. Corma, Catal. Today (2008),
doi:10.1016/j.cattod.2008.10.046.[55] S. Zhang, Z.C. Zhang, Catal. Lett. 115 (2007) 114–121.[56] L. Mokrzycki, B. Sulikowski, Z. Olejniczak, Catal. Lett. 127 (2009) 296–303.[57] !. Mokrzycki, B. Sulikowski, Stud. Surf. Sci. Catal. 174B (2008) 1231–1234.[58] J.A. Rabo, M.W. Schoonover, Appl. Catal. A 222 (2001) 261.[59] H.H. Kung, S.M. Babitz, J.T. Miller, W.O. Haag, R.Q. Snurr, Top. Catal. 10 (2000)
59–64.[60] W.O. Haag, R.M. Lago, P.B. Weisz, Faraday Discuss. Chem. Soc. 72 (1981)
317–330.
61

Please cite this article in press as: M.S. Holm, et al., Catalysis with hierarchical zeolites, Catal. Today (2011), doi:10.1016/j.cattod.2011.01.007
ARTICLE IN PRESSG Model
CATTOD-7186; No. of Pages 14
14 M.S. Holm et al. / Catalysis Today xxx (2011) xxx–xxx
[61] J.S. Jung, J.W. Park, G. Seo, Appl. Catal. A 288 (2005) 149–157.[62] K. Suzuki, Y. Aoyagi, N. Katada, M. Choi, R. Ryoo, M. Niwa, Catal. Today 132
(2008) 38–45.[63] M.A. Bari Siddiqui, A.M. Aitani, M.R. Saeed, S. Al-Khattaf, Top. Catal. 53 (2010)
1387–1393.[64] J. Zheng, X. Zhang, Y. Wang, Y. Bai, W. Sun, R. Li, J. Porous Mater.,
doi:10.1007/s10934-008-9255-2.[65] Q. Lei, T. Zhao, F. Li, L. Zhang, Y. Wang, Chem. Commun. (2006) 1769–1771.[66] H. Zhu, Z. Liu, D. Kong, Y. Wang, Z. Xie, J. Phys. Chem. C 112 (2008)
17257–17264.[67] H.S. Bierenbaum, S. Chiramongkol, A.H. Weiss, J. Catal. 23 (1971) 61–70.[68] C.H. Christensen, I. Schmidt, C.H. Christensen, Catal. Commun. 5 (2004)
543–546.[69] M.Y. Kustova, P. Hasselriis, C.H. Christensen, Catal. Lett. 96 (2004) 205–211.[70] M. Kustova, K. Egeblad, C.H. Christensen, A.L. Kustov, C.H. Christensen, Stud.
Surf. Sci. Catal. (2007) 267–275.[71] D.H. Park, S.S. Kim, H. Wang, T.J. Pinnavaia, M.C. Papapetrou, A.A. Lappas, K.S.
Triantafyllidis, Angew. Chem. Int. Ed. 48 (2009) 7645–7648.[72] D.P. Serrano, J. Aguado, J.M. Escola, J.M. Rodriguez, A. Peral, Chem. Mater. 18
(2006) 2462–2464.[73] D.P. Serrano, J. Aguado, J.M. Escola, E. Garagorri, J.M. Rodríguez, L. Morselli, G.
Palazzi, R. Orsi, Appl. Catal. B 49 (2004) 257–265.[74] J. Aguado, D.P. Serrano, J.M. Rodríguez, Micropor. Mesopor. Mater. 115 (2008)
504–513.[75] J. Pérez-Ramírez, S. Abelló, A. Bonilla, J.C. Groen, Adv. Funct. Mater. 19 (2009)
164–172.[76] V.N. Shetti, J. Kim, R. Srivastava, M. Choi, R. Ryoo, J. Catal. 245 (2008) 296–303.[77] D. Verboekend, J.C. Groen, J. Perez-Ramirez, Adv. Funct. Mater. 20 (2010)
1441–1450.[78] M. Choi, H.S. Cho, R. Srivastava, C. Venkatesan, D.-H. Choi, R. Ryoo, Nat. Mater.
5 (2006) 718.[79] R. Srivastava, M. Choi, R. Ryoo, Chem. Commun. (2006) 4489.[80] F. Jin, Y. Cui, Y. Li, Appl. Catal. A 350 (2008) 71.[81] W.-C. Li, A.-H. Lu, R. Palkovits, W. Schmidt, B. Spliethoff, F. Schüth, J. Am. Chem.
Soc. 127 (2005) 12595.[82] R. Palkovits, W. Schmidt, Y. Ilhan, A. Erdem-Senatalar, F. Schüth, Micropor.
Mesopor. Mater. 117 (2009) 228.[83] P. Botella, A. Corma, S. Iborra, R. Monton, I. Rodriguez, V. Costa, J. Catal. 250
(2007) 161.
[84] I. Schmidt, A. Krogh, K. Wienberg, A. Carlsson, M. Brorson, C.J.H. Jacobsen,Chem. Commun. (2000) 2157.
[85] M. Reichinger, W. Schmidt, M.W.E. Berg, A. Aerts, J.A. Martens, C.E.A.Kirschhock, H. Gies, W. Grünert, J. Catal. 269 (2010) 367.
[86] M.Yu. Kustova, P. Hasselriis, C.H. Christensen, Catal. Lett. 96 (2004) 205.[87] D. Serrano, R. Sanz, P. Pizarro, I. Moreno, Chem. Commun. 11 (2009) 1407.[88] S. Gopalakrishnan, A. Zampieri, W. Schwieger, J. Catal. 260 (2008) 193.[89] H. Xin, J. Zhao, S. Xu, J. Li, W. Zhang, X. Guo, E.J.M. Hensen, Q. Yang, C. Li, J.
Phys. Chem. C 114 (2010) 6553.[90] T. Tang, C. Yin, L. Wang, Y. Ji, F.-S. Xiao, J. Catal. 249 (2007) 111.[91] T. Tang, C. Yin, L. Wang, Y. Ji, F.-S. Xiao, J. Catal. 257 (2008) 125.[92] Y. Sun, R. Prins, Angew. Chem. Int. Ed. 47 (2008) 8478.[93] Q. Huo, T. Dou, Z. Zhao, H. Pan, Appl. Catal. A 381 (2010) 101.[94] S. Brandenberger, O. Kröcjer, A. Tissler, R. Althoff, Catal. Rev. 50 (2008)
492.[95] A.L. Kustov, K. Egeblad, M. Kustova, T.W. Hansen, C.H. Christensen, Top. Catal.
45 (2007) 159.[96] A.L. Kustov, T.W. Hansen, M. Kustova, C.H. Christensen, Appl. Catal. B 76 (2007)
311.[97] M.Yu. Kustova, S.B. Rasmussen, A.L. Kustov, C.H. Christensen, Appl. Catal. B 67
(2006) 60.[98] J. Perez-Ramirez, F. Kapteijn, J.C. Groen, A. Domenech, G. Mul, J.A. Moulijn, J.
Catal. 214 (2003) 33.[99] I. Melian-Cabrera, S. Espinosa, J.C. Groen, B. v/d Linden, F. Kapteijn, J.A.
Moulijn, J. Catal. 238 (2006) 250.[100] J.C. Groen, A. Brückner, E. Berrier, L. Maldonado, J.A. Moulijn, J. Perez-Ramirez,
J. Catal. 243 (2006) 212.[101] F. Thibault-Starzyk, I. Stan, S. Abelló, A. Bonilla, K. Thomas, C. Fernandez, J.-P.
Gilson, J. Pérez-Ramírez, J. Catal. 264 (2009) 11–14.[102] J. Perez-Ramirez, D. Verboekend, A. Bonilla, S. Abello, Adv. Funct. Mater. 19
(2009) 3972–3979.[103] F.M. Dautzenberg, Characterization and Catalyst Development, 1989, pp.
99–119, chap. 11.[104] M.S. Holm, K. Egeblad, P.N.R. Vennestrøm, C.G. Hartmann, M. Kustova, C.H.
Christensen, Eur. J. Inorg. Chem. 33 (2008) 5185–5189.[105] Z. Kake, K. Egeblad, C.H. Christensen, Stud. Surf. Sci. Catal. 174a (2008)
285–288.[106] M.S. Holm, S. Svelle, F. Joensen, P. Beato, C.H. Christensen, S. Bordiga, M.
Bjørgen, Appl. Catal. A 1 (2009) 23–30.
62

Conversion of Oxygenates over Zeolite Catalysts: Structure-Activity Relations !
63!!
Part 2 2.6 Aim and idea preceding the studies within co-feeding of oxygenates in MTG
Shortly after discovering the MTG process; it was shown that other oxygenates such as acetone, acetic acid or propanal could also be converted into hydrocarbons over zeolite ZSM-5. However, excessive coking of the catalyst compared to methanol conversion occurred.1,2 Interestingly, decades later researchers that work in ‘green and sustainable chemistry’ pursue the conversion of similar oxygenates derived from non-edible biomass into hydrocarbon fuels. To facilitate transport and handling of for example straw it is commonly heat-treated. This produces a liquid (or aqueous suspension) called bio-oil that consists of lignocellulosic degradation products. This “oil” contains hundreds of different oxygenated compounds and is not directly usable as a fuel or even to blend with conventional hydrocarbons. Furthermore, it is corrosive, acidic, unstable and highly viscous.3 Therefore it was proposed that zeolite-catalyzed deoxygenation could be used to produce hydrocarbons; thereby opening a path to a “green” fuel additive. If bio-oil is feed to a ZSM-5 catalyst at MTG-like reaction conditions (or higher temperatures to obtain a reasonable conversion) a rapid deactivation by coking is observed. Due to the very complex composition of bio-oil it is difficult to determine whether specific functionalities, unfavorable cross reactivity within the mixture or whether relatively few compounds are responsible for this deactivation. Yet another possibility could be that the zeolite-based conversion strategy simply is ill suited for the conversion of oxygenate substrates other than mono-alcohols.
Several reports have tried to convert either pure bio-oil or selected model compounds from bio-oil. They have predicted the reactivity of individual oxygenate species based on the formula given in Equation 2.1 below.4,5,6,7 This equation defines the so-called effective H/C ratio of a compound.
!" #$$#%&'(# )
*! + ,-."
Equation 2.1. The effective H/C ratio of a compound is calculated by inserting the number of hydrogen, oxygen and carbon atoms present in the molecule.
The effective H/C ratio is a measure of how much hydrogen compared to carbon is left in a specific molecule after it has dissociated its oxygen via dehydration. It is recognized in the literature that it is very difficult to predict the reactivity of various ketones, acids, diols, and mixtures thereof at the rather harsh reaction conditions of 370 °C catalyzed by a strong Brøndsted acidic zeolite. Therefore the effective H/C ratio is used as a “rule of thumb” to predict that a decreasing H/C ratio correspondingly will diminish the suitability of the given molecule. However, this approach completely neglects the presence of different functionalities in different positions within the molecule by simply narrowing the reactivity down to the atomic ratio of the molecule.
We suspected that the nature of the individual functionalities and positions within a molecule could not be ignored when predicting the potential of oxygenate conversion. We therefore chose to convert a variety of model compounds over zeolite ZSM-5 at MTG-like reaction conditions. In general, the catalytic results clearly showed that conversion of all compounds except mono-alcohols resulted in

Conversion of Oxygenates over Zeolite Catalysts: Structure-Activity Relations !
64!!
extremely short catalyst lifetimes. Nevertheless the results presented in section 2.7 showed that i-propanol proved to be a very suitable reactant that gave significant advantages as compared to reacting methanol or ethanol. Propanol is not present in bio-oil but we initially investigated it as part of the full experimental series. However, higher alcohols are produced in small amounts during methanol synthesis from syn gas. This could make it an interesting reactant at least as a co-feed and efforts are being directed towards increasing the yield of higher alcohols through innovative catalyst design.8
Section 2.8 includes the results obtained when reacting model oxygenates diluted in methanol. The co-feed model compounds were chosen based on their abundance in bio-oil and supplemented by compounds selected to cover as wide a span of H/C ratios and functionalities as possible. Further, for practical reasons the co-feed molecules were required to be volatile in order to be introduced into the setup.
!!!!!!!!!!!!!!!!!!!!!!!!!!!!!!!!!!!!!!!!!!!!!!!!!!!!!!!!!!!!!1 C. D. Chang, A. J. Silvestri, J. Catal., 47, (1977), 249-259. 2 W. O. Haag, P. G. Rodewald, P. B. Weisz, (1981), Mobil Oil Corporation, US. Patent 4.300.009. 3 D. Mohan, C. U. Pittman Jr., P. H. Steele, Energ. Fuel., 20, (2006), 848-889. 4 N. Y. Chen, T. F. Degan, Jr., L. R. Koenig, ChemTech, (1986), 506-511. 5 P. A. Horne, P. T. Williams, Renew. Energ., 7, (1996), 131-144. 6 R. French, S. Czernik, Fuel Process Technol., 91, (2010), 25-32. 7 T. R. Carlson, T. P. Vispute, G. W. Huber, ChemSusChem, 1, (2008), 397-400. 8 J. M. Christensen, P. M. Mortensen, R. Trane, P. A. Jensen, A. D. Jensen, Appl. Catal. A, 366, (2009), 29-43.!

High Yield of Liquid Range Olefins Obtained by Convertingi-Propanol over Zeolite H-ZSM-5
Uffe V. Mentzel,*,†,‡ Saravanamurugan Shunmugavel,† Sarah L. Hruby,§
Claus H. Christensen,‡ and Martin S. Holm*,†,‡
Department of Chemistry, Technical UniVersity of Denmark, DK-2800 Kgs. Lyngby, HaldorTopsøe A/S, 2800 Kgs. Lyngby, and Department of Chemical and Biological Engineering, Iowa
State UniVersity, Ames, Iowa 50011
Received September 10, 2009; E-mail: [email protected]; [email protected]
Abstract: Methanol, ethanol, and i-propanol were converted under methanol-to-gasoline (MTH)-like
conditions (400 °C, 1-20 bar) over zeolite H-ZSM-5. For methanol and ethanol, the catalyst lifetimes and
conversion capacities are comparable, but when i-propanol is used as the reactant, the catalyst lifetime is
increased dramatically. In fact, the total conversion capacity (calculated as the total amount of alcohol
converted before deactivation in galcohol/gzeolite) is more than 25 times higher for i-propanol compared to the
lower alcohols. Furthermore, when i-propanol is used as the reactant, the selectivity toward alkanes and
aromatics declines rapidly over time on stream, and at 20 bar of pressure the liquid product mixture consists
almost exclusively of C4-C12 alkenes after approximately a third of the full reaction time. This discovery
could open a new route to hydrocarbons via i-propanol from syn-gas or biobased feedstocks.
Introduction
The methanol-to-hydrocarbons (MTH) reaction was discov-ered and commercialized more than two decades ago. However,due to the situation on the global oil market, the gasolinesynthesis was discontinued.1,2 Currently, the MTH reaction isreceiving renewed attention due to the focus on renewable fuelsources.3 The level to which this reaction can contribute to asustainable nonfossil-based energy sector naturally depends onthe origin of the methanol.4 Methanol is traditionally producedfrom coal or natural gas via syn-gas, but many interestingnonfossil routes for the production of methanol as well as higheralcohols are investigated today.5 Methods for production ofhigher alcohols from syn-gas are also under development6,7 asis the gasification of biomass to syn-gas.8
Since the MTH reaction was discovered in the early 1970sand published in 1977,9 the reaction mechanism has been widelydebated.10 The “hydrocarbon pool mechanism” in which car-bonaceous species in the zeolitic pores are part of the catalytic
system has become generally accepted. This idea was originallysuggested by Mole11 and Langner,12 and a decade later Kolboeet al.13,14 introduced a more general mechanism. Throughisotopic labeling experiments Bjørgen et al.15 uncovered furthermechanistic details about the hydrocarbon pool and suggested“the dual cycle mechanism”. Recently, mechanistic modelinghas also been used to gain insight into the mechanisticdetails.16,17
In the MTH reaction, the zeolite catalyst suffers fromdeactivation due to coking and frequent regeneration bycombustion of the deposited coke is required. It is thus a keyresearch area to improve the catalyst lifetime between regenera-tions. Another important objective is to suppress the formationof aromatic compounds and shift the selectivity toward theproduction of olefins (the MTO reaction).18,19 Numerous ap-proaches have been tried to obtain these goals, most of themdealing with optimization of the catalyst or modifying thereaction conditions.20-24
† Technical University of Denmark.‡ Haldor Topsøe A/S.§ Iowa State University.
(1) Stocker, M. Microporous Mesoporous Mater. 1999, 2, 9–3.(2) Topp-Jørgensen, J. Stud. Surf. Sci. Catal. 1998, 36, 293.(3) Suntana, A. S.; Vogt, K. A.; Turnblom, E. C.; Upadhye, R. Appl.
Energy 2009, 86, 215.(4) Vogt, K. A.; Vogt, D. J.; Patel-Weynand, T.; Upadhye, R.; Edlund,
D.; Edmonds, R. L.; Gordan, J. C.; Suntana, A. S.; Sigurdardottir, R.;Miller, M.; Roads, P. A.; Andreu, M. G. Renew. Energ. 2009, 34,233.
(5) Atsumi, S.; Hanai, T.; Liao, J. C. Nature. 2008, 451.(6) Iranmahboob, J.; Hill, D. O.; Toghiani, H. Appl. Catal., A 2002, 231,
99.(7) Spivey, J. J.; Egbebi, A. Chem. Soc. ReV. 2007, 36, 1514.(8) Al Arni, S.; Bosio, B.; Arato, E. Renew. Energ. 2010, 35, 29.(9) Chang, C. D.; Silvestri, A. J. J. Catal. 1977, 47, 249.
(10) Haw, J. F.; Song, W.; Marcus, D. M.; Nicholas, J. B. Acc. Chem.Res. 2003, 36, 317.
(11) Mole, T.; Whiteside, J. A.; Seddon, D. J. Catal. 1983, 82, 261.(12) Langner, B. E. Appl. Catal. 1982, 2, 289.(13) Dahl, I. M.; Kolboe, S. Catal. Lett. 1993, 20, 329.(14) Dahl, I. M.; Kolboe, S. J. Catal. 1994, 149, 458.(15) Bjørgen, M.; Svelle, S.; Joensen, F.; Nerlov, J.; Kolboe, S.; Bonino,
F.; Bordiga, S.; Olsbye, U. J. Catal. 2007, 249, 195.(16) McCann, D. M.; Lesthaeghe, D.; Kletnieks, P. W.; Guenther, D. R.;
Hayman, M. J.; Speybroeck, V. V.; Waroquier, M.; Haw, J. F. Angew.Chem., Int. Ed. 2008, 47, 5179.
(17) Svelle, S.; Tuma, C.; Rozanska, X.; Kerber, T.; Sauer, J. J. Am. Chem.Soc. 2009, 131, 816.
(18) Haw, J. F.; Marcus, D. M. Nanotechnology in Catalysis; PlenumPublishers: New York, 2004; Vol. 1, Chapter 13.
(19) Bjørgen, M.; Joensen, F.; Lillerud, K.-P.; Olsbye, U.; Svelle, S. Catal.Today 2009, 142, 90.
(20) Chen, J. Q.; Bozzano, A.; Glover, B.; Fuglerud, T.; Kvisle, S. Catal.Today 2005, 106, 103.
(21) Mokrani, T.; Scurrell, M. Catal. ReV. 2009, 51 (1), 145.
Published on Web 10/30/2009
10.1021/ja907692t CCC: $40.75 ! 2009 American Chemical Society J. AM. CHEM. SOC. 2009, 131, 17009–17013 9 17009
65

In the literature, many different reactants have been testedunder MTH-like reaction conditions. Already in the first articleon MTH9 a number of different oxygen containing reactants(higher alcohols, carbonyl compounds, acids, and esters) werescreened in the reaction, all resulting in a mixture of hydrocarbonproducts. Recently, Gayubo et al.25,26 did a thorough screeningof reactants, including higher alcohols (propanol and butanol)phenols, aldehydes, ketones, and carboxylic acids. In all cases,a mixture of hydrocarbon products containing olefins, paraffins,and aromatics was produced, illustrating that H-ZSM-5 isvirtually omnivorous. In an attempt to elucidate mechanisticinformation, mixtures of methanol and higher alcohols (ethanol,i-propanol, and 1-butanol), were reacted over H-ZSM-5 by Tauet al.27 Through isotopic labeling experiments it was concludedthat the carbon atoms from the different alcohols are scrambledand distributed randomly in the products. Lifetime and deactiva-tion of the catalyst however was not addressed in these studies.
Tabak et al. have converted propene and butene to hydro-carbons over ZSM-5.28 They show that the small alkenesoligomerize and by varying the reaction temperature andpressure they are able to change the reactivity of oligomerizationversus cracking and thereby controlling the molecular weightof the products.
In an early study,29 methanol and ethanol were compared asreactants over H-ZSM-5, and very similar product distributionswere obtained. This was confirmed in a recent article from ourresearch group, where the differences in the hydrocarbon poolwere also discussed.30
Very recently, Gujar et al. studied the conversion of C1-C4
alcohols over H-ZSM-5 in a batch reactor. They concluded thatthe higher alcohols produce more organic liquid than methanol,when allowed to react for the fixed time in the reactor.31
Even though several different reactants and cofeeding experi-ments have been tested in the catalytic conversion over H-ZSM-5, almost no emphasis has been put on the dependence of thereactant on catalyst lifetime and deactivation when using otherreactants than methanol or ethanol. In the present study,methanol, ethanol, and i-propanol are compared as reactants overH-ZSM-5 and the focus is placed on the beneficial effects
observed on product selectivity as well as lifetime of the catalystwhen feeding i-propanol.
Experimental Section
The catalyst used was a commercially available zeolite ZSM-5(Si/Al ) 40) kindly provided by Zeolyst International. The catalyticreactions were performed in a fixed bed reactor at a reactiontemperature of 400 °C and a pressure of 1 or 20 bar. In all runs,300 mg of fractioned (350-500 µm) zeolite catalyst was used. Thereactant liquid was introduced by a HPLC pump and evaporatedbefore the catalyst bed. The feed rates of the various alcohols werenormalized to introduce an equivalent molar amount of alcohol perunit of time. This resulted in a significantly larger WHSV for thehigher alcohols compared to methanol. The feed rates for thedifferent alcohols are listed in Table 1.
For reactions performed at 1 bar, the products were analyzed byan online GC equipped with a flame ionization detector. Heliumwas used as an inert carrier gas with a flow of 20 mL/min in allnonpressurerized experiments.
When performing the reaction at 20 bar of pressure, the productswere condensed at room temperature while still pressurized. The
(22) Bjørgen, M.; Joensen, F.; Holm, M. S.; Olsbye, U.; Lillerud, K. P.;Svelle, S. Appl. Catal., A 2008, 345, 43.
(23) Christensen, C. H.; Johannsen, K.; Tornqvist, E.; Schmidt, I.; Topsoe,H.; Christensen, C. H. Catal. Today 2007, 128, 177.
(24) Teketel, S.; Svelle, S.; Lillerud, K. P.; Olsbye, U. ChemCatChem 2009,1, 78.
(25) Gayubo, A. G.; Aguayo, A. T.; Atutxa, A.; Aguado, R.; Bilbao, J.Ind. Eng. Chem. Res. 2004, 43, 2610.
(26) Gayubo, A. G.; Aguayo, A. T.; Atutxa, A.; Aguado, R.; Olazar, M.;Bilbao, J. Ind. Eng. Chem. Res. 2004, 43, 2619.
(27) Tau, L. M.; Davis, B. H. Fuel Process. Technol. 1990, 26, 209.(28) Tabak, S. A.; Krambeck, F. J.; Garwood, W. E. AIChE J. 1986, 64,
72.(29) Derouane, E. G.; Nagy, J. B.; Dejaifve, P.; van Hoff, J. H. C.; Spekman,
B. P.; Vedrine, J. C.; Naccache, C. J. Catal. 1978, 53, 40.(30) Johanson, R.; Hruby, S. L.; Rass-Hansen, J.; Christensen, C. H. Catal.
Lett. 2009, 127, 1.(31) Gujar, A. C.; Guda, V. K.; Nolan, M.; Yan, Q.; Toghiani, H.; White,
M. G. Appl. Catal., A 2009, 363, 115.
Table 1. Feed Rates and Observed Conversion Capacities
P (atm) WHSV (h-1) feed rate nalcohol (mmol/gcat*h) feed rate ncarbon (mmol/gcat*h) conv. cap. molcarbon/gzeolite conv. cap. galcohol/gzeolite
methanol 1 8.4 263 263 11 350ethanol 1 12.1 263 526 22 505i-propanol 1 15.8 263 789 565 11300
Figure 1. (a) Conversion profiles of methanol, ethanol, and i-propanolreacted over H-ZSM-5 at 400 °C. (b) Cumulative conversion capacities ingalcohol/gzeolite given as a function of the alcohol conversion.
17010 J. AM. CHEM. SOC. 9 VOL. 131, NO. 46, 2009
A R T I C L E S Mentzel et al.
66

gas phase was continuously monitored by an online GC whereasthe liquid products were analyzed by offline GC after decompressingthe liquid sample to ambient pressure. Helium was used as thecarrier gas with a flow of 40 mL/min in all pressurized experiments.
Results and Discussion
The lifetime of the catalyst (conversion vs time on stream)for the different alcohol feeds is illustrated in Figure 1a. Whenthe conversions of the different alcohols are calculated, the directdehydration products (dimethyl ether, diethyl ether, ethene,dipropyl ether, and propene, respectively) are consideredreactants. These dehydration products are still produced overthe completely deactivated catalyst, although dipropyl ether wasnever formed in significant amounts. Initially, we do not observefull conversion in the cases of ethanol and i-propanol. This doesnot mean that the catalyst is not sufficiently active; the(dehydrated) reactants are simply part of the normal productsformed during the reaction.
From Figure 1a it is seen that when methanol or ethanol isfed, the catalyst is deactivated within in a few days, but wheni-propanol is used, the catalyst is still active (>30% conversion)after more than 1000 h on stream.
In addition, the molar feed rates are kept constant for thedifferent alcohols, meaning that the catalyst converts three timesthe amount of carbon/h when i-propanol is fed compared tomethanol, see Table 1. If i-propanol is fed with a WHSV of8.4 as in the case of methanol, the deactivation of the catalystscales accordingly, simply making the reaction times requiredto reach deactivation impractical.
For conversion of methanol, coke is deposited on the catalyst,and a deactivation zone moves through the catalyst bed, resultingin the sudden drop in conversion when the whole catalyst bed
is deactivated. This sudden drop in conversion is not observed
to the same degree for ethanol and especially not for i-propanol.
The cumulative conversion capacity is plotted in Figure 1b,
and values showing the total amount (calculated on a weight
basis) of alcohol converted over the entire lifetime of the catalyst
are summarized in Table 1. When propanol is fed, the catalyst
is able to convert more than 25 times the amount of alcohol
before reaching complete deactivation, compared to the smaller
alcohols.
When the catalytic activity in the MTH reaction is described,
the “C4 hydrogen transfer index” (C4-HTI) is often used.22 This
is defined as the amount of butanes (iso-butane and n-butane)
divided by the total amount of C4-compounds and thus gives a
good indication of the development of the hydrogen transfer
ability of the working catalyst. When the C4-HTI is high, the
catalyst is able to convert alkenes to aromatics and alkanes.
The C4-HTI as a function of conversion for the three alcohols
is presented in Figure 2. For methanol the C4-HTI is quite high
(ca. 0.47) in the beginning and drops steadily as the catalyst
deactivates to around 0.22, at which point we observe break-
through of methanol and the catalyst is completely deactivated.
For ethanol and i-propanol, the initial values are around 0.26
and 0.38, respectively, and they decline with conversion.
Interestingly, for i-propanol, the C4-HTI approaches zero
already when the conversion is around 60-70%. This means
that the catalyst is no longer able to convert alkenes to aromatics
and alkanes, and therefore the product mixture consists almost
exclusively of alkenes. A decrease in the C4-HTI is expected
during deactivation due to a decrease in the effective acid site
Figure 2. C4-HTI plotted as a function of the conversion for the three alcohols tested.
J. AM. CHEM. SOC. 9 VOL. 131, NO. 46, 2009 17011
High Yield of Liquid Range Olefins Obtained A R T I C L E S
67
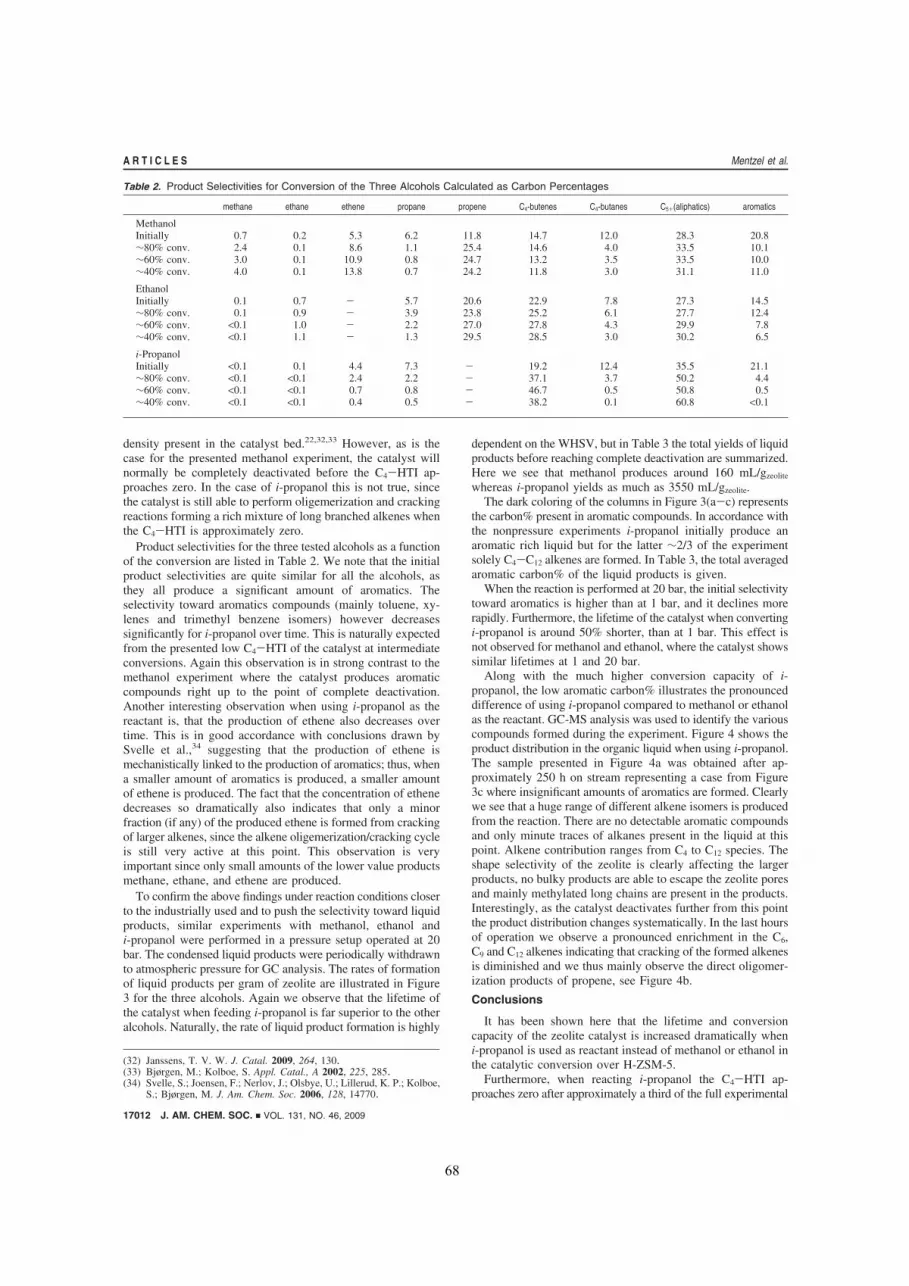
density present in the catalyst bed.22,32,33 However, as is thecase for the presented methanol experiment, the catalyst willnormally be completely deactivated before the C4-HTI ap-proaches zero. In the case of i-propanol this is not true, sincethe catalyst is still able to perform oligemerization and crackingreactions forming a rich mixture of long branched alkenes whenthe C4-HTI is approximately zero.
Product selectivities for the three tested alcohols as a functionof the conversion are listed in Table 2. We note that the initialproduct selectivities are quite similar for all the alcohols, asthey all produce a significant amount of aromatics. Theselectivity toward aromatics compounds (mainly toluene, xy-lenes and trimethyl benzene isomers) however decreasessignificantly for i-propanol over time. This is naturally expectedfrom the presented low C4-HTI of the catalyst at intermediateconversions. Again this observation is in strong contrast to themethanol experiment where the catalyst produces aromaticcompounds right up to the point of complete deactivation.Another interesting observation when using i-propanol as thereactant is, that the production of ethene also decreases overtime. This is in good accordance with conclusions drawn bySvelle et al.,34 suggesting that the production of ethene ismechanistically linked to the production of aromatics; thus, whena smaller amount of aromatics is produced, a smaller amountof ethene is produced. The fact that the concentration of ethenedecreases so dramatically also indicates that only a minorfraction (if any) of the produced ethene is formed from crackingof larger alkenes, since the alkene oligemerization/cracking cycleis still very active at this point. This observation is veryimportant since only small amounts of the lower value productsmethane, ethane, and ethene are produced.
To confirm the above findings under reaction conditions closerto the industrially used and to push the selectivity toward liquidproducts, similar experiments with methanol, ethanol andi-propanol were performed in a pressure setup operated at 20bar. The condensed liquid products were periodically withdrawnto atmospheric pressure for GC analysis. The rates of formationof liquid products per gram of zeolite are illustrated in Figure3 for the three alcohols. Again we observe that the lifetime ofthe catalyst when feeding i-propanol is far superior to the otheralcohols. Naturally, the rate of liquid product formation is highly
dependent on the WHSV, but in Table 3 the total yields of liquidproducts before reaching complete deactivation are summarized.Here we see that methanol produces around 160 mL/gzeolite
whereas i-propanol yields as much as 3550 mL/gzeolite.The dark coloring of the columns in Figure 3(a-c) represents
the carbon% present in aromatic compounds. In accordance withthe nonpressure experiments i-propanol initially produce anaromatic rich liquid but for the latter !2/3 of the experimentsolely C4-C12 alkenes are formed. In Table 3, the total averagedaromatic carbon% of the liquid products is given.
When the reaction is performed at 20 bar, the initial selectivitytoward aromatics is higher than at 1 bar, and it declines morerapidly. Furthermore, the lifetime of the catalyst when convertingi-propanol is around 50% shorter, than at 1 bar. This effect isnot observed for methanol and ethanol, where the catalyst showssimilar lifetimes at 1 and 20 bar.
Along with the much higher conversion capacity of i-propanol, the low aromatic carbon% illustrates the pronounceddifference of using i-propanol compared to methanol or ethanolas the reactant. GC-MS analysis was used to identify the variouscompounds formed during the experiment. Figure 4 shows theproduct distribution in the organic liquid when using i-propanol.The sample presented in Figure 4a was obtained after ap-proximately 250 h on stream representing a case from Figure3c where insignificant amounts of aromatics are formed. Clearlywe see that a huge range of different alkene isomers is producedfrom the reaction. There are no detectable aromatic compoundsand only minute traces of alkanes present in the liquid at thispoint. Alkene contribution ranges from C4 to C12 species. Theshape selectivity of the zeolite is clearly affecting the largerproducts, no bulky products are able to escape the zeolite poresand mainly methylated long chains are present in the products.Interestingly, as the catalyst deactivates further from this pointthe product distribution changes systematically. In the last hoursof operation we observe a pronounced enrichment in the C6,C9 and C12 alkenes indicating that cracking of the formed alkenesis diminished and we thus mainly observe the direct oligomer-ization products of propene, see Figure 4b.
Conclusions
It has been shown here that the lifetime and conversioncapacity of the zeolite catalyst is increased dramatically wheni-propanol is used as reactant instead of methanol or ethanol inthe catalytic conversion over H-ZSM-5.
Furthermore, when reacting i-propanol the C4-HTI ap-proaches zero after approximately a third of the full experimental
(32) Janssens, T. V. W. J. Catal. 2009, 264, 130.(33) Bjørgen, M.; Kolboe, S. Appl. Catal., A 2002, 225, 285.(34) Svelle, S.; Joensen, F.; Nerlov, J.; Olsbye, U.; Lillerud, K. P.; Kolboe,
S.; Bjørgen, M. J. Am. Chem. Soc. 2006, 128, 14770.
Table 2. Product Selectivities for Conversion of the Three Alcohols Calculated as Carbon Percentages
methane ethane ethene propane propene C4-butenes C4-butanes C5+(aliphatics) aromatics
MethanolInitially 0.7 0.2 5.3 6.2 11.8 14.7 12.0 28.3 20.8!80% conv. 2.4 0.1 8.6 1.1 25.4 14.6 4.0 33.5 10.1!60% conv. 3.0 0.1 10.9 0.8 24.7 13.2 3.5 33.5 10.0!40% conv. 4.0 0.1 13.8 0.7 24.2 11.8 3.0 31.1 11.0
EthanolInitially 0.1 0.7 - 5.7 20.6 22.9 7.8 27.3 14.5!80% conv. 0.1 0.9 - 3.9 23.8 25.2 6.1 27.7 12.4!60% conv. <0.1 1.0 - 2.2 27.0 27.8 4.3 29.9 7.8!40% conv. <0.1 1.1 - 1.3 29.5 28.5 3.0 30.2 6.5
i-PropanolInitially <0.1 0.1 4.4 7.3 - 19.2 12.4 35.5 21.1!80% conv. <0.1 <0.1 2.4 2.2 - 37.1 3.7 50.2 4.4!60% conv. <0.1 <0.1 0.7 0.8 - 46.7 0.5 50.8 0.5!40% conv. <0.1 <0.1 0.4 0.5 - 38.2 0.1 60.8 <0.1
17012 J. AM. CHEM. SOC. 9 VOL. 131, NO. 46, 2009
A R T I C L E S Mentzel et al.
68

run time, meaning that the selectivity is almost exclusivelyshifted toward the production of alkenes, and only minuteamounts of aromatics and alkanes are formed. The resultingalkene rich liquid product which is very low in aromatic content
can serve as an attractive raw material for the chemical industry,or could easily be hydrogenated to produce high quality cleanfuel. On the basis of the results presented here, an alternativeroute from syn-gas or biobased feedstocks to hydrocarbons goingvia i-propanol instead of methanol can be envisaged.
Acknowledgment. The Centre for Catalysis and Sustainable
Chemistry is sponsored by the Danish National Research Founda-
tion. S.L.H. acknowledges the National Science Foundation’s
Partnership for International Research and Education (PIRE) (NSF
grant OISE 0730277) for financial support.
JA907692T
Figure 3. Rate of formation of the organic phase from reacting (a)methanol, (b) ethanol, and (c) i-propanol over H-ZSM-5 at 400 °C. Thedark coloring represents the carbon% present in aromatics.
Table 3. Total Yield and Selectivities at 20 bar
P bar WHSV gg-1h-1 org. liq. mL/gcat total carbon in aromatics
Methanol 20 8.4 160 46.9%Ethanol 20 12 200 49.9%i-Propanol 20 16 3550 6.1%
Figure 4. GC-MS analysis of the organic phase feeding i-propanol (a)after 250 h on stream and (b) after 425 h on stream. Major compounds arelabeled for illustrative reasons.
J. AM. CHEM. SOC. 9 VOL. 131, NO. 46, 2009 17013
High Yield of Liquid Range Olefins Obtained A R T I C L E S
69

Please cite this article in press as: U.V. Mentzel, M.S. Holm, Appl. Catal. A: Gen. (2011), doi:10.1016/j.apcata.2011.01.040
ARTICLE IN PRESSG Model
APCATA-13016; No. of Pages 9
Applied Catalysis A: General xxx (2011) xxx–xxx
Contents lists available at ScienceDirect
Applied Catalysis A: General
journa l homepage: www.e lsev ier .com/ locate /apcata
Utilization of biomass: Conversion of model compounds to hydrocarbons overzeolite H-ZSM-5
Uffe V. Mentzela,b,!, Martin S. Holma,b,!
a Centre for Catalysis and Sustainable Chemistry, Department of Chemistry, Technical University of Denmark, Anker Engelundsvej 1, DK 2800 Kgs. Lyngby, Denmarkb Center for Green and Sustainable Chemistry, Department of Chemistry, Technical University of Denmark, Anker Engelundsvej 1, DK 2800 Kgs. Lyngby, Denmark
a r t i c l e i n f o
Article history:
Received 23 November 2010Received in revised form 25 January 2011Accepted 27 January 2011Available online xxx
Keywords:
ZeoliteZSM-5Methanol-to-Hydrocarbons (MTH)Bio-oilBiomass-to-liquids (BTL)
a b s t r a c t
Zeolite catalyzed deoxygenation of small oxygenates present in bio-oil or selected as model compoundswas performed under Methanol-to-Hydrocarbons (MTH) like reaction conditions using H-ZSM-5 as thecatalyst. Co-feeding of the oxygenates with methanol generally decreases catalyst lifetime due to cok-ing and results in higher selectivity towards aromatics compared to conversion of pure methanol. Thereaction pattern of the different oxygenates did not simply follow the effective H/C ratio of the additivessince structural isomers with identical effective H/C ratios showed significant differences with respectto catalyst lifetime and product selectivity. A distinct positive effect on catalyst lifetime was observedfor methanol dilution. Thus, the conversion capacity of the catalyst was up to 10 times higher whenthe reactant was diluted in methanol. We observe that in particular acid/ester functionalities favor oxy-gen removal through decarbonylation over dehydration which preserves hydrogen in the hydrocarbonproduct mixture. By employing 13C labeled substrates we confirmed the incorporation of carbon into thehydrocarbon products as well as a pronounced preference of the additive carbon towards incorporationinto aromatic compounds.
© 2011 Elsevier B.V. All rights reserved.
1. Introduction
The development of a more sustainable and environmentallyfriendly production of chemicals and transportation fuels is pur-sued today [1]. The use of a biomass derived fuel additives such asbio-ethanol or bio-diesel represent examples of current strategiestowards the employment of “greener” fuels [2,3].
Bio-oil can be produced from numerous types of biomassthrough a rapid thermal treatment with no or only little oxy-gen present. Bio-oil represents an abundant and near CO2 neutralresource which could find application if sufficiently efficientupgrading strategies are identified. Depending on the startingmaterial and the specific treatment conditions, large composi-tional discrepancies are seen within bio-oils but in general it is ahighly complex mixture of oxygenates produced by depolymeriza-tion and fragmentation of cellulose, hemi-cellulose, and lignin [4].Bio-oil is immiscible with hydrocarbons, contains large amountsof water, and is relatively unstable, however the liquid has anadvantage over untreated biomass with respect to handling and
! Corresponding authors at: Centre for Catalysis and Sustainable Chemistry,Department of Chemistry, Technical University of Denmark, Anker Engelundsvej1, DK 2800 Kgs. Lyngby, Denmark.
E-mail addresses: [email protected] (U.V. Mentzel),[email protected] (M.S. Holm).
transportation [5,6]. Transformation of bio-oil into a mixture ofhydrocarbons through zeolite catalyzed deoxygenation is highlydesired and could ensure compatibility with conventional gasoline[7]. In fact, researchers at Mobil already in the years following thediscovery of the Methanol-to-gasoline (MTG) process [8] investi-gated this idea of converting biomass into hydrocarbons primarilyover zeolite ZSM-5 [9,10]. They introduced the effective H/C ratioof a substrate (see Eq. (1)), with H, O, and C being the moles ofhydrogen, oxygen, and carbon present in the compound. This is aconvenient measure of the hydrogen content left in the productsonce oxygen is removed as water [11].
H
Ceffective =
(H " 20)
C(1)
Eq. (1): Definition of the effective H/C ratio, where H, C, and O arethe number of hydrogen, carbon, and oxygen atoms present in thespecific compound.
Excessive deactivation of the catalyst by coking was discoveredas a major problem when reacting compounds with an effective H/Cratio below 2. A carbohydrate with a molecular formula of C6H12O6
has an effective H/C ratio of 0 and will thus be able to produce onlycarbon if fully dehydrated. However, if the reactants are deoxy-genated by decarbonylation or decarboxylation (formation of CO orCO2, respectively) hydrogen is retained in the hydrocarbon prod-ucts. Consequently, if a gasoline product mixture with a similarH/C content as conventional MTH fuel is desired, a hexose would
0926-860X/$ – see front matter © 2011 Elsevier B.V. All rights reserved.
doi:10.1016/j.apcata.2011.01.040
70

Please cite this article in press as: U.V. Mentzel, M.S. Holm, Appl. Catal. A: Gen. (2011), doi:10.1016/j.apcata.2011.01.040
ARTICLE IN PRESSG Model
APCATA-13016; No. of Pages 9
2 U.V. Mentzel, M.S. Holm / Applied Catalysis A: General xxx (2011) xxx–xxx
need to dissociate 1/3 of its carbon atoms as CO2 which resemblesfermentation where CO2 and ethanol are formed.
Several authors have reported on zeolite catalyzed conversionof bio-oil/pyrolysis vapors [7,12–17] or selected model compoundspresent in bio-oil [18–31] over mainly zeolite ZSM-5 at MTH-likereaction conditions. Due to the very complex nature of bio-oilonly limited information regarding the reactivity of the individualcomponents is obtained when feeding the highly complex bio-oilmixture which merits the investigation of representative modelcompounds. Very interestingly the reports show that hydrocar-bons can indeed be produced from virtually any oxygenate butgenerally the catalyst suffers from extremely fast deactivation bycoking. The addition of methanol, which has an effective H/C ratioof 2, will increase the combined H/C ratio of the feed and has beenreported to have a positive effect e.g. on the conversion of furfural[11,32]. Also dilution of bio-oil with methanol has been reported[33] and recently Bilbao and co-workers showed that methanoladdition attenuates the condensation of pyrolytic lignin when thefeed is heated prior to introduction to the reactor [34]. Significantimprovements were thus achieved in a two-step process wherethe bio-oil and methanol mixture was volatilized in a separate unitbefore the catalytic conversion [35,36].
The use of zeolite catalysts for conversion of biomass derivedcompounds in the high temperature range of FCC have also recentlybeen reported [37–39]. In relation to this, Huber and co-workersused finely dispersed sugar physically blended with the catalystwhile applying extremely rapid heating, and were thus able to pro-duce single- and poly-aromatics alongside CO2 and water althoughalso substantial coking of the catalyst occurs [40–42].
Here we present a study investigating the reactivity of selectedoxygenates when co-fed with methanol at MTH reaction conditionsover zeolite H-ZSM-5. The additives contain different functional-ities and were selected to cover a wide range of H/C ratios. Theoxygenates were co-reacted as 10 wt% solutions in methanol toobtain lifetimes between one hour and 2.5 days which made evalu-ation of their compatibility with MTH possible. The most interestingcompounds were further tested in a wt% series intended to quantifythe positive effect of methanol dilution with respect to conver-sion capacity of the additive. Experiments using 13C-labeling of thesubstrates were performed in order to address whether the car-bon atoms from the additives were in fact incorporated into thehydrocarbon products.
2. Experimental
The zeolite catalyst used in this study was a commercially avail-able zeolite ZSM-5 with a Si/Al ratio of 40 kindly supplied by Zeolyst.The NH4-ZSM-5 was transformed into proton form by calcinationat 550 #C for 6 h reached with a heating ramp of 2 #C/min.
Characterization by XRPD, N2-sorption, and elemental analysisof the commercial ZSM-5 sample is presented in supplementarydata. Phase purity, crystallinity, and the nominal Si/Al ratio of 40are confirmed.
Catalytic experiments were performed with 300 mg of purezeolite which was crushed and sieved to obtain particle size of350–500 !m and fixated by quartz wool in a quartz reactor hav-ing an internal diameter of 4 mm. During heating to the reactiontemperature (370 #C) the catalyst was kept in a flow of helium of40 ml/min. The reactants were introduced by an HPLC pump at arate of 0.05 ml/min through a stainless steel tube (1/16 in.) heatedto above the boiling point of the respective reactants. The constantfeed volume gave a typical WHSV of around 8 h"1 depending onthe density of the specific feed composition. Conversion capacitiesreported in gfeed/gzeolite for the individual experiments were calcu-lated from the measured WHSV multiplied by the lifetime observed
when a conversion of 50% of additive + methanol/DME was reached[44].
The reaction temperature was measured inside the reactorapproximately 0.5 cm below the catalyst bed and was stabilizedat 370 #C before the experiments. Steel piping (1/4 in.) heated to>200 #C directed the products to analysis by on-line GC equippedwith an FID. Response factors of all hydrocarbons were assumed tobe 1 while 0.63 and 0.81 was used for DME and methanol, respec-tively. Response factors for other oxygenates were estimated tobe equal to that of DME. The concentrations of CO and CO2 in theeffluent were determined by a BINOS instrument placed after con-densation of liquids in a cold trap kept at 0 #C.
In the case of experiments converting 13C enriched reactants;the same setup, scaling and reaction conditions were used. Theconversion and product selectivities were monitored by on-lineGC in order to verify similarity with conventional runs while addi-tional product samples were frequently withdrawn for GC–MSanalyses. Calculation of the 13C content in the products was donebased on reference spectra obtained from reacting pure 13C labeledmethanol. In a typical 13C experiment enough substrate was usedto continue operation for approximately 1 h. In all cases only minordeactivation occurs in this short time range thus giving informationon additive carbon incorporation over a “fresh” catalyst.
TPO (temperature programmed oxidation) of the deactivatedcatalysts was performed on 100 mg of sample. The coked catalystwas heated from RT to 670 #C at a rate of 2.7 #C/min in a flow of20 ml/min of 5% O2 in He. The formed CO and CO2 were continu-ously detected by a BINOS instrument.
All chemicals are commercially available and were used aspurchased without further purification. A full list of chemical com-pounds is found in supplementary data.
3. Results and discussion
3.1. Additive screening
An initial screening of pure compounds with relatively loweffective H/C ratios ($1.5) was done at MTH reaction conditions(370 #C) over H-ZSM-5. This resulted in catalyst lifetimes in theorder of minutes which was in strong contrast to reacting methanolwhich gives a catalyst lifetime of around 65 h. Clearly, this illus-trated that excessive coking of the zeolite catalyst occurred whennon-mono alcohols (ethylene glycol, propanediol, glycerol, etc.)were converted. In order to examine all molecules under simi-lar conditions we therefore chose to react the compounds dilutedto 10 wt% in methanol. This resulted in catalyst lifetimes span-ning from as little as 2% to approximately equal that of puremethanol thus illustrating the “toxicity” of co-converting theindividual molecules. Table 1 presents the additives chosen for co-feeding, their effective H/C ratio, the total conversion capacities ingfeed/gzeolite and the amounts of CO and CO2 formed (given as a per-centage relative to the molar amount of additive introduced). Theinitial product distribution is described by grouped selectivities incombination with the C4-HTI (hydrogen transfer index) which isa descriptor of the hydrogen transfer activity of the catalyst (seeEq. (2)) [43]. The C4-HTI and the selectivity were both measuredapproximately 5–10% into the full experiment run time. As is thecase in conventional MTH, the product selectivity in the co-feedingexperiments shifts from large amounts of aromatic and paraf-finic products towards olefins as the catalyst gradually deactivates[44].
C4-HTI =
! Butanes
Butanes + Butenes(2)
Eq. (2): Definition of the C4-HTI.
71

Please cite this article in press as: U.V. Mentzel, M.S. Holm, Appl. Catal. A: Gen. (2011), doi:10.1016/j.apcata.2011.01.040
ARTICLE IN PRESSG Model
APCATA-13016; No. of Pages 9
U.V. Mentzel, M.S. Holm / Applied Catalysis A: General xxx (2011) xxx–xxx 3
Table 1
Conversion capacity, initial selectivity, C4-HTI, and CO/CO2 production from conversion of various oxygenates as 10% solutions in methanol (T = 370 #C, P = 1 bar, 300 mgH-ZSM-5, WHSV = 8 h"1).
Additive Eff. H/C (additive) Conversion capacitya C4-HTIc COb CO2b C1–3
c C4c C5+
c (aliphatic) C6–10c (aromatic)
H2O – 512 0.36 0% 0% 22% 28% 31% 19%Methanol 2 471 0.38 0% 0% 22% 28% 31% 19%Formaldehyde dimethyl acetal 1.33 62 0.34 0% 0% 22% 25% 28% 25%Formic acid "2 496 0.38 85% 2% 22% 28% 32% 18%Ethanol 2 487 0.36 0% 0% 24% 27% 31% 18%Ethyleneglycol 1 131 0.31 4% 0% 23% 24% 25% 28%Acetaldehyde 1 72 0.29 7% 0% 26% 23% 22% 29%Acetic acid 0 91 0.26 5% 3% 21% 20% 23% 36%Glycolaldehyde dimethyl acetal 1 40 0.31 43% 3% 23% 26% 28% 23%Methyl glycolate 0 86 0.34 91% 0% 23% 25% 26% 26%2-Propanol 2 578 0.38 0% 0% 21% 28% 32% 19%1,2-Propanediol 1.33 190 0.32 1% 0% 21% 25% 29% 25%1,3-Propanediol 1.33 96 0.33 1% 0% 22% 25% 28% 25%Glycerol 0.67 44 0.33 8% 0% 24% 23% 25% 28%Acetoned 1.33 271 0.29 0% 1% 22% 24% 26% 27%Propionaldehyde 1.33 138 0.31 3% 0% 22% 24% 26% 28%Propionic acid 0.67 109 0.30 26% 4% 22% 24% 25% 29%Methyl lactate 0.5 189 0.33 93% 0% 21% 25% 28% 26%Methyl acrylate 0.5 27 0.27 26% 10% 24% 22% 25% 29%1-Butanol 2 679 0.39 0% 0% 20% 27% 32% 21%1,4-Butanediol 1.5 139 0.33 0% 0% 22% 25% 27% 26%1,3-Butanediol 1.5 120 0.33 0% 0% 23% 26% 27% 24%1,2-Butanediol 1.5 166 0.33 n.a. n.a. 22% 26% 28% 24%2,3-Butanediold 1.5 320 0.31 0% 0% 22% 25% 29% 24%Butyraldehyde 1.5 146 0.34 5% 0% 22% 25% 27% 26%Butanoned 1.5 327 0.27 0% 0% 23% 25% 26% 25%Butyric acid 1 219 0.35 62% 0% 21% 25% 30% 24%1,5-Pentanediol 1.6 299 0.34 0% 0% 22% 25% 28% 25%Levulinic acid 0.4 37 0.29 90% 0% 24% 25% 25% 26%"-Valerolactone 0.8 82 0.33 78% 7% 22% 26% 28% 24%2-methyl-tetrahydrofuran 1.6 255 0.36 0% 0% 20% 25% 29% 26%Toluene 1.14 412 0.33 0% 0% 19% 20% 21% 40%Anisole 0.86 10 na. 0% 0% 26% 21% 21% 32%1,2-dimethoxybenzene 0.75 9 na. 0% 0% 28% 20% 26% 26%
agfeed/gzeolite, bmol/moladditive, cinitial, dbreakthrough of additive before DME/methanol.
From the data in Table 1 we see that any additive leads to lowerconversion capacities compared to conversion of pure methanolwith the exception of water, formic acid and higher alcohols. Thelatter is in good correlation with results published recently [45]while water and formic acid (formic acid dissociates predomi-nantly into CO and water) leads to a lower WHSV of methanol withan increased water concentration which presumably suppressescoke formation [29]. Co-feeding a 10 wt% solution of the pheno-lic species anisole or 1,2-dimethoxybenzene results in conversioncapacities of <10 gfeed/gzeolite. The huge difficulty in convertingthese species is in good agreement with previous reports whereremoval of phenolic species prior to bio-oil upgrading was sug-gested [18,19]. Other compounds which deactivate the catalyststrongly are levulinic acid, glycerol, and formaldehyde dimethylacetal. These compounds all represent highly hydrogen deficientmolecules with critically low effective H/C ratios of 0.4, 0.6 and 1.33,respectively. As expected, compounds which are more compati-ble do indeed have higher effective H/C ratios, e.g. 1,5-pentanediol.In general, lower conversion capacities are obtained for low H/Cratios of the additives. Illustrative examples of this include hydroxyacetaldehyde (introduced as the dimethyl acetal) which deactivatesthe catalyst faster than acetaldehyde, glycerol is harder to convertthan propanediol and butanoic acid performs better than the loweracids, however several additional features should be noted.
Fig. 1 presents the conversion capacities from Table 1 plot-ted as a function of the effective H/C ratio of the pure additive.Here it can be seen that compounds which have the same effec-tive H/C ratio do not give identical conversion capacities. This isobserved for molecules containing oxygen in different functionali-ties as well as for positional isomers. A pronounced difference in theconversion capacity between 2,3-butanediol and the other butane-
diols is observed disregarding that they all have an effective H/Cratio of 1.5 and contain the same functional groups. Interestinglybutanone performs similar to 2,3-butanediol whereas butyralde-hyde groups with the diols having one or two hydroxyl groupsat a terminal carbon. This reactivity correlates with the detectionof butanone as the direct dehydration product formed from 2,3-butanediol whereas predominantly butadiene and butyraldehyde
Fig. 1. Total conversion capacity from experiments having 10 wt% of additive inmethanol plotted as a function of the effective H/C ratio of the additive (T = 370 #C,P = 1 bar, 300 mg H-ZSM-5, WHSV = 8 h"1).
72

Please cite this article in press as: U.V. Mentzel, M.S. Holm, Appl. Catal. A: Gen. (2011), doi:10.1016/j.apcata.2011.01.040
ARTICLE IN PRESSG Model
APCATA-13016; No. of Pages 9
4 U.V. Mentzel, M.S. Holm / Applied Catalysis A: General xxx (2011) xxx–xxx
are produced from 1,3- and 1,2-butanediol. However, tetrahydrofu-ran is the main dehydration product of 1,4-butanediol which gives aconversion capacity close to the latter isomers. The same tendencyof higher conversion capacities of the ketone over the aldehyde isobserved for acetone and propanal, where also 1,2-propanediol issignificant better than the corresponding 1,3-propanediol. How-ever breakthrough of butanone and acetone before methanol/DMEis observed which indicates a significantly lower reactivity as com-pared to the corresponding aldehydes. In all other cases the additive(or derivatives thereof) only starts to appear in the reactor outletalongside unconverted methanol/DME.
Levulinic acid and "-valerolactone can be derived from biomass[46,47] and represent along with 2-methyl-tetrahydrofuran a seriesof molecules with an identical carbon backbone which are increas-ingly hydrogenated. From Fig. 1 (and Table 1) we see that thisseries does indeed group according to their oxidation state, withthe most reduced compounds performing superior, giving conver-sion capacities of around 10%, 20% and 55% compared to conversionof pure methanol, respectively. This observation can prove impor-tant since the use of 1 equivalent of H2 when going from levulinicacid to "-valerolactone actually doubles the conversion capacitythus showing that partial hydrogenation could be advantageous.
In conventional MTH the alcohol oxygen is removed by dehy-dration. When converting higher oxidized compounds it wouldhowever be useful to remove oxygen by decarboxylation or decar-bonylation in order to preserve hydrogen in the hydrocarbonproducts. Fig. 1 shows that the acids and in particular methyl lactateperforms significantly better than could be expected from their lowH/C ratios. Acetic acid forms only minor amounts of CO and CO2 (5%,3%) while propanoic acid (26%, 4%) and butyric acid (62%, 0%) pro-duce larger amounts of CO. The high oxidation state of acetic acidin combination with a negligible tendency to dissociate CO and/orCO2 (at this concentration) leads to a very high initial aromatic car-bon percentage of 35% compared to 29% for propanoic acid, 24% forbutanoic acid and only 19% for pure methanol.
Fig. 2 shows the initial carbon % located in aromatic productsplotted as a function of the effective H/C ratio in the combinedfeed (methanol + additive) for the compounds in Table 1. Thecoloring differentiates between molecules able to dissociate sig-nificant amounts (>30%) of CO and/or CO2 (gray) and those unable(dark). Clearly, conversion of compounds deoxygenating throughdehydration (dark) results in a relatively high selectivity towardsaromatics while compounds which are able to split off CO or CO2
produce less aromatics. It appears that the intrinsic selectivity of theH-ZSM-5 zeolite forces the product distribution within the gaso-
Fig. 2. Initial aromatic carbon % plotted as a function of the effective H/C ratio of thereactant mixture (T = 370 #C, P = 1 bar, 300 mg H-ZSM-5, WHSV = 8 h"1).
line range and preserving hydrogen in the products increases theselectivity towards aliphatic products over the hydrogen deficientaromatic compounds.
Dissociation of CO is also relevant to explain the extraordinarygood performance of methyl lactate. More than 90% of the intro-duced methyl lactate dissociate CO which is in good agreementwith very recent results [48]. In fact after complete deactivationof the catalyst we observe a continued formation of mainly CO,acetaldehyde and DME/methanol indicating that acetaldehyde andmethanol are the “true” reactants when converting methyl lactate.
Also levulinic acid and "-valerolactone form large amounts ofCO and in the case of "-valerolactone also small amounts of CO2 areproduced (Table 1). "-Valerolactone has previously been reportedto decompose into CO2 and butene over a weak solid acid at a sim-ilar temperature [49]. However, under MTH conditions butadiene,CO, and water are observed as the primary decomposition productsfrom "-valerolactone.
3.2. Additive concentration
Based on the data from Table 1 in combination with knowl-edge of very short lifetimes when reacting the pure compoundswe speculated whether the lifetime improvement from dilutionin methanol correlated linearly with the wt% of the additives orwhether it was possible to convert more of the additive at suit-able concentrations. To investigate this, the 4 most interestingcompounds from Table 1 (methyl lactate, "-valerolactone, glyc-erol, and acetic acid) were converted in different concentrationsin methanol. These compounds can potentially be derived frombiomass and possessed the ability to dissociate CO/CO2. Fig. 3presents the conversion capacities of the additives diluted inmethanol. Fig. 3a and b illustrate that reacting pure methyl lactateor pure "-valerolactone results in very poor conversion capacities.However, looking at the lower levels of methyl lactate in the feed(Fig. 3a) we clearly see that an optimum in the conversion capacityexists at a wt% of 10–25. Conclusively, the dilution of methanol doesnot only increase the lifetime proportionally to the dilution levelbut fine tuning the concentration leads to an increased total con-version capacity of methyl lactate before the catalyst is deactivated.The lower limit is rationalized by considering that when only smallamounts of methyl lactate is added deactivation from conversion ofmethanol dominates. This means that even if the catalyst had a sim-ilar lifetime as for conversion of pure methanol, a 2.5 wt% solutionof methyl lactate would not result in as high additive conversion asa feed in the 10–25 wt% range.
Fig. 3b shows a similar dilution behavior for converting "-valerolactone as observed for methyl lactate. Also here an optimumexists in the conversion capacity, though it should be noted thatthe optimum is at a lower wt%, namely around 5–10. In the caseof glycerol (Fig. 3c) the experiments revealed an optimum around2.5–5 wt% and high concentrations (above 50 wt%) deactivate thecatalyst so rapidly that we chose not to react pure glycerol underthese reaction conditions. Glycerol has a very low effective H/Cratio of 0.67 which correlates well with the low optimum level ofaddition and the rapid deactivation seen in Table 1. Furthermore,glycerol forms only modest amounts of CO and CO2 which supportthe fact that it is one of the most unwanted molecules to co-convertwith methanol from a catalyst lifetime perspective.
For acetic acid a somewhat different trend is revealed. Increasingamounts of acetic acid in the feed results in a larger amount of CO2
which can be explained by increased tendency towards ketoniza-tion forming acetone and CO2 [28]. The conversion capacity of aceticacid thus increases with the concentration correlating with the factthat acetone does not induce massive deactivation (see Table 1).However, very early breakthrough of methyl acetate and acetic acidin the 25 wt% experiment complicates the quantitative interpreta-
73

Please cite this article in press as: U.V. Mentzel, M.S. Holm, Appl. Catal. A: Gen. (2011), doi:10.1016/j.apcata.2011.01.040
ARTICLE IN PRESSG Model
APCATA-13016; No. of Pages 9
U.V. Mentzel, M.S. Holm / Applied Catalysis A: General xxx (2011) xxx–xxx 5
Fig. 3. Conversion capacities plotted at different wt% of additive in the feed. (a) Methyl lactate, (b) "-valerolactone, (c) glycerol and (d) acetic acid. Error bars represent ±2standard deviations. Note the different scales below the break (T = 370 #C, P = 1 bar, 300 mg H-ZSM-5, WHSV = 8 h"1).
tion and presumably a higher reaction temperature is required toreach a satisfactory conversion level. Acetic acid and methyl acetateappears alongside methanol and DME in the 10 wt% experiment.
3.3. Product distribution
Not only the conversion capacity but also changes in prod-uct selectivity are crucial when co-feeding various compounds. Ifthe deoxygenation proceeds through dehydration and not throughdecarboxylation and decarbonylation the reaction will inevitablyproduce a more hydrogen deficient hydrocarbon product mixture.This point is rather important since it has previously been arguedthat the high aromatic content in MTH derived gasoline limits itsimplementation [50,51]. Table 2 lists the initial product selectivi-ties as a function of increasing oxygenate addition. We note thatreacting small amounts of additive leads to very similar prod-uct compositions as observed for pure methanol. However, withincreasing amounts of additive a rise in the abundance of aro-matics (mainly benzene, toluene, xylenes and tri-methylbenzenes)is observed at the cost of the C4+ aliphatic products while nooxygenated aromatic products are detected. This high selectivitytowards aromatics at low methanol contents in the feed is sup-ported by a recent report on direct conversion of glycerol overH-ZSM-5, where aromatics are produced in large amounts [25]. Fur-ther from Table 2 it is clear that the increasing selectivity towardsaromatics comes alongside a decreasing C4-HTI. The low C4-HTIcould be explained by the possibility of arene production without
the necessity of co-production of alkanes due to the low effectiveH/C ratio of the reaction mixture. It should be noted that in thehigh concentration experiments (with run times below one hour)the C4-HTI decreases rapidly with time-on-stream as deactivationis very pronounced.
With respect to the formation of CO and CO2 in the experi-ments concerning conversion of glycerol and acetic acid presentedin Table 2, high concentration of the additive leads to the pro-duction of more CO and CO2 pr. mole of additive. This indicatesthat the decarboxylation/decarbonylation routes are favored at lowmethanol contents, which is in good correlation with a previousreport [35]. This is also observed for low concentrations of methyllactate and "-valerolactone which indicate that this is a more gen-eral trend. Even though the amount of CO and CO2 produced pr.mole of additive increases at higher concentrations, this is notenough to offset the very low H/Ceff ratio at these feed composi-tions, and the hydrocarbon product mixture is thus very rich inaromatics.
3.4. Isotopic labeling
When CO or CO2 is formed, some carbon atoms are lost and donot enter the hydrocarbon products. The analysis of the productstream for CO and CO2 gives an indication of what is occurring butnot whether the carbon atoms present in the additive do in fact endup in conventional gasoline products. In order to investigate thisissue in detail 13C labeled additives or 13C labeled methanol was
74

Please cite this article in press as: U.V. Mentzel, M.S. Holm, Appl. Catal. A: Gen. (2011), doi:10.1016/j.apcata.2011.01.040
ARTICLE IN PRESSG Model
APCATA-13016; No. of Pages 9
6 U.V. Mentzel, M.S. Holm / Applied Catalysis A: General xxx (2011) xxx–xxx
Table 2
Initial selectivity, C4-HTI, and CO/CO2 production from conversion of different concentrations of various oxygenates in methanol (T = 370 #C, P = 1 bar, 300 mg H-ZSM-5,WHSV = 8 h"1).
Additive wt% Eff. H/C of feeda C4-HTIb COc CO2c C1–3
b C4b C5+
b (aliphatic) C6–10b (aromatic)
Methanol – 2 0.38 0% 0% 22% 28% 31% 19%Acetic acid 2.5% 1.95 0.34 0% 0% 24% 26% 28% 22%Acetic acid 5% 1.89 0.31 4% 4% 24% 24% 26% 26%Acetic acid 10% 1.79 0.27 5% 3% 21% 20% 23% 36%Acetic acid 25% 1.48 0.19 6% 9% 21% 12% 13% 53%Glycerol 1% 1.99 0.38 0% 0% 22% 27% 30% 21%Glycerol 2.5% 1.97 0.36 0% 0% 23% 27% 29% 21%Glycerol 5% 1.93 0.34 10% 0% 24% 26% 27% 23%Glycerol 10% 1.86 0.30 11% 0% 24% 23% 25% 28%Glycerol 25% 1.66 0.23 16% 2% 23% 20% 20% 37%Glycerol 50% 1.32 na.d 21% 3% 24% 15% 16% 45%Methyl lactate 2.5% 1.95 0.39 70% 0% 21% 26% 30% 23%Methyl lactate 10% 1.82 0.33 93% 0% 21% 25% 28% 26%Methyl lactate 17.5% 1.69 0.31 >95% 1% 23% 24% 26% 27%Methyl lactate 25% 1.56 0.27 >95% 1% 23% 22% 23% 32%Methyl lactate 50% 1.17 0.20 >95% 1% 25% 17% 17% 41%Methyl lactate 100% 0.50 na.d na.d na.d 26% 7% 6% 61%"-Valerolactone 2.5% 1.95 0.39 76% <2% 24% 27% 28% 21%"-Valerolactone 5% 1.91 0.38 78% 6% 22% 27% 29% 22%"-Valerolactone 10% 1.82 0.32 78% 7% 22% 26% 28% 24%"-Valerolactone 25% 1.58 0.27 73% 9% 23% 23% 25% 29%"-Valerolactone 50% 1.26 0.24 72% 11% 21% 20% 19% 40%"-Valerolactone 100% 0.80 na.d na.d na.d 17% 16% 15% 52%
aCalculated from the dehydrated H/C ratios, binitial, cmol/moladditive, dtoo rapid catalyst deactivation to obtain data.
employed and the 13C content in selected main products (butene,butane, pentane, pentene, toluene, xylene and trimethylbenzene)was analyzed in order to trace the carbon atoms from the additives.For labeling experiments we employed the additives investigatedin Table 2 and the compounds were reacted in a concentrationclose to the previously defined optimum. In the case of glyceroland acetic acid, the additives were 13C labeled whereas for methyllactate and "-valerolactone we used standard additives and 13Clabeled methanol. The experiments were conducted for %1 h cor-responding to less than 1/10 the total reaction time which makesthe data representative for the initial product selectivities given inTables 1 and 2. During this time span no change in the pattern of13C incorporation was observed.
Fig. 4 presents results from the labeling experiments for glyc-erol, methyl lactate, acetic acid, and "-valerolactone, respectively.Fig. 4a shows the 13C content in the products when reacting 5 wt%of 13C labeled glycerol in methanol. The dotted line representsthe 13C content in the feed. If all additive carbons were incorpo-rated and distributed evenly in the products, 5.05% 13C would beexpected in all products. Interestingly, we see that the aromaticproducts (toluene, xylene, and trimethylbenzene) actually containsignificantly more 13C than the average while the aliphatic prod-ucts contain less. It thus appears that the reaction path of glycerolfavors the formation of aromatics. Carbon atoms present in thearomatics will eventually equilibrate into the remaining productsthrough alkene dissociation as described in detail elsewhere [52].This observation is in good agreement with a recent report where anincreased affinity for aromatization is found for propanal comparedto propanol when reacted over HZSM-5 [21], and the authors pro-pose direct production of aromatics from propanal through a seriesof aldol condensation reactions and dehydrations. In the aliphaticcompounds, only a small difference exists between incorporationinto saturated and unsaturated compounds, but the longer pen-tane and pentene have a markedly lower content than their C4
analogues.Fig. 4b presents data from conversion of 25 wt% methyl lactate
in 13C labeled methanol. From Table 2 it can be seen that methyllactate splits off CO suggesting a loss of 1/4 of the carbon atoms orig-inally present in the molecule. The dotted lines in Fig. 4b represents
the average 13C content in the feed while the dashed line representthe expected 13C content if only 3 of the carbon atoms in methyllactate are incorporated into the hydrocarbon products. Note thatthe Y-axis shows the 12C content since 13C labeled methanol is usedinstead of labeled additive in this experiment. As for glycerol, it isobserved that the aromatic products contain more additive carboncompared to the aliphatic products and the C5 compounds con-tain less additive carbon than the C4 compounds. Further, the 12Ccontent of the individual products is located above and below the12C level for incorporation of 3 carbon atoms in correlation withthe fact that one carbon atom from methyl lactate is removed bydecarbonylation. At present we are unable to explain the lowerincorporation into pentane compared to butane but we note thatthis trend is also present in the other experiments, though to asmaller extent.
Fig. 4c shows data from the experiment co-reacting 10 wt% of13C labeled acetic acid in methanol. The pattern of 13C incorporationwith high levels in the aromatic compounds and less in the aliphaticis recognized. The total incorporation distributes below and abovethe 13C content of the feed which means that the vast majority ofeven the acid carbon from acetic acid is likely incorporated into thehydrocarbon products. This is somewhat surprising since transferof significant amounts of hydrogen to acetic acid (H/C effective = 0)is required to produce these products. The aliphatic 13C incorpora-tion is somewhat inconsistent with the other experiments whichcan partly be explained by the reaction path of acetic acid describedelsewhere [9,28]. Acetic acid can form acetone and further iso-butene in sequence. However only a relatively low amount of CO2
which would be formed in the ketonization reaction (producingacetone and CO2) was detected but it could be enough to enrich iso-butene above the expected value. Finally in Fig. 4d "-valerolactonewas co-reacted with 13C methanol. The results are very similar towhat was observed when converting methyl lactate. Around 4/5of the carbon from the additive is incorporated into the products(predominantly into the aromatics) which corresponds well withthe significant CO and CO2 formation observed.
From this type of GC–MS analysis it is not possible to analyzethe 13C content in the myriad of products formed in the reaction inorder to calculate an average 13C content in the gasoline product.
75

Please cite this article in press as: U.V. Mentzel, M.S. Holm, Appl. Catal. A: Gen. (2011), doi:10.1016/j.apcata.2011.01.040
ARTICLE IN PRESSG Model
APCATA-13016; No. of Pages 9
U.V. Mentzel, M.S. Holm / Applied Catalysis A: General xxx (2011) xxx–xxx 7
Fig. 4. 13C and 12C content observed in typical main products of MTH. In the case of (a) 5 wt% glycerol and (c) 10 wt% acetic acid 13C labeled additives in unlabeled methanolwere used. In the case of (b) 25 wt% methyl lactate and (d) 10 wt% "-valerolactone 13C methanol was used. The dotted lines correspond to the 13C content in the feed whilethe dashed lines in (b) and (d) correspond to incorporation of all additive carbon after dissociation of 1 mol of CO or CO2 (T = 370 #C, P = 1 bar, 300 mg H-ZSM-5, WHSV = 8 h"1).
However, based on the detected levels of CO and CO2 as well as thepresented data on 13C incorporation it seems likely that the major-ity of the carbon present in the additive, which do not form CO orCO2, does indeed end up in the hydrocarbon products. Presumablythe different additives have individual reaction paths highly depen-dent on the specific concentration and we are only able to observethe composition after some equilibration (by cracking, isomeriza-tion, oligomerization, etc.) over the full catalyst bed has occurred.To address the enrichment of additive carbon in the aromatic prod-ucts we repeated the experiment with 13C labeled acetic acid withlower amounts of catalyst in order to suppress secondary reactions.The results are given in Fig. 5 and in all cases >99% conversion ofmethanol/DME and acetic acid was observed.
Fig. 5 reveals that as less catalyst is used, a pronounced decreasein the 13C carbon % of the aliphatics is observed while the content isrelatively unchanged in the aromatics products. It is also clear thatless additive carbon is present in the saturated aliphatics comparedto the corresponding olefins. These results support a reaction pathwhere aliphatic products are not formed directly from acetic acid.
Over an active catalyst the initially formed aromatic compoundswill subsequently split off alkenes which through hydrogen trans-fer reactions can produce alkanes and thus distribute the additivecarbon into all products.
3.5. Temperature programmed oxidation (TPO)
A catalyst deactivated in methanol conversion is able to catalyzethe methanol-DME equilibrium yielding predominantly DME fornumerous hours after hydrocarbons are no longer formed in sig-nificant amounts. In the case of 10 wt% of "-valerolactone, methyllactate, and glycerol in methanol the DME formation decreasesrapidly after deactivation whereas DME is continually produced forconversion of acetic acid in methanol. Surprisingly, deactivatingthe catalyst with 10 wt% of anisole which shows the lowest con-version capacity of all the additives (see Table 1) does however notstop the production of DME. To investigate this observation, TPOon the catalysts used in the concentration series (from Table 2) aswell as on selected catalysts from Table 1 was performed in order
76

Please cite this article in press as: U.V. Mentzel, M.S. Holm, Appl. Catal. A: Gen. (2011), doi:10.1016/j.apcata.2011.01.040
ARTICLE IN PRESSG Model
APCATA-13016; No. of Pages 9
8 U.V. Mentzel, M.S. Holm / Applied Catalysis A: General xxx (2011) xxx–xxx
Fig. 5. 13C content in selected products from conversion of 10% 13C labeled aceticacid in methanol over 300 mg (WHSV = 8 h"1), 100 mg (WHSV = 24 h"1), or 33 mg(WHSV = 72 h"1) of catalyst (T = 370 #C, P = 1 bar).
to determine the amount of coke present on the catalyst at fulldeactivation.
Bilbao and co-workers have done thorough coke analyses forconversion of bio-oil diluted in methanol over H-ZSM-5 andreported a distinction between thermal and catalytic coke. Thethermal coke which has a higher H/C ratio was attributed to bio-oiland could be combusted at a lower temperature compared to cokefrom a conventional methanol experiment [18,34].
Fig. 6 shows the results from TPO experiments of the concen-tration series from Table 2 and it is clear that the total amount ofcoke deposited on the deactivated catalyst decreases as the wt%of additive is increased. We were however unable to correlate thecombustion temperature to specific types of coke on the catalystsbut merely note that a catalyst employed in the conversion of
methanol for less than an hour (the lifetime of experiments hav-ing &50 wt% of additive) contain very small amounts of coke (%1%)which underline that conversion of the hydrogen deficient addi-tives from Table 1 results in excessive coke formation. No cleartrend in levels of coke deposition was observed from the exper-iments in Table 1 where most catalysts contained approximately10 wt% carbon although catalysts from conversion of 10 wt% anisoleor dimethoxybenzene contained slightly less (%8 wt%).
4. Conclusions
We have investigated the co-conversion of various modelcompounds in methanol under MTH reaction conditions which rep-resents an alternative strategy to simply using “green” additives toconventional gasoline. The effective H/C ratio has previously beenused as an indicator of whether an oxygenate would lead to rapiddeactivation and we confirm the overall tendency of pronounceddeactivation for conversion of compounds with low effective H/Cratios. However, the catalytic data also shows that structuralisomers can indeed perform very differently with respect to con-version capacity and selectivity. Molecules capable of dissociatingCO2 or CO generally experience higher conversion capacities high-lighting that consideration of the specific functionalities presentin the additive is crucial in order to understand the reactivity.Converting the pure compounds leads to very short lifetimesof the zeolite catalyst and depending on the molecule an opti-mal dilution in methanol can result in up to 10 times higherconversion capacities of the additive before deactivation of thecatalyst.
Experiments using 13C labeling show that the carbon atoms fromthe additives are distributed into the hydrocarbon products with ahigh affinity for the aromatics. We can thus rule out that the addi-tive carbon ends up in single “dead end” hydrocarbons or form newunconvertible oxygenates.
The results presented here give new understanding of the reac-tivity of different oxygenates when converted to hydrocarbons overH-ZSM-5, and might help pave the road for development of newprocesses for conversion of biomass to hydrocarbon-based fuelsand chemicals.
Fig. 6. Data obtained from TPO experiments presenting the amount of carbon deposited on the fully deactivated catalysts upon conversion of different concentrations ofadditive in methanol. (a) Methyl lactate, (b) "-valerolactone, and (c) glycerol (T = 370 #C, P = 1 bar, 300 mg H-ZSM-5, WHSV = 8 h"1).
77

Please cite this article in press as: U.V. Mentzel, M.S. Holm, Appl. Catal. A: Gen. (2011), doi:10.1016/j.apcata.2011.01.040
ARTICLE IN PRESSG Model
APCATA-13016; No. of Pages 9
U.V. Mentzel, M.S. Holm / Applied Catalysis A: General xxx (2011) xxx–xxx 9
Acknowledgements
The Center for Sustainable and Green Chemistry is sponsored bythe Danish National Research Foundation.
Appendix A. Supplementary data
Supplementary data associated with this article can be found, inthe online version, at doi:10.1016/j.apcata.2011.01.040.
References
[1] G.W. Huber, S. Iborra, A. Corma, Chem. Rev. 106 (2006) 4044–4098.[2] J.R. Regalbuto, Science 325 (2009) 822–824.[3] A. Demirbas, Energy Convers. Manage. 50 (2009) 2239–2249.[4] A.V. Bridgewater, M.L. Cottam, Energy Fuels 6 (1992) 113–120.[5] S. Czernik, A.V. Bridgwater, Energy Fuels 18 (2004) 590–598.[6] D. Mohan, C.U. Pittman, P.H. Steele, Energy Fuels 20 (2006) 848–889.[7] R. French, S. Czernik, Fuel Process. Technol. 91 (2010) 25–32.[8] M. Stöcker, Microporous Mesoporous Mater. 29 (1999) 3–48.[9] C.D. Chang, A.J. Silvestri, J. Catal. 47 (1977) 249–259.
[10] P.B. Weisz, W.O. Haag, P.G. Rodewald, Science 206 (1979) 57–58.[11] N.Y. Chen, T.F. Degan Jr., L.R. Koenig, Chemtech 16 (1986) 506–511.[12] P.D. Chantal, S. Kaliaguine, J.L. Grandmaison, A. Mahay, Appl. Catal. 10 (1984)
317–332.[13] P.A. Horne, P.T.J. Williams, Anal. Appl. Pyrolysis 34 (1995) 65–85.[14] J.D. Adjaye, N.N. Bakhshi, Fuel Process. Technol. 45 (1995) 185–202.[15] R.K. Sharma, N.N. Bakhshi, Fuel Process. Technol. 35 (1993) 201–218.[16] P.T. Williams, A.J.J. Brindle, Anal. Appl. Pyrolysis 67 (2003) 143–164.[17] T.P. Vispute, H. Zhang, A. Sanna, R. Xiao, G.W. Huber, Science 330 (2010)
1222–1227.[18] A.G. Gayubo, A.T. Aguayo, A. Atutxa, B. Valle, J.J. Bilbao, Chem. Technol. Biotech-
nol. 80 (2005) 1244–1251.[19] P.A. Horne, P.T. Williams, Renewable Energy 7 (1996) 131–144.[20] X. Zhu, R.G. Mallinson, D.E. Resasco, Appl. Catal. A 379 (2010) 172–181.[21] T.Q. Hoang, X. Zhu, T. Sooknoi, D.E. Resasco, R.G. Mallinson, J. Catal. 271 (2010)
201–208.[22] M.C. Samolada, A. Papafotica, I. Vasalos, Energy Fuels 14 (2000) 1161–1167.[23] P.D. Chantal, S. Kaliaguine, J.L. Grandmaison, Appl. Catal. 18 (1985) 133–145.[24] J.L. Grandmaison, P.D. Chantal, S.C. Kaliaguine, Fuel 69 (1990) 1058–1061.[25] T.Q. Hoang, X. Zhu, T. Danuthai, L.L. Lobban, D.E. Resasco, R.G. Mallinson, Energy
Fuels 24 (2010) 3804–3809.
[26] R.J. Evans, T. Milne, ACS Symp. Ser. 376 (1988) 311–327.[27] T.Q. Hoang, X. Zhu, L.L. Lobban, D.E. Resasco, R.G. Mallinson, Catal. Commun.
11 (2010) 977–981.[28] G.J. Hutchings, P. Johnston, D.F. Lee, A. Warwick, C.D. Williams, M. Wilkinson,
J. Catal. 147 (1994) 177–185.[29] A.G. Gayubo, A.T. Aguayo, A. Atutxa, R. Aguado, J. Bilbao, Ind. Eng. Chem. Res.
43 (2004) 2610–2618.[30] A.G. Gayubo, A.T. Aguayo, A. Atutxa, R. Aguado, M. Olazar, J. Bilbao, Ind. Eng.
Chem. Res. 43 (2004) 2619–2626.[31] J.D. Adjaye, N.N. Bakhshi, Biomass Bioenergy 8 (1995) 131–149.[32] L.H. Dao, M. Haniff, A. Houle, D. Lamothe, 193. National Meeting of the American
Chemical Society 32:2 (1987) 308–316.[33] R.K. Sharma, N.N. Bakhshi, Bioresour. Technol. 35 (1991) 57–66.[34] A.G. Gayubo, B. Valle, A.T. Aguayo, M. Olazar, J. Bilbao, Energy Fuels 23 (2009)
4129–4136.[35] A.G. Gayubo, B. Valle, A.T. Aguayo, M. Olazar, J. Bilbao, Ind. Eng. Chem. Res. 49
(2010) 123–131.[36] B. Valle, A.G. Gayubo, A. Alonso, A.T. Aguayo, J. Bilbao, Appl. Catal. B 100 (2010)
318–327.[37] A. Corma, G.W. Huber, L. Sauvanaud, P. O’Connor, J. Catal. 247 (2007) 307–327.[38] A. Corma, G.W. Huber, L. Sauvanaud, P. O’Connor, J. Catal. 257 (2008) 163–171.[39] I. Graca, F.R. Ribeiro, H.S. Cerqueira, Y.L. Lam, M.B.B. de Almeida, Appl. Catal. B
90 (2009) 556–563.[40] T.R. Carlson, T.P. Vispute, G.W. Huber, ChemSusChem 1 (2008) 397–400.[41] T.R. Carlson, G.A. Tompsett, W.C. Conner, G.W. Huber, Top. Catal. 52 (2009)
241–252.[42] T.R. Carlson, J. Jae, Y.-C. Lin, G.A. Tompsett, G.W. Huber, J. Catal. 270 (2010)
110–124.[43] M. Bjørgen, F. Joensen, M.S. Holm, U. Olsbye, K.-P. Lillerud, S. Svelle, Appl. Catal.
A 345 (2008) 43–50.[44] T.V.W. Janssens, J. Catal. 264 (2009) 130–137.[45] U.V. Mentzel, S. Shunmugavel, S.L. Hruby, C.H. Christensen, M.S. Holm, J. Am.
Chem. Soc. 131 (2009) 17009–17013.[46] H. Heeres, R. Handana, D. Chunai, C.B. Rasrendra, B. Girisuta, H.J. Heeres, Green
Chem. 11 (2009) 1247–1255.[47] H. Mehdi, V. Fabos, R. Tuba, A. Bodor, L.T. Mika, I.T. Horvath, Top. Catal. 48 (2008)
49–54.[48] B. Kartryniok, S. Paul, F. Dumeignil, Green Chem. 12 (2010) 1910–1913.[49] J.Q. Bond, D.M. Alonso, D. Wang, R.M. West, J.A. Dumesic, Science 327 (2010)
1110–1114.[50] J.F. Haw, D.M. Marcus, Top. Catal. 34 (2005) 41–48.[51] J.F. Haw, D.M. Marcus, Nanotechnology in Catalysis, vol. 1, Plenum Publishers,
New York, 2004, Chapter 13.[52] M. Bjørgen, S. Svelle, F. Joensen, J. Nerlov, S. Kolboe, F. Binino, L. Palumbo, S.
Bordiga, U. Olsbye, J. Catal. 249 (2007) 195–207.
78

Conversion of Oxygenates over Zeolite Catalysts: Structure-Activity Relations !
79 !
Part 3 2.9 Aim and idea preceding the studies within lactic acid formation
Numerous strategies are currently being investigated for upgrading of biomass. Zeolites have been tested in high temperature deoxygenation reactions for hydrocarbon formation as described in detail in part 2 of this thesis. We had the ambition to exploit the attractive characteristics of zeolite catalysts to synthesize commodity chemicals. The target molecules should not be deoxygenated, but instead selectively transformed. Therefore, lower temperatures, alternative active sites and liquid phase reactions were “on the table”. To serve as an inspiration was a report by the Sasaki group in Hiroshima, Japan from 2005 where they show that isomerization of triose sugars into methyl lactate occur in alcohol solutions. 1 C3-sugars are not readily available in nature but they represent an interesting class of compounds and can be produced by for example oxidation of glycerol with air.2 The Sasaki group showed that the reaction sequence was homogeneously catalyzed by various inorganic halide salts. Particularly, Sn (II) and Sn (IV) chloride proved superior while CrCl3 and AlCl3 were also active. The mechanism presented in Figure 2.1 was proposed.
Figure 2.1. Proposed mechanism for the tin halide catalyzed triose isomerization forming alkyl lactate from glycol aldehyde dimer. Figure from Ref. 1.
Of the C3-sugars, dihydroxy acetone (DHA) has the highest reactivity starting already at room temperature. This indicates that glyceraldehyde (GLA) needs to be converted through the aldose-ketose isomerization into DHA. Coordination of tin to the keto-oxygen and the terminal hydroxyl oxygen catalyzes the formation of the enediol. This isomerization incorporates a hydrogen atom from the solvent into the hydroxyl group on carbon 2. Dehydration could initially form enol-pyruvic aldehyde and then form pyruvic aldehyde by isomerization. This would effectively “land” the solvent hydrogen in the methyl group. This proposed mechanism is based on earlier reports which show that one hydrogen in the methyl group of lactic acid indeed originates from the solvent when the reaction starts from DHA. No incorporation was seen in a control experiment where pyruvic aldehyde was converted.3,4 Alcohol addition to pyruvic aldehyde and a tin catalyzed 1,2-hydride shift produces the stable alkyl lactate and releases the catalyst.
Interestingly, Esben Taarning (a colleague working on the project) recognized the final step of the sequence resembles an intramolecular Meerwein-Ponndorf-Verley Reduction and Oppenauer oxidation. This step involves the 1,2-hydride shift; scheme 2.1 illustrates a bi-molecular MPVO reaction in which a ketone is reduced and an alcohol correspondingly oxidized.

Conversion of Oxygenates over Zeolite Catalysts: Structure-Activity Relations !
80 !
Scheme 2.1. Schematic presentation of an Oppenauer oxidation of a secondary alcohol with acetone and the corresponding Meerwein-Ponndorf-Verley reduction.
This resemblance prompted us to search the literature for heterogeneous catalysts (zeolites) which had been used in MPVO type reactions. Indeed, several zeolite catalysts containing Lewis acidity were in fact reported to be active.5,6,7 The hypothesis that these zeolite/zeotype materials could be active for GLA/DHA conversion into lactic acid/alkyl lactate became the working hypothesis for the work presented in part 3.
Glycerol oxidation was mentioned above as a potential source of C3-sugars. Previously, it has been shown that retro aldol condensation of glucose and fructose can occur in (sub) super critical water forming C3 sugars, glycolaldehyde and eryhtrose as well as a number of different acids. 8 This prompted us to investigate whether the strong affinity for carbonyl functionalities of Sn-Beta could catalyze this fragmentation at elevated temperatures, thus converting hexose sugars directly into lactic acid derivatives.
!
!!!!!!!!!!!!!!!!!!!!!!!!!!!!!!!!!!!!!!!!!!!!!!!!!!!!!!!!!!!!!1 Y. Hayashi, Y. Sasaki, Chem. Commun., (2005), 2716-2718. 2 E. Taarning, A. T. Madsen, J. M. Marchetti, K. Egeblad, C. H. Christensen, GreenChem, 10, (2008), 408-414. 3 E. bang, J. Eriksen, L. Mønsted, O. Mønsted, Acta Chemica Scandinavia, 48, (1994), 12-19. 4 J. Eriksen, O. Mønsted, L. Mønsted, Transition. Met. Chem., 23, (1998), 783-787. 5 E. J. Creyghton, S. D. Ganeshie, R. S. Downing, H. van Bekkum, J. Mol. Catal. A., 115, (1997), 457-472. 6 A. Corma, M. E. Domine, L. Nemeth, S. Valencia, J. Am. Chem. Soc., 124, (2002), 3194-3195. 7 Y. Zhu, G-K. Chuah, S. Jaenicke., J. Catal, 241, (2006), 25-33. 8 M. Sasaki, K. Goto, K. Tajima, T. Adschiri, K. Arai, GreenChem., 4, (2002), 285-287.

Zeolite H-USY for the production of lactic acid and methyl lactate from C3-sugars
Ryan M. West a, Martin Spangsberg Holmb, Shunmugavel Saravanamurugan b, Jianmin Xiong b,Zachary Beversdorf c, Esben Taarning d,*, Claus Hviid Christensen d
aUniversity of Wisconsin-Madison, Department of Chemical and Biological Engineering, Madison, WI 53706, USAbCenter for Sustainable and Green Chemistry, Department of Chemistry, Technical University of Denmark, DK-2800 Lyngby, Denmarkc Iowa State University, Department of Chemical and Biological Engineering, Ames, IA 50011, USAdHaldor Topsøe A/S, Nymøllevej 55, DK-2800, Denmark
a r t i c l e i n f o
Article history:
Received 4 June 2009Revised 21 October 2009
Accepted 24 October 2009Available online 25 November 2009
Keywords:
Lactic acidMethyl lactateH-USYZeoliteDihydroxyacetoneGlyceraldehydeTriose sugar
DeactivationBiomass
a b s t r a c t
Lactic acid is an interesting platform chemical with many promising applications. This includes the use asa building block for the production of biodegradable plastics and environmentally friendly solvents. Astudy of the liquid-phase conversion of the triose-sugars, glyceraldehyde and dihydroxyacetone directlyto methyl lactate and lactic acid catalyzed by inexpensive commercially available zeolites is presented.One particular zeolite, H-USY (Si/Al = 6) is shown to be quite active with near quantitative yields for thisisomerization. Deactivation of the H-USY-zeolite was studied by correlating the catalytic activity to dataobtained by TPO, XRD, N2-sorption, and NH3-TPD on fresh and used catalysts. Coking and irreversibleframework damage occurs when lactic acid is produced under aqueous conditions. In methanol, methyllactate is produced and catalyst deactivation is suppressed. Additionally, reaction rates for the formationof methyl lactate in methanol are almost an order of magnitude higher as compared to the rate of lacticacid formation in water.
! 2009 Elsevier Inc. All rights reserved.
1. Introduction
Lactic acid is currently emerging as a building block in a newgeneration of materials such as biodegradable plastics and solvents[1–3]. These new materials can be produced from biomass-derivedprecursors and have the potential to replace existing petroleum-based materials by displaying comparable and even superior prop-erties [4]. Lactic acid also has the potential to become a centralchemical feedstock for the chemical industry in the production ofacrylic acid, propylene glycol, and different useful condensationproducts [5–8].
However despite its high potential, the major obstacle in awider implementation of lactic acid-based materials and a lacticacid platform in the chemical industry is the high cost associatedwith the expensive and cumbersome manufacturing route of lacticacid. The large-scale production of lactic acid relies on the batch-wise fermentation of aqueous glucose under anaerobic conditions[9,10]. The fermentation reaction typically takes 2–4 days and re-quires calcium hydroxide to be added continuously to maintain aneutral pH-level in order for the bacteria to function optimally,thereby resulting in the formation of calcium lactate. Crystalliza-
tion of calcium lactate, followed by acidification with sulfuric acidreleases the crude lactic acid and gypsum. Typically, one ton ofgypsum is formed for every ton of lactic acid produced [1]. Furtherpurification of lactic acid is done by esterification to methyl lactatefollowed by distillation and hydrolysis to release pure lactic acid.
Lactic acid is an isomer of the triose sugars dihydroxyacetone(DHA) and glyceraldehyde (GLA). The relative stability of the threeisomers are in the order of lactic acid! DHA > GLA. The triosesugars can be formed by aerobic oxidation of glycerol usingboth homogeneous and heterogeneous catalysts [11–14] or byfermentation of glycerol using the Gluconobactor suboxydans strain[15–18].
Homogeneous catalysts such as sulfuric acid and sodiumhydroxide are known to catalyze the isomerization of DHA andGLA in very hot water (250–300 "C) to give low yields of lactic acid[19,20]. A more effective isomerization catalyst is zinc sulfate,which is reported to give a 75–86% yield of lactic acid in 300 "Chot water [21]. However, the use of a homogeneous isomerizationcatalyst is problematic from an environmental point of view andthe purification of lactic acid can be problematic. Furthermore,the use of very hot water as the reaction media requires expensivepressure resistant equipment which will make a large-scaleprocess unattractive. Homogeneous metal chlorides are active inthis isomerization–esterification reaction. In particular, tin
0021-9517/$ - see front matter ! 2009 Elsevier Inc. All rights reserved.doi:10.1016/j.jcat.2009.10.023
* Corresponding author.E-mail address: [email protected] (E. Taarning).
Journal of Catalysis 269 (2010) 122–130
Contents lists available at ScienceDirect
Journal of Catalysis
journal homepage: www.elsevier .com/locate / jcat
81

chloride has been found to be able to form methyl lactate in a high89% yield [22]. However, a high catalytic amount (10 mol%) of tinchloride is used in this case.
Currently, very limited work has been done using acidic zeolitesfor the conversion of biomass to value added chemicals. Acidic zeo-lites have been demonstrated to catalyze the conversion of DHA inethanol to form ethyl lactate, although in a moderate 65% yield[23]. Very recently Lewis acidic beta zeolites were shown to behighly active in the isomerization reaction of DHA and GLA withexcellent selectivity toward methyl lactate/lactic acid [24]. Thesehydrophobic zeolites were made by incorporating Ti, Zr, and Sninto the framework. In particular the Sn-Beta zeolite appears tobe an exceptionally promising catalyst in the DHA/GLA conversion.However, application may be limited due to long synthesis timeand to the use of tin. Thus an investigation using commerciallyavailable solid acids, mainly zeolites containing only silicon andaluminum and sulfated zirconia was undertaken in batch reactors.The most promising of these catalysts, the proton form of an ultrastable Y-zeolite with a Si/Al = 6 (H-USY-6) showed very good activ-ity with near quantitative yields at appropriate conditions. Thiszeolite was tested under continuous flow within a plug flow reac-tor to determine the kinetics of the isomerization network and tostudy the deactivation of the system. A discussion of the catalyticbehavior is coupled to the results from XRD, NH3-TPD, N2-sorption,FT-IR, and TPO of the fresh and spent zeolite.
2. Experimental
2.1. Chemicals
Dihydroxyacetone (97%), pyruvic aldehyde dimethyl acetal(PADA) (97%), glyceraldehyde (95%), anhydrous pyridine (99.8%),and methanol (99.9%) were purchased from Sigma-Aldrich. Methyllactate (97%) was obtained from Fluka. Pyruvic aldehyde (PA) wasobtained from SAFC Supply as a 40 wt.% aqueous solution whilelactic acid was obtained from Fluka and Riedel-de Haën. All thecommercially available zeolites used throughout this study werekindly provided by Zeolyst International. The zeolites are pureand do not contain any binder material. Some of the zeolites werereceived in the NH4-form. In these cases the zeolites were calcinedat 550 "C in air for 6 h prior to use in order to produce the acidicform.
2.2. Catalytic tests
Batch experiments were performed in an Ace pressure tubewith magnetic stirring. In these runs, 80 mg of catalyst, 1.25 mmolof substrate (calculated as monomer), and 4 g of water or methanolwere added and mixed in the pressure tube using magnetic stirrerring. The ace pressure tube was then dipped into an oil bath havinga temperature of 140 "C for experiments with water and 120 "C forexperiments with methanol. The internal temperature during reac-tion as recorded with an internal thermocouple was 125 "C and115 "C, respectively.
In the flow reactor set-up, the feed was introduced into the sys-tem by either a Waters 501 HPLC pump, or by a Knauer K-120 HPLCpump. The catalyst was held in place in a stainless steel reactortube by quartz wool on both sides of the catalyst. The reactor tubewas heated by a Carbolite oven while a type E thermocouple at-tached to the external surface of the reactor tube was used to mon-itor the reactor temperature. The effluent was collected in astainless steel collector tube. The system was pressurized to20 bar of pressure with Argon before each run. Feeds were createdby placing a measured amount of substrate in a volumetric flaskand filling to the set volume. For concentrated solutions, the mix-
tures were heated to 69 "C under stirring for 1–2 h to help dissolvethe substrate.
Effluent concentrations for batch and flow experiments werecharacterized by an Agilent 1200 Series HPLC with an R.I. detectorand a Biorad Aminex HPX-87H column and an Agilent 6890N GCwith an HP-5column and an FID detector. Species were quantifiedwith standards and confirmed with GC-MS, Agilent 6850 GC sys-tem coupled with Agilent 5975 C MSD.
2.3. Zeolite characterization
The degree of carbon deposition on used catalysts was deter-mined using temperature-programed oxidation (TPO). Prior toanalysis the used zeolites were dried at 110 "C. The TPO was car-ried out by heating a premeasured amount of used catalyst to650 "C at 3.5 "C min"1 in a gas flow of 20 mL min"1 consisting of5% oxygen in helium. The release of CO and CO2 was quantifiedusing a BINOS detector. The TPO data are shown in Table 4 as theweight percent of carbon present on the coked catalyst.
NH3-TPD, N2-sorption, and XRD were performed on calcinedcatalyst samples. The procedures used were either as describedfor the TPO or calcination at 550 "C for 4 h in static air, heated ata ramp of #2 "C/min. Nitrogen physisorption was measured on aMicromeretics ASAP 2020 after the samples had been degassedin vacuum at 300 "C for 2 h.
Powder X-ray diffraction (XRD) patterns were recorded on aBruker AXS powder diffractometer. The XRD data are shown in Ta-ble 4 as a relative crystallinity, calculated by integrating the peakarea of eight characteristic reflections and comparing to the un-used zeolite. The reflections used along with the respective 2h val-ues given in parenthesis were 331 (15.97), 511 (19.01), 440(20.71), 533 (24.06), 642 (27.52), 822 (31.29), 555 (31.95), and664 (34.69) [25].
NH3-TPD measurements were performed on a MicromeriticsAutochem II equipped with a TCD detector. Dry weights of thesamples were found after evacuation at 300 "C for 1 h. After satu-ration with ammonia, the weakly bound ammonia was desorbedprior to measurement at 150 "C for 1 h in a He flow of 25 mL min"1.The desorption curve was then attained at a heating ramp of 15 "Cper minute to 550 "C at a He flow rate of 25 mL min"1.
FT-IR operated in transmission mode was used to analyze thezeolites on a BioRad FTS 80 spectrometer equipped with a MCTdetector. Self-supporting wafers of the zeolites were pressed andwere prior to analysis dehydrated under evacuation at 400 "C for4 h. The absorbance spectra were obtained after the samples wereallowed to cool to RT. Pyridine adsorption was done by saturatingthe zeolite at RT and subsequently heating the sample to 200 "C for30 min under evacuation. The sample was once again allowed tocool to RT before the spectrum was recorded.
3. Results and discussion
3.1. Reaction pathway
We have investigated the isomerization of the two three-carbonsugars dihydroxyacetone (DHA) and glyceraldehyde (GLA) intomethyl lactate and lactic acid over an acidic zeolite catalyst. Whenthe solvent used is methanol, the resulting product becomesmethyl lactate and if water is used, lactic acid is formed. Scheme1 gives the proposed reaction path of the isomerization reactionin either alcohol or water [22–24]. Pyruvaldehyde (PA) is believedto be an initial product formed by the dehydration of DHA/GLA.After addition of water/methanol the resulting hydrate/hemiacetalcan isomerize into lactic acid/methyl lactate (path A). The reaction
R.M. West et al. / Journal of Catalysis 269 (2010) 122–130 123
82

path in Scheme 1 will be discussed in detail along with the presen-tation of the experimental findings.
Product formation in a typical batch experiment was monitoredas a function of reaction time. Concentration profiles, based on the
carbon balance of the initial triose sugars, are shown in Figs. 1 and2 for the H-USY-6 zeolite. Fig. 1a and b shows the reaction profilesfor DHA and GLA, respectively, in methanol while Fig. 2a and b
HO O
HO OH
O OR
OR
OR
OH
O
O O
OR
OH
OH
O
GLA
DHA
+ROH
-H2O
+ROH
-ROH
-ROH
O
+H2O
-H2O
A
B
Scheme 1. Reactive pathways of DHA/GLA to lactate/lactic acid (path A) or hydrated/methylated pyruvic aldehyde derivates (path B), in methanol, (R = CH3) and water(R = H).
0 1 2 3 20 21
0
20
40
60
80
100
Ca
rbo
n B
ala
nce
(%
)
Time (Hours)
DHA GLA PA LacticAcid Other
0 1 2 3 4 5 6 22 23
0
20
40
60
80
100
Ca
rbo
n B
ala
nce
(%
)
Time (Hours)
DHA GLA PA Lactic Acid Other
a
b
Fig. 2. Batch concentration profiles for DHA and GLA in water. Other includespyruvic acid, formic acid, acetic acid, levulinic acid, and acetol. (a) 1.25 mmol DHAin 4.0 g water at 125 "C with 80 mg H-USY-6 catalyst; and (b) 1.25 mmol GLA in4.0 g water at 125 "C with 80 mg H-USY-6 catalyst.
0 2 4 6 8 24 25
0
20
40
60
80
100
Ca
rbo
n B
ala
nce
(%
)
Time (Hours)
DHA GLA PADA Methyl Lactate Other
0 2 4 6 8 24 36 48
0
20
40
60
80
100
Ca
rbo
n B
ala
nce
(%
)
Time (Hours)
DHA GLA PADA Methyl Lactate Other
a
b
Fig. 1. Batch concentration profiles for DHA and GLA in methanol. Other includesPyruvic Acid PA, MMP, and TMO. (a) 1.25 mmol DHA in 4.0 g methanol at 115 "Cwith 80 mg H-USY-6 catalyst; and (b) 1.25 mmol GLA in 4.0 g methanol at 115 "Cwith 80 mg H-USY-6 catalyst.
124 R.M. West et al. / Journal of Catalysis 269 (2010) 122–130
83

shows the profiles in water. The yields of methyl lactate/lactic acidfor a variety of solid acids are summarized in Table 1 and are sim-ply the end data point of the individual experiments.
Both GLA and DHA are observed when either substrate is usedas a starting reagent as can be seen from Figs. 1a,b and 2a,b. Theseobservations indicate that isomerization between these two sugarsoccurs and PA is formed as an intermediary product, in accordancewith previous reports [26–28]. DHA reacts more quickly thandoes GLA. In water (Fig. 2b), it is noted that GLA first isomerizesto DHA and the DHA then appears to react. Starting form GLA,the reaction network appears to be dominated by the isomeriza-tion and dehydration over the first 6 h. After 6 h, the system ap-proaches the final distribution seen at 22 h. When DHA is insteadused as a starting reagent, the final distribution is reached in lessthan 1 h.
The presence of PA as an intermediate can also be seen in Fig. 2.The concentration of PA is observed to be highest at very shortreaction times for both DHA and GLA, thus supporting the hypoth-esis that PA is an initial intermediate. Addition of either water ormethanol forms either hydrated PA or the methyl hemiacetal ofPA (PAMA), respectively, both of which can undergo a 1,2-hydrideshift and isomerize into lactic acid or methyl lactate (Scheme 1,path A), respectively. The hydrated form of PA can react with anadditional water molecule to form the di-hydrated form of PA. Itis noted that in water, pyruvaldehyde exists in three forms; alde-hyde, hydrated, and di-hydrated with a typical distribution oftrace, 56% and 44%, respectively [29]. In the analytical methodsused in this study, it was not possible to distinguish these threespecies, but all are expected to be present. Additionally, the degra-dation products seen in water consisted of known PA degradationproducts as seen in commercial sources of pyruvaldehyde, namelypyruvic acid, acetol, and formaldehyde [30].
The same is not true for the methanol case. The PAMA was ob-served directly as an intermediate species and it can react with an-other molecule of methanol to form pyruvaldehyde dimethylacetal(PADA), (Scheme 1, path B). PADA has additionally been observedto react further in very small amounts to the methylated formTMP (1,1,2,2-tetramethoxy propane) at low to intermediate con-versions. At full conversion, however, PADA, TMP, and PAMA areconverted into methyl lactate (Fig. 1) suggesting the back reactionshown in Scheme 1.
3.2. Screening of commercial zeolites
A series of different commercially available zeolites were inves-tigated in the isomerization of the trioses into lactic acid or methyllactate. Table 1 provides an overview of the yields observed inbatch experiments for both GLA and DHA in water and methanol.From Table 1 we conclude that very similar selectivity toward lac-tic acid/methyl lactate is obtained using either DHA or GLA as thesubstrate, with only H-beta and sulphated zirconia showing a sig-nificant but reproducible selectivity difference with methanol asthe solvent.
It is clear from Table 1 that the most effective catalysts for thisisomerization–esterification reaction are the proton form of thehighly acidic ultra stable Y-zeolite with a Si/Al ratio of 6 (H-USY-6). Indeed, the H-USY-6 zeolite affords methyl lactate yields higherthan 95% within the 24 h reaction time which is comparable to themost selective catalysts reported so far in the literature [21–24]. Inthe absence of a catalyst, DHA and GLA are not converted intomethyl lactate/lactic acid in any significant degree. The triosesare stable in pure methanol, but degrade readily in water to forma product mixture consisting of carbonaceous products along withpyruvic aldehyde and some lactic acid. The H-beta zeolite givesmoderate yields (DHA 42%/GLA 62%) of methyl lactate, whereasthe best H-ZSM-5 catalyst affords only a low yield (<20%) of methyllactate. In general as the Si/Al ratios are lowered (higher acid den-sity) a higher triose conversion and moderately higher selectivityfor methyl lactate is achieved. In a previous work zeolite betawas tested in the isomerization of DHA/GLA to methyl lactate/lac-tic acid. It was shown that dealumination of zeolite beta by steam-ing increased the yields of methyl lactate/lactic acid relative to thenon-dealuminated catalyst thus indicating that the presence of ex-tra framework aluminum was beneficial for the reaction. However,other factors such as, the effective diffusion rates, acid densities aswell as acid strength could also have important roles in determin-ing the activity of the various zeolite structures.
3.3. Characterization by FT-IR
Due to the very large difference in the yield of methyl lactate ofthe two H-USY samples (98% and 25%, from Table 1) we chose toinvestigate these two samples by FT-IR using pyridine as a molec-
Table 1
Yields obtained from DHA/GLA conversion to lactic acid and methyl lactate over commercial catalysts; 80 mg catalyst, 1.25 mmol substrate (calculated as monomer), 4 g solvent(water or methanol), reaction time 24 h (DHA) or 48 h (GLA), temperature 115 "C (methanol) or 125 "C (water).
Zeolite Si/Al Substrate Water solvent Methanol solvent
Yield of lactic acid (%) Substrate conversion (%) Yield of methyl lactate (%) Substrate conversion (%)
H-USY-6 6 DHA 71 >99 96 99GLA 63 >99 98 >99
H-USY-30 30 DHA 47 >99 26 79GLA 41 >99 25 64
H-beta 12.5 DHA 63 >99 42 88GLA 60 >99 63 90
19 DHA 37 >99 19 79
GLA 37 >99 8 64H-ZSM-5 11.5 DHA 32 >99 17 76
GLA 30 >99 19 7325 DHA 22 >99 7 61
GLA 23 >99 7 59H-MOR 10 DHA 39 >99 8 74
GLA 32 >99 10 28H-montmorillonite – DHA 46 >99 29 44
GLA 44 >99 30 43Sulphated zirconia – DHA 39 >99 17 96
GLA 41 >99 37 91No catalyst – DHA 5 >99 0 <0.1
GLA 4 >99 0 <0.1
R.M. West et al. / Journal of Catalysis 269 (2010) 122–130 125
84

ular probe while combined the results with acidity measurementsfrom NH3-TPD. The dehydrated spectra of the two samples (notshown) reveal the high frequency bridging hydroxyl (HF(OH)) lo-cated within the supercage of the zeolite at 3632 cm"1, and thelow frequency bridging hydroxyl (LF(OH)) present in the sodalitecage at 3566 cm"1 [31]. In addition, contributions at 3602 cm"1,3526 cm"1, and 3674 cm"1 are seen in the case of the H-USY-6sample. The two former bands located at 3602 cm"1 (HF’(OH))and 3526 cm"1 (LF’(OH)) have been reported to occur due to per-turbation by extra framework silicoaluminous debris formed upondealumination of zeolite Y [32,33]. Further, the 3674 cm"1 band issaid to arise from hydroxyl groups linked to extra framework alu-minum (EFAL) species [33]. From pyridine adsorption we were ableto differentiate between Lewis and Brønsted acidity while the NH3-TPD provided a measure of the total acidity. Fig. 3 presents the dif-ference spectra of the pyridine saturated samples after evacuationat 200 cm"1 C for 30 min. The relative Brønsted and Lewis acidityratio could be obtained from integrating the areas under the bandsat 1545 cm"1 (pyridinium ion) and 1455 cm"1 (pyridine) whiletaking the extinction coefficients into account [34,35]. Using valuesof eBrønsted = 1.67 and eLewis = 2.22 as reported in Ref. [35], we ob-tained values of B/L ratio of 1.8 for H-USY-6 and 5.6 for the H-USY-30 zeolite. From NH3-TPD we found that the total acidity ofthe H-USY-6 and H-USY-30 samples was 563 lmol/gzeolite and199 lmol/gzeolite, respectively. Interestingly, these results showthat a large fraction of the acidity of the H-USY-6 zeolite actuallyconsists of Lewis acidic sites. Also the total number of Lewis acidsites per gram of zeolite is much larger for H-USY-6 as comparedto the H-USY-30 zeolite (#200 lmol/gzeolite and #30 lmol/gzeolite,respectively). These findings are in agreement with an earlier re-port showing that a purely Lewis acidic zeolite beta is highly activefor the formation of methyl lactate from triose sugars [24] and theysupport the hypothesis that the Brønsted and Lewis acidic sites cancatalyze two different reaction paths, with only the Lewis acidicsites leading to the formation of lactic acid/methyl lactate in appre-ciable amounts from DHA/GLA.
3.4. Flow experiments
The high yields obtained when using the H-USY-6 zeolite as cat-alyst merited further study in continuous flow mode. The stabilityof the H-USY-6 catalyst at high conversion in water and in metha-nol was investigated for approximately 45 h on stream. Reaction
Fig. 3. IR difference spectra after pyridine saturation and subsequent evacuation at 200 "C for 30 min: (a) H-USY-6; and (b) H-USY-30.
0 5 10 15 20 25 30 35 40 45
0
5
10
15
60
70
80
90
100
Carb
on B
ala
nce
(%
)
Time on Stream (Hours)
DHA GLA PA LacticAcid Other
0 10 20 30 40 50
0
5
10
15
60
70
80
90
100
Carb
on B
ala
nce
(%
)
Time on Stream (Hours)
DHA GLA PADA MethylLactate Other
a
b
Fig. 4. Concentration profiles vs. time on stream for 0.31M DHA over H-USY-6
catalyst. Other includes pyruvic acid and TMO. (a) DHA conversion in water at177 "C, WHSV of 0.18 h"1. Other includes pyruvic acid, formic acid, acetic acid,levulinic acid, and acetol; and (b) DHA conversion in methanol at 157 "C, WHSV of0.16 h"1.
126 R.M. West et al. / Journal of Catalysis 269 (2010) 122–130
85

conditions for the two experiments were chosen to achieve fullconversion initially, and a high yield of products, i.e. in the caseof water, a reaction temperature of 177 "C, concentration of0.31 M DHA, and a WHSV of 0.18 h"1 was chosen, while for meth-anol a temperature of 157 "C, concentration of 0.31 M DHA, andWHSV of 0.16 h"1 was used. Fig. 4 presents the observed productcompositions obtained by sampling the effluent as a function oftime on stream.
In Fig. 4a while the initial yield of lactic acid in water was quitehigh, 95%, the sample showed continual deactivation. After around25 h, the concentration of both unreacted feed and pyruvic alde-hyde (PA) increased significantly, while the yield of lactic acid de-creased sharply. This deactivation continued for the duration of therun reaching a #70% yield of lactic acid after 44 h. In the case ofmethanol as a solvent we observed a much improved stabilitywithin the 47 h as shown in Fig. 4b. The yield of methyl lactate re-mained around or above 90% for the duration of the run. As theyield of methyl lactate drops slowly, the yield of pyruvic aldehydedimethyl acetal (PADA) increases. Only low concentrations of unre-acted triose sugars were observed in the effluent.
3.5. Kinetic study in the flow system
In order to better understand the current system, a simulta-neous investigation of the kinetics and deactivation under variousreactions conditions were conducted. The temperature, feed con-centration, and feed substrates were systematically varied asshown in Table 2 while the catalyst loading was adjusted to keepthe initial disappearance of reagent to less than 70% and the yieldof lactic acid/methyl lactate to less than 50%. The initial activityand calculated initial activity of the H-USY-6 as a function of sys-tematically altered reaction conditions are shown in Table 2. Theinitial measured activities are given for the disappearance of triosesugars (total disappearance of GLA and DHA), the appearance oflactic acid/methyl lactate, and for the appearance of intermediatespecies PA/PAMA (pyruvic aldehyde methyl acetal), and PADA,(depending on the solvents). The calculated values were fit witha simple kinetic model while as described in detail in the modelingsection below.
As one would expect, the rates increased as the temperaturewas increased at otherwise constant conditions, (entries 1–6).The activity of DHA and GLA in water at #160 "C and 0.31 M (en-
tries 4 and 7) showed quite different results. The total disappear-ance rate when GLA is the starting reagent is only 305 lmol/(min * gcat), while this value is 425 when DHA is the starting re-agent. Likewise, the appearance of lactic acid from GLA is only120 compared to 355 for DHA at the same conditions. The observa-tion suggests isomerization of GLA to DHA readily occurs with theDHA ultimately reacting as discussed later. When the suspectedintermediate species PA is reacted at similar conditions, (entry8), a higher disappearance of feed of 820 and an appearance of lac-tic acid of 770 is observed. This observation appears reasonablesince the dehydration step is surpassed and the kinetics of isomer-ization are quite favorable as discussed in a later section.
When the feed concentration of DHA is increased at any tem-perature, the disappearance of triose sugars is seen to likewise in-crease (entries 2, 9, and 10 and entries 4, 11, and 13). However, theappearance of lactic acid is not observed to increase correspond-ingly. In Table 1, it is noted that when given enough time, completeconversion of triose sugars to products other than lactic acid is pos-sible without catalyst in water. It is believed that similar degrada-tion reactions are occurring when the concentration of feeds isincreased beyond 0.31 M.
Switching the solvent to methanol (entries 14–19) caused adrastic difference in the observed rates. For a 1.25 M feed solutionof DHA, the initial disappearance of triose sugars increased by afactor of #7 from 775 in water at 160 "C (entry 11) to 5590 inmethanol at 150 "C (entry 18), while the appearance increased bya factor of #8 from 405 for lactic acid to 3315 for methyl lactate.A similar trend is seen at 130 "C where the rate of disappearanceincreases from 225 to 1305, while the rate of appearance increasesfrom 50 to 1060 (entries 2 and 15, respectively).
Interestingly, using a mixed solvent of methanol and water (en-try 17) produced disappearance and production rates between thatof pure methanol and water. For a 1.25 M solution of DHA, a 45/55molar mixture of methanol and water (64.5 wt.% methanol) at150 "C showed a disappearance rate of 1300, double that of purewater, 775 (entry 11), but much less than that of pure methanol,5590 (entry 18). The rate of appearance of product, a mixture oflactic acid and methyl lactate for the 45/55 mixture was 860, againabout double that of pure water, 405, and much less than that ofpure methanol 3315. A mixture of the solvents is indeed an inter-esting situation since for every one mole of DHA reacted, one moleof water is created in an alcohol solvent meaning that minor
Table 2
Initial rates of reaction under systematically varied conditions using H-USY-6. The total number of acid sites are 563 umol/g based on NH3-deposition. The number of Brønstedand Lewis acid sites corresponds to 362 lmol/g and 200 lmol/g, respectively (based on pyridine IR-adsorption).
Entry Conditions of run Measured initial rate (lmol/(min*gcat)) Calculated rate (lmol/(min*gcat))
Temp. ("C) Reagent Solvent Concentration(M)
Triosedissappearance
LA/MLappearance
PA/PAMAappearance
PADAappearance
Triosedissappearance
LA appearance PA appearance
1 116 DHA Water 0.31 27 17 2 32 23 82 130 DHA Water 0.31 75 50 8 75 40 353 142 DHA Water 0.31 100 100 15 110 65 35
4 165 DHA Water 0.31 425 355 40 450 315 905 172 DHA Water 0.31 550 445 25 525 380 756 190 DHA Water 0.31 1530 1055 205 1545 1075 2307 160 GLA Water 0.31 305 120 308 160 PA Water 0.36 – 770 820a – 820 930a
9 130 DHA Water 0.80 180 50 30 210 90 11010 130 DHA Water 1.25 225 30 45 260 120 130
11 160 DHA Water 1.25 775 405 125 710 415 24012 160 PA Water 1.25 – 780 865a – 855 975a
13 160 DHA Water 3.44 2475 340 405 2480 1495 78514 112 DHA MeOH 1.25 735 620 30 4515 130 DHA MeOH 1.25 1305 1060 35 30016 130 GLA MeOH 1.25 1270 800 25 19017 150 DHA MeOH/water 1.25 920 865 95 15018 150 DHA MeOH 1.25 5590 3315 385 1400
19 165 DHA MeOH 1.25 10080 4600 905 2850
a Disappearance of PA.
R.M. West et al. / Journal of Catalysis 269 (2010) 122–130 127
86

amounts of water are inevitably present. Further, this situation isimportant if operating in solvents of only technical grade. Impor-tantly as just outlined above using the mixture of water and meth-anol did increase the rates with respect to those observed in purewater. However, reaction rates in the solvent mixture are stillmuch closer to the rates seen in water than those in puremethanol.
3.6. Deactivation
The reasons for deactivation were investigated by characteriz-ing fresh and used catalysts. Table 4 demonstrates the surfaceproperties for fresh and selected used catalyst collects from Table3 as well as H-USY-6 zeolites under modeled deactivating condi-tions. Table 4 entry 1 represents the fresh, unused H-USY-6 zeolitewhich is used for comparison. Entries 2–8 contains data for theused catalysts and were chosen as to cover the range of reactiontimes, temperatures, feeds, concentrations, and solvents used.
Entry 2 was tested at low temperature (116 "C) and short time(6 h) on stream while entry 3A corresponds to the zeolite used inFig. 3a namely a temperature of 177 "C and time on stream 44 hin water. Entry 3B is the same sample without calcination to showthe influence of carbon on the surface area. Characterizing thethree used zeolites we note that the adsorption characteristic ofentry 2 is very similar to the parent zeolite exemplified by a micro-pore volume which only decreased from 0.253 ml/g to 0.236 ml/gindicating that the zeolite structure is mostly preserved. This isin strong contrast to the prolonged and high temperature reactionused for entry 3A which resulted in an almost complete loss ofcrystal integrity. This can be seen by a reduction in the measuredsurface area and micropore volume of around 80%, a loss of acidityof 46% as well as a final crystallinity calculated to <10%. Further-more, the catalyst is heavily covered in carbon, containing as muchas 9 wt.% carbon.
Entry 4 shows data for the zeolite after a time on stream of 47 hat 157 "C in the conversion of DHA in methanol (Fig. 3b). Ammo-
nia-TPD, porosity measurements, and the estimated crystallinityall shows that less framework deterioration takes place duringthe reaction in methanol compared to water (entry 3A). However,a modest loss in micropore volume, surface area, and acidity isseen along with a decrease in the calculated crystallinity of around40% indicating that the catalyst has suffered some structural dam-age in excess of the deactivation by carbon deposits.
Entries 5 and 6 shows that the highest deposition of carbontakes place when PA is used as the feed, (Table 2 entries 8 and12, respectively). In 9 h at 160 "C, 5.2% of carbon had depositedonto the H-USY-6 zeolite when using a feed of 0.36 M PA as sub-strate. Increasing the PA concentration aggravates the depositionof carbon, since 15.7% is deposited in only 5 h when a feed consist-ing of 1.25 M PA was used. In contrast, after running for 44 h, a0.31 M DHA solution in water amounted to 9.0% carbon. In addi-tion to the excessive carbon deposits, high surface area and micro-pore volume losses were also observed (entry 5). It is also notedthat the deactivation of the catalyst in the two runs using PA as afeed was also the most rapid among all feeds and conditions tested.
Entries 7 and 8 in Table 4 were created by flushing the H-USY-6zeolite with either a 0.31 M lactic acid solution in water or a 0.31 Mmethyl lactate solution in methanol overnight at the specified tem-perature. The lactic acid and methyl lactate were quantitativelyrecovered in the effluent indicating that the reverse reactions donot occur. These experiments show that the desired end productsin methanol and water, methyl lactate and lactic acid, are not thecause for the excessive carbon deposition onto the zeolite. Impor-tantly, we observe that the product in water, lactic acid, stronglydamages the catalyst already after 12 h. Again this is in strong con-trast to what is observed in the case of methyl lactate in methanolwhere more modest changes in the structure of the catalyst weredetected for the comparable reaction conditions (entries 4 and8). Although the XRD show a decrease of 41.2% for this samplethe effect on micropore volume, surface area and total acidity ofthe zeolite is much smaller.
The specific cause of irreversible zeolite destruction was furthersystematically tested under controlled conditions. Entries 9through 15 were created by exposing the fresh H-USY-6 zeoliteto the specified conditions listed in a sealed teflon container ro-tated at 20 rpm. The zeolite was subsequently recovered by filtra-tion and washed thoroughly with demineralized water and driedbefore analysis.
Stirring the zeolite in demineralized water for 24 or 48 h at140 "C (entries 9 and 10) slightly decreased the surface areas and
Table 3
Modeled kinetic parameters for Scheme 1 on H-USY-6.
Ea (kJ/mol K) ln(A) (1/mass)
1 53 ± 13 17.4 ± 8.92 61 ± 15 20 ± 133 89 26
Table 4
Physical properties of fresh, used, and treated H-USY-6 catalysts.
Entry Temperature("C)
Solvent Feed Concentration(M)
Time (h) Location TPO(% C)
BET(m2/g)
Vmicro
(mL/g)Vmeso
(mL/g)Smeso
(m2/g)NH3-TPD(umol/g)
XRD,C/C0 (%)
1 – – – – – – – 725 0.253 0.058 134 563 1002 116 Water DHA 0.31 6 Reactor 2.0 674 0.236 0.076 1423A 177 Water DHA 0.31 44 Reactor 9.0 182 0.048 0.198 97 306 8.63B 177 Water DHA 0.31 44 Reactor 115 0.015 0.188 714 157 MeOH DHA 0.31 47 Reactor 2.7 619 0.217 0.060 128 461 595 160 Water PA 0.36 9 Reactor 5.2 246 0.076 0.102 796 160 Water PA 1.25 5 Reactor 15.7
7 177 Water LA 0.31 12 Reactor 1.7 405 0.129 0.151 127 394 348 137 MeOH ML 0.31 11 Reactor 1.8 708 0.246 0.071 142 486 569 140 Water – – 24 Vial 555 0.211 0.089 108 561 8010 140 Water – – 48 Vial 554 0.208 0.108 10811 140 Water LA 0.3 2 Vial 716 0.248 0.094 16412 140 Water LA 0.3 8 Vial 670 0.232 0.106 16413 140 Water LA 0.3 24 Vial 537 0.188 0.118 129 490 7114 140 Water LA 1 24 Vial 0.4 238 0.017 0.290 223 158 $0
15 140 MeOH – – 24 Vial 693 0.251 0.057 131 486 93
A CalcinedB uncalcined.
128 R.M. West et al. / Journal of Catalysis 269 (2010) 122–130
87

crystallinity of the sample, however it did not markedly decreasethe total acidity of the zeolite.
Carefully repeating the experiment by using a 0.3 M solution oflactic acid and a shorter treatment period caused a more pro-nounced destruction of the zeolite than pure water. Entries 11–14 show the systematic decrease in surface areas, and microporevolume corresponding to treatment times of 2, 8, and 24 h in0.3 M lactic acid. At 24 h, the surface areas number of acid sitesand crystallinity of the sample subjected to 0.3 M lactic acid (entry13) were all lower than the corresponding values in pure water(entry 9) at 24 h. Further increasing the concentration of lactic acidto 1.0 M (entry 14) caused a complete destruction of the zeolitewith no recognizable diffraction peaks present in the XPRD diffrac-togram, i.e. the crystallinity of this sample was $0%. Results fromNH3-TPD and N2-sorption analysis support the complete disman-tling of the zeolite. Importantly, a concentration of approximately0.3 M of lactic acid, which is the concentration of final product ineither the batch or flow experiments, is sufficient to destroy thezeolite suggesting that it is necessary to work with dilute systemsif water is used as the solvent. In entry 8 we used anhydrous meth-anol for the treatment. It is however clear from the results that thezeolite is extremely stable in pure methanol as the zeolite charac-teristics are practically identical to the fresh zeolite.
As highlighted from the characterization above it is importantto distinguish between the reversible deactivation occurringthrough coking of the zeolite in contrast to the irreversible deacti-vation through structural damage of the zeolite. The results indi-cate that coking originates from decomposition of PA and notfrom the end products. The conditions that lead to the most rapidloss in activity can be summarized as follows. Higher temperaturesand higher concentration of lactic acid (either directly or throughthe formation from PA) are detrimental to the zeolite structure.Using water compared to methanol as a solvent causes a higher le-vel of irreversible damage. This difference arising from the solventis further increased as lactic acid also causes far more destructionthan does methyl lactate. Minimal deactivation through destruc-tion of the zeolite can therefore be expected when operating atlow concentrations, low temperature, and when using an alcoholas the solvent.
3.7. Modeling the reaction path
The initial rate of reaction was modeled as a plug flow reactorwith a series of simple first order reactions as shown in Scheme2 for all runs involving DHA and PA with water as a solvent. Theforward rate constants were assumed to be Arrhenius expressionsof the form, ki % Ai exp
EAiRT . The pre-exponential factor A and activa-
tion energy of each step were then estimated by integrating overthe mass of catalyst in Matlab using the lsqnonlin function to min-imize the differences in calculated and experimental rates for thedisappearance of trioses, appearance of pyruvaldehyde, and theappearance of lactic acid. The fit parameters for each step are foundin Table 3, while the calculated rates are included in Table 2.
Despite fairly good agreement over the large temperature andconcentration range of this study, the confidence intervals seen
in Table 3 are quite large. This variance is primarily due to rela-tively good fit over a range of values; that is similar forward rateconstants can be calculated with a range of pre-exponential andactivation energies. The initial disappearance of triose sugars wasless than 70% while the initial yield was less than 50%, hence themodel used incorporated the changing concentrations of the re-agents through the reactor. This reaction model is not differentialand hence the confidence intervals are quite large. Despite theselarge intervals, several important conclusions can be made by cal-culating the forward rate constants at the best fit values for eachstep in Scheme 2. It is observed that the forward rate constantfor isomerization is the largest forward rate constant at all temper-atures of this study. The ratio of k2/k1 increases as the temperatureis increased from a value of 1.1 at 115 "C to 1.7 at 190 "C. This high-er value for k2 implies that the isomerization step occurs morereadily than the dehydration step and that the isomerization is rel-atively more favorable as the temperature is increased. A secondtrend can be seen by comparing the degradation and isomerizationconstants, k2/k3. At 115 "C this value is 14.6, heavily favoring theisomerization. As the temperature is raised however to 190 "C, thisratio drops swiftly to 3.6 indicating that the degradation reactionsbecome much more favorable at higher temperatures.
The model predicts the initial rates for a variety of concentra-tions, temperatures, and feeds relatively accurate. The differencesbetween the calculated and observed initial rate of disappearanceof triose species and pyruvic aldehyde are less than 20% for con-centrations ranging from 0.31 M to 3.44 M and temperatures from116 to 190 "C indicating the system is well described by theassumptions of first order kinetics and simple activation energies.The estimated production rate of lactic acid is also accurately mod-eled for the tests at low concentration. Deviations between themodel and experimental data are largest at high concentrationswith the largest differences between the predicted and observedrates occurring for the production of LA in entries 10 (131 "C1.25 M) and 13 (159 "C 3.44 M). Since the reaction pathway is be-lieved to be a series of reactions, and since the model does not in-clude surface coverage terms, one possible explanation is that thecatalytic sites are covered by either initial species DHA or water,and are blocked from reaction of DHA. A second explanation couldinclude a diffusion limitation at high concentration. The surfaceblocking explanation is better supported, however, by the closefit between experimental and calculated rates when the intermedi-ate species, PA is used. At higher concentrations of PA (entry 12)the rate of lactic acid production is relatively close to the rate ofPA disappearance, while the same is not true of DHA at the sameconditions (entry 11). If the system was diffusion limited, onewould expect large differences for both cases, however if the initialreactivity of DHA is limited, large deviations would only be ex-pected for the case starting with DHA, as observed.
Previous authors have modeled the degradation of triose sugarsunder isothermal conditions without a catalyst [26,27]. These stud-ies looked at the isomerization and degradation of GLA and DHAinto PA. As in the current case, first-order kinetics were found toappropriately model the disappearances of triose sugars and PA.As expected, the heterogeneously catalyzed activation energy
HO OH O OH
O OOH
O
1 2
3
Scheme 2. Modeled reaction scheme for the conversion of DHA into LA.
R.M. West et al. / Journal of Catalysis 269 (2010) 122–130 129
88

determined here is much lower than previous reports for the dehy-dration of triose sugars (53 ± 13 vs. 75–92 kJ/mol, respectively).The degradation/isomerization of PA determined in this reportare comparable to previous values, with the isomerization havinga lower activation energy (61 ± 15 kJ/mol) and the degradationreaction having similar value (89 kJ/mol) to the other reports(77–94 kJ/mol). It is important to note that due to the aqueousenvironment of this and previous studies, PA is present as the hy-drated and dehydrated forms. This implies that the degradationreactions of PA (as the mono- and di-hydrate) would proceed evenin the absence of heterogeneous catalyst and further suggestsavoidance by operation at lower temperatures.
From the modeling study, we see that the optimal reactionsconditions for the production of a lactic acid derivative are lowconcentrations in an alcohol solvent such as methanol at low tem-peratures. The experimental data for the isomerization reactionscan despite a relative large confidence interval be described by aseries of first-order reaction and the model can be used to gain use-ful information of the involved rate constants. Specifically, thehigher temperatures favor isomerization, k2 over dehydration k1,but also favor degradation k3 over isomerization k2. To limit degra-dation to other products, it is therefore suggested that the reactionbe run at lower temperatures.
4. Conclusion
It has been demonstrated that the Lewis acidic H-USY-6 zeoliteis highly effective for the isomerization of triose sugars to lacticacid and methyl lactate. Indeed, methyl lactate can be formed in al-most quantitative yields directly from DHA and GLA, using thisinexpensive zeolite. The transformation can be modeled via a ser-ies of first order reactions in water. In methanol, the rate of reac-tion is as much as an order of magnitude higher than in water.The catalyst deactivates both by carbon deposition and by frame-work degradation. However, deactivation by carbon deposition aswell as structural damage can be minimized by using optimizedreaction conditions of low concentration and temperature andwith an alcohol such as methanol as the solvent. The presentedwork adds to the pool of information regarding this very interest-ing process wherein it is possible to produce racemic lactic acid orthe corresponding methyl ester from biomass-derived substrates.Furthermore, since methyl lactate is formed directly in this pro-cess, purification to form high-grade lactic acid could be facilitatedby distillation and hydrolysis, thereby avoiding the cumbersomepurification process associated with the current production of lac-tic acid.
Acknowledgments
Supported by the Danish National Research Foundation, and theNational Science Foundation, PIRE Program (Award # 0730277).We also thank Dr. J. Rass-Hansen and R. Johansson for technicalassistance.
References
[1] R. Dhatta, M. Henry, J. Chem. Technol. Biotechnol. 81 (2006) 1119.[2] R.A. Sheldon, Green Chem. 7 (2005) 267.[3] Y.-J. Wee, J.-N. Kim, H.-W. Ryu, Food Technol. Biotechnol. 44 (2) (2006) 163.[4] R. Leaversuch, Plast. Technol. 48 (3) (2002) 50.[5] S. Varadarajan, D.J. Miller, Biotechnol. Prog. 15 (1999) 845.[6] H.F. Shi, Y.C. Hu, Y. Wang, H. Huang, Chin. Chem. Lett. 18 (2007) 476.[7] R.D. Cortright, M. Sanchez-Castillo, J.A. Dumesic, Appl. Catal. B: Environ. 39
(2002) 353.[8] J.C. Serrano-Ruiz, J.A. Dumesic, Chem. Sus. Chem. 2 (6) (2009) 581.[9] D. Garlotta, J. Polym. Environ. 9 (2) (2001) 63.[10] R.P. John, K.M. Nampoothiri, A. Pandey, Appl. Microbiol. Biotechnol. 74 (2007)
524.[11] H. Kimura, K. Tsuto, Appl. Catal. A: Gen. 96 (1993) 217.[12] H. Kimura, Appl. Catal. A: Gen. 105 (1993) 147.[13] R. Garcia, M. Besson, P. Gallezot, Appl. Catal. A: Gen. 127 (1995) 165.[14] E. Farnetti, J. Kaspar, C. Crotti, Green Chem. 11 (2009) 704.[15] D. Hekmat, R. Bauer, V. Neff, Process Biochem. 42 (2007) 71.[16] S. Yamada, K. Nabe, N. Izuo, M. Wada, I. Chibata, J. Ferment. Technol. 57 (3)
(1979) 215.[17] K. Nabe, N. Izuo, S. Yamada, I. Chibata, Appl. Environ. Microbiol. 38 (6) (1979)
1056.[18] M.C. Flickinger, D. Perlman, Appl. Environ. Microbiol. 33 (3) (1977) 706.[19] M.J. Antal Jr., W.S.L. Mok, G.N. Richards, Carbohydr. Res. 199 (1990) 111.[20] H. Kishida, F. Jin, X. Yan, T. Moriya, H. Enomoto, Carbohydr. Res. 341 (2006)
2619.[21] M. Bicker, S. Endres, L. Ott, H. Vogel, J. Mol. Catal. A: Chem. 239 (2005) 151.[22] Y. Hayashi, Y. Sasaki, Chem. Commun. (2005) 2716.[23] K.P.F. Janssen, J.S. Paul, B.F. Sels, P.A. Jacobs, Stud. Surf. Sci. Catal. 170B (2007)
1222.[24] E. Taarning, S. Saravanamurugan, M. Spangsberg Holm, J. Xiong, R.W. West,
C.H. Christensen, Chem. Sus. Chem. 2 (7) (2009) 625.[25] S. Sombatchaisak, P. Praserthdam, C. Chaisuk, J. Panpranot, Ind. Eng. Chem. Res.
43 (2004) 4066.[26] G. Bonn, M. Rinderer, O. Bobleter, J. Carbohydr. Chem. 4 (1) (1985) 67.[27] B.M. Kabyemela, T. Adschiri, R. Malaluan, K. Arai, Ind. Eng. Chem. Res. 36
(1997) 2025.[28] G. Lookhart, M.S. Feather, Carbohydr. Res. 60 (1978) 259.[29] A.C. McLellan, P.J. Thornalley, Anal. Chim. Acta 263 (1992) 137.[30] C. Rae, S.J. Berners-Price, B.T. Bulliman, P.W. Kuchel, Eur. J. Biochem. 193
(1990) 83.[31] F. Wakabayashi, J.N. Kondo, K. Domen, C. Hirose, Microporous Mater. 8 (1997)
29.[32] O. Cairon, T. Chevreau, J.-C. Lavalley, J. Chem., Soc., Faraday Trans. 94 (1998)
3039.[33] S. Kotrel, J.H. Lunsford, H. Knözinger, J. Phys. Chem. B 105 (2001) 3917.[34] T. Barzetti, E. Selli, D. Moscotti, L. Forni, J. Chem. Soc. Faraday Trans. 92 (8)
(1996) 1401.[35] C.A. Emeis, J. Catal. 141 (1993) 347.
130 R.M. West et al. / Journal of Catalysis 269 (2010) 122–130
89

DOI: 10.1002/cssc.200900099
Zeolite-Catalyzed Isomerization of Triose Sugars
Esben Taarning,[b] Shunmugavel Saravanamurugan,[b] Martin Spangsberg Holm,[b] Jianmin Xiong,[b]
Ryan M. West,[c] and Claus Hviid Christensen*[a]
Lactic acid is an important chemical that is used for production
of biodegradable polymers and solvents. The industrial produc-
tion of lactic acid is based on the anaerobic fermentation of
glucose and sucrose using microbial fermentation.[1] The major
complications associated with this process are the need to
neutralize lactic acid with a stoichiometric amount of base
during the fermentation process and the energy-intensive
work-up of lactic acid from the aqueous fermentation broth.
However, a different route to lactic acid, based on the isomeri-
zation of the triose sugars dihydroxyacetone (DHA) and glycer-
aldehyde (GLA), could be envisioned. Such a process could be
based on glycerol as a raw material, which can be converted
to GLA and DHA by fermentation[2] or catalytic oxidation,[3] re-
spectively.
Herein, we report that Lewis-acidic zeolites such as Sn-Beta
show surprisingly high activities and selectivities for the iso-
merization of trioses to lactic acid, and for the isomerization–
esterification to form lactate esters. This discovery represents
one of the most selective zeolite-catalyzed transformations of
a biomass substrate. Furthermore, we demonstrate the impor-
tant role that Lewis and Brønsted acidity have on the product
selectivity and we propose that the isomerization reaction in-
volves a Meerwein–Ponndorf–Verley reduction and Oppenauer
oxidation (MPVO)-type redox step that is catalyzed only by
Lewis acids.
Isomerization of DHA and GLA into lactic acid is energetical-
ly favored by 24 and 27 kcalmol!1, respectively (1 cal=
4.184 J).[4] Aqueous acid[5] and base[6] are known to catalyze
this isomerization reaction at temperatures of 250–300 8C to
give moderate yields of lactic acid, while aqueous zinc sul-
phate is known to form up to 86% lactic acid under similar
conditions.[7] The isomerization reaction has also been reported
to occur in alcohol solvents, in which the resulting product is
the corresponding lactate ester. In methanol, SnCl4·5H2O was
demonstrated to give up to 82% methyl lactate from DHA at
90 8C,[8] although in this case large amounts of SnCl4 were
needed to achieve high yields. Heterogeneous catalysts have
also been employed for this reaction. Janssen et al. reported
that acidic Y-zeolites catalyze the isomerization–esterification
reaction of DHA in ethanol to give moderate yields of ethyl
lactate along with some pyruvaldehyde diethylacetal.[9]
The reaction of DHA in alcohols is believed to proceed via
dehydration to form pyruvaldehyde,[8–9] followed by conversion
to either pyruvaldehyde dimethylacetal (PADA) or methyl lac-
tate (Scheme 1). The formation of methyl lactate (pathway A)
necessitates a redox step in the reaction pathway. We there-
fore hypothesized that a high selectivity towards methyl lac-
tate is favored by zeolites that feature redox activity. This par-
ticular redox reaction bears a distinct resemblance to the
MPVO-redox reaction, in which a ketone or an aldehyde is re-
duced by an alcohol in the presence of a Lewis-acidic cata-
lyst.[10] We therefore decided to investigate the activity of zeo-
lites that are known to be highly active MPVO-redox catalysts
in the conversion of DHA to methyl lactate and lactic acid.
Such catalysts include, amongst others, extra-framework-alumi-
num (EFAL)-containing zeolites,[11] but more interestingly non-
Brønsted-acidic zeolites containing framework titanium,[12] zir-
conium,[13] and tin[14] have also been reported to be highly
active MPVO-redox catalysts.
We synthesized a series of Beta zeolites containing Al, Zr, Ti,
and Sn to evaluate their relative activities and selectivities for
the reaction of DHA in methanol as well as pure siliceous Beta
for comparison (Table 1). In addition, we prepared the corre-
sponding oxides by incipient wetness impregnation to evalu-
ate the importance of framework incorporation of the metals.
Interestingly, tin incorporated into zeolite Beta was found to
be highly selective for the formation of methyl lactate from
DHA and GLA in methanol. Full conversion of DHA was ach-
ieved in water at 125 8C for all zeolites, however, only in the
case of Sn-Beta was DHA fully converted in methanol at 80 8C.
Sn-Beta could be reused for three consecutive runs without
any noticeable loss in activity by simply adding fresh DHA
after the 24 h reaction when the reaction was carried out in
methanol. However, in water this was not possible because
Scheme 1. Conversion of DHA in methanol to form methyl lactate or pyru-
valdehyde dimethylacetal (PADA).
[a] Prof. C. H. Christensen
Haldor Topsøe A/S
Nymøllevej 55, 2800 (Denmark)
Fax: (+45)45272999
E-mail : [email protected]
[b] Dr. E. Taarning, Dr. S. Saravanamurugan, M. S. Holm, Dr. J. Xiong
Center for Sustainable and Green Chemistry
Department of Chemistry, Technical University of Denmark
2800 (Denmark)
[c] R. M. West
Department of Chemistry and Biological Engineering
University of Wisconsin–Madison
Madison, WI 53706 (USA)
Supporting information for this article is available on the WWW under
http://dx.doi.org/10.1002/cssc.200900099.
ChemSusChem 2009, 2, 625 – 627 ! 2009 Wiley-VCH Verlag GmbH&Co. KGaA, Weinheim 625
90

large amounts of carbonaceous deposits were formed, result-
ing in a decrease of the formation of lactic acid, from 90% in
the first run to 21% in the second run. This could be a result
of the unavoidable presence of a Brønsted acid in the aqueous
reaction mixture, as the concentration of lactic acid increased.
Indeed, when using a purely Brønsted-acidic catalyst, such as
an acidic ion-exchange resin in water, only 11% of lactic acid
was formed along with large amounts of carbonaceous depos-
its.
It is interesting to note that when tin is incorporated into
the zeolite framework it becomes more active for the forma-
tion of methyl lactate than homogeneous tin in the form of
SnCl4·5H2O. Thus, the initial rate of methyl lactate formation
when using low loadings of Sn-Beta was found to be approxi-
mately 45 molmolSn!1h!1 with low yields of methyl lactate
(<7% yield from DHA), whereas it was only 4.2 molmolSn!1h!1
when using a similar molar amount of SnCl4·5H2O. In addition,
SnO2/Si-Beta as well as large amounts of nanopowdered SnO2
afforded only trace amounts of methyl lactate, illustrating that
tin oxide is not catalytically active.
One of the advantages of single-site heterogeneous cataly-
sis[15] is the possibility to probe and study the active site. The
single-site enhancement achieved when incorporating tin into
the zeolite framework has been studied by Corma and co-
workers.[16] Based on NMR evidence it was found to be possible
to fully incorporate tin into the zeolite framework.[17] The cata-
lytically active site is believed to be a partially hydrolyzed
framework tin species. The Lewis acid strength of the metal
site in the zeolite framework can be evaluated by its ability to
shift the carbonyl IR stretching frequency of cyclohexanone.
The Sn-Beta catalyst used in this study was synthesized accord-
ing to a procedure by which tin is known to be fully incorpo-
rated into the zeolite framework. We found that the C=O
stretch of cyclohexanone shifted by 49 cm!1 for the Sn-Beta
catalyst, 28 cm!1 for Zr-Beta, and 22 cm!1 for Ti-Beta. These re-
sults clearly indicate that Sn-Beta is a stronger Lewis acid than
Ti-Beta and Zr-Beta, which could explain its increased activity
relative to the other metals.
In methanol, the acidic ion-exchange resin was found to be
highly selective towards PADA. In order to study the selectivity
difference for the formation of methyl lactate and PADA, a re-
action series was performed at a higher temperature (115 8C),
where all the catalysts are appreciably active (Figure 1). Here,
the acidic ion-exchange resin is highly selective towards the
formation of PADA (pathway B, Scheme 1) whereas Sn-Beta, Zr-
Beta, and Ti-Beta are only selective for the formation of methyl
lactate (pathway A, Scheme 1). Al-Beta is highly selective to-
wards PADA, suggesting that it mainly contains Brønsted-acidic
framework aluminum. In order to substantiate this argument,
we decided to steam-dealuminate the Al-Beta zeolite from
Table 1 for comparison. Hence, the Al-Beta was steam-calcined
at 750 8C for 20 h. The selectivity towards methyl lactate was
found to increase significantly, as would be expected from the
formation of more EFAL sites.
It is thus clear that for the reaction of triose sugars in metha-
nol, Lewis-acidic catalysts are selective towards the formation
of methyl lactate whereas Brønsted-acidic catalysts are selec-
tive towards PADA. The zeolite activity correlates with its rela-
tive Lewis-acid strength as determined by IR measurements of
adsorbed cyclohexanone. The reaction pathway could be
thought to involve a MPVO-type redox reaction of the pyruval-
dehyde hemiacetal (MeOH) or hydrate (H2O) in which a 1,2-hy-
dride shift takes place in a concerted fashion, leading to
methyl lactate or lactic acid, respectively (Scheme 2).
The strongly Lewis-acidic Sn-Beta catalyst used here is, to
the best of our knowledge, the most active catalyst for the
conversion of triose sugars to methyl lactate and lactic acid re-
ported until now. It is more active than even homogeneous tin
Table 1. Conversion of DHA to methyl lactate in methanol and to lactic
acid in water using various catalysts.[a]
Catalyst Si/Me
ratio[b]
Surface
areaACHTUNGTRENNUNG[m2 g!1]
Micropore
volumeACHTUNGTRENNUNG[mL g!1]
Methyl
lactate
[%]
Lactic
acid
[%]
Al-Beta 65 449 0.19 0 22
Zr-Beta 125 506 0.20 1 44
Ti-Beta 125 492 0.20 2 25
Sn-Beta 125 478 0.19 >99 90
Sn-Beta[c] 125 478 0.19 >99 90
Si-Beta – 462 0.19 0 3
Al2O3/Beta 125 460 0.19 0 8
ZrO2/Beta 125 453 0.19 0 13
TiO2/Beta 125 464 0.19 0 11
SnO2/Beta 125 458 0.19 <1 8
SnO2[d] – 19 – <1 6
Acidic
resin[e]
– – – <1 11
No catalyst – – – 0 3
[a] 1.25 mmol DHA in 4 g of methanol (80 8C) or water (125 8C), 80 mg of
catalyst was added and the mixture was stirred for 24 h. [b] As-synthe-
sized. [c] GLA used as substrate. [d] As nanopowder. [e] DOWEX 50WX8-
100.
Figure 1. Yield of methyl lactate and PADA for various catalysts. Conditions:
DHA (1.25 mmol), methanol (4 g), and catalyst (80 mg) were stirred at 115 8C
for 24 h.
626 www.chemsuschem.org ! 2009 Wiley-VCH Verlag GmbH&Co. KGaA, Weinheim ChemSusChem 2009, 2, 625 – 627
91

chloride, and because of its ease of reuse it is more attractive
from an environmental point of view. The surprising activity,
selectivity, and reusability illustrate the important potential
that zeolites have in the conversion of biomass to value-added
chemicals.
Experimental Section
Sn-Beta, Zr-Beta, Ti-Beta, Al-Beta, and Si-Beta were all synthesizedin fluoride media according to known procedures.[17] The metaloxides on Si-Beta were prepared by incipient wetness impregna-tion using the corresponding metal precursors and then calcinedat 450 8C for 4 h.In a 15 mL ace-vial, 1.25 mmol of triose, 4.0 g of solvent (MeOH orH2O), and 80 mg of catalyst were added. In the case of MeOH,naphthalene was added as an internal standard. The vials werethen heated and stirred for 24 h. Samples were analyzed by GC(MeOH) and HPLC (H2O).Experimental details, a time-course study, and details on the cata-lyst characterization are provided as Supporting Information.
Acknowledgements
The Center for Sustainable and Green Chemistry is sponsored by
the Danish National Research Foundation. R.M.W acknowledges
funding by PIRE, NSF OISE 0730277.
Keywords: biomass · heterogeneous catalysis · Lewis acids ·
tin · zeolites
[1] a) Y.-J. Wee, J.-N. Kim, H.-W. Ryu, Food Technol. Biotechnol. 2006, 44, 163;
b) R. Datta, M. Henry, J. Chem. Technol. Biotechnol. 2006, 81, 1119.
[2] a) D. Hekmat, R. Bauer, V. Neff, Process Biochem. 2007, 42, 71; b) S.
Yamada, K. Nabe, N. Izuo, M. Wada, I. Chibata, J. Ferment. Technol. 1979,
57, 215.
[3] a) H. Kimura, K. Tsuto, Appl. Catal. A 1993, 96, 217; b) H. Kimura, Appl.
Catal. A 1993, 105, 147.
[4] R. M. West, E. L. Kunkes, D. A. Simonetti, J. A. Dumesic, Catal. Today
2009, 10.1016/j.cattod.2009.02.004.
[5] M. J. Antal, Jr. , W. S. L. Mok, G. N. Richards, Carb. Res. 1990, 199, 111.
[6] H. Kishida, F. Jin, X. Yan, T. Moriva, H. Enomoto, Carb. Res. 2006, 341,
2619.
[7] M. Bicker, S. Endres, L. Ott, H. Vogel, J. Mol. Catal. A 2005, 239, 151.
[8] Y. Hayashi, Y. Sasaki, Chem. Commun. 2005, 2716.
[9] K. P. F. Janssen, J. S. Paul, B. F. Sels, P. A. Jacobs, Stud. Surf. Sci. Catal.
2007, 170, 1222.
[10] C. F. de Graauw, J. A. Peters, H. van Bekkum, J. Huskens, Synthesis 1994,
10, 1007.
[11] P. J. Kunkeler, B. J. Zuurdeeg, J. C. van der Waal, J. A. van Bokhoven,
D. C. Koningsberger, H. van Bekkum, J. Catal. 1998, 180, 234.
[12] J. C. van der Waal, E. J. Creyghton, P. J. Kunkeler, K. Tan, H. van Bekkum,
Top. Catal. 1997, 4, 261.
[13] Y. Zhu, G.-K. Chuah, S. Jaenicke, J. Catal. 2006, 241, 25.
[14] A. Corma, M. E. Domine, L. Nemeth, S. Valencia, J. Am. Chem. Soc. 2002,
124, 3194.
[15] J. M. Thomas, R. Raja, D. W. Lewis, Angew. Chem. 2005, 117, 6614;
Angew. Chem. Int. Ed. 2005, 44, 6456.
[16] a) M. Boronat, A. Corma, M. Renz, P. M. Viruela, Chem. Eur. J. 2006, 12,
7067; b) M. Boronat, A. Corma, M. Renz, J. Phys. Chem. B 2006, 110,
21168.
[17] a) Y. Zhu, G. Chuah, S. Jaenicke, J. Catal. 2004, 227, 1; b) M. Renz, T.
Blasco, A. Corma, V. Forn"s, R. Jensen, L. Nemeth, Chem. Eur. J. 2002, 8,
4708; c) T. Blasco, M. A. Camblor, A. Corma, P. Esteve, A. Mart#nez, C.
Prieto, S. Valencia, Chem. Commun. 1996, 2367.
Received: December 30, 2008
Published online on June 27, 2009
Scheme 2. Tentative MPVO-type redox reaction leading to methyl lactate.
ChemSusChem 2009, 2, 625 – 627 ! 2009 Wiley-VCH Verlag GmbH&Co. KGaA, Weinheim www.chemsuschem.org 627
92

s1
Figure s1. Time-course study on the formation of methyl lactate from DHA at 80 ºC. DHA (1.25 mmol), Sn-Beta (80 mg), methanol (4.0 g) and naphthalene (60mg) were charged in a 15 mL Ace-vial. Small aliquots of the reaction mixture were withdrawn at various time intervals and analyzed byGC. The yield of methyl lactate was 97% at 6 hours reaction time and more than 99% of methyl lactate was observed after 24 hours.
Figure s1.2. Effect of catalysts on the formation of methyl lactate at low conversion. The influence of reaction time was investigated over Sn-beta (0.0080 g) and SnCl4.5H2O (3,7 mg) at 80 ºC on the yield of methyl lactate. Dihydroxyacetone (2.5 mmol), methanol (4.0 g) and naphthalene (60mg) were charged in a 15 mL Ace-vial.
Supporting information
Zeolite-catalyzed Isomerisation of Triose Sugars
Esben Taarning, Shunmugavel Saravanamurugan, Martin Spangsberg Holm, Jianmin Xiong, Ryan M. West, Claus Hviid Christensen*
Reactions with the trioses
Experimental procedure for the triose isomerisationThe triose sugar (DHA or GLA, 112.5 mg, 1.25 mmol) was added to a 15 ml Ace-vial together with 4 g of solvent (H2O or MeOH) and naphthalene (ca. 60 mg, internal standard only for MeOH as solvent). Finally, 80 mg of catalyst was added and the flask was sealed with the Teflon lid and immersed into a preheated oilbath (80 or 120 ºC for MeOH and 140 ºC for H2O). The internal reaction temperature was measured in a separate control experiment by drilling a hole in the Teflon cap and tightly inserting a thermocouple. This showed that the internal temperature for the experiments with methanol at 120 ºC was 115 ºC and while with water at 140 ºC it was 125 ºC. After the desired reaction time, the flask was cooled to room temperature and a sample was acquired using a syringe with a filter. The sample was then analyzed by GC (MeOH, using internal standard) and HPLC or HPLC only (for H2O as solvent, using a calibration curve). A time-course study is shown in figure s1. Figure s1.2 compares the yields of methyl lactate as a function of time obtained when using an equivalent amount of tin in either Sn-Beta or SnCl4
.5H2O. Catalyst and substrate loadings in Figure s1.2 are chosen as to generate data in the low conversion/low yield regime.
0 5 10 15 20 25
0
20
40
60
80
100
Met
hy
l la
ctat
e (%
)
Time (h)
0 1 2 3 4
0
2
4
6
Met
hyl
lact
ate
(%)
Time (h)
Sn-Beta
SnCl4 . 5H2O
93
s2
Instrumental information GC-analysis was performed on an Agilent 6890N instrument with an FID-detector. The column
equipped was an HP-5 capillary column (30.0 m x 320 µm x 0.25 µm). A helium flow-rate of 6.0 ml/min pressurized at 1.498 bar was used. The oven temperature program is as follows: the initial temperature is 50 ºC (hold 2 min) and then heated to 280 ºC (ramp 20 ºC per min). The retention time of methyl lactate when using these settings is 1.51 min. A GC-MS instrument (Agilent 6850 GC system coupled with an Agilent 5975C mass detector) was also used in some cases for qualitative purposes. HPLC analysis was performed using an Agilent 1200 series instrument equipped with an Aminex® HPX-87H column (30 cm length). The eluent used was in all cases a 0.005 M aqueous sulfuric acid solution.
Chemicals used All chemicals were used as purchased without further purification. Dihydroxyacetone dimer (97%, Aldrich), DL-glyceraldehyde (minimum 95%, Aldrich), Naphthalene (99+%, Aldrich), DOWEX® 50WX8-100 ion exchange resin (Aldrich) and methanol (Biotech grade, 99.93%, Aldrich) were all used as received from the chemical companies. Commercial samples of methyl DL-lactate (!97%, Aldrich), L-(+)-lactic acid (99%, Fluka) and Pyruvaldehyde dimethylacetal (!97%, Fluka) were used as reference compounds for GC and HPLC analysis. Tetraethylammonium hydroxide 40 wt.% in water (analytical grade, Fluka) , TEOS !99% (Fluka), HF 40 wt.% in water (analytical grade, Fluka), Zirconium(IV) oxychloride octahydrate !99% (analytical grade, Fluka), Tin(IV) chloride pentahydrate 98 % (Aldrich), Aluminum nitrate nonahydrate !98% (Sigma-Aldrich), Aluminum chloride hexahydrate !99% (Fluka), Titanium(IV) ethoxide (analytical grade, Fluka), Hydrogen peroxide 30 wt.% in water (Merck), Nitric acid 69 wt.% (analytical grade, Merck), Ammonium Nitrate !98% (Riedel-de-Haën), Cyclohexanone !99,9% (Fluka), Demineralized water, Tin(IV) oxide nanopowder (Sigma-Aldrich)
Catalyst synthesis
Synthesis of zeolite Beta seeds Whenever seeding was applied in the syntheses, beta seeds synthesized and dealuminated in close accordance to US patent 5968473A[s1] were used. 1.85 g. AlCl3*6H2O was dissolved in 4.33 g. water. To this solution 45.24 g. TEAOH (35 wt.%) was added followed by 40 g. of TEOS. The gel was aged under stirring for 8 hours before being transferred to a Teflon cup with lid and fitted into a stainless steel autoclave for crystallization. Crystallization took place for 3 days at 140 °C while rotated at 20 rpm. The product was isolated and then washed using centrifugation and subsequently dried at 110 °C overnight. The dealumination step was done by suspending the “as synthesized” zeolite in 65 wt.% HNO3 and heating to 80 °C for 24 hours while stirring. A ratio of approximately 1 g. of zeolite per 50 g. HNO3 was used. The dealuminated zeolite was isolated by suction filtration and washed thoroughly with demineralized water.
Synthesis of Ti-Beta Synthesis of unseeded Ti-Beta was done according to a previous published procedure[s2] introducing minor modifications described here. A molar oxide ratio in the gel before aging of 0.008 TiO2: 1 SiO2: 27.5 (TEA)2O: 0.55 HF: 0.33 H2O2: 9 H2O was aimed for. 30.0 g. of TEOS and 29,0 g. of TEAOH (40%) was mixed and stirred for a few minutes. 5.3 g. of H2O2 (30%) was added and after an additional 5 minutes 0.26 g. TEOT was added slowly. The gel was allowed to age for
94

s3
approximately 7 hours allowing for the evaporation of ethanol produced by hydrolysis of TEOS. This produced a homogeneous and slightly yellow paste. 3.9 g. HF (40%) was then added drop wise under rapid stirring. The rigid gel obtained was manually homogenized before it was transferred to a Teflon cup with lid which was inserted into a stainless steel autoclave for crystallization. The autoclave was rotated at a speed of 20 rpm. while kept at a temperature of 140 °C for 10 days.
Synthesis of Zr-Beta, Al-Beta and Si-Beta Synthesis of Zr-Beta was done according to a previous published procedure[s3] introducing minor modifications described here. A molar oxide ratio in the gel before aging of 0.008 ZrO2: 1 SiO2: 0.28 (TEA)2O: 0.56 HF: 10 H2O was aimed for. 30 g. TEOS and 29.7 g. TEAOH (40%) were mixed and stirred for 90 min. A solution of 0.37 g. ZrOCl2*8H2O in 3 g. water was added slowly and the gel was subsequently allowed to age for 7 hours while stirred. At this point 4.04 g. HF (40%) was added under stirring which produced a white rigid gel. An aqueous suspension of 0.36 g. dealuminated beta seeds in 2.5 g. demineralized water was sonicated for 5 minutes and then added to the gel while mixing. The gel was manually homogenized before it was transferred to a Teflon cup with lid which was inserted into a stainless steel autoclave for crystallization. The autoclave was rotated at a speed of 20 rpm. while kept at a temperature of 140 °C for 20 days. The pure siliceous and the aluminum containing zeolite Beta from Table 1 were synthesized using an identical procedure as the one described for the Zr-Beta. Though with the exception of either excluding the addition of the metal salt or replacing the zirconium salt with 0.83 g. of Al(NO3)3*5H2O, respectively. The crystallization times in both these syntheses were 10 days.
Synthesis of Sn-Beta Synthesis of Sn-Beta was done according to a previous published procedure[s1,s4] introducing minor modifications described here. A molar oxide ratio in the gel before aging of 0.008 SnO2: 1 SiO2: 0.27 (TEA)2O: 0.54 HF: 11 H2O was aimed for. 30 g TEOS was mixed with 33 g. TEAOH (35%) while stirring. After 90 minutes a solution of 0.42 g. SnCl4*5H2O in 2.75 g. water was added. The gel was allowed to age for 10 hours under stirring to allow for ethanol formed by hydrolysis of TEOS to evaporate. 3.86 g. HF (40%) was added drop-wise under stirring which produced a rigid gel. 0.36 g. of dealuminated beta seeds suspended in 1.75 g. of water was sonicated for 5 minutes and then added to the gel while mixing. The gel was manually homogenized before it was transferred to a Teflon cup with lid which was inserted into a stainless steel autoclave for crystallization. The autoclave was rotated at a speed of 20 rpm. while kept at a temperature of 140 °C for 22 days.
Product recovery and ion-exchange procedure After crystallization the autoclaves were allowed to cool to room temperature. The products were isolated by suction filtration. The zeolites were washed by two fold resuspension in demineralized water and subsequently dried at 110 °C overnight. The dried zeolites were calcined in static air at 550 °C for 6 hours using a ramp of 2 °C/min to remove the structure directing agent. The zeolite Beta containing aluminum was ion-exchanged into the ammonia form by suspending it in a 1 M. NH4NO3 solution at 50 °C for 2 hours. The zeolite was isolated and resuspended two additional times to ensure complete exchange. The proton form of the zeolite was obtained by drying at 110 °C and calcination in static air at 550 °C for 6 hours using a ramp of 2 °C/min.
Incipient wetness impregnation method The Si-Beta impregnated metal oxides were synthesized by following the procedure: 0.5 ml of an aqueous solution of the appropriate amount of metal precursor (tin(IV) chloride penthydrate, aluminum nitrate nonahydrate, zirconium(IV) oxychloride octahydrate and titanium (IV) ethoxide) was added drop-wise on to appropriate amount of Si-Beta zeolite. The mixture was physically
95

s4
mixed using a spatula. The solid material was dried at 80 ºC for 2 h and the dried solid material was then calcined at 450 ºC for 4h. In the case of titanium, the titanium source was dissolved in ethanol instead of water. The silicon to metal ratio was 125:1 in all cases.
Catalyst characterization
Table s1 presents an overview of the samples used in this study.
Table s1.
Sample Seeded Synthesis time /days
Si/Metal* Crystal size (SEM)**
SBET
(m2/g) Vmicropore
(ml/g)Cyclohexanone shift
(FT-IR) Si-Beta + 10 - 0.5-2 µm 462 0.19 -
Sn-Beta + 22 125 0.5-2 µm 478 0.19 49 cm-1
Zr-Beta + 20 125 0.5-2 µm 506 0.20 28 cm-1
Ti-Beta ÷ 10 125 2-8 µm 492 0.20 22 cm-1
Al-Beta + 10 65 0.5-2 µm 449 0.19 n.a
Al-Beta (steamed at 750 °C) 65 450 0.19 n.a
Si-Beta SnO2-Imp 125 458 0.19 n.a
Si-Beta ZrO2-Imp 125 453 0.19 n.a
Si-Beta TiO2-Imp 125 464 0.19 n.a
Si-Beta Al2O3-Imp 125 460 0.19 n.a
SnO2 nanopowder - !100 nm*** 19 - n.a
*Si/Metal ratio in the synthesis gel or from impregnation, **Estimated from SEM imaging, ***From BET by supplier
XRD XRD analyses were performed on a Bruker AXS powder diffractometer. Figure s2 shows the XRD diffractograms of the key materials from Table s1 after calcination. XRD analyses reveals that all samples are phase pure zeolite Beta with a good crystallinity. This is supported by the consistent micropore volumes of 0.19-0.20 ml/g (calculated from the t-plot method) given in Table s1.
10 20 30 40 50
0
10000
20000
30000
40000
(e)
(d)
(c)
(b)
Co
un
ts a
.u.
2*Theta / o
(a)
Figure s2. XRPD diffractograms of the key samples from Table s1, Si-Beta (a), Sn-Beta (b), Zr-Beta (c), Ti-Beta (d) and Al-Beta (e). Diffractograms are moved 5000 counts in-between for illustrative reasons.
96

s5
It is noteworthy, as has previously been observed[s3], that the incorporated of zirconium (c) shifts the relative abundance of the possible polymorphs of zeolite beta. With regard to crystal integrity as a function of the dealumination procedure, Figure s3 shows the XRD diffractograms of the original Al-Beta sample (a) along with the steam dealuminated sample (b). It is apparent from the diffractograms that the dealuminated zeolite has preserved its overall crystallinity which further is supported by the unchanged micropore volume of 0.19 ml/g given in Table s1. Presumably this can be attributed to the relative low aluminum content of the structure.
0 10 20 30 40 50
0
10000
20000
(b)
Cou
nts
a
.u.
2*Theta / o
(a)
Figure s3. XRD diffractograms of Al-Beta and (a) and steam dealuminated Al-Beta (b). (b) is moved 4000 counts for illustrative reasons.
N2-sorption experiments N2-sorption experiments were performed on a Micromeritics ASAP 2020 apparatus. Prior to sorption analyses samples were outgassed in vacuum at 300 °C for 2 hours. Surface area and micropore volume were calculated by applying the BET and t-plot methods, respectively.
Ammonia-TPD of steam dealuminated Al-Beta Steam dealumination of zeolite Beta was done at 750 °C in argon. A flow of 35 ml/min was saturated with water at 298 K and lead over the finely dispersed zeolite for 20 hours. The oven temperature of 750 °C was reached from RT within one hour of heating (~12 °C /min).
NH3-TPD analyses were performed on a Micromeretics Autochem II instrument. Pretreatment was done by first saturating the zeolites with ammonia followed by desorption of weakly bound NH3 at either 100 °C or 150 °C for 2 hours. Subsequently the actual temperature programmed desorption was performed. Dry weights of the zeolites were measured by outgassing the zeolites in vacuum for 1 hour at 300 °C.
We chose to monitor the acidity of the parent and dealuminated Al-Beta by NH3-TPD. Figure s4 (a) and (b) shows the NH3 desorption curves obtained after desorbing weakly adsorbed ammonia at 100 °C and 150 °C, for 2 hours respectively. Clearly the acidity of the samples is affected by the steam treatment. We observe a significant reduction in the band attributed to strong acidity centered at 335 °C as a function of the dealumination. The location of this band correlates well with what we expect arising from strong Brønsted acidity of zeolite Beta. We attribute the reduction of this band to dealumination of the structure. Furthermore, the dealumination could add to desorption in the low or medium temperature regime from NH3 adsorbed on EFAL species as we observe in (a).
97

s6
100 200 300 400 500
0,00
0,02
0,04
0,06
0,08
0,10
TC
D s
ign
al /
g zeoli
te
(a.u
.)
Temperature / °C
Al-Beta
Al-beta (Steamed at 750 °C)
33
5 °
C
(A)
100 200 300 400 500
0,00
0,02
0,04
0,06
0,08
0,10
TC
D s
ign
al /
gze
oli
te
(a.
u.)
Temperature / °C
Al-Beta
Al-Beta (Steamed at 750 °C)33
5 °
C
(B)
Figure s4. NH3-TPD of Al-Beta and steam dealuminated Al-Beta. Desorption curves in (A) are obtained after desorbing weakly adsorbed NH3 at 100 °C for 2 hours prior to measurement and (B) is obtained after a corresponding desorption at 150 °C.
FT-IR using cyclohexanone as a probe For infrared analysis a BioRad FTS 80 spectrometer equipped with a MCT detector operated in transmission mode was used. The zeolites investigated were pressed into self supporting wafers and mounted in at home-built Pyrex cell equipped with NaCl windows and connected to a vacuum line. Prior to analysis samples were dehydrated at 400 °C for 2 hours, reaching a background pressure of <5*10-5 torr. The spectra were recorded after allowing the samples to cool to room temperature. Cyclohexanone was used as a molecular probe in this study. Liquid cyclohexanone was cooled in an ice bath and connected to the IR-cell through a double lock system. Cyclohexanone was dosed by exposing the sample to small aliquots of cyclohexanone vapor. A series of absorbance spectra were recorded in-between the stepwise dosing.
Cyclohexanone was used as a molecular probe to determine the relative Lewis acidic strength of metals isomorphously substituted into the structure of zeolite Beta. It has previously been reported that cyclohexanone coordinated to a strong Lewis acidic site in a zeolite leads to a shift in the stretch frequency of the carbonyl functionality compared to the non-coordinated carbonyl. Further the Lewis acidic strength of the material is thought to correlate with the magnitude of the observed shift[s5,s6,s7]. The zeolites investigated here with infrared spectroscopy possess strong Lewis acidity originating from the non-silicon elements (Ti, Zr and Sn) present in the framework. Importantly this is in contrast to the same elements impregnated onto siliceous zeolite beta which does not possess this strong acidity.[s6] Figure s5 presents the IR region including the zeolite framework overtone as well as the characteristic carbonyl stretch frequencies interesting when probing with cyclohexanone. The pure siliceous zeolite Beta along with the zeolites containing Ti, Zr or Sn from Table s1 were investigated. The absorption spectrum of the dehydrated zeolites corresponds to the lower bold curve in Figure s5 a-d.
98

s7
1900 1850 1800 1750 1700 1650 1600
17
05
cm
-1
16
78
cm
-1
Wavenumber /cm-1
17
17
cm
-1
1.0 A.U.
a
1900 1850 1800 1750 1700 1650 1600
17
17
cm
-1
166
8 c
m-1
167
8 c
m-1
Wavenumber /cm-1
1.0 A.U.
b
1900 1850 1800 1750 1700 1650 1600
171
7 c
m-1
168
9 c
m-1
16
78
cm
-1
Wavenumber /cm-1
c
1.0 A.U.
1900 1850 1800 1750 1700 1650 1600
1717
cm
-1
16
78 c
m-1
1695
cm
-1
Wavenumber /cm-1
d
1.0 A.U.
Figure s5. FT-IR spectra recorded in-between aliquot of cyclohexanone dosed to Si-Beta (a), Sn-Beta (b), Zr-Beta (c) and Ti-Beta (d).
From (a) it can be seen that at low cyclohexanone loadings two distinct absorptions are present for the purely siliceous zeolite beta, namely at 1717 cm-1 and at 1704 cm-1. However at the high and very high loadings absorption at 1678 cm-1 appears. This later absorption is very important since it interferes with the region of the Lewis shifted carbonyl absorptions. Dosing cyclohexanone onto the clean zeolite one would expect cyclohexanone to predominantly adsorb on the strong Lewis acidic sites and the interfering 1678 cm-1 absorption to occur only at high cyclohexanone loadings. For this reason we have chosen to perform the IR experiments by dosing very small amounts of cyclohexanone in sequence while recording the absorption spectrum in-between.
In the case of Sn-Beta (b) it is clear from the initial aliquots that a band at 1668 cm-1
appears along with the 1717 cm-1 and 1704 cm-1 absorptions. Further more at higher loadings the 1717 cm-1 and 1704 cm-1 absorptions increase and finally the 1678 cm-1 absorption may be seen. Comparing the shifted 1668 cm-1 band to the carbonyl frequency of the physically adsorbed cyclohexanone a shift of 49 cm-1 is calculated. A very similar carbonyl shift of 48 cm-1 has been reported by Corma et al.[s6] for cyclohexanone interacting with Sn-Beta. From the adsorption series in (c) and (d) the induced shift for cyclohexanone adsorbed in Zr-Beta and Ti-beta could be determined to 28 cm-1 and 22 cm-1, respectively. Interestingly, this provides an explanation as to
99

s8
why a much higher catalytic activity for Sn-Beta is observed compared to Zr-Beta and Ti-Beta. Zr-Beta and Ti-Beta are similarly active in the DHA isomerisation reaction, corresponding to them possessing comparable Lewis acidic strengths as measured here by cyclohexanone adsorption. Cyclohexanone adsorption studies using FT-IR is a convenient way to ensure that the metal is incorporated into the zeolite structure since extra framework species do not possess the same Lewis acidic strengths as the framework incorporated samples do.
References used in the supplementary information [s1] S. Valencia, A. Corma, US 5968473A, 1999[s2] T. Blasco, M. A. Camblor, A. Corma, P. Esteve, A. Martínez, C. Prieto, S. Valencia, Chem.
Commun., 1996, 2367. [s3] Y. Zhu, G. Chuah, S. Jaenicke, J. Catal. 2004, 227, 1. [s4] M. Renz, T. Blasco, A. Corma, V. Fornés, R. Jensen, L. Nemeth, Chem. Eur. J., 2002, 8,
4708. [s5] A. Corma, M. E. Domaine, S. Valencia, J. Catal., 2003, 215, 294. [s6] A. Corma, M. E. Domine, L. Nemeth, S. Valencia, J. Am. Chem. Soc., 2002, 124, 3194. [s7] Y. Zhu, G. Chuah, S. Jaenicke, Chem. Commun., 2003, 2734.
100

2% (8). However, they constitute a significantfraction of the supermassive black hole massdensity in the universe (29). Adding the extraobscured accretion reported here, which lasts aslong as the optically bright phase, increases ouroriginal estimate of the integrated black hole massdensity at z = 0 by 4%, to 4.5 ! 105 M! Mpc"3
(8). Including this additional contribution, theintegrated black hole growth in the obscured qua-sar phase is 1.3 ! 105 M! Mpc"3, or ~ 30% ofthe total black hole mass density at z = 0, inagreement with our conclusion that the obscuredquasar phase can harbor a large fraction of theblack hole growth (30). Our results are in agreementwith recent estimates (26) that suggest an averageaccretion efficiency of #10% even accounting forheavily obscured accretion.
References and Notes1. By quasar, we refer here to the most luminous members
of the AGN family, typically MB < !23, LX > 1044 erg/s orLbol > 1045 erg/s.
2. M. Schmidt, Nature 197, 1040 (1963).3. G. T. Richards et al., Astrophys. J. 180 (suppl.), 67
(2009).4. A. J. Barger et al., Astron. J. 126, 632 (2003).5. N. L. Zakamska et al., Astron. J. 126, 2125 (2003).
6. A. Martínez-Sansigre et al., Mon. Not. R. Astron. Soc.370, 1479 (2006).
7. R. Gilli, M. Salvati, G. Hasinger, Astron. Astrophys. 366,407 (2001).
8. E. Treister, C. M. Urry, S. Virani, Astrophys. J. 696, 110 (2009).9. D. B. Sanders et al., Astrophys. J. 325, 74 (1988).10. D. B. Sanders, I. F. Mirabel, Annu. Rev. Astron. Astrophys.
34, 749 (1996).11. J. E. Barnes, L. E. Hernquist, Astrophys. J. 370, L65 (1991).12. R. Genzel et al., Astrophys. J. 498, 579 (1998).13. By heavily obscured, we refer here to sources with neutral
hydrogen column densities NH > 1023 cm!2, enough tohide most of the soft x-rays to optical quasar signatures.
14. P. Tozzi et al., Astron. Astrophys. 451, 457 (2006).15. D. M. Alexander et al., Astrophys. J. 687, 835 (2008).16. F. Fiore et al., Astrophys. J. 693, 447 (2009).17. E. Treister et al., Astrophys. J. 706, 535 (2009).18. D.-C. Kim, D. B. Sanders, Astrophys. J. 119 (suppl.), 41 (1998).19. P. F. Hopkins, L. Hernquist, T. J. Cox, D. Keres, Astrophys. J.
175 (suppl.), 356 (2008).20. P. F. Hopkins et al., http://arxiv.org/abs/0906.5357 (2009).21. D. Marchesini et al., Astrophys. J. 701, 1765 (2009).22. T. Dahlen et al., Astrophys. J. 654, 172 (2007).23. G. Hasinger, T. Miyaji, M. Schmidt, Astron. Astrophys.
441, 417 (2005).24. A. J. Barger et al., Astron. J. 129, 578 (2005).25. G. T. Richards et al., Astron. J. 131, 2766 (2006).26. A. Martínez-Sansigre, A. M. Taylor, Astrophys. J. 692, 964
(2009).27. M. Dietrich, S. Mathur, D. Grupe, S. Komossa, Astrophys. J.
696, 1998 (2009).
28. M. Vestergaard, P. S. Osmer, Astrophys. J. 699, 800 (2009).29. M. G. Haehnelt, P. Natarajan, M. J. Rees, Mon. Not. R.
Astron. Soc. 300, 817 (1998).30. This integrated value was obtained assuming an accretion
efficiency of 0.1 and is in very good agreement withobservational results (31), even after incorporating thisadditional accretion.
31. A. Marconi et al., Mon. Not. R. Astron. Soc. 351, 169(2004).
32. R. Della Ceca et al., Astron. Astrophys. 487, 119 (2008).33. S. H. Teng et al., Astrophys. J. 691, 261 (2009).34. Support for the work of E.T. and K.S. was provided by the
National Aeronautics and Space Administration (NASA)through Chandra/Einstein Postdoctoral Fellowship awardnumbers PF8-90055 and PF9-00069, respectively, issuedby the Chandra X-ray Observatory Center, which isoperated by the Smithsonian Astrophysical Observatoryfor and on behalf of NASA under contract NAS8-03060.P.N. acknowledges the Radcliffe Institute for AdvancedStudy where this work was started. C.M.U. acknowledgessupport from NSF grant AST-0407295.
Supporting Online Materialwww.sciencemag.org/cgi/content/full/science.1184246/DC1SOM TextFigs. S1 and S2References
4 November 2009; accepted 17 March 2010Published online 25 March 2010;10.1126/science.1184246Include this information when citing this paper.
Conversion of Sugars toLactic Acid Derivatives UsingHeterogeneous Zeotype CatalystsMartin Spangsberg Holm,1,2,3* Shunmugavel Saravanamurugan,1,2* Esben Taarning2,3†
Presently, very few compounds of commercial interest are directly accessible from carbohydratesby using nonfermentive approaches. We describe here a catalytic process for the direct formationof methyl lactate from common sugars. Lewis acidic zeotypes, such as Sn-Beta, catalyze theconversion of mono- and disaccharides that are dissolved in methanol to methyl lactate at160°C. With sucrose as the substrate, methyl lactate yield reaches 68%, and the heterogeneouscatalyst can be easily recovered by filtration and reused multiple times after calcinationwithout any substantial change in the product selectivity.
Carbohydrates represent the largest frac-tion of biomass, and various strategiesfor their efficient use as a commercial
chemical feedstock are being established in theinterest of supplementing, and ultimately replac-ing, petroleum (1–4). The thermal instability ofcarbohydrates is a major obstacle in this regard,and biochemical processes have proven to bemore applicable than catalytic ones, in part be-cause of their ability to operate at low temper-
atures. On the other hand, catalysis often presentsimproved process design options, resulting inhigher productivity and reduced costs related toproduct work-up. Indeed, catalysis has proven to
be scalable and able to supply numerous low-costproducts from petroleum.
In contrast to the case for biochemical pro-cesses, relatively few products are directly ob-tainable from carbohydrates by using catalysis.Gluconic acid and sorbitol can be obtainedfrom glucose by oxidation and hydrogenation,respectively, and acidic catalysts are currentlybeing examined for the direct production of 5-hydroxymethylfurfural (HMF) (5–7). However,currently the production of fuels and value-added compounds from carbohydrates is domi-nated by fermentative processes (8). An importantexample is the fermentation of glucose to lacticacid, which is used for the production of bio-degradable plastics (9, 10) and solvents (11, 12).Lactic acid has also been investigated as a pre-cursor to the production of a wide range of use-ful compounds through catalytic transformation(13, 14). However, the future role of lactic acidwill largely depend on its production costs. Be-cause the fermentation of glucose to lactic acid
1Centre for Catalysis and Sustainable Chemistry, Depart-ment of Chemistry, Technical University of Denmark, AnkerEngelundsvej 1, 2800 Kongens Lyngby, Denmark. 2Centerfor Sustainable and Green Chemistry, Department of Chem-istry, Technical University of Denmark, Anker Engelundsvej1, 2800 Kongens Lyngby, Denmark. 3Haldor Topsøe A/S,Nymøllevej 55, 2800 Kongens Lyngby, Denmark.
*These authors contributed equally to this work.†To whom correspondence should be addressed. E-mail:[email protected]
Fig. 1. Proposed reactionpathway for the conversionof fructose to methyl lac-tate. The reaction formallycomprises a retro aldol frag-mentation of fructose andisomerization-esterificationof the trioses.
OH
OH
OH
OH
HO
O
OH
OH
O
O
OH
HO
O
O
–H2O
+MeOHOH
O
O
1,2 hydride shiftO
OH
O
Fructose
Dihydroxyacetone
PyruvaldehydeMethyl lactate
GlyceraldehydeRetro-aldol reaction
30 APRIL 2010 VOL 328 SCIENCE www.sciencemag.org602
REPORTS
101

involves the coproduction of large amounts of saltwaste, a less expensive route would be an impor-tant step toward a biomass-based chemical industryusing lactic acid more widely as a feedstock. Herewe show that sucrose, glucose, and fructose dis-solved in methanol can be converted directly intoracemic methyl lactate in yields up to 68% in aprocess resembling the alkaline degradation of sug-ars. Methyl lactate can be purified by distillation,and its one-pot formation offers an advantage overthe fermentative route, wherein the esterificationof lactic acid to methyl lactate is often necessary.
We recently reported that Lewis acidic zeolitesand zeotypes efficiently catalyze the conversion,in methanol, of the two trioses dihydroxyace-tone and glyceraldehyde to methyl lactate atmoderate temperatures (15, 16). Here we re-port that while investigating the properties ofthe Sn-Beta zeolite for fructose transformation,we discovered that, at elevated temperatures,fructose is transformed to methyl lactate in yieldsof up to 44%. We assume that this reaction pro-ceeds via a retro aldol reaction of fructoseforming two trioses (Fig. 1). These trioses are
readily converted to the thermodynamically verystable methyl lactate through sequential dehy-dration and methanol addition, followed by a1,2-hydride shift as reported previously (15–17).Indeed, at intermediate reaction times, small amountsof unconverted triose sugars were observed by high-performance liquid chromatography (HPLC),supporting the existence of this reaction pathway.
A retro aldol reaction is favored at high tem-peratures, and fructose and glucose are knownto undergo fragmentation in supercritical waterto form C2 to C4 carbohydrate products (18, 19).In the presence of aqueous alkali hydroxides,the transformation of the monosaccharides tolactate salts occurs at milder conditions (100°to 260°C) (20–22). However, to obtain high lac-tate yields, a stoichiometric amount of base isrequired because of the acid-base reaction be-tween lactic acid and hydroxide. For the Sn-Beta–catalyzed reaction in methanol, we observedmethyl lactate formation from fructose at tem-peratures as low as 140°C. This observationsuggests that the retro aldol reaction is the rate-determining step in the overall transformationof fructose, because methyl lactate is readilyformed from trioses at lower temperatures (80°C)(15). Glucose and sucrose are less expensive andmuch more abundant sugars than fructose, andtherefore these substrates were also investigatedfor the production of methyl lactate.
We have synthesized highly crystalline Betazeolites and zeotypes with the BEA frameworktopology that differ in the type of metal that isincorporated into the framework according toestablished procedures (23). They can be dividedinto Lewis acidic (Ti-, Sn-, and Zr-Beta), Brønstedacidic (H-Al-Beta), and nonacidic (Si-Beta)classes. These materials contain well-definedmetal single sites that were found to have cata-lytic activity in various reactions (24–26). ZeoliteBeta has a three-dimensional porous system with12-ring pores that are sufficiently large to accom-modate acyclic monosaccharides (27).We testedthese materials for the conversion of sugars at160°C in an autoclave setup (Table 1).
In agreement with previous reports (28), wefound that the Brønsted acidic zeolite H-Al-Betacatalyzes the dehydration of the sugars, leadingto HMF derivatives and methyl levulinate fromfructose and predominantly methyl-D-pyranosidefrom glucose and sucrose (table S1). The Lewisacidic zeolites, on the other hand, were found toinduce high selectivities toward methyl lactate.Sn-Beta is the most selective, giving a methyllactate yield of 64 to 68%, which was calcu-lated on a carbon basis when using sucrose asthe substrate. Of the three Lewis acidic zeo-lites, Sn-Beta has the strongest Lewis acidicsites, which could explain its higher selectivity(15, 29). However, both Zr-Beta and Ti-Beta arecapable of producing methyl lactate in moderateyields (31 to 44%). The nonacidic Si-Beta didnot improve the yield of methyl lactate over thatof the background reaction, indicating that thecatalytic ability is related to the Lewis acidity of
Table 1. Conversion of sugars using different zeolite and zeotype materials. Substrate (225 mg),catalyst (160 mg), naphtalene (120 mg), and methanol (8.0 g) were stirred in an autoclave at 160°Cfor 20 hours. Yields are calculated on a carbon basis and given as mean values. The key experimentsconverting sucrose using Ti-, Zr-, and Sn-Beta were repeated five times (see table S5 for statisticalinformation). Conversion is calculated based on the amount of unconverted hexoses. Si/M, Si/metal ratioin the synthesis gel.
Catalyst Si/M Substrate ConversionYield of
methyl lactate
H-(Al)-Beta 125 Glucose 97% 0%H-(Al)-Beta 125 Fructose >99% 1%H-(Al)-Beta 125 Sucrose 99% 0%Ti-Beta 125 Glucose 99% 31%Ti-Beta 125 Fructose >99% 36%Ti-Beta 125 Sucrose 98% 44%Zr-Beta 125 Glucose 99% 33%Zr-Beta 125 Fructose >99% 33%Zr-Beta 125 Sucrose 99% 40%Sn-Beta 125 Glucose >99% 43%Sn-Beta 125 Fructose >99% 44%Sn-Beta 125 Sucrose >99% 64%Si-Beta — Glucose 61% 5%Si-Beta — Fructose 79% 9%Si-Beta — Sucrose 63% 6%No catalyst — Glucose 53% 5%No catalyst — Fructose 67% 8%No catalyst — Sucrose 54% 6%SnCl4·5H2O* — Sucrose 99% 31%SnO2† — Sucrose 81% 4%
*Equivalent molar amount of Sn as for 160-mg Sn-Beta. †160 mg of SnO2 used.
Fig. 2. Comparison of different sol-vents and reaction conditions forthe conversion of sucrose using Sn-Beta (Si:Sn 165). Sucrose (225 mg),Sn-Beta (160 mg), and solvent(8.0 g) were stirred at 160°C for 20hours.
Wate
r
Meth
anol
Ethanol
2-Pro
panol
Meth
anol (4 x
substra
te)
Meth
anol (2.5
wt. %
wate
r)
Meth
anol (Ery
thro
se)
0
10
20
30
40
50
60
70
80
90
100
Yie
ld %
Levulinic acid
Hydroxymethylfurfural
Alkyl vinylglycolate
Lactic acid / Alkyl lactate
www.sciencemag.org SCIENCE VOL 328 30 APRIL 2010 603
REPORTS
102

the metals incorporated into the zeolite structure.Homogeneous SnCl4 as well as nanocrystallineSnO2, were also tested in the reaction. SnO2 isinactive, whereas SnCl4 shows moderate selec-tivity toward methyl lactate.
Glucose conversion proceeds in yields ofmethyl lactate comparable to those from fruc-tose. We found that the Sn-Beta catalyst is ca-pable of catalyzing Lobry-de Bruyn-van Ekensteinisomerization of glucose to fructose at low tem-peratures (100°C), which explains the similaryields obtained when using either of the hexoses.In addition, we observed that the disaccharidesucrose gives a substantially higher yield ofmethyl lactate as compared with fructose andglucose. This trend has also been observed forthe alkaline degradation of fructose, glucose, andsucrose in water (20, 21). This result is sur-prising, because the overall reaction pathwayfrom sucrose to methyl lactate is thought toinvolve the intermediary formation of glucoseand methyl fructoside by methanolysis, fromwhich fructose is then formed via isomerizationand hydrolysis, respectively (fig. S1).
Methyl lactate is not the only product formedduring the reaction. The largest volatile coproductis methyl vinylglycolate (methyl 2-hydroxy-3-butenoate), which is formed in yields rangingfrom 3 to 11% in all cases when using the Lewisacidic catalysts. Retro aldol reaction of glucosewill produce erythrose (C4 sugar) and glycol-aldehyde (C2). Methyl vinylglycolate formationcould proceed by a reaction pathway analogousto that forming methyl lactate from trioses (fig.S1). To support this hypothesis, we heated D-erythrose to 160°C in methanol with Sn-Beta asthe catalyst, and we observed methyl vinylgly-colate formation in a considerably higher yield(56%) than that of methyl lactate (6%). Thus,tetroses appear to be precursors for methyl vinyl-glycolate (Fig. 2). Other products that wereformed in small amounts from the mono- anddisaccharides when using Sn-Beta are glycol-aldehyde dimethylacetal (<1%), formaldehydedimethylacetal (<1%), and methyl glycolate(<0.5%). Furthermore, we observed trace amountsof methyl 2-hydroxy butyrate and small amountsof methoxy derivatives of furfural and HMF(table S1 and fig. S2). Many of these productsare similar to the saccharinic acids that areformed in the alkaline degradation of sugars,where major products are lactic acid, glycolicacid, 2,4-dihydroxybutanoic acid, as well ashigher C6 acids (21). In the case of Sn-Beta, weobserved, using HPLC analysis, the presence ofa noticeable amount of highly polar products,which could be methyl esters of the higher C6
saccharinic acids. The combined yields of methyllactate (68%) and methyl vinylglycolate (8%)exceed 75% for sucrose on a carbon basis whenSn-Beta (Si:Sn 165) is used as the catalyst. Whenthe amount of sucrose and glucose is increasedby a factor of four [>10 weight percent (wt %) inmethanol], similar combined yields of methyllactate and methyl vinylglycolate are obtained,
and full conversion is still reached within 20 hours(Fig. 2). In this experiment, the average turnovernumber per Sn atom is >400 for the production ofmethyl lactate based on the assumed participationof all Sn atoms in the catalyst. A further increasein sucrose concentration to 20 wt % causes a dropin the yields of methyl lactate (47%) and methylvinylglycolate (12%) in an experiment using twicethe amount of Sn-Beta.
Changing the solvent from methanol tohigher alcohols or water leads to the formationof the corresponding alkyl lactates and freelactic acid, respectively (Fig. 2 and see table S2for data for glucose and fructose). Low amounts(<30%) of lactic acid are formed in water to-gether with HMF (1 to 2%) and levulinic acid(~5%). Additionally, temperature-programmedoxidation showed that more carbon is depositedon the catalyst when water is used as the solvent(7.0 wt % of carbon per g catalyst) in place ofmethanol (1.3 wt %) (table S3). The change inthe product composition when using water asthe solvent can be explained by the auto-catalyticeffect of the organic acids formed. Lactic acidand levulinic acid, being Brønsted acids, willshift the course of the reaction toward that typ-ically seen with Brønsted acid catalysts (HMF,levulinic acid); the result is lower yields of thea-hydroxycarboxylic acid products formed inthe pathway catalyzed by Lewis acids. Becausesmall amounts of water are formed during thereaction, we examined the effect of water inmethanol. Using a solvent mixture consisting of2.5 wt % water in methanol, we obtained yieldsof methyl lactate similar to those obtained in puremethanol (Fig. 2). Changing the solvent to higheralcohols leads to a decrease in alkyl lactate se-lectivity. In ethanol, 39%of ethyl lactate is formedusing sucrose as the substrate and Sn-Beta asthe catalyst, whereas 25% of isopropyl lactate isformed in i-propyl alcohol.
Long-term stability is a very important char-acteristic for a heterogeneous catalyst. We there-fore explored the prospects for reusing Sn-, Zr-,and Ti-Beta (Fig. 3). Each catalyst was used sixtimes for the conversion of sucrose after calcin-ing between each run to burn away deposited
carbon. The catalysts were found to remainactive with an almost unchanged selectivityeven after the sixth reuse (fig. S5). After thefifth run, the zeotypes were calcined and ana-lyzed by N2-sorption and x-ray powder diffrac-tion (XRPD) (fig. S6 and table S3). Analysisshows that the BEA structure is preserved andthe micropore volumes for Ti-Beta and Zr-Betaremain constant; a very small volume decreasefrom 0.201 ml/g to 0.197 ml/g was observed forSn-Beta. These data after >100 hours of catalystuse thus show promising stability character-istics. Further examination of the catalyst stabil-ity using a fixed bed reactor shows that Sn-Betadeactivates gradually as a function of time onstream (fig. S7). This indicates that the ability toregenerate the activity by calcination is an im-portant feature of the catalyst. The reusability ofLewis acidic zeolites and zeotypes has also beenreported in other reactions (30, 31).
In contrast to the alkaline degradation, acid-catalyzed conversion of mono- and disaccha-rides does not consume a stoichiometric amountof base. However, the reaction pathway in theacid-catalyzed conversion is highly sensitive tothe type of acid used. Whereas Brønsted acidscatalyze monosaccharide dehydration reactions,leading primarily to HMF and its decompositionproducts, Lewis acidic zeotype catalysts lead toretro aldol reaction of the monosaccharides andsubsequent transformation to a-hydroxycarboxylicacid derivatives. To achieve a high selectivity inthe Lewis acid–catalyzed pathway, it is impor-tant to diminish the catalytic effect of Brønstedacids, for example, by using a solvent such asmethanol in which esters, rather than free car-boxylic acids, are formed.
Unlike the primary product of the Brønstedacid–catalyzed reaction, HMF, a market alreadyexists for lactic acid and its ester derivatives.These compounds are now accessible from su-crose, glucose, and fructose, using non-noblemetal–containing catalysts. However, the catalyticprocess results in a racemic product mixture. Thisplays no role for solvent or feedstock end-use,but enantiomeric purity is an important parameterin the production of biodegradable plastics.
0 1 2 3 4 5 60
10
20
30
40
50
60
70
80
90
100
0
10
20
30
40
50
60
70
80
90
100
Reuse sequence
Sn-BetaTi-BetaZr-BetaC
on
vers
ion
of
su
cro
se %
A
Zr-Beta Ti-Beta Sn-Beta
B
Yie
ld %
Methyl vinylglycolateMethyl lactate
First through sixth reuse of the zeotypes
Fig. 3. Reuse of Sn-, Zr-, and Ti-Beta (Si/metal: 125) for the conversion of sucrose in methanol,with calcination of the zeotypes between each experiment. (A) Conversion of sucrose and (B) yieldsof methyl lactate and methyl vinylglycolate in the reuse experiments.
30 APRIL 2010 VOL 328 SCIENCE www.sciencemag.org604
REPORTS
103

References and Notes1. G. W. Huber, S. Iborra, A. Corma, Chem. Rev. 106, 4044
(2006).2. H. Danner, R. Braun, Chem. Soc. Rev. 28, 395 (1999).3. A. Corma, S. Iborra, A. Velty, Chem. Rev. 107, 2411
(2007).4. C. H. Christensen, J. Rass-Hansen, C. C. Marsden,
E. Taarning, K. Egeblad, Chem. Sus. Chem. 1, 283(2008).
5. H. Zhao, J. E. Holladay, H. Brown, Z. C. Zhang, Science316, 1597 (2007).
6. Y. Román-Leshkov, J. N. Chheda, J. A. Dumesic, Science312, 1933 (2006).
7. M. Bicker, J. Hirth, H. Vogel, Green Chem. 5, 280(2003).
8. M. E. Himmel et al., Science 315, 804 (2007).9. J. Lunt, Polym. Degrad. Stabil. 59, 145 (1998).
10. E. T. H. Vink, K. R. Ràbago, D. A. Glassner, P. R. Gruber,Polym. Degrad. Stabil. 80, 403 (2003).
11. K. L. Wasewar, A. A. Yawalkar, J. A. Moulijn,V. G. Pangarkar, Ind. Eng. Chem. Res. 43, 5969(2004).
12. R. Datta, M. Henry, J. Chem. Technol. Biotechnol. 81,1119 (2006).
13. Y. Fan, C. Zhou, X. Zhu, Catal. Rev. 51, 293 (2009).14. J. C. Serrano-Ruiz, J. A. Dumesic, Chem. Sus. Chem 2,
581 (2009).15. E. Taarning et al., Chem. Sus. Chem 2, 625
(2009).16. R. M. West et al., J. Catal. 269, 122 (2010).17. Y. Hayashi, Y. Sasaki, Chem. Commun. (Camb.) (21):
2716 (2005).18. T. M. Aida et al., J. Supercrit. Fluid. 42, 110 (2007).19. M. Sasaki, K. Goto, K. Tajima, T. Adschiri, K. Arai,
Green Chem. 4, 285 (2002).20. R. Montgomery, Ind. Eng. Chem. 45, 1144 (1953).21. B. Y. Yang, R. Montgomery, Carbohydr. Res. 280, 47
(1996).22. G. Braun, U.S. patent 2,024,565 (1935).23. Materials and methods are available as supporting
material on Science Online.24. J. M. Thomas, R. Raja, D. W. Lewis, Angew. Chem. Int. Ed.
44, 6456 (2005).25. M. Boronat, A. Corma, M. Renz, P. M. Viruela, Chemistry
12, 7067 (2006).26. A. Corma, J. Catal. 216, 298 (2003).27. J. Jow, G. L. Rorrer, M. C. Hawley, D. T. A. Lamport,
Biomass 14, 185 (1987).
28. P. Rivalier, J. Duhamet, C. Moreau, R. Durand,Catal. Today 24, 165 (1995).
29. M. Renz et al., Chemistry 8, 4708 (2002).30. J. C. van der Waal, E. J. Creyghton, P. J. Kunkeler, K. Tan,
H. van Bekkum, Top. Catal. 4, 261 (1997).31. A. Corma, M. E. Domine, L. Nemeth, S. Valencia, J. Am.
Chem. Soc. 124, 3194 (2002).32. The Catalysis for Sustainable Energy initiative is funded
by the Danish Ministry of Science, Technology andInnovation. The Center for Sustainable and GreenChemistry is sponsored by the Danish National ResearchFoundation. Haldor Topsøe A/S holds patent applicationEP 090137829 related to the work described in thisreport. The authors thank C. Hviid Christensen (HaldorTopsøe A/S) for helpful advice.
Supporting Online Materialwww.sciencemag.org/cgi/content/full/328/5978/602/DC1Materials and MethodsFigs. S1 to S8Tables S1 to S6References
29 October 2009; accepted 17 March 201010.1126/science.1183990
Recent Hotspot Volcanism on Venusfrom VIRTIS Emissivity DataSuzanne E. Smrekar,1* Ellen R. Stofan,2 Nils Mueller,3,6 Allan Treiman,4 Linda Elkins-Tanton,5
Joern Helbert,6 Giuseppe Piccioni,7 Pierre Drossart8
The questions of whether Venus is geologically active and how the planet has resurfaced overthe past billion years have major implications for interior dynamics and climate change. Nine“hotspots”—areas analogous to Hawaii, with volcanism, broad topographic rises, and large positivegravity anomalies suggesting mantle plumes at depth—have been identified as possibly active.This study used variations in the thermal emissivity of the surface observed by the Visible andInfrared Thermal Imaging Spectrometer on the European Space Agency’s Venus Express spacecraft toidentify compositional differences in lava flows at three hotspots. The anomalies are interpreted asa lack of surface weathering. We estimate the flows to be younger than 2.5 million years and probablymuch younger, about 250,000 years or less, indicating that Venus is actively resurfacing.
Venus’ resurfacing record holds importantclues to its geological evolution. Venusand Earth are similar in size and in
internal heat production, yet Venus is in a stagnantlid convection regime whereas Earth has vigorousplate tectonics. Venus’ sparse and largely un-modified crater population has spawned a debateover whether it was resurfaced catastrophically (1)or gradually (2). These two end members have
very different dynamic implications. Catastrophicresurfacing could have been caused by episodicmantle overturn (3) or melting in a hot mantleinsulated by a stagnant lid (4). Gradual resurfacing
is consistent with more Earth-like volcanic andinterior processes (5). The rate and style of re-surfacing have important implications for bothinterior evolution and climate change driven byvolatile release from volcanic outgassing.
The Visible and Infrared Thermal ImagingSpectrometer (VIRTIS) on the European SpaceAgency’s Venus Express spacecraft provided amap of thermal emission for much of the southernhemisphere of Venus’ surface in the atmosphericwindow at 1.02 mm (6). Surface emissivities in the1.02-mm band are retrieved from surface bright-ness by correcting for effects of instrumental straylight, viewing geometry, cloud opacity, andelevation (7, 8). More accurate topographic data(9) allowed us tomake significantly better maps ofsurface emissivity (10). Absolute surface emissiv-ities are model-dependent (11) but are calculatedfrom variations in the emitted fluxes that are up to12% greater than the average value. These emis-sivity variations represent differences in material
1Jet Propulsion Laboratory, Mail Stop 183-501, 4800 Oak GroveDrive, Pasadena, CA 91109, USA. 2Proxemy Research, 20528Farcroft Lane, Laytonsville, MD 20882, USA. 3Institute forPlanetology, Westfälische Wilhelms-Universität Münster, Wilhelm-Klemm-Strasse 10, 48149 Münster, Germany. 4Lunar and Plan-etary Institute, 3600 Bay Area Boulevard, Houston, TX 77058,USA. 5Massachusetts Institute of Technology, Earth, Atmo-spheric, and Planetary Sciences, Building 54-824, 77 Mas-sachusetts Avenue, Cambridge, MA 02139, USA. 6Institute ofPlanetary Research, GermanAerospace Center, Rutherfordstrasse2, D-12489 Berlin, Germany. 7Istituto Nazionale di Astrofisica–Istituto di Astrofisica Spaziale e Fisica Cosmica (INAF-IASF), Viadel Fosso del Cavaliere 100, 00133 Rome, Italy. 8Laboratoired'Etudes Spatiales et d'Instrumentation enAstrophysique (LESIA),Observatoire de Paris, CNRS, UPMC, Université Paris-Diderot, 5Place Jules Janssen, 92195 Meudon, France.
*To whom correspondence should be addressed. E-mail:[email protected]
Fig. 1. (Top) Magellan synthetic aperture radar (SAR) image, left looking, overlain on topography.(Bottom) Surface emissivity derived from the VIRTIS spectrometer. Regio names are located below thetopographic rises. Boxes indicate example sites shown in Fig. 2.
www.sciencemag.org SCIENCE VOL 328 30 APRIL 2010 605
REPORTS
104
Supporting online material for
Conversion of Sugars to Lactic Acid Derivatives using Heterogeneous
Zeotype Catalysts
Martin Spangsberg Holm,1,2,3† Shunmugavel Saravanamurugan,1,2
† Esben Taarning2,3*
1) Centre for Catalysis and Sustainable Chemistry, Department of Chemistry, Technical University of Denmark,
Anker Engelundsvej 1, 2800 Kgs. Lyngby, Denmark.
2) Center for Sustainable and Green Chemistry, Department of Chemistry, Technical University of Denmark, Anker
Engelundsvej 1, 2800 Kgs. Lyngby, Denmark.
3) Haldor Topsøe A/S, Nymøllevej 55, 2800 Kgs. Lyngby, Denmark.
† These authors contributed equally. *To whom correspondence should be addressed. E-mail: [email protected].
This PDF file includes:
Materials and Methods
Figs. S1-S8
Supporting Tables S1-S6
References
Materials & methods
Catalyst preparation. The zeolite and zeotype catalysts were all synthesized from fluoride
media according to known procedures with minor modifications. (S1,S2,S3,S4) Tetraethyl
orthosilicate (TEOS) and tetraethylammonium hydroxide were mixed and stirred for
approximately 90 minutes before the dissolved metal salt (tetraethyl orthotitanate and H2O2 in
the case of Ti-Beta) was added. The gel was aged while stirring until all ethanol formed by
105

hydrolysis of TEOS had evaporated. HF was added drop-wise, resulting in a hardened gel, which
was homogenized manually. The molar oxide ratio of the resulting gel was as follows: 0.008
MeO2: 1 SiO2: 0.27 (TEA)2O: 0.54 HF: 11 H2O. Dealuminated Beta seeds (~4 wt% compared to
the theoretical zeolite amount) were suspended in demineralized water, sonicated and carefully
dispersed in the gel (Ti-, Al- and Si-Beta were crystallized unseeded). The gel was transferred to
a closed Teflon vessel in a stainless steel autoclave and crystallized at 140 °C with synthesis
times varying between 10-20 days. One Sn-Beta zeotype catalyst (Si/Sn ratio of 125) was
tumbled at 20 revolutions/minute while the other catalysts were synthesized under static
conditions. After crystallization the autoclaves were allowed to cool to room temperature and the
products were isolated by suction filtration. The products were carefully washed by two fold
resuspension in demineralized water and dried at 110 °C overnight. The dried zeolites were
finally calcined in static air at 550 °C for 6 hours using a ramp of 2 °C/min to remove
carbonaceous residues. The Al-Beta zeolite was subsequently ion-exchanged into the ammonia
form by three times suspending it in a 1.0 M NH4NO3 solution at 50 °C. The proton form of the
zeolite was obtained by drying at 110 °C followed by calcination in static air at 550 °C.
Catalyst characterization. XRPD data were collected on a Bruker AXS powder diffractometer.
N2-sorption was measured on degassed samples using a Micromeritics ASAP 2020 apparatus.
Surface areas and micropore volumes were calculated by applying the BET and t-plot methods,
respectively. TPO analysis were performed by heating samples from rt to 700 °C over 4 hours in
a flow of 5% oxygen in helium. The formed CO and CO2 were quantified on a Rosemount Binos
100 apparatus. The metal incorporation was confirmed by FT-IR using cyclohexanone vapor
adsorption with spectra recorded on a BioRad FTS 80 spectrometer equipped with an MCT
detector. SEM micrographs were obtained on a Philips XL 30 ESEM-FEG instrument.
106

Carbohydrate conversion and product analysis. A 50 ml autoclave (Microclave reactor from
Autoclave Engineers) was charged with carbohydrate (225 mg, 1.25 mmol fructose/glucose or
0.657 mmol sucrose), catalyst (160 mg), naphthalene (internal standard, 120 mg) and solvent
(8.0 g) and then pressurised with argon (20 bar). The autoclave was heated to 160 °C and the
stirring was started once the temperature reached 100 °C (300 rpm). After 20 hours of stirring,
the autoclave was cooled and the reaction mixture analyzed. The undiluted reaction mixture was
analyzed on a GC (Agilent 6890N instrument) equipped with an HP-5 capillary column (30.0 m
x 320 !m x 0.25 !m) and an FID detector. The reaction mixture was also analyzed on an Agilent
1200 series HPLC (30 cm Aminex© HPX-87H column) with a RI detector using a 0.0050 M
aqueous sulphuric acid solution as eluent. An Agilent 6850 GC system coupled with an Agilent
5975C mass detector was used for qualitative analysis. The yields of methyl, ethyl and i-propyl
lactate and methyl vinylglycolate were calculated from the GC-data, based on the internal
standard. All yields were calculated on a carbon-basis, i.e. four moles of methyl lactate or three
moles of methyl vinylglycolate can be formed from one mole of sucrose. Carbohydrate
conversions and lactic acid yield (in water) was determined by HPLC. Sucrose inverts to fructose
and glucose on the acidic HPLC-column used, and the conversions were calculated from the
monosaccharides fructose, glucose and mannose on a carbon-basis. HPLC standards were made
from commercial samples. Yields of methyl-, ethyl- and i-propyl lactate, methyl vinylglycolate,
formaldehyde dimethylacetal, glycolaldehyde dimethylacetal and methyl glycolate were obtained
from GC analysis based on a calibration curve from commercial samples of the compounds. The
two compounds ethyl- and i-propyl vinylglycolate are not commercially available and they were
identified by GC-MS and yields were calculated by using calibration data of the i-propyl lactate
and n-butyl lactate while assuming similar carbon response factors, respectively. Optical rotation
107

was measured on a product sample obtained by flash distillation of the reaction mixture; the
sample containing a mixture of methyl lactate and methyl vinyl glycolate did not display optical
rotation (589 nm, 20 ºC, Perkin Elmer-Precisely model 341 polarimeter).
Flow experiments. To illustrate the convenience of using a heterogeneous catalyst Sn-Beta was
tested for fructose conversion in a fixed bed reactor. 3.0 g of Sn-Beta (Si:Sn 125) was
fractionized (300-600 µm.) and loaded into a stainless steel reactor. Reaction conditions of 164
!C and a flow of 0.50 ml/min of a 5 wt.% fructose solution in methanol was chosen in order to
give an initial conversion of approximately 50%. The effluent was collected continuously and
analyzed as described above for the batch experiments.
Re-use study. Scaled-up experiments were performed to take catalyst loss during handling into
account. After each experiment the catalyst was recovered and calcined at 480 °C for 6 hours in
static air before it was reused in a new experiment that was scaled according to the amount of
recovered catalyst. Scaling-up the experiments in the autoclave system was found to affect the
sucrose conversions slightly when using Zr- and Ti-Beta. Lower sucrose conversions of
approximately 80% instead of ~98% were obtained in these cases (Fig. 3) compared to the
catalyst screening (Table 1). We believe that this results from small changes in the stirring
efficiency when scaling up. In the sixth reuse cycle the scaling of the reactants, solvent and
catalyst was similar to that used for the experiments in Table 1 which indicates that a modest loss
of activity occurs as a function of reusing the catalyst while the selectivity remains constant (see
Fig. S6).
List of Chemicals. All chemicals were used as purchased without further purification.
Sucrose (99.5%, Sigma-Aldrich), D-(-)-Fructose (99%, Sigma-Aldrich), D-(+)-Glucose (99.5%,
Sigma-Aldrich), Naphtalene (>99%, Aldrich), D-(-)-Erythrose, ("75%, Sigma), 2-Propanol
108

(99.5%, Sigma-Aldrich), Methanol (99.93%, Sigma-Aldrich), Ethanol (99.9 % vol., Kemetyl
A/S), (D-L)-2-Hydroxy-3-butenoic acid methyl ester (96%, ABCR), L-(-)-Ethyl lactate (>99%,
Fluka), L-(-)-Methyl lactate (98%, Aldrich), Methyl levulinate ("98%, Aldrich), Levulinic acid
(98%, Aldrich), i-propyl-L-lactate ("97%, Sigma-Aldrich), L-(+)-Lactic acid ("99%, Fluka), 5-
(hydroxymethyl)furfural (>99%, Aldrich), TEOS ("99%, Sigma-Aldrich), Tetraethylammonium
hydroxide (40 wt.% in water, Aldrich), Hydrofluoric acid (40 wt.% in water, Fluka), Tetraethyl
orthotitanate (97% the rest ~3% is tetraisopropyl orthotitanate, Fluka), Zirconium(IV)
oxychloride octa hydrate (>99%, Fluka), Hydrogen peroxide (30 wt.% in water, Merck),
Aluminium nitrate nona hydrate (>98%, Sigma-Aldrich), Aluminium chloride hexa hydrate
("99%, Sigma), Tin(IV) chloride penta hydrate (98%, Sigma), Tin oxide nanopowder (Sigma-
Aldrich).
109

Supporting Figures
OO
O
HO
OH
OH
OH
OH
OHHO
OH
MeOH
O
O
OHHO
HOO
OH
OH
OH
HO OH
OH
retro aldol
reaction
O
OHHO
OH
HO O
O
O
-H2O
OH
O
O
isomerisation
Lewis acid
Sucrose
Methyl fructoside
Glucose
retro aldol
reaction
glycolaldehyde dimethylacetal
+ MeOH
O
OH
O
HO
O
OH
OHO
HO+
Erythrose Glycolaldehyde
MeOH
O
O
HO
-2H2O
O
O
+ MeOH
O
OH
O
Lewis acid
Isomerisation
OH
O
O
methyl vinylglycolate
methyl lactate
O
OHHO
HOOH
OH
Fructose
H2O isomerisation
+
Figure S1. Proposed reaction pathway for the formation of different products from sucrose.
110

Figure S2. Photographs of the reaction liquids from the experiments in Table 1.
111

Figure S3. XRPD diffractograms of the calcined zeolite/zeotype catalysts. Individual samples
have been moved in steps of 5000 for illustrative purposes.
112

Figure S4. SEM micrographs of the zeotypes (a) Sn-Beta (Si/Sn:125), (b) Ti-Beta and (c) Zr-
Beta.
113

Figure S5. Methyl lactate selectivity during six reuses of the Ti-, Zr- and Sn-Beta catalysts.
114
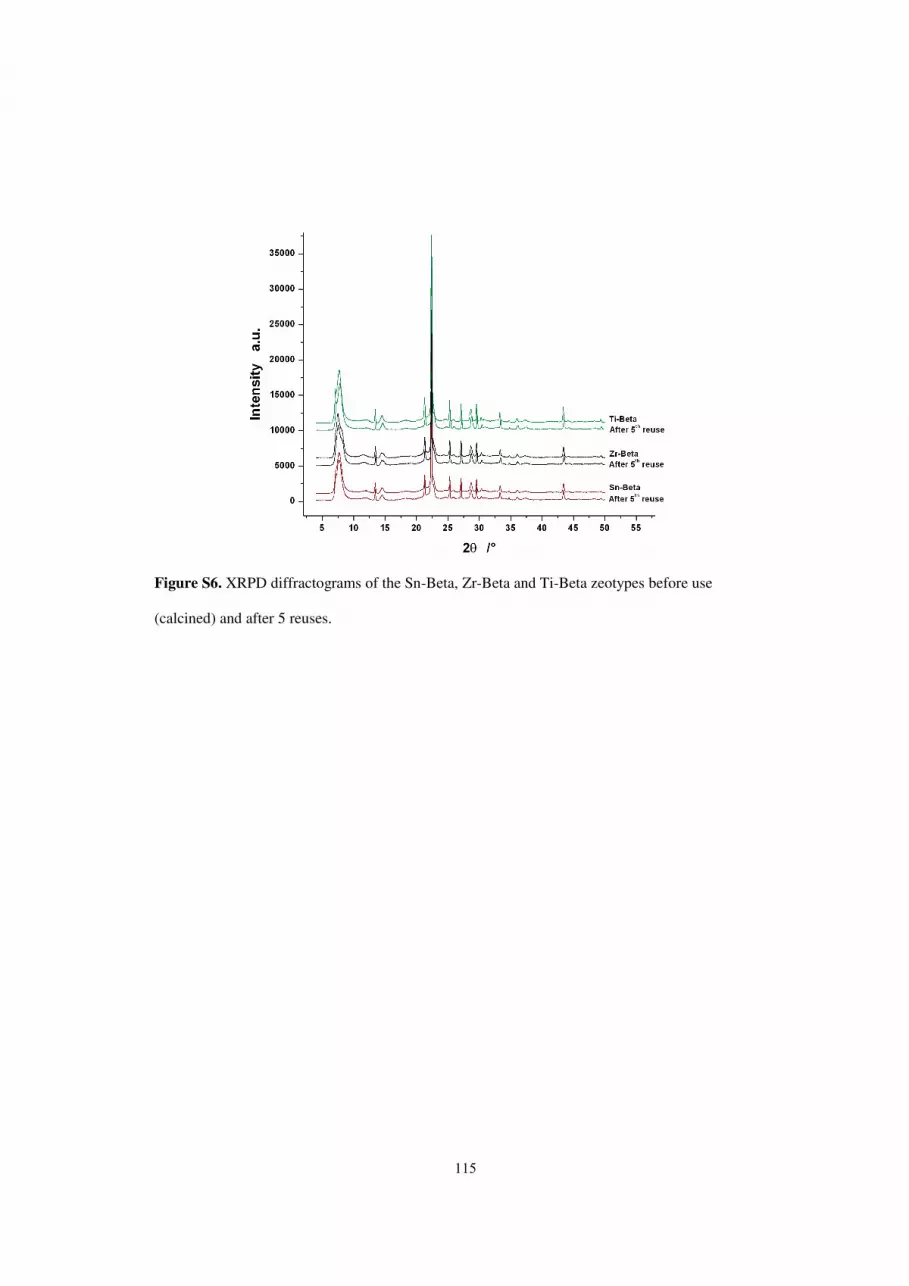
Figure S6. XRPD diffractograms of the Sn-Beta, Zr-Beta and Ti-Beta zeotypes before use
(calcined) and after 5 reuses.
115

Figure S7. Yield of methyl lactate as a function of time on stream when fructose (5 wt.%) in
methanol is converted over Sn-Beta (Si:Sn 125) operated in flow mode at 164 !C.
116

Figure S8. IR absorbance spectra of (a) Si-Beta, (b) Sn-Beta (Si/Sn: 125), (c) Zr-Beta and (d) Ti-
Beta during step-wise adsorption of cyclohexanone. Shifts in the carbonyl frequency upon
coordination are highlighted.
117

Su
pp
ortin
g T
ab
les T
ab
le S1
. Carb
on
distrib
utio
ns fo
r the ex
perim
ents in
Tab
le 1.
*Id
entificatio
n is b
ased o
n th
e MS
fragm
entatio
n p
attern o
f the co
mp
on
ent (m
/z: 11
6 2
% [-H
2 O]; 9
1 6
%; 9
0 4
1%
[-CH
3 CH
O o
r CH
2 CH
OH
]; 89
46%
[-CH
3 CH
OH
]; 87
3%
; 75
3%
[-C
H3 O
and
CO
]; 71
3%
; 60
4%
; 59
26%
[CO
(OC
H3 )]
+; 58
4%
; 57 1
2%
; 56
4%
; 55 4
%; 4
6 2
%; 4
5 1
00%
[CH
3 CH
OH
]+; 4
4 4
%; 4
3 7
%). Q
uan
tification
is based
on
the F
ID
respon
se factors o
f meth
yl v
inylg
lyco
late. †
Un
iden
tified co
mp
ou
nd
s that are d
etectable b
y H
PL
C-R
I. Qu
antificatio
n is b
ased o
n th
e respon
se factor fo
r fructo
se in th
e case of h
igh
ly p
olar co
mp
ou
nd
s (short elu
tion
times)
and
meth
yl lactate fo
r less polar co
mpo
un
ds (lo
ng elu
tion
times).
S
n-B
eta
Ti-B
eta
Zr-B
eta
Si-B
eta
Al-B
eta
No
cata
lyst
Pro
du
ct F
ru
Glu
S
ucr
Eryth
-ro
se F
ru
Glu
S
ucr
Fru
G
lu
Su
cr F
ru
Glu
S
ucr
Fru
G
lu
Su
cr F
ru
Glu
S
ucr
Meth
yl la
ctate
44
%
43
%
68
%
6%
3
6%
3
1%
4
4%
3
3%
3
3%
4
0%
9
%
5%
6
%
1%
"0
.1%
"0
.1%
8
%
5%
6
%
Meth
yl v
iny
lgly
cola
te 9
%
10
%
8%
5
6%
2
%
4%
4
.5%
5
%
7%
4
%
- -
- -
- -
- -
-
Fo
rma
ldeh
yd
e d
imeth
yla
cetal*
1
%
1%
1
%
1.5
%
1%
0
.5%
"0
.2%
3
%
2.5
%
2%
"0
.5%
0
.5%
"0
.5%
3
%
1%
1
.5%
1
%
"0
.5%
"0
.5%
Gly
cola
ldeh
yd
e d
imeth
yla
cetal
0.5
%
0.5
%
"0
.5
0.5
%
3%
2
.5%
2
%
5%
5
.5%
5
%
0.5
%
1.5
%
1.5
%
- -
- 0
.5%
2
%
1%
Un
con
verted
hexo
ses "1
%
"1
%
"1
%
"1
%
"1
%
1%
2
%
"1
%
1%
1
%
21
%
39
%
37
%
"1
%
3%
1
%
33
%
47
%
46
%
Meth
yl p
yra
no
side
- -
- -
- -
- -
- -
- -
- 2
%
43
%
27
%
- -
-
Meth
yl 2
,3-d
ihy
dro
xy-
bu
tan
oa
te*
4%
3
.5%
1
.5%
1
6.5
%
0.2
%
- 0
.2%
-
0.1
%
- 0
.5%
0
.1%
-
- -
- -
- -
HM
F &
furfu
ral
deriv
ativ
es 3
%
2.5
%
1.5
%
"0
.2%
4
%
3.5
%
3%
4
%
6%
4
.5%
9
%
4.5
%
5%
7
%
1%
1
.5%
7
%
5%
4
.5%
Meth
yl lev
ulin
ate
- -
- -
- -
- -
- -
- -
- 4
0%
5
%
23
%
- -
-
Un
iden
tified
com
po
un
ds
†
22
.5%
2
7.5
%
12
.5%
4
.5%
6
%
5.5
%
4.5
%
8%
8
.5%
8
%
16
%
10
%
11
%
17
%
6%
1
1.5
%
11
.5%
8
.5%
8
%
Co
ke
n.d
. n
.d.
2.5
%
n.d
. n
.d.
n.d
. n
.d.
n.d
. n
.d.
n.d
. n
.d.
n.d
. <
0.5
%
n.d
. n
.d.
2.5
%
- -
-
Un
acco
un
ted
16
%
12
%
5%
1
5%
4
8%
5
2%
4
0%
4
2%
3
6.5
%
35
.5%
4
4%
3
9.5
%
39
.5%
3
0%
4
1%
3
2%
3
9%
3
2.5
%
34
.5%
Ca
rbo
n b
ala
nce
84%
8
8%
9
5%
8
5%
5
2%
4
8%
6
0%
5
8%
6
3.5
%
64
.5%
5
6%
6
0.5
%
60
.5%
7
0%
5
9%
6
8%
6
1%
6
7.5
%
65
.5%
118

Table S2. Yields of lactic acid/alkyl lactate and alkyl vinylglycolate using various solvents.
Reaction conditions are the same as those reported in materials & methods. More than 99%
conversion reached in all experiments with Sn-Beta. Tin content in the zeolite used was Si/Sn:
165 (as synthesised, 1.2 wt% of tin).
*4 times the amount of substrate used. † Solvent used was 2.5 wt.% H2O in methanol. ‡ 237 mg erythrose is used as substrate (equivalent carbon amount as is present in 225 mg of sucrose).
Catalyst Substrate
Lactic acid / alkyl lactate
Alkyl vinyl-glycolate
Water Sn-Beta Glucose 26% n.d. Sn-Beta Fructose 27% n.d. Sn-Beta Sucrose 28% n.d. No catalyst Sucrose 1% n.d.
Methanol Sn-Beta Glucose 43% 10% Sn-Beta Fructose 44% 9% Sn-Beta Sucrose 68% 8% No catalyst Sucrose 6% 0% Sn-Beta* Sucrose 62% 11% Sn-Beta† Sucrose 68% 6% Sn-Beta‡ Erythrose 6% 56% Ethanol Sn-Beta Glucose 32% 10% Sn-Beta Fructose 35% 10% Sn-Beta Sucrose 39% 8% No catalyst Sucrose 1% 0% i-Propanol Sn-Beta Glucose 18% 8% Sn-Beta Fructose 21% 9%
Sn-Beta Sucrose 25% 8%
No catalyst Sucrose 3% 0%
119

Table S3. Porosity and TPO data of the fresh and used zeolite/zeotype catalysts.
Zeolites Si/Me Reaction solvent
Surface area (m2/g)
t-plot (ml/g)
Carbon wt% (from TPO)
Sn-Beta 125 511 0.201 After 1st use† - Methanol 500 0.195 - After 5th reuse† - Methanol 504 0.197 - Zr-Beta 125 506 0.202 After 1st use* - Methanol 505 0.203 - After 5th reuse† - Methanol 500 0.202 - Ti-beta 125 492 0.203 After 1st use* - Methanol 491 0.203 - After 5th reuse† - Methanol 490 0.203 - H-(Al)-Beta 125 501 0.207 After 1st use* - Methanol 494 0.205 1.5%
Si-Beta # 487 0.203
After 1st use* - Methanol 486 0.200 <0.1%
Sn-Beta 165 513 0.205 After 1st use* - Water 496 0.192 7.0% After 1st use* - Methanol 499 0.201 1.3% After 1st use† - Ethanol 482 0.196 - After 1st use* - 2-Propanol 494 0.195 -
Used catalysts were calcined at 480 °C in static air (ramp of 2 °C/min) for 6 hours before analyzed for porosity.
*Fructose used as substrate †Sucrose used as substrate
120

Table S4. Conversion, selectivity and yield for methyl lactate from the 6-fold reuse.
Zeolites Conversion* Selectivity to methyl lactate
Yield of methyl lactate
Yield of methyl vinylglycolate
Sn-Beta 1st use >99 % 60 % 60 % 4 %
2nd use >99 % 67 % 67 % 3 % 3rd use >99 % 71 % 71 % 5 % 4th use >99 % 68 % 68 % 5 % 5th use >99 % 67 % 67 % 4 % 6th use >99 % 65 % 65 % 7 % Zr-Beta 1st use 67 % 48 % 32 % 4 %
2nd use 75 % 51 % 38 % 4 % 3rd use 72 % 51 % 37 % 3 % 4th use 76 % 53 % 40 % 4 % 5th use 73 % 52 % 38 % 3 % 6th use 84 % 51 % 43 % 4 % Ti-Beta 1st use 88 % 53 % 47 % 6 %
2nd use 82 % 51 % 42 % 6 % 3rd use 78 % 49 % 38 % 4 % 4th use 78 % 49 % 38 % 3 % 5th use 86 % 43 % 37 % 3 % 6th use 86 % 44 % 38 % 3 %
Experiments were performed according to materials & methods. The amount of methanol and sucrose was scaled according to
the recovered amount of catalyst.
*Conversion calculated based on unconverted hexoses.
121
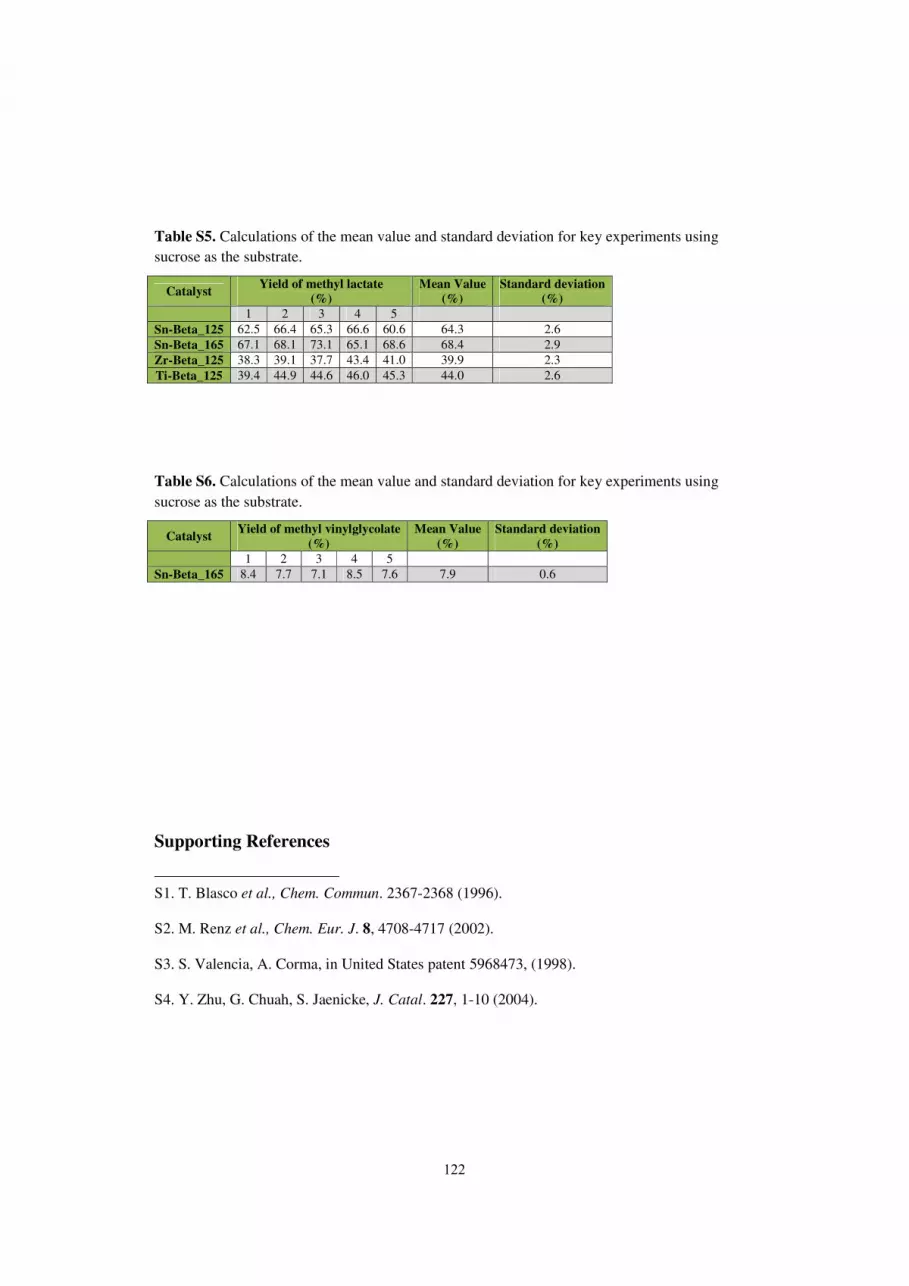
Table S5. Calculations of the mean value and standard deviation for key experiments using
sucrose as the substrate.
Catalyst Yield of methyl lactate
(%) Mean Value
(%) Standard deviation
(%) 1 2 3 4 5
Sn-Beta_125 62.5 66.4 65.3 66.6 60.6 64.3 2.6
Sn-Beta_165 67.1 68.1 73.1 65.1 68.6 68.4 2.9
Zr-Beta_125 38.3 39.1 37.7 43.4 41.0 39.9 2.3
Ti-Beta_125 39.4 44.9 44.6 46.0 45.3 44.0 2.6
Table S6. Calculations of the mean value and standard deviation for key experiments using
sucrose as the substrate.
Catalyst Yield of methyl vinylglycolate
(%) Mean Value
(%) Standard deviation
(%) 1 2 3 4 5
Sn-Beta_165 8.4 7.7 7.1 8.5 7.6 7.9 0.6
Supporting References
S1. T. Blasco et al., Chem. Commun. 2367-2368 (1996).
S2. M. Renz et al., Chem. Eur. J. 8, 4708-4717 (2002).
S3. S. Valencia, A. Corma, in United States patent 5968473, (1998).
S4. Y. Zhu, G. Chuah, S. Jaenicke, J. Catal. 227, 1-10 (2004).
122

Conversion of Oxygenates over Zeolite Catalysts: Structure-Activity Relations
123
3.0 Discussion and future perspectives 3.1 Desilication The work performed within desilication (part 1) was done in the first part of my PhD project. Interestingly, our findings using organic bases as the desilication agent were later expanded on by others. The pore forming abilities of the organic base could, be generalized to other quartenary bases and was useful on an additional zeolite structure (MFI).1,2 The fact that quartenary ammonium bases are able to produce mesoporosity is indeed interesting. Meanwhile, it is important to evaluate whether they have potential for large-scale application. Speaking against - these chemicals are significantly more expensive than sodium hydroxide and can even pose health problems. But the possibility of circumventing the ion-exchange step represents a simplification of the overall process with an associated cost reduction. However, additional information about zeolite loss during desilication, processing time, effectiveness of the organic desilication, equipment requirements etc. would be needed to make a fair estimate. Reuse of the desilication medium could potentially reduce waste of the expensive base. An alternative strategy would be to use weaker but much cheaper bases. The limitations of desilication with respect to base strength and accessibility of the base to the zeolite interior has not been fully clarified. This could likely be done with bases such as alkyl amines, guanidine, imidazole, bipyridine or 1,8-bisdimethylamino naphthalene (proton sponge). A very interesting characterization study using alkyl pyridine in combination with FT-IR on desilicated samples was published recently. 3 The findings are in line with what we observe in section 2.3 in that EFAL is formed predominantly located on the external surface or in the newly formed mesopores. The authors further introduce the accessibility index (ACI). The ACI is a generalized concept which is convenient to analytically describe the porosity of a zeolite sample. ACI measures the fraction of acidic sites accessible to substrates of increasing sizes. A thorough description of the accessibility index is given in the review in section 2.5.
3.2 Bio-gasoline production Part 2 describes our work on the conversion of oxygenates over ZSM-5. The results confirmed that it is indeed possible to form hydrocarbons from most oxygenates at typical laboratory scale MTG reaction conditions (370 °C, WHSV: ~8, He: 40 ml/min, ZSM-5). However, the parameter space for the optimal conversion of each individual additive becomes considerable when one considers the level of methanol dilution, reaction temperature, potential cross reactions, choice of catalyst etc. Nonetheless, the lifetime of the catalyst decreases significantly in almost all cases when reacting a 10 wt.% additive solution compared to pure methanol. We considered this a rather surprising result since 10 wt.% represents a relatively modest additive level. This indicates that the poor performance of bio-oil could be explained by a general problematic conversion of non-methanol oxygenates. Arguably, the methanol conversion could be viewed as exceptionally good, rather than other oxygenates being disastrous. The amount of coke deposited on the catalyst at full deactivation in a methanol experiment corresponds to only about every 2000th carbon atom converted or a hydrocarbon selectivity of ≥99.9.

Conversion of Oxygenates over Zeolite Catalysts: Structure-Activity Relations
124
The differences in lifetime ranging from catastrophic to moderate could thus be an acceptable starting point for oxygenate conversion.
There were exceptions to the general trend that catalyst lifetime dramatically decreased when co-feeding oxygenates. The conversions of 10 wt.% toluene or i-propanol were two examples. These compounds (propene in the case of i-propanol) are products normally formed in the MTG reaction and appeared to have little or even a positive effect on the lifetime. This observation is quite reasonable. If pronounced deactivation was taking place during the secondary reactions in MTG a strong dependence of catalyst loading (WHSV) on conversion capacity (gconverted methanol/gzeolite) would be seen, which is not the case. Interestingly, toluene has a critically low effective H/C ratio of 1.14. The compatibility of toluene shows that it is not specifically the low H/C ratio of an additive that is the limitation but rather ‘poor’ selectivity of the additives towards the formation of inert compounds. Non-MTG products such as tetrahydrofuran, acetaldehyde, and dienes (depending on the additive) were detectable by GC-MS after methanol/DME breakthrough in the 10 wt.% series. Compounds like these are never formed in significant quantities in MTG. It appears that these “alien” compounds initially forms from the additive before they preferentially end up in the aromatics. In order to understand the reactivity and pronounced deactivation of the various oxygenates; knowledge about the favored reaction paths for each intermediate would be required. This would be unrealistic to do so generalizations within the relevant classes of compounds could be a reasonable starting point.
An increased conversion capacity of the additives is seen as a function of optimal methanol dilution. This observation indicates a selectivity change of the additive (decreased tendency towards coke formation). Methanol dilution increases the total effective H/C ratio of the feed. However, the combined H/C ratio of the feed is something very different than the H/C ratio of the individual additive. Similar reactivity from a dilute compound with low H/C and a more concentrated high H/C compound can only be expected if cross-reaction between methanol and the additive is in fact taking place. Methanol/DME is only present in the primary reaction zone of the catalyst bed. Thus, it is important to note if the decreased selectivity towards coking of the additive is due to cross-reactions associated with secondary reactions further down the bed or whether methanol/DME is required to alkylate the oxygenate intermediates (dienes, cyclo compounds, ethers etc.). If alkenes and/or aromatics are responsible for the improvement; then a fraction of the product could simply be recycled to obtain the improved conversion capacity. However, if the presence of methanol/DME is key, we could be registering only a fraction of the positive effect since it would depend on how large a fraction of the additive that is converted simultaneously with methanol/DME. In order to investigate this further; reaction conditions designed to give incomplete methanol conversion could be investigated. Another possibility could be to compare results obtained from a back-mixing reactor with those from plug flow.
We chose to react the additives as 10 wt.% solutions in methanol. The conversion of methyl lactate is an illustrative example of the reactivity and the difficulty in choosing comparable reaction conditions. Upon contact with the catalyst methyl lactate breaks down into acetaldehyde, CO and methanol/DME. A valid interpretation is that that only the acetaldehyde fraction of the additive is in fact the “real” reactant. Converting 10 wt.% acetaldehyde in methanol gives a conversion capacity well below half of that of methyl lactate but this experiment was performed with a higher acetaldehyde concentration in the feed. Acrylic acid (“dehydrated methyl lactate”) is slightly more concentrated due to the lower molecular weight but performs catalytically very poor. The large difference between methyl lactate and acrylic acid, despite the same effective H/C ratio, illustrates that the H/C ratio can function as a guideline; but also reveals its limitations in accounting for the chemistry observed. When designing the experiments; we considered how additives could most elegantly be compared and in the end chose

Conversion of Oxygenates over Zeolite Catalysts: Structure-Activity Relations
125
wt.% as the standard. The additives could alternatively have been introduced based on concentration (moladditive/h), an equal amount of carbon (molcarbon/h) or calculating an equal carbon concentration while subtracting carbon dissociated as CO/CO2. The question is: Can carbon from the additive ending up in CO be considered “converted”? This choice depends on whether emphasis is put on catalyst lifetime or strictly on the amount of carbon incorporated into the hydrocarbon products. By comparing additives based on wt.% we focused on catalyst lifetime and it appears reasonable to consider CO a product since it can be utilized further. The effect of minor differences in methanol dilution due to the fact that the additives have different molecular weights is small. Results from section 2.8 (Figure 2.3) showed it was fair to assume that a molecule performing well will continue to do so in a slightly more concentrated or dilute solution.
A peculiar coincidence connected the results from bio-gasoline production in part 2 to part 3 where methyl lactate was synthesized from sugar. Methyl lactate was not an obvious candidate to co-feed in MTG since the unit price of the pure compound is significantly higher than gasoline. Lactic acid has the same oxidation state (identical effective H/C ratio) as sugar. A carbohydrate is perhaps the worst type of compound to co-feed in MTG 4,5,6 whereas methyl lactate proved to be a relatively well suited additive when taking the low effective H/C ratio into account. Very recently, R. F. Lobo pointed out how lactic acid (methyl lactate) synthesis from sugar could be viewed as an intramolecular redistribution of oxidation states.7 Our results in part 2 show exactly that - a redistribution of oxidation states (which functionalities are present where) was the key to tuning reactivity. In all cases the acid/ester functionality favored dissociation of CO (and to a smaller extend CO2). This occurs to much lower extents from alcohol and carbonyl functionalities. CO can be used to produce H2 through the water-gas-shift reaction. Then hydrogen could be used to partially hydrogenate either the product mixture or the feed to improve the final energy content (and perhaps lifetime). Interestingly, an improved hydrocarbon yield was recently reported in a study that performed a partial hydrogenation of bio-oil prior to zeolite deoxygenation.8 This observation is in line with our findings in section 2.8.
Nevertheless, no solution is presented to solve the pronounced deactivation seen when converting phenolic species. Extensive (and selective) hydrogenation can form compounds like cyclohexanol which likely relieves catalyst deactivation but require numerous equivalents of hydrogen. The hydrogen needed could be obtained by reforming a fraction of the biomass. When considering the required amounts of H2 integration with other renewable energy sources could perhaps be advantageous. A surplus of electricity typically exists outside peak hours. If this energy was used through electrolysis for hydrogenation of bio-oil the extent could depend on the availability of cheap electricity and thus serve as flexible energy storage. Yet another solution would be to separate cellulose and hemi-cellulose from lignin before bio-oil formation. However, the advantage of an easy on-site treatment of the lignocellulosic material would then be (at least partially) lost.9
3.3 Synthesis of lactic acid derivatives The production of lactic acid is today done by fermentation of glucose using lactic acid producing bacteria, but can also be made by fungal species.10,11 Lactic acid is produced on a relatively large scale (~300.000 t/yr) in a process which has strengths as well as limitations. The fermentation is very selective (~95% selectivity) but the bacteria are highly pH sensitive and the culture supresses lactic acid production at elevated concentrations (product inhibition). Neutralization by calcium hydroxide or carbonate is thus continuously required. Purification of lactic acid from a dilute aqueous medium is challenging. One method is isolating precipitated calcium lactate with a subsequent release of the acid by addition of sulfuric acid. Lactic acid is not volatile and the acid needs to be esterified for

Conversion of Oxygenates over Zeolite Catalysts: Structure-Activity Relations
126
purification by distillation.12,13 The cost of purification can be as high as 50% of the total production cost while large amounts of lime, equal in weight as the desired lactic acid, are an unfortunate byproduct. Importantly, the purification procedure in a heterogeneously catalyzed reaction where methyl lactate is formed from sugar in methanol would be fundamentally different. Notable differences include the direct formation of volatile methyl lactate and not lactic acid, the solvent is methanol instead of water and the reaction is performed at elevated vs. physiological temperature. Lactic acid contains a stereo center and fermentation of glucose selectively produces one stereo isomer, whereas the heterogeneously catalyzed route produces a racemic mixture. The prices of these two products (mixtures) are not identical and the optical purity obtained from the biological process is a significant advantage. Polymerization of optically pure or racemic lactic acid into PLA creates polymers with distinctly different properties (e.g. higher melting point).14 However, as presented in Figure 1.2 (section 1.1) some upgrading routes include elimination of the stereo center and are thus indifferent to the optical purity of the starting material. Furthermore, the use of methyl lactate as a green solvent does not require stereochemically pure lactate. However, it is clear that an alternative route to lactic acid would need to be considerable cheaper than fermentation or have other inherent advantages in substrate utilization, process robustness, higher productivity, decreased investment cost, shut down potential or a good inhibitor resistance to be a realistic competitor to the established lactic acid production.
1 S. Abello, A. Bonilla, J. Perez-Ramirez, Appl. Catal. A, 364, (2009), 191-198. 2 J. Perez-Ramirez, D. Verboekend, A. Bonilla, S. Abello, Adv. Funct. Mater., 19, (2009), 1-8. 3 F. Thibault-Starzyk, I. Stan, S. Abello, A. Bonilla, K. Thomas, C. Fernandez, J-P. Gilson, J. Perez-Ramirez, J.
Catal., 254, (2009), 11-14. 4 N. Y. Chen, T. F. Degnan Jr., L. R. Koenig, Chemtech, 16, (1986), 506-511. 5 L. H. Dao, M. Haniff, A. Houle, D. Lamothe, Prepr. Papr. Am. Chem. Soc. Div. Fuel Chem., 32, (1987), 308-
316. 6 C. D. Chang, A. J. Silvestri, J. Catal., 47, (1977), 249-259. 7 R. F. Lobo, ChemSusChem, 3, (2010), 1237-1240. 8 T. P. Vispute, H. Zhang, A. Sanna, R. Xiao, G. W. Huber, Science, 330, (2010), 1222-1227. 9 M. G. Adsul, M. S. Singhvi, S. A. Gaikaiwari, D. V. Gokhale, Bioresource Technol., 102, (2011), 4304-4312. 10 E. T. H. Vink, K. R. Rabago, D. A. Glassner, P. R. Gruber, Polymer Degrad. Stabil., 80, (2003), 403-419. 11 Z. Y. Zhang, B. Jin, J. M. Kelly, Biochem. Eng. J., 35, (2007), 251-263. 12 K. L. Wasewar, A. A. Yawalkar, J. A. Moulijn, V. G. Pangarkar, Ind. Eng. Chem. Res., 43, (2004), 5969-
5982. 13 H. Danner, R. Braun, Chem. Soc. Rev., 28, (1999), 395-405. 14 J. Lunt, Polymer Degrad. Stabil., 59, (1998), 145-152.

Conversion of Oxygenates over Zeolite Catalysts: Structure-Activity Relations
127
4.0 Appendix 4.1 Publications and patent
Publications relevant for the thesis
M. S. Holm, K. Egeblad, P. N. R. Vennestrøm, C. G. Hartmann, M. Kustova, C. H. Christensen, Enhanching the Porosity of Mesoporous Carbon-Templated ZSM-5 by Desilication, Eur. J. Inorg. Chem., (2008), 5185-5185-5189.
M. S. Holm, S. Svelle, F. Joensen, P. Beato, C. H. Christensen, S. Bordiga, M. Bjørgen, Assessing the acid properties of desilicated ZSM-5 by FTIR using CO and 2,4,6-trimethylpyridine (collidine) as molecular probes, Appl. Catal. A, (2009), 256, 23-30.
M. S. Holm, M. K. Hansen, C. H. Christensen, ”One-Pot” Ion-Exchange and Mesopore Formation During Desilication, Eur. J. Inorg. Chem., (2009), 1194-1198.
U. V. Mentzel, S. Shunmugavel, S. L. Hruby, C. H. Christensen, M. S. Holm, High Yield of Liquid Olefins Obtained by Converting i-Propanol over Zeolite H-ZSM-5, J. Am. Chem. Soc., (2009), 131, 17009-17013.
E. Taarning, S. Shunmugavel, M. S. Holm, J. Xiong, R. M. West, C. H. Christensen, Zeolite-Catalyzed Isomerization of Triose Sugars, ChemSusChem, (2009), 2, 625-627.
R. M. West, M. S. Holm, S. Shunmugavel, J. Xiong, Z. Beversdorf, E. Taarning, C. H. Christensen, Zeolite H-USY for the production of lactic acid and methyl lactate from C3-sugars, J. Catal., (2010), 269, 122-130.
M. S. Holm, S. Shunmugavel, E. Taarning, Conversion of Sugars to Lactic Acid Derivatives Using Heterogeneous Zeotype Catalysts, Science, (2010), 328, 602-605.
U. V. Mentzel, M. S. Holm, Utilization of Biomass: Conversion of Model Compounds to Hydrocarbons over Zeolite H-ZSM-5, Appl. Catal. A, (2011), accepted, doi: 10.1016/j.apcata.2011.01.040.
Review
M. S. Holm, E. Taarning, K. Egeblad, C. H. Christensen, Catalysis with Hierarchical Zeolites, Top. Catal., (2011), accepted, doi: 10.1016/j.cattod.2011.01.007.
Patent
E. Taarning, S. Shunmugavel, M. S. Holm, Zeolite-catalyzed preparation of alpha-hydroxy carboxylic acid compounds and esters thereof, (2010), US 20100121096.

Conversion of Oxygenates over Zeolite Catalysts: Structure-Activity Relations
128
Other publications
K. T. Leth, A. K. Rovik, M. S. Holm, M. Brorson, H. J. Jakobsen, J. Skibsted, C. H. Christensen, Synthesis and characterization of conventional and mesoporous Ga-MFI for ethane dehydrogenation, Appl. Catal. A, (2008), 348, 257-265.
M. Kustova, M. S. Holm, C. H. Christensen, Y.-H. Pan, P. Beato, T. V.W. Janssens, F. Joensen, J. Nerlov, Synthesis and characterization of mesoporous ZSM-5 core-shell particles for improved catalytic properties, Stud. Surf. Sci, Catal., (2008), 174, 117-122.
4.2 Conference contributions
Sep. 2008 Oral and poster presentation at 2nd EuCheMS Chemistry Congress, Turin, Italy.
Jun. 2009 Poster presentation at inGAP-NanoCat Summerschool, Trondheim, Norway.
Aug. 2009 Poster presentation at EuropaCat-IX, Salamanca, Spain.
Aug. 2010 Oral presentation at Nordic Symposium on Catalysis, Denmark.
2007 - 2010 Oral presentations internally at Haldor Topsoe A/S, Denmark.
Conversion of Oxygenates over Zeolite Catalysts: Structure-Activity Relations
129
4.3 Authorship declarations
Section 2.2 Enhancing the Porosity of Mesoporous Carbon-Templated ZSM-5 by Desilication
Martin S. Holm has made the experiments used in Figure 1-3. He has made the Table and Figures and co-authored the manuscript. Section 2.3 Assessing the acid properties of desilicated ZSM-5 by FTIR using CO and 2,4,6-trimethylpyridine (collidine) as molecular probes
Martin S. Holm has performed the IR experiments used in Figure 1-5 and he has produced scheme 1. Section 2.4 “One-Pot” Ion-Exchange and Mesopore Formation During Desilication
Martin S. Holm has made the experiments used in Figure 1-6 in equal collaboration with Martin Kalhmar Hansen. Martin S. Holm has made the Table and Figures and co-authored the manuscript. Section 2.5 Catalysis with Hierarchical Zeolites
Martin S. Holm has written the section describing alkylation reactions. He has worked with combining the individual contributions and the shaping of the discussion/conclusion part. Section 2.7 High Yield of Liquid Range Olefins Obtained by Converting i-Propanol over Zeolite H-ZSM-5
Martin S. Holm has made the experiments used in Table 1-2 and Figure 1-4 in equal colaboration with Uffe Vie Mentzel. Martin has been closely involved in preparing the Figures and Tables and has co-authored the manuscript. Section 2.8 Utilization of Biomass: Conversion of Model Compounds to Hydrocarbons over Zeolite H-ZSM-5
Martin S. Holm has made the experiments used in Table 1-2 and Figure 1-6 in equal colaboration with Uffe Vie Mentzel. Martin has been closely involved in preparing the Figures and Tables and has co-authored the manuscript. Section 2.10 Zeolite H-USY for the production of lactic acid and methyl lactate from C3-sugars
Martin S. Holm has performed the characterization of the samples e.i. data presented in Figure 3 and Table 4. Martin has co-authored the manuscript. Section 2.11 Zeolite-Catalyzed Isomerization of Triose Sugars
Martin S. Holm has synthesized, post treated and characterized the samples used (Table 1 and Figure s1-s5). Martin has co-authored the manuscript. Section 2.12 Conversion of Sugars to Lactic Acid Derivatives Using Heterogeneous Zeotype Catalysts
Martin S. Holm has synthesized and characterized the samples used. Martin has in collaboration with Shunmugavel Saravanamurugan performed the catalytic testing of the materials. Martin has been involved in making the Figures and Tables and has co-authored the manuscript.

Conversion of Oxygenates over Zeolite Catalysts: Structure-Activity Relations
130
4.4 Supporting NMR data
Figure 4.1. Identification of methyl lactate by NMR. Carbon spectrum of methyl lactate isolated from the reaction mixture and a commercial reference sample.
Figure 4.2. Identification of methyl lactate by NMR. Proton spectrum of methyl lactate isolated from the reaction mixture and a commercial reference sample.

Conversion of Oxygenates over Zeolite Catalysts: Structure-Activity Relations
131
Figure 4.3. Identification of methyl vinyl glycolate by NMR. Carbon spectrum of methyl vinyl glycolate isolated from the reaction mixture and a commercial reference sample.
Figure 4.4. Identification of methyl vinyl glycolate by NMR. Proton spectrum of methyl vinyl glycolate isolated from the reaction mixture and a commercial reference sample.

Conversion of Oxygenates over Zeolite Catalysts: Structure-Activity Relations
132
4.5 Supporting FT-IR data
Figure 4.5. Liquid phase FT-IR spectra of methyl lactate isolated from the reaction mixture and a commercial reference sample. Gas phase spectrum downloaded from NIST (http://webbook.nist.gov/chemistry/) is included from comparison. The spectra are offset by 0,5 for illustrative reasons.