Embed Size (px)
Citation preview

General rights Copyright and moral rights for the publications made accessible in the public portal are retained by the authors and/or other copyright owners and it is a condition of accessing publications that users recognise and abide by the legal requirements associated with these rights.
Users may download and print one copy of any publication from the public portal for the purpose of private study or research.
You may not further distribute the material or use it for any profit-making activity or commercial gain
You may freely distribute the URL identifying the publication in the public portal If you believe that this document breaches copyright please contact us providing details, and we will remove access to the work immediately and investigate your claim.
Downloaded from orbit.dtu.dk on: Mar 28, 2022
Granular filters for water treatment: heterogeneity and diagnostic tools
Lopato, Laure Rose
Publication date:2011
Document VersionPublisher's PDF, also known as Version of record
Link back to DTU Orbit
Citation (APA):Lopato, L. R. (2011). Granular filters for water treatment: heterogeneity and diagnostic tools. TechnicalUniversity of Denmark.
PhD ThesisJune 2011
Granular filters for water treatment:
heterogeneity and diagnostic tools
Laure Lopato

Granular filters for water treatment: heterogeneity and diagnostic tools
Laure Lopato
PhD Thesis June 2011
DTU Environment Department of Environmental Engineering
Technical University of Denmark

DTU Environment
June 2011
Department of Environmental Engineering
Technical University of Denmark
Miljoevej, building 113
DK-2800 Kgs. Lyngby
Denmark
+45 4525 1600
+45 4525 1610
+45 4593 2850
http://www.env.dtu.dk
Vester Kopi
Virum,
Torben Dolin
978-87-92654-40-3
Address:
Phone reception:
Phone library:
Fax:
Homepage:
E-mail:
Printed by:
Cover:
ISBN:
Laure Lopato
PhD Thesis,
The thesis will be available as a pdf-file for downloading from the homepage of
the department: www.env.dtu.dk
June 2011
Granular filters for water treatment:
heterogeneity and diagnostic tools
iii
Preface This thesis presents the outcome of a PhD project carried out at the Department of Environmental Engineering, Technical University of Denmark. The project was supervised by Professor Erik Arvin and Professor Philip J. Binning. The thesis is based on three scientific journal papers:
I. Lopato, L., Galaj, Z., Delpont, S., Binning, P.J., and Arvin, E. (2011). Heterogeneity of rapid sand filters and its effect on contaminant transport and nitrification performance, J. Env. Eng. – ASCE 137(4), 248-257.
II. Lopato, L., Röttgers N., Binning, P.J., and Arvin, E. (2011).
Heterogeneous nitrification in a full-scale rapid sand filter, (submitted). III. Lopato, L., Binning, P.J., and Arvin, E. (2011). Review of diagnostic tools
to investigate the physical state of rapid sand filters, (submitted). In the thesis, these papers are referred to with the roman numerals (e.g. Lopato et al., I).
The papers are not included in this www-version, but can be obtained from the Library at DTU Environment Department of Environmental Engineering Technical University of Denmark Miljoevej, Building 113 DK-2800 Kgs. Lyngby, Denmark ([email protected])
May 2011
Laure Lopato

iv

v
Acknowledgements I would like to thank my supervisors Erik Arvin and Philip Binning for providing consistent support, great advice and strong motivation during the entire PhD study. I am also grateful to Grontmij for their support, especially to Morten Riemer for fruitful discussions and comments. The PhD was supported in part by Grontmij and the Urban Water Technology Graduate School. Conference funding was provided by Otto Mønsteds Fond. I am very grateful to my co-authors Sébastien Delpont, Zofia Galaj and Nina Röttgers. It was a pleasure working together with Zofia and Nina who made the coldness of the waterworks bearable during the long hours we spent there. Their help was very important to my project. I would also like to thank the laboratory technicians at DTU Environment, especially Bent Skov, Susanne Kruse, Mona Refstrup, Sinh Nguyen, and Jens Sørensen, for their help and assistance in the laboratory and in the field. I acknowledge the support of the municipalities of Gentofte and Lyngby-Taarbæk, particularly the employees of Sjælsø Waterworks and Dybendal Waterworks who allowed me to perform experiments in their rapid sand filters, and who provided the necessary data together with deliciously warm coffee. I thank my colleagues and my present and former office-mates who made the working environment so pleasant. My appreciations go to Anne Harsting for her unlimited support in all administrative matters. Thanks to my friends in Denmark for making it fun.

vi
vii
Summary Rapid granular filters are the most commonly used filters in drinking water treatment plants and are the focus of this PhD study. They are usually constructed with sand, anthracite, activated carbon, garnet sand, and ilmenite and have filtration rates ranging from 3 to 15 m/h. Filters are often the last barrier against disinfection resistant protozoan pathogens and this has led to increased regulation of the filtration process. To be able to produce high-quality filtrate in a constant and reliable manner while meeting stricter drinking water guideline values, it is important to be able to optimize the design and operation of filters. However, the operation of the filtration process is considered to be easy and the design and control of filters are still based on empirical values, rules of thumb, simple guidelines, or past experience To optimize the use of granular filters, it is necessary to be able to observe the physical state of the filter. The aim of this PhD study is to contribute to the understanding and optimization of the granular media filtration process. The focus of the work is to develop methodologies and diagnostic tools to analyze the physical state of rapid filters and improve their use and performance. A review of diagnostic tools for rapid granular filters has uncovered both conventional tools, state of the art tools and tools currently in the development or conception stage. The use of the tools for investigating a filter is described. Simple diagnostic tools can be used in a preliminary investigation to observe the symptoms of filter failure. These observations can then motivate a preliminary diagnosis and then appropriate diagnostic tools can be selected and a thorough analysis conducted. From the information obtained, the preliminary diagnosis can be revised and mitigation options prescribed. The diagnostic tools are then used again to verify the efficiency of the solution applied. If the problem is not solved the whole process starts again. These tools are of significant interest for the development of the Water Safety Plans recommended by WHO to monitor filters in a proactive manner. They can also be used to optimize the filtration process. However, further research is necessary to relate the information obtained through the tools to specific causes. New tools such as the total dissolved gas probe, salt tracers and ammonium profiles are presented. Potential tools from the soil and groundwater field such as the hand penetrometer, time domain reflectometry and ground penetrating radar are suggested.
viii
The heterogeneity of rapid filters has not been previously studied at full scale. Filter heterogeneity is not desirable because it makes it difficult to achieve constant and reliable filter performance, and water quality compliance. A salt tracer tool is developed to be used in full-scale filters to investigate the heterogeneity of the filter bed. The tool allows the pore velocity to be estimated in different locations of the filter bed during the duration of a filter run. Similarly, despite the importance of nitrification in groundwater treatment, the removal of ammonium and the determination of the kinetics of nitrification have been insufficiently researched in full-scale filters. A tool is developed to describe nitrification quantitatively on full-scale filters under real conditions with varying inlet flow and concentrations. Experiments conducted in full-scale filters demonstrate that rapid granular filters cannot be considered homogeneous. The estimated pore velocities were shown to be variable in both space and time. A model was used to demonstrate that filter heterogeneity can result in higher filter outlet contaminant concentrations. An experiment also showed that nitrification in full-scale filters is heterogeneous. The ammonium profiles exhibited variation in time and in space, vertically and laterally within the filter. The nitrification rate constants varied randomly in time and it was not possible to determine a clear nitrification reaction order. The cause of the observed nitrification heterogeneity was discussed. Clogging in the top layer of the porous media in a pilot-scale filter was shown to be a possible explanation for the unexpected zero-order nitrification rate. It was also observed that nitrification in the studied full-scale filter was mass transfer limited because the local first-order nitrification rate constants were linearly related to the local pore velocity. By introducing the use of diagnostic tools to Water Safety Plans, new monitoring measures with specific critical limits can be established that can provide an early warning of deteriorating filter performance. However, research on the use of diagnostic tools has to be conducted to document and standardize each procedure, and to relate the information provided by the tools to guideline values or design criteria, and to specific filter failures. Moreover, further research is necessary to develop promising tools such as the hand penetrometer, time domain reflectometry and ground penetrating radar.
ix
Dansk resumé Hurtige granulære filtre er de oftest anvendte filtre i vandværker og er emnet for dette ph.d.-studie. Det granulære medium kan være sand, hvilket er det mest almindelige, antracit, aktivt kul, granat sand, og ilmenit og filtrene har filterhastigheder mellem 3 og 15 m/t. Filtre er ofte den sidste barriere mod patogener, især protozoer, der er resistente overfor disinfektion, hvilket har ført til en øget regulering af filtreringsprocessen. For at være i stand til at producere et filtrat af høj kvalitet på en konstant og pålidelig måde og samtidig opfylde strengere krav til drikkevandskvaliteten, er det vigtigt at kunne optimere design og drift af filtre. Imidlertid anses driften af filtreringsprocessen for at være let, og design og kontrol af filtre er stadig baseret på empiriske værdier, tommelfingerregler, simple retningslinjer eller tidligere erfaring. For at kunne optimere brugen af granulære filtre, er det nødvendigt at kunne observere filterets fysiske tilstand. Formålet med dette ph.d.-studie er at bidrage til forståelsen og optimering af den granulere filtreringsproces. Fokus for arbejdet er at udvikle metoder og diagnostiske værktøjer til at analysere de fysiske tilstande i hurtige granulære filtre og forbedre deres anvendelse og ydeevne. En gennemgang af diagnostiske værktøjer til hurtige granulære filtre har afdækket både konventionelle værktøjer, state of the art værktøjer og redskaber der er under udvikling. Brugen af værktøjerne til at undersøge et filter er beskrevet. Enkle diagnostiske værktøjer kan anvendes i indledende undersøgelser til at observere symptomer på fejl i filteret. Disse observationer kan så føre til en foreløbig diagnose, hvorefter passende diagnostiske værktøjer kan vælges, og en grundig analyse foretages. Fra de indhentede oplysninger, kan den foreløbige diagnose revideres og de nødvendige tiltag blive beskrevet. De diagnostiske værktøjer anvendes igen efter et indgreb for at kontrollere effektiviteten af den anvendte løsning. Hvis problemet ikke er løst foretages hele processen igen. Disse værktøjer er af væsentlig interesse for udviklingen af de Water Safety Plans, der anbefales af WHO til at overvåge filtre på en proaktiv måde. De kan også bruges til at optimere filtrering processen. Imidlertid er der behov for yderligere forskning for at relatere de oplysninger, der er opnået gennem værktøjerne til at udpege fejlenes årsager. Nye værktøjer som ”total opløst gas probe”, salt-sporstoffer og ammoniumprofiler præsenteres. Potentielle værktøjer fra jord og grundvands-området såsom hånd penetrometret, time domain reflectometry og georadar er foreslået.
x
Heterogenitet af hurtige filtre er ikke tidligere blevet undersøgt i fuld skala. Filter heterogenitet er uønsket, fordi det gør det vanskeligt at opnå konstant og pålidelig filter ydeevne og at overholde vandkvalitetskrav. Et salt-sporstof værktøj er udviklet til brug i fuld skala filtre til at undersøge heterogenitet af filtermediet. Værktøjet gør det muligt at bestemme pore hastighed forskellige steder i filteret i løbet af en kørsel. På tilsvarende måde har fjernelse af ammonium og bestemmelse af kinetikken af nitrifikation ikke været tilstrækkeligt udforsket i fuld skala filtre, på trods af betydningen af nitrifikation i grundvandsbehandlingen. Et værktøj er udviklet til at beskrive nitrifikation kvantitativt i fuld-skala filtre under virkelige forhold med varierende indløbsstrømme og koncentrationer. Eksperimenter i fuld skala filtre viser, at hurtige granulære filtre ikke kan betragtes som homogene. Porehastighederne, der blev bestemt under forsøgene, viste sig at være variabel i både tid og rum. En model blev anvendt til at vise, at filtrenes heterogenitet kan resultere i højere forureningskoncentrationer i afgangsvandet. Et eksperiment viste også, at nitrifikation i fuld skala filtre er heterogen. Ammonium profiler udviste variation i tid og rum, vertikalt og horisontalt i filteret. Nitrifikations hastighedskonstanterne varierede, og det var ikke muligt at fastslå en klar nitrifikations reaktionsorden. Årsagen til den observerede nitrifikation heterogenitet diskuteres. Tilstopning i det øverste lag af sandmediet i et pilot plant viste sig at være en mulig forklaring på den uventede observerede nulte-ordens nitrifikation. Det blev også påvist, at nitrifikationen i et fuldskala filter var begrænset af massetransport, fordi første-ordens nitrifikationshastighedskonstanten var lineært relateret til den lokale porevandshastighed. Ved at anvende diagnostiske værktøjer til udarbejdelse af Water Safety Plans kan der etableres nye kontrolforanstaltninger med specifikke grænseværdier til tidlig advarsel om nedsat filter ydeevne. Men der skal forskes i anvendelsen af diagnostiske redskaber for at dokumentere og standardisere hver procedure, og for at relatere den opnåede information fra værktøjet til grænseværdier eller design kriterier, og til specifikke filter fejl. Yderligere forskning er derudover nødvendig for at udvikle lovende redskaber såsom hånd penetrometret, time domain reflectometry og georadar.
xi
Contents 1 Introduction ......................................................................................................1
1.1 Presentation of rapid filters ........................................................................1 1.2 Motivation of the project ............................................................................5 1.3 Objectives ...................................................................................................7
2 Review of diagnostic tools................................................................................9 2.1 Problems in filters.......................................................................................9 2.2 Filter troubleshooting .................................................................................9
2.2.1 Observing symptoms and identifying tools..........................................11 2.2.2 Conducting the main investigation......................................................13 2.2.3 Establishing a diagnosis......................................................................14 2.2.4 Prescribing mitigation options............................................................16
3 Investigation of hydraulic heterogeneity......................................................19 3.1 Salt tracer tool...........................................................................................19 3.2 Hydraulic heterogeneity in filters.............................................................20 3.3 Potential causes of hydraulic heterogeneities...........................................21
3.3.1 Bubble formation experiment ..............................................................22 3.3.2 Effect of filter design ...........................................................................27
3.4 Effect of hydraulics heterogeneities on filter efficiency ..........................27
4 Investigation of nitrification..........................................................................31 4.1 Ammonium diagnostic tool ......................................................................33 4.2 Nitrification in filters................................................................................34 4.3 Factors influencing nitrification ...............................................................36
4.3.1 Nitrification heterogeneity................................................................36 4.3.2 Nitrification kinetics .........................................................................38
5 Conclusions .....................................................................................................41
6 Perspectives.....................................................................................................43 6.1 Significance of the work...........................................................................43 6.2 Limitations................................................................................................43 6.3 Recommendations ....................................................................................44 6.4 Further research ........................................................................................44
References............................................................................................................49
Papers ..................................................................................................................53

xii
1
1 Introduction Filtration has been used to clarify water for thousand of years, but granular filters only became popular for treating drinking water at the end of the nineteenth century when evidence emerged that filtration can prevent waterborne disease. Granular filtration is now used in most drinking water treatment utilities. Depending on the origin of the raw water, filters are designed to remove different type of contaminants. In this thesis, surface water and groundwater under the influence of surface water will be called surface water and groundwater from a protected aquifer will be called groundwater. Granular filters are used to remove algae, sediment, clay, organic matter, and pathogens from surface water. Filtration can also remove dissolved contaminants such as ammonia through microbiologically mediated degradation processes in the filter bed. Groundwater is low in particulates and pathogens but aeration or softening often creates particles that are then removed by filtration.
1.1 Presentation of rapid filters Different kinds of filters are currently used in waterworks: slow sand filters, rapid filters, high rate filters and precoat filters. This work will only consider rapid filters as they are the most common type used in drinking water treatment plants (Crittenden et al. 2005). The term rapid filtration is related to the rate at which water flows through the filter bed. Filtration rates for rapid filters range from 3 to 15 m/h. The filtration rate is a flux (volume/filter area/time) and is also known as the filter velocity amongst practitioners. Rapid filters can be classified using different criteria: operational mode, pretreatment type and the number of filter media layers.
- Flow in rapid filters is either due to gravity or an imposed pressure. Pressure filters work on the same principles as rapid gravity filters; only the filter bed is enclosed in a steel vessel and water is forced through at a pressure of 2-5 atm. The water flow can be downward, upward or horizontal. In the case of trickling filters, the water is sprayed on top of the filter bed leaving the filter media unsaturated. In conventional filtration, a water head of 25 cm to a few meters is maintained on top of the filter.

2
- A typical treatment of surface water includes coagulation, flocculation, and sedimentation followed by filtration. In direct filtration, sedimentation occurs at the same time as filtration. In-line filtration, without coagulation or flocculation, is used for raw water of stable and good quality such as water from groundwater. In-line filtration is sometimes a two-stage filtration process, where the first-stage filter is made of coarse media.
- Monomedia filters include only one layer of filter material, often sand.
Rapid sand filters are the oldest type of rapid filters. They are still in use but are being abandoned for more efficient designs. Deep-bed monomedia filters are typically constructed of a 1.5-1.8-m deep layer of anthracite or activated carbon. Dual-media filters have a 0.5-m deep layer of anthracite or granular activated carbon on top of a 0.3-m deep layer of sand. In multi-media filters, a 0.1-m deep layer of garnet or ilmenite is added at the bottom.
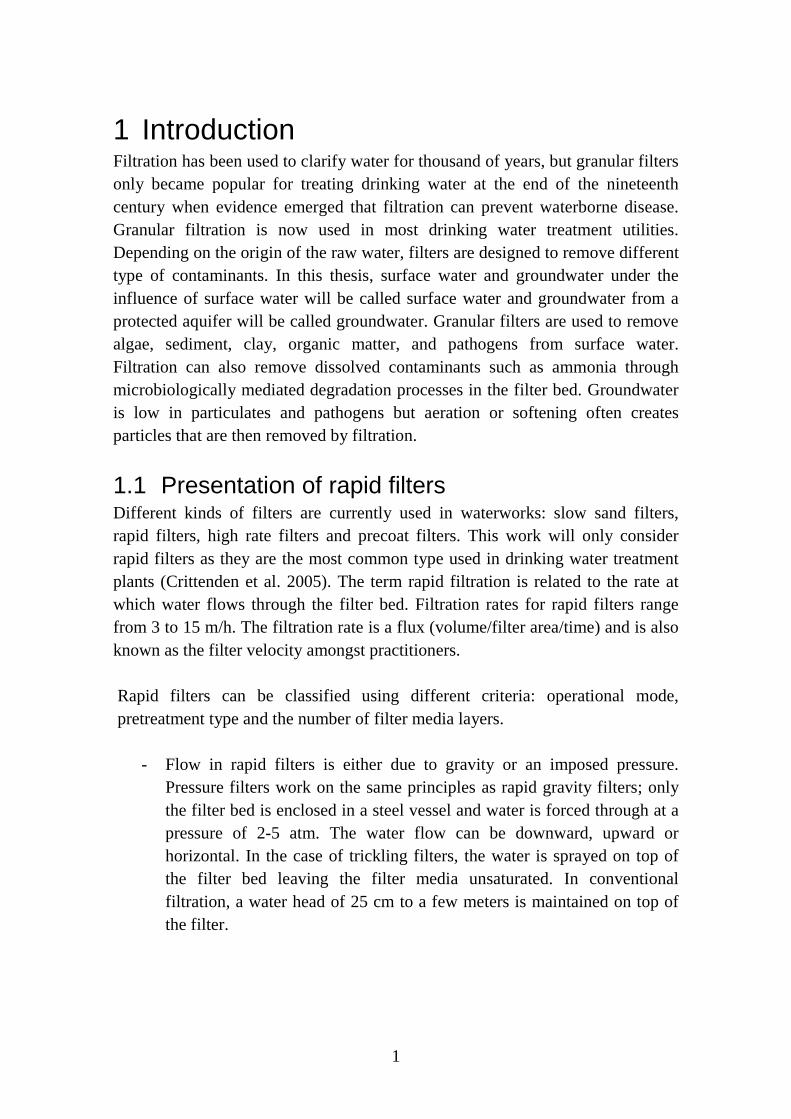
A common configuration for rapid filters is illustrated in Figure 1.1. A filter box contains the filter bed, typically one meter deep, and the media support. The filter media grain size is typically between 0.4 to 5mm. As the water flows downward through the filter bed, particles and soluble contaminants are removed. Particles are removed by attachment to filter material or by physical straining. Soluble contaminants such as ammonium are removed through biological degradation by an active biomass growing on the filter medium. After some time, typically 1 to 8 days, the filter bed is backwashed to remove the accumulated particles and biomass. During backwash, water flows upwards to clean the filter bed. Backwashes can last 15 to 30 minutes. The upward water flow is often supplemented with compressed air blown through the filter from the bottom (air scour) or by water jets from nozzles placed on top of the filter bed (surface wash).
3
Figure 1.1: Open-top gravity rapid filter with air scour backwash system.
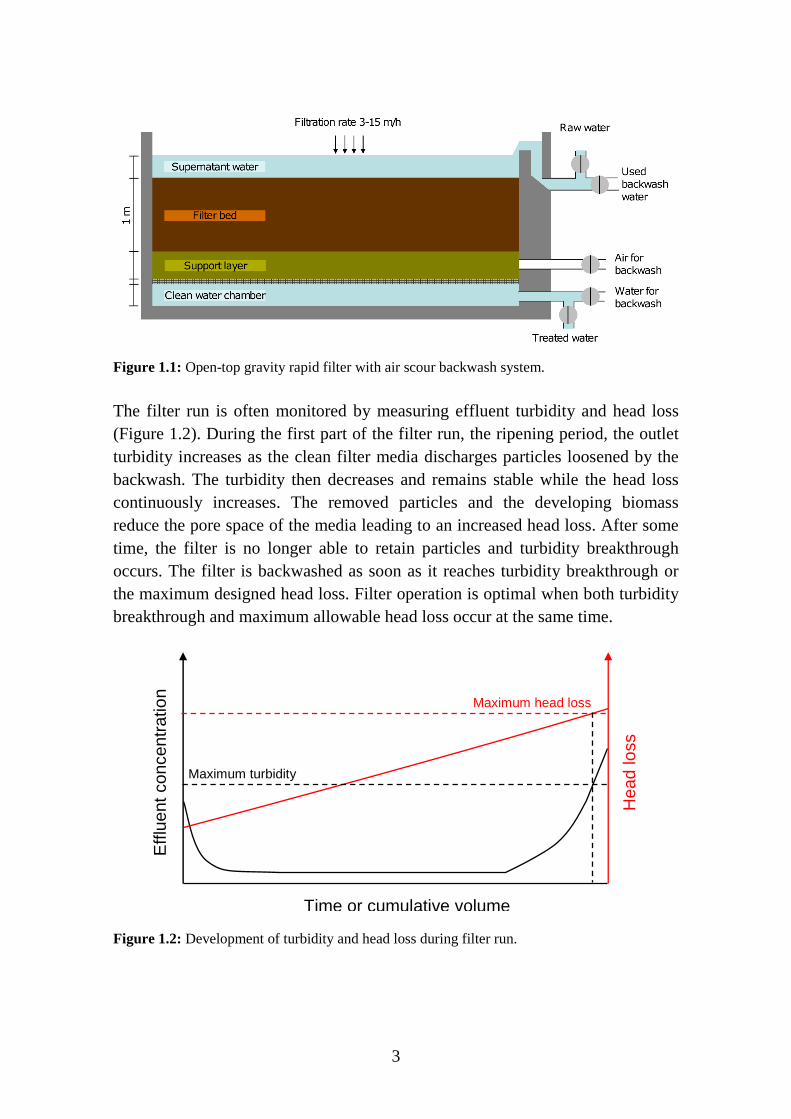
The filter run is often monitored by measuring effluent turbidity and head loss (Figure 1.2). During the first part of the filter run, the ripening period, the outlet turbidity increases as the clean filter media discharges particles loosened by the backwash. The turbidity then decreases and remains stable while the head loss continuously increases. The removed particles and the developing biomass reduce the pore space of the media leading to an increased head loss. After some time, the filter is no longer able to retain particles and turbidity breakthrough occurs. The filter is backwashed as soon as it reaches turbidity breakthrough or the maximum designed head loss. Filter operation is optimal when both turbidity breakthrough and maximum allowable head loss occur at the same time.
Figure 1.2: Development of turbidity and head loss during filter run.
Time or cumulative volume
Effl
uent
con
cent
ratio
n
Hea
d lo
ss
Maximum turbidity
Maximum head loss
4
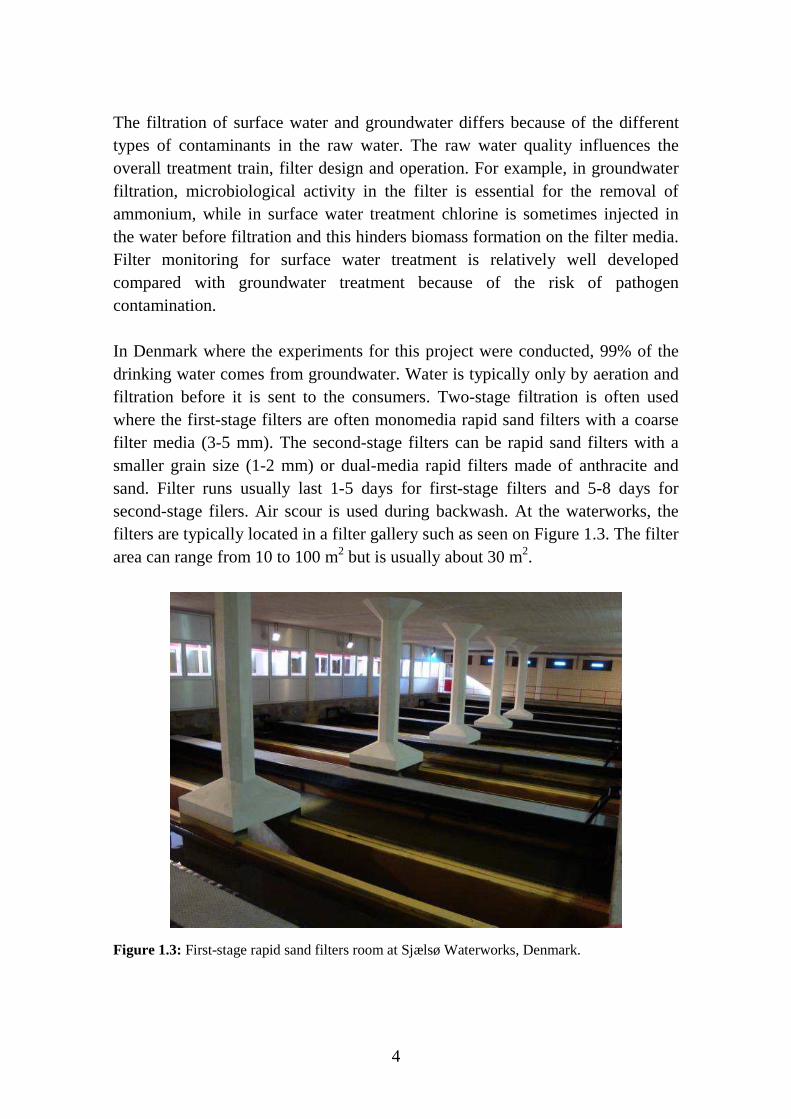
The filtration of surface water and groundwater differs because of the different types of contaminants in the raw water. The raw water quality influences the overall treatment train, filter design and operation. For example, in groundwater filtration, microbiological activity in the filter is essential for the removal of ammonium, while in surface water treatment chlorine is sometimes injected in the water before filtration and this hinders biomass formation on the filter media. Filter monitoring for surface water treatment is relatively well developed compared with groundwater treatment because of the risk of pathogen contamination. In Denmark where the experiments for this project were conducted, 99% of the drinking water comes from groundwater. Water is typically only by aeration and filtration before it is sent to the consumers. Two-stage filtration is often used where the first-stage filters are often monomedia rapid sand filters with a coarse filter media (3-5 mm). The second-stage filters can be rapid sand filters with a smaller grain size (1-2 mm) or dual-media rapid filters made of anthracite and sand. Filter runs usually last 1-5 days for first-stage filters and 5-8 days for second-stage filers. Air scour is used during backwash. At the waterworks, the filters are typically located in a filter gallery such as seen on Figure 1.3. The filter area can range from 10 to 100 m2 but is usually about 30 m2.
Figure 1.3: First-stage rapid sand filters room at Sjælsø Waterworks, Denmark.
5
1.2 Motivation of the project Filtration processes are sometimes considered to be simple with the removal of particles being quite well described in the literature. However, granular filters are not just strainers, processes such as transport, adhesion, and detachment occur in the filter media and these are complicated by the development of heterogeneities. Moreover, filters are an engineered system composed of a filter box, filter media, a support layer, an underdrain, piping, pumps, valves, nozzles, a control system and a monitoring system. Poor filter operation can lead to treatment failure jeopardizing the production of safe drinking water and causing waterborne disease outbreaks. The outbreaks of the waterborne diseases caused by Giardia cysts (Daly et al., Karanis et al. 2007) and Cryptosporidium oocysts (Karanis et al. 2007) over the last three decades have increased attention on filtration efficiency in the water industry. Granular media filtration may be the only barrier for removing these protozoan pathogens when chlorine is used as the sole disinfectant (LeChevallier and Au 2004). Indeed Giardia cysts and Cryptosporidium oocysts are highly resistant to chlorination (Korich et al. 1990). Concentrations and contact time required to achieve inactivation of these pathogens by conventional disinfectants (chlorine, chlorine dioxide, chloramine and ozone) are not appropriate for use in treatment plants (Medema et al. 2009). On the other hand, under optimal conditions, conventional treatment with coagulation, flocculation, sedimentation and granular media filtration can result in the 4 log removal of Cryptosporidium. and Giardia (LeChevallier and Au 2004). This has led to increased regulations of the filtration process (Bouchier 1998, US EPA 1998). To be able to consistently and reliably produce high-quality drinking-water that meets stricter drinking water guideline values, it is important to be able to optimize the design and operation of filters. Surprisingly, despite the widespread use of granular filters (rapid filters in particular), and improvement in our scientific understanding of the fundamental mechanisms operating during filtration, the design and control of filters is still based on empirical observation, rules of thumb, simple guidelines, or past experience (Lawler and Nason 2006, Scardina and Edwards 2002). Some frequently occurring problems in filters, such as air binding, are rarely investigated or prevented (Edwards and Scardina 2007). There is a need for a better understanding and monitoring of granular filters.

6
To be able to optimize the use of granular filters, it is necessary to observe the physical state of the filter. Diagnostic tools can be used to investigate the physical state of the filter and obtain a better understanding of the filter performance and of the influence of the operating conditions. Diagnostic tools are described in water treatment textbooks and in specialized filtration books. However, there are very few scientific articles published on the subject. A review of available tools is necessary to establish the quality of the information they provide and how they can be used for monitoring and optimization of the filtration process. Many waterworks aim to adopt the Water Safety Plans of WHO (Davison et al. 2005), which provide a common framework for applying risk management techniques in the water industry. The procedure includes identification of control measures in the different water production steps with appropriate means of monitoring. Corrective action procedures and contingency plan are put in place when deviation from a defined critical limit is detected. It is therefore important to improve monitoring of the filtration step so that more control measures and appropriate critical limits become available. The review also indicates knowledge gaps and the necessity for the development of new tools. For example, the heterogeneity of filter beds has not been studied at full-scale. Filter heterogeneity is not desirable because it makes it difficult to achieve constant and reliable filter performance and comply with water quality criteria. Tracer studies of deep-bed filters at the laboratory scale have shown that clogging and heterogeneity affect hydraulics, but are limited because they are only small-scale one-dimensional column studies (Coad and Ives 1981, Pendse et al. 1978, Rodier et al. 1997, Seifert and Engesgaard 2007). Tracer studies are needed in full-scale filters to investigate hydraulics heterogeneity and its effect on filter efficiency. Similarly, despite the importance of nitrification in groundwater treatment, the removal of ammonium and the kinetics of nitrification have been insufficiently researched in full-scale filters (Johansen et al. 1999, Laurent et al. 2003). The precise and quantitative description of nitrification in a filter bed is important for filtration process understanding and for improving filter design and operation. It is desirable to develop tools to investigate nitrification on full-scale filters under real conditions with varying inlet flow and concentrations.
7
1.3 Objectives The aim of this PhD study is to contribute to the understanding and optimization of the granular media filtration process. The focus of the work is to develop methodologies and diagnostic tools to analyze the physical state of rapid filters and improve their use and performance. The thesis aims to:
- Provide an overview of the problems occurring in filters and of their possible causes in order to be able to identify valid diagnostic tools. Review existing and potential diagnostic tools.
- Develop a tool and procedure to investigate and determine the extent of
filter hydraulic heterogeneity and its effect on filtration efficiency.
- Develop a tool and procedure to investigate nitrification in filters. Describe nitrification kinetics in filters
Each specific objective is considered in a chapter of this thesis and each forms the basis of a scientific paper. For detailed discussions and conclusions, the reader is referred to the papers. Finally, the main conclusions of the PhD study are presented.

8
9
2 Review of diagnostic tools Although the construction and operation of rapid sand filters appear simple, several problems can occur in waterworks hindering the efficiency of the filtration process.
2.1 Problems in filters Some problems such as decreases in the removal efficiency of soluble or particulate contaminants, a short filter run caused by too fast increases in head loss or fast breakthrough, or a growth or compaction of the filter bed can be easily spotted by waterworks operators during regular monitoring of the filters. These problems disrupt the filtration process and decrease the quality of the treated water. Unfortunately, they are not uncommon. There are many reports of filter problems in the literature. Scardina and Edwards (2002) investigated a waterworks where employees complained about a rapid increase of head loss during filtration and media boiling during backwashing. Edwards and Scardina (2007) studied a waterworks with an inefficient filtration process characterized by very short filter runs and media flotation during filtration. In another filtration they observed excessive algal blooms in the filter bed. Mayhugh et al. (1996) worked on the rehabilitation of a filter producing high turbidity water and exhibiting filter bed growth and inefficient backwash. In Denmark, a report on continuous monitoring of drinking water quality (Corfitzen and Albrechtsen 2010) showed that 4 out of 5 waterworks studied had filter effluent turbidity levels higher than 0.3 NTU 13-42% of the time. At one waterworks in Denmark, the effluent turbidity was higher than 0.3 NTU 20% of the time. Many additional examples of poor filter performance are described by waterworks operators in Denmark. At one utility, the filter bed of some filters grew so much that the top centimeters of the media had to be removed to keep enough space in the filter box. In two other plants, media boiling during filtration was an issue. Another common problem is that the ammonium removal efficiency is too low.
2.2 Filter troubleshooting To optimize the use of filters, it is necessary to establish the causes and mechanisms of the problems occurring in filters. Diagnostic tools achieve this
10
purpose by investigating the physical state of the filter. Filter evaluation and troubleshooting is described in chapters of water treatment textbooks such as AWWA (2003), Cleasby (1990) and Kawamura (1991), and in specialized filtration books such as Beverly (2005), Logsdon (2008), Logsdon et al. (2002) and Nix and Taylor (2003). No scientific articles consider comprehensive filter investigation and very few discuss the use of diagnostic tools (de Vet et al. 2009, Edwards and Scardina 2007, van Staden and Haarhoff 2004). However, the diversity of available tools reflects the difficulty of operating granular filtration processes and the necessity of filter evaluation. Diagnostic tools can first be used to observe the symptoms of the filter failure. Once a preliminary diagnosis has been made based on these observations, appropriate diagnostic tools can be selected and a thorough analysis conducted. From the information obtained, the preliminary diagnosis can be revised and mitigation options prescribed. Diagnostic tools can then be used to verify the efficiency of the solution applied. If the problem has not been resolved the whole process is repeated (Figure 2.1). Specialized filtration books (Beverly 2005, Nix and Taylor 2003) detail very clearly the procedures required to carry out a filter evaluation at a waterworks as routine maintenance or as corrective action. They even provide the readers with template for assessment reports. However, they only provide help on data collection and do not provide the values or criteria the information obtained should be compared too. They also do not describe how to respond to the information obtained. Moreover, the use of the tools for studying a specific problem or for optimizing filtration is not explained.

11
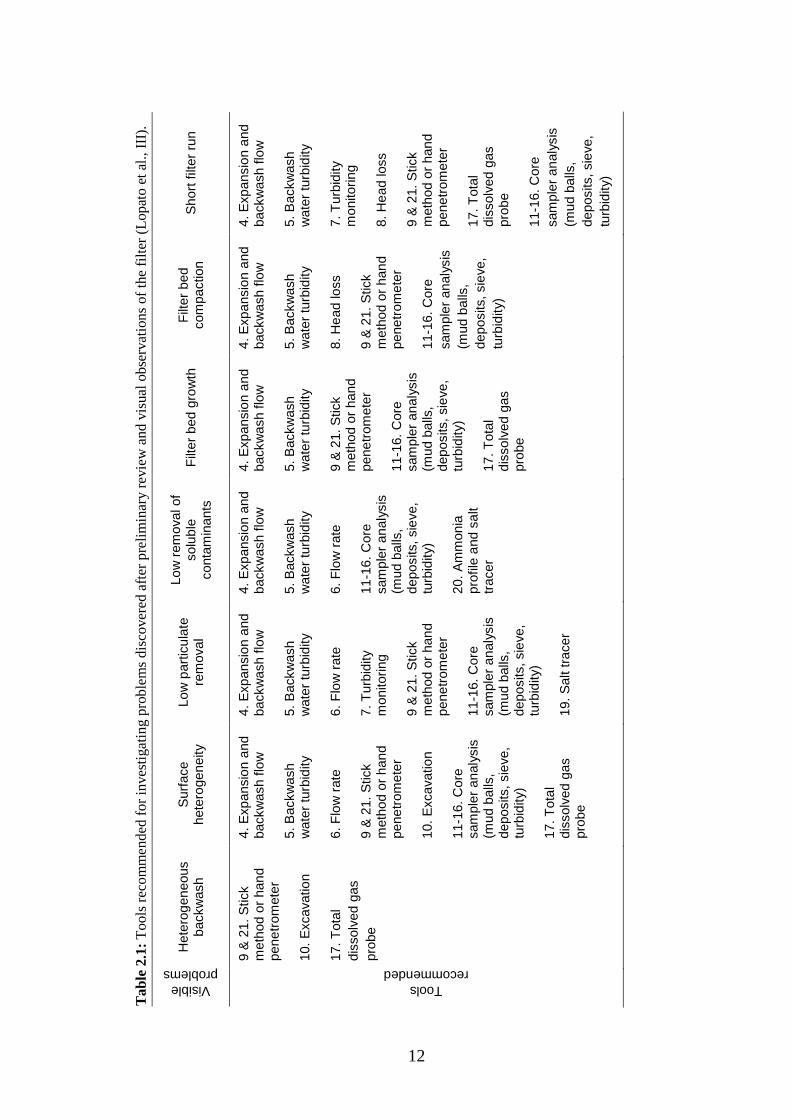
Figure 2.1: Filter troubleshooting flow chart diagram including the role of diagnostic tools (Lopato et al., III).
2.2.1 Observing symptoms and identifying tools Filter investigations start with a preliminary review and visual observations methods to provide a precise description of the problems occurring in the filter and a preliminary diagnosis (Figure 2.1). Often a review and observations are not sufficient to determine the causes of a filter problem, but they can help identify the appropriate tools for further analysis of the filter (Table 2.1).
Diagnostic tools
2. Preliminary diagnosis
Poor inlet water quality
Operational failures Structural failures
1. Observe
symptoms
Poor effluent quality and structural
problems
5. Revise
diagnosis
6. Prescribe mitigation
options
3. Identify
tools
4. Conduct analysis
7. Monitor
efficiency of the changes
Are the problems solved?
Done
Yes No
12
Tab
le 2
.1: T
ools
rec
omm
end
ed fo
r in
vest
igat
ing
prob
lem
s di
scov
ered
afte
r pr
elim
inar
y re
view
and
vis
ual o
bser
vatio
ns o
f th
e fil
ter
(Lop
ato
et a
l., II
I).
Visible problems
Het
erog
eneo
us
back
was
h S
urfa
ce
hete
roge
neity
Lo
w p
artic
ulat
e re
mov
al
Low
rem
oval
of
solu
ble
cont
amin
ants
F
ilter
bed
gro
wth
F
ilter
bed
co
mpa
ctio
n S
hort
filte
r ru
n
Tools recommended
9 &
21.
Stic
k m
etho
d or
han
d pe
netr
omet
er
10. E
xcav
atio
n
17. T
otal
di
ssol
ved
gas
prob
e
4. E
xpan
sion
and
ba
ckw
ash
flow
5.
Bac
kwas
h w
ater
turb
idity
6.
Flo
w r
ate
9 &
21.
Stic
k m
etho
d or
han
d pe
netr
omet
er
10. E
xcav
atio
n 11
-16.
Cor
e sa
mpl
er a
naly
sis
(mud
bal
ls,
depo
sits
, sie
ve,
turb
idity
) 17
. Tot
al
diss
olve
d ga
s pr
obe
4. E
xpan
sion
and
ba
ckw
ash
flow
5.
Bac
kwas
h w
ater
turb
idity
6.
Flo
w r
ate
7. T
urbi
dity
m
onito
ring
9 &
21.
Stic
k m
etho
d or
han
d pe
netr
omet
er
11-1
6. C
ore
sam
pler
ana
lysi
s (m
ud b
alls
, de
posi
ts, s
ieve
, tu
rbid
ity)
19. S
alt t
race
r
4. E
xpan
sion
and
ba
ckw
ash
flow
5.
Bac
kwas
h w
ater
turb
idity
6.
Flo
w r
ate
11-1
6. C
ore
sam
pler
ana
lysi
s (m
ud b
alls
, de
posi
ts, s
ieve
, tu
rbid
ity)
20. A
mm
onia
pr
ofile
and
sal
t tr
acer
4. E
xpan
sion
and
ba
ckw
ash
flow
5.
Bac
kwas
h w
ater
turb
idity
9
& 2
1. S
tick
met
hod
or h
and
pene
trom
eter
11
-16.
Cor
e sa
mpl
er a
naly
sis
(mud
bal
ls,
depo
sits
, sie
ve,
turb
idity
) 17
. Tot
al
diss
olve
d ga
s pr
obe
4. E
xpan
sion
and
ba
ckw
ash
flow
5.
Bac
kwas
h w
ater
turb
idity
8.
Hea
d lo
ss
9 &
21.
Stic
k m
etho
d or
han
d pe
netr
omet
er
11-1
6. C
ore
sam
pler
ana
lysi
s (m
ud b
alls
, de
posi
ts, s
ieve
, tu
rbid
ity)
4. E
xpan
sion
and
ba
ckw
ash
flow
5.
Bac
kwas
h w
ater
turb
idity
7.
Tur
bidi
ty
mon
itorin
g 8.
Hea
d lo
ss
9 &
21.
Stic
k m
etho
d or
han
d pe
netr
omet
er
17. T
otal
di
ssol
ved
gas
prob
e
11-1
6. C
ore
sam
pler
ana
lysi
s (m
ud b
alls
, de
posi
ts, s
ieve
, tu
rbid
ity)
13
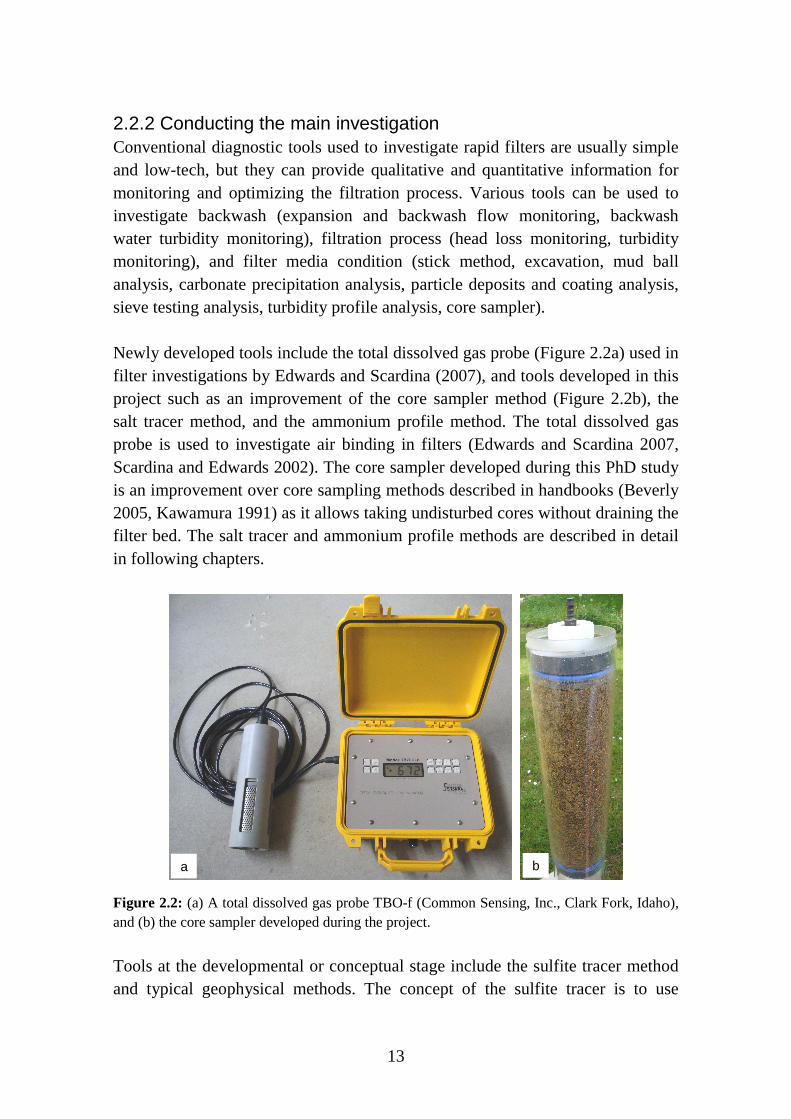
2.2.2 Conducting the main investigation Conventional diagnostic tools used to investigate rapid filters are usually simple and low-tech, but they can provide qualitative and quantitative information for monitoring and optimizing the filtration process. Various tools can be used to investigate backwash (expansion and backwash flow monitoring, backwash water turbidity monitoring), filtration process (head loss monitoring, turbidity monitoring), and filter media condition (stick method, excavation, mud ball analysis, carbonate precipitation analysis, particle deposits and coating analysis, sieve testing analysis, turbidity profile analysis, core sampler). Newly developed tools include the total dissolved gas probe (Figure 2.2a) used in filter investigations by Edwards and Scardina (2007), and tools developed in this project such as an improvement of the core sampler method (Figure 2.2b), the salt tracer method, and the ammonium profile method. The total dissolved gas probe is used to investigate air binding in filters (Edwards and Scardina 2007, Scardina and Edwards 2002). The core sampler developed during this PhD study is an improvement over core sampling methods described in handbooks (Beverly 2005, Kawamura 1991) as it allows taking undisturbed cores without draining the filter bed. The salt tracer and ammonium profile methods are described in detail in following chapters.
Figure 2.2: (a) A total dissolved gas probe TBO-f (Common Sensing, Inc., Clark Fork, Idaho), and (b) the core sampler developed during the project.
Tools at the developmental or conceptual stage include the sulfite tracer method and typical geophysical methods. The concept of the sulfite tracer is to use
a b
14
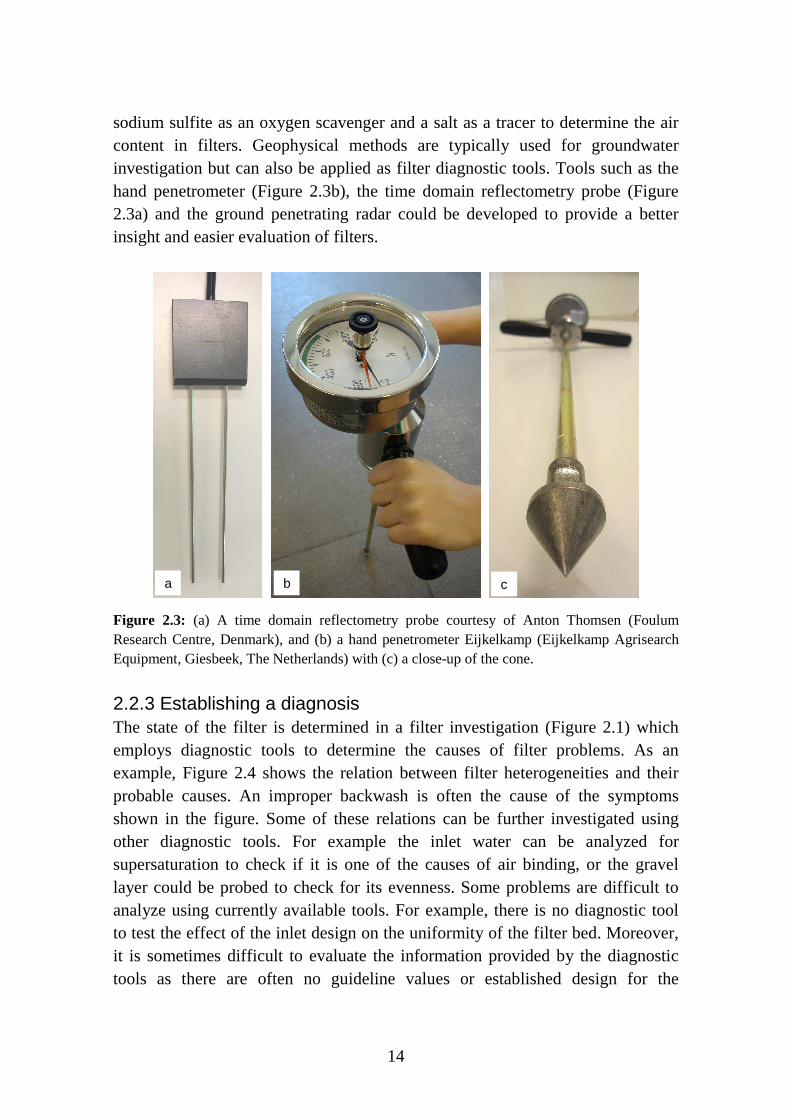
sodium sulfite as an oxygen scavenger and a salt as a tracer to determine the air content in filters. Geophysical methods are typically used for groundwater investigation but can also be applied as filter diagnostic tools. Tools such as the hand penetrometer (Figure 2.3b), the time domain reflectometry probe (Figure 2.3a) and the ground penetrating radar could be developed to provide a better insight and easier evaluation of filters.
Figure 2.3: (a) A time domain reflectometry probe courtesy of Anton Thomsen (Foulum Research Centre, Denmark), and (b) a hand penetrometer Eijkelkamp (Eijkelkamp Agrisearch Equipment, Giesbeek, The Netherlands) with (c) a close-up of the cone.
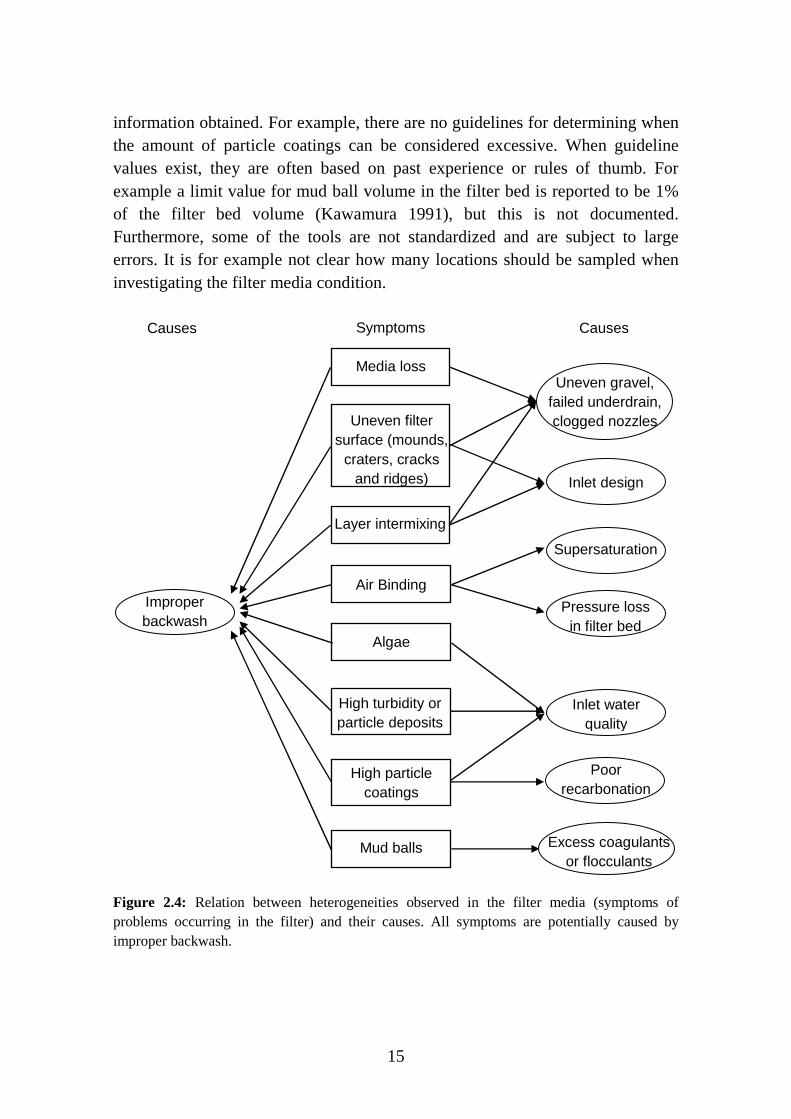
2.2.3 Establishing a diagnosis The state of the filter is determined in a filter investigation (Figure 2.1) which employs diagnostic tools to determine the causes of filter problems. As an example, Figure 2.4 shows the relation between filter heterogeneities and their probable causes. An improper backwash is often the cause of the symptoms shown in the figure. Some of these relations can be further investigated using other diagnostic tools. For example the inlet water can be analyzed for supersaturation to check if it is one of the causes of air binding, or the gravel layer could be probed to check for its evenness. Some problems are difficult to analyze using currently available tools. For example, there is no diagnostic tool to test the effect of the inlet design on the uniformity of the filter bed. Moreover, it is sometimes difficult to evaluate the information provided by the diagnostic tools as there are often no guideline values or established design for the
a b c
15
information obtained. For example, there are no guidelines for determining when the amount of particle coatings can be considered excessive. When guideline values exist, they are often based on past experience or rules of thumb. For example a limit value for mud ball volume in the filter bed is reported to be 1% of the filter bed volume (Kawamura 1991), but this is not documented. Furthermore, some of the tools are not standardized and are subject to large errors. It is for example not clear how many locations should be sampled when investigating the filter media condition.
Figure 2.4: Relation between heterogeneities observed in the filter media (symptoms of problems occurring in the filter) and their causes. All symptoms are potentially caused by improper backwash.
Symptoms
Pressure loss in filter bed
Supersaturation
Improper backwash
Inlet water quality
Inlet design
Uneven gravel, failed underdrain, clogged nozzles Uneven filter
surface (mounds, craters, cracks
and ridges)
High particle coatings
Layer intermixing
Air Binding
Mud balls
Algae
High turbidity or particle deposits
Excess coagulants or flocculants
Poor recarbonation
Causes Causes
Media loss
16
To be able to use diagnostic tools in a proactive manner for monitoring filters as part of the Water Safety Plans recommended by WHO (Davison et al. 2005), their use needs to be documented and standardized. By introducing the use of diagnostic tools to Water Safety Plans, new monitoring measures with specific critical limits can be established that can provide an early warning of deteriorating filter performance (Table 2.2). Diagnostic tools can also be used to intervene and further investigate problems observed and optimize the filter. Table 2.2: Example of control measures, critical limits and monitoring related to microbial, chemical and physical hazards affecting the filtration process which can be used for describing operational monitoring in a Water Safety Plan.
Hazardous event Control measures Critical limits Monitoring
Improper backwash as nozzles from surface wash are clogged
Ensure no nozzles are clogged on the surface wash
One clogged nozzle
Observing surface wash
Poor filtration as the filter bed is filled with mud balls.
Ensure low presence of mud balls in the filter bed
1% in volume of mud balls in the filter bed
Filter surface observation and core sample analysis
Turbidity peaks caused by sudden changes in inlet flow rate
Ensure nearly constant flow rate
5% flow rate increase per minute
Flow meter at the inlet of the filter
2.2.4 Prescribing mitigation options Once the causes of filter problems are discovered, it is important to determine the best mitigation options (Figure 2.1). At a waterworks, filters are often investigated when they are no longer able to operate correctly and when the only practical mitigation option is to replace the filter bed and this is both costly and time-consuming. If filter investigations are conducted during preventive maintenance then a larger range of viable mitigation options will be available. It is sometimes necessary to restore the physical state of the filter bed before applying mitigation options. For example failed filter media must be treated before improved design, backwash or pretreatment is put in place. Mud balls can be removed by straining them from the top of the filter while backwash is run at a low rate, by breaking them with rakes, hose jets, by using strong surface wash, or by removing them manually (Cleasby 1990, Logsdon 2008). Mineral deposits and mud balls can also be removed by chemical methods such as the addition of acetic acid or sodium hydroxide (Logsdon 2008, Mayhugh et al. 1996).
17
Mitigation options can vary from improved pretreatment, to changes in operational parameters (backwash sequence, flow rate, run time), and in structural parameters (inlet design, tank structure, underdrain structure, filter media). Beverly (2005) recommends the optimization of pretreatment before attempting to improve the filtration process itself. Proper selection of mitigation options can lead to optimized filtration performance.

18
19
3 Investigation of hydraulic heterogeneity A salt tracer tool was developed to test the hypothesis that the hydraulic conditions in a rapid filter bed are heterogeneous (Lopato et al., I). The technique was developed because visual observations of the filter surface of various filters in different waterworks showed that filter beds are non uniform. Heterogeneity is not desirable because it makes it difficult to achieve constant and reliable filter performance regarding water quality compliance. Tracers are commonly used to study the hydraulic properties of the porous media and to identify the structure of heterogeneities in the soil subsurface. For more than two decades, extensive studies have been conducted on the spatial variability of the hydraulic conductivity of the subsurface. These studies have shown that hydraulic properties vary irregularly in three-dimensions (Close et al. 2008, Slater et al. 2002, Sudicky 1986). Such methods have not been applied in filters measurements or modeling.
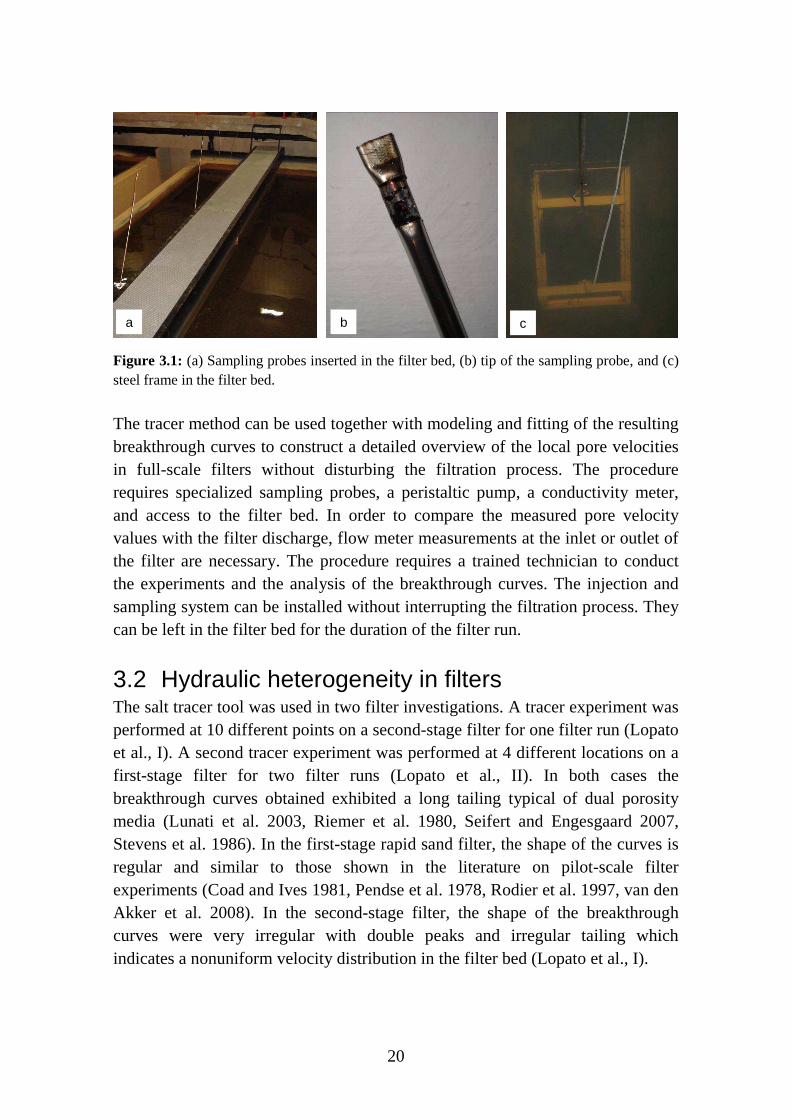
3.1 Salt tracer tool To investigate the heterogeneity of filter hydraulics, tracer tests are conducted at various locations in a filter bed at approximately the same time. For a tracer test, a sampling probe (Figure 3.1) is inserted into the filter bed and a volume of salt solution is injected into the filter bed above the probe. A steel frame (Figure 3.1) is used to ensure that the injection needle is located just above the tip of the sampling probe. The steel frame was added after the first set of experiments to help locating the injection point. The electrical conductivity of the water pumped out of the filter probe is measured. A breakthrough curve is obtained from these measurements. The sampling and injection tools can be placed at different locations in the filter bed and left in place for the duration of the filter run. The methodology is described in Lopato et al. (I). The measured breakthrough curves are modeled using the analytical solution of Leij et al. (1991, Eq. 3T) of the advection-dispersion equation for three-dimensional solute transport in a semi-infinite porous media with unidirectional flow, using a flux boundary condition at the inlet of the medium. Three parameters are fitted to the curves using a nonlinear least-squares regression implemented in Matlab: pore-water velocity, longitudinal dispersivity and transverse dispersivity (Lopato et al., I).
20
Figure 3.1: (a) Sampling probes inserted in the filter bed, (b) tip of the sampling probe, and (c) steel frame in the filter bed.
The tracer method can be used together with modeling and fitting of the resulting breakthrough curves to construct a detailed overview of the local pore velocities in full-scale filters without disturbing the filtration process. The procedure requires specialized sampling probes, a peristaltic pump, a conductivity meter, and access to the filter bed. In order to compare the measured pore velocity values with the filter discharge, flow meter measurements at the inlet or outlet of the filter are necessary. The procedure requires a trained technician to conduct the experiments and the analysis of the breakthrough curves. The injection and sampling system can be installed without interrupting the filtration process. They can be left in the filter bed for the duration of the filter run.
3.2 Hydraulic heterogeneity in filters The salt tracer tool was used in two filter investigations. A tracer experiment was performed at 10 different points on a second-stage filter for one filter run (Lopato et al., I). A second tracer experiment was performed at 4 different locations on a first-stage filter for two filter runs (Lopato et al., II). In both cases the breakthrough curves obtained exhibited a long tailing typical of dual porosity media (Lunati et al. 2003, Riemer et al. 1980, Seifert and Engesgaard 2007, Stevens et al. 1986). In the first-stage rapid sand filter, the shape of the curves is regular and similar to those shown in the literature on pilot-scale filter experiments (Coad and Ives 1981, Pendse et al. 1978, Rodier et al. 1997, van den Akker et al. 2008). In the second-stage filter, the shape of the breakthrough curves were very irregular with double peaks and irregular tailing which indicates a nonuniform velocity distribution in the filter bed (Lopato et al., I).
a b c
21
Both filters are from the same waterworks and work in series. The first-stage filter treats water with higher ammonium, iron and particles concentrations. The filter media is coarser and less uniform in the first-stage (3-14 mm in diameter in the top layers) than in the second-stage (1.5-2 mm in diameter). The first-stage filter is run at higher flux (10 m/h in average) than the second-stage filter (2 m/h in average). Both filters have low backwash frequency, every 6 days for the first-stage filter and every 11 days for the second-stage filter. It can be speculated that the higher uniformity of the first-stage filter media is due to the backwash frequency. The more frequent backwash might restore the filter bed more efficiently despite the higher load of particles. Further research on this matter is necessary to investigate how heterogeneity in the filter media can be limited. The local pore velocities obtained by fitting the breakthrough curves were compared to the inlet flow. In both set of experiments, it was shown that at a given time the local pore velocities varied within the filter bed, and at a given flow, the local pore velocities varied with time proving that the hydraulic conditions in the filter bed were heterogeneous (Lopato et al., I and II). The tracer experiment carried out at Sjælsø waterworks showed that the investigated filters were heterogeneous. Since these filters have a design that it is typical for rapid sand filters, it is reasonable to make the general conclusion that rapid sand filters used for drinking water treatment cannot be considered to be homogeneous (Lopato et al., I and II).
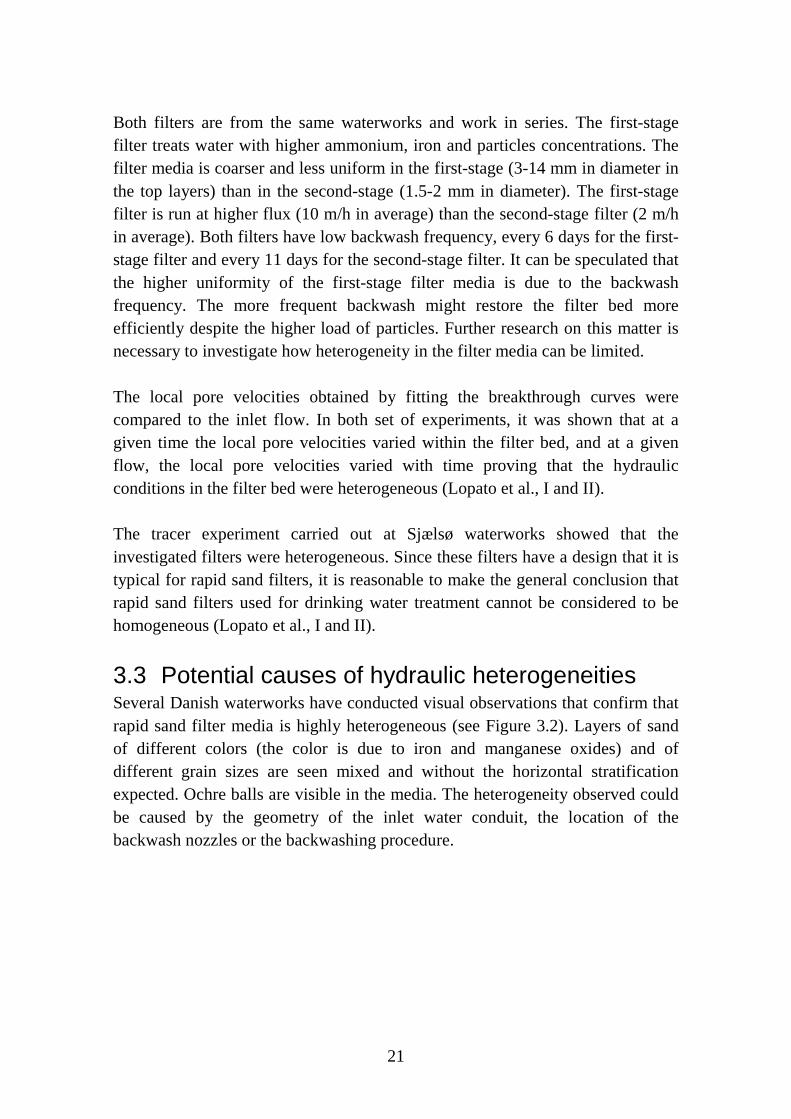
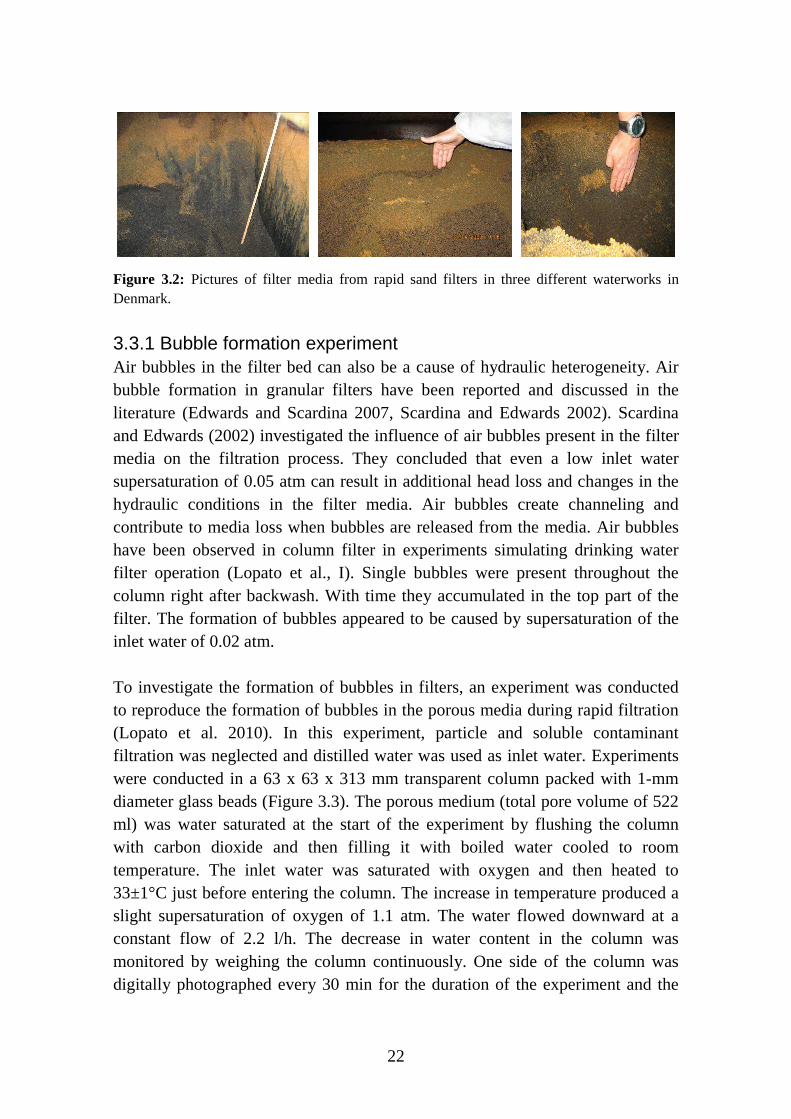
3.3 Potential causes of hydraulic heterogeneities Several Danish waterworks have conducted visual observations that confirm that rapid sand filter media is highly heterogeneous (see Figure 3.2). Layers of sand of different colors (the color is due to iron and manganese oxides) and of different grain sizes are seen mixed and without the horizontal stratification expected. Ochre balls are visible in the media. The heterogeneity observed could be caused by the geometry of the inlet water conduit, the location of the backwash nozzles or the backwashing procedure.
22
Figure 3.2: Pictures of filter media from rapid sand filters in three different waterworks in Denmark.
3.3.1 Bubble formation experiment Air bubbles in the filter bed can also be a cause of hydraulic heterogeneity. Air bubble formation in granular filters have been reported and discussed in the literature (Edwards and Scardina 2007, Scardina and Edwards 2002). Scardina and Edwards (2002) investigated the influence of air bubbles present in the filter media on the filtration process. They concluded that even a low inlet water supersaturation of 0.05 atm can result in additional head loss and changes in the hydraulic conditions in the filter media. Air bubbles create channeling and contribute to media loss when bubbles are released from the media. Air bubbles have been observed in column filter in experiments simulating drinking water filter operation (Lopato et al., I). Single bubbles were present throughout the column right after backwash. With time they accumulated in the top part of the filter. The formation of bubbles appeared to be caused by supersaturation of the inlet water of 0.02 atm. To investigate the formation of bubbles in filters, an experiment was conducted to reproduce the formation of bubbles in the porous media during rapid filtration (Lopato et al. 2010). In this experiment, particle and soluble contaminant filtration was neglected and distilled water was used as inlet water. Experiments were conducted in a 63 x 63 x 313 mm transparent column packed with 1-mm diameter glass beads (Figure 3.3). The porous medium (total pore volume of 522 ml) was water saturated at the start of the experiment by flushing the column with carbon dioxide and then filling it with boiled water cooled to room temperature. The inlet water was saturated with oxygen and then heated to 33±1°C just before entering the column. The increase in temperature produced a slight supersaturation of oxygen of 1.1 atm. The water flowed downward at a constant flow of 2.2 l/h. The decrease in water content in the column was monitored by weighing the column continuously. One side of the column was digitally photographed every 30 min for the duration of the experiment and the

23
pictures were processed in Photoshop (Adobe Systems Inc., San Jose, California) to determine area and location of the bubbles. Color tracer tests were performed during the experiment. A 5 ml syringe connected to a 0.8-mm thick and 75-mm long needle was inserted into sample port 2 and a volume of 5 ml of a carmine solution (food dye) was injected into the column over a period of approximately 10 s. Pictures were taken every second to monitor the movement of the tracer in the column.
Figure 3.3: Column set up for investigating the formation of bubbles.
During the experiment, the weight of the column decreased at constant rate as bubbles forming in the column displaced water. Over 25 hours, the weight decreased by 30 g, an amount which corresponds to 7% of the initial water volume present in the column (Figure 3.4).
Time [h]
0 5 10 15 20 25
Cha
nge
in c
olum
n w
eigh
t [g]
-30
-25
-20
-15
-10
-5
0
Figure 3.4: Changes in filter column weight versus filter run time. The dashed line is a regression of R2=0.82.
24
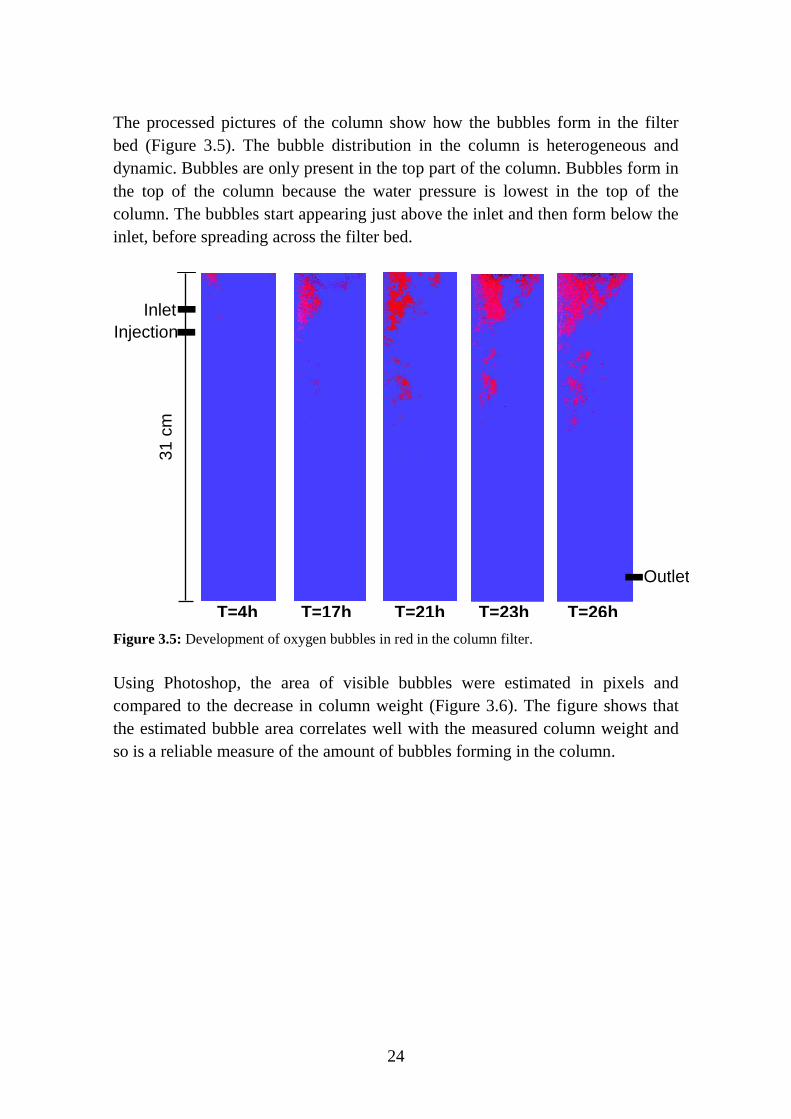
The processed pictures of the column show how the bubbles form in the filter bed (Figure 3.5). The bubble distribution in the column is heterogeneous and dynamic. Bubbles are only present in the top part of the column. Bubbles form in the top of the column because the water pressure is lowest in the top of the column. The bubbles start appearing just above the inlet and then form below the inlet, before spreading across the filter bed.
Figure 3.5: Development of oxygen bubbles in red in the column filter.
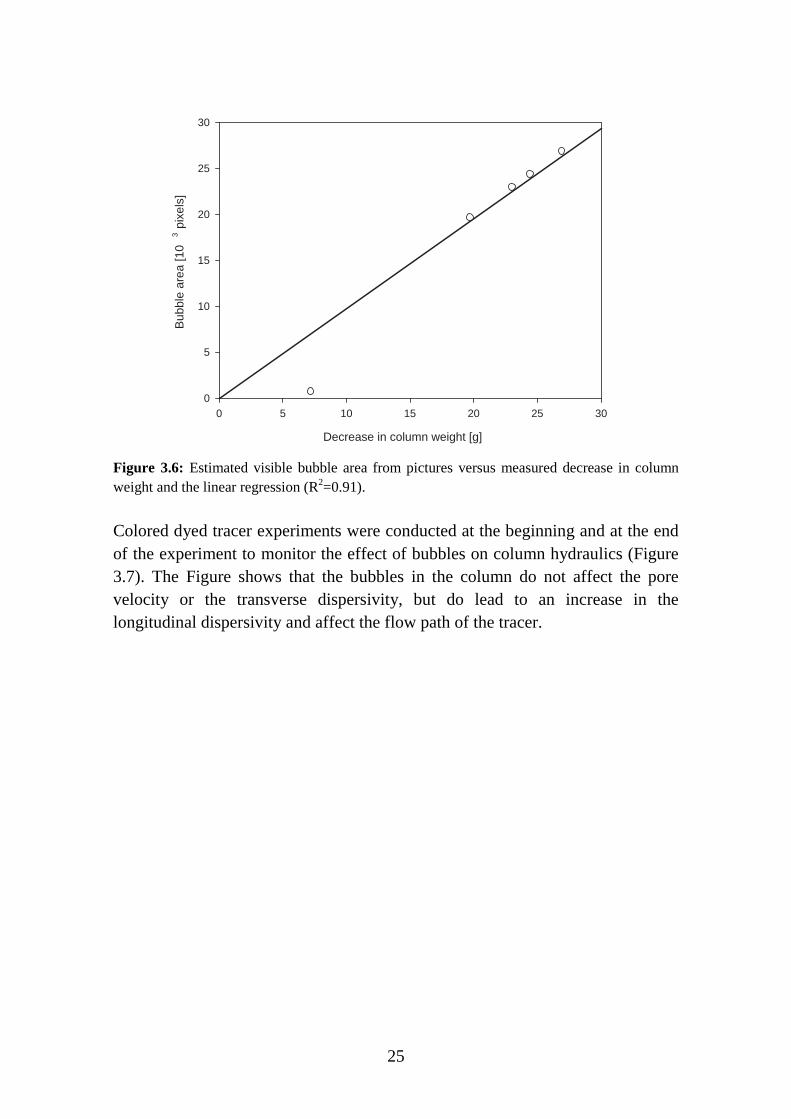
Using Photoshop, the area of visible bubbles were estimated in pixels and compared to the decrease in column weight (Figure 3.6). The figure shows that the estimated bubble area correlates well with the measured column weight and so is a reliable measure of the amount of bubbles forming in the column.
Inlet Injection
31 c
m
T=4h T=17h T=21h T=23h T=26h
Outlet
25
Decrease in column weight [g]
0 5 10 15 20 25 30
Bub
ble
area
[10
3 p
ixel
s]
0
5
10
15
20
25
30
Figure 3.6: Estimated visible bubble area from pictures versus measured decrease in column weight and the linear regression (R2=0.91).
Colored dyed tracer experiments were conducted at the beginning and at the end of the experiment to monitor the effect of bubbles on column hydraulics (Figure 3.7). The Figure shows that the bubbles in the column do not affect the pore velocity or the transverse dispersivity, but do lead to an increase in the longitudinal dispersivity and affect the flow path of the tracer.

26
Figure 3.7: Tracer plume in a clean column (a) and in a column filled with bubbles (b).
The experiment showed that bubbles formed in the column with a gas supersaturation of 1.1 atm in the inlet water. The distribution of the bubbles was heterogeneous and dynamic and was influenced by the inlet design. The hydraulics of the column was influenced by the bubble distribution. On the basis
T=0s T=100s T=230s T=300s T=440s
31 c
m
Outlet
Inlet
Outlet
T=0s T=100s T=230s T=300s T=440s
Injection
Injection
31 c
m
a
b
27
of the experiments it can be concluded that bubbles are a cause of heterogeneity and problems in filters.
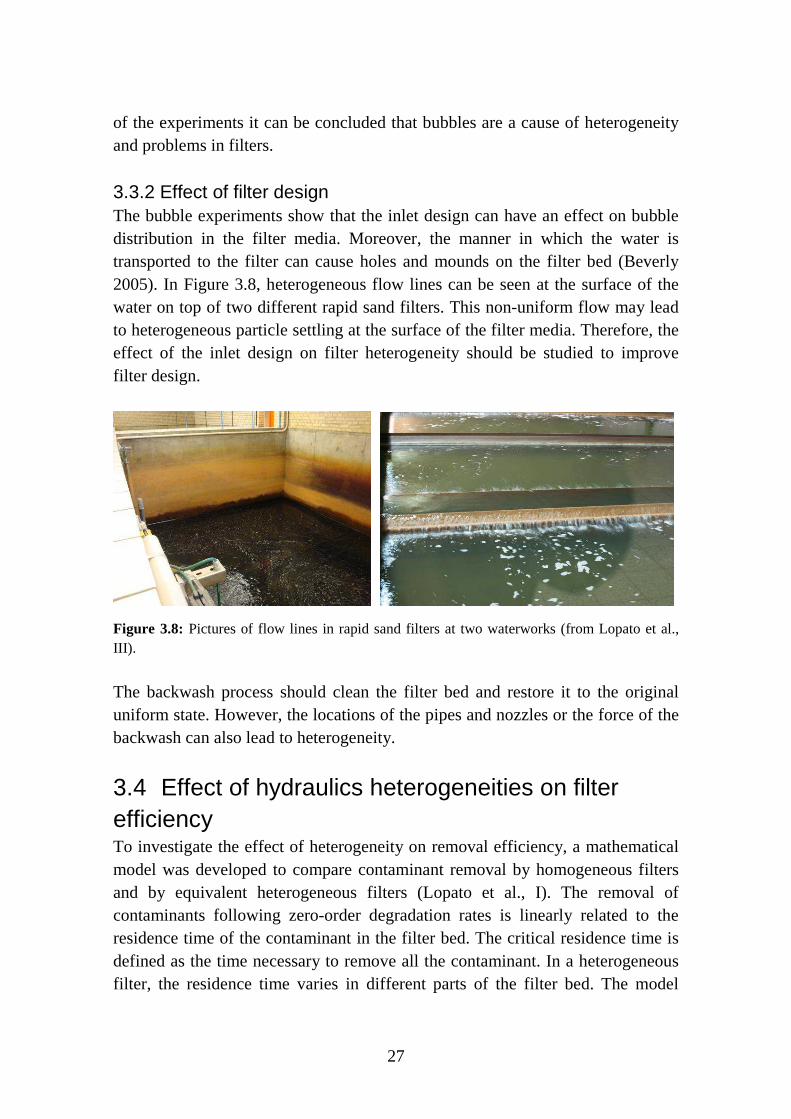
3.3.2 Effect of filter design The bubble experiments show that the inlet design can have an effect on bubble distribution in the filter media. Moreover, the manner in which the water is transported to the filter can cause holes and mounds on the filter bed (Beverly 2005). In Figure 3.8, heterogeneous flow lines can be seen at the surface of the water on top of two different rapid sand filters. This non-uniform flow may lead to heterogeneous particle settling at the surface of the filter media. Therefore, the effect of the inlet design on filter heterogeneity should be studied to improve filter design.
Figure 3.8: Pictures of flow lines in rapid sand filters at two waterworks (from Lopato et al., III).
The backwash process should clean the filter bed and restore it to the original uniform state. However, the locations of the pipes and nozzles or the force of the backwash can also lead to heterogeneity.
3.4 Effect of hydraulics heterogeneities on filter efficiency To investigate the effect of heterogeneity on removal efficiency, a mathematical model was developed to compare contaminant removal by homogeneous filters and by equivalent heterogeneous filters (Lopato et al., I). The removal of contaminants following zero-order degradation rates is linearly related to the residence time of the contaminant in the filter bed. The critical residence time is defined as the time necessary to remove all the contaminant. In a heterogeneous filter, the residence time varies in different parts of the filter bed. The model

28
shows that the removal efficiency of a heterogeneous filter is lower than that of a homogeneous filter when the average residence time is close to the critical residence time of the contaminant because some parts of the filter have slow pathways and other parts have fast ones (Lopato et al., I). An example of the influence of heterogeneity on contaminant removal can be calculated using the observed flow rates obtained from the tracer experiments conducted in the second-stage filter. The filter is approximated as a series of nine parallel columns of the length of the filter bed with pore velocity and flow values obtained from the tracer experiments (Lopato et al., I). Because the model employs observed flow rates, the values are realistic and do not reflect extreme heterogeneity. Results are compared with a model where the filter is considered to be homogeneous with average properties calculated so that the total discharge is the same as that for the heterogeneous filter (Table 3.1). Contaminant removal was computed for ammonium, assimilable organic carbon (AOC), methyl tert-butyl ether (MTBE) and methylchlorophenoxypropionic acid (MCPP) (Lopato et al. 2009). The degradation rate constants were taken from the literature and the input concentrations are similar to typical concentrations observed in groundwater. Table 3.1: Effect of heterogeneity on removal efficiency for different contaminants.
Homogeneous filter Heterogeneous filter
Zero-order
rate Inlet Outlet Removal Outlet Removal
Ammonium 9 mg/l/h * 1.45 mg/l 0.01 mg/l 99.5 % 0.11 mg/l 92.5 %
MTBE 360 µg/l/h ** 60 µg/l 2 µg/l 97.5 % 8 µg/l 86.6 %
AOC 520 µg/l/h *** 91 µg/l 7 µg/l 92.8 % 14 µg/l 84.6 %
MCPP 59 ng/l/h **** 10 ng/l 0.4 ng/l 95.8 % 1.4 ng/l 85.9 %
*(Lopato et al., I), **(Nielsen et al. 2002), ***(Palinski et al. 1999). 1999), ****(Ferguson et al. 2009).
The example model calculation shows that heterogeneity of rapid sand filters influences the produced water quality in drinking water plant operation. For ammonium and MTBE, if the filter is heterogeneous, the outlet water quality does not comply with Danish drinking water guidelines (0.05 mg/l for ammonium and 5 µg/l for MTBE). In contrast, if the filter is incorrectly considered to be homogeneous, then calculations would show that guidelines are met. There is no guideline for AOC, but as a rule of thumb the concentration at the filter outlet should be under 10 µg/l. MCCP is usually not present in concentrations above the guideline (1µg/l) in groundwater but it is interesting to
29
notice that the concentration at the outlet of the heterogeneous filter is more than twice that of the homogeneous filter. The effect of moderate filter heterogeneity on the removal efficiency of compounds following a zeroth order degradation rate is therefore important and has a significant impact on outlet water quality. The heterogeneity in rapid sand filters used for drinking water has practical implications for filter plant operation.

30
31
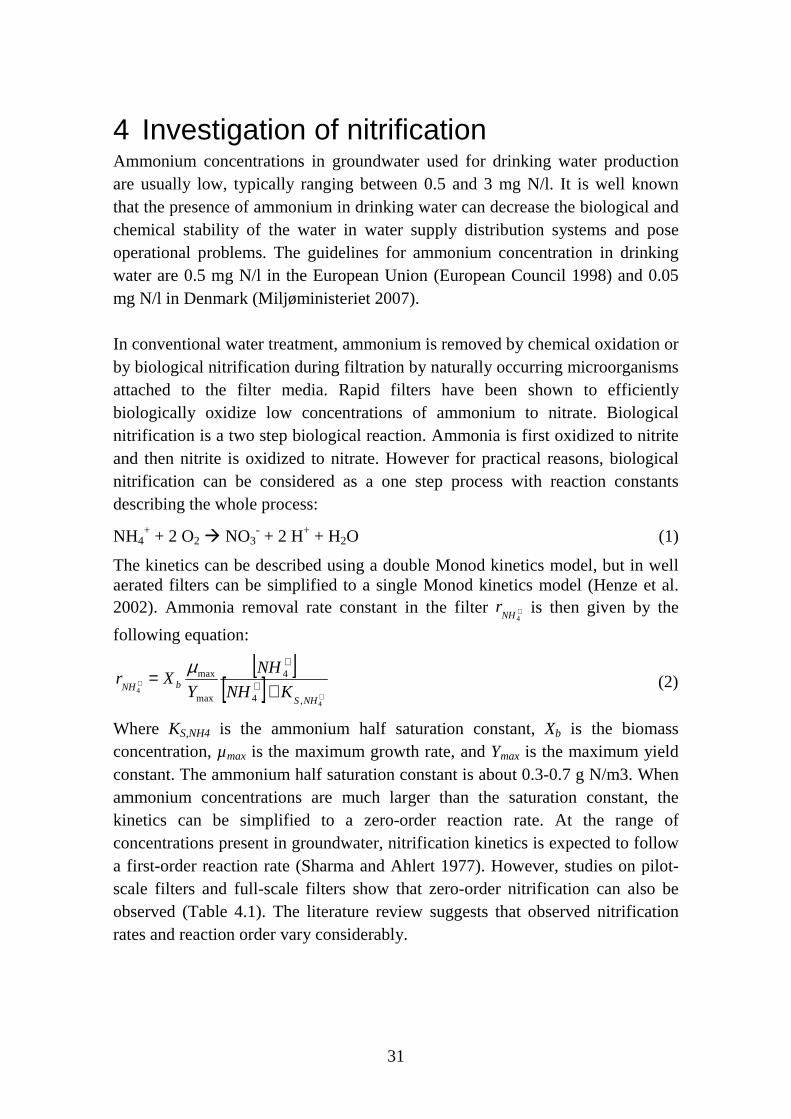
4 Investigation of nitrification Ammonium concentrations in groundwater used for drinking water production are usually low, typically ranging between 0.5 and 3 mg N/l. It is well known that the presence of ammonium in drinking water can decrease the biological and chemical stability of the water in water supply distribution systems and pose operational problems. The guidelines for ammonium concentration in drinking water are 0.5 mg N/l in the European Union (European Council 1998) and 0.05 mg N/l in Denmark (Miljøministeriet 2007). In conventional water treatment, ammonium is removed by chemical oxidation or by biological nitrification during filtration by naturally occurring microorganisms attached to the filter media. Rapid filters have been shown to efficiently biologically oxidize low concentrations of ammonium to nitrate. Biological nitrification is a two step biological reaction. Ammonia is first oxidized to nitrite and then nitrite is oxidized to nitrate. However for practical reasons, biological nitrification can be considered as a one step process with reaction constants describing the whole process:
NH4+ + 2 O2 � NO3
- + 2 H+ + H2O (1)
The kinetics can be described using a double Monod kinetics model, but in well aerated filters can be simplified to a single Monod kinetics model (Henze et al. 2002). Ammonia removal rate constant in the filter +
4NHr is then given by the
following equation:
[ ][ ] +
++
= +
+
4
4
,4
4
max
max
NHS
bNH KNH
NH
YXr
µ (2)
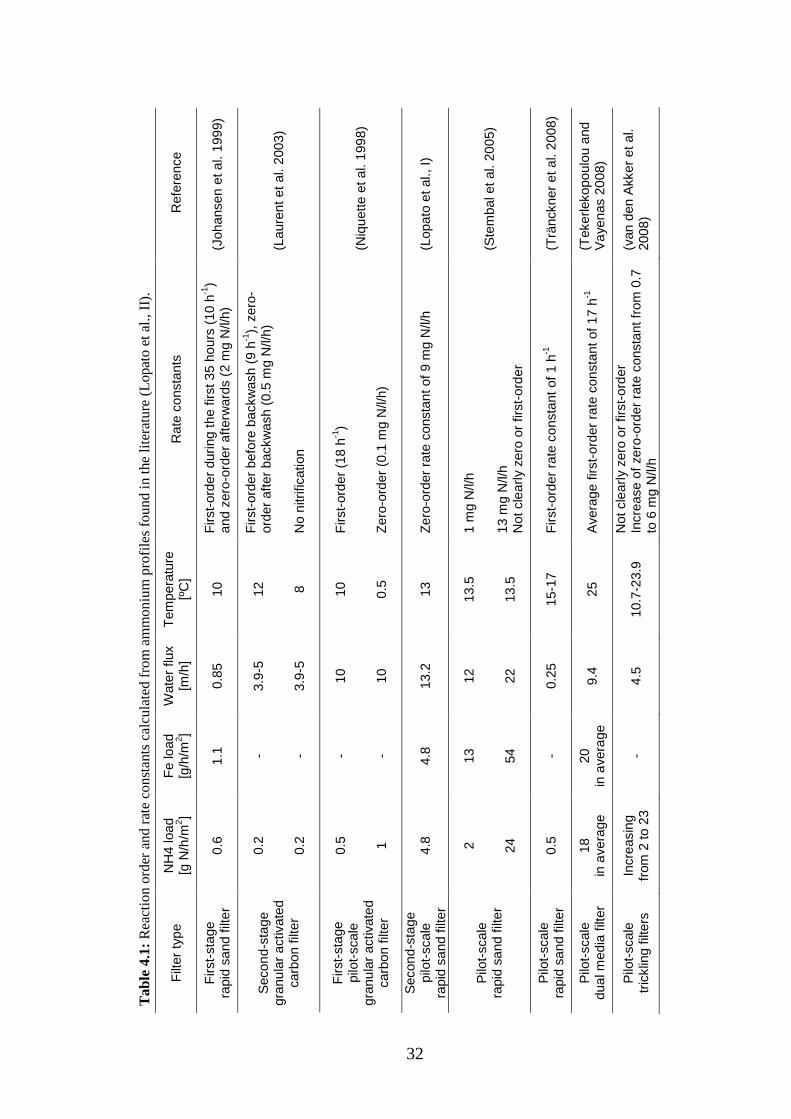
Where KS,NH4 is the ammonium half saturation constant, Xb is the biomass concentration, µmax is the maximum growth rate, and Ymax is the maximum yield constant. The ammonium half saturation constant is about 0.3-0.7 g N/m3. When ammonium concentrations are much larger than the saturation constant, the kinetics can be simplified to a zero-order reaction rate. At the range of concentrations present in groundwater, nitrification kinetics is expected to follow a first-order reaction rate (Sharma and Ahlert 1977). However, studies on pilot-scale filters and full-scale filters show that zero-order nitrification can also be observed (Table 4.1). The literature review suggests that observed nitrification rates and reaction order vary considerably.
32
Tab
le 4
.1:
Rea
ctio
n or
der
and
rate
con
stan
ts c
alcu
late
d fr
om a
mm
oniu
m p
rofil
es fo
und
in t
he li
tera
ture
(Lo
pato
et
al.,
II).
Filt
er ty
pe
NH
4 lo
ad
[g N
/h/m
2 ] F
e lo
ad
[g/h
/m2 ]
Wat
er fl
ux
[m/h
] T
empe
ratu
re
[ºC
] R
ate
cons
tant
s R
efer
ence
Firs
t-st
age
ra
pid
sand
filte
r 0.
6 1.
1 0.
85
10
Firs
t-or
der
durin
g th
e fir
st 3
5 ho
urs
(10
h-1)
and
zero
-ord
er a
fterw
ards
(2
mg
N/l/
h)
(Joh
anse
n et
al.
1999
)
0.2
- 3.
9-5
12
Firs
t-or
der
befo
re b
ackw
ash
(9 h
-1),
zer
o-or
der
afte
r ba
ckw
ash
(0.5
mg
N/l/
h)
Sec
ond-
stag
e gr
anul
ar a
ctiv
ated
ca
rbon
filte
r 0.
2 -
3.9-
5 8
No
nitr
ifica
tion
(Lau
rent
et a
l. 20
03)
0.5
- 10
10
F
irst-
orde
r (1
8 h-1
) F
irst-
stag
e
pilo
t-sc
ale
gr
anul
ar a
ctiv
ated
ca
rbon
filte
r 1
- 10
0.
5 Z
ero-
orde
r (0
.1 m
g N
/l/h)
(Niq
uette
et a
l. 19
98)
Sec
ond-
stag
e pi
lot-
scal
e
rapi
d sa
nd fi
lter
4.8
4.8
13.2
13
Z
ero-
orde
r ra
te c
onst
ant o
f 9 m
g N
/l/h
(Lop
ato
et a
l., I)
2 13
12
13
.5
1 m
g N
/l/h
Pilo
t-sc
ale
ra
pid
sand
filte
r 24
54
22
13
.5
13 m
g N
/l/h
Not
cle
arly
zer
o or
firs
t-or
der
(Ste
mba
l et a
l. 20
05)
Pilo
t-sc
ale
ra
pid
sand
filte
r 0.
5 -
0.25
15
-17
Firs
t-or
der
rate
con
stan
t of 1
h-1
(T
ränc
kner
et a
l. 20
08)
Pilo
t-sc
ale
du
al m
edia
filte
r 18
in
ave
rage
20
in
ave
rage
9.
4 25
A
vera
ge fi
rst-
orde
r ra
te c
onst
ant o
f 17
h-1
(Tek
erle
kopo
ulou
and
V
aye
nas
2008
)
Pilo
t-sc
ale
tric
klin
g fil
ters
In
crea
sing
fr
om 2
to 2
3 -
4.5
10.7
-23.
9 N
ot c
lear
ly z
ero
or fi
rst-
orde
r In
crea
se o
f zer
o-or
der
rate
con
stan
t fro
m 0
.7
to 6
mg
N/l/
h
(van
den
Akk
er e
t al.
2008
)

33
The lack of consensus on the ammonium removal reaction rates and order suggest that the kinetics of nitrification in rapid filters have been insufficiently researched. Few nitrification experiments in columns simulating drinking water filters with low initial ammonium concentration have been published. The evolution of nitrification kinetics with filter run time as well as the effects of heterogeneities on nitrification needs to be investigated in a controlled environment. Moreover, the quantitative description of nitrification in a full-scale operating filter is important for filtration process understanding and for improving filter design and operation. It is necessary to investigate nitrification on full-scale filters under real conditions with varying inlet flow and concentrations because pilot-scale filters cannot represent the heterogeneity observed at full scale (Lopato et al., I).
4.1 Ammonium diagnostic tool Ammonium profiling is a common tool when studying nitrification but is rarely used in full-scale waterworks even though inadequate ammonium removal is often a problem in waterworks treating groundwater. The investigation of ammonium profiles is a scientific approach to the problem, and can reveal how nitrification evolves with filter run time and with space. Ammonium profiles can be conducted at different locations in the filter bed. Water samples are taken at different depths in the filter material by inserting a probe vertically and water is pumped out and the ammonium concentration in the samples is measured. Tracer experiments are performed at the same time and a few centimeters away from the sampling points. The estimated pore velocities are used to calculate the ammonium removal rate constants and to find the order of the reaction. By combining the ammonium profile tool and the salt tracer tool, nitrification kinetics can be quantitatively described at a specific time and location in the filter bed. The procedure requires sampling probes, a peristaltic pump, a conductivity meter, an ammonium field test, and access to the filter bed. In order to compare the measured pore velocities values with the filter discharge, flow meter measurements at the inlet or outlet of the filter are necessary. The procedure must be conducted while the filter is running.
34
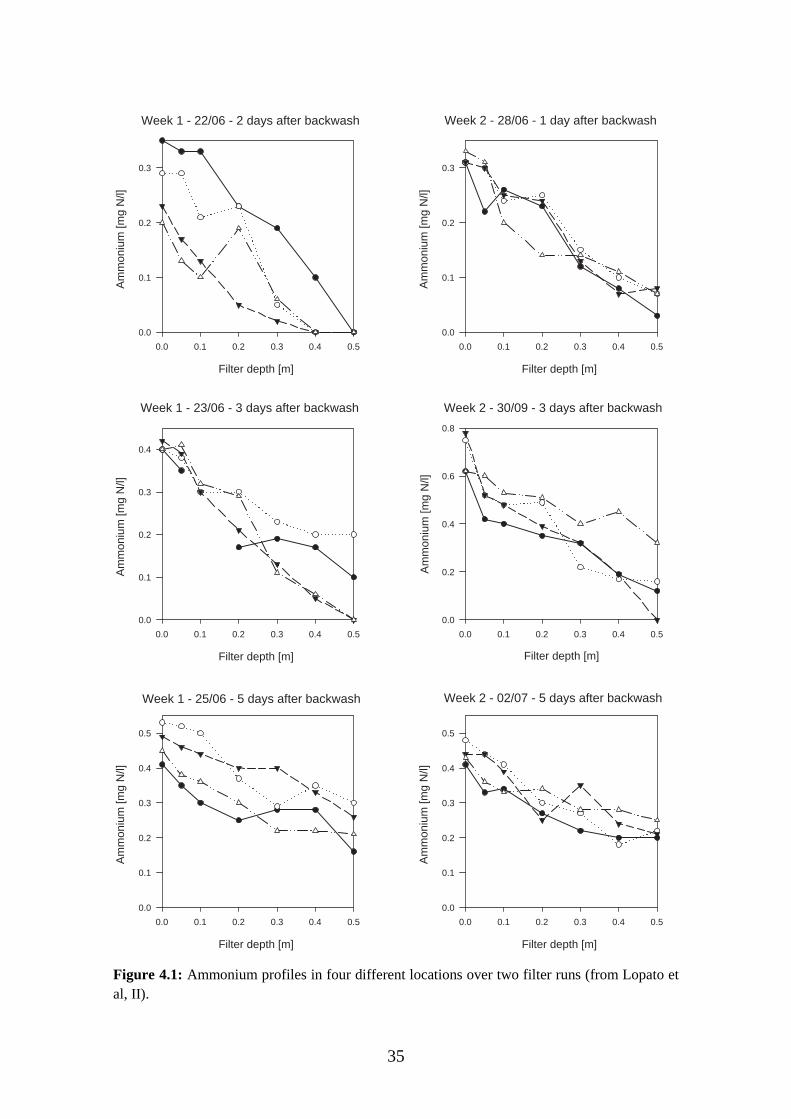
4.2 Nitrification in filters Experiments were conducted on a first-stage rapid sand filter at Sjælsø waterworks (Lopato et al., II). A first-stage filter was chosen because it had a higher inlet ammonium concentration so that it is easier to monitor nitrification in the filter bed. Ammonium profiles were measured at 4 different sampling points in the filter bed. The ammonium profiles were obtained at different locations in the filter bed and at different times in the filter run (Figure 4.1). The ammonium profiles and the breakthrough curves obtained varied both in time and with sampling location. Nitrification and hydraulic conditions in the studied filter were heterogeneous (Lopato et al., II). Results showed no clear evidence for whether nitrification followed a zero-order reaction or a first-order reaction. The removal rate constants estimated are high compared to the values found in the literature for an ammonium load of 1.5 g N/h/m2 (Table 4.1). However, comparison with other studies is difficult because of differences in experimental conditions (temperature, ammonium load, iron load, and water flux).
35
Filter depth [m]
0.0 0.1 0.2 0.3 0.4 0.5
Am
mon
ium
[mg
N/l]
0.0
0.1
0.2
0.3
Filter depth [m]
0.0 0.1 0.2 0.3 0.4 0.5
Am
mon
ium
[mg
N/l]
0.0
0.2
0.4
0.6
0.8
Filter depth [m]
0.0 0.1 0.2 0.3 0.4 0.5
Am
mon
ium
[mg
N/l]
0.0
0.1
0.2
0.3
0.4
0.5
Filter depth [m]
0.0 0.1 0.2 0.3 0.4 0.5
Am
mon
ium
[mg
N/l]
0.0
0.1
0.2
0.3
Filter depth [m]
0.0 0.1 0.2 0.3 0.4 0.5
Am
mon
ium
[mg
N/l]
0.0
0.1
0.2
0.3
0.4
Filter depth [m]
0.0 0.1 0.2 0.3 0.4 0.5
Am
mon
ium
[mg
N/l]
0.0
0.1
0.2
0.3
0.4
0.5
Week 1 - 23/06 - 3 days after backwash
Week 2 - 28/06 - 1 day after backwash
Week 2 - 30/09 - 3 days after backwash
Week 1 - 25/06 - 5 days after backwash Week 2 - 02/07 - 5 days after backwash
Week 1 - 22/06 - 2 days after backwash
Figure 4.1: Ammonium profiles in four different locations over two filter runs (from Lopato et al, II).
36
4.3 Factors influencing nitrification Due to ammonium concentrations below 0.8 mg N/l, nitrification in the rapid filters investigated should follow first-order kinetics (Sharma and Ahlert 1977) with a greater presence of biomass in the top part of the filter bed (Henze et al. 2002). However, the results from the investigated filters show that nitrification was not always first-order and that it was heterogeneous in time and space. It is therefore relevant to discuss the factors that can influence nitrification kinetics and nitrification heterogeneity in the filters.
4.3.1 Nitrification heterogeneity The temporal and spatial variations of the ammonium profiles observed in the full-scale filter are probably related to the filter pore structure. Indeed, the tracer breakthrough curves obtained in the filter showed that the filter media structure was heterogeneous. Most likely, the filter is heterogeneous because of non uniform formation of biofilm, precipitation of oxides, and accumulation of particles. The geometry of the inlet water conduit, the location of the backwash nozzles and the backwashing procedures may have caused this non uniformity and resulted in regions with different porosity and conductivity. It is believed that the way filters are operated (varying flow and inlet water composition) and designed (water conduit and backwash nozzles) allows the development of non uniform treatment efficiency in the filter. Filter operation has an impact on nitrification heterogeneity because it can affect the hydraulic heterogeneity. The heterogeneity of the ammonium profiles observed in the full-scale filter can be related to the variation in inlet parameters. The inlet flow and ammonium concentration were shown to vary rapidly (Figure 4.2). Sudden increases in flow rates have been shown to result in flushing of materials (Han et al. 2009, Kim and Lawler 2006), so they could modify the porous structure of the filter bed.

37
Time [days]
22-0
6
23-0
6
24-0
6
25-0
6
26-0
6
27-0
6
28-0
6
29-0
6
30-0
6
01-0
7
02-0
7
03-0
7
Flo
w [m
3/h
]
0
20
40
60
80
100
120
140
160
180
Time [days]
22-0
6
23-0
6
24-0
6
25-0
6
26-0
6
27-0
6
28-0
6
29-0
6
30-0
6
01-0
7
02-0
7
03-0
7
Am
mon
ium
[mg
N/l]
0.0
0.2
0.4
0.6
0.8
1.0
a
b
Figure 4.2: (a) Inlet flow to the filter and (b) measured inlet ammonium concentration to the filter (from Lopato et al, II).
The effect of backwash on nitrification has been investigated in rapid filters. Laurent et al. (2003) observed mixed results, while Niquette et al. (1998) observed improved nitrification efficiency in cold water sources after backwash. Such an effect was not observed in the experiments conducted during this project. Laurent et al. (2003) found the potential nitrifying activity of a full-scale second-stage granular activated carbon filter to be uniformly distributed along the depth of the filter. On the other hand, biomass stratification was observed in granular activated carbon filters used in surface water treatment (Servais et al. 1991), in a rapid sand filter treating groundwater (Madoni et al. 2001). Removal of ammonium was close to constant with depth in the filters studied here.
38
4.3.2 Nitrification kinetics Some of the ammonium profiles obtained in the full-scale first-stage rapid sand filter followed a zero-order reaction (Lopato et al., II). Moreover, nitrification in a pilot-scale filter simulating a first-stage rapid sand filter treating typical Danish groundwater (Lopato et al., I) was also zero-order. The zero-order nitrification observed in the pilot-scale filter was attributed to the decrease of pore-water velocity with depth in the column caused by the decreasing amount of gas bubbles with depth observed in the column (Lopato et al., I). The location of the gas bubbles in the column leads to an increase in porosity with depth and therefore a decrease in pore-water velocity. It was shown theoretically that if the pore-water velocity decreases linearly with depth, an intrinsic first-order reaction can be interpreted as a zero-order reaction (Lopato et al., I). So, nitrification could be observed as being zero-order while being intrinsically first-order as theoretically expected. The same behavior is expected to occur in full-scale rapid sand filters where the formation of gas bubbles takes place in the filter bed. It was also hypothesized that a zero-order rate was observed because of a decrease in removal efficiency in the top part of the filter. For example, the presence of flocs in the influent of a first-stage dual media filter was shown to reduce ammonium removal efficiency (Niquette et al. 1998). As flocs deposit on the top of the filter bed, they may affect biomass activity by decreasing the contact between water and the biomass attached to the filter media grains. A similar effect would be obtained for any type of clogging which decreases the porosity in the top layer of the filter bed. There are no flocs in the filters studied but the negative effect of iron on nitrification has been observed in pilot-scale trickling filters (Gouzinis et al. 1998) and in full-scale trickling filters (de Vet et al. 2009). According to de Vet et al. (2009), the accumulation of iron hydroxide deposits on the filter media grains are the probable cause for decreased ammonium removal efficiency in ageing filters. As iron oxides deposit at the top of the filter, nitrifying activity is displaced deeper into the filter bed and could change an intrinsic first-order reaction into an observed zero-order reaction. Ammonium removal rate constants have been analyzed statistically to determine the factors influencing the rate. Van den Akker et al. (2008) observed an increase in the nitrification rate constants with ammonium load in pilot-scale trickling filters, as ammonium is the limiting substrate. However, in the full-scale filter investigated in this work, the removal rate constants were independent of

39
ammonium loads, perhaps because the nitrifying biomass cannot adapt to the fast variation in load. The removal rate constants in this work were also independent of filter run time except for the second set of experiments which were fitted by a first-order removal rate constant (p=0.005). The statistical analysis of the full-scale data also showed that the local nitrification rate constants are dependent on pore velocity (Figure 4.3) showing that nitrification is limited by substrate transport in the diffusive boundary layer (Lopato et al, II). Similar results have been reported in the literature. Local mass transfer into a biofilm has been found to be dependent on the average flow velocity (Stoodley et al. 1997) and the thickness of the diffusive boundary layer has been shown to decrease exponentially with flow velocity (De Beer et al. 1996). A mass transfer limitation of nitrification during filtration was also observed in pilot-scale rapid sand filters by Stembal et al. (2005), who observed increasing amounts of ammonium being removed with increasing flow rates. This has the important consequence that the local ammonium removal efficiency is nearly independent of the local pore velocity for the type of sand filter studied (Lopato et al, II).
Local pore velocity [m/h]
0 5 10 15 20
Firs
t-or
der
rem
oval
rat
e co
nsta
nt [h
-1]
0
20
40
60
80
100
120
140
Figure 4.3: Estimated local first-order removal rate constants versus the local pore velocities estimated from the breakthrough curves. The line represents a power regression of equation y = 2.06 x1.06 with an R-square value of 0.88 (from Lopato et al, II).

40
41
5 Conclusions Rapid granular filters are not always operated under the best conditions and diagnostic tools are necessary to improve the operation and design of filters. There are currently 20 diagnostic tools available to investigate the physical state of the rapid granular filters and they can rapidly provide significant qualitative and quantitative information. These tools can be used to investigate problems or to optimize the filtration process. They can also be used by water companies as part of their implementation of the Water Safety Plans. Two new diagnostic tools were developed: a salt tracer tool and an ammonium profile tool. The salt tracer tool can be used to investigate the hydraulic conditions in full-scale filters by quantitatively estimating the local pore velocities at different locations in the filter bed. The ammonium profile tool was developed to quantitatively estimate the local reaction rate constants for nitrification in full-scale filters. Because these tools provide information at specific locations in the filters they can be employed to investigate filter heterogeneity. Investigation of local hydraulic conditions and nitrification kinetics in a full-scale filter was conducted for the first time, using these tools. Rapid granular filters cannot be considered homogeneous with regards to hydraulics or nitrification. Indeed, breakthrough curves obtained during the investigation of full-scale filters exhibited irregular shapes typical of double porosity media or fractured media. The pore velocities estimated from the breakthrough curves varied significantly in time and space in the filter bed. Similarly, the ammonium profiles obtained during the investigation of a first-stage filter were irregular and the nitrification rate constants varied in space and time. Another significant observation is that local nitrification rate constants in the full-scale first-stage filter studied are dependent on pore velocity. So nitrification is mass-transfer limited and dependent on the hydraulic conditions in the filter bed. Filter design and operation lead to the observed heterogeneity as they result in an uneven distribution of biofilm, bubbles, mud balls, and deposits in the filter bed. Laboratory experiments showed that bubble formation in the filter bed occurs even with low gas supersaturation in the inlet water and that it affects transport in the media.
42
A mathematical model emphasized the importance of filter heterogeneity by showing that it can jeopardize outlet water quality. Using pore-velocity values measured in a full-scale filter, a heterogeneous filter was modeled. The concentrations of ammonium, MTBE, AOC and MCPP were always greater in the outlet of the modeled heterogeneous filter than in the outlet of the equivalent homogeneous filter.

43
6 Perspectives Granular rapid filters are used by many water utilities, whether water supply is based on groundwater or surface water. Filtration is sometimes considered to be simple with the design and control of filters still based on empirical observation, rules of thumb, simple guidelines, or past experience. However recurring filter problems and failure to meet water quality guidelines has led many water utilities to realize that they have too little knowledge about the optimal design and operation of their filter systems. This PhD project addresses this problem and contributes to the understanding and optimization of the granular media filtration process by developing diagnostic tools to analyze the physical state of rapid filters.
6.1 Significance of the work The review of diagnostic tools conducted during this project described the state of knowledge in this field. It uncovered a list of 20 available tools that are able to rapidly provide qualitative and quantitative information on the physical state of filters. The review identified knowledge gaps in the use of diagnostic tools. For example, few guideline values and design criteria are available in the literature to compare against the information obtained from the tools. There is little scientific research on the relation between the information provided by the tools and the cause of filter problems. Moreover, more tools are required to further improve filter investigation. These identified gaps are discussed in more detail in the last section of this chapter. This PhD project contributed to enhance the state of the technology by developing two diagnostic tools improving the possibility of filter investigation. The salt tracer tool was developed in this work to investigate filter hydraulics and the ammonium profile tool to investigate nitrification. They are the only tools available so far to be able to investigate local filter hydraulics and local nitrification kinetics quantitatively and get an overview of filter heterogeneity. In this work, the reasons for the observed heterogeneity and nitrification kinetics were discussed, paving the way for further research on the correct approach to filter design and operation.
6.2 Limitations The salt tracer tool and the ammonium profile tool developed during this project can be used without disturbing the filtration process. However they require good
44
access to the filter bed and some modeling to interpret the data obtained. They are not easy of use and can be difficult to implement as part of routine filter investigations. In their current form, they should be viewed as research tools. Further development and new tools are needed before investigation of filter heterogeneity can become part of the day to day operation of water supply plants. During the full-scale experiments, there was no control over the inlet conditions. The inlet flow and inlet water composition changed constantly making difficult a comparison of the results with time. It was for example not possible to determine if heterogeneity increased with filter run time in the filter bed. Moreover, nitrification was only investigated in one full-scale filter, so the results cannot be generalized.
6.3 Recommendations During the review, the total dissolved gas probe, which is not currently part of the diagnostic tools presented in specialized filter books, was identified as a relevant tool. It is a simple to use, it is commercially available, and it has been proven to be able to investigate air supersaturation problems at waterworks (Edwards and Scardina 2007). Furthermore, research has been conducted on the levels of air supersaturation which cause problem to filter efficiency (Scardina and Edwards 2002). Therefore, it is recommended to be part of the usual filter toolbox. In general, the diagnostic tools reviewed should be used in routine evaluation and in troubleshooting of filters. They can be used to further investigate problems observed and optimize the filter. The diagnostic tools can also be useful when implementing a Water Safety Plan at a waterworks as recommended by WHO where they can help provide early warnings of deteriorating filter performance (Table 2.2).
6.4 Further research The influence of heterogeneity on filter efficiency was demonstrated by mathematical modeling (Lopato et al. I), but the consequences of heterogeneity on filter performance needs to be investigated experimentally at full-scale. It is also necessary to investigate how heterogeneity develops in the filter bed. Filter operation and design have been pointed out as the leading factors in heterogeneity development. Further research should investigate the effects of backwash, filter run time, changes in flow rate or inlet water quality, inlet design,
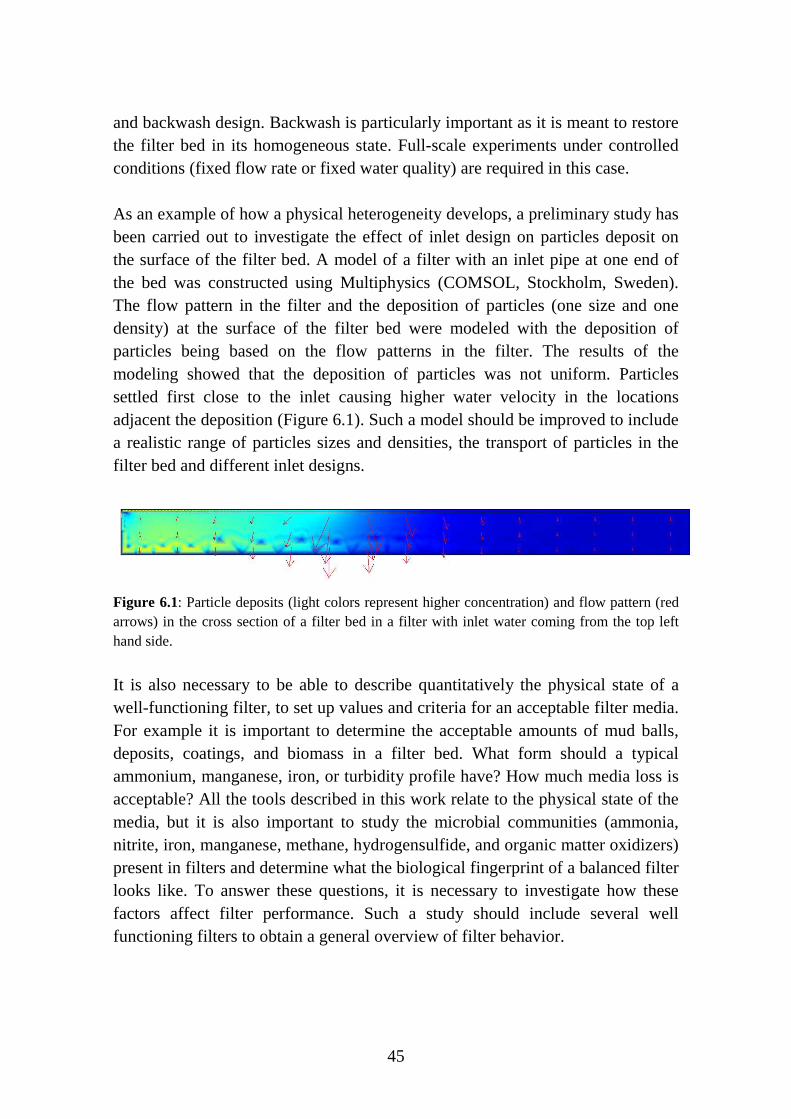
45
and backwash design. Backwash is particularly important as it is meant to restore the filter bed in its homogeneous state. Full-scale experiments under controlled conditions (fixed flow rate or fixed water quality) are required in this case. As an example of how a physical heterogeneity develops, a preliminary study has been carried out to investigate the effect of inlet design on particles deposit on the surface of the filter bed. A model of a filter with an inlet pipe at one end of the bed was constructed using Multiphysics (COMSOL, Stockholm, Sweden). The flow pattern in the filter and the deposition of particles (one size and one density) at the surface of the filter bed were modeled with the deposition of particles being based on the flow patterns in the filter. The results of the modeling showed that the deposition of particles was not uniform. Particles settled first close to the inlet causing higher water velocity in the locations adjacent the deposition (Figure 6.1). Such a model should be improved to include a realistic range of particles sizes and densities, the transport of particles in the filter bed and different inlet designs.
Figure 6.1: Particle deposits (light colors represent higher concentration) and flow pattern (red arrows) in the cross section of a filter bed in a filter with inlet water coming from the top left hand side.
It is also necessary to be able to describe quantitatively the physical state of a well-functioning filter, to set up values and criteria for an acceptable filter media. For example it is important to determine the acceptable amounts of mud balls, deposits, coatings, and biomass in a filter bed. What form should a typical ammonium, manganese, iron, or turbidity profile have? How much media loss is acceptable? All the tools described in this work relate to the physical state of the media, but it is also important to study the microbial communities (ammonia, nitrite, iron, manganese, methane, hydrogensulfide, and organic matter oxidizers) present in filters and determine what the biological fingerprint of a balanced filter looks like. To answer these questions, it is necessary to investigate how these factors affect filter performance. Such a study should include several well functioning filters to obtain a general overview of filter behavior.

46
To establish a Water Safety Plan at a waterworks, control measures, appropriate means of monitoring and critical limits are needed for each water production step (Davison et al. 2005). Diagnostic tools can be used as monitoring methods if threshold values or critical limits are defined. Moreover, standard methods for use of the diagnostic tools, as done by van Staden and Haarhoff (2004) for turbidity measurements in the filter bed, should be developed so they can be used in a reproducible manner. Furthermore, additional tools are necessary to provide a better insight and easier evaluation of filters. The sulfite tracer diagnostic tool described in Lopato et al. (III) should be further developed to be able to estimate the volume of air in the filter bed. Preliminary studies were conducted in a laboratory column filled with 1 mm diameter glass beads and with different volumetric air content (Lopato et al. 2010). A sulfite sodium solution was pumped in the column continuously. Sodium sulfite is a salt and an oxygen scavenger and so conductivity and dissolved oxygen were measured in the effluent. Air bubbles were injected in a heterogeneous manner into a column. In such a column, the front of the oxygen curve was delayed compared to a column where no bubbles were present (Figure 6.2). Because the aqueous concentration of oxygen is directly related to the amount of bubbles in the filter, the time difference between the measured curves can be related to the amount of oxygen gas in the column. In this case, it was possible to estimate the correct amount of bubbles present in the column from the tracer curves. Unfortunately, these results could not be reproduced when the bubbles were distributed homogeneously. A possible explanation is that the small bubbles were not reached by the sulfite solution or that heterogeneity influences the dissolved oxygen curves and distorts the results. More laboratory experiments need to be conducted to valid sulfite tracer as a reliable method for monitoring bubbles in heterogeneous porous media. Different volumes of air, different bubble sizes and different bubble distributions should be investigated. This method should then be tried at full-scale in a similar fashion to the salt tracer.

47
Figure 6.2: Dissolved oxygen and conductivity curves measured in the effluent of the laboratory column after injection of a sodium sulfite solution to investigate the volume of oxygen in the column. The continuous lines represent the curves measured at the outlet of the column free of bubbles and the dashed lines the curves measured at the outlet of the column filled with bubbles. The circles represent the dissolved oxygen values and the triangles the salt concentration values.
The best possible diagnostic tool should provide a precise three-dimensional picture of the filter bed showing mud balls, sand stones, biomass, air bubbles and grain size distribution in the filter media without disturbing the filtration process. Ground penetrating radar sounds promising as it is used to investigate the subsurface structure (Davis and Annan 1989). Otherwise, hand penetrometers could be used to identify zones of higher resistance in the filter bed (mud balls, sand stones) without removing media samples. Time-domain reflectometry probes and sulfite tracers could investigate bubble formation in the media.

48
49
References American Water Works Association (2003) Water treatment - Principles and practices of water supply operations series, American Water Works Association, Denver, CO. Beverly, R.P. (2005) Filter Troubleshooting and Design Handbook, American Waterworks Association, Denver, CO. Bouchier, I. (1998) Cryptosporidium in water supplies: third report of the Group of Experts, HMSO. Cleasby, J.L. (1990) Water quality and treatment: A handbook of community water supplies. American Water Works Association (ed), McGraw-Hill Inc., New York. Close, M., Bright, J., Wang, F.L., Pang, L.P. and Manning, M. (2008) Key Features of Artificial Aquifers for Use in Modeling Contaminant Transport. Ground Water 46(6), 814-828. Coad, M.A. and Ives, K.J. (1981) Investigation of deep bed filters using tracers. Filtration Society (ed), pp. 131-136, London. Corfitzen, C.B. and Albrechtsen, H. (2010) Online measurement of drinking water quality (in Danish), By- og Landskabsstyrelsen, Miljøministeriet. Crittenden, J.C., Trussel, R.R., Hand, D.W., Howe, K.J. and Tchobanoglous, G. (2005) Water treatment principles and design, John Wiley, Hoboken, N.J. Daly, E.R., Roy, S.J., Blaney, D.D., Manning, J.S., Hill, V.R., Xiao, L. and Stull, J.W. Outbreak of giardiasis associated with a community drinking-water source. Epidemiology and Infection 138(4), 491-500. Davis, J.L. and Annan, A.P. (1989) Ground-Penetrating Radar for High-Resolution Mapping of Soil and Rock Stratigraphy. Geophysical Prospecting 37(5), 531-551. Davison, A., Howard, G., Stevens, M., Callan, P., Fewtrell, L., Deere, D. and Bartram, J. (2005) Water safety plans: Managing drinking-water quality from catchment to consumer, World Health Organization, Geneva. De Beer, D., Stoodley, P. and Lewandowski, Z. (1996) Liquid flow and mass transport in heterogeneous biofilms. Water Research 30(11), 2761-2765. De Vet, W., Rietveld, L.C. and van Loosdrecht, M.C.M. (2009) Influence of iron on nitrification in full-scale drinking water trickling filters. Journal of Water Supply Research and Technology-Aqua 58(4), 247-256. Edwards, M. and Scardina, P. (2007) Addressing problems with gas supersaturation at drinking water utilities. Journal American Water Works Association 99(5), 137-147. European Council (1998) Council Directive 98/83/EC of 3 November 1998 on the quality of water intended for human consumption.
50
Ferguson, C., Corfitzen, C.B., Albrechtsen, H. and Arvin, E. (2009) Investigation on pesticide removal at Kerteminde waterworks with focus on process optimization, Department of Environmental Engineering, Technical University of Denmark, County of Funen. Gouzinis, A., Kosmidis, N., Vayenas, D.V. and Lyberatos, G. (1998) Removal of Mn and simultaneous removal of NH3, Fe and Mn from potable water using a trickling filter. Water Research 32(8), 2442-2450. Han, S.J., Fitzpatrick, C.S.B. and Wetherill, A. (2009) The impact of flow surges on rapid gravity filtration. Water Research 43(5), 1171-1178. Henze, M., Harremoes, P., la Cour Jansen, J. and Arvin, E. (2002) Wastewater Treatment: Biological and Chemical Processes, Springer, Berlin. Johansen, G.E., Rasmussen, T., Arvin, E. and Albrechtsen, H. (1999) Prøvetagningssonde til vandværksfiltre. Vandteknik 67, 522 - 525. Karanis, P., Kourenti, C. and Smith, H. (2007) Waterborne transmission of protozoan parasites: A worldwide review of outbreaks and lessons learnt. Journal of Water and Health 5(1), 1-38. Kawamura, S. (1991) Integrated design of water treatment facilities, Wiley, New York. Kim, J.K. and Lawler, D.F. (2006) Particle detachment during hydraulic shock loads in granular media filtration. Water Science and Technology 53(7), 177-184. Korich, D.G., Mead, J.R., Madore, M.S., Sinclair, N.A. and Sterling, C.R. (1990) Effects of Ozone, Chlorine Dioxide, Chlorine, and Monochloramine on Cryptosporidium-Parvum Oocyst Viability. Applied and Environmental Microbiology 56(5), 1423-1428. Laurent, P., Kihn, A., Andersson, A. and Servais, P. (2003) Impact of backwashing on nitrification in the biological activated carbon filters used in drinking water treatment. Environmental Technology 24(3), 277-287. Lawler, D.F. and Nason, J.A. (2006) Granular media filtration: old process, new thoughts. Water Science and Technology 53(7), 1-7. LeChevallier, M.W. and Au, K.K. (2004) Water treatment and pathogen control., IWA publishing (WHO), London, UK. Leij, F.J., Skaggs, T.H. and van Genuchten, M.T. (1991) Analytical Solutions for Solute Transport in 3-Dimensional Semi-Infinite Porous-Media. Water Resources Research 27(10), 2719-2733. Logsdon, G.S. (2008) Water filtration practices: including slow sand filters and precoat filtration, American Water Works Association, Denver, CO. Logsdon, G.S., Hess, A.F., Chipps, M.J. and Rachwal, A.J. (2002) Filter Maintenance and Operations Guidance Manual, American Water Works Association, Denver, CO. Lopato, L., Galaj, Z., Binning, P.J. and Arvin, E. (2009) Influence of inhomogeneities on rapid sand filter efficiency, IWA, Kobe, Japan.
51
Lopato, L., Röttgers, N., Binning, P.J. and Arvin, E. (2010) Monitoring of gas bubbles in rapid sand filters, pp. 154-158, DANVA, Copenhagen, DK. Lunati, I., Kinzelbach, W. and Sorensen, I. (2003) Effects of pore volume-transmissivity correlation on transport phenomena. Journal of Contaminant Hydrology 67(1-4), 195-217. Madoni, P., Davoli, D., Fontani, N., Cucchi, A. and Rossi, F. (2001) Spatial distribution of microorganisms and measurements of oxygen uptake rate and ammonia uptake rate activity in a drinking water biofilter. Environmental Technology 22(4), 455-462. Mayhugh, J.R., Smith, J.A., Elder, D.B. and Logsdon, G.S. (1996) Filter media rehabilitation at a lime-softening plant. Journal American Water Works Association 88(8), 64-69. Medema, G., Teunis, P., Blokker, M., Deere, D., Davison, A., Charles, P. and Loret, J.F. (2009) Risk Assessment of Cryptosporidium in Drinking Water, World Health Organization. Miljøministeriet (2007) Departmental order on water quality and supervsion of waterworks (in Danish), BEK nr 1449 af 11/12/2007. Nielsen, L.K., Tully, A.G., Albrechtsen, H.-J., Mosbæk, H. and Arvin, E. (2002) Removal of MTBE in Danish waterworks (In Danish), Miljøstyrelsen (Danish EPA). No. 17. Niquette, P., Prevost, M., Maclean, R.G., Thibault, D., Coallier, J., Desjardins, R. and Lafrance, P. (1998) Backwashing first-stage sand - BAC filters. Journal American Water Works Association 90(1), 86-97. Nix, D.K. and Taylor, J.S. (2003) Filter Evaluation Procedures for Granular Media, American Waterworks Association, Denver, CO. Palinski, A., Ulh, W. and Gimbel, R. (1999) Modelling of AOC removal in filters. Vom Wasser 93, 195-214. Pendse, H., Tien, C., Rajagopalan, R. and Turian, R.M. (1978) Dispersion Measurement in Clogged Filter Beds - Diagnostic Study on Morphology of Particle Deposits. AICHE Journal, 24(3), 473-485. Riemer, M., Kristensen, G.H. and Harremoes, P. (1980) Residence Time Distribution in Submerged Biofilters. Water Research 14(8), 949-958. Rodier, E., Dodds, J.A., Leclerc, D. and Clement, G. (1997) Changes in fluid residence time distribution during deep-bed filtration. Chemical Engineering Journal 68(2-3), 131-138. Scardina, P. and Edwards, M. (2002) Practical implications of bubble formation in conventional treatment. Journal American Water Works Association 94(8), 85-94. Seifert, D. and Engesgaard, P. (2007) Use of tracer tests to investigate changes in flow and transport properties due to bioclogging of porous media. Journal of Contaminant Hydrology 93(1-4), 58-71. Servais, P., Billen, G., Ventresque, C. and Bablon, G.P. (1991) Microbial Activity in GAC Filters at the Choisy-Le-Roi Treatment-Plant. Journal American Water Works Association 83(2), 62-68.

52
Sharma, B. and Ahlert, R.C. (1977) Nitrification and Nitrogen Removal. Water Research 11(10), 897-925. Slater, L., Binley, A., Versteeg, R., Cassiani, G., Birken, R. and Sandberg, S. (2002) A 3D ERT study of solute transport in a large experimental tank. Journal of Applied Geophysics 49(4), 211-229. Stembal, T., Markic, M., Ribicic, N., Briski, F. and Sipos, L. (2005) Removal of ammonia, iron and manganese from groundwaters of northern Croatia - pilot plant studies. Process Biochemistry 40(1), 327-335. Stevens, D.K., Berthouex, P.M. and Chapman, T.W. (1986) The Effect of Tracer Diffusion in Biofilm on Residence Time Distributions. Water Research 20(3), 369-375. Stoodley, P., Yang, S.N., LappinScott, H. and Lewandowski, Z. (1997) Relationship between mass transfer coefficient and liquid flow velocity in heterogenous biofilms using microelectrodes and confocal microscopy. Biotechnology and Bioengineering 56(6), 681-688. Sudicky, E.A. (1986) A Natural Gradient Experiment on Solute Transport in a Sand Aquifer - Spatial Variability of Hydraulic Conductivity and Its Role in the Dispersion Process. Water Resources Research 22(13), 2069-2082. Tekerlekopoulou, A.G. and Vayenas, D.V. (2008) Simultaneous biological removal of ammonia, iron and manganese from potable water using a trickling filter. Biochemical Engineering Journal 39(1), 215-220. Tränckner, J., Wricke, B. and Krebs, P. (2008) Estimating nitrifying biomass in drinking water filters for surface water treatment. Water Research 42(10-11), 2574-2584. US EPA (1998) National Primary Drinking Water Regulations: Interim Enhanced Surface Water Treatment, pp. 69477-69521. Van den Akker, B., Holmes, M., Cromar, N. and Fallowfield, H. (2008) Application of high rate nitrifying trickling filters for potable water treatment. Water Research 42(17), 4514-4524. Van Staden, S.J. and Haarhoff, J. (2004) A standard test for filter media cleanliness. Water Sa 30(1), 81-88.
53
Papers The following papers are included in the thesis:
I. Lopato, L., Galaj, Z., Delpont, S., Binning, P.J., and Arvin, E. (2011). Heterogeneity of rapid sand filters and its effect on contaminant transport and nitrification performance, J. Env. Eng. – ASCE 137(4), 248-257.
II. Lopato, L., Röttgers N., Binning, P.J., and Arvin, E. (2011).
Heterogeneous nitrification in a full-scale rapid sand filter, (submitted). III. Lopato, L., Binning, P.J., and Arvin, E. (2011). Review of diagnostic tools
to investigate the physical state of rapid sand filters, (submitted). The papers are not included in this www-version, but can be obtained from the Library at DTU Environment. Contact [email protected] or Department of Environmental Engineering, Technical University of Denmark, Miljoevej, Building 113, DK-2800 Kgs. Lyngby, Denmark.


Technical University of Denmark
DTU Environment
Department of Environmental Engineering
Miljoevej, building 113
DK-2800 Kgs. Lyngby
Denmark
Phone: +45 4525 1600
Fax: +45 4593 2850
e-mail: [email protected]
www.env.dtu.dk
The Department of Environmental Engineering (DTU Environment) conducts
science-based engineering research within four themes:
Water Resource Engineering, Urban Water Engineering,
Residual Resource Engineering and Environmental Chemistry & Microbiology.
Each theme hosts two to four research groups.
The department dates back to 1865, when Ludvig August Colding, the
founder of the , gave the first lecture on sanitary engineering as
response to the cholera epidemics in Copenhagen in the late 1800s.
department
ISBN 978-87-92654-40-3