Embed Size (px)
Citation preview

General rights Copyright and moral rights for the publications made accessible in the public portal are retained by the authors and/or other copyright owners and it is a condition of accessing publications that users recognise and abide by the legal requirements associated with these rights.
Users may download and print one copy of any publication from the public portal for the purpose of private study or research.
You may not further distribute the material or use it for any profit-making activity or commercial gain
You may freely distribute the URL identifying the publication in the public portal If you believe that this document breaches copyright please contact us providing details, and we will remove access to the work immediately and investigate your claim.
Downloaded from orbit.dtu.dk on: Jul 26, 2022
Reproducibility of surface roughness in reaming
Müller, Pavel; De Chiffre, Leonardo
Publication date:2011
Document VersionPublisher's PDF, also known as Version of record
Link back to DTU Orbit
Citation (APA):Müller, P., & De Chiffre, L. (2011). Reproducibility of surface roughness in reaming. DTU MechanicalEngineering.

Technical report
Reproducibility of surface roughnessin reaming
Pavel MüllerLeonardo De Chiffre
2011
Manufacturing EngineeringDepartment of Mechanical Engineering
Technical University of Denmark


Foreword
Part of the data obtained in this report come from experiments performed during a courseManufacturing Tribology - Modelling and Testing at Technical University of Denmark(DTU). This report is also a part of an on-going research on metal cutting activities atDTU.
The Authors wish to thank Ditte Bangsgaard Kjeldsen for performing micro hardnessand some of surface roughness measurements, Rene Sobiecki for making reference 2Dand 3D measurements and Lars Peter Holmbaeck for assistance with machining setup.
Kgs.Lyngby, 2011
Pavel Müller
i

Abstract
An investigation on the reproducibility of surface roughness in reaming was performedto document the applicability of this approach for testing cutting fluids. Austeniticstainless steel was used as a workpiece material and HSS reamers as cutting tools. Repro-ducibility of the results was evaluated with respect to different operators, workpieces andmeasured position in the reamed hole for different combinations of lubrication conditionand cutting speed. The measurands were the conventional surface roughness parameter,Ra and the ability of a cutting fluid to ensure a surface which is a replication of toolgeometry and path. 2D and 3D reference measurements were done to ensure traceabilityof the measurement. Moreover, surface profiles were examined under the 3D opticalmicroscope. Measuring uncertainty evaluation using statistical methods was applied.
Surfaces produced with a low cutting speed were generally reproducible when consider-ing different operators, workpieces and measured position in the hole, unlike the surfacesproduced with high cutting speed. These latter contain uneven, random surface profilesand vary considerably for different operators. However, it can be observed that a higherconcentration of the oil in water-based cutting fluid (or when using a straight mineral oil)results in surface profiles that are more reproducible at higher cutting speed. Moreover,it can be seen that three cutting fluids (two water-based cutting fluids with different oilconcentration and a straight mineral oil) used in connection with a low cutting speedresult in "identical" surface profiles.
Biggest uncertainty contributors were due to the process repeatability and repeatabilityaround the hole circumference. This was however only in the case of high cuttingspeeds and low degree of oil concentration. High reproducibility of different operators,especially when low cutting speed was applied, was achieved. From the surface profiles,an identification of individual feed marks from the tool is possible, tool replication beingmost clear from the 3D reference measurements.
ii

Aim of the work
The general aim of this work was to investigate reproducibility of surface roughness inreaming austenitic stainless steel with HSS reamers. Specific aims were:
1. quantify tool replication in reaming as a more precise way of addressing the effectof lubrication on surface roughness;
2. analyze the surface profiles from different operators, workpieces, measured posi-tion on the workpieces, cutting speeds and cutting fluids;
3. obtain high reproducibility as a step to accredited testing.
iii

Contents
1 Introduction 1
2 Cutting setup 32.1 Machine tool and tooling . . . . . . . . . . . . . . . . . . . . . . . . . . . . . 32.2 Workpiece and cutting fluid . . . . . . . . . . . . . . . . . . . . . . . . . . . 32.3 Measuring procedure . . . . . . . . . . . . . . . . . . . . . . . . . . . . . . . 5
2.3.1 Surface roughness . . . . . . . . . . . . . . . . . . . . . . . . . . . . 52.3.2 2D and 3D surface roughness reference measurements . . . . . . . 62.3.3 Surface topography under microscope . . . . . . . . . . . . . . . . . 82.3.4 Microhardness . . . . . . . . . . . . . . . . . . . . . . . . . . . . . . 9
2.4 Test procedure . . . . . . . . . . . . . . . . . . . . . . . . . . . . . . . . . . . 112.5 Test plan . . . . . . . . . . . . . . . . . . . . . . . . . . . . . . . . . . . . . . 12
3 Expression of uncertainty for roughness measurement 14
4 Results and discussion 164.1 Ra values . . . . . . . . . . . . . . . . . . . . . . . . . . . . . . . . . . . . . . 164.2 Replication . . . . . . . . . . . . . . . . . . . . . . . . . . . . . . . . . . . . . 184.3 2D and 3D reference measurements . . . . . . . . . . . . . . . . . . . . . . 234.4 Surface topography under microscope . . . . . . . . . . . . . . . . . . . . . 304.5 Frequency analysis . . . . . . . . . . . . . . . . . . . . . . . . . . . . . . . . 324.6 Microhardness . . . . . . . . . . . . . . . . . . . . . . . . . . . . . . . . . . . 33
5 Conclusion 34
References 35
A Surface roughness measurement - Tables 36
B Surface roughness measurement - Profiles 44
C 2D reference measurements 84
D 3D reference measurements 95
E Surface roughness profiles as feed marks from a cutting tool 101
F Measurements on the 3D optical microscope 112
iv

CONTENTS
G Frequency analysis 121
H Microhardness measurement 151
I Calibration certificate 155
J Surface roughness profiles in their original format 160
v

Chapter 1
Introduction
Reaming process is widely used cutting operation in industry. Reaming tests belong toprocesses which are used as laboratory tests for cutting fluids efficiency evaluation [1,2, 3, 4]. Among the most considerable performance criteria in reaming belong reamingtorque, reaming thurst, hole diameter oversize, hole geometry and surface roughness.
There are many independent influence parameters in reaming processes, such as ma-chine, cutting tool, workpiece, cutting conditions, cutting fluid and parameters connectedto the operator, his experience in performing cutting, choosing the correct measuringstrategy and final data processing and evaluation. Therefore, a complete control overthese influence quantities is necessary. One possibility of doing so is to calculate adispersion of data or variability of data or calculating the uncertainty budget. Thisresults in detailed description of all influence contributors and their impact on the overalluncertainty.
In reaming operation where a cutting tool with n edges is used, the surface is generatedas a spiral having n leads. Depending on the lubrication conditions, reamed surfacesare typically furrowed or more random [1]. One of the main aims of this work wasto investigate the ability of a cutting fluid to ensure a surface which is a replication ofthe reamer geometry and of the spiral path determined by the feed. Figure 1.1 showsa theoretical form of a surface generated by a reamer with six flutes used at a feedof six times the furrow width, w, per revolution. The profile produced by this tool isdetermined by the angle of entry of 45◦ and the relief angle, which is of the order of 1:100.
1

CHAPTER 1. INTRODUCTION
Figure 1.1: A theoretical surface profile as a replication of a reamer geometry [1].
2

Chapter 2
Cutting setup
2.1 Machine tool and tooling
All tests were carried out on a 3.7 kW radial drilling machine, Modig (see Figure 2.1(a)).Two high speed steel 6-flute machine reamers (see Figure 2.1(b)) with Ø10.2 mm wereused for the tests. Reamer specifications are listed in Table 2.1. Reamers were clamped ina floating holder SK30 x MK3 Gewefa. Run-out less than 5 µm was measured.
(a) 3.7 kW radial drilling ma-chine, Modig.
(b) 6-flute HSS machine reamer.
Figure 2.1: Machine tool and cutting tool.
2.2 Workpiece and cutting fluid
Specimens were austenitic steel AISI 316L, which is low-carbon grade, non-magneticstainless steel, see workpiece material specification in Table 2.2.
Such material is hard to machine due to its ductility, high strain hardening and lowthermal conductivity. Chips produced are long wiry chips, and the material can easilywork harden if not machined with correct feeds. The test workpieces were rings with a
3

CHAPTER 2. CUTTING SETUP
Table 2.1: Reamer specifications.Chucking reamer DIN 212 - F1352 TITEX
Material HSS-E (COBALT)Shank cylindrical, DIN 212No. of flutes 6Helix angle, γ 7◦ left handChamfer angle, κ 45◦
Dimensions [mm]l1 133l2 38d1 10.2d2 10.0h9Tolerance for H7 fit
Table 2.2: Workpiece material characteristics.Workpiece material AISI 316L Stainless steelVickers Hardness 258.1 HV20
Composition analysisElement Mass [%] Element Mass [%]
C 0.016 Cr 17.31Si 0.39 Mo 2.11
Mn 1.4 S 0.026P 0.027 N 0.052
Ni 11.21
pre-manufactured hole by drilling and grinding. Dimension, form and surface roughnessspecifications of workpieces can be seen in Figure 2.2. This was previously investigatedin [5]. Workpieces were clamped in a holder so that the workpieces were fully immersedin the cutting fluid (see Figure 2.3). Tool holder and workpiece were aligned using alever-type dial gauge.
Cutting fluids (CF) employed in this test are summarized in Table 2.3.
The concentration of the oil in water was measured by refractometer, see Figure 2.4.
4

CHAPTER 2. CUTTING SETUP
Figure 2.2: Workpiece dimensional characteris-tics.
Figure 2.3: Clamping of theworkpiece and application oflubrication.
Table 2.3: An overview of cutting fluids.Code Description Concentration (%)W1 Amine-free Water-based cooling lu-
bricant (Rhenus)1
W2 Amine-free Water-based cooling lu-bricant (Rhenus)
10
M Straight mineral oil 100N Additivated neat oil (TDN81) -
chlorine, vegetables fats and sul-phur
100
Figure 2.4: Refractometer.
2.3 Measuring procedure
2.3.1 Surface roughness
The surface topography of the reamed holes was characterized in terms of conventionalsurface roughness parameter Ra, defined in ISO 4287 [6]. As discussed in [1], the Raparameter is not appropriate to compare different machined surfaces; however, in thepresent investigation, where the focus is on process repeatability and tool replication, Rawas considered to be a convenient parameter. Measurements were carried out using a
5

CHAPTER 2. CUTTING SETUP
stylus roughness tester, Surtronic 4+ (Figure 2.5(a)), equipped with a skid pick-up anda 2 µm radius tip (Figure 2.5(b)) according to ISO 3274:1975 [7]. The resolution of theinstrument is 0.01 mm. The workpieces were cleaned from chips before the measurementusing an alcohol. Measuring profiles were recorded on the reamed specimens at 4different positions equally distributed around the hole circumference, at a distance 5.5mm from the top surface, see Figure 2.5(c). An evaluation length ln = 4 mm, low-passλs = 0 µm and high-pass λc = 0.8 µm profile filtering, according to ISO 3274:1996 [8], wereapplied. According to this ISO standard, λs should be set to 2.5 µm, but since the tipradius of the stylus is 2 µm, λs was set to zero, since this has a minimum effect on themeasurement result.
(a) Surtronic 4+, Taylor Hobson. (b) Skid pick-up and 2µmradius tip.
(c) Surface roughness measurement strategy.
Figure 2.5: Surface roughness measurement setup.
2.3.2 2D and 3D surface roughness reference measurements
Both 2D and 3D surface roughness measurements were performed using Form TalySurfSeries 2 (Figure 2.6(a))and RTH TalySurf 5-120 measuring instruments, both from Taylor
6

CHAPTER 2. CUTTING SETUP
Hobson, equipped with a skidless pick-up and a 2 µm radius tip according to ISO3274:1975 [7]. The measurement strategy for 2D and 3D measurements can be seen inFigure 2.6(c) and Figure 2.6(d). Profiles for 2D reference measurements were recordedstarting approximately 2mm from the top surface of the workpiece, with evaluationlength ln = 5.1 mm, low-pass λs = 0 µm and high-pass λc = 0.8 µm profile filtering,according to ISO 3274:1996 [8]. The second profile was taken starting approximately inthe middle of the first one, 0.5 mm apart in y direction. The third profile was recordedin the same way as the second with respect to the first one. Profiles for 3D referencemeasurements were recorded on a measuring area 1 x 0.4 mm with spacing in betweenmeasuring profiles 1 µm (→ 1000 samples) and 2 µm (→ 200 samples) respectively, in themiddle of the reamed specimens.
(a) Form TalySurf Series 2, Taylor Hobson. (b) Measurement position.
(c) 2D reference measurement strategy. (d) 3D reference measurement strategy.
Figure 2.6: Surface roughness reference measurements.
Specimens taken into consideration for reference measurements are listed in Table 2.4 andTable 2.5. It can be noticed that specimens measured by each of the reference instrumentsare from different operators (C and E) for cutting fluids W1, W2 and M and specimens forcutting fluid N are from the same operators (F and G). Here, for cutting fluid N, differentspecimens from the batch were used (P2 for measurements by Form TalySurf Series 2 andP3 for measurements by RTH TalySurf 5-1202).
7

CHAPTER 2. CUTTING SETUP
Table 2.4: Specimens for surface roughness reference measurement using Form TalySurfSeries 2.
WP indication Cutting conditions CodeCF Operator f [mm/rev] Reamer
P2 W1 C 0.3 1 P/W1P1 W2 C 0.3 1 P/W2P1 M C 0.3 1 P/MP2 N F 0.3 2 P0.3/NP2 N G 0.2 2 P0.2/NP stands for low cutting speed (vc = 4.5 m/min) and the number after Pindicates workpiece number.
Table 2.5: Specimens for surface roughness reference measurement using RTH TalySurf5-1202.
WP indication Cutting conditions CodeCF Operator f [mm/rev] Reamer
P3 W1 E 0.3 1 P/W1P1 W2 E 0.3 1 P/W2P3 M E 0.3 1 P/MP3 N F 0.3 2 P0.3/NP3 N G 0.2 2 P0.2/NP stands for low cutting speed (vc = 4.5 m/min) and the number after Pindicates workpiece number.
2.3.3 Surface topography under microscope
Specimens reamed under different cutting conditions were examined for surface to-pography under the optical microscope. The microscope is InfiniteFocus, Alicona (seeFigure 2.7), which is an optical 3D measurement device. The surface topography wasmeasured with a 50x magnification. The surface of reamed holes was measured at threepositions in the middle of the workpiece. The area measured was 290 x 218 µm.
8

CHAPTER 2. CUTTING SETUP
Figure 2.7: InfiniteFocus, Alicona, 3D optical microscope.
Specimens taken into consideration for measurements on Alicona microscope are listedin Table 2.6.
Table 2.6: Specimens for surface roughness measurement under microscope.WP indication Cutting conditions Code
CF Operator f [mm/rev] ReamerP2 W1 C 0.3 1 P/W1R2 W1 C 0.3 1 R/W1P1 W2 C 0.3 1 P/W2R3 W2 C 0.3 1 R/W2P1 M C 0.3 1 P/MR1 M C 0.3 1 R/MP2 N F 0.3 2 P0.3/NP2 N G 0.2 2 P0.2/NP stands for low cutting speed (vc = 4.5 m/min), R stands for highcutting speed (vc = 10.2 m/min) and the number after indicatesworkpiece number.
2.3.4 Microhardness
After roughness testing, the samples were milled in half and ground for microhardnesstests. Because of the steep hardness gradients near the machined surface, the choice andpreparation of the test surface into which the indentations are made is very important.Grinding papers with a grit between 180 and 1000 were used for approximately 1min. Between changing the grinding papers, high pressure air was used to cleanthe specimens. The grinding was performed on a rotating plate with cold water.Microhardness testing with a Vickers indentor was carried out. The diagonal of thediamond pyramid was 20 µm. Calibration using reference materials with a givenhardness was carried out before measurements on real workpieces. A load of 100 g (seeFigure 2.8(a)) was applied for 18 sec to all specimens. The specimens were fixed and
9

CHAPTER 2. CUTTING SETUP
clamped in a fixture, see Figure 2.8(b). The microhardness value was determined as theaverage of five indentations taken at the same distance on the specimen’s cross-sectionalradius from edges, thus reducing the probability of systematic errors. The sequence ofthe indentations is shown in Table 2.7. The dimensions of the indentation were measuredwith a built-in function in the microscope (see Figure 2.8(c)), and the correspondinghardness value was found in a table. If the diagonals were unequal, an average valuewas calculated.
Specimens taken into consideration for the microhardness measurement are listed inTable 2.8.
(a) Applied load. (b) Specimen positioned in the fixture and coordi-nates for measuring strategy.
(c) Microscope.
Figure 2.8: Microhardness measurement setup.
Table 2.7: Position of indentations for micro hardness measurement. See correspondingcoordinate system in Figure 2.8(b).
Measurement in x [mm] 0.05 0.1 0.15 0.3 0.6 1.2 2.4Measurement in y [mm] 2.5 5.0 7.5 10.0 12.5
10

CHAPTER 2. CUTTING SETUP
Table 2.8: Specimens for microhardness measurement.WP indication Cutting conditions Code
CF Operator f [mm/rev] ReamerP3 W1 E 0.3 1 P/W1R2 W1 E 0.3 1 R/W1P1 W2 E 0.3 1 P/W2R1 W2 E 0.3 1 R/W2P1 M E 0.3 1 P/MR1 M E 0.3 1 R/MP2 N F 0.3 2 P0.3/NP2 N G 0.2 2 P0.2/NP stands for low cutting speed (vc = 4.5 m/min), R stands for highcutting speed (vc = 10.2 m/min) and the number after indicatesworkpiece number.
2.4 Test procedure
All the groups followed the same procedure which is described in 13 steps below:
1. Workpiece was clamped in the mounting device (holder);
2. Lubrication was applied so that the workpiece remained fully immersed;
3. The correct feed and rotational speed were set;
4. The pre-manufactured holes were reamed;
5. The reamer was examined for attached chips and these were respectively removedby compressed air;
6. This was repeated for two more workpieces;
7. Rotational speed was changed from 140 rpm to 320 rpm while keeping the samefeed;
8. In this way, three workpieces were reamed;
9. The reservoir with the workpiece holder were cleaned and a new cutting fluid wasapplied;
10. The process was repeated for three cutting fluids;
11. Reamer was changed for a new one;
12. Five specimens were reamed for run-in;
13. The reaming process was repeated for additional cutting fluid, changing the feedfrom 0.3 mm/rev to 0.2 mm/rev and keeping the same rotational speed;
11

CHAPTER 2. CUTTING SETUP
2.5 Test plan
Three specimens for combination of rotational speed/lubrication were reamed. Thisstrategy was applied to five different operators (see Table 2.9 and Table 2.10) using reamer1. This results in a total of 90 specimens (i.e. 5 operators, 3 cutting fluids, 2 rotationalspeeds and 3 specimens). Another serious of tests was performed using reamer 2 (newreamer) and a new CF. Ten specimens were reamed before the second series using reamer2 was run in order to perform run-in. Then, six specimens were reamed according to thetest plan, three with a feed 0.3 mm/rev and three with a feed 0.2 mm/rev, keeping thesame rotational speed 140 rpm.
Table 2.9: Test plan.CF Operator
E* A* B* C* D* F** G***W1 X X X X XW2 X X X X XM X X X X XN X XNote: The stars are further explained in Table 2.10.
Table 2.10: Cutting conditions.* ** *** units
Cutting tool Reamer 1 Reamer 2 Reamer 2Reamer diameter 10.2 10.2 10.2 mm/revFeed, f 0.3 0.3 0.2 mm/revNumber of flutes 6 6 6Feed per tooth (chip load), CL 0.05 0.05 0.033 mmRotational speed, N1 140 140 140 rpmCutting speed (low), P 4.5 4.5 4.5 m/minRotational speed, N2 320 rpmCutting speed (high), R 10.2 m/minDepth of cut, ap 0.15 0.15 0.15 mm
It can be seen from Table 2.9 and Table 2.10 that the variables employed during the testwere:
• operators (E, A, B, C, D, F, G);
• number of specimens for individual tests (WP1, WP2, WP3);
• cutting fluids CFs (see description of CFs in Table 2.3);
• cutting speeds (low: 4.5 m/min and high: 10.2 m/min);
• feeds (0.3 mm/rev and 0.2 mm/rev);
• reamers (Reamer 1 and Reamer 2).
12

CHAPTER 2. CUTTING SETUP
Before the test, the actual rotational speeds 140 rpm and 320 rpm and feeds 0.3 mm/revand 0.2 mm/rev were measured. The rotational speed of the spindle was measured bytachometer. The spindle displacement was measured over time on the NC console whichis a part of a drilling press. The correct values of actual rotational speeds and feeds areshown in Table 2.11. It can be seen that the feed reduction (FR) for feed of 0.3 mm/revwas 7% (for both rotational speeds) whereas FR for feed of 0.2 mm/rev was 26.2%.
Table 2.11: Feed reduction.Parameter Symbol Value Unit
Parameters set Feed length L 100 100 100 mmRotational speed N 140 320 140 rpmFeed f 0.3 0.3 0.2 mm/rev
Measured values Time t 146 66 276 sActual rotational speed N’ 147.3 326.0 147.3 rpm
Calculated values Actual feed rate fr’ 41.1 90.9 21.7 mm/minActual feed f’ 0.279 0.279 0.148 mm/revFeed reduction FR 7.0 7.0 26.2 %
13

Chapter 3
Expression of uncertainty forroughness measurement
An uncertainty for surface roughness measurements using a conventional stylus rough-ness tester was assessed taking into account calibration of this instrument and variabilityof the machined surface. The instrument was first calibrated using an optical flat, todetermine the background noise and roughness standard ISO 5436 type C [9], to deter-mine the repeatability of the measurement (see Calibration certificate in Appendix I).The uncertainty of the instrument was calculated Uinst = 0.016 µm. The expandeduncertainty of the instrument was calculated using the following formula:
Uinst = k ×√u2n + u2r + u2b (3.1)
where
• k is a coverage factor corresponding to 95% confidence interval (k=2);
• un is uncertainty of the roughness calibration standard, Un is from calibrationcertificate; un =
Un2
• ur is repeatability of the instrument, n is number of measurements in the same trackwith the standard deviation STDr; ur =
STDr√n
• ub is uncertainty caused by the background noise, Rx0 is the measured backgroundnoise (average Ra measured on the optical flat); ub = 1
2 ×Rx0√
3
The individual uncertainty contributors and expanded combined uncertainty for mea-surements of the instrument were calculated and the results are shown in Table 3.1.
Table 3.1: Uncertainty budget for calibration of the stylus instrument. All values in µm.Standard uncertainty components Exp. comb. unc.un ur ub Uinst
0.008 0.001 0.005 0.016
The uncertainty budget (Table 3.2) of the reaming process was then calculated followingGUM procedures [10], taking into account both the calibration of the stylus instrument
14

CHAPTER 3. EXPRESSION OF UNCERTAINTY FOR ROUGHNESS MEASUREMENT
and the variability of actual measurements on the specimen. The variability was assessedthrough repeated measurements at different locations on the workpiece, as explained inSection 2.3.1. The uncertainty was calculated as follows:
Uream = k ×√u2inst + u2s (3.2)
where
• Uream is expanded combined uncertainty for each combination of rotational speedand feed;
• k is a coverage factor corresponding to 95% confidence interval (k=2);
• uinst is uncertainty of the instrument, uinst = Uinst/2;
• us is uncertainty caused by variations in the roughness of the specimen in differentlocations, us = ss/
√n, where n is number of measurements (n = 60 for operators
A, B, C, D, E and n = 12 for operators F, G) with standard deviation ss.
Table 3.2: Uncertainty budget for the reaming process. All values in µm.Cutting condition
P/W1 P/W2 P/M R/W1 R/W2 R/M P0.3/N P0.3/Nuinst 0.008 0.008 0.008 0.008 0.008 0.008 0.008 0.008us 0.016 0.012 0.012 0.039 0.028 0.023 0.007 0.008Uream 0.036 0.029 0.029 0.079 0.057 0.049 0.022 0.023
15

Chapter 4
Results and discussion
This chapter is dedicated to results achieved in this work. Results are discussedin different sections including investigation of Ra values and uncertainty calculationconsidering different uncertainty contributors, replication of the tool geometry, 2D and3D reference measurements, investigation of surface roughness under the microscope,frequency analysis and microhardness measurements.
4.1 Ra values
Results shown in Figure 4.1 highlight clear idea about the influence of different cuttingconditions on surface roughness parameter Ra. Individual columns in the graphrepresent average values coming from different operators, reaming process (includingdifferent workpieces) and measuring repeatability in the reamed hole. Error barsrepresent expanded uncertainty Uream, expressed in Equation 3.2. It should also benoted, that the outliers and systematic errors were not eliminated. Low surface roughnessvalues are due to specimens that were machined with low cutting speed (4.5 m/min), nomatter what cutting fluid was used. Low uncertainties results from good reproducibilityof the whole process, including both machining and measurements. Roughness of thespecimens machined with high cutting speed (10.2 m/min), result in increased valuesand low process reproducibility which can be observed from bigger error bars whencompared to low cutting speed. It can be seen that the uncertainty slightly decreaseswith increased concentration of the oil in solution (W1 compared to W2) or when straightmineral oil was used.
The influence of uncertainty contributors including repeatability around the hole cir-cumference, repeatability of the process and reproducibility from different operators,is shown in Figure 4.2 and it is in a good agreement with Figure 4.1: individualuncertainty contributors are dependent on the selection of a combination of cuttingspeed/lubrication. It is shown in Figure 4.2 that the measuring repeatability in thereamed hole and process repeatability decreases with increased concentration of the oil(or when using a straight mineral oil) when high cutting speed was applied. However,it is generally difficult to describe which uncertainty contributor is more pronounced inthe case of low cutting speed since this varies no matter which cutting fluid was used.
Individual uncertainty contributors in Figure 4.2 are calculated as following:
16

CHAPTER 4. RESULTS AND DISCUSSION
0.0
0.2
0.4
0.6
0.8
1.0
P/W1 P/W2 P/M R/W1 R/W2 R/M P0.3/N P0.2/N
Su
rfac
e ro
ug
hn
ess,
Ra
[µm
]
Cutting condition
Figure 4.1: Surface roughness measurement results. Error bars represent expanded measuringuncertainty at 95% confidence interval (k=2). The symbols refer to: Cutting speed (low P: 4.5 m/minand high R: 10.2 m/min), Feed (0.3 mm/rev and 0.2 mm/rev), Cutting fluid: W1, W2, M, N.
• instrument: Calculated as uinst = Uinst/2;
• repeatability around hole circumference: For four measured positions (i, j, k,l) a standard deviation is calculated. An average of three standard deviations,representing three workpieces, is calculated. From this, an average for fiveoperators is considered;
• repeatability of the process: For four measured positions (i, j, k, l) an averageis calculated. A standard deviation of three average values, representing threeworkpieces, is calculated. From this, an average for five operators is considered;
• reproducibility of different operators: An average of three workpieces measuredat four positions (i, j, k, l) is calculated. From this, a standard deviation for fiveoperators is considered.
17

CHAPTER 4. RESULTS AND DISCUSSION
0.000
0.050
0.100
0.150
0.200
0.250
P/W1 P/W2 P/M R/W1 R/W2 R/M P0.3/N P0.2/N
Sta
nd
ard
un
cert
ain
ty [
mm
]
Cutting condition
instrument
repeatability around hole circumference
repeatability of the process
reproducibility of different operators
Figure 4.2: Uncertainty caused by various contributors. The symbols refer to: Cutting speed (low P: 4.5m/min and high R: 10.2 m/min), Feed (0.3 mm/rev and 0.2 mm/rev), Cutting fluid: W1, W2, M, N.
It can be noticed from Figure 4.1 and Figure 4.2 that the new reamer in a combinationwith a chlorinated neat oil results in much lower surface roughness values and lowuncertainties. This is because the contribution to uncertainty due to measurementsaround the hole circumference and repeatability of the process is lower, too. Moreover,the influence of the operator is not included in calculation.
In reaming tests generally, low Ra values can be combined with poor surface quality.However, it was observed in the present investigation that the low values of Ra surfaceroughness parameter correspond to good surface quality.
4.2 Replication
It is assumed that that the "long" wavelengths on the profiles correspond to feed markscoming from the cutting tool. As it can be seen in Figure 4.3, the number of peaks withinan evaluation length ln = 4mm for a given feed f = 0.279 mm/rev is approximately 14.This is confirmed by a simple calculation, see below:
ln
f=
4
0.279= 14.3 peaks (4.1)
Each peak on the profile therefore represents a feed mark caused by the reamer. Thenumber of peaks for individual cutting conditions corresponds to the feed of the tool,
18

CHAPTER 4. RESULTS AND DISCUSSION
however is more distinct for low cutting speed.
Figure 4.3: Profile of a reamed surface. Each peak on the surface profile represents a feed that the toolmoves per revolution.
It can be seen from the profiles obtained from all the measurements (see Appendix A andAppendix B), that surfaces produced with a low cutting speed are generally reproduciblewhen considering different operators, unlike the surfaces produced with high cuttingspeed. These result in uneven, random surface profiles and vary considerably fordifferent operators. However, it can be observed that a higher concentration of the oilin water-based cutting fluid (or when using a straight mineral oil) results in surfaceprofiles that are more reproducible at a higher cutting speed. Moreover, it can be seen thatthree cutting fluids (two water-based cutting fluids with different oil concentrations anda straight mineral oil) used in connection with a low cutting speed result in "identical"surface profiles.
Profiles presented in Figure 4.4, Figure 4.5 and Figure 4.6 confirm high reproducibilityof surface roughness profiles for low cutting speed. It can be however observed thatthe surface roughness profiles in the case of W1 lubrication result in high reproducibilityfor individual specimens (measurements around the hole circumference) but vary for allthree specimens reamed under the same conditions.
19

CHAPTER 4. RESULTS AND DISCUSSION
Figure 4.4: Reproducibility of surface roughness profiles for operator E with the following cuttingconditions: low cutting speed, water-miscible CF with 1% concentration (P/W1). The first four profilesrepresent WP1, the middle four profiles WP2 and the last four profiles WP3. The evaluation length is 4 mmand the height between the dotted lines corresponds to 4 µm.
20

CHAPTER 4. RESULTS AND DISCUSSION
Figure 4.5: Reproducibility of surface roughness profiles for operator E with the following cuttingconditions: low cutting speed, water-miscible CF with 10% concentration (P/W2). The first four profilesrepresent WP1, the middle four profiles WP2 and the last four profiles WP3. The evaluation length is 4 mmand the height between the dotted lines corresponds to 4 µm.
21

CHAPTER 4. RESULTS AND DISCUSSION
Figure 4.6: Reproducibility of surface roughness profiles for operator E with the following cuttingconditions: low cutting speed, straight mineral oil (P/M). The first four profiles represent WP1, the middlefour profiles WP2 and the last four profiles WP3. The evaluation length is 4 mm and the height betweenthe dotted lines corresponds to 4 µm.
22

CHAPTER 4. RESULTS AND DISCUSSION
A significant difference was found when low cutting speed, feed 0.2 mm/rev and neatoil were used. In this case, profiles do not have so much characteristic appearance andfeed marks cannot be observed. This can be seen for example in Figure 4.7, which showscharacteristic profiles from different operators under specific cutting conditions. Whencutting with high cutting speed, the feed marks are difficult to recognize either.
(a) Operator C, P/W1. (b) Operator A, R/W1.
(c) Operator C, P/W2. (d) Operator B, R/W2.
(e) Operator A, P/M. (f) Operator C, R/M.
(g) Operator F, P0.3/N. (h) Operator G, P0.2/N.
Figure 4.7: Representative profiles for different cutting conditions.
4.3 2D and 3D reference measurements
Profiles from 2D reference measurements can be found in Appendix C. Table 4.1 shows acomparison between Ra values obtained from a reference instrument and a conventionalportable measuring instrument. A percentage deviation was calculated, and is expressedas follows:
DEV =conventional − reference
reference× 100(%) (4.2)
Difference among values obtained from conventional and reference measurements wasfound. The difference is however random for both comparison measurements. First,the reason why measurements performed on a conventional and reference instruments
23

CHAPTER 4. RESULTS AND DISCUSSION
are different may be due to different measuring strategies applied to both measuringinstruments (see Figure 2.6(c) and Figure 2.5(c)). Secondly, such difference can beassigned to the use of skid pick-up in the case of conventional portable measuringinstrument. The ’optimal’ cutting condition leading to a good agreement between thesemeasurements was found when higher feed and neat oil were used, resulting in adifference of approximantely 4%.
A qualitative comparison between conventional and reference measurements (twodifferent reference instruments were used) is shown in Figure 4.8 and Figure 4.9. It can beseen that the surface topography has the same nature of the profile appearance and thedifference is in the profile height. Profiles also revealed that using low feed and mineralstraight oil leads to a clean cut.
Figure 4.10 shows profiles with a length corresponding to the actual feed of 0.279mm/rev. The red lines then represent a furrow width, w, that is a width correspondingto individual flutes of the reamer and is calculated as follows:
w =feed
number of flutes=
0.279
6= 46.5µm (4.3)
Replication of a geometry of the tool cannot be however recognized. More distinctreplication of tool geometry can be observed on profiles from 3D measurement shownin Figure 4.11, which is a top view of 3D surface topography taken in SPIP software.Here, six furrow widths within the feed can be recognized, i.e. 46.5 µm for feed of 0.279mm/rev and 24.6 µm for feed of 0.148 mm/rev from Table 2.11, respectively. 3D profilesalong with a bearing ratio curve can be found in Appendix D. Marks after a rapid reversemotion of the spindle to the initial position can be noticed. Based on the surface profilefrom Figure 1.1, a theoretical depth of marks is approximately 46.5 µm/100 = 0.465 µm.Having this information in mind and looking at Figure 4.10 it can be concluded, that abuild-up edge was present.
Table 4.1: Comparison between Ra values measured by reference instrument (ref1), FormTalySurf Series 2, and conventional portable measuring instrument (conv), Surtronic 4+.Symbols 1/i . . . correspond to a measuring strategy (see Figure 2.6(c) and Figure 2.5(c))
.
CF Meas.type 1/i 2/j 3/k l avg s DEV [%]W1 ref1 0.312 0.249 0.291 0.284 0.032 64
conv 0.459 0.522 0.464 0.414 0.465 0.044W2 ref1 0.328 0.304 0.307 0.313 0.013 44
conv 0.38 0.566 0.43 0.426 0.451 0.080M ref1 0.285 0.244 0.256 0.262 0.021 46
conv 0.454 0.399 0.337 0.341 0.383 0.055N ref1 0.349 0.29 0.279 0.306 0.038 -5
conv 0.258 0.299 0.287 0.323 0.292 0.027N ref1 0.151 0.183 0.159 0.164 0.017 8
conv 0.172 0.181 0.184 0.174 0.178 0.006
24

CHAPTER 4. RESULTS AND DISCUSSION
Table 4.2: Comparison between Ra values measured by reference instrument (ref2), RTHTalySurf 5-120, and conventional portable measuring instrument (conv), Surtronic 4+.Symbols 1/i . . . correspond to a measuring strategy (see Figure 2.6(c) and Figure 2.5(c)).
CF Meas.type 1 2 3 4 avg s DEV [%]W1 ref2 0.306 0.372 0.323 0.334 0.034 10
conv 0.337 0.351 0.395 0.388 0.368 0.028W2 ref2 0.312 0.291 0.304 0.302 0.011 43
conv 0.372 0.434 0.412 0.511 0.432 0.058M ref2 0.253 0.322 0.389 0.321 0.068 19
conv 0.328 0.345 0.424 0.438 0.384 0.055N ref2 0.273 0.316 0.292 0.294 0.022 -4
conv 0.283 0.291 0.26 0.296 0.283 0.016N ref2 0.19 0.139 0.165 0.165 0.026 44
conv 0.245 0.225 0.239 0.238 0.237 0.008
25

CHAPTER 4. RESULTS AND DISCUSSION
(a) P/W1.
(b) P/W2.
(c) P/M.
(d) P0.3/N.
(e) P0.2/N.
Figure 4.8: Qualitative comparison of surface roughness profiles measured using conventional (Surtronic4+) (top) and reference (Form TalySurf Series 2) (bottom) measuring instruments. The evaluation lengthis 4 mm and the height between the dotted lines corresponds to 4 µm.
26

CHAPTER 4. RESULTS AND DISCUSSION
(a) P/W1.
(b) P/W2.
(c) P/M.
(d) P0.3/N.
(e) P0.2/N.
Figure 4.9: Qualitative comparison of surface roughness profiles measured using conventional (Surtronic4+) (top) and reference (RTH TalySurf 5-120) (bottom) measuring instruments. The evaluation length is 4mm and the height between the dotted lines corresponds to 4 µm.
27

CHAPTER 4. RESULTS AND DISCUSSION
(a) Furrow width, operator C, P/W1.
(b) Furrow width, operator C, P/W2.
(c) Furrow width, operator C, P/M.
(d) Furrow width, operator F, P0.3/N.
(e) Furrow width, operator G, P0.2/N.
Figure 4.10: Feed mark and furrow widths for different cutting conditions measured on a referenceinstrument (2D). Distance between the red lines corresponds to a furrow width.
28

CHAPTER 4. RESULTS AND DISCUSSION
(a) Furrow width, operator C, P/W1.
(b) Furrow width, operator C, P/W2.
(c) Furrow width, operator C, P/M.
(d) Furrow width, operator F, P0.3/N.
(e) Furrow width, operator G, P0.2/N.
Figure 4.11: Feed mark and furrow widths for different cutting conditions measured on a referenceinstrument (3D). The measuring area is 1 x 0.4 mm with spacing 1 µm (1000 samples) and 2 µm (200samples). Distance between the red lines corresponds to a furrow width.
29

CHAPTER 4. RESULTS AND DISCUSSION
4.4 Surface topography under microscope
The results from the 3D optical measurements (see Figure 4.12) have shown that it isnot easy to distinguish tool replication on reamed surfaces. Cutting condition enablingvisual evidence of the tool replication, and so appearance of furrow width, was whenlow cutting speed was used in combination with mineral straight oil. 3D profiles alongwith bearing ratio curves can be found in Appendix F.
30

CHAPTER 4. RESULTS AND DISCUSSION
(a) Operator C, P/W1. (b) Operator A, R/W1.
(c) Operator C, P/W2. (d) Operator B, R/W2.
(e) Operator A, P/M. (f) Operator C, R/M.
(g) Operator F, P0.3/N. (h) Operator G, P0.2/N.
Figure 4.12: Surface topography measured on a 3D optical microscope.
31

CHAPTER 4. RESULTS AND DISCUSSION
4.5 Frequency analysis
A spectral analysis of the profiles was performed in Matlab software. Graphs are plottedin linear and logarithmic scales. Each graph represents the average of four profiles whichare taken around the hole circumference. Several remarks concerning the reproducibilityof surface roughness can be stated. Surface profiles are generally reproducible at lowspeed for all lubrications, and are less reproducible at high speed. The latter concernsonly lubrication W1. The surface analysis confirmed the previous conclusions from 2Dsurface roughness measurements. All the graphs are plotted in Appendix G.
Appendix G: Frequency analysis - FFT 119
19.4. Operator C – low speed, feed 0.3mm/rev –linear scale
P_1% P_10% P_oil
Wp1
Wp2
Wp3
500 200 100 50 200
0.05
0.1
0.15
0.2
0.25
0.3
0.35
0.4
Wavelength ( m)
RM
S (
m)
Spectral analysis using Fast Fourier Transform
500 200 100 50 200
0.05
0.1
0.15
0.2
0.25
0.3
0.35
0.4
Wavelength ( m)
RM
S (
m)
Spectral analysis using Fast Fourier Transform
500 200 100 50 200
0.05
0.1
0.15
0.2
0.25
0.3
0.35
0.4
Wavelength ( m)
RM
S (
m)
Spectral analysis using Fast Fourier Transform
500 200 100 50 200
0.05
0.1
0.15
0.2
0.25
0.3
0.35
0.4
Wavelength ( m)
RM
S (
m)
Spectral analysis using Fast Fourier Transform
500 200 100 50 200
0.05
0.1
0.15
0.2
0.25
0.3
0.35
0.4
Wavelength ( m)
RM
S (
m)
Spectral analysis using Fast Fourier Transform
500 200 100 50 200
0.05
0.1
0.15
0.2
0.25
0.3
0.35
0.4
Wavelength ( m)
RM
S (
m)
Spectral analysis using Fast Fourier Transform
500 200 100 50 200
0.05
0.1
0.15
0.2
0.25
0.3
0.35
0.4
Wavelength ( m)
RM
S (
m)
Spectral analysis using Fast Fourier Transform
500 200 100 50 200
0.05
0.1
0.15
0.2
0.25
0.3
0.35
0.4
Wavelength ( m)
RM
S (
m)
Spectral analysis using Fast Fourier Transform
500 200 100 50 200
0.05
0.1
0.15
0.2
0.25
0.3
0.35
0.4
Wavelength ( m)
RM
S (
m)
Spectral analysis using Fast Fourier Transform(a) Operator C, P/W1.
Appendix G: Frequency analysis - FFT 119
19.4. Operator C – low speed, feed 0.3mm/rev –linear scale
P_1% P_10% P_oil
Wp1
Wp2
Wp3
500 200 100 50 200
0.05
0.1
0.15
0.2
0.25
0.3
0.35
0.4
Wavelength ( m)
RM
S (
m)
Spectral analysis using Fast Fourier Transform
500 200 100 50 200
0.05
0.1
0.15
0.2
0.25
0.3
0.35
0.4
Wavelength ( m)
RM
S (
m)
Spectral analysis using Fast Fourier Transform
500 200 100 50 200
0.05
0.1
0.15
0.2
0.25
0.3
0.35
0.4
Wavelength ( m)
RM
S (
m)
Spectral analysis using Fast Fourier Transform
500 200 100 50 200
0.05
0.1
0.15
0.2
0.25
0.3
0.35
0.4
Wavelength ( m)
RM
S (
m)
Spectral analysis using Fast Fourier Transform
500 200 100 50 200
0.05
0.1
0.15
0.2
0.25
0.3
0.35
0.4
Wavelength ( m)
RM
S (
m)
Spectral analysis using Fast Fourier Transform
500 200 100 50 200
0.05
0.1
0.15
0.2
0.25
0.3
0.35
0.4
Wavelength ( m)R
MS
(m
)
Spectral analysis using Fast Fourier Transform
500 200 100 50 200
0.05
0.1
0.15
0.2
0.25
0.3
0.35
0.4
Wavelength ( m)
RM
S (
m)
Spectral analysis using Fast Fourier Transform
500 200 100 50 200
0.05
0.1
0.15
0.2
0.25
0.3
0.35
0.4
Wavelength ( m)
RM
S (
m)
Spectral analysis using Fast Fourier Transform
500 200 100 50 200
0.05
0.1
0.15
0.2
0.25
0.3
0.35
0.4
Wavelength ( m)
RM
S (
m)
Spectral analysis using Fast Fourier Transform(b) Operator C, P/W2.
Appendix G: Frequency analysis - FFT 124
26.4. Operator A – low speed, feed 0.3mm/rev – linear scale
P_1% P_10% P_oil
Wp1
500 200 100 50 200
0.05
0.1
0.15
0.2
0.25
0.3
0.35
0.4
Wavelength ( m)
RM
S (
m)
500 200 100 50 200
0.05
0.1
0.15
0.2
0.25
0.3
0.35
0.4
Wavelength ( m)
RM
S (
m)
500 200 100 50 200
0.05
0.1
0.15
0.2
0.25
0.3
0.35
0.4
Wavelength ( m)
RM
S (
m)
Wp2
500 200 100 50 200
0.05
0.1
0.15
0.2
0.25
0.3
0.35
0.4
Wavelength ( m)
RM
S (
m)
500 200 100 50 200
0.05
0.1
0.15
0.2
0.25
0.3
0.35
0.4
Wavelength ( m)
RM
S (
m)
500 200 100 50 200
0.05
0.1
0.15
0.2
0.25
0.3
0.35
0.4
Wavelength ( m)
RM
S (
m)
Wp3
500 200 100 50 200
0.05
0.1
0.15
0.2
0.25
0.3
0.35
0.4
Wavelength ( m)
RM
S (
m)
500 200 100 50 200
0.05
0.1
0.15
0.2
0.25
0.3
0.35
0.4
Wavelength ( m)
RM
S (
m)
500 200 100 50 200
0.05
0.1
0.15
0.2
0.25
0.3
0.35
0.4
Wavelength ( m)
RM
S (
m)
(c) Operator C, P/M.
Appendix G: Frequency analysis - FFT 126
26.4. Operator A – high speed, feed 0.3mm/rev –linear scale
R_1% R_10% R_oil
Wp1
500 200 100 50 200
0.05
0.1
0.15
0.2
0.25
0.3
0.35
0.4
Wavelength ( m)
RM
S (
m)
500 200 100 50 200
0.05
0.1
0.15
0.2
0.25
0.3
0.35
0.4
Wavelength ( m)
RM
S (
m)
500 200 100 50 200
0.05
0.1
0.15
0.2
0.25
0.3
0.35
0.4
Wavelength ( m)
RM
S (
m)
Wp2
500 200 100 50 200
0.05
0.1
0.15
0.2
0.25
0.3
0.35
0.4
Wavelength ( m)
RM
S (
m)
500 200 100 50 200
0.05
0.1
0.15
0.2
0.25
0.3
0.35
0.4
Wavelength ( m)
RM
S (
m)
500 200 100 50 200
0.05
0.1
0.15
0.2
0.25
0.3
0.35
0.4
Wavelength ( m)
RM
S (
m)
Wp3
500 200 100 50 200
0.05
0.1
0.15
0.2
0.25
0.3
0.35
0.4
Wavelength ( m)
RM
S (
m)
500 200 100 50 200
0.05
0.1
0.15
0.2
0.25
0.3
0.35
0.4
Wavelength ( m)
RM
S (
m)
500 200 100 50 200
0.05
0.1
0.15
0.2
0.25
0.3
0.35
0.4
Wavelength ( m)
RM
S (
m)
(d) Operator A, R/W1.
Appendix G: Frequency analysis - FFT 126
26.4. Operator A – high speed, feed 0.3mm/rev –linear scale
R_1% R_10% R_oil
Wp1
500 200 100 50 200
0.05
0.1
0.15
0.2
0.25
0.3
0.35
0.4
Wavelength ( m)
RM
S (
m)
500 200 100 50 200
0.05
0.1
0.15
0.2
0.25
0.3
0.35
0.4
Wavelength ( m)
RM
S (
m)
500 200 100 50 200
0.05
0.1
0.15
0.2
0.25
0.3
0.35
0.4
Wavelength ( m)
RM
S (
m)
Wp2
500 200 100 50 200
0.05
0.1
0.15
0.2
0.25
0.3
0.35
0.4
Wavelength ( m)
RM
S (
m)
500 200 100 50 200
0.05
0.1
0.15
0.2
0.25
0.3
0.35
0.4
Wavelength ( m)
RM
S (
m)
500 200 100 50 200
0.05
0.1
0.15
0.2
0.25
0.3
0.35
0.4
Wavelength ( m)
RM
S (
m)
Wp3
500 200 100 50 200
0.05
0.1
0.15
0.2
0.25
0.3
0.35
0.4
Wavelength ( m)
RM
S (
m)
500 200 100 50 200
0.05
0.1
0.15
0.2
0.25
0.3
0.35
0.4
Wavelength ( m)
RM
S (
m)
500 200 100 50 200
0.05
0.1
0.15
0.2
0.25
0.3
0.35
0.4
Wavelength ( m)
RM
S (
m)
(e) Operator A, R/W2.
Appendix G: Frequency analysis - FFT 126
26.4. Operator A – high speed, feed 0.3mm/rev –linear scale
R_1% R_10% R_oil
Wp1
500 200 100 50 200
0.05
0.1
0.15
0.2
0.25
0.3
0.35
0.4
Wavelength ( m)
RM
S (
m)
500 200 100 50 200
0.05
0.1
0.15
0.2
0.25
0.3
0.35
0.4
Wavelength ( m)
RM
S (
m)
500 200 100 50 200
0.05
0.1
0.15
0.2
0.25
0.3
0.35
0.4
Wavelength ( m)
RM
S (
m)
Wp2
500 200 100 50 200
0.05
0.1
0.15
0.2
0.25
0.3
0.35
0.4
Wavelength ( m)
RM
S (
m)
500 200 100 50 200
0.05
0.1
0.15
0.2
0.25
0.3
0.35
0.4
Wavelength ( m)
RM
S (
m)
500 200 100 50 200
0.05
0.1
0.15
0.2
0.25
0.3
0.35
0.4
Wavelength ( m)
RM
S (
m)
Wp3
500 200 100 50 200
0.05
0.1
0.15
0.2
0.25
0.3
0.35
0.4
Wavelength ( m)
RM
S (
m)
500 200 100 50 200
0.05
0.1
0.15
0.2
0.25
0.3
0.35
0.4
Wavelength ( m)
RM
S (
m)
500 200 100 50 200
0.05
0.1
0.15
0.2
0.25
0.3
0.35
0.4
Wavelength ( m)
RM
S (
m)
(f) Operator A, R/M.
Appendix G: Frequency analysis - FFT 139
23.6. Operator F – low speed, feed 0.3mm/rev – linear scale
23.6. - Operator F – low speed, feed 0.3mm/rev – log scale
Neat oil – TDN81 Neat oil – TDN81
Wp1
500 200 100 50 200
0.05
0.1
0.15
0.2
0.25
0.3
0.35
0.4
Wavelength ( m)
RM
S (
m)
500 200 100 50 200.002
0.005
0.01
0.02
0.05
0.1
0.2
Wavelength ( m)
RM
S (
m)
Wp2
500 200 100 50 200
0.05
0.1
0.15
0.2
0.25
0.3
0.35
0.4
Wavelength ( m)
RM
S (
m)
500 200 100 50 200.002
0.005
0.01
0.02
0.05
0.1
0.2
Wavelength ( m)
RM
S (
m)
Wp3
500 200 100 50 200
0.05
0.1
0.15
0.2
0.25
0.3
0.35
0.4
Wavelength ( m)
RM
S (
m)
500 200 100 50 200.002
0.005
0.01
0.02
0.05
0.1
0.2
Wavelength ( m)
RM
S (
m)
(g) Operator F, P0.3/N.
Appendix G: Frequency analysis - FFT 141
23.6. Operator G – low speed, feed 0.2mm/rev –linear scale
23.6. Operator G – low speed, feed 0.2mm/rev – log scale
Neat oil – TDN81 Neat oil – TDN81
Wp1
500 200 100 50 200
0.05
0.1
0.15
0.2
0.25
0.3
0.35
0.4
Wavelength ( m)
RM
S (
m)
500 200 100 50 200.002
0.005
0.01
0.02
0.05
0.1
0.2
Wavelength ( m)
RM
S (
m)
Wp2
500 200 100 50 200
0.05
0.1
0.15
0.2
0.25
0.3
0.35
0.4
Wavelength ( m)
RM
S (
m)
500 200 100 50 200.002
0.005
0.01
0.02
0.05
0.1
0.2
Wavelength ( m)
RM
S (
m)
Wp3
500 200 100 50 200
0.05
0.1
0.15
0.2
0.25
0.3
0.35
0.4
Wavelength ( m)
RM
S (
m)
500 200 100 50 200.002
0.005
0.01
0.02
0.05
0.1
0.2
Wavelength ( m)
RM
S (
m)
(h) Operator G, P0.2/N.
Figure 4.13: Representative profiles of frequency analysis in linear scale for different cutting conditions.Individual graphs are produced as an average of four single surface roughness profiles within one specimen.
32

CHAPTER 4. RESULTS AND DISCUSSION
4.6 Microhardness
Based on the graph in Figure 4.14, the properties of the base material can be measuredat a depth of approximately 200 µm where no strain hardening takes place. This isin a good agreement with that what was investigated in [1]. The microhardness valuemeasured on the base material is 164<HV<174 at a 95% confidence interval. It is shownthat the microhardness is smaller when mineral oil and neat oil were used. This confirmsgood lubrication properties of these cutting fluids in reaming process. Microhardnessmeasured close to the hole edge results in increased values by 65% from those measuredon a base material. The standard deviation increases with a distance closer to the cut edgesince the indentation at this location increases the systematic error. It is expected that themicrohardness increases considerably even closer to the cutting edge, as is it shown in [1],at distances 30 µm and 15 µm respectively, where the microhardness can increase up to a100% with respect to the base material microhardness.
0
50
100
150
200
250
300
P/W1 P/W2 P/M R/W1 R/W2 R/M P0.3/N P0.2/N
HV
Cutting condition
0.05 mm
0.10 mm
0.15 mm
0.30 mm
0.60 mm
1.20 mm
2.40 mm
Figure 4.14: Results of microhardness measurement. Error bars represent five repeated measurements atthe same distance on the specimen’s cross-sectional radius from edges.
33

Chapter 5
Conclusion
An investigation on the reproducibility of surface roughness in reaming has beenperformed to document the applicability of this approach for testing cutting fluids.Reproducibility included three main factors: measuring repeatability in the reamed hole,repeatability of the process and reproducibility of different operators. It was observedfrom the profiles that surfaces produced with a low cutting speed were generally repro-ducible, unlike the surfaces produced with high cutting speed. These contained uneven,random surface profiles and varied considerably for different operators. However, itcould be observed that a higher concentration of the oil in water-based cutting fluid (orwhen using a straight mineral oil) results in surface profiles that are more reproducibleat higher cutting speed. Reproducibility from different operators was not significant andwas the same for different cutting fluids. From the surface profiles, an identification ofindividual feed marks from the tool was possible. This was however more distinct forlow cutting speed rather than high cutting speed.
34

References
[1] L. De Chiffre, S. Lassen, K. B. Pedersen, S. Skade, A reaming test for cutting fluidevaluation, Journal of Synthetic Lubrication 11 (1994) 17–34.
[2] L. De Chiffre, Testing the overall performance fo cutting fluids, LubricationEngineering 34 (1978) 244–251.
[3] L. De Chiffre, Mechanical testing and selection of cutting fluids, LubricationEngineering 36 (1980) 33–39.
[4] L. De Chiffre, G. Tosello, M. Píška, P. Müller, Investigation on capability of reamingprocess using minimal quantity lubrication, CIRP - Journal of ManufacturingScience and Technology 2 (1) (2009) 47–54.
[5] W. Belluco, Performance testing of cutting fluids, Ph.D. thesis, Technical Universityof Denmark (2000).
[6] ISO 4287:1997 - Geometrical product specifications (GPS) - Surface texture: Profilemethod—terms, definitions and surface texture parameters.
[7] ISO 3274:1975 - Geometrical product specifications (GPS) - Surface texture: Profilemethod—nominal characteristics of contact (stylus) instruments.
[8] ISO 3274:1996 - Geometrical product specifications (GPS) - Surface texture: Profilemethod—nominal characteristics of contact (stylus) instruments.
[9] ISO 5436-1:2000 - Geometrical product specifications (GPS) - Surface texture: Profilemethod; measurement standards – Part 1: Material measures.
[10] ISO/IEC Guide 98-3:2008 - Uncertainty of measurement – Part 3: Guide to theexpression of uncertainty in measurement (GUM:1995).
35

Appendix A
Surface roughness measurement -Tables
Appendix A contains tables from all surface roughness measurements.
The values in table are corrected with a correction factor CF = 0.992 for operators E, A,B, C and D and CF = 0.990 for operators F and G. The assessment of CF is based on thecalibration of the instrument.
All units in the following tables are in µm.
36

Appendix A: Surface roughness measurement results - Tables 37
Table A1: Surface roughness measurement results – P/W1.
1% oil concentration, P(low speed vc=4.5m/min), N=140rpm, f=0.3mm/rev, reamer HSS Ø10.2mm
Operator E (23/3-2010) Operator B (12/4-2010)
Position Position
i j k l avg std i j k l avg std
WP1 0.827 0.827 0.849 0.793 0.824 0.023 0.442 0.347 0.265 0.616 0.418 0.151
WP2 0.421 0.374 0.359 0.369 0.381 0.027 0.527 0.477 0.231 0.366 0.400 0.131
WP3 0.337 0.351 0.395 0.388 0.368 0.028 0.484 0.493 0.505 0.489 0.493 0.009
avg 0.528 0.517 0.534 0.517 0.524 0.484 0.439 0.334 0.490 0.437
std 0.262 0.269 0.273 0.239 0.260 0.043 0.080 0.149 0.125 0.049
1% oil concentration, P(low speed vc=4.5m/min), N=140rpm, f=0.3mm/rev, reamer HSS Ø10.2mm
Operator C (19/4-2010) Operator A (26/4-2010)
Position Position
i j k l avg std i j k l avg std
WP1 0.479 0.491 0.382 0.460 0.453 0.049 0.351 0.368 0.389 0.443 0.388 0.040
WP2 0.459 0.522 0.464 0.414 0.465 0.044 0.474 0.697 0.527 0.542 0.560 0.096
WP3 0.472 0.440 0.417 0.300 0.407 0.075 0.393 0.380 0.384 0.423 0.395 0.019
avg 0.470 0.484 0.421 0.391 0.442 0.406 0.482 0.433 0.469 0.448
std 0.010 0.041 0.041 0.082 0.030 0.063 0.187 0.081 0.064 0.097
1% oil concentration, P(low speed vc=4.5m/min), N=140rpm, f=0.3mm/rev, reamer HSS Ø10.2mm
Operator D (3/5-2010)
Position
i j k l avg std
WP1 0.365 0.386 0.413 0.454 0.405 0.038
WP2 0.424 0.423 0.379 0.495 0.430 0.048
WP3 0.366 0.457 0.364 0.548 0.434 0.088
avg 0.385 0.422 0.385 0.499 0.423
std 0.034 0.036 0.025 0.047 0.016

Appendix A: Surface roughness measurement results - Tables 38
Table A2: Surface roughness measurement results – R/W1.
1% oil concentration, R(high speed vc=10.2m/min), N=320rpm, f=0.3mm/rev, reamer HSS Ø10.2mm
Operator E (23/3-2010) Operator B (12/4-2010)
Position Position
i j k l avg std i j k l avg std
WP1 0.834 0.619 0.639 0.636 0.682 0.102 0.402 0.389 0.474 0.887 0.538 0.236
WP2 0.668 0.623 0.945 0.966 0.801 0.180 0.436 0.499 0.411 0.434 0.445 0.038
WP3 0.686 0.740 0.650 0.680 0.689 0.037 0.930 0.993 0.493 0.518 0.734 0.265
avg 0.729 0.661 0.745 0.761 0.724 0.589 0.627 0.459 0.613 0.572
std 0.091 0.069 0.174 0.179 0.066 0.296 0.322 0.043 0.241 0.147
1% oil concentration, R(high speed vc=10.2m/min), N=320rpm, f=0.3mm/rev, reamer HSS Ø10.2mm
Operator C (19/4-2010) Operator A (26/4-2010)
Position Position
i j k l avg std i j k l avg std
WP1 0.982 1.307 0.978 1.921 1.297 0.444 0.588 1.000 0.853 0.611 0.763 0.198
WP2 0.456 0.451 0.474 0.489 0.468 0.017 1.087 0.572 0.614 0.594 0.717 0.247
WP3 1.186 1.111 0.668 0.714 0.920 0.267 0.804 1.352 1.144 0.707 1.002 0.299
avg 0.875 0.956 0.707 1.041 0.895 0.826 0.975 0.870 0.637 0.827
std 0.377 0.448 0.254 0.770 0.415 0.250 0.391 0.265 0.061 0.153
1% oil concentration, R(high speed vc=10.2m/min), N=320rpm, f=0.3mm/rev, reamer HSS Ø10.2mm
Operator D (3/5-2010)
Position
i j k l avg std
WP1 0.819 0.750 0.946 0.690 0.801 0.110
WP2 0.682 1.029 1.632 0.942 1.071 0.402
WP3 0.919 0.686 0.816 0.900 0.830 0.106
avg 0.807 0.822 1.131 0.844 0.901
std 0.119 0.182 0.438 0.135 0.148

Appendix A: Surface roughness measurement results - Tables 39
Table A3: Surface roughness measurement results – P/W2.
10% oil concentration, P(low speed vc=4.5m/min), N=140rpm, f=0.3mm/rev, reamer HSS Ø10.2mm
Operator E (23/3-2010) Operator B (12/4-2010)
Position Position
i j k l avg std i j k l avg std
WP1 0.372 0.434 0.412 0.511 0.432 0.058 0.316 0.471 0.299 0.372 0.365 0.078
WP2 0.492 0.452 0.401 0.460 0.451 0.038 0.328 0.483 0.394 0.310 0.379 0.078
WP3 0.464 0.399 0.324 0.345 0.383 0.063 0.461 0.485 0.302 0.350 0.400 0.088
avg 0.443 0.428 0.379 0.439 0.422 0.368 0.480 0.332 0.344 0.381
std 0.063 0.027 0.048 0.085 0.035 0.080 0.008 0.054 0.031 0.018
10% oil concentration, P(low speed vc=4.5m/min), N=140rpm, f=0.3mm/rev, reamer HSS Ø10.2mm
Operator C (19/4-2010) Operator A (26/4-2010)
Position Position
i j k l avg std i j k l avg std
WP1 0.380 0.566 0.430 0.426 0.451 0.080 0.446 0.466 0.497 0.479 0.472 0.021
WP2 0.436 0.399 0.372 0.363 0.393 0.033 0.451 0.449 0.570 0.449 0.480 0.060
WP3 0.365 0.356 0.578 0.357 0.414 0.109 0.424 0.436 0.400 0.426 0.422 0.015
avg 0.394 0.440 0.460 0.382 0.419 0.440 0.450 0.489 0.451 0.458
std 0.037 0.111 0.106 0.038 0.029 0.014 0.015 0.085 0.027 0.032
10% oil concentration, P(low speed vc=4.5m/min), N=140rpm, f=0.3mm/rev, reamer HSS Ø10.2mm
Operator D (3/5-2010)
Position
i j k l avg std
WP1 0.580 0.680 0.638 0.449 0.587 0.101
WP2 0.491 0.520 0.650 0.630 0.573 0.079
WP3 0.730 0.533 0.452 0.415 0.533 0.141
avg 0.600 0.578 0.580 0.498 0.564
std 0.121 0.089 0.111 0.116 0.028

Appendix A: Surface roughness measurement results - Tables 40
Table A4: Surface roughness measurement results – R/W2.
10% oil concentration, R(high speed vc=10.2m/min), N=320rpm, f=0.3mm/rev, reamer HSS Ø10.2mm
Operator E (23/3-2010) Operator B (12/4-2010)
Position Position
i j k l avg std i j k l avg std
WP1 0.734 0.637 0.636 0.587 0.649 0.062 0.763 0.585 0.523 0.665 0.634 0.104
WP2 0.605 0.629 0.455 0.547 0.559 0.077 0.515 0.775 0.986 0.599 0.719 0.209
WP3 0.844 0.870 0.887 0.933 0.884 0.037 0.755 0.596 0.692 0.428 0.618 0.142
avg 0.728 0.712 0.659 0.689 0.697 0.678 0.652 0.734 0.564 0.657
std 0.120 0.137 0.217 0.212 0.168 0.141 0.107 0.234 0.122 0.054
10% oil concentration, R(high speed vc=10.2m/min), N=320rpm, f=0.3mm/rev, reamer HSS Ø10.2mm
Operator C (19/4-2010) Operator A (26/4-2010)
Position Position
i j k l avg std i j k l avg std
WP1 0.564 0.472 0.676 0.537 0.562 0.085 0.619 0.734 0.596 0.747 0.674 0.078
WP2 0.485 0.413 0.448 0.443 0.447 0.030 0.932 0.493 0.935 1.094 0.864 0.258
WP3 0.475 0.373 0.429 0.400 0.419 0.044 0.661 0.717 0.690 0.574 0.661 0.062
avg 0.508 0.419 0.518 0.460 0.476 0.737 0.648 0.740 0.805 0.733
std 0.049 0.050 0.137 0.070 0.076 0.170 0.135 0.175 0.265 0.114
10% oil concentration, R(high speed vc=10.2m/min), N=320rpm, f=0.3mm/rev, reamer HSS Ø10.2mm
Operator D (3/5-2010)
Position
i j k l avg std
WP1 0.604 0.510 0.685 0.707 0.627 0.089
WP2 0.504 1.125 1.647 0.558 0.959 0.538
WP3 0.533 0.562 0.558 0.622 0.569 0.038
avg 0.547 0.732 0.963 0.629 0.718
std 0.051 0.341 0.595 0.075 0.210

Appendix A: Surface roughness measurement results - Tables 41
Table A5: Surface roughness measurement results – P/M.
Mineral oil, P(low speed vc=4.5m/min), N=140rpm, f=0.3mm/rev, reamer HSS Ø10.2mm
Operator E (23/3-2010) Operator B (12/4-2010)
Position Position
i j k l avg std i j k l avg std
WP1 0.419 0.378 0.381 0.391 0.392 0.019 0.368 0.303 0.282 0.262 0.304 0.046
WP2 0.336 0.325 0.328 0.362 0.338 0.017 0.380 0.420 0.388 0.342 0.383 0.032
WP3 0.328 0.345 0.424 0.438 0.384 0.055 0.403 0.604 0.283 0.310 0.400 0.145
avg 0.361 0.349 0.378 0.397 0.371 0.384 0.442 0.318 0.305 0.362
std 0.050 0.027 0.048 0.038 0.029 0.018 0.152 0.061 0.040 0.051
Mineral oil, P(low speed vc=4.5m/min), N=140rpm, f=0.3mm/rev, reamer HSS Ø10.2mm
Operator C (19/4-2010) Operator A (26/4-2010)
Position Position
i j k l avg std i j k l avg std
WP1 0.454 0.399 0.337 0.341 0.383 0.055 0.615 0.555 0.682 0.513 0.591 0.074
WP2 0.531 0.435 0.421 0.350 0.434 0.074 0.434 0.425 0.371 0.594 0.456 0.096
WP3 0.351 0.434 0.455 0.547 0.447 0.081 0.429 0.347 0.432 0.482 0.423 0.056
avg 0.445 0.423 0.404 0.413 0.421 0.493 0.442 0.495 0.530 0.490
std 0.090 0.021 0.061 0.116 0.034 0.106 0.105 0.165 0.058 0.089
Mineral oil, P(low speed vc=4.5m/min), N=140rpm, f=0.3mm/rev, reamer HSS Ø10.2mm
Operator D (3/5-2010)
Position
i j k l avg std
WP1 0.533 0.490 0.368 0.582 0.493 0.092
WP2 0.482 0.595 0.436 0.473 0.497 0.069
WP3 0.558 0.515 0.428 0.401 0.476 0.073
avg 0.524 0.533 0.411 0.485 0.488
std 0.039 0.055 0.037 0.091 0.011

Appendix A: Surface roughness measurement results - Tables 42
Table A6: Surface roughness measurement results - R/M.
Mineral oil, R(high speed vc=10.2m/min), N=320rpm, f=0.3mm/rev, reamer HSS Ø10.2mm
Operator E (23/3-2010) Operator B (12/4-2010)
Position Position
i j k l avg std i j k l avg std
WP1 0.358 0.304 0.310 0.329 0.325 0.024 0.451 0.306 0.388 1.017 0.541 0.323
WP2 0.400 0.283 0.362 0.474 0.380 0.080 1.115 0.279 0.749 0.187 0.583 0.432
WP3 0.420 0.405 0.378 0.498 0.425 0.052 0.354 0.717 0.983 0.596 0.663 0.262
avg 0.393 0.331 0.350 0.434 0.377 0.640 0.434 0.707 0.600 0.595
std 0.032 0.065 0.036 0.091 0.050 0.414 0.245 0.300 0.415 0.062
Mineral oil, R(high speed vc=10.2m/min), N=320rpm, f=0.3mm/rev, reamer HSS Ø10.2mm
Operator C (19/4-2010) Operator A (26/4-2010)
Position Position
i j k l avg std i j k l avg std
WP1 0.461 0.480 0.493 0.493 0.482 0.015 0.639 0.637 0.737 0.793 0.702 0.077
WP2 0.710 0.692 0.436 0.529 0.592 0.132 0.662 0.797 0.702 0.744 0.726 0.058
WP3 0.440 0.448 0.570 0.427 0.471 0.066 1.499 1.497 1.442 0.878 1.329 0.302
avg 0.537 0.540 0.500 0.483 0.515 0.933 0.977 0.960 0.805 0.919
std 0.150 0.133 0.067 0.052 0.067 0.490 0.457 0.418 0.068 0.355
Mineral oil, R(high speed vc=10.2m/min), N=320rpm, f=0.3mm/rev, reamer HSS Ø10.2mm
Operator D (3/5-2010)
Position
i j k l avg std
WP1 0.468 0.453 0.512 0.464 0.474 0.026
WP2 0.309 0.358 0.645 0.363 0.419 0.153
WP3 0.368 0.415 0.496 0.397 0.419 0.055
avg 0.382 0.409 0.551 0.408 0.437
std 0.080 0.048 0.082 0.051 0.032

Appendix A: Surface roughness measurement results - Tables 43
Table A7: Surface roughness measurement results - P0.3/N.
Neat oil, P(low speed vc=4.5m/min), N=140rpm, f=0.3mm/rev, reamer HSS Ø10.2mm (new)
Operator F (22/6-2010)
Position
i j k l avg std
WP1 0.251 0.272 0.229 0.256 0.252 0.018
WP2 0.258 0.299 0.287 0.323 0.292 0.027
WP3 0.283 0.291 0.260 0.296 0.283 0.016
avg 0.264 0.287 0.259 0.292 0.275
std 0.017 0.014 0.029 0.034 0.021
Table A8: Surface roughness measurement results - P0.2/N.
Neat oil, P(low speed vc=4.5m/min), N=140rpm, f=0.2mm/rev, reamer HSS Ø10.2mm (new)
Operator G (22/6-2010)
Position
i j k l avg std
WP1 0.233 0.243 0.222 0.225 0.231 0.009
WP2 0.172 0.181 0.184 0.174 0.178 0.006
WP3 0.245 0.225 0.239 0.238 0.237 0.008
avg 0.217 0.216 0.215 0.212 0.215
std 0.039 0.032 0.028 0.034 0.032

Appendix B
Surface roughness measurement -Profiles
Appendix B contains profiles from all the operators (i.e. E, A, B, C, D, F, G). Theinstrument was Surtronic 4+, Taylor Hobson.
Symbols in the tables (i, j, k, l) correspond to a position of the profile around the holecircumference.
P: Low speed, 4.5 m/minR: High speed, 10.2 m/min
Feed, 0.3 mm/rev (operators A, B, C, D, E and F)Feed, 0.2 mm/rev (operator G)
Evaluation length, 4mmThe height between the dotted lines is 4 µm.
44

Appendix B: Surface roughness measurement (Profiles) 45
Appendix B1: Surface roughness measurement
Operator E: 23/3-2010

Appendix B: Surface roughness measurement (Profiles) 46
Operator E – 23/03 – 2010; P (low vc=4,5 m/min), R (high vc=10,2 m/min)
Workpiece P1 – 1% oil concentration (P0.3/W1)
i
j
k
l
Workpiece P2 – 1% oil concentration (P0.3/W1)
i
j
k
l
Workpiece P3 – 1% oil concentration (P0.3/W1)
i
j
k
l

Appendix B: Surface roughness measurement (Profiles) 47
Operator E – 23/03 – 2010; P (low vc=4,5 m/min), R (high vc=10,2 m/min)
Workpiece R1 – 1% oil concentration (R0.3/W1)
i
j
k
l
Workpiece R2 – 1% oil concentration (R0.3/W1)
i
j
k
l
Workpiece R3 – 1% oil concentration (R0.3/W1)
i
j
k
l

Appendix B: Surface roughness measurement (Profiles) 48
Operator E – 23/03 – 2010; P (low vc=4,5 m/min), R (high vc=10,2 m/min)
Workpiece P1 – 10% oil concentration (P0.3/W2)
i
j
k
l
Workpiece P2 – 10% oil concentration (P0.3/W2)
i
j
k
l
Workpiece P3 – 10% oil concentration (P0.3/W2)
i
j
k
l

Appendix B: Surface roughness measurement (Profiles) 49
Operator E – 23/03 – 2010; P (low vc=4,5 m/min), R (high vc=10,2 m/min)
Workpiece R1 – 10% oil concentration (R0.3/W2)
i
j
k
l
Workpiece R2 – 10% oil concentration (R0.3/W2)
i
j
k
l
Workpiece R3 – 10% oil concentration (R0.3/W2)
i
j
k
l

Appendix B: Surface roughness measurement (Profiles) 50
Operator E – 23/03 – 2010; P (low vc=4,5 m/min), R (high vc=10,2 m/min)
Workpiece P1 – mineral oil (P0.3/M)
i
j
k
l
Workpiece P2 – mineral oil (P0.3/M)
i
j
k
l
Workpiece P3 – mineral oil (P0.3/M)
i
j
k
l

Appendix B: Surface roughness measurement (Profiles) 51
Operator E – 23/03 – 2010; P (low vc=4,5 m/min), R (high vc=10,2 m/min)
Workpiece R1 – mineral oil (R0.3/M)
i
j
k
l
Workpiece R2 – mineral oil (R0.3/M)
i
j
k
l
Workpiece R3 – mineral oil (R0.3/M)
i
j
k
l

Appendix B: Surface roughness measurement (Profiles) 52
Appendix B2: Surface roughness measurement Operator B: 12/4-2010

Appendix B: Surface roughness measurement (Profiles) 53
Operator B – 12/4 – 2010; P (low vc=4,5 m/min), R (high vc=10,2 m/min)
Workpiece P1 – 1% oil concentration (P0.3/W1)
i
j
k
l
Workpiece P2 – 1% oil concentration (P0.3/W1)
i
j
k
l
Workpiece P3 – 1% oil concentration (P0.3/W1)
i
j
k
l

Appendix B: Surface roughness measurement (Profiles) 54
Operator B – 12/4 – 2010; P (low vc=4,5 m/min), R (high vc=10,2 m/min)
Workpiece R1 – 1% oil concentration (R0.3/W1)
i
j
k
l
Workpiece R2 – 1% oil concentration (R0.3/W1)
i
j
k
l
Workpiece R3 – 1% oil concentration (R0.3/W1)
i
j
k
l

Appendix B: Surface roughness measurement (Profiles) 55
Operator B – 12/4 – 2010; P (low vc=4,5 m/min), R (high vc=10,2 m/min)
Workpiece P1 – 10% oil concentration (P0.3/W2)
i
j
k
l
Workpiece P2 – 10% oil concentration (P0.3/W2)
i
j
k
l
Workpiece P3 – 10% oil concentration (P0.3/W2)
i
j
k
l

Appendix B: Surface roughness measurement (Profiles) 56
Operator B – 12/4 – 2010; P (low vc=4,5 m/min), R (high vc=10,2 m/min)
Workpiece R1 – 10% oil concentration (R0.3/W2)
i
j
k
l
Workpiece R2 – 10% oil concentration (R0.3/W2)
i
j
k
l
Workpiece R3 – 10% oil concentration (R0.3/W2)
i
j
k
l

Appendix B: Surface roughness measurement (Profiles) 57
Operator B – 12/4 – 2010; P (low vc=4,5 m/min), R (high vc=10,2 m/min)
Workpiece P1 – mineral oil (P0.3/M)
i
j
k
l
Workpiece P2 – mineral oil (P0.3/M)
i
j
k
l
Workpiece P3 – mineral oil (P0.3/M)
i
j
k
l

Appendix B: Surface roughness measurement (Profiles) 58
Operator B – 12/4 – 2010; P (low vc=4,5 m/min), R (high vc=10,2 m/min)
Workpiece R1 – mineral oil (R0.3/M)
i
j
k
l
Workpiece R2 – mineral oil (R0.3/M)
i
j
k
l
Workpiece R3 – mineral oil (R0.3/M)
i
j
k
l

Appendix B: Surface roughness measurement (Profiles) 59
Appendix B3: Surface roughness measurement Operator C: 19/4-2010

Appendix B: Surface roughness measurement (Profiles) 60
Operator C – 19/4 – 2010; P (low vc=4,5 m/min), R (high vc=10,2 m/min)
Workpiece P1 – 1% oil concentration (P0.3/W1)
i
j
k
l
Workpiece P2 – 1% oil concentration (P0.3/W1)
i
j
k
l
Workpiece P3 – 1% oil concentration (P0.3/W1)
i
j
k
l

Appendix B: Surface roughness measurement (Profiles) 61
Operator C – 19/4 – 2010; P (low vc=4,5 m/min), R (high vc=10,2 m/min)
Workpiece R1 – 1% oil concentration (R0.3/W1)
i
j
k
l
Workpiece R2 – 1% oil concentration (R0.3/W1)
i
j
k
l
Workpiece R3 – 1% oil concentration (R0.3/W1)
i
j
k
l

Appendix B: Surface roughness measurement (Profiles) 62
Operator C – 19/4 – 2010; P (low vc=4,5 m/min), R (high vc=10,2 m/min)
Workpiece P1 – 10% oil concentration (P0.3/W2)
i
j
k
l
Workpiece P2 – 10% oil concentration (P0.3/W2)
i
j
k
l
Workpiece P3 – 10% oil concentration (P0.3/W2)
i
j
k
l

Appendix B: Surface roughness measurement (Profiles) 63
Operator C – 19/4 – 2010; P (low vc=4,5 m/min), R (high vc=10,2 m/min)
Workpiece R1 – 10% oil concentration (R0.3/W2)
i
j
k
l
Workpiece R2 – 10% oil concentration (R0.3/W2)
i
j
k
l
Workpiece R3 – 10% oil concentration (R0.3/W2)
i
j
k
l

Appendix B: Surface roughness measurement (Profiles) 64
Operator C – 19/4 – 2010; P (low vc=4,5 m/min), R (high vc=10,2 m/min)
Workpiece P1 – mineral oil (P0.3/M)
i
j
k
l
Workpiece P2 – mineral oil (P0.3/M)
i
j
k
l
Workpiece P3 – mineral oil (P0.3/M)
i
j
k
l

Appendix B: Surface roughness measurement (Profiles) 65
Operator C – 19/4 – 2010; P (low vc=4,5 m/min), R (high vc=10,2 m/min)
Workpiece R1 – mineral oil (R0.3/M)
i
j
k
l
Workpiece R2 – mineral oil (R0.3/M)
i
j
k
l
Workpiece R3 – mineral oil (R0.3/M)
i
j
k
l

Appendix B: Surface roughness measurement (Profiles) 66
Appendix B4: Surface roughness measurement Operator A: 26/4-2010

Appendix B: Surface roughness measurement (Profiles) 67
Operator A – 26/4 – 2010; P (low vc=4,5 m/min), R (high vc=10,2 m/min)
Workpiece P1 – 1% oil concentration (P0.3/W1)
i
j
k
l
Workpiece P2 – 1% oil concentration (P0.3/W1)
i
j
k
l
Workpiece P3 – 1% oil concentration (P0.3/W1)
i
j
k
l

Appendix B: Surface roughness measurement (Profiles) 68
Operator A – 26/4 – 2010; P (low vc=4,5 m/min), R (high vc=10,2 m/min)
Workpiece R1 – 1% oil concentration (R0.3/W1)
i
j
k
l
Workpiece R2 – 1% oil concentration (R0.3/W1)
i
j
k
l
Workpiece R3 – 1% oil concentration (R0.3/W1)
i
j
k
l

Appendix B: Surface roughness measurement (Profiles) 69
Operator A – 26/4 – 2010; P (low vc=4,5 m/min), R (high vc=10,2 m/min)
Workpiece P1 – 10% oil concentration (P0.3/W2)
i
j
k
l
Workpiece P2 – 10% oil concentration (P0.3/W2)
i
j
k
l
Workpiece P3 – 10% oil concentration (P0.3/W2)
i
j
k
l

Appendix B: Surface roughness measurement (Profiles) 70
Operator A – 26/4 – 2010; P (low vc=4,5 m/min), R (high vc=10,2 m/min)
Workpiece R1 – 10% oil concentration (R0.3/W2)
i
j
k
l
Workpiece R2 – 10% oil concentration (R0.3/W2)
i
j
k
l
Workpiece R3 – 10% oil concentration (R0.3/W2)
i
j
k
l

Appendix B: Surface roughness measurement (Profiles) 71
Operator A – 26/4 – 2010; P (low vc=4,5 m/min), R (high vc=10,2 m/min)
Workpiece P1 – mineral oil (P0.3/M)
i
j
k
l
Workpiece P2 – mineral oil (P0.3/M)
i
j
k
l
Workpiece P3 – mineral oil (P0.3/M)
i
j
k
l

Appendix B: Surface roughness measurement (Profiles) 72
Operator A – 26/4 – 2010; P (low vc=4,5 m/min), R (high vc=10,2 m/min)
Workpiece R1 – mineral oil (R0.3/M)
i
j
k
l
Workpiece R2 – mineral oil (R0.3/M)
i
j
k
l
Workpiece R3 – mineral oil (R0.3/M)
i
j
k
l

Appendix B: Surface roughness measurement (Profiles) 73
Appendix B5: Surface roughness measurement Operator D: 3/5-2010

Appendix B: Surface roughness measurement (Profiles) 74
Operator D – 3/5 – 2010; P (low vc=4,5 m/min), R (high vc=10,2 m/min)
Workpiece P1 – 1% oil concentration (P0.3/W1)
i
j
k
l
Workpiece P2 – 1% oil concentration (P0.3/W1)
i
j
k
l
Workpiece P3 – 1% oil concentration (P0.3/W1)
i
j
k
l

Appendix B: Surface roughness measurement (Profiles) 75
Operator D – 3/5 – 2010; P (low vc=4,5 m/min), R (high vc=10,2 m/min)
Workpiece R1 – 1% oil concentration (R0.3/W1)
i
j
k
l
Workpiece R2 – 1% oil concentration (R0.3/W1)
i
j
k
l
Workpiece R3 – 1% oil concentration (R0.3/W1)
i
j
k
l

Appendix B: Surface roughness measurement (Profiles) 76
Operator D – 3/5 – 2010; P (low vc=4,5 m/min), R (high vc=10,2 m/min)
Workpiece P1 – 10% oil concentration (P0.3/W2)
i
j
k
l
Workpiece P2 – 10% oil concentration (P0.3/W2)
i
j
k
l
Workpiece P3 – 10% oil concentration (P0.3/W2)
i
j
k
l

Appendix B: Surface roughness measurement (Profiles) 77
Operator D – 3/5 – 2010; P (low vc=4,5 m/min), R (high vc=10,2 m/min)
Workpiece R1 – 10% oil concentration (R0.3/W2)
i
j
k
l
Workpiece R2 – 10% oil concentration (R0.3/W2)
i
j
k
l
Workpiece R3 – 10% oil concentration (R0.3/W2)
i
j
k
l

Appendix B: Surface roughness measurement (Profiles) 78
Operator D – 3/5 – 2010; P (low vc=4,5 m/min), R (high vc=10,2 m/min)
Workpiece P1 – mineral oil (P0.3/M)
i
j
k
l
Workpiece P2 – mineral oil (P0.3/M)
i
j
k
l
Workpiece P3 – mineral oil (P0.3/M)
i
j
k
l

Appendix B: Surface roughness measurement (Profiles) 79
Operator D – 3/5 – 2010; P (low vc=4,5 m/min), R (high vc=10,2 m/min)
Workpiece R1 – mineral oil (R0.3/M)
i
j
k
l
Workpiece R2 – mineral oil (R0.3/M)
i
j
k
l
Workpiece R3 – mineral oil (R0.3/M)
i
j
k
l

Appendix B: Surface roughness measurement (Profiles) 80
Appendix B6: Surface roughness measurement Operator F: 22/6-2010

Appendix B: Surface roughness measurement (Profiles) 81
Operator F – 22/6 – 2010; P (low vc=4,5 m/min)
Workpiece P1 – neat oil (P0.3/N)
i
j
k
l
Workpiece P2 – neat oil (P0.3/N)
i
j
k
l
Workpiece P3 – neat oil (P0.3/N)
i
j
k
l

Appendix B: Surface roughness measurement (Profiles) 82
Appendix B7: Surface roughness measurement Operator G: 22/6-2010

Appendix B: Surface roughness measurement (Profiles) 83
Operator G – 22/6 – 2010; P (low vc=4,5 m/min)
Workpiece P1 – neat oil (P0.2/N)
i
j
k
l
Workpiece P2 – neat oil (P0.2/N)
i
j
k
l
Workpiece P3 – neat oil (P0.2/N)
i
j
k
l

Appendix C
2D reference measurements
Appendix C contains profiles of 2D reference measurements which were performed byRene Sobiecki. The two reference instruments were Form TalySurf 2 and RTH TalySurf5-120, both from Taylor Hobson.
Table C.1: Workpieces measured using Form TalySurf 2.Operator Date WP indication Lubrication CodeC 19.4.2010 P2 W1 P/W1C 19.4.2010 P1 W2 P/W2C 19.4.2010 P1 M P/MF 22.6.2010 P2 N P0.3/NG 22.6.2010 P2 N P0.2/N
Table C.2: Workpieces measured using RTH TalySurf 5-120.Operator Date WP indication Lubrication CodeE 23.3.2010 P3 W1 P/W1E 23.3.2010 P1 W2 P/W2E 23.3.2010 P3 M P/MF 22.6.2010 P3 N P0.3/NG 22.6.2010 P3 N P0.2/N
P: Low speed, 4.5 m/min
Feed, 0.3 mm/rev (operators C, E and F)Feed, 0.2 mm/rev (operator G)
84

Appendix C: 2D reference measurement 85
Reference surface roughness instrument: Form TalySurf Series 2, Taylor Hobson
Operator C, Date: 19.4.2010, Workpiece P2 – 1% oil concentration (P0.3/W1)
a
b
c

Appendix C: 2D reference measurement 86
Operator C, Date: 19.4.2010, Workpiece P1 – 10% oil concentration (P0.3/W2)
a
b
c

Appendix C: 2D reference measurement 87
Operator C, Date: 19.4.2010, Workpiece P1 –oil (P0.3/M)
a
b
c

Appendix C: 2D reference measurement 88
Operator F, Date: 22.6.2010, Workpiece P2 – neat oil (P0.3/N)
a
b
c

Appendix C: 2D reference measurement 89
Operator G, Date: 22.6.2010, Workpiece P2 – neat oil (P0.2/N)
a
b
c

Appendix C: 2D reference measurement 90
Reference surface roughness instrument: RTH TalySurf 5-120, Taylor Hobson
Operator E, Date: 23.3.2010, Workpiece P3 – 1% oil concentration (P0.3/W1)
a
b
c

Appendix C: 2D reference measurement 91
Operator E, Date: 23.3.2010, Workpiece P1 – 10% oil concentration (P0.3/W2)
a
b
c

Appendix C: 2D reference measurement 92
Operator E, Date: 23.3.2010, Workpiece P3 –oil (P0.3/M)
a
b
c

Appendix C: 2D reference measurement 93
Operator F, Date: 22.6.2010, Workpiece P3 – neat oil (P0.3/N)
a
b
c

Appendix C: 2D reference measurement 94
Operator G, Date: 22.6.2010, Workpiece P3 – neat oil (P0.2/N)
a
b
c

Appendix D
3D reference measurements
Appendix D contains profiles of 3D reference measurements which were performed byRene Sobiecki. The instrument was TalySurf 2, Taylor Hobson.
Table D.1: Measured workpieces.Operator Date WP indication Lubrication CodeC 19.4.2010 P2 W1 P/W1C 19.4.2010 P1 W2 P/W2C 19.4.2010 P1 M P/MF 22.6.2010 P2 N P0.3/NG 22.6.2010 P2 N P0.2/N
Numbers 1, 2, 3 in the table starting on the following page correspond to a following:
• 1 - top view
• 2 - 3D view
• 3 - bearing ratio curve
Measuring strategy is according to Figure 2.6(d).
P: Low speed, 4.5 m/min
Feed, 0.3 mm/rev (operators C and F)Feed, 0.2 mm/rev (operator G)
95

Appendix D: 3D reference measurement 96
Operator C, Date: 19.4.2010, Workpiece P2 – 1% oil concentration (P0.3/W1)
1
2
3

Appendix D: 3D reference measurement 97
Operator C, Date: 19.4.2010, Workpiece P1 – 10% oil concentration (P0.3/W2)
1
2
3

Appendix D: 3D reference measurement 98
Operator C, Date: 19.4.2010, Workpiece P1 –mineral oil (P0.3/M)
1
2
3

Appendix D: 3D reference measurement 99
Operator F, Date: 22.6.2010, Workpiece P2 – neat oil (P0.3/N)
1
2
3

Appendix D: 3D reference measurement 100
Operator G, Date: 22.6.2010, Workpiece P2 – neat oil (P0.2/N)
1
2
3

Appendix E
Surface roughness profiles as feedmarks from a cutting tool
Appendix E contains profiles of a length 0.3 mm corresponding to a feed mark from thecutting tool. The correct feed was however measured to be 0.279 mm/rev as explainedin Section 2.5.
Table E.1: Selected profiles for two lubrications.Lubrication W1 MOperator WP Profile # WP Profile #B P3 4 P3 2
R3 3 R1 4C P2 4 P1 3
R2 4 R1 1A P1 2 P3 4
R2 2 R1 1D P2 2 P1 1
R3 1 R1 1
P: Low speed, 4.5 m/minR: High speed, 10.2 m/min
Feed, 0.3 mm/rev
101

Appendix E: Feed marks 102
Appendix E1: Surface roughness profiles
corresponding to feed marks of a cutting
tool – W1 lubrication

Appendix E: Feed marks 103
Operator B, Date: 12.4.2010, Workpiece P3 – 1% oil concentration (P0.3/W1)
Operator B, Date: 12.4.2010, Workpiece R3 – 1% oil concentration (R0.3/W1)
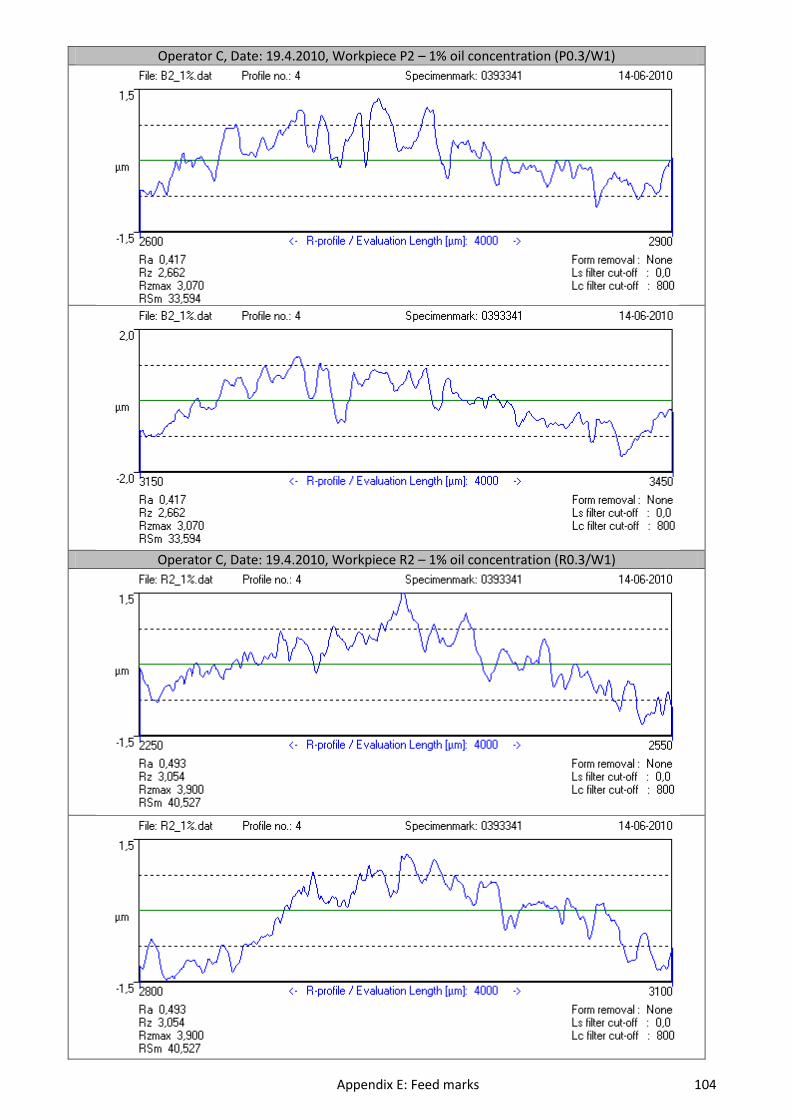
Appendix E: Feed marks 104
Operator C, Date: 19.4.2010, Workpiece P2 – 1% oil concentration (P0.3/W1)
Operator C, Date: 19.4.2010, Workpiece R2 – 1% oil concentration (R0.3/W1)

Appendix E: Feed marks 105
Operator A, Date: 26.4.2010, Workpiece P1 – 1% oil concentration (P0.3/W1)
Operator A, Date: 26.4.2010, Workpiece R2 – 1% oil concentration (R0.3/W1)

Appendix E: Feed marks 106
Operator D, Date: 3.5.2010, Workpiece P2 – 1% oil concentration (P0.3/W1)
Operator D, Date: 3.5.2010, Workpiece R3 – 1% oil concentration (R0.3/W1)

Appendix E: Feed marks 107
Appendix E2: Surface roughness profiles
corresponding to feed marks of a cutting
tool – M lubrication

Appendix E: Feed marks 108
Operator B, Date: 12.4.2010, Workpiece P3 –oil (P0.3/M)
Operator B, Date: 12.4.2010, Workpiece R3 – oil (R0.3/M)

Appendix E: Feed marks 109
Operator C, Date: 19.4.2010, Workpiece P1 – oil (P0.3/M)
Operator C, Date: 19.4.2010, Workpiece R1 –oil (R0.3/M)

Appendix E: Feed marks 110
Operator A, Date: 26.4.2010, Workpiece P3 – oil (P0.3/M)
Operator A, Date: 26.4.2010, Workpiece R1 – oil (R0.3/M)

Appendix E: Feed marks 111
Operator D, Date: 3.5.2010, Workpiece P1 – 1% oil (P0.3/M)
Operator D, Date: 3.5.2010, Workpiece R1 – oil (R0.3/M)

Appendix F
Measurements on the 3D opticalmicroscope
Appendix F contains profiles of 3D surface profiles. The instrument was a 3D opticalmicroscope InfiniteFocus, Alicona.
Table F.1: Workpieces measured.Group Date WP indication Lubrication CodeC 19.4.2010 P2 W1 P/W1C 19.4.2010 R2 W1 R/W1C 19.4.2010 P1 W2 P/W2C 19.4.2010 R3 W2 R/W2C 19.4.2010 P1 M P/MC 19.4.2010 R1 M R/MF 22.6.2010 P2 N P0.3/NG 22.6.2010 P2 N P0.2/N
Numbers 1, 2 in the table starting on the following page correspond to a following:
• 1 - 3D view
• 2 - bearing ratio curve
The measured area was 287 x 218 µm. Measuring strategy is in more details explained inSection 2.3.3.
P: Low speed, 4.5 m/minR: High speed, 10.2 m/min
Feed, 0.3 mm/rev (operators C and F)Feed, 0.2 mm/rev (operator G)
112

Appendix F: 3D optical measurements on Alicona 113
P/W1
Group C, Date: 19.4.2010, Workpiece P2 – 1% oil concentration (P0.3/W1)
1
2

Appendix F: 3D optical measurements on Alicona 114
R/W1
Group C, Date: 19.4.2010, Workpiece R2 – 1% oil concentration (R0.3/W2)
1
2

Appendix F: 3D optical measurements on Alicona 115
P/W2
Group C, Date: 19.4.2010, Workpiece P1 – 10% oil concentration (P0.3/W2)
1
2

Appendix F: 3D optical measurements on Alicona 116
R/W2
Group C, Date: 19.4.2010, Workpiece R3 – 10% oil concentration (R0.3/W2)
1
2

Appendix F: 3D optical measurements on Alicona 117
P/M
Group C, Date: 19.4.2010, Workpiece P1 –mineral oil (P0.3/M)
1
2

Appendix F: 3D optical measurements on Alicona 118
R/M
Group C, Date: 19.4.2010, Workpiece R1 –mineral oil (R0.3/M)
1
2

Appendix F: 3D optical measurements on Alicona 119
P0.3/N
Group C, Date: 19.4.2010, Workpiece P2 – neat oil (P0.3/N)
1
2

Appendix F: 3D optical measurements on Alicona 120
P0.2/N
Group C, Date: 19.4.2010, Workpiece P2 – neat oil (P0.2/N)
1
2

Appendix G
Frequency analysis
Appendix G contains frequency analysis profiles of reamed holes from all the operators(i.e. E, A, B, C, D, F, G). Graphs are plotted in linear and logarithmic scales. Each graphrepresents an average of four profiles which are taken around the hole circumference.
121

Appendix G: Frequency analysis - FFT 122
Appendix G1: Frequency analysis
Operator E: 23/03-2010

Appendix G: Frequency analysis - FFT 123
23.3. Operator E – low speed, feed 0.3mm/rev – linear scale
P_1% P_10% P_oil
Wp1
Wp2
Wp3
500 200 100 50 200
0.05
0.1
0.15
0.2
0.25
0.3
0.35
0.4
Wavelength ( m)
RM
S (
m)
Spectral analysis using Fast Fourier Transform
500 200 100 50 200
0.05
0.1
0.15
0.2
0.25
0.3
0.35
0.4
Wavelength ( m)
RM
S (
m)
Spectral analysis using Fast Fourier Transform
500 200 100 50 200
0.05
0.1
0.15
0.2
0.25
0.3
0.35
0.4
Wavelength ( m)
RM
S (
m)
Spectral analysis using Fast Fourier Transform
500 200 100 50 200
0.05
0.1
0.15
0.2
0.25
0.3
0.35
0.4
Wavelength ( m)
RM
S (
m)
Spectral analysis using Fast Fourier Transform
500 200 100 50 200
0.05
0.1
0.15
0.2
0.25
0.3
0.35
0.4
Wavelength ( m)
RM
S (
m)
Spectral analysis using Fast Fourier Transform
500 200 100 50 200
0.05
0.1
0.15
0.2
0.25
0.3
0.35
0.4
Wavelength ( m)
RM
S (
m)
Spectral analysis using Fast Fourier Transform
500 200 100 50 200
0.05
0.1
0.15
0.2
0.25
0.3
0.35
0.4
Wavelength ( m)
RM
S (
m)
Spectral analysis using Fast Fourier Transform
500 200 100 50 200
0.05
0.1
0.15
0.2
0.25
0.3
0.35
0.4
Wavelength ( m)
RM
S (
m)
Spectral analysis using Fast Fourier Transform
500 200 100 50 200
0.05
0.1
0.15
0.2
0.25
0.3
0.35
0.4
Wavelength ( m)
RM
S (
m)
Spectral analysis using Fast Fourier Transform

Appendix G: Frequency analysis - FFT 124
23.3. Operator E – low speed, feed 0.3mm/rev – log scale
P_1% P_10% P_oil
Wp1
Wp2
Wp3
500 200 100 50 200.002
0.005
0.01
0.02
0.05
0.1
0.2
Wavelength ( m)
RM
S (
m)
Spectral analysis using Fast Fourier Transform
500 200 100 50 200.002
0.005
0.01
0.02
0.05
0.1
0.2
Wavelength ( m)
RM
S (
m)
Spectral analysis using Fast Fourier Transform
500 200 100 50 200.002
0.005
0.01
0.02
0.05
0.1
0.2
Wavelength ( m)
RM
S (
m)
Spectral analysis using Fast Fourier Transform
500 200 100 50 200.002
0.005
0.01
0.02
0.05
0.1
0.2
Wavelength ( m)
RM
S (
m)
Spectral analysis using Fast Fourier Transform
500 200 100 50 200.002
0.005
0.01
0.02
0.05
0.1
0.2
Wavelength ( m)
RM
S (
m)
Spectral analysis using Fast Fourier Transform
500 200 100 50 200.002
0.005
0.01
0.02
0.05
0.1
0.2
Wavelength ( m)
RM
S (
m)
Spectral analysis using Fast Fourier Transform
500 200 100 50 200.002
0.005
0.01
0.02
0.05
0.1
0.2
Wavelength ( m)
RM
S (
m)
Spectral analysis using Fast Fourier Transform
500 200 100 50 200.002
0.005
0.01
0.02
0.05
0.1
0.2
Wavelength ( m)
RM
S (
m)
Spectral analysis using Fast Fourier Transform
500 200 100 50 200.002
0.005
0.01
0.02
0.05
0.1
0.2
Wavelength ( m)
RM
S (
m)
Spectral analysis using Fast Fourier Transform

Appendix G: Frequency analysis - FFT 125
23.3. Operator E – high speed, feed 0.3mm/rev –linear scale
R_1% R_10% R_oil
Wp1
Wp2
Wp3
500 200 100 50 200
0.05
0.1
0.15
0.2
0.25
0.3
0.35
0.4
Wavelength ( m)
RM
S (
m)
Spectral analysis using Fast Fourier Transform
500 200 100 50 200
0.05
0.1
0.15
0.2
0.25
0.3
0.35
0.4
Wavelength ( m)
RM
S (
m)
Spectral analysis using Fast Fourier Transform
500 200 100 50 200
0.05
0.1
0.15
0.2
0.25
0.3
0.35
0.4
Wavelength ( m)
RM
S (
m)
Spectral analysis using Fast Fourier Transform
500 200 100 50 200
0.05
0.1
0.15
0.2
0.25
0.3
0.35
0.4
Wavelength ( m)
RM
S (
m)
Spectral analysis using Fast Fourier Transform
500 200 100 50 200
0.05
0.1
0.15
0.2
0.25
0.3
0.35
0.4
Wavelength ( m)
RM
S (
m)
Spectral analysis using Fast Fourier Transform
500 200 100 50 200
0.05
0.1
0.15
0.2
0.25
0.3
0.35
0.4
Wavelength ( m)
RM
S (
m)
Spectral analysis using Fast Fourier Transform
500 200 100 50 200
0.05
0.1
0.15
0.2
0.25
0.3
0.35
0.4
Wavelength ( m)
RM
S (
m)
Spectral analysis using Fast Fourier Transform
500 200 100 50 200
0.05
0.1
0.15
0.2
0.25
0.3
0.35
0.4
Wavelength ( m)
RM
S (
m)
Spectral analysis using Fast Fourier Transform
500 200 100 50 200
0.05
0.1
0.15
0.2
0.25
0.3
0.35
0.4
Wavelength ( m)
RM
S (
m)
Spectral analysis using Fast Fourier Transform

Appendix G: Frequency analysis - FFT 126
23.3. Operator E – high speed, feed 0.3mm/rev – log scale
R_1% R_10% R_oil
Wp1
Wp2
Wp3
500 200 100 50 200.002
0.005
0.01
0.02
0.05
0.1
0.2
Wavelength ( m)
RM
S (
m)
Spectral analysis using Fast Fourier Transform
500 200 100 50 200.002
0.005
0.01
0.02
0.05
0.1
0.2
Wavelength ( m)
RM
S (
m)
Spectral analysis using Fast Fourier Transform
500 200 100 50 200.002
0.005
0.01
0.02
0.05
0.1
0.2
Wavelength ( m)
RM
S (
m)
Spectral analysis using Fast Fourier Transform
500 200 100 50 200.002
0.005
0.01
0.02
0.05
0.1
0.2
Wavelength ( m)
RM
S (
m)
Spectral analysis using Fast Fourier Transform
500 200 100 50 200.002
0.005
0.01
0.02
0.05
0.1
0.2
Wavelength ( m)
RM
S (
m)
Spectral analysis using Fast Fourier Transform
500 200 100 50 200.002
0.005
0.01
0.02
0.05
0.1
0.2
Wavelength ( m)
RM
S (
m)
Spectral analysis using Fast Fourier Transform
500 200 100 50 200.002
0.005
0.01
0.02
0.05
0.1
0.2
Wavelength ( m)
RM
S (
m)
Spectral analysis using Fast Fourier Transform
500 200 100 50 200.002
0.005
0.01
0.02
0.05
0.1
0.2
Wavelength ( m)
RM
S (
m)
Spectral analysis using Fast Fourier Transform
500 200 100 50 200.002
0.005
0.01
0.02
0.05
0.1
0.2
Wavelength ( m)
RM
S (
m)
Spectral analysis using Fast Fourier Transform

Appendix G: Frequency analysis - FFT 127
Appendix G2: Frequency analysis
Operator C: 19/04-2010

Appendix G: Frequency analysis - FFT 128
19.4. Operator C – low speed, feed 0.3mm/rev –linear scale
P_1% P_10% P_oil
Wp1
Wp2
Wp3
500 200 100 50 200
0.05
0.1
0.15
0.2
0.25
0.3
0.35
0.4
Wavelength ( m)
RM
S (
m)
Spectral analysis using Fast Fourier Transform
500 200 100 50 200
0.05
0.1
0.15
0.2
0.25
0.3
0.35
0.4
Wavelength ( m)
RM
S (
m)
Spectral analysis using Fast Fourier Transform
500 200 100 50 200
0.05
0.1
0.15
0.2
0.25
0.3
0.35
0.4
Wavelength ( m)
RM
S (
m)
Spectral analysis using Fast Fourier Transform
500 200 100 50 200
0.05
0.1
0.15
0.2
0.25
0.3
0.35
0.4
Wavelength ( m)
RM
S (
m)
Spectral analysis using Fast Fourier Transform
500 200 100 50 200
0.05
0.1
0.15
0.2
0.25
0.3
0.35
0.4
Wavelength ( m)
RM
S (
m)
Spectral analysis using Fast Fourier Transform
500 200 100 50 200
0.05
0.1
0.15
0.2
0.25
0.3
0.35
0.4
Wavelength ( m)
RM
S (
m)
Spectral analysis using Fast Fourier Transform
500 200 100 50 200
0.05
0.1
0.15
0.2
0.25
0.3
0.35
0.4
Wavelength ( m)
RM
S (
m)
Spectral analysis using Fast Fourier Transform
500 200 100 50 200
0.05
0.1
0.15
0.2
0.25
0.3
0.35
0.4
Wavelength ( m)
RM
S (
m)
Spectral analysis using Fast Fourier Transform
500 200 100 50 200
0.05
0.1
0.15
0.2
0.25
0.3
0.35
0.4
Wavelength ( m)
RM
S (
m)
Spectral analysis using Fast Fourier Transform

Appendix G: Frequency analysis - FFT 129
19.4. Operator C – low speed, feed 0.3mm/rev – log scale
P_1% P_10% P_oil
Wp1
Wp2
Wp3
500 200 100 50 200.002
0.005
0.01
0.02
0.05
0.1
0.2
Wavelength ( m)
RM
S (
m)
Spectral analysis using Fast Fourier Transform
500 200 100 50 200.002
0.005
0.01
0.02
0.05
0.1
0.2
Wavelength ( m)
RM
S (
m)
Spectral analysis using Fast Fourier Transform
500 200 100 50 200.002
0.005
0.01
0.02
0.05
0.1
0.2
Wavelength ( m)
RM
S (
m)
Spectral analysis using Fast Fourier Transform
500 200 100 50 200.002
0.005
0.01
0.02
0.05
0.1
0.2
Wavelength ( m)
RM
S (
m)
Spectral analysis using Fast Fourier Transform
500 200 100 50 200.002
0.005
0.01
0.02
0.05
0.1
0.2
Wavelength ( m)
RM
S (
m)
Spectral analysis using Fast Fourier Transform
500 200 100 50 200.002
0.005
0.01
0.02
0.05
0.1
0.2
Wavelength ( m)
RM
S (
m)
Spectral analysis using Fast Fourier Transform
500 200 100 50 200.002
0.005
0.01
0.02
0.05
0.1
0.2
Wavelength ( m)
RM
S (
m)
Spectral analysis using Fast Fourier Transform
500 200 100 50 200.002
0.005
0.01
0.02
0.05
0.1
0.2
Wavelength ( m)
RM
S (
m)
Spectral analysis using Fast Fourier Transform
500 200 100 50 200.002
0.005
0.01
0.02
0.05
0.1
0.2
Wavelength ( m)
RM
S (
m)
Spectral analysis using Fast Fourier Transform

Appendix G: Frequency analysis - FFT 130
19.4. Operator C – high speed, feed 0.3mm/rev – linear scale
R_1% R_10% R_oil
Wp1
Wp2
Wp3
500 200 100 50 200
0.05
0.1
0.15
0.2
0.25
0.3
0.35
0.4
Wavelength ( m)
RM
S (
m)
Spectral analysis using Fast Fourier Transform
500 200 100 50 200
0.05
0.1
0.15
0.2
0.25
0.3
0.35
0.4
Wavelength ( m)
RM
S (
m)
Spectral analysis using Fast Fourier Transform
500 200 100 50 200
0.05
0.1
0.15
0.2
0.25
0.3
0.35
0.4
Wavelength ( m)
RM
S (
m)
Spectral analysis using Fast Fourier Transform
500 200 100 50 200
0.05
0.1
0.15
0.2
0.25
0.3
0.35
0.4
Wavelength ( m)
RM
S (
m)
Spectral analysis using Fast Fourier Transform
500 200 100 50 200
0.05
0.1
0.15
0.2
0.25
0.3
0.35
0.4
Wavelength ( m)
RM
S (
m)
Spectral analysis using Fast Fourier Transform
500 200 100 50 200
0.05
0.1
0.15
0.2
0.25
0.3
0.35
0.4
Wavelength ( m)
RM
S (
m)
Spectral analysis using Fast Fourier Transform
500 200 100 50 200
0.05
0.1
0.15
0.2
0.25
0.3
0.35
0.4
Wavelength ( m)
RM
S (
m)
Spectral analysis using Fast Fourier Transform
500 200 100 50 200
0.05
0.1
0.15
0.2
0.25
0.3
0.35
0.4
Wavelength ( m)
RM
S (
m)
Spectral analysis using Fast Fourier Transform
500 200 100 50 200
0.05
0.1
0.15
0.2
0.25
0.3
0.35
0.4
Wavelength ( m)
RM
S (
m)
Spectral analysis using Fast Fourier Transform

Appendix G: Frequency analysis - FFT 131
19.4. Operator C – high speed, feed 0.3mm/rev – log scale
R_1% R_10% R_oil
Wp1
Wp2
Wp3
500 200 100 50 200.002
0.005
0.01
0.02
0.05
0.1
0.2
Wavelength ( m)
RM
S (
m)
Spectral analysis using Fast Fourier Transform
500 200 100 50 200.002
0.005
0.01
0.02
0.05
0.1
0.2
Wavelength ( m)
RM
S (
m)
Spectral analysis using Fast Fourier Transform
500 200 100 50 200.002
0.005
0.01
0.02
0.05
0.1
0.2
Wavelength ( m)
RM
S (
m)
Spectral analysis using Fast Fourier Transform
500 200 100 50 200.002
0.005
0.01
0.02
0.05
0.1
0.2
Wavelength ( m)
RM
S (
m)
Spectral analysis using Fast Fourier Transform
500 200 100 50 200.002
0.005
0.01
0.02
0.05
0.1
0.2
Wavelength ( m)
RM
S (
m)
Spectral analysis using Fast Fourier Transform
500 200 100 50 200.002
0.005
0.01
0.02
0.05
0.1
0.2
Wavelength ( m)
RM
S (
m)
Spectral analysis using Fast Fourier Transform
500 200 100 50 200.002
0.005
0.01
0.02
0.05
0.1
0.2
Wavelength ( m)
RM
S (
m)
Spectral analysis using Fast Fourier Transform
500 200 100 50 200.002
0.005
0.01
0.02
0.05
0.1
0.2
Wavelength ( m)
RM
S (
m)
Spectral analysis using Fast Fourier Transform
500 200 100 50 200.002
0.005
0.01
0.02
0.05
0.1
0.2
Wavelength ( m)
RM
S (
m)
Spectral analysis using Fast Fourier Transform

Appendix G: Frequency analysis - FFT 132
Appendix G3: Frequency analysis
Operator A: 26/04-2010

Appendix G: Frequency analysis - FFT 133
26.4. Operator A – low speed, feed 0.3mm/rev – linear scale
P_1% P_10% P_oil
Wp1
500 200 100 50 200
0.05
0.1
0.15
0.2
0.25
0.3
0.35
0.4
Wavelength ( m)
RM
S (
m)
500 200 100 50 200
0.05
0.1
0.15
0.2
0.25
0.3
0.35
0.4
Wavelength ( m)
RM
S (
m)
500 200 100 50 200
0.05
0.1
0.15
0.2
0.25
0.3
0.35
0.4
Wavelength ( m)
RM
S (
m)
Wp2
500 200 100 50 200
0.05
0.1
0.15
0.2
0.25
0.3
0.35
0.4
Wavelength ( m)
RM
S (
m)
500 200 100 50 200
0.05
0.1
0.15
0.2
0.25
0.3
0.35
0.4
Wavelength ( m)
RM
S (
m)
500 200 100 50 200
0.05
0.1
0.15
0.2
0.25
0.3
0.35
0.4
Wavelength ( m)
RM
S (
m)
Wp3
500 200 100 50 200
0.05
0.1
0.15
0.2
0.25
0.3
0.35
0.4
Wavelength ( m)
RM
S (
m)
500 200 100 50 200
0.05
0.1
0.15
0.2
0.25
0.3
0.35
0.4
Wavelength ( m)
RM
S (
m)
500 200 100 50 200
0.05
0.1
0.15
0.2
0.25
0.3
0.35
0.4
Wavelength ( m)
RM
S (
m)

Appendix G: Frequency analysis - FFT 134
26.4. Operator A – low speed, feed 0.3mm/rev – log scale
P_1% P_10% P_oil
Wp1
500 200 100 50 200.002
0.005
0.01
0.02
0.05
0.1
0.2
Wavelength ( m)
RM
S (
m)
500 200 100 50 20
0.002
0.005
0.01
0.02
0.05
0.1
0.2
Wavelength ( m)
RM
S (
m)
500 200 100 50 20
0.002
0.005
0.01
0.02
0.05
0.1
0.2
Wavelength ( m)
RM
S (
m)
Wp2
500 200 100 50 200.002
0.005
0.01
0.02
0.05
0.1
0.2
Wavelength ( m)
RM
S (
m)
500 200 100 50 20
0.002
0.005
0.01
0.02
0.05
0.1
0.2
Wavelength ( m)
RM
S (
m)
500 200 100 50 20
0.002
0.005
0.01
0.02
0.05
0.1
0.2
Wavelength ( m)
RM
S (
m)
Wp3
500 200 100 50 200.002
0.005
0.01
0.02
0.05
0.1
0.2
Wavelength ( m)
RM
S (
m)
500 200 100 50 20
0.002
0.005
0.01
0.02
0.05
0.1
0.2
Wavelength ( m)
RM
S (
m)
500 200 100 50 20
0.002
0.005
0.01
0.02
0.05
0.1
0.2
Wavelength ( m)
RM
S (
m)

Appendix G: Frequency analysis - FFT 135
26.4. Operator A – high speed, feed 0.3mm/rev –linear scale
R_1% R_10% R_oil
Wp1
500 200 100 50 200
0.05
0.1
0.15
0.2
0.25
0.3
0.35
0.4
Wavelength ( m)
RM
S (
m)
500 200 100 50 200
0.05
0.1
0.15
0.2
0.25
0.3
0.35
0.4
Wavelength ( m)
RM
S (
m)
500 200 100 50 200
0.05
0.1
0.15
0.2
0.25
0.3
0.35
0.4
Wavelength ( m)
RM
S (
m)
Wp2
500 200 100 50 200
0.05
0.1
0.15
0.2
0.25
0.3
0.35
0.4
Wavelength ( m)
RM
S (
m)
500 200 100 50 200
0.05
0.1
0.15
0.2
0.25
0.3
0.35
0.4
Wavelength ( m)
RM
S (
m)
500 200 100 50 200
0.05
0.1
0.15
0.2
0.25
0.3
0.35
0.4
Wavelength ( m)
RM
S (
m)
Wp3
500 200 100 50 200
0.05
0.1
0.15
0.2
0.25
0.3
0.35
0.4
Wavelength ( m)
RM
S (
m)
500 200 100 50 200
0.05
0.1
0.15
0.2
0.25
0.3
0.35
0.4
Wavelength ( m)
RM
S (
m)
500 200 100 50 200
0.05
0.1
0.15
0.2
0.25
0.3
0.35
0.4
Wavelength ( m)
RM
S (
m)

Appendix G: Frequency analysis - FFT 136
26.4. Operator A – high speed, feed 0.3mm/rev – log scale
R_1% R_10% R_oil
Wp1
500 200 100 50 200.002
0.005
0.01
0.02
0.05
0.1
0.2
Wavelength ( m)
RM
S (
m)
500 200 100 50 20
0.002
0.005
0.01
0.02
0.05
0.1
0.2
Wavelength ( m)
RM
S (
m)
500 200 100 50 20
0.002
0.005
0.01
0.02
0.05
0.1
0.2
Wavelength ( m)
RM
S (
m)
Wp2
500 200 100 50 200.002
0.005
0.01
0.02
0.05
0.1
0.2
Wavelength ( m)
RM
S (
m)
500 200 100 50 20
0.002
0.005
0.01
0.02
0.05
0.1
0.2
Wavelength ( m)
RM
S (
m)
500 200 100 50 20
0.002
0.005
0.01
0.02
0.05
0.1
0.2
Wavelength ( m)
RM
S (
m)
Wp3
500 200 100 50 200.002
0.005
0.01
0.02
0.05
0.1
0.2
Wavelength ( m)
RM
S (
m)
500 200 100 50 20
0.002
0.005
0.01
0.02
0.05
0.1
0.2
Wavelength ( m)
RM
S (
m)
500 200 100 50 20
0.002
0.005
0.01
0.02
0.05
0.1
0.2
Wavelength ( m)
RM
S (
m)

Appendix G: Frequency analysis - FFT 137
Appendix G4: Frequency analysis
Operator B: 12/04-2010

Appendix G: Frequency analysis - FFT 138
12.4. Operator B – low speed, feed 0.3mm/rev – linear scale
P_1% P_10% P_oil
Wp1
500 200 100 50 200
0.05
0.1
0.15
0.2
0.25
0.3
0.35
0.4
Wavelength ( m)
RM
S (
m)
500 200 100 50 200
0.05
0.1
0.15
0.2
0.25
0.3
0.35
0.4
Wavelength ( m)
RM
S (
m)
500 200 100 50 200
0.05
0.1
0.15
0.2
0.25
0.3
0.35
0.4
Wavelength ( m)
RM
S (
m)
Wp2
500 200 100 50 200
0.05
0.1
0.15
0.2
0.25
0.3
0.35
0.4
Wavelength ( m)
RM
S (
m)
500 200 100 50 200
0.05
0.1
0.15
0.2
0.25
0.3
0.35
0.4
Wavelength ( m)
RM
S (
m)
500 200 100 50 200
0.05
0.1
0.15
0.2
0.25
0.3
0.35
0.4
Wavelength ( m)
RM
S (
m)
Wp3
500 200 100 50 200
0.05
0.1
0.15
0.2
0.25
0.3
0.35
0.4
Wavelength ( m)
RM
S (
m)
500 200 100 50 200
0.05
0.1
0.15
0.2
0.25
0.3
0.35
0.4
Wavelength ( m)
RM
S (
m)
500 200 100 50 200
0.05
0.1
0.15
0.2
0.25
0.3
0.35
0.4
Wavelength ( m)
RM
S (
m)

Appendix G: Frequency analysis - FFT 139
12.4. Operator B – low speed, feed 0.3mm/rev – log scale
P_1% P_10% P_oil
Wp1
500 200 100 50 200.002
0.005
0.01
0.02
0.05
0.1
0.2
Wavelength ( m)
RM
S (
m)
500 200 100 50 20
0.002
0.005
0.01
0.02
0.05
0.1
0.2
Wavelength ( m)
RM
S (
m)
500 200 100 50 20
0.002
0.005
0.01
0.02
0.05
0.1
0.2
Wavelength ( m)
RM
S (
m)
Wp2
500 200 100 50 200.002
0.005
0.01
0.02
0.05
0.1
0.2
Wavelength ( m)
RM
S (
m)
500 200 100 50 20
0.002
0.005
0.01
0.02
0.05
0.1
0.2
Wavelength ( m)
RM
S (
m)
500 200 100 50 20
0.002
0.005
0.01
0.02
0.05
0.1
0.2
Wavelength ( m)
RM
S (
m)
Wp3
500 200 100 50 200.002
0.005
0.01
0.02
0.05
0.1
0.2
Wavelength ( m)
RM
S (
m)
500 200 100 50 20
0.002
0.005
0.01
0.02
0.05
0.1
0.2
Wavelength ( m)
RM
S (
m)
500 200 100 50 20
0.002
0.005
0.01
0.02
0.05
0.1
0.2
Wavelength ( m)
RM
S (
m)

Appendix G: Frequency analysis - FFT 140
12.4. Operator B – high speed, feed 0.3mm/rev – linear scale
R_1% R_10% R_oil
Wp1
500 200 100 50 200
0.05
0.1
0.15
0.2
0.25
0.3
0.35
0.4
Wavelength ( m)
RM
S (
m)
500 200 100 50 200
0.05
0.1
0.15
0.2
0.25
0.3
0.35
0.4
Wavelength ( m)
RM
S (
m)
500 200 100 50 200
0.05
0.1
0.15
0.2
0.25
0.3
0.35
0.4
Wavelength ( m)
RM
S (
m)
Wp2
500 200 100 50 200
0.05
0.1
0.15
0.2
0.25
0.3
0.35
0.4
Wavelength ( m)
RM
S (
m)
500 200 100 50 200
0.05
0.1
0.15
0.2
0.25
0.3
0.35
0.4
Wavelength ( m)
RM
S (
m)
500 200 100 50 200
0.05
0.1
0.15
0.2
0.25
0.3
0.35
0.4
Wavelength ( m)
RM
S (
m)
Wp3
500 200 100 50 200
0.05
0.1
0.15
0.2
0.25
0.3
0.35
0.4
Wavelength ( m)
RM
S (
m)
500 200 100 50 200
0.05
0.1
0.15
0.2
0.25
0.3
0.35
0.4
Wavelength ( m)
RM
S (
m)
500 200 100 50 200
0.05
0.1
0.15
0.2
0.25
0.3
0.35
0.4
Wavelength ( m)
RM
S (
m)

Appendix G: Frequency analysis - FFT 141
12.4. Operator B – high speed, feed 0.3mm/rev – log scale
R_1% R_10% R_oil
Wp1
500 200 100 50 200.002
0.005
0.01
0.02
0.05
0.1
0.2
Wavelength ( m)
RM
S (
m)
500 200 100 50 20
0.002
0.005
0.01
0.02
0.05
0.1
0.2
Wavelength ( m)
RM
S (
m)
500 200 100 50 20
0.002
0.005
0.01
0.02
0.05
0.1
0.2
Wavelength ( m)
RM
S (
m)
Wp2
500 200 100 50 200.002
0.005
0.01
0.02
0.05
0.1
0.2
Wavelength ( m)
RM
S (
m)
500 200 100 50 20
0.002
0.005
0.01
0.02
0.05
0.1
0.2
Wavelength ( m)
RM
S (
m)
500 200 100 50 20
0.002
0.005
0.01
0.02
0.05
0.1
0.2
Wavelength ( m)
RM
S (
m)
Wp3
500 200 100 50 200.002
0.005
0.01
0.02
0.05
0.1
0.2
Wavelength ( m)
RM
S (
m)
500 200 100 50 20
0.002
0.005
0.01
0.02
0.05
0.1
0.2
Wavelength ( m)
RM
S (
m)
500 200 100 50 20
0.002
0.005
0.01
0.02
0.05
0.1
0.2
Wavelength ( m)
RM
S (
m)

Appendix G: Frequency analysis - FFT 142
Appendix G5: Frequency analysis
Operator D: 03/05-2010

Appendix G: Frequency analysis - FFT 143
3.5. Operator D – low speed, feed 0.3mm/rev – linear scale
P_1% P_10% P_oil
Wp1
500 200 100 50 200
0.05
0.1
0.15
0.2
0.25
0.3
0.35
0.4
Wavelength ( m)
RM
S (
m)
500 200 100 50 200
0.05
0.1
0.15
0.2
0.25
0.3
0.35
0.4
Wavelength ( m)
RM
S (
m)
500 200 100 50 200
0.05
0.1
0.15
0.2
0.25
0.3
0.35
0.4
Wavelength ( m)
RM
S (
m)
Wp2
500 200 100 50 200
0.05
0.1
0.15
0.2
0.25
0.3
0.35
0.4
Wavelength ( m)
RM
S (
m)
500 200 100 50 200
0.05
0.1
0.15
0.2
0.25
0.3
0.35
0.4
Wavelength ( m)
RM
S (
m)
500 200 100 50 200
0.05
0.1
0.15
0.2
0.25
0.3
0.35
0.4
Wavelength ( m)
RM
S (
m)
Wp3
500 200 100 50 200
0.05
0.1
0.15
0.2
0.25
0.3
0.35
0.4
Wavelength ( m)
RM
S (
m)
500 200 100 50 200
0.05
0.1
0.15
0.2
0.25
0.3
0.35
0.4
Wavelength ( m)
RM
S (
m)
500 200 100 50 200
0.05
0.1
0.15
0.2
0.25
0.3
0.35
0.4
Wavelength ( m)
RM
S (
m)

Appendix G: Frequency analysis - FFT 144
3.5. Operator D – low speed, feed 0.3mm/rev – log scale
P_1% P_10% P_oil
Wp1
500 200 100 50 200.002
0.005
0.01
0.02
0.05
0.1
0.2
Wavelength ( m)
RM
S (
m)
500 200 100 50 20
0.002
0.005
0.01
0.02
0.05
0.1
0.2
Wavelength ( m)
RM
S (
m)
500 200 100 50 20
0.002
0.005
0.01
0.02
0.05
0.1
0.2
Wavelength ( m)
RM
S (
m)
Wp2
500 200 100 50 200.002
0.005
0.01
0.02
0.05
0.1
0.2
Wavelength ( m)
RM
S (
m)
500 200 100 50 20
0.002
0.005
0.01
0.02
0.05
0.1
0.2
Wavelength ( m)
RM
S (
m)
500 200 100 50 20
0.002
0.005
0.01
0.02
0.05
0.1
0.2
Wavelength ( m)
RM
S (
m)
Wp3
500 200 100 50 200.002
0.005
0.01
0.02
0.05
0.1
0.2
Wavelength ( m)
RM
S (
m)
500 200 100 50 20
0.002
0.005
0.01
0.02
0.05
0.1
0.2
Wavelength ( m)
RM
S (
m)
500 200 100 50 20
0.002
0.005
0.01
0.02
0.05
0.1
0.2
Wavelength ( m)
RM
S (
m)

Appendix G: Frequency analysis - FFT 145
3.5. Operator D – high speed, feed 0.3mm/rev – linear scale
R_1% R_10% R_oil
Wp1
500 200 100 50 200
0.05
0.1
0.15
0.2
0.25
0.3
0.35
0.4
Wavelength ( m)
RM
S (
m)
500 200 100 50 200
0.05
0.1
0.15
0.2
0.25
0.3
0.35
0.4
Wavelength ( m)
RM
S (
m)
500 200 100 50 200
0.05
0.1
0.15
0.2
0.25
0.3
0.35
0.4
Wavelength ( m)
RM
S (
m)
Wp2
500 200 100 50 200
0.05
0.1
0.15
0.2
0.25
0.3
0.35
0.4
Wavelength ( m)
RM
S (
m)
500 200 100 50 200
0.05
0.1
0.15
0.2
0.25
0.3
0.35
0.4
Wavelength ( m)
RM
S (
m)
500 200 100 50 200
0.05
0.1
0.15
0.2
0.25
0.3
0.35
0.4
Wavelength ( m)
RM
S (
m)
Wp3
500 200 100 50 200
0.05
0.1
0.15
0.2
0.25
0.3
0.35
0.4
Wavelength ( m)
RM
S (
m)
500 200 100 50 200
0.05
0.1
0.15
0.2
0.25
0.3
0.35
0.4
Wavelength ( m)
RM
S (
m)
500 200 100 50 200
0.05
0.1
0.15
0.2
0.25
0.3
0.35
0.4
Wavelength ( m)
RM
S (
m)

Appendix G: Frequency analysis - FFT 146
3.5. Operator D – high speed, feed 0.3mm/rev – log scale
R_1% R_10% R_oil
Wp1
500 200 100 50 200.002
0.005
0.01
0.02
0.05
0.1
0.2
Wavelength ( m)
RM
S (
m)
500 200 100 50 20
0.002
0.005
0.01
0.02
0.05
0.1
0.2
Wavelength ( m)
RM
S (
m)
500 200 100 50 20
0.002
0.005
0.01
0.02
0.05
0.1
0.2
Wavelength ( m)
RM
S (
m)
Wp2
500 200 100 50 200.002
0.005
0.01
0.02
0.05
0.1
0.2
Wavelength ( m)
RM
S (
m)
500 200 100 50 20
0.002
0.005
0.01
0.02
0.05
0.1
0.2
Wavelength ( m)
RM
S (
m)
500 200 100 50 20
0.002
0.005
0.01
0.02
0.05
0.1
0.2
Wavelength ( m)
RM
S (
m)
Wp3
500 200 100 50 200.002
0.005
0.01
0.02
0.05
0.1
0.2
Wavelength ( m)
RM
S (
m)
500 200 100 50 20
0.002
0.005
0.01
0.02
0.05
0.1
0.2
Wavelength ( m)
RM
S (
m)
500 200 100 50 20
0.002
0.005
0.01
0.02
0.05
0.1
0.2
Wavelength ( m)
RM
S (
m)

Appendix G: Frequency analysis - FFT 147
Appendix G6: Frequency analysis
Operator F: 23/06-2010

Appendix G: Frequency analysis - FFT 148
23.6. Operator F – low speed, feed 0.3mm/rev – linear scale
23.6. - Operator F – low speed, feed 0.3mm/rev – log scale
Neat oil – TDN81 Neat oil – TDN81
Wp1
500 200 100 50 200
0.05
0.1
0.15
0.2
0.25
0.3
0.35
0.4
Wavelength ( m)
RM
S (
m)
500 200 100 50 200.002
0.005
0.01
0.02
0.05
0.1
0.2
Wavelength ( m)
RM
S (
m)
Wp2
500 200 100 50 200
0.05
0.1
0.15
0.2
0.25
0.3
0.35
0.4
Wavelength ( m)
RM
S (
m)
500 200 100 50 200.002
0.005
0.01
0.02
0.05
0.1
0.2
Wavelength ( m)
RM
S (
m)
Wp3
500 200 100 50 200
0.05
0.1
0.15
0.2
0.25
0.3
0.35
0.4
Wavelength ( m)
RM
S (
m)
500 200 100 50 200.002
0.005
0.01
0.02
0.05
0.1
0.2
Wavelength ( m)
RM
S (
m)

Appendix G: Frequency analysis - FFT 149
Appendix G7: Frequency analysis
Operator G: 23/06-2010

Appendix G: Frequency analysis - FFT 150
23.6. Operator G – low speed, feed 0.2mm/rev –linear scale
23.6. Operator G – low speed, feed 0.2mm/rev – log scale
Neat oil – TDN81 Neat oil – TDN81
Wp1
500 200 100 50 200
0.05
0.1
0.15
0.2
0.25
0.3
0.35
0.4
Wavelength ( m)
RM
S (
m)
500 200 100 50 200.002
0.005
0.01
0.02
0.05
0.1
0.2
Wavelength ( m)
RM
S (
m)
Wp2
500 200 100 50 200
0.05
0.1
0.15
0.2
0.25
0.3
0.35
0.4
Wavelength ( m)
RM
S (
m)
500 200 100 50 200.002
0.005
0.01
0.02
0.05
0.1
0.2
Wavelength ( m)
RM
S (
m)
Wp3
500 200 100 50 200
0.05
0.1
0.15
0.2
0.25
0.3
0.35
0.4
Wavelength ( m)
RM
S (
m)
500 200 100 50 200.002
0.005
0.01
0.02
0.05
0.1
0.2
Wavelength ( m)
RM
S (
m)

Appendix H
Microhardness measurement
Appendix H contains tables from all microhardness measurements.
Measuring strategy is explained in Section 2.3.4.
151

Appendix H: Microhardness measurement results - Tables 152
Table H1: Microhardness measurement results – P0.3/W1.
Operator E, 23.3.2010, f=0.3mm/rev, reamer Ø10.2mm
P3 / 1% (P0.3/W1)
Distance from the edge [mm]
Repetition 0.05 0.10 0.15 0.30 0.60 1.20 2.40
1 247 217 182 167 169 166 169
2 172 160 166 172 172
3 253 225 180 170 172 172 176
4 197 172 168 169 175
5 290 233 203 168 178 175 175
avg
263.3
225.0
186.8
167.4
170.6
170.8
173.4
std
23.3
8.0
12.8
4.6
4.7
3.4
2.9
Table H2: Microhardness measurement results – P0.3/W2.
Operator E, 23.3.2010, f=0.3mm/rev, reamer Ø10.2mm
P1 / 10% (P0.3/W2)
Distance from the edge [mm]
Repetition 0.05 0.10 0.15 0.30 0.60 1.20 2.40
1 270 251 199 186 168 168 169
2 175 161 165 169 168
3 270 225 182 162 170 172 169
4 196 169 169 169 170
5 260 222 193 169 169 166 165
avg
266.7
232.7
189.0
169.4
168.2
168.8
168.2
std
5.8
15.9
10.1
10.0
1.9
2.2
1.9
Table H3: Microhardness measurement results – P0.3/M.
Operator E, 23.3.2010, f=0.3mm/rev, reamer Ø10.2mm
P1 / mineral oil (P0.3/M)
Distance from the edge [mm]
Repetition 0.05 0.10 0.15 0.30 0.60 1.20 2.40
1 258 212 169 178 179 178 176
2 158 176 169 170 170
3 216 203 167 169 168 175 169
4 170 169 172 166 169
5 233 209 175 167 169 164 170
avg
235.7
208.0
167.8
171.8
171.4
170.6
170.8
std
21.1
4.6
6.2
4.9
4.5
5.9
2.9

Appendix H: Microhardness measurement results - Tables 153
Table H4: Microhardness measurement results – R0.3/W1.
Operator E, 23.3.2010, f=0.3mm/rev, reamer Ø10.2mm
R2 / 1% (R0.3/W1)
Distance from the edge [mm]
Repetition 0.05 0.10 0.15 0.30 0.60 1.20 2.40
1 276 264 201 171 170 169 162
2 192 169 169 162 163
3 297 242 200 170 164 166 166
4 204 162 164 166 166
5 279 235 184 164 166 167 166
avg
284.0
247.0
196.2
167.2
166.6
166.0
164.6
std
11.4
15.1
8.1
4.0
2.8
2.5
1.9
Table H5: Microhardness measurement results – R0.3/W2.
Operator E, 23.3.2010, f=0.3mm/rev, reamer Ø10.2mm
R1 / 10% (R0.3/W2)
Distance from the edge [mm]
Repetition 0.05 0.10 0.15 0.30 0.60 1.20 2.40
1 292 254 186 178 172 172 173
2 186 167 169 176 171
3 260 254 190 179 167 167 171
4 195 176 173 169 172
5 317 245 206 177 175 170 173
avg
289.7
251.0
192.6
175.4
171.2
170.8
172.0
std
28.6
5.2
8.4
4.8
3.2
3.4
1.0
Table H6: Microhardness measurement results – R0.3/M.
Operator E, 23.3.2010, f=0.3mm/rev, reamer Ø10.2mm
R1 / mineral oil (R0.3/M)
Distance from the edge [mm]
Repetition 0.05 0.10 0.15 0.30 0.60 1.20 2.40
1 235 221 178 172 169 172 168
2 170 162 162 169 163
3 227 227 168 166 162 165 172
4 172 167 160 170 167
5 245 221 171 161 164 167 170
avg
235.7
223.0
171.8
165.6
163.4
168.6
168.0
std
9.0
3.5
3.8
4.4
3.4
2.7
3.4

Appendix H: Microhardness measurement results - Tables 154
Table H7: Microhardness measurement results – P0.3/N.
Operator F, 22.6.2010, f=0.3mm/rev, New reamer Ø10.2mm
P2 / neat oil (P0.3/N)
Distance from the edge [mm]
Repetition 0.05 0.10 0.15 0.30 0.60 1.20 2.40
1 260 228 186 170 167 168 170
2 175 174 168 175 172
3 230 199 173 166 166 169 168
4 170 169 169 166 169
5 219 206 173 169 169 165 170
avg
236.3
211.0
175.4
169.6
167.8
168.6
169.8
std
21.2
15.1
6.2
2.9
1.3
3.9
1.5
Table H8: Microhardness measurement results – P0.2/N.
Operator G, 22.6.2010, f=0.2mm/rev, New reamer Ø10.2mm
P2 / neat oil (P0.2/N)
Distance from the edge [mm]
Repetition 0.05 0.10 0.15 0.30 0.60 1.20 2.40
1 266 237 194 181 169 172 169
2 182 173 166 166 168
3 256 212 174 166 164 166 169
4 166 169 162 166 166
5 215 205 169 162 166 167 166
avg
245.7
218.0
177.0
170.2
165.4
167.4
167.6
std
27.0
16.8
11.3
7.3
2.6
2.6
1.5

Appendix I
Calibration certificate
Appendix I contains a calibration certificate for below mentioned specifications:
Object: Roughness Standard ISO 5436 type C
Type: 528 RS-5
Serial number: P1167
Date of calibration: 19.6.2007
155

Kalibreringscertifikat Calibration Certificate
Side 1 af 3 Page 1 of 3 Antal Bilag 1 No of Enclosures 1 Rou07017 Certifikat nr. Certificate No. Rou07017 Objekt Object Ruhedsnormal / Roughness Standard ISO 5436 type C Fabrikant Manufacturer Rubert Type Type 528 RS-5 Serienummer Serial number P1167 Rekvirent Customer Institut for Produktion og Ledelse Produktionstorvet, bygn. 425 2800 Lyngby Kalibreringscertifikatet må kun gengives i uddrag hvis det enten er offentligt tilgængeligt, eller hvis CGM har godkendt uddraget. The calibration certificate may not be reproduced other than in full except with the permission of CGM. Dato for modtagelse Date of receipt 19.06.07 Dato for kalibreringen Date of calibration 19.06.07
Dato for certifikatets udstedelse Date of issue of certificate 24.07.07
Underskrift Signature Jan L. Andreasen Fagligt ansvarlig Signatory, Surface Roughness Calibration
CENTER FOR GEOMETRISK METROLOGI CGM Aps reg. nr. 203.012 CVR-nr. 15498544
Danmarks Tekniske Universitet, Bygning 425, 2800 Lyngby Telefon 45 93 44 41 – Telefax 45 93 01 90
Appendix I: Calibration certificate - Roughness standard 156

Side 2 af 3 Page 2 of 3 Rou07017 Kalibreringsresultater og –usikkerheder. I den efterfølgende tabel er parameterværdier i henhold til ISO 4287-1997 og DIN 4768 angivet. Angivelserne er et gennemsnit af 12 målinger foretaget tilfældigt fordelt på overfladen. Usikkerheden er angivet med faktor k=2 95 % konfidensniveau.
Calibration results and uncertainties. The table below gives the roughness parameters according to ISO 4287-1997 and DIN 4768. The stated values refer to an average of 12 tracings randomly distributed over the measuring area. The uncertainties refer to the factor k=2 95 % confidence level.
P1167
ISO parametre DIN parametre Fasekorrekt filter
Phase correct filter
2RC-filter Usikkerhed Uncertainty
Ra Ra 0.507 0.506 0.013
Rz Rz 1.607 1.605 0.040
Rz1maks Rmax 1.625 1.627 0.041
µm µm µm
Målebetingelser. Measuring conditions. Målingerne er udført med et fritastsystem ifølge procedure RU-534. Tastradius er ca. 2 µm. Målingerne er foretaget ved en temperatur på 20 ± 1°C. Den anvendte software er RCS4G kalibreringssoftware version 2.2. Der er anvendt Ls cut-off 2.5 µm og Lc cut-off filter på 0.8 mm og en evalueringslængde på 4.0 mm.
The measurements were carried out by means of a pick-up system with independent datum in accordance with procedure RU-534. The stylus radius is approx. 2 µm. The measurements were carried out at a temperature of 20 ± 1°C. The software used is RCS4G calibration software Version 2.2. A Ls cut-off filter of 2.5 µm and a Lc cut-off filter of 0.8 mm were used. The evaluation length was 4.0 mm.
Appendix I: Calibration certificate - Roughness standard 157

Side 3 af 3 Page 3 of 3 Rou07017 Måledata. Measuring data. Normalen er målt efter tastsnitmetoden i 12 snit fordelt over målefladen. Den følgende tabel giver parameter værdierne for de 12 aftastninger.
The standard has been measured using the tracing method in 12 traces distributed over the measuring surface. The table below gives the parameter values for the 12 traces.
Fasekorrekt filter
Phase correct filter
2RC-filter
ISO DIN
Ra Ra
Rz Rz
Rz1maks Rmax
Ra Ra
Rz Rz
Rz1maks Rmax
1 0.509 1.622 1.634 0.508 1.613 1.625
2 0.506 1.609 1.663 0.506 1.606 1.654
3 0.510 1.598 1.611 0.510 1.595 1.611
4 0.504 1.597 1.622 0.504 1.601 1.626
5 0.508 1.608 1.618 0.508 1.603 1.613
6 0.508 1.610 1.623 0.508 1.606 1.626
7 0.505 1.603 1.618 0.504 1.600 1.612
8 0.506 1.605 1.613 0.506 1.604 1.609
9 0.509 1.608 1.622 0.508 1.606 1.636
10 0.506 1.610 1.619 0.506 1.604 1.626
11 0.508 1.615 1.640 0.508 1.616 1.649
12 0.500 1.595 1.613 0.500 1.602 1.634 Sporbarhed. Traceability. Kalibreringen er sporbar til: The calibration is traceable to: PTB Kalibreringen er sporbar via normalen: The calibration is traceable through the standard: HALLE no. 826 Med certifikatet: With the certificate: 049 PTB 04 Certifikatet er dateret: The certificate is dated: 11.10.04
Appendix I: Calibration certificate - Roughness standard 158

Side 1 af 1 Page 1 of 1 Rou07017 Vilkår for certifikatet Conditions for the certificate DANAK
Den Danske Akkrediterings- og Metrologifond -DANAK- administrerer den danske akkrediteringsordning på grundlag af en aftale med Sikkerhedsstyrelsen under Økonomi- og Erhvervsministeriet, som er ansvarlig for lovgivningen om akkreditering i Danmark. De grundlæggende akkrediteringskriterier er beskrevet i henholdsvis DS/EN ISO/IEC 17025 "Generelle krav til prøvnings- og ka1ibreringslaboratoners kompetence" og i DS/EN ISO 15189 "Medicinske laboratorier- Særlige krav til kva1itet og kompetence". DANAK anvender fortolkningsdokumenter til de enkelte krav i standarderne, hvor det skønnes nødvendigt. Disse vil hovedsageligt være udarbejdet af "European co-operation for Accreditation (EA)" eller "Internationa1 Laboratory Accreditation Co-operation (ILAC)" med det formå1 at opnå ensartede kriterier for akkreditering på verdensplan. Sikkerhedsstyrelsen udsteder desuden tekniske forskrifter udarbejdet af DANAK vedr. specifikke krav til akkreditering, som ikke er indeholdt i standarderne. For at et laboratorium kan være akkrediteret kræves blandt andet: at laboratoriet og dets personale skal være fri for enhver
kommerciel, økonomisk eller anden form for pression, som kan påvirke deres uvildighed,
at laboratoriet har et dokumenteret ledelsessystem og en ledelse,
der kan sikre, at dette følges og vedligeholdes, at laboratoriet råder over teknisk udstyr og lokaler af en
tilstrækkelig standard til at kunne udføre den ydelse, som laboratoriet er akkrediteret til,
at laboratoriet råder over personale med såvel faglig kompetence
som praktisk erfaring i udførelsen af de ydelser, som laboratoriet er akkrediteret til,
at der er indarbejdet faste rutiner for sporbarhed og
usikkerhedsbestemmelse, at akkrediteret prøvning, kalibrering eller medicinsk undersøgelse
udføres efter fuldt validerede og dokumenterede metoder, at akkrediterede ydelser udføres og rapporteres i fortrolighed med
rekvirenten og i overensstemmelse med dennes behov, at laboratoriet skal registrere forløbet af akkrediteret prøvning,
kalibrering eller medicinsk undersøgelse således, at dette kan rekonstrueres, at laboratoriet er underkastet regelmæssigt tilsyn af DANAK, at laboratoriet skal have en forsikring, som kan dække laboratoriets
ansvar i forbindelse med udførelsen af akkrediterede ydelser. Rapporter, der bærer DANAK's akkrediteringsmærke, anvendes ved rapportering af akkrediterede ydelser og viser, at disse er foretaget i henhold til akkrediteringsreglerne.
DANAK
The Danish Accreditation and Metrology Fund -DANAK -is managing the Danish accreditation scheme based on a contract with the Danish Safety Technology Authority under the Danish Ministry of Economics and Business Affairs who is responsible for the legislation on accreditation in Denmark. The fundamental criteria for accreditation are described in DS/EN ISO/IEC 17025: "General requirements for the competence of testing and calibration laboratories", and in DS/EN ISO/IEC 15189 "Medical laboratories -Particular requirements for quality and competence" respectively. DANAK uses guidance documents to clarify the requirements in the standards, where this is considered to be necessary.. These will mainly be drawn up by the "European co-operation for Accreditation (EA)" or the "International Laboratory Accreditation Co-operation (ILAC)" with a view to obtaining uniform criteria for accreditation worldwide. In addition, the Danish Safety Technology Authority issues Technical Regulations prepared by DANAK with specific requirements for accreditation that are not contained in the standards. In order for a laboratory to be accredited it is, among other things, required: that the laboratory and its personnel are free from any commercial,
financial or other pressures, which might influence their impartiality; that the laboratory operates a documented management system, and
has a management that ensures that the system is followed and maintained; that the laboratory has at its disposal all items of equipment,
facilities and premises required for correct performance of the service that it is accredited to perform;
that the laboratory has at its disposal personnel with technical
competence and practical experience in performing the services that they are accredited to perform;
that the laboratory has procedures for traceability and uncertainty
calculations; that accredited testing, calibration or medical examination are
performed in accordance with fully validated and documented methods; that accredited services are performed and reported in
confidentiality with the customer and in compliance with the customer’s request;
that the laboratory keeps records which contain sufficient
information to permit repetition of the accredited test, calibration or medical examination;
that the laboratory is subject to surveillance by DANAK on a
regular basis; that the laboratory shall take out an insurance, which covers
liability in connection with the performance of accredited services. Reports carrying DANAK' s accreditation mark are used when reporting accredited services and show that these have been performed in accordance with the rules for accreditation.
Appendix I: Calibration certificate - Roughness standard 159

Appendix J
Surface roughness profiles in theiroriginal format
Appendix J contains profiles from all the operators (i.e. E, A, B, C, D, F, G). The instrumentwas Surtronic 4+, Taylor Hobson.
Four profiles on each page correspond to four profiles taken around the hole circumfer-ence.
P: Low speed, 4.5 m/minR: High speed, 10.2 m/min
Feed, 0.3 mm/rev (operators A, B, C, D, E and F)Feed, 0.2 mm/rev (operator G)
160

Appendix J: Surface roughness profiles 161
Appendix J1: Surface roughness measurement Operator E: 23/03-2010

Appendix J: Surface roughness profiles 162
Operator E – 23/03 – 2010; P (low vc=4,5 m/min), R (high vc=10,2 m/min)
Workpiece P1 – 1% oil concentration (P0.3/W1)

Appendix J: Surface roughness profiles 163
Operator E – 23/03 – 2010; P (low vc=4,5 m/min), R (high vc=10,2 m/min)
Workpiece P2 – 1% oil concentration (P0.3/W1)

Appendix J: Surface roughness profiles 164
Operator E – 23/03 – 2010; P (low vc=4,5 m/min), R (high vc=10,2 m/min)
Workpiece P3 – 1% oil concentration (P0.3/W1)

Appendix J: Surface roughness profiles 165
Operator E – 23/03 – 2010; P (low vc=4,5 m/min), R (high vc=10,2 m/min)
Workpiece R1 – 1% oil concentration (R0.3/W1)

Appendix J: Surface roughness profiles 166
Operator E – 23/03 – 2010; P (low vc=4,5 m/min), R (high vc=10,2 m/min)
Workpiece R2 – 1% oil concentration (R0.3/W1)

Appendix J: Surface roughness profiles 167
Operator E – 23/03 – 2010; P (low vc=4,5 m/min), R (high vc=10,2 m/min)
Workpiece R3 – 1% oil concentration (R0.3/W1)

Appendix J: Surface roughness profiles 168
Operator E – 23/03 – 2010; P (low vc=4,5 m/min), R (high vc=10,2 m/min)
Workpiece P1 – 10% oil concentration (P0.3/W2)

Appendix J: Surface roughness profiles 169
Operator E – 23/03 – 2010; P (low vc=4,5 m/min), R (high vc=10,2 m/min)
Workpiece P2 – 10% oil concentration (P0.3/W2)

Appendix J: Surface roughness profiles 170
Operator E – 23/03 – 2010; P (low vc=4,5 m/min), R (high vc=10,2 m/min)
Workpiece P3 – 10% oil concentration (P0.3/W2)

Appendix J: Surface roughness profiles 171
Operator E – 23/03 – 2010; P (low vc=4,5 m/min), R (high vc=10,2 m/min)
Workpiece R1 – 10% oil concentration (R0.3/W2)

Appendix J: Surface roughness profiles 172
Operator E – 23/03 – 2010; P (low vc=4,5 m/min), R (high vc=10,2 m/min)
Workpiece R2 – 10% oil concentration (R0.3/W2)

Appendix J: Surface roughness profiles 173
Operator E – 23/03 – 2010; P (low vc=4,5 m/min), R (high vc=10,2 m/min)
Workpiece R3 – 10% oil concentration (R0.3/W2)

Appendix J: Surface roughness profiles 174
Operator E – 23/03 – 2010; P (low vc=4,5 m/min), R (high vc=10,2 m/min)
Workpiece P1 – OIL (P0.3/M)

Appendix J: Surface roughness profiles 175
Operator E – 23/03 – 2010; P (low vc=4,5 m/min), R (high vc=10,2 m/min)
Workpiece P2 – OIL (P0.3/M)

Appendix J: Surface roughness profiles 176
Operator E – 23/03 – 2010; P (low vc=4,5 m/min), R (high vc=10,2 m/min)
Workpiece P3 – OIL (P0.3/M)

Appendix J: Surface roughness profiles 177
Operator E – 23/03 – 2010; P (low vc=4,5 m/min), R (high vc=10,2 m/min)
Workpiece R1 – OIL (R0.3/M)

Appendix J: Surface roughness profiles 178
Operator E – 23/03 – 2010; P (low vc=4,5 m/min), R (high vc=10,2 m/min)
Workpiece R2 – OIL (R0.3/M)

Appendix J: Surface roughness profiles 179
Operator E – 23/03 – 2010; P (low vc=4,5 m/min), R (high vc=10,2 m/min)
Workpiece R3 – OIL (R0.3/M)

Appendix J: Surface roughness profiles 180
Appendix J2: Surface roughness measurement Operator B: 12/04-2010

Appendix J: Surface roughness profiles 181
Operator B – 12/04 – 2010; P (low vc=4,5 m/min), R (high vc=10,2 m/min)
Workpiece P1 - 1% oil concentration (P0.3/W1)

Appendix J: Surface roughness profiles 182
Operator B – 12/04 – 2010; P (low vc=4,5 m/min), R (high vc=10,2 m/min)
Workpiece P2 – 1% oil concentration (P0.3/W1)

Appendix J: Surface roughness profiles 183
Operator B – 12/04 – 2010; P (low vc=4,5 m/min), R (high vc=10,2 m/min)
Workpiece P3 - 1% oil concentration (P0.3/W1)

Appendix J: Surface roughness profiles 184
Operator B – 12/04 – 2010; P (low vc=4,5 m/min), R (high vc=10,2 m/min)
Workpiece R1 - 1% oil concentration (R0.3/W1)

Appendix J: Surface roughness profiles 185
Operator B – 12/04 – 2010; P (low vc=4,5 m/min), R (high vc=10,2 m/min)
Workpiece R2 - 1% oil concentration (R0.3/W1)

Appendix J: Surface roughness profiles 186
Operator B – 12/04 – 2010; P (low vc=4,5 m/min), R (high vc=10,2 m/min)
Workpiece R3 - 1% oil concentration (R0.3/W1)

Appendix J: Surface roughness profiles 187
Operator B – 12/04 – 2010; P (low vc=4,5 m/min), R (high vc=10,2 m/min)
Workpiece P1 - 10% oil concentration (P0.3/W2)

Appendix J: Surface roughness profiles 188
Operator B – 12/04 – 2010; P (low vc=4,5 m/min), R (high vc=10,2 m/min)
Workpiece P2 - 10% oil concentration (P0.3/W2)

Appendix J: Surface roughness profiles 189
Operator B – 12/04 – 2010; P (low vc=4,5 m/min), R (high vc=10,2 m/min)
Workpiece P3 - 10% oil concentration (P0.3/W2)

Appendix J: Surface roughness profiles 190
Operator B – 12/04 – 2010; P (low vc=4,5 m/min), R (high vc=10,2 m/min)
Workpiece R1 - 10% oil concentration (R0.3/W2)

Appendix J: Surface roughness profiles 191
Operator B – 12/04 – 2010; P (low vc=4,5 m/min), R (high vc=10,2 m/min)
Workpiece R2 - 10% oil concentration (R0.3/W2)

Appendix J: Surface roughness profiles 192
Operator B – 12/04 – 2010; P (low vc=4,5 m/min), R (high vc=10,2 m/min)
Workpiece R3 - 10% oil concentration (R0.3/W2)

Appendix J: Surface roughness profiles 193
Operator B – 12/04 – 2010; P (low vc=4,5 m/min), R (high vc=10,2 m/min)
Workpiece P1 – OIL (P0.3/M)

Appendix J: Surface roughness profiles 194
Operator B – 12/04 – 2010; P (low vc=4,5 m/min), R (high vc=10,2 m/min)
Workpiece P2 –OIL (P0.3/M)

Appendix J: Surface roughness profiles 195
Operator B – 12/04 – 2010; P (low vc=4,5 m/min), R (high vc=10,2 m/min)
Workpiece P3 – OIL (P0.3/M)

Appendix J: Surface roughness profiles 196
Operator B – 12/04 – 2010; P (low vc=4,5 m/min), R (high vc=10,2 m/min)
Workpiece R1 – OIL (R0.3/M)

Appendix J: Surface roughness profiles 197
Operator B – 12/04 – 2010; P (low vc=4,5 m/min), R (high vc=10,2 m/min)
Workpiece R2 – OIL (R0.3/M)

Appendix J: Surface roughness profiles 198
Operator B – 12/04 – 2010; P (low vc=4,5 m/min), R (high vc=10,2 m/min)
Workpiece R3 – OIL (R0.3/M)

Appendix J: Surface roughness profiles 199
Appendix J3: Surface roughness measurement Operator C: 19/04-2010

Appendix J: Surface roughness profiles 200
Operator C – 19/04 – 2010; P (low vc=4,5 m/min), R (high vc=10,2 m/min)
Workpiece P1 – 1% oil concentration (P0.3/W1)

Appendix J: Surface roughness profiles 201
Operator C – 19/04 – 2010; P (low vc=4,5 m/min), R (high vc=10,2 m/min)
Workpiece P2 – 1% oil concentration (P0.3/W1)

Appendix J: Surface roughness profiles 202
Operator C – 19/04 – 2010; P (low vc=4,5 m/min), R (high vc=10,2 m/min)
Workpiece P3 – 1% oil concentration (P0.3/W1)

Appendix J: Surface roughness profiles 203
Operator C – 19/04 – 2010; P (low vc=4,5 m/min), R (high vc=10,2 m/min)
Workpiece R1 – 1% oil concentration (R0.3/W1)

Appendix J: Surface roughness profiles 204
Operator C – 19/04 – 2010; P (low vc=4,5 m/min), R (high vc=10,2 m/min)
Workpiece R2 – 1% oil concentration (R0.3/W1)

Appendix J: Surface roughness profiles 205
Operator C – 19/04 – 2010; P (low vc=4,5 m/min), R (high vc=10,2 m/min)
Workpiece R3 – 1% oil concentration (R0.3/W1)

Appendix J: Surface roughness profiles 206
Operator C – 19/04 – 2010; P (low vc=4,5 m/min), R (high vc=10,2 m/min)
Workpiece P1 – 10% oil concentration (P0.3/W2)

Appendix J: Surface roughness profiles 207
Operator C – 19/04 – 2010; P (low vc=4,5 m/min), R (high vc=10,2 m/min)
Workpiece P2 – 10% oil concentration (P0.3/W2)

Appendix J: Surface roughness profiles 208
Operator C – 19/04 – 2010; P (low vc=4,5 m/min), R (high vc=10,2 m/min)
Workpiece P3 – 10% oil concentration (P0.3/W2)

Appendix J: Surface roughness profiles 209
Operator C – 19/04 – 2010; P (low vc=4,5 m/min), R (high vc=10,2 m/min)
Workpiece R1 – 10% oil concentration (R0.3/W2)

Appendix J: Surface roughness profiles 210
Operator C – 19/04 – 2010; P (low vc=4,5 m/min), R (high vc=10,2 m/min)
Workpiece R2 – 10% oil concentration (R0.3/W2)

Appendix J: Surface roughness profiles 211
Operator C – 19/04 – 2010; P (low vc=4,5 m/min), R (high vc=10,2 m/min)
Workpiece R3 – 10% oil concentration (R0.3/W2)

Appendix J: Surface roughness profiles 212
Operator C – 19/04 – 2010; P (low vc=4,5 m/min), R (high vc=10,2 m/min)
Workpiece P1 – OIL (P0.3/M)

Appendix J: Surface roughness profiles 213
Operator C – 19/04 – 2010; P (low vc=4,5 m/min), R (high vc=10,2 m/min)
Workpiece P2 – OIL (P0.3/M)

Appendix J: Surface roughness profiles 214
Operator C – 19/04 – 2010; P (low vc=4,5 m/min), R (high vc=10,2 m/min)
Workpiece P3 – OIL (P0.3/M)

Appendix J: Surface roughness profiles 215
Operator C – 19/04 – 2010; P (low vc=4,5 m/min), R (high vc=10,2 m/min)
Workpiece R1 – OIL (R0.3/M)

Appendix J: Surface roughness profiles 216
Operator C – 19/04 – 2010; P (low vc=4,5 m/min), R (high vc=10,2 m/min)
Workpiece R2 – OIL (R0.3/M)

Appendix J: Surface roughness profiles 217
Operator C – 19/04 – 2010; P (low vc=4,5 m/min), R (high vc=10,2 m/min)
Workpiece R3 – OIL (R0.3/M)

Appendix J: Surface roughness profiles 218
Appendix J4: Surface roughness measurement Operator A: 26/04-2010

Appendix J: Surface roughness profiles 219
Operator A – 26/04 – 2010; P (low vc=4,5 m/min), R (high vc=10,2 m/min)
Workpiece P1 – 1% oil concentration (P0.3/W1)

Appendix J: Surface roughness profiles 220
Operator A – 26/04 – 2010; P (low vc=4,5 m/min), R (high vc=10,2 m/min)
Workpiece P2 – 1% oil concentration (P0.3/W1)

Appendix J: Surface roughness profiles 221
Operator A – 26/04 – 2010; P (low vc=4,5 m/min), R (high vc=10,2 m/min)
Workpiece P3 – 1% oil concentration (P0.3/W1)

Appendix J: Surface roughness profiles 222
Operator A – 26/04 – 2010; P (low vc=4,5 m/min), R (high vc=10,2 m/min)
Workpiece R1 – 1% oil concentration (R0.3/W1)

Appendix J: Surface roughness profiles 223
Operator A – 26/04 – 2010; P (low vc=4,5 m/min), R (high vc=10,2 m/min)
Workpiece R2 – 1% oil concentration (R0.3/W1)

Appendix J: Surface roughness profiles 224
Operator A – 26/04 – 2010; P (low vc=4,5 m/min), R (high vc=10,2 m/min)
Workpiece R3 – 1% oil concentration (R0.3/W1)

Appendix J: Surface roughness profiles 225
Operator A – 26/04 – 2010; P (low vc=4,5 m/min), R (high vc=10,2 m/min)
Workpiece P1 – 10% oil concentration (P0.3/W2)

Appendix J: Surface roughness profiles 226
Operator A – 26/04 – 2010; P (low vc=4,5 m/min), R (high vc=10,2 m/min)
Workpiece P2 – 10% oil concentration (P0.3/W2)

Appendix J: Surface roughness profiles 227
Operator A – 26/04 – 2010; P (low vc=4,5 m/min), R (high vc=10,2 m/min)
Workpiece P3 – 10% oil concentration (P0.3/W2)

Appendix J: Surface roughness profiles 228
Operator A – 26/04 – 2010; P (low vc=4,5 m/min), R (high vc=10,2 m/min)
Workpiece R1 – 10% oil concentration (R0.3/W2)

Appendix J: Surface roughness profiles 229
Operator A – 26/04 – 2010; P (low vc=4,5 m/min), R (high vc=10,2 m/min)
Workpiece R2 – 10% oil concentration (R0.3/W2)

Appendix J: Surface roughness profiles 230
Operator A – 26/04 – 2010; P (low vc=4,5 m/min), R (high vc=10,2 m/min)
Workpiece R3 – 10% oil concentration (R0.3/W2)

Appendix J: Surface roughness profiles 231
Operator A – 26/04 – 2010; P (low vc=4,5 m/min), R (high vc=10,2 m/min)
Workpiece P1 – OIL (P0.3/M)

Appendix J: Surface roughness profiles 232
Operator A – 26/04 – 2010; P (low vc=4,5 m/min), R (high vc=10,2 m/min)
Workpiece P2 – OIL (P0.3/M)

Appendix J: Surface roughness profiles 233
Operator A – 26/04 – 2010; P (low vc=4,5 m/min), R (high vc=10,2 m/min)
Workpiece P3 – OIL (P0.3/M)

Appendix J: Surface roughness profiles 234
Operator A – 26/04 – 2010; P (low vc=4,5 m/min), R (high vc=10,2 m/min)
Workpiece R1 – OIL (R0.3/M)

Appendix J: Surface roughness profiles 235
Operator A – 26/04 – 2010; P (low vc=4,5 m/min), R (high vc=10,2 m/min)
Workpiece R2 – OIL (R0.3/M)

Appendix J: Surface roughness profiles 236
Operator A – 26/04 – 2010; P (low vc=4,5 m/min), R (high vc=10,2 m/min)
Workpiece R3 – OIL (R0.3/M)

Appendix J: Surface roughness profiles 237
Appendix J5: Surface roughness measurement Operator D: 3/5-2010

Appendix J: Surface roughness profiles 238
Operator D – 03/05 – 2010; P (low vc=4,5 m/min), R (high vc=10,2 m/min)
Workpiece P1 – 1% oil concentration (P0.3/W1)

Appendix J: Surface roughness profiles 239
Operator D – 03/05 – 2010; P (low vc=4,5 m/min), R (high vc=10,2 m/min)
Workpiece P2 – 1% oil concentration (P0.3/W1)

Appendix J: Surface roughness profiles 240
Operator D – 03/05 – 2010; P (low vc=4,5 m/min), R (high vc=10,2 m/min)
Workpiece P3 – 1% oil concentration (P0.3/W1)

Appendix J: Surface roughness profiles 241
Operator D – 03/05 – 2010; P (low vc=4,5 m/min), R (high vc=10,2 m/min)
Workpiece R1 – 1% oil concentration (R0.3/W1)

Appendix J: Surface roughness profiles 242
Operator D – 03/05 – 2010; P (low vc=4,5 m/min), R (high vc=10,2 m/min)
Workpiece R2 – 1% oil concentration (R0.3/W1)

Appendix J: Surface roughness profiles 243
Operator D – 03/05 – 2010; P (low vc=4,5 m/min), R (high vc=10,2 m/min)
Workpiece R3 – 1% oil concentration (R0.3/W1)

Appendix J: Surface roughness profiles 244
Operator D – 03/05 – 2010; P (low vc=4,5 m/min), R (high vc=10,2 m/min)
Workpiece P1 – 10% oil concentration (P0.3/W2)

Appendix J: Surface roughness profiles 245
Operator D – 03/05 – 2010; P (low vc=4,5 m/min), R (high vc=10,2 m/min)
Workpiece P2 – 10% oil concentration (P0.3/W2)

Appendix J: Surface roughness profiles 246
Operator D – 03/05 – 2010; P (low vc=4,5 m/min), R (high vc=10,2 m/min)
Workpiece P3 – 10% oil concentration (P0.3/W2)

Appendix J: Surface roughness profiles 247
Operator D – 03/05 – 2010; P (low vc=4,5 m/min), R (high vc=10,2 m/min)
Workpiece R1 – 10% oil concentration (R0.3/W2)

Appendix J: Surface roughness profiles 248
Operator D – 03/05 – 2010; P (low vc=4,5 m/min), R (high vc=10,2 m/min)
Workpiece R2 – 10% oil concentration (R0.3/W2)

Appendix J: Surface roughness profiles 249
Operator D – 03/05 – 2010; P (low vc=4,5 m/min), R (high vc=10,2 m/min)
Workpiece R3 – 10% oil concentration (R0.3/W2)

Appendix J: Surface roughness profiles 250
Operator D – 03/05 – 2010; P (low vc=4,5 m/min), R (high vc=10,2 m/min)
Workpiece P1 – OIL (P0.3/M)

Appendix J: Surface roughness profiles 251
Operator D – 03/05 – 2010; P (low vc=4,5 m/min), R (high vc=10,2 m/min)
Workpiece P2 – OIL (P0.3/M)

Appendix J: Surface roughness profiles 252
Operator D – 03/05 – 2010; P (low vc=4,5 m/min), R (high vc=10,2 m/min)
Workpiece P3 – OIL (P0.3/M)

Appendix J: Surface roughness profiles 253
Operator D – 03/05 – 2010; P (low vc=4,5 m/min), R (high vc=10,2 m/min)
Workpiece R1 – OIL (R0.3/M)

Appendix J: Surface roughness profiles 254
Operator D – 03/05 – 2010; P (low vc=4,5 m/min), R (high vc=10,2 m/min)
Workpiece R2 – OIL (R0.3/M)

Appendix J: Surface roughness profiles 255
Operator D – 03/05 – 2010; P (low vc=4,5 m/min), R (high vc=10,2 m/min)
Workpiece R3 – OIL (R0.3/M)

Appendix J: Surface roughness profiles 256
Appendix J6: Surface roughness measurement Operator F: 22/6-2010

Appendix J: Surface roughness profiles 257
Operator F – 22/06 – 2010; P (low vc=4,5 m/min)
Workpiece P1 - neat oil (P0.3/N)

Appendix J: Surface roughness profiles 258
Operator F – 22/06 – 2010; P (low vc=4,5 m/min)
Workpiece P2 - neat oil (P0.3/N)

Appendix J: Surface roughness profiles 259
Operator F – 22/06 – 2010; P (low vc=4,5 m/min)
Workpiece P3 - neat oil (P0.3/N)

Appendix J: Surface roughness profiles 260
Appendix J7: Surface roughness measurement Operator G: 22/6-2010

Appendix J: Surface roughness profiles 261
Operator G – 22/06 – 2010; P (low vc=4,5 m/min)
Workpiece P1 - neat oil (P0.2/N)

Appendix J: Surface roughness profiles 262
Operator G – 22/06 – 2010; P (low vc=4,5 m/min)
Workpiece P2 - neat oil (P0.2/N)

Appendix J: Surface roughness profiles 263
Operator G – 22/06 – 2010; P (low vc=4,5 m/min)
Workpiece P3 - neat oil (P0.2/N)