Embed Size (px)
Citation preview
General rights Copyright and moral rights for the publications made accessible in the public portal are retained by the authors and/or other copyright owners and it is a condition of accessing publications that users recognise and abide by the legal requirements associated with these rights.
Users may download and print one copy of any publication from the public portal for the purpose of private study or research.
You may not further distribute the material or use it for any profit-making activity or commercial gain
You may freely distribute the URL identifying the publication in the public portal If you believe that this document breaches copyright please contact us providing details, and we will remove access to the work immediately and investigate your claim.
Downloaded from orbit.dtu.dk on: Jun 01, 2022
Investigations of Compositions and Fluid-Fluid Association Mechanisms for PetroleumFluids
Mihrin, Dmytro
Publication date:2020
Document VersionPublisher's PDF, also known as Version of record
Link back to DTU Orbit
Citation (APA):Mihrin, D. (2020). Investigations of Compositions and Fluid-Fluid Association Mechanisms for Petroleum Fluids.Technical University of Denmark.
Ph.D. ThesisDoctor of Philosophy
Investigations of Compositions andFluid-Fluid Association Mechanisms for
Petroleum FluidsApplication of the FT-IR techniques
Dmy tro S. Mihr in M.Sc .
Kongens Ly ngby 2020

DTU Chemistry
Technical University of Denmark
Kemitorvet
Building 206
2800 Kongens Lyngby, Denmark
Phone +45 93 86 55 72
www.kemi.dtu.dk
SummaryCrude oil has become the core resource, irreplaceable for many industries and areas of
life. For the longest foreseeable future, most areas will not see a completely fulfilling sustain-able replacement for this finite natural resource, particularly as a source of various precursormolecules for medicinal chemistry and advanced functional materials. In the events of rais-ing climate concerns and ever increasing challenges associated with recovering oil from thesubsurface, it is necessary to develop novel advanced methods to achieve the best possible oilrecovery at minimal cost and environmental impact. Oil is deposited at elevated temperaturesand pressures, often deep in geologically challenging conditions. Crude oil of the North Seais located in tight chalk reservoirs, characterized by high porosity and low permeability andsweep efficiency associated with strong surface adhesion of the oil. Extraction of this organicmaterial requires very accurate understanding and maintaining tight control of the complexphase behavior of the gas/oil mixture, as it passes through the porous material.
Oil recovery and refining is a large and complex set of processes, where the most advancedknowledge from multiple fields of engineering and natural sciences has to be utilized. Chal-lenges with recovery, reservoir souring, scale and corrosion, formation of clathrates etc., areall of critical importance due to sheer scale of production, making even minor effects clearlyimpactful. Crude oil found in different places around the world is not the same. It exhibitsunique combinations of physical properties and complex chemical composition giving eachcrude oil a specific chemical fingerprint. These differences result in vastly different phase be-havior in the subsurface, warranting case specific approaches to be designed for the extraction.
The goal of this PhD dissertation is to investigate mechanisms governing phase behaviorand surface interactions of crude oil in the tight chalk reservoir of the Danish North Sea fromthe perspective of intermolecular forces. Geographical variations of chemical composition ofthe crude oil in the North Sea are investigated, as this work is part of the effort to developcustom tailored solutions to be applied for the enhanced oil recovery in the North Sea.
Infrared spectroscopy is a powerful method targeting functional groups of molecules, andis therefore used to study polar constituents of the oil. Polar chemical groups have an impacton the physical properties of the fluid. The chemical compositions of several crude oils fromthe North Sea have been studied alongside chalk samples containing reservoir oil, to comparecomposition of material at the surface against that in bulk fluids. Residue extracted from thechalk surface is much more rich in polar compounds than bulk oil and even it’s respectiveheavy fraction from vacuum distillation separations.
ii Summary
A method was developed to analyze the crude oil contained in the original drill coresamples, sourced in the various geographic locations across the oil fields in the North Sea. Thesolid phase extraction (SPE) procedure yields separation of a sample of the solvent-extractedcrude oil from the core into four fraction, based on the presence of polar functional groupsin the molecules. Infrared spectroscopy allows direct access to the characteristic vibrationalfeatures of these functional groups, and allows quantify their abundance.
Statistical analysis was used to uncover the most important differences in chemistry andfind correlations among samples from various geographical locations. The distributions re-vealed from the principal component analysis (PCA) plots demonstrate that there are distinc-tive variations in the composition of polar functional groups attributed to specific classes ofchemical compounds and that wells can be grouped based on these chemical properties tooptimize the conditions of oil production for the specific case.
In order to aid the development of enhanced oil recovery processes, various models simu-lating fluid behavior in the reservoir are used. The most common approach is to use the pres-sure/volume/temperature (PVT) phase diagrams obtained in a laboratory for a model fluidcomposition. The diversity of fluid chemistry in a real reservoir and the complex interactionwith the surfaces shows how very limited this approach is in it’s applicability. Therefore oneof the objectives of this thesis is to investigate the molecular association mechanisms of mi-crosolvation relevant to molecules found in the oil and associated industrial processes. Again,as crude oil chemistry is infinitely diverse, instead of taking a case approach, it was decided todevelop a broadly applicable model based that would take into account the immediate chemi-cal surrounding of the functional groups to exactly describe their local effect on the molecularassociation in the condensed phase.
Infrared (IR) and terahertz (THz) spectroscopy in cryogenic matrices allow access to large-amplitude intermolecular vibrations, that characterize well the non-covalent interactions thatcause individual molecules to form clusters. This experimental approach was used to estimatethe strengths of hydrogen bonds formed with water of a systematic set of compounds to es-tablish a widely applicable model for the prediction of hydrogen bond acceptor properties ofoxygen- and sulfur-based polar groups. We have determined the extent to which the induc-tive effect influences acceptor properties of oxygen and sulfur atoms, and used the local paircoupled cluster method to analyze the interaction energy of the non-covalent aggregates, pro-viding deeper insight into the role of London dispersion forces on intermolecular interactionsin liquid phase. The resulting data array provides a useful experimental reference for the de-velopment of advanced thermodynamic models for reservoir scale simulations of fluid-fluidbehavior.
The molecular associations of dimethyl ether with various classes of oxygen-containing
Summary iii
polar compounds were investigated also. Dimethyl ether has received attention as a potentiallyfeasible agent for solvent based enhanced oil recovery, that could be applied in the North Sea.It has the potential to efficiently elute heavier compounds, that tend to strongly adhere tosurfaces, and affect physical properties of the flooding fluid. However, a successful applicationrequires thermodynamic models to find the most economy-efficient use of the agent.
The investigation also includes light non-polar compounds, such as CO2, OCS and CS2,that are of importance in gas injection production techniques and desulfurization processes.These systems exhibit very weak interactions where dispersion forces are very important. Suchsystems require particularly sensitive techniques with the spectral range extended into theTHz region. We have used para-hydrogen as an alternative to noble gases for cryogenic matrixformation, as the former is transparent in the terahertz range. For this purpose, a cryogenicconversion setup was designed to produce para-hydrogen in a fully automatic way from normalhydrogen, without the need for valuable liquid helium.

iv
ResuméRåolie er fortsat en af de vigtigste energikilder, uerstattelig for mange forskellige indus-
trier og aspekter af menneskers hverdag. Selvom oliereserverne ikke er uudtømmelige, vil deri den overskuelige fremtid ikke være en fuldt ud bæredygtig erstatning for denne naturres-source til rådighed. Især som en kilde til forskellige forstadiemolekyler til medicinsk kemiog avancerede funktionelle materialer vil råolien forblive en nødvendig ressource i mange årendnu. I forbindelse med klimaproblemerne og de stadigt stigende udfordringer forbundetmed udvinding af olie fra undergrunden er det nødvendigt at udvikle nye avancerede metoderfor at opnå den bedst mulige olieudvinding med minimale omkostninger og miljøpåvirkninger.Olie aflejres i undergrunden ved høje temperaturer og tryk, under geologisk udfordrendeforhold. Råolie i Nordsøen er placeret i tætte kalkreservoirer, der er kendetegnet ved højporøsitet, lav permeabilitet og relativt lav indvindingsgrad som menes at være forbundet medstærk vekselvirkninger af olien til klippeoverfladen. Ekstraktion af disse organiske materi-aler kræver meget nøjagtig forståelse og kontrol af den komplekse faseopførsel af gas / olie-blandingen, når den passerer gennem det porøse materiale.
Olieudvinding og raffinering komplekse processer, hvor den mest avancerede viden fraflere tekniske- og naturvidenskabelige områder skal anvendes. Udfordringer med udvindelse,forsuring af reservoiret, aflejringer og korrosion, dannelse af faste faser osv. er alle af kritiskbetydning. På grund af de store volumner af olie der produceres, bliver selv mindre effekterklart indflydelsesrige når de opskaleres. Råolier fra forskellige steder i verden, er langt fra ens.De udviser unikke kombinationer af fysiske egenskaber og kompleks kemisk sammensætning.Disse forskelle resulterer i meget forskellig faseopførsel og kemiske egenskaber i undergrun-den, hvilket nødvendiggør udvindingstrategier der tager oliens unikke kemi i betragtning.
Målet med denne ph.d.-afhandling er at undersøge mekanismer, der styrer faseopførselog overfladevekselvirkninger af råolie i det tætte kridtreservoir i den danske del af Nordsøenpå basis af intermolekylære kræfter. Geografiske variationer af den kemiske sammensætningaf råolien i Nordsøen undersøges, da dette arbejde er en del af bestræbelserne på at udvikletilpassede løsninger, der skal anvendes til den forbedrede olieudvinding i Nordsøen.
Infrarød spektroskopi er en fordelagtig metode, der er målrettet funktionelle grupper imolekyler, og anvendes derfor til at studere de polære bestanddele af olien. Polære kemiskegrupper har indflydelse på væskens fysiske egenskaber. De kemiske sammensætninger af ad-skillige råolier fra Nordsøen er undersøgt samtidig med studier af kalkprøver, der indeholderoprindelig reservoirolie, for at sammenligne materialesammensætning på overfladen med den
vi Resumé
i olien. Oliebestanddele, der ekstraheres fra kridtoverfladen, er meget mere rig på polæreforbindelser end den producerede olie og endda dets respektive tunge fraktion fra vakuumdes-tillationsseparationer.
Der blev udviklet en metode til analyse af den råolie, der var indeholdt i de originaleborekerneprøver, hentet på de forskellige geografiske placeringer på tværs af oliefelterne iNordsøen. Proceduren med solid phase ekstraktion (SPE) giver separation af en prøve afden opløsningsmiddelekstraherede råolie fra kernen i fire fraktioner. Separation er baseretpå tilstedeværelsen af polære funktionelle grupper i molekylerne. Infrarød spektroskopi giverdirekte information om bindingerne i de funktionelle grupper og muliggør kvantificering afdisse stoffer
Statistisk analyse blev brugt til at afdække de vigtigste forskelle i kemien og finde korrela-tioner mellem prøver fra forskellige geografiske placeringer. Fordelingerne fundet ved hjælp afprimær komponentanalyse (PCA) viser, at der er karakteristiske variationer i sammensætnin-gen af polære funktionelle grupper, der tilskrives specifikke klasser af kemiske forbindelser,og at brønde kan grupperes baseret på disse kemiske egenskaber. Forståelse af forskellen ikemisk sammensætning kan hjælpe med at optimere betingelserne for olieproduktion for detkonkrete tilfælde.
For at hjælpe med udviklingen af forbedrede olieudvindingsprocesser anvendes forskelligemodeller, der simulerer væskeadfærd i reservoiret. Den mest almindelige fremgangsmådeer at bruge tryk / volumen / temperatur (PVT) fasediagrammer opnået i et laboratoriumfor en modelvæskesammensætning. Mangfoldigheden af væskekemi i et reelt reservoir ogden komplekse interaktion med overfladerne viser, hvor begrænset denne tilgang er i densanvendelighed. Derfor er et af målene med denne afhandling at undersøge molekylære as-socieringsmekanismer ved mikrosolvering, der er relevante for molekyler, der findes i olienog tilknyttede industrielle processer. Da råoliekemien er uendeligt forskelligartet, blev detbesluttet at forsøge at udvikle en bredt anvendelig model der ville tage hensyn til den øjeb-likkelige kemiske omgivelse af de funktionelle grupper for nøjagtigt at beskrive deres lokalevirkning på molekylvekselvirkningerne i den kondenserede fase.
Infrarøde (IR) og terahertz (THz) spektroskopistudier i kryogene matricer giver adgangtil intermolekylære vibrationer med stor amplitude, der kendetegner de ikke-kovalente inter-aktioner der får individuelle molekyler til at danne aggregater. Denne eksperimentelle frem-gangsmåde blev anvendt til at estimere styrkerne af hydrogen-bindinger dannet med vandfor et systematisk sæt af kemiske forbindelser for at etablere en bredt anvendelig model tilforudsigelse af ilt- og svovl-baserede polære gruppers evne som acceptor i intermolekylærehydrogen-bindinger. Vi har bestemt, hvorvidt den induktive effekt påvirker acceptoregensk-aber af ilt- og svovl-atomer og har anvendt “local pair coupled cluster” metoder til at analysere
Resumé vii
interaktionsenergier for de studerede aggregater, hvilket giver en dybere indsigt i London-dispersionskræfternes rolle på intermolekylære interaktioner i væskefase. De resulterende datagiver en nyttig eksperimentel reference til udvikling af avancerede termodynamiske modellertil reservoirskala-simuleringer af fluid-fluid opførsel.
De molekylære vekselvirkninger mellem dimethylæter og forskellige klasser af ilt-holdigepolære forbindelser blev også undersøgt. Dimethylæter har fået opmærksomhed som et mid-del til opløsningsmiddelbaseret forbedret olieudvinding, der potentielt kan anvendes i Nord-søen. Det har potentialet til effektivt at eluere tungere forbindelser, der har en tendens til atvekselvirke stærkt med kalkoverflader og påvirke de fysiske egenskaber af de anvendte opløs-ninger. En vellykket anvendelse kræver imidlertid termodynamiske modeller for at finde denmest økonomiske effektiv anvendelse af stoffet.
Undersøgelsen vedrører også lette ikke-polære forbindelser, såsom CO2, OCS og CS2,der er vigtige for produktion med gasinjektion og desulfuriseringsprocesser. Disse systemerudviser meget svage vekselvirkninger, hvor dispersionskræfter er meget vigtige. Sådanne sys-temer kræver særlig følsomme teknikker med det spektrale område udvidet til THz-regionen.Vi har brugt para-hydrogen som et alternativ til ædelgasser til kryogen matrixdannelse, daførstnævnte er gennemsigtig i terahertz-området. Til dette formål blev en fuldautomatis-eret kryogen konverteringsopsætning designet til at fremstille para-hydrogen fra normal brintuden behov for værdifuld flydende helium.

viii
Preface and AcknowledgmentsThis dissertation is submitted in fulfillment of the requirements for the degree of Doctor of
Philosophy from the Technical University of Denmark (DTU). This work has been carried outin Danish Hydrocarbon Research and Technology Center (DHRTC) and the Departmentof Chemistry at DTU from February 2017 to January 2020 under the supervision of KarenLouise Feilberg, senior researcher at DHRTC, René Wugt Larsen, associate professor at theDepartment of Chemistry DTU, and Jonas Rosager Henriksen, associate professor at theDepartment of Health Technology. This work is part of the Advanced Waterflooding projectat the DHRTC.
I would like to thank my supervisors Karen Feilberg and René Wugt Larsen for theirencouragement, indispensable help with solving challenging problems and friendly support.I sincerely thank Jonas Andersen for his valuable mentorship in the starting phase of myexperimental work. I am grateful to Casper Hoeck and Maria-Alejandra Sánchez for layingthe foundation of our joint work on crude oil studies. I thank Alexandre Paolo Voute forhis brilliant engineering contribution in the project of designing and building setups for para-hydrogen preparation and matrix isolation on a closed-cycle cryocooler. I would like to thankMing Li for developing the statistical analysis programs for spectral data interpretation. Ithank Tran Thuong Dang for the preparative work on the produced crude oil samples. I thankSofie Pedersen for her work on the theoretical analysis of the carbonyl sulfide matrix isolationexperiments. I am grateful to Peter W. Jakobsen for the preparative work on the hydrogensulfide, hydrogen cyanide and ether studies as well as his contribution to the construction ofthe closed-cycle matrix isolation setup.
Finally, I thank all my colleagues at DTU Chemistry and DHRTC for fruitful scientificdiscussions.
Kongens Lyngby, January 31
Dmytro S. Mihrin M.Sc.

x
List of Peer-Reviewed PapersPeer-reviewed papers included in the thesis
1. Mihrin, D., Andersen, J., Jakobsen, P. W., and Wugt Larsen, R. (2019). Highly local-ized H2O librational motion as a far-infrared spectroscopic probe for microsolvationof organic molecules.Physical Chemistry Chemical Physics, 21(4), 1717-1723.
2. Mihrin, D., Wugt Larsen, R. (2019). THz spectroscopy of weakly bound clustermolecules in solid para-hydrogen: a sensitive probe of van der Waals interactions.Physical Chemistry Chemical Physics, 21(1), 349-358.
3. Mihrin, D., Jakobsen, P. W., Voute, A., Manceron, L., and Wugt Larsen, R.(2019). High-Resolution Infrared Synchrotron Investigation of (HCN)2 and a Semi-Experimental Determination of the Dissociation Energy D0.ChemPhysChem, 20(23), 3238-3244.
4. Mihrin, D., Jakobsen, P. W., Voute, A., Manceron, L., and Wugt Larsen, R. (2018).High-resolution synchrotron terahertz investigation of the large-amplitude hydrogenbond librational band of (HCN)2.Physical Chemistry Chemical Physics, 20(12), 8241-8246.
Peer-reviewed papers not included in the thesis
1. Pedersen, K. S., Vinum, M. G., Voigt, L., Bell, C., Mihrin, D., Wugt Larsen, R., andClark, K. M. (2019). Evidence for Non-Innocence of a 𝛽-Diketonate Ligand.Chemistry–A European Journal. DOI: 10.1002/chem.201904899.
2. Andersen, J., Voute, A., Mihrin, D., Heimdal, J., Berg, R. W., Torsson, M., and WugtLarsen, R. (2017). Probing the global potential energy minimum of (CH2O)2: THzabsorption spectrum of (CH2O)2 in solid neon and para-hydrogen.The Journal of Chemical Physics, 146(24), 244311.

xii

List of Abbreviations
Table 1: List of the abbreviations for terms and methods used in the the-sis.
API - American Petroleum InstituteASTM - American Society for Testing and MaterialsATR - Attenuated total reflectanceBSSE - Basis set superposition errorCBS - Complete basis setCCSD(T) - Coupled cluster theory with singles, doubles and perturbative triplesCHELPG - Charges from Electrostatic Potentials on GridCOSX - Chain-of-spheres exchangeCVD - Chemical vapor depositionDESI - desorption electrospray ionizationDFT - Density functional theoryDLPNO - Domain-based local pair natural orbital methodDRIFT - Diffused reflectanceDTGS - Deuterated triglycine sulfate detectorEOR - Enhanced oil recoveryFID - Flame Ionization DetectorFIR - Far-infrared rangeFT - Fourier transformGC - Gas chromatographyGGA - Generalized Gradient ApproximationGM - Gifford-McMahonHBA - Hydrogen bond acceptorHBD - Hydrogen bond donorHF - Hartree-Fock methodHPLC - High-performance liquid chromatographyICR - Ion-Cyclotron-ResonanceInSb - Indium Antimonide detectorIR - Infrared

xiv List of Abbreviations
ISO - International Organization forStandardization
LED - Local energy decompositionMCT - Mercury-Cadmium-Telluride detectorMD - Molecular dynamicsMIR - Mid-infrared rangeMPn - Møller-Plesset perturbation theoryMS - Mass spectroscopyNIR - Near-infrared rangeNMR - Nuclear magnetic resonanceOFHC - Oxygen-free high-conductivity (copper grade)PAH - Polyaromatic hydrocarbonsPC(s) - Principal component(s)PCA - Principal component analysisPLS - Partial least squaresPTFE - PolytetrafluoroethylenePVT - Pressure/volume/temperatureRI - Resolution of the identitySAPT - Symmetry-adapted perturbation theorySARA - Saturates, Aromatics, Resins, AsphaltenesSCF - Self-consistent fieldSCX - Strong cation exchange columnSPE - Solid phase extractionTAN - Total acid numberTBN - Total base numberTHz - Terahertz rangeTLC - Thin layer chromatographyTOF - Time-of-flightUV/Vis - Ultra-violet/visibleVPT2 - Second-order vibrational perturbation theoryVRT - Vibration-rotation-tunnelingZPE - Zero-point energy

List of Abbreviations xv
Table 2: List of the abbreviations used for chemicalcompounds in the thesis.
DEE - Diethyl etherDiPE - Diisopropyl etherDME - Dimethyl etherEME - Ethyl methyl etherFA - Formic acidp-H2 - Para-hydrogenPhEE - Phenyl ethyl ether, ethoxybenzenePhME - Phenyl methyl ether, anisolePME - Propyl methyl etherTBEE - Tert-butyl ethyl etherTBME - Tert-butyl methyl ether

xvi
ContentsSummary i
Resumé v
Preface and Acknowledgments ix
List of Peer-Reviewed Papers xi
List of Abbreviations xiii
Contents xvii
I Introduction 1I.1 Crude oil production and recovery methods . . . . . . . . . . . . . . . . . 4I.2 The chemical composition and physical chemistry of crude oil . . . . . . . . 5
I.2.1 Characteristics of oil and analytical methods . . . . . . . . . . . . . 6I.3 Molecular physics of condensed phases . . . . . . . . . . . . . . . . . . . . 11
I.3.1 Molecular vibrational energies in thermodynamic models . . . . . . 14I.3.2 From molecules to building bricks of the condensed phase . . . . . 16I.3.3 Spectroscopic methods to obtain thermodynamic data . . . . . . . 19
II Methods 23II.1 Infrared Spectroscopy . . . . . . . . . . . . . . . . . . . . . . . . . . . . . 23
II.1.1 Infrared spectrometers, optical design and instrumentation . . . . . 23II.1.2 Attenuated total reflectance (ATR) spectroscopy . . . . . . . . . . 29II.1.3 FT-Raman Spectroscopy . . . . . . . . . . . . . . . . . . . . . . . 32
II.2 Preparative techniques and statistical analysis . . . . . . . . . . . . . . . . 33II.2.1 Solid phase extraction . . . . . . . . . . . . . . . . . . . . . . . . 33II.2.2 Data processing and statistical analysis . . . . . . . . . . . . . . . 34
II.3 Methodology of matrix isolation spectroscopy . . . . . . . . . . . . . . . . 35II.3.1 Liquid helium bath cryostat setup . . . . . . . . . . . . . . . . . . 37II.3.2 Closed-cycle cryostat setup . . . . . . . . . . . . . . . . . . . . . . 38
II.4 Supporting computational methods . . . . . . . . . . . . . . . . . . . . . . 40II.4.1 Brief overview of quantum chemical methodologies . . . . . . . . . 42
xviii Contents
II.4.2 On approximations and reasonable expectations . . . . . . . . . . . 43II.4.3 Computational approaches to simulation of vibrational spectra . . . 49II.4.4 Procedures for data analysis . . . . . . . . . . . . . . . . . . . . . . 51
III FromChemistry to Flow Properties 55III.1 Geographic origins of the samples . . . . . . . . . . . . . . . . . . . . . . 56III.2 Chemical analysis of the produced oil samples . . . . . . . . . . . . . . . . 59
III.2.1 True boiling point distillation and sample measurement . . . . . . . 59III.2.2 Compositional analysis of produced oil samples . . . . . . . . . . . 60
III.3 Chemical fingerprinting of the wells . . . . . . . . . . . . . . . . . . . . . 66III.3.1 Overview of the sample sets . . . . . . . . . . . . . . . . . . . . . 67III.3.2 Drill core sample preparation . . . . . . . . . . . . . . . . . . . . . 67III.3.3 Notes on method development . . . . . . . . . . . . . . . . . . . . 69III.3.4 Statistical analysis of the core extract data . . . . . . . . . . . . . . 71III.3.5 Samples from the South North Sea . . . . . . . . . . . . . . . . . 73III.3.6 Samples from the Valdemar field . . . . . . . . . . . . . . . . . . . 75
III.4 Concluding remarks . . . . . . . . . . . . . . . . . . . . . . . . . . . . . . 84
IV Molecular AssociationMechanisms Involving Strong Hydrogen Bonds 87IV.1 Microsolvation of oxygen-based compounds . . . . . . . . . . . . . . . . . 89
IV.1.1 Experimental details . . . . . . . . . . . . . . . . . . . . . . . . . 89IV.1.2 Results and analysis . . . . . . . . . . . . . . . . . . . . . . . . . . 90
IV.1.2.1 Computational analysis of structure . . . . . . . . . . . . 93IV.1.2.2 Aliphatic ethers as hydrogen bond acceptors . . . . . . . 94IV.1.2.3 Phenyl ethers as hydrogen bond acceptors . . . . . . . . . 101IV.1.2.4 Hydrogen bond energy decomposition . . . . . . . . . . 102
IV.2 Solvent based enhanced oil recovery: Dimethyl Ether (DME) . . . . . . . 109IV.2.1 Methanol/DME . . . . . . . . . . . . . . . . . . . . . . . . . . . 112IV.2.2 Ethanol/DME . . . . . . . . . . . . . . . . . . . . . . . . . . . . 114IV.2.3 Tert-Butanol/DME . . . . . . . . . . . . . . . . . . . . . . . . . 117IV.2.4 Phenol/DME . . . . . . . . . . . . . . . . . . . . . . . . . . . . . 118IV.2.5 Formic acid/DME . . . . . . . . . . . . . . . . . . . . . . . . . . 123IV.2.6 Non-specific bonding to oil constituents . . . . . . . . . . . . . . . 126IV.2.7 Data analysis . . . . . . . . . . . . . . . . . . . . . . . . . . . . . 126
V Molecular AssociationMechanisms Governed by van derWaals Forces 131
Contents xix
V.1 Method development: THz spectroscopy of weakly bound van der Waalscomplexes . . . . . . . . . . . . . . . . . . . . . . . . . . . . . . . . . . . 131V.1.1 Para-hydrogen as matrix host material . . . . . . . . . . . . . . . . 132V.1.2 Preparation of para-hydrogen . . . . . . . . . . . . . . . . . . . . . 133V.1.3 Experimental measurement of conversion efficiency . . . . . . . . . 134V.1.4 Helium immersion based preparation setup . . . . . . . . . . . . . 137V.1.5 Closed-cycle cryocooler based preparation setup . . . . . . . . . . . 139
V.2 Carbon Dioxide – Water . . . . . . . . . . . . . . . . . . . . . . . . . . . 141V.3 Carbon Disulfide – Water . . . . . . . . . . . . . . . . . . . . . . . . . . . 144
V.3.1 Semi-experimental dissociation energy of CS2··H2O . . . . . . . . 144V.3.2 CS2·(H2O)2 Ternary Complexes . . . . . . . . . . . . . . . . . . . 149
V.4 Carbonyl Sulfide – Water . . . . . . . . . . . . . . . . . . . . . . . . . . . 155V.5 Hydrogen Sulfide – Water . . . . . . . . . . . . . . . . . . . . . . . . . . 158V.6 Concluding remarks . . . . . . . . . . . . . . . . . . . . . . . . . . . . . . 160
VI Conclusions 163
A Closed cycle p-H2 converter blueprints 167
B True Boiling Point Distillates 177
C List of Drill Core Samples 187
D Peer-Reviewed Journal Publications 189D.1 Highly localized H2O librational motion as a far-infrared spectroscopic probe
for microsolvation of organic molecules . . . . . . . . . . . . . . . . . . . . 189D.2 THz spectroscopy of weakly bound cluster molecules in solid para-hydrogen:
a sensitive probe of van der Waals interactions . . . . . . . . . . . . . . . . 197D.3 High-Resolution Infrared Synchrotron Investigation of (HCN)2 and a Semi-
Experimental Determination of the Dissociation Energy D0 . . . . . . . . 208D.4 High-resolution synchrotron terahertz investigation of the large-amplitude
hydrogen bond librational band of (HCN)2 . . . . . . . . . . . . . . . . . 216
Bibliography 223

xx
CHAPTER IIntroduction
If all you have is a hammer, everything looks like a nail.ABRAHAM MASLOW, The Psychology of Science, 1966
Since the discovery of oil, it has become a major part of contemporary industry. From it’sfirst notable appearance in history, found in a coal mine in Scotland and distilled to be usedas lamp oil, to modern times, oil-based products have found their way into every aspect of ourlives1. Now, crude oil as a resource is of pivotal importance for international economics, pol-itics and technology. From food packaging to combustion engine, society is now completelyreliant on crude oil resources.
The primary area of consumption of oil material is for production of refined gasoline.While it is quite possible that in the future this type of consumption is going to decline withdevelopment of renewable sources of energy and electrical transportation, it is unlikely thatthe demand will cease to exist, with many commonly used materials using oil as a convenientprecursor.
The first oil well was drilled by Colonel Edwin L. Drake and was 21 m deep. This eventhas kickstarted the Pennsylvania oil rush and is considered the first commercial-scale extrac-tion of oil2. At the dawn of the petroleum industry extraction of oil was comparatively cheap,as natural gas contained in the underground drove the oil to the surface. Decades later, pro-duction of many fields is no longer profitable when using remaining natural pressure. Yet inmany cases, only a very small portion of original oil in place has been extracted, leading tothe development of technology to improve total recovery. The most simple solution, that inthe industry is called “secondary” recovery, is using water flood or gas injection to generatepressure and drive oil to the surface at another well3. In many cases these days, wells evenstart their production from the secondary recovery stage.
Eventually secondary recovery loses its profitability as oil is recovered, however significantamounts of oil can still remain in the reservoir. Residual oil, depending on the type andgeology of the reservoir is immobilized in the porous media of the rock material or is tooheavy. Further recovery improvement requires more sophisticated methods, which in turnrely on a deep understanding of the underlying processes and physical chemistry of the oil.The latter is particularly challenging due to the complex and diverse composition of the crudeoil4.
2 I Introduction
Enhanced oil recovery (EOR), also generally known as tertiary recovery, is focused onchanging physical parameters that would significantly alter oil hydrodynamics in the reser-voir. Examples are polymer flooding, miscible gas, solvent, steam and fire injection. Thesetechniques alter physical properties such as viscosity, density, or interfacial tension on theoil/water surface. Most widely used is carbon dioxide gas injection, which strongly dependson the reservoir temperature, pressure and oil composition.
A combination of effects comprising surface tension, physical and chemical adsorptionetc. that define the interaction of oil with the solid matrix of the reservoir in petroleum engi-neering has traditionally been referred to as wettability5. Since the nature of the phenomenais highly complex, for years it was primarily evaluated experimentally. With its mechanismspoorly understood to this day, it is now a subject of many studies. Obviously, the adsorptionmechanism is strongly related to microscopic interactions in the oil bulk and on the surfacesof the rock, oil and brine6. Careful investigation of these interactions is necessary to constructaccurate models of EOR.
Another component of a successful model, from a chemistry side of the problem, is adetailed understanding of the oil composition. Having accurate models for all kinds of inter-actions possible in the system, it is very important to know the composition of the crude oilto properly build the model. It is well understood that polar compounds are a determiningfactor in defining the properties of the liquid, and so are other properties, such as maturityand aromatic content7.
Intermolecular interactions are at the core of the vast majority of known physicochemi-cal processes. The combination of all specific and non-specific forces between the moleculeswill determine phase behavior, chemical reaction pathways via mutual orientation of the frag-ments, solubility etc. Hydrogen bonding is an all-important factor when it comes to interac-tions involving polar molecules. As such, accurate simulation of the phenomena is pivotal forsolving practical issues all across the industries.
From the perspective of the petroleum industry, plenty of application cases can be found,where hydrogen bonding in particular and intermolecular interactions in general are the driv-ing mechanisms behind both up- and downstream processes - ranging from oil recovery, togas capture and desulfurization procedures8,9.
Solvent injection today is a mature enhanced oil recovery technique, involving, as namesuggests, introducing a solvent in the flooding stage of a well. The solvents could be hydro-carbons, CO2, and others. Primary considerations in these techniques are usually focused onhow the introduced “solvent” would affect the physical properties of the fluid, impacting onthe flow. Proper economical analysis would require a model that is able to estimate solubilityand phase behavior at the given reservoir conditions and find the optimal EOR strategy. Such
I Introduction 3
models are usually constructed based on limited PVT (pressure/volume/temperature) data ofmixtures consisting of several components of interest, to which polynomial equations are fit-ted10. The parameters obtained are often not particularly accurate in the scope of the intendedapplication, while also very limited by the specific origin of the data. For example, a PVTmodel of a DME/oil/brine mixture11,12 established with a specific oil may not be immediatelyapplicable if the crude oil composition is very different from the one that was used, and wouldnot provide much help in description of surface interactions, where the chemical compositionof phases and dominant factors in the interactions themselves strongly differ from that of thebulk phase.
Considering how infinitely diverse the application cases could be, whether it is an EORscenario or green house gas capture process, it becomes clear that mathematical models re-quire more robust thermodynamical basis, since empirical data cannot be collected for everycase. While a very fundamental approach, such as in-depth ab initio treatment is equally outof reach, there are still possibilities to obtain a good understanding of intermolecular interac-tions by taking a “molecular” approach and closing in on the individual components of theintermolecular interactions.
The objective of this work is to investigate hydrogen bonding and non-specific interactionson a set of oil recovery relevant model interactions and obtain better quantitative measures ofthe bond energy at different levels of abstraction, so that the result could be applied to thebroadest possible number of tasks. This task is preceded by the importance of investigatingcomposition of crude oil, exemplified by studies of oil samples from the Danish North Sea.Due to the fact that interactions in bulk are often defined by specific functional groups, in-frared spectroscopy can serve as powerful tool for detecting and quantifying presence of thiskey components. The contribution of this study is primarily in finding chemical correlationsin oil composition and linking it to the geographical distribution of extraction points in theNorth Sea. Combining the knowledge of both directions should prove valuable in the de-velopment of enhanced oil recovery techniques in the future, and in the improvement of ourunderstanding of complex fluid properties in general.
4 I Introduction
I.1 Crude oil production and recovery methodsIn the general case, an oil well produces only crude oil with natural gas dissolved in it.
Pressures in the underground is much higher, which result in crude oil degas when broughtto the surface. The liquid is comprised of a light oil fraction and heavy bitumens, with a ratiovarying strongly among different oil reservoirs. Crude oil mostly includes alkanes (paraffins),cyclic alkanes (naphtenes), aromatic and various sulfur-, nitrogen- and oxygen- containingcompounds. Oil also contains trace amounts of metals such as iron, nickel, copper and vana-dium13. Elemental compositions are comparatively stable from field to field, with a carboncontent ranging from 83% to 85%, and H from 10% to 14%. The largest variation in compo-sition is observed for sulfur, with it’s content being anywhere from 0.05% to 6%.
The chemical and structural compositions, on the other hand, strongly depends on the oilfield14. Oil is usually found with “gas cap” of natural gas above it, and saline water that ismixed with it or sunken below. Oil that can be extracted using conventional techniques andoil wells is referred to and “conventional oil”. Oil can also be found in the form of heavy tarthat has to be heated up to flow. Mixed with sand it forms extra heavy bitumen. This form ofcrude oil comprises around third of world oil resource, with another third being various heavyoils. These two groups are referred to as “unconventional oil”.
Many aspects can govern oil-brine-solid interactions, but one of the pivotal ones is thecomposition. It goes without saying that heavier and polar compounds contribute to increaseddensity and viscosity of oil. Some of the oil components are interfacially active and can alterwetting, although whether this actually occurs depends on the total composition and the en-vironment. The temperature is the dominant ambient parameter affecting wetting of the rocksurface, while pressure plays a minor role in the first approximation of the condensed phase,as investigated by Hjemeland4.
It is important to mention, that when practical systems are considered, wetting is alwaysa competition between brine and oil. Increasing temperature from ambient to reservoir con-ditions was found to alter wetting from oil-wet case to water-wet, with gradual transitionbetween those states at intermediate temperatures.
Precipitation of asphaltenes or heavy oil aggregation may occur when paraffin liquid areintroduced. This also depends on the type of oil, and has to be considered in practical appli-cations, e.g. solvent flooding. Solvent or precipitant effects on the solvent-oil mixture can beestablished from refractive index measurements15.
I.2 The chemical composition and physical chemistry of crude oil 5
I.2 The chemical composition and physical chemistry
of crude oilOil characterization is the representation of oil properties with a set of measurable param-
eters. Such parameters include specific and API (American Petroleum Institute) gravities,PVT measurements, estimation of oil maturity, degree of substitution in aromatic systems,presence of oxidized compounds, bacteria etc. Initially, detailed characterization of the crudeoil was mostly a concern for the design of refining processes and exploration, but more re-cently it has become apparent that it is also necessary for exploration, recovery optimizationand to estimate the volume of the reservoir.
Oil maturity defines the state of oil in the generation process. Maturation occurs throughdiagenesis and catagenesis processes in the oil’s source rock. The majority of crude oil isformed by the catagenesis and metagenesis of biomaterial. Diagenesis is the chemical reactionsthrough which oxygen, nitrogen and sulfur are removed from the organic matter leading to anincrease in hydrogen ratio of the sedimentary organic material. This process occurs within thefirst few thousand years with temperatures up to 50°C. The presence of iron during that processalso improves the quality of oil, as it strongly binds the sulfur away from organic compoundsin an inert FeS solid16. The substance formed at this stage is referred to as “kerogen”.
During catagenesis, kerogen is exposed to thermal degradation reactions, in which doublebonds are reduced, compounds are cracked or condensed. These reactions require temper-atures in the range between 60-200°C. Metagenesis is the last step in the maturation of oil.Occurring above 150°C, this process cracks the organic molecules into smaller fragments andcarbonizing matter, evolving methane, hydrogen sulfide, carbon dioxide and nitrogen. Thegenerated petroleum then migrates until it is trapped and accumulated in a reservoir.
The presence of bacteria alters and broadens the transformation pathways. Hydrocarbonsare oxidized and degraded by aerobic and, to a lesser extent, anaerobic bacteria often present inoil. Additionally, surface active compounds, produced this way, cause emulsification of oil inbrine. Most strains target medium sized n-alkanes (C12-C18). The reason for this selectivityis that small hydrocarbons are toxic to bacteria, dissolving their cellular membrane, while longchained hydrocarbons are solid and insoluble for degradation in bacteria17,18. A certain typeof bacteria is capable of reducing sulphate ions at the expense of hydrocarbons (eq. I.1).
C10H22 + 7.75 SO42− + 5.5 H+ → 10 HCO3
− + 7.75 H2S + H2O (I.1)
Anaerobic oxidation of hydrocarbons results in generation of sulfide ions and acidifica-tion of the reservoir. This becomes a major concern, when using sulphate-rich seawater forinjection19,20.
6 I Introduction
The geological conditions of oil maturation lead to substances with very different com-position and properties, quality and production considerations. Many methods have beendeveloped to efficiently gather sufficient data to describe the oil. After decades of production,the world industry is now shifting towards heavier crude oil slates and deeper production wellsin more complicated matrices.
Likewise, the focus of the scientific advances has also been moved to heavy oil properties,metal and trace compound identification. Advancements in gas chromatography and mass-spectrometry has significantly enhanced the amount of molecular data received from a sample.Petroleomics is becoming increasingly important to correlate obtained data, as the flow of datahas exceeded the level at which it can be utilized for concise decisions by an analyst. Now thegoal is to develop tools to correlate and use all the available data for applied modeling.
I.2.1 Characteristics of oil and analytical methods
The following is a brief overview of the most important parameters commonly used inpetroleum industry to describe a given oil, and the analytical techniques behind them.
API GRAVITY. The most basic of the parameters that could be attributed to the oil is thespecific gravity. Traditionally, the API (American Petroleum Institute) gravity scale was usedin the industry. It is a measure of how heavy the oil is compared to water, and is linked to theinverse density of the liquid. an API value lower than 10° means that the oil is heavier thanwater, and, conversely, API higher than 10° defines light oil that would float on water. Thenumerical definition of the term is given by eq. I.2.
𝛾𝐴𝑃𝐼 = 141.5𝑆𝐺 − 131.5 = 141.5 ⋅ 𝜌𝑤𝑎𝑡𝑒𝑟
𝜌𝑜𝑖𝑙− 131.5 (I.2)
where: 𝛾𝐴𝑃𝐼 − API gravity value,𝑆𝐺 − specific gravity,𝜌𝑤𝑎𝑡𝑒𝑟 − density of water,𝜌𝑜𝑖𝑙 − density of the oil.
Generally, light crude oil with API gravity above 40° is the most preferable grade. Crudeoil with API gravity lower than 10° is considered bitumen, a heavy oil requiring further pro-cessing. The standard method to estimate the density and the API gravity of the oil sampleis by using the oscillating U-tube method as described by the ASTM D1298 standard.
I.2 The chemical composition and physical chemistry of crude oil 7
TOTAL ACID/BASE NUMBER. Total acid number (TAN) is the measure of acidity of the sam-ple and is defined as amount of potassium hydroxide (KOH), in milligrams, that is used toneutralize the acids contained is one gram of oil. TAN is an important measure of oil qual-ity and indicates possible challenges with corrosion, that may occur during transport andrefinement of the oil. ASTM D664 is an example of standard methods to measure TAN.Potentiometric titration is done with a glass electrode for non-aqueous media referenced byan Ag/AgCl electrode, with the titrant being an isopropanol solution of KOH, standardizedby the usual potassium hydrogen phtalate. Sample is dissolved in chloroform/isopropanolmixture.
The total acid number can be also estimated by other techniques, e.g. infrared spec-troscopy, by using statistical methods combined with a training set. Such approaches areadvantageous due to much faster measurement procedures, when compared to titration, oncethe method is established in the lab for a particular sample type21.
The total base number is defined as the equivalent quantity of potassium hydroxide (inmilligrams) per gram of oil sample. Determination is carried out by forward potentiometrictitration with perchloric acid solution as the titrant. A quantitative method based on mid-infrared spectroscopy is established, based on measurement of the carboxylate ions, whichare formed after neutralization of trifluoroacetic acid22. High TBN oil additives find applica-tion in lubricants such as motor oil, as they help neutralize acids and prevent some corrosionmechanisms.
SARAANALYSIS. Saturates, Aromatics, Resins and Asphaltenes (SARA) is an analysis thatinvolves separation of an oil sample into constituents based on their “polarity”, forming theaforementioned fractions. The work on the approach dates back to 1972, and the methodsdeveloped by Jewell and co-workers23. The SARA does not refer to a particular approach, butrather the goal of the analysis. Hence, multiple standard techniques are certified by ASTMand used in the industry, while in the research laboratories method are custom-tailored to beperformed in a specific way required by the study. So in general, results cannot be comparedacross techniques directly and only broad conclusion could be drawn without using the exactsame method to characterize the oils.
The saturates fraction consists of nonpolar molecules of linear, branched and cyclic struc-ture. Aromatics include one or more aromatic rings, and are more “polar” owing to higherpolarizability of the conjugated system of 𝜋-electrons. Resins and asphaltenes are polar frac-tions with oxygen- and nitrogen-containing substituents, such as acids, amides, ketones, etc.The difference between them is defined by the fact that the resins fraction is soluble in excessof heptane, whereas asphaltenes are not.
8 I Introduction
The most basic separation can be done by mixing an oil sample with n-heptane to sepa-rate asphaltenes out as precipitate, that can be then measured by weight. The rest, maltene,can then be loaded on a chromatographic activated silica column, preconditioned with hep-tane, and then eluted sequentially with heptane (saturates), toluene (aromatics), followed byvariations on polar eluent mixtures, such as toluene/methanol, methanol/chloroform, or ace-tonitrile (resins).
The classical ASTM procedure is a clay-gel adsorption chromatography method, formingthe basis of the D2007 standard. Other techniques generally can be divided into two cate-gories. First, the high-performance liquid chromatography based procedures24 coupled withmodern columns employing an NH2-bonded solid phase makes it feasible to separate heavyfractions of petroleum. The major advantage of this family of methods is that they could bewell automated and expanded for a large-throughput routine analysis, provided the asphaltenefraction is removed beforehand, as these compounds strongly adsorb to the column materialor precipitate when the eluent for the lighter fractions is introduced25.
Second, thin-layer chromatography (TLC) based methods are the fastest way to performSARA analysis. Here, unlike in the HPLC based procedures, asphaltenes do not have toremoved prior to the analysis. Separation is performed on silica-coated quartz rods. A pop-ular variant of the technique is to combine TLC separation with a flame ionization detector(FID), developed into well-automated quantitative procedure by Suzuki26. TLC-FID hassince become very popular and has been implemented in a form of dedicated instrumentswith minimal sample requirements, e.g. the Iatroscan instrument.
As mentioned above, results from different approaches are not directly comparable. More-over, even when the measurement is done with the same method can produce results highlydependent on the type of sample studied. As such TLC-FID suffers from discrepancies in-volving volatility of the sample, and only for medium and heavier oils could the result becompared to the ASTM number27. The way forward is clearly favoring HPLC approaches,as the means to correct for the errors associated with the compounds boiling up to 250°Ccounter the main advantage of the TLC method - the speed. HPLC can also easily improveon some of the aspects over the ASTM method, e.g. losses of volatile fractions, albeit smallbut still present and hard to control with the reference method. With the respect to timing,both techniques require asphaltenes removed, which takes about two days by common prac-tice. Beyond that a typical measurement time is estimated to be ca. 1 hour for the HPLCmethod and 20 hours for the ASTM one, with the sample requirements of 1 gram for theHPLC and 10 grams for the ASTM.
Infrared spectroscopy is sometimes applied for fast SARA analysis in an approximatemanner, employing statistical methods with a training set. A partial least squares (PLS) based
I.2 The chemical composition and physical chemistry of crude oil 9
method was applied in a attenuated total reflectance infrared (ATR-FTIR) spectroscopicstudy of Colombian oil samples from various locations in the country28. The results werecross-matched to the ATR-FTIR spectra of the oils. PCA allowed to identify correlationsacross samples and define groups based on the indirect compositional information.
TPHANDPAHANALYSIS. The aromatic constituents of crude oil are important in determin-ing the useful properties of the end petroleum products. Chemical analysis of polyaromatichydrocarbons (PAHs) is a focus of many research groups, in no small part due to environmen-tal concerns associated with these compounds29–31, such as toxicity and carcinogenic proper-ties. Analysis is usually carried out on a GC instrument with FID or MS detectors, althoughmany more methods are available. The former is used for the aliphatic components. A mass-detector is particularly useful to detect compounds in the aromatic fraction, that help directlyidentify specific types of petroleum products, e.g. the ratio of phenanthrenes to dibenzothio-phenes32.
Apart from the GC-MS, the most frequently used methods are infrared (IR), Raman, andfluorescence spectroscopies, immunoassays (IMA) and gravimetry. Most recent techniquesjoining the lineup are the portable GC-MS and near-infrared spectroscopy based approaches,sometimes coupled with visible range spectroscopy33–35, both advantageous in the field. Inthe laboratory, standard GC-MS remains the preferred method.
Some time ago, the IR methods based on detection of the C-H stretching modes in mid-infrared spectral region36, were the standard in determining total petroleum hydrocarbons(TPH), and to an extent could be applied to the full SARA analysis when combined withadvanced spectral processing, like differential spectroscopy, PCA and PLS. In terms of theprocedure, technique is attractive due to low cost, speed, and fairly high sensitivity. For quanti-tative analysis of PAH, the most popular solvent applied was 1,1,2-trichlorotrifluoroethane37.However, following the ban of Freons, caused by the environmental concerns, the applicabil-ity of the IR methods has gone down, eventually succeeded by the advent of GC-MS methodsas the recommended standard technique. IR spectroscopy is still actively used for fast in situscreening of samples in environmental analysis, using modern sample probing techniques, e.g.ATR and diffused reflectance (DRIFT)35. Owing to the broad response of these techniques,application is often expanded to the determination of polar compounds, sulfur etc38.
In the standard GC-FID method, samples are kept at 4°C until solvent extraction iscarried out and then dried by sodium sulfate. Samples for the analysis are produced the sameway as for the SARA aliphatic fraction. GC-FID is the standard method to determine TPHas recommended by the British Standard Institution, ISO and EPA.
A mass-spectrometer is an alternative detection method to the FID, providing capability
10 I Introduction
for a more detailed analysis based on the molecular ion or fragmentation pattern producedat the ionization stage39. MS can be coupled with both LC and GC for the determinationof the PAHs, depending on the goal of the measurement. As such, some procedures donot resolve certain groups of compounds, e.g. anthracene and phenanthrene, while othersprovide varying degrees of quantitative accuracy and other parameters to be adjusted. Themost important part is the selection of the stationary phase, usually carefully chosen for aparticular case40–42. Widely used for this purpose polysiloxane columns with phenyl andmethyl substitutions. Despite wide use of GC-MS, it is limited by the fact that it requiressamples that are volatile and thermally stable during the analysis, often requiring extensivesample separation followed by derivatization of some fractions43.
Electrospray ionization approach to petroleum material developed by Fenn44, allowedmass-spectrometry of polar crude oil components without any additional fractionation. Thisapproach has later been coupled with the Fourier-transform ion cyclotron resonance MS (FT-ICR-MS) technique45. Over 3000 nitrogen-containing species were found by that method,despite the fact that in general hydrocarbon matrix is not ionized very efficiently still. For theanalysis of saturated hydrocarbons desorption electrospray ionization (DESI) was pioneeredby Wu et al46. A more detailed description of modern FT-ICR-MS and GC-TOF typetechniques are given in the in-depth review by Ryan Rogers47.
BIOMARKERS. Biological markers are important compounds originating from living organ-isms, primarily lipids preserved over ages in the underground. These molecules can be stablefor millions of years in an oxygen-free environment, with little change from the biogenicprecursor (like steroids, hopanoids).
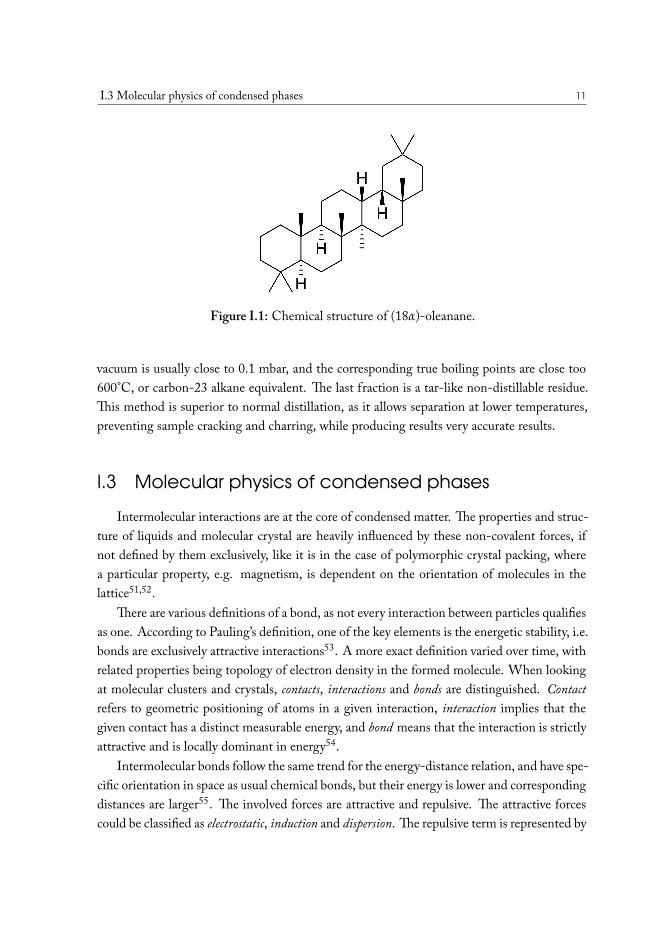
Biomarkers are mostly carbohydrates containing oxygen, nitrogen, sulfur atoms, with oc-casional heavy metal elements, such as Fe. Despite quite low abundance in crude, on the orderof hundreds ppm, they are often used as indicators of age and origin of the oil, e.g. bacteria,algae, plants. Markers can be used to correlate oils to their source rock, estimate environmen-tal conditions of the deposition (e.g. marine, terrestrial etc.), thermal history and maturity ofthe oil. For example, presence of (18𝛼)-oleanane is evidence that deposition is from eitherTertiary or Cretaceous period48,49. A pristane to phytane ratio below one is an indicator ofthe fact that the environment during the deposition was hypersaline50.
Biomarkers have become an important factor in oil exploration and have been extensivelyresearched by the oil companies.
TRUE BOILING POINT DISTILLATION. The method is used to determine boiling points andphase behavior properties of crude oil and its constituents. Conceptually it is a standardstep-wise distillation procedure, which is run under gradually lowered pressure. The highest
I.3 Molecular physics of condensed phases 11
Figure I.1: Chemical structure of (18𝛼)-oleanane.
vacuum is usually close to 0.1 mbar, and the corresponding true boiling points are close too600°C, or carbon-23 alkane equivalent. The last fraction is a tar-like non-distillable residue.This method is superior to normal distillation, as it allows separation at lower temperatures,preventing sample cracking and charring, while producing results very accurate results.
I.3 Molecular physics of condensed phasesIntermolecular interactions are at the core of condensed matter. The properties and struc-
ture of liquids and molecular crystal are heavily influenced by these non-covalent forces, ifnot defined by them exclusively, like it is in the case of polymorphic crystal packing, wherea particular property, e.g. magnetism, is dependent on the orientation of molecules in thelattice51,52.
There are various definitions of a bond, as not every interaction between particles qualifiesas one. According to Pauling’s definition, one of the key elements is the energetic stability, i.e.bonds are exclusively attractive interactions53. A more exact definition varied over time, withrelated properties being topology of electron density in the formed molecule. When lookingat molecular clusters and crystals, contacts, interactions and bonds are distinguished. Contactrefers to geometric positioning of atoms in a given interaction, interaction implies that thegiven contact has a distinct measurable energy, and bond means that the interaction is strictlyattractive and is locally dominant in energy54.
Intermolecular bonds follow the same trend for the energy-distance relation, and have spe-cific orientation in space as usual chemical bonds, but their energy is lower and correspondingdistances are larger55. The involved forces are attractive and repulsive. The attractive forcescould be classified as electrostatic, induction and dispersion. The repulsive term is represented by
12 I Introduction
the Pauli exclusion principle56 - electrons from interacting fragments are unable to penetrateeach other’s occupied orbitals when electron spins are the same, giving rise to the exchange-repulsion term:
𝐸𝑒𝑥𝑐ℎ = 𝐴 ⋅ 𝑒2𝑟𝑎0 (I.3)
where: 𝐴 − empirical constant,𝑟 − intermolecular distance,𝑎0 − Bohr radius of the atom.
This term is always repulsive, particularly at close range, creating characteristic energy wellthat defines the closest range to which the fragments could approach each other. The inter-action between permanent charges can be described by the Coulomb equation expanded intomultipole components (eq.I.4), and constitutes the electrostatic term of the interaction en-ergy. Components in the presented partial equation below are charge-charge, charge-dipoleand dipole-dipole terms respectively.
𝐸𝑒𝑙.𝑠𝑡𝑎𝑡 = 14𝜋𝜀0
𝑞𝐴𝑞𝐵𝑟 − 1
4𝜋𝜀0
𝑞𝐴𝜇𝐵𝑟2 𝑐𝑜𝑠𝜃−
− 14𝜋𝜀0
𝜇𝐴𝜇𝐵𝑟4 (2 𝑐𝑜𝑠 𝜃1 𝑐𝑜𝑠 𝜃2 − 𝑠𝑖𝑛 𝜃1 𝑠𝑖𝑛 𝜃2 𝑐𝑜𝑠 𝜙)... (I.4)
where: 𝑞𝑁 − charge of particle N,𝜇𝑁 − dipole moment of particle N,𝑟 − distance between particles,𝜀0 − vacuum electric permittivity,𝜃, 𝜙 − angles to distance vectors.
As seen from the equation, the strength of this interaction is dependent on both themagnitude and orientation of the multipoles, and higher-order terms tend to decrease rapidlywith distance. Highly symmetric system often have near zero low-order components andthe interaction is then dominated by the high-order terms. Equation I.4 does not take intoaccount mutual polarization of the interacting fragments, however there are proper analyticalexpressions to represent this term57.
The induction component (𝐸𝑖𝑛𝑑) is caused by the interaction of the permanent dipoleof one fragment with the induced dipole in the other one. The magnitude of the latter isdependent on the polarizability of the fragment:
I.3 Molecular physics of condensed phases 13
𝐸𝑖𝑛𝑑 = −𝛼𝜇2
𝑟6(3 𝑐𝑜𝑠2𝜃 + 1)
(4𝜋𝜖0)2 ) (I.5)
where: 𝜇 − permanent dipole moment,𝑟 − interfragment distance,𝛼 − polarizability.
The charge-transfer component (𝐸𝐶𝑇) is associated with difference in interaction causedby charge transfer between fragments, when electronic distribution has relaxed. The last at-tractive term, dispersion (𝐸𝑑𝑖𝑠𝑝), also known as London forces, is a nonclassical term thatoriginates from electronic correlation effects. It can be imagined as interaction between in-stantaneous dipoles formed in the molecules. Energy of the dispersive interaction is given bythe following equation:
𝐸𝑑𝑖𝑠𝑝 = −𝐶6r6
− 𝐶8r8
− 𝐶10r10 ... (I.6)
where: 𝐶6,8,10 − empirical constants,r − the position vector.
The dispersion (𝐸𝑑𝑖𝑠𝑝) is generally the weakest term, yet it becomes very important fornon-polar molecules, where the other electrostatic components are non-existent. It is thedriving force behind heavy non-polar compounds existing as liquids at room temperature, e.g.carbon disulfide.
The total electronic energy is then given by the sum:
𝐸𝑒𝑙 = 𝐸𝑒𝑥𝑐ℎ + 𝐸𝑒𝑙.𝑠𝑡𝑎𝑡 + 𝐸𝑖𝑛𝑑 + 𝐸𝐶𝑇 + 𝐸𝑑𝑖𝑠𝑝 (I.7)
The term “van der Waals complex” is used for molecular clusters that are formed almostexclusively due to dispersion and induced dipole-dipole interactions. Rough estimate58 of anaverage bond energy of such type is around 2-8 kJ⋅mol-1, whereas a typical covalent bondis ca. 150-400 kJ⋅mol-1. However, as mentioned above, many contributing factors and theisotropic nature of dispersive interaction make this class quite loosely defined.
Ionic bonds are interactions between particle with non-zero net charge. This class is domi-nated by electrostatic component, namely it’s charge-charge, charge-dipole terms. Examplesof such are ions in solvent or ionic crystal lattice, part of a zwitter-ionic molecule with local-ized charge interacting with a polar solvent, etc.
Hydrogen bonds are intermolecular bonds with a A-H···X topology, where A-H is a hy-drogen bond donor (HBD), and X is the hydrogen bond acceptor (HBA). HBD points in
14 I Introduction
the direction of increased electron density - lone pairs or the bonding 𝜋-electrons. A is usu-ally an electronegative atom, such as oxygen, nitrogen, etc., with a strongly polarized A-Hcovalent bond. To qualify for a hydrogen bond, interaction should fit several criteria59: theforces involved in the bond should be electrostatic, primarily dipole-dipole in case of neutralmolecules, must include partial charge transfer from Y to H, and dispersion; the bond angleshould be close to 180°.
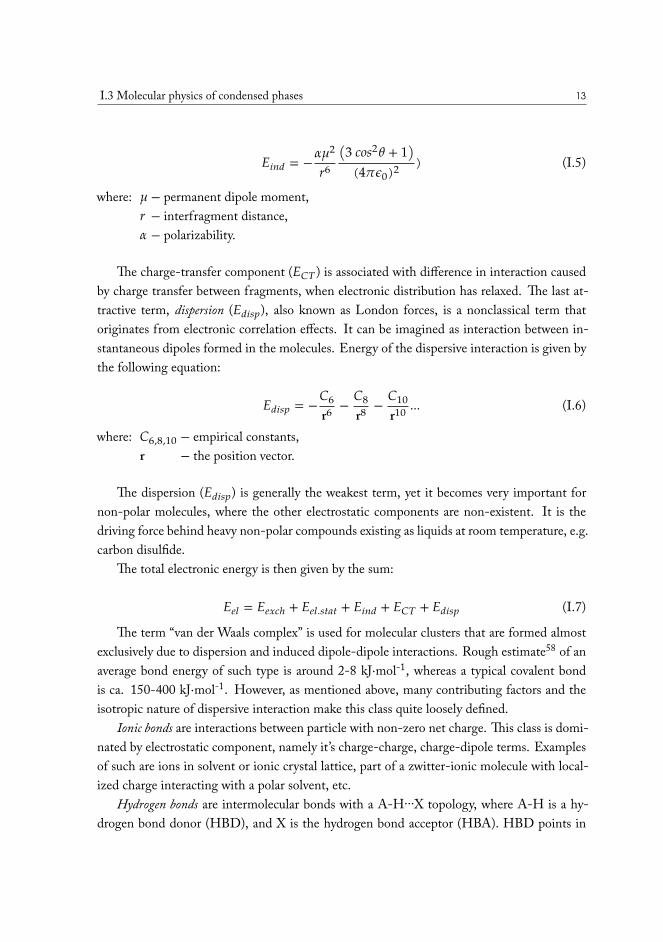
Formation of the hydrogen bond weakens the A-H covalent bond due to charge transfer.This results in spectral red shifts of some vibrational bands, e.g. X-H stretching bands (seefig. I.2). This spectral shift in used nowadays as a measure of the bond strength. In NMRspectroscopy, one can observe 1H chemical shifts up to 20 ppm due to H-bonding. The energyof a hydrogen bond ranges60 between 0.8 and 160 kJ⋅mol-1. The most common example of ahydrogen bond is a O-H···O motif found in water clusters. Based on the energy of the bond,they are loosely classified with respect to “normal” cases, basically those found in water. The“moderate” bonds have energies from 16-60 kJ⋅mol-1, according to this classification61.
Figure I.2: OH-stretching vibrational mode in the water dimer molecular complex.
I.3.1 Molecular vibrational energies in thermodynamic models
Quantum systems fluctuate near their lowest energy point, as described by the Heisenberguncertainty principle62. Molecules are constantly in motion, which can be described by 3Ndegrees of freedom in cartesian coordinates. These degrees of freedom include translation,rotational and vibrational motions. Vibrational modes degrees of freedom constitute 3N -6modes for a non-linear system.
On formation of a molecular cluster, new large-amplitude intermolecular modes areformed from the translational and rotational degrees of freedom of the fragment. Thesemodes tend to have lower frequencies and larger vibrational amplitudes than those linked tocovalent bonds of the fragments, and are associated with the newly formed intermolecularbond, e.g. the hydrogen bond in a water dimer. The contribution from the intermolecu-
I.3 Molecular physics of condensed phases 15
lar modes to the total change in zero-point energy (ZPE) tends to be larger than the spectralshifts of the intramolecular modes, and the difference becomes more important for the weaklybound systems.
Molecular vibrations contribute to the thermochemistry of the cluster formation processas part of the internal energy (U ) of the system. The fundamental vibrational excitations𝜈0→1 comprise ZPE (eq. I.8) of the system E0
63, and typically is the second largest contri-bution to the thermodynamic properties of the process after the electronic energy. At finitetemperatures, a significant portion of the molecules are in vibrationally excited state and fur-ther irradiation invokes transitions from these states as well (e.g. 𝜈1→2,3...), contributing tothe thermal component of the energy. These transitions are called “hot bands”, and their pres-ence complicates the interpretation of experimental data where fundamental bands are sought.In cryogenic conditions the majority of the molecules are in their vibrational ground state, inwhich case only excitations from this state are observed (𝜈0→1,2,3...), and fundamentals couldbe found easier.
𝐸𝑣𝑖𝑏 = ∑𝑖
⎧{⎨{⎩
ℎ𝜈𝑖2 + ℎ𝜈𝑖 𝑒−ℎ𝜈𝑖/𝑘𝑇
1 − ℎ𝜈𝑖 𝑒−ℎ𝜈𝑖/𝑘𝑇
⎫}⎬}⎭
= 𝑍𝑃𝐸 + ∑𝑖
ℎ𝜈𝑖 𝑒−ℎ𝜈𝑖/𝑘𝑇
1 − ℎ𝜈𝑖 𝑒−ℎ𝜈𝑖/𝑘𝑇 (I.8)
where: ℎ − Planck constant,𝜈𝑖 − the i-th normal vibration frequency,𝑘 − Boltzmann constant,𝑍𝑃𝐸 − zero-point energy.
The rotational and translational energy components are both 32𝑘𝑇 for a general non-linear
polyatomic molecule, and is close to zero in cryogenic matrix conditions. In case of a harmonicoscillator, the zero-point energy can then be estimated as the half-sum of fundamental modes’vibrational frequencies64.
𝑈 = 𝐸𝑒𝑙 + 𝐸𝑍𝑃𝐸⏟⏟⏟⏟⏟E0
+ 𝐸𝑣𝑖𝑏,𝑇 + 𝐸𝑟𝑜𝑡 + 𝐸𝑡𝑟𝑎𝑛𝑠⏟⏟⏟⏟⏟⏟⏟⏟⏟⏟⏟Thermal contribution
(I.9)
Internal energy is linked to the Gibbs free energy (𝐺) by the following relation:
𝐻 = 𝑈 + 𝑘𝑇 (I.10)
𝐺 = 𝐻 − 𝑇𝑆𝑡𝑜𝑡 (I.11)
The accurate estimation of the Gibbs free energy of a process is very important for theindustry. Depending on the scale, even small improvements could lead to crucial gainsin efficiency. The development of versatile simulation models requires a molecular route
16 I Introduction
towards the solution. A proper understanding of all involved interactions in the system andtheir strengths is critical, and is not limited to simple force fields. In the case of water, coined“the universal solvent”, complex networks of hydrogen bonds are present in liquid phase, witha strong cooperativity observed.
It has been shown that the two-body term, i.e. the interaction limited to formation of awater dimer, accounts for about 80% of the cohesive energy of liquid water. Inclusion of thethree-body term brings that number up to 99%65. It is debatable whether this is enough fora particular task, but it is clear that real-life macroscopic systems are very dependent on com-plex many-body interactions, and as it is often in modern practice, fluid systems utilized inthe industry consist of multiple components, where one has to account for all molecular inter-actions. Such diversity of possible systems encountered cannot be universally approached onempirical level. It can be seen from the long history of many solvent scales created based ex-perimental observables. In lieu of advanced experimental techniques allowing direct insightsinto molecular, physical properties, e.g. dielectric constant, or more extensively - chemicalprobes, have been used to establish dependencies between chemical composition of a liquidand it’s solvating capabilities.
A notable chapter in that story would be the solvatochromic probes, particularly the familyof compounds specifically designed for that purpose and collectively known as “Reichardt’sdyes”66. These dyes posses an electronic transition in the NIR-Vis range, associated with along-range charge transfer and resulting in a drastic change in dipole moment, in which case,the exact energy of this transition is dependent on the solvent shell. An extensive amountof data has been accumulated over the years with commonly used solvents. There is littlecorrelation with simple physical estimates of solvent polarity, and the vast majority of thesolvent mixtures exhibit preferential solvation and non-linear behavior with inflection point.The latter can only be explained by interaction with the in-situ formed component, e.g. mixedsolvent complex67–69.
I.3.2 From molecules to building bricks of the condensed phase
Direct experimental measurements are only meaningful when small systems are concerned.Most of the spectroscopic studies usually concern small isolated fragments or “pure” systemsthat could be assumed to an extent being representative of the certain molecule that formsit, e.g. solid powder of a pure chemical. Mixtures are often approached in a phenomenolog-ical way, where physical observables are linked to properties indirectly, typically by means ofstatistical correlations and chemometrics.
I.3 Molecular physics of condensed phases 17
Spectroscopic observables could provide the most accurate characterization of a given in-teraction, but complete understanding is required to use them and thus the method is limitedto few molecules. When combined with theory, a reliable thermochemical picture of a smallbuilding block can be obtained. These blocks are far less diverse than bulk phases that theyform. By examining a few of the blocks, general conclusions on the underlying mechanismscan be made, that allow to predict properties of similar blocks. Forming a condensed phaseinvolves joining many blocks together, but the larger the block, the less important it is howit’s joined to other blocks. The concept is similar to surface tension, where relative importanceof the surface diminishes as small droplets aggregate into a bulk liquid. It is our goal to ap-proach bulk properties a through very detailed understanding of small molecular aggregates- clusters, composed of two or three molecules, establishing the link between their structureand role as a building block in the bulk, and use this knowledge to expand onto other possibleconfigurations that are present in real oil. From this point, feasible thermodynamic modelscan be constructed to simulate the behavior of a liquid under given conditions.
Modern theoretical methods have reached formidable level of accuracy when it comesto structures and electronic energies. Direct experimental data on vibrational transitions forvarious combinations of dimers and trimers would allow to the establishment of accurate semi-experimental estimates of interaction strengths, as well as detailed understanding of both hy-drogen bonding and cooperative effects in complex systems, which can later be implementedin more general thermodynamic models with inclusion of corrected many-body terms. Adetailed description of the theoretical approach used in this work is given in section II.4.
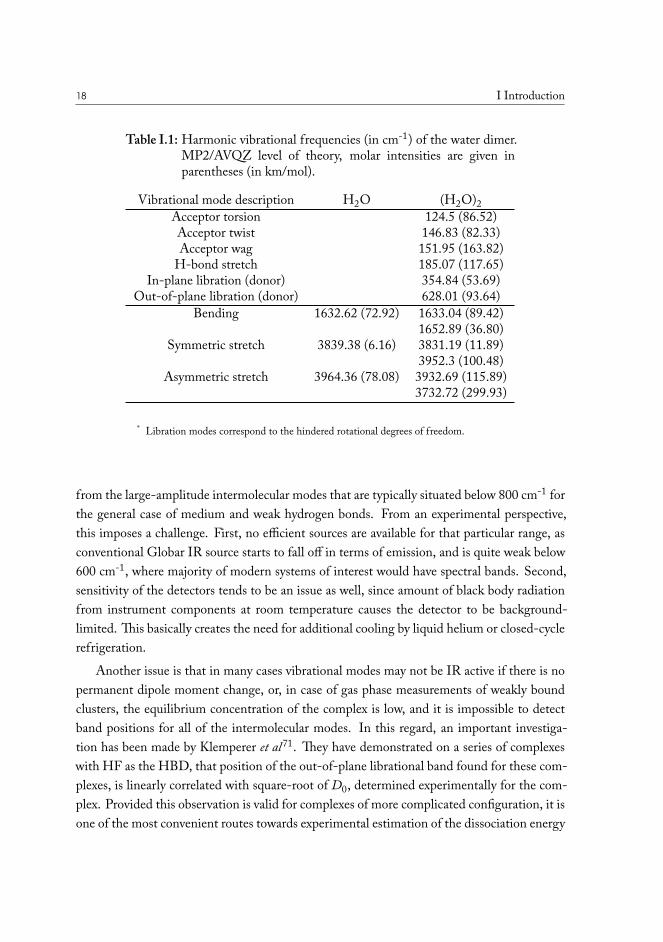
To demonstrate the experimental challenges in determining zero-point energies, thehydrogen-bonded water dimer can be taken as an example. As illustrated in table I.1, thespectral shifts in the intramolecular modes of the water molecule comprise a total change inZPE of -68.9 cm-1. At the same time, the newly formed six intermolecular modes contributea total of 795.6 cm-1. The calculated electronic dissociation energy (De) is -1716.6 cm-1.
In this particular example, the contribution from intermolecular modes is 11 times largerthan the perturbations in the original intramolecular modes. The total zero-point correcteddissociation energy D0 is 989.9 cm-1 and the magnitude of ∆ZPE is 42% of the De value.The deviation from harmonic calculations for the large-amplitude modes usually is around12-20%, translating into ca. 10-15% error in estimation of the D0. This error is unacceptablein the majority of models that deal with the chemical equilibria, since energy differencesare concerned and then relative error becomes even more critical. On top of that, errorsassociated with the electronic structure method, various unaccounted vibrational couplingsand resonances, relativistic effects etc. add up70.
It appears from this (H2O)2 model system, that the most important contribution arises
18 I Introduction
Table I.1: Harmonic vibrational frequencies (in cm-1) of the water dimer.MP2/AVQZ level of theory, molar intensities are given inparentheses (in km/mol).
Vibrational mode description H2O (H2O)2Acceptor torsion 124.5 (86.52)Acceptor twist 146.83 (82.33)Acceptor wag 151.95 (163.82)
H-bond stretch 185.07 (117.65)In-plane libration (donor) 354.84 (53.69)
Out-of-plane libration (donor) 628.01 (93.64)Bending 1632.62 (72.92) 1633.04 (89.42)
1652.89 (36.80)Symmetric stretch 3839.38 (6.16) 3831.19 (11.89)
3952.3 (100.48)Asymmetric stretch 3964.36 (78.08) 3932.69 (115.89)
3732.72 (299.93)
* Libration modes correspond to the hindered rotational degrees of freedom.
from the large-amplitude intermolecular modes that are typically situated below 800 cm-1 forthe general case of medium and weak hydrogen bonds. From an experimental perspective,this imposes a challenge. First, no efficient sources are available for that particular range, asconventional Globar IR source starts to fall off in terms of emission, and is quite weak below600 cm-1, where majority of modern systems of interest would have spectral bands. Second,sensitivity of the detectors tends to be an issue as well, since amount of black body radiationfrom instrument components at room temperature causes the detector to be background-limited. This basically creates the need for additional cooling by liquid helium or closed-cyclerefrigeration.
Another issue is that in many cases vibrational modes may not be IR active if there is nopermanent dipole moment change, or, in case of gas phase measurements of weakly boundclusters, the equilibrium concentration of the complex is low, and it is impossible to detectband positions for all of the intermolecular modes. In this regard, an important investiga-tion has been made by Klemperer et al71. They have demonstrated on a series of complexeswith HF as the HBD, that position of the out-of-plane librational band found for these com-plexes, is linearly correlated with square-root of D0, determined experimentally for the com-plex. Provided this observation is valid for complexes of more complicated configuration, it isone of the most convenient routes towards experimental estimation of the dissociation energy
I.3 Molecular physics of condensed phases 19
for hydrogen-bonded molecular complexes. The reason is that the librational band generallytends to have the highest IR intensity among the intermolecular modes and is situated at thehighest wavenumber.
The question remains to which extent Klemperers’ observed correlation can be trusted forlarge non-linear systems. Since HF complexes presented are mostly linear in structure andrepresent interaction with a fairly small donor molecule, it can be assumed that the interactionis heavily dominated by electrostatic components of the energy. Such assumption is clearly notgrounded even for the cases of hydrates of polar organic molecules. This particular questionwill be investigated more deeply in chapter IV.1.
I.3.3 Spectroscopic methods to obtain thermodynamic data
As for the modern methods of obtaining experimental data, several approaches exist thatcould be applied, depending on the difficulty of the case. Gas phase spectra, as the mostpreferable, may be performed by passing the IR beam through a multi-pass gas cell. An ex-ample of such a cell is installed at the AILES beamline of the Soleil synchrotron facility. Thecell is 2 m long and has a variable path length up to 140 m, employing an optical arrangementdesign by Chernin and Barskaya72. The cell is equipped with a liquid nitrogen cooled jacketand a set of resistive heaters for the mirrors and internal surface of the chamber allowing op-eration between 80 K and 400 K. Due to the gas pressure affecting the width of the spectrallines in the gas phase, the pressure of the sample should be minimal for high-resolution inves-tigations, while the optical path should be maximized or optimized for particular absorptionrange. Using the cooling jacket allows to operate in conditions where appropriate pressure ofthe sample is present, with the minimal ambient temperature. The latter is important as lowertemperature shifts the equilibrium towards complex formation. At high resolution, a highlycollimated and bright probing beam is necessary, and for the far-infrared/THz applicationsthe best solution is synchrotron radiation source. We have performed a study on a HCNhydrogen bonded dimer, where a complete experimental dissociation energy can be extractedfrom the data70,73. The dimer can be used as prototypical system for development of accuratecomputational method for treatment of medium strength hydrogen bonds which, this partic-ular case, are almost entirely attributable to non-dispersive components of the non-covalentinteraction.
Naturally, the beam time at a synchrotron source is very limited and expensive. As thisgas-phase approach considers the rotational-vibrational structure of the bands, molecular sym-metry plays an important role in how the overall intensity is distributed and how complex isthe assignment and the interpretation. In general, this approach is not sufficiently sensitive

20 I Introduction
for asymmetric systems and weaker interactions.Other techniques employed for spectroscopy of molecular complexes are matrix isolation
and supersonic jet expansions. The former involves embedding analyte in a inert gas matrixand frozen solid at cryogenic temperatures. Molecular gas-phase spectra at elevated tempera-tures exhibit broadened lines due to presence of hot bands and various temperature-dependentline broadening effects, something that could be avoided in jet expansions and cryogenic ma-trix conditions.
Figure I.3: Schematic depiction of the supersonic jet expansion process. Random motion ina pressurized chamber is converted into a direct mass flow perpendicular to theorifice.
In a supersonic jet expansion74 a gaseous sample is diluted with a buffer gas, such as he-lium, argon, xenon etc., and stored under elevated pressure in a chamber with a small orifice,through which it is expanded into a vacuum chamber. In the high pressure volume the molec-ular motion is random. The pressure is selected so that mean free path of the gas molecules ismuch smaller than the orifice. In this case only the gas molecules with that have high velocityin the axial direction are able to escape the chamber. Transformation of the chaotic movementinto directed motion requires energy, which comes from the inner energy of the molecules,causing the cooling of the expanded gas.
From that point, particles moving in the molecular beam have nearly the same direction
I.3 Molecular physics of condensed phases 21
and velocity. Since the amount of buffer is significantly exceeding that of the sample, collisionsbetween sample molecules are rare, thus avoiding condensation despite the low temperature.Fine control over concentrations allows to vary content of molecular complexes in the freeflow region of the beam. In this way, many isolated exotic complexes can be formed andmeasured, e.g. HeNO2 fluorescence spectra obtained by Smalley et al75.
Rotational temperatures around 0.1-10 K are typically achieved, while vibrational tem-peratures are higher - 20-150 K. The difference is due to smaller collisional cross section forvibrational motion. Large-amplitude modes though tend to have the larger cross section anddue to lower energy of these vibrations, are also more thermally populated at the equilibriumtemperature. For example, under identical conditions, stretching mode of I2 located at 250cm-1 is cooled to 50 K, while bending mode of NO2 at 750 cm-1 is only cooled down to150 K.
The cooling effect in the jet expansion is affected by the nature of the buffer gas. Despitethe process being purely kinetic, formation of complexes between the sample and carrier gasmolecules has effect on end translational temperature. Therefore, the best choice for the car-rier are noble gases, particularly helium. In some cases using a heavier gas, argon or xenon,can lead to lower vibrational temperatures. Fewer collisions are required to accelerate themolecule to the velocity of the carrier gas, and thus more are available for the vibrational cool-ing further in the stream. This additional cooling comes at the expense higher final rotationaltemperatures though76.
Due to lower sample concentration in the free flow region, the technique is requiring moresensitive detection methods than normal absorption spectroscopy, for the vast majority ofapplications, especially analytical ones. Complex spectroscopy is one of the more demandingapplications, as it is hard to form complexes selectively, and so their signals are low. Especiallychallenging are the studies of mixed complexes involving different molecules. At the sametime, jet expansion requires a continuous flow of the sample during the measurement, andthe sample consumption is extremely high for the technique, which excluded the possibilityto study of rare and expensive samples.
Helium nanodroplets technique involves formation of sub-micron droplets of liquid he-lium in superfluid state near 0.4 K. The helium gas from which these droplets are formed canbe doped with molecules of interest to form complexes in the droplet. A laser beam is thenfocused onto the droplet, where its energy is absorbed by the molecules of the dopant, caus-ing partial evaporation of the droplet. This technique requires tunable laser sources of highintensity77. For THz spectral range, such sources are not yet available. A study of the waterdimer far-infrared spectrum was carried out using the ultrabright free-electron laser sourceFELIX78, although sensitivity was not very high, and such approach is not possible yet for

22 I Introduction
hetero-complexes.Due to the limitations of these techniques mentioned above, the optimal approach for
molecular association studies carried out in this work is matrix isolation spectroscopy. Themethod allows measurements in the full terahertz range with conventional sources, high sen-sitivity and better control over complex formation than most other methods.
CHAPTER IIMethods
II.1 Infrared Spectroscopy
Spectroscopy in the infrared range exploits the fact that molecules absorb light at the reso-nant frequencies of their characteristic molecular vibrations. The requirement for a vibrationto be observed in the infrared spectrum, is that the vibration has to be associated with a changein the permanent dipole moment of the molecule. Each combination of atoms and bonds hasunique set of vibrations, that can be used to recognize a particular structural fragment, suchas a functional group of an organic molecule. The vibrations are virtually linked to “bonds”between atoms, fragment, or molecules, and infrared spectroscopy can viewed as a method todirectly probe the interactions, both intramolecular and intermolecular.
From this point, it is generally a matter of how the sample is presented. Solid or liquidsamples will exhibit all the features of many-body interactions in condensed phase, gas-phasespectra will mostly show isolated molecules. More advanced approaches can lead to multitudeof systems to study. In this work, the matrix isolation method (see II.3) is used to generateisolated molecular aggregates of two-three molecules (complexes), to directly investigate thehydrogen bonding potential of certain classes of molecules of relevance for oil and gas produc-tion.
II.1.1 Infrared spectrometers, optical design and instrumentation
A Bruker IFS 120 Fourier-Transform Infrared spectrometer is used for all experimentswith the immersion type cryostat discussed here. The optical design is shown in figure II.1. Itoperates by passing light from the source through the Michelson type interferometer to thesample, where light is partially absorbed and the rest of it is registered with a detector.
INTERFEROMETER. The heart of the spectrometer is the interferometer. It functions bysplitting the incoming beam into two equal parts on an optical element called “beam splitter”,where one part is transmitted to a fixed mirror, while the other is reflected towards the movingmirror - the scanner. Scanner creates a variable optical path difference between the beamswhen they are recombined. The interference pattern thus obtained allows to reconstruct thespectrum via Fourier transform.
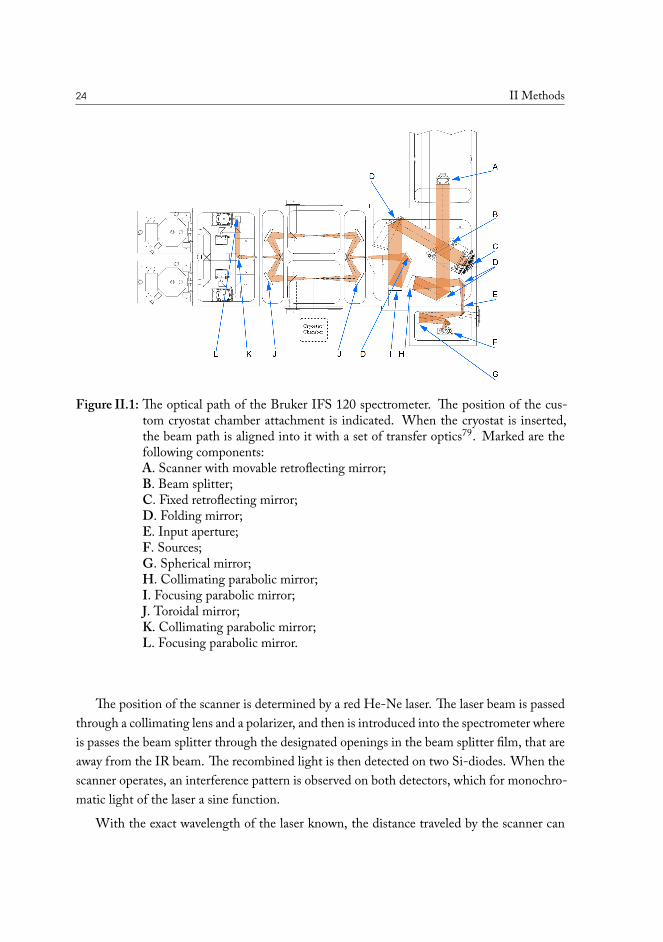
24 II Methods
Figure II.1: The optical path of the Bruker IFS 120 spectrometer. The position of the cus-tom cryostat chamber attachment is indicated. When the cryostat is inserted,the beam path is aligned into it with a set of transfer optics79. Marked are thefollowing components:A. Scanner with movable retroflecting mirror;B. Beam splitter;C. Fixed retroflecting mirror;D. Folding mirror;E. Input aperture;F. Sources;G. Spherical mirror;H. Collimating parabolic mirror;I. Focusing parabolic mirror;J. Toroidal mirror;K. Collimating parabolic mirror;L. Focusing parabolic mirror.
The position of the scanner is determined by a red He-Ne laser. The laser beam is passedthrough a collimating lens and a polarizer, and then is introduced into the spectrometer whereis passes the beam splitter through the designated openings in the beam splitter film, that areaway from the IR beam. The recombined light is then detected on two Si-diodes. When thescanner operates, an interference pattern is observed on both detectors, which for monochro-matic light of the laser a sine function.
With the exact wavelength of the laser known, the distance traveled by the scanner can
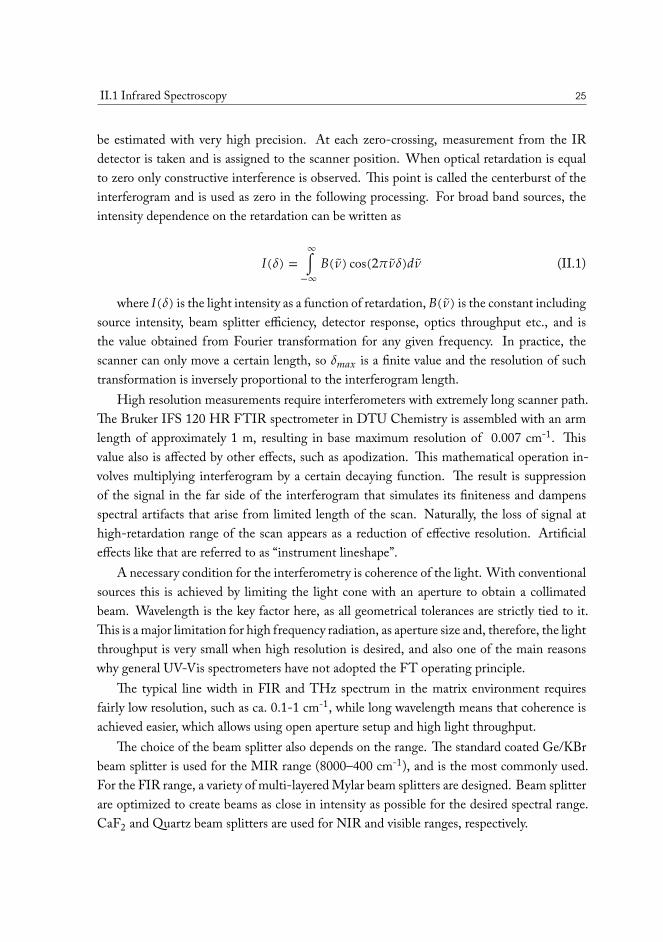
II.1 Infrared Spectroscopy 25
be estimated with very high precision. At each zero-crossing, measurement from the IRdetector is taken and is assigned to the scanner position. When optical retardation is equalto zero only constructive interference is observed. This point is called the centerburst of theinterferogram and is used as zero in the following processing. For broad band sources, theintensity dependence on the retardation can be written as
𝐼(𝛿) =∞∫
−∞𝐵( 𝜈) cos(2𝜋 𝜈𝛿)𝑑 𝜈 (II.1)
where 𝐼(𝛿) is the light intensity as a function of retardation, 𝐵( 𝜈) is the constant includingsource intensity, beam splitter efficiency, detector response, optics throughput etc., and isthe value obtained from Fourier transformation for any given frequency. In practice, thescanner can only move a certain length, so 𝛿𝑚𝑎𝑥 is a finite value and the resolution of suchtransformation is inversely proportional to the interferogram length.
High resolution measurements require interferometers with extremely long scanner path.The Bruker IFS 120 HR FTIR spectrometer in DTU Chemistry is assembled with an armlength of approximately 1 m, resulting in base maximum resolution of 0.007 cm-1. Thisvalue also is affected by other effects, such as apodization. This mathematical operation in-volves multiplying interferogram by a certain decaying function. The result is suppressionof the signal in the far side of the interferogram that simulates its finiteness and dampensspectral artifacts that arise from limited length of the scan. Naturally, the loss of signal athigh-retardation range of the scan appears as a reduction of effective resolution. Artificialeffects like that are referred to as “instrument lineshape”.
A necessary condition for the interferometry is coherence of the light. With conventionalsources this is achieved by limiting the light cone with an aperture to obtain a collimatedbeam. Wavelength is the key factor here, as all geometrical tolerances are strictly tied to it.This is a major limitation for high frequency radiation, as aperture size and, therefore, the lightthroughput is very small when high resolution is desired, and also one of the main reasonswhy general UV-Vis spectrometers have not adopted the FT operating principle.
The typical line width in FIR and THz spectrum in the matrix environment requiresfairly low resolution, such as ca. 0.1-1 cm-1, while long wavelength means that coherence isachieved easier, which allows using open aperture setup and high light throughput.
The choice of the beam splitter also depends on the range. The standard coated Ge/KBrbeam splitter is used for the MIR range (8000–400 cm-1), and is the most commonly used.For the FIR range, a variety of multi-layered Mylar beam splitters are designed. Beam splitterare optimized to create beams as close in intensity as possible for the desired spectral range.CaF2 and Quartz beam splitters are used for NIR and visible ranges, respectively.
26 II Methods
The interferogram is obtained by assigning measured detector response to the estimatedposition of the mirror. The scanner mirror is set in motion by two motors - internal andexternal. Internal motor (DC drive unit) facilitates smooth small scale oscillations, which isused for low resolution scans (<2 cm-1) and to compensate for fluctuations in the outer scannermovement. The outer scanner facilitates gliding movement along the scanner rails.
As light exits the interferometer, it is sent into one of the channels, depending on whichof the two sample compartments is used. A set of transfer optics consisting of spherical andflat mirrors is used then to focus the beam on the cold mirror of the cryostat and deliver theoutgoing beam into the detector compartment.
LIGHT SOURCES. FT-IR instruments require stable broadband sources. The method isbased on detection of intensity difference, therefore variations in source emission is allowed aslong as its frequency is out of the studied range, e.g. external mechanical vibration are rarelyan issue for work in NIR with fast detectors, but are critical in the far-infrared region.
Conventional light sources for FT-IR spectroscopy used in the spectrometer are tungstenhalogen lamps for the near-infrared range (NIR), air- or water-cooled Globar lamps (siliconcarbide) for the mid-infrared (MIR) and far-infrared (FIR) ranges. Mercury arc lamp inquartz casing is often used source for THz radiation. Additional specialized sources, such asinfrared lasers and synchrotron radiation can be also used for specific cases, primarily high-resolution spectroscopy. Lasers have the disadvantage of having very limiting spectral ranges,which requires shifting through several different lasers to even obtain relatively narrow regionof the spectrum. Highly brilliant synchrotron sources produce a very collimated beam, provid-ing dramatic improvement over Globar source in high-resolution FIR and THz applications.Recent advances in QCL technology has led to cryogen-free tunable THz lasers80, althoughsuch source are less suitable for FT instruments.
DETECTORS. The detectors in IR spectroscopy are primarily of two types - quantum andthermal. The former are based on semiconductors and register photons hitting the detectorelement. These detectors are characterized by fast response and high sensitivity. The mostcommon of these are InSb and HgCdTe (MCT) detectors. Both types are operated at liquidnitrogen temperature to reduce number of thermal transitions in the element. The InSb de-tector has a typical cut-off at 1800 cm-1, and has higher sensitivity when compared to MCTand other types detectors. Three common types of MCT devices are manufactured for FT-IRspectroscopy - they are referred to as narrow-, mid-, and broadband models with 800, 600,and 450 cm-1 cut-offs, respectively. They use CdTe or KRS-5 window material, depending onthe range. While wide spectral range can be covered with the broadband detector, its sensitiv-ity is only marginally better than thermal detectors, and it is not suitable for high-resolution
II.1 Infrared Spectroscopy 27
spectroscopy. A custom-built variant of the mid-band detector can be used, when exclusivelyhigh-resolution measurements are sought, by eliminating some of the issues present in versa-tile commercial detectors. An improved version of the MCT detector based on commercialelement was developed at the Soleil facility. By reducing the heat flux in the element throughlimiting field of view of the detector, improving radiation shielding and bringing temperaturedown to 4 K, a significant gain in S/N ratio as well as extension of the spectral range from600 to 500 cm-1 was achieved81. This gain, of course, comes at cost of more expensive cryo-gen, more strict alignment, additional equipment (e.g. turbopump), that can usually only bejustified when the data collection time is of particularly high cost, as is the case at synchrotronfacilities.
Other types of semiconductor detectors are InGaAs and Ge, used for the near-infraredspectral range. InGaAs is used at room temperature or with thermoelectric cooling, thatmakes it advantageous in cases where no liquid nitrogen supply is available in the lab. Ger-manium detector is the high-sensitivity option, and is usually used for low-light application,e.g. Raman spectroscopy, as it is easily saturated. One of the primary drawbacks of quantumdetectors is a strong deviation from linearity at high flux, particularly for those with highersensitivity.
Thermal detectors respond to heat load from the incoming beam, meaning that responseper fixed number of photons is linearly proportional to the frequency of light. It also meansthat in principle the element picks up on any type of radiation that can be absorbed by itsmaterial and does not have a fixed spectral range - it is defined by the window material, elec-tronics bandwidth and absorption spectrum of the element coating. Thermal detectors havehigher dynamic range and linearity compared to semiconductor based ones. Depending onhow the heat load in converted to electrical signal, detectors are broken down in several cate-gories, with most important of them being pyroelectric and bolometric detectors. The formerare based on temperature dependence of the element material polarization, the pyroelectriceffect. The most notable detector type in this category is deuterated triglycerine sulphate(DTGS). It used as a standard option with KBr window in most FT-IR instruments. CsIand Polyethylene windows allow to extend its spectral range, and it can be readily applied forTHz spectroscopy at low resolution.
The thermal nature of the response also changes its relationship with the scanner velocityof the instrument. While quantum detectors usually have a sweet-spot determined by theirnatural responsiveness, thermal detectors accumulate heat and therefore signal to a certainextent, making it inversely proportional to the scanner velocity and the S/N is then inverselyproportional to the square-root of the velocity. As a result, DTGS detectors could be quitesensitive at minimum scanning rates, even in THz range, potentially eliminating the need for
28 II Methods
expensive alternatives. The challenge, however, is that at low velocities (e.g. 1.6 kHz HeNelaser modulation frequency) the corresponding modulation of the probing beam radiationdrops below 100 Hz. At these frequencies multiple sources of disturbances are present, suchas electrical interference from AC grid, laboratory vibrations, and, notably in the scope of thisthesis, compressor and expander vibrations in the closed-cycle Gifford-McMahon cryocooler.For these reasons, it is often necessary to go up in the velocity to separate signal changes causedby scanner operation from the external interferences. Obviously, the lower wavenumber is ofinterest in the experiment, the more severe loss of performance will have to be taken.
Modern DTGS detectors are usually thermoelectrically cooled to slightly below room tem-perature, for optimal performance, baseline stability, and the safety of the detector element.The latter is due to low Curie point of the element material, around 62°C. Exceeding thattemperature could temporarily or permanently break the polarization of the element. Contin-uous heat load from the light source in vacuum instruments, where limited heat dissipationpathways exist for the element, cooling is necessary to prevent overheating and damaging it.
Bolometer type detectors use thermistors, temperature dependent resistors, as the sensingelement82. The most common detecting material used for laboratory detectors is amorphoussilicon83. This element requires liquid helium cooling to operate. The element is situatedinside of a light collection cone attached to the heat sink. High density polyethylene is usedas the external window, and a set of filters thermally anchored to the He reservoir follows.The element must be fully surrounded by helium cold materials to achieve the necessary levelof thermal noise. Therefore a filter is always present in the optical path. A standard option isthe 650 cm-1 diamond-coated thin film low-pass filter.
The change in temperature of the element caused by the incident IR radiation results inchange of the resistance, which is measured as voltage and amplified. A variety of factors in thedesign of the individual components can change characteristics of the detector significantly,and the wide range of conditions in which they are used requires bolometers to be customtailored to these scenarios. Apart from a multitude of other element options available on themarket and being tested out by researchers, different geometry of the system, filter set andthermal anchoring of the sensor, all contribute to specific working regime of the detector. Asan example, Infrared Laboratories produces four types of bolometers - two general purposesystems, 4 and 1.6 K, where trade-off is the hold time for lower thermal noise level; andtwo specialized systems. The high resolution bolometer at 4 K is optimized for use withhighly collimated and narrow incoming beam, that is usually obtained with small aperture orproduces by a synchrotron. In this case it is possible to further cut down the field of view of theelement and reduce parasitic heat load. The other change is the reduced thermal conductivitycompared to general purpose model. This allows for longer integration times, beneficial for
II.1 Infrared Spectroscopy 29
experiments with lower heat load, as is also the case with their last model, the 1.6 K far-infrared detector, designed to operate from 300 μm to 5 mm. Conversely, the general purposemodels would have higher light throughput and faster response in high energy low-resolutionexperiments than the specialized models.
Due to the specific application needs, most modern developments of bolometers are fo-cused in two directions: 1. Optimizing the performance at minimal temperature (4 K - 1.6 K);2. Designing detectors for room-temperature or thermoelectrically cooled range.
As liquid helium cooling with time becomes a challenging issue, the closed-cycle coolinghas been in development for many years. This bolometer concept poses a particular set ofproblems, so that despite 4 K coolers sufficient for normal Si-bolometers being commerciallyavailable for over a decade at the time of writing, cryogen-free detectors remain quite exotic.The reason for that is the sensitivity of the detection system to the disturbances caused bymotor operation. Apart from usual vibrations, electric impulses at each cycle and temperaturefluctuation, typical for Gifford-McMahon (GM) refrigerators84, are the critical problems fordifferential measurements of resistance. The current approach to combat this is the use ofpulse-tube coolers or low-vibration versions of GM coolers, in which the primary cold headis separated from the cooler mechanism and the heat conduction between them is carried outby the helium gas interlayer. Although most of the aforementioned drawbacks are minimizedthis way, noticeable cooling power degradation is present. Typically ultimate temperatures atthe cold head is ~2 K higher than with the same cryocooler used directly. Therefore, the moreexpensive 1.6 K refrigerators are often required.
VERTEX SPECTROMETER. Measurements of crude oil samples have been performed on Ver-tex 80V vacuum FT spectrometer (see fig. II.2). The operating principle is similar to thatof the IFS 120 spectrometer, with two internal air-cooled sources and an additional externalwater-cooled Globar. In this instrument, the linear scanner is run on an air bearing, operatedon a continuous supply of dry nitrogen gas delivered from liquid nitrogen tank.
The spectrometer is capable of isolating sample compartment from the optics using flapswith KBr windows mounted on each side of the compartment. This allows for fast sampleexchange with low atmospheric interference by selectively purging the sample compartmentwith continuous stream of nitrogen.
II.1.2 Attenuated total reflectance (ATR) spectroscopyThe measurements on solid and liquid samples have been performed by an ATR (attenu-
ated total reflectance) accessory, to minimize the sample preparation routine in favor of highreproducibility and throughput.
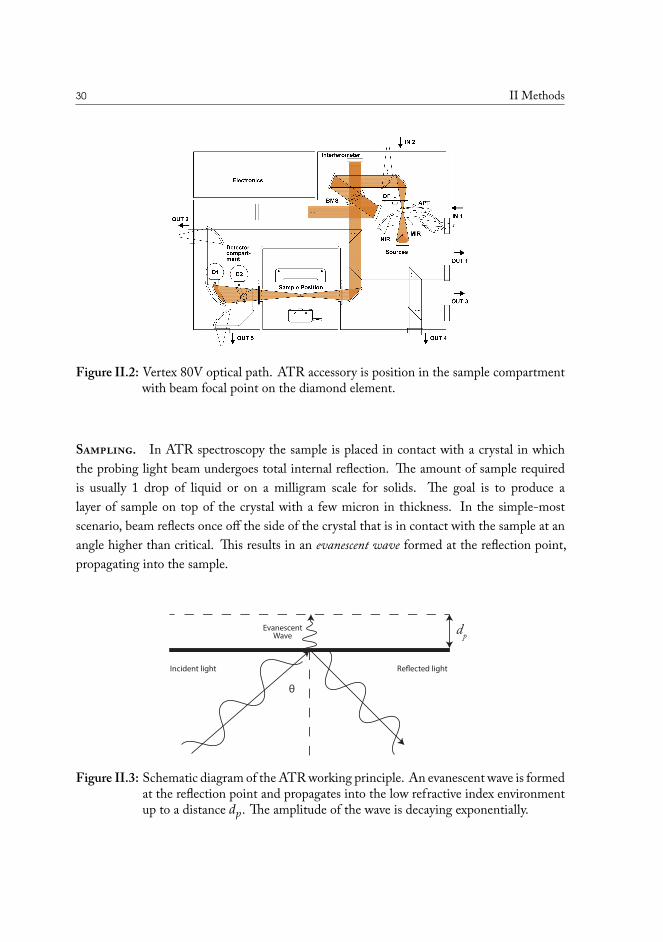
30 II Methods
Figure II.2: Vertex 80V optical path. ATR accessory is position in the sample compartmentwith beam focal point on the diamond element.
SAMPLING. In ATR spectroscopy the sample is placed in contact with a crystal in whichthe probing light beam undergoes total internal reflection. The amount of sample requiredis usually 1 drop of liquid or on a milligram scale for solids. The goal is to produce alayer of sample on top of the crystal with a few micron in thickness. In the simple-mostscenario, beam reflects once off the side of the crystal that is in contact with the sample at anangle higher than critical. This results in an evanescent wave formed at the reflection point,propagating into the sample.
dp
Incident light Reflected light
EvanescentWave
θ
Figure II.3: Schematic diagram of the ATR working principle. An evanescent wave is formedat the reflection point and propagates into the low refractive index environmentup to a distance 𝑑𝑝. The amplitude of the wave is decaying exponentially.
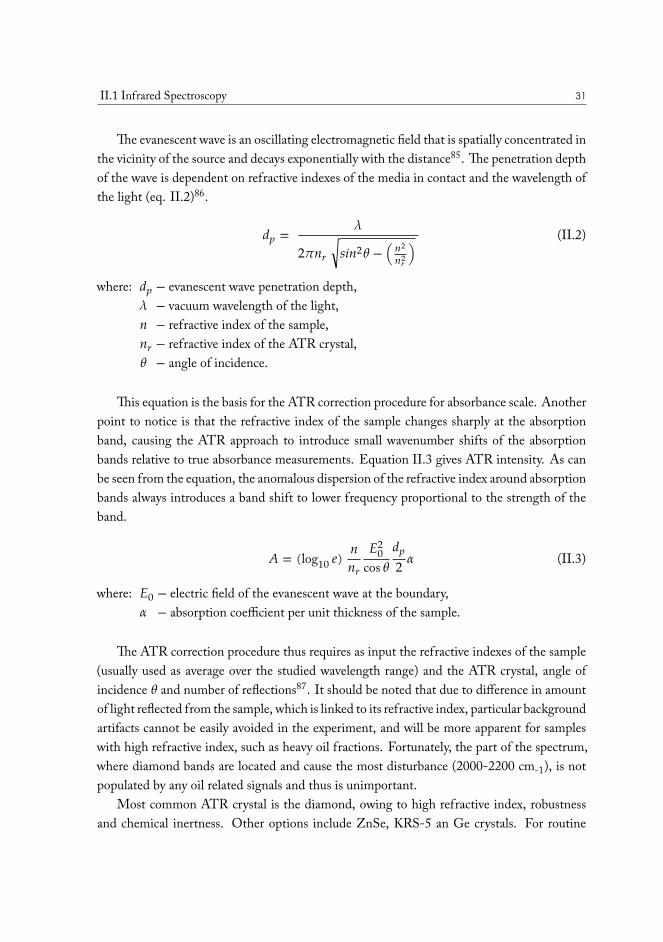
II.1 Infrared Spectroscopy 31
The evanescent wave is an oscillating electromagnetic field that is spatially concentrated inthe vicinity of the source and decays exponentially with the distance85. The penetration depthof the wave is dependent on refractive indexes of the media in contact and the wavelength ofthe light (eq. II.2)86.
𝑑𝑝 = 𝜆
2𝜋𝑛𝑟 √𝑠𝑖𝑛2𝜃 − (𝑛2
𝑛2𝑟)
(II.2)
where: 𝑑𝑝 − evanescent wave penetration depth,𝜆 − vacuum wavelength of the light,𝑛 − refractive index of the sample,𝑛𝑟 − refractive index of the ATR crystal,𝜃 − angle of incidence.
This equation is the basis for the ATR correction procedure for absorbance scale. Anotherpoint to notice is that the refractive index of the sample changes sharply at the absorptionband, causing the ATR approach to introduce small wavenumber shifts of the absorptionbands relative to true absorbance measurements. Equation II.3 gives ATR intensity. As canbe seen from the equation, the anomalous dispersion of the refractive index around absorptionbands always introduces a band shift to lower frequency proportional to the strength of theband.
𝐴 = (log10 𝑒) 𝑛𝑛𝑟
𝐸20
cos 𝜃𝑑𝑝2 𝛼 (II.3)
where: 𝐸0 − electric field of the evanescent wave at the boundary,𝛼 − absorption coefficient per unit thickness of the sample.
The ATR correction procedure thus requires as input the refractive indexes of the sample(usually used as average over the studied wavelength range) and the ATR crystal, angle ofincidence 𝜃 and number of reflections87. It should be noted that due to difference in amountof light reflected from the sample, which is linked to its refractive index, particular backgroundartifacts cannot be easily avoided in the experiment, and will be more apparent for sampleswith high refractive index, such as heavy oil fractions. Fortunately, the part of the spectrum,where diamond bands are located and cause the most disturbance (2000-2200 cm-1), is notpopulated by any oil related signals and thus is unimportant.
Most common ATR crystal is the diamond, owing to high refractive index, robustnessand chemical inertness. Other options include ZnSe, KRS-5 an Ge crystals. For routine
32 II Methods
measurements diamond crystal has clear advantages, as its absorption bands are not interferingstrongly with IR bands of the samples, while using other crystals is very challenging due tosoftness and limited pH range. The germanium crystal has niche application for stronglyabsorbing samples, such as black rubber, as its refractive index is higher than that of thediamond, which results in shallower penetration of the sample by the evanescent wave.
We have used a Bruker ATR accessory, which is a single reflection module with 45° angleof incidence and uses 1 mm2 CVD diamond crystal. The spectra of liquid oil samples havebeen recorded in vacuum with the sample protected with a o-ring sealed cap above the crystalarea. The spectra of solid samples were recorded with the samples exposed to spectrometervacuum (≈2 mbar) to eliminate traces of the solvents used to deposit the sample on the crystal.
The quality of ATR corrections for our purposes has been tested against transmissionspectra in a liquid cell equipped with KBr windows. The accuracy of the correction was foundto be acceptable within the experimental and statistical errors of the methods used whenappropriate sample refractive indexes have been applied.
II.1.3 FT-Raman Spectroscopy
Raman spectroscopy is a useful complementary technique to FT-IR. The method is basedon the inelastic scattering of monochromatic light by the matter. The beam of light, usuallya laser, interacts with the sample, causing the scattered light to be shifted with respect to theoriginal frequency. These shifts are related to vibrational levels of the probed matter. Somevibrational transitions have higher intensity than others in Raman when compared to IR.
In our setup, a Bruker RAM II Fourier transform Raman module equipped with aNd:YAG 1064 nm laser was used for the measurements. The laser is focused onto the sample,placed in a 10 mm optical glass cuvette with a mirror on the back side, or a polished steel dyewith a small cavity for the viscous or solid samples, in front of the lens. The light scatteredby the sample is then collected with the lens and sent into the spectrometer (IN1 port, seefig. II.2), where it is passed through the interferometer with the CaF2 beam splitter installed.The light that exits interferometer is then reflected back into the Raman module throughOUT1 port, and to the liquid nitrogen cooled Ge semiconductor NIR detector.
The important advantage of FT-Raman with a near-infrared laser excitation is the sig-nificantly reduced fluorescence of the sample, that often makes it impossible to study oilsamples88,89.
II.2 Preparative techniques and statistical analysis 33
II.2 Preparative techniques and statistical analysisThe complex composition of oil calls for sophisticated techniques to separate the mixture
into components of interest. Different analytical methods have varying prerequisites whenit comes to sample composition. In case of chromatographic methods, the columns havelimited load capacity, as well as other restrictions, e.g. volatility of the compound. Infraredspectroscopy detects multiple signals originating from several chromophores present in themolecule, and even the most simple of oil components have multiple IR bands. When manyclasses of compounds and species are present, the spectra quickly become cluttered and un-interpretable. Moreover, in case of methods such ATR, an almost fixed quantity of sampleis actually probed by the instrument, namely a few micron layer directly in contact with ca.1 mm2 area of the crystal. So when the target components in the sample are mixed with othercompounds, the effective signal of the target diminishes, being virtually “diluted” by those ofothers.
For the FT-IR measurements, the samples were processed based on the volatility (TBPdistillation, see I.2.1) or chemical properties (solid phase extraction).
II.2.1 Solid phase extractionCrude oil constitutes predominantly of hydrocarbon compounds such as aromatic hydro-
carbons, naphthenes, paraffins, and only a relatively small portions of polar compounds90.For the analysis of the latter, it is crucial to separate and concentrate these polar compounds.Solid phase extraction (SPE) was employed for the spectroscopic investigation of the residualoil deposited in the core material, that was cut out during the well drilling. The residual mate-rial is comprised of non-volatile organics, with higher content of polar compounds adsorbedon the calcite surface. To analyze this matter, it is necessary to extract it from the rock andseparate it into fractions according to chemical properties.
SPE is a preparative chromatographic technique, that involves use of small disposablecolumns. The procedure is usually custom tailored to the problem, starting with the recipeprovided by the manufacturer for each particular column type. The stationary phase is pre-pared by passing a solvent, activating the adsorbing material, followed by equilibration withthe initial eluent composition. Speed with which solvent passes through the column can beregulated by adjusting the air pressure at the outlet, although, depending on the procedure,this could create practical issues, e.g. constant chamber venting for when multiple fractionsneed to be collected.
The criteria of a successful procedure is an effective separation of fractions with minimaloverlap, fast elution, and column stability. One of the possible issues faced with the more
34 II Methods
specialized columns when applied to crude oil, is that effective elution of some compoundswould require aggressive eluents to completely wash out the deposited material, which canlead to column bleed. Finally, the sample needs to be concentrated and prepared in a form,suitable for the chosen analytical method. In our case, ATR requires a film deposited on a1 mm2 diamond crystal with thicknesses exceeding ca. 100 μm. The samples have to be driedto completely remove any traces of eluent, so the eluent is chosen to be composed of the mostvolatile solvents applicable.
II.2.2 Data processing and statistical analysis
Infrared spectra of crude oil contains lot of chemical information, with each compoundhaving multiple signals across mid-IR and far-IR spectral ranges. As mixture contains thou-sands of compounds with wildly varying structure, interpretation of the spectrum, alike withmany other analytical techniques, is very complicated. This issue coupled with large samplethroughput required in the study, is the reason chemometrical approaches as so prominent inpetroleum science91–93.
There are multiple statistical methods that could be used to isolate important features ofthe data, categorize samples and quantify properties, and last but not the least, efficientlypresent the result. FT-IR is extensively used in variety of ways to extract different data fromthe sample. This method is so widely used since IR is linked to pretty much every significantclass of compounds94, is quite versatile regarding the sample form, and can facilitate compar-atively high sample throughput. Though, due to signals being closely packed, quantitativedata is not directly available, so it helps to apply statistical techniques to correlate to physicalobservables. The latter could be density, viscosity, or better yet, a chemical property, such asTAN95 or wax precipitation conditions96.
Our goal, for the measured selection of samples, was to determine important chemicaldifferences between geographically distant points, both in recovered crude oil and residualmatter on the reservoir rock surface, and subsequently attempt to quantify these differencesand explain changes in production efficiency across different wells based on the chemistry.
As a first step, spectra were investigated by peak fitting in the 2000-1500 cm-1 region,where carbonile and amide peaks are located. Peak fitting allows to determine primary con-stituents of the spectral profile, with subsequent assignment to a particular vibration type,and to understand the chemistry behind uncovered trends. The Voigt profile (eq. II.4, where𝐺(𝑥; 𝜎) and 𝐿(𝑥; 𝛾) are centered Gaussian and Lorentzian profiles respectively) is generallya good choice for fitting spectra of condensed phase samples97.
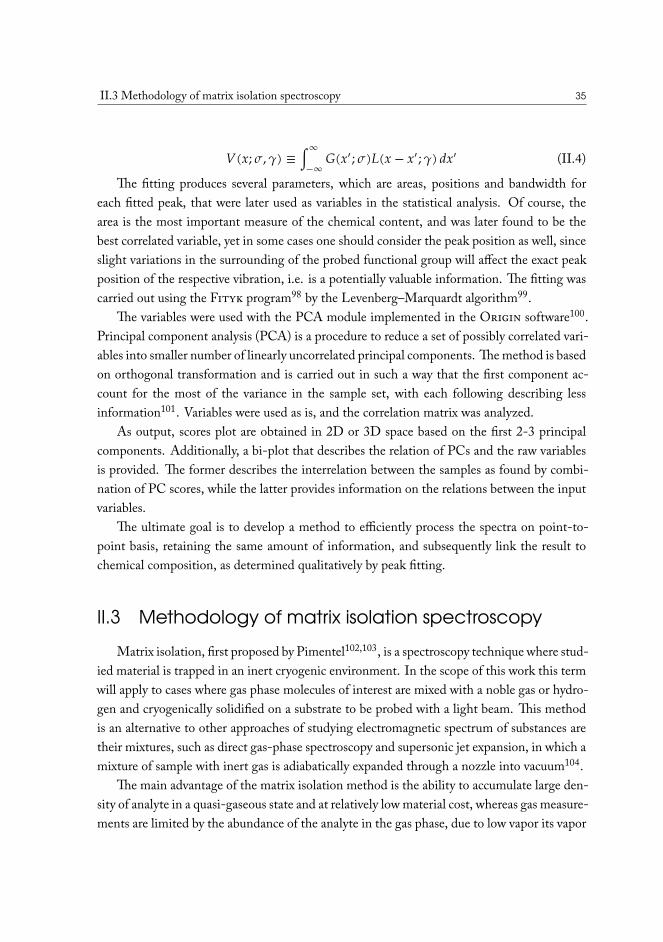
II.3 Methodology of matrix isolation spectroscopy 35
𝑉(𝑥; 𝜎, 𝛾) ≡ ∫∞
−∞𝐺(𝑥′; 𝜎)𝐿(𝑥 − 𝑥′; 𝛾) 𝑑𝑥′ (II.4)
The fitting produces several parameters, which are areas, positions and bandwidth foreach fitted peak, that were later used as variables in the statistical analysis. Of course, thearea is the most important measure of the chemical content, and was later found to be thebest correlated variable, yet in some cases one should consider the peak position as well, sinceslight variations in the surrounding of the probed functional group will affect the exact peakposition of the respective vibration, i.e. is a potentially valuable information. The fitting wascarried out using the FITYK program98 by the Levenberg–Marquardt algorithm99.
The variables were used with the PCA module implemented in the ORIGIN software100.Principal component analysis (PCA) is a procedure to reduce a set of possibly correlated vari-ables into smaller number of linearly uncorrelated principal components. The method is basedon orthogonal transformation and is carried out in such a way that the first component ac-count for the most of the variance in the sample set, with each following describing lessinformation101. Variables were used as is, and the correlation matrix was analyzed.
As output, scores plot are obtained in 2D or 3D space based on the first 2-3 principalcomponents. Additionally, a bi-plot that describes the relation of PCs and the raw variablesis provided. The former describes the interrelation between the samples as found by combi-nation of PC scores, while the latter provides information on the relations between the inputvariables.
The ultimate goal is to develop a method to efficiently process the spectra on point-to-point basis, retaining the same amount of information, and subsequently link the result tochemical composition, as determined qualitatively by peak fitting.
II.3 Methodology of matrix isolation spectroscopyMatrix isolation, first proposed by Pimentel102,103, is a spectroscopy technique where stud-
ied material is trapped in an inert cryogenic environment. In the scope of this work this termwill apply to cases where gas phase molecules of interest are mixed with a noble gas or hydro-gen and cryogenically solidified on a substrate to be probed with a light beam. This methodis an alternative to other approaches of studying electromagnetic spectrum of substances aretheir mixtures, such as direct gas-phase spectroscopy and supersonic jet expansion, in which amixture of sample with inert gas is adiabatically expanded through a nozzle into vacuum104.
The main advantage of the matrix isolation method is the ability to accumulate large den-sity of analyte in a quasi-gaseous state and at relatively low material cost, whereas gas measure-ments are limited by the abundance of the analyte in the gas phase, due to low vapor its vapor
36 II Methods
pressure or stability (e.g. weak complexes), and jet experiments consume large quantities ofmaterial.
This advantage comes at the cost of minor spectroscopic shifts of the infrared bands, whencompared to the gas phase, caused by the interaction of the trapped system with the hostmaterial. The severity of these shifts is determined by the host material, with heavy gasessuch as argon causing stronger shifts than, for example, neon. A related unwanted effectcan be observed in argon and nitrogen matrices, called “site splitting”. This effect is due toseveral types of crystal packing present or anisotropy of trapping sites, that causes the samevibrational band being perturbed in different ways, resulting in extra signals present in thespectrum or additional broadening105.
The choice of material for a matrix is then of the determining factors to the quality of theend result. Through the history of the method, several materials have been used extensively,but ultimately there is almost straightforward hierarchy for the preferred gas to use. Minimalinteractions of the host molecules among themselves and with the guest particles are sought,and here the noble gases are generally the best. Among these, smaller molecules such as neonare generally superior, and in most cases the choice comes down to economic considerations.The most used matrix materials in literature over the years are argon and, predominantly inolder works, nitrogen. One of the reasons is that these gases are abundant and inexpensive inthe required high purity, though the primary one is that they have rather high melting points,that were possible to achieve with quite simple closed-cycle cryocoolers106. Argon has theadded advantage that it can be used to perform experiments at higher temperatures, if that isthe goal. In other cases, neon is the better material, but temperatures below 8 K are necessaryto maintain the matrix, and even lower in a typical deposition scenario. Such temperaturesrequire either liquid helium cooling or helium-based closed-cycle cryostats.
Still, neon is not a perfect all-purpose host material. It has limited transparency in theTHz spectral range (<3 THz), caused by the strong rotation-translation coupling (RTC)bands of the guest molecules. For example, RTC bands of water molecules obscure the rangebelow 100 cm-1. A novel material for matrix isolation – para-hydrogen, does not suffer fromthis issue, and it requires coolers reaching below 4 K. We have applied this materials to studythe weakly bound complexes with water with non-polar molecules. The description of therelevant equipment and methods is given in chapter V.
The goal of the matrix studies performed here is to determine the structure of relevant sys-tems and quantify the vibrational anharmonicity of the large-amplitude modes along with pre-cise estimation of vibrational contributions to the thermochemistry. The results are to be com-bined with the high-level electronic energy calculations to obtain accurate semi-experimentalzero-point dissociation energies.
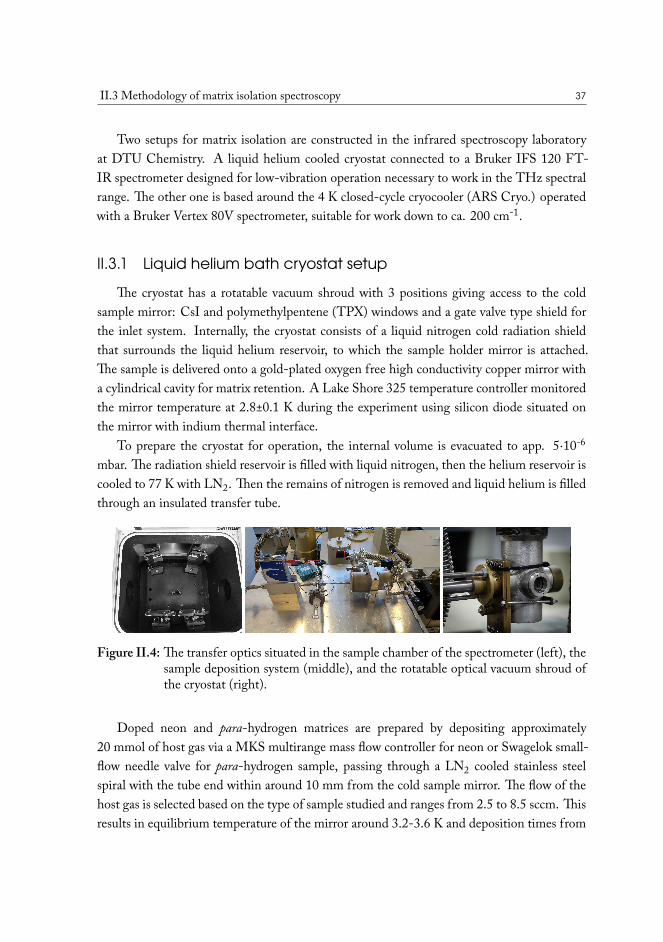
II.3 Methodology of matrix isolation spectroscopy 37
Two setups for matrix isolation are constructed in the infrared spectroscopy laboratoryat DTU Chemistry. A liquid helium cooled cryostat connected to a Bruker IFS 120 FT-IR spectrometer designed for low-vibration operation necessary to work in the THz spectralrange. The other one is based around the 4 K closed-cycle cryocooler (ARS Cryo.) operatedwith a Bruker Vertex 80V spectrometer, suitable for work down to ca. 200 cm-1.
II.3.1 Liquid helium bath cryostat setupThe cryostat has a rotatable vacuum shroud with 3 positions giving access to the cold
sample mirror: CsI and polymethylpentene (TPX) windows and a gate valve type shield forthe inlet system. Internally, the cryostat consists of a liquid nitrogen cold radiation shieldthat surrounds the liquid helium reservoir, to which the sample holder mirror is attached.The sample is delivered onto a gold-plated oxygen free high conductivity copper mirror witha cylindrical cavity for matrix retention. A Lake Shore 325 temperature controller monitoredthe mirror temperature at 2.8±0.1 K during the experiment using silicon diode situated onthe mirror with indium thermal interface.
To prepare the cryostat for operation, the internal volume is evacuated to app. 5⋅10-6
mbar. The radiation shield reservoir is filled with liquid nitrogen, then the helium reservoir iscooled to 77 K with LN2. Then the remains of nitrogen is removed and liquid helium is filledthrough an insulated transfer tube.
Figure II.4: The transfer optics situated in the sample chamber of the spectrometer (left), thesample deposition system (middle), and the rotatable optical vacuum shroud ofthe cryostat (right).
Doped neon and para-hydrogen matrices are prepared by depositing approximately20 mmol of host gas via a MKS multirange mass flow controller for neon or Swagelok small-flow needle valve for para-hydrogen sample, passing through a LN2 cooled stainless steelspiral with the tube end within around 10 mm from the cold sample mirror. The flow of thehost gas is selected based on the type of sample studied and ranges from 2.5 to 8.5 sccm. Thisresults in equilibrium temperature of the mirror around 3.2-3.6 K and deposition times from
38 II Methods
1 to 4 hours. The sample flow is delivered via separate tubes to the same spot where the hostgas tube end, resulting in gas mixing immediately before freezing on the mirror. The designof the inlet system allows two different sample flows. This is most important for very reactivespecies, deuterated species, and sample combinations of different states. The cryostat withsample deposited is then moved to the dedicated chamber of the spectrometer.
The chemicals used are of spectroscopic or puriss p.a. grade purity and are prepared formatrix deposition by degassing in vacuum in glass tubes with PTFE valves, unless statedotherwise in text. The host materials are neon (99.999%, Air Liquide) or para-hydrogen (seesection V.1).
For our experiments, MIR spectra were recorded by a LN2 cooled MCT detectorequipped with a KRS-5 window, combined with Ge on a KBr beam splitter and a Globarradiation source on IFS 120 and a broadband MCT on the Vertex 80V. FIR and THz single-beam spectra were generated by a liquid helium cooled Si-bolometer on IFS 120 in combina-tion with a 6 μm multilayer Mylar beam splitter and a Globar radiation source. NIR spectraare obtained with InSb detector, tungsten halogen lamp and the CaF2 beam splitter. Thespectral resolution is chosen based on the type of sample and spectral range. The resolutionused was 0.1-1 cm-1. The filters and aperture size were selected accordingly.
Once cold spectra are obtained, it is possible to use integrated heater to stabilize matrix atan elevated temperature. This procedure is called “annealing” and its purpose is to bring thematrix to the highest temperature, at which it can still exist in vacuum, to soften the crystalstructure and allow diffusion of the guest molecules within it. In this way, one can formadditional complex species, increasing the signal and distinguishing between peaks originatingfrom complexes of varying composition. Additionally it is possible to determine presence of“hot bands” and temperature dependent splittings. For neon, it could be possible to reachtemperatures as high as 9-10 K. Hydrogen, on the other hand, is quite challenging in thisregard, due to low boiling point and extremely high conductivity of the gas, with possibletemperatures being limited at around 5-5.5 K. Yet even this limit is very hard to reach on aliquid helium cooled cryostat, since low temperature spots always exist and act as cryopumps,and also sudden evaporation of helium critically affects its cooling capacity, triggering chainreaction that leads to complete warm-up of the cryostat.
II.3.2 Closed-cycle cryostat setup
The closed-cycle matrix isolation setup employs a ARS Cryo DE-204 4 K expander witha welded instrumentation skirt and shared the compressor with the para-H2 setup via an all-
II.3 Methodology of matrix isolation spectroscopy 39
metal gas manifold. This closed-cycle cryostat is equipped for spectroscopy in transmissionmode. The temperature sensor is a curve-matched silicon diode Lake Shore DT-670, withabsolute accuracy of ±0.25 K below 100 K, that is anchored to the tip of the 4 K stage witha thin indium gasket. The sample holder is attached to the cold head tip via a threadedconnection and is thermally anchored with an indium gasket on the contact plate and Apiezongrease on the thread. The window holder is made out of nickel plated “oxygen free highconductivity” grade copper and accommodates 1 in. flat round windows, that are sandwichedbetween the holder rings with indium wire gaskets on each side. The sample windows areeither of KBr or CsI, with lower spectral limit of approximately 375 and 200 cm-1 respectively.CsI has slightly lower light throughput due to reflectivity, is more hygroscopic, and has lowerheat conductivity compared to the KBr material.
The radiation shield is made of a nickel plated OFHC copper tube with threaded con-nection to the 1st stage and 40 mm round light ports. It was found that the radiation shielddoes not provide sufficient protection of the sample due to excessive field of view, while themaximum beam profile in Vertex spectrometer is only around 8 mm. Thus, the openings werereduced by attaching aluminium foil with ca. 15 mm light ports on each side, which resultedin minimum temperature drop of about 0.5 K at the sample window.
The vacuum shroud is mounted on double Viton o-ring seal, facilitating rotation undervacuum. The shroud is equipped with four flanges, two of which are used for 40 mm opticalwindows, KBr of CsI, and the third has custom manufactured brass gate valve for the inletsystem attachment. The standard commercial model comes with two 1/16 in. inlet portswelded in, but we have found that they are ineffective for matrix isolation, as these tubesthat are fed through get cooled slightly by the radiation shield, condensing the sample vapor,whenever compounds with volatility comparable to that of water is used. The cryostat isconnected to a vacuum manifold equipped with solenoid actuated valves, that allows softwarecontrolled operation.
The sample is delivered through a custom inlet system that is designed to combine threesources (fig. II.5). A host gas line has a MFC installed for the neon supply and a needle-valveregulated flow from a glass flask for the supply of para-hydrogen or argon. The sample isdelivered from a 2 L gas flask or a vial, when vapor pressure of a liquid or a solid is used,passing Swagelok 0.004 Cv metering valve set at 0.5 turn. The sample exits tubes with 2 mminner diameter approximately 5 mm away from the cold window.
After the deposition procedure, the inlet system is retracted and the cryostat is positionedinto the sample chamber of the spectrometer. The measurements are done with the cryostatlowered into the sample compartment isolated from the optical bench by motorized flapswith KBr windows mounted. The sample compartment is continuously purged by dry nitro-

40 II Methods
Figure II.5: Custom manufactured inlet mechanism. Tubes are fed through the gate valveclose to the sample holder and retracted by rotation of the brass barrel.
gen during the measurement to eliminate atmospheric interference without establishing rigidconnection to the spectrometer.
The mechanical vibrations caused by the cryostat operation are potentially interfering withmeasurements as well. Two principal vibrations are present - those originating from the ex-pander operation, which has a base frequency of around 1 Hz, and those originating fromthe operation of the compressor, supplying helium gas, with base frequency of 50 Hz. Evenmicrometer scale displacement of the sample caused by these oscillations are picked up by thedetector, and their appearance depends on the velocity of the scanner. It appears that onecan operate MCT detectors at 40 kHz velocity without experiencing spikes resulting fromthe vibrations, but for a DTGS detector, where minimum velocity is preferable, vibrationsappear strong throughout the FIR spectrum. With the current setup, it appears to be feasibleto reach range as low ca. 200 cm-1 at 10 kHz. A better performance might be possible withadditional anchoring of the gas supply lines, though THz spectroscopy is known to be chal-lenging employing closed-cycle coolers and generally requires low-vibration models, wherethe sample holder is decoupled from the motor.
As opposed to liquid helium cooled cryostats, annealing is quite straightforward here, andis even possible for para-hydrogen matrices, when carried out in a slow and careful manner.
II.4 Supporting computational methodsVibrational band assignments based exclusively on experimental data become increasingly
complex as the studied molecules grow in size. The primary approaches, such as concentrationdependence studies and isotopic substitutions sometimes cannot provide enough information.Spectral signatures of asymmetric trimer species can congest the spectrum, while slight anhar-
II.4 Supporting computational methods 41
monic shifts that appear when different isotopes are used can introduce enough uncertaintyso that harmonic theoretical estimations of the isotopic shifts no longer unambiguously pointto the origin of band for the normal species.
This is where the necessity of supporting the experiments with theoretical calculationscomes. While the accuracy of these results alone does not allow to conclusively assign experi-mental result right away, matching predicted spectral features provides an extra confirmationof conclusion based on matrix measurements. It is important to have a preliminary under-standing of the expected strength of the complex, the possibility and relative stability of mul-tiple conformations, and have an idea of how strong is the intensity of the target band in theIR spectrum. Despite the enormous complexity of the quantum effects involved, that mightproduce unexpected shifts of band positions and intensities of the bands, as well as conditionsof the medium that are rarely included in the model, more often than not, calculation canproduce results of sufficient accuracy and consistency so that they can significantly help withunderstanding the system. For predicted vibrational frequencies, scaling factors could workwell in compensating electronic structure method errors as well as anharmonicity, at least pro-vided the scaling factors has been obtained on very similar systems107,108. When a large setof molecular systems is available for reference, it is very convenient to apply this approach, asit becomes rather insensitive to the multitude of quantum effects, such as the contributionof core electron correlation, relativistic effects, adiabatic corrections, and lack of higher orderexcitations.
With the fast rise of computational power over the last years, as well as the developmentof theory, bringing classical methods down in cost and introducing new and more preciseones, accurate treatment of systems substantially larger than before and inclusion of complexeffects such as vibrational anharmonicity is possible. All of the methods, though, have issueswhen it comes to weakly bound molecular systems, and still have a long way to go to beable to predict vibrational spectra reliably for industrially important chemicals and processes.Another critical point is that these systems typically cannot be studied in the gas phase either,due to low vapor pressure or, in case of weakly bound clusters, negligible amounts of complexspecies to accumulate enough signal with current instrumentation. Some of these limitationsare being pushed with the development of spectroscopic equipment and powerful light sources(e.g. synchrotrons), but the majority of those systems are still out of reach in the FIR and THzrange.
42 II Methods
II.4.1 Brief overview of quantum chemical methodologiesAs this thesis is focused mostly on experimental work, only a short description of theoret-
ical methods will be given in order to familiarize the reader with the terminology and generalstate-of-the-art of techniques that can be applied to practical cases as those featured in thisproject.
The movement or distribution of electrons in a quantum mechanical system is describedby the wavefunction, presented mathematically by the Schrödinger equation.
− ℏ2
2𝑚∇2𝜓(𝑥) + 𝑉(𝑥)𝜓(𝑥) = 𝐸𝜓(𝑥) (II.5)
The exact solution of this equation is limited to the smallest of systems. Therefore, inquantum chemistry a set of approximations is used. The Hartree-Fock (HF) method is usedto determine the wavefunction in a stationary state, assuming that it can be approximated by asingle Slater determinant109. It is also referred to as a self-consistent field (SCF), or as a single-reference method, as opposed to more complex multi-reference methods. In the HF method,the electronic correlation, i.e. interaction between electrons is not included. Methods dealingwith that part of the energy of a quantum system are called “post-HF” methods. The mostused of these methods today are Møller–Plesset perturbation theory110 (MP) and CoupledCluster (CC) theory. Here a special note should be given to an alternative approach - DensityFunctional Theory (DFT). The DFT approach takes its roots in Kohn-Sham theory, focusingon electron density, and as with wavefunction theory, exact treatment of all terms is out ofreach, forming an hierarchy of approximate methods (LDA, GGA, meta-GGA etc.) withpreset parameters that form “functionals”. Hundreds of these functionals have been developedat different levels of the hierarchy, with the best functionals often including HF-exchange(hybrid DFT).
The Møller–Plesset perturbation theory is usually truncated at second order, denoted asMP2111. Higher order variants have been developed112, but their accuracy do not improve in asystematic manner113, clearly hitting the ceiling with what purely pertubative approaches canachieve, while the computational cost increases tremendously. Scaled variants of MP2114 tendto perform better with no extra cost, and recently methods that use scaled MP2 correctionto the hybrid DFT-optimized orbitals (Double-hybrid DFT) were introduced. The latter isconsidered to be the best115 way of computing energies at the DFT/MP2 cost level. However,a sea of parameters and contribution scaling factors that could be set for them leads to a nearinfinite number of functionals available in the literature. A general benchmark could be usedas a rough guideline to what accuracy can be expected from a functional and which one to pickfor a particular study, but it is impossible to cover all possible scenarios as well as to provide areliable reference where necessary.
II.4 Supporting computational methods 43
Coupled cluster116 is a numerical method for describing many-body-systems. It origi-nates from nuclear physics and was adapted for the estimation of electronic correlation117. Ituses a reference wavefunction, which is typically based on HF orbitals, but can be appliedto other wavefunctions. The extent to which the method describes electronic correlation isregulated by the order of excitations that are included in the calculation (single, double, triple,etc.). CCSD stands for coupled cluster with single and double excitations. When the excita-tion symbol is included in parentheses, it means that the respective contribution is calculatedperturbatively, rather than iteratively. At the moment of writing, CCSD(T) method is con-sidered to as the gold standard118 of computational chemistry. While it doesn’t necessarilymean that it is the best method available, but it has much better cost-to-performance ratioand can be applied to small and medium molecular systems. Its particularly high accuracyis actually a result of error cancellation, where lack of high-order excitations is compensatedby overestimation of triples contribution done perturbatively. Consequently, CCSD(T) of-ten performs better than CCSDT, despite the latter having much higher computational cost,and to improve on accuracy of CCSD(T) one has to go to CCSDT(Q). It is rarely feasibleto use this high level for systems containing more than a few heavy atoms, in particular whenspectroscopic properties are to be computed, and it should be noted that it only provides highaccuracy when all other links are just as rigorous. In this regard the reference wavefunctionshould be mentioned. While one can be lucky and occasionally dynamic correlation treat-ment in CC will partially compensate for deficiency of a single determinant reference, it isstill very important to ensure that the system studied can be reasonably approximated by theHF method.
II.4.2 On approximations and reasonable expectations
Quantum chemical calculations are rather expensive in the broad sense, especially whencompared to molecular dynamics, semi-empirical approaches and other numerical techniquesused in science, if one considers systems that are usually treated in this way. With the ab ini-tio methods one has to be aware of how cost scales with size and the underlying parametersthat contribute to the accuracy. DFT is usually the method of choice when it comes to largesystems, but it has a comparatively low accuracy, which might not be sufficient for some ap-plications. Numerical integration in DFT is also worth mentioning. It could be that theproperty to be determined in the end is not sensitive to the errors of the grid, yet numericalnoise introduced with small grids could hamper geometry optimization or lead to unphysi-cal structures. Tightening the grid or tolerances to which SCF is converged might increasecomputational cost so much, that the method is no longer optimal for the task.
44 II Methods
High-level methods, e.g. CCSD(T), are very memory and storage demanding, and havescaling factors as high as O(N7) for the (T) component. For the medium sized systems dis-cussed, example being the binary dimethyl ether - water cluster studied with triple-𝜁 , canon-ical CCSD(T) would require around 4 GB of RAM per thread and up to 1 TB of storageat any given time for a job running on a generic cluster node, and the run time ranges fromseveral days to a couple of weeks to obtain the vibrational frequencies. As all requirementsscale roughly the same way, it becomes impractical to run anything larger than systems ofsimilar size. Even this calculation by itself has quite a few details let out, e.g. core electronscorrelation, relativistic effects, and it is “only” triple-𝜁 basis. When comparing the result tothe experiment, one has to keep in mind all these factors, their effect on the target property,try to account for them from other methods or via scaling. Thus, while anharmonicity is animportant energy component and is often the hardest to calculate, the quality of the referenceharmonic frequency is of even higher importance, since its magnitude is about 5 times larger.
With that said, it is clear from the benchmark studies, that direct estimations of ther-mochemical properties from ab initio methods is still both very complicated and is limitedin accuracy and applicability119. From an experimental physical chemist perspective, higheraccuracy is not necessarily ensuring to better interpretability of data. In case of vibrationalspectroscopy, uncertainty associated with anharmonicity calculations and electronic struc-ture method usually outweigh basis set errors and some minor approximations (e.g. frozencore). The discrepancy between MP2 and CCSD(T) is typically around 20 cm-1 for thecase of out-of-plane libration of a medium-strength hydrogen-bonded complex, and varia-tion through various DFT methods easily exceeds 80 cm-1. Such errors are too large to assistspectral interpretation in ambiguous cases, especially considering that even the golden stan-dard CCSD(T)/CBS grade calculation itself is not always accurate enough for some weaklybound molecular complexes120,121.
Ultimately, the objective is to produce the most accurate result with the reasonable timeinvested, that can be used to help understanding the system investigated. Obtaining reliabledifferences between several related systems is often easier than predicting properties exactlyfrom scratch. Thus, it is necessary to capture the most dominant factors contributing tochange in the property and minimize all other errors in a balanced way. In this regard, severalsignificant advances in the field of computational chemistry have occurred in recent years withwidespread implementation of approximations, explicitly correlated and compound electronicstructure methods.
COMPOUND METHODS. Traditional compound methods are also referred to as “thermo-chemical recipes”122. They combine several standard methods to estimate the best energies at
II.4 Supporting computational methods 45
the minimal cost. A classical example is the G2 scheme123: the molecular geometry and fre-quencies are obtained at all-electron MP2/6-31G(d) basis, electronic energy is estimated atQCISD(T)/6-311G(d) level, and the residual basis set deficiency is corrected by comparingdifferences of several MP calculations with different basis sets. With the progress in methoddevelopment, several updates to the recipe has been issued, including the CCSD(T) approachas the electronic energy method, different DFT functionals for geometry evaluation, etc.
At the time of writing, this sort of approach is rarely applied anymore. No small reasonfor that is the advent of other approximate methods, that in general are more accurate andhave benefit of less variables that go under the hood. A normal approach that is still widelyused, is to use high-level methods (e.g. CCSD(T)/CBS, CCSDT(Q)) on a less accuratepotential energy minimum geometries. This is a very cost-effective method, and correctionsbeyond this point are only done for small systems, and are rarely defined as a solid recipe.The most rigorous type involves extrapolation of geometries, vibrational frequencies and elec-tronic energies124 to CBS level at the CCSDT(Q) level of theory, with inclusion of coreand relativistic effects at the CCSD(T) level. Further improvements are done by includinganharmonic corrections to the zero-point vibrational energy (ZPE).
A more novel range of compound methods are focused on the highest effectiveness atvery low cost, and are primarily used as methods of preliminary geometry optimization, fastscreening, for work with very large systems or the quantum chemical method in ab initio ormixed molecular dynamics. The common part in these methods is that they are based on a lowcost SCF level electronic structure method with modest basis sets, and corrected by a set ofempirical parameters. As an example, HF-3c125 approach utilizes the Hartree-Fock methodwith the small MINIX basis. The obtained energy is then corrected by three terms:
𝐸𝐻𝐹−3𝑐𝑡𝑜𝑡 = 𝐸𝐻𝐹/𝑀𝐼𝑁𝐼𝑋
𝑡𝑜𝑡 + 𝐸𝐷3(𝐵𝐽)𝑑𝑖𝑠𝑝 + 𝐸𝑔𝐶𝑃
𝐵𝑆𝑆𝐸 + 𝐸𝑆𝑅𝐵 (II.6)
The first term is the atom-pair London dispersion D3-BJ126 correction. The second termis the “geometric counterpoise correction” (gCP)127, a semi-empirical approach to removethe basis set superposition error (BSSE), that for intermolecular interactions approximatesBoys and Bernardi counterpoise correction128 method. The last term corrects for the basis setdeficiency.
A more recent B97-3c method129 was used in this work for the initial geometry prepara-tion steps and conformation search.
RESOLUTION OF THE IDENTITY APPROXIMATION. Density fitting, also referred to as “res-olution of the identity” (RI) is a mathematical technique to approximate the two-electronintergrals130–132. An integral, usually a four-index type, is replaced with a linear combination
46 II Methods
of auxiliary basis functions (eq. II.7). RI is available for Coulomb and exchange integrals forSCF calculations and MP2 integrals.
𝜑𝑖 ( 𝑟) 𝜑𝑗 ( 𝑟) ≈ ∑𝑘
𝑐𝑖𝑗𝑘 𝜂𝑘(r) (II.7)
The error introduced by the approximation depends on the accompanying auxiliary basisset, which is usually 2-4 times larger than the AO basis used. For most common basis setfamilies the corresponding fitting basis sets of appropriate size are available, that keep RIerror several times lower than the basis set error. The major advantage of switching to 3-indexintegrals is the significantly reduced storage required. In many cases integrals can be keptin memory or the disk I/O is significantly lower. This is very apparent in MP2 calculations,where canonical method is very memory demanding, RI-MP2 energy is very fast and hasinsignificant memory requirements for modern computers. The errors in the MP2 part arenegligible, and it has been shown that effect on geometries and vibrational frequencies arebasically zero. Therefore, considering accuracy of the MP2 method itself and the basis setincompleteness error of realistic basis sets used in production calculations, RI is a must inevery scenario and has really opened up MP2 level calculations for medium-sized systems.
Unfortunately, analytical gradient with full RI are not available for MP2, so one has tostill calculate exchange integrals in some other way, either exactly, or via the numerical “chainof spheres X” (COSX)133 approximation. The latter provides a large speedup to the gradient,but it is slower at the SCF stage and introduces numerical noise associated with integrationon a grid. Nevertheless, we have found it absolutely necessary to work with the larger systemsstudied in this project, and the errors are usually very small, only manifesting as noise in thegeometry convergence.
Coupled cluster methods usually don’t utilize RI as much. The complexity of CC integralsmeans significant overhead from operations required for density fitting, so it is reserved onlyfor the most expensive sort, and only when more efficient in-memory algorithms are out ofreach. RI is routinely used in “local” approximations of CC, where all integrals have to bewritten to disk anyway.
LOCAL AND EXPLICITLY CORRELATED METHODS. The high cost and poor basis set conver-gence of wavefunction based correlation methods has caused efforts towards improving thecost-efficiency of the theory. The importance of triples for CCSD calculations has beenknown for a long time134, while the scaling for this component has limited its applicationto only the smallest of molecular systems. A series of non-iterative approaches to triples havebeen developed, culminating with the now widely used (T) method established by Pople andco-workers135. Nevertheless, the CCSD(T) method is not applicable to many systems of
II.4 Supporting computational methods 47
interest, if a large basis set is concerned. That particularly relates to the need of additionaldiffuse functions for non-covalent interactions.
Local correlation methods attempt to remove the major bottlenecks by discarding low-importance pairs in the calculation. It is recognized, that dynamic correlation, is largely arather local effect, although to obtain chemical accuracy (<1 kcal/mol) one has to recovermore than 99.9% of the electronic correlation energy of the parent method. Local methodsare based on fragmenting the system based on some schemes136 (molecular orbitals, electronpairs etc.), screen the fragments, discard them if found of minor importance, and then runcalculations on the rest of the fragments, ultimately estimating the result as a combinationof those calculation. While this also creates many additional procedures, these are easy toimplement in parallel.
In this work, the domain-based local pair natural orbital CCSD(T) (DLPNO-CCSD(T))method137,138 was used. It is based on the pair natural orbital (PNO) approach developed byMeyer and Ahlrichs in the early 70s139,140. The result is a near-linear scaling method that iswithin chemical accuracy of the canonical CCSD(T), when used with appropriate cutoffs141.The basis set scaling is also noticeably lower than that of the canonical method, estimatingroughly at 6 for each step, rather than 12-13 for the CCSD(T).
The method’s strong point is the reduced scaling, which makes it primarily beneficial whenapplied to large systems. While a step above all the alternatives, it still has an error comparedto canonical calculations, roughly around (0.5 kcal/mol) for medium sized systems, as con-firmed by us as well. Therefore, it is only applied here where canonical energy calculationwith a decent (T-, Q-𝜁 ) basis set are completely impossible. Smaller systems, particularlythose with symmetry elements, can be calculated using explicitly correlated methods imple-mented in MOLPRO142 with support for abelian groups of symmetry. In our experience theDLPNO approach is also rather ill-fitted for generation of derivatives, since the cost scalingis quite poor for the small systems where one can hope to achieve that, and also appears tohave efficiency issues with the code. The latter is evident from the fact that MOLPRO, wherefeasible, can produce harmonic vibrational frequencies much faster with canonical methodsthan can be obtained with DLPNO. Local energy decomposition (LED)143,144 was devel-oped to exploit the local nature of the method to analyze the calculated electronic energy andextract physically meaningful components of the interaction between fragments. It is a usefulalternative to other interpretative methods, such as DFT-SAPT, as it is based on a scalablecoupled cluster electronic structure, and as such, can be expected to be both widely applicableand affordable.
One of the reasons for the poor basis set convergence of the wavefunction based methodsis the fact that the wavefunction is poorly described by the basis set functions near Coulomb
48 II Methods
singularities, the electronic cusp145. Kato discovered that by using interelectronic distances,a more efficient wavefunction could be constructed146. Explicitly correlated method appendextra terms to the canonical wavefunction that efficiently deal with the electronic cusp con-dition. CCSD-F12147 is now available to accelerate basis set convergence over the classicalmethod by only adding minor overhead to the calculation. While the method was praised fordramatic improvements in some cases, it is only marginally better by itself for other applica-tions148. First of all, different methods have different manner of the complete basis set (CBS)limit convergence, with many being quite erratic at smaller basis set sizes. For non-covalentsystems, user would only gain 1-2 “zetas” of basis set quality at best, as was also seen in thiswork, when using standard Dunning’s basis set family. The basis used should be custom madeto take full advantage of the explicit correlation, and development of those is still nascent. Thecc-pVXZ-F12149 basis set family (X = D-Q,5148) was established recently and has shown tohave much better convergence.
The F12 correction is only applicable at this point to the CCSD wavefunction and theunderlying HF reference150, while (T) calculation is done canonically using the F12 ampli-tudes. This means that the (T) components exhibits the same convergence as in the canonicalCCSD(T) method, still imposing demand for unfeasible basis set sizes to reach chemicalaccuracy. A crude solution for this is to apply an empirical scaling to the (T), using the MP2-F12/MP2 energy ratio151. While the idea is very simple and comes at no cost, it generallyprovides a tremendous improvement in quality of energy, even at small basis sets. The onedownside is that basis set convergence becomes even more unstable, and any attempts at ex-trapolation are pointless, so one has to treat the single point result as a CBS level, but withhigher uncertainty. Also using the MP2 wavefunction as a reference for the scaling has itsown obvious implications, and, alternatively, one can use the CCSD-F12/CCSD ratio. Thereis no certain advantage of the latter, as generally it would underestimate the scaling, while theformer would overestimate it.
Apart from the general specifics of the method, it should be noted that it is also lessadvantageous when it comes to non-covalently bound systems, due to limited inclusion ofdiffuse functions in the basis set. I have observed that for several van der Waals type systemsdiscussed in this work, the dissociation energy would change linearly with the basis set in theD-Q 𝜁-range. This issue has been addressed recently in the literature with the developmentof the aug-cc-pVXZ-F12 basis set family152, although due to the fact that it is not nativelyimplemented in our quantum chemistry packages and has not been extensively tested, we havenot used it in this work. For comparison purposes, quadruple-𝜁 quality basis set with the F12method, or the 5-𝜁 local CC result is perfectly fine as it is well within chemical accuracy.
II.4 Supporting computational methods 49
II.4.3 Computational approaches to simulation of vibrational
spectra
Vibrational frequencies are related to the curvature of the potential energy surface. Vibra-tions are calculated at the stationary point and are related to the eigenvalues of the Hessianmatrix, which is constructed of the second derivatives of energy with respect to the Cartesiannuclear coordinates. The calculation is only valid at the stationary point and will produce allreal frequencies if the system is at the minimum, or will contain one imaginary frequencywhen the system is at a saddle point. Thus it is critical to optimize the geometry of the systemto the point where residual gradients are non-existent.
Any derivative calculation is more susceptible to noise, and for hessian construction, wherepossible, analytical derivatives should be applied. Sadly, implementing such operations forlarge number of methods and functionals out there has become a very daunting task, and themajority of the software packages don’t invest in analytical Hessian programs. No analyticalderivatives are available at the moment for the high-level coupled cluster theories, and mostMP2 and SCF level methods have only gradients at their disposal. It is necessary then toobtain vibrational frequencies by numerical differentiation of either the energy or gradientwith very high precision, while scaling of the technique is quite unfavorable. One has to ob-tain 6N atoms gradient evaluations to construct the Hessian numerically. Luckily, these tasksare completely independent and can be run in parallel across multiple computational nodes.Another consequence is that the use of DFT is generally less advantageous for non-covalentinteractions, due to the inherent noise of numerical integration on the grid, and weakly boundsystems would make the use of rather fine grids mandatory, eliminating most of the perfor-mance gain. A detailed description of how exactly the procedure is performed in GAUSSIANcan be found in the paper by Ochterski153.
To obtain infrared spectra, it is also necessary to properly predict intensities of the vibra-tional transitions. This can be done through the square of the second derivative of dipolemoment change. This is commonly available at the SCF and MP2 level, while only frequen-cies can be found at CCSD(T) level.
Eventually the calculations yield vibrational frequencies in the harmonic approximation.These do not account for the various couplings between vibrational modes and natural devi-ations from the harmonic oscillator model. For intramolecular modes relative amplitude issmall and so are the anharmonicity contributions, since the curvature close to energy poten-tial minimum is close to quadratic, and is in the order of 2-5%. But the low frequency inter-molecular vibrations, abundant in non-covalent molecular complexes, have large amplitudeand significantly deviate from the harmonic oscillator description, with the scaling factors to
50 II Methods
calculated frequencies reaching 80-85%154.
Accurate prediction of anharmonicity remains a challenging task. Due to the uncertaintyassociated with the existing methods, extremely high cost and too small of a selection of reli-able reference systems among weakly bound complexes73. It has been shown that while state-of-the-<art anharmonic calculations are by all means a huge improvement over the harmonicapproximation, often the cost that goes into them is not justified by the accuracy achieved,when a simple alternative in the form of scaling is available. Thus, even though anharmonictheory is an important milestone to be achieved for spectroscopic science, it is not yet matureenough to be used routinely for spectral interpretation for the vast majority of the cases, andshould be used with caution. It has been speculated, that due to the much lower absolutemagnitude compared to the harmonic part, the anharmonic contribution can be estimatedusing much cheaper method and, in particular, while coupled with a rather small basis set -it has been practically demonstrated to be false, as for any situation and method the qualityquickly drops way below what could be achieved by crude scaling155.
Naturally, it is commonly the case that proper experimental data is not readily availablefor the type of system one is investigating, and while it is convenient that scaling takes care ofmany errors originating from the underlying approximations found in every quantum chemi-cal method, the flip side is that the scaling factor is only valid for a “very” particular methodfor which it was developed. This includes not only the global method/functional, but also thebasis set, additional approximations that introduce systematic error, fitting basis sets, localiza-tion method, and, to a lesser extent, numerical precision factors (e.g. grids, integral thresholdetc.). On top of that, the scaling factor also depends on type of the vibration, as mentionedabove, with intramolecular modes being a lot closer to their harmonic estimate than the largeamplitude intermolecular modes. This fact greatly elevates the value of “pure” experimentaldata that could be directly compared to theory - gas phase, jet expansion and inert matrixisolation spectra, since these are able to isolate spectral signatures of selected complexes, free(or almost free) of solvent effects.
Nevertheless, anharmonic quantum chemical calculations of vibrational spectra still haveplace in experimental spectroscopy. Many systems could and will exhibit cmomplex behaviordue to couplings, resonances, specific structural features etc., and these will to varying extentbe lost in the harmonic oscillator model and scaled incorrectly. One should look no furtherthan the case of one of the simplest complexes, the water dimer, which exhibits significantvariation in the vibrational spectra across different matrix environments156. Many of theseissues could be detected in the proper anharmonic calculation, although such cases are farfrom routine studies.
In brief, two families of methods exist for the calculation of the anharmonic vibrational
II.4 Supporting computational methods 51
frequencies - variational and perturbative. The former includes vibrational self-consistentfield157–159 with its correlated variants VMP (vibrational Møller-Plesset theory)160,161 andVCI (vibrational configuration interaction)162. These methods require potential energy sur-face generated for the system and are thus restricted to fairly small systems. Potentially, devel-opment of more cost-effective quantum chemical methods in the future will allow for a morewide spread application of these methods, which is of particular interest for less rigid systemswith large-amplitude modes.
The alternative approach involves vibrational second-order perturbation theory163 (de-noted as VPT2) and is consequently a lot less expensive, albeit still costly. Starting fromanalytical second derivatives, third and semidiagonal fourth derivatives are produced by nu-merical differentiation. The method is relatively “black box”, and is implemented in a userfriendly manner164–166 in the GAUSSIAN167 package. The method suffers from classical prob-lems of the perturbation approach, namely symmetry and degeneracy handling, and reso-nances. Multiple parameters can be adjusted by the user, such as whether two or four pointsare used for derivatives, affecting the cost and stability of result, and numerical step, that canbe set depending on the anticipated amplitude of the displacement in the vibrational mode.
One of the possible techniques to reduce computational cost involved is the use of reduced-dimensionality scheme, where user would select only several modes to be included for differ-entiation168. There is no clear recipe for this, and it is purely up to the user to decide whichvibrational modes are critical for the accurate determination of the anharmonic shifts in aparticular mode of interest. Generally, it is often the case that some isolated modes are barelyaffected by other modes and therefore such approach could be an inexpensive trick to accountfor higher-order terms of the potential along the mode, although, in our experience, this isalso the case where frequency scaling is at its best. Which modes to include and establishinghow isolated the mode of interest is could be tricky. Considerations that go into the decisionsare the geometrical confinement of the vibration, checking the harmonic normal modes forvibrational motion bleed across modes, and evaluating the reduced mass of the vibration.
II.4.4 Procedures for data analysis
Based on the methods and features of available software packages at the time of this study,a set of methodologies have been established to analyze spectroscopic data and calculate ther-mochemical parameters. The optimum method combination designed for large systems wasobtaining energy derivatives using the RI-MP2 method with aug-cc-pVQZ (later in the textthis family of basis sets will be denoted as AVQZ) basis set, complemented by suitable /C169
and /J170–172 auxiliary basis sets (or generated automatically with AutoAux173 procedure) and
52 II Methods
using numerical COSX (GridX9 integration grid) method for K-integrals in ORCA174 (v. 4.2and later) package. This approach allowed us to obtain potential energy minima structures andharmonic vibrational frequencies for complexes as large as t-butanol dimer with a precisionappropriate for studies of both strong hydrogen bonds and weak van der Waals interactionswith wave function based methods. In this case, the first derivatives are produced analyticallywith the RIJCOSX-RI-MP2175 method, while second derivatives were obtained numericallywith default step of 0.002 Bohr. This level of theory allows to reduce the basis set errorsenough to avoid expensive counterpoise128 correction for frequencies.
Where possible or deemed important, additional corrections, such as going to quintuple-𝜁basis sets or introducing core electrons into the correlation treatment with corresponding aug-cc-pCVXZ176 (ACVXZ) basis sets have been performed and will be specifically mentionedin the text.
The electronic energy has been calculated using variations to the canonical CCSD(T)177
theory. DLPNO-CCSD(T) was used with cutoffs set with TightPNO setting. The com-plete basis set limit energies were obtained from 3-point extrapolation to the basis set limitwith the conventional Dunning AVXZ basis178–180 fitted to an exponential decay function181,separately for SCF and correlation energy, analogous to the method described by Řezáč118.
Alternatively, the explicitly correlated CCSD(T)-F12b method with cc-pVXZ-F12149
basis and scaling of triples (T) contribution using MP2-F12 correction as a reference wasused for small systems and the cases where symmetry could be exploited to reduce computa-tional cost. In special cases, e.g. small and/or highly symmetrical molecules make the numer-ical calculation of derivatives with CCSD(T)-F12 method, as implemented in MOLPRO142,computationally feasible. Vibrational frequencies derived from this approach are found tobe within a few cm-1 of the basis set limit for coupled cluster method for typical hydrogen-bonded complexes, making these a very reliable harmonic base force field for full anharmoniccalculations.
Anharmonic calculations are very expensive, therefore the choice of method wasfully dependent on the size and symmetry of the system and was restricted to B3LYP-D3BJ/ATZ182–184 or MP2/ADZ185 levels for most systems, in particular due to absence ofRI methods for hybrid DFT and MP2 methods in the GAUSSIAN package. The general VPT2formulation with two or four 0.025 Å step differentiation was selected. The anharmonic shiftswere used in conjunction with higher quality harmonic frequencies, MP2 or CCSD(T), toproduce the final results. Numerical precision in all tasks was set to significantly exceed usuallyrecommended thresholds, to reduce noise in the derivatives and thus ensure smooth geometryconvergence and accurate Hessians.
The DLPNO-based local energy decomposition method (LED) was applied to analyze

II.4 Supporting computational methods 53
the various contributions to the electronic dissociation energy of the molecular complexes andprovide a physical interpretation to the experimentally observed results and a deeper under-standing of the different types of association mechanisms.

54
CHAPTER IIIFrom Chemistry to Flow
PropertiesThe PVT (pressure-volume-temperature) properties of a petroleum fluid govern how the
fluid behaves in the production well as it is produced. The fluid under high pressure andhigh temperature reservoir condition will be subject to pressure and temperature changes as itcomes to the surface and the conditions necessary to prevent boil-off and three-phase flow (gas-liquid-liquid), which can hinder efficient production186–188, need to be accurately determinedfor a given crude oil composition and well. The phase diagram for the oil is calculated basedon the boiling points of the distillation fractions of the crude oil.
The distillation process is carried out at atmospheric pressure, until a certain temperature,after which system is put under gradually increasing vacuum, down to 0.1 mbar in a typicalcommercial instrument, lowering the boiling point of the chemicals and preventing cracking.Commercial instruments provide separation of equivalent to ca. 100 theoretical plates andtypically produce distillate fractions from C6 to C24+, the latter being the residual that is leftand not distillable. The bulk of polar compounds and heavy resins and asphaltenes will befound in the C24+ fraction.
The boiling points of individual oil constituents are determined by their fundamentalmolecular properties, while the actual behavior in the TBP distillation system is affected bythe interactions between multiple different chemicals. As an example, a light molecule likewater forms condensed phase with characteristic boiling point of 100°C, which among simplealkanes, that do not exhibit hydrogen bonding capabilities, is only matched by heptane, withmolecular mass almost 6 times that of water. In mixtures lots of possible molecular combi-nations are possible, as well as presence of weakly interacting molecules in the mixture coulddisrupt bonds formed in pure liquid, because of that physical properties become hard to pre-dict, and they are not only characteristic of chemical composition, but is also dependent onconditions to which matter is subjected to.
The following spectroscopic study of the C6-C24+ distillation cuts demonstrates thespread in actual chemical composition in the individual cuts, and illustrates the risk of relyinguncritically on the results of the conventional TBP distillation to predict flow properties of thefluid during production. Improved techniques include spinning band distillation with morethan 1000 theoretical plates which yields improved separation189 and simulated distillation
56 III From Chemistry to Flow Properties
on a GC-MS190 instrumentation. The use of GC approach allows reproducible boiling pointanalysis up to C120 in crude oil191, making the method very useful to consider non-volatilepolar compounds.
In this chapter, the distillation cuts from the five crude oil samples from the North Seaare investigated by infrared and Raman spectroscopy.
III.1 Geographic origins of the samplesThe samples originate from the Dan, Halfdan, Kraka and Valdemar fields, displayed on
the Figures III.2 to III.4192. Kraka is the first of the fields discovered in the Danish NorthSea, and is located at the southernmost part of it. The produced oil is transported to the Danfield for processing before it is transported ashore.
The samples for this characterization study are the original drill core samples and producedoil samples from the Dan, Halfdan, Kraka and Valdemar fields. The Dan, Halfdan and Krakafields are located in the Southern part of the Danish North Sea and are related by geology andfluid migration. The producing wells in Dan and Halfdan are located in the MaastrichtianChalk (Tor formation) and the Kraka wells in the Danian chalk (Ekofisk formation) both be-ing in the upper cretaceous. The current reservoir conditions after 15-25 years of productionfor these fields are in the range T=60-70°C and pressure 160-170 bar. The Valdemar field pro-duces from wells in the lower cretaceous, mainly the Tuxen formation, with average reservoirconditions of T= 90°C and the pressure of 300 bar. The drill core samples were selected onthe basis of geological position and availability of core material to get samples from as widea geological area within the four fields as possible. The core samples for chemical analysiswere taken as 20-40 gram miniplugs drilled from the center of the original drill cores to avoidmaterial that has been exposed directly to atmosphere, hydrocarbon-based drilling liquidsand mechanical influence. The influence of atmosphere is assumed to be limited due to thelow permeability of the rock material. The Tor chalk has permeabilities around K=0.5-2 mDwhile the Valdemar chalk is extremely low permeability, K=0.08-0.12 mD.
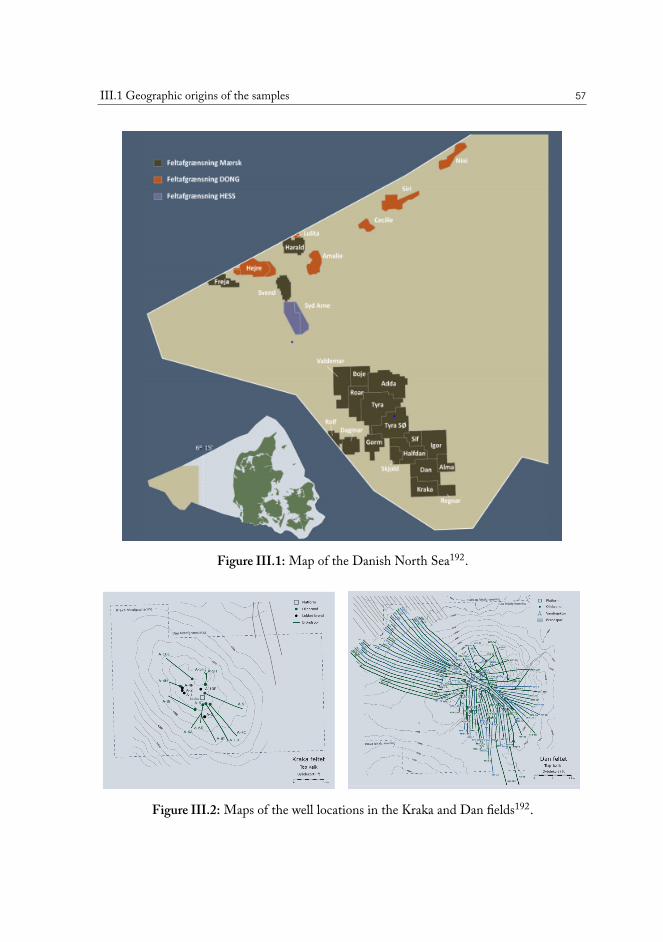
III.1 Geographic origins of the samples 57
Figure III.1: Map of the Danish North Sea192.
Figure III.2: Maps of the well locations in the Kraka and Dan fields192.
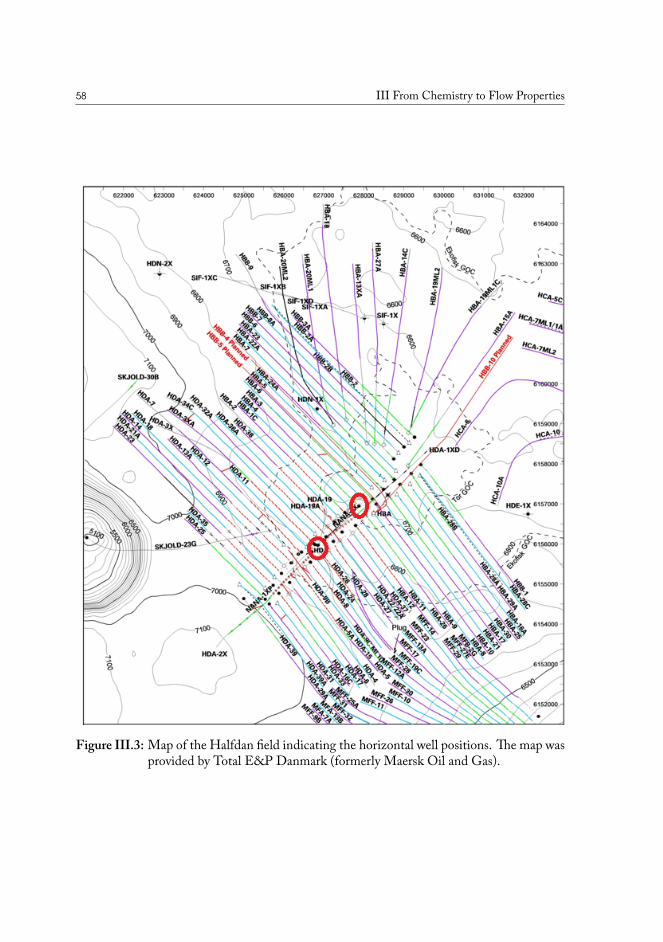
58 III From Chemistry to Flow Properties
Figure III.3: Map of the Halfdan field indicating the horizontal well positions. The map wasprovided by Total E&P Danmark (formerly Maersk Oil and Gas).
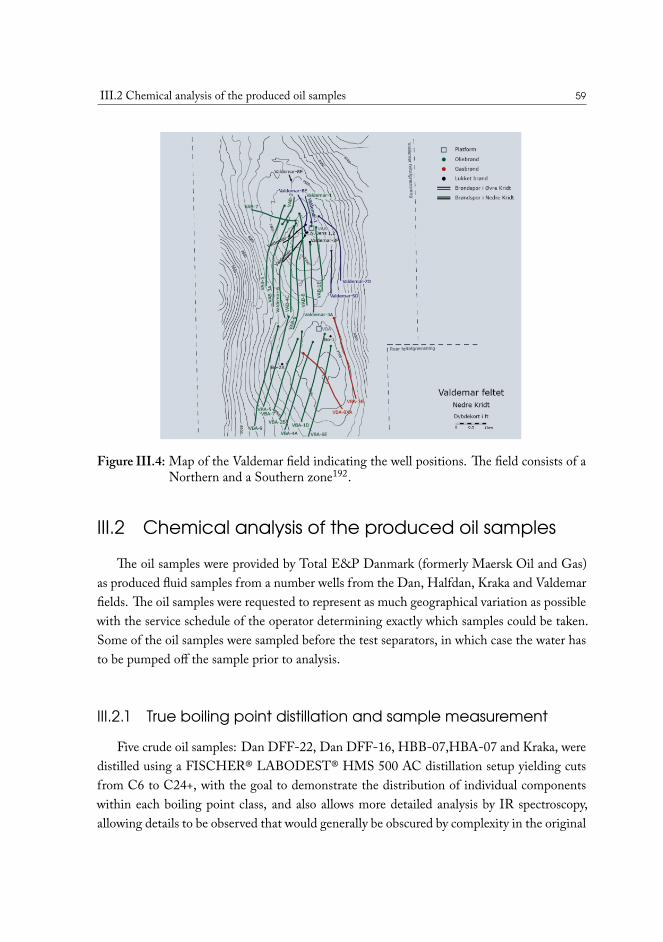
III.2 Chemical analysis of the produced oil samples 59
Figure III.4: Map of the Valdemar field indicating the well positions. The field consists of aNorthern and a Southern zone192.
III.2 Chemical analysis of the produced oil samples
The oil samples were provided by Total E&P Danmark (formerly Maersk Oil and Gas)as produced fluid samples from a number wells from the Dan, Halfdan, Kraka and Valdemarfields. The oil samples were requested to represent as much geographical variation as possiblewith the service schedule of the operator determining exactly which samples could be taken.Some of the oil samples were sampled before the test separators, in which case the water hasto be pumped off the sample prior to analysis.
III.2.1 True boiling point distillation and sample measurement
Five crude oil samples: Dan DFF-22, Dan DFF-16, HBB-07,HBA-07 and Kraka, weredistilled using a FISCHER® LABODEST® HMS 500 AC distillation setup yielding cutsfrom C6 to C24+, with the goal to demonstrate the distribution of individual componentswithin each boiling point class, and also allows more detailed analysis by IR spectroscopy,allowing details to be observed that would generally be obscured by complexity in the original
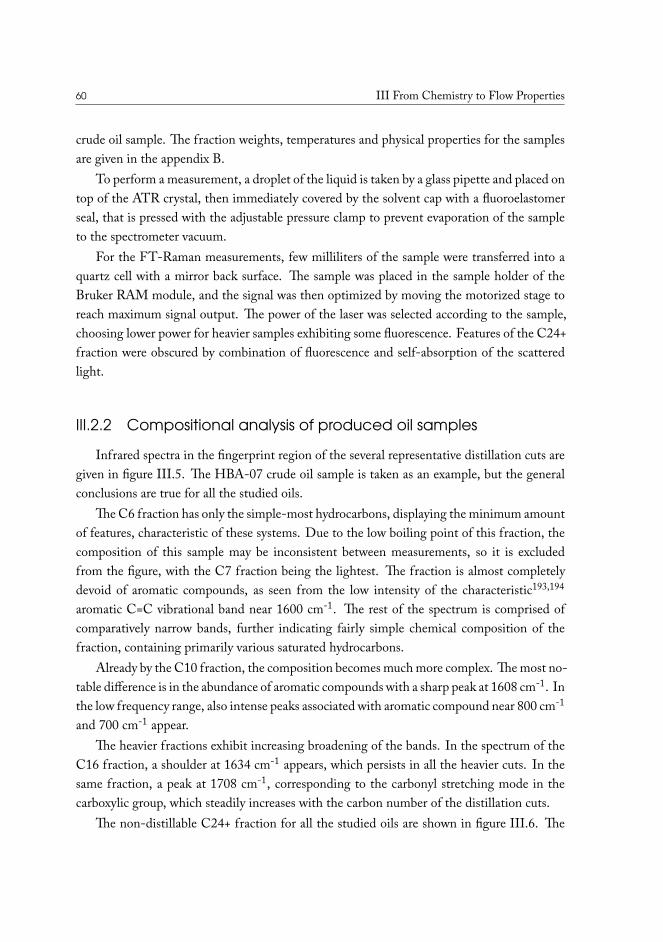
60 III From Chemistry to Flow Properties
crude oil sample. The fraction weights, temperatures and physical properties for the samplesare given in the appendix B.
To perform a measurement, a droplet of the liquid is taken by a glass pipette and placed ontop of the ATR crystal, then immediately covered by the solvent cap with a fluoroelastomerseal, that is pressed with the adjustable pressure clamp to prevent evaporation of the sampleto the spectrometer vacuum.
For the FT-Raman measurements, few milliliters of the sample were transferred into aquartz cell with a mirror back surface. The sample was placed in the sample holder of theBruker RAM module, and the signal was then optimized by moving the motorized stage toreach maximum signal output. The power of the laser was selected according to the sample,choosing lower power for heavier samples exhibiting some fluorescence. Features of the C24+fraction were obscured by combination of fluorescence and self-absorption of the scatteredlight.
III.2.2 Compositional analysis of produced oil samples
Infrared spectra in the fingerprint region of the several representative distillation cuts aregiven in figure III.5. The HBA-07 crude oil sample is taken as an example, but the generalconclusions are true for all the studied oils.
The C6 fraction has only the simple-most hydrocarbons, displaying the minimum amountof features, characteristic of these systems. Due to the low boiling point of this fraction, thecomposition of this sample may be inconsistent between measurements, so it is excludedfrom the figure, with the C7 fraction being the lightest. The fraction is almost completelydevoid of aromatic compounds, as seen from the low intensity of the characteristic193,194
aromatic C=C vibrational band near 1600 cm-1. The rest of the spectrum is comprised ofcomparatively narrow bands, further indicating fairly simple chemical composition of thefraction, containing primarily various saturated hydrocarbons.
Already by the C10 fraction, the composition becomes much more complex. The most no-table difference is in the abundance of aromatic compounds with a sharp peak at 1608 cm-1. Inthe low frequency range, also intense peaks associated with aromatic compound near 800 cm-1
and 700 cm-1 appear.The heavier fractions exhibit increasing broadening of the bands. In the spectrum of the
C16 fraction, a shoulder at 1634 cm-1 appears, which persists in all the heavier cuts. In thesame fraction, a peak at 1708 cm-1, corresponding to the carbonyl stretching mode in thecarboxylic group, which steadily increases with the carbon number of the distillation cuts.
The non-distillable C24+ fraction for all the studied oils are shown in figure III.6. The
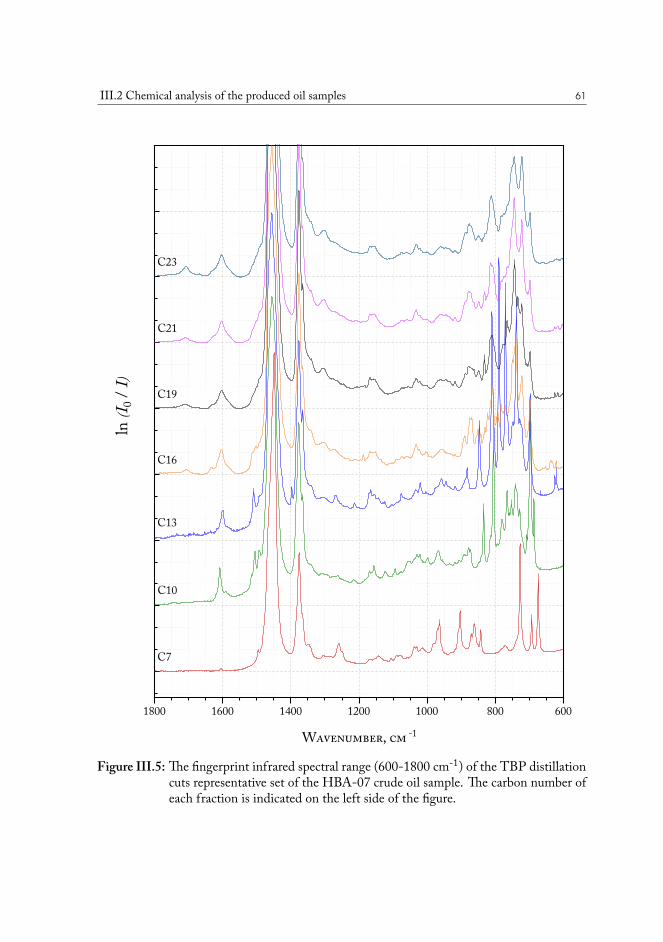
III.2 Chemical analysis of the produced oil samples 61
1800 1600 1400 1200 1000 800 600
C23
C21
C19
C16
C10
C13
C7
Wavenumber, cm -1
ln (I 0
/ I)
Figure III.5: The fingerprint infrared spectral range (600-1800 cm-1) of the TBP distillationcuts representative set of the HBA-07 crude oil sample. The carbon number ofeach fraction is indicated on the left side of the figure.
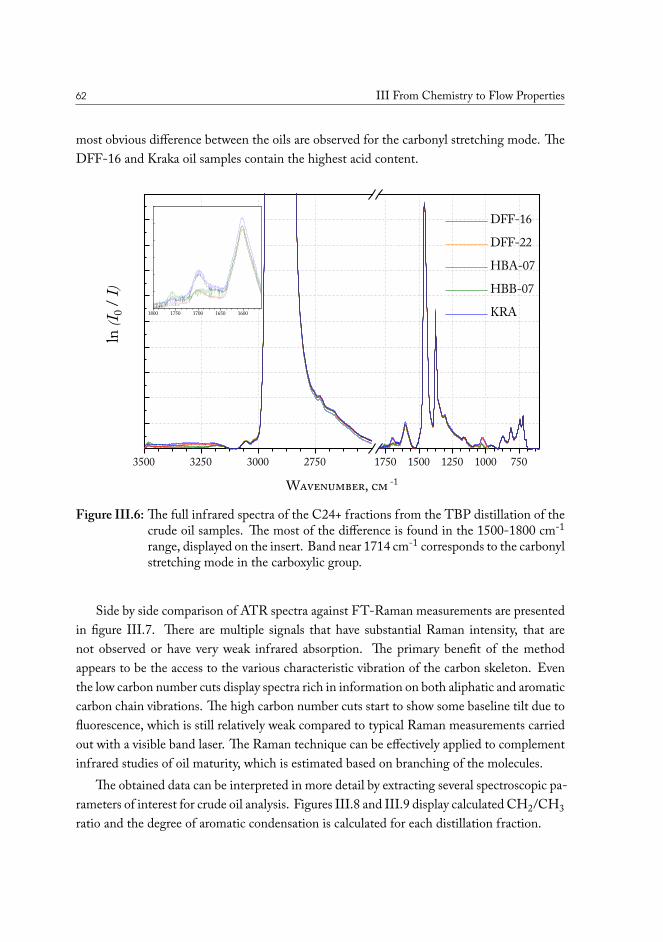
62 III From Chemistry to Flow Properties
most obvious difference between the oils are observed for the carbonyl stretching mode. TheDFF-16 and Kraka oil samples contain the highest acid content.
3500 3250 3000 2750 1750 1500 1250 1000 750
1800 1750 1700 1650 1600
DFF-16 DFF-22 HBA-07 HBB-07 KRA
Wavenumber, cm -1
ln (I 0
/ I)
Figure III.6: The full infrared spectra of the C24+ fractions from the TBP distillation of thecrude oil samples. The most of the difference is found in the 1500-1800 cm-1
range, displayed on the insert. Band near 1714 cm-1 corresponds to the carbonylstretching mode in the carboxylic group.
Side by side comparison of ATR spectra against FT-Raman measurements are presentedin figure III.7. There are multiple signals that have substantial Raman intensity, that arenot observed or have very weak infrared absorption. The primary benefit of the methodappears to be the access to the various characteristic vibration of the carbon skeleton. Eventhe low carbon number cuts display spectra rich in information on both aliphatic and aromaticcarbon chain vibrations. The high carbon number cuts start to show some baseline tilt due tofluorescence, which is still relatively weak compared to typical Raman measurements carriedout with a visible band laser. The Raman technique can be effectively applied to complementinfrared studies of oil maturity, which is estimated based on branching of the molecules.
The obtained data can be interpreted in more detail by extracting several spectroscopic pa-rameters of interest for crude oil analysis. Figures III.8 and III.9 display calculated CH2/CH3ratio and the degree of aromatic condensation is calculated for each distillation fraction.
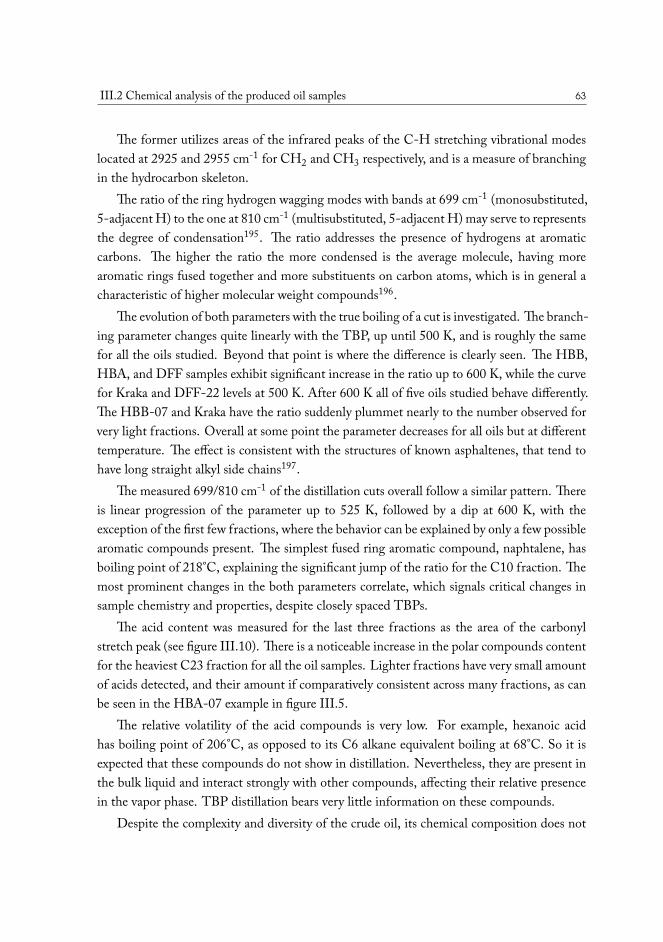
III.2 Chemical analysis of the produced oil samples 63
The former utilizes areas of the infrared peaks of the C-H stretching vibrational modeslocated at 2925 and 2955 cm-1 for CH2 and CH3 respectively, and is a measure of branchingin the hydrocarbon skeleton.
The ratio of the ring hydrogen wagging modes with bands at 699 cm-1 (monosubstituted,5-adjacent H) to the one at 810 cm-1 (multisubstituted, 5-adjacent H) may serve to representsthe degree of condensation195. The ratio addresses the presence of hydrogens at aromaticcarbons. The higher the ratio the more condensed is the average molecule, having morearomatic rings fused together and more substituents on carbon atoms, which is in general acharacteristic of higher molecular weight compounds196.
The evolution of both parameters with the true boiling of a cut is investigated. The branch-ing parameter changes quite linearly with the TBP, up until 500 K, and is roughly the samefor all the oils studied. Beyond that point is where the difference is clearly seen. The HBB,HBA, and DFF samples exhibit significant increase in the ratio up to 600 K, while the curvefor Kraka and DFF-22 levels at 500 K. After 600 K all of five oils studied behave differently.The HBB-07 and Kraka have the ratio suddenly plummet nearly to the number observed forvery light fractions. Overall at some point the parameter decreases for all oils but at differenttemperature. The effect is consistent with the structures of known asphaltenes, that tend tohave long straight alkyl side chains197.
The measured 699/810 cm-1 of the distillation cuts overall follow a similar pattern. Thereis linear progression of the parameter up to 525 K, followed by a dip at 600 K, with theexception of the first few fractions, where the behavior can be explained by only a few possiblearomatic compounds present. The simplest fused ring aromatic compound, naphtalene, hasboiling point of 218°C, explaining the significant jump of the ratio for the C10 fraction. Themost prominent changes in the both parameters correlate, which signals critical changes insample chemistry and properties, despite closely spaced TBPs.
The acid content was measured for the last three fractions as the area of the carbonylstretch peak (see figure III.10). There is a noticeable increase in the polar compounds contentfor the heaviest C23 fraction for all the oil samples. Lighter fractions have very small amountof acids detected, and their amount if comparatively consistent across many fractions, as canbe seen in the HBA-07 example in figure III.5.
The relative volatility of the acid compounds is very low. For example, hexanoic acidhas boiling point of 206°C, as opposed to its C6 alkane equivalent boiling at 68°C. So it isexpected that these compounds do not show in distillation. Nevertheless, they are present inthe bulk liquid and interact strongly with other compounds, affecting their relative presencein the vapor phase. TBP distillation bears very little information on these compounds.
Despite the complexity and diversity of the crude oil, its chemical composition does not
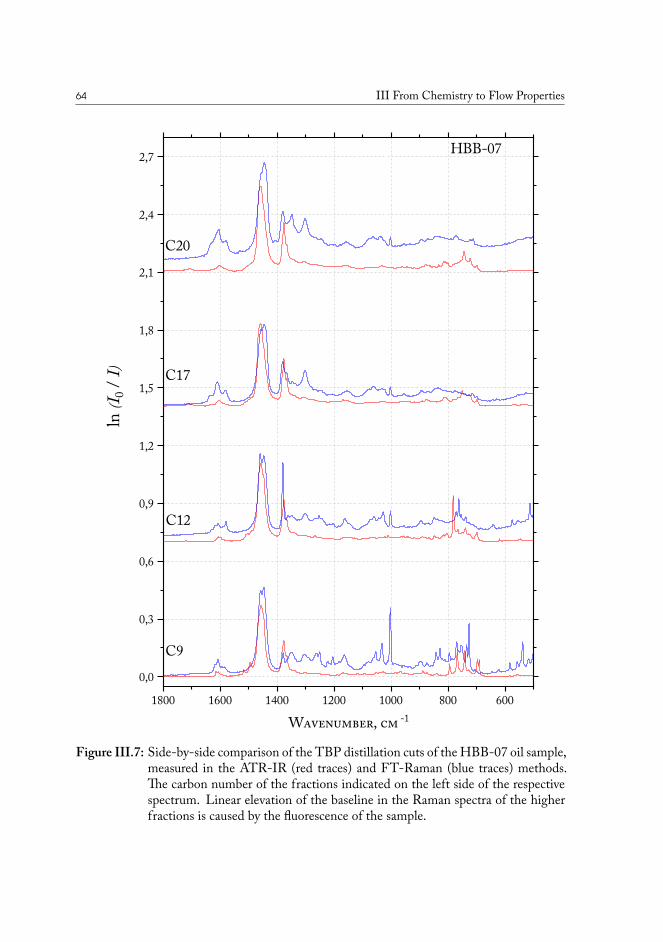
64 III From Chemistry to Flow Properties
1800 1600 1400 1200 1000 800 6000,0
0,3
0,6
0,9
1,2
1,5
1,8
2,1
2,4
2,7
C20
C12
C17
C9
Wavenumber, cm -1
ln (I 0
/ I)
HBB-07
Figure III.7: Side-by-side comparison of the TBP distillation cuts of the HBB-07 oil sample,measured in the ATR-IR (red traces) and FT-Raman (blue traces) methods.The carbon number of the fractions indicated on the left side of the respectivespectrum. Linear elevation of the baseline in the Raman spectra of the higherfractions is caused by the fluorescence of the sample.
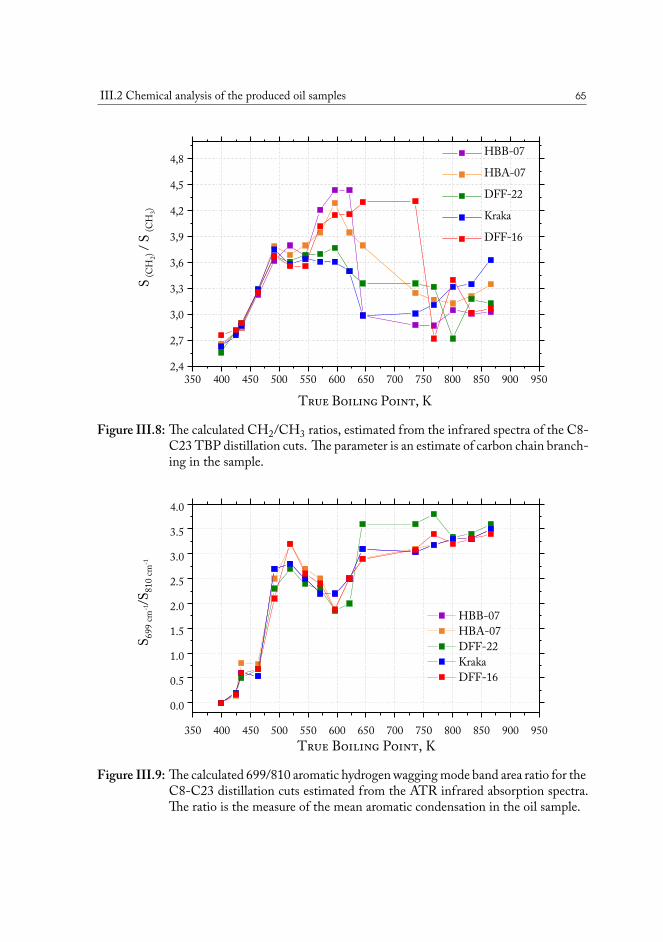
III.2 Chemical analysis of the produced oil samples 65
350 400 450 500 550 600 650 700 750 800 850 900 9502,4
2,7
3,0
3,3
3,6
3,9
4,2
4,5
4,8
HBB-07 HBA-07 DFF-22 Kraka DFF-16
True Boiling Point, K
S (CH
2) / S
(CH
3)
Figure III.8: The calculated CH2/CH3 ratios, estimated from the infrared spectra of the C8-C23 TBP distillation cuts. The parameter is an estimate of carbon chain branch-ing in the sample.
350 400 450 500 550 600 650 700 750 800 850 900 950
0.0
0.5
1.0
1.5
2.0
2.5
3.0
3.5
4.0
HBB-07 HBA-07 DFF-22 Kraka DFF-16
True Boiling Point, K
S 699
cm-1/S
810 c
m-1
Figure III.9: The calculated 699/810 aromatic hydrogen wagging mode band area ratio for theC8-C23 distillation cuts estimated from the ATR infrared absorption spectra.The ratio is the measure of the mean aromatic condensation in the oil sample.
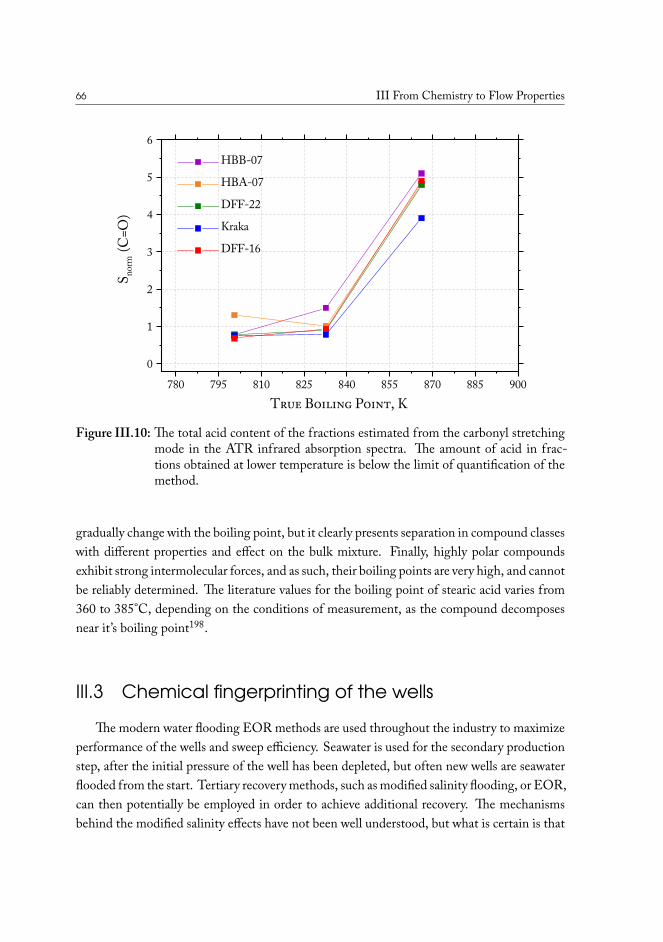
66 III From Chemistry to Flow Properties
780 795 810 825 840 855 870 885 9000
1
2
3
4
5
6
HBB-07 HBA-07 DFF-22 Kraka DFF-16
True Boiling Point, K
S norm
(C=O
)
Figure III.10: The total acid content of the fractions estimated from the carbonyl stretchingmode in the ATR infrared absorption spectra. The amount of acid in frac-tions obtained at lower temperature is below the limit of quantification of themethod.
gradually change with the boiling point, but it clearly presents separation in compound classeswith different properties and effect on the bulk mixture. Finally, highly polar compoundsexhibit strong intermolecular forces, and as such, their boiling points are very high, and cannotbe reliably determined. The literature values for the boiling point of stearic acid varies from360 to 385°C, depending on the conditions of measurement, as the compound decomposesnear it’s boiling point198.
III.3 Chemical fingerprinting of the wells
The modern water flooding EOR methods are used throughout the industry to maximizeperformance of the wells and sweep efficiency. Seawater is used for the secondary productionstep, after the initial pressure of the well has been depleted, but often new wells are seawaterflooded from the start. Tertiary recovery methods, such as modified salinity flooding, or EOR,can then potentially be employed in order to achieve additional recovery. The mechanismsbehind the modified salinity effects have not been well understood, but what is certain is that
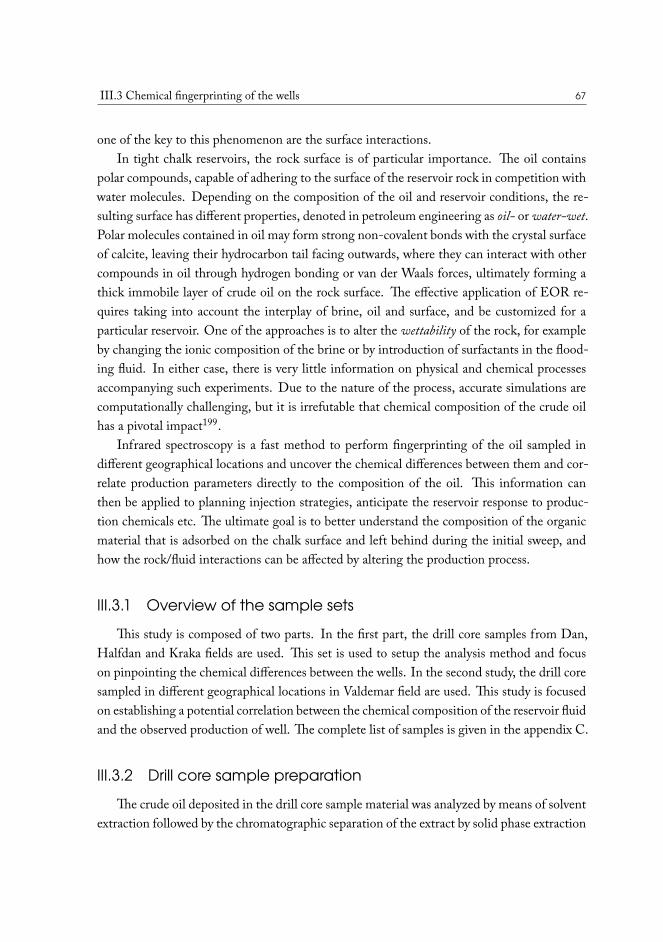
III.3 Chemical fingerprinting of the wells 67
one of the key to this phenomenon are the surface interactions.In tight chalk reservoirs, the rock surface is of particular importance. The oil contains
polar compounds, capable of adhering to the surface of the reservoir rock in competition withwater molecules. Depending on the composition of the oil and reservoir conditions, the re-sulting surface has different properties, denoted in petroleum engineering as oil- or water-wet.Polar molecules contained in oil may form strong non-covalent bonds with the crystal surfaceof calcite, leaving their hydrocarbon tail facing outwards, where they can interact with othercompounds in oil through hydrogen bonding or van der Waals forces, ultimately forming athick immobile layer of crude oil on the rock surface. The effective application of EOR re-quires taking into account the interplay of brine, oil and surface, and be customized for aparticular reservoir. One of the approaches is to alter the wettability of the rock, for exampleby changing the ionic composition of the brine or by introduction of surfactants in the flood-ing fluid. In either case, there is very little information on physical and chemical processesaccompanying such experiments. Due to the nature of the process, accurate simulations arecomputationally challenging, but it is irrefutable that chemical composition of the crude oilhas a pivotal impact199.
Infrared spectroscopy is a fast method to perform fingerprinting of the oil sampled indifferent geographical locations and uncover the chemical differences between them and cor-relate production parameters directly to the composition of the oil. This information canthen be applied to planning injection strategies, anticipate the reservoir response to produc-tion chemicals etc. The ultimate goal is to better understand the composition of the organicmaterial that is adsorbed on the chalk surface and left behind during the initial sweep, andhow the rock/fluid interactions can be affected by altering the production process.
III.3.1 Overview of the sample setsThis study is composed of two parts. In the first part, the drill core samples from Dan,
Halfdan and Kraka fields are used. This set is used to setup the analysis method and focuson pinpointing the chemical differences between the wells. In the second study, the drill coresampled in different geographical locations in Valdemar field are used. This study is focusedon establishing a potential correlation between the chemical composition of the reservoir fluidand the observed production of well. The complete list of samples is given in the appendix C.
III.3.2 Drill core sample preparationThe crude oil deposited in the drill core sample material was analyzed by means of solvent
extraction followed by the chromatographic separation of the extract by solid phase extraction
68 III From Chemistry to Flow Properties
method (SPE).The middle part of a core that is less likely to exhibit any artifacts, that could be related
to drilling mud, or large heterogeneous sections, is cleaved out and ground in a mortar toobtain a semi-fine uniform powder. The powder is collected in a 8 ml sample vial and isstirred. Then, an approximately 1 g of the sample is transferred into a separate vial and 4 mlof dichloromethane is added to it. The mixture is stirred on a shaker for an hour, after that itis centrifuged and the supernatant is transferred into a different vial and another portion ofdichloromethane is added to the powder and shaken overnight. The two extracts are mergedand dried under a gentle stream of nitrogen to estimate the mass of the extracted oil. Basedon the measured mass, the sample is redissolved in an appropriate volume of dichloromethaneand a portion of that solution is transferred into an HPLC vial, while the rest of the extractis used for complementary analysis, e.g. GC-MS. The exact amount transferred is selected toobtain quantity of material suitable for loading a 500 mg SPE column, and is typically in therange from 20 to 30 mg.
The sample is then dried and redissolved in 0.5 ml of n-heptane. Sonication is usuallynecessary to achieve proper dissolution. At this point, the column is conditioned by adding3 ml of dichloromethane and equilibrated with 6 ml of heptane. The sample is loaded onto thecolumn and the vial is then washed by another 0.5 ml of heptane. In some cases, the sampleis rich in heptane-insoluble material that might stick to the glass surface. In such case, theresidue was dissolved in the heptane-toluene mixture, used in the second round of elution, andis loaded when the column wash is changed to that solvent. Two column volumes of eluentare added at each stage, amounting to 4 ml, with four fractions produced (see table III.1).Elution is performed by gravity, with the fractions collected in 8 ml glass vials. The fractionsare subsequently dried under the stream of nitrogen in a sample concentrator apparatus, wherevial is placed in a cast aluminum block heated to 35°C and the gas is delivered through theneedle placed about a centimeter above level of the liquid.
Table III.1: Description of the SPE fractions obtained from the silica columns.
Fraction Eluent mixture Chemical compositionA n-heptane Aliphatics, light aromaticsB 80% n-heptane / 20% toluene PolyaromaticsC toluene Asphaltenes, polarD 80% toluene / 20% methanol Asphaltenes, polar, amides
The masses of each fractions are obtained. Then extracts are dissolved in small quantitiesof solvent, to be transferred onto the ATR crystal. The amount is roughly one drop per 0.5 mg
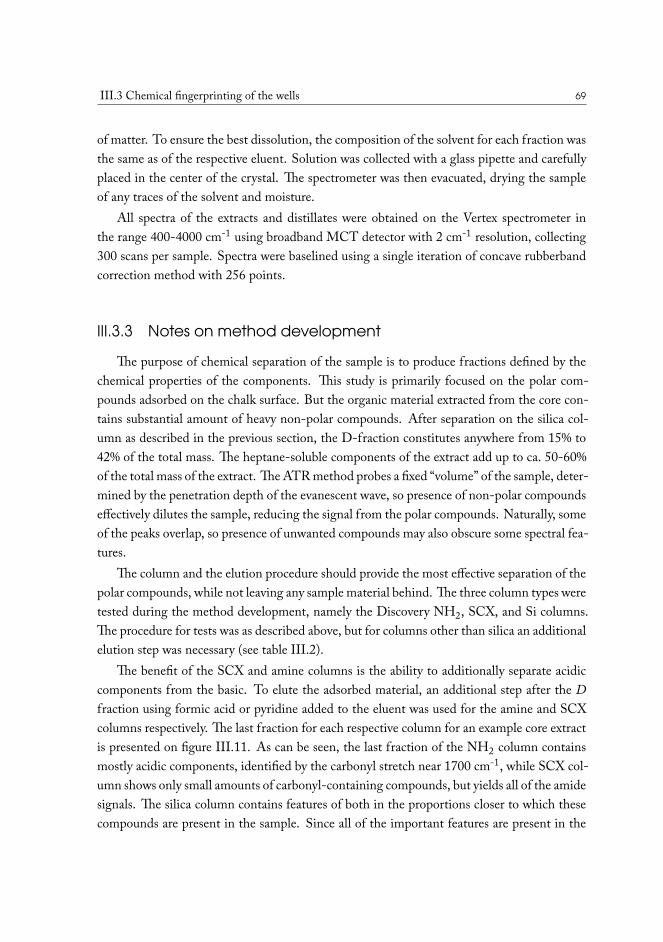
III.3 Chemical fingerprinting of the wells 69
of matter. To ensure the best dissolution, the composition of the solvent for each fraction wasthe same as of the respective eluent. Solution was collected with a glass pipette and carefullyplaced in the center of the crystal. The spectrometer was then evacuated, drying the sampleof any traces of the solvent and moisture.
All spectra of the extracts and distillates were obtained on the Vertex spectrometer inthe range 400-4000 cm-1 using broadband MCT detector with 2 cm-1 resolution, collecting300 scans per sample. Spectra were baselined using a single iteration of concave rubberbandcorrection method with 256 points.
III.3.3 Notes on method development
The purpose of chemical separation of the sample is to produce fractions defined by thechemical properties of the components. This study is primarily focused on the polar com-pounds adsorbed on the chalk surface. But the organic material extracted from the core con-tains substantial amount of heavy non-polar compounds. After separation on the silica col-umn as described in the previous section, the D-fraction constitutes anywhere from 15% to42% of the total mass. The heptane-soluble components of the extract add up to ca. 50-60%of the total mass of the extract. The ATR method probes a fixed “volume” of the sample, deter-mined by the penetration depth of the evanescent wave, so presence of non-polar compoundseffectively dilutes the sample, reducing the signal from the polar compounds. Naturally, someof the peaks overlap, so presence of unwanted compounds may also obscure some spectral fea-tures.
The column and the elution procedure should provide the most effective separation of thepolar compounds, while not leaving any sample material behind. The three column types weretested during the method development, namely the Discovery NH2, SCX, and Si columns.The procedure for tests was as described above, but for columns other than silica an additionalelution step was necessary (see table III.2).
The benefit of the SCX and amine columns is the ability to additionally separate acidiccomponents from the basic. To elute the adsorbed material, an additional step after the Dfraction using formic acid or pyridine added to the eluent was used for the amine and SCXcolumns respectively. The last fraction for each respective column for an example core extractis presented on figure III.11. As can be seen, the last fraction of the NH2 column containsmostly acidic components, identified by the carbonyl stretch near 1700 cm-1, while SCX col-umn shows only small amounts of carbonyl-containing compounds, but yields all of the amidesignals. The silica column contains features of both in the proportions closer to which thesecompounds are present in the sample. Since all of the important features are present in the
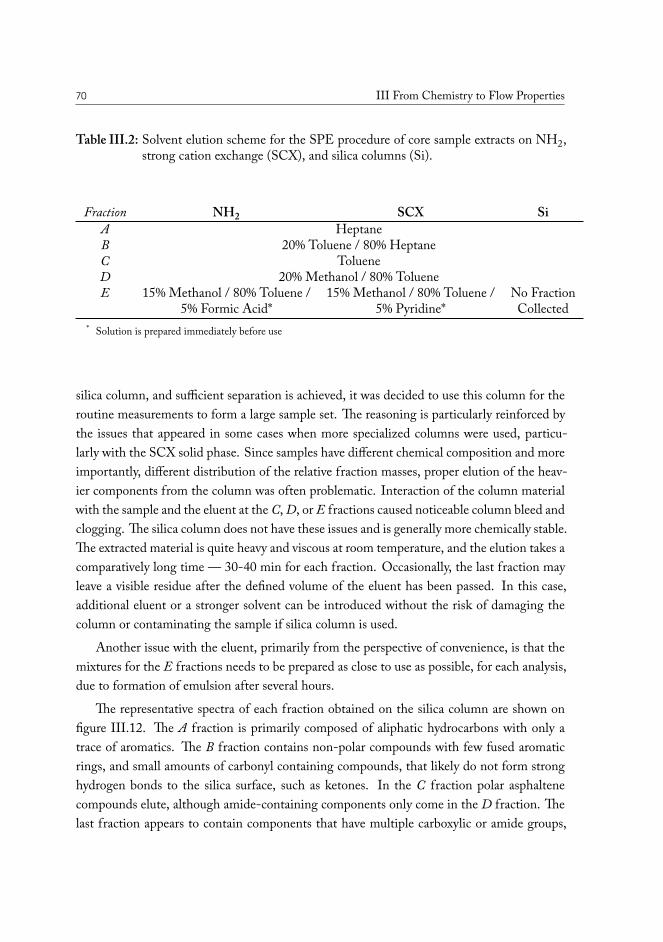
70 III From Chemistry to Flow Properties
Table III.2: Solvent elution scheme for the SPE procedure of core sample extracts on NH2,strong cation exchange (SCX), and silica columns (Si).
Fraction NH2 SCX SiA HeptaneB 20% Toluene / 80% HeptaneC TolueneD 20% Methanol / 80% TolueneE 15% Methanol / 80% Toluene / 15% Methanol / 80% Toluene / No Fraction
5% Formic Acid* 5% Pyridine* Collected* Solution is prepared immediately before use
silica column, and sufficient separation is achieved, it was decided to use this column for theroutine measurements to form a large sample set. The reasoning is particularly reinforced bythe issues that appeared in some cases when more specialized columns were used, particu-larly with the SCX solid phase. Since samples have different chemical composition and moreimportantly, different distribution of the relative fraction masses, proper elution of the heav-ier components from the column was often problematic. Interaction of the column materialwith the sample and the eluent at the C, D, or E fractions caused noticeable column bleed andclogging. The silica column does not have these issues and is generally more chemically stable.The extracted material is quite heavy and viscous at room temperature, and the elution takes acomparatively long time — 30-40 min for each fraction. Occasionally, the last fraction mayleave a visible residue after the defined volume of the eluent has been passed. In this case,additional eluent or a stronger solvent can be introduced without the risk of damaging thecolumn or contaminating the sample if silica column is used.
Another issue with the eluent, primarily from the perspective of convenience, is that themixtures for the E fractions needs to be prepared as close to use as possible, for each analysis,due to formation of emulsion after several hours.
The representative spectra of each fraction obtained on the silica column are shown onfigure III.12. The A fraction is primarily composed of aliphatic hydrocarbons with only atrace of aromatics. The B fraction contains non-polar compounds with few fused aromaticrings, and small amounts of carbonyl containing compounds, that likely do not form stronghydrogen bonds to the silica surface, such as ketones. In the C fraction polar asphaltenecompounds elute, although amide-containing components only come in the D fraction. Thelast fraction appears to contain components that have multiple carboxylic or amide groups,
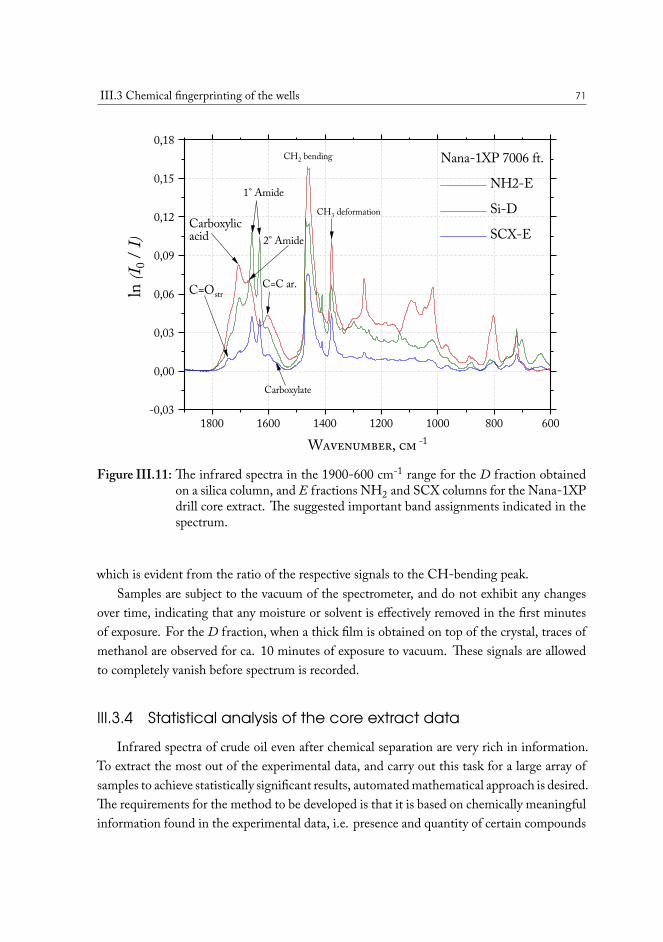
III.3 Chemical fingerprinting of the wells 71
1800 1600 1400 1200 1000 800 600-0,03
0,00
0,03
0,06
0,09
0,12
0,15
0,18
2° Amide
C=Ostr
CH3 deformation
CH2 bending
Carboxylate
C=C ar.
Carboxylicacid
Nana-1XP 7006 ft. NH2-E Si-D SCX-E
Wavenumber, cm -1
ln (I 0
/ I)
1° Amide
Figure III.11: The infrared spectra in the 1900-600 cm-1 range for the D fraction obtainedon a silica column, and E fractions NH2 and SCX columns for the Nana-1XPdrill core extract. The suggested important band assignments indicated in thespectrum.
which is evident from the ratio of the respective signals to the CH-bending peak.Samples are subject to the vacuum of the spectrometer, and do not exhibit any changes
over time, indicating that any moisture or solvent is effectively removed in the first minutesof exposure. For the D fraction, when a thick film is obtained on top of the crystal, traces ofmethanol are observed for ca. 10 minutes of exposure to vacuum. These signals are allowedto completely vanish before spectrum is recorded.
III.3.4 Statistical analysis of the core extract dataInfrared spectra of crude oil even after chemical separation are very rich in information.
To extract the most out of the experimental data, and carry out this task for a large array ofsamples to achieve statistically significant results, automated mathematical approach is desired.The requirements for the method to be developed is that it is based on chemically meaningfulinformation found in the experimental data, i.e. presence and quantity of certain compounds
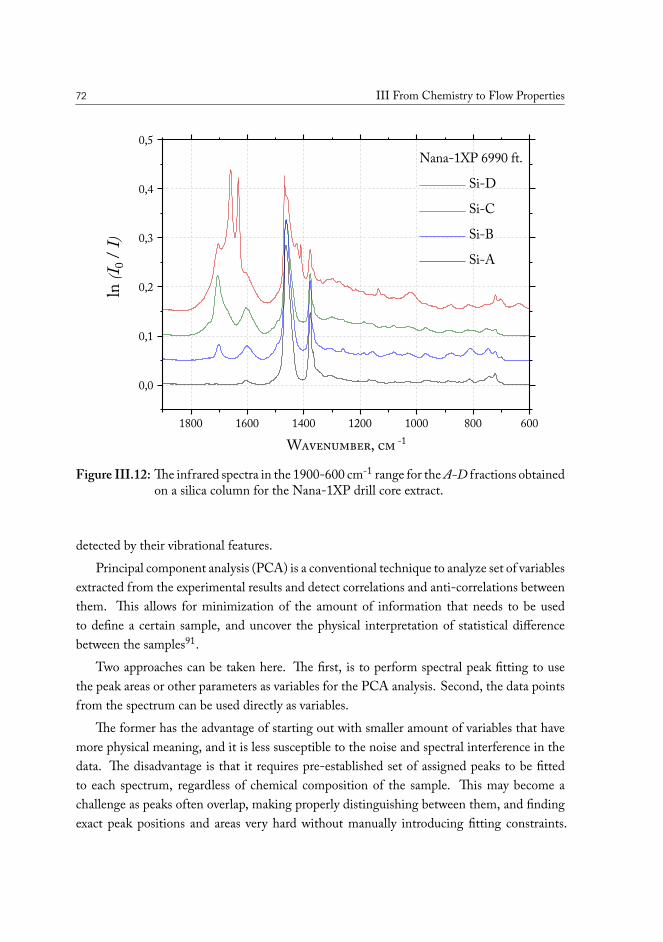
72 III From Chemistry to Flow Properties
1800 1600 1400 1200 1000 800 600
0,0
0,1
0,2
0,3
0,4
0,5
Nana-1XP 6990 ft. Si-D Si-C Si-B Si-A
Wavenumber, cm -1
ln (I 0
/ I)
Figure III.12: The infrared spectra in the 1900-600 cm-1 range for theA-D fractions obtainedon a silica column for the Nana-1XP drill core extract.
detected by their vibrational features.Principal component analysis (PCA) is a conventional technique to analyze set of variables
extracted from the experimental results and detect correlations and anti-correlations betweenthem. This allows for minimization of the amount of information that needs to be usedto define a certain sample, and uncover the physical interpretation of statistical differencebetween the samples91.
Two approaches can be taken here. The first, is to perform spectral peak fitting to usethe peak areas or other parameters as variables for the PCA analysis. Second, the data pointsfrom the spectrum can be used directly as variables.
The former has the advantage of starting out with smaller amount of variables that havemore physical meaning, and it is less susceptible to the noise and spectral interference in thedata. The disadvantage is that it requires pre-established set of assigned peaks to be fittedto each spectrum, regardless of chemical composition of the sample. This may become achallenge as peaks often overlap, making properly distinguishing between them, and findingexact peak positions and areas very hard without manually introducing fitting constraints.
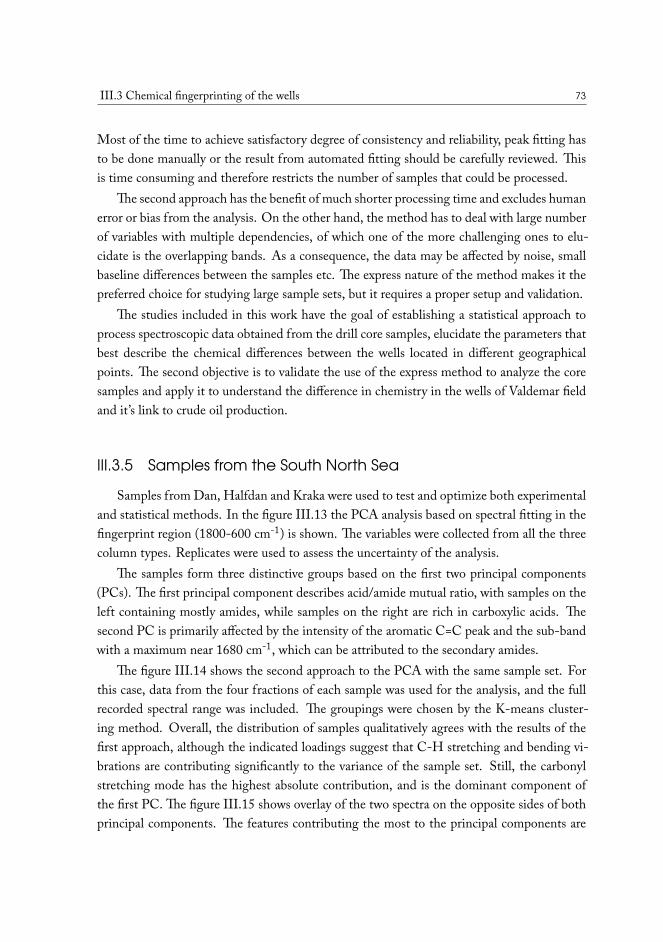
III.3 Chemical fingerprinting of the wells 73
Most of the time to achieve satisfactory degree of consistency and reliability, peak fitting hasto be done manually or the result from automated fitting should be carefully reviewed. Thisis time consuming and therefore restricts the number of samples that could be processed.
The second approach has the benefit of much shorter processing time and excludes humanerror or bias from the analysis. On the other hand, the method has to deal with large numberof variables with multiple dependencies, of which one of the more challenging ones to elu-cidate is the overlapping bands. As a consequence, the data may be affected by noise, smallbaseline differences between the samples etc. The express nature of the method makes it thepreferred choice for studying large sample sets, but it requires a proper setup and validation.
The studies included in this work have the goal of establishing a statistical approach toprocess spectroscopic data obtained from the drill core samples, elucidate the parameters thatbest describe the chemical differences between the wells located in different geographicalpoints. The second objective is to validate the use of the express method to analyze the coresamples and apply it to understand the difference in chemistry in the wells of Valdemar fieldand it’s link to crude oil production.
III.3.5 Samples from the South North Sea
Samples from Dan, Halfdan and Kraka were used to test and optimize both experimentaland statistical methods. In the figure III.13 the PCA analysis based on spectral fitting in thefingerprint region (1800-600 cm-1) is shown. The variables were collected from all the threecolumn types. Replicates were used to assess the uncertainty of the analysis.
The samples form three distinctive groups based on the first two principal components(PCs). The first principal component describes acid/amide mutual ratio, with samples on theleft containing mostly amides, while samples on the right are rich in carboxylic acids. Thesecond PC is primarily affected by the intensity of the aromatic C=C peak and the sub-bandwith a maximum near 1680 cm-1, which can be attributed to the secondary amides.
The figure III.14 shows the second approach to the PCA with the same sample set. Forthis case, data from the four fractions of each sample was used for the analysis, and the fullrecorded spectral range was included. The groupings were chosen by the K-means cluster-ing method. Overall, the distribution of samples qualitatively agrees with the results of thefirst approach, although the indicated loadings suggest that C-H stretching and bending vi-brations are contributing significantly to the variance of the sample set. Still, the carbonylstretching mode has the highest absolute contribution, and is the dominant component ofthe first PC. The figure III.15 shows overlay of the two spectra on the opposite sides of bothprincipal components. The features contributing the most to the principal components are
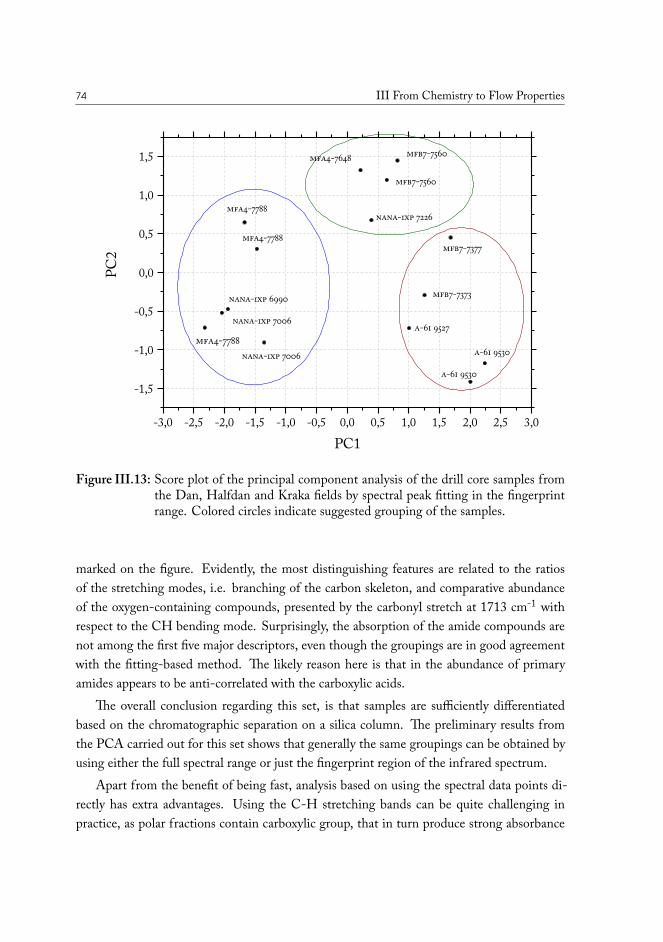
74 III From Chemistry to Flow Properties
-3,0 -2,5 -2,0 -1,5 -1,0 -0,5 0,0 0,5 1,0 1,5 2,0 2,5 3,0
-1,5
-1,0
-0,5
0,0
0,5
1,0
1,5
mfa4-7788
nana-1xp 7226
nana-1xp 7006
nana-1xp 7006
mfa4-7788
mfa4-7788
mfb7-7560
mfb7-7560
mfa4-7648
mfb7-7377
nana-1xp 6990 mfb7-7373
a-6i 9527
a-6i 9530
PC1
PC2
a-6i 9530
Figure III.13: Score plot of the principal component analysis of the drill core samples fromthe Dan, Halfdan and Kraka fields by spectral peak fitting in the fingerprintrange. Colored circles indicate suggested grouping of the samples.
marked on the figure. Evidently, the most distinguishing features are related to the ratiosof the stretching modes, i.e. branching of the carbon skeleton, and comparative abundanceof the oxygen-containing compounds, presented by the carbonyl stretch at 1713 cm-1 withrespect to the CH bending mode. Surprisingly, the absorption of the amide compounds arenot among the first five major descriptors, even though the groupings are in good agreementwith the fitting-based method. The likely reason here is that in the abundance of primaryamides appears to be anti-correlated with the carboxylic acids.
The overall conclusion regarding this set, is that samples are sufficiently differentiatedbased on the chromatographic separation on a silica column. The preliminary results fromthe PCA carried out for this set shows that generally the same groupings can be obtained byusing either the full spectral range or just the fingerprint region of the infrared spectrum.
Apart from the benefit of being fast, analysis based on using the spectral data points di-rectly has extra advantages. Using the C-H stretching bands can be quite challenging inpractice, as polar fractions contain carboxylic group, that in turn produce strong absorbance
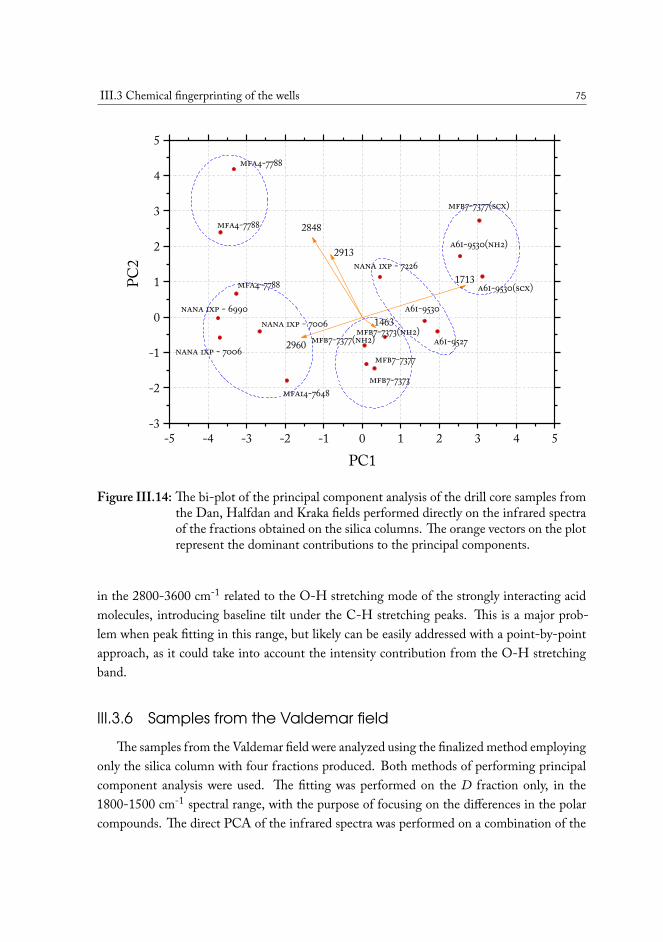
III.3 Chemical fingerprinting of the wells 75
-5 -4 -3 -2 -1 0 1 2 3 4 5-3
-2
-1
0
1
2
3
4
5
1463
2960
2913
1713
mfa4-7788
a6i-9527
a6i-9530
mfb7-7373(nh2)mfb7-7377(nh2)
mfb7-7377
mfb7-7373
a6i-9530(scx)
a6i-9530(nh2)
nana 1xp - 7226
mfb7-7377(scx)
nana 1xp - 7006
nana 1xp - 6990
mfa14-7648
nana 1xp - 7006
mfa4-7788
2848
mfa4-7788
PC1
PC2
Figure III.14: The bi-plot of the principal component analysis of the drill core samples fromthe Dan, Halfdan and Kraka fields performed directly on the infrared spectraof the fractions obtained on the silica columns. The orange vectors on the plotrepresent the dominant contributions to the principal components.
in the 2800-3600 cm-1 related to the O-H stretching mode of the strongly interacting acidmolecules, introducing baseline tilt under the C-H stretching peaks. This is a major prob-lem when peak fitting in this range, but likely can be easily addressed with a point-by-pointapproach, as it could take into account the intensity contribution from the O-H stretchingband.
III.3.6 Samples from the Valdemar fieldThe samples from the Valdemar field were analyzed using the finalized method employing
only the silica column with four fractions produced. Both methods of performing principalcomponent analysis were used. The fitting was performed on the D fraction only, in the1800-1500 cm-1 spectral range, with the purpose of focusing on the differences in the polarcompounds. The direct PCA of the infrared spectra was performed on a combination of the
76 III From Chemistry to Flow Properties
3600 3400 3200 3000 2800 1800 1600 1400 1200 1000 800 6000,0
0,2
0,4
0,6
0,8
1,0
1,2
1,4
1,6
1,8
2,0
2,22930, 2920
2960
2850
1463
A-6I 9527 ft. MFA-4 7788 ft.
Wavenumber, cm -1
ln (I 0
/ I)
1713
Figure III.15: The full-range (3800-600 cm-1) infrared spectra of the D fractions obtainedfrom the drill core samples on the opposite sides of the PCA bi-plot, calculateddirectly from the spectral data. Indicated are the peaks corresponding to thedominant contributions to the first two principal components. The axis breakexcludes the part of the spectrum where the diamond absorption is present.
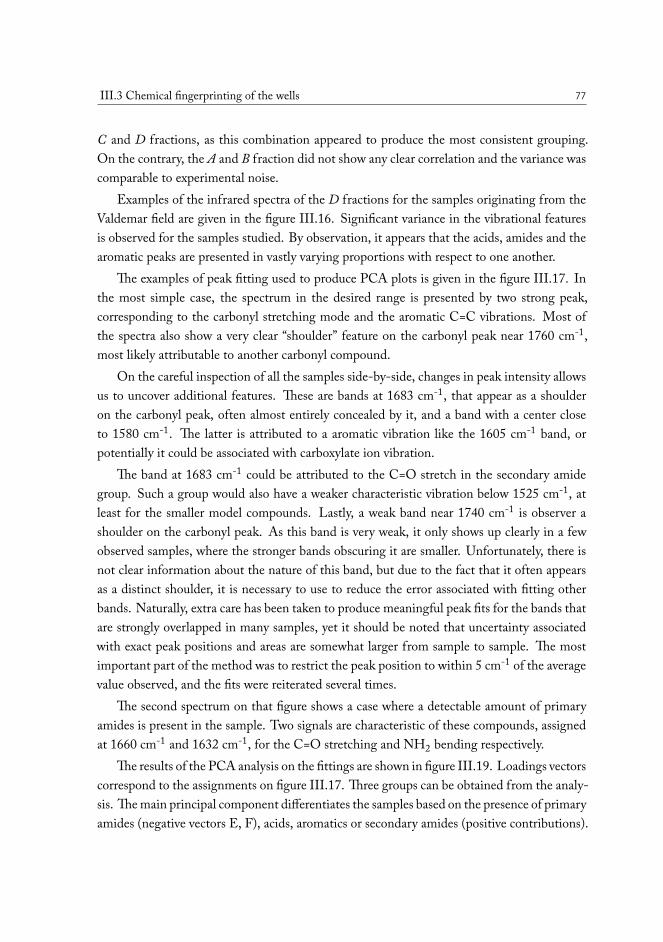
III.3 Chemical fingerprinting of the wells 77
C and D fractions, as this combination appeared to produce the most consistent grouping.On the contrary, the A and B fraction did not show any clear correlation and the variance wascomparable to experimental noise.
Examples of the infrared spectra of the D fractions for the samples originating from theValdemar field are given in the figure III.16. Significant variance in the vibrational featuresis observed for the samples studied. By observation, it appears that the acids, amides and thearomatic peaks are presented in vastly varying proportions with respect to one another.
The examples of peak fitting used to produce PCA plots is given in the figure III.17. Inthe most simple case, the spectrum in the desired range is presented by two strong peak,corresponding to the carbonyl stretching mode and the aromatic C=C vibrations. Most ofthe spectra also show a very clear “shoulder” feature on the carbonyl peak near 1760 cm-1,most likely attributable to another carbonyl compound.
On the careful inspection of all the samples side-by-side, changes in peak intensity allowsus to uncover additional features. These are bands at 1683 cm-1, that appear as a shoulderon the carbonyl peak, often almost entirely concealed by it, and a band with a center closeto 1580 cm-1. The latter is attributed to a aromatic vibration like the 1605 cm-1 band, orpotentially it could be associated with carboxylate ion vibration.
The band at 1683 cm-1 could be attributed to the C=O stretch in the secondary amidegroup. Such a group would also have a weaker characteristic vibration below 1525 cm-1, atleast for the smaller model compounds. Lastly, a weak band near 1740 cm-1 is observer ashoulder on the carbonyl peak. As this band is very weak, it only shows up clearly in a fewobserved samples, where the stronger bands obscuring it are smaller. Unfortunately, there isnot clear information about the nature of this band, but due to the fact that it often appearsas a distinct shoulder, it is necessary to use to reduce the error associated with fitting otherbands. Naturally, extra care has been taken to produce meaningful peak fits for the bands thatare strongly overlapped in many samples, yet it should be noted that uncertainty associatedwith exact peak positions and areas are somewhat larger from sample to sample. The mostimportant part of the method was to restrict the peak position to within 5 cm-1 of the averagevalue observed, and the fits were reiterated several times.
The second spectrum on that figure shows a case where a detectable amount of primaryamides is present in the sample. Two signals are characteristic of these compounds, assignedat 1660 cm-1 and 1632 cm-1, for the C=O stretching and NH2 bending respectively.
The results of the PCA analysis on the fittings are shown in figure III.19. Loadings vectorscorrespond to the assignments on figure III.17. Three groups can be obtained from the analy-sis. The main principal component differentiates the samples based on the presence of primaryamides (negative vectors E, F), acids, aromatics or secondary amides (positive contributions).
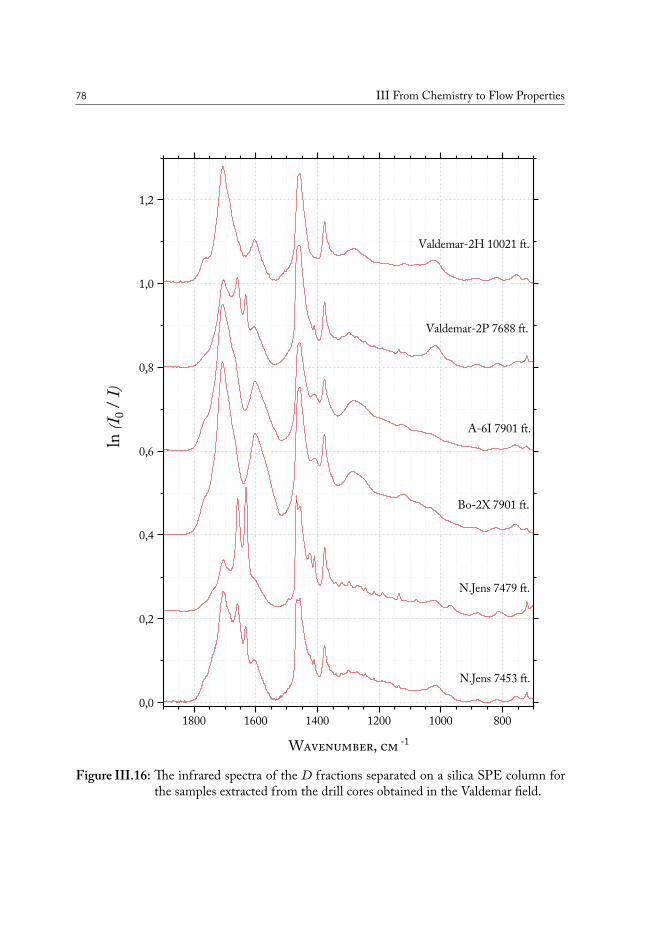
78 III From Chemistry to Flow Properties
1800 1600 1400 1200 1000 8000,0
0,2
0,4
0,6
0,8
1,0
1,2
Valdemar-2H 10021 ft.
A-6I 7901 ft.
Valdemar-2P 7688 ft.
Bo-2X 7901 ft.
N.Jens 7479 ft.
Wavenumber, cm -1
ln (I 0
/ I)
N.Jens 7453 ft.
Figure III.16: The infrared spectra of the D fractions separated on a silica SPE column forthe samples extracted from the drill cores obtained in the Valdemar field.
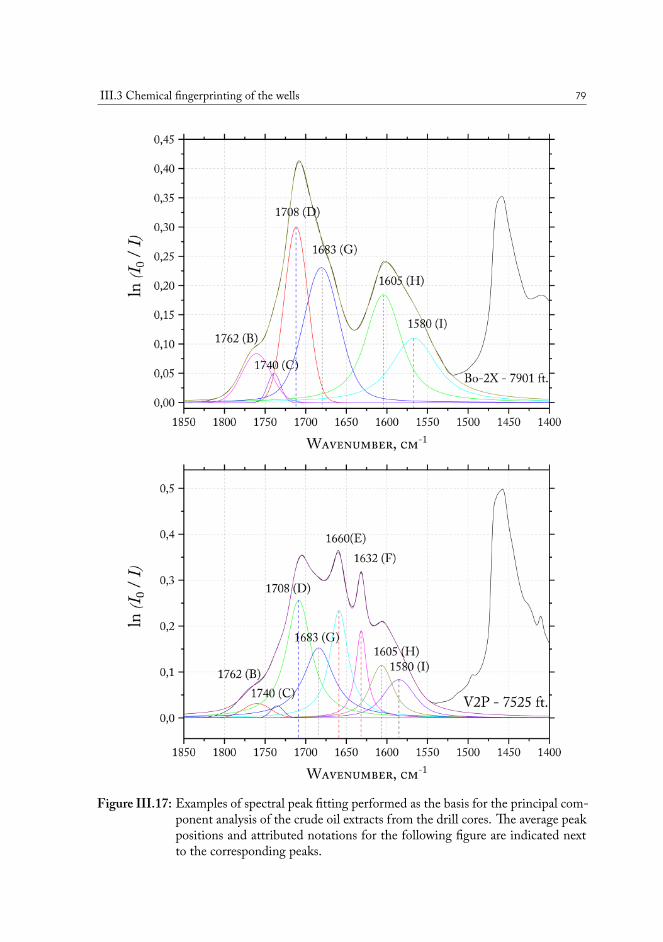
III.3 Chemical fingerprinting of the wells 79
Figure III.17: Examples of spectral peak fitting performed as the basis for the principal com-ponent analysis of the crude oil extracts from the drill cores. The average peakpositions and attributed notations for the following figure are indicated nextto the corresponding peaks.
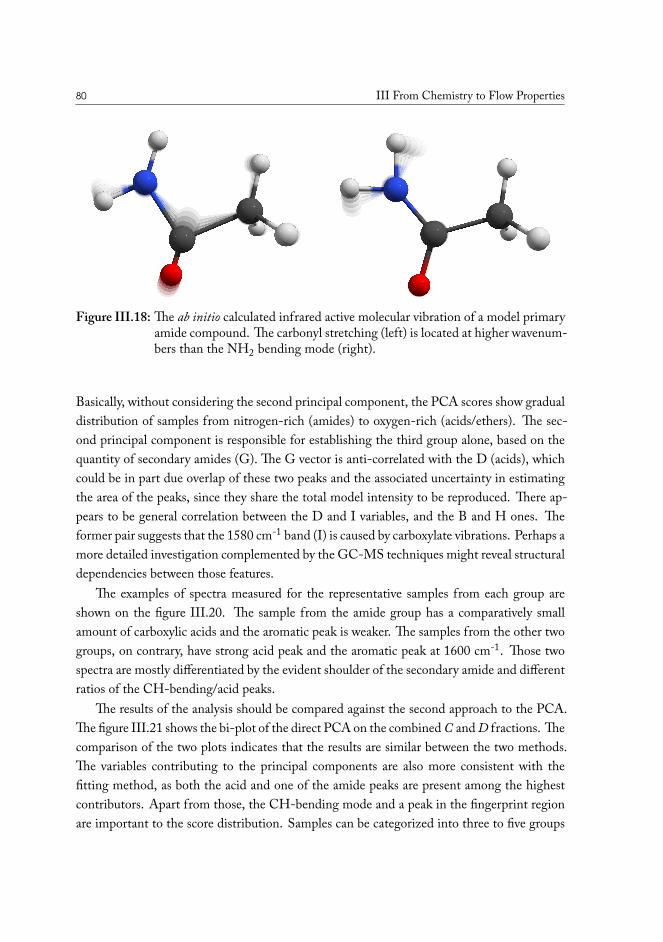
80 III From Chemistry to Flow Properties
Figure III.18: The ab initio calculated infrared active molecular vibration of a model primaryamide compound. The carbonyl stretching (left) is located at higher wavenum-bers than the NH2 bending mode (right).
Basically, without considering the second principal component, the PCA scores show gradualdistribution of samples from nitrogen-rich (amides) to oxygen-rich (acids/ethers). The sec-ond principal component is responsible for establishing the third group alone, based on thequantity of secondary amides (G). The G vector is anti-correlated with the D (acids), whichcould be in part due overlap of these two peaks and the associated uncertainty in estimatingthe area of the peaks, since they share the total model intensity to be reproduced. There ap-pears to be general correlation between the D and I variables, and the B and H ones. Theformer pair suggests that the 1580 cm-1 band (I) is caused by carboxylate vibrations. Perhaps amore detailed investigation complemented by the GC-MS techniques might reveal structuraldependencies between those features.
The examples of spectra measured for the representative samples from each group areshown on the figure III.20. The sample from the amide group has a comparatively smallamount of carboxylic acids and the aromatic peak is weaker. The samples from the other twogroups, on contrary, have strong acid peak and the aromatic peak at 1600 cm-1. Those twospectra are mostly differentiated by the evident shoulder of the secondary amide and differentratios of the CH-bending/acid peaks.
The results of the analysis should be compared against the second approach to the PCA.The figure III.21 shows the bi-plot of the direct PCA on the combinedC andD fractions. Thecomparison of the two plots indicates that the results are similar between the two methods.The variables contributing to the principal components are also more consistent with thefitting method, as both the acid and one of the amide peaks are present among the highestcontributors. Apart from those, the CH-bending mode and a peak in the fingerprint regionare important to the score distribution. Samples can be categorized into three to five groups
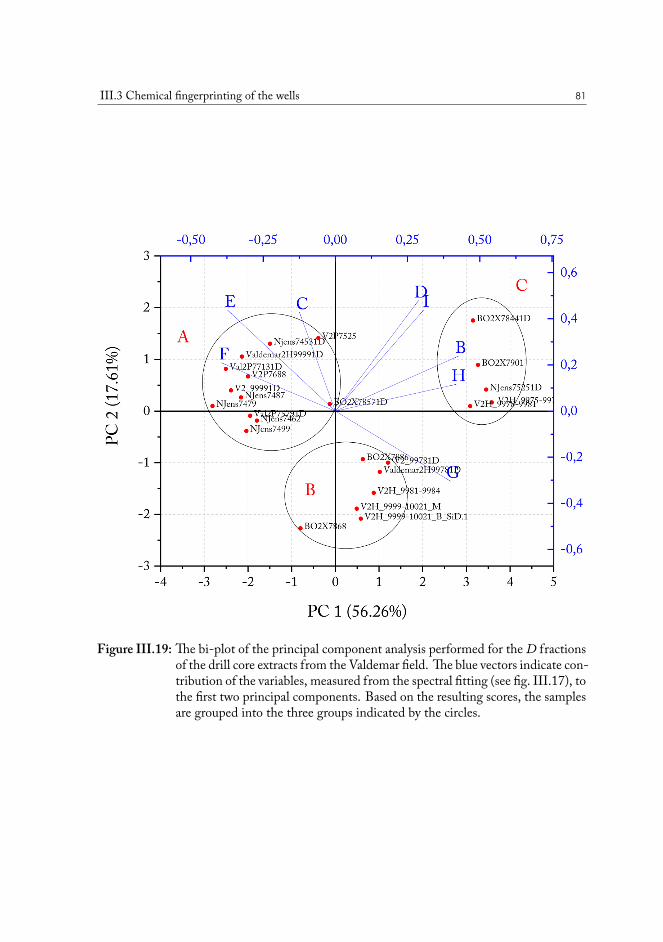
III.3 Chemical fingerprinting of the wells 81
Figure III.19: The bi-plot of the principal component analysis performed for the D fractionsof the drill core extracts from the Valdemar field. The blue vectors indicate con-tribution of the variables, measured from the spectral fitting (see fig. III.17), tothe first two principal components. Based on the resulting scores, the samplesare grouped into the three groups indicated by the circles.
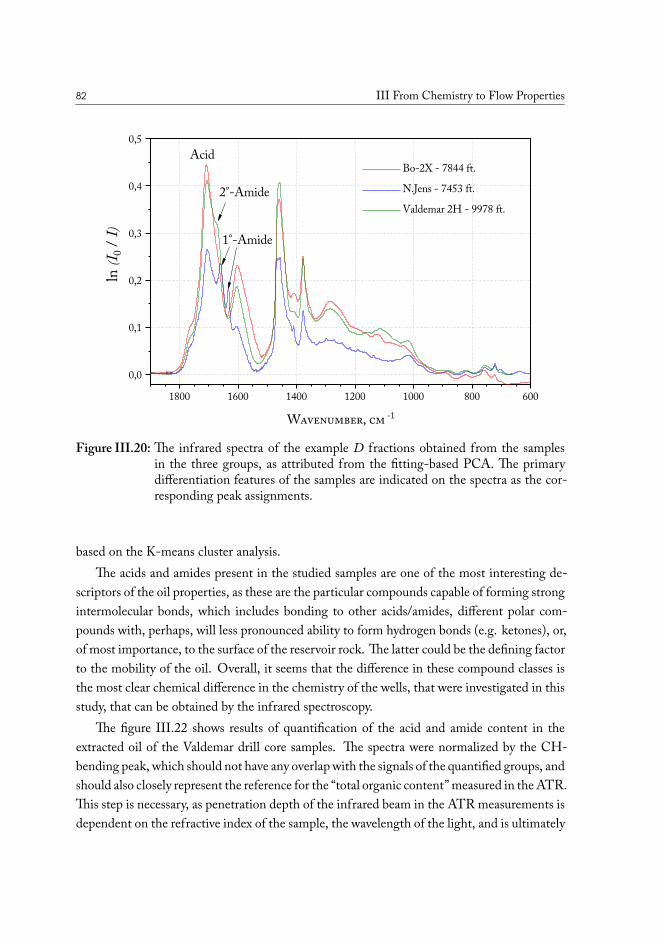
82 III From Chemistry to Flow Properties
1800 1600 1400 1200 1000 800 6000,0
0,1
0,2
0,3
0,4
0,5
1°-Amide
2°-Amide Bo-2X - 7844 ft. N.Jens - 7453 ft. Valdemar 2H - 9978 ft.
Wavenumber, cm -1
ln (I 0
/ I)
Acid
Figure III.20: The infrared spectra of the example D fractions obtained from the samplesin the three groups, as attributed from the fitting-based PCA. The primarydifferentiation features of the samples are indicated on the spectra as the cor-responding peak assignments.
based on the K-means cluster analysis.The acids and amides present in the studied samples are one of the most interesting de-
scriptors of the oil properties, as these are the particular compounds capable of forming strongintermolecular bonds, which includes bonding to other acids/amides, different polar com-pounds with, perhaps, will less pronounced ability to form hydrogen bonds (e.g. ketones), or,of most importance, to the surface of the reservoir rock. The latter could be the defining factorto the mobility of the oil. Overall, it seems that the difference in these compound classes isthe most clear chemical difference in the chemistry of the wells, that were investigated in thisstudy, that can be obtained by the infrared spectroscopy.
The figure III.22 shows results of quantification of the acid and amide content in theextracted oil of the Valdemar drill core samples. The spectra were normalized by the CH-bending peak, which should not have any overlap with the signals of the quantified groups, andshould also closely represent the reference for the “total organic content” measured in the ATR.This step is necessary, as penetration depth of the infrared beam in the ATR measurements isdependent on the refractive index of the sample, the wavelength of the light, and is ultimately
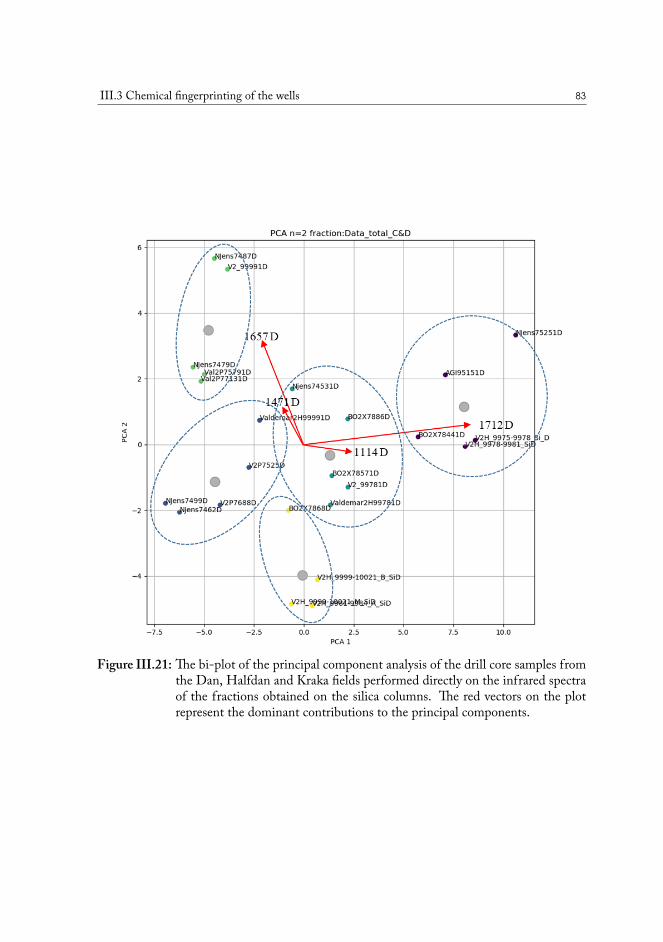
III.3 Chemical fingerprinting of the wells 83
Figure III.21: The bi-plot of the principal component analysis of the drill core samples fromthe Dan, Halfdan and Kraka fields performed directly on the infrared spectraof the fractions obtained on the silica columns. The red vectors on the plotrepresent the dominant contributions to the principal components.
84 III From Chemistry to Flow Properties
limited by the thickness of the layer on the diamond crystal of the ATR module. For thesereasons, a reference peak located as close as possible to the quantified bands is necessary forquantitative applications in our scenario.
The observation from these results is that the acids are present consistently in all of thesamples and in dramatically higher concentrations than found in any of the produced fluidsfractions. The concentration of amides varies a lot more across the sample set. The quantityof amides in the Bo-2X wells is comparable to the uncertainty of fitting. It can be noticed,that for most wells, the quantity of acids is inversely proportional to the quantity of amides.As such, all of the N.Jens wells are amide-rich and do not show as much acid content as Bowells.
III.4 Concluding remarks
The infrared spectroscopy has proven to be a powerful tool to experimentally measure thechemical differences between crude oil samples. The samples sourced from the different geo-graphical locations within each oil field show substantial chemical differences in the quantitiesof polar oxygen- and nitrogen-containing compounds, namely carboxylic acids, primary andsecondary amides. The data can be obtained with the ATR method with less sample prepa-ration and average analysis time than is usually the case with high-resolution GC techniquesapplied to heavy heteroatom compounds200, and as such constitutes an excellent complemen-tary technique to the latter.
Samples show distinct intercorrelations, and can be grouped with the PCA based on theobserved chemical composition in polar compounds, oil maturity, alkyl chain branching, de-gree of aromatic condensation, all accessible in an express manner from the IR spectrum. Thegroups can then be used to explain specifics of phase and flow behavior, and allow to planbetter approaches to increase the oil recovery factor.
The principal component analysis is one of the more classic methods of statistical inter-pretation of data, and for the coming project we plan to explore the modern and advancedtechniques to maximize the amount of information that can be extracted from the IR experi-ment.
The IR spectroscopic method is not the most in-depth method, when it comes to extract-ing information regarding saturates and polyaromatic hydrocarbons. While there are severaldescriptive parameters that may be obtained in a fairly express way, the best result can beachieved if the technique is supplemented by the GC-MS techniques that are dedicated tothis exact purpose201.
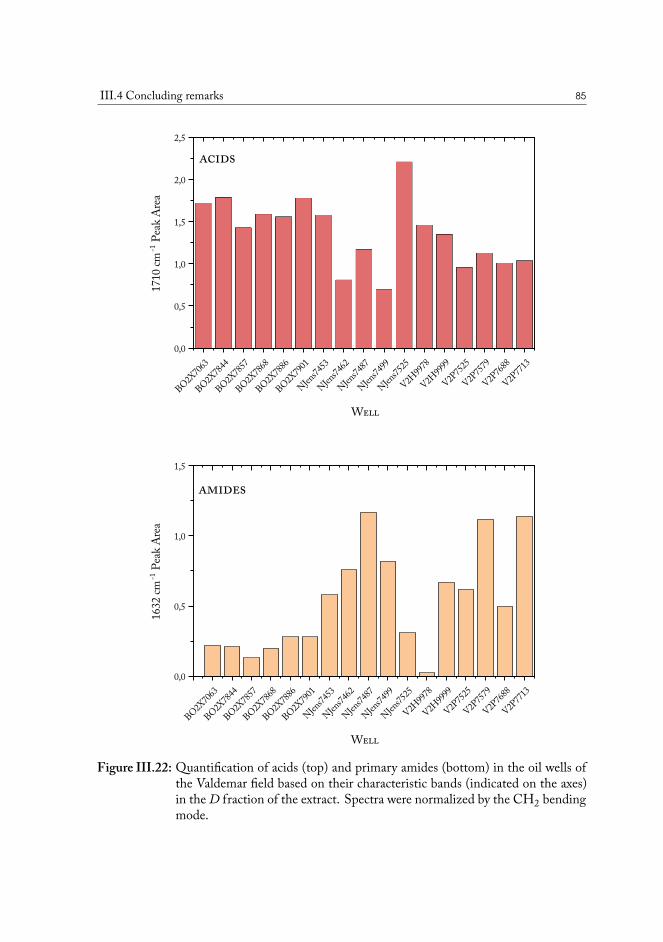
III.4 Concluding remarks 85
BO2X7063
BO2X7844
BO2X7857
BO2X7868
BO2X7886
BO2X7901
NJens74
53
NJens74
62
NJens74
87
NJens74
99
NJens75
25
V2H997
8
V2H999
9
V2P7525
V2P7579
V2P7688
V2P7713
0,0
0,5
1,0
1,5
2,0
2,5
acids17
10 cm
-1 Pe
ak A
rea
Well
BO2X7063
BO2X7844
BO2X7857
BO2X7868
BO2X7886
BO2X7901
NJens74
53
NJens74
62
NJens74
87
NJens74
99
NJens75
25
V2H997
8
V2H999
9
V2P7525
V2P7579
V2P7688
V2P7713
0,0
0,5
1,0
1,5
1632
cm-1
Peak
Area
Well
amides
Figure III.22: Quantification of acids (top) and primary amides (bottom) in the oil wells ofthe Valdemar field based on their characteristic bands (indicated on the axes)in the D fraction of the extract. Spectra were normalized by the CH2 bendingmode.
86 III From Chemistry to Flow Properties
The average composition of the drill core extracts is heavier and more rich in asphaltenesand resins than was observed in the true boiling point distillates. Even the heaviest non-distillable fraction of the produced oil sample contains small amount of acids compared to theproportion of the latter in the drill core exracts. The mass of theD fraction of the extract rangesfrom 15-45% across the samples from the Valdemar field. Carbonyl-containing compoundsare observed in lesser amounts in the C and B fractions as well. This suggests that the vastmajority of the acidic compounds and amides is retained on the rock surface after the oil hasbeen produced, and leaving this fraction behind has detrimental impact for the recovery factor,as well as potentially has the determining impact on the flow of the fluid during production.
The carboxylic acids, amides, etc., observed in large quantities on the chalk surface, arecapable of forming strong hydrogen bonds. This causes association of molecules betweenthemselves via the functional groups, to other hydrocarbons through non-specific van derWaals interactions, and through hydrogen bonding to the charged calcite surface, ultimatelyimmobilizing the oil on the rock. These three types of interactions deserve in-depth analysisto be properly accounted for in the advanced thermodynamic models that aim to go beyondthe PVT basis.
The chapter IV is focused on obtaining the necessary thermodynamic data by directly ob-serving isolated hydrogen-bonded molecular complexes, with the goal of developing a scalablemodel that can be used to accurately predict hydrogen-bonding potential of a given moleculefrom its structure. The modern theoretical methods are limited in that regard, as the errors ofestimating the vibrational contributions exceed 20% due to the vibrational anharmonicity, butcan potentially be corrected by combining supplementing high-level theoretical calculationswith the direct spectroscopic observables of associated with the intermolecular interaction.
The chapter V deals with finding similar corrections for the thermodynamics of van derWaals interactions and weak interactions with sulfur-containing compounds. Van der Waalsinteractions, albeit weak when considering a single contact, are present universally in thecondensed phases, and add up to become the determining factor in many processes, e.g. su-percritical CO2 flooding, non-polar solvation of asphaltenes etc.
The interactions with the surface are unsuitable to study by conventional infrared spec-troscopy. Recent studies in the literature apply a variety of techniques, such as constantlyadvancing classical and quantum molecular dynamics simulations202. From the experimentalperspective, the recently developed nano-IR approach, combining infrared spectroscopic ca-pabilities with the resolution of the atomic force microscope has a lot of promise to addressthis topic203.
CHAPTER IVMolecular Association
Mechanisms Involving StrongHydrogen Bonds
As mentioned in the introduction, there are several spectroscopic features that could beused to characterize intermolecular interactions. Firstly, there is a general observation that thespectral shifts in the fundamental vibrational modes of the interacting molecules are relatedin magnitude to the strength of the interaction. In a large molecule, most of these are toosmall and overlapping to be used as a sensitive probe of the interaction, with few exceptions,most notable of which are the intramolecular stretching modes of bonds like O-H···O.
These modes have been used extensively throughout the history as means to estimatethe relative stability of hydrogen bonded complexes204. Due to the coupling between thesymmetric and asymmetric stretching modes of the hydrogen bond donor (HBD) in a watermolecule, calculating the spectral shift of the intramolecular stretching mode is challenging205.Secondary interactions of the acceptor molecule with the oxygen atom might also affect thespectral shift. The issue is well demonstrated on the basis of previous studies of the sulfurcomplexes, where comparison of O-H···O and O-H···S related spectral shifts, at the timewithout support of modern high-level calculations, led to erroneous conclusions that sulfur isa better proton acceptor than oxygen, and for that reason molecular complexes of sulfides withwater would exhibit larger dissociation energies on the basis increased electrostatic interaction,when compared to their oxygen counterparts (e.g. alcohols, ethers). The conclusion wasdrawn from the fact that O-H stretching mode of water in sulfur complexes were foundbelow that of water dimer in matrix isolation studies206,207. Extensive computational workshave demonstrated that it is not the case208.
The intermolecular vibrational modes of a complex, originating from the rotational andtranslational degrees of freedom, generally comprise a large portion of the total ∆ZPE. Thehydrogen bond is highly directional, so the strength of that bond could have a very stronglink to the angular rigidity of the donor, acceptor and the radial rigidity of the binding pair,represented by the respective intermolecular hindered rotations, or librational modes. Thework of Saykally’s group demonstrated with the use terahertz VRT spectroscopy, that exci-tations to the out-of-plane librational mode causes dramatic decrease of the lifetime of the
88 IV Molecular Association Mechanisms Involving Strong Hydrogen Bonds
water trimer, concluding that this angular motion is critical to formation of non-covalent in-teractions209–211, in agreement with the molecular dynamics (MD) study of Luzar and Chan-dler212. Yu and Klemperer have compared the experimental dissociation energies of a range ofHF molecular complexes against their respective donor out-of-plane bending frequencies71.They have observed that there is a decent linear correlation between vibrational frequency ofthe mode and the square root of the zero-point dissociation energy (D0) of the complex. Thechoice of systems in that study was primarily governed by the fact that HF complexes gener-ally have the librational band positions available in the literature for a wide range of complexes,as it has a higher donor capability, compared to water. As a consequence, also many of thesystems have accurate dissociation energies found experimentally. The end sample set com-prises a structurally and energetically diverse selection of complexes, with interaction energiesranging from 400 to 2867 cm-1.
Nevertheless, the sample set consists of small systems, mostly of linear structure. Suchcomplexes are ideal, in terms of the vibrational mode utilized as a probe being highly isolated,minimal secondary interactions, and, for the most part, negligible expected contribution fromthe London dispersion forces. But, when considering different donor and acceptor moieties,one cannot say from a single set of complexes, how would other systems with different chem-ical structure compare, and what is the precision to which the dissociation energy could bepredicted from the librational band position. In practical applications, non-covalent inter-actions are usually found involving large and complex systems of non-linear and often non-rigid structure, having freely rotating methyl groups, multiple structural conformations, etc.In such systems, one could readily expect secondary interactions competing with the mainhydrogen bond, as well as much higher overall contributions from dispersion forces.
The N-, S- and O-containing compounds are at the core of pharmaceutical and petroleumindustries, as well as multiple directions of the green chemistry developments. It would thenbe useful to investigate the possibility of utilizing experimental observations of the librationalmode to accurately measure the interaction strengths involving these atoms and relevant func-tional groups. We chose to approach this by investigating systematically a series of complexesinvolving O-containing homologous compounds, with the aim to determine how differencesin the molecular structure of the individual substituents would affect the hydrogen bond ac-ceptor (HBA) properties of the molecule. Systematic trends could then be extrapolated toobtain values for a compound of interest. As the next step, investigating groups of analogueswith different acceptor atoms would shed the light on the specific change in behavior thisbrings.
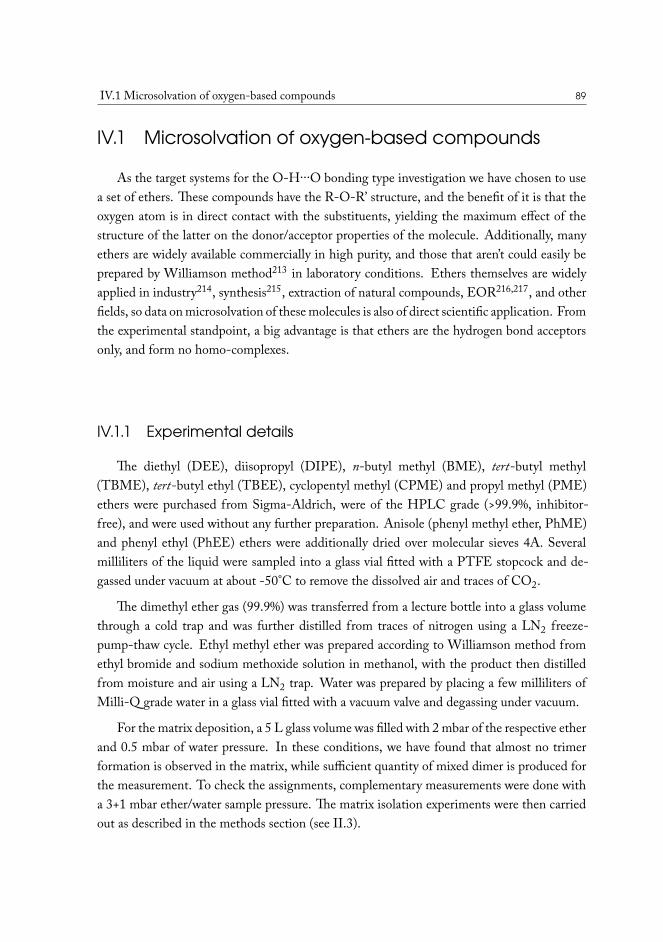
IV.1 Microsolvation of oxygen-based compounds 89
IV.1 Microsolvation of oxygen-based compounds
As the target systems for the O-H···O bonding type investigation we have chosen to usea set of ethers. These compounds have the R-O-R’ structure, and the benefit of it is that theoxygen atom is in direct contact with the substituents, yielding the maximum effect of thestructure of the latter on the donor/acceptor properties of the molecule. Additionally, manyethers are widely available commercially in high purity, and those that aren’t could easily beprepared by Williamson method213 in laboratory conditions. Ethers themselves are widelyapplied in industry214, synthesis215, extraction of natural compounds, EOR216,217, and otherfields, so data on microsolvation of these molecules is also of direct scientific application. Fromthe experimental standpoint, a big advantage is that ethers are the hydrogen bond acceptorsonly, and form no homo-complexes.
IV.1.1 Experimental details
The diethyl (DEE), diisopropyl (DIPE), n-butyl methyl (BME), tert-butyl methyl(TBME), tert-butyl ethyl (TBEE), cyclopentyl methyl (CPME) and propyl methyl (PME)ethers were purchased from Sigma-Aldrich, were of the HPLC grade (>99.9%, inhibitor-free), and were used without any further preparation. Anisole (phenyl methyl ether, PhME)and phenyl ethyl (PhEE) ethers were additionally dried over molecular sieves 4A. Severalmilliliters of the liquid were sampled into a glass vial fitted with a PTFE stopcock and de-gassed under vacuum at about -50°C to remove the dissolved air and traces of CO2.
The dimethyl ether gas (99.9%) was transferred from a lecture bottle into a glass volumethrough a cold trap and was further distilled from traces of nitrogen using a LN2 freeze-pump-thaw cycle. Ethyl methyl ether was prepared according to Williamson method fromethyl bromide and sodium methoxide solution in methanol, with the product then distilledfrom moisture and air using a LN2 trap. Water was prepared by placing a few milliliters ofMilli-Q grade water in a glass vial fitted with a vacuum valve and degassing under vacuum.
For the matrix deposition, a 5 L glass volume was filled with 2 mbar of the respective etherand 0.5 mbar of water pressure. In these conditions, we have found that almost no trimerformation is observed in the matrix, while sufficient quantity of mixed dimer is produced forthe measurement. To check the assignments, complementary measurements were done witha 3+1 mbar ether/water sample pressure. The matrix isolation experiments were then carriedout as described in the methods section (see II.3).
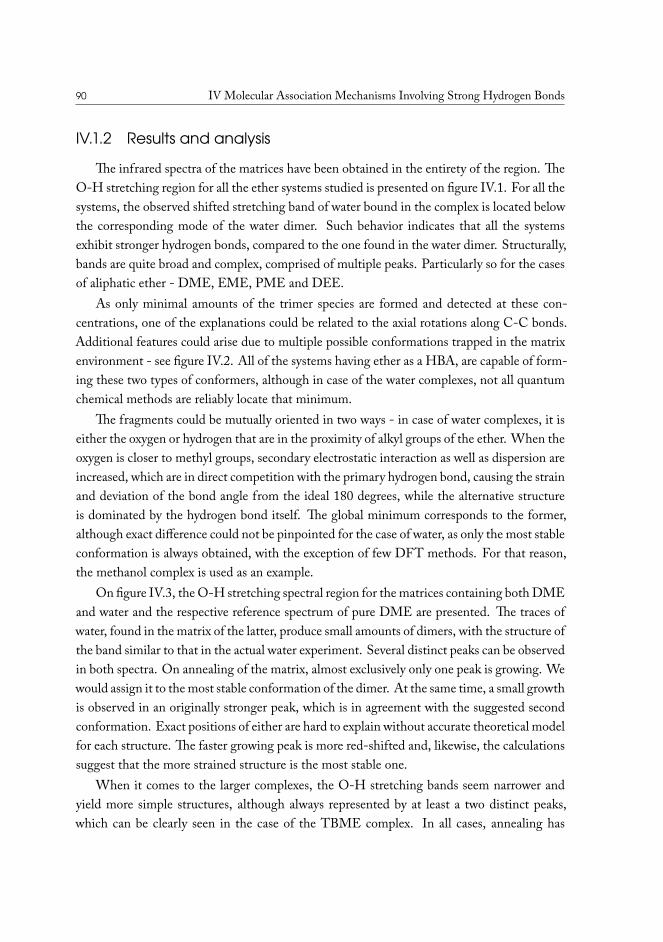
90 IV Molecular Association Mechanisms Involving Strong Hydrogen Bonds
IV.1.2 Results and analysis
The infrared spectra of the matrices have been obtained in the entirety of the region. TheO-H stretching region for all the ether systems studied is presented on figure IV.1. For all thesystems, the observed shifted stretching band of water bound in the complex is located belowthe corresponding mode of the water dimer. Such behavior indicates that all the systemsexhibit stronger hydrogen bonds, compared to the one found in the water dimer. Structurally,bands are quite broad and complex, comprised of multiple peaks. Particularly so for the casesof aliphatic ether - DME, EME, PME and DEE.
As only minimal amounts of the trimer species are formed and detected at these con-centrations, one of the explanations could be related to the axial rotations along C-C bonds.Additional features could arise due to multiple possible conformations trapped in the matrixenvironment - see figure IV.2. All of the systems having ether as a HBA, are capable of form-ing these two types of conformers, although in case of the water complexes, not all quantumchemical methods are reliably locate that minimum.
The fragments could be mutually oriented in two ways - in case of water complexes, it iseither the oxygen or hydrogen that are in the proximity of alkyl groups of the ether. When theoxygen is closer to methyl groups, secondary electrostatic interaction as well as dispersion areincreased, which are in direct competition with the primary hydrogen bond, causing the strainand deviation of the bond angle from the ideal 180 degrees, while the alternative structureis dominated by the hydrogen bond itself. The global minimum corresponds to the former,although exact difference could not be pinpointed for the case of water, as only the most stableconformation is always obtained, with the exception of few DFT methods. For that reason,the methanol complex is used as an example.
On figure IV.3, the O-H stretching spectral region for the matrices containing both DMEand water and the respective reference spectrum of pure DME are presented. The traces ofwater, found in the matrix of the latter, produce small amounts of dimers, with the structure ofthe band similar to that in the actual water experiment. Several distinct peaks can be observedin both spectra. On annealing of the matrix, almost exclusively only one peak is growing. Wewould assign it to the most stable conformation of the dimer. At the same time, a small growthis observed in an originally stronger peak, which is in agreement with the suggested secondconformation. Exact positions of either are hard to explain without accurate theoretical modelfor each structure. The faster growing peak is more red-shifted and, likewise, the calculationssuggest that the more strained structure is the most stable one.
When it comes to the larger complexes, the O-H stretching bands seem narrower andyield more simple structures, although always represented by at least a two distinct peaks,which can be clearly seen in the case of the TBME complex. In all cases, annealing has
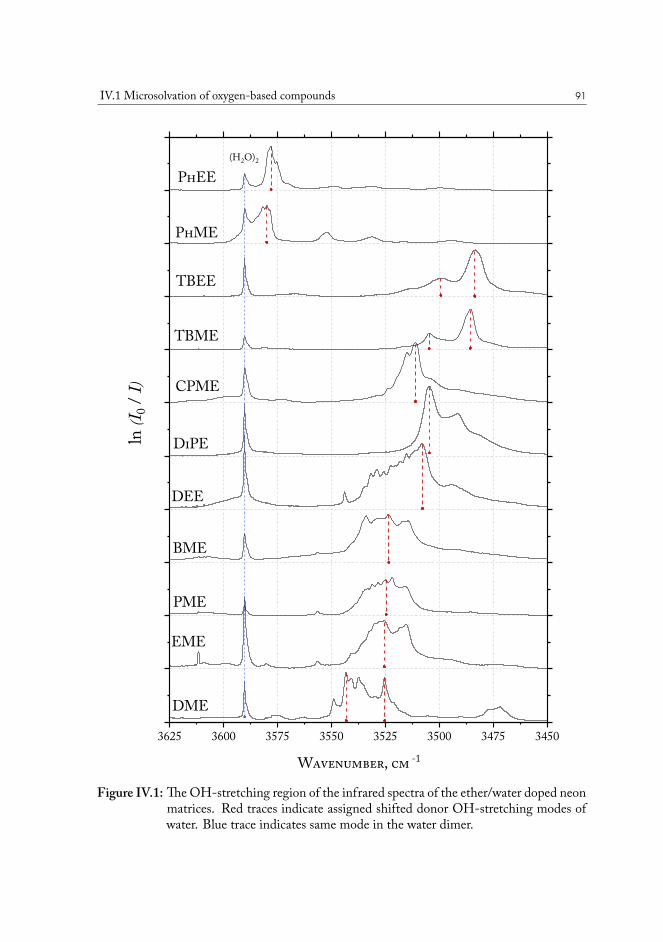
IV.1 Microsolvation of oxygen-based compounds 91
3625 3600 3575 3550 3525 3500 3475 3450
(H2O)2PhEE
PhME
TBEE
TBME
CPME
DiPE
DEE
BME
PME
EME
Wavenumber, cm -1
ln (I 0
/ I)
DME
Figure IV.1: The OH-stretching region of the infrared spectra of the ether/water doped neonmatrices. Red traces indicate assigned shifted donor OH-stretching modes ofwater. Blue trace indicates same mode in the water dimer.
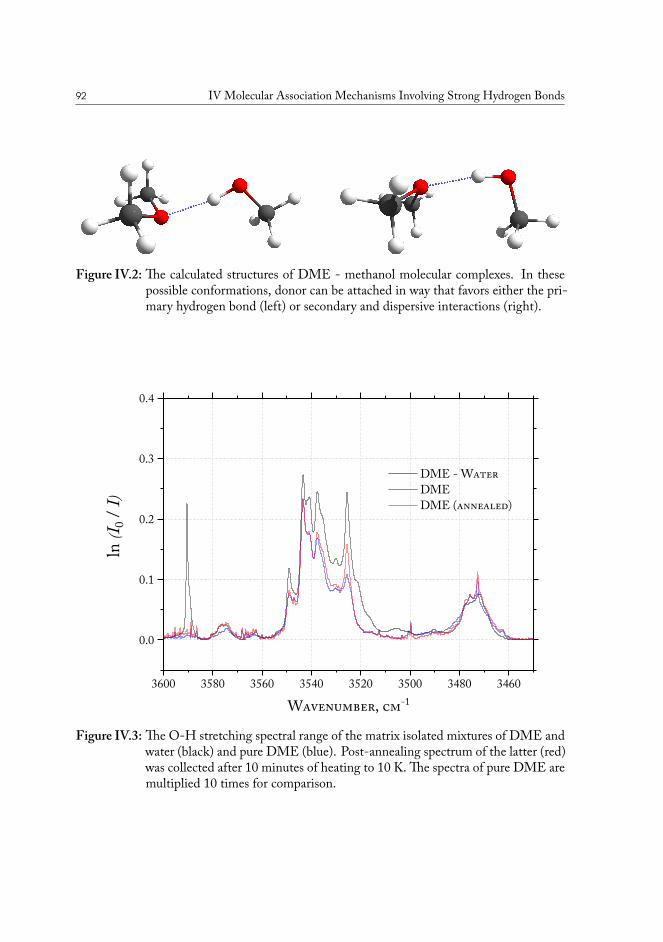
92 IV Molecular Association Mechanisms Involving Strong Hydrogen Bonds
Figure IV.2: The calculated structures of DME - methanol molecular complexes. In thesepossible conformations, donor can be attached in way that favors either the pri-mary hydrogen bond (left) or secondary and dispersive interactions (right).
3600 3580 3560 3540 3520 3500 3480 3460
0.0
0.1
0.2
0.3
0.4
DME - Water DME DME (annealed)
Wavenumber, cm-1
ln (I 0
/ I)
Figure IV.3: The O-H stretching spectral range of the matrix isolated mixtures of DME andwater (black) and pure DME (blue). Post-annealing spectrum of the latter (red)was collected after 10 minutes of heating to 10 K. The spectra of pure DME aremultiplied 10 times for comparison.
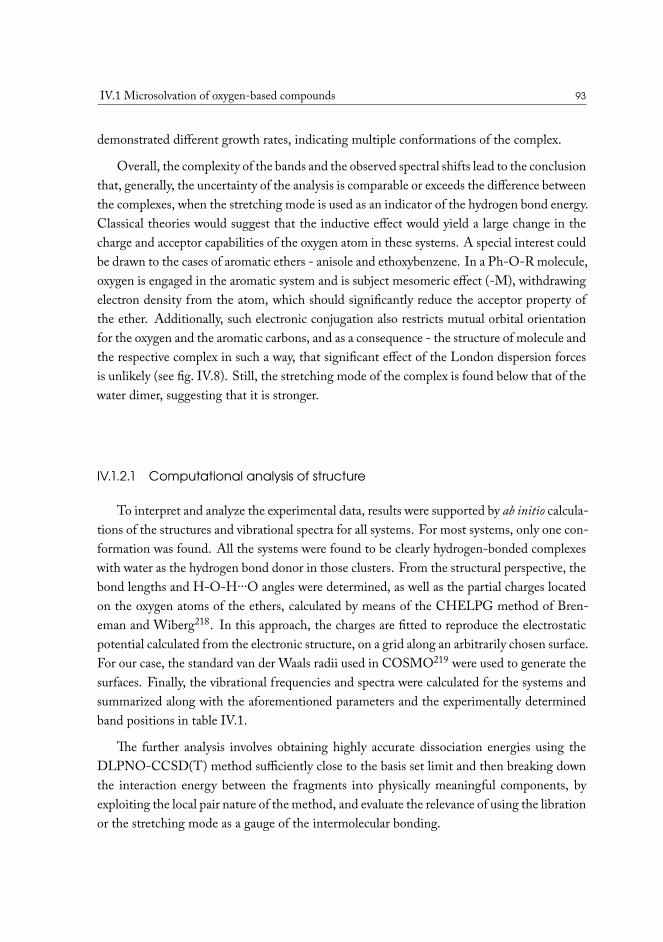
IV.1 Microsolvation of oxygen-based compounds 93
demonstrated different growth rates, indicating multiple conformations of the complex.
Overall, the complexity of the bands and the observed spectral shifts lead to the conclusionthat, generally, the uncertainty of the analysis is comparable or exceeds the difference betweenthe complexes, when the stretching mode is used as an indicator of the hydrogen bond energy.Classical theories would suggest that the inductive effect would yield a large change in thecharge and acceptor capabilities of the oxygen atom in these systems. A special interest couldbe drawn to the cases of aromatic ethers - anisole and ethoxybenzene. In a Ph-O-R molecule,oxygen is engaged in the aromatic system and is subject mesomeric effect (-M), withdrawingelectron density from the atom, which should significantly reduce the acceptor property ofthe ether. Additionally, such electronic conjugation also restricts mutual orbital orientationfor the oxygen and the aromatic carbons, and as a consequence - the structure of molecule andthe respective complex in such a way, that significant effect of the London dispersion forcesis unlikely (see fig. IV.8). Still, the stretching mode of the complex is found below that of thewater dimer, suggesting that it is stronger.
IV.1.2.1 Computational analysis of structure
To interpret and analyze the experimental data, results were supported by ab initio calcula-tions of the structures and vibrational spectra for all systems. For most systems, only one con-formation was found. All the systems were found to be clearly hydrogen-bonded complexeswith water as the hydrogen bond donor in those clusters. From the structural perspective, thebond lengths and H-O-H∙∙∙O angles were determined, as well as the partial charges locatedon the oxygen atoms of the ethers, calculated by means of the CHELPG method of Bren-eman and Wiberg218. In this approach, the charges are fitted to reproduce the electrostaticpotential calculated from the electronic structure, on a grid along an arbitrarily chosen surface.For our case, the standard van der Waals radii used in COSMO219 were used to generate thesurfaces. Finally, the vibrational frequencies and spectra were calculated for the systems andsummarized along with the aforementioned parameters and the experimentally determinedband positions in table IV.1.
The further analysis involves obtaining highly accurate dissociation energies using theDLPNO-CCSD(T) method sufficiently close to the basis set limit and then breaking downthe interaction energy between the fragments into physically meaningful components, byexploiting the local pair nature of the method, and evaluate the relevance of using the librationor the stretching mode as a gauge of the intermolecular bonding.
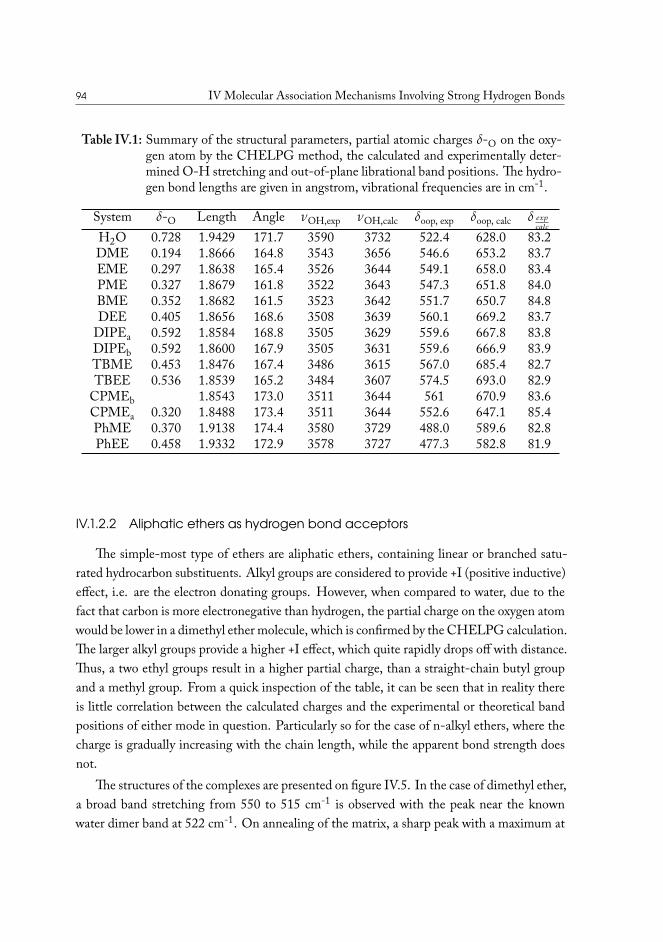
94 IV Molecular Association Mechanisms Involving Strong Hydrogen Bonds
Table IV.1: Summary of the structural parameters, partial atomic charges 𝛿-O on the oxy-gen atom by the CHELPG method, the calculated and experimentally deter-mined O-H stretching and out-of-plane librational band positions. The hydro-gen bond lengths are given in angstrom, vibrational frequencies are in cm-1.
System 𝛿-O Length Angle 𝜈OH,exp 𝜈OH,calc 𝛿oop, exp 𝛿oop, calc 𝛿 𝑒𝑥𝑝𝑐𝑎𝑙𝑐
H2O 0.728 1.9429 171.7 3590 3732 522.4 628.0 83.2DME 0.194 1.8666 164.8 3543 3656 546.6 653.2 83.7EME 0.297 1.8638 165.4 3526 3644 549.1 658.0 83.4PME 0.327 1.8679 161.8 3522 3643 547.3 651.8 84.0BME 0.352 1.8682 161.5 3523 3642 551.7 650.7 84.8DEE 0.405 1.8656 168.6 3508 3639 560.1 669.2 83.7
DIPEa 0.592 1.8584 168.8 3505 3629 559.6 667.8 83.8DIPEb 0.592 1.8600 167.9 3505 3631 559.6 666.9 83.9TBME 0.453 1.8476 167.4 3486 3615 567.0 685.4 82.7TBEE 0.536 1.8539 165.2 3484 3607 574.5 693.0 82.9
CPMEb 1.8543 173.0 3511 3644 561 670.9 83.6CPMEa 0.320 1.8488 173.4 3511 3644 552.6 647.1 85.4PhME 0.370 1.9138 174.4 3580 3729 488.0 589.6 82.8PhEE 0.458 1.9332 172.9 3578 3727 477.3 582.8 81.9
IV.1.2.2 Aliphatic ethers as hydrogen bond acceptors
The simple-most type of ethers are aliphatic ethers, containing linear or branched satu-rated hydrocarbon substituents. Alkyl groups are considered to provide +I (positive inductive)effect, i.e. are the electron donating groups. However, when compared to water, due to thefact that carbon is more electronegative than hydrogen, the partial charge on the oxygen atomwould be lower in a dimethyl ether molecule, which is confirmed by the CHELPG calculation.The larger alkyl groups provide a higher +I effect, which quite rapidly drops off with distance.Thus, a two ethyl groups result in a higher partial charge, than a straight-chain butyl groupand a methyl group. From a quick inspection of the table, it can be seen that in reality thereis little correlation between the calculated charges and the experimental or theoretical bandpositions of either mode in question. Particularly so for the case of n-alkyl ethers, where thecharge is gradually increasing with the chain length, while the apparent bond strength doesnot.
The structures of the complexes are presented on figure IV.5. In the case of dimethyl ether,a broad band stretching from 550 to 515 cm-1 is observed with the peak near the knownwater dimer band at 522 cm-1. On annealing of the matrix, a sharp peak with a maximum at
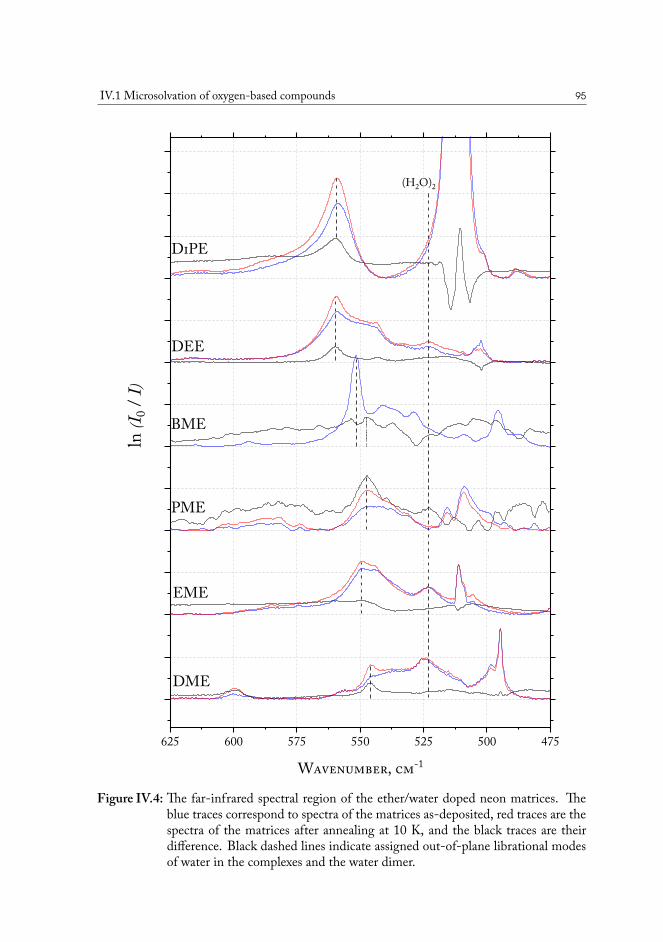
IV.1 Microsolvation of oxygen-based compounds 95
625 600 575 550 525 500 475
(H2O)2
DiPE
DEE
BME
PME
EME
Wavenumber, cm-1
ln (I 0
/ I)
DME
Figure IV.4: The far-infrared spectral region of the ether/water doped neon matrices. Theblue traces correspond to spectra of the matrices as-deposited, red traces are thespectra of the matrices after annealing at 10 K, and the black traces are theirdifference. Black dashed lines indicate assigned out-of-plane librational modesof water in the complexes and the water dimer.
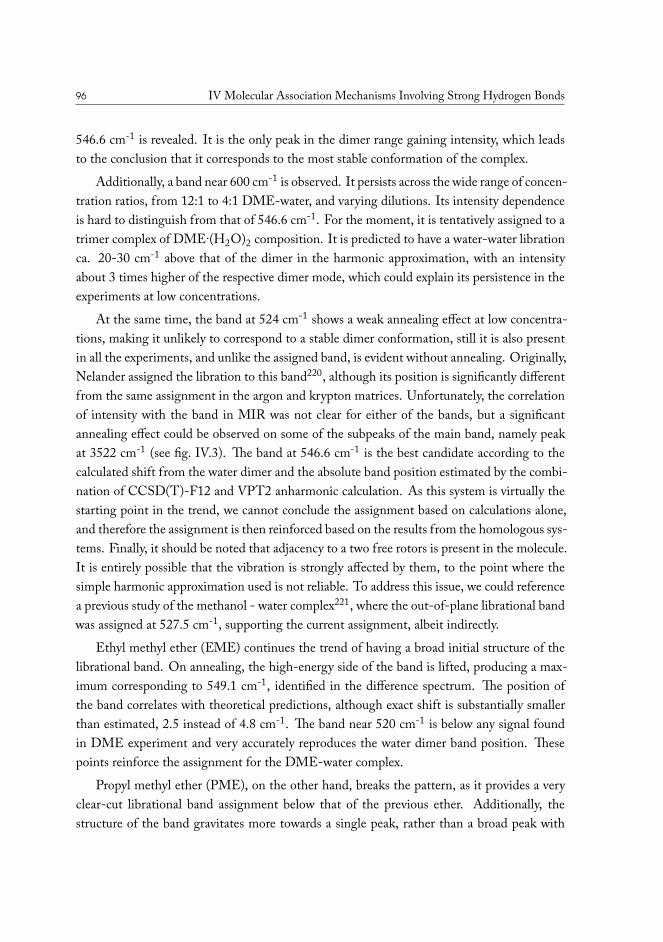
96 IV Molecular Association Mechanisms Involving Strong Hydrogen Bonds
546.6 cm-1 is revealed. It is the only peak in the dimer range gaining intensity, which leadsto the conclusion that it corresponds to the most stable conformation of the complex.
Additionally, a band near 600 cm-1 is observed. It persists across the wide range of concen-tration ratios, from 12:1 to 4:1 DME-water, and varying dilutions. Its intensity dependenceis hard to distinguish from that of 546.6 cm-1. For the moment, it is tentatively assigned to atrimer complex of DME∙(H2O)2 composition. It is predicted to have a water-water librationca. 20-30 cm-1 above that of the dimer in the harmonic approximation, with an intensityabout 3 times higher of the respective dimer mode, which could explain its persistence in theexperiments at low concentrations.
At the same time, the band at 524 cm-1 shows a weak annealing effect at low concentra-tions, making it unlikely to correspond to a stable dimer conformation, still it is also presentin all the experiments, and unlike the assigned band, is evident without annealing. Originally,Nelander assigned the libration to this band220, although its position is significantly differentfrom the same assignment in the argon and krypton matrices. Unfortunately, the correlationof intensity with the band in MIR was not clear for either of the bands, but a significantannealing effect could be observed on some of the subpeaks of the main band, namely peakat 3522 cm-1 (see fig. IV.3). The band at 546.6 cm-1 is the best candidate according to thecalculated shift from the water dimer and the absolute band position estimated by the combi-nation of CCSD(T)-F12 and VPT2 anharmonic calculation. As this system is virtually thestarting point in the trend, we cannot conclude the assignment based on calculations alone,and therefore the assignment is then reinforced based on the results from the homologous sys-tems. Finally, it should be noted that adjacency to a two free rotors is present in the molecule.It is entirely possible that the vibration is strongly affected by them, to the point where thesimple harmonic approximation used is not reliable. To address this issue, we could referencea previous study of the methanol - water complex221, where the out-of-plane librational bandwas assigned at 527.5 cm-1, supporting the current assignment, albeit indirectly.
Ethyl methyl ether (EME) continues the trend of having a broad initial structure of thelibrational band. On annealing, the high-energy side of the band is lifted, producing a max-imum corresponding to 549.1 cm-1, identified in the difference spectrum. The position ofthe band correlates with theoretical predictions, although exact shift is substantially smallerthan estimated, 2.5 instead of 4.8 cm-1. The band near 520 cm-1 is below any signal foundin DME experiment and very accurately reproduces the water dimer band position. Thesepoints reinforce the assignment for the DME-water complex.
Propyl methyl ether (PME), on the other hand, breaks the pattern, as it provides a veryclear-cut librational band assignment below that of the previous ether. Additionally, thestructure of the band gravitates more towards a single peak, rather than a broad peak with
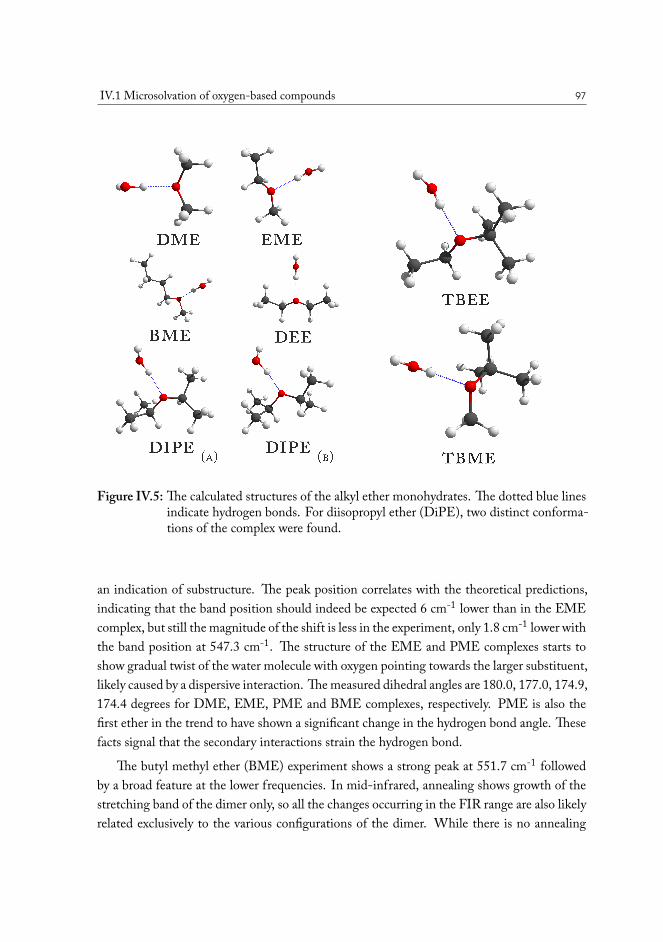
IV.1 Microsolvation of oxygen-based compounds 97
Figure IV.5: The calculated structures of the alkyl ether monohydrates. The dotted blue linesindicate hydrogen bonds. For diisopropyl ether (DiPE), two distinct conforma-tions of the complex were found.
an indication of substructure. The peak position correlates with the theoretical predictions,indicating that the band position should indeed be expected 6 cm-1 lower than in the EMEcomplex, but still the magnitude of the shift is less in the experiment, only 1.8 cm-1 lower withthe band position at 547.3 cm-1. The structure of the EME and PME complexes starts toshow gradual twist of the water molecule with oxygen pointing towards the larger substituent,likely caused by a dispersive interaction. The measured dihedral angles are 180.0, 177.0, 174.9,174.4 degrees for DME, EME, PME and BME complexes, respectively. PME is also thefirst ether in the trend to have shown a significant change in the hydrogen bond angle. Thesefacts signal that the secondary interactions strain the hydrogen bond.
The butyl methyl ether (BME) experiment shows a strong peak at 551.7 cm-1 followedby a broad feature at the lower frequencies. In mid-infrared, annealing shows growth of thestretching band of the dimer only, so all the changes occurring in the FIR range are also likelyrelated exclusively to the various configurations of the dimer. While there is no annealing
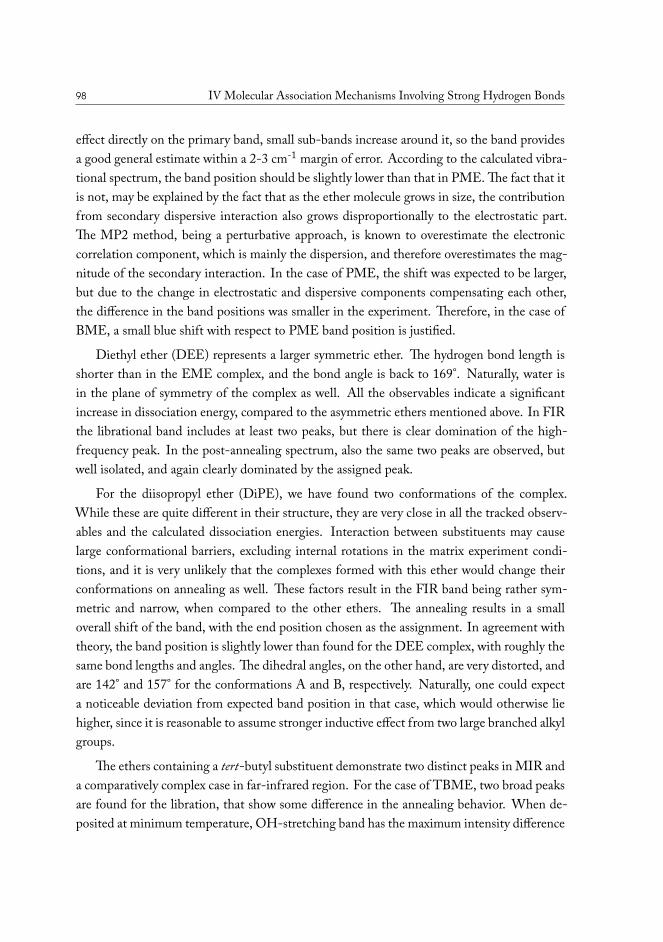
98 IV Molecular Association Mechanisms Involving Strong Hydrogen Bonds
effect directly on the primary band, small sub-bands increase around it, so the band providesa good general estimate within a 2-3 cm-1 margin of error. According to the calculated vibra-tional spectrum, the band position should be slightly lower than that in PME. The fact that itis not, may be explained by the fact that as the ether molecule grows in size, the contributionfrom secondary dispersive interaction also grows disproportionally to the electrostatic part.The MP2 method, being a perturbative approach, is known to overestimate the electroniccorrelation component, which is mainly the dispersion, and therefore overestimates the mag-nitude of the secondary interaction. In the case of PME, the shift was expected to be larger,but due to the change in electrostatic and dispersive components compensating each other,the difference in the band positions was smaller in the experiment. Therefore, in the case ofBME, a small blue shift with respect to PME band position is justified.
Diethyl ether (DEE) represents a larger symmetric ether. The hydrogen bond length isshorter than in the EME complex, and the bond angle is back to 169°. Naturally, water isin the plane of symmetry of the complex as well. All the observables indicate a significantincrease in dissociation energy, compared to the asymmetric ethers mentioned above. In FIRthe librational band includes at least two peaks, but there is clear domination of the high-frequency peak. In the post-annealing spectrum, also the same two peaks are observed, butwell isolated, and again clearly dominated by the assigned peak.
For the diisopropyl ether (DiPE), we have found two conformations of the complex.While these are quite different in their structure, they are very close in all the tracked observ-ables and the calculated dissociation energies. Interaction between substituents may causelarge conformational barriers, excluding internal rotations in the matrix experiment condi-tions, and it is very unlikely that the complexes formed with this ether would change theirconformations on annealing as well. These factors result in the FIR band being rather sym-metric and narrow, when compared to the other ethers. The annealing results in a smalloverall shift of the band, with the end position chosen as the assignment. In agreement withtheory, the band position is slightly lower than found for the DEE complex, with roughly thesame bond lengths and angles. The dihedral angles, on the other hand, are very distorted, andare 142° and 157° for the conformations A and B, respectively. Naturally, one could expecta noticeable deviation from expected band position in that case, which would otherwise liehigher, since it is reasonable to assume stronger inductive effect from two large branched alkylgroups.
The ethers containing a tert-butyl substituent demonstrate two distinct peaks in MIR anda comparatively complex case in far-infrared region. For the case of TBME, two broad peaksare found for the libration, that show some difference in the annealing behavior. When de-posited at minimum temperature, OH-stretching band has the maximum intensity difference
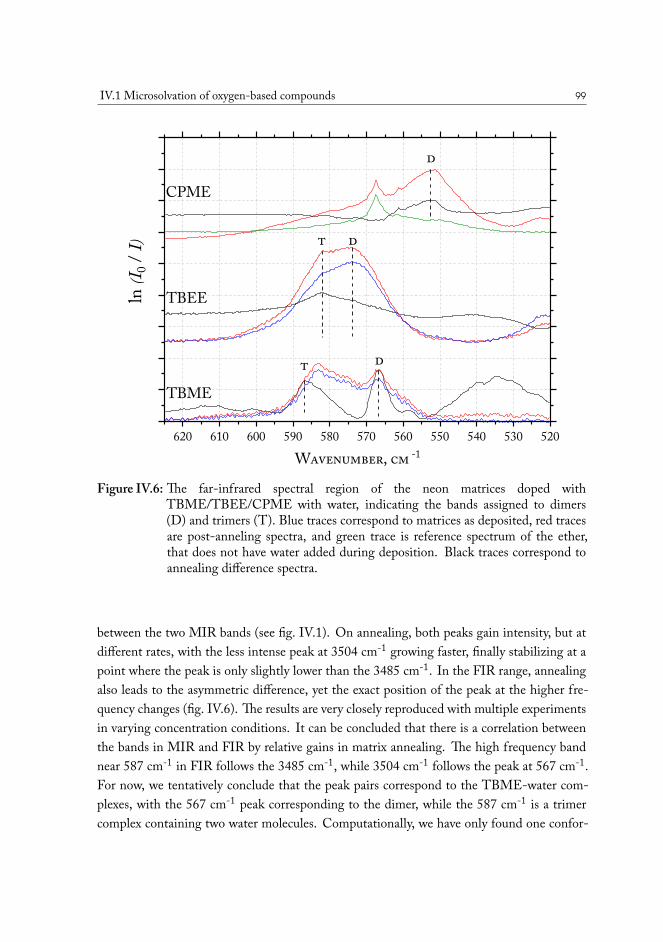
IV.1 Microsolvation of oxygen-based compounds 99
620 610 600 590 580 570 560 550 540 530 520
d
d
d
t
CPME
TBME
Wavenumber, cm -1
ln (I 0
/ I)
TBEE
t
Figure IV.6: The far-infrared spectral region of the neon matrices doped withTBME/TBEE/CPME with water, indicating the bands assigned to dimers(D) and trimers (T). Blue traces correspond to matrices as deposited, red tracesare post-anneling spectra, and green trace is reference spectrum of the ether,that does not have water added during deposition. Black traces correspond toannealing difference spectra.
between the two MIR bands (see fig. IV.1). On annealing, both peaks gain intensity, but atdifferent rates, with the less intense peak at 3504 cm-1 growing faster, finally stabilizing at apoint where the peak is only slightly lower than the 3485 cm-1. In the FIR range, annealingalso leads to the asymmetric difference, yet the exact position of the peak at the higher fre-quency changes (fig. IV.6). The results are very closely reproduced with multiple experimentsin varying concentration conditions. It can be concluded that there is a correlation betweenthe bands in MIR and FIR by relative gains in matrix annealing. The high frequency bandnear 587 cm-1 in FIR follows the 3485 cm-1, while 3504 cm-1 follows the peak at 567 cm-1.For now, we tentatively conclude that the peak pairs correspond to the TBME-water com-plexes, with the 567 cm-1 peak corresponding to the dimer, while the 587 cm-1 is a trimercomplex containing two water molecules. Computationally, we have only found one confor-
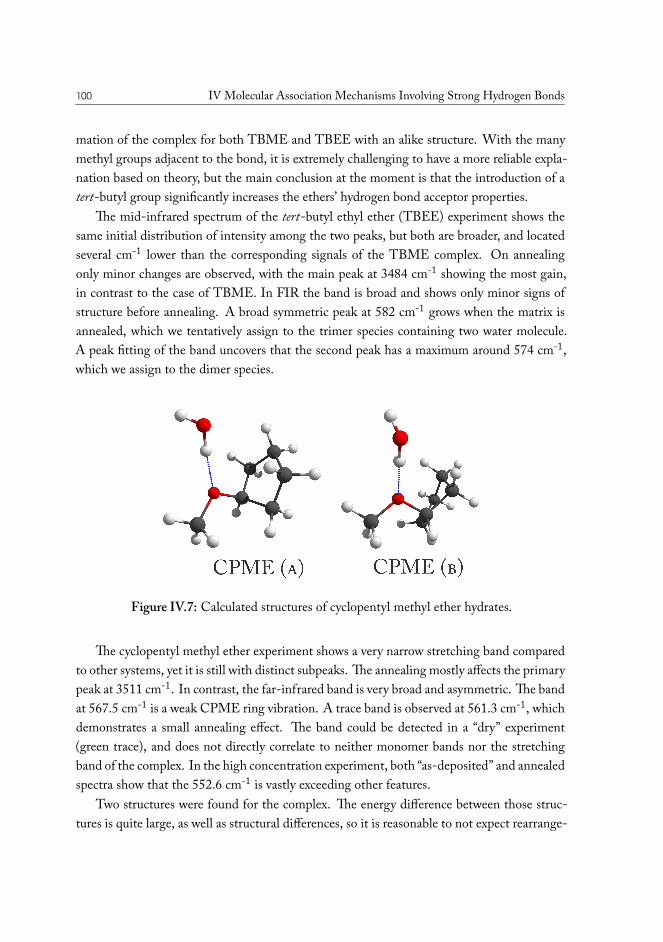
100 IV Molecular Association Mechanisms Involving Strong Hydrogen Bonds
mation of the complex for both TBME and TBEE with an alike structure. With the manymethyl groups adjacent to the bond, it is extremely challenging to have a more reliable expla-nation based on theory, but the main conclusion at the moment is that the introduction of atert-butyl group significantly increases the ethers’ hydrogen bond acceptor properties.
The mid-infrared spectrum of the tert-butyl ethyl ether (TBEE) experiment shows thesame initial distribution of intensity among the two peaks, but both are broader, and locatedseveral cm-1 lower than the corresponding signals of the TBME complex. On annealingonly minor changes are observed, with the main peak at 3484 cm-1 showing the most gain,in contrast to the case of TBME. In FIR the band is broad and shows only minor signs ofstructure before annealing. A broad symmetric peak at 582 cm-1 grows when the matrix isannealed, which we tentatively assign to the trimer species containing two water molecule.A peak fitting of the band uncovers that the second peak has a maximum around 574 cm-1,which we assign to the dimer species.
Figure IV.7: Calculated structures of cyclopentyl methyl ether hydrates.
The cyclopentyl methyl ether experiment shows a very narrow stretching band comparedto other systems, yet it is still with distinct subpeaks. The annealing mostly affects the primarypeak at 3511 cm-1. In contrast, the far-infrared band is very broad and asymmetric. The bandat 567.5 cm-1 is a weak CPME ring vibration. A trace band is observed at 561.3 cm-1, whichdemonstrates a small annealing effect. The band could be detected in a “dry” experiment(green trace), and does not directly correlate to neither monomer bands nor the stretchingband of the complex. In the high concentration experiment, both “as-deposited” and annealedspectra show that the 552.6 cm-1 is vastly exceeding other features.
Two structures were found for the complex. The energy difference between those struc-tures is quite large, as well as structural differences, so it is reasonable to not expect rearrange-
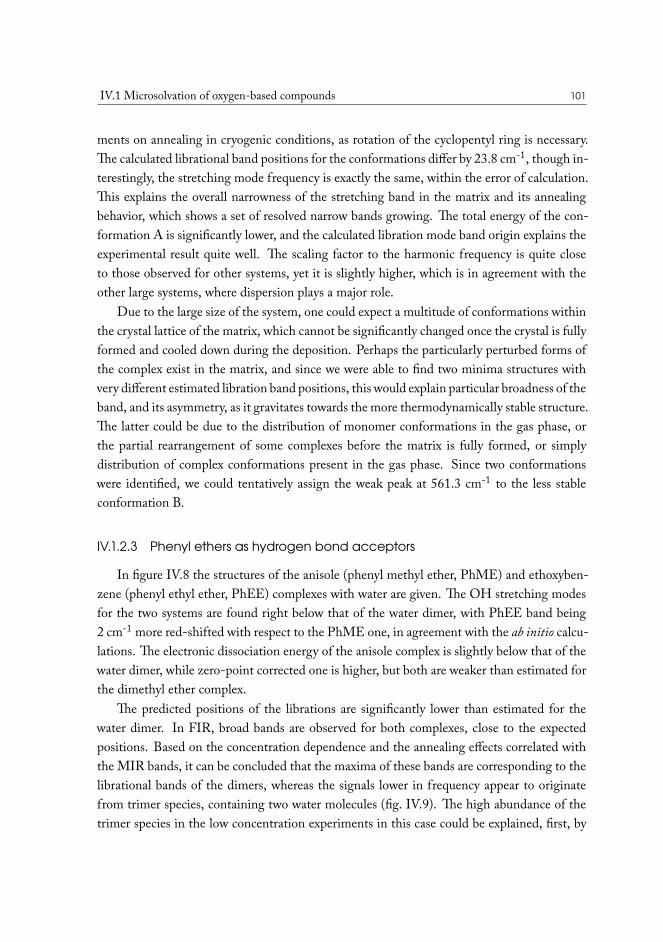
IV.1 Microsolvation of oxygen-based compounds 101
ments on annealing in cryogenic conditions, as rotation of the cyclopentyl ring is necessary.The calculated librational band positions for the conformations differ by 23.8 cm-1, though in-terestingly, the stretching mode frequency is exactly the same, within the error of calculation.This explains the overall narrowness of the stretching band in the matrix and its annealingbehavior, which shows a set of resolved narrow bands growing. The total energy of the con-formation A is significantly lower, and the calculated libration mode band origin explains theexperimental result quite well. The scaling factor to the harmonic frequency is quite closeto those observed for other systems, yet it is slightly higher, which is in agreement with theother large systems, where dispersion plays a major role.
Due to the large size of the system, one could expect a multitude of conformations withinthe crystal lattice of the matrix, which cannot be significantly changed once the crystal is fullyformed and cooled down during the deposition. Perhaps the particularly perturbed forms ofthe complex exist in the matrix, and since we were able to find two minima structures withvery different estimated libration band positions, this would explain particular broadness of theband, and its asymmetry, as it gravitates towards the more thermodynamically stable structure.The latter could be due to the distribution of monomer conformations in the gas phase, orthe partial rearrangement of some complexes before the matrix is fully formed, or simplydistribution of complex conformations present in the gas phase. Since two conformationswere identified, we could tentatively assign the weak peak at 561.3 cm-1 to the less stableconformation B.
IV.1.2.3 Phenyl ethers as hydrogen bond acceptors
In figure IV.8 the structures of the anisole (phenyl methyl ether, PhME) and ethoxyben-zene (phenyl ethyl ether, PhEE) complexes with water are given. The OH stretching modesfor the two systems are found right below that of the water dimer, with PhEE band being2 cm-1 more red-shifted with respect to the PhME one, in agreement with the ab initio calcu-lations. The electronic dissociation energy of the anisole complex is slightly below that of thewater dimer, while zero-point corrected one is higher, but both are weaker than estimated forthe dimethyl ether complex.
The predicted positions of the librations are significantly lower than estimated for thewater dimer. In FIR, broad bands are observed for both complexes, close to the expectedpositions. Based on the concentration dependence and the annealing effects correlated withthe MIR bands, it can be concluded that the maxima of these bands are corresponding to thelibrational bands of the dimers, whereas the signals lower in frequency appear to originatefrom trimer species, containing two water molecules (fig. IV.9). The high abundance of thetrimer species in the low concentration experiments in this case could be explained, first, by
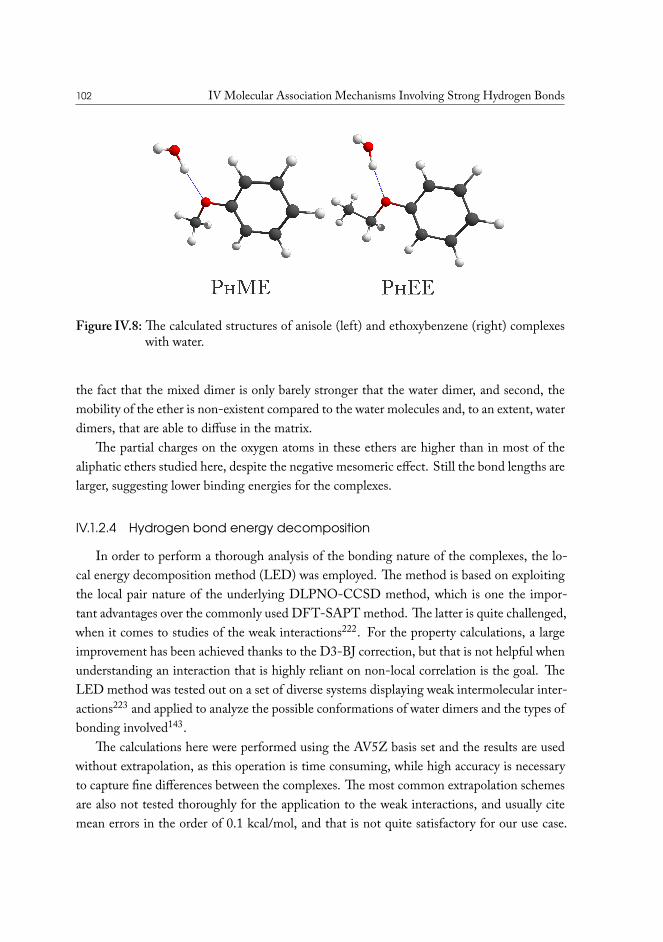
102 IV Molecular Association Mechanisms Involving Strong Hydrogen Bonds
Figure IV.8: The calculated structures of anisole (left) and ethoxybenzene (right) complexeswith water.
the fact that the mixed dimer is only barely stronger that the water dimer, and second, themobility of the ether is non-existent compared to the water molecules and, to an extent, waterdimers, that are able to diffuse in the matrix.
The partial charges on the oxygen atoms in these ethers are higher than in most of thealiphatic ethers studied here, despite the negative mesomeric effect. Still the bond lengths arelarger, suggesting lower binding energies for the complexes.
IV.1.2.4 Hydrogen bond energy decomposition
In order to perform a thorough analysis of the bonding nature of the complexes, the lo-cal energy decomposition method (LED) was employed. The method is based on exploitingthe local pair nature of the underlying DLPNO-CCSD method, which is one the impor-tant advantages over the commonly used DFT-SAPT method. The latter is quite challenged,when it comes to studies of the weak interactions222. For the property calculations, a largeimprovement has been achieved thanks to the D3-BJ correction, but that is not helpful whenunderstanding an interaction that is highly reliant on non-local correlation is the goal. TheLED method was tested out on a set of diverse systems displaying weak intermolecular inter-actions223 and applied to analyze the possible conformations of water dimers and the types ofbonding involved143.
The calculations here were performed using the AV5Z basis set and the results are usedwithout extrapolation, as this operation is time consuming, while high accuracy is necessaryto capture fine differences between the complexes. The most common extrapolation schemesare also not tested thoroughly for the application to the weak interactions, and usually citemean errors in the order of 0.1 kcal/mol, and that is not quite satisfactory for our use case.
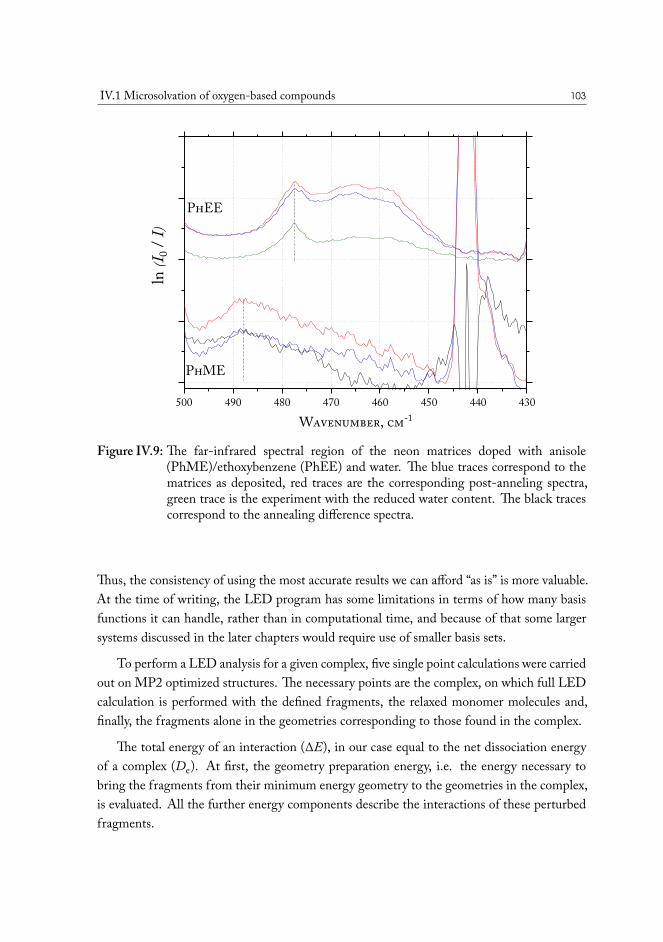
IV.1 Microsolvation of oxygen-based compounds 103
500 490 480 470 460 450 440 430
PhEE
PhME
Wavenumber, cm-1
ln (I 0
/ I)
Figure IV.9: The far-infrared spectral region of the neon matrices doped with anisole(PhME)/ethoxybenzene (PhEE) and water. The blue traces correspond to thematrices as deposited, red traces are the corresponding post-anneling spectra,green trace is the experiment with the reduced water content. The black tracescorrespond to the annealing difference spectra.
Thus, the consistency of using the most accurate results we can afford “as is” is more valuable.At the time of writing, the LED program has some limitations in terms of how many basisfunctions it can handle, rather than in computational time, and because of that some largersystems discussed in the later chapters would require use of smaller basis sets.
To perform a LED analysis for a given complex, five single point calculations were carriedout on MP2 optimized structures. The necessary points are the complex, on which full LEDcalculation is performed with the defined fragments, the relaxed monomer molecules and,finally, the fragments alone in the geometries corresponding to those found in the complex.
The total energy of an interaction (∆E), in our case equal to the net dissociation energyof a complex (De). At first, the geometry preparation energy, i.e. the energy necessary tobring the fragments from their minimum energy geometry to the geometries in the complex,is evaluated. All the further energy components describe the interactions of these perturbedfragments.
104 IV Molecular Association Mechanisms Involving Strong Hydrogen Bonds
𝐷𝑒 = 𝐸𝑒𝑙,𝐴𝐵 − 𝐸𝑒𝑙,𝐴 − 𝐸𝑒𝑙,𝐴 (IV.1)
𝐷𝑒 = Δ𝐸 = Δ𝐸𝑔𝑒𝑜−𝑝𝑟𝑒𝑝 + Δ𝐸𝑖𝑛𝑡 (IV.2)
Δ𝐸𝑖𝑛𝑡 = Δ𝐸𝐻𝐹𝑖𝑛𝑡 + Δ𝐸𝐶𝐶
𝑖𝑛𝑡 (IV.3)
The HF component is then decomposed into the three contribution - electrostatic, ex-change and electronic preparation. The first two are calculated directly from the LED of thecomplex. The latter is estimated as the difference between the HF intra-fragment terms andthe HF energy of the relaxed fragments. In the table IV.2, the attractive terms are added up(el.st.+XC), and the Int.ref refers to the net HF interaction energy between the fragments.
The CCSD contribution is separated into the “strong” and “weak” pairs based on the localMP2 assessment. The pairs estimated to have “negligible” contributions to the interaction,based on the predefined cut-offs, are referred to as “weak” and end up treated on the MP2level of theory. Strong pairs are calculated at the CCSD level. The total CCSD(T) energy isthen obtained when combined with the triples contribution, which won’t be decomposed forthis study:
Δ𝐸𝐶𝑖𝑛𝑡 = Δ𝐸𝑆𝑃
𝑖𝑛𝑡 + Δ𝐸𝑊𝑃𝑖𝑛𝑡 + Δ𝐸(𝑇)
𝑖𝑛𝑡 (IV.4)
The strong pairs represent the dominant component, and so it makes sense to performdecomposition for this part. This contribution can be separated into electronic preparationenergy, a charge-transfer/charge-polarization component and London dispersion. The elec-tronic preparation originates from the excitations contained within the same fragment. Thecharge-transfer component has the opposite sign and usually compensates the most of thepreparation energy, and so it makes sense to combine them144. Their sum provides the extentof the non-dispersive contribution from strong pairs, denoted as ∆E𝑆𝑃
𝑟𝑒𝑠.
Δ𝐸𝑆𝑃𝑖𝑛𝑡 = Δ𝐸𝑆𝑃
𝑒𝑙−𝑝𝑟𝑒𝑝 + Δ𝐸𝑆𝑃𝐶𝑇 + Δ𝐸𝑆𝑃
𝑑𝑖𝑠𝑝 = Δ𝐸𝑆𝑃𝑟𝑒𝑠 + Δ𝐸𝑆𝑃
𝑑𝑖𝑠𝑝 (IV.5)
In the recent implementation of the LED scheme, the genuine dispersion contributionfrom weak pairs has been added. It is summed with the ∆E𝑆𝑃
𝑑𝑖𝑠𝑝 to give the dispersion contri-bution in table IV.2. Finally, the perturbative triples contribution ∆E(𝑇) is calculated fromthe complex and the perturbed fragments. Our goal is to estimate how much of the inter-molecular interaction energy is comprised of the characteristic hydrogen bond components,i.e. electrostatic and charge-transfer, versus non-specific contributions, which is mainly dis-persion. For this purpose we combine the dispersion contribution from LED with the (T)component, as the latter could be expected to be mostly of dispersive nature due to the high
IV.1 Microsolvation of oxygen-based compounds 105
excitations level. The triples and, more so the quadruples, are usually most important forsystems that are very weak and characterized as van der Waals complexes124.
Considering all of the above, the final fragmentation of a complete zero-point correcteddissociation energy for a given complex we select as:
𝐷0 = Δ𝐸𝑔𝑒𝑜 + Δ𝐸𝐻𝐹𝑒𝑙.𝑝𝑟𝑒𝑝. + Δ𝐸𝐻𝐹
𝑒𝑙−𝑠𝑡+𝑋𝐶 + Δ𝐸𝑆𝑃𝑟𝑒𝑠⏟⏟⏟⏟⏟⏟⏟⏟⏟⏟⏟⏟⏟⏟⏟Non-dispersive
+ Δ𝐸𝑆𝑃𝑑𝑖𝑠𝑝 + Δ𝐸𝑊𝑃
𝑑𝑖𝑠𝑝 + Δ𝐸(𝑇)⏟⏟⏟⏟⏟⏟⏟⏟⏟⏟⏟⏟⏟
Dispersive
+Δ𝑍𝑃𝐸
(IV.6)The results of the analysis and the total dissociation energies for the complexes are summa-
rized in table IV.2. As expected, water is heavily dominated by the non-dispersive component,comprising 71% of the total interaction energy. The systems containing ether as the accep-tor show dramatically higher influence of the dispersion component, increasing from 29% inwater dimer to 41% in the DME complex. The highest ratios observed are for the PhEEcomplex and the stable conformation of the CPME complex, 55.9% and 55.7% respectively.
The straight-chain alkyl ethers show higher dissociation energies than the water dimer,with the energy gradually increasing with the size of the substituents. There is a significantgain when the first two methyl groups are introduced, but then the change is small and fairlyconsistent when increasing the chain length in asymmetric ethers, and the gain stays around0.15 kJ∙mol-1 for every extra carbon atom in the EME<PME<BME sequence. The theoreticallibrational band position progresses up to EME, and goes down onward.
The change in dispersion is fairly consistent in the larger ethers, which seems to suggestthat the increase of the librational band origin initially is associated with larger gain in bindingenergy, which, while comes in no small part from dispersion, still results in a much smallerloss in the non-dispersive interaction component. It seems that the exact mutual positions ofthe librational band for this set of systems is critically dependent on a fine interplay of changein electrostatic interactions and competing dispersive attractions to the large substituents.
Accurate predictions of the differences in librational band origins appear very problem-atic, as the DFT functional PW6B95, commonly recognized as one of the best performingfunctionals224,225, suggests that the band origin of the librational band should grow consis-tently with size of the substituents. The error on the harmonic frequencies between our bestestimates at MP2 (RI, AVQZ) and coupled cluster (CCSD(T)-F12b,VTZ-F12, scaled) is23 cm-1 for the DME-water complex with the CC result having the lower frequency, andabout another 25 cm-1 lower for the DFT result. Calculating vibrational frequencies for sys-tems any larger than that at the coupled cluster level with a decent basis set was found notfeasible.
Since the changes in the geometry preparation energy between the complexes is small
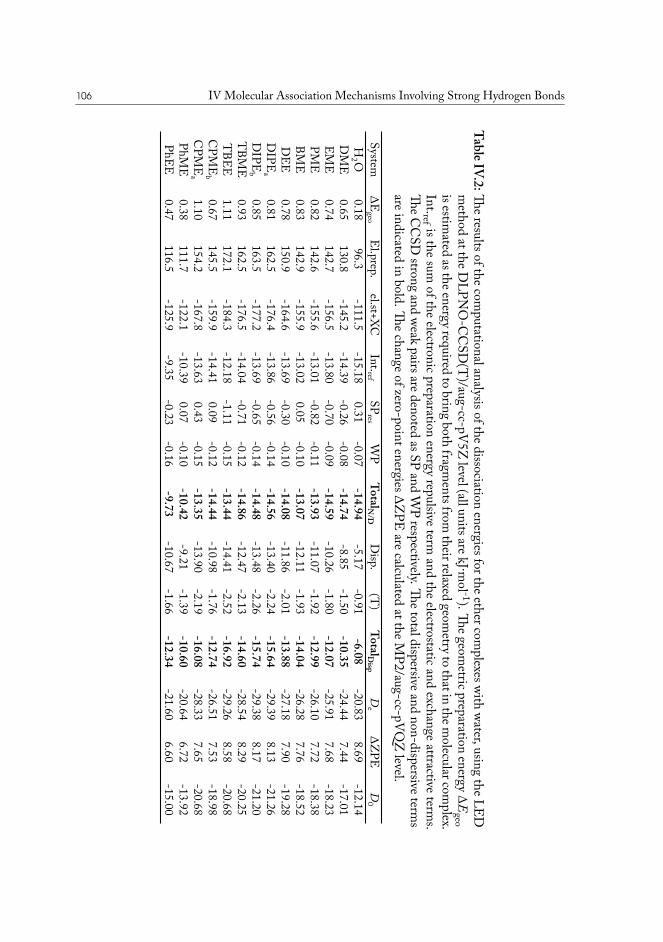
106 IV Molecular Association Mechanisms Involving Strong Hydrogen Bonds
TableIV.2:Theresultsofthecom
putationalanalysisofthedissociationenergiesfortheethercom
plexeswithwater,using
theLEDm
ethodattheD
LPNO
-CC
SD(T
)/aug-cc-pV5Z
level(allunitsarekJ∙mol -1).Th
egeometricpreparation
energy∆Egeo
isestimated
astheenergyrequiredto
bringboth
fragmentsfrom
theirrelaxedgeom
etrytothatin
themolecularcom
plex.Int.ref isthe
sumofthe
electronicpreparationenergy
repulsiveterm
andthe
electrostaticandexchange
attractiveterm
s.Th
eCC
SDstrong
andweak
pairsaredenotedasSP
andW
Prespectively.Th
etotaldispersiveandnon-dispersiveterm
sareindicated
inbold.Th
echangeofzero-pointenergiesΔZPE
arecalculatedattheM
P2/aug-cc-pVQZ
level.
SystemΔE
geoE
l.prep.el.st+XC
Int.refSP
resW
PTotalN
/DD
isp.(T
)TotalD
ispD
eΔZ
PED
0H
2 O0.18
96.3-111.5
-15.180.31
-0.07-14.94
-5.17-0.91
-6.08-20.83
8.69-12.14
DM
E0.65
130.8-145.2
-14.39-0.26
-0.08-14.74
-8.85-1.50
-10.35-24.44
7.44-17.01
EME
0.74142.7
-156.5-13.80
-0.70-0.09
-14.59-10.26
-1.80-12.07
-25.917.68
-18.23PM
E0.82
142.6-155.6
-13.01-0.82
-0.11-13.93
-11.07-1.92
-12.99-26.10
7.72-18.38
BME
0.83142.9
-155.9-13.02
0.05-0.10
-13.07-12.11
-1.93-14.04
-26.287.76
-18.52D
EE0.78
150.9-164.6
-13.69-0.30
-0.10-14.08
-11.86-2.01
-13.88-27.18
7.90-19.28
DIPE
a0.81
162.5-176.4
-13.86-0.56
-0.14-14.56
-13.40-2.24
-15.64-29.39
8.13-21.26
DIPE
b0.85
163.5-177.2
-13.69-0.65
-0.14-14.48
-13.48-2.26
-15.74-29.38
8.17-21.20
TBM
E0.93
162.5-176.5
-14.04-0.71
-0.12-14.86
-12.47-2.13
-14.60-28.54
8.29-20.25
TBEE
1.11172.1
-184.3-12.18
-1.11-0.15
-13.44-14.41
-2.52-16.92
-29.268.58
-20.68C
PME
b0.67
145.5-159.9
-14.410.09
-0.12-14.44
-10.98-1.76
-12.74-26.51
7.53-18.98
CPM
Ea
1.10154.2
-167.8-13.63
0.43-0.15
-13.35-13.90
-2.19-16.08
-28.337.65
-20.68PhM
E0.38
111.7-122.1
-10.390.07
-0.10-10.42
-9.21-1.39
-10.60-20.64
6.72-13.92
PhEE0.47
116.5-125.9
-9.35-0.23
-0.16-9.73
-10.67-1.66
-12.34-21.60
6.60-15.00
IV.1 Microsolvation of oxygen-based compounds 107
compared to change in dissociation energy, we can assume that the error to the trend intro-duced by the use of MP2 geometries is negligible, and then highly accurate local coupledcluster results should provide trustworthy electronic dissociation energies. In that case, thecalculated energies could be used for both intercomparison of complexes and as a part of the li-bration band trend. The conclusion for this set of complexes is that the changes in dissociationenergy are rather small beyond the ethyl group, and that the competition with the secondarydispersive interaction is present, which reduces both the actual electrostatic interaction andthe net non-dispersive component. In figure IV.10, the calculated zero-point corrected dis-sociation energies are plotted against the experimentally determined librational band originsof the respective molecular complexes.
When comparing the DME complex to the water dimer, the electrostatic interaction issignificantly increased in the former, but at the same time an even larger increase in disper-sive interaction results in an uncompensated repulsion, that brings the total non-dispersivecomponent slightly below that of water dimer, while the total dissociation energy is muchhigher. The diethyl ether complex has a higher total D0 and non-dispersive component thanBME, demonstrating the fall-off of the inductive effect of the substituent in the asymmetricethers. DEE has a higher electrostatic component, that roughly follows the partial charge onoxygen, the net non-dispersive component is less than for the EME complex, owing to thelarge gain in the dispersion interaction, and again, the higher repulsion in HF and strong pairs.Interestingly, one could also note that the geometry preparation is slightly lower here than forthe BME and PME complexes, although trend was steadily following D0 in the asymmetricether set.
Moving on to the branched substituents, diisopropyl ether (DiPE) is a more potent hy-drogen bond acceptor, both on the account of dispersion and the electrostatic interaction. Thedistribution of components brings the system to BME range, with 52% dispersion calculatedfor both conformations. While there is some difference in the dispersion/electrostatics com-ponents between the conformations, with the accompanying effects on bond lengths, anglesand estimated libration frequencies, both end up very close in the total D0.
The tert-butyl methyl ether complex shows the highest non-dispersive interaction compo-nent, almost on par with that of the water dimer, possibly explaining the low scaling factor forthe harmonic frequency of the libration. The D0 and the dispersion component of the com-plex fall in between DiPE and DEE, while the observed librational band is somewhat higher.Tert-butyl ethyl ether demonstrates the already established traits associated with growing asubstituent by one carbon atom — a decrease in non-dispersive component compensated bythe additional dispersion gain, that results in a net gain in D0. The geometry preparationenergy for the complex of TBEE is lower than for the DiPE one, like was observed for the
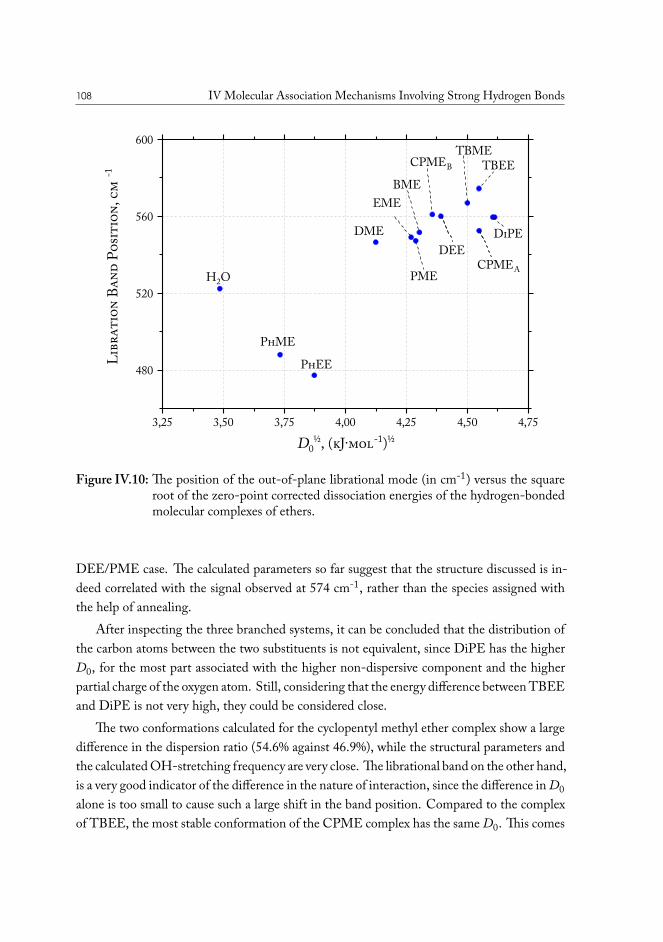
108 IV Molecular Association Mechanisms Involving Strong Hydrogen Bonds
3,25 3,50 3,75 4,00 4,25 4,50 4,75
480
520
560
600
DiPE
CPMEA
TBEETBME
DEE
CPMEB
BME
PME
EME
DME
H2O
PhEE
PhME
D0½, (kJ·mol-1)½
Lib
rati
on B
and
Posi
tion
, cm
-1
Figure IV.10: The position of the out-of-plane librational mode (in cm-1) versus the squareroot of the zero-point corrected dissociation energies of the hydrogen-bondedmolecular complexes of ethers.
DEE/PME case. The calculated parameters so far suggest that the structure discussed is in-deed correlated with the signal observed at 574 cm-1, rather than the species assigned withthe help of annealing.
After inspecting the three branched systems, it can be concluded that the distribution ofthe carbon atoms between the two substituents is not equivalent, since DiPE has the higherD0, for the most part associated with the higher non-dispersive component and the higherpartial charge of the oxygen atom. Still, considering that the energy difference between TBEEand DiPE is not very high, they could be considered close.
The two conformations calculated for the cyclopentyl methyl ether complex show a largedifference in the dispersion ratio (54.6% against 46.9%), while the structural parameters andthe calculated OH-stretching frequency are very close. The librational band on the other hand,is a very good indicator of the difference in the nature of interaction, since the difference in D0alone is too small to cause such a large shift in the band position. Compared to the complexof TBEE, the most stable conformation of the CPME complex has the same D0. This comes
IV.2 Solvent based enhanced oil recovery: Dimethyl Ether (DME) 109
from the fact that TBEE has almost 1 kJ higher ∆ZPE.In the case of aromatic ethers, both the dispersion and electrostatic interactions are much
lower than for the water dimer. Due to the high non-dispersive component in (H2O)2, ithas a larger ∆ZPE that ultimately brings its D0-value below that of the anisole complex, inspite of the fact that De of the latter is lower. Even though the charge on the oxygen atomis larger than for the most of the ethers discussed, the actual electrostatic components arethe lowest for the aromatic ethers. Ethoxybenzene follows the observed trend, where theextension of the alkyl group increases the dispersion component at the expense of the netnon-dispersive part, though in this case it is more pronounced. The gain in the electrostaticinteraction is marginal, possibly due to the fact that the mesomeric effect selectively affectsπ-electrons, whereas inductive effect is distributed through the 𝜎-bonds, and these are ofdifferent importance to the formation of a hydrogen bond. Water dimer is generally an outlierdue to it’s dramatically higher ratio of non-dispersive component in the dissociation energy,which is why when its librational band position is compared to those of the aromatic ethers,the water dimer appears to be stronger. When a comparison against DME and EME isdrawn for PhME and PhEE respectively, the change in the calculated energy componentsfollows the established concepts, although the experimental librational band origin is lowerfor the PhEE complex. The OH-stretching mode, while happens to correctly indicate thatwater dimer is a weaker complex that these two ethers would form, in no way responds to themagnitude of the difference.
IV.2 Solvent based enhanced oil recovery: Dimethyl
Ether (DME)Enhanced oil recovery methods designed around solvent injection have been an object
of multiple studies. Particular interest comes from the fact that the light organic solventshave comparatively low viscosity and surface tension. Coming in contact with crude oil, thesesolvents tend to mix with the oil, lowering its viscosity, which increases the mobility of thefluid. This effect, as well as the ability to reduce the flow resistance caused by capillary forces,has brought interest to search for the feasible solvent flooding approaches in heavy oil reser-voirs226.
Various solvents and combinations have been tested, e.g n-hexane, n-heptane, solvent-based surfactant emulsions and nano-particle stabilized emulsions to in situ generate emul-sions without surfactant227 etc. Chemical EOR projects in the U.S. historically peaked in1980s, with the majority applied to sandstone reservoirs. Ever since then chemical approaches
110 IV Molecular Association Mechanisms Involving Strong Hydrogen Bonds
have been in decline, largely due to the success of CO2 flooding, outcompeting many of theselling points of solvent EOR228,229.
Dimethyl ether (DME) has received a lot of attention as an enhanced oil recovery(EOR)11,216,217 agent thanks to its miscibility with the brines used in secondary water flood-ing. This enables a possibility for a cost-efficient injection of the solution into the reservoir,where DME would partition in the oil phase, reducing oil’s viscosity and improving its mo-bility. Another feature that sets DME apart from other potential EOR agents, such as CO2,is the ability to form hydrogen bonds with polar oil components. Carboxylic acids, primary,secondary, tertiary and aromatic alcohols are commonly found in crude oils.
The polar components of the oil are known to strongly adsorb on the surface of the reser-voir rock material. Many studies have been performed to design a brine composition thatwould cause these compounds to be released from the surface, primarily by the changingionic composition of the solution to alter the wettability of the rock. But the mechanismsinvolved in these processes are still uncertain.
DME on the other hand, has the potential to compete with the rock-fluid interaction, bypartitioning into the oil phase and forming hydrogen bonds. The challenge of the method sofar remains comparatively high cost of the solvent. Recently, a significant number of studieshas been devoted to optimizing the catalytic processes for the synthesis of DME in a cheapone-stage approach. Another aspect that would improve the feasibility of the process, is anaccurate prediction of recovery, based on the available chemical and geological data. Thecommon approach is to perform a PVT230 simulation, often based on empirical partitionconstants and involving approximations to the representation of the fluid chemistry that couldrender the results unreliable.
An alternative approach would be to perform simulations on a molecular scale and to ex-trapolate the results to bulk properties. This is often achieved by means of molecular dynamics(MD)231 simulations, using Newtonian mechanics or Car-Parrinello MD (CPMD)232. New-tonian method relies on the predefined force fields, that are obtained from costly potentialenergy surfaces, the expense of assembling which increases exponentially with the number ofcomponents in the system. The CPMD approach calculates forces by a plane wave DFT ateach numerical step, allowing to study systems of high complexity, but of very limited sizeand in a small time window233.
Opposite of that family of methods are the statistical thermodynamical approaches. Thequantum cluster equilibrium theory (QCE)234 of liquids has been developed to provide bulkproperties based on ab initio thermochemical data of molecular clusters present in a system.As input, the method requires energies, structures and harmonic force fields of the clusters.The application of the method to the mixed methanol-water system, approaching the accuracy
IV.2 Solvent based enhanced oil recovery: Dimethyl Ether (DME) 111
of MD simulations235 has demonstrated its potential for complex mixtures.Recent advances in computational chemistry have also opened possibilities for fast and
accurate calculations of the required molecular properties, even for large systems, due to useof efficient approximations. The major accuracy limitations of input cluster models can beremediated by applying modern hybrid-DFT methods115, local and/or explicitly correlatedvariations of CCSD(T)141 theory, resulting in reliable structures and energies.
However, predicting higher-order properties, namely the vibrational frequencies, remainsa formidable challenge. The large-amplitude intermolecular vibrational motions constitutethe major part of the zero-point vibrational energy (ΔZPE) component of the molecularcluster dissociation energy (D0). Applying the harmonic oscillator approximation to estimatevibrational frequencies of such modes may result in errors up to 20%.
Ab initio anharmonic treatment methods are still far from being applicable to most practi-cal cases, and are primarily at the stage of early development, using experimental data on smallsystems as the reference sets. It has been demonstrated that it is very convenient to estimatethe strength of intermolecular hydrogen bonds through the intermolecular librational modes(see fig. IV.11). This mode usually contributes the most to the ΔZPE-value and is stronglyrelated to the D0-value of the hydrogen-bonded complex. The experimental investigation ofinfrared spectra of the DME complexes with a series of alcohols will provide insight on theexpected structures of clusters, their relative stability in the liquid phase, and provide moreaccurate tools for oil sweep simulations, where fluid-fluid-rock interactions play a crucial role.
PREPARATION OF CHEMICALS. Methanol (MeOH), ethanol (EtOH), tert-butanol(t-BuOH) (Sigma-Aldrich, 99.9%), methanol-OD (Sigma-Aldrich, 99% atom D), ethanol-OD (Sigma-Aldrich, 99% atom D), tert-butanol-OD (Sigma-Aldrich, 99% atom D) weredegassed and purified by multiple freeze-pump-thaw cycles. Phenol (PhOH) (Sigma-Aldrich, 99.5%) and phenol-D6 (Sigma-Aldrich, 99% atom D) were stored in vacuum withmolecular sieves 3Å for several days to recrystallize prior to use.
For the systems of DME with water, methanol, ethanol, tert-butanol and their isotopi-cally substituted analogues, the samples were prepared by mixing the gases in a 2000 ml glassvolume. The volumes used for the deuterated samples were thoroughly purged with the cor-responding component prior to mixing with DME, to ensure minimal H/D exchange withthe glass surface. To prepare the matrices doped with DME and phenol, DME was deliveredfrom a 2000 ml volume, while phenol was deposited via separate inlet line from the solidsample cooled with an ice bath.
The out-of-plane librational bands of the water subunit for the hydrogen bonded ether
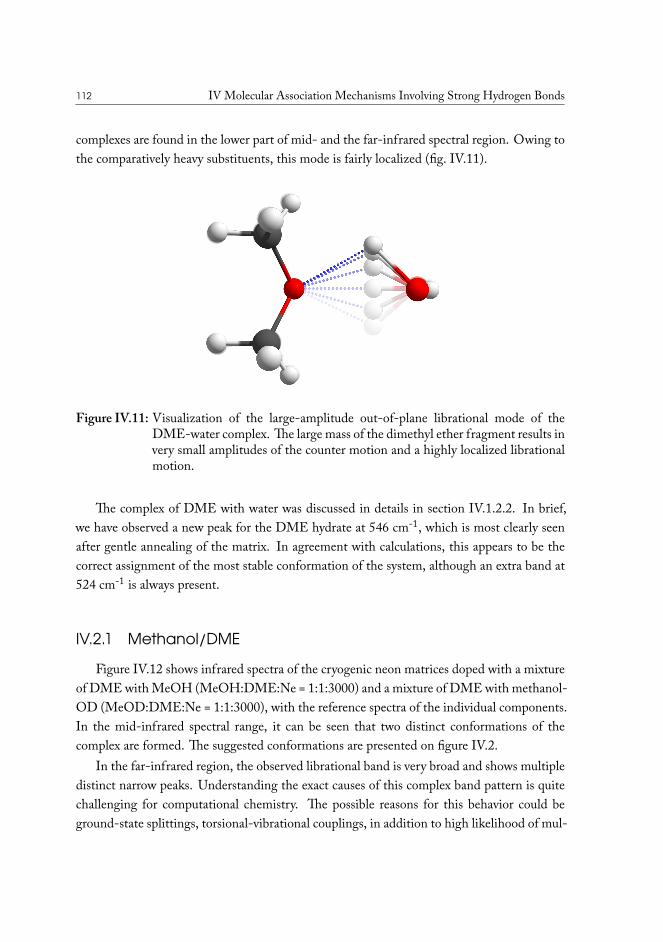
112 IV Molecular Association Mechanisms Involving Strong Hydrogen Bonds
complexes are found in the lower part of mid- and the far-infrared spectral region. Owing tothe comparatively heavy substituents, this mode is fairly localized (fig. IV.11).
Figure IV.11: Visualization of the large-amplitude out-of-plane librational mode of theDME-water complex. The large mass of the dimethyl ether fragment results invery small amplitudes of the counter motion and a highly localized librationalmotion.
The complex of DME with water was discussed in details in section IV.1.2.2. In brief,we have observed a new peak for the DME hydrate at 546 cm-1, which is most clearly seenafter gentle annealing of the matrix. In agreement with calculations, this appears to be thecorrect assignment of the most stable conformation of the system, although an extra band at524 cm-1 is always present.
IV.2.1 Methanol/DME
Figure IV.12 shows infrared spectra of the cryogenic neon matrices doped with a mixtureof DME with MeOH (MeOH:DME:Ne = 1:1:3000) and a mixture of DME with methanol-OD (MeOD:DME:Ne = 1:1:3000), with the reference spectra of the individual components.In the mid-infrared spectral range, it can be seen that two distinct conformations of thecomplex are formed. The suggested conformations are presented on figure IV.2.
In the far-infrared region, the observed librational band is very broad and shows multipledistinct narrow peaks. Understanding the exact causes of this complex band pattern is quitechallenging for computational chemistry. The possible reasons for this behavior could beground-state splittings, torsional-vibrational couplings, in addition to high likelihood of mul-
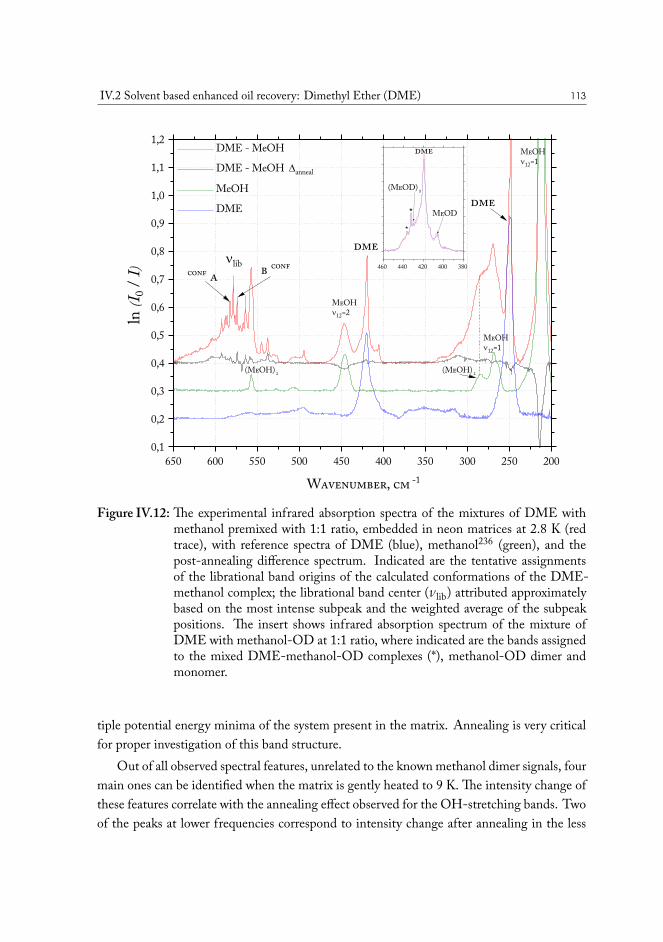
IV.2 Solvent based enhanced oil recovery: Dimethyl Ether (DME) 113
650 600 550 500 450 400 350 300 250 2000,1
0,2
0,3
0,4
0,5
0,6
0,7
0,8
0,9
1,0
1,1
1,2
460 440 420 400 380
MeOD
(MeOD) 2
MeOHn12=1
(MeOH) 2 (MeOH) 2
MeOHn12=1
MeOHn12=2
dme
dme
nlib
DME - MeOH DME - MeOH Danneal
MeOH DME
Wavenumber, cm -1
ln (I 0
/ I) conf a b conf
dme
*
*
Figure IV.12: The experimental infrared absorption spectra of the mixtures of DME withmethanol premixed with 1:1 ratio, embedded in neon matrices at 2.8 K (redtrace), with reference spectra of DME (blue), methanol236 (green), and thepost-annealing difference spectrum. Indicated are the tentative assignmentsof the librational band origins of the calculated conformations of the DME-methanol complex; the librational band center (𝜈lib) attributed approximatelybased on the most intense subpeak and the weighted average of the subpeakpositions. The insert shows infrared absorption spectrum of the mixture ofDME with methanol-OD at 1:1 ratio, where indicated are the bands assignedto the mixed DME-methanol-OD complexes (*), methanol-OD dimer andmonomer.
tiple potential energy minima of the system present in the matrix. Annealing is very criticalfor proper investigation of this band structure.
Out of all observed spectral features, unrelated to the known methanol dimer signals, fourmain ones can be identified when the matrix is gently heated to 9 K. The intensity change ofthese features correlate with the annealing effect observed for the OH-stretching bands. Twoof the peaks at lower frequencies correspond to intensity change after annealing in the less
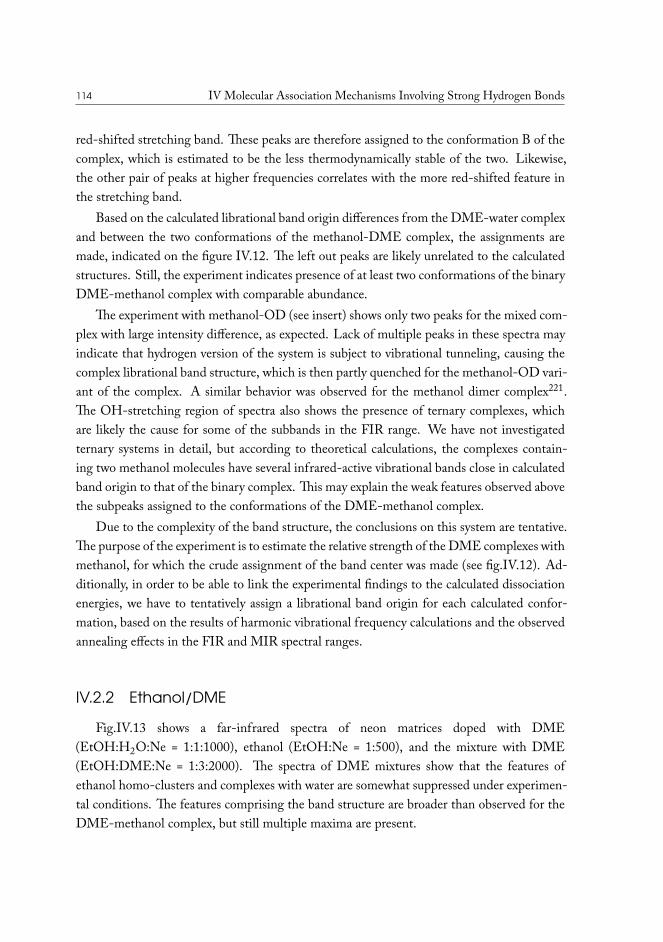
114 IV Molecular Association Mechanisms Involving Strong Hydrogen Bonds
red-shifted stretching band. These peaks are therefore assigned to the conformation B of thecomplex, which is estimated to be the less thermodynamically stable of the two. Likewise,the other pair of peaks at higher frequencies correlates with the more red-shifted feature inthe stretching band.
Based on the calculated librational band origin differences from the DME-water complexand between the two conformations of the methanol-DME complex, the assignments aremade, indicated on the figure IV.12. The left out peaks are likely unrelated to the calculatedstructures. Still, the experiment indicates presence of at least two conformations of the binaryDME-methanol complex with comparable abundance.
The experiment with methanol-OD (see insert) shows only two peaks for the mixed com-plex with large intensity difference, as expected. Lack of multiple peaks in these spectra mayindicate that hydrogen version of the system is subject to vibrational tunneling, causing thecomplex librational band structure, which is then partly quenched for the methanol-OD vari-ant of the complex. A similar behavior was observed for the methanol dimer complex221.The OH-stretching region of spectra also shows the presence of ternary complexes, whichare likely the cause for some of the subbands in the FIR range. We have not investigatedternary systems in detail, but according to theoretical calculations, the complexes contain-ing two methanol molecules have several infrared-active vibrational bands close in calculatedband origin to that of the binary complex. This may explain the weak features observed abovethe subpeaks assigned to the conformations of the DME-methanol complex.
Due to the complexity of the band structure, the conclusions on this system are tentative.The purpose of the experiment is to estimate the relative strength of the DME complexes withmethanol, for which the crude assignment of the band center was made (see fig.IV.12). Ad-ditionally, in order to be able to link the experimental findings to the calculated dissociationenergies, we have to tentatively assign a librational band origin for each calculated confor-mation, based on the results of harmonic vibrational frequency calculations and the observedannealing effects in the FIR and MIR spectral ranges.
IV.2.2 Ethanol/DME
Fig.IV.13 shows a far-infrared spectra of neon matrices doped with DME(EtOH:H2O:Ne = 1:1:1000), ethanol (EtOH:Ne = 1:500), and the mixture with DME(EtOH:DME:Ne = 1:3:2000). The spectra of DME mixtures show that the features ofethanol homo-clusters and complexes with water are somewhat suppressed under experimen-tal conditions. The features comprising the band structure are broader than observed for theDME-methanol complex, but still multiple maxima are present.
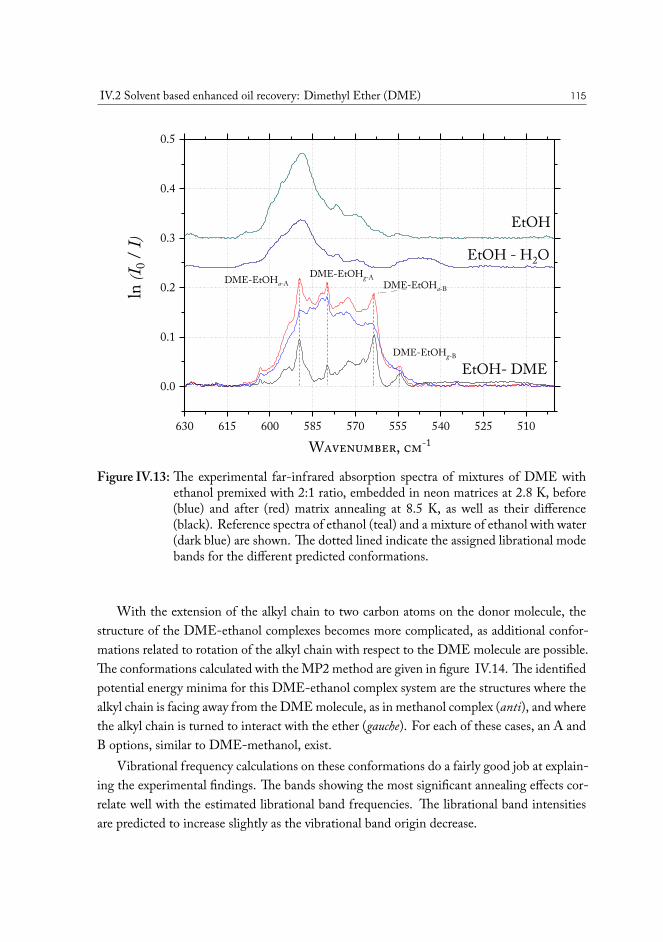
IV.2 Solvent based enhanced oil recovery: Dimethyl Ether (DME) 115
630 615 600 585 570 555 540 525 510
0.0
0.1
0.2
0.3
0.4
0.5
Wavenumber, cm-1
ln (I 0
/ I)
EtOH
EtOH - H2O
EtOH- DME
DME-EtOHa-ADME-EtOHg-A
DME-EtOHg-B
DME-EtOHa-B
Figure IV.13: The experimental far-infrared absorption spectra of mixtures of DME withethanol premixed with 2:1 ratio, embedded in neon matrices at 2.8 K, before(blue) and after (red) matrix annealing at 8.5 K, as well as their difference(black). Reference spectra of ethanol (teal) and a mixture of ethanol with water(dark blue) are shown. The dotted lined indicate the assigned librational modebands for the different predicted conformations.
With the extension of the alkyl chain to two carbon atoms on the donor molecule, thestructure of the DME-ethanol complexes becomes more complicated, as additional confor-mations related to rotation of the alkyl chain with respect to the DME molecule are possible.The conformations calculated with the MP2 method are given in figure IV.14. The identifiedpotential energy minima for this DME-ethanol complex system are the structures where thealkyl chain is facing away from the DME molecule, as in methanol complex (anti), and wherethe alkyl chain is turned to interact with the ether (gauche). For each of these cases, an A andB options, similar to DME-methanol, exist.
Vibrational frequency calculations on these conformations do a fairly good job at explain-ing the experimental findings. The bands showing the most significant annealing effects cor-relate well with the estimated librational band frequencies. The librational band intensitiesare predicted to increase slightly as the vibrational band origin decrease.
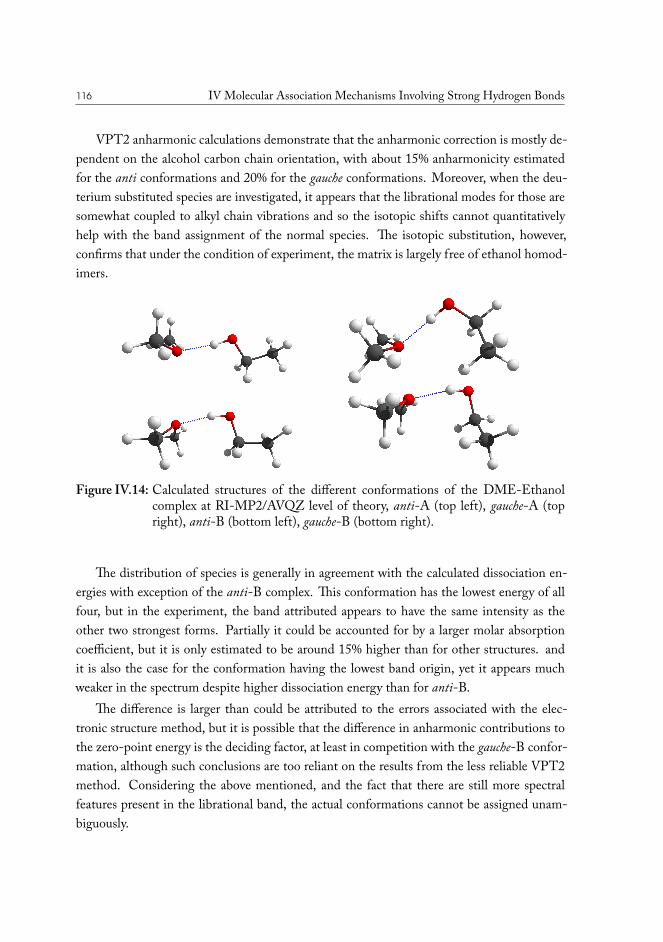
116 IV Molecular Association Mechanisms Involving Strong Hydrogen Bonds
VPT2 anharmonic calculations demonstrate that the anharmonic correction is mostly de-pendent on the alcohol carbon chain orientation, with about 15% anharmonicity estimatedfor the anti conformations and 20% for the gauche conformations. Moreover, when the deu-terium substituted species are investigated, it appears that the librational modes for those aresomewhat coupled to alkyl chain vibrations and so the isotopic shifts cannot quantitativelyhelp with the band assignment of the normal species. The isotopic substitution, however,confirms that under the condition of experiment, the matrix is largely free of ethanol homod-imers.
Figure IV.14: Calculated structures of the different conformations of the DME-Ethanolcomplex at RI-MP2/AVQZ level of theory, anti-A (top left), gauche-A (topright), anti-B (bottom left), gauche-B (bottom right).
The distribution of species is generally in agreement with the calculated dissociation en-ergies with exception of the anti-B complex. This conformation has the lowest energy of allfour, but in the experiment, the band attributed appears to have the same intensity as theother two strongest forms. Partially it could be accounted for by a larger molar absorptioncoefficient, but it is only estimated to be around 15% higher than for other structures. andit is also the case for the conformation having the lowest band origin, yet it appears muchweaker in the spectrum despite higher dissociation energy than for anti-B.
The difference is larger than could be attributed to the errors associated with the elec-tronic structure method, but it is possible that the difference in anharmonic contributions tothe zero-point energy is the deciding factor, at least in competition with the gauche-B confor-mation, although such conclusions are too reliant on the results from the less reliable VPT2method. Considering the above mentioned, and the fact that there are still more spectralfeatures present in the librational band, the actual conformations cannot be assigned unam-biguously.
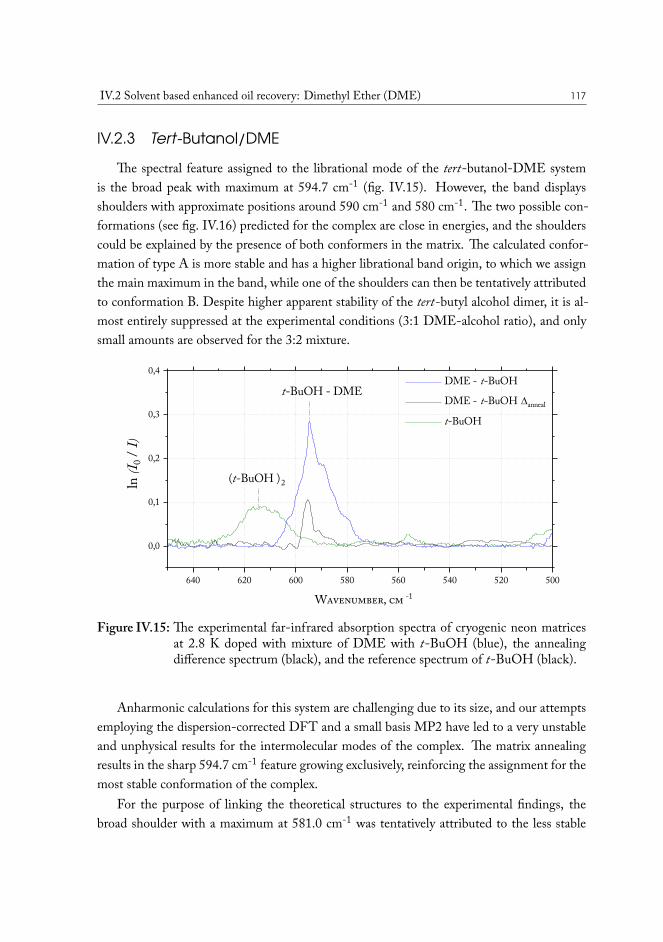
IV.2 Solvent based enhanced oil recovery: Dimethyl Ether (DME) 117
IV.2.3 Tert-Butanol/DME
The spectral feature assigned to the librational mode of the tert-butanol-DME systemis the broad peak with maximum at 594.7 cm-1 (fig. IV.15). However, the band displaysshoulders with approximate positions around 590 cm-1 and 580 cm-1. The two possible con-formations (see fig. IV.16) predicted for the complex are close in energies, and the shoulderscould be explained by the presence of both conformers in the matrix. The calculated confor-mation of type A is more stable and has a higher librational band origin, to which we assignthe main maximum in the band, while one of the shoulders can then be tentatively attributedto conformation B. Despite higher apparent stability of the tert-butyl alcohol dimer, it is al-most entirely suppressed at the experimental conditions (3:1 DME-alcohol ratio), and onlysmall amounts are observed for the 3:2 mixture.
640 620 600 580 560 540 520 500
0,0
0,1
0,2
0,3
0,4 DME - t-BuOH DME - t-BuOH Danneal
t-BuOH
Wavenumber, cm -1
ln (I 0
/ I)
(t-BuOH )2
t-BuOH - DME
Figure IV.15: The experimental far-infrared absorption spectra of cryogenic neon matricesat 2.8 K doped with mixture of DME with t-BuOH (blue), the annealingdifference spectrum (black), and the reference spectrum of t-BuOH (black).
Anharmonic calculations for this system are challenging due to its size, and our attemptsemploying the dispersion-corrected DFT and a small basis MP2 have led to a very unstableand unphysical results for the intermolecular modes of the complex. The matrix annealingresults in the sharp 594.7 cm-1 feature growing exclusively, reinforcing the assignment for themost stable conformation of the complex.
For the purpose of linking the theoretical structures to the experimental findings, thebroad shoulder with a maximum at 581.0 cm-1 was tentatively attributed to the less stable
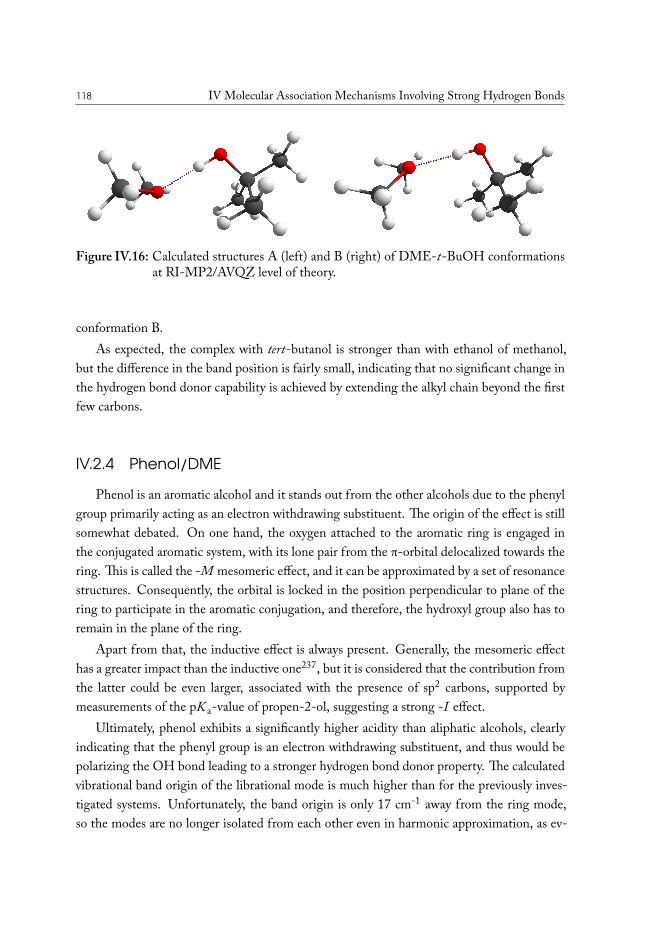
118 IV Molecular Association Mechanisms Involving Strong Hydrogen Bonds
Figure IV.16: Calculated structures A (left) and B (right) of DME-t-BuOH conformationsat RI-MP2/AVQZ level of theory.
conformation B.As expected, the complex with tert-butanol is stronger than with ethanol of methanol,
but the difference in the band position is fairly small, indicating that no significant change inthe hydrogen bond donor capability is achieved by extending the alkyl chain beyond the firstfew carbons.
IV.2.4 Phenol/DME
Phenol is an aromatic alcohol and it stands out from the other alcohols due to the phenylgroup primarily acting as an electron withdrawing substituent. The origin of the effect is stillsomewhat debated. On one hand, the oxygen attached to the aromatic ring is engaged inthe conjugated aromatic system, with its lone pair from the π-orbital delocalized towards thering. This is called the -M mesomeric effect, and it can be approximated by a set of resonancestructures. Consequently, the orbital is locked in the position perpendicular to plane of thering to participate in the aromatic conjugation, and therefore, the hydroxyl group also has toremain in the plane of the ring.
Apart from that, the inductive effect is always present. Generally, the mesomeric effecthas a greater impact than the inductive one237, but it is considered that the contribution fromthe latter could be even larger, associated with the presence of sp2 carbons, supported bymeasurements of the pK a-value of propen-2-ol, suggesting a strong -I effect.
Ultimately, phenol exhibits a significantly higher acidity than aliphatic alcohols, clearlyindicating that the phenyl group is an electron withdrawing substituent, and thus would bepolarizing the OH bond leading to a stronger hydrogen bond donor property. The calculatedvibrational band origin of the librational mode is much higher than for the previously inves-tigated systems. Unfortunately, the band origin is only 17 cm-1 away from the ring mode,so the modes are no longer isolated from each other even in harmonic approximation, as ev-
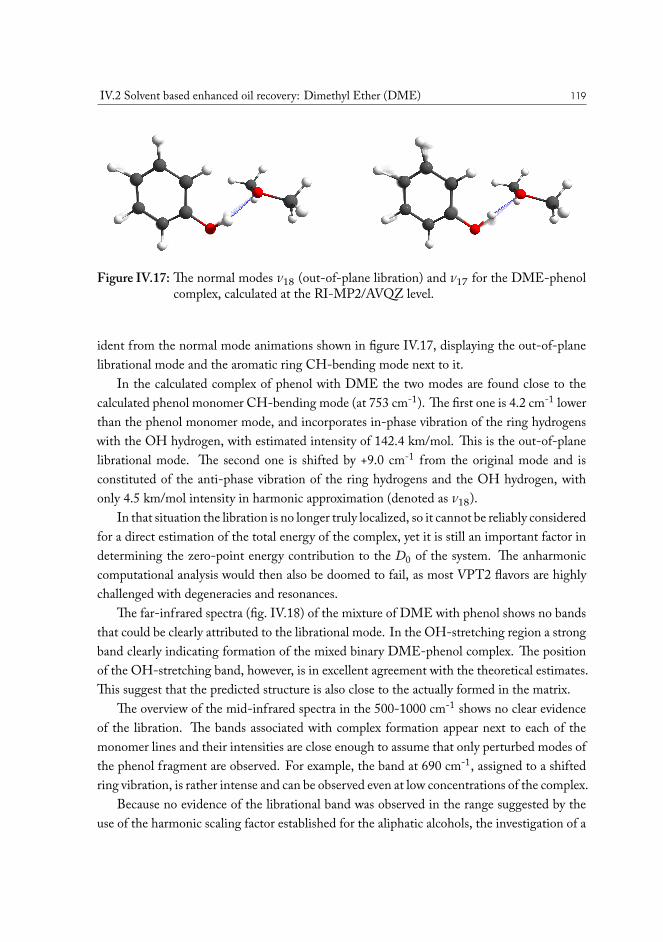
IV.2 Solvent based enhanced oil recovery: Dimethyl Ether (DME) 119
Figure IV.17: The normal modes 𝜈18 (out-of-plane libration) and 𝜈17 for the DME-phenolcomplex, calculated at the RI-MP2/AVQZ level.
ident from the normal mode animations shown in figure IV.17, displaying the out-of-planelibrational mode and the aromatic ring CH-bending mode next to it.
In the calculated complex of phenol with DME the two modes are found close to thecalculated phenol monomer CH-bending mode (at 753 cm-1). The first one is 4.2 cm-1 lowerthan the phenol monomer mode, and incorporates in-phase vibration of the ring hydrogenswith the OH hydrogen, with estimated intensity of 142.4 km/mol. This is the out-of-planelibrational mode. The second one is shifted by +9.0 cm-1 from the original mode and isconstituted of the anti-phase vibration of the ring hydrogens and the OH hydrogen, withonly 4.5 km/mol intensity in harmonic approximation (denoted as 𝜈18).
In that situation the libration is no longer truly localized, so it cannot be reliably consideredfor a direct estimation of the total energy of the complex, yet it is still an important factor indetermining the zero-point energy contribution to the D0 of the system. The anharmoniccomputational analysis would then also be doomed to fail, as most VPT2 flavors are highlychallenged with degeneracies and resonances.
The far-infrared spectra (fig. IV.18) of the mixture of DME with phenol shows no bandsthat could be clearly attributed to the librational mode. In the OH-stretching region a strongband clearly indicating formation of the mixed binary DME-phenol complex. The positionof the OH-stretching band, however, is in excellent agreement with the theoretical estimates.This suggest that the predicted structure is also close to the actually formed in the matrix.
The overview of the mid-infrared spectra in the 500-1000 cm-1 shows no clear evidenceof the libration. The bands associated with complex formation appear next to each of themonomer lines and their intensities are close enough to assume that only perturbed modes ofthe phenol fragment are observed. For example, the band at 690 cm-1, assigned to a shiftedring vibration, is rather intense and can be observed even at low concentrations of the complex.
Because no evidence of the librational band was observed in the range suggested by theuse of the harmonic scaling factor established for the aliphatic alcohols, the investigation of a
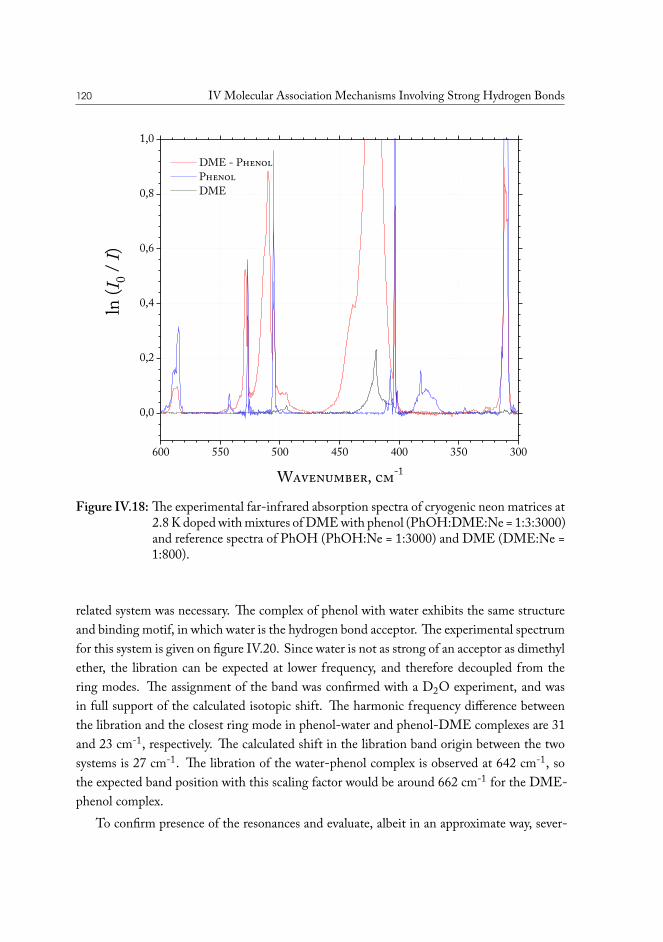
120 IV Molecular Association Mechanisms Involving Strong Hydrogen Bonds
300350400450500550600
0,0
0,2
0,4
0,6
0,8
1,0
ln (I 0 /
I)
Wavenumber, cm-1
DME - Phenol Phenol DME
Figure IV.18: The experimental far-infrared absorption spectra of cryogenic neon matrices at2.8 K doped with mixtures of DME with phenol (PhOH:DME:Ne = 1:3:3000)and reference spectra of PhOH (PhOH:Ne = 1:3000) and DME (DME:Ne =1:800).
related system was necessary. The complex of phenol with water exhibits the same structureand binding motif, in which water is the hydrogen bond acceptor. The experimental spectrumfor this system is given on figure IV.20. Since water is not as strong of an acceptor as dimethylether, the libration can be expected at lower frequency, and therefore decoupled from thering modes. The assignment of the band was confirmed with a D2O experiment, and wasin full support of the calculated isotopic shift. The harmonic frequency difference betweenthe libration and the closest ring mode in phenol-water and phenol-DME complexes are 31and 23 cm-1, respectively. The calculated shift in the libration band origin between the twosystems is 27 cm-1. The libration of the water-phenol complex is observed at 642 cm-1, sothe expected band position with this scaling factor would be around 662 cm-1 for the DME-phenol complex.
To confirm presence of the resonances and evaluate, albeit in an approximate way, sever-
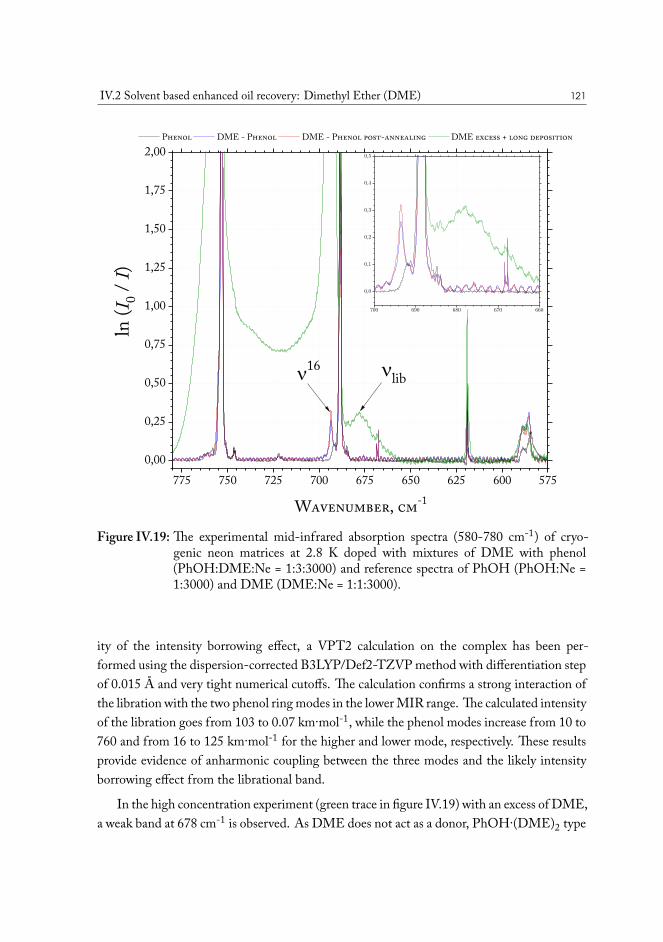
IV.2 Solvent based enhanced oil recovery: Dimethyl Ether (DME) 121
5756006256506757007257507750,00
0,25
0,50
0,75
1,00
1,25
1,50
1,75
2,00
660670680690700
0,0
0,1
0,2
0,3
0,4
0,5
ln (I 0 /
I)
Wavenumber, cm-1
n16
Phenol DME - Phenol DME - Phenol post-annealing DME excess + long deposition
nlib
Figure IV.19: The experimental mid-infrared absorption spectra (580-780 cm-1) of cryo-genic neon matrices at 2.8 K doped with mixtures of DME with phenol(PhOH:DME:Ne = 1:3:3000) and reference spectra of PhOH (PhOH:Ne =1:3000) and DME (DME:Ne = 1:1:3000).
ity of the intensity borrowing effect, a VPT2 calculation on the complex has been per-formed using the dispersion-corrected B3LYP/Def2-TZVP method with differentiation stepof 0.015 Å and very tight numerical cutoffs. The calculation confirms a strong interaction ofthe libration with the two phenol ring modes in the lower MIR range. The calculated intensityof the libration goes from 103 to 0.07 km·mol-1, while the phenol modes increase from 10 to760 and from 16 to 125 km·mol-1 for the higher and lower mode, respectively. These resultsprovide evidence of anharmonic coupling between the three modes and the likely intensityborrowing effect from the librational band.
In the high concentration experiment (green trace in figure IV.19) with an excess of DME,a weak band at 678 cm-1 is observed. As DME does not act as a donor, PhOH·(DME)2 type
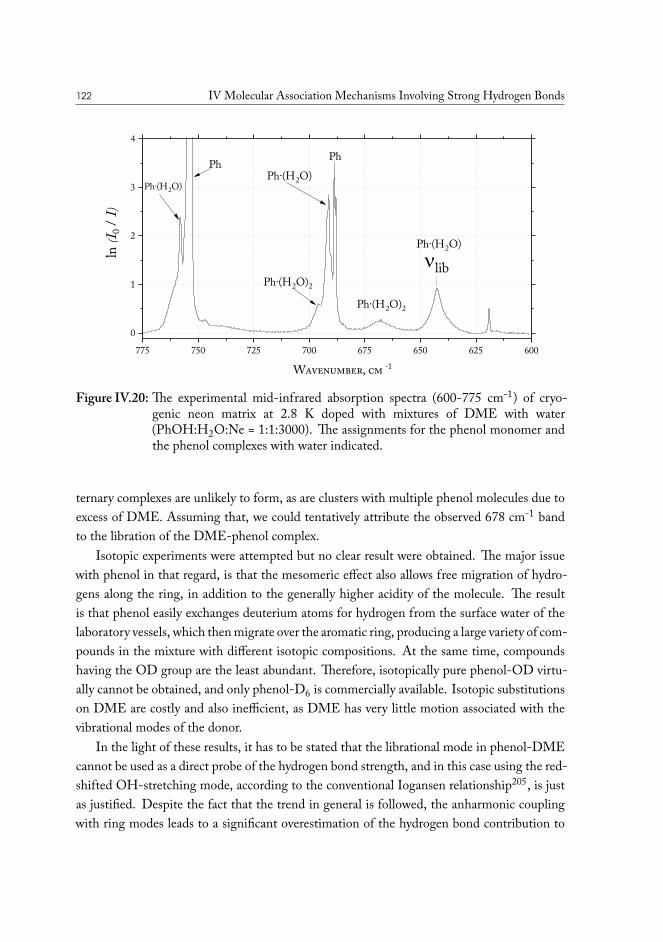
122 IV Molecular Association Mechanisms Involving Strong Hydrogen Bonds
775 750 725 700 675 650 625 6000
1
2
3
4
Ph·(H2O)2Ph·(H2O)2
Ph·(H2O)
Ph·(H2O)Ph·(H2O)
Ph Ph
Wavenumber, cm -1
ln (I 0
/ I)
nlib
Figure IV.20: The experimental mid-infrared absorption spectra (600-775 cm-1) of cryo-genic neon matrix at 2.8 K doped with mixtures of DME with water(PhOH:H2O:Ne = 1:1:3000). The assignments for the phenol monomer andthe phenol complexes with water indicated.
ternary complexes are unlikely to form, as are clusters with multiple phenol molecules due toexcess of DME. Assuming that, we could tentatively attribute the observed 678 cm-1 bandto the libration of the DME-phenol complex.
Isotopic experiments were attempted but no clear result were obtained. The major issuewith phenol in that regard, is that the mesomeric effect also allows free migration of hydro-gens along the ring, in addition to the generally higher acidity of the molecule. The resultis that phenol easily exchanges deuterium atoms for hydrogen from the surface water of thelaboratory vessels, which then migrate over the aromatic ring, producing a large variety of com-pounds in the mixture with different isotopic compositions. At the same time, compoundshaving the OD group are the least abundant. Therefore, isotopically pure phenol-OD virtu-ally cannot be obtained, and only phenol-D6 is commercially available. Isotopic substitutionson DME are costly and also inefficient, as DME has very little motion associated with thevibrational modes of the donor.
In the light of these results, it has to be stated that the librational mode in phenol-DMEcannot be used as a direct probe of the hydrogen bond strength, and in this case using the red-shifted OH-stretching mode, according to the conventional Iogansen relationship205, is justas justified. Despite the fact that the trend in general is followed, the anharmonic couplingwith ring modes leads to a significant overestimation of the hydrogen bond contribution to
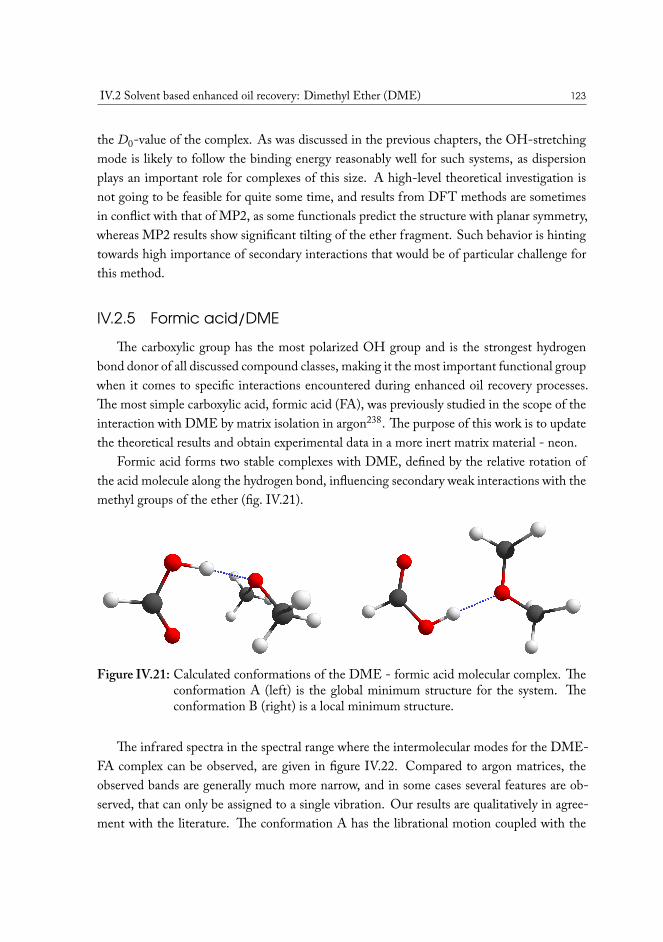
IV.2 Solvent based enhanced oil recovery: Dimethyl Ether (DME) 123
the D0-value of the complex. As was discussed in the previous chapters, the OH-stretchingmode is likely to follow the binding energy reasonably well for such systems, as dispersionplays an important role for complexes of this size. A high-level theoretical investigation isnot going to be feasible for quite some time, and results from DFT methods are sometimesin conflict with that of MP2, as some functionals predict the structure with planar symmetry,whereas MP2 results show significant tilting of the ether fragment. Such behavior is hintingtowards high importance of secondary interactions that would be of particular challenge forthis method.
IV.2.5 Formic acid/DMEThe carboxylic group has the most polarized OH group and is the strongest hydrogen
bond donor of all discussed compound classes, making it the most important functional groupwhen it comes to specific interactions encountered during enhanced oil recovery processes.The most simple carboxylic acid, formic acid (FA), was previously studied in the scope of theinteraction with DME by matrix isolation in argon238. The purpose of this work is to updatethe theoretical results and obtain experimental data in a more inert matrix material - neon.
Formic acid forms two stable complexes with DME, defined by the relative rotation ofthe acid molecule along the hydrogen bond, influencing secondary weak interactions with themethyl groups of the ether (fig. IV.21).
Figure IV.21: Calculated conformations of the DME - formic acid molecular complex. Theconformation A (left) is the global minimum structure for the system. Theconformation B (right) is a local minimum structure.
The infrared spectra in the spectral range where the intermolecular modes for the DME-FA complex can be observed, are given in figure IV.22. Compared to argon matrices, theobserved bands are generally much more narrow, and in some cases several features are ob-served, that can only be assigned to a single vibration. Our results are qualitatively in agree-ment with the literature. The conformation A has the librational motion coupled with the
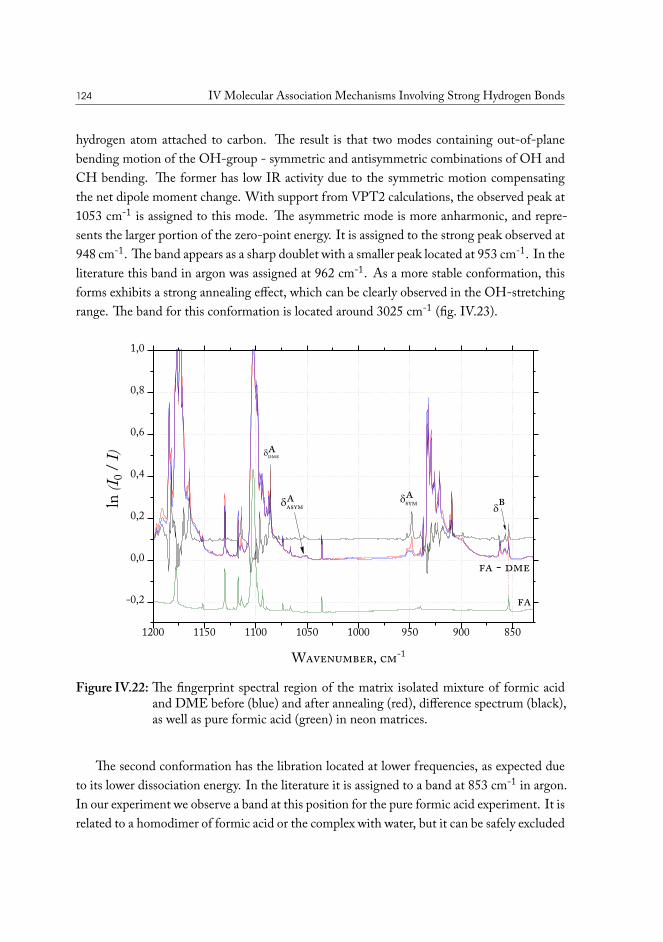
124 IV Molecular Association Mechanisms Involving Strong Hydrogen Bonds
hydrogen atom attached to carbon. The result is that two modes containing out-of-planebending motion of the OH-group - symmetric and antisymmetric combinations of OH andCH bending. The former has low IR activity due to the symmetric motion compensatingthe net dipole moment change. With support from VPT2 calculations, the observed peak at1053 cm-1 is assigned to this mode. The asymmetric mode is more anharmonic, and repre-sents the larger portion of the zero-point energy. It is assigned to the strong peak observed at948 cm-1. The band appears as a sharp doublet with a smaller peak located at 953 cm-1. In theliterature this band in argon was assigned at 962 cm-1. As a more stable conformation, thisforms exhibits a strong annealing effect, which can be clearly observed in the OH-stretchingrange. The band for this conformation is located around 3025 cm-1 (fig. IV.23).
1200 1150 1100 1050 1000 950 900 850
-0,2
0,0
0,2
0,4
0,6
0,8
1,0
Wavenumber, cm-1
ln (I 0
/ I) ddme
dasymdsym
fa
fa - dme
aa
a
bd
Figure IV.22: The fingerprint spectral region of the matrix isolated mixture of formic acidand DME before (blue) and after annealing (red), difference spectrum (black),as well as pure formic acid (green) in neon matrices.
The second conformation has the libration located at lower frequencies, as expected dueto its lower dissociation energy. In the literature it is assigned to a band at 853 cm-1 in argon.In our experiment we observe a band at this position for the pure formic acid experiment. It isrelated to a homodimer of formic acid or the complex with water, but it can be safely excluded
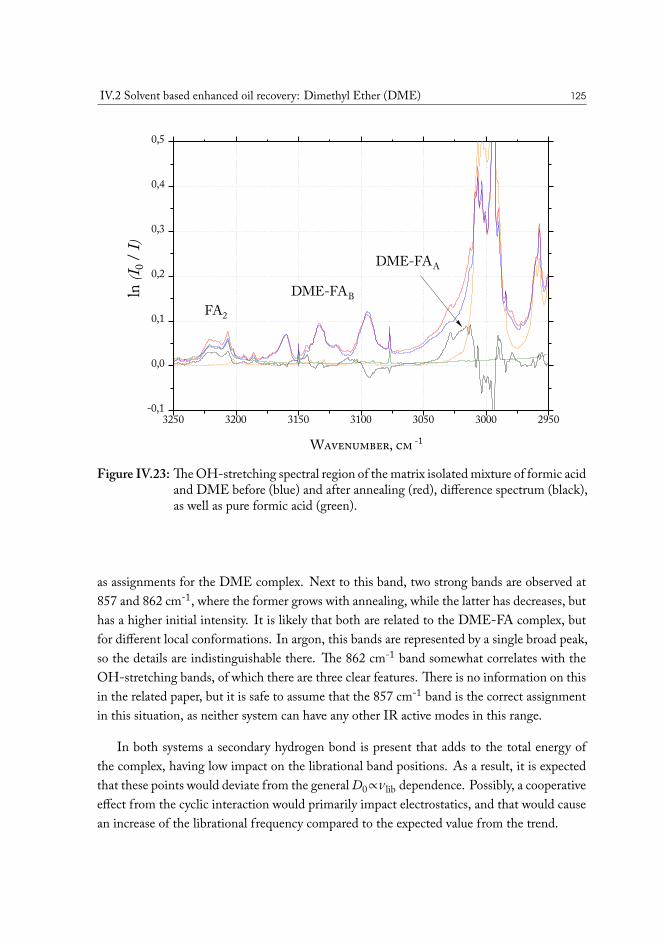
IV.2 Solvent based enhanced oil recovery: Dimethyl Ether (DME) 125
3250 3200 3150 3100 3050 3000 2950-0,1
0,0
0,1
0,2
0,3
0,4
0,5
DME-FABFA2
Wavenumber, cm -1
ln (I 0
/ I)
DME-FAA
Figure IV.23: The OH-stretching spectral region of the matrix isolated mixture of formic acidand DME before (blue) and after annealing (red), difference spectrum (black),as well as pure formic acid (green).
as assignments for the DME complex. Next to this band, two strong bands are observed at857 and 862 cm-1, where the former grows with annealing, while the latter has decreases, buthas a higher initial intensity. It is likely that both are related to the DME-FA complex, butfor different local conformations. In argon, this bands are represented by a single broad peak,so the details are indistinguishable there. The 862 cm-1 band somewhat correlates with theOH-stretching bands, of which there are three clear features. There is no information on thisin the related paper, but it is safe to assume that the 857 cm-1 band is the correct assignmentin this situation, as neither system can have any other IR active modes in this range.
In both systems a secondary hydrogen bond is present that adds to the total energy ofthe complex, having low impact on the librational band positions. As a result, it is expectedthat these points would deviate from the general D0∝𝜈lib dependence. Possibly, a cooperativeeffect from the cyclic interaction would primarily impact electrostatics, and that would causean increase of the librational frequency compared to the expected value from the trend.
126 IV Molecular Association Mechanisms Involving Strong Hydrogen Bonds
IV.2.6 Non-specific bonding to oil constituents
Crude oil is largely containing non-polar components or large molecules with scarcelyplaced polar functional groups. As such, the majority of actual intermolecular interactions,albeit weak, are caused by London dispersion forces. For completeness of the reported systemset, we decided to include an alkane compound, that are generally used as “model oil” inlaboratory experiments by petroleum engineers. Decane is the most commonly used, buthexane was chosen for this study, due to the limited size of the system that could be accuratelytreated by theory.
Since there is no specific bonding, the van der Waals complex formed between the alkaneand DME does not produce any infrared active modes, and therefore cannot be experimen-tally detected in the experiment and does not have the characteristic vibrations of a hydrogen-bonded system. The study of this complex is then carried out computationally only. Thecoupled cluster approach combined with a large basis set should provide decent energy forthis DME-hexane system.
IV.2.7 Data analysis
For the analysis of the dissociation energies of formed molecular complexes, DLPNO-CCSD(T) single point calculations were done on the optimized MP2 geometries, followedby a three-point extrapolation of the result to the complete basis set limit. The analysis ofthe components using the local energy decomposition method is simplified to estimate of thedispersion energies of the complexes. These energies are then directly compared to the totaldissociation energies without accounting for geometry preparation contributions, etc. Theresults of these calculations and the vibrational assignments are summarized in table IV.3.
It is evident from the results that the more stable conformations of a given complexedo not necessarily have the highest band origin of the librational mode. The difference ismost noticeable in the gauche conformations of ethanol, where strong secondary interactionsare present, while the total energies remain relatively constant. The linearity with respectto predicted D0 results is maintained over few complex species, but when it comes to thearomatic alcohol and acids, serious deviations are observed.
When comparing results from different complexes in the same or alike conformations (e.g.methanol-A, ethanol-a-A, t-butanol-A) the trend and the span of hydrogen bond strengthsbecomes apparent (fig. IV.24). The aliphatic alcohols form stronger complexes with DMEthan water, and the stability of the complexes is almost independent of the carbon chainlength. The branching at the OH carbon results in an increased interaction strength, withsecondary and tertiary alcohols being stronger hydrogen bond donors, but the difference is
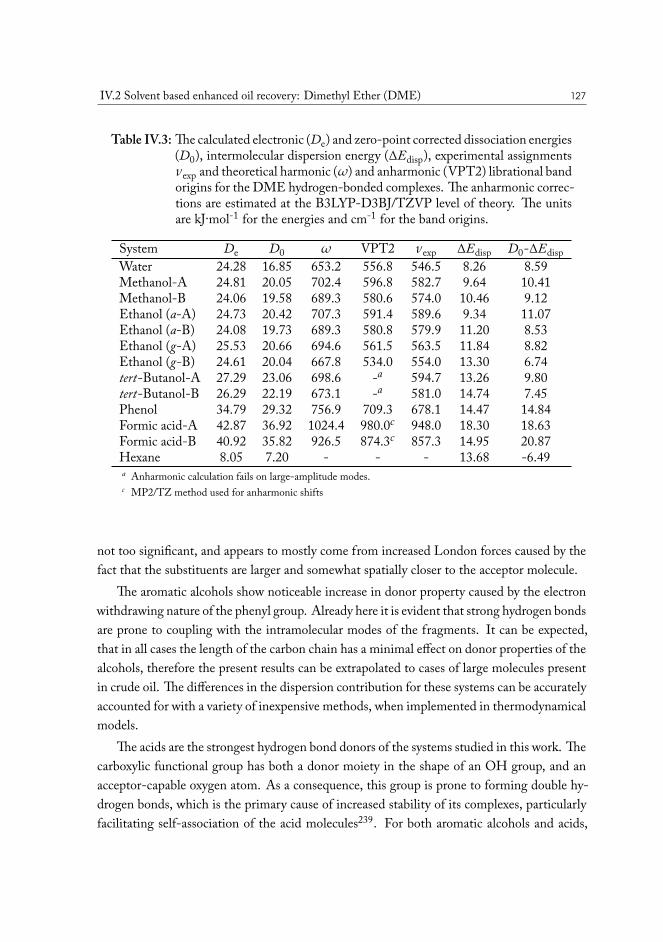
IV.2 Solvent based enhanced oil recovery: Dimethyl Ether (DME) 127
Table IV.3: The calculated electronic (De) and zero-point corrected dissociation energies(D0), intermolecular dispersion energy (∆Edisp), experimental assignments𝜈exp and theoretical harmonic (𝜔) and anharmonic (VPT2) librational bandorigins for the DME hydrogen-bonded complexes. The anharmonic correc-tions are estimated at the B3LYP-D3BJ/TZVP level of theory. The unitsare kJ∙mol-1 for the energies and cm-1 for the band origins.
System De D0 𝜔 VPT2 𝜈exp ∆Edisp D0-∆EdispWater 24.28 16.85 653.2 556.8 546.5 8.26 8.59Methanol-A 24.81 20.05 702.4 596.8 582.7 9.64 10.41Methanol-B 24.06 19.58 689.3 580.6 574.0 10.46 9.12Ethanol (a-A) 24.73 20.42 707.3 591.4 589.6 9.34 11.07Ethanol (a-B) 24.08 19.73 689.3 580.8 579.9 11.20 8.53Ethanol (g-A) 25.53 20.66 694.6 561.5 563.5 11.84 8.82Ethanol (g-B) 24.61 20.04 667.8 534.0 554.0 13.30 6.74tert-Butanol-A 27.29 23.06 698.6 -𝑎 594.7 13.26 9.80tert-Butanol-B 26.29 22.19 673.1 -𝑎 581.0 14.74 7.45Phenol 34.79 29.32 756.9 709.3 678.1 14.47 14.84Formic acid-A 42.87 36.92 1024.4 980.0𝑐 948.0 18.30 18.63Formic acid-B 40.92 35.82 926.5 874.3𝑐 857.3 14.95 20.87Hexane 8.05 7.20 - - - 13.68 -6.49a Anharmonic calculation fails on large-amplitude modes.c MP2/TZ method used for anharmonic shifts
not too significant, and appears to mostly come from increased London forces caused by thefact that the substituents are larger and somewhat spatially closer to the acceptor molecule.
The aromatic alcohols show noticeable increase in donor property caused by the electronwithdrawing nature of the phenyl group. Already here it is evident that strong hydrogen bondsare prone to coupling with the intramolecular modes of the fragments. It can be expected,that in all cases the length of the carbon chain has a minimal effect on donor properties of thealcohols, therefore the present results can be extrapolated to cases of large molecules presentin crude oil. The differences in the dispersion contribution for these systems can be accuratelyaccounted for with a variety of inexpensive methods, when implemented in thermodynamicalmodels.
The acids are the strongest hydrogen bond donors of the systems studied in this work. Thecarboxylic functional group has both a donor moiety in the shape of an OH group, and anacceptor-capable oxygen atom. As a consequence, this group is prone to forming double hy-drogen bonds, which is the primary cause of increased stability of its complexes, particularlyfacilitating self-association of the acid molecules239. For both aromatic alcohols and acids,
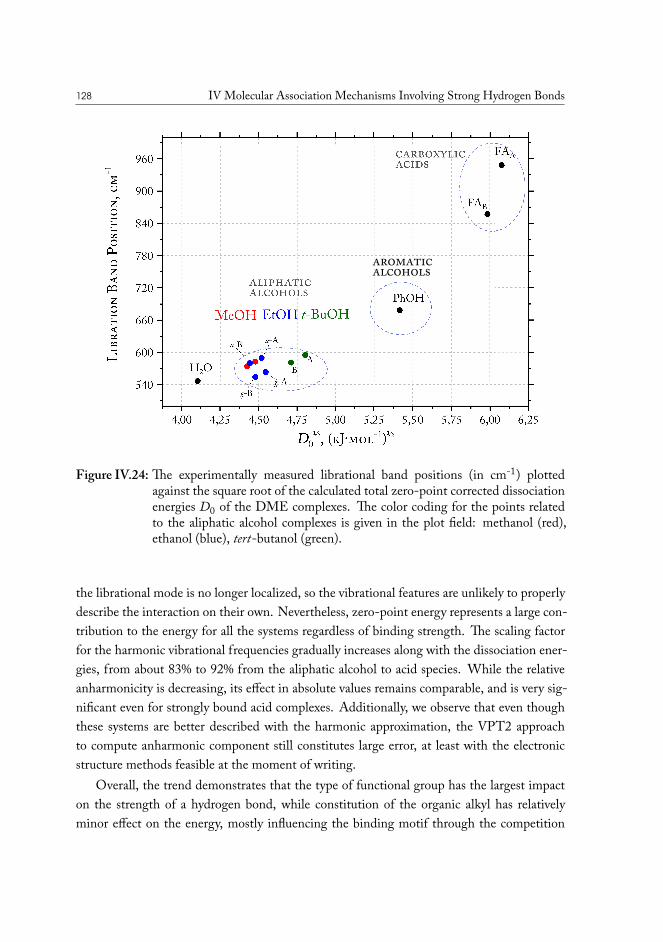
128 IV Molecular Association Mechanisms Involving Strong Hydrogen Bonds
aromaticalcohols
Figure IV.24: The experimentally measured librational band positions (in cm-1) plottedagainst the square root of the calculated total zero-point corrected dissociationenergies D0 of the DME complexes. The color coding for the points relatedto the aliphatic alcohol complexes is given in the plot field: methanol (red),ethanol (blue), tert-butanol (green).
the librational mode is no longer localized, so the vibrational features are unlikely to properlydescribe the interaction on their own. Nevertheless, zero-point energy represents a large con-tribution to the energy for all the systems regardless of binding strength. The scaling factorfor the harmonic vibrational frequencies gradually increases along with the dissociation ener-gies, from about 83% to 92% from the aliphatic alcohol to acid species. While the relativeanharmonicity is decreasing, its effect in absolute values remains comparable, and is very sig-nificant even for strongly bound acid complexes. Additionally, we observe that even thoughthese systems are better described with the harmonic approximation, the VPT2 approachto compute anharmonic component still constitutes large error, at least with the electronicstructure methods feasible at the moment of writing.
Overall, the trend demonstrates that the type of functional group has the largest impacton the strength of a hydrogen bond, while constitution of the organic alkyl has relativelyminor effect on the energy, mostly influencing the binding motif through the competition
IV.2 Solvent based enhanced oil recovery: Dimethyl Ether (DME) 129
with secondary interactions, e.g. a strained hydrogen bond in the gauche conformationsof ethanol complexes with DME. The effect of chain length converges quite fast and canbe easily extrapolated for larger systems. For the discussed classes of compounds, theapproximate range of the dissociation energies are the following:
Water 17 kJ∙mol-1
Primary alcohols ≈20 kJ∙mol-1
Branched alcohols ≈23 kJ∙mol-1
Aromatic alcohols ≈29 kJ∙mol-1
Acid ≈36 kJ∙mol-1
The anharmonicity contribution in the ∆ZPE has been estimated across a wide range ofsystems that could be encountered in chemical equilibria models used for reservoir floodingsimulations. These could be empirically accounted for in a simple way, while retaining a fairlyhigh degree of accuracy.

130
CHAPTERVMolecular Association
Mechanisms Governed by vander Waals Forces
As evident from the previous chapter, specific intermolecular interactions such as hydro-gen bonds are important for the understanding of the behavior of liquids containing polarcompounds and ultimately predicting its flow properties in the presence of solid surfaces. Nev-ertheless, the dispersion constitutes a significant part of the non-covalent interactions evenfor relatively small molecular systems presented in this work. For larger molecules, the non-specific intermolecular forces are enough to create condensed phases at normal conditions.Non-polar solvents, such as CS2, have commonly been used to dissolve and extract asphaltsand resins240, despite the fact that these latter compounds contain polar groups.
Non-covalent bonds with sulfur are more complex owing to the lower electrostatic interac-tions, and might not comprise the largest contribution to the molecular association thermody-namics, but unlike dispersion, these interactions are specific, and thus may have a determiningrole in the structure of the formed aggregates and the association mechanism. Such interac-tions have already been found to play a critical role in properties of sulfur-containing peptides,for example241,242.
V.1 Method development: THz spectroscopy of
weakly bound van der Waals complexesMolecular hydrogen naturally occurs in two spin isomeric forms. Its two nuclear spins
are either parallel (ortho-hydrogen, triplet state) or antiparallel (para-hydrogen, singlet state).The resulting nuclear spin of the molecule is linked to the discrete rotational energy levels in-dicated with a rotational quantum number J. Due to the nuclear spin statistics, para-hydrogencan only have even energy levels occupied (J=0, 2...) while ortho-hydgogen only has odd J-levels occupied. Para-hydrogen is the more thermodynamically stable form (J=0). At roomtemperature, the equilibrium para-ortho ratio is 1:3 due to the Boltzmann distribution. How-ever, the transition probability between ortho-para states is very low under normal conditions.
132 V Molecular Association Mechanisms Governed by van der Waals Forces
V.1.1 Para-hydrogen as matrix host materialSolid enriched p-H2 has several advantages over conventional rare gas matrices243:
• Spherical symmetry of the rotational ground state, with all molecules in the J = 0 rota-tional state
• The crystal structure is pure hexagonal-closed packed, while neon and argon also formface-centered cubic packing
• Large-amplitude zero-point lattice vibration, which is expected to result in self-repairing trapping sites, higher homogeneity, and larger space around solute
• Large lattice constant results in larger space for the guest molecule, lower interactionwith the host molecules and longer lifetime of excited states
For decades, para-hydrogen has been an object of studies, but quite recently its use hasbecome more common, as its fascinating properties unveil. Authors have been showing ex-amples of near-gas-phase behavior of guest molecules, such as methane being able to freelyrotate in the solid para-hydrogen244,245, but also some valuable niche applications.
Our primary interest in para-hydrogen as a host material is due to the extended spectralrange offered in the THz region. Rare gas matrices suffer from the appearance of strongbands associated with the rotational-translation-coupling (RTC) motions of H2O and othermolecules in the matrix cages. These signals obscure the lower part of the THz region(<3 THz), which is where the most important bands for very weakly bound systems are ex-pected. The large crystal lattice constant of p-H2 is the reason this effect is absent in this hostmaterial, as illustrated in fig. V.1 for the weakly bound CO2··H2O van der Waals complex.
In the light of the fact that van der Waals interactions are very important in establishingthe fluid properties of oil and its chemistry, measuring fundamental thermodynamic proper-ties of the underlying complex species is crucial. Obtaining spectroscopic data in the gas phaseis very hard for any of these systems. Reasons is that amount of complex formed in the gas isnegligible, while the vibrations dominating the ZPE contribution, such as the out-of-planelibration of hydrogen-bonded systems, have low infrared intensity. All of that combinedwith comparatively low sensitivity of currently available spectroscopic equipment in the THzregion makes matrix isolation the only option for these measurements.
Last but not the least, the large-amplitude vibrational motions, found in the THz spec-trum for weakly bound complexes, are notoriously challenging to calculate theoretically. Amultitude of anharmonic treatment procedures are being developed to address this challenge,and reliable experimental data is of paramount importance for the field.
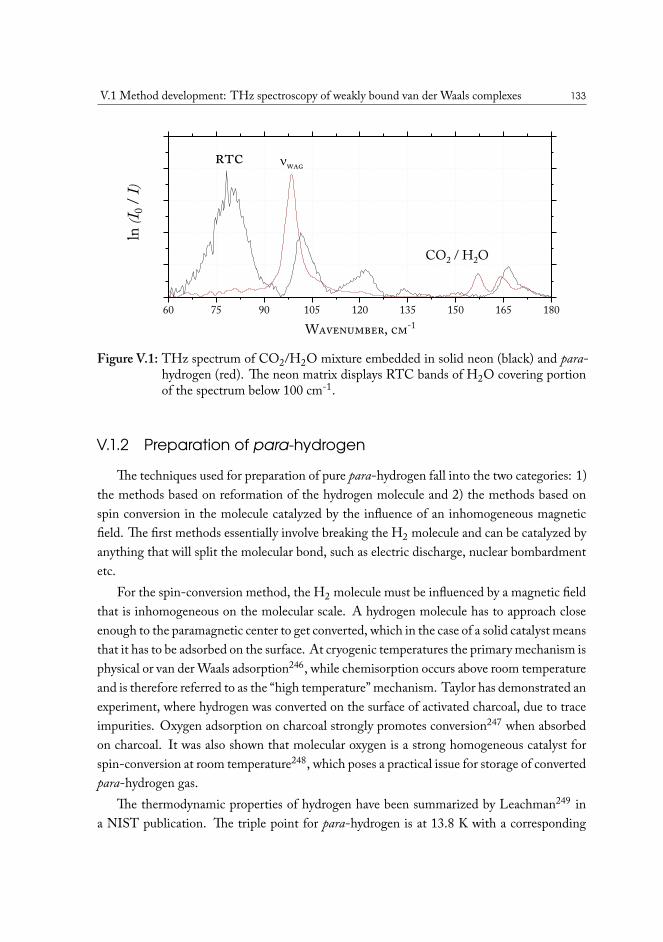
V.1 Method development: THz spectroscopy of weakly bound van der Waals complexes 133
60 75 90 105 120 135 150 165 180
Wavenumber, cm-1
ln (I 0
/ I)
nwag
CO2 / H2O
rtc
Figure V.1: THz spectrum of CO2/H2O mixture embedded in solid neon (black) and para-hydrogen (red). The neon matrix displays RTC bands of H2O covering portionof the spectrum below 100 cm-1.
V.1.2 Preparation of para-hydrogen
The techniques used for preparation of pure para-hydrogen fall into the two categories: 1)the methods based on reformation of the hydrogen molecule and 2) the methods based onspin conversion in the molecule catalyzed by the influence of an inhomogeneous magneticfield. The first methods essentially involve breaking the H2 molecule and can be catalyzed byanything that will split the molecular bond, such as electric discharge, nuclear bombardmentetc.
For the spin-conversion method, the H2 molecule must be influenced by a magnetic fieldthat is inhomogeneous on the molecular scale. A hydrogen molecule has to approach closeenough to the paramagnetic center to get converted, which in the case of a solid catalyst meansthat it has to be adsorbed on the surface. At cryogenic temperatures the primary mechanism isphysical or van der Waals adsorption246, while chemisorption occurs above room temperatureand is therefore referred to as the “high temperature” mechanism. Taylor has demonstrated anexperiment, where hydrogen was converted on the surface of activated charcoal, due to traceimpurities. Oxygen adsorption on charcoal strongly promotes conversion247 when absorbedon charcoal. It was also shown that molecular oxygen is a strong homogeneous catalyst forspin-conversion at room temperature248, which poses a practical issue for storage of convertedpara-hydrogen gas.
The thermodynamic properties of hydrogen have been summarized by Leachman249 ina NIST publication. The triple point for para-hydrogen is at 13.8 K with a corresponding
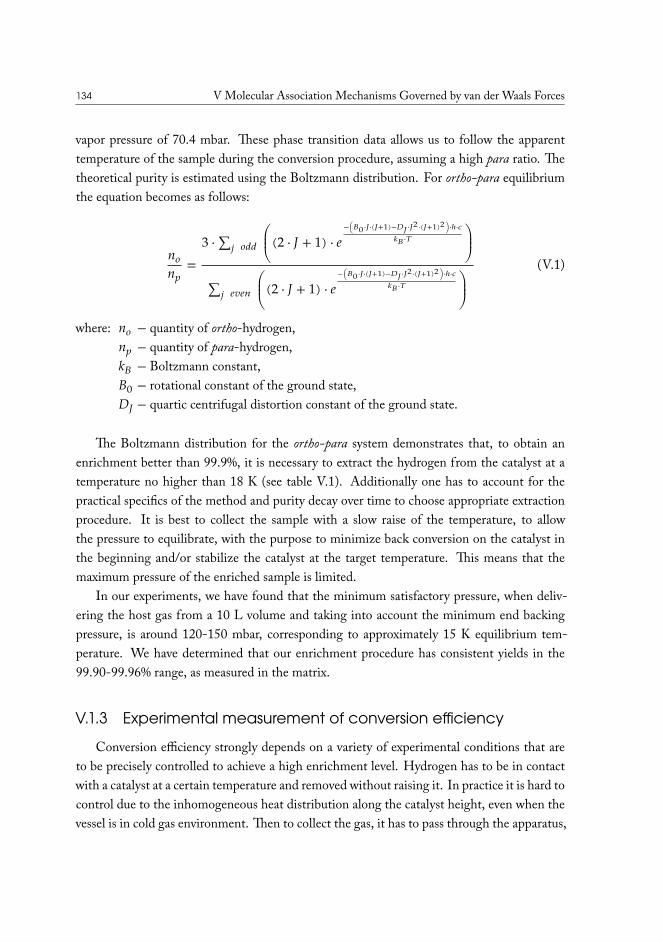
134 V Molecular Association Mechanisms Governed by van der Waals Forces
vapor pressure of 70.4 mbar. These phase transition data allows us to follow the apparenttemperature of the sample during the conversion procedure, assuming a high para ratio. Thetheoretical purity is estimated using the Boltzmann distribution. For ortho-para equilibriumthe equation becomes as follows:
𝑛𝑜𝑛𝑝
=3 · ∑𝑗 𝑜𝑑𝑑
⎛⎜⎜⎝
(2 · 𝐽 + 1) · 𝑒−(𝐵0·𝐽·(𝐽+1)−𝐷𝐽·𝐽2·(𝐽+1)2)·ℎ·𝑐
𝑘𝐵·𝑇 ⎞⎟⎟⎠
∑𝑗 𝑒𝑣𝑒𝑛⎛⎜⎜⎝
(2 · 𝐽 + 1) · 𝑒−(𝐵0·𝐽·(𝐽+1)−𝐷𝐽·𝐽2·(𝐽+1)2)·ℎ·𝑐
𝑘𝐵·𝑇 ⎞⎟⎟⎠
(V.1)
where: 𝑛𝑜 − quantity of ortho-hydrogen,𝑛𝑝 − quantity of para-hydrogen,𝑘𝐵 − Boltzmann constant,𝐵0 − rotational constant of the ground state,𝐷𝐽 − quartic centrifugal distortion constant of the ground state.
The Boltzmann distribution for the ortho-para system demonstrates that, to obtain anenrichment better than 99.9%, it is necessary to extract the hydrogen from the catalyst at atemperature no higher than 18 K (see table V.1). Additionally one has to account for thepractical specifics of the method and purity decay over time to choose appropriate extractionprocedure. It is best to collect the sample with a slow raise of the temperature, to allowthe pressure to equilibrate, with the purpose to minimize back conversion on the catalyst inthe beginning and/or stabilize the catalyst at the target temperature. This means that themaximum pressure of the enriched sample is limited.
In our experiments, we have found that the minimum satisfactory pressure, when deliv-ering the host gas from a 10 L volume and taking into account the minimum end backingpressure, is around 120-150 mbar, corresponding to approximately 15 K equilibrium tem-perature. We have determined that our enrichment procedure has consistent yields in the99.90-99.96% range, as measured in the matrix.
V.1.3 Experimental measurement of conversion efficiencyConversion efficiency strongly depends on a variety of experimental conditions that are
to be precisely controlled to achieve a high enrichment level. Hydrogen has to be in contactwith a catalyst at a certain temperature and removed without raising it. In practice it is hard tocontrol due to the inhomogeneous heat distribution along the catalyst height, even when thevessel is in cold gas environment. Then to collect the gas, it has to pass through the apparatus,
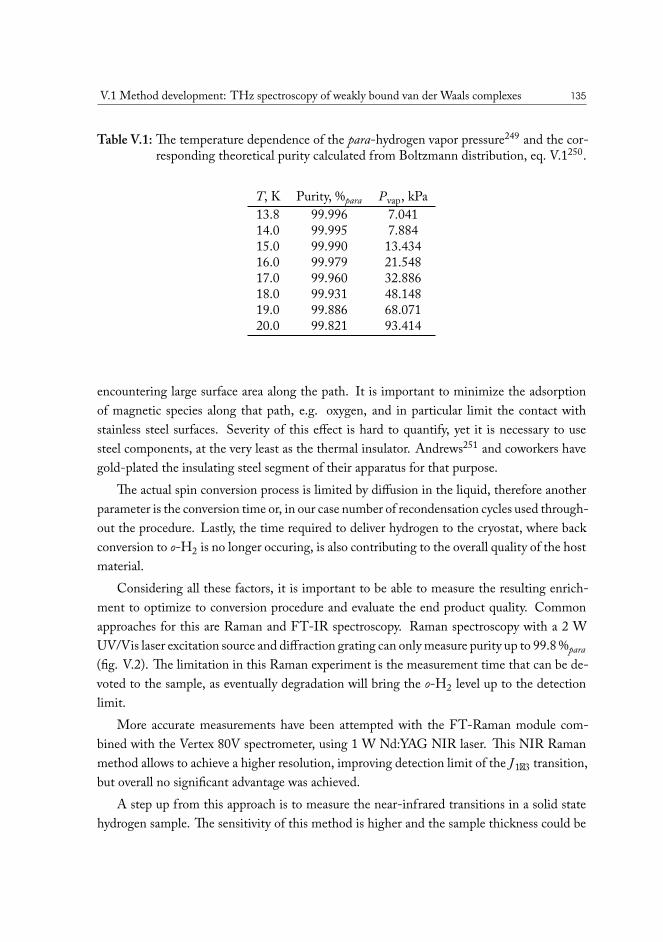
V.1 Method development: THz spectroscopy of weakly bound van der Waals complexes 135
Table V.1: The temperature dependence of the para-hydrogen vapor pressure249 and the cor-responding theoretical purity calculated from Boltzmann distribution, eq. V.1250.
T, K Purity, %para Pvap, kPa13.8 99.996 7.04114.0 99.995 7.88415.0 99.990 13.43416.0 99.979 21.54817.0 99.960 32.88618.0 99.931 48.14819.0 99.886 68.07120.0 99.821 93.414
encountering large surface area along the path. It is important to minimize the adsorptionof magnetic species along that path, e.g. oxygen, and in particular limit the contact withstainless steel surfaces. Severity of this effect is hard to quantify, yet it is necessary to usesteel components, at the very least as the thermal insulator. Andrews251 and coworkers havegold-plated the insulating steel segment of their apparatus for that purpose.
The actual spin conversion process is limited by diffusion in the liquid, therefore anotherparameter is the conversion time or, in our case number of recondensation cycles used through-out the procedure. Lastly, the time required to deliver hydrogen to the cryostat, where backconversion to o-H2 is no longer occuring, is also contributing to the overall quality of the hostmaterial.
Considering all these factors, it is important to be able to measure the resulting enrich-ment to optimize to conversion procedure and evaluate the end product quality. Commonapproaches for this are Raman and FT-IR spectroscopy. Raman spectroscopy with a 2 WUV/Vis laser excitation source and diffraction grating can only measure purity up to 99.8 %para(fig. V.2). The limitation in this Raman experiment is the measurement time that can be de-voted to the sample, as eventually degradation will bring the o-H2 level up to the detectionlimit.
More accurate measurements have been attempted with the FT-Raman module com-bined with the Vertex 80V spectrometer, using 1 W Nd:YAG NIR laser. This NIR Ramanmethod allows to achieve a higher resolution, improving detection limit of the J 1�3 transition,but overall no significant advantage was achieved.
A step up from this approach is to measure the near-infrared transitions in a solid statehydrogen sample. The sensitivity of this method is higher and the sample thickness could be
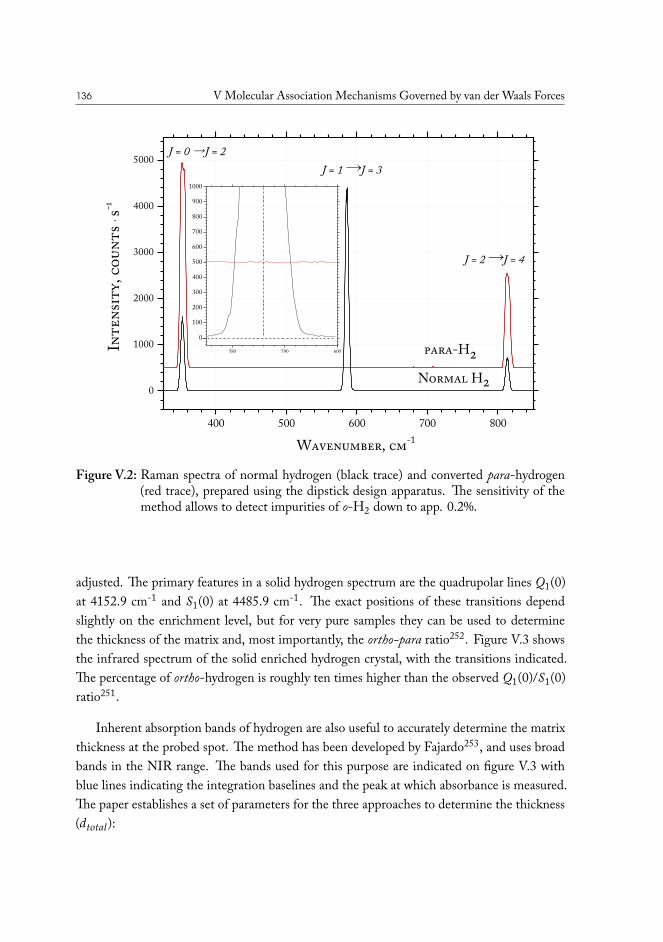
136 V Molecular Association Mechanisms Governed by van der Waals Forces
400 500 600 700 800
0
1000
2000
3000
4000
5000
580 590 600
0
100
200
300
400
500
600
700
800
900
1000
Inte
nsit
y, c
ount
s · s
-1
Wavenumber, cm-1
J = 2 J = 4
J = 1 J = 3
para-H2
Normal H2
J = 0 J = 2
Figure V.2: Raman spectra of normal hydrogen (black trace) and converted para-hydrogen(red trace), prepared using the dipstick design apparatus. The sensitivity of themethod allows to detect impurities of o-H2 down to app. 0.2%.
adjusted. The primary features in a solid hydrogen spectrum are the quadrupolar lines Q1(0)at 4152.9 cm-1 and S1(0) at 4485.9 cm-1. The exact positions of these transitions dependslightly on the enrichment level, but for very pure samples they can be used to determinethe thickness of the matrix and, most importantly, the ortho-para ratio252. Figure V.3 showsthe infrared spectrum of the solid enriched hydrogen crystal, with the transitions indicated.The percentage of ortho-hydrogen is roughly ten times higher than the observed Q1(0)/S1(0)ratio251.
Inherent absorption bands of hydrogen are also useful to accurately determine the matrixthickness at the probed spot. The method has been developed by Fajardo253, and uses broadbands in the NIR range. The bands used for this purpose are indicated on figure V.3 withblue lines indicating the integration baselines and the peak at which absorbance is measured.The paper establishes a set of parameters for the three approaches to determine the thickness(𝑑𝑡𝑜𝑡𝑎𝑙):
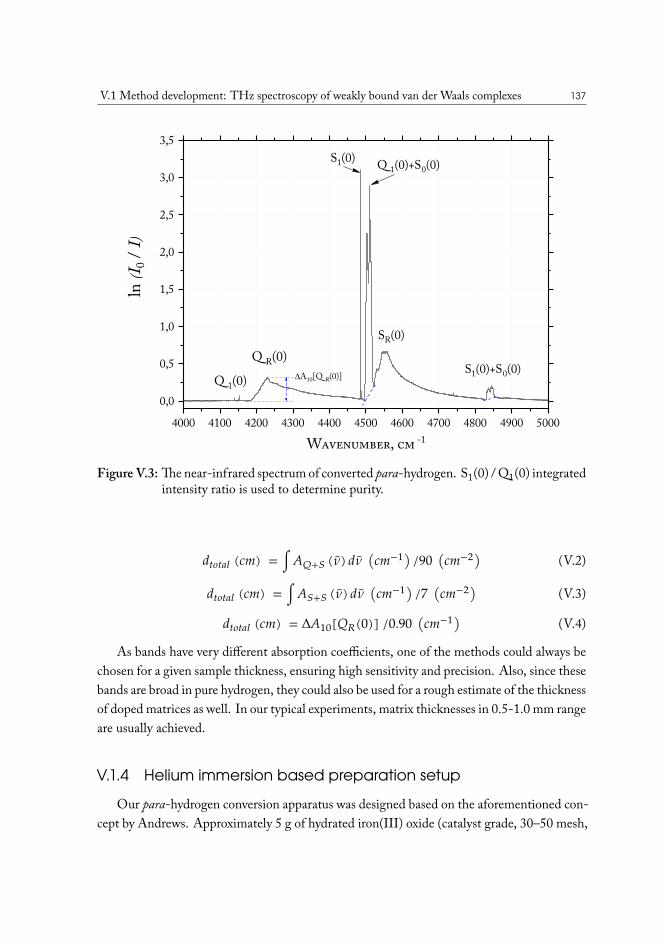
V.1 Method development: THz spectroscopy of weakly bound van der Waals complexes 137
4000 4100 4200 4300 4400 4500 4600 4700 4800 4900 50000,0
0,5
1,0
1,5
2,0
2,5
3,0
3,5
Q R(0)S1(0)+S0(0)
SR(0)
Q 1(0)+S0(0)
Wavenumber, cm -1
ln (I 0
/ I)
S1(0)
Q 1(0) DA10[Q R(0)]
Figure V.3: The near-infrared spectrum of converted para-hydrogen. S1(0) / Q1(0) integratedintensity ratio is used to determine purity.
𝑑𝑡𝑜𝑡𝑎𝑙 (𝑐𝑚) = ∫ 𝐴𝑄+𝑆 ( 𝜈) 𝑑 𝜈 (𝑐𝑚−1) /90 (𝑐𝑚−2) (V.2)
𝑑𝑡𝑜𝑡𝑎𝑙 (𝑐𝑚) = ∫ 𝐴𝑆+𝑆 ( 𝜈) 𝑑 𝜈 (𝑐𝑚−1) /7 (𝑐𝑚−2) (V.3)
𝑑𝑡𝑜𝑡𝑎𝑙 (𝑐𝑚) = Δ𝐴10[𝑄𝑅(0)] /0.90 (𝑐𝑚−1) (V.4)
As bands have very different absorption coefficients, one of the methods could always bechosen for a given sample thickness, ensuring high sensitivity and precision. Also, since thesebands are broad in pure hydrogen, they could also be used for a rough estimate of the thicknessof doped matrices as well. In our typical experiments, matrix thicknesses in 0.5-1.0 mm rangeare usually achieved.
V.1.4 Helium immersion based preparation setupOur para-hydrogen conversion apparatus was designed based on the aforementioned con-
cept by Andrews. Approximately 5 g of hydrated iron(III) oxide (catalyst grade, 30–50 mesh,
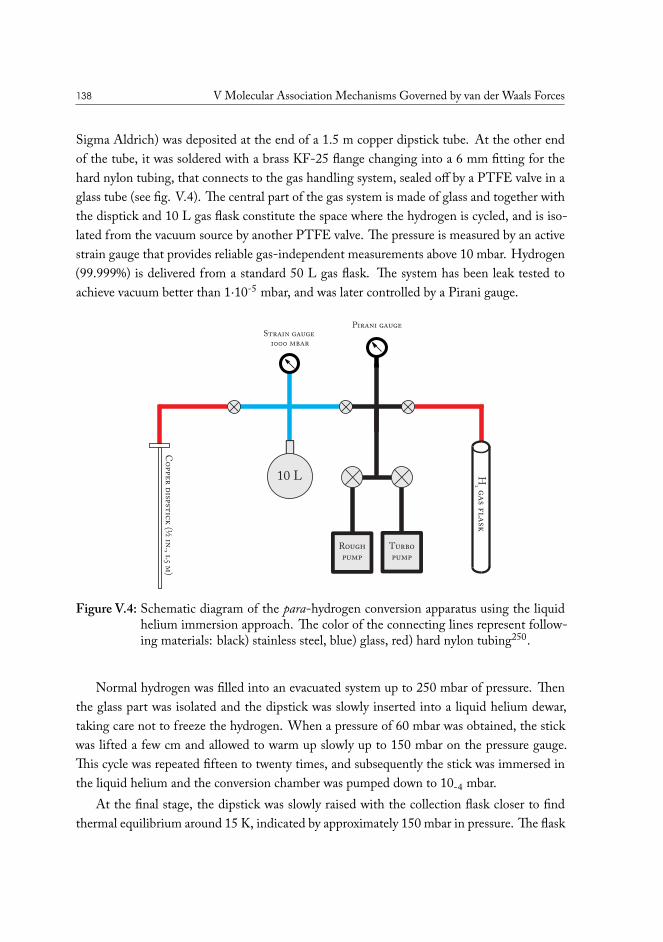
138 V Molecular Association Mechanisms Governed by van der Waals Forces
Sigma Aldrich) was deposited at the end of a 1.5 m copper dipstick tube. At the other endof the tube, it was soldered with a brass KF-25 flange changing into a 6 mm fitting for thehard nylon tubing, that connects to the gas handling system, sealed off by a PTFE valve in aglass tube (see fig. V.4). The central part of the gas system is made of glass and together withthe disptick and 10 L gas flask constitute the space where the hydrogen is cycled, and is iso-lated from the vacuum source by another PTFE valve. The pressure is measured by an activestrain gauge that provides reliable gas-independent measurements above 10 mbar. Hydrogen(99.999%) is delivered from a standard 50 L gas flask. The system has been leak tested toachieve vacuum better than 1⋅10-5 mbar, and was later controlled by a Pirani gauge.
10 L
Roughpump
Turbopump
H2 g
as fla
sk
Strain gauge 1000 mbar
Pirani gauge
Co
pper
dispst
ick
(½ in
., 1.5 m)
Figure V.4: Schematic diagram of the para-hydrogen conversion apparatus using the liquidhelium immersion approach. The color of the connecting lines represent follow-ing materials: black) stainless steel, blue) glass, red) hard nylon tubing250.
Normal hydrogen was filled into an evacuated system up to 250 mbar of pressure. Thenthe glass part was isolated and the dipstick was slowly inserted into a liquid helium dewar,taking care not to freeze the hydrogen. When a pressure of 60 mbar was obtained, the stickwas lifted a few cm and allowed to warm up slowly up to 150 mbar on the pressure gauge.This cycle was repeated fifteen to twenty times, and subsequently the stick was immersed inthe liquid helium and the conversion chamber was pumped down to 10-4 mbar.
At the final stage, the dipstick was slowly raised with the collection flask closer to findthermal equilibrium around 15 K, indicated by approximately 150 mbar in pressure. The flask
V.1 Method development: THz spectroscopy of weakly bound van der Waals complexes 139
was opened and the first 150 mbar of enriched para-hydrogen was collected. The proceduretakes around 2 hours and consumes 1-2 L of liquid helium. The cost factor and considerabletime involving manual operation of the setup led to a necessitated construction of a moreautomated setup. Considering that the concept allows a high degree of control over the qualityof conversion, it was decided to stay with small scale concept of Andrews, rather that optingfor a continuous flow design, such as published by Sundararajan243.
V.1.5 Closed-cycle cryocooler based preparation setup
This setup was based around a ARS DE-202 closed cycle cryostat coupled with a 4HWcompressor. This cold head operates on the principle of the Gifford-McMahon refrigerationcycle and achieves temperatures down to 10 K. The temperature can be controlled by a resis-tive heater attached around the cold head and the measurements are done with a Si-diode,operated by a Lake Shore 335 controller. Using this setup allows to automate many stages ofthe process by software-controlling the heaters and vacuum valves.
Let us first address the gas-handling system, as it has experienced less changes than otherparts. The vacuum source now is also shared with the cryostat insulating vacuum space viaan additional line and is sealed off by a KF-25 aluminium valve. Hydrogen is delivered via abrass 3-way ¼ in. valve, that is shared with a N2 line sourced from 5.0 grade gas supply, andis used for venting the system between the experiments, eliminating long evacuation timescaused by adsorbed water in the system.
The non-optical version of the cryostat was modified for the purpose of the experiment.Schematics of the custom designed parts can be found in the appendix A. In this design,hydrogen is condensed in a cylindrical copper vessel containing 5 g of the above mentionediron oxide catalyst. The vessel is equipped with a threaded stem on the bottom which is usedto connect it firmly to the cold head. The bottom of the vessel is fine-polished to improve thethermal contact, which is interfaced by a 0.1 mm thick indium foil sandwiched between thecold head and the vessel. On top of the vessel, a steel plate with a ½ inch tube was mountedto connect the assembly to the system outside of the vacuum shroud and provide thermalinsulation. The parts of the vessel are silver soldered together.
The solid radiation shield and the vacuum shroud included in the shipment have beenmodified to pass the tube through. A flexible stainless steel bellows with a KF-25 flangehave been welded on top of the vacuum shroud to allow for larger concentricity tolerance forthe tube weld. A custom made KF-25 to Swagelok ultra-torr type fitting was made for thevacuum feed-through of the vessel tube, and was mounted on top of the bellows. The adapterand the vessel were tested to achieve vacuum down to 3⋅10-7 mbar.
140 V Molecular Association Mechanisms Governed by van der Waals Forces
The vessel was connected to the gas-handling system via a 117 cm PTFE smooth coreSwagelok ½ in. hose, with ultra-torr adapter on the vessel side and a standard union, con-necting to a custom made adapter to the glass tubing, on the other. The type of core waschosen deliberately, to minimize the number of collisions of hydrogen molecules with thesteel surfaces at high temperature. In the final construction, the hydrogen only has to passthe insulating section of the vessel made in stainless steel, and the fittings connecting the hoseto the glass section of the setup, thus providing minimal back conversion due to collisions withthe surfaces, with a small trade-off of minor air permeation through the hose’s PTFE border.The latter has no tangible effect on the purity of the end product, as in the final step thecryostat is brought to its minimal temperature and all of the impurities are condensed.
The procedure is analogous to that of the immersion setup. The 10 L sample flask is opento the catalyst chamber and is filled with approximately 250 mbar of hydrogen gas. Fromthis point the process is largely controlled by the software. The compressor and the cold headare started at the chosen time and the valve to the cryostat’s vacuum space is closed. Anindependent program is monitoring and logging the temperature while also controlling thesetpoint of the Lake Shore temperature controller. The catalyst chamber is cooled down tostart condensing hydrogen over the catalyst. Once 60 mbar of vapor pressure is obtained, orequivalent to ~12.5 K reading on the temperature diode, the heater is enabled to slowly rampup to just about 15 K to gradually heat up the catalyst. Once 150 mbar of vapor pressureis reached, the heater is turned off until 40-50 mbar is observed. The software controls theheater remotely based on temperature reading, although exact values and cycle lengths wereempirically established based on the pressure readings, as a more reliable measure of catalysttemperature due to limited heat transfer between the cold finger and the catalyst particles.
The procedure can be set up the day before the experiment, so that the ~5 hour totalrun time would be completed without user involvement. After filling the hydrogen gas, theprocess is fully automated all the way up to the product collection. Unlike the manual method,this approach is rather consistent with the timings at each step, so it is more convenient in thescope of a matrix isolation experiment, as the setup can be prepared accordingly, minimizingdelay and ensuring the highest yield of p-H2.
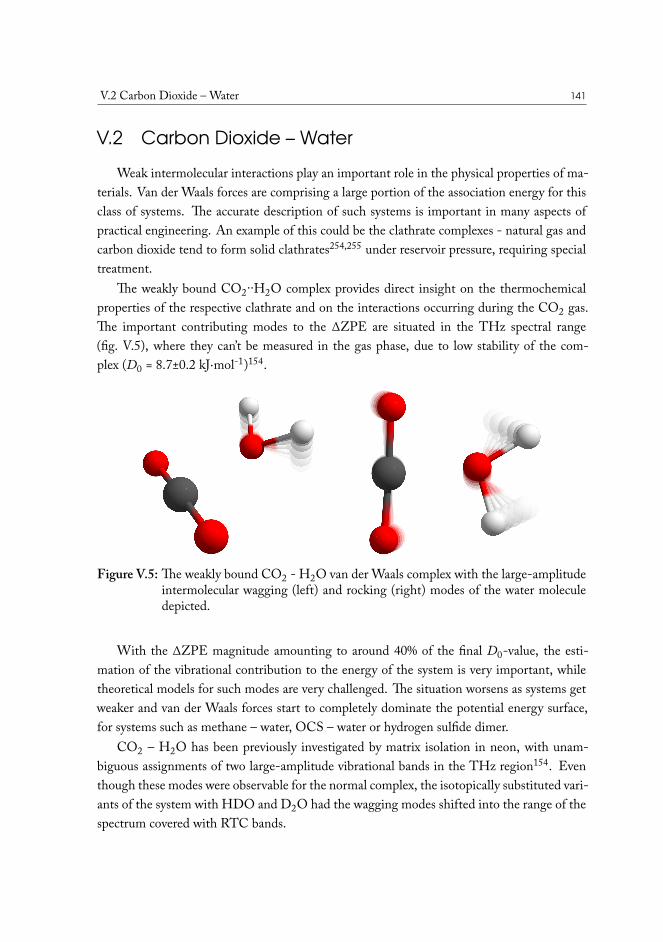
V.2 Carbon Dioxide – Water 141
V.2 Carbon Dioxide – WaterWeak intermolecular interactions play an important role in the physical properties of ma-
terials. Van der Waals forces are comprising a large portion of the association energy for thisclass of systems. The accurate description of such systems is important in many aspects ofpractical engineering. An example of this could be the clathrate complexes - natural gas andcarbon dioxide tend to form solid clathrates254,255 under reservoir pressure, requiring specialtreatment.
The weakly bound CO2··H2O complex provides direct insight on the thermochemicalproperties of the respective clathrate and on the interactions occurring during the CO2 gas.The important contributing modes to the ∆ZPE are situated in the THz spectral range(fig. V.5), where they can’t be measured in the gas phase, due to low stability of the com-plex (D0 = 8.7±0.2 kJ⋅mol-1)154.
Figure V.5: The weakly bound CO2 - H2O van der Waals complex with the large-amplitudeintermolecular wagging (left) and rocking (right) modes of the water moleculedepicted.
With the ∆ZPE magnitude amounting to around 40% of the final D0-value, the esti-mation of the vibrational contribution to the energy of the system is very important, whiletheoretical models for such modes are very challenged. The situation worsens as systems getweaker and van der Waals forces start to completely dominate the potential energy surface,for systems such as methane – water, OCS – water or hydrogen sulfide dimer.
CO2 – H2O has been previously investigated by matrix isolation in neon, with unam-biguous assignments of two large-amplitude vibrational bands in the THz region154. Eventhough these modes were observable for the normal complex, the isotopically substituted vari-ants of the system with HDO and D2O had the wagging modes shifted into the range of thespectrum covered with RTC bands.
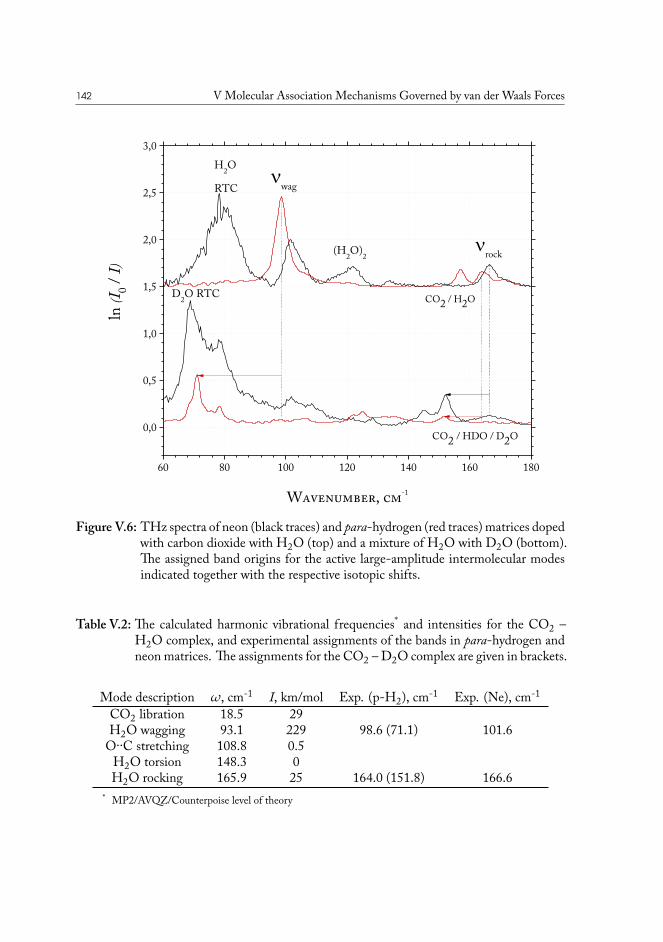
142 V Molecular Association Mechanisms Governed by van der Waals Forces
60 80 100 120 140 160 180
0,0
0,5
1,0
1,5
2,0
2,5
3,0
nrock
nwag
ln (I 0 /
I)
Wavenumber, cm-1
H2O
RTC
D2O RTC CO2 / H2O
CO2 / HDO / D2O
(H2O)2
Figure V.6: THz spectra of neon (black traces) and para-hydrogen (red traces) matrices dopedwith carbon dioxide with H2O (top) and a mixture of H2O with D2O (bottom).The assigned band origins for the active large-amplitude intermolecular modesindicated together with the respective isotopic shifts.
Table V.2: The calculated harmonic vibrational frequencies* and intensities for the CO2 –H2O complex, and experimental assignments of the bands in para-hydrogen andneon matrices. The assignments for the CO2 – D2O complex are given in brackets.
Mode description 𝜔, cm-1 I, km/mol Exp. (p-H2), cm-1 Exp. (Ne), cm-1
CO2 libration 18.5 29H2O wagging 93.1 229 98.6 (71.1) 101.6
O··C stretching 108.8 0.5H2O torsion 148.3 0H2O rocking 165.9 25 164.0 (151.8) 166.6
* MP2/AVQZ/Counterpoise level of theory

V.2 Carbon Dioxide – Water 143
To complement the previously obtained data, the measurements in the para-hydrogenenvironment have been made. For both assigned bands, slight red shifts are observed whencompared to neon. In both spectra, the RTC bands of water, previously observed in neon, arecompletely absent. In the case of deuterated water, this opens up the portion of the THz spec-tra where the corresponding wagging modes are situated at 71.0 and 78.6 cm-1 for D2O andHDO, respectively. To estimate accurate semi-experimental dissociation energy for the bi-nary complex, the CCSD(T)/ quality electronic dissociation energy in combination with thezero-point energy calculated from the experimental band origins together with the theoreti-cally predicted spectral shifts of the intramolecular modes and band origins of non-observedintermolecular vibrations. The results are presented in table V.7 at the end of this chapter.
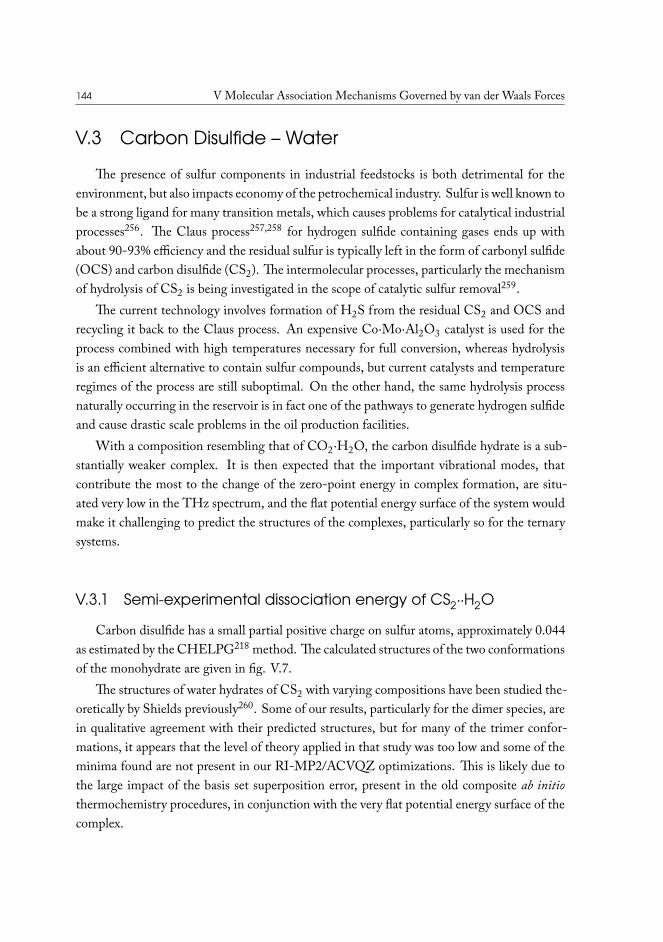
144 V Molecular Association Mechanisms Governed by van der Waals Forces
V.3 Carbon Disulfide – Water
The presence of sulfur components in industrial feedstocks is both detrimental for theenvironment, but also impacts economy of the petrochemical industry. Sulfur is well known tobe a strong ligand for many transition metals, which causes problems for catalytical industrialprocesses256. The Claus process257,258 for hydrogen sulfide containing gases ends up withabout 90-93% efficiency and the residual sulfur is typically left in the form of carbonyl sulfide(OCS) and carbon disulfide (CS2). The intermolecular processes, particularly the mechanismof hydrolysis of CS2 is being investigated in the scope of catalytic sulfur removal259.
The current technology involves formation of H2S from the residual CS2 and OCS andrecycling it back to the Claus process. An expensive Co⋅Mo⋅Al2O3 catalyst is used for theprocess combined with high temperatures necessary for full conversion, whereas hydrolysisis an efficient alternative to contain sulfur compounds, but current catalysts and temperatureregimes of the process are still suboptimal. On the other hand, the same hydrolysis processnaturally occurring in the reservoir is in fact one of the pathways to generate hydrogen sulfideand cause drastic scale problems in the oil production facilities.
With a composition resembling that of CO2⋅H2O, the carbon disulfide hydrate is a sub-stantially weaker complex. It is then expected that the important vibrational modes, thatcontribute the most to the change of the zero-point energy in complex formation, are situ-ated very low in the THz spectrum, and the flat potential energy surface of the system wouldmake it challenging to predict the structures of the complexes, particularly so for the ternarysystems.
V.3.1 Semi-experimental dissociation energy of CS2··H2O
Carbon disulfide has a small partial positive charge on sulfur atoms, approximately 0.044as estimated by the CHELPG218 method. The calculated structures of the two conformationsof the monohydrate are given in fig. V.7.
The structures of water hydrates of CS2 with varying compositions have been studied the-oretically by Shields previously260. Some of our results, particularly for the dimer species, arein qualitative agreement with their predicted structures, but for many of the trimer confor-mations, it appears that the level of theory applied in that study was too low and some of theminima found are not present in our RI-MP2/ACVQZ optimizations. This is likely due tothe large impact of the basis set superposition error, present in the old composite ab initiothermochemistry procedures, in conjunction with the very flat potential energy surface of thecomplex.
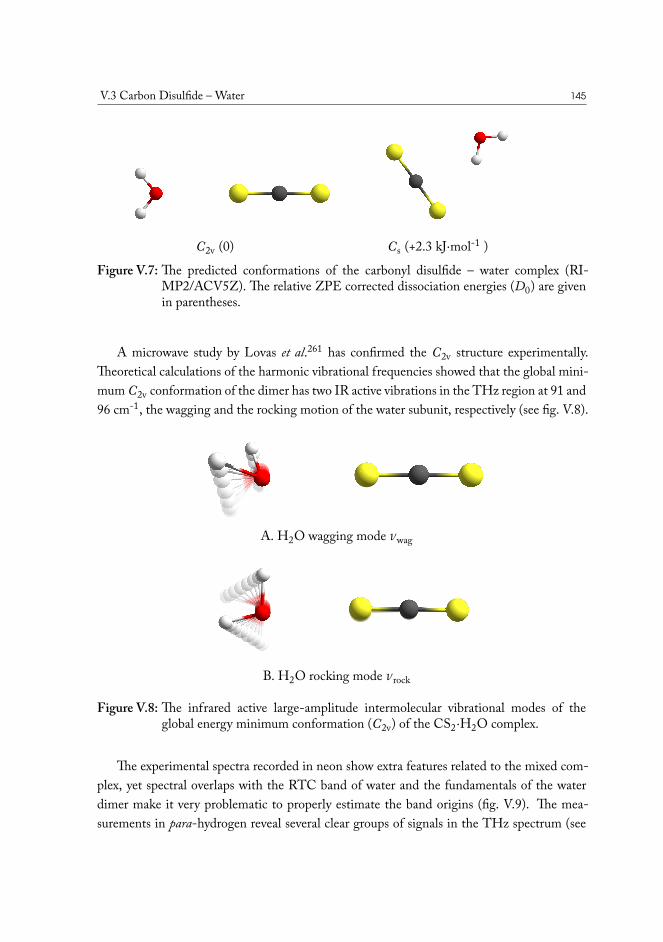
V.3 Carbon Disulfide – Water 145
C2v (0) Cs (+2.3 kJ⋅mol-1 )
Figure V.7: The predicted conformations of the carbonyl disulfide – water complex (RI-MP2/ACV5Z). The relative ZPE corrected dissociation energies (D0) are givenin parentheses.
A microwave study by Lovas et al.261 has confirmed the C2v structure experimentally.Theoretical calculations of the harmonic vibrational frequencies showed that the global mini-mum C2v conformation of the dimer has two IR active vibrations in the THz region at 91 and96 cm-1, the wagging and the rocking motion of the water subunit, respectively (see fig. V.8).
A. H2O wagging mode 𝜈wag
B. H2O rocking mode 𝜈rock
Figure V.8: The infrared active large-amplitude intermolecular vibrational modes of theglobal energy minimum conformation (C2v) of the CS2⋅H2O complex.
The experimental spectra recorded in neon show extra features related to the mixed com-plex, yet spectral overlaps with the RTC band of water and the fundamentals of the waterdimer make it very problematic to properly estimate the band origins (fig. V.9). The mea-surements in para-hydrogen reveal several clear groups of signals in the THz spectrum (see
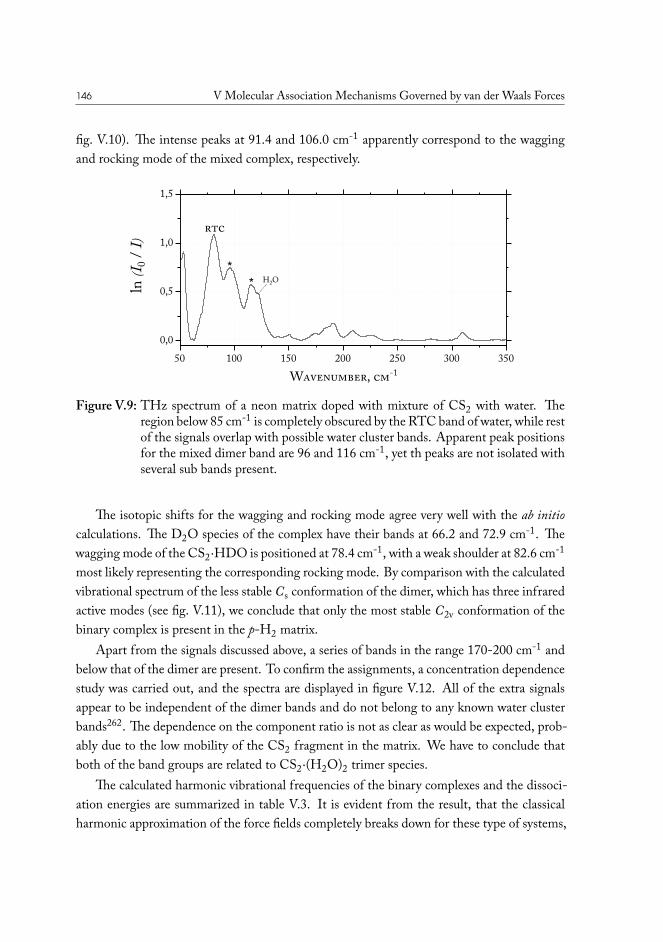
146 V Molecular Association Mechanisms Governed by van der Waals Forces
fig. V.10). The intense peaks at 91.4 and 106.0 cm-1 apparently correspond to the waggingand rocking mode of the mixed complex, respectively.
50 100 150 200 250 300 3500,0
0,5
1,0
1,5
*
Wavenumber, cm-1
ln (I 0
/ I)
rtc
* H2O
Figure V.9: THz spectrum of a neon matrix doped with mixture of CS2 with water. Theregion below 85 cm-1 is completely obscured by the RTC band of water, while restof the signals overlap with possible water cluster bands. Apparent peak positionsfor the mixed dimer band are 96 and 116 cm-1, yet th peaks are not isolated withseveral sub bands present.
The isotopic shifts for the wagging and rocking mode agree very well with the ab initiocalculations. The D2O species of the complex have their bands at 66.2 and 72.9 cm-1. Thewagging mode of the CS2⋅HDO is positioned at 78.4 cm-1, with a weak shoulder at 82.6 cm-1
most likely representing the corresponding rocking mode. By comparison with the calculatedvibrational spectrum of the less stable Cs conformation of the dimer, which has three infraredactive modes (see fig. V.11), we conclude that only the most stable C2v conformation of thebinary complex is present in the p-H2 matrix.
Apart from the signals discussed above, a series of bands in the range 170-200 cm-1 andbelow that of the dimer are present. To confirm the assignments, a concentration dependencestudy was carried out, and the spectra are displayed in figure V.12. All of the extra signalsappear to be independent of the dimer bands and do not belong to any known water clusterbands262. The dependence on the component ratio is not as clear as would be expected, prob-ably due to the low mobility of the CS2 fragment in the matrix. We have to conclude thatboth of the band groups are related to CS2⋅(H2O)2 trimer species.
The calculated harmonic vibrational frequencies of the binary complexes and the dissoci-ation energies are summarized in table V.3. It is evident from the result, that the classicalharmonic approximation of the force fields completely breaks down for these type of systems,
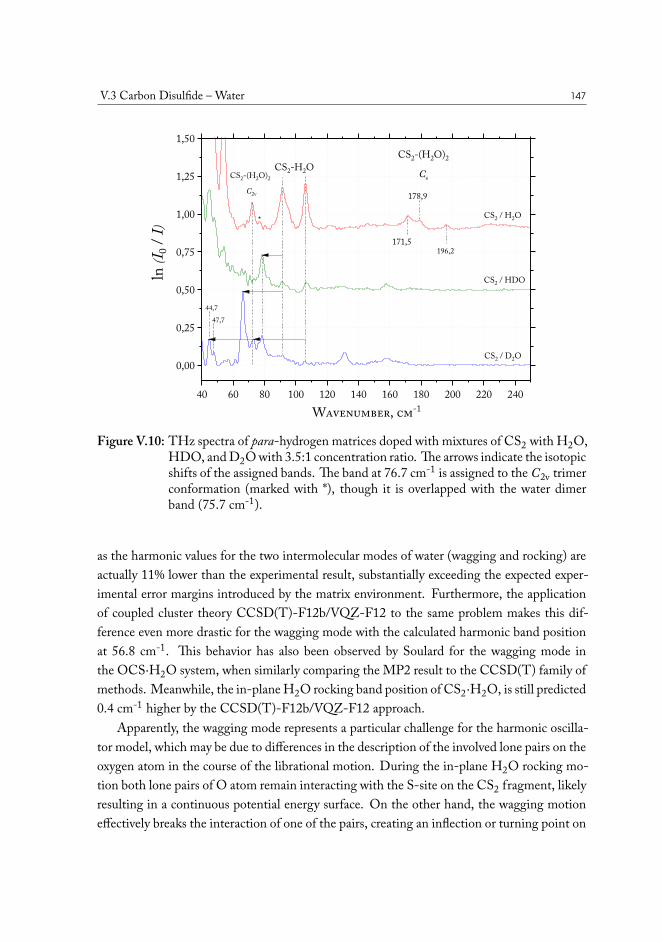
V.3 Carbon Disulfide – Water 147
40 60 80 100 120 140 160 180 200 220 240
0,00
0,25
0,50
0,75
1,00
1,25
1,50
44,7
196,2
CS2-H2OCS2-(H2O)2 C2v
CS2 / D2O
CS2 / HDO
CS2 / H2O
Wavenumber, cm-1
ln (I 0
/ I)
CS2-(H2O)2
Cs
171,5
178,9
47,7
*
Figure V.10: THz spectra of para-hydrogen matrices doped with mixtures of CS2 with H2O,HDO, and D2O with 3.5:1 concentration ratio. The arrows indicate the isotopicshifts of the assigned bands. The band at 76.7 cm-1 is assigned to the C2v trimerconformation (marked with *), though it is overlapped with the water dimerband (75.7 cm-1).
as the harmonic values for the two intermolecular modes of water (wagging and rocking) areactually 11% lower than the experimental result, substantially exceeding the expected exper-imental error margins introduced by the matrix environment. Furthermore, the applicationof coupled cluster theory CCSD(T)-F12b/VQZ-F12 to the same problem makes this dif-ference even more drastic for the wagging mode with the calculated harmonic band positionat 56.8 cm-1. This behavior has also been observed by Soulard for the wagging mode inthe OCS⋅H2O system, when similarly comparing the MP2 result to the CCSD(T) family ofmethods. Meanwhile, the in-plane H2O rocking band position of CS2⋅H2O, is still predicted0.4 cm-1 higher by the CCSD(T)-F12b/VQZ-F12 approach.
Apparently, the wagging mode represents a particular challenge for the harmonic oscilla-tor model, which may be due to differences in the description of the involved lone pairs on theoxygen atom in the course of the librational motion. During the in-plane H2O rocking mo-tion both lone pairs of O atom remain interacting with the S-site on the CS2 fragment, likelyresulting in a continuous potential energy surface. On the other hand, the wagging motioneffectively breaks the interaction of one of the pairs, creating an inflection or turning point on
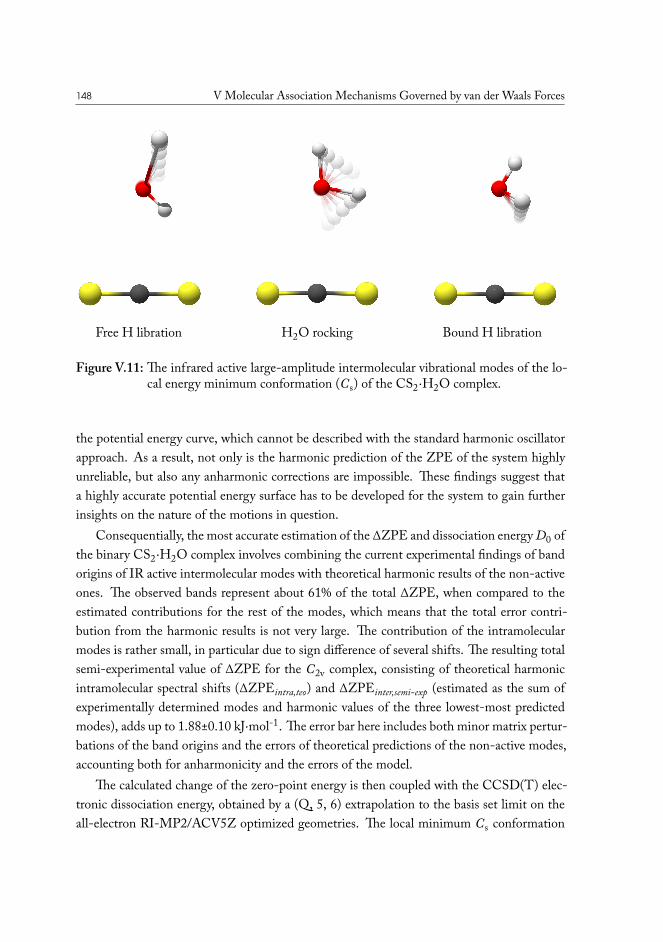
148 V Molecular Association Mechanisms Governed by van der Waals Forces
Free H libration H2O rocking Bound H libration
Figure V.11: The infrared active large-amplitude intermolecular vibrational modes of the lo-cal energy minimum conformation (Cs) of the CS2⋅H2O complex.
the potential energy curve, which cannot be described with the standard harmonic oscillatorapproach. As a result, not only is the harmonic prediction of the ZPE of the system highlyunreliable, but also any anharmonic corrections are impossible. These findings suggest thata highly accurate potential energy surface has to be developed for the system to gain furtherinsights on the nature of the motions in question.
Consequentially, the most accurate estimation of the ∆ZPE and dissociation energy D0 ofthe binary CS2⋅H2O complex involves combining the current experimental findings of bandorigins of IR active intermolecular modes with theoretical harmonic results of the non-activeones. The observed bands represent about 61% of the total ∆ZPE, when compared to theestimated contributions for the rest of the modes, which means that the total error contri-bution from the harmonic results is not very large. The contribution of the intramolecularmodes is rather small, in particular due to sign difference of several shifts. The resulting totalsemi-experimental value of ∆ZPE for the C2v complex, consisting of theoretical harmonicintramolecular spectral shifts (∆ZPEintra,teo) and ∆ZPEinter,semi-exp (estimated as the sum ofexperimentally determined modes and harmonic values of the three lowest-most predictedmodes), adds up to 1.88±0.10 kJ⋅mol-1. The error bar here includes both minor matrix pertur-bations of the band origins and the errors of theoretical predictions of the non-active modes,accounting both for anharmonicity and the errors of the model.
The calculated change of the zero-point energy is then coupled with the CCSD(T) elec-tronic dissociation energy, obtained by a (Q, 5, 6) extrapolation to the basis set limit on theall-electron RI-MP2/ACV5Z optimized geometries. The local minimum Cs conformation
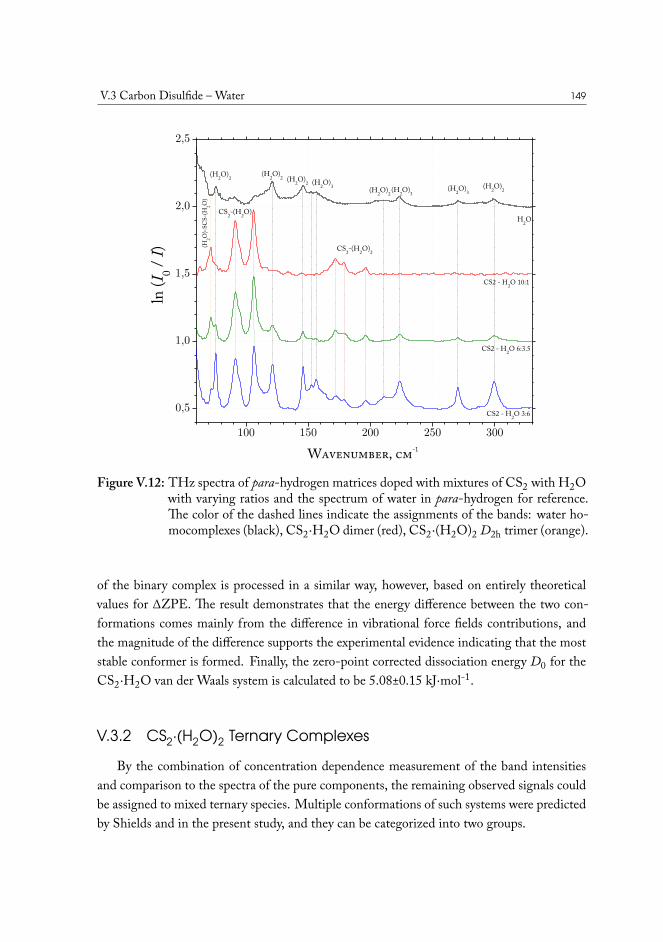
V.3 Carbon Disulfide – Water 149
300250200150100
0,5
1,0
1,5
2,0
2,5
(H2O)
-SCS
-(H2O)
CS2-(H2O)2
(H2O)3
CS2-(H2O)
(H2O)3(H2O)3
(H2O)2(H2O)2(H2O)2
(H2O)2
H2O
Wavenumber, cm-1
(H2O)2
CS2 - H2O 3:6
CS2 - H2O 6:3.5
CS2 - H2O 10:1
ln (I 0 / I
)
Figure V.12: THz spectra of para-hydrogen matrices doped with mixtures of CS2 with H2Owith varying ratios and the spectrum of water in para-hydrogen for reference.The color of the dashed lines indicate the assignments of the bands: water ho-mocomplexes (black), CS2⋅H2O dimer (red), CS2⋅(H2O)2 D2h trimer (orange).
of the binary complex is processed in a similar way, however, based on entirely theoreticalvalues for ∆ZPE. The result demonstrates that the energy difference between the two con-formations comes mainly from the difference in vibrational force fields contributions, andthe magnitude of the difference supports the experimental evidence indicating that the moststable conformer is formed. Finally, the zero-point corrected dissociation energy D0 for theCS2⋅H2O van der Waals system is calculated to be 5.08±0.15 kJ⋅mol-1.
V.3.2 CS2·(H2O)2 Ternary Complexes
By the combination of concentration dependence measurement of the band intensitiesand comparison to the spectra of the pure components, the remaining observed signals couldbe assigned to mixed ternary species. Multiple conformations of such systems were predictedby Shields and in the present study, and they can be categorized into two groups.
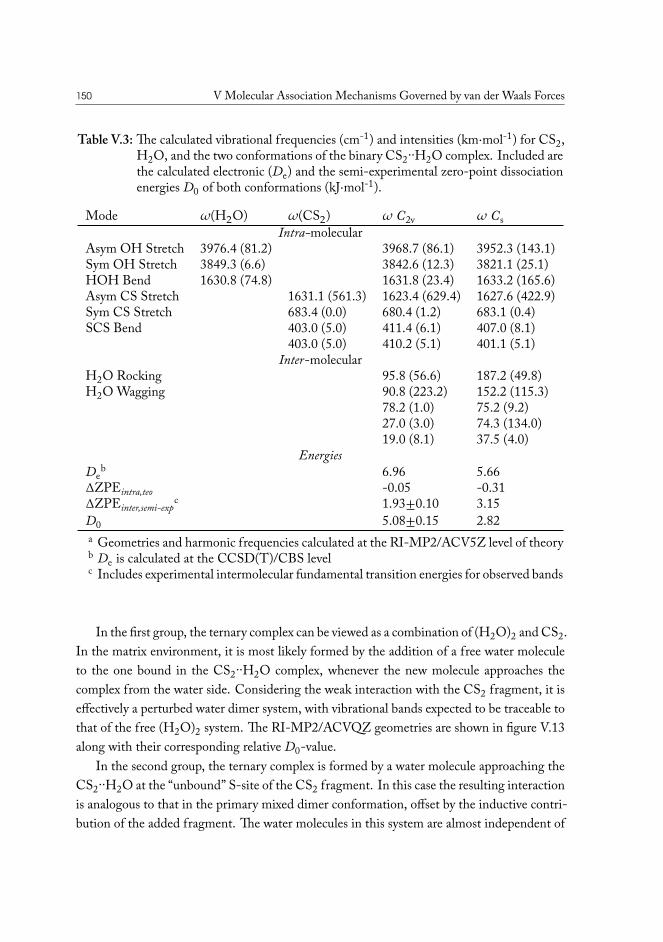
150 V Molecular Association Mechanisms Governed by van der Waals Forces
Table V.3: The calculated vibrational frequencies (cm-1) and intensities (km⋅mol-1) for CS2,H2O, and the two conformations of the binary CS2··H2O complex. Included arethe calculated electronic (De) and the semi-experimental zero-point dissociationenergies D0 of both conformations (kJ⋅mol-1).
Mode 𝜔(H2O) 𝜔(CS2) 𝜔 C2v 𝜔 CsIntra-molecular
Asym OH Stretch 3976.4 (81.2) 3968.7 (86.1) 3952.3 (143.1)Sym OH Stretch 3849.3 (6.6) 3842.6 (12.3) 3821.1 (25.1)HOH Bend 1630.8 (74.8) 1631.8 (23.4) 1633.2 (165.6)Asym CS Stretch 1631.1 (561.3) 1623.4 (629.4) 1627.6 (422.9)Sym CS Stretch 683.4 (0.0) 680.4 (1.2) 683.1 (0.4)SCS Bend 403.0 (5.0) 411.4 (6.1) 407.0 (8.1)
403.0 (5.0) 410.2 (5.1) 401.1 (5.1)Inter-molecular
H2O Rocking 95.8 (56.6) 187.2 (49.8)H2O Wagging 90.8 (223.2) 152.2 (115.3)
78.2 (1.0) 75.2 (9.2)27.0 (3.0) 74.3 (134.0)19.0 (8.1) 37.5 (4.0)
EnergiesDe
b 6.96 5.66∆ZPEintra,teo -0.05 -0.31∆ZPEinter,semi-exp
c 1.93±0.10 3.15D0 5.08±0.15 2.82a Geometries and harmonic frequencies calculated at the RI-MP2/ACV5Z level of theoryb De is calculated at the CCSD(T)/CBS levelc Includes experimental intermolecular fundamental transition energies for observed bands
In the first group, the ternary complex can be viewed as a combination of (H2O)2 and CS2.In the matrix environment, it is most likely formed by the addition of a free water moleculeto the one bound in the CS2··H2O complex, whenever the new molecule approaches thecomplex from the water side. Considering the weak interaction with the CS2 fragment, it iseffectively a perturbed water dimer system, with vibrational bands expected to be traceable tothat of the free (H2O)2 system. The RI-MP2/ACVQZ geometries are shown in figure V.13along with their corresponding relative D0-value.
In the second group, the ternary complex is formed by a water molecule approaching theCS2··H2O at the “unbound” S-site of the CS2 fragment. In this case the resulting interactionis analogous to that in the primary mixed dimer conformation, offset by the inductive contri-bution of the added fragment. The water molecules in this system are almost independent of
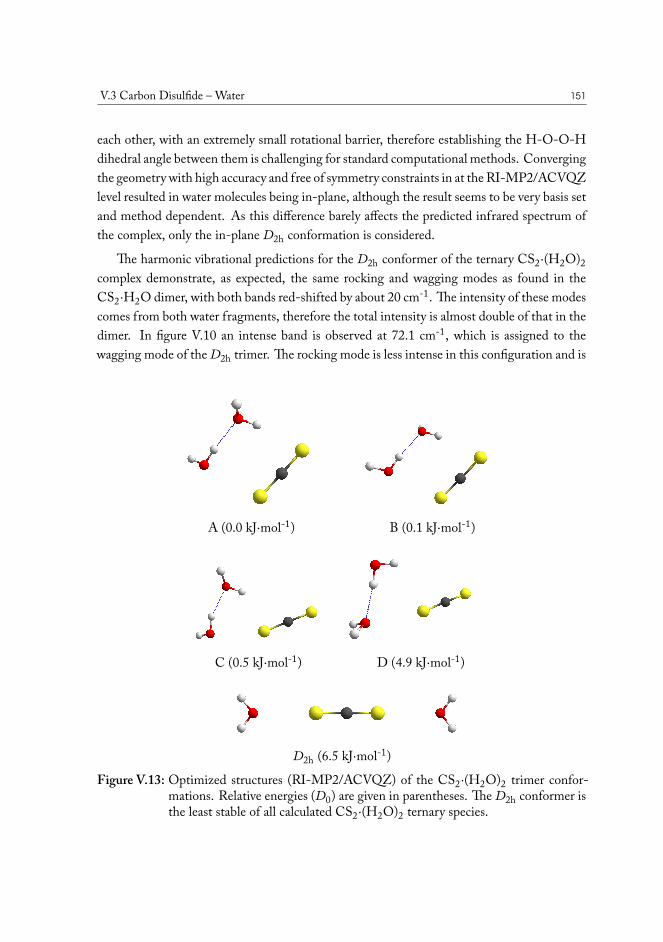
V.3 Carbon Disulfide – Water 151
each other, with an extremely small rotational barrier, therefore establishing the H-O-O-Hdihedral angle between them is challenging for standard computational methods. Convergingthe geometry with high accuracy and free of symmetry constraints in at the RI-MP2/ACVQZlevel resulted in water molecules being in-plane, although the result seems to be very basis setand method dependent. As this difference barely affects the predicted infrared spectrum ofthe complex, only the in-plane D2h conformation is considered.
The harmonic vibrational predictions for the D2h conformer of the ternary CS2⋅(H2O)2complex demonstrate, as expected, the same rocking and wagging modes as found in theCS2⋅H2O dimer, with both bands red-shifted by about 20 cm-1. The intensity of these modescomes from both water fragments, therefore the total intensity is almost double of that in thedimer. In figure V.10 an intense band is observed at 72.1 cm-1, which is assigned to thewagging mode of the D2h trimer. The rocking mode is less intense in this configuration and is
A (0.0 kJ⋅mol-1) B (0.1 kJ⋅mol-1)
C (0.5 kJ⋅mol-1) D (4.9 kJ⋅mol-1)
D2h (6.5 kJ⋅mol-1)
Figure V.13: Optimized structures (RI-MP2/ACVQZ) of the CS2⋅(H2O)2 trimer confor-mations. Relative energies (D0) are given in parentheses. The D2h conformer isthe least stable of all calculated CS2⋅(H2O)2 ternary species.
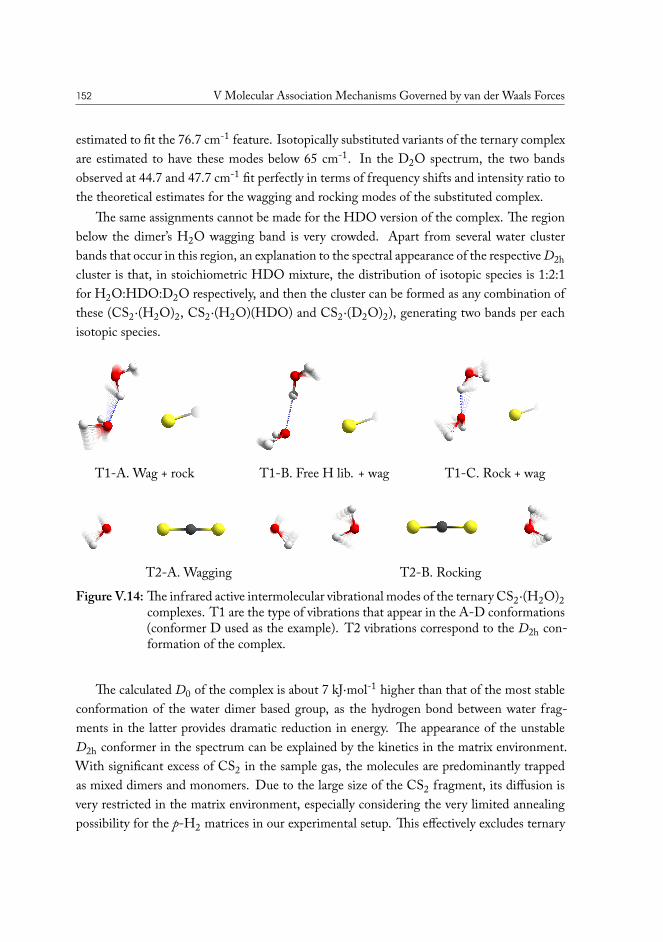
152 V Molecular Association Mechanisms Governed by van der Waals Forces
estimated to fit the 76.7 cm-1 feature. Isotopically substituted variants of the ternary complexare estimated to have these modes below 65 cm-1. In the D2O spectrum, the two bandsobserved at 44.7 and 47.7 cm-1 fit perfectly in terms of frequency shifts and intensity ratio tothe theoretical estimates for the wagging and rocking modes of the substituted complex.
The same assignments cannot be made for the HDO version of the complex. The regionbelow the dimer’s H2O wagging band is very crowded. Apart from several water clusterbands that occur in this region, an explanation to the spectral appearance of the respective D2hcluster is that, in stoichiometric HDO mixture, the distribution of isotopic species is 1:2:1for H2O:HDO:D2O respectively, and then the cluster can be formed as any combination ofthese (CS2⋅(H2O)2, CS2⋅(H2O)(HDO) and CS2⋅(D2O)2), generating two bands per eachisotopic species.
T1-A. Wag + rock T1-B. Free H lib. + wag T1-C. Rock + wag
T2-A. Wagging T2-B. Rocking
Figure V.14: The infrared active intermolecular vibrational modes of the ternary CS2⋅(H2O)2complexes. T1 are the type of vibrations that appear in the A-D conformations(conformer D used as the example). T2 vibrations correspond to the D2h con-formation of the complex.
The calculated D0 of the complex is about 7 kJ⋅mol-1 higher than that of the most stableconformation of the water dimer based group, as the hydrogen bond between water frag-ments in the latter provides dramatic reduction in energy. The appearance of the unstableD2h conformer in the spectrum can be explained by the kinetics in the matrix environment.With significant excess of CS2 in the sample gas, the molecules are predominantly trappedas mixed dimers and monomers. Due to the large size of the CS2 fragment, its diffusion isvery restricted in the matrix environment, especially considering the very limited annealingpossibility for the p-H2 matrices in our experimental setup. This effectively excludes ternary
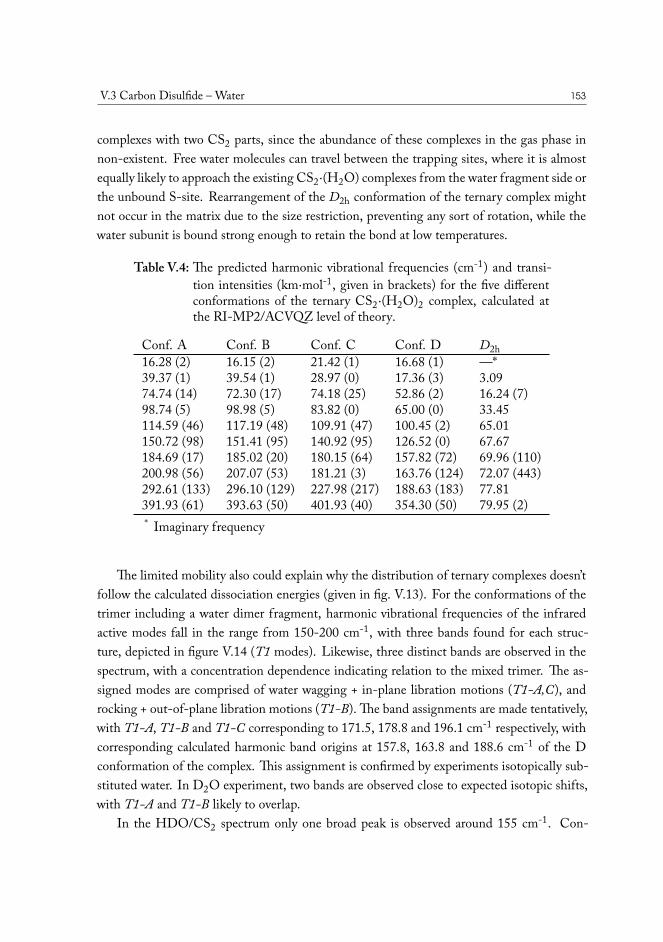
V.3 Carbon Disulfide – Water 153
complexes with two CS2 parts, since the abundance of these complexes in the gas phase innon-existent. Free water molecules can travel between the trapping sites, where it is almostequally likely to approach the existing CS2⋅(H2O) complexes from the water fragment side orthe unbound S-site. Rearrangement of the D2h conformation of the ternary complex mightnot occur in the matrix due to the size restriction, preventing any sort of rotation, while thewater subunit is bound strong enough to retain the bond at low temperatures.
Table V.4: The predicted harmonic vibrational frequencies (cm-1) and transi-tion intensities (km⋅mol-1, given in brackets) for the five differentconformations of the ternary CS2⋅(H2O)2 complex, calculated atthe RI-MP2/ACVQZ level of theory.
Conf. A Conf. B Conf. C Conf. D D2h16.28 (2) 16.15 (2) 21.42 (1) 16.68 (1) —*39.37 (1) 39.54 (1) 28.97 (0) 17.36 (3) 3.0974.74 (14) 72.30 (17) 74.18 (25) 52.86 (2) 16.24 (7)98.74 (5) 98.98 (5) 83.82 (0) 65.00 (0) 33.45114.59 (46) 117.19 (48) 109.91 (47) 100.45 (2) 65.01150.72 (98) 151.41 (95) 140.92 (95) 126.52 (0) 67.67184.69 (17) 185.02 (20) 180.15 (64) 157.82 (72) 69.96 (110)200.98 (56) 207.07 (53) 181.21 (3) 163.76 (124) 72.07 (443)292.61 (133) 296.10 (129) 227.98 (217) 188.63 (183) 77.81391.93 (61) 393.63 (50) 401.93 (40) 354.30 (50) 79.95 (2)* Imaginary frequency
The limited mobility also could explain why the distribution of ternary complexes doesn’tfollow the calculated dissociation energies (given in fig. V.13). For the conformations of thetrimer including a water dimer fragment, harmonic vibrational frequencies of the infraredactive modes fall in the range from 150-200 cm-1, with three bands found for each struc-ture, depicted in figure V.14 (T1 modes). Likewise, three distinct bands are observed in thespectrum, with a concentration dependence indicating relation to the mixed trimer. The as-signed modes are comprised of water wagging + in-plane libration motions (T1-A,C), androcking + out-of-plane libration motions (T1-B). The band assignments are made tentatively,with T1-A, T1-B and T1-C corresponding to 171.5, 178.8 and 196.1 cm-1 respectively, withcorresponding calculated harmonic band origins at 157.8, 163.8 and 188.6 cm-1 of the Dconformation of the complex. This assignment is confirmed by experiments isotopically sub-stituted water. In D2O experiment, two bands are observed close to expected isotopic shifts,with T1-A and T1-B likely to overlap.
In the HDO/CS2 spectrum only one broad peak is observed around 155 cm-1. Con-

154 V Molecular Association Mechanisms Governed by van der Waals Forces
sidering the distribution of species having isotopic combinations in the mixture of HDO as1:2:1 and the estimated intensities, it can be concluded that the observed band is an overlapbetween T1-A and T1-B of the HDO species and T1-C of the D2O species, accumulatingenough intensity to be detectable in the spectrum.
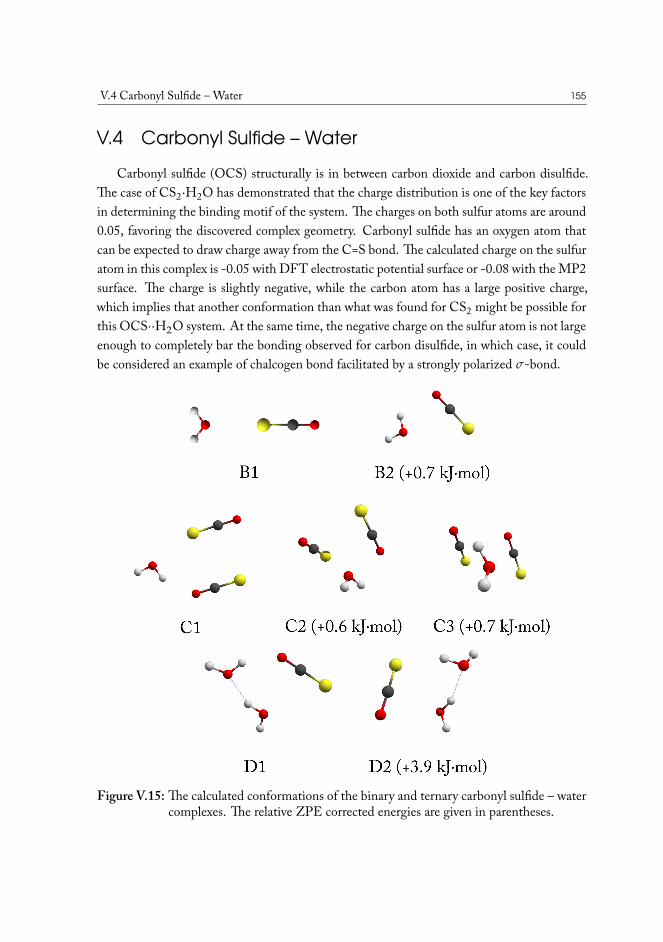
V.4 Carbonyl Sulfide – Water 155
V.4 Carbonyl Sulfide – WaterCarbonyl sulfide (OCS) structurally is in between carbon dioxide and carbon disulfide.
The case of CS2⋅H2O has demonstrated that the charge distribution is one of the key factorsin determining the binding motif of the system. The charges on both sulfur atoms are around0.05, favoring the discovered complex geometry. Carbonyl sulfide has an oxygen atom thatcan be expected to draw charge away from the C=S bond. The calculated charge on the sulfuratom in this complex is -0.05 with DFT electrostatic potential surface or -0.08 with the MP2surface. The charge is slightly negative, while the carbon atom has a large positive charge,which implies that another conformation than what was found for CS2 might be possible forthis OCS⋅⋅H2O system. At the same time, the negative charge on the sulfur atom is not largeenough to completely bar the bonding observed for carbon disulfide, in which case, it couldbe considered an example of chalcogen bond facilitated by a strongly polarized 𝜎-bond.
Figure V.15: The calculated conformations of the binary and ternary carbonyl sulfide – watercomplexes. The relative ZPE corrected energies are given in parentheses.
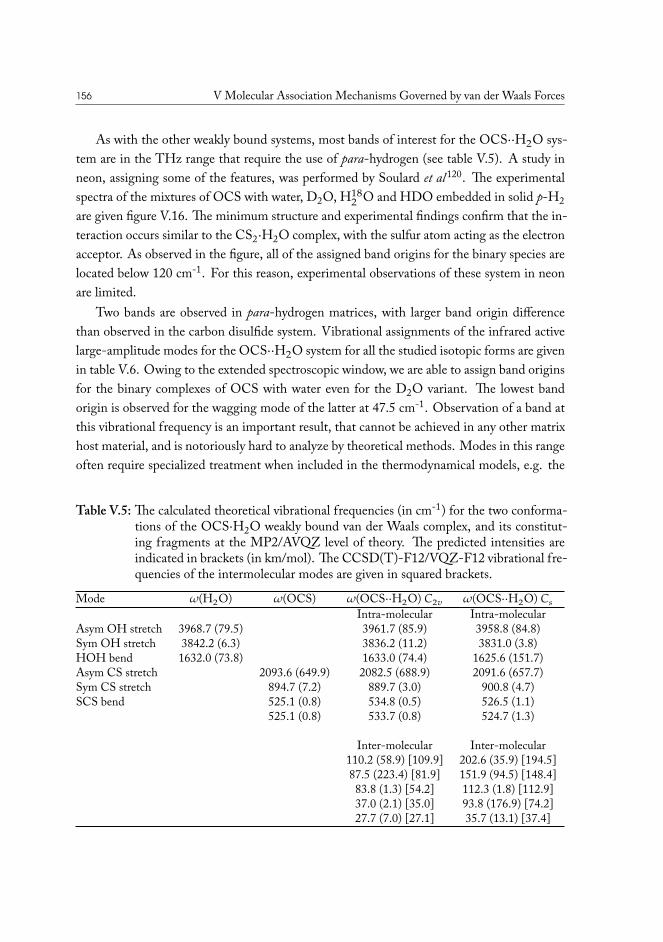
156 V Molecular Association Mechanisms Governed by van der Waals Forces
As with the other weakly bound systems, most bands of interest for the OCS⋅⋅H2O sys-tem are in the THz range that require the use of para-hydrogen (see table V.5). A study inneon, assigning some of the features, was performed by Soulard et al120. The experimentalspectra of the mixtures of OCS with water, D2O, H18
2 O and HDO embedded in solid p-H2are given figure V.16. The minimum structure and experimental findings confirm that the in-teraction occurs similar to the CS2⋅H2O complex, with the sulfur atom acting as the electronacceptor. As observed in the figure, all of the assigned band origins for the binary species arelocated below 120 cm-1. For this reason, experimental observations of these system in neonare limited.
Two bands are observed in para-hydrogen matrices, with larger band origin differencethan observed in the carbon disulfide system. Vibrational assignments of the infrared activelarge-amplitude modes for the OCS⋅⋅H2O system for all the studied isotopic forms are givenin table V.6. Owing to the extended spectroscopic window, we are able to assign band originsfor the binary complexes of OCS with water even for the D2O variant. The lowest bandorigin is observed for the wagging mode of the latter at 47.5 cm-1. Observation of a band atthis vibrational frequency is an important result, that cannot be achieved in any other matrixhost material, and is notoriously hard to analyze by theoretical methods. Modes in this rangeoften require specialized treatment when included in the thermodynamical models, e.g. the
Table V.5: The calculated theoretical vibrational frequencies (in cm-1) for the two conforma-tions of the OCS⋅H2O weakly bound van der Waals complex, and its constitut-ing fragments at the MP2/AVQZ level of theory. The predicted intensities areindicated in brackets (in km/mol). The CCSD(T)-F12/VQZ-F12 vibrational fre-quencies of the intermolecular modes are given in squared brackets.
Mode 𝜔(H2O) 𝜔(OCS) 𝜔(OCS⋅⋅H2O) 𝐶2𝑣 𝜔(OCS⋅⋅H2O) 𝐶𝑠Intra-molecular Intra-molecular
Asym OH stretch 3968.7 (79.5) 3961.7 (85.9) 3958.8 (84.8)Sym OH stretch 3842.2 (6.3) 3836.2 (11.2) 3831.0 (3.8)HOH bend 1632.0 (73.8) 1633.0 (74.4) 1625.6 (151.7)Asym CS stretch 2093.6 (649.9) 2082.5 (688.9) 2091.6 (657.7)Sym CS stretch 894.7 (7.2) 889.7 (3.0) 900.8 (4.7)SCS bend 525.1 (0.8) 534.8 (0.5) 526.5 (1.1)
525.1 (0.8) 533.7 (0.8) 524.7 (1.3)
Inter-molecular Inter-molecular110.2 (58.9) [109.9] 202.6 (35.9) [194.5]87.5 (223.4) [81.9] 151.9 (94.5) [148.4]83.8 (1.3) [54.2] 112.3 (1.8) [112.9]37.0 (2.1) [35.0] 93.8 (176.9) [74.2]27.7 (7.0) [27.1] 35.7 (13.1) [37.4]
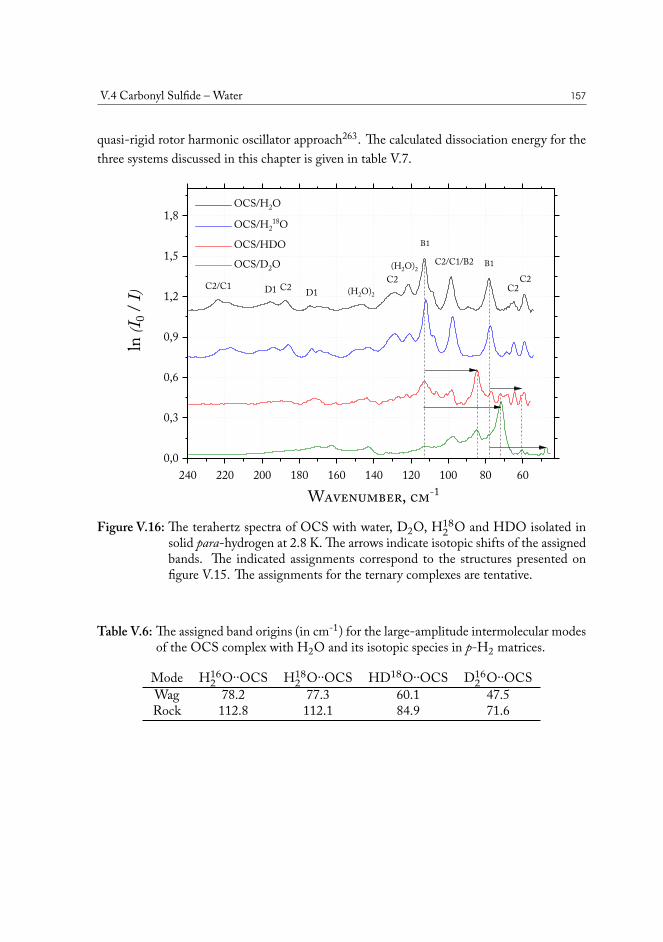
V.4 Carbonyl Sulfide – Water 157
quasi-rigid rotor harmonic oscillator approach263. The calculated dissociation energy for thethree systems discussed in this chapter is given in table V.7.
240 220 200 180 160 140 120 100 80 600,0
0,3
0,6
0,9
1,2
1,5
1,8 OCS/H2O OCS/H2
18O OCS/HDO OCS/D2O
C2
C2/C1/B2B1
C2D1 (H2O)2
C2D1C2/C1
Wavenumber, cm-1
ln (I 0
/ I)
(H2O)2C2
B1
Figure V.16: The terahertz spectra of OCS with water, D2O, H182 O and HDO isolated in
solid para-hydrogen at 2.8 K. The arrows indicate isotopic shifts of the assignedbands. The indicated assignments correspond to the structures presented onfigure V.15. The assignments for the ternary complexes are tentative.
Table V.6: The assigned band origins (in cm-1) for the large-amplitude intermolecular modesof the OCS complex with H2O and its isotopic species in p-H2 matrices.
Mode H162 O··OCS H18
2 O··OCS HD18O··OCS D162 O··OCS
Wag 78.2 77.3 60.1 47.5Rock 112.8 112.1 84.9 71.6
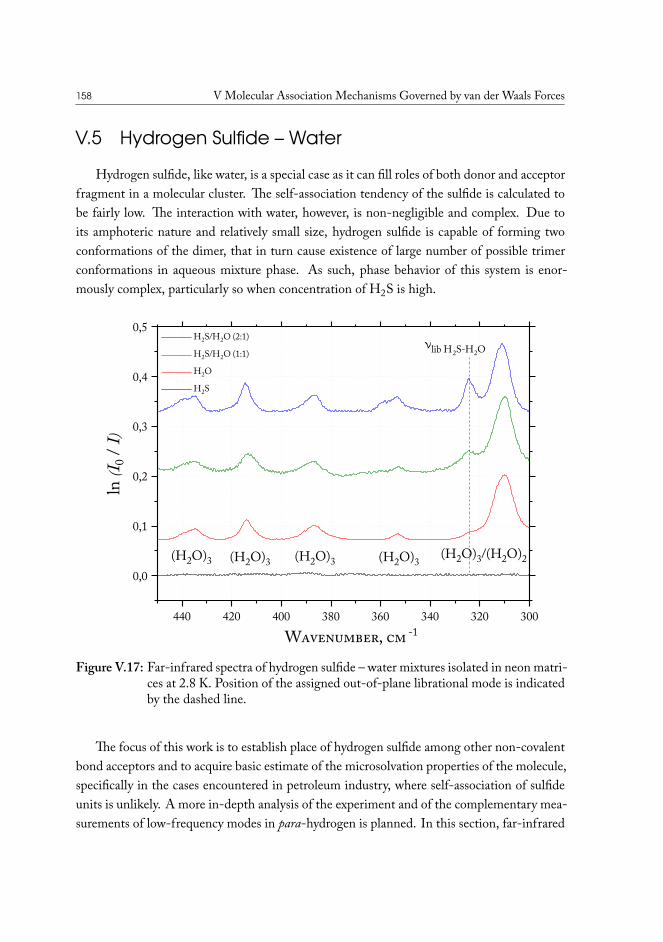
158 V Molecular Association Mechanisms Governed by van der Waals Forces
V.5 Hydrogen Sulfide – Water
Hydrogen sulfide, like water, is a special case as it can fill roles of both donor and acceptorfragment in a molecular cluster. The self-association tendency of the sulfide is calculated tobe fairly low. The interaction with water, however, is non-negligible and complex. Due toits amphoteric nature and relatively small size, hydrogen sulfide is capable of forming twoconformations of the dimer, that in turn cause existence of large number of possible trimerconformations in aqueous mixture phase. As such, phase behavior of this system is enor-mously complex, particularly so when concentration of H2S is high.
440 420 400 380 360 340 320 300
0,0
0,1
0,2
0,3
0,4
0,5
H2S/H2O (2:1) H2S/H2O (1:1) H2O H2S
lib H2S-H2O
Wavenumber, cm -1
ln (I 0
/ I)
(H2O)3/(H2O)2(H2O)3(H2O)3(H2O)3(H2O)3
Figure V.17: Far-infrared spectra of hydrogen sulfide – water mixtures isolated in neon matri-ces at 2.8 K. Position of the assigned out-of-plane librational mode is indicatedby the dashed line.
The focus of this work is to establish place of hydrogen sulfide among other non-covalentbond acceptors and to acquire basic estimate of the microsolvation properties of the molecule,specifically in the cases encountered in petroleum industry, where self-association of sulfideunits is unlikely. A more in-depth analysis of the experiment and of the complementary mea-surements of low-frequency modes in para-hydrogen is planned. In this section, far-infrared
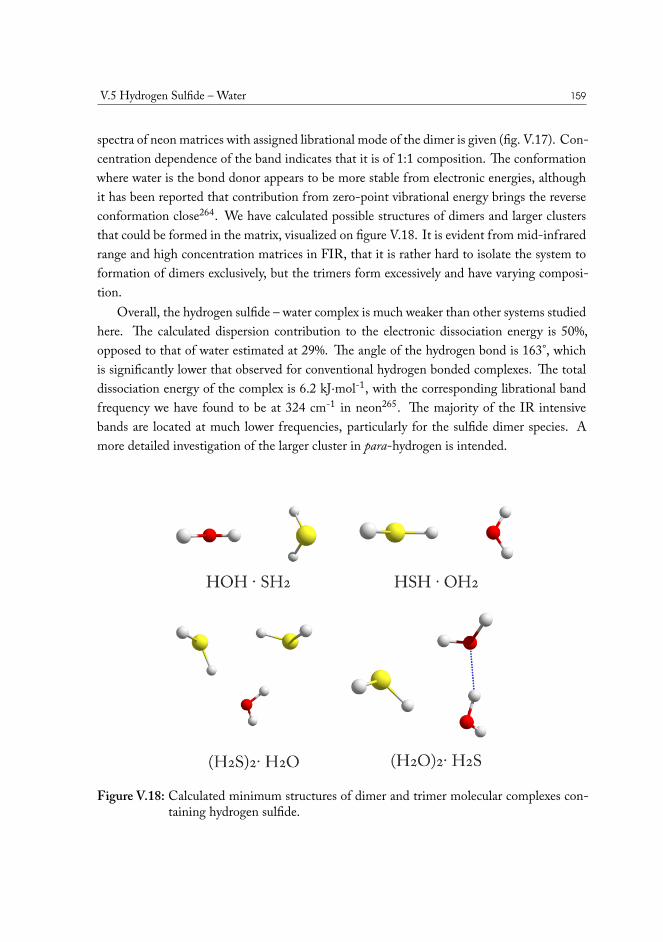
V.5 Hydrogen Sulfide – Water 159
spectra of neon matrices with assigned librational mode of the dimer is given (fig. V.17). Con-centration dependence of the band indicates that it is of 1:1 composition. The conformationwhere water is the bond donor appears to be more stable from electronic energies, althoughit has been reported that contribution from zero-point vibrational energy brings the reverseconformation close264. We have calculated possible structures of dimers and larger clustersthat could be formed in the matrix, visualized on figure V.18. It is evident from mid-infraredrange and high concentration matrices in FIR, that it is rather hard to isolate the system toformation of dimers exclusively, but the trimers form excessively and have varying composi-tion.
Overall, the hydrogen sulfide – water complex is much weaker than other systems studiedhere. The calculated dispersion contribution to the electronic dissociation energy is 50%,opposed to that of water estimated at 29%. The angle of the hydrogen bond is 163°, whichis significantly lower that observed for conventional hydrogen bonded complexes. The totaldissociation energy of the complex is 6.2 kJ⋅mol-1, with the corresponding librational bandfrequency we have found to be at 324 cm-1 in neon265. The majority of the IR intensivebands are located at much lower frequencies, particularly for the sulfide dimer species. Amore detailed investigation of the larger cluster in para-hydrogen is intended.
Figure V.18: Calculated minimum structures of dimer and trimer molecular complexes con-taining hydrogen sulfide.
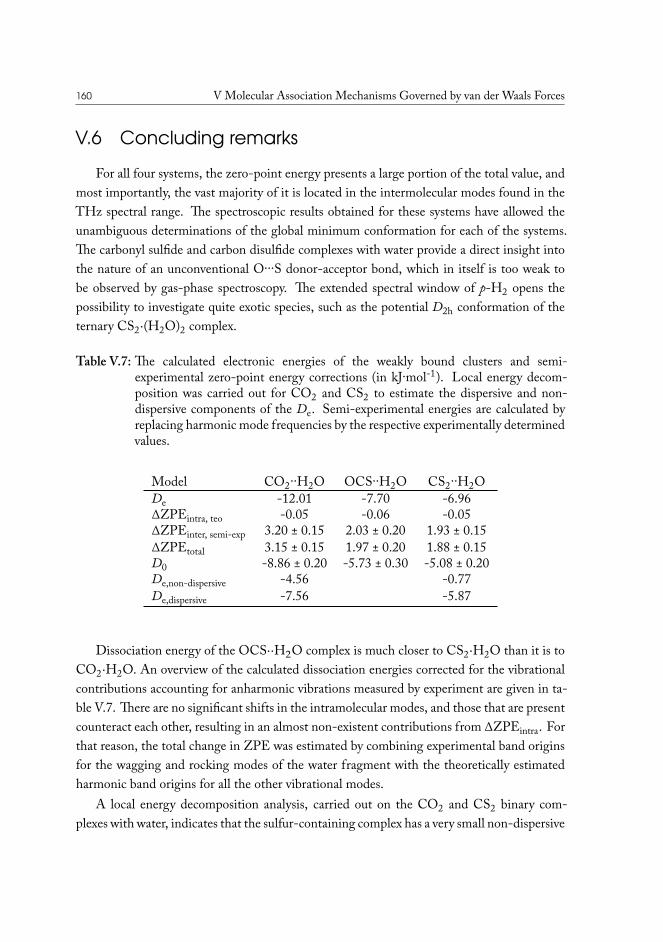
160 V Molecular Association Mechanisms Governed by van der Waals Forces
V.6 Concluding remarksFor all four systems, the zero-point energy presents a large portion of the total value, and
most importantly, the vast majority of it is located in the intermolecular modes found in theTHz spectral range. The spectroscopic results obtained for these systems have allowed theunambiguous determinations of the global minimum conformation for each of the systems.The carbonyl sulfide and carbon disulfide complexes with water provide a direct insight intothe nature of an unconventional O···S donor-acceptor bond, which in itself is too weak tobe observed by gas-phase spectroscopy. The extended spectral window of p-H2 opens thepossibility to investigate quite exotic species, such as the potential D2h conformation of theternary CS2⋅(H2O)2 complex.
Table V.7: The calculated electronic energies of the weakly bound clusters and semi-experimental zero-point energy corrections (in kJ∙mol-1). Local energy decom-position was carried out for CO2 and CS2 to estimate the dispersive and non-dispersive components of the De. Semi-experimental energies are calculated byreplacing harmonic mode frequencies by the respective experimentally determinedvalues.
Model CO2··H2O OCS··H2O CS2··H2ODe -12.01 -7.70 -6.96∆ZPEintra, teo -0.05 -0.06 -0.05∆ZPEinter, semi-exp 3.20 ± 0.15 2.03 ± 0.20 1.93 ± 0.15∆ZPEtotal 3.15 ± 0.15 1.97 ± 0.20 1.88 ± 0.15D0 -8.86 ± 0.20 -5.73 ± 0.30 -5.08 ± 0.20De,non-dispersive -4.56 -0.77De,dispersive -7.56 -5.87
Dissociation energy of the OCS⋅⋅H2O complex is much closer to CS2⋅H2O than it is toCO2⋅H2O. An overview of the calculated dissociation energies corrected for the vibrationalcontributions accounting for anharmonic vibrations measured by experiment are given in ta-ble V.7. There are no significant shifts in the intramolecular modes, and those that are presentcounteract each other, resulting in an almost non-existent contributions from ∆ZPEintra. Forthat reason, the total change in ZPE was estimated by combining experimental band originsfor the wagging and rocking modes of the water fragment with the theoretically estimatedharmonic band origins for all the other vibrational modes.
A local energy decomposition analysis, carried out on the CO2 and CS2 binary com-plexes with water, indicates that the sulfur-containing complex has a very small non-dispersive
V.6 Concluding remarks 161
contribution. The second conformation of that complex even has a strong repulsive electro-static component at the equilibrium geometry (3.16 kJ∙mol-1) that is partially compensatedby strong dispersion (-9.05 kJ∙mol-1). It appears from the analysis that, while electrostaticinteractions have very small effect on the formation of these complexes, it is, nevertheless, adefining factor of the mutual molecular orientation, as it is without a doubt responsible forthe specific energy wells of these systems. Evident from the calculated vibrational band ori-gins, the coupled cluster approach fails to properly describe these van der Waals complexes,but MP2 values appear somewhat better on average. This may indicate that there is a severelack of proper correlation treatment. As demonstrated recently for the case of the weaklybound methane – water molecular complex, the calculated vibrational band origins for the in-termolecular modes are critically dependent on the inclusion of higher (Q) excitations in thecoupled cluster treatment124. The majority of the intermolecular modes have not been foundexperimentally yet, but it is very likely that matrix isolation in the para-hydrogen environmentwould allow to obtain experimental data for the this weakly bound molecular system in thefuture.

162
CHAPTERVIConclusions
Infrared spectroscopy approach has been demonstrated to be a powerful tool that can beapplied to solve many challenges related to oil production. The currently applied methods toevaluate phase behavior of the reservoir fluids during production rely on indirect conclusions,based on the PVT properties of model mixtures. The true boiling point curve of a substancein a mixture is the result of intermolecular interactions occurring in the condensed phase, andfor this reason, properties of a fluid are uniquely affected by its chemical composition.
The analysis of the produced oil samples from several wells located in different geograph-ical locations in the South North Sea has demonstrated that polar oxygen-containing com-pounds are present in quantifiable amounts in the crude oil fractions as low as C16 and gradu-ally increases with the carbon number of the fraction. Such compounds are particularly apt toform non-covalent intermolecular bonds to other molecules, forming large and heavy molec-ular clusters, and also to the surface of the reservoir rock, ultimately hindering the flow. Formany heavy polar compounds, determination of the boiling point is associated with an uncer-tainty of several tens of degrees, or cannot be determined altogether without destroying thesample.
The extracted spectroscopic parameters, describing certain aspects of chemical composi-tion of the analyzed sample, such as alkyl chain branching and maturity, indicate that thereis a non-linear change of the distribution of compound classes with the true boiling points,which would suggest that the compositional effect on the behavior of the fluid in the produc-tion scenarios is as unsteady.
The evidence of strong adsorption of polar compounds can be found by investigating theoriginal drill core samples. The spectroscopic analysis of extracted oil residue deposited inthese chalk samples has shown that a very high concentration of polar asphaltene/resin com-pounds, containing carboxylic and amide functional groups, is left on the surfaces. The heavyfraction containing asphaltene and resin compounds can constitute more than 50% of thetotal organic matter adsorbed, but it also limits the mobility of the non-polar grease-like hy-drocarbons, that are linked to them by means of van der Waals forces.
The polar fraction of the organic residue on the rock surface also bears characteristic chem-ical signatures. The information on the chemical functional groups present in the moleculesof these fractions can be easily assessed by infrared spectroscopy. We have found evidencethat the production wells in the North Sea can be grouped based on their chemistry, andthe dominant features that define the groups are signals of carboxylic acids and amides. We
164 VI Conclusions
have tested out an express method to perform statistical analysis of the spectroscopic dataand compared it to a PCA done with manually fitted spectra. The results are in agreement,so ATR-FTIR spectroscopy can be used to extract a valuable overview of the chemical com-position, and serve as a supplement to methods that provide more detail, but are orders ofmagnitude slower to use and analyze, such as high resolution mass spectroscopy.
The adsorbed material poses a challenge for oil recovery process design. The case of tightchalk reservoirs, that is widely represented in the Danish North Sea area, requires advancedapproaches to improve sweep efficiency and other economic aspects of the production process.“Wettability” has been a key concept for engineering the flooding solutions, but the sciencebehind the phenomenon is poorly understood. This means that the development of moreefficient bespoke approaches to flooding can still be improved on several levels, and mostmodern research in this area is more reliant on empirical observations than could be desired.As a step towards thermodynamic models capable of accurately simulating phase and flowbehavior of the reservoir fluid rooted in actual chemical composition and the related properties,a better understanding of the physics involved in molecular association is necessary.
Spectroscopic measurements of vibrational spectra of small molecular clusters, formedfrom two-three individual molecules trapped in solid inert gas material, is a powerful tool thatallows direct studies of non-covalent intermolecular forces. This systematic study of prototyp-ical clusters of small oxygen-containing compounds sheds light on the nature of hydrogenbonds. It is observed that the inductive and mesomeric effects have a strong effect on thedonor-acceptor properties of the molecule, and the decay with distance across bonds limitsthe extent of its effect in large systems. These facts provide the possibility of using the ex-perimental data to estimate the thermodynamic stability of a given hydrogen bond, formedbetween the molecules in a condensed phase, provided the structural information on just thenearest surroundings of a functional group is available. This limits the possible number of themost primitive building blocks of the condensed phase and has the potential of constructingthe scalable model of hydrogen-bonded interactions.
The hydrogen bonding to the dimethyl ether molecule (DME) was also studied in thecontext of solvent-based enhanced oil recovery. DME is uniquely suited for this purposeowing to its ability to dissolve in water, but partition into the organic phase on contact. Wehave determined that the interactions with a series of model hydrogen bond donor compoundsare significantly stronger than non-specific London forces that may form with non-polar oilconstituents. In that regard, DME may be perfectly suited to recover strongly adsorbed polarcompounds from the rock surface. Now to assess the potential recovery benefit of using thisagent, a thermodynamic model can be used, for which purpose we have determined the semi-experimental dissociation energies by IR spectroscopy.
VI Conclusions 165
The dissociation energies of the hydrogen bonded complexes with water that were studiedrange from 17.0 to 21.3 kJ∙mol-1. Dispersion interactions contribute significantly to forma-tion of these complexes, unlike observed for the water dimer. For this reason, theoreticaldescription of such systems requires high-level electronic structure method to account for theelectronic correlation effects, yet these methods are out of reach for most systems of that size.The spectroscopic observables, that are directly linked to the interaction energy of the systemsand serve as reference experimental data for development of novel approaches to treatment ofanharmonicity of vibrations, were obtained, and are also of value on their own.
While each hydrogen bond can be considered much stronger than van der Waals forces,the latter are always present and also contribute significantly to the dissociation energy of asystem. These forces can only be assessed by means of computational quantum chemistry,and for clusters of medium-sized polar molecules may contribute nearly half of the total dis-sociation energy. The particular interest arises when trying to estimate the thermodynamicalproperties associated with non-polar solvation, as in many cases acquiring experimental datais notoriously challenging. We have investigated molecular complexes of CO2, OCS, CS2and H2S. These systems are model compounds for donor-acceptor interactions, where vander Waals forces play the key role, and are applied in some fields of the industry, e.g. CO2gas injection. Even though these compounds do not possess a substantial permanent dipolemoment, electrostatic forces are intricately woven into the forces binding the clusters, and thecase was found to be unique to each molecule.
Intermolecular vibrations constitute almost the entirety of the vibrational energy for thesesystems, and all of them are located in the terahertz spectral range. To access this range, wehave constructed an automated setup to routinely produce >99.96% spin-isomer pure para-hydrogen. It can be used as a matrix material and we have found it to be completely trans-parent in THz range, thus allowing experimental determination of the zero-point energychanges of the complexes. In such interactions, while they are facilitated mostly by Londondispersion forces, the structure is defined by the weak electrostatic interactions. Since thelatter is strongly linked to the molecular vibrations, IR spectroscopy in solid para-hydrogenis a unique approach to extract this information for the weakly bound complexes that cannotbe observed in any other way.
The conclusion from these results is that dispersion interactions are just as important forthe proper understanding of the molecular association mechanisms as hydrogen bonds, andboth can be potentially leveraged to design better engineering solutions for crude oil pro-duction and processing. The necessary requirement to apply this knowledge is to have anin-depth information on the chemical composition of the actual fluid in the process. Infraredspectroscopy in all of its flavors has the tools to contribute to the solutions for both of these

166 VI Conclusions
problems. The next step in the development of thermodynamic models, fluid-rock interac-tions should be considered more explicitly. In this regard, the novel approach combiningthe nanometer-scale resolving power of an AFM instrument with direct sensitivity to specificchemical signatures of infrared spectroscopy - AFM-IR, is a promising tool to observe in situthe behavior and distribution patterns of heavy polar compound adsorbed on the surface ofthe rock, and, perhaps, the direct effect of the interaction on the functional groups containedin the molecules of crude oil.

APPENDIXAClosed cycle p-H2 converter
blueprintsBelow are schematics for the custom made components of the closed-cycle parahydrogen
setup described, kindly provided by A. Voute.Following part drawings are attached:
• Swagelok-to-glass fitting — ½ in. tube fitting to 8 mm I.D. glass tube with doubleo-ring seals. The material used for the setup is brass.
• Vacuum feedthrough for the vessel tube — ½ in. tube feedthrough from the cryostatvacuum space to the hydrogen handling system with a KF-25 flange. Welded KF blankwith Swagelok ½ in. ultra-torr bore-through fitting. The material is stainless steel.
• Vessel base — copper base plate for the catalyst vessel with a threaded stem on thethermal interface side for the attachment to the cryostat.
• Vessel tube interface — interface is welded to the ½ in. tube and soldered as the topplate on the vessel cylinder.
• Vessel body — copper cylinder serving as the body of the vessel.
• Vessel assembly — drawing for the fully assembled tube-vessel part.
• Radiation shield — commercial aluminium radiation shield with a bore to pass thetube.
• Vacuum shroud — stainless steel vacuum shroud for the cryostat with an interface tothe weld on a KF-25 flexible bellows.

Alexandre [email protected] 21 87 37
Units:
Part name:
Contact Scale
Approved by:
Material:
MODIFIED BY DESCRIPTIONDATEREV.Edges - ISO 13715
+0,2-0,2
( )
General rugosity General tolerance class
Checked by:Drawn by:
Laboratory:
Mass :
Danmarks Tekniske Universitet - DTU KemiKemitorvet, bygning 2072800 Kongens Lyngby
Date:
Drawing number: Page
Surface finishing:
Paper format:
THz lab-
mm [in]
1/1
-R.W. LarsenA. Voute
Stainless steel 304
ISO 2687 - mKRa 3,2
31-07-2018
2:1
A4
Swagelock-glass vacuum fitting
THZ-paraH2-007
-
25 1
.70 3
3.5
0 1
.70
0.50 X 45°
5.7
5
5.4
0 0.50 X 45°
A
A
0.1 C
0.05
C
0.500 g612.70 g6
10.30
3.30
7.80
5.50
SECTION A-A
A
12 x 30°
12 x R222
19
0.5 A B B
This side is identical to the usual teflon fitting.
A A
B B
C C
D D
E E
F F
4
4
3
3
2
2
1
1

Units:
Part name:
Contact Scale
Approved by:
Material:
MODIFIED BY DESCRIPTIONDATEREV.Edges - ISO 13715
+0,2-0,2
( )
General rugosity General tolerance class
Checked by:Drawn by:
Laboratory:
Mass :
Danmarks Tekniske Universitet - DTU KemiKemitorvet, bygning 2072800 Kongens Lyngby
Date:
Drawing number: Page
Surface finishing:
Paper format:
THz labI. Khaliqdad
mm [in]
1/1
-R.W. LarsenA. Voute
Stainless steel 304
ISO 2687 - mKRa 3,2
24-06-2018
1:1
A4
Flange with vacuum fitting
THZ-paraH2-005
-
SwagelokSS-8-UT-A-10BT
KF25 blank flange(hole to be drilled)
A
A
40
Alexandre [email protected] 21 87 37
A
13
0.625 H715.875 H7
3
SECTION A-A
Weld
0.2 A
A A
B B
C C
D D
E E
F F
4
4
3
3
2
2
1
1
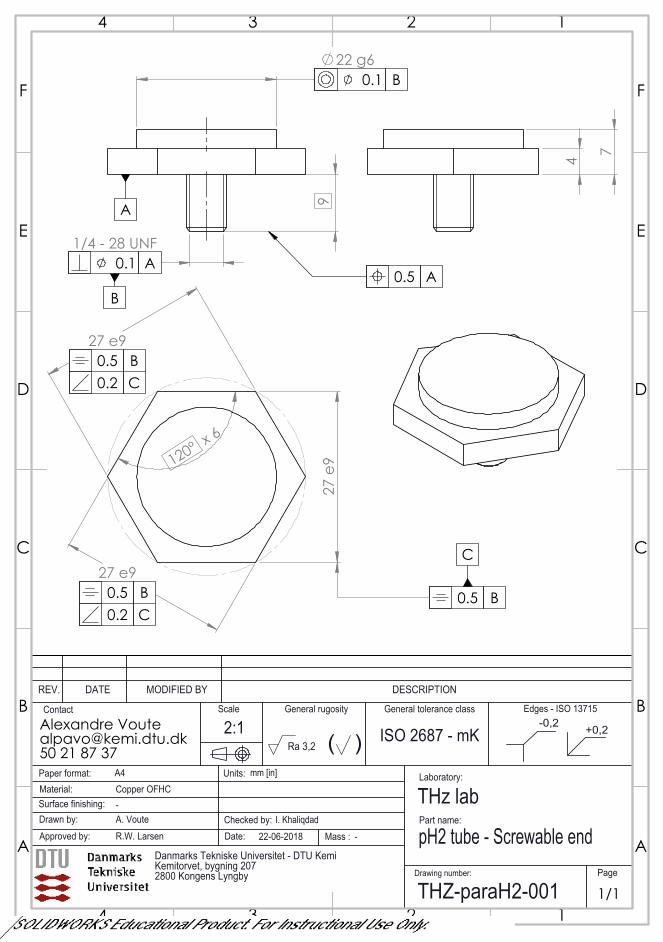
Alexandre [email protected] 21 87 37
Units:
Part name:
Contact Scale
Approved by:
Material:
MODIFIED BY DESCRIPTIONDATEREV.Edges - ISO 13715
+0,2-0,2
( )
General rugosity General tolerance class
Checked by:Drawn by:
Laboratory:
Mass :
Danmarks Tekniske Universitet - DTU KemiKemitorvet, bygning 2072800 Kongens Lyngby
Date:
Drawing number: Page
Surface finishing:
Paper format:
THz labI. Khaliqdad
mm [in]
1/1
-R.W. LarsenA. Voute
Copper OFHC
ISO 2687 - mKRa 3,2
22-06-2018
2:1
A4
pH2 tube - Screwable end
THZ-paraH2-001
-
9
1/4 - 28 UNF
22 g6
0.5 A0.1 A
0.1 B
A
B
4 7
27
e9 120° x 6
27 e9
27 e9
0.5 B
0.5 B0.2 C
0.5 B0.2 C
C
A A
B B
C C
D D
E E
F F
4
4
3
3
2
2
1
1

Units:
Part name:
Contact Scale
Approved by:
Material:
MODIFIED BY DESCRIPTIONDATEREV.Edges - ISO 13715
+0,2-0,2
( )
General rugosity General tolerance class
Checked by:Drawn by:
Laboratory:
Mass :
Danmarks Tekniske Universitet - DTU KemiKemitorvet, bygning 2072800 Kongens Lyngby
Date:
Drawing number: Page
Surface finishing:
Paper format:
THz labI. Khaliqdad
mm [in]
1/1
-R.W. LarsenA. Voute
Stainless steel 304
ISO 2768 - mKRa 3,2
22-06-2018
2:1
A4
pH2 tube - Interface Cu container/Steel tube
THZ - paraH2 - 003
-
2
5
27
22 g6
Alexandre [email protected] 21 87 37
0.4 A
A
A
A
0.500 H712.70 H7
10.70
3
SECTION A-A
0.1 A
0.4 A
0.5 BB
A A
B B
C C
D D
E E
F F
4
4
3
3
2
2
1
1

Alexandre [email protected] 21 87 37
Units:
Part name:
Contact Scale
Approved by:
Material:
MODIFIED BY DESCRIPTIONDATEREV.Edges - ISO 13715
+0,2-0,2
( )
General rugosity General tolerance class
Checked by:Drawn by:
Laboratory:
Mass :
Danmarks Tekniske Universitet - DTU KemiKemitorvet, bygning 2072800 Kongens Lyngby
Date:
Drawing number: Page
Surface finishing:
Paper format:
THz labI. Khaliqdad
mm [in]
1/1
-R.W. LarsenA. Voute
Copper OFHC
ISO 2687 - mKRa 3,2
22-06-2018
2:1
A4
pH2 tube - Copper container
THZ-paraH2-002
-
25
22 H7
1.50
30
0.4 A 0.4 B
AB
A A
B B
C C
D D
E E
F F
4
4
3
3
2
2
1
1

Alexandre [email protected] 21 87 37
Units:
Part name:
Contact Scale
Approved by:
Material:
MODIFIED BY DESCRIPTIONDATEREV.Edges - ISO 13715
+0,2-0,2
( )
General rugosity General tolerance class
Checked by:Drawn by:
Laboratory:
Mass :
Danmarks Tekniske Universitet - DTU KemiKemitorvet, bygning 2072800 Kongens Lyngby
Date:
Drawing number: Page
Surface finishing:
Paper format:
THz labI. Khaliqdad
mm [in]
1/1
-R.W. LarsenA. Voute
-
ISO 2768 - mKRa 3,2
22-06-2018
1:1
A4
pH2 tube - Assembly
THZ-paraH2-004
-
A
A
350
10.70 max.
0.50012.70
SECTION A-A
Weld
Solder
Solder
Screwable end
Copper container
Interface
1/2'' steel 304 tube(possibly Swagelok)
A A
B B
C C
D D
E E
F F
4
4
3
3
2
2
1
1

Alexandre [email protected] 21 87 37
Units:
Part name:
Contact Scale
Approved by:
Material:
MODIFIED BY DESCRIPTIONDATEREV.Edges - ISO 13715
+0,2-0,2
( )
General rugosity General tolerance class
Checked by:Drawn by:
Laboratory:
Mass :
Danmarks Tekniske Universitet - DTU KemiKemitorvet, bygning 2072800 Kongens Lyngby
Date:
Drawing number: Page
Surface finishing:
Paper format:
THz lab-
mm
1/1
-R.W. LarsenA. Voute
Stainless steel 304
ISO 2687 - mKRa 3,2
30-07-2018
1:2
A4
Radiation shield cryostatat
THZ-paraH2-006
-
18
SCALE 1:1
A A
B B
C C
D D
E E
F F
4
4
3
3
2
2
1
1

Alexandre [email protected] 21 87 37
Units:
Part name:
Contact Scale
Approved by:
Material:
MODIFIED BY DESCRIPTIONDATEREV.Edges - ISO 13715
+0,2-0,2
( )
General rugosity General tolerance class
Checked by:Drawn by:
Laboratory:
Mass :
Danmarks Tekniske Universitet - DTU KemiKemitorvet, bygning 2072800 Kongens Lyngby
Date:
Drawing number: Page
Surface finishing:
Paper format:
THz lab-
mm [in]
1/1
-R.W. LarsenA. Voute
Stainless steel 304
ISO 2687 - mKRa 3,2
30-07-2018
1:2
A4
Vacuum shroud cryostat
THZ-paraH2-005
-
0.
190
4.83
24
40 2
14.9
0037
8.46
A A
B B
C C
D D
E E
F F
4
4
3
3
2
2
1
1

176

APPENDIXBTrue Boiling Point Distillates
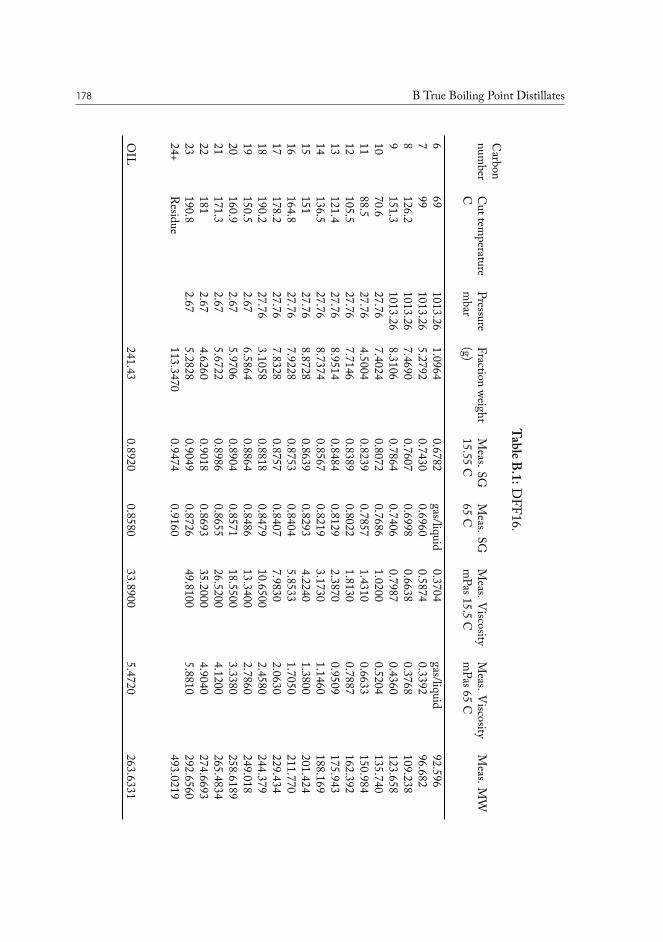
178 B True Boiling Point Distillates
TableB.1:DFF16.
Carbon
number
Cuttem
peraturePressure
Fractionweight
Meas.SG
Meas.SG
Meas.V
iscosityM
eas.Viscosity
Meas.M
WC
mbar
(g)15.55
C65
Cm
Pas15.5C
mPas65
C
669
1013.261.0964
0.6782gas/liquid
0.3704gas/liquid
92.5967
991013.26
5.27920.7430
0.69600.5874
0.339296.682
8126.2
1013.267.4690
0.76070.6998
0.66380.3768
109.2389
151.31013.26
8.31060.7864
0.74060.7987
0.4360123.658
1070.6
27.767.4024
0.80720.7686
1.02000.5204
135.74011
88.527.76
4.50040.8239
0.78571.4310
0.6633150.984
12105.5
27.767.7146
0.83890.8022
1.81300.7887
162.39213
121.427.76
8.95140.8484
0.81292.3870
0.9509175.943
14136.5
27.768.7374
0.85670.8219
3.17301.1460
188.16915
15127.76
8.87280.8639
0.82934.2240
1.3800201.424
16164.8
27.767.9228
0.87530.8404
5.85331.7050
211.77017
178.227.76
7.83280.8757
0.84077.9830
2.0630229.434
18190.2
27.763.1058
0.88180.8479
10.65002.4580
244.37919
150.52.67
6.58640.8864
0.848613.3400
2.7860249.018
20160.9
2.675.9706
0.89040.8571
18.55003.3380
258.618921
171.32.67
5.67220.8986
0.865526.5200
4.1200265.4834
22181
2.674.6260
0.90180.8693
35.20004.9040
274.669323
190.82.67
5.28280.9049
0.872649.8100
5.8810292.6560
24+R
esidue113.3470
0.94740.9160
493.0219
OIL
241.430.8920
0.858033.8900
5.4720263.6331
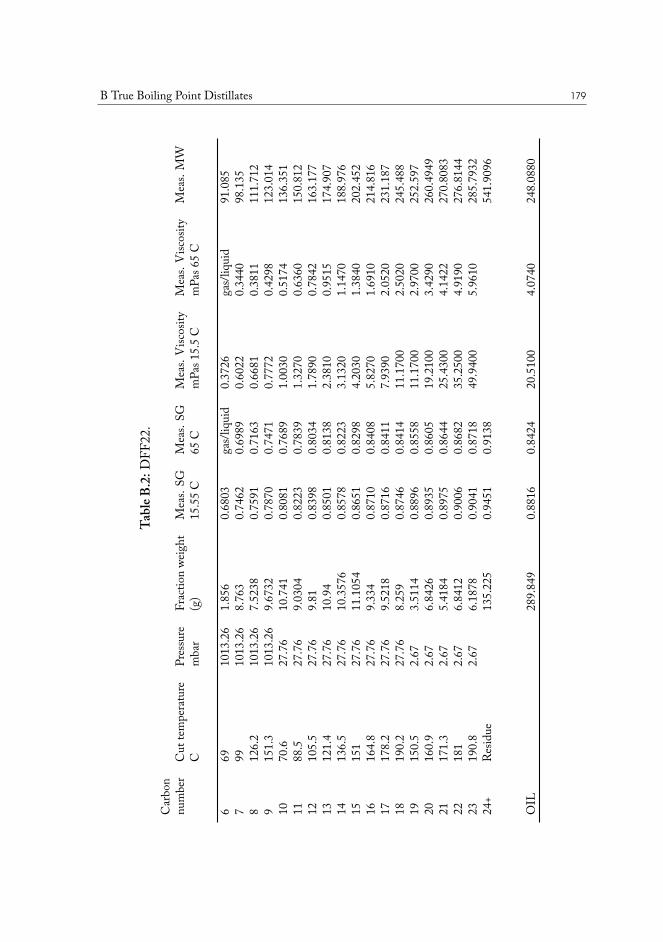
B True Boiling Point Distillates 179
TableB
.2:D
FF22
.C
arbo
nnu
mbe
rC
utte
mpe
ratu
rePr
essu
reFr
actio
nwe
ight
Mea
s.SG
Mea
s.SG
Mea
s.V
iscos
ityM
eas.
Visc
osity
Mea
s.M
WC
mba
r(g
)15
.55
C65
Cm
Pas1
5.5
Cm
Pas6
5C
669
1013
.26
1.85
60.
6803
gas/
liqui
d0.
3726
gas/
liqui
d91
.085
799
1013
.26
8.76
30.
7462
0.69
890.
6022
0.34
4098
.135
812
6.2
1013
.26
7.52
380.
7591
0.71
630.
6681
0.38
1111
1.71
29
151.
310
13.2
69.
6732
0.78
700.
7471
0.77
720.
4298
123.
014
1070
.627
.76
10.7
410.
8081
0.76
891.
0030
0.51
7413
6.35
111
88.5
27.7
69.
0304
0.82
230.
7839
1.32
700.
6360
150.
812
1210
5.5
27.7
69.
810.
8398
0.80
341.
7890
0.78
4216
3.17
713
121.
427
.76
10.9
40.
8501
0.81
382.
3810
0.95
1517
4.90
714
136.
527
.76
10.3
576
0.85
780.
8223
3.13
201.
1470
188.
976
1515
127
.76
11.1
054
0.86
510.
8298
4.20
301.
3840
202.
452
1616
4.8
27.7
69.
334
0.87
100.
8408
5.82
701.
6910
214.
816
1717
8.2
27.7
69.
5218
0.87
160.
8411
7.93
902.
0520
231.
187
1819
0.2
27.7
68.
259
0.87
460.
8414
11.1
700
2.50
2024
5.48
819
150.
52.
673.
5114
0.88
960.
8558
11.1
700
2.97
0025
2.59
720
160.
92.
676.
8426
0.89
350.
8605
19.2
100
3.42
9026
0.49
4921
171.
32.
675.
4184
0.89
750.
8644
25.4
300
4.14
2227
0.80
8322
181
2.67
6.84
120.
9006
0.86
8235
.250
04.
9190
276.
8144
2319
0.8
2.67
6.18
780.
9041
0.87
1849
.940
05.
9610
285.
7932
24+
Res
idue
135.
225
0.94
510.
9138
541.
9096
OIL
289.
849
0.88
160.
8424
20.5
100
4.07
4024
8.08
80
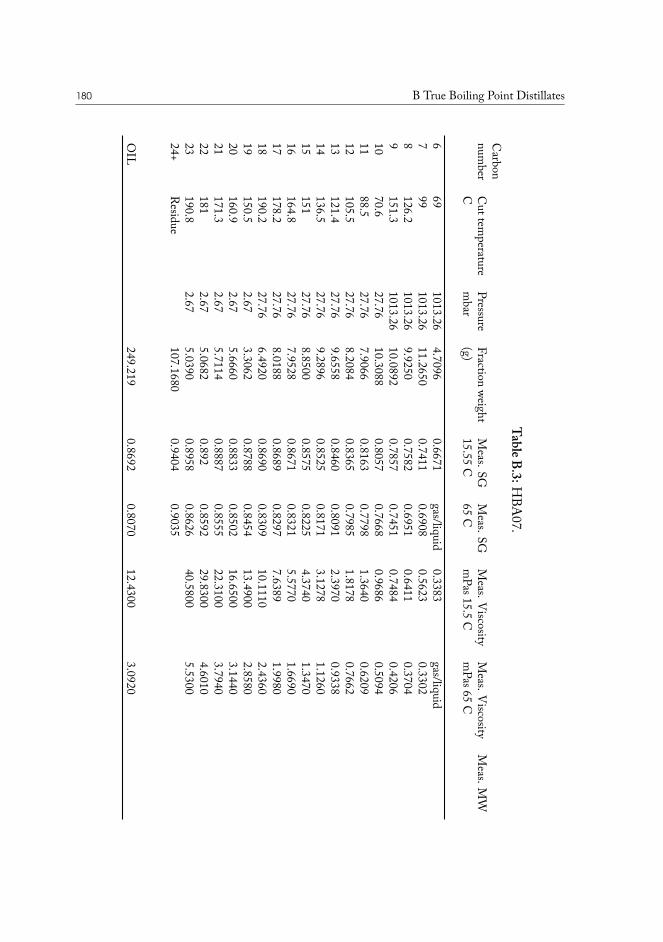
180 B True Boiling Point Distillates
TableB.3:HBA
07.C
arbonnum
berC
uttemperature
PressureFraction
weightM
eas.SGM
eas.SGM
eas.Viscosity
Meas.V
iscosityM
eas.MW
Cm
bar(g)
15.55C
65C
mPas15.5
Cm
Pas65C
669
1013.264.7096
0.6671gas/liquid
0.3383gas/liquid
799
1013.2611.2650
0.74110.6908
0.56230.3302
8126.2
1013.269.9250
0.75820.6951
0.64110.3704
9151.3
1013.2610.0892
0.78570.7451
0.74840.4206
1070.6
27.7610.3088
0.80570.7668
0.96860.5094
1188.5
27.767.9066
0.81630.7798
1.36400.6209
12105.5
27.768.2084
0.83650.7985
1.81780.7662
13121.4
27.769.6558
0.84600.8091
2.39700.9338
14136.5
27.769.2896
0.85250.8171
3.12781.1260
15151
27.768.8500
0.85750.8225
4.37401.3470
16164.8
27.767.9528
0.86710.8321
5.57701.6690
17178.2
27.768.0188
0.86890.8297
7.63891.9980
18190.2
27.766.4920
0.86900.8309
10.11102.4360
19150.5
2.673.3062
0.87880.8454
13.49002.8580
20160.9
2.675.6660
0.88330.8502
16.65003.1440
21171.3
2.675.7114
0.88870.8555
22.31003.7940
22181
2.675.0682
0.8920.8592
29.83004.6010
23190.8
2.675.0390
0.89580.8626
40.58005.5300
24+R
esidue107.1680
0.94040.9035
OIL
249.2190.8692
0.807012.4300
3.0920
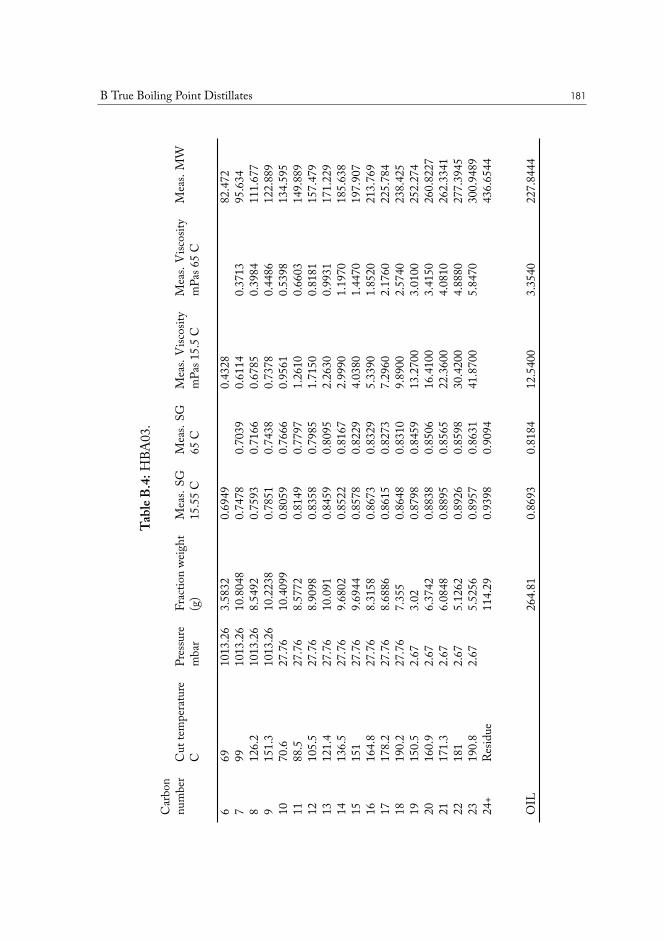
B True Boiling Point Distillates 181
TableB
.4:H
BA03
.C
arbo
nnu
mbe
rC
utte
mpe
ratu
rePr
essu
reFr
actio
nwe
ight
Mea
s.SG
Mea
s.SG
Mea
s.V
iscos
ityM
eas.
Visc
osity
Mea
s.M
WC
mba
r(g
)15
.55
C65
Cm
Pas1
5.5
Cm
Pas6
5C
669
1013
.26
3.58
320.
6949
0.43
2882
.472
799
1013
.26
10.8
048
0.74
780.
7039
0.61
140.
3713
95.6
348
126.
210
13.2
68.
5492
0.75
930.
7166
0.67
850.
3984
111.
677
915
1.3
1013
.26
10.2
238
0.78
510.
7438
0.73
780.
4486
122.
889
1070
.627
.76
10.4
099
0.80
590.
7666
0.95
610.
5398
134.
595
1188
.527
.76
8.57
720.
8149
0.77
971.
2610
0.66
0314
9.88
912
105.
527
.76
8.90
980.
8358
0.79
851.
7150
0.81
8115
7.47
913
121.
427
.76
10.0
910.
8459
0.80
952.
2630
0.99
3117
1.22
914
136.
527
.76
9.68
020.
8522
0.81
672.
9990
1.19
7018
5.63
815
151
27.7
69.
6944
0.85
780.
8229
4.03
801.
4470
197.
907
1616
4.8
27.7
68.
3158
0.86
730.
8329
5.33
901.
8520
213.
769
1717
8.2
27.7
68.
6886
0.86
150.
8273
7.29
602.
1760
225.
784
1819
0.2
27.7
67.
355
0.86
480.
8310
9.89
002.
5740
238.
425
1915
0.5
2.67
3.02
0.87
980.
8459
13.2
700
3.01
0025
2.27
420
160.
92.
676.
3742
0.88
380.
8506
16.4
100
3.41
5026
0.82
2721
171.
32.
676.
0848
0.88
950.
8565
22.3
600
4.08
1026
2.33
4122
181
2.67
5.12
620.
8926
0.85
9830
.420
04.
8880
277.
3945
2319
0.8
2.67
5.52
560.
8957
0.86
3141
.870
05.
8470
300.
9489
24+
Res
idue
114.
290.
9398
0.90
9443
6.65
44
OIL
264.
810.
8693
0.81
8412
.540
03.
3540
227.
8444
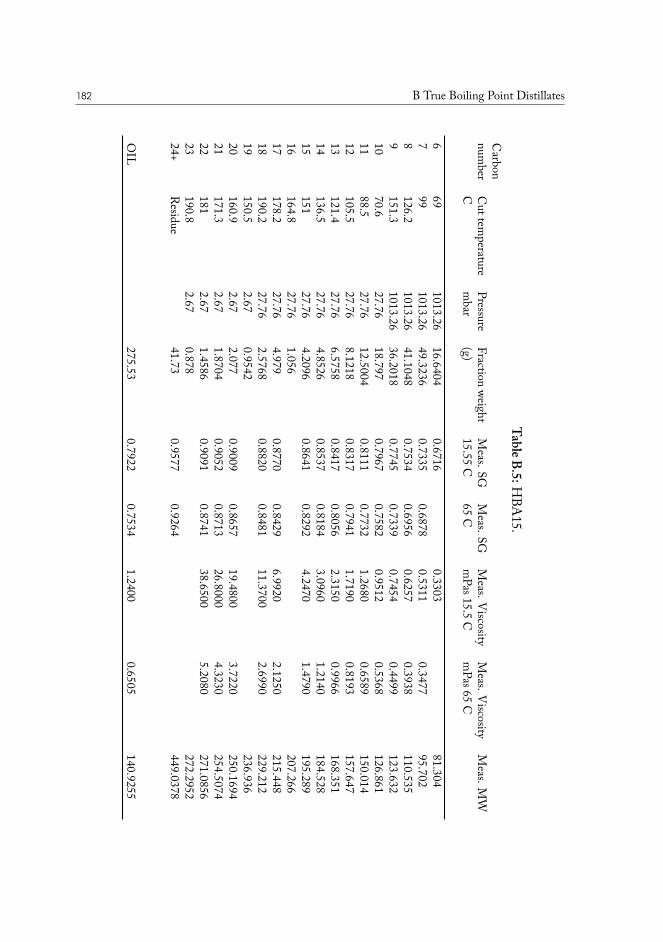
182 B True Boiling Point Distillates
TableB.5:HBA
15.C
arbonnum
berC
uttemperature
PressureFraction
weightM
eas.SGM
eas.SGM
eas.Viscosity
Meas.V
iscosityM
eas.MW
Cm
bar(g)
15.55C
65C
mPas15.5
Cm
Pas65C
669
1013.2616.6404
0.67160.3303
81.3047
991013.26
49.32360.7335
0.68780.5311
0.347795.702
8126.2
1013.2641.1048
0.75340.6956
0.62570.3938
110.5359
151.31013.26
36.20180.7745
0.73390.7454
0.4499123.632
1070.6
27.7618.797
0.79670.7582
0.95120.5368
126.86111
88.527.76
12.50040.8111
0.77321.2680
0.6589150.014
12105.5
27.768.1218
0.83170.7941
1.71900.8193
157.64713
121.427.76
6.57580.8417
0.80562.3150
0.9966168.351
14136.5
27.764.8526
0.85370.8184
3.09601.2140
184.52815
15127.76
4.20960.8641
0.82924.2470
1.4790195.289
16164.8
27.761.056
207.26617
178.227.76
4.9790.8770
0.84296.9920
2.1250215.448
18190.2
27.762.5768
0.88200.8481
11.37002.6990
229.21219
150.52.67
0.9542236.936
20160.9
2.672.077
0.90090.8657
19.48003.7220
250.169421
171.32.67
1.87040.9052
0.871326.8000
4.3230254.5074
22181
2.671.4586
0.90910.8741
38.65005.2080
271.085623
190.82.67
0.878272.2952
24+R
esidue41.73
0.95770.9264
449.0378
OIL
275.530.7922
0.75341.2400
0.6505140.9255
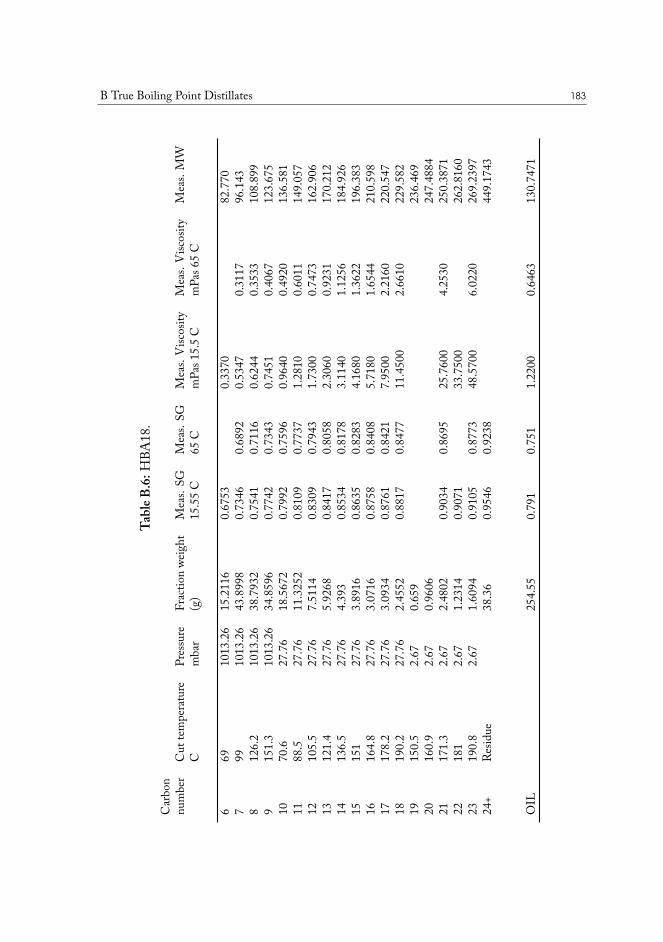
B True Boiling Point Distillates 183
TableB
.6:H
BA18
.C
arbo
nnu
mbe
rC
utte
mpe
ratu
rePr
essu
reFr
actio
nwe
ight
Mea
s.SG
Mea
s.SG
Mea
s.V
iscos
ityM
eas.
Visc
osity
Mea
s.M
WC
mba
r(g
)15
.55
C65
Cm
Pas1
5.5
Cm
Pas6
5C
669
1013
.26
15.2
116
0.67
530.
3370
82.7
707
9910
13.2
643
.899
80.
7346
0.68
920.
5347
0.31
1796
.143
812
6.2
1013
.26
38.7
932
0.75
410.
7116
0.62
440.
3533
108.
899
915
1.3
1013
.26
34.8
596
0.77
420.
7343
0.74
510.
4067
123.
675
1070
.627
.76
18.5
672
0.79
920.
7596
0.96
400.
4920
136.
581
1188
.527
.76
11.3
252
0.81
090.
7737
1.28
100.
6011
149.
057
1210
5.5
27.7
67.
5114
0.83
090.
7943
1.73
000.
7473
162.
906
1312
1.4
27.7
65.
9268
0.84
170.
8058
2.30
600.
9231
170.
212
1413
6.5
27.7
64.
393
0.85
340.
8178
3.11
401.
1256
184.
926
1515
127
.76
3.89
160.
8635
0.82
834.
1680
1.36
2219
6.38
316
164.
827
.76
3.07
160.
8758
0.84
085.
7180
1.65
4421
0.59
817
178.
227
.76
3.09
340.
8761
0.84
217.
9500
2.21
6022
0.54
718
190.
227
.76
2.45
520.
8817
0.84
7711
.450
02.
6610
229.
582
1915
0.5
2.67
0.65
923
6.46
920
160.
92.
670.
9606
247.
4884
2117
1.3
2.67
2.48
020.
9034
0.86
9525
.760
04.
2530
250.
3871
2218
12.
671.
2314
0.90
7133
.750
026
2.81
6023
190.
82.
671.
6094
0.91
050.
8773
48.5
700
6.02
2026
9.23
9724
+R
esid
ue38
.36
0.95
460.
9238
449.
1743
OIL
254.
550.
791
0.75
11.
2200
0.64
6313
0.74
71
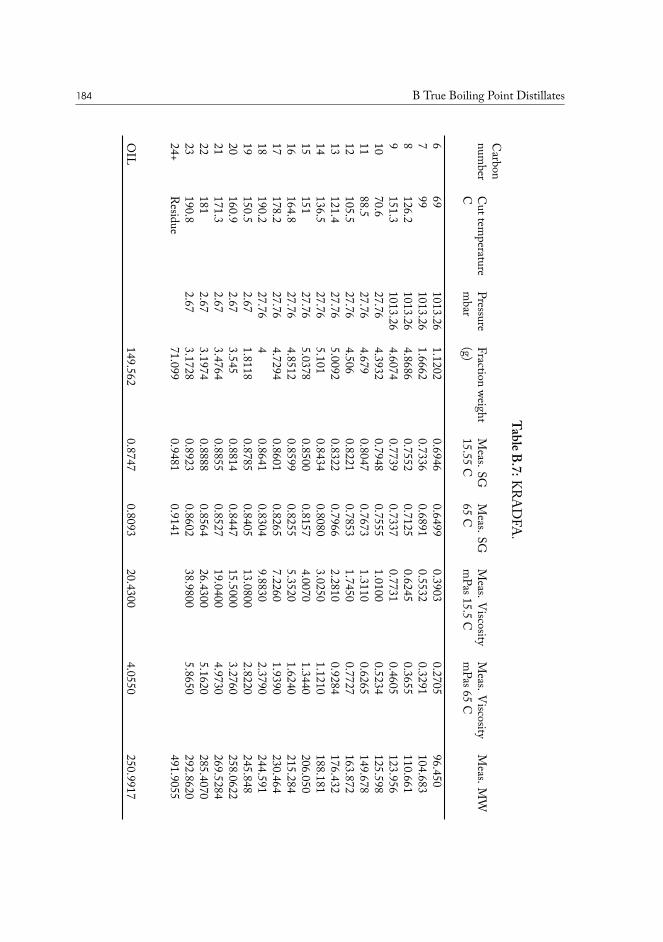
184 B True Boiling Point Distillates
TableB.7:KRA
DFA
.C
arbonnum
berC
uttemperature
PressureFraction
weightM
eas.SGM
eas.SGM
eas.Viscosity
Meas.V
iscosityM
eas.MW
Cm
bar(g)
15.55C
65C
mPas15.5
Cm
Pas65C
669
1013.261.1202
0.69460.6499
0.39030.2705
96.4507
991013.26
1.66620.7336
0.68910.5532
0.3291104.683
8126.2
1013.264.8686
0.75520.7125
0.62450.3655
110.6619
151.31013.26
4.60740.7739
0.73370.7731
0.4605123.956
1070.6
27.764.3932
0.79480.7555
1.01000.5234
125.59811
88.527.76
4.6790.8047
0.76731.3110
0.6265149.678
12105.5
27.764.506
0.82210.7853
1.74500.7727
163.87213
121.427.76
5.00920.8322
0.79662.2810
0.9284176.432
14136.5
27.765.101
0.84340.8080
3.02501.1210
188.18115
15127.76
5.03780.8500
0.81574.0070
1.3440206.050
16164.8
27.764.8512
0.85990.8255
5.35201.6240
215.28417
178.227.76
4.72940.8601
0.82657.2260
1.9390230.464
18190.2
27.764
0.86410.8304
9.88302.3790
244.59119
150.52.67
1.81180.8785
0.840513.0800
2.8220245.848
20160.9
2.673.545
0.88140.8447
15.50003.2760
258.062221
171.32.67
3.47640.8855
0.852719.0400
4.9730269.5284
22181
2.673.1974
0.88880.8564
26.43005.1620
285.407023
190.82.67
3.17280.8923
0.860238.9800
5.8650292.8620
24+R
esidue71.099
0.94810.9141
491.9055
OIL
149.5620.8747
0.809320.4300
4.0550250.9917
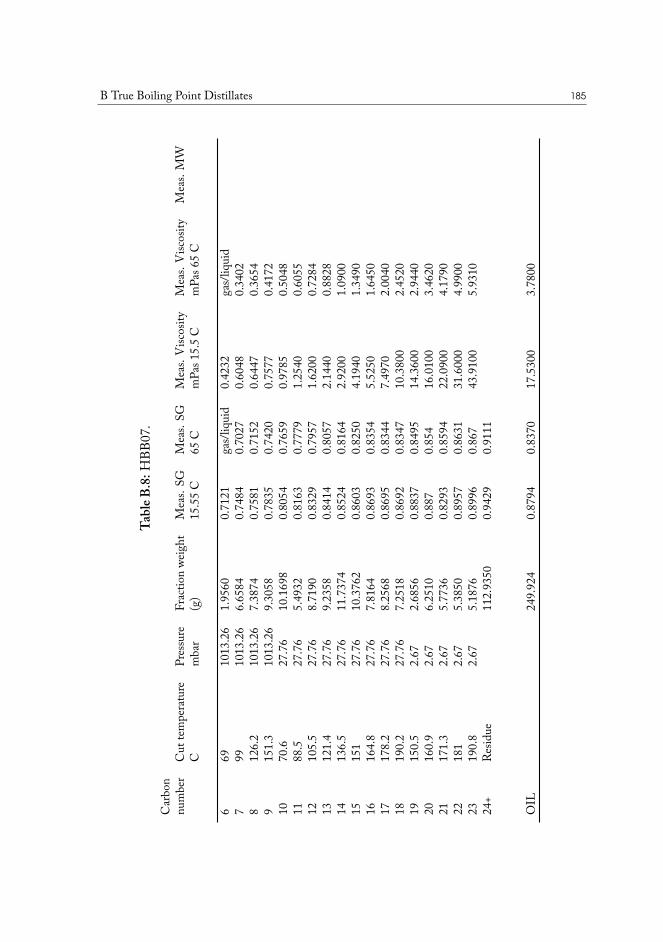
B True Boiling Point Distillates 185
TableB
.8:H
BB07
.C
arbo
nnu
mbe
rC
utte
mpe
ratu
rePr
essu
reFr
actio
nwe
ight
Mea
s.SG
Mea
s.SG
Mea
s.V
iscos
ityM
eas.
Visc
osity
Mea
s.M
WC
mba
r(g
)15
.55
C65
Cm
Pas1
5.5
Cm
Pas6
5C
669
1013
.26
1.95
600.
7121
gas/
liqui
d0.
4232
gas/
liqui
d7
9910
13.2
66.
6584
0.74
840.
7027
0.60
480.
3402
812
6.2
1013
.26
7.38
740.
7581
0.71
520.
6447
0.36
549
151.
310
13.2
69.
3058
0.78
350.
7420
0.75
770.
4172
1070
.627
.76
10.1
698
0.80
540.
7659
0.97
850.
5048
1188
.527
.76
5.49
320.
8163
0.77
791.
2540
0.60
5512
105.
527
.76
8.71
900.
8329
0.79
571.
6200
0.72
8413
121.
427
.76
9.23
580.
8414
0.80
572.
1440
0.88
2814
136.
527
.76
11.7
374
0.85
240.
8164
2.92
001.
0900
1515
127
.76
10.3
762
0.86
030.
8250
4.19
401.
3490
1616
4.8
27.7
67.
8164
0.86
930.
8354
5.52
501.
6450
1717
8.2
27.7
68.
2568
0.86
950.
8344
7.49
702.
0040
1819
0.2
27.7
67.
2518
0.86
920.
8347
10.3
800
2.45
2019
150.
52.
672.
6856
0.88
370.
8495
14.3
600
2.94
4020
160.
92.
676.
2510
0.88
70.
854
16.0
100
3.46
2021
171.
32.
675.
7736
0.82
930.
8594
22.0
900
4.17
9022
181
2.67
5.38
500.
8957
0.86
3131
.600
04.
9900
2319
0.8
2.67
5.18
760.
8996
0.86
743
.910
05.
9310
24+
Res
idue
112.
9350
0.94
290.
9111
OIL
249.
924
0.87
940.
8370
17.5
300
3.78
00

186

APPENDIXCList of Drill Core Samples
The following is the list of drill core samples analyzed in both studied in section III.3.
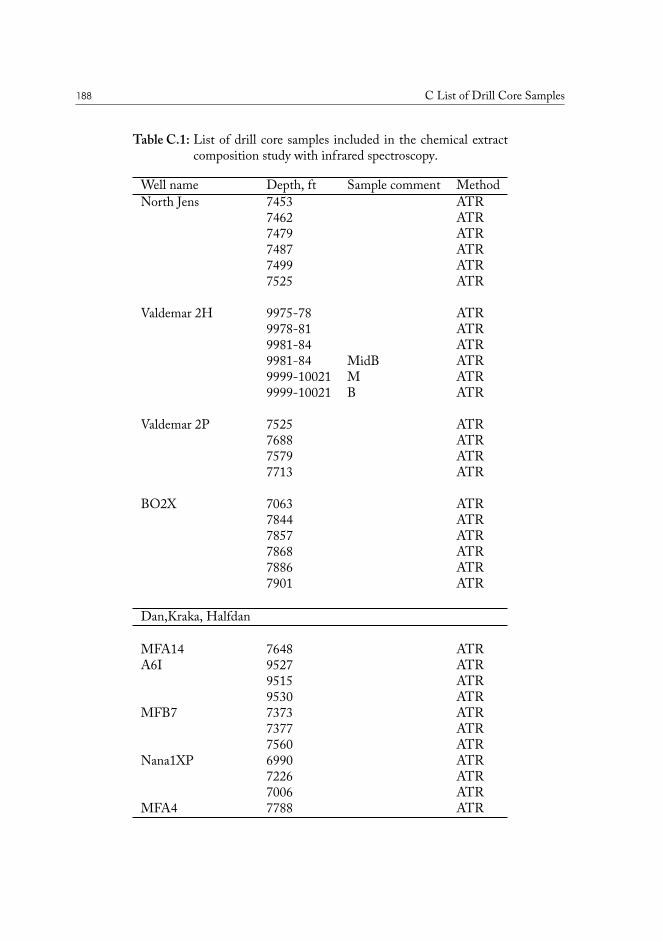
188 C List of Drill Core Samples
Table C.1: List of drill core samples included in the chemical extractcomposition study with infrared spectroscopy.
Well name Depth, ft Sample comment MethodNorth Jens 7453 ATR
7462 ATR7479 ATR7487 ATR7499 ATR7525 ATR
Valdemar 2H 9975-78 ATR9978-81 ATR9981-84 ATR9981-84 MidB ATR9999-10021 M ATR9999-10021 B ATR
Valdemar 2P 7525 ATR7688 ATR7579 ATR7713 ATR
BO2X 7063 ATR7844 ATR7857 ATR7868 ATR7886 ATR7901 ATR
Dan,Kraka, Halfdan
MFA14 7648 ATRA6I 9527 ATR
9515 ATR9530 ATR
MFB7 7373 ATR7377 ATR7560 ATR
Nana1XP 6990 ATR7226 ATR7006 ATR
MFA4 7788 ATR

APPENDIXDPeer-Reviewed Journal
PublicationsD.1 Highly localized H2O librational motion as a
far-infrared spectroscopic probe for
microsolvation of organic moleculesReprinted with permission from:Mihrin, D., Andersen, J., Jakobsen, P. W., and Wugt Larsen, R. (2019). Highly localizedH2O librational motion as a far-infrared spectroscopic probe for microsolvation of organicmolecules.Physical Chemistry Chemical Physics, 21(4), 1717-1723.https://doi.org/10.1039/c8cp05985c
This journal is© the Owner Societies 2019 Phys. Chem. Chem. Phys., 2019, 21, 1717--1723 | 1717
Cite this:Phys.Chem.Chem.Phys.,
2019, 21, 1717
Highly localized H2O librational motion as afar-infrared spectroscopic probe formicrosolvation of organic molecules
D. Mihrin, J. Andersen, P. W. Jakobsen and R. Wugt Larsen *
The most prominent spectroscopic observable for the hydrogen bonding between individual molecules
in liquid water is the broad absorption band detected in the spectral region between 300 and 900 cm�1.
The present work demonstrates how the associated large-amplitude out-of-plane OH librational motion
of H2O molecules also directly reflects the microsolvation of organic compounds. This highly localized
OH librational motion of the first solvating H2O molecule causes a significant change of dipole moment
and gives rise to a strong characteristic band in the far-infrared spectral region, which is correlated
quantitatively with the complexation energy. The out-of-plane OH librational band origins ranging from
324.5 to 658.9 cm�1 have been assigned experimentally for a series of four binary hydrogen-bonded
H2O complexes embedded in solid neon involving S-, O- and N-containing compounds with increasing
hydrogen bond acceptor capability. The hydrogen bond energies for altogether eight binary H2O
complexes relative to the experimental value of 13.2 � 0.12 kJ mol�1 for the prototypical (H2O)2 system
[Rocher-Casterline et al., J. Chem. Phys., 2011, 134, 211101] are revealed directly by these far-infrared
spectroscopic observables. The far-infrared spectral signatures are able to capture even minor
differences in the hydrogen bond acceptor capability of O atoms with slightly different alkyl substituents
in the order H–O–C(CH3)3 4 CH3–O–CH3 4 H–O–CH(CH3)2 4 H–O–CH2CH3.
1. Introduction
The out-of-plane hydrogen bond librational band is the mostprominent spectroscopic manifestation of bulk water and theassociated large-amplitude intermolecular vibrational motionof H2O clusters is of enormous importance for the uniquehydrogen bond rearrangement dynamics in liquid water. Theexcitation of these large-amplitude vibrational coordinates,which occurs in the 300–900 cm�1 spectral region, has beenshown to comprise motions which are breaking and formingintermolecular hydrogen bonds between individual molecules.Saykally and co-workers have reported three orders of magnitudeshorter lifetimes of the intermolecular hydrogen bonds in (H2O)n
(n = 2–6) clusters upon single excitations of out-of-plane OHlibrational modes, demonstrating the importance of this class oflarge-amplitude hindered rotational motion.1–5 A moleculardynamics simulation investigation by Chandler and co-workerssupportingly has demonstrated that these hindered rotationalmotions play more significant roles than the hindered transla-tional motions in the hydrogen bond breaking processes of bulkwater.6
The two-body interactions represented by the prototypicalhydrogen-bonded (H2O)2 system account for 90% of the totalcohesive energy of both solid and liquid water.7–9 The large-amplitude intermolecular librational motion of (H2O)2 hasboth been extensively investigated by high-resolution vibra-tion–rotation-tunneling laser spectroscopy of seeded supersonicmolecular beams10 and complementary low-resolution Fouriertransform spectroscopy of doped cryogenic neon matrices at 3 K.11–14
The complexation of two H2O molecules reveals two infraredactive large-amplitude intermolecular librational modes asso-ciated with the hydrogen bond donor subunit; a highly localizedout-of-plane OH librational mode observed at 522.4 cm�1 incryogenic neon matrices13 and 523.7 cm�1 (Ka = 1) in supersonicmolecular beams1 together with an in-plane c-axis librationalmode involving the entire donor H2O molecule observed at309.1 cm�1 in cryogenic neon matrices13 but yet unobserved inmolecular beams. The vibration–rotation-tunneling THz laserapproach has provided a wealth of information about thecomplete 12-D intermolecular potential energy surface of theprototypical (H2O)2 system and the three existing low-energybarrier tunneling pathways.15–17
The highly localized nature of out-of-plane hydrogen bonddonor librational motion has previously proven much useful asan indicator for the hydrogen bond energy for a series of binary
Department of Chemistry, Technical University of Denmark, Kemitorvet 206,
2800 Kgs. Lyngby, Denmark. E-mail: [email protected]
Received 23rd September 2018,Accepted 17th December 2018
DOI: 10.1039/c8cp05985c
rsc.li/pccp
PCCP
PAPER
Publ
ishe
d on
09
Janu
ary
2019
. Dow
nloa
ded
by D
TU
Lib
rary
on
1/21
/202
0 10
:13:
00 A
M.
View Article OnlineView Journal | View Issue
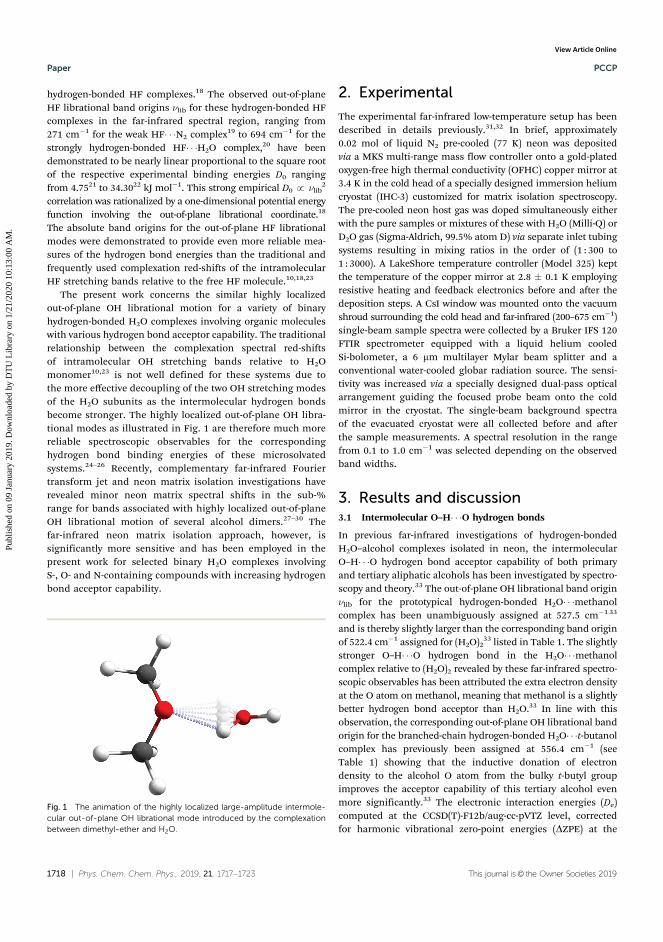
1718 | Phys. Chem. Chem. Phys., 2019, 21, 1717--1723 This journal is© the Owner Societies 2019
hydrogen-bonded HF complexes.18 The observed out-of-planeHF librational band origins nlib for these hydrogen-bonded HFcomplexes in the far-infrared spectral region, ranging from271 cm�1 for the weak HF� � �N2 complex19 to 694 cm�1 for thestrongly hydrogen-bonded HF� � �H2O complex,20 have beendemonstrated to be nearly linear proportional to the square rootof the respective experimental binding energies D0 rangingfrom 4.7521 to 34.3022 kJ mol�1. This strong empirical D0 p nlib
2
correlation was rationalized by a one-dimensional potential energyfunction involving the out-of-plane librational coordinate.18
The absolute band origins for the out-of-plane HF librationalmodes were demonstrated to provide even more reliable mea-sures of the hydrogen bond energies than the traditional andfrequently used complexation red-shifts of the intramolecularHF stretching bands relative to the free HF molecule.10,18,23
The present work concerns the similar highly localizedout-of-plane OH librational motion for a variety of binaryhydrogen-bonded H2O complexes involving organic moleculeswith various hydrogen bond acceptor capability. The traditionalrelationship between the complexation spectral red-shiftsof intramolecular OH stretching bands relative to H2Omonomer10,23 is not well defined for these systems due tothe more effective decoupling of the two OH stretching modesof the H2O subunits as the intermolecular hydrogen bondsbecome stronger. The highly localized out-of-plane OH libra-tional modes as illustrated in Fig. 1 are therefore much morereliable spectroscopic observables for the correspondinghydrogen bond binding energies of these microsolvatedsystems.24–26 Recently, complementary far-infrared Fouriertransform jet and neon matrix isolation investigations haverevealed minor neon matrix spectral shifts in the sub-%range for bands associated with highly localized out-of-planeOH librational motion of several alcohol dimers.27–30 Thefar-infrared neon matrix isolation approach, however, issignificantly more sensitive and has been employed in thepresent work for selected binary H2O complexes involvingS-, O- and N-containing compounds with increasing hydrogenbond acceptor capability.
2. Experimental
The experimental far-infrared low-temperature setup has beendescribed in details previously.31,32 In brief, approximately0.02 mol of liquid N2 pre-cooled (77 K) neon was depositedvia a MKS multi-range mass flow controller onto a gold-platedoxygen-free high thermal conductivity (OFHC) copper mirror at3.4 K in the cold head of a specially designed immersion heliumcryostat (IHC-3) customized for matrix isolation spectroscopy.The pre-cooled neon host gas was doped simultaneously eitherwith the pure samples or mixtures of these with H2O (Milli-Q) orD2O gas (Sigma-Aldrich, 99.5% atom D) via separate inlet tubingsystems resulting in mixing ratios in the order of (1 : 300 to1 : 3000). A LakeShore temperature controller (Model 325) keptthe temperature of the copper mirror at 2.8 � 0.1 K employingresistive heating and feedback electronics before and after thedeposition steps. A CsI window was mounted onto the vacuumshroud surrounding the cold head and far-infrared (200–675 cm�1)single-beam sample spectra were collected by a Bruker IFS 120FTIR spectrometer equipped with a liquid helium cooledSi-bolometer, a 6 mm multilayer Mylar beam splitter and aconventional water-cooled globar radiation source. The sensi-tivity was increased via a specially designed dual-pass opticalarrangement guiding the focused probe beam onto the coldmirror in the cryostat. The single-beam background spectraof the evacuated cryostat were all collected before and afterthe sample measurements. A spectral resolution in the rangefrom 0.1 to 1.0 cm�1 was selected depending on the observedband widths.
3. Results and discussion3.1 Intermolecular O–H� � �O hydrogen bonds
In previous far-infrared investigations of hydrogen-bondedH2O–alcohol complexes isolated in neon, the intermolecularO–H� � �O hydrogen bond acceptor capability of both primaryand tertiary aliphatic alcohols has been investigated by spectro-scopy and theory.33 The out-of-plane OH librational band originnlib for the prototypical hydrogen-bonded H2O� � �methanolcomplex has been unambiguously assigned at 527.5 cm�1 33
and is thereby slightly larger than the corresponding band originof 522.4 cm�1 assigned for (H2O)2
33 listed in Table 1. The slightlystronger O–H� � �O hydrogen bond in the H2O� � �methanolcomplex relative to (H2O)2 revealed by these far-infrared spectro-scopic observables has been attributed the extra electron densityat the O atom on methanol, meaning that methanol is a slightlybetter hydrogen bond acceptor than H2O.33 In line with thisobservation, the corresponding out-of-plane OH librational bandorigin for the branched-chain hydrogen-bonded H2O� � �t-butanolcomplex has previously been assigned at 556.4 cm�1 (seeTable 1) showing that the inductive donation of electrondensity to the alcohol O atom from the bulky t-butyl groupimproves the acceptor capability of this tertiary alcohol evenmore significantly.33 The electronic interaction energies (De)computed at the CCSD(T)-F12b/aug-cc-pVTZ level, correctedfor harmonic vibrational zero-point energies (DZPE) at the
Fig. 1 The animation of the highly localized large-amplitude intermole-cular out-of-plane OH librational mode introduced by the complexationbetween dimethyl-ether and H2O.
Paper PCCP
Publ
ishe
d on
09
Janu
ary
2019
. Dow
nloa
ded
by D
TU
Lib
rary
on
1/21
/202
0 10
:13:
00 A
M.
View Article Online
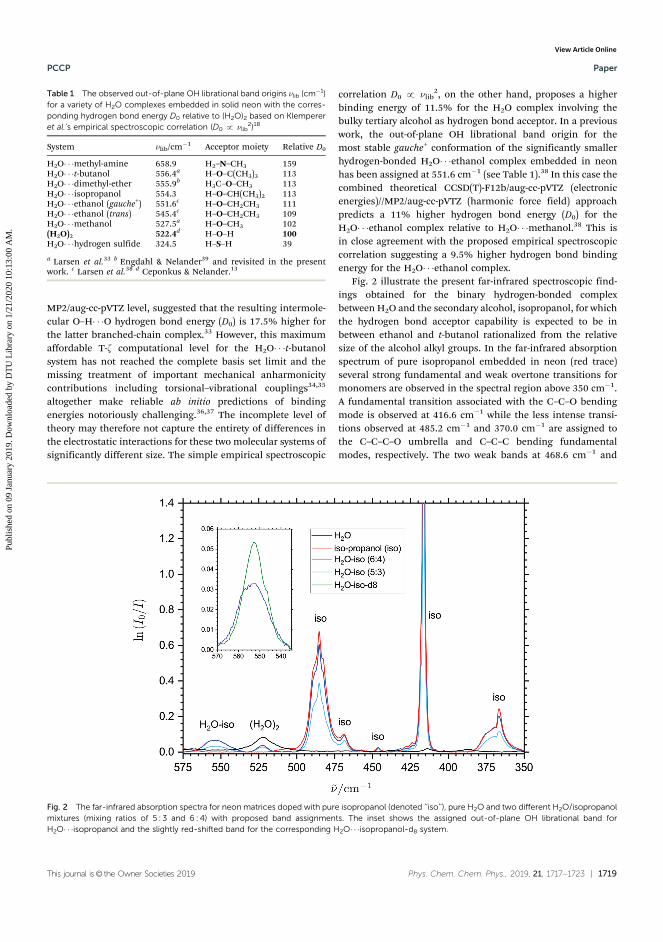
This journal is© the Owner Societies 2019 Phys. Chem. Chem. Phys., 2019, 21, 1717--1723 | 1719
MP2/aug-cc-pVTZ level, suggested that the resulting intermole-cular O–H� � �O hydrogen bond energy (D0) is 17.5% higher forthe latter branched-chain complex.33 However, this maximumaffordable T-z computational level for the H2O� � �t-butanolsystem has not reached the complete basis set limit and themissing treatment of important mechanical anharmonicitycontributions including torsional–vibrational couplings34,35
altogether make reliable ab initio predictions of bindingenergies notoriously challenging.36,37 The incomplete level oftheory may therefore not capture the entirety of differences inthe electrostatic interactions for these two molecular systems ofsignificantly different size. The simple empirical spectroscopic
correlation D0 p nlib2, on the other hand, proposes a higher
binding energy of 11.5% for the H2O complex involving thebulky tertiary alcohol as hydrogen bond acceptor. In a previouswork, the out-of-plane OH librational band origin for themost stable gauche+ conformation of the significantly smallerhydrogen-bonded H2O� � �ethanol complex embedded in neonhas been assigned at 551.6 cm�1 (see Table 1).38 In this case thecombined theoretical CCSD(T)-F12b/aug-cc-pVTZ (electronicenergies)//MP2/aug-cc-pVTZ (harmonic force field) approachpredicts a 11% higher hydrogen bond energy (D0) for theH2O� � �ethanol complex relative to H2O� � �methanol.38 This isin close agreement with the proposed empirical spectroscopiccorrelation suggesting a 9.5% higher hydrogen bond bindingenergy for the H2O� � �ethanol complex.
Fig. 2 illustrate the present far-infrared spectroscopic find-ings obtained for the binary hydrogen-bonded complexbetween H2O and the secondary alcohol, isopropanol, for whichthe hydrogen bond acceptor capability is expected to be inbetween ethanol and t-butanol rationalized from the relativesize of the alcohol alkyl groups. In the far-infrared absorptionspectrum of pure isopropanol embedded in neon (red trace)several strong fundamental and weak overtone transitions formonomers are observed in the spectral region above 350 cm�1.A fundamental transition associated with the C–C–O bendingmode is observed at 416.6 cm�1 while the less intense transi-tions observed at 485.2 cm�1 and 370.0 cm�1 are assigned tothe C–C–C–O umbrella and C–C–C bending fundamentalmodes, respectively. The two weak bands at 468.6 cm�1 and
Table 1 The observed out-of-plane OH librational band origins nlib (cm�1)for a variety of H2O complexes embedded in solid neon with the corres-ponding hydrogen bond energy D0 relative to (H2O)2 based on Klempereret al.’s empirical spectroscopic correlation (D0 p nlib
2)18
System nlib/cm�1 Acceptor moiety Relative D0
H2O� � �methyl-amine 658.9 H2–N–CH3 159H2O� � �t-butanol 556.4a H–O–C(CH3)3 113H2O� � �dimethyl-ether 555.9b H3C–O–CH3 113H2O� � �isopropanol 554.3 H–O–CH(CH3)2 113H2O� � �ethanol (gauche+) 551.6c H–O–CH2CH3 111H2O� � �ethanol (trans) 545.4c H–O–CH2CH3 109H2O� � �methanol 527.5a H–O–CH3 102(H2O)2 522.4d H–O–H 100H2O� � �hydrogen sulfide 324.5 H–S–H 39
a Larsen et al.33 b Engdahl & Nelander39 and revisited in the presentwork. c Larsen et al.38 d Ceponkus & Nelander.13
Fig. 2 The far-infrared absorption spectra for neon matrices doped with pure isopropanol (denoted ‘‘iso’’), pure H2O and two different H2O/isopropanolmixtures (mixing ratios of 5 : 3 and 6 : 4) with proposed band assignments. The inset shows the assigned out-of-plane OH librational band forH2O� � �isopropanol and the slightly red-shifted band for the corresponding H2O� � �isopropanol-d8 system.
PCCP Paper
Publ
ishe
d on
09
Janu
ary
2019
. Dow
nloa
ded
by D
TU
Lib
rary
on
1/21
/202
0 10
:13:
00 A
M.
View Article Online
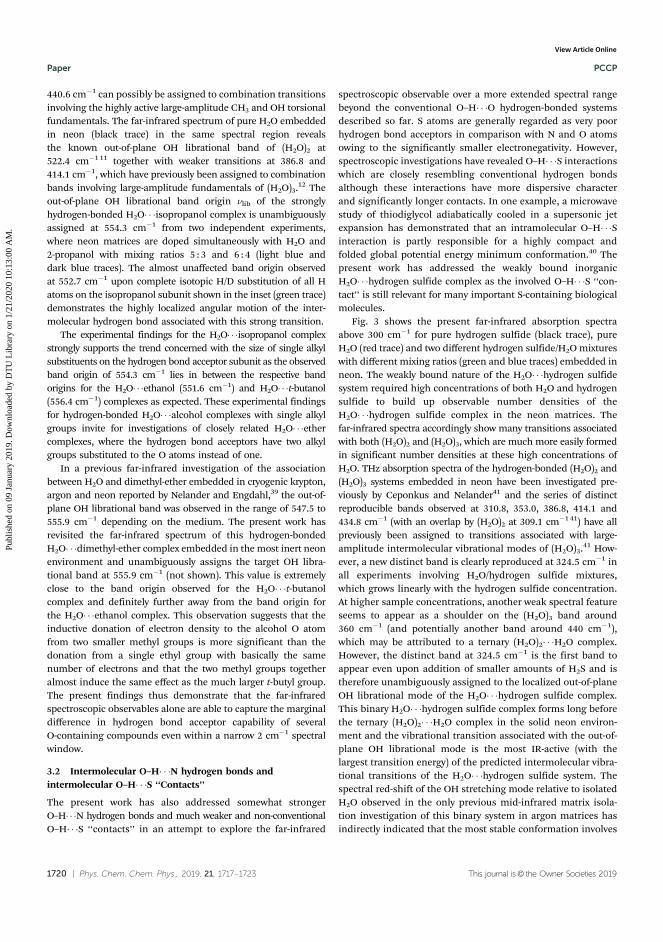
1720 | Phys. Chem. Chem. Phys., 2019, 21, 1717--1723 This journal is© the Owner Societies 2019
440.6 cm�1 can possibly be assigned to combination transitionsinvolving the highly active large-amplitude CH3 and OH torsionalfundamentals. The far-infrared spectrum of pure H2O embeddedin neon (black trace) in the same spectral region revealsthe known out-of-plane OH librational band of (H2O)2 at522.4 cm�1 11 together with weaker transitions at 386.8 and414.1 cm�1, which have previously been assigned to combinationbands involving large-amplitude fundamentals of (H2O)3.12 Theout-of-plane OH librational band origin nlib of the stronglyhydrogen-bonded H2O� � �isopropanol complex is unambiguouslyassigned at 554.3 cm�1 from two independent experiments,where neon matrices are doped simultaneously with H2O and2-propanol with mixing ratios 5 : 3 and 6 : 4 (light blue anddark blue traces). The almost unaffected band origin observedat 552.7 cm�1 upon complete isotopic H/D substitution of all Hatoms on the isopropanol subunit shown in the inset (green trace)demonstrates the highly localized angular motion of the inter-molecular hydrogen bond associated with this strong transition.
The experimental findings for the H2O� � �isopropanol complexstrongly supports the trend concerned with the size of single alkylsubstituents on the hydrogen bond acceptor subunit as the observedband origin of 554.3 cm�1 lies in between the respective bandorigins for the H2O� � �ethanol (551.6 cm�1) and H2O� � �t-butanol(556.4 cm�1) complexes as expected. These experimental findingsfor hydrogen-bonded H2O� � �alcohol complexes with single alkylgroups invite for investigations of closely related H2O� � �ethercomplexes, where the hydrogen bond acceptors have two alkylgroups substituted to the O atoms instead of one.
In a previous far-infrared investigation of the associationbetween H2O and dimethyl-ether embedded in cryogenic krypton,argon and neon reported by Nelander and Engdahl,39 the out-of-plane OH librational band was observed in the range of 547.5 to555.9 cm�1 depending on the medium. The present work hasrevisited the far-infrared spectrum of this hydrogen-bondedH2O� � �dimethyl-ether complex embedded in the most inert neonenvironment and unambiguously assigns the target OH libra-tional band at 555.9 cm�1 (not shown). This value is extremelyclose to the band origin observed for the H2O� � �t-butanolcomplex and definitely further away from the band origin forthe H2O� � �ethanol complex. This observation suggests that theinductive donation of electron density to the alcohol O atomfrom two smaller methyl groups is more significant than thedonation from a single ethyl group with basically the samenumber of electrons and that the two methyl groups togetheralmost induce the same effect as the much larger t-butyl group.The present findings thus demonstrate that the far-infraredspectroscopic observables alone are able to capture the marginaldifference in hydrogen bond acceptor capability of severalO-containing compounds even within a narrow 2 cm�1 spectralwindow.
3.2 Intermolecular O–H� � �N hydrogen bonds andintermolecular O–H� � �S ‘‘Contacts’’
The present work has also addressed somewhat strongerO–H� � �N hydrogen bonds and much weaker and non-conventionalO–H� � �S ‘‘contacts’’ in an attempt to explore the far-infrared
spectroscopic observable over a more extended spectral rangebeyond the conventional O–H� � �O hydrogen-bonded systemsdescribed so far. S atoms are generally regarded as very poorhydrogen bond acceptors in comparison with N and O atomsowing to the significantly smaller electronegativity. However,spectroscopic investigations have revealed O–H� � �S interactionswhich are closely resembling conventional hydrogen bondsalthough these interactions have more dispersive characterand significantly longer contacts. In one example, a microwavestudy of thiodiglycol adiabatically cooled in a supersonic jetexpansion has demonstrated that an intramolecular O–H� � �Sinteraction is partly responsible for a highly compact andfolded global potential energy minimum conformation.40 Thepresent work has addressed the weakly bound inorganicH2O� � �hydrogen sulfide complex as the involved O–H� � �S ‘‘con-tact’’ is still relevant for many important S-containing biologicalmolecules.
Fig. 3 shows the present far-infrared absorption spectraabove 300 cm�1 for pure hydrogen sulfide (black trace), pureH2O (red trace) and two different hydrogen sulfide/H2O mixtureswith different mixing ratios (green and blue traces) embedded inneon. The weakly bound nature of the H2O� � �hydrogen sulfidesystem required high concentrations of both H2O and hydrogensulfide to build up observable number densities of theH2O� � �hydrogen sulfide complex in the neon matrices. Thefar-infrared spectra accordingly show many transitions associatedwith both (H2O)2 and (H2O)3, which are much more easily formedin significant number densities at these high concentrations ofH2O. THz absorption spectra of the hydrogen-bonded (H2O)2 and(H2O)3 systems embedded in neon have been investigated pre-viously by Ceponkus and Nelander41 and the series of distinctreproducible bands observed at 310.8, 353.0, 386.8, 414.1 and434.8 cm�1 (with an overlap by (H2O)2 at 309.1 cm�1 41) have allpreviously been assigned to transitions associated with large-amplitude intermolecular vibrational modes of (H2O)3.41 How-ever, a new distinct band is clearly reproduced at 324.5 cm�1 inall experiments involving H2O/hydrogen sulfide mixtures,which grows linearly with the hydrogen sulfide concentration.At higher sample concentrations, another weak spectral featureseems to appear as a shoulder on the (H2O)3 band around360 cm�1 (and potentially another band around 440 cm�1),which may be attributed to a ternary (H2O)2� � �H2O complex.However, the distinct band at 324.5 cm�1 is the first band toappear even upon addition of smaller amounts of H2S and istherefore unambiguously assigned to the localized out-of-planeOH librational mode of the H2O� � �hydrogen sulfide complex.This binary H2O� � �hydrogen sulfide complex forms long beforethe ternary (H2O)2� � �H2O complex in the solid neon environ-ment and the vibrational transition associated with the out-of-plane OH librational mode is the most IR-active (with thelargest transition energy) of the predicted intermolecular vibra-tional transitions of the H2O� � �hydrogen sulfide system. Thespectral red-shift of the OH stretching mode relative to isolatedH2O observed in the only previous mid-infrared matrix isola-tion investigation of this binary system in argon matrices hasindirectly indicated that the most stable conformation involves
Paper PCCP
Publ
ishe
d on
09
Janu
ary
2019
. Dow
nloa
ded
by D
TU
Lib
rary
on
1/21
/202
0 10
:13:
00 A
M.
View Article Online
This journal is© the Owner Societies 2019 Phys. Chem. Chem. Phys., 2019, 21, 1717--1723 | 1721
H2O as the donor of a hydrogen atom to the S atom on hydrogensulfide.42 The out-of-plane SH librational mode of the 1 : 1complex having hydrogen sulfide as hydrogen bond donorwould furthermore be expected to have much lower transitionenergy (and a significantly low band intensity) according to aprevious quantum chemical investigation.43 This unambiguousfar-infrared observable alone thus suggests a O–H� � �S inter-action energy of the H2O� � �hydrogen sulfide complex almostthree times smaller than the considered H2O� � �alcohol com-plexes involving conventional O–H� � �O hydrogen bonds.
Fig. 4 shows the present far-infrared absorption spectraobtained above 400 cm�1 for pure methyl-amine (black trace)and mixtures of methyl-amine with H2O (green trace) andD2O (red trace) embedded in neon to explore the binaryH2O� � �methylamine complex involving the somewhat strongerO–H� � �N hydrogen bond. These experiments required a special-ized dual-inlet deposition system in order to avoid isotopic H/Dexchange between the D2O and methyl-amine samples priordeposition.29 The far-infrared spectrum of pure methyl-aminein the region below 400 cm�1 (not shown) is rather complicatedowing to the CH3 torsional motion of methyl-amine and severalbands associated with large-amplitude modes of the methyl-amine dimer, which shall not be described further. However, twonew distinct bands observed at 419.8 and 658.9 cm�1, the lattervery close to the Si-bolometer cut-off, are clearly reproducedwhenever H2O and methyl-amine are deposited in neon simulta-neously. The intensities of both bands increase after annealingof the doped neon matrix to 9 K for 5 min (blue trace).
This observation indicates that the two bands should both beassigned to complexes involving H2O as the light H2O moleculesare able to diffuse in the ‘‘warmer’’ and thereby soft neon matrixand interact with neighboring association partners. A somewhatbroad but still distinct band is reproduced at 508 cm�1 wheneverD2O and methyl-amine is deposited in neon simultaneously.This band is probably overlapped with small traces of theHDO� � �methyl-amine complex explaining the larger band width.The ratio of the observed 658.9 and 508 cm�1 band origins of
ca. 1.3 is close to the harmonic value offfiffiffi
2p
expected for the highlylocalized OH (OD) librational motion and the two bands areaccordingly assigned to the large-amplitude out-of-plane OH/ODlibrational modes of the H2O� � �methyl-amine and D2O� � �methyl-amine complexes, respectively. The strong band reproduced at419.8 cm�1 in the far-infrared spectra for the H2O/methyl-aminemixtures, which is also observable in the far-infrared spectra formethyl-amine due to small traces of H2O from the inlet system, isassigned to the in-plane H2O librational mode (c-axis libration) ofthis strongly hydrogen-bonded H2O� � �methyl-amine complex.Based on these assignments, the empirical spectroscopiccorrelation indicates that the O–H� � �N hydrogen bond of theH2O� � �methyl-amine complex is 55% stronger than the corres-ponding O–H� � �O hydrogen bond of the H2O� � �methanolcomplex, where the hydrogen bond acceptor moiety containsthe same alkyl group substituent.
Table 1 reports the observed out-of-plane OH librationalband origins for the four systems investigated in the presentcontribution together with our previous observations for a
Fig. 3 The far-infrared absorption spectra obtained for neon matrices doped with pure H2S, pure H2O and two different H2S/H2O mixtures with mixingratios of 1 : 1 and 2 : 1 and the proposed assignment for the out-of-plane OH librational band of the binary H2O� � �H2S complex. The spectra have beennormalized to the strong band observed at 310.8 cm�1 in the far-infrared spectrum obtained for pure H2O in neon.
PCCP Paper
Publ
ishe
d on
09
Janu
ary
2019
. Dow
nloa
ded
by D
TU
Lib
rary
on
1/21
/202
0 10
:13:
00 A
M.
View Article Online
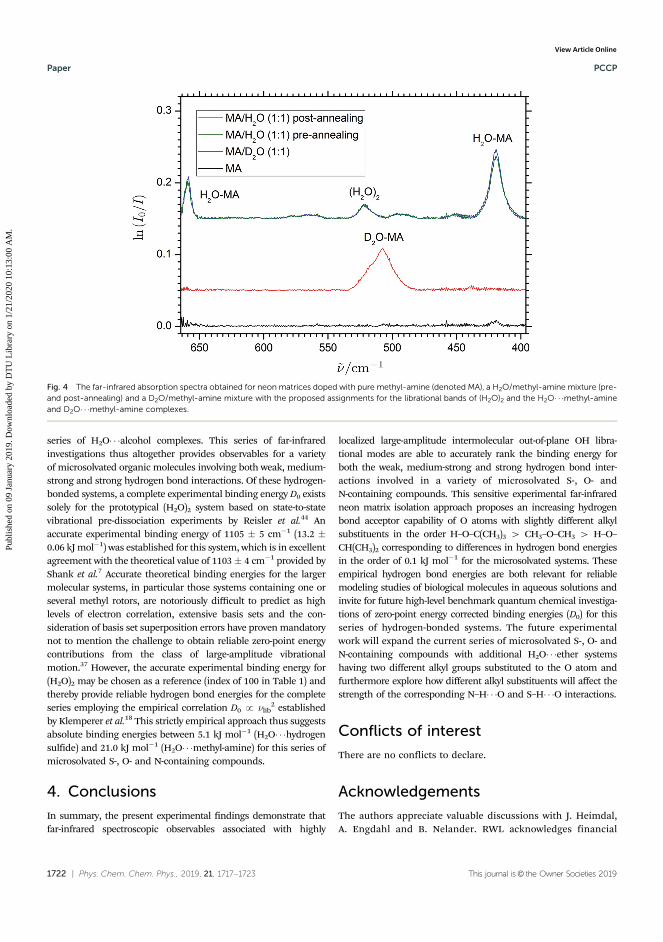
1722 | Phys. Chem. Chem. Phys., 2019, 21, 1717--1723 This journal is© the Owner Societies 2019
series of H2O� � �alcohol complexes. This series of far-infraredinvestigations thus altogether provides observables for a varietyof microsolvated organic molecules involving both weak, medium-strong and strong hydrogen bond interactions. Of these hydrogen-bonded systems, a complete experimental binding energy D0 existssolely for the prototypical (H2O)2 system based on state-to-statevibrational pre-dissociation experiments by Reisler et al.44 Anaccurate experimental binding energy of 1105 � 5 cm�1 (13.2 �0.06 kJ mol�1) was established for this system, which is in excellentagreement with the theoretical value of 1103� 4 cm�1 provided byShank et al.7 Accurate theoretical binding energies for the largermolecular systems, in particular those systems containing one orseveral methyl rotors, are notoriously difficult to predict as highlevels of electron correlation, extensive basis sets and the con-sideration of basis set superposition errors have proven mandatorynot to mention the challenge to obtain reliable zero-point energycontributions from the class of large-amplitude vibrationalmotion.37 However, the accurate experimental binding energy for(H2O)2 may be chosen as a reference (index of 100 in Table 1) andthereby provide reliable hydrogen bond energies for the completeseries employing the empirical correlation D0 p nlib
2 establishedby Klemperer et al.18 This strictly empirical approach thus suggestsabsolute binding energies between 5.1 kJ mol�1 (H2O� � �hydrogensulfide) and 21.0 kJ mol�1 (H2O� � �methyl-amine) for this series ofmicrosolvated S-, O- and N-containing compounds.
4. Conclusions
In summary, the present experimental findings demonstrate thatfar-infrared spectroscopic observables associated with highly
localized large-amplitude intermolecular out-of-plane OH libra-tional modes are able to accurately rank the binding energy forboth the weak, medium-strong and strong hydrogen bond inter-actions involved in a variety of microsolvated S-, O- andN-containing compounds. This sensitive experimental far-infraredneon matrix isolation approach proposes an increasing hydrogenbond acceptor capability of O atoms with slightly different alkylsubstituents in the order H–O–C(CH3)3 4 CH3–O–CH3 4 H–O–CH(CH3)2 corresponding to differences in hydrogen bond energiesin the order of 0.1 kJ mol�1 for the microsolvated systems. Theseempirical hydrogen bond energies are both relevant for reliablemodeling studies of biological molecules in aqueous solutions andinvite for future high-level benchmark quantum chemical investiga-tions of zero-point energy corrected binding energies (D0) for thisseries of hydrogen-bonded systems. The future experimentalwork will expand the current series of microsolvated S-, O- andN-containing compounds with additional H2O� � �ether systemshaving two different alkyl groups substituted to the O atom andfurthermore explore how different alkyl substituents will affect thestrength of the corresponding N–H� � �O and S–H� � �O interactions.
Conflicts of interest
There are no conflicts to declare.
Acknowledgements
The authors appreciate valuable discussions with J. Heimdal,A. Engdahl and B. Nelander. RWL acknowledges financial
Fig. 4 The far-infrared absorption spectra obtained for neon matrices doped with pure methyl-amine (denoted MA), a H2O/methyl-amine mixture (pre-and post-annealing) and a D2O/methyl-amine mixture with the proposed assignments for the librational bands of (H2O)2 and the H2O� � �methyl-amineand D2O� � �methyl-amine complexes.
Paper PCCP
Publ
ishe
d on
09
Janu
ary
2019
. Dow
nloa
ded
by D
TU
Lib
rary
on
1/21
/202
0 10
:13:
00 A
M.
View Article Online
This journal is© the Owner Societies 2019 Phys. Chem. Chem. Phys., 2019, 21, 1717--1723 | 1723
support from the Danish Council for Independent Research’sSapere Aude Programme (Grant Ref. 12-125248).
References
1 W. T. S. Cole, R. S. Fellers, M. R. Viant, C. Leforestier andR. J. Saykally, J. Chem. Phys., 2015, 143(15), 154306.
2 W. T. S. Cole, R. S. Fellers, M. R. Viant and R. J. Saykally,J. Chem. Phys., 2017, 146(1), 014306.
3 W. T. S. Cole, J. D. Farrell, A. A. Sheikh, Y. Oezlem,R. S. Fellers, M. R. Viant, D. J. Wales and R. J. Saykally,J. Chem. Phys., 2018, 148(9), 094301.
4 F. N. Keutsch, R. S. Fellers, M. G. Brown, M. R. Viant, P. B.Petersen and R. J. Saykally, JACS, 2001, 123(25), 5938–5941.
5 F. N. Keutsch, R. S. Fellers, M. R. Viant and R. J. Saykally,J. Chem. Phys., 2001, 114(9), 4005–4015.
6 A. Luzar and D. Chandler, Nature, 1996, 379, 55–57.7 A. Shank, Y. Wang, A. Kaledin, B. J. Braams and J. M. Bowman,
J. Chem. Phys., 2009, 130, 144314.8 N. Goldman, R. S. Fellers, M. G. Brown, L. B. Braly, C. J.
Keoshian, C. Leforestier and R. J. Saykally, J. Phys. Chem.,2002, 116(23), 10148.
9 M. P. Hodges, A. J. Stone and S. S. Xantheas, J. Phys.Chem. A, 1997, 101(48), 9163–9168.
10 R. M. Badger and S. H. Bauer, J. Chem. Phys., 1937, 5(11),839–851.
11 J. Ceponkus, P. Uvdal and B. Nelander, J. Chem. Phys., 2008,129(19), 194306.
12 J. Ceponkus, A. Engdahl, P. Uvdal and B. Nelander, Chem.Phys. Lett., 2013, 581, 1–9.
13 J. Ceponkus and B. Nelander, J. Phys. Chem. A, 2004, 108(31),6499–6502.
14 J. Ceponkus, P. Uvdal and B. Nelander, J. Chem. Phys., 2010,133(7), 074301.
15 N. Goldman, C. Leforestier and R. J. Saykally, Philos. Trans.R. Soc., A, 2005, 363(1827), 493–508.
16 C. Leforestier, F. Gatti, R. S. Fellers and R. J. Saykally, J. Phys.Chem., 2002, 117(19), 8710.
17 C. Leforestier, J. Chem. Phys., 2014, 140(7), 074106.18 Y. Zhenhong and W. Klemperer, PNAS, 2005, 102(36),
12667–12669.19 M. Goubet, P. Asselin, L. Manceron, P. Soulard and J. P.
Perchard, Phys. Chem. Chem. Phys., 2003, 5, 3591–3594.20 L. Andrews, J. Phys. Chem., 1984, 88, 2940–2949.
21 R. J. Benish, E. J. Bohac, M. Wu and R. E. Miller, J. Chem.Phys., 1994, 101, 9457–9468.
22 A. C. Legon, D. J. Millen and H. M. North, Chem. Phys. Lett.,1987, 135, 303–306.
23 A. V. Iogansen, Spectrochim. Acta, Part A, 1999, 55, 1585–1612.24 B. Nelander, Chem. Phys., 1992, 159, 281–287.25 A. Engdahl, Chem. Phys., 1993, 178, 305–314.26 S. Jarmelo, I. Reva, M. Rozenberg, M. Ramos Silva, A. M. Matos
Beja and R. Fausto, J. Phys. Chem. B, 2008, 112, 8032–8041.27 R. Wugt Larsen and M. A. Suhm, J. Chem. Phys., 2006,
125, 154314.28 R. Wugt Larsen and M. A. Suhm, Phys. Chem. Chem. Phys.,
2010, 12, 8152–8157.29 F. Kollipost, J. Andersen, D. Mahler, J. Heimdal, M. Heger,
M. A. Suhm and R. Wugt Larsen, J. Chem. Phys., 2014, 141, 174314.30 J. Andersen, PhD thesis, Technical University of Denmark,
Kongens Lyngby, Denmark, 2016.31 J. Andersen, J. Heimdal, D. W. Mahler, B. Nelander and
R. Wugt Larsen, J. Chem. Phys., 2014, 140(9), 091103.32 J. Andersen, J. Heimdal, B. Nelander and R. Wugt Larsen,
J. Chem. Phys., 2017, 146, 194302.33 J. Andersen, J. Heimdal and R. Wugt Larsen, Phys. Chem.
Chem. Phys., 2015, 17, 23761–23769.34 V. Barone, J. Chem. Phys., 2005, 122, 14108.35 V. Barone, M. Biczysko, J. Bloino, M. Borkowska-Panek,
I. Carnimeo and P. Panek, Int. J. Quantum Chem., 2012,112, 2185–2200.
36 A. Poblotzki, H. C. Gottschalk and M. A. Suhm, J. Phys.Chem. Lett., 2017, 8, 5656–5665.
37 R. A. Mata and M. A. Suhm, Angew. Chem., Int. Ed., 2017, 56,11011–11018.
38 J. Andersen, J. Heimdal and R. Wugt Larsen, J. Chem. Phys.,2015, 143(22), 224315.
39 A. Engdahl and B. Nelander, J. Chem. Soc., Faraday Trans.,1992, 88(2), 177–182.
40 L.-H. Xu, Q. Liu, R. D. Suenram, F. J. Lovas, A. R. HightWalker, J. O. Jensen and A. C. Samuels, J. Mol. Spectrosc.,2004, 228, 243–250.
41 J. Ceponkus, G. Karlstrom and B. Nelander, J. Phys. Chem. A,2005, 109(35), 7859–7864.
42 A. J. Barnes, R. M. Bentwood and M. P. Wright, J. Mol.Struct., 1984, 118(1-2), 97–102.
43 R. D. Amos, Chem. Phys., 1986, 104(1), 145–151.44 B. E. Rocher-Casterline, L. C. Ch’ng, A. K. Mollner and
H. Reisler, J. Chem. Phys., 2011, 134, 211101.
PCCP Paper
Publ
ishe
d on
09
Janu
ary
2019
. Dow
nloa
ded
by D
TU
Lib
rary
on
1/21
/202
0 10
:13:
00 A
M.
View Article Online
D.2 THz spectroscopy of weakly bound cluster molecules in solid para-hydrogen: a sensitive probe ofvan der Waals interactions 197
D.2 THz spectroscopy of weakly bound cluster
molecules in solid para-hydrogen: a sensitive
probe of van der Waals interactionsReprinted with permission from:Mihrin, D., Larsen, R. W. (2019). THz spectroscopy of weakly bound cluster molecules insolid para-hydrogen: a sensitive probe of van der Waals interactions.Physical Chemistry Chemical Physics, 21(1), 349-358.https://doi.org/10.1039/c8cp05060k
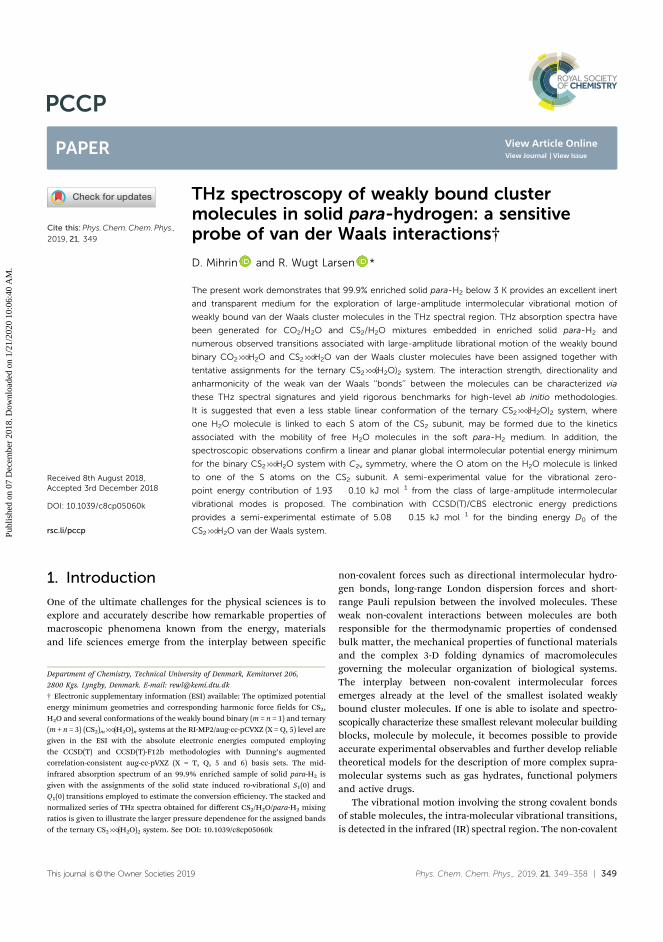
This journal is© the Owner Societies 2019 Phys. Chem. Chem. Phys., 2019, 21, 349--358 | 349
Cite this:Phys.Chem.Chem.Phys.,
2019, 21, 349
THz spectroscopy of weakly bound clustermolecules in solid para-hydrogen: a sensitiveprobe of van der Waals interactions†
D. Mihrin and R. Wugt Larsen *
The present work demonstrates that 99.9% enriched solid para-H2 below 3 K provides an excellent inert
and transparent medium for the exploration of large-amplitude intermolecular vibrational motion of
weakly bound van der Waals cluster molecules in the THz spectral region. THz absorption spectra have
been generated for CO2/H2O and CS2/H2O mixtures embedded in enriched solid para-H2 and
numerous observed transitions associated with large-amplitude librational motion of the weakly bound
binary CO2� � �H2O and CS2� � �H2O van der Waals cluster molecules have been assigned together with
tentative assignments for the ternary CS2� � �(H2O)2 system. The interaction strength, directionality and
anharmonicity of the weak van der Waals ‘‘bonds’’ between the molecules can be characterized via
these THz spectral signatures and yield rigorous benchmarks for high-level ab initio methodologies.
It is suggested that even a less stable linear conformation of the ternary CS2� � �(H2O)2 system, where
one H2O molecule is linked to each S atom of the CS2 subunit, may be formed due to the kinetics
associated with the mobility of free H2O molecules in the soft para-H2 medium. In addition, the
spectroscopic observations confirm a linear and planar global intermolecular potential energy minimum
for the binary CS2� � �H2O system with C2v symmetry, where the O atom on the H2O molecule is linked
to one of the S atoms on the CS2 subunit. A semi-experimental value for the vibrational zero-
point energy contribution of 1.93 � 0.10 kJ mol�1 from the class of large-amplitude intermolecular
vibrational modes is proposed. The combination with CCSD(T)/CBS electronic energy predictions
provides a semi-experimental estimate of 5.08 � 0.15 kJ mol�1 for the binding energy D0 of the
CS2� � �H2O van der Waals system.
1. Introduction
One of the ultimate challenges for the physical sciences is toexplore and accurately describe how remarkable properties ofmacroscopic phenomena known from the energy, materialsand life sciences emerge from the interplay between specific
non-covalent forces such as directional intermolecular hydro-gen bonds, long-range London dispersion forces and short-range Pauli repulsion between the involved molecules. Theseweak non-covalent interactions between molecules are bothresponsible for the thermodynamic properties of condensedbulk matter, the mechanical properties of functional materialsand the complex 3-D folding dynamics of macromoleculesgoverning the molecular organization of biological systems.The interplay between non-covalent intermolecular forcesemerges already at the level of the smallest isolated weaklybound cluster molecules. If one is able to isolate and spectro-scopically characterize these smallest relevant molecular buildingblocks, molecule by molecule, it becomes possible to provideaccurate experimental observables and further develop reliabletheoretical models for the description of more complex supra-molecular systems such as gas hydrates, functional polymersand active drugs.
The vibrational motion involving the strong covalent bondsof stable molecules, the intra-molecular vibrational transitions,is detected in the infrared (IR) spectral region. The non-covalent
Department of Chemistry, Technical University of Denmark, Kemitorvet 206,
2800 Kgs. Lyngby, Denmark. E-mail: [email protected]
† Electronic supplementary information (ESI) available: The optimized potentialenergy minimum geometries and corresponding harmonic force fields for CS2,H2O and several conformations of the weakly bound binary (m = n = 1) and ternary(m + n = 3) (CS2)m� � �(H2O)n systems at the RI-MP2/aug-cc-pCVXZ (X = Q, 5) level aregiven in the ESI with the absolute electronic energies computed employingthe CCSD(T) and CCSD(T)-F12b methodologies with Dunning’s augmentedcorrelation-consistent aug-cc-pVXZ (X = T, Q, 5 and 6) basis sets. The mid-infrared absorption spectrum of an 99.9% enriched sample of solid para-H2 isgiven with the assignments of the solid state induced ro-vibrational S1(0) andQ1(0) transitions employed to estimate the conversion efficiency. The stacked andnormalized series of THz spectra obtained for different CS2/H2O/para-H2 mixingratios is given to illustrate the larger pressure dependence for the assigned bandsof the ternary CS2� � �(H2O)2 system. See DOI: 10.1039/c8cp05060k
Received 8th August 2018,Accepted 3rd December 2018
DOI: 10.1039/c8cp05060k
rsc.li/pccp
PCCP
PAPER
Publ
ishe
d on
07
Dec
embe
r 20
18. D
ownl
oade
d on
1/2
1/20
20 1
0:06
:40
AM
.
View Article OnlineView Journal | View Issue
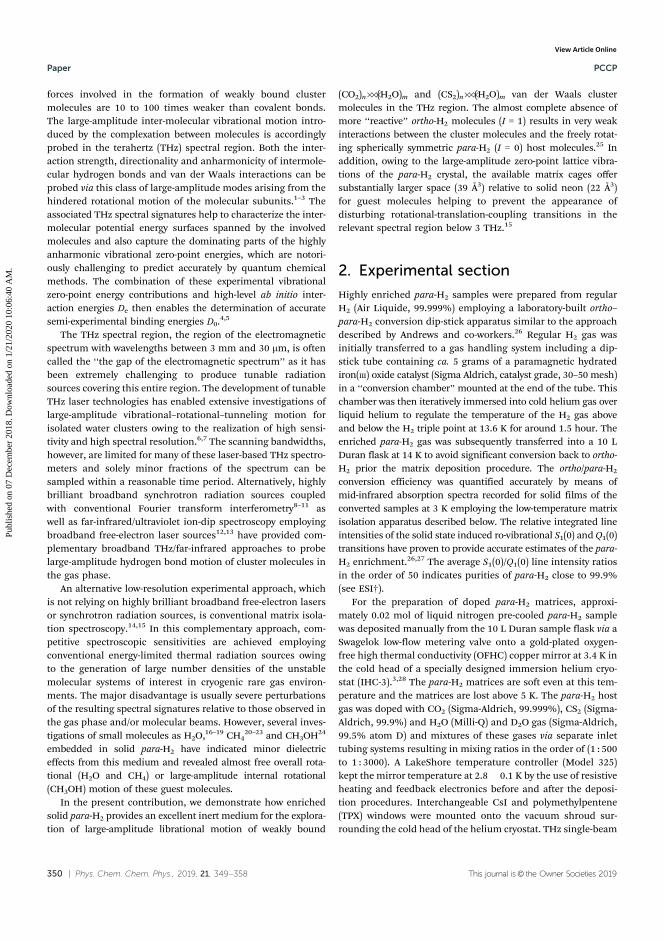
350 | Phys. Chem. Chem. Phys., 2019, 21, 349--358 This journal is© the Owner Societies 2019
forces involved in the formation of weakly bound clustermolecules are 10 to 100 times weaker than covalent bonds.The large-amplitude inter-molecular vibrational motion intro-duced by the complexation between molecules is accordinglyprobed in the terahertz (THz) spectral region. Both the inter-action strength, directionality and anharmonicity of intermole-cular hydrogen bonds and van der Waals interactions can beprobed via this class of large-amplitude modes arising from thehindered rotational motion of the molecular subunits.1–3 Theassociated THz spectral signatures help to characterize the inter-molecular potential energy surfaces spanned by the involvedmolecules and also capture the dominating parts of the highlyanharmonic vibrational zero-point energies, which are notori-ously challenging to predict accurately by quantum chemicalmethods. The combination of these experimental vibrationalzero-point energy contributions and high-level ab initio inter-action energies De then enables the determination of accuratesemi-experimental binding energies D0.4,5
The THz spectral region, the region of the electromagneticspectrum with wavelengths between 3 mm and 30 mm, is oftencalled the ‘‘the gap of the electromagnetic spectrum’’ as it hasbeen extremely challenging to produce tunable radiationsources covering this entire region. The development of tunableTHz laser technologies has enabled extensive investigations oflarge-amplitude vibrational–rotational–tunneling motion forisolated water clusters owing to the realization of high sensi-tivity and high spectral resolution.6,7 The scanning bandwidths,however, are limited for many of these laser-based THz spectro-meters and solely minor fractions of the spectrum can besampled within a reasonable time period. Alternatively, highlybrilliant broadband synchrotron radiation sources coupledwith conventional Fourier transform interferometry8–11 aswell as far-infrared/ultraviolet ion-dip spectroscopy employingbroadband free-electron laser sources12,13 have provided com-plementary broadband THz/far-infrared approaches to probelarge-amplitude hydrogen bond motion of cluster molecules inthe gas phase.
An alternative low-resolution experimental approach, whichis not relying on highly brilliant broadband free-electron lasersor synchrotron radiation sources, is conventional matrix isola-tion spectroscopy.14,15 In this complementary approach, com-petitive spectroscopic sensitivities are achieved employingconventional energy-limited thermal radiation sources owingto the generation of large number densities of the unstablemolecular systems of interest in cryogenic rare gas environ-ments. The major disadvantage is usually severe perturbationsof the resulting spectral signatures relative to those observed inthe gas phase and/or molecular beams. However, several inves-tigations of small molecules as H2O,16–19 CH4
20–23 and CH3OH24
embedded in solid para-H2 have indicated minor dielectriceffects from this medium and revealed almost free overall rota-tional (H2O and CH4) or large-amplitude internal rotational(CH3OH) motion of these guest molecules.
In the present contribution, we demonstrate how enrichedsolid para-H2 provides an excellent inert medium for the explora-tion of large-amplitude librational motion of weakly bound
(CO2)n� � �(H2O)m and (CS2)n� � �(H2O)m van der Waals clustermolecules in the THz region. The almost complete absence ofmore ‘‘reactive’’ ortho-H2 molecules (I = 1) results in very weakinteractions between the cluster molecules and the freely rotat-ing spherically symmetric para-H2 (I = 0) host molecules.25 Inaddition, owing to the large-amplitude zero-point lattice vibra-tions of the para-H2 crystal, the available matrix cages offersubstantially larger space (39 Å3) relative to solid neon (22 Å3)for guest molecules helping to prevent the appearance ofdisturbing rotational-translation-coupling transitions in therelevant spectral region below 3 THz.15
2. Experimental section
Highly enriched para-H2 samples were prepared from regularH2 (Air Liquide, 99.999%) employing a laboratory-built ortho–para-H2 conversion dip-stick apparatus similar to the approachdescribed by Andrews and co-workers.26 Regular H2 gas wasinitially transferred to a gas handling system including a dip-stick tube containing ca. 5 grams of a paramagnetic hydratediron(III) oxide catalyst (Sigma Aldrich, catalyst grade, 30–50 mesh)in a ‘‘conversion chamber’’ mounted at the end of the tube. Thischamber was then iteratively immersed into cold helium gas overliquid helium to regulate the temperature of the H2 gas aboveand below the H2 triple point at 13.6 K for around 1.5 hour. Theenriched para-H2 gas was subsequently transferred into a 10 LDuran flask at 14 K to avoid significant conversion back to ortho-H2 prior the matrix deposition procedure. The ortho/para-H2
conversion efficiency was quantified accurately by means ofmid-infrared absorption spectra recorded for solid films of theconverted samples at 3 K employing the low-temperature matrixisolation apparatus described below. The relative integrated lineintensities of the solid state induced ro-vibrational S1(0) and Q1(0)transitions have proven to provide accurate estimates of the para-H2 enrichment.26,27 The average S1(0)/Q1(0) line intensity ratiosin the order of 50 indicates purities of para-H2 close to 99.9%(see ESI†).
For the preparation of doped para-H2 matrices, approxi-mately 0.02 mol of liquid nitrogen pre-cooled para-H2 samplewas deposited manually from the 10 L Duran sample flask via aSwagelok low-flow metering valve onto a gold-plated oxygen-free high thermal conductivity (OFHC) copper mirror at 3.4 K inthe cold head of a specially designed immersion helium cryo-stat (IHC-3).3,28 The para-H2 matrices are soft even at this tem-perature and the matrices are lost above 5 K. The para-H2 hostgas was doped with CO2 (Sigma-Aldrich, 99.999%), CS2 (Sigma-Aldrich, 99.9%) and H2O (Milli-Q) and D2O gas (Sigma-Aldrich,99.5% atom D) and mixtures of these gases via separate inlettubing systems resulting in mixing ratios in the order of (1 : 500to 1 : 3000). A LakeShore temperature controller (Model 325)kept the mirror temperature at 2.8� 0.1 K by the use of resistiveheating and feedback electronics before and after the deposi-tion procedures. Interchangeable CsI and polymethylpentene(TPX) windows were mounted onto the vacuum shroud sur-rounding the cold head of the helium cryostat. THz single-beam
Paper PCCP
Publ
ishe
d on
07
Dec
embe
r 20
18. D
ownl
oade
d on
1/2
1/20
20 1
0:06
:40
AM
.
View Article Online
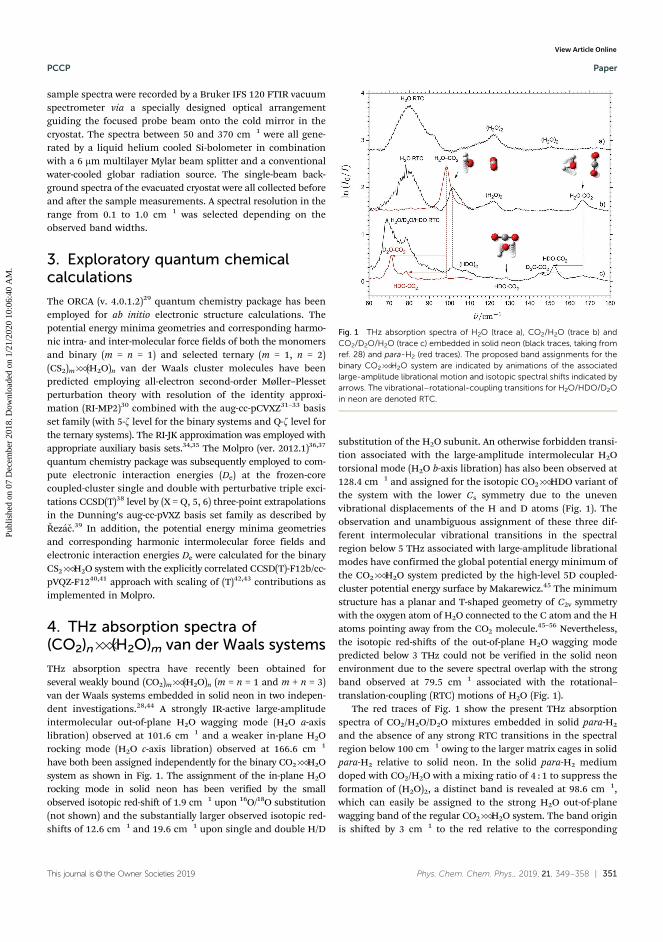
This journal is© the Owner Societies 2019 Phys. Chem. Chem. Phys., 2019, 21, 349--358 | 351
sample spectra were recorded by a Bruker IFS 120 FTIR vacuumspectrometer via a specially designed optical arrangementguiding the focused probe beam onto the cold mirror in thecryostat. The spectra between 50 and 370 cm�1 were all gene-rated by a liquid helium cooled Si-bolometer in combinationwith a 6 mm multilayer Mylar beam splitter and a conventionalwater-cooled globar radiation source. The single-beam back-ground spectra of the evacuated cryostat were all collected beforeand after the sample measurements. A spectral resolution in therange from 0.1 to 1.0 cm�1 was selected depending on theobserved band widths.
3. Exploratory quantum chemicalcalculations
The ORCA (v. 4.0.1.2)29 quantum chemistry package has beenemployed for ab initio electronic structure calculations. Thepotential energy minima geometries and corresponding harmo-nic intra- and inter-molecular force fields of both the monomersand binary (m = n = 1) and selected ternary (m = 1, n = 2)(CS2)m� � �(H2O)n van der Waals cluster molecules have beenpredicted employing all-electron second-order Møller–Plessetperturbation theory with resolution of the identity approxi-mation (RI-MP2)30 combined with the aug-cc-pCVXZ31–33 basisset family (with 5-z level for the binary systems and Q-z level forthe ternary systems). The RI-JK approximation was employed withappropriate auxiliary basis sets.34,35 The Molpro (ver. 2012.1)36,37
quantum chemistry package was subsequently employed to com-pute electronic interaction energies (De) at the frozen-corecoupled-cluster single and double with perturbative triple exci-tations CCSD(T)38 level by (X = Q, 5, 6) three-point extrapolationsin the Dunning’s aug-cc-pVXZ basis set family as described byRezac.39 In addition, the potential energy minima geometriesand corresponding harmonic intermolecular force fields andelectronic interaction energies De were calculated for the binaryCS2� � �H2O system with the explicitly correlated CCSD(T)-F12b/cc-pVQZ-F1240,41 approach with scaling of (T)42,43 contributions asimplemented in Molpro.
4. THz absorption spectra of(CO2)n� � �(H2O)m van der Waals systems
THz absorption spectra have recently been obtained forseveral weakly bound (CO2)m� � �(H2O)n (m = n = 1 and m + n = 3)van der Waals systems embedded in solid neon in two indepen-dent investigations.28,44 A strongly IR-active large-amplitudeintermolecular out-of-plane H2O wagging mode (H2O a-axislibration) observed at 101.6 cm�1 and a weaker in-plane H2Orocking mode (H2O c-axis libration) observed at 166.6 cm�1
have both been assigned independently for the binary CO2� � �H2Osystem as shown in Fig. 1. The assignment of the in-plane H2Orocking mode in solid neon has been verified by the smallobserved isotopic red-shift of 1.9 cm�1 upon 16O/18O substitution(not shown) and the substantially larger observed isotopic red-shifts of 12.6 cm�1 and 19.6 cm�1 upon single and double H/D
substitution of the H2O subunit. An otherwise forbidden transi-tion associated with the large-amplitude intermolecular H2Otorsional mode (H2O b-axis libration) has also been observed at128.4 cm�1 and assigned for the isotopic CO2� � �HDO variant ofthe system with the lower Cs symmetry due to the unevenvibrational displacements of the H and D atoms (Fig. 1). Theobservation and unambiguous assignment of these three dif-ferent intermolecular vibrational transitions in the spectralregion below 5 THz associated with large-amplitude librationalmodes have confirmed the global potential energy minimum ofthe CO2� � �H2O system predicted by the high-level 5D coupled-cluster potential energy surface by Makarewicz.45 The minimumstructure has a planar and T-shaped geometry of C2v symmetrywith the oxygen atom of H2O connected to the C atom and the Hatoms pointing away from the CO2 molecule.45–56 Nevertheless,the isotopic red-shifts of the out-of-plane H2O wagging modepredicted below 3 THz could not be verified in the solid neonenvironment due to the severe spectral overlap with the strongband observed at 79.5 cm�1 associated with the rotational–translation-coupling (RTC) motions of H2O (Fig. 1).
The red traces of Fig. 1 show the present THz absorptionspectra of CO2/H2O/D2O mixtures embedded in solid para-H2
and the absence of any strong RTC transitions in the spectralregion below 100 cm�1 owing to the larger matrix cages in solidpara-H2 relative to solid neon. In the solid para-H2 mediumdoped with CO2/H2O with a mixing ratio of 4 : 1 to suppress theformation of (H2O)2, a distinct band is revealed at 98.6 cm�1,which can easily be assigned to the strong H2O out-of-planewagging band of the regular CO2� � �H2O system. The band originis shifted by 3 cm�1 to the red relative to the corresponding
Fig. 1 THz absorption spectra of H2O (trace a), CO2/H2O (trace b) andCO2/D2O/H2O (trace c) embedded in solid neon (black traces, taking fromref. 28) and para-H2 (red traces). The proposed band assignments for thebinary CO2� � �H2O system are indicated by animations of the associatedlarge-amplitude librational motion and isotopic spectral shifts indicated byarrows. The vibrational–rotational-coupling transitions for H2O/HDO/D2Oin neon are denoted RTC.
PCCP Paper
Publ
ishe
d on
07
Dec
embe
r 20
18. D
ownl
oade
d on
1/2
1/20
20 1
0:06
:40
AM
.
View Article Online
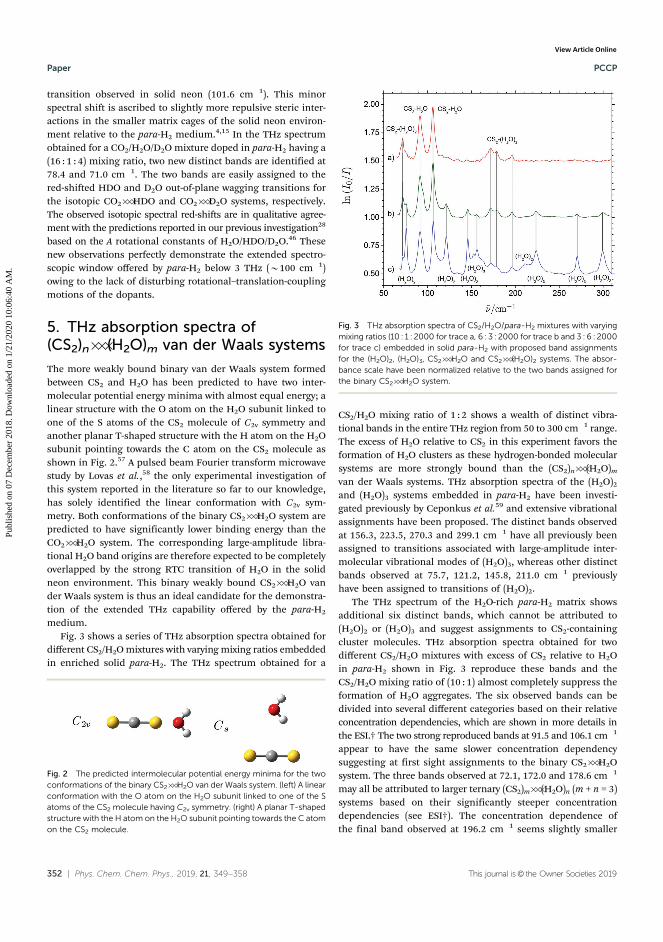
352 | Phys. Chem. Chem. Phys., 2019, 21, 349--358 This journal is© the Owner Societies 2019
transition observed in solid neon (101.6 cm�1). This minorspectral shift is ascribed to slightly more repulsive steric inter-actions in the smaller matrix cages of the solid neon environ-ment relative to the para-H2 medium.4,15 In the THz spectrumobtained for a CO2/H2O/D2O mixture doped in para-H2 having a(16 : 1 : 4) mixing ratio, two new distinct bands are identified at78.4 and 71.0 cm�1. The two bands are easily assigned to thered-shifted HDO and D2O out-of-plane wagging transitions forthe isotopic CO2� � �HDO and CO2� � �D2O systems, respectively.The observed isotopic spectral red-shifts are in qualitative agree-ment with the predictions reported in our previous investigation28
based on the A rotational constants of H2O/HDO/D2O.46 Thesenew observations perfectly demonstrate the extended spectro-scopic window offered by para-H2 below 3 THz (B100 cm�1)owing to the lack of disturbing rotational–translation-couplingmotions of the dopants.
5. THz absorption spectra of(CS2)n� � �(H2O)m van der Waals systems
The more weakly bound binary van der Waals system formedbetween CS2 and H2O has been predicted to have two inter-molecular potential energy minima with almost equal energy; alinear structure with the O atom on the H2O subunit linked toone of the S atoms of the CS2 molecule of C2v symmetry andanother planar T-shaped structure with the H atom on the H2Osubunit pointing towards the C atom on the CS2 molecule asshown in Fig. 2.57 A pulsed beam Fourier transform microwavestudy by Lovas et al.,58 the only experimental investigation ofthis system reported in the literature so far to our knowledge,has solely identified the linear conformation with C2v sym-metry. Both conformations of the binary CS2� � �H2O system arepredicted to have significantly lower binding energy than theCO2� � �H2O system. The corresponding large-amplitude libra-tional H2O band origins are therefore expected to be completelyoverlapped by the strong RTC transition of H2O in the solidneon environment. This binary weakly bound CS2� � �H2O vander Waals system is thus an ideal candidate for the demonstra-tion of the extended THz capability offered by the para-H2
medium.Fig. 3 shows a series of THz absorption spectra obtained for
different CS2/H2O mixtures with varying mixing ratios embeddedin enriched solid para-H2. The THz spectrum obtained for a
CS2/H2O mixing ratio of 1 : 2 shows a wealth of distinct vibra-tional bands in the entire THz region from 50 to 300 cm�1 range.The excess of H2O relative to CS2 in this experiment favors theformation of H2O clusters as these hydrogen-bonded molecularsystems are more strongly bound than the (CS2)n� � �(H2O)m
van der Waals systems. THz absorption spectra of the (H2O)2
and (H2O)3 systems embedded in para-H2 have been investi-gated previously by Ceponkus et al.59 and extensive vibrationalassignments have been proposed. The distinct bands observedat 156.3, 223.5, 270.3 and 299.1 cm�1 have all previously beenassigned to transitions associated with large-amplitude inter-molecular vibrational modes of (H2O)3, whereas other distinctbands observed at 75.7, 121.2, 145.8, 211.0 cm�1 previouslyhave been assigned to transitions of (H2O)2.
The THz spectrum of the H2O-rich para-H2 matrix showsadditional six distinct bands, which cannot be attributed to(H2O)2 or (H2O)3 and suggest assignments to CS2-containingcluster molecules. THz absorption spectra obtained for twodifferent CS2/H2O mixtures with excess of CS2 relative to H2Oin para-H2 shown in Fig. 3 reproduce these bands and theCS2/H2O mixing ratio of (10 : 1) almost completely suppress theformation of H2O aggregates. The six observed bands can bedivided into several different categories based on their relativeconcentration dependencies, which are shown in more details inthe ESI.† The two strong reproduced bands at 91.5 and 106.1 cm�1
appear to have the same slower concentration dependencysuggesting at first sight assignments to the binary CS2� � �H2Osystem. The three bands observed at 72.1, 172.0 and 178.6 cm�1
may all be attributed to larger ternary (CS2)m� � �(H2O)n (m + n = 3)systems based on their significantly steeper concentrationdependencies (see ESI†). The concentration dependence ofthe final band observed at 196.2 cm�1 seems slightly smaller
Fig. 2 The predicted intermolecular potential energy minima for the twoconformations of the binary CS2� � �H2O van der Waals system. (left) A linearconformation with the O atom on the H2O subunit linked to one of the Satoms of the CS2 molecule having C2v symmetry. (right) A planar T-shapedstructure with the H atom on the H2O subunit pointing towards the C atomon the CS2 molecule.
Fig. 3 THz absorption spectra of CS2/H2O/para-H2 mixtures with varyingmixing ratios (10 : 1 : 2000 for trace a, 6 : 3 : 2000 for trace b and 3 : 6 : 2000for trace c) embedded in solid para-H2 with proposed band assignmentsfor the (H2O)2, (H2O)3, CS2� � �H2O and CS2� � �(H2O)2 systems. The absor-bance scale have been normalized relative to the two bands assigned forthe binary CS2� � �H2O system.
Paper PCCP
Publ
ishe
d on
07
Dec
embe
r 20
18. D
ownl
oade
d on
1/2
1/20
20 1
0:06
:40
AM
.
View Article Online
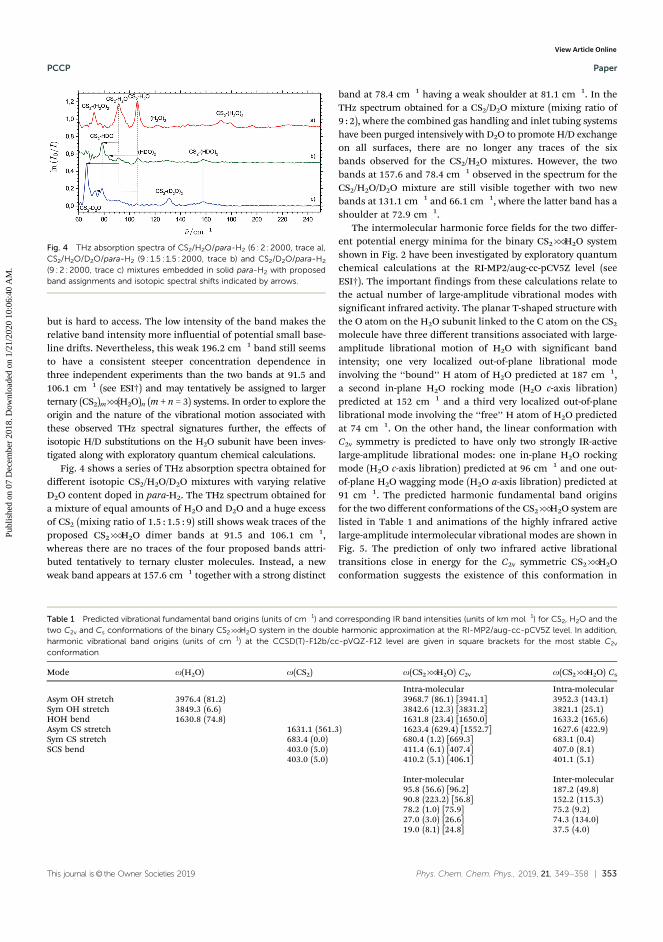
This journal is© the Owner Societies 2019 Phys. Chem. Chem. Phys., 2019, 21, 349--358 | 353
but is hard to access. The low intensity of the band makes therelative band intensity more influential of potential small base-line drifts. Nevertheless, this weak 196.2 cm�1 band still seemsto have a consistent steeper concentration dependence inthree independent experiments than the two bands at 91.5 and106.1 cm�1 (see ESI†) and may tentatively be assigned to largerternary (CS2)m� � �(H2O)n (m + n = 3) systems. In order to explore theorigin and the nature of the vibrational motion associated withthese observed THz spectral signatures further, the effects ofisotopic H/D substitutions on the H2O subunit have been inves-tigated along with exploratory quantum chemical calculations.
Fig. 4 shows a series of THz absorption spectra obtained fordifferent isotopic CS2/H2O/D2O mixtures with varying relativeD2O content doped in para-H2. The THz spectrum obtained fora mixture of equal amounts of H2O and D2O and a huge excessof CS2 (mixing ratio of 1.5 : 1.5 : 9) still shows weak traces of theproposed CS2� � �H2O dimer bands at 91.5 and 106.1 cm�1,whereas there are no traces of the four proposed bands attri-buted tentatively to ternary cluster molecules. Instead, a newweak band appears at 157.6 cm�1 together with a strong distinct
band at 78.4 cm�1 having a weak shoulder at 81.1 cm�1. In theTHz spectrum obtained for a CS2/D2O mixture (mixing ratio of9 : 2), where the combined gas handling and inlet tubing systemshave been purged intensively with D2O to promote H/D exchangeon all surfaces, there are no longer any traces of the sixbands observed for the CS2/H2O mixtures. However, the twobands at 157.6 and 78.4 cm�1 observed in the spectrum for theCS2/H2O/D2O mixture are still visible together with two newbands at 131.1 cm�1 and 66.1 cm�1, where the latter band has ashoulder at 72.9 cm�1.
The intermolecular harmonic force fields for the two differ-ent potential energy minima for the binary CS2� � �H2O systemshown in Fig. 2 have been investigated by exploratory quantumchemical calculations at the RI-MP2/aug-cc-pCV5Z level (seeESI†). The important findings from these calculations relate tothe actual number of large-amplitude vibrational modes withsignificant infrared activity. The planar T-shaped structure withthe O atom on the H2O subunit linked to the C atom on the CS2
molecule have three different transitions associated with large-amplitude librational motion of H2O with significant bandintensity; one very localized out-of-plane librational modeinvolving the ‘‘bound’’ H atom of H2O predicted at 187 cm�1,a second in-plane H2O rocking mode (H2O c-axis libration)predicted at 152 cm�1 and a third very localized out-of-planelibrational mode involving the ‘‘free’’ H atom of H2O predictedat 74 cm�1. On the other hand, the linear conformation withC2v symmetry is predicted to have only two strongly IR-activelarge-amplitude librational modes: one in-plane H2O rockingmode (H2O c-axis libration) predicted at 96 cm�1 and one out-of-plane H2O wagging mode (H2O a-axis libration) predicted at91 cm�1. The predicted harmonic fundamental band originsfor the two different conformations of the CS2� � �H2O system arelisted in Table 1 and animations of the highly infrared activelarge-amplitude intermolecular vibrational modes are shown inFig. 5. The prediction of only two infrared active librationaltransitions close in energy for the C2v symmetric CS2� � �H2Oconformation suggests the existence of this conformation in
Fig. 4 THz absorption spectra of CS2/H2O/para-H2 (6 : 2 : 2000, trace a),CS2/H2O/D2O/para-H2 (9 : 1.5 : 1.5 : 2000, trace b) and CS2/D2O/para-H2
(9 : 2 : 2000, trace c) mixtures embedded in solid para-H2 with proposedband assignments and isotopic spectral shifts indicated by arrows.
Table 1 Predicted vibrational fundamental band origins (units of cm�1) and corresponding IR band intensities (units of km mol�1) for CS2, H2O and thetwo C2v and Cs conformations of the binary CS2� � �H2O system in the double harmonic approximation at the RI-MP2/aug-cc-pCV5Z level. In addition,harmonic vibrational band origins (units of cm�1) at the CCSD(T)-F12b/cc-pVQZ-F12 level are given in square brackets for the most stable C2v
conformation
Mode o(H2O) o(CS2) o(CS2� � �H2O) C2v o(CS2� � �H2O) Cs
Intra-molecular Intra-molecularAsym OH stretch 3976.4 (81.2) 3968.7 (86.1) [3941.1] 3952.3 (143.1)Sym OH stretch 3849.3 (6.6) 3842.6 (12.3) [3831.2] 3821.1 (25.1)HOH bend 1630.8 (74.8) 1631.8 (23.4) [1650.0] 1633.2 (165.6)Asym CS stretch 1631.1 (561.3) 1623.4 (629.4) [1552.7] 1627.6 (422.9)Sym CS stretch 683.4 (0.0) 680.4 (1.2) [669.3] 683.1 (0.4)SCS bend 403.0 (5.0) 411.4 (6.1) [407.4] 407.0 (8.1)
403.0 (5.0) 410.2 (5.1) [406.1] 401.1 (5.1)
Inter-molecular Inter-molecular95.8 (56.6) [96.2] 187.2 (49.8)90.8 (223.2) [56.8] 152.2 (115.3)78.2 (1.0) [75.9] 75.2 (9.2)27.0 (3.0) [26.6] 74.3 (134.0)19.0 (8.1) [24.8] 37.5 (4.0)
PCCP Paper
Publ
ishe
d on
07
Dec
embe
r 20
18. D
ownl
oade
d on
1/2
1/20
20 1
0:06
:40
AM
.
View Article Online
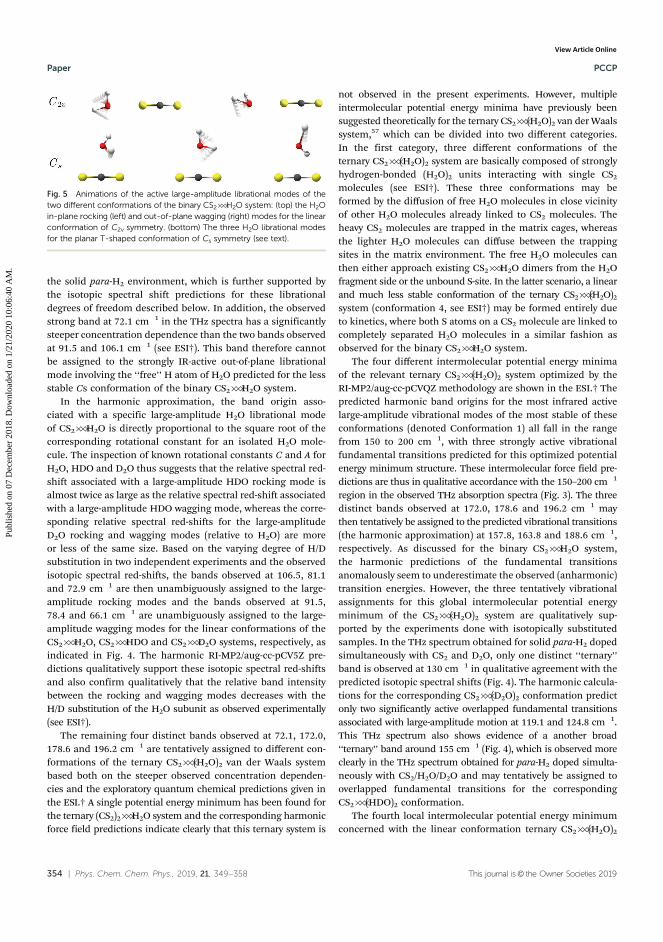
354 | Phys. Chem. Chem. Phys., 2019, 21, 349--358 This journal is© the Owner Societies 2019
the solid para-H2 environment, which is further supported bythe isotopic spectral shift predictions for these librationaldegrees of freedom described below. In addition, the observedstrong band at 72.1 cm�1 in the THz spectra has a significantlysteeper concentration dependence than the two bands observedat 91.5 and 106.1 cm�1 (see ESI†). This band therefore cannotbe assigned to the strongly IR-active out-of-plane librationalmode involving the ‘‘free’’ H atom of H2O predicted for the lessstable Cs conformation of the binary CS2� � �H2O system.
In the harmonic approximation, the band origin asso-ciated with a specific large-amplitude H2O librational modeof CS2� � �H2O is directly proportional to the square root of thecorresponding rotational constant for an isolated H2O mole-cule. The inspection of known rotational constants C and A forH2O, HDO and D2O thus suggests that the relative spectral red-shift associated with a large-amplitude HDO rocking mode isalmost twice as large as the relative spectral red-shift associatedwith a large-amplitude HDO wagging mode, whereas the corre-sponding relative spectral red-shifts for the large-amplitudeD2O rocking and wagging modes (relative to H2O) are moreor less of the same size. Based on the varying degree of H/Dsubstitution in two independent experiments and the observedisotopic spectral red-shifts, the bands observed at 106.5, 81.1and 72.9 cm�1 are then unambiguously assigned to the large-amplitude rocking modes and the bands observed at 91.5,78.4 and 66.1 cm�1 are unambiguously assigned to the large-amplitude wagging modes for the linear conformations of theCS2� � �H2O, CS2� � �HDO and CS2� � �D2O systems, respectively, asindicated in Fig. 4. The harmonic RI-MP2/aug-cc-pCV5Z pre-dictions qualitatively support these isotopic spectral red-shiftsand also confirm qualitatively that the relative band intensitybetween the rocking and wagging modes decreases with theH/D substitution of the H2O subunit as observed experimentally(see ESI†).
The remaining four distinct bands observed at 72.1, 172.0,178.6 and 196.2 cm�1 are tentatively assigned to different con-formations of the ternary CS2� � �(H2O)2 van der Waals systembased both on the steeper observed concentration dependen-cies and the exploratory quantum chemical predictions given inthe ESI.† A single potential energy minimum has been found forthe ternary (CS2)2� � �H2O system and the corresponding harmonicforce field predictions indicate clearly that this ternary system is
not observed in the present experiments. However, multipleintermolecular potential energy minima have previously beensuggested theoretically for the ternary CS2� � �(H2O)2 van der Waalssystem,57 which can be divided into two different categories.In the first category, three different conformations of theternary CS2� � �(H2O)2 system are basically composed of stronglyhydrogen-bonded (H2O)2 units interacting with single CS2
molecules (see ESI†). These three conformations may beformed by the diffusion of free H2O molecules in close vicinityof other H2O molecules already linked to CS2 molecules. Theheavy CS2 molecules are trapped in the matrix cages, whereasthe lighter H2O molecules can diffuse between the trappingsites in the matrix environment. The free H2O molecules canthen either approach existing CS2� � �H2O dimers from the H2Ofragment side or the unbound S-site. In the latter scenario, a linearand much less stable conformation of the ternary CS2� � �(H2O)2
system (conformation 4, see ESI†) may be formed entirely dueto kinetics, where both S atoms on a CS2 molecule are linked tocompletely separated H2O molecules in a similar fashion asobserved for the binary CS2� � �H2O system.
The four different intermolecular potential energy minimaof the relevant ternary CS2� � �(H2O)2 system optimized by theRI-MP2/aug-cc-pCVQZ methodology are shown in the ESI.† Thepredicted harmonic band origins for the most infrared activelarge-amplitude vibrational modes of the most stable of theseconformations (denoted Conformation 1) all fall in the rangefrom 150 to 200 cm�1, with three strongly active vibrationalfundamental transitions predicted for this optimized potentialenergy minimum structure. These intermolecular force field pre-dictions are thus in qualitative accordance with the 150–200 cm�1
region in the observed THz absorption spectra (Fig. 3). The threedistinct bands observed at 172.0, 178.6 and 196.2 cm�1 maythen tentatively be assigned to the predicted vibrational transitions(the harmonic approximation) at 157.8, 163.8 and 188.6 cm�1,respectively. As discussed for the binary CS2� � �H2O system,the harmonic predictions of the fundamental transitionsanomalously seem to underestimate the observed (anharmonic)transition energies. However, the three tentatively vibrationalassignments for this global intermolecular potential energyminimum of the CS2� � �(H2O)2 system are qualitatively sup-ported by the experiments done with isotopically substitutedsamples. In the THz spectrum obtained for solid para-H2 dopedsimultaneously with CS2 and D2O, only one distinct ‘‘ternary’’band is observed at 130 cm�1 in qualitative agreement with thepredicted isotopic spectral shifts (Fig. 4). The harmonic calcula-tions for the corresponding CS2� � �(D2O)2 conformation predictonly two significantly active overlapped fundamental transitionsassociated with large-amplitude motion at 119.1 and 124.8 cm�1.This THz spectrum also shows evidence of a another broad‘‘ternary’’ band around 155 cm�1 (Fig. 4), which is observed moreclearly in the THz spectrum obtained for para-H2 doped simulta-neously with CS2/H2O/D2O and may tentatively be assigned tooverlapped fundamental transitions for the correspondingCS2� � �(HDO)2 conformation.
The fourth local intermolecular potential energy minimumconcerned with the linear conformation ternary CS2� � �(H2O)2
Fig. 5 Animations of the active large-amplitude librational modes of thetwo different conformations of the binary CS2� � �H2O system: (top) the H2Oin-plane rocking (left) and out-of-plane wagging (right) modes for the linearconformation of C2v symmetry. (bottom) The three H2O librational modesfor the planar T-shaped conformation of Cs symmetry (see text).
Paper PCCP
Publ
ishe
d on
07
Dec
embe
r 20
18. D
ownl
oade
d on
1/2
1/20
20 1
0:06
:40
AM
.
View Article Online
This journal is© the Owner Societies 2019 Phys. Chem. Chem. Phys., 2019, 21, 349--358 | 355
system has also been optimized by the RI-MP2/aug-cc-pCVQZmethodology as shown in the ESI† (denoted Conformation 4). Thislinear conformation with the O atoms of two H2O molecules linkedto the two S atoms on the CS2 subunit has D2h symmetry and issignificantly less stable than the other three intermolecularpotential energy minima based on the (H2O)2 system. However,due to the diffusion of the lighter H2O molecules in the soft para-H2 medium, this less stable conformation may form due to kineticswhen free H2O molecules approach the S atoms on CS2 molecules,which have already H2O molecules linked to the other S atoms inthe opposite end of the molecules. The harmonic intermolecularforce field calculations for this linear conformation supportinglypredict two highly infrared active transitions associated with large-amplitude H2O rocking and wagging modes at 72.1 and 70.0 cm�1,respectively, as observed also for the binary CS2� � �H2O system (seeESI†). Both of these transitions gain enormous band intensityrelative to the binary CS2� � �H2O system (552.6 km mol�1 altogetherfor these two overlapping H2O rocking and wagging modes). Theseharmonic predictions tentatively support the origin of the fourthdistinct band at 72.1 cm�1 reproduced in the THz spectra with aconcentration dependency larger than the two bands assigned forthe binary CS2� � �H2O system. Both transitions are predicted to havesignificant spectral red-shifts upon H/D substitution in agreementwith the observation that this 72.1 cm�1 band vanishes completelyin the THz spectra obtained for para-H2 doped simultaneously withCS2/H2O/D2O (Fig. 4). In the only converged potential energyminimum for the ternary (CS2)2� � �H2O system (see ESI†), the H2Omolecule is ‘‘sandwiched’’ in between the two CS2 subunits. Theformation of this ternary system in the matrices is probablykinetically unfavored as only the lighter H2O molecules undergodiffusion in the para-H2 medium.
As pointed out during the peer-review correspondence, it wouldbe desirable to support the proposed kinetic schemes involved in theformation of the different conformations of the ternary CS2� � �(H2O)2
system by dedicated annealing experiments. However, several seriesof THz spectra obtained during the entire hold time of our immer-sion helium cryostat (8 hours) have not revealed significant changesof relative band intensities. It appears that the para-H2 medium ‘‘self-anneal’’ during the deposition procedure due to the heat loadcoming from the ‘‘warm’’ para-H2 suggesting that the cluster forma-tion steps due to diffusion of the light H2O molecules must takeplace already during the deposition procedure. A similar behaviorhas been observed for doped neon matrices, where only the firstannealing step (from 3 K to 10 K and back to 3 K) triggers theformation of more cluster molecules. In subsequent annealing stepsof doped neon matrices, any spectral changes are rarely observedsuggesting that the vast majority of the free H2O molecules in theclose vicinity of neighboring sample molecules already combine withthe sample molecules during the first annealing step in solid neon.
6. A semi-experimental binding energyfor the CS2� � �H2O system
The observation of two large-amplitude librational modes (H2Orocking and wagging) of the most stable C2v conformation of
the binary CS2� � �H2O system enables the determination of areliable semi-experimental value for the change of vibrationalzero-point energy DZPE upon complexation arising from the classof large-amplitude vibrational motion. These two observed large-amplitude H2O librational fundamental bands alone constituteca. 60% of the total vibrational zero-point energy of the completeset of five intermolecular vibrational fundamental modes of themost stable CS2� � �H2O conformation according to the harmonicRI-MP2/aug-cc-pCV5Z predictions listed in Table 1. Besides theobserved transitions associated with the large-amplitude inter-molecular H2O rocking and wagging modes, an almost forbiddenlarge-amplitude intermolecular stretching fundamental transi-tion and two very weak and low-energy fundamental transitionsassociated with large-amplitude in-plane and out-of-plane CS2
librational modes exist for this global potential energy minimum.The harmonic RI-MP2/aug-cc-pCV5Z predictions of fundamentalenergies provide a value of 1.86 kJ mol�1 in total for this changeof intermolecular vibrational zero-point energy. In addition, thecomplexation between CS2 and H2O is predicted to result inminor spectral shifts of the intramolecular vibrational modesadding up to �0.05 kJ mol�1 for the change of zero-point energydenoted DZPEintra. This very small value of DZPEintra relative toDZPEinter (ca. 3%) is partly due to the opposite signs of the minorcomplexation red-shifts associated with the intramolecular OHstretching modes of the H2O subunit and the minor complexa-tion blue-shifts associated with the intramolecular bendingmodes of the CS2 subunit.
The highly anharmonic nature of the large-amplitude vibra-tional motion for the CS2� � �H2O system challenges the employedharmonic approximation severely. The shallow potential energysurface of van der Waals cluster molecules furthermore preventsstandard anharmonic treatments such as the second-ordervibrational perturbational theory (VPT2) implementation byBarone,60,61 making reliable theoretical predictions of the inter-molecular vibrational band origins notoriously challenging. Thisis clear from the comparison between theory and experiment inrelation to the two large-amplitude H2O librational modes (rock-ing and wagging). The observed origin of the large-amplituderocking band is surprisingly 11% higher than the harmonicprediction and the observed origin of the large-amplitude wag-ging band is also slightly higher (1%) than the harmonicprediction. Harmonic intermolecular force field predictionsusually overshoot the actual (anharmonic) intermolecular transi-tion energies associated with large-amplitude vibrational modesof hydrogen-bonded cluster molecules by 15–25%62–64 and pointat some severe cancellation of errors in the present harmoniccalculations. However, similar anomalous harmonic MP2 inter-molecular force field predictions have been described for theclosely related CO2� � �H2O28,44 and OCS� � �H2O65 van der Waalscluster molecules. In the latter investigation, even harmonicpredictions employing the benchmark CCSD(T)-F12 method-ology fails to describe the large-amplitude out-of-plane waggingmode (the H2O a-axis libration) of the weakly bound OCS� � �H2Osystem. The out-of-plane wagging band origin for the OCS� � �H2Osystem was calculated to 83 cm�1 by harmonic MP2/aug-cc-pVTZ predictions, whereas harmonic CCSD(T)-F12a/aug-cc-pVTZ
PCCP Paper
Publ
ishe
d on
07
Dec
embe
r 20
18. D
ownl
oade
d on
1/2
1/20
20 1
0:06
:40
AM
.
View Article Online
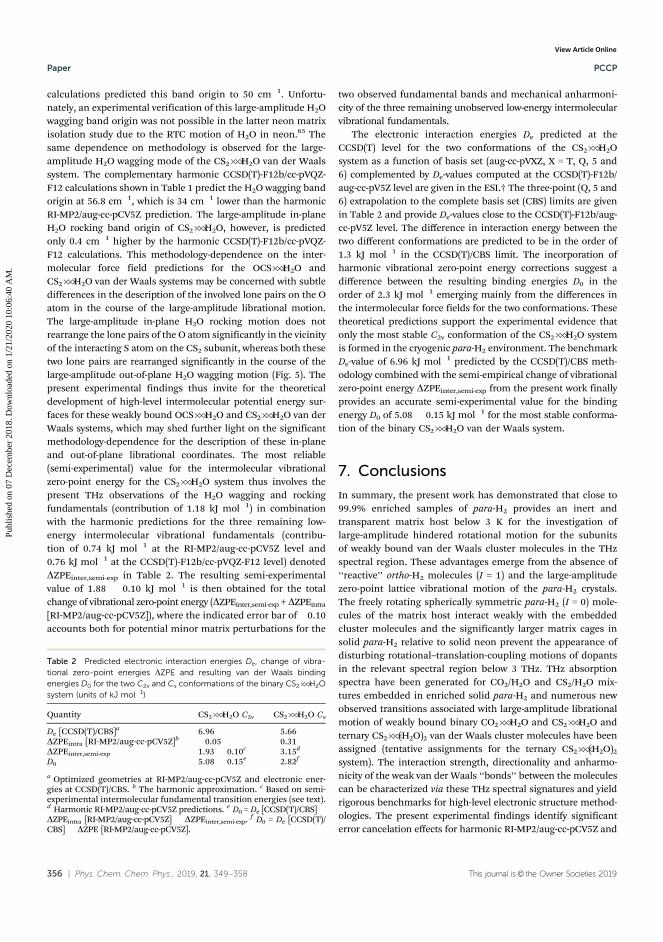
356 | Phys. Chem. Chem. Phys., 2019, 21, 349--358 This journal is© the Owner Societies 2019
calculations predicted this band origin to 50 cm�1. Unfortu-nately, an experimental verification of this large-amplitude H2Owagging band origin was not possible in the latter neon matrixisolation study due to the RTC motion of H2O in neon.65 Thesame dependence on methodology is observed for the large-amplitude H2O wagging mode of the CS2� � �H2O van der Waalssystem. The complementary harmonic CCSD(T)-F12b/cc-pVQZ-F12 calculations shown in Table 1 predict the H2O wagging bandorigin at 56.8 cm�1, which is 34 cm�1 lower than the harmonicRI-MP2/aug-cc-pCV5Z prediction. The large-amplitude in-planeH2O rocking band origin of CS2� � �H2O, however, is predictedonly 0.4 cm�1 higher by the harmonic CCSD(T)-F12b/cc-pVQZ-F12 calculations. This methodology-dependence on the inter-molecular force field predictions for the OCS� � �H2O andCS2� � �H2O van der Waals systems may be concerned with subtledifferences in the description of the involved lone pairs on the Oatom in the course of the large-amplitude librational motion.The large-amplitude in-plane H2O rocking motion does notrearrange the lone pairs of the O atom significantly in the vicinityof the interacting S atom on the CS2 subunit, whereas both thesetwo lone pairs are rearranged significantly in the course of thelarge-amplitude out-of-plane H2O wagging motion (Fig. 5). Thepresent experimental findings thus invite for the theoreticaldevelopment of high-level intermolecular potential energy sur-faces for these weakly bound OCS� � �H2O and CS2� � �H2O van derWaals systems, which may shed further light on the significantmethodology-dependence for the description of these in-planeand out-of-plane librational coordinates. The most reliable(semi-experimental) value for the intermolecular vibrationalzero-point energy for the CS2� � �H2O system thus involves thepresent THz observations of the H2O wagging and rockingfundamentals (contribution of 1.18 kJ mol�1) in combinationwith the harmonic predictions for the three remaining low-energy intermolecular vibrational fundamentals (contribu-tion of 0.74 kJ mol�1 at the RI-MP2/aug-cc-pCV5Z level and0.76 kJ mol�1 at the CCSD(T)-F12b/cc-pVQZ-F12 level) denotedDZPEinter,semi-exp in Table 2. The resulting semi-experimentalvalue of 1.88 � 0.10 kJ mol�1 is then obtained for the totalchange of vibrational zero-point energy (DZPEinter,semi-exp + DZPEintra
[RI-MP2/aug-cc-pCV5Z]), where the indicated error bar of �0.10accounts both for potential minor matrix perturbations for the
two observed fundamental bands and mechanical anharmoni-city of the three remaining unobserved low-energy intermolecularvibrational fundamentals.
The electronic interaction energies De predicted at theCCSD(T) level for the two conformations of the CS2� � �H2Osystem as a function of basis set (aug-cc-pVXZ, X = T, Q, 5 and6) complemented by De-values computed at the CCSD(T)-F12b/aug-cc-pV5Z level are given in the ESI.† The three-point (Q, 5 and6) extrapolation to the complete basis set (CBS) limits are givenin Table 2 and provide De-values close to the CCSD(T)-F12b/aug-cc-pV5Z level. The difference in interaction energy between thetwo different conformations are predicted to be in the order of1.3 kJ mol�1 in the CCSD(T)/CBS limit. The incorporation ofharmonic vibrational zero-point energy corrections suggest adifference between the resulting binding energies D0 in theorder of 2.3 kJ mol�1 emerging mainly from the differences inthe intermolecular force fields for the two conformations. Thesetheoretical predictions support the experimental evidence thatonly the most stable C2v conformation of the CS2� � �H2O systemis formed in the cryogenic para-H2 environment. The benchmarkDe-value of 6.96 kJ mol�1 predicted by the CCSD(T)/CBS meth-odology combined with the semi-empirical change of vibrationalzero-point energy DZPEinter,semi-exp from the present work finallyprovides an accurate semi-experimental value for the bindingenergy D0 of 5.08 � 0.15 kJ mol�1 for the most stable conforma-tion of the binary CS2� � �H2O van der Waals system.
7. Conclusions
In summary, the present work has demonstrated that close to99.9% enriched samples of para-H2 provides an inert andtransparent matrix host below 3 K for the investigation oflarge-amplitude hindered rotational motion for the subunitsof weakly bound van der Waals cluster molecules in the THzspectral region. These advantages emerge from the absence of‘‘reactive’’ ortho-H2 molecules (I = 1) and the large-amplitudezero-point lattice vibrational motion of the para-H2 crystals.The freely rotating spherically symmetric para-H2 (I = 0) mole-cules of the matrix host interact weakly with the embeddedcluster molecules and the significantly larger matrix cages insolid para-H2 relative to solid neon prevent the appearance ofdisturbing rotational–translation-coupling motions of dopantsin the relevant spectral region below 3 THz. THz absorptionspectra have been generated for CO2/H2O and CS2/H2O mix-tures embedded in enriched solid para-H2 and numerous newobserved transitions associated with large-amplitude librationalmotion of weakly bound binary CO2� � �H2O and CS2� � �H2O andternary CS2� � �(H2O)2 van der Waals cluster molecules have beenassigned (tentative assignments for the ternary CS2� � �(H2O)2
system). The interaction strength, directionality and anharmo-nicity of the weak van der Waals ‘‘bonds’’ between the moleculescan be characterized via these THz spectral signatures and yieldrigorous benchmarks for high-level electronic structure method-ologies. The present experimental findings identify significanterror cancelation effects for harmonic RI-MP2/aug-cc-pCV5Z and
Table 2 Predicted electronic interaction energies De, change of vibra-tional zero-point energies DZPE and resulting van der Waals bindingenergies D0 for the two C2v and Cs conformations of the binary CS2� � �H2Osystem (units of kJ mol�1)
Quantity CS2� � �H2O C2v CS2� � �H2O Cs
De [CCSD(T)/CBS]a 6.96 5.66DZPEintra [RI-MP2/aug-cc-pCV5Z]b �0.05 �0.31DZPEinter,semi-exp 1.93 � 0.10c 3.15d
D0 5.08 � 0.15e 2.82f
a Optimized geometries at RI-MP2/aug-cc-pCV5Z and electronic ener-gies at CCSD(T)/CBS. b The harmonic approximation. c Based on semi-experimental intermolecular fundamental transition energies (see text).d Harmonic RI-MP2/aug-cc-pCV5Z predictions. e D0 = De [CCSD(T)/CBS]�DZPEintra [RI-MP2/aug-cc-pCV5Z] � DZPEinter,semi-exp. f D0 = De [CCSD(T)/CBS] � DZPE [RI-MP2/aug-cc-pCV5Z].
Paper PCCP
Publ
ishe
d on
07
Dec
embe
r 20
18. D
ownl
oade
d on
1/2
1/20
20 1
0:06
:40
AM
.
View Article Online
This journal is© the Owner Societies 2019 Phys. Chem. Chem. Phys., 2019, 21, 349--358 | 357
CCSD(T)-F12b/cc-pVQZ-F12 vibrational frequency predictions,where the latter approach severely fails to describe large-amplitude H2O wagging motion. The spectroscopic observa-tions confirm unambiguously a planar global potential energyminimum for the binary CS2� � �H2O system with C2v symmetry,where the O atom on the H2O molecule is linked to one of the Satoms on the CS2 subunit. A semi-experimental value for thechange of vibrational zero-point energy of 1.93 � 0.10 kJ mol�1
from the class of large-amplitude intermolecular vibrationalmodes is proposed. The combination with CCSD(T)/CBS electro-nic energy predictions provides a semi-experimental estimateof 5.08 � 0.15 kJ mol�1 for the dissociation energy D0 of theCS2� � �H2O van der Waals system.
Conflicts of interest
There are no conflicts to declare.
Acknowledgements
The authors acknowledge J. Andersen, M. Torsson and R. W. Bergfor help with the design of the para-H2 conversion apparatus andthe DTU Computing Center for access to the High PerformanceComputing services. RWL acknowledges financial support fromthe Danish Council for Independent Research’s Sapere AudeProgramme (Grant Ref.: 12-125248).
References
1 F. Kollipost, J. Andersen, D. Mahler, J. Heimdal, M. Heger,M. A. Suhm and R. Wugt Larsen, J. Chem. Phys., 2014,141, 174314.
2 F. Kollipost, R. Wugt Larsen, A. V. Domanskaya,M. Noerenberg and M. A. Suhm, J. Chem. Phys., 2012,136, 151101.
3 J. Ceponkus, P. Uvdal and B. Nelander, J. Chem. Phys., 2008,129(19), 194306.
4 J. Andersen, A. Voute, D. Mihrin, J. Heimdahl, R. W. Berg,M. Torsson and R. Wugt Larsen, J. Chem. Phys., 2017,146, 244311.
5 J. Andersen, J. Heimdal, B. Nelander and R. Wugt Larsen,J. Chem. Phys., 2017, 146, 194302.
6 K. Tanaka, K. Harada and K. M. Yamada, Handbook of High-Resolution Spectroscopy, John Wiley & Sons, Ltd, 2011.
7 G. A. Blake, K. B. Laughlin, R. C. Cohen, K. L. Busarow,D.-H. Gwo, C. A. Schmuttenmaer, D. W. Steyert and R. Saykally,Rev. Sci. Instrum., 1991, 62, 1701–1716.
8 D. Mihrin, P. W. Jakobsen, A. Voute, L. Manceron andR. Wugt Larsen, Phys. Chem. Chem. Phys., 2018, 20,8241–8246.
9 A. R. W. McKellar, J. Mol. Spectrosc., 2010, 262, 1–10.10 R. Wugt Larsen, F. Hegelund and B. Nelander, Mol. Phys.,
2004, 102, 1743–1748.11 R. Wugt Larsen, F. Hegelund and B. Nelander, J. Phys.
Chem. A, 2004, 108, 1524–1530.
12 D. J. Bakker, A. Peters, V. Yatsyna, V. Zhaunerchyk andA. M. Rijs, J. Phys. Chem. Lett., 2016, 7, 1238–1243.
13 D. J. Bakker, A. Dey, D. P. Tabor, Q. Ong, J. Mahe,M.-P. Gaigeot, E. L. Sibert and A. M. Rijs, Phys. Chem. Chem.Phys., 2017, 19, 20343–20356.
14 A. J. Barnes, J. Mol. Struct., 2018, 1163(5), 77–85.15 J. Ceponkus, A. Engdahl, P. Uvdal and B. Nelander, Chem.
Phys. Lett., 2013, 581, 1–9.16 J. Ceponkus, P. Uvdal and B. Nelander, J. Phys. Chem. A,
2011, 115(27), 7921–7927.17 J. Ceponkus, P. Uvdal and B. Nelander, J. Phys. Chem. A,
2010, 114(25), 6829–6831.18 M. E. Fajardo and M. Lindsay, J. Chem. Phys., 2008,
128, 014505.19 M. Fajardo, S. Tam and M. DeRose, J. Mol. Struct., 2004, 695,
111–127.20 Y. Miyamoto, M. Fushitani, D. Ando and T. Momose,
J. Chem. Phys., 2008, 128(11), 114502.21 T. Momose, M. Fushitani and H. Hoshina, Int. Rev. Phys.
Chem., 2005, 24, 533.22 S. Tam, M. E. Fajardo, H. Katsuki, H. Hoshina,
T. Wakabayashi and T. Momose, J. Chem. Phys., 1999,111(9), 4191.
23 T. Momose, H. Katsuki, H. Hoshina, N. Sogoshi,T. Wakabayashi and T. Shida, J. Chem. Phys., 1997,107, 7717.
24 Y.-P. Lee, Y.-J. Wu, R. Lees, L.-H. Xu and J. T. Hougen,Science, 2006, 311(5759), 365–368.
25 I. F. Rivera, Rev. Mod. Phys., 1980, 52(2), 393–452.26 L. Andrews and X. Wang, Rev. Sci. Instrum., 2004, 75,
3039–3044.27 S. Tam and M. E. Fajardo, Rev. Sci. Instrum., 1999, 70,
1926–1932.28 J. Andersen, J. Heimdal, D. W. Mahler, B. Nelander and
R. Wugt Larsen, J. Chem. Phys., 2014, 140(9), 091103.29 F. Neese, Wiley Interdiscip. Rev.: Comput. Mol. Sci., 2017, 1–6.30 D. E. Bernholdt and R. J. Harrison, Chem. Phys. Lett., 1996,
250(5-6), 477–484.31 T. H. Dunning Jr, J. Chem. Phys., 1989, 90(2), 1007–1023.32 A. K. Wilson, T. van Mourik and T. H. Dunning Jr,
THEOCHEM, 1996, 388, 339–349.33 K. A. Peterson and T. H. Dunning, J. Chem. Phys., 2002, 117,
10548–10560.34 F. Weigend, Phys. Chem. Chem. Phys., 2002, 4, 4285–4291.35 F. Weigend, A. Kohn and C. Hattig, J. Chem. Phys., 2002,
116(8), 3175–3183.36 H.-J. Werner, P. J. Knowles, G. Knizia, F. R. Manby and
M. Schotz, Wiley Interdiscip. Rev.: Comput. Mol. Sci., 2012, 2,242–253.
37 H.-J. Werner, P. J. Knowles, G. Knizia, F. R. Manby andM. Schutz, Wiley Interdiscip. Rev.: Comput. Mol. Sci., 2012, 2,242–253.
38 J. A. Pople, M. Head-Gordon and K. Raghavachari, J. Chem.Phys., 1987, 134(87), 5968.
39 J. Rezac and P. Hobza, J. Chem. Theory Comput., 2013, 9(5),2151–2155.
PCCP Paper
Publ
ishe
d on
07
Dec
embe
r 20
18. D
ownl
oade
d on
1/2
1/20
20 1
0:06
:40
AM
.
View Article Online
358 | Phys. Chem. Chem. Phys., 2019, 21, 349--358 This journal is© the Owner Societies 2019
40 G. Knizia, T. B. Adler and H.-J. Werner, J. Chem. Phys., 2009,130, 054104.
41 K. A. Peterson, T. B. Adler and H.-J. Werner, J. Chem. Phys.,2008, 128(8), 084102.
42 O. Marchetti and H.-J. Werner, Phys. Chem. Chem. Phys.,2008, 10(23), 3400–3409.
43 K. A. Peterson, M. K. Kesharwani and J. M. Martin, Mol.Phys., 2015, 113(13–14), 1551–1558.
44 P. Soulard and B. Tremblay, J. Chem. Phys., 2015, 143,224311.
45 J. Makarewicz, J. Chem. Phys., 2010, 132(23), 234305.46 Y. Abashkin, F. Mele, N. Russo and M. Toscano, Int.
J. Quantum Chem., 1994, 52(4), 1011–1015.47 J. Altmann and T. Ford, J. Mol. Struct., 2007, 818(13), 85–92.48 R. J. Wheatley and A. H. Harvey, J. Chem. Phys., 2011,
134(13), 134309.49 J. Sadlej and P. Mazurek, J. Mol. Struct., 1995, 337(2),
129–138.50 J. Sadlej, J. Makarewicz and G. Chalasinski, J. Chem. Phys.,
1998, 109(10), 3919–3927.51 C. N. Ramachandran and E. Ruckenstein, Comput. Theor.
Chem., 2011, 966(13), 84–90.52 K. M. de Lange and J. R. Lane, J. Chem. Phys., 2011,
134(3), 034301.
53 M. Kieninger and O. Ventura, J. Mol. Struct., 1997, 390,157–167.
54 Y. Danten, T. Tassaing and M. Besnard, J. Phys. Chem. A,2005, 109(14), 3250–3256.
55 A. S. Tulegenov, Chem. Phys. Lett., 2011, 505(21–23), 71–74.56 J. Makarewicz, T. Ha and A. Bauder, J. Chem. Phys., 1993,
99(5), 3694–3699.57 K. N. Kirschner, G. M. Hartt, T. M. Evans and G. C. Shields,
J. Chem. Phys., 2007, 126, 154320.58 T. Ogata and F. J. Lovas, J. Mol. Spectrosc., 1993, 162(2), 505–512.59 J. Ceponkus, P. Uvdal and B. Nelander, J. Phys. Chem. A,
2012, 112, 3921–3926.60 V. Barone, J. Chem. Phys., 2005, 122, 14108.61 V. Barone, M. Biczysko, J. Bloino, M. Borkowska-Panek,
I. Carnimeo and P. Panek, Int. J. Quantum Chem., 2012,112, 2185–2200.
62 R. Wugt Larsen and M. A. Suhm, Phys. Chem. Chem. Phys.,2010, 12, 8152–8157.
63 J. Andersen, J. Heimdal and R. Wugt Larsen, Phys. Chem.Chem. Phys., 2015, 17, 23761–23769.
64 J. Andersen, J. Heimdal and R. Wugt Larsen, J. Chem. Phys.,2015, 143, 224315.
65 P. Soulard, B. Madebene and B. Tremblay, J. Chem. Phys.,2017, 146(23), 234303.
Paper PCCP
Publ
ishe
d on
07
Dec
embe
r 20
18. D
ownl
oade
d on
1/2
1/20
20 1
0:06
:40
AM
.
View Article Online
208 D Peer-Reviewed Journal Publications
D.3 High-Resolution Infrared Synchrotron Investigation
of (HCN)2 and a Semi-Experimental Determination
of the Dissociation Energy D0
Reprinted with permission from:Mihrin, D., Jakobsen, P. W., Voute, A., Manceron, L., and Wugt Larsen, R. (2019). High-Resolution Infrared Synchrotron Investigation of (HCN)2 and a Semi-Experimental Deter-mination of the Dissociation Energy D0.ChemPhysChem, 20(23), 3238-3244.
1
2
3
4
5
6
7
8
9
10
11
12
13
14
15
16
17
18
19
20
21
22
23
24
25
26
27
28
29
30
31
32
33
34
35
36
37
38
39
40
41
42
43
44
45
46
47
48
49
50
51
52
53
54
55
56
57
High-Resolution Infrared Synchrotron Investigation of(HCN)2 and a Semi-Experimental Determination of theDissociation Energy D0
D. Mihrin,[a] P. W. Jakobsen,[a] A. Voute,[a] L. Manceron,[b, c] and R. Wugt Larsen*[a]
The high-resolution infrared absorption spectrum of the donorbending fundamental band ν1
6 of the homodimer (HCN)2 hasbeen collected by long-path static gas-phase Fourier transformspectroscopy at 207 K employing the highly brilliant 2.75 GeVelectron storage ring source at Synchrotron SOLEIL. The rovibra-tional structure of the ν1
6 transition has the typical appearanceof a perpendicular type band associated with a Σ–Π transitionfor a linear polyatomic molecule. The total number of 100assigned transitions are fitted employing a standard semi-rigidlinear molecule Hamiltonian, providing the band origin ν0 of779.05182(50) cm� 1 together with spectroscopic parameters forthe degenerate excited state. This band origin, blue-shifted by67.15 cm� 1 relative to the HCN monomer, provides the final
significant contribution to the change of intra-molecular vibra-tional zero-point energy upon HCN dimerization. The combina-tion with the vibrational zero-point energy contributiondetermined recently for the class of large-amplitude inter-molecular fundamental transitions then enables a completedetermination of the total change of vibrational zero-pointenergy of 3.35�0.30 kJ mol� 1. The new spectroscopic findingstogether with previously reported benchmark CCSDT(Q)/CBSelectronic energies [Hoobler et al. ChemPhysChem. 19, 3257–3265 (2018)] provide the best semi-experimental estimate of16.48�0.30 kJ mol� 1 for the dissociation energy D0 of thisprototypical homodimer.
1. Introduction
A highly accurate experimental determination of the dissocia-tion energy D0 for a binary non-covalent weakly bound clustermolecule is notoriously challenging and has solely beendemonstrated for a small number of molecular systems. In theelementary case of the simple hydrogen-bonded (HF)2 homo-dimer, direct measurements of unparalleled accuracy based onstate-to-state vibrational pre-dissociation dynamics by Milleret al.[1] provided a D0-value of 1062�1 cm� 1. In a fully non-empirical quantum chemical computational work, Hobza et al.[2]
employed large basis set CCSD(T) calculations including con-tributions of higher excitations up to the full CCSDTQ level andrelativistic and diagonal Born-Oppenheimer corrections togeth-er with anharmonic vibrational zero-point energies in order toreproduce the dissociation energy. This demanding computa-tional approach solely available for molecular systems of a very
limited size, however, still underestimated the experimentaldissociation energy by 25 cm� 1 owing to the inaccuracy of thesecond order vibrational perturbation theory approach em-ployed to predict the vibrational zero-point energy of the (HF)2
system. In a similar direct fragment analysis based on velocitymap imaging and resonance-enhanced multiphoton ionization,Rocher-Casterline et al. provided an accurate experimentaldissociation energy of 1105�10 cm� 1 for the slightly largerprototypical hydrogen-bonded (H2O)2 homodimer.[3] This exper-imental determination helped to validate the accuracy ofdifferent theoretical methodologies and most notably thecomprehensive work by Shank et al. who constructed anintermolecular potential energy surface (IPES) based on 30 000ab initio CCSD(T) grid points.[4] This full-dimensional IPES wasfitted to reproduce available benchmark calculations of theinteraction energy De
[5] and employed for diffusion Monte Carlocalculations of the vibrational zero-point energy of (H2O)2 topredict a dissociation energy D0 of 1103 cm� 1. An alternativeindirect approach was demonstrated by Kollipost et al.[6] for aneven larger system, the doubly hydrogen-bonded dimer offormic acid (HCOOH)2, based on the macroscopic dissociationequilibrium constant and the rich rovibrational spectroscopicdatasets available for this strongly bound system. After anextensive far-infrared jet spectroscopic characterization of large-amplitude hydrogen bond vibrational modes,[6,7] the combina-tion of room temperature dissociation equilibrium constantsand statistical treatments of the rovibrational partition functioninvolving the complete set of altogether 24 vibrationalfundamental transitions enabled the determination of anexperimental D0-value of 59.5(5) kJ mol� 1. The present workdemonstrates an indirect semi-experimental strategy for the
[a] D. Mihrin, Dr. P. W. Jakobsen, A. Voute, Prof. R. Wugt LarsenDepartment of Chemistry, Technical University of DenmarkKemitorvet 206, 2800 Kgs. Lyngby, DenmarkE-mail: [email protected]
[b] Dr. L. ManceronSynchrotron SOLEIL, L’Orme des MerisiersSaint-Aubin-BP 48, 91192 Gif-sur-Yvette Cedex, France
[c] Dr. L. ManceronLab. MONARIS, CNRS-UPMC UMR82334 Place Jussieu, 75230 Paris Cedex, FranceSupporting information for this article is available on the WWW underhttps://doi.org/10.1002/cphc.201900811
© 2019 The Authors. Published by Wiley-VCH Verlag GmbH & Co. KGaA.This is an open access article under the terms of the Creative CommonsAttribution License, which permits use, distribution and reproduction in anymedium, provided the original work is properly cited.
ArticlesDOI: 10.1002/cphc.201900811
3238ChemPhysChem 2019, 20, 3238 – 3244 © 2019 The Authors. Published by Wiley-VCH Verlag GmbH & Co. KGaA
Wiley VCH Donnerstag, 12.12.2019
1923 - closed* / 149078 [S. 3238/3244] 1
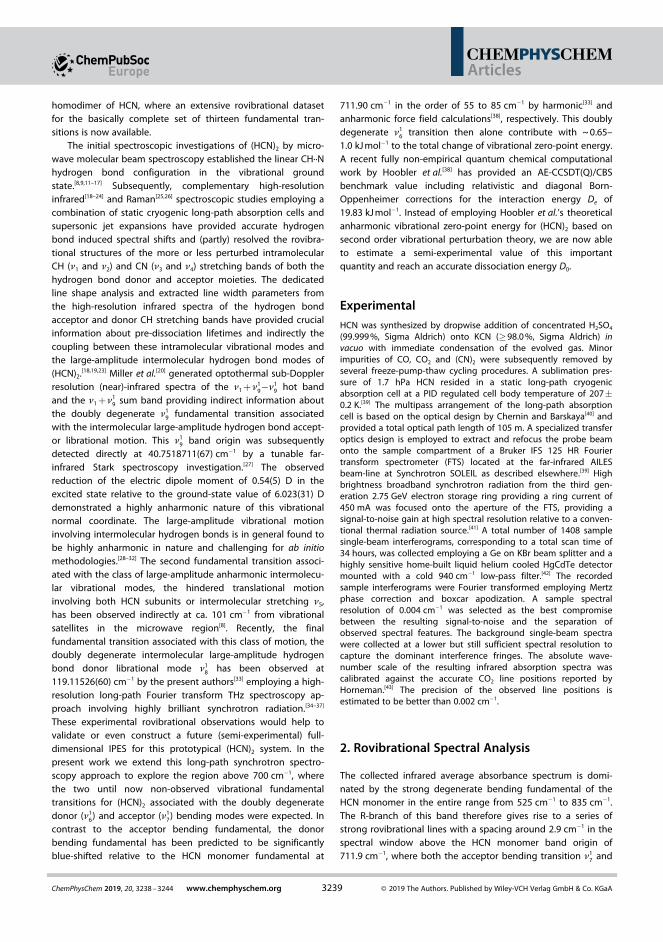
1
2
3
4
5
6
7
8
9
10
11
12
13
14
15
16
17
18
19
20
21
22
23
24
25
26
27
28
29
30
31
32
33
34
35
36
37
38
39
40
41
42
43
44
45
46
47
48
49
50
51
52
53
54
55
56
57
homodimer of HCN, where an extensive rovibrational datasetfor the basically complete set of thirteen fundamental tran-sitions is now available.
The initial spectroscopic investigations of (HCN)2 by micro-wave molecular beam spectroscopy established the linear CH··Nhydrogen bond configuration in the vibrational groundstate.[8,9,11–17] Subsequently, complementary high-resolutioninfrared[18–24] and Raman[25,26] spectroscopic studies employing acombination of static cryogenic long-path absorption cells andsupersonic jet expansions have provided accurate hydrogenbond induced spectral shifts and (partly) resolved the rovibra-tional structures of the more or less perturbed intramolecularCH (ν1 and ν2) and CN (ν3 and ν4) stretching bands of both thehydrogen bond donor and acceptor moieties. The dedicatedline shape analysis and extracted line width parameters fromthe high-resolution infrared spectra of the hydrogen bondacceptor and donor CH stretching bands have provided crucialinformation about pre-dissociation lifetimes and indirectly thecoupling between these intramolecular vibrational modes andthe large-amplitude intermolecular hydrogen bond modes of(HCN)2.
[18,19,23] Miller et al.[20] generated optothermal sub-Dopplerresolution (near)-infrared spectra of the ν1 + n1
9� n19 hot band
and the ν1 +n19 sum band providing indirect information about
the doubly degenerate n19 fundamental transition associated
with the intermolecular large-amplitude hydrogen bond accept-or librational motion. This n1
9 band origin was subsequentlydetected directly at 40.7518711(67) cm� 1 by a tunable far-infrared Stark spectroscopy investigation.[27] The observedreduction of the electric dipole moment of 0.54(5) D in theexcited state relative to the ground-state value of 6.023(31) Ddemonstrated a highly anharmonic nature of this vibrationalnormal coordinate. The large-amplitude vibrational motioninvolving intermolecular hydrogen bonds is in general found tobe highly anharmonic in nature and challenging for ab initiomethodologies.[28–32] The second fundamental transition associ-ated with the class of large-amplitude anharmonic intermolecu-lar vibrational modes, the hindered translational motioninvolving both HCN subunits or intermolecular stretching ν5,has been observed indirectly at ca. 101 cm� 1 from vibrationalsatellites in the microwave region[8]. Recently, the finalfundamental transition associated with this class of motion, thedoubly degenerate intermolecular large-amplitude hydrogenbond donor librational mode n1
8 has been observed at119.11526(60) cm� 1 by the present authors[33] employing a high-resolution long-path Fourier transform THz spectroscopy ap-proach involving highly brilliant synchrotron radiation.[34–37]
These experimental rovibrational observations would help tovalidate or even construct a future (semi-experimental) full-dimensional IPES for this prototypical (HCN)2 system. In thepresent work we extend this long-path synchrotron spectro-scopy approach to explore the region above 700 cm� 1, wherethe two until now non-observed vibrational fundamentaltransitions for (HCN)2 associated with the doubly degeneratedonor (ν1
6) and acceptor (ν17) bending modes were expected. In
contrast to the acceptor bending fundamental, the donorbending fundamental has been predicted to be significantlyblue-shifted relative to the HCN monomer fundamental at
711.90 cm� 1 in the order of 55 to 85 cm� 1 by harmonic[33] andanharmonic force field calculations[38], respectively. This doublydegenerate ν1
6 transition then alone contribute with ~ 0.65–1.0 kJ mol� 1 to the total change of vibrational zero-point energy.A recent fully non-empirical quantum chemical computationalwork by Hoobler et al.[38] has provided an AE-CCSDT(Q)/CBSbenchmark value including relativistic and diagonal Born-Oppenheimer corrections for the interaction energy De of19.83 kJ mol� 1. Instead of employing Hoobler et al.’s theoreticalanharmonic vibrational zero-point energy for (HCN)2 based onsecond order vibrational perturbation theory, we are now ableto estimate a semi-experimental value of this importantquantity and reach an accurate dissociation energy D0.
ExperimentalHCN was synthesized by dropwise addition of concentrated H2SO4
(99.999 %, Sigma Aldrich) onto KCN (�98.0 %, Sigma Aldrich) invacuo with immediate condensation of the evolved gas. Minorimpurities of CO, CO2 and (CN)2 were subsequently removed byseveral freeze-pump-thaw cycling procedures. A sublimation pres-sure of 1.7 hPa HCN resided in a static long-path cryogenicabsorption cell at a PID regulated cell body temperature of 207�0.2 K.[39] The multipass arrangement of the long-path absorptioncell is based on the optical design by Chernin and Barskaya[40] andprovided a total optical path length of 105 m. A specialized transferoptics design is employed to extract and refocus the probe beamonto the sample compartment of a Bruker IFS 125 HR Fouriertransform spectrometer (FTS) located at the far-infrared AILESbeam-line at Synchrotron SOLEIL as described elsewhere.[39] Highbrightness broadband synchrotron radiation from the third gen-eration 2.75 GeV electron storage ring providing a ring current of450 mA was focused onto the aperture of the FTS, providing asignal-to-noise gain at high spectral resolution relative to a conven-tional thermal radiation source.[41] A total number of 1408 samplesingle-beam interferograms, corresponding to a total scan time of34 hours, was collected employing a Ge on KBr beam splitter and ahighly sensitive home-built liquid helium cooled HgCdTe detectormounted with a cold 940 cm� 1 low-pass filter.[42] The recordedsample interferograms were Fourier transformed employing Mertzphase correction and boxcar apodization. A sample spectralresolution of 0.004 cm� 1 was selected as the best compromisebetween the resulting signal-to-noise and the separation ofobserved spectral features. The background single-beam spectrawere collected at a lower but still sufficient spectral resolution tocapture the dominant interference fringes. The absolute wave-number scale of the resulting infrared absorption spectra wascalibrated against the accurate CO2 line positions reported byHorneman.[43] The precision of the observed line positions isestimated to be better than 0.002 cm� 1.
2. Rovibrational Spectral Analysis
The collected infrared average absorbance spectrum is domi-nated by the strong degenerate bending fundamental of theHCN monomer in the entire range from 525 cm� 1 to 835 cm� 1.The R-branch of this band therefore gives rise to a series ofstrong rovibrational lines with a spacing around 2.9 cm� 1 in thespectral window above the HCN monomer band origin of711.9 cm� 1, where both the acceptor bending transition n1
7 and
Articles
3239ChemPhysChem 2019, 20, 3238 – 3244 www.chemphyschem.org © 2019 The Authors. Published by Wiley-VCH Verlag GmbH & Co. KGaA
Wiley VCH Donnerstag, 12.12.2019
1923 - closed* / 149078 [S. 3239/3244] 1
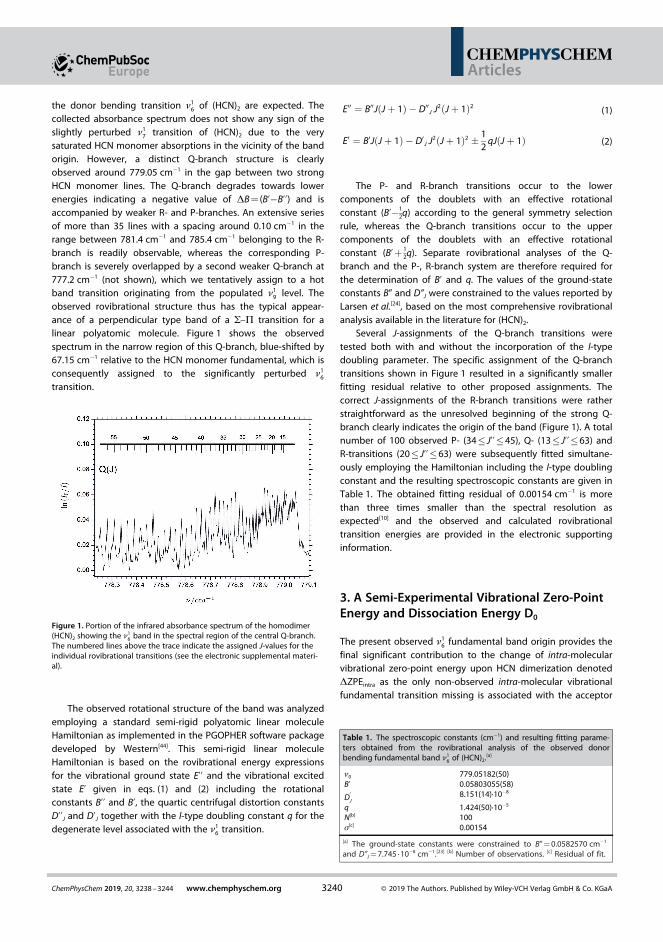
1
2
3
4
5
6
7
8
9
10
11
12
13
14
15
16
17
18
19
20
21
22
23
24
25
26
27
28
29
30
31
32
33
34
35
36
37
38
39
40
41
42
43
44
45
46
47
48
49
50
51
52
53
54
55
56
57
the donor bending transition n16 of (HCN)2 are expected. The
collected absorbance spectrum does not show any sign of theslightly perturbed n1
7 transition of (HCN)2 due to the verysaturated HCN monomer absorptions in the vicinity of the bandorigin. However, a distinct Q-branch structure is clearlyobserved around 779.05 cm� 1 in the gap between two strongHCN monomer lines. The Q-branch degrades towards lowerenergies indicating a negative value of ΔB= (B’� B’’) and isaccompanied by weaker R- and P-branches. An extensive seriesof more than 35 lines with a spacing around 0.10 cm� 1 in therange between 781.4 cm� 1 and 785.4 cm� 1 belonging to the R-branch is readily observable, whereas the corresponding P-branch is severely overlapped by a second weaker Q-branch at777.2 cm� 1 (not shown), which we tentatively assign to a hotband transition originating from the populated n1
9 level. Theobserved rovibrational structure thus has the typical appear-ance of a perpendicular type band of a Σ–Π transition for alinear polyatomic molecule. Figure 1 shows the observedspectrum in the narrow region of this Q-branch, blue-shifted by67.15 cm� 1 relative to the HCN monomer fundamental, which isconsequently assigned to the significantly perturbed n1
6
transition.
The observed rotational structure of the band was analyzedemploying a standard semi-rigid polyatomic linear moleculeHamiltonian as implemented in the PGOPHER software packagedeveloped by Western[44]. This semi-rigid linear moleculeHamiltonian is based on the rovibrational energy expressionsfor the vibrational ground state E’’ and the vibrational excitedstate E’ given in eqs. (1) and (2) including the rotationalconstants B’’ and B’, the quartic centrifugal distortion constantsD’’J and D’J together with the l-type doubling constant q for thedegenerate level associated with the n1
6 transition.
E00 ¼ B00JðJ þ 1Þ � D00J J2ðJþ 1Þ2 (1)
E0 ¼ B0JðJ þ 1Þ � D0J J2ðJþ 1Þ2 �
12qJðJ þ 1Þ (2)
The P- and R-branch transitions occur to the lowercomponents of the doublets with an effective rotationalconstant (B’� 1
2q) according to the general symmetry selectionrule, whereas the Q-branch transitions occur to the uppercomponents of the doublets with an effective rotationalconstant (B’+ 1
2q). Separate rovibrational analyses of the Q-branch and the P-, R-branch system are therefore required forthe determination of B’ and q. The values of the ground-stateconstants B” and D”J were constrained to the values reported byLarsen et al.[24], based on the most comprehensive rovibrationalanalysis available in the literature for (HCN)2.
Several J-assignments of the Q-branch transitions weretested both with and without the incorporation of the l-typedoubling parameter. The specific assignment of the Q-branchtransitions shown in Figure 1 resulted in a significantly smallerfitting residual relative to other proposed assignments. Thecorrect J-assignments of the R-branch transitions were ratherstraightforward as the unresolved beginning of the strong Q-branch clearly indicates the origin of the band (Figure 1). A totalnumber of 100 observed P- (34� J’’�45), Q- (13� J’’�63) andR-transitions (20� J’’�63) were subsequently fitted simultane-ously employing the Hamiltonian including the l-type doublingconstant and the resulting spectroscopic constants are given inTable 1. The obtained fitting residual of 0.00154 cm� 1 is morethan three times smaller than the spectral resolution asexpected[10] and the observed and calculated rovibrationaltransition energies are provided in the electronic supportinginformation.
3. A Semi-Experimental Vibrational Zero-PointEnergy and Dissociation Energy D0
The present observed ν16 fundamental band origin provides the
final significant contribution to the change of intra-molecularvibrational zero-point energy upon HCN dimerization denotedΔZPEintra as the only non-observed intra-molecular vibrationalfundamental transition missing is associated with the acceptor
Figure 1. Portion of the infrared absorbance spectrum of the homodimer(HCN)2 showing the ν1
6 band in the spectral region of the central Q-branch.The numbered lines above the trace indicate the assigned J-values for theindividual rovibrational transitions (see the electronic supplemental materi-al).
Table 1. The spectroscopic constants (cm� 1) and resulting fitting parame-ters obtained from the rovibrational analysis of the observed donorbending fundamental band ν1
6 of (HCN)2.[a]
ν0 779.05182(50)B’ 0.05803055(58)
D0
J8.151(14)·10� 8
q 1.424(50)·10� 5
N[b] 100σ[c] 0.00154
[a] The ground-state constants were constrained to B”= 0.0582570 cm� 1
and D”J= 7.745 · 10� 8 cm� 1.[23] [b] Number of observations. [c] Residual of fit.
Articles
3240ChemPhysChem 2019, 20, 3238 – 3244 www.chemphyschem.org © 2019 The Authors. Published by Wiley-VCH Verlag GmbH & Co. KGaA
Wiley VCH Donnerstag, 12.12.2019
1923 - closed* / 149078 [S. 3240/3244] 1
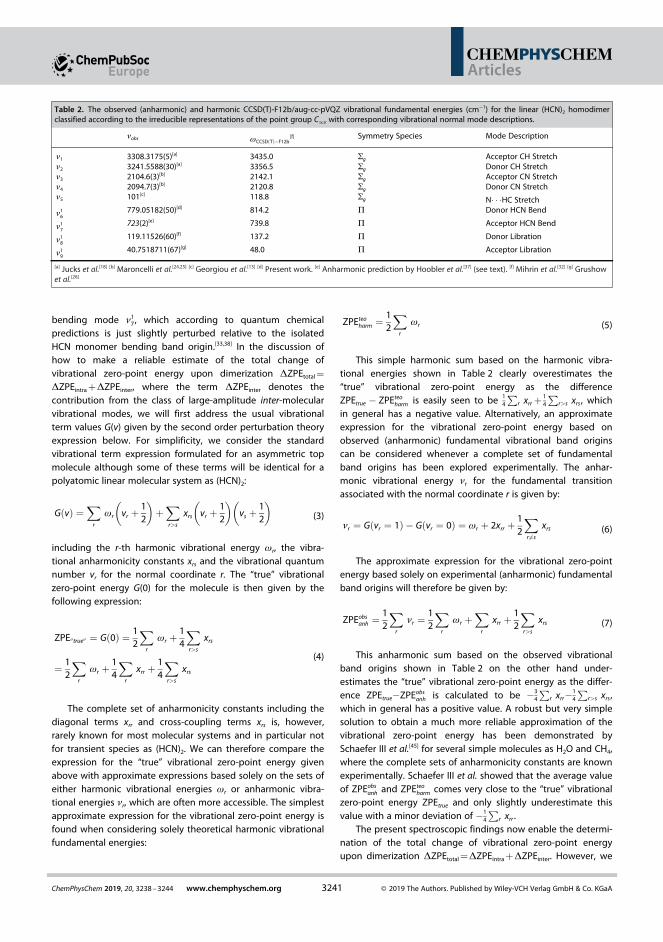
1
2
3
4
5
6
7
8
9
10
11
12
13
14
15
16
17
18
19
20
21
22
23
24
25
26
27
28
29
30
31
32
33
34
35
36
37
38
39
40
41
42
43
44
45
46
47
48
49
50
51
52
53
54
55
56
57
bending mode n17, which according to quantum chemical
predictions is just slightly perturbed relative to the isolatedHCN monomer bending band origin.[33,38] In the discussion ofhow to make a reliable estimate of the total change ofvibrational zero-point energy upon dimerization ΔZPEtotal =
ΔZPEintra +ΔZPEinter, where the term ΔZPEinter denotes thecontribution from the class of large-amplitude inter-molecularvibrational modes, we will first address the usual vibrationalterm values G(v) given by the second order perturbation theoryexpression below. For simplificity, we consider the standardvibrational term expression formulated for an asymmetric topmolecule although some of these terms will be identical for apolyatomic linear molecular system as (HCN)2:
GðvÞ ¼X
r
wr vr þ12
� �
þX
r>s
xrs vr þ12
� �
vs þ12
� �
(3)
including the r-th harmonic vibrational energy ωr, the vibra-tional anharmonicity constants xrs and the vibrational quantumnumber vr for the normal coordinate r. The “true” vibrationalzero-point energy G(0) for the molecule is then given by thefollowing expression:
ZPE00true00 ¼ Gð0Þ ¼12
X
r
wr þ14
X
r>s
xrs
¼12
X
r
wr þ14
X
r
xrr þ14
X
r>s
xrs
(4)
The complete set of anharmonicity constants including thediagonal terms xrr and cross-coupling terms xrs is, however,rarely known for most molecular systems and in particular notfor transient species as (HCN)2. We can therefore compare theexpression for the “true” vibrational zero-point energy givenabove with approximate expressions based solely on the sets ofeither harmonic vibrational energies ωr or anharmonic vibra-tional energies νr, which are often more accessible. The simplestapproximate expression for the vibrational zero-point energy isfound when considering solely theoretical harmonic vibrationalfundamental energies:
ZPEteoharm ¼
12
X
r
wr (5)
This simple harmonic sum based on the harmonic vibra-tional energies shown in Table 2 clearly overestimates the“true” vibrational zero-point energy as the differenceZPEtrue � ZPEteo
harm is easily seen to be 14
Pr xrr +
14
Pr>s xrs, which
in general has a negative value. Alternatively, an approximateexpression for the vibrational zero-point energy based onobserved (anharmonic) fundamental vibrational band originscan be considered whenever a complete set of fundamentalband origins has been explored experimentally. The anhar-monic vibrational energy νr for the fundamental transitionassociated with the normal coordinate r is given by:
nr ¼ Gðvr ¼ 1Þ � Gðvr ¼ 0Þ ¼ wr þ 2xrr þ12
X
r6¼s
xrs (6)
The approximate expression for the vibrational zero-pointenergy based solely on experimental (anharmonic) fundamentalband origins will therefore be given by:
ZPEobsanh ¼
12
X
r
nr ¼12
X
r
wr þX
r
xrr þ12
X
r>s
xrs (7)
This anharmonic sum based on the observed vibrationalband origins shown in Table 2 on the other hand under-estimates the “true” vibrational zero-point energy as the differ-ence ZPEtrue� ZPEobs
anh is calculated to be � 34
Pr xrr�
14
Pr>s xrs,
which in general has a positive value. A robust but very simplesolution to obtain a much more reliable approximation of thevibrational zero-point energy has been demonstrated bySchaefer III et al.[45] for several simple molecules as H2O and CH4,where the complete sets of anharmonicity constants are knownexperimentally. Schaefer III et al. showed that the average valueof ZPEobs
anh and ZPEteoharm comes very close to the “true” vibrational
zero-point energy ZPEtrue and only slightly underestimate thisvalue with a minor deviation of � 1
4
Pr xrr .
The present spectroscopic findings now enable the determi-nation of the total change of vibrational zero-point energyupon dimerization ΔZPEtotal =ΔZPEintra +ΔZPEinter. However, we
Table 2. The observed (anharmonic) and harmonic CCSD(T)-F12b/aug-cc-pVQZ vibrational fundamental energies (cm� 1) for the linear (HCN)2 homodimerclassified according to the irreducible representations of the point group C1v with corresponding vibrational normal mode descriptions.
νobs wCCSDðTÞ� F12b[f] Symmetry Species Mode Description
ν1 3308.3175(5)[a] 3435.0 Σg Acceptor CH Stretchν2 3241.5588(30)[a] 3356.5 Σg Donor CH Stretchν3 2104.6(3)[b] 2142.1 Σg Acceptor CN Stretchν4 2094.7(3)[b] 2120.8 Σg Donor CN Stretchν5 101[c] 118.8 Σg N� � �HC Stretch
n16
779.05182(50)[d] 814.2 Π Donor HCN Bend
n17
723(2)[e] 739.8 Π Acceptor HCN Bend
n18
119.11526(60)[f] 137.2 Π Donor Libration
n19
40.7518711(67)[g] 48.0 Π Acceptor Libration
[a] Jucks et al.[18] [b] Maroncelli et al.[24,25] [c] Georgiou et al.[13] [d] Present work. [e] Anharmonic prediction by Hoobler et al.[37] (see text). [f] Mihrin et al.[32] [g] Grushowet al.[26]
Articles
3241ChemPhysChem 2019, 20, 3238 – 3244 www.chemphyschem.org © 2019 The Authors. Published by Wiley-VCH Verlag GmbH & Co. KGaA
Wiley VCH Donnerstag, 12.12.2019
1923 - closed* / 149078 [S. 3241/3244] 1
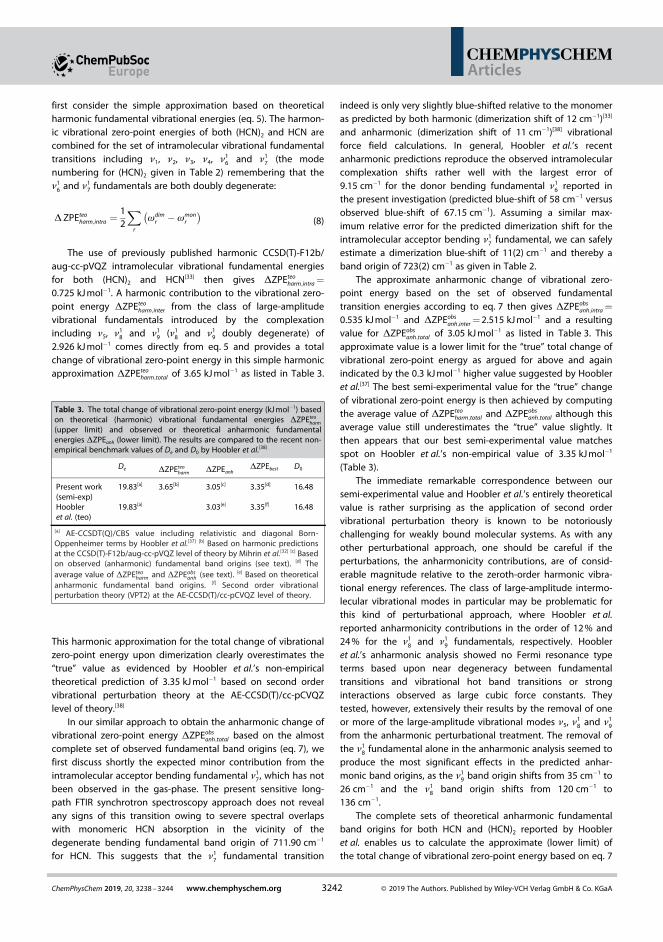
1
2
3
4
5
6
7
8
9
10
11
12
13
14
15
16
17
18
19
20
21
22
23
24
25
26
27
28
29
30
31
32
33
34
35
36
37
38
39
40
41
42
43
44
45
46
47
48
49
50
51
52
53
54
55
56
57
first consider the simple approximation based on theoreticalharmonic fundamental vibrational energies (eq. 5). The harmon-ic vibrational zero-point energies of both (HCN)2 and HCN arecombined for the set of intramolecular vibrational fundamentaltransitions including ν1, ν2, ν3, ν4, n1
6 and n17 (the mode
numbering for (HCN)2 given in Table 2) remembering that then1
6 and n17 fundamentals are both doubly degenerate:
D ZPEteoharm;intra ¼
12
X
r
wdimr � wmon
r
� �
(8)
The use of previously published harmonic CCSD(T)-F12b/aug-cc-pVQZ intramolecular vibrational fundamental energiesfor both (HCN)2 and HCN[33] then gives ΔZPEteo
harm;intra =
0.725 kJ mol� 1. A harmonic contribution to the vibrational zero-point energy ΔZPEteo
harm;inter from the class of large-amplitudevibrational fundamentals introduced by the complexationincluding ν5, n1
8 and n19 (n1
8 and n19 doubly degenerate) of
2.926 kJ mol� 1 comes directly from eq. 5 and provides a totalchange of vibrational zero-point energy in this simple harmonicapproximation ΔZPEteo
harm;total of 3.65 kJ mol� 1 as listed in Table 3.
This harmonic approximation for the total change of vibrationalzero-point energy upon dimerization clearly overestimates the“true” value as evidenced by Hoobler et al.’s non-empiricaltheoretical prediction of 3.35 kJ mol� 1 based on second ordervibrational perturbation theory at the AE-CCSD(T)/cc-pCVQZlevel of theory.[38]
In our similar approach to obtain the anharmonic change ofvibrational zero-point energy ΔZPEobs
anh;total based on the almostcomplete set of observed fundamental band origins (eq. 7), wefirst discuss shortly the expected minor contribution from theintramolecular acceptor bending fundamental n1
7, which has notbeen observed in the gas-phase. The present sensitive long-path FTIR synchrotron spectroscopy approach does not revealany signs of this transition owing to severe spectral overlapswith monomeric HCN absorption in the vicinity of thedegenerate bending fundamental band origin of 711.90 cm� 1
for HCN. This suggests that the n17 fundamental transition
indeed is only very slightly blue-shifted relative to the monomeras predicted by both harmonic (dimerization shift of 12 cm� 1)[33]
and anharmonic (dimerization shift of 11 cm� 1)[38] vibrationalforce field calculations. In general, Hoobler et al.’s recentanharmonic predictions reproduce the observed intramolecularcomplexation shifts rather well with the largest error of9.15 cm� 1 for the donor bending fundamental n1
6 reported inthe present investigation (predicted blue-shift of 58 cm� 1 versusobserved blue-shift of 67.15 cm� 1). Assuming a similar max-imum relative error for the predicted dimerization shift for theintramolecular acceptor bending n1
7 fundamental, we can safelyestimate a dimerization blue-shift of 11(2) cm� 1 and thereby aband origin of 723(2) cm� 1 as given in Table 2.
The approximate anharmonic change of vibrational zero-point energy based on the set of observed fundamentaltransition energies according to eq. 7 then gives ΔZPEobs
anh;intra =
0.535 kJ mol� 1 and ΔZPEobsanh;inter = 2.515 kJ mol� 1 and a resulting
value for ΔZPEobsanh;total of 3.05 kJ mol� 1 as listed in Table 3. This
approximate value is a lower limit for the “true” total change ofvibrational zero-point energy as argued for above and againindicated by the 0.3 kJ mol� 1 higher value suggested by Hoobleret al.[37] The best semi-experimental value for the “true” changeof vibrational zero-point energy is then achieved by computingthe average value of ΔZPEteo
harm;total and ΔZPEobsanh;total although this
average value still underestimates the “true” value slightly. Itthen appears that our best semi-experimental value matchesspot on Hoobler et al.’s non-empirical value of 3.35 kJ mol� 1
(Table 3).The immediate remarkable correspondence between our
semi-experimental value and Hoobler et al.’s entirely theoreticalvalue is rather surprising as the application of second ordervibrational perturbation theory is known to be notoriouslychallenging for weakly bound molecular systems. As with anyother perturbational approach, one should be careful if theperturbations, the anharmonicity contributions, are of consid-erable magnitude relative to the zeroth-order harmonic vibra-tional energy references. The class of large-amplitude intermo-lecular vibrational modes in particular may be problematic forthis kind of perturbational approach, where Hoobler et al.reported anharmonicity contributions in the order of 12 % and24 % for the n1
8 and n19 fundamentals, respectively. Hoobler
et al.’s anharmonic analysis showed no Fermi resonance typeterms based upon near degeneracy between fundamentaltransitions and vibrational hot band transitions or stronginteractions observed as large cubic force constants. Theytested, however, extensively their results by the removal of oneor more of the large-amplitude vibrational modes ν5, n1
8 and n19
from the anharmonic perturbational treatment. The removal ofthe n1
8 fundamental alone in the anharmonic analysis seemed toproduce the most significant effects in the predicted anhar-monic band origins, as the n1
9 band origin shifts from 35 cm� 1 to26 cm� 1 and the n1
8 band origin shifts from 120 cm� 1 to136 cm� 1.
The complete sets of theoretical anharmonic fundamentalband origins for both HCN and (HCN)2 reported by Hoobleret al. enables us to calculate the approximate (lower limit) ofthe total change of vibrational zero-point energy based on eq. 7
Table 3. The total change of vibrational zero-point energy (kJ mol� 1) basedon theoretical (harmonic) vibrational fundamental energies ΔZPEteo
harm(upper limit) and observed or theoretical anharmonic fundamentalenergies ΔZPEanh (lower limit). The results are compared to the recent non-empirical benchmark values of De and D0 by Hoobler et al.[38]
De ΔZPEteoharm ΔZPEanh
ΔZPEbest D0
Present work(semi-exp)
19.83[a] 3.65[b] 3.05[c] 3.35[d] 16.48
Hoobleret al. (teo)
19.83[a] 3.03[e] 3.35[f] 16.48
[a] AE-CCSDT(Q)/CBS value including relativistic and diagonal Born-Oppenheimer terms by Hoobler et al.[37] [b] Based on harmonic predictionsat the CCSD(T)-F12b/aug-cc-pVQZ level of theory by Mihrin et al.[32] [c] Basedon observed (anharmonic) fundamental band origins (see text). [d] Theaverage value of ΔZPEteo
harm and ΔZPEobsanh (see text). [e] Based on theoretical
anharmonic fundamental band origins. [f] Second order vibrationalperturbation theory (VPT2) at the AE-CCSD(T)/cc-pCVQZ level of theory.
Articles
3242ChemPhysChem 2019, 20, 3238 – 3244 www.chemphyschem.org © 2019 The Authors. Published by Wiley-VCH Verlag GmbH & Co. KGaA
Wiley VCH Donnerstag, 12.12.2019
1923 - closed* / 149078 [S. 3242/3244] 1
1
2
3
4
5
6
7
8
9
10
11
12
13
14
15
16
17
18
19
20
21
22
23
24
25
26
27
28
29
30
31
32
33
34
35
36
37
38
39
40
41
42
43
44
45
46
47
48
49
50
51
52
53
54
55
56
57
ignoring all involved anharmonicity constants. The extractedvalue of 3.03 kJ mol� 1 (Table 3) again is remarkable close to thevalue based on the complete set of experimental (anharmonic)fundamental band origins of 3.05 kJ mol� 1. A closer look atHoobler et al.’s reported non-empirical anharmonic band posi-tions, however, reveals total numeric deviations
Pr jn
VPT2r � nobs
r j
in the order of 10 cm� 1 for the HCN monomer and 44.7 cm� 1 forthe (HCN)2 system. These deviations would potentially introducean error of 0.4 kJ mol� 1 in this approximate value for the totalvibrational zero-point energy ΔZPEanh;total if the theoreticalanharmonic band origins systematically were predicted athigher energies than the observed band origins. The excellentagreement between the observed and theoretical values ofDZPEanh;total is partly due to cancellation of errors with oppositesigns, where overestimated fundamental band origins arecanceled out by underestimated fundamental band positions ofthe same order of magnitude. Nevertheless, the present semi-experimental approach for the determination of the totalchange of vibrational zero-point energy upon (HCN)2 complex-ation combined with the AE-CCSDT(Q)/CBS benchmark De-valueby Hoobler et al then reproduces the “best” value of16.48 kJ mol� 1 for the dissociation energy D0 (Table 3). Based onour estimated lower (anharmonic) and higher (harmonic) limitsfor the “true” value of ΔZPEtotal, we bracket this final semi-empirical dissociation energy with an error of �0.30 kJ mol� 1,which should even include minor remaining errors of thebenchmark electronic energies (�0.05 kJ mol� 1) as suggestedby Hoobler et al. The present “best” semi-experimental estimateof D0 is slightly lower than the value of 17.2 kJ mol� 1 estimatedpreviously by the same authors based on the observed changeof vibrational zero-point energy from the class of large-amplitude vibrational modes alone.[33] The previous semi-experimental estimate of D0 employed the harmonic predictionof the intramolecular donor bending n1
6 fundamental bandorigin now available by experiment. However, more importantlythe present work now employs Schaefer et al.’s accurateapproach to extract the “true” intermolecular vibrational zero-point energy contribution by considering an average of thetheoretical harmonic and experimental (anharmonic) vibrationalfundamental energies.[45]
4. Conclusions
In summary, the generated high-resolution synchrotron infraredabsorption spectrum of (HCN)2 has enabled a detailed rovibra-tional analysis of the missing n1
6 band associated with thedoubly degenerate donor bending mode. The observed rovibra-tional structure has the characteristics of a perpendicular typeband of a Σ� Π transition for a linear polyatomic molecule andin total 100 spectral lines belonging to the P-, Q-, and R-branches have been assigned and fitted simultaneously to astandard semi-rigid linear molecule Hamiltonian. The resultingfit provides an accurate value for the missing band origin ν0 of779.05182(50) cm� 1 together with the spectroscopic parametersB’, D’J and q for the doubly degenerate excited state n1
6. Thisaccurate n1
6 fundamental band origin, blue-shifted by
67.15 cm� 1 relative to the degenerate HCN monomer bendingband origin, provides the final significant contribution of0.8 kJ mol� 1 to the change of intra-molecular vibrational zero-point energy upon complexation and the best semi-experimen-tal estimate of 3.35�0.30 kJ mol� 1 for the total change ofvibrational zero-point energy. The combination with Hoobleret al.’s[37] AE-CCSDT(Q)/CBS benchmark value for the interactionenergy De of 19.83 kJ mol� 1 including relativistic and diagonalBorn-Oppenheimer corrections then enables a reliable semi-experimental value of 16.48�0.30 kJ mol� 1 for the intermolecu-lar hydrogen bond energy D0.
Supporting Information
The observed and calculated line positions from the rovibra-tional analysis of the n1
6 band are given as electronic supportinginformation.
Acknowledgements
RWL acknowledges Synchrotron SOLEIL for the granted beam-timefor proposal 20170820. RWL and AV acknowledge financialsupport by the CALIPSOplus project funded by the EuropeanUnion’s Horizon 2020 Research and Innovation programme. Theauthors finally thank the SOLEIL chemistry laboratory supportteam led by S. Blanchandin for their valuable assistance and M. A.Sánchez for help during the measurements.
Conflict of Interest
The authors declare no conflict of interest.
Keywords: Dissociation Energy · Hydrogen Bonding · InfraredSynchrotron Radiation · Non-Covalent Forces · Vibrational Zero-Point Energy
[1] E. J. Bohac, M. D. Marshall, R. E. Miller, J. Chem. Phys. 1992, 96, 6681.[2] J. Rezac, P. Hobza, J. Chem. Theory Comput. 2014, 10, 3066–3073.[3] B. E. Rocher-Casterline, L. C. Ch’ng, A. K. Mollner, H. Reisler, J. Chem.
Phys. 2011, 134, 211101.[4] A. Shank, Y. Wang, A. Kaledin, B. J. Braams, J. M. Bowman, J. Chem. Phys.
2000, 130, 144314.[5] G. S. Tschumper, M. L. Leininger, B. C. Hoffman, E. F. Valeev, H. F.
Schaefer, M. Quack, J. Chem. Phys. 2002, 116, 690–701.[6] F. Kollipost, R. Wugt Larsen, A. V. Domanskaya, M. Noerenberg, M. A.
Suhm, J. Chem. Phys. 2012, 136.[7] Z. Xu, M. A. Suhm, J. Chem. Phys. 2009, 131, 054301.[8] A. C. Legon, D. J. Millen, P. J. Mjöberg, Chem. Phys. Lett. 1977, 47, 589–
591.[9] R. D. Brown, P. D. Godfrey, D. A. Winkler, J. Mol. Spectrosc. 1981, 89, 352–
355.[10] R. Wugt Larsen, F. Pawlowski, F. Hegelund, P. Jørgensen, J. Gauss, B.
Nelander, Phys. Chem. Chem. Phys. 2003, 5, 5031–5037.[11] L. W. Buxton, E. J. Campbell, W. H. Flygare, Chem. Phys. 1981, 56, 399–
406.[12] A. J. Fillery-Travis, A. C. Legon, L. C. Willoughby, A. D. Buckingham,
Chem. Phys. Lett. 1981, 102, 126–131.[13] E. J. Campbell, S. G. Kukolich, Chem. Phys. 1983, 76, 225–229.
Articles
3243ChemPhysChem 2019, 20, 3238 – 3244 www.chemphyschem.org © 2019 The Authors. Published by Wiley-VCH Verlag GmbH & Co. KGaA
Wiley VCH Donnerstag, 12.12.2019
1923 - closed* / 149078 [S. 3243/3244] 1
1
2
3
4
5
6
7
8
9
10
11
12
13
14
15
16
17
18
19
20
21
22
23
24
25
26
27
28
29
30
31
32
33
34
35
36
37
38
39
40
41
42
43
44
45
46
47
48
49
50
51
52
53
54
55
56
57
[14] K. Georgiou, A. C. Legon, D. J. Millen, P. J. Mjöberg, Proc. R. Soc. LondonSer. A 1985, 399, 377–390.
[15] R. S. Ruoff, T. Emilsson, C. Chuang, T. D. Klots, H. S. Gutowsky, Chem.Phys. Lett. 1987, 138, 553–558.
[16] A. Haynes, A. C. Legon, J. Mol. Struct. 1988, 189, 153–164.[17] R. E. Bumgarner, G. A. Blake, Chem. Phys. Lett. 1989, 161, 308–314.[18] B. A. Wofford, J. W. Bevan, W. B. Olson, W. J. Lafferty, J. Chem. Phys.
1986, 85, 105–108.[19] K. W. Jucks, R. E. Miller, J. Chem. Phys. 1988, 88, 6059–6067.[20] K. W. Jucks, R. E. Miller, Chem. Phys. Lett. 1988, 147, 137–141.[21] D. S. Anex, E. R. Davidson, C. Douketis, G. E. Ewing, J. Phys. Chem. 1988,
92, 2913–2925.[22] J. Meyer, E. R. T. H. Kerstel, D. Zhuang, G. Scoles, J. Chem. Phys. 1989, 90,
4623–4625.[23] E. R. T. H. Kerstel, K. K. Lehmann, J. E. Gambogi, X. Yang, G. J. Scoles,
Chem. Phys. 1993, 99, 8559–8570.[24] R. Wugt Larsen, F. Hegelund, B. Nelander, Phys. Chem. Chem. Phys. 2004,
6, 3077–3080.[25] G. A. Hopkins, M. Maroncelli, J. W. Nibler, Chem. Phys. Lett. 1985, 114,
97–102.[26] M. Maroncelli, G. A. Hopkins, J. W. Nibler, T. R. Dyke, J. Chem. Phys. 1985,
83, 2129–2146.[27] A. Grushow, W. A. Burns, K. R. Leopold, J. Mol. Spectrosc. 1995, 170, 335–
345.[28] J. Andersen, J. Heimdal, B. Nelander, R. Wugt Larsen, J. Chem. Phys.
2017, 146, 194302.[29] J. Andersen, J. Heimdal, R. Wugt Larsen, Phys. Chem. Chem. Phys. 2015,
17, 23761–23769.[30] J. Andersen, J. Heimdal, R. Wugt Larsen, J. Chem. Phys. 2015, 143,
224315.[31] F. Kollipost, J. Andersen, D. Mahler, J. Heimdal, M. Heger, M. A. Suhm, R.
Wugt Larsen, J. Chem. Phys. 2014, 141, 174314.
[32] J. Andersen, J. Heimdal, D. W. Mahler, B. Nelander, R. W. Larsen, J. Chem.Phys. 2014, 140, 091103.
[33] D. Mihrin, P. W. Jakobsen, A. Voute, L. Manceron, R. Wugt Larsen, Phys.Chem. Chem. Phys. 2018, 20, 8241–8246.
[34] R. Wugt Larsen, F. Hegelund, B. Nelander, J. Phys. Chem. A 2004, 108,1524–1530.
[35] R. Wugt Larsen, F. Hegelund, B. Nelander, Phys. Chem. Chem. Phys. 2005,7, 1953–1959.
[36] R. Wugt Larsen, F. Hegelund, B. Nelander, J. Phys. Chem. A 2005, 109,4459–4463.
[37] R. Wugt Larsen, F. Hegelund, B. Nelander, Mol. Phys. 2004, 102, 1743–1748.
[38] P. R. Hoobler, J. M. Turney, J. Agarwal, H. F. Schaefer III, ChemPhysChem2018, 19, 3257–3265.
[39] F. Kwabia Tchana, F. Willaert, X. Landsheere, J.-M. Flaud, L. Lago, M.Chapuis, P. Roy, L. Manceron, Rev. Sci. Instrum. 2013, 84, 093101.
[40] S. M. Chernin, E. G. Barskaya, Appl. Opt. 1991, 30, 51–58.[41] A. R. W. Mckellar, J. Mol. Spectrosc. 2010, 262, 1–10.[42] M. Faye, M. Bordessoule, B. Kanouté, J.-B. Brubach, P. Roy, L. Manceron,
Rev. Sci. Instrum. 2016, 87, 063119.[43] V.-M. Horneman, J. Mol. Spectrosc. 2007, 241, 45–50.[44] C. M. Western, B. E. Billinghurst, Phys. Chem. Chem. Phys. 2017, 19,
10222–10226.[45] R. S. Grev, C. L. Janssen, H. F. Schaefer III, J. Chem. Phys. 1995, 95, 5128–
5132.
Manuscript received: August 14, 2019Version of record online: November 8, 2019
Articles
3244ChemPhysChem 2019, 20, 3238 – 3244 www.chemphyschem.org © 2019 The Authors. Published by Wiley-VCH Verlag GmbH & Co. KGaA
Wiley VCH Donnerstag, 12.12.2019
1923 - closed* / 149078 [S. 3244/3244] 1

216 D Peer-Reviewed Journal Publications
D.4 High-resolution synchrotron terahertz investigation
of the large-amplitude hydrogen bond librational
band of (HCN)2Reprinted with permission from:Mihrin, D., Jakobsen, P. W., Voute, A., Manceron, L., and Larsen, R. W. (2018). High-resolution synchrotron terahertz investigation of the large-amplitude hydrogen bond libra-tional band of (HCN)2.Physical Chemistry Chemical Physics, 20(12), 8241-8246.
This journal is© the Owner Societies 2018 Phys. Chem. Chem. Phys., 2018, 20, 8241--8246 | 8241
Cite this:Phys.Chem.Chem.Phys.,
2018, 20, 8241
High-resolution synchrotron terahertzinvestigation of the large-amplitude hydrogenbond librational band of (HCN)2†
D. Mihrin, a P. W. Jakobsen,a A. Voute, a L. Manceronbc andR. Wugt Larsen *a
The high-resolution terahertz absorption spectrum of the large-amplitude intermolecular donor
librational band n18 of the homodimer (HCN)2 has been recorded by means of long-path static gas-phase
Fourier transform spectroscopy at 207 K employing a highly brilliant electron storage ring source. The
rovibrational structure of the n18 band has the typical appearance of a perpendicular type band of a S–P
transition for a linear polyatomic molecule. The generated terahertz spectrum is analyzed employing a
standard semi-rigid linear molecule Hamiltonian, yielding a band origin n0 of 119.11526(60) cm�1
together with values for the excited state rotational constant B0, the excited state quartic centrifugal
distortion constant DJ0 and the l-type doubling constant q for the degenerate state associated with the
n18 mode. The until now missing donor librational band origin enables the determination of an accurate
experimental value for the vibrational zero-point energy of 2.50 � 0.05 kJ mol�1 arising from the entire
class of large-amplitude intermolecular modes. The spectroscopic findings are complemented by
CCSD(T)-F12b/aug-cc-pV5Z (electronic energies) and CCSD(T)-F12b/aug-cc-pVQZ (force fields) electronic
structure calculations, providing a (semi)-experimental value of 17.20 � 0.20 kJ mol�1 for the dissociation
energy D0 of this strictly linear weak intermolecular CH� � �N hydrogen bond.
1. Introduction
The terahertz (THz) spectral region, the region of the electro-magnetic spectrum with wavelengths between 3 mm to 30 mm,is referred to ‘‘the gap of the electromagnetic spectrum’’because it historically has been extremely difficult to producetunable, coherent radiation throughout the entire region. Thetechnology of tunable THz laser sources has greatly expandedthe range of spectroscopic applications for studies of weaklybound molecular complexes, owing to the realization of both highsensitivity and ultrahigh resolution.1 The scanning bandwidths,however, are limited for these laser-based THz spectrometers,
only minor fractions of the spectrum can be sampled within areasonable time period and solely a few laser technologies arefeasible above 3 THz.2 In the present contribution, it is demon-strated how highly brilliant synchrotron radiation coupled toFourier transform spectrometers provides a complementarybroadband THz/far-infrared approach with sufficient sensitivityand resolution to observe and resolve the rovibrational structureof large-amplitude vibrational bands of weakly bound molecularcomplexes down to 3 THz. The high-resolution absorptionspectrum for the donor librational band n1
8 of (HCN)2 reportedhere resolves the lowest-energy intermolecular large-amplitudevibrational band observed so far employing this implementationof synchrotron point sources for Fourier transform THz spectro-scopy (FTS).3–6
The first experimental investigations of (HCN)2 by micro-wave molecular beam spectroscopy established a linear CH� � �Nhydrogen bond geometry in the vibrational ground state.7–15
Subsequently, a variety of infrared16–22 and Raman23,24 spectro-scopic studies employing a combination of static equilibriumabsorption cells and supersonic jet expansions have providedaccurate dimerization spectral shifts and (partly) resolved therovibrational structures of the perturbed intramolecular CH(n1 and n2) and CN (n3 and n4) stretching bands of both thehydrogen bond acceptor and donor subunits. The dedicated
a Department of Chemistry, Technical University of Denmark, Kemitorvet 206,
2800 Kgs. Lyngby, Denmark. E-mail: [email protected] Synchrotron SOLEIL, L’orme des Merisiers, Saint-Aubin-BP 48,
91192 Gif-sur-Yvette Cedex, Francec Lab. MONARIS, CNRS-UPMC UMR8233, 4 Place Jussieu, 75230 Paris Cedex,
France
† Electronic supplementary information (ESI) available: The observed and calcu-lated line positions from the rovibrational analysis are given as electronicsupplemental material together with the calculated absolute electronic energiesemploying the CCSD(T) and CCSD(T)-F12b methodologies with Dunning’s aug-mented correlation-consistent aug-cc-pVXZ (X = D, T, Q, 5, 6) basis sets and thecalculated harmonic vibrational energies at the CCSD(T)-F12b/aug-cc-pVQZ level.See DOI: 10.1039/c7cp08412a
Received 15th December 2017,Accepted 4th March 2018
DOI: 10.1039/c7cp08412a
rsc.li/pccp
PCCP
PAPER
Publ
ishe
d on
12
Mar
ch 2
018.
Dow
nloa
ded
by D
TU
Lib
rary
on
1/21
/202
0 10
:07:
07 A
M.
View Article OnlineView Journal | View Issue
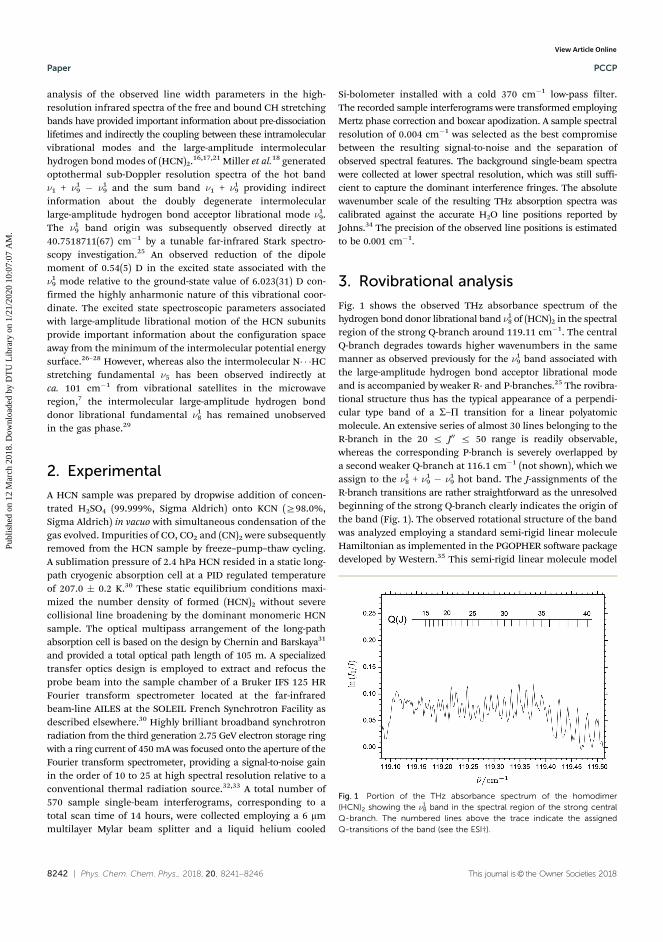
8242 | Phys. Chem. Chem. Phys., 2018, 20, 8241--8246 This journal is© the Owner Societies 2018
analysis of the observed line width parameters in the high-resolution infrared spectra of the free and bound CH stretchingbands have provided important information about pre-dissociationlifetimes and indirectly the coupling between these intramolecularvibrational modes and the large-amplitude intermolecularhydrogen bond modes of (HCN)2.16,17,21 Miller et al.18 generatedoptothermal sub-Doppler resolution spectra of the hot bandn1 + n1
9 � n19 and the sum band n1 + n1
9 providing indirectinformation about the doubly degenerate intermolecularlarge-amplitude hydrogen bond acceptor librational mode n1
9.The n1
9 band origin was subsequently observed directly at40.7518711(67) cm�1 by a tunable far-infrared Stark spectro-scopy investigation.25 An observed reduction of the dipolemoment of 0.54(5) D in the excited state associated with then1
9 mode relative to the ground-state value of 6.023(31) D con-firmed the highly anharmonic nature of this vibrational coor-dinate. The excited state spectroscopic parameters associatedwith large-amplitude librational motion of the HCN subunitsprovide important information about the configuration spaceaway from the minimum of the intermolecular potential energysurface.26–28 However, whereas also the intermolecular N� � �HCstretching fundamental n5 has been observed indirectly atca. 101 cm�1 from vibrational satellites in the microwaveregion,7 the intermolecular large-amplitude hydrogen bonddonor librational fundamental n1
8 has remained unobservedin the gas phase.29
2. Experimental
A HCN sample was prepared by dropwise addition of concen-trated H2SO4 (99.999%, Sigma Aldrich) onto KCN (Z98.0%,Sigma Aldrich) in vacuo with simultaneous condensation of thegas evolved. Impurities of CO, CO2 and (CN)2 were subsequentlyremoved from the HCN sample by freeze–pump–thaw cycling.A sublimation pressure of 2.4 hPa HCN resided in a static long-path cryogenic absorption cell at a PID regulated temperatureof 207.0 � 0.2 K.30 These static equilibrium conditions maxi-mized the number density of formed (HCN)2 without severecollisional line broadening by the dominant monomeric HCNsample. The optical multipass arrangement of the long-pathabsorption cell is based on the design by Chernin and Barskaya31
and provided a total optical path length of 105 m. A specializedtransfer optics design is employed to extract and refocus theprobe beam into the sample chamber of a Bruker IFS 125 HRFourier transform spectrometer located at the far-infraredbeam-line AILES at the SOLEIL French Synchrotron Facility asdescribed elsewhere.30 Highly brilliant broadband synchrotronradiation from the third generation 2.75 GeV electron storage ringwith a ring current of 450 mA was focused onto the aperture of theFourier transform spectrometer, providing a signal-to-noise gainin the order of 10 to 25 at high spectral resolution relative to aconventional thermal radiation source.32,33 A total number of570 sample single-beam interferograms, corresponding to atotal scan time of 14 hours, were collected employing a 6 mmmultilayer Mylar beam splitter and a liquid helium cooled
Si-bolometer installed with a cold 370 cm�1 low-pass filter.The recorded sample interferograms were transformed employingMertz phase correction and boxcar apodization. A sample spectralresolution of 0.004 cm�1 was selected as the best compromisebetween the resulting signal-to-noise and the separation ofobserved spectral features. The background single-beam spectrawere collected at lower spectral resolution, which was still suffi-cient to capture the dominant interference fringes. The absolutewavenumber scale of the resulting THz absorption spectra wascalibrated against the accurate H2O line positions reported byJohns.34 The precision of the observed line positions is estimatedto be 0.001 cm�1.
3. Rovibrational analysis
Fig. 1 shows the observed THz absorbance spectrum of thehydrogen bond donor librational band n1
8 of (HCN)2 in the spectralregion of the strong Q-branch around 119.11 cm�1. The centralQ-branch degrades towards higher wavenumbers in the samemanner as observed previously for the n1
9 band associated withthe large-amplitude hydrogen bond acceptor librational modeand is accompanied by weaker R- and P-branches.25 The rovibra-tional structure thus has the typical appearance of a perpendi-cular type band of a S–P transition for a linear polyatomicmolecule. An extensive series of almost 30 lines belonging to theR-branch in the 20 r J00 r 50 range is readily observable,whereas the corresponding P-branch is severely overlapped bya second weaker Q-branch at 116.1 cm�1 (not shown), which weassign to the n1
8 + n19 � n1
9 hot band. The J-assignments of theR-branch transitions are rather straightforward as the unresolvedbeginning of the strong Q-branch clearly indicates the origin ofthe band (Fig. 1). The observed rotational structure of the bandwas analyzed employing a standard semi-rigid linear moleculeHamiltonian as implemented in the PGOPHER software packagedeveloped by Western.35 This semi-rigid linear molecule model
Fig. 1 Portion of the THz absorbance spectrum of the homodimer(HCN)2 showing the n1
8 band in the spectral region of the strong centralQ-branch. The numbered lines above the trace indicate the assignedQ-transitions of the band (see the ESI†).
Paper PCCP
Publ
ishe
d on
12
Mar
ch 2
018.
Dow
nloa
ded
by D
TU
Lib
rary
on
1/21
/202
0 10
:07:
07 A
M.
View Article Online
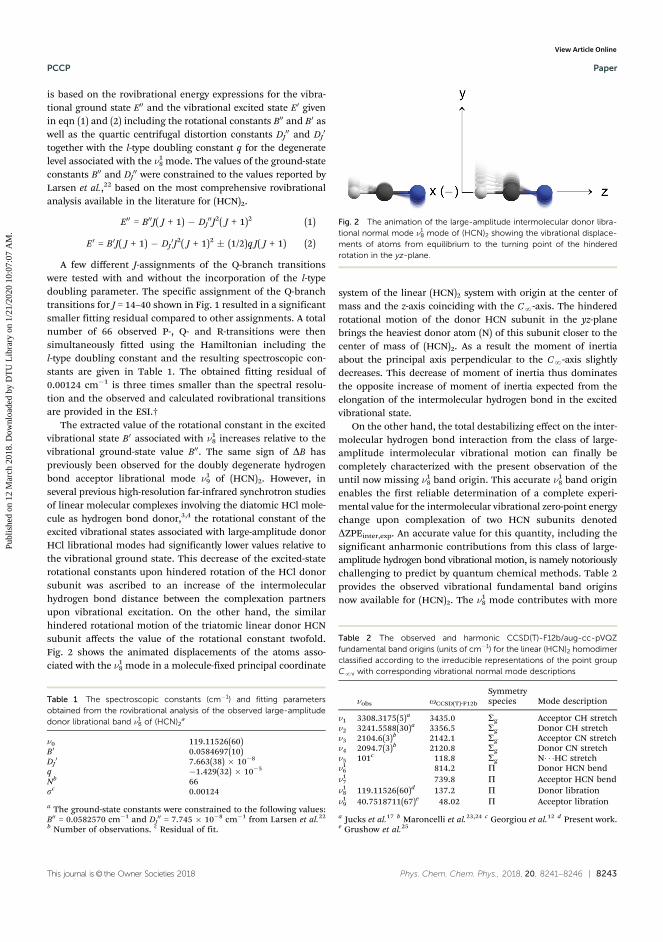
This journal is© the Owner Societies 2018 Phys. Chem. Chem. Phys., 2018, 20, 8241--8246 | 8243
is based on the rovibrational energy expressions for the vibra-tional ground state E00 and the vibrational excited state E0 givenin eqn (1) and (2) including the rotational constants B00 and B0 aswell as the quartic centrifugal distortion constants DJ
00 and DJ0
together with the l-type doubling constant q for the degeneratelevel associated with the n1
8 mode. The values of the ground-stateconstants B00 and DJ
00 were constrained to the values reported byLarsen et al.,22 based on the most comprehensive rovibrationalanalysis available in the literature for (HCN)2.
E00 = B00J( J + 1) � DJ00J2( J + 1)2 (1)
E0 = B0J( J + 1) � DJ0J2( J + 1)2 � (1/2)q J( J + 1) (2)
A few different J-assignments of the Q-branch transitionswere tested with and without the incorporation of the l-typedoubling parameter. The specific assignment of the Q-branchtransitions for J = 14–40 shown in Fig. 1 resulted in a significantsmaller fitting residual compared to other assignments. A totalnumber of 66 observed P-, Q- and R-transitions were thensimultaneously fitted using the Hamiltonian including thel-type doubling constant and the resulting spectroscopic con-stants are given in Table 1. The obtained fitting residual of0.00124 cm�1 is three times smaller than the spectral resolu-tion and the observed and calculated rovibrational transitionsare provided in the ESI.†
The extracted value of the rotational constant in the excitedvibrational state B0 associated with n1
8 increases relative to thevibrational ground-state value B00. The same sign of DB haspreviously been observed for the doubly degenerate hydrogenbond acceptor librational mode n1
9 of (HCN)2. However, inseveral previous high-resolution far-infrared synchrotron studiesof linear molecular complexes involving the diatomic HCl mole-cule as hydrogen bond donor,3,4 the rotational constant of theexcited vibrational states associated with large-amplitude donorHCl librational modes had significantly lower values relative tothe vibrational ground state. This decrease of the excited-staterotational constants upon hindered rotation of the HCl donorsubunit was ascribed to an increase of the intermolecularhydrogen bond distance between the complexation partnersupon vibrational excitation. On the other hand, the similarhindered rotational motion of the triatomic linear donor HCNsubunit affects the value of the rotational constant twofold.Fig. 2 shows the animated displacements of the atoms asso-ciated with the n1
8 mode in a molecule-fixed principal coordinate
system of the linear (HCN)2 system with origin at the center ofmass and the z-axis coinciding with the CN-axis. The hinderedrotational motion of the donor HCN subunit in the yz-planebrings the heaviest donor atom (N) of this subunit closer to thecenter of mass of (HCN)2. As a result the moment of inertiaabout the principal axis perpendicular to the CN-axis slightlydecreases. This decrease of moment of inertia thus dominatesthe opposite increase of moment of inertia expected from theelongation of the intermolecular hydrogen bond in the excitedvibrational state.
On the other hand, the total destabilizing effect on the inter-molecular hydrogen bond interaction from the class of large-amplitude intermolecular vibrational motion can finally becompletely characterized with the present observation of theuntil now missing n1
8 band origin. This accurate n18 band origin
enables the first reliable determination of a complete experi-mental value for the intermolecular vibrational zero-point energychange upon complexation of two HCN subunits denotedDZPEinter,exp. An accurate value for this quantity, including thesignificant anharmonic contributions from this class of large-amplitude hydrogen bond vibrational motion, is namely notoriouslychallenging to predict by quantum chemical methods. Table 2provides the observed vibrational fundamental band originsnow available for (HCN)2. The n1
8 mode contributes with more
Table 1 The spectroscopic constants (cm�1) and fitting parametersobtained from the rovibrational analysis of the observed large-amplitudedonor librational band n1
8 of (HCN)2a
n0 119.11526(60)B0 0.0584697(10)DJ0 7.663(38) � 10�8
q �1.429(32) � 10�5
Nb 66sc 0.00124
a The ground-state constants were constrained to the following values:B00 = 0.0582570 cm�1 and DJ
00 = 7.745 � 10�8 cm�1 from Larsen et al.22
b Number of observations. c Residual of fit.
Fig. 2 The animation of the large-amplitude intermolecular donor libra-tional normal mode n1
8 mode of (HCN)2 showing the vibrational displace-ments of atoms from equilibrium to the turning point of the hinderedrotation in the yz-plane.
Table 2 The observed and harmonic CCSD(T)-F12b/aug-cc-pVQZfundamental band origins (units of cm�1) for the linear (HCN)2 homodimerclassified according to the irreducible representations of the point groupCNv with corresponding vibrational normal mode descriptions
nobs oCCSD(T)-F12b
Symmetryspecies Mode description
n1 3308.3175(5)a 3435.0 Sg Acceptor CH stretchn2 3241.5588(30)a 3356.5 Sg Donor CH stretchn3 2104.6(3)b 2142.1 Sg Acceptor CN stretchn4 2094.7(3)b 2120.8 Sg Donor CN stretchn5 101c 118.8 Sg N� � �HC stretchn1
6 814.2 P Donor HCN bendn1
7 739.8 P Acceptor HCN bendn1
8 119.11526(60)d 137.2 P Donor librationn1
9 40.7518711(67)e 48.02 P Acceptor libration
a Jucks et al.17 b Maroncelli et al.23,24 c Georgiou et al.12 d Present work.e Grushow et al.25
PCCP Paper
Publ
ishe
d on
12
Mar
ch 2
018.
Dow
nloa
ded
by D
TU
Lib
rary
on
1/21
/202
0 10
:07:
07 A
M.
View Article Online
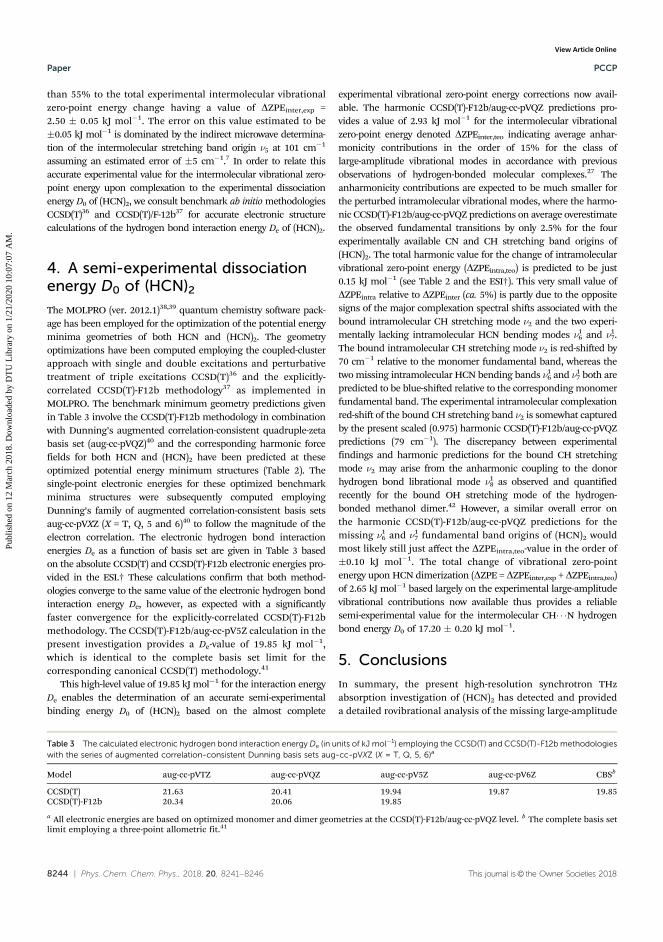
8244 | Phys. Chem. Chem. Phys., 2018, 20, 8241--8246 This journal is© the Owner Societies 2018
than 55% to the total experimental intermolecular vibrationalzero-point energy change having a value of DZPEinter,exp =2.50 � 0.05 kJ mol�1. The error on this value estimated to be�0.05 kJ mol�1 is dominated by the indirect microwave determina-tion of the intermolecular stretching band origin n5 at 101 cm�1
assuming an estimated error of �5 cm�1.7 In order to relate thisaccurate experimental value for the intermolecular vibrational zero-point energy upon complexation to the experimental dissociationenergy D0 of (HCN)2, we consult benchmark ab initio methodologiesCCSD(T)36 and CCSD(T)/F-12b37 for accurate electronic structurecalculations of the hydrogen bond interaction energy De of (HCN)2.
4. A semi-experimental dissociationenergy D0 of (HCN)2The MOLPRO (ver. 2012.1)38,39 quantum chemistry software pack-age has been employed for the optimization of the potential energyminima geometries of both HCN and (HCN)2. The geometryoptimizations have been computed employing the coupled-clusterapproach with single and double excitations and perturbativetreatment of triple excitations CCSD(T)36 and the explicitly-correlated CCSD(T)-F12b methodology37 as implemented inMOLPRO. The benchmark minimum geometry predictions givenin Table 3 involve the CCSD(T)-F12b methodology in combinationwith Dunning’s augmented correlation-consistent quadruple-zetabasis set (aug-cc-pVQZ)40 and the corresponding harmonic forcefields for both HCN and (HCN)2 have been predicted at theseoptimized potential energy minimum structures (Table 2). Thesingle-point electronic energies for these optimized benchmarkminima structures were subsequently computed employingDunning’s family of augmented correlation-consistent basis setsaug-cc-pVXZ (X = T, Q, 5 and 6)40 to follow the magnitude of theelectron correlation. The electronic hydrogen bond interactionenergies De as a function of basis set are given in Table 3 basedon the absolute CCSD(T) and CCSD(T)-F12b electronic energies pro-vided in the ESI.† These calculations confirm that both method-ologies converge to the same value of the electronic hydrogen bondinteraction energy De, however, as expected with a significantlyfaster convergence for the explicitly-correlated CCSD(T)-F12bmethodology. The CCSD(T)-F12b/aug-cc-pV5Z calculation in thepresent investigation provides a De-value of 19.85 kJ mol�1,which is identical to the complete basis set limit for thecorresponding canonical CCSD(T) methodology.41
This high-level value of 19.85 kJ mol�1 for the interaction energyDe enables the determination of an accurate semi-experimentalbinding energy D0 of (HCN)2 based on the almost complete
experimental vibrational zero-point energy corrections now avail-able. The harmonic CCSD(T)-F12b/aug-cc-pVQZ predictions pro-vides a value of 2.93 kJ mol�1 for the intermolecular vibrationalzero-point energy denoted DZPEinter,teo indicating average anhar-monicity contributions in the order of 15% for the class oflarge-amplitude vibrational modes in accordance with previousobservations of hydrogen-bonded molecular complexes.27 Theanharmonicity contributions are expected to be much smaller forthe perturbed intramolecular vibrational modes, where the harmo-nic CCSD(T)-F12b/aug-cc-pVQZ predictions on average overestimatethe observed fundamental transitions by only 2.5% for the fourexperimentally available CN and CH stretching band origins of(HCN)2. The total harmonic value for the change of intramolecularvibrational zero-point energy (DZPEintra,teo) is predicted to be just0.15 kJ mol�1 (see Table 2 and the ESI†). This very small value ofDZPEintra relative to DZPEinter (ca. 5%) is partly due to the oppositesigns of the major complexation spectral shifts associated with thebound intramolecular CH stretching mode n2 and the two experi-mentally lacking intramolecular HCN bending modes n1
6 and n17.
The bound intramolecular CH stretching mode n2 is red-shifted by70 cm�1 relative to the monomer fundamental band, whereas thetwo missing intramolecular HCN bending bands n1
6 and n17 both are
predicted to be blue-shifted relative to the corresponding monomerfundamental band. The experimental intramolecular complexationred-shift of the bound CH stretching band n2 is somewhat capturedby the present scaled (0.975) harmonic CCSD(T)-F12b/aug-cc-pVQZpredictions (79 cm�1). The discrepancy between experimentalfindings and harmonic predictions for the bound CH stretchingmode n2 may arise from the anharmonic coupling to the donorhydrogen bond librational mode n1
8 as observed and quantifiedrecently for the bound OH stretching mode of the hydrogen-bonded methanol dimer.42 However, a similar overall error onthe harmonic CCSD(T)-F12b/aug-cc-pVQZ predictions for themissing n1
6 and n17 fundamental band origins of (HCN)2 would
most likely still just affect the DZPEintra,teo-value in the order of�0.10 kJ mol�1. The total change of vibrational zero-pointenergy upon HCN dimerization (DZPE = DZPEinter,exp + DZPEintra,teo)of 2.65 kJ mol�1 based largely on the experimental large-amplitudevibrational contributions now available thus provides a reliablesemi-experimental value for the intermolecular CH� � �N hydrogenbond energy D0 of 17.20 � 0.20 kJ mol�1.
5. Conclusions
In summary, the present high-resolution synchrotron THzabsorption investigation of (HCN)2 has detected and provideda detailed rovibrational analysis of the missing large-amplitude
Table 3 The calculated electronic hydrogen bond interaction energy De (in units of kJ mol�1) employing the CCSD(T) and CCSD(T)-F12b methodologieswith the series of augmented correlation-consistent Dunning basis sets aug-cc-pVXZ (X = T, Q, 5, 6)a
Model aug-cc-pVTZ aug-cc-pVQZ aug-cc-pV5Z aug-cc-pV6Z CBSb
CCSD(T) 21.63 20.41 19.94 19.87 19.85CCSD(T)-F12b 20.34 20.06 19.85
a All electronic energies are based on optimized monomer and dimer geometries at the CCSD(T)-F12b/aug-cc-pVQZ level. b The complete basis setlimit employing a three-point allometric fit.41
Paper PCCP
Publ
ishe
d on
12
Mar
ch 2
018.
Dow
nloa
ded
by D
TU
Lib
rary
on
1/21
/202
0 10
:07:
07 A
M.
View Article Online
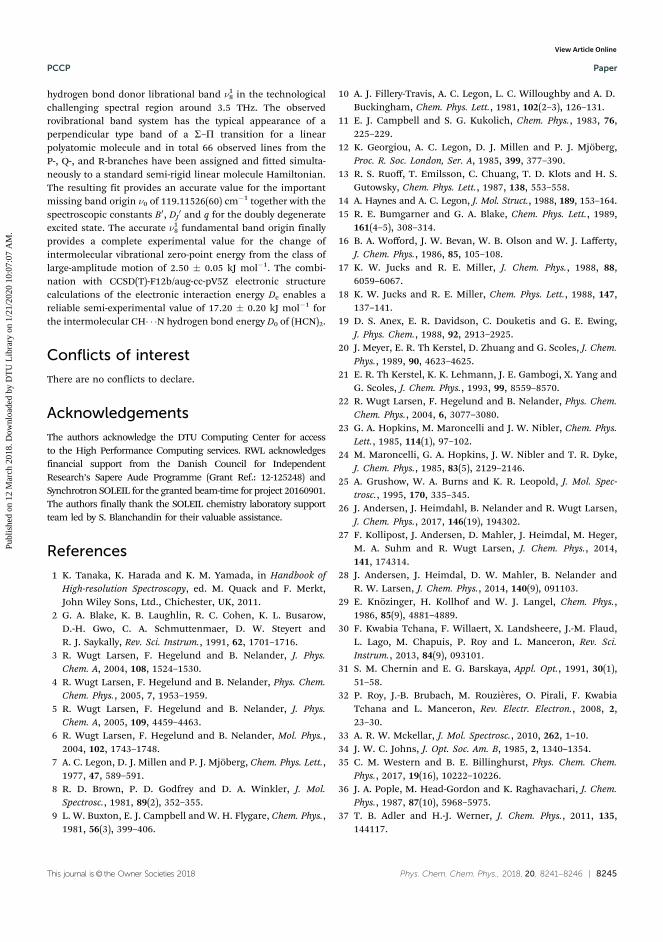
This journal is© the Owner Societies 2018 Phys. Chem. Chem. Phys., 2018, 20, 8241--8246 | 8245
hydrogen bond donor librational band n18 in the technological
challenging spectral region around 3.5 THz. The observedrovibrational band system has the typical appearance of aperpendicular type band of a S–P transition for a linearpolyatomic molecule and in total 66 observed lines from theP-, Q-, and R-branches have been assigned and fitted simulta-neously to a standard semi-rigid linear molecule Hamiltonian.The resulting fit provides an accurate value for the importantmissing band origin n0 of 119.11526(60) cm�1 together with thespectroscopic constants B0, DJ
0 and q for the doubly degenerateexcited state. The accurate n1
8 fundamental band origin finallyprovides a complete experimental value for the change ofintermolecular vibrational zero-point energy from the class oflarge-amplitude motion of 2.50 � 0.05 kJ mol�1. The combi-nation with CCSD(T)-F12b/aug-cc-pV5Z electronic structurecalculations of the electronic interaction energy De enables areliable semi-experimental value of 17.20 � 0.20 kJ mol�1 forthe intermolecular CH� � �N hydrogen bond energy D0 of (HCN)2.
Conflicts of interest
There are no conflicts to declare.
Acknowledgements
The authors acknowledge the DTU Computing Center for accessto the High Performance Computing services. RWL acknowledgesfinancial support from the Danish Council for IndependentResearch’s Sapere Aude Programme (Grant Ref.: 12-125248) andSynchrotron SOLEIL for the granted beam-time for project 20160901.The authors finally thank the SOLEIL chemistry laboratory supportteam led by S. Blanchandin for their valuable assistance.
References
1 K. Tanaka, K. Harada and K. M. Yamada, in Handbook ofHigh-resolution Spectroscopy, ed. M. Quack and F. Merkt,John Wiley Sons, Ltd., Chichester, UK, 2011.
2 G. A. Blake, K. B. Laughlin, R. C. Cohen, K. L. Busarow,D.-H. Gwo, C. A. Schmuttenmaer, D. W. Steyert andR. J. Saykally, Rev. Sci. Instrum., 1991, 62, 1701–1716.
3 R. Wugt Larsen, F. Hegelund and B. Nelander, J. Phys.Chem. A, 2004, 108, 1524–1530.
4 R. Wugt Larsen, F. Hegelund and B. Nelander, Phys. Chem.Chem. Phys., 2005, 7, 1953–1959.
5 R. Wugt Larsen, F. Hegelund and B. Nelander, J. Phys.Chem. A, 2005, 109, 4459–4463.
6 R. Wugt Larsen, F. Hegelund and B. Nelander, Mol. Phys.,2004, 102, 1743–1748.
7 A. C. Legon, D. J. Millen and P. J. Mjoberg, Chem. Phys. Lett.,1977, 47, 589–591.
8 R. D. Brown, P. D. Godfrey and D. A. Winkler, J. Mol.Spectrosc., 1981, 89(2), 352–355.
9 L. W. Buxton, E. J. Campbell and W. H. Flygare, Chem. Phys.,1981, 56(3), 399–406.
10 A. J. Fillery-Travis, A. C. Legon, L. C. Willoughby and A. D.Buckingham, Chem. Phys. Lett., 1981, 102(2–3), 126–131.
11 E. J. Campbell and S. G. Kukolich, Chem. Phys., 1983, 76,225–229.
12 K. Georgiou, A. C. Legon, D. J. Millen and P. J. Mjoberg,Proc. R. Soc. London, Ser. A, 1985, 399, 377–390.
13 R. S. Ruoff, T. Emilsson, C. Chuang, T. D. Klots and H. S.Gutowsky, Chem. Phys. Lett., 1987, 138, 553–558.
14 A. Haynes and A. C. Legon, J. Mol. Struct., 1988, 189, 153–164.15 R. E. Bumgarner and G. A. Blake, Chem. Phys. Lett., 1989,
161(4–5), 308–314.16 B. A. Wofford, J. W. Bevan, W. B. Olson and W. J. Lafferty,
J. Chem. Phys., 1986, 85, 105–108.17 K. W. Jucks and R. E. Miller, J. Chem. Phys., 1988, 88,
6059–6067.18 K. W. Jucks and R. E. Miller, Chem. Phys. Lett., 1988, 147,
137–141.19 D. S. Anex, E. R. Davidson, C. Douketis and G. E. Ewing,
J. Phys. Chem., 1988, 92, 2913–2925.20 J. Meyer, E. R. Th Kerstel, D. Zhuang and G. Scoles, J. Chem.
Phys., 1989, 90, 4623–4625.21 E. R. Th Kerstel, K. K. Lehmann, J. E. Gambogi, X. Yang and
G. Scoles, J. Chem. Phys., 1993, 99, 8559–8570.22 R. Wugt Larsen, F. Hegelund and B. Nelander, Phys. Chem.
Chem. Phys., 2004, 6, 3077–3080.23 G. A. Hopkins, M. Maroncelli and J. W. Nibler, Chem. Phys.
Lett., 1985, 114(1), 97–102.24 M. Maroncelli, G. A. Hopkins, J. W. Nibler and T. R. Dyke,
J. Chem. Phys., 1985, 83(5), 2129–2146.25 A. Grushow, W. A. Burns and K. R. Leopold, J. Mol. Spec-
trosc., 1995, 170, 335–345.26 J. Andersen, J. Heimdahl, B. Nelander and R. Wugt Larsen,
J. Chem. Phys., 2017, 146(19), 194302.27 F. Kollipost, J. Andersen, D. Mahler, J. Heimdal, M. Heger,
M. A. Suhm and R. Wugt Larsen, J. Chem. Phys., 2014,141, 174314.
28 J. Andersen, J. Heimdal, D. W. Mahler, B. Nelander andR. W. Larsen, J. Chem. Phys., 2014, 140(9), 091103.
29 E. Knozinger, H. Kollhof and W. J. Langel, Chem. Phys.,1986, 85(9), 4881–4889.
30 F. Kwabia Tchana, F. Willaert, X. Landsheere, J.-M. Flaud,L. Lago, M. Chapuis, P. Roy and L. Manceron, Rev. Sci.Instrum., 2013, 84(9), 093101.
31 S. M. Chernin and E. G. Barskaya, Appl. Opt., 1991, 30(1),51–58.
32 P. Roy, J.-B. Brubach, M. Rouzieres, O. Pirali, F. KwabiaTchana and L. Manceron, Rev. Electr. Electron., 2008, 2,23–30.
33 A. R. W. Mckellar, J. Mol. Spectrosc., 2010, 262, 1–10.34 J. W. C. Johns, J. Opt. Soc. Am. B, 1985, 2, 1340–1354.35 C. M. Western and B. E. Billinghurst, Phys. Chem. Chem.
Phys., 2017, 19(16), 10222–10226.36 J. A. Pople, M. Head-Gordon and K. Raghavachari, J. Chem.
Phys., 1987, 87(10), 5968–5975.37 T. B. Adler and H.-J. Werner, J. Chem. Phys., 2011, 135,
144117.
PCCP Paper
Publ
ishe
d on
12
Mar
ch 2
018.
Dow
nloa
ded
by D
TU
Lib
rary
on
1/21
/202
0 10
:07:
07 A
M.
View Article Online

8246 | Phys. Chem. Chem. Phys., 2018, 20, 8241--8246 This journal is© the Owner Societies 2018
38 H.-J. Werner, P. J. Knowles, G. Knizia, F. R. Manby andM. Schotz, Wiley Interdiscip. Rev.: Comput. Mol. Sci., 2012, 2,242–253.
39 H.-J. Werner, P. J. Knowles, G. Knizia, F. R. Manby,M. Schutz, P. Celani, W. Gyorffy, D. Kats, T. Korona,R. Lindh, A. Mitrushenkov, G. Rauhut, K. R.Shamasundar, T. B. Adler, R. D. Amos, A. Bernhardsson,A. Berning, D. L. Cooper, M. J. O. Deegan, A. J. Dobbyn,F. Eckert, E. Goll, C. Hampel, A. Hesselmann, G. Hetzer,T. Hrenar, G. Jansen, C. Koppl, Y. Liu, A. W. Lloyd,R. A. Mata, A. J. May, S. J. McNicholas, W. Meyer,
M. E. Mura, A. Nicklass, D. P. O’Neill, P. Palmieri,D. Peng, K. Pfluger, R. Pitzer, M. Reiher, T. Shiozaki,H. Stoll, A. J. Stone, R. Tarroni, T. Thorsteinsson andM. Wang, Molpro, version 2012.1, a package of ab initioprograms, 2012.
40 R. A. Kendall, T. H. Dunning, Jr. and R. J. Harrison, J. Chem.Phys., 1992, 96(9), 6796–6806.
41 J. Rezac and P. Hobza, J. Chem. Theory Comput., 2013, 9,2151–2155.
42 M. Heger, J. Andersen, M. A. Suhm and R. Wugt Larsen,Phys. Chem. Chem. Phys., 2016, 18, 3739–3745.
Paper PCCP
Publ
ishe
d on
12
Mar
ch 2
018.
Dow
nloa
ded
by D
TU
Lib
rary
on
1/21
/202
0 10
:07:
07 A
M.
View Article Online

Bibliography(1) L. S. Russell, AHeritage of light: lamps and lighting in the early Canadian home, Springer Science & Business,
2003.
(2) H. Dolson,TheGreat Oildorado:TheGaudy andTurbulent Years of the First Oil Rush: Pennsylvania, 1859-1880,Random House, 1959.
(3) E. Tzimas, A. Georgakaki, C. G. Cortes and S. Peteves, Report EUR, 2005, 21895.
(4) O. Hjelmeland, L. Larrondo et al., SPE Reservoir Engineering, 1986, 1, 321–328.
(5) M. Denekas, C. Mattax, G. Davis et al., 1959.
(6) M. M. Thomas, J. A. Clouse and J. M. Longo, Chemical geology, 1993, 109, 201–213.
(7) M. Radke, D. Welte and H. Willsch, Organic geochemistry, 1986, 10, 51–63.
(8) A. S. Costa, L. Romão, B. Araújo, S. Lucas, S. Maciel, A. Wisniewski Jr and M. d. R. Alexandre, BioresourceTechnology, 2012, 105, 31–39.
(9) D. Johansson, P.-Å. Franck, K. Pettersson and T. Berntsson, Energy, 2013, 59, 387–401.
(10) M. Mahdizadeh, A. A. Eftekhari and H. Nick, Journal of Petroleum Science and Engineering, 2019, 175, 681–692.
(11) A. Chernetsky, S. Masalmeh, D. Eikmans, P. Boerrigter, A. Fadili, C. Parsons, A. Parker, D. Boersma, J.Cui, B. Dindoruk et al., Abu Dhabi International Petroleum Exhibition and Conference, 2015.
(12) R. R. Ratnakar, B. Dindoruk and L. Wilson, Fuel, 2016, 182, 188–197.
(13) J. G. Speight, The chemistry and technology of petroleum, CRC press, 2014.
(14) N. J. Hyne, Nontechnical guide to petroleum geology, exploration, drilling, and production, PennWell Books,2012.
(15) J. S. Buckley, Y. Liu, X. Xie, N. R. Morrow et al., SPE journal, 1997, 2, 107–119.
(16) S. Libes, Introduction to marine biogeochemistry, Academic Press, 2011.
(17) N. Bailey, A. Jobson and M. Rogers, Chemical Geology, 1973, 11, 203–221.
(18) M. Hassanshahian, M. S. Zeynalipour and F. H. Musa, Marine Pollution Bulletin, 2014, 82, 39–44.
(19) P. Rueter, R. Rabus, H. Wilkest, F. Aeckersberg, F. A. Rainey, H. W. Jannasch and F. Widdel, Nature, 1994,372, 455.
(20) U. Jaekel, J. Zedelius, H. Wilkes and F. Musat, Frontiers in Microbiology, 2015, 6, 116.
(21) G. Parisotto, M. F. Ferrao, A. L. Müller, E. I. Müller, M. F. Santos, R. C. Guimaraes, J. C. Dias and É. M.Flores, Energy & Fuels, 2010, 24, 5474–5478.
(22) J. Dong, F. R. van de Voort, V. Yaylayan, A. A. Ismail, D. Pinchuk and A. Taghizadeh, Lubrication Engi-neering, 2001, 57.
(23) D. Jewell, J. Weber, J. Bunger, H. Plancher and D. Latham, Analytical Chemistry, 1972, 44, 1391–1395.
(24) J. Suatoni and R. Swab, Journal of Chromatographic Science, 1975, 13, 361–366.
224 Bibliography
(25) J. D. McLean and P. K. Kilpatrick, Energy & Fuels, 1997, 11, 570–585.
(26) Y. Suzuki, 21st Annual meeting of the Japan society for analytical chemistry, 1972, vol. 47.
(27) T. Fan, J. Wang, J. S. Buckley et al., SPE/DOE improved oil recovery symposium, 2002.
(28) L. V. Melendez, A. Lache, J. A. Orrego-Ruiz, Z. Pachón and E. Mejı�a-Ospino, Journal of Petroleum Scienceand Engineering, 2012, 90, 56–60.
(29) O. Amador-Muñoz and P. J. Marriott, Journal of Chromatography A, 2008, 1184, 323–340.
(30) M. D. Bleasel, S. Aldous and N. W. Davies, Journal of Analytical and Applied Pyrolysis, 2003, 70, 649–663.
(31) D. Cavagnino, P. Magni, G. Zilioli and S. Trestianu, Journal of Chromatography A, 2003, 1019, 211–220.
(32) G. S. Douglas, A. E. Bence, R. C. Prince, S. J. McMillen and E. L. Butler, Environmental Science & Tech-nology, 1996, 30, 2332–2339.
(33) H. Malle and P. Fowlie, Proceedings of the second biennial international conference on chemical measure-ment and monitoring of the environment, EnviroAnalysis’ 98 Conference, 1998, pp. 11–14.
(34) S. Chakraborty, D. C. Weindorf, C. L. Morgan, Y. Ge, J. M. Galbraith, B. Li and C. S. Kahlon, Journal ofEnvironmental Quality, 2010, 39, 1378–1387.
(35) S. Forrester, L. Janik, M. McLaughlin et al., Proceedings of the 19th World Congress of Soil Science: Soilsolutions for a changing world, Brisbane, Australia, 1-6 August 2010. Working Group 1.5 Soil sense: rapidsoil measurements, 2010, pp. 13–16.
(36) M. Whittaker, S. J. Pollard and T. E. Fallick, Environmental Technology, 1995, 16, 1009–1033.
(37) P. R. Loconto, Trace Environmental Quantitative Analysis: Principles: Techniques, and Applications, CRCPress, 2019.
(38) A. L. H. Müller, R. S. Picoloto, P. de Azevedo Mello, M. F. Ferrão, M. d. F. P. dos Santos, R. C. L.Guimarães, E. I. Müller and E. M. M. Flores, Spectrochimica Acta Part A: Molecular and Biomolecular Spec-troscopy, 2012, 89, 82–87.
(39) D. L. Poster, M. M. Schantz, L. C. Sander and S. A. Wise, Analytical and Bioanalytical Chemistry, 2006,386, 859–881.
(40) D. L. Poster, B. A. Benner Jr, M. M. Schantz, L. C. Sander, S. A. Wise and M. G. Vangel, Polycyclic AromaticCompounds, 2003, 23, 113–139.
(41) D. L. Poster, M. J. Lopez de Alda, M. M. Schantz, L. C. Sander, S. A. Wise and M. G. Vangel, PolycyclicAromatic Compounds, 2003, 23, 141–191.
(42) S. A. Wise, D. L. Poster, M. M. Schantz, J. R. Kucklick, L. C. Sander, M. L. de Alda, P. Schubert, R. M.Parris and B. J. Porter, Analytical and bioanalytical chemistry, 2004, 378, 1251–1264.
(43) J. C. Chuang, J. M. Van Emon, Y.-L. Chou, N. Junod, J. K. Finegold and N. K. Wilson, Analytica ChimicaActa, 2003, 486, 31–39.
(44) D. Zhan and J. B. Fenn, International Journal of Mass Spectrometry, 2000, 194, 197–208.
(45) K. Qian, R. P. Rodgers, C. L. Hendrickson, M. R. Emmett and A. G. Marshall, Energy & Fuels, 2001, 15,492–498.
(46) C. Wu, K. Qian, M. Nefliu and R. G. Cooks, Journal of the American Society for Mass Spectrometry, 2010, 21,261–267.
(47) R. P. Rodgers and A. M. McKenna, Analytical Chemistry, 2011, 83, 4665–4687.
Bibliography 225
(48) K. E. Peters and J. M. Moldowan, 1993.
(49) J. M. Moldowan, J. Dahl, B. J. Huizinga, F. J. Fago, L. J. Hickey, T. M. Peakman and D. W. Taylor, Science,1994, 265, 768–771.
(50) H. Ten Haven, M. Baas, M. Kroot, J. De Leeuw, P. Schenck and J. Ebbing, Geochimica et Cosmochimica Acta,1987, 51, 803–810.
(51) R. J. Davey, Polymorphism inMolecular Crystals, Joel Bernstein. Oxford University Press, New York, 2002. ISBN0198506058. 2002.
(52) G. R. Desiraju and G. W. Parshall, Materials Science Monographs, 1989, 54.
(53) L. Pauling, The Nature of the Chemical Bond, Cornell university press Ithaca, NY, 1960, vol. 260.
(54) S. J. Grabowski, Hydrogen Bonding: New Insights, Springer, 2006, vol. 3.
(55) V. Majer, V. Svoboda and H. V. Kehiaian, Enthalpies of vaporization of organic compounds: a critical reviewand data compilation, Blackwell Scientific Oxford, 1985, vol. 32.
(56) J. N. Israelachvili, Intermolecular and surface forces, Academic press, 2015.
(57) G. Maitland, M. Rigby, E. Smith, W. Wakeham and D. Henderson, Physics Today, 1983, 36, 57.
(58) G. R. Desiraju, Nature, 2001, 412, 397.
(59) E. Arunan, G. R. Desiraju, R. A. Klein, J. Sadlej, S. Scheiner, I. Alkorta, D. C. Clary, R. H. Crabtree, J. J.Dannenberg, P. Hobza et al., Pure and Applied Chemistry, 2011, 83, 1637–1641.
(60) G. R. Desiraju and T. Steiner, Theweak hydrogen bond: in structural chemistry and biology, International Unionof Crystal, 2001, vol. 9.
(61) G. C. Pimentel and A. McClellan, Annual Review of Physical Chemistry, 1971, 22, 347–385.
(62) W. Heisenberg, in Original Scientific Papers Wissenschaftliche Originalarbeiten, Springer, 1985, pp. 478–504.
(63) P. W. Milonni, The quantum vacuum: an introduction to quantum electrodynamics, Academic press, 2013.
(64) J. W. Ochterski, Gaussian Inc, 2000, 1–19.
(65) S. S. Xantheas, The Journal of Chemical Physics, 1994, 100, 7523–7534.
(66) C. Reichardt, Chemical Reviews, 1994, 94, 2319–2358.
(67) U. Buhvestov, F. Rived, C. Ràfols, E. Bosch and M. Rosés, Journal of Physical Organic Chemistry, 1998, 11,185–192.
(68) R. D. Skwierczynski and K. A. Connors, Journal of the Chemical Society, Perkin Transactions 2, 1994, 467–472.
(69) P. Mancini, A. Terenzani, M. Gasparri and L. Vottero, Journal of Physical Organic Chemistry, 1995, 8, 617–625.
(70) D. Mihrin, P. Jakobsen, A. Voute, L. Manceron and R. Wugt Larsen, ChemPhysChem, 2019, 20, 3238–3244.
(71) Z. Yu and W. Klemperer, Proceedings of the National Academy of Sciences of the United States of America, 2005,102, 12667–12669.
(72) S. Chernin and E. Barskaya, Applied Optics, 1991, 30, 51–58.
(73) D. Mihrin, P. Jakobsen, A. Voute, L. Manceron and R. W. Larsen, Physical Chemistry Chemical Physics, 2018,20, 8241–8246.
226 Bibliography
(74) M. V. Johnston, TrAC Trends in Analytical Chemistry, 1984, 3, 58–61.
(75) R. Smalley, L. Wharton and D. Levy, The Journal of Chemical Physics, 1977, 66, 2750–2751.
(76) A. Amirav, U. Even and J. Jortner, Chemical Physics, 1980, 51, 31–42.
(77) M. Choi, G. Douberly, T. Falconer, W. Lewis, C. Lindsay, J. Merritt, P. Stiles and R. Miller, InternationalReviews in Physical Chemistry, 2006, 25, 15–75.
(78) R. Schwan, C. Qu, D. Mani, N. Pal, L. van der Meer, B. Redlich, C. Leforestier, J. M. Bowman, G. Schwaaband M. Havenith, Angewandte Chemie, 2019, 131, 13253–13260.
(79) Bruker IFS 125 HR User Manual, 2006.
(80) L. Bosco, M. Franckié, G. Scalari, M. Beck, A. Wacker and J. Faist, Applied Physics Letters, 2019, 115,010601.
(81) M. Faye, M. Bordessoule, B. Kanouté, J.-B. Brubach, P. Roy and L. Manceron, Review of Scientific Instru-ments, 2016, 87, 063119.
(82) F. Simoens, in Physics and Applications of Terahertz Radiation, Springer, 2014, pp. 35–75.
(83) A. Lange, E. Kreysa, S. McBride, P. Richards and E. Haller, International Journal of Infrared andMillimeterWaves, 1983, 4, 689–706.
(84) R. Radebaugh, Infrared Technology and Applications XXVI, 2000, vol. 4130, pp. 363–379.
(85) F. M. Mirabella, Internal reflection spectroscopy: theory and applications, CRC Press, 1992, vol. 15.
(86) J. Grdadolnik, Acta Chimica Slovenica, 2002, 49, 631–642.
(87) K. Nishikida and K. Kempfert, Pittsburgh Conference on Analytical Chemistry and Applied Spectroscopy,2013.
(88) J. B. Cooper, K. L. Wise, J. Groves and W. T. Welch, Analytical Chemistry, 1995, 67, 4096–4100.
(89) H. Sadeghi-Jorabchi, P. Hendra, R. Wilson and P. Belton, Journal of the American Oil Chemists’ Society, 1990,67, 483–486.
(90) C. A. Hughey, R. P. Rodgers, A. G. Marshall, C. C. Walters, K. Qian and P. Mankiewicz, Organic Geo-chemistry, 2004, 35, 863–880.
(91) B. P. Lovatti, S. R. Silva, N. d. A. Portela, C. M. Sad, K. P. Rainha, J. T. Rocha, W. Romão, E. V. Castroand P. R. Filgueiras, Fuel, 2019, 254, 115670.
(92) A. B. Garmarudi, M. Khanmohammadi, H. G. Fard and M. de la Guardia, Fuel, 2019, 236, 1093–1099.
(93) É. V. Rodrigues, S. R. Silva, W. Romão, E. V. Castro and P. R. Filgueiras, Fuel, 2018, 220, 389–395.
(94) H. Zhan, S. Wu, R. Bao, L. Ge and K. Zhao, Fuel, 2015, 143, 189–193.
(95) D. Rivera-Barrera, H. Rueda-Chacón and D. Molina, Talanta, 2019, 120186.
(96) H. M. Meighani, C. Ghotbi, T. J. Behbahani and K. Sharifi, Journal of Molecular Liquids, 2018, 249, 970–979.
(97) E. G. Lee, J. Y. Seto, T. Hirao, P. F. Bernath and R. J. Le Roy, Journal of Molecular Spectroscopy, 1999, 194,197–202.
(98) M. Wojdyr, Journal of Applied Crystallography, 2010, 43, 1126–1128.
(99) J. J. Moré, in Numerical Analysis, Springer, 1978, pp. 105–116.
Bibliography 227
(100) P. M. Edwards, Journal of chemical information and computer sciences, 2002, 42, 1270–1271.
(101) J. E. Jackson, A user’s guide to principal components, John Wiley & Sons, 2005, vol. 587.
(102) E. Whittle, D. A. Dows and G. C. Pimentel, The Journal of Chemical Physics, 1954, 22, 1943–1943.
(103) M. Van Thiel, E. D. Becker and G. C. Pimentel, The Journal of Chemical Physics, 1957, 27, 486–490.
(104) T. Häber, U. Schmitt and M. A. Suhm, Physical Chemistry Chemical Physics, 1999, 1, 5573–5582.
(105) S. Coussan, P. Roubin and J. Perchard, The Journal of Physical Chemistry A, 2004, 108, 7331–7338.
(106) N. Balshaw, Practical cryogenics. And introduction to laboratory cryogenics, 1996.
(107) A. P. Scott and L. Radom, The Journal of Physical Chemistry, 1996, 100, 16502–16513.
(108) J. P. Merrick, D. Moran and L. Radom, The Journal of Physical Chemistry A, 2007, 111, 11683–11700.
(109) J. C. Slater, Physical Review, 1951, 81, 385.
(110) C. Møller and M. S. Plesset, Physical Review, 1934, 46, 618.
(111) M. Head-Gordon, J. A. Pople and M. J. Frisch, Chemical Physics Letters, 1988, 153, 503–506.
(112) R. Krishnan and J. A. Pople, International Journal of Quantum Chemistry, 1978, 14, 91–100.
(113) R. Sedlak, T. Janowski, M. Pitonak, J. Rezac, P. Pulay and P. Hobza, Journal of Chemical Theory and Com-putation, 2013, 9, 3364–3374.
(114) S. Grimme, The Journal of Chemical Physics, 2003, 118, 9095–9102.
(115) L. Goerigk and S. Grimme, Physical Chemistry Chemical Physics, 2011, 13, 6670–6688.
(116) H. Kummel, 11/2003, vol. 17, pp. 5311–5325, DOI: 10.1142/S0217979203020442.
(117) J. Čižek, The Journal of Chemical Physics, 1966, 45, 4256–4266.
(118) J. Řezáč and P. Hobza, Journal of Chemical Theory and Computation, 2013, 9, 2151–2155, DOI: 10.1021/ct400057w.
(119) M. K. Kesharwani, B. Brauer and J. M. Martin, The Journal of Physical Chemistry A, 2014, 119, 1701–1714.
(120) P. Soulard, B. Madebène and B. Tremblay, The Journal of Chemical Physics, 2017, 146, 234303.
(121) D. Mihrin and R. W. Larsen, Physical Chemistry Chemical Physics, 2019, 21, 349–358.
(122) W. S. Ohlinger, P. E. Klunzinger, B. J. Deppmeier and W. J. Hehre, The Journal of Physical Chemistry A, 2009,113, 2165–2175.
(123) L. A. Curtiss, K. Raghavachari and J. A. Pople, The Journal of Chemical Physics, 1993, 98, 1293–1298.
(124) H. I. Rivera-Arrieta, J. M. Turney and H. F. Schaefer III, Journal of Chemical Theory and Computation, 2017,13, 1478–1485.
(125) R. Sure and S. Grimme, Journal of Computational Chemistry, 2013, 34, 1672–1685.
(126) S. Grimme, J. Antony, S. Ehrlich and H. Krieg, The Journal of Chemical Physics, 2010, 132, 154104.
(127) H. Kruse and S. Grimme, The Journal of Chemical Physics, 2012, 136, 04B613.
(128) S. F. Boys and F. d. Bernardi, Molecular Physics, 1970, 19, 553–566.
(129) J. G. Brandenburg, C. Bannwarth, A. Hansen and S. Grimme, The Journal of Chemical Physics, 2018, 148,064104.
(130) H.-J. Werner, F. R. Manby and P. J. Knowles, The Journal of Chemical Physics, 2003, 118, 8149–8160.
228 Bibliography
(131) B. I. Dunlap, J. Connolly and J. Sabin, The Journal of Chemical Physics, 1979, 71, 3396–3402.
(132) E. Baerends, D. Ellis and P. Ros, Chemical Physics, 1973, 2, 41–51.
(133) F. Neese, F. Wennmohs, A. Hansen and U. Becker, Chemical Physics, 2009, 356, 98–109, DOI: 10.1016/j.chemphys.2008.10.036.
(134) J. Paldus, J. Čı�žek and I. Shavitt, Physical Review A, 1972, 5, 50.
(135) K. Raghavachari, G. W. Trucks, J. A. Pople and M. Head-Gordon, Chemical Physics Letters, 1989, 157, 479–483.
(136) J. Pipek and P. G. Mezey, The Journal of Chemical Physics, 1989, 90, 4916–4926.
(137) C. Riplinger, B. Sandhoefer, A. Hansen and F. Neese, The Journal of Chemical Physics, 2013, 139, 134101.
(138) C. Riplinger, P. Pinski, U. Becker, E. F. Valeev and F. Neese, Journal of Chemical Physics, 2016, 144, DOI:10.1063/1.4939030.
(139) W. Meyer, Methods of Electronic Structure Theory, 1977.
(140) R. Ahlrichs, F. Driessler, H. Lischka, V. Staemmler and W. Kutzelnigg, The Journal of Chemical Physics, 1975,62, 1235–1247.
(141) D. G. Liakos, M. Sparta, M. K. Kesharwani, J. M. Martin and F. Neese, Journal of Chemical Theory andComputation, 2015, 11, 1525–1539.
(142) H.-J. Werner, P. J. Knowles, G. Knizia, F. R. Manby and M. Schütz, Wiley Interdisciplinary Reviews: Com-putational Molecular Science, 03/2012, 2, 242–253, DOI: 10.1002/wcms.82.
(143) A. Altun, F. Neese and G. Bistoni, Beilstein Journal of Organic Chemistry, 2018, 14, 919–929.
(144) G. Bistoni, A. A. Auer and F. Neese, Chemistry-A European Journal, 2017, 23, 865–873.
(145) L. Kong, F. A. Bischoff and E. F. Valeev, Chemical Reviews, 2011, 112, 75–107.
(146) T. Kato, Communications on Pure and Applied Mathematics, 1957, 10, 151–177.
(147) G. Knizia, T. B. Adler and H.-J. Werner, The Journal of Chemical Physics, 02/2009, 130, 054104, DOI: 10.1063/1.3054300.
(148) K. A. Peterson, M. K. Kesharwani and J. M. Martin, Molecular Physics, 2015, 113, 1551–1558.
(149) K. A. Peterson, T. B. Adler and H.-J. Werner, The Journal of Chemical Physics, 2008, 128, 084102.
(150) T. B. Adler, G. Knizia and H.-J. Werner, A simple and efficient CCSD (T)-F12 approximation, 2007.
(151) O. Marchetti and H.-J. Werner, Physical Chemistry Chemical Physics, 2008, 10, 3400–3409.
(152) N. Sylvetsky, M. K. Kesharwani and J. M. Martin, The Journal of Chemical Physics, 2017, 147, 134106.
(153) J. W. Ochterski, help@ gaussian. com, 1999.
(154) J. Andersen, J. Heimdal, D. Mahler, B. Nelander and R. W. Larsen,Communication: THz absorption spectrumof the CO2–H2O complex: Observation and assignment of intermolecular van der Waals vibrations, 2014.
(155) R. L. Jacobsen, R. D. Johnson III, K. K. Irikura and R. N. Kacker, Journal of Chemical Theory and Computa-tion, 2013, 9, 951–954.
(156) J. Ceponkus, P. Uvdal and B. Nelander, The Journal of Physical Chemistry A, 2010, 114, 6829–6831.
(157) J. M. Bowman, Accounts of Chemical Research, 1986, 19, 202–208.
(158) R. Gerber and M. A. Ratner, Adv. Chem. Phys, 1988, 70, 97–132.
Bibliography 229
(159) G. M. Chaban, J. O. Jung and R. B. Gerber, The Journal of Chemical Physics, 1999, 111, 1823–1829.
(160) L. S. Norris, M. A. Ratner, A. E. Roitberg and R. Gerber, The Journal of Chemical Physics, 1996, 105, 11261–11267.
(161) O. Christiansen, The Journal of Chemical Physics, 2003, 119, 5773–5781.
(162) X. Huang, S. Carter and J. Bowman, The Journal of Chemical Physics, 2003, 118, 5431–5441.
(163) V. Barone, The Journal of Physical Chemistry A, 2004, 108, 4146–4150.
(164) V. Barone, The Journal of Chemical Physics, 2005, 122, 014108.
(165) V. Barone, J. Bloino, C. A. Guido and F. Lipparini, Chemical Physics Letters, 2010, 496, 157–161.
(166) V. Barone, The Journal of Chemical Physics, 2005, 122, 014108.
(167) M. Frisch, G. Trucks, H. Schlegel, G. Scuseria, M. Robb, J. Cheeseman, G. Scalmani, V. Barone, B. Men-nucci, G. Petersson et al., Gaussian 09, revision D. 01, 2009.
(168) V. Barone, M. Biczysko, J. Bloino, M. Borkowska-Panek, I. Carnimeo and P. Panek, International Journalof Quantum Chemistry, 2012, 112, 2185–2200.
(169) F. Weigend, A. Köhn and C. Hättig, Journal of Chemical Physics, 2002, 116, 3175–3183, DOI: 10.1063/1.1445115.
(170) F. Weigend, Physical Chemistry Chemical Physics, 09/2002, 4, 4285–4291, DOI: 10.1039/b204199p.
(171) F. Weigend, Physical Chemistry Chemical Physics, 2006, 8, 1057–1065.
(172) F. Weigend, Journal of Computational Chemistry, 2008, 29, 167–175.
(173) G. L. Stoychev, A. A. Auer and F. Neese, Journal of Chemical Theory and Computation, 2017, 13, 554–562.
(174) F. Neese, Wiley Interdisciplinary Reviews: ComputationalMolecular Science, 2017, 1–6, DOI: 10.1002/wcms.1327.
(175) D. E. Bernholdt and R. J. Harrison, Chemical Physics Letters, 1996, 250, 477–484, DOI: 10.1016/0009-2614(96)00054-1.
(176) B. P. Prascher, D. E. Woon, K. A. Peterson, T. H. Dunning and A. K. Wilson, Theoretical Chemistry Accounts,01/2011, 128, 69–82, DOI: 10.1007/s00214-010-0764-0.
(177) J. A. Pople, M. Head‐Gordon and K. Raghavachari, The Journal of Chemical Physics, 11/1987, 87, 5968–5975,DOI: 10.1063/1.453520.
(178) T. H. Dunning Jr, The Journal of Chemical Physics, 1989, 90, 1007–1023.
(179) A. K. Wilson, T. van Mourik and T. H. Dunning Jr, Journal of Molecular Structure: THEOCHEM, 1996,388, 339–349.
(180) K. A. Peterson and T. H. Dunning, The Journal of Chemical Physics, 12/2002, 117, 10548–10560, DOI:10.1063/1.1520138.
(181) F. Neese, A. Hansen and D. G. Liakos, Journal of Chemical Physics, 2009, 131, DOI: 10.1063/1.3173827.
(182) A. D. Becke, The Journal of Chemical Physics, 1992, 96, 2155–2160.
(183) S. Grimme, J. Chem. Phys., 2010, 132, 154104.
(184) S. Grimme, S. Ehrlich and L. Goerigk, Journal of Computational Chemistry, 2011, 32, 1456–1465.
(185) M. Head‐Gordon and T. Head‐Gordon, Chemical Physics Letters, 1994, 220, 122–128.
230 Bibliography
(186) G. Hewitt, Nuclear Engineering and Design, 2005, 235, 1303–1316.
(187) M. Açikgöz, F. Franca and R. Lahey Jr, International Journal of Multiphase Flow, 1992, 18, 327–336.
(188) B. Hu, C. Stewart, C. P. Hale, C. J. Lawrence, A. R. Hall, H. Zwiens and G. F. Hewitt, Experiments inFluids, 2005, 39, 667–678.
(189) V. P. Ribeiro, C. Arruda, J. J. M. da Silva, J. A. Aldana Mejia, N. A. J. C. Furtado and J. K. Bastos, BiomedicalChromatography, 2019, 33, e4412.
(190) C. Song, W.-C. Lai, K. M. Reddy and B. Wei, in Analytical Advances for Hydrocarbon Research, Springer,2003, pp. 147–210.
(191) D. C. Villalanti, J. C. Raia and J. B. Maynard, Encyclopedia of Analytical Chemistry: Applications, Theory andInstrumentation, 2006.
(192) Danmarks olie- og gasproduktion 2013, tech. rep., Energi Styrelsen, 2013.
(193) V. Malhotra and H. Buckmaster, Dallas, TX, April, 1989.
(194) B. K. Wilt, W. T. Welch and J. G. Rankin, Energy & Fuels, 1998, 12, 1008–1012.
(195) M. Sánchez-Lemus, F. Schoeggl, S. Taylor, S. Andersen, M. Mapolelo, S. Mahavadi and H. Yarranton,Energy & Fuels, 2016, 30, 10187–10199.
(196) M. Asemani and A. R. Rabbani, Geosciences Journal, 2016, 20, 273–283.
(197) M. Schulze, M. P. Lechner, J. M. Stryker and R. R. Tykwinski, Organic & Biomolecular Chemistry, 2015,13, 6984–6991.
(198) J. C. Prager, 1995.
(199) D. C. Standnes and T. Austad, Journal of Petroleum Science and Engineering, 2000, 28, 123–143.
(200) J. Sundberg and K. L. Feilberg, Journal of Petroleum Science and Engineering, 2020, 184, 106563.
(201) U. K. Bhui, S. Sanyal, R. Saha, S. Rakshit and S. K. Pal, Fuel, 2018, 234, 1081–1088.
(202) S. Prabhakar and R. Melnik, Scientific Reports, 2017, 7, 1–9.
(203) I. Gaiani, A. Aplin, R. Day-Stirrat, H. Greenwell and P. Cubillas, 2019 AAPG Annual Convention andExhibition.
(204) R. S. Bhatta, P. P. Iyer, A. Dhinojwala and M. Tsige, Modern Physics Letters B, 2014, 28, 1430014.
(205) A. Iogansen, Spectrochimica Acta Part A: Molecular and Biomolecular Spectroscopy, 1999, 55, 1585–1612.
(206) A. Barnes, R. Bentwood and M. Wright, Journal of Molecular Structure, 1984, 118, 97–102.
(207) B. Nelander, The Journal of Chemical Physics, 1978, 69, 3870–3871.
(208) K. M. Dreux and G. S. Tschumper, Journal of Computational Chemistry, 2019, 40, 229–236.
(209) W. T. Cole, R. S. Fellers, M. R. Viant, C. Leforestier and R. J. Saykally, The Journal of Chemical Physics,2015, 143, 154306.
(210) W. T. Cole, R. S. Fellers, M. R. Viant and R. J. Saykally, The Journal of Chemical Physics, 2017, 146, 014306.
(211) W. T. Cole, J. D. Farrell, A. A. Sheikh, Ö. Yönder, R. S. Fellers, M. R. Viant, D. J. Wales and R. J. Saykally,The Journal of Chemical Physics, 2018, 148, 094301.
(212) A. Luzar and D. Chandler, Nature, 1996, 379, 55.
Bibliography 231
(213) A. Williamson, The London, Edinburgh, and Dublin Philosophical Magazine and Journal of Science, 1850, 37,350–356.
(214) T. J. Wallington, P. Dagaut, R. Liu and M. J. Kurylo, Environmental science & technology, 1988, 22, 842–844.
(215) K. Watanabe, Molecules, 2013, 18, 3183–3194.
(216) R. R. Ratnakar, B. Dindoruk and L. Wilson, SPE Annual Technical Conference and Exhibition, Societyof Petroleum Engineers, 09/2016, DOI: 10.2118/181515-MS.
(217) J. Cho, T. H. Kim and K. S. Lee, Petroleum Science, 01/2018, 1–8, DOI: 10.1007/s12182-017-0212-z.
(218) C. M. Breneman and K. B. Wiberg, Journal of Computational Chemistry, 1990, 11, 361–373.
(219) A. Schäfer, A. Klamt, D. Sattel, J. C. Lohrenz and F. Eckert, Physical Chemistry Chemical Physics, 2000, 2,2187–2193.
(220) A. Engdahl and B. Nelander, Journal of the Chemical Society, Faraday Transactions, 1992, 88, 177–182.
(221) M. Heger, J. Andersen, M. Suhm and R. W. Larsen, Physical Chemistry Chemical Physics, 2016, 18, 3739–3745.
(222) J. Pérez-Jordá and A. D. Becke, Chemical Physics Letters, 1995, 233, 134–137.
(223) W. B. Schneider, G. Bistoni, M. Sparta, M. Saitow, C. Riplinger, A. A. Auer and F. Neese, Journal ofChemical Theory and Computation, 2016, 12, 4778–4792.
(224) M. Steinmetz and S. Grimme, ChemistryOpen, 2013, 2, 115–124.
(225) L. Goerigk, A. Hansen, C. Bauer, S. Ehrlich, A. Najibi and S. Grimme, Physical Chemistry Chemical Physics,2017, 19, 32184–32215.
(226) S. Farzaneh, R. Kharrat, M. Ghazanfari et al., Journal of Canadian Petroleum Technology, 2010, 49, 36–43.
(227) F. Qiu et al., Canadian unconventional resources and international petroleum conference, 2010.
(228) E. J. Manrique, C. P. Thomas, R. Ravikiran, M. Izadi Kamouei, M. Lantz, J. L. Romero, V. Alvarado et al.,SPE improved oil recovery symposium, 2010.
(229) W. Brock, L. Bryan et al., Low permeability reservoirs symposium, 1989.
(230) A. Danesh, PVT and phase behaviour of petroleum reservoir fluids, Elsevier, 1998, vol. 47.
(231) B. J. Alder and T . E. Wainwright, The Journal of Chemical Physics, 1959, 31, 459–466.
(232) R. Car and M. Parrinello, Physical review letters, 1985, 55, 2471.
(233) E. I. Izgorodina, Physical Chemistry Chemical Physics, 2011, 13, 4189–4207.
(234) F. Weinhold, The Journal of Chemical Physics, 06/1998, 109, 367, DOI: 10.1063/1.476573.
(235) G. Matisz, A.-M. Kelterer, W. M. F. Fabian and S. Kunsági-Máté, Physical Chemistry Chemical Physics,03/2015, 17, 8467–8479, DOI: 10.1039/C4CP05836D.
(236) F. Kollipost, J. Andersen, D. Mahler, J. Heimdal, M. Heger, M. Suhm and R. Wugt Larsen, The Journal ofchemical physics, 2014, 141, 174314.
(237) O. Reutov, A. Kurtz and K. Butin, Binom, 2004.
(238) E. Sánchez-Garcia, M. Studentkowski, L. A. Montero and W. Sander, ChemPhysChem, 2005, 6, 618–624.
(239) F. Kollipost, R. W. Larsen, A. Domanskaya, M. Nörenberg and M. Suhm, Communication: The highestfrequency hydrogen bond vibration and an experimental value for the dissociation energy of formic acid dimer, 2012.
232 Bibliography
(240) Y. Long, T. Dabros and H. Hamza, The Canadian Journal of Chemical Engineering, 2004, 82, 776–781.
(241) B. R. Beno, K.-S. Yeung, M. D. Bartberger, L. D. Pennington and N. A. Meanwell, Journal of MedicinalChemistry, 2015, 58, 4383–4438.
(242) C. D. Tatko and M. L. Waters, Protein Science, 2004, 13, 2515–2522.
(243) K. Sundararajan, K. Sankaran, N. Ramanathan and R. Gopi, Journal of Molecular Structure, 2016, 1117,181–191.
(244) T. Oka, Annual Review of Physical Chemistry, 1993, 44, 299–333.
(245) T. Momose, M. Miki, M. Uchida, T. Shimizu, I. Yoshizawa and T. Shida, The Journal of Chemical Physics,1995, 103, 1400–1405.
(246) H. S. Taylor, Journal of the American Chemical Society, 1931, 53, 578–597.
(247) K. Bonhoeffer, A. Farkas and K. Rummel, Zeitschrift für Physikalische Chemie, 1933, 21, 225–234.
(248) L. Farkas and U. Garbatski, The Journal of Chemical Physics, 1938, 6, 260–263.
(249) J. W. Leachman, R. T. Jacobsen, S. Penoncello and E. W. Lemmon, Journal of Physical andChemical ReferenceData, 2009, 38, 721–748.
(250) M. Torsson, Bachelor Thesis, DTU Chemistry, 2017.
(251) L. Andrews and X. Wang, Review of Scientific Instruments, 2004, 75, 3039–3044.
(252) H. Gush, E. Allin, H. Welsh and W. Hare, Canadian Journal of Physics, 1960, 38, 176–193.
(253) M. Fajardo, Applied Spectroscopy, 2019, 0003702819861581.
(254) S.-Y. Lee and G. D. Holder, Fuel processing technology, 2001, 71, 181–186.
(255) E. D. Sloan Jr and C. Koh, Clathrate hydrates of natural gases, CRC press, 2007.
(256) C. N. Satterfield, 1991.
(257) A. Piéplu, O. Saur, J.-C. Lavalley, O. Legendre and C. Nédez, Catalysis Reviews, 1998, 40, 409–450.
(258) J. Duffy and M. Ingram, Journal of the American Chemical Society, 1971, 93, 6448–6454.
(259) C. Rhodes, S. A. Riddel, J. West, B. P. Williams and G. J. Hutchings, Catalysis Today, 2000, 59, 443–464.
(260) G. C. Shields, K. N. Kirschner, G. M. Hartt and T. M. Evans, The Journal of Chemical Physics, 2007, 154320–1.
(261) T. Ogata and F. J. Lovas, Journal of Molecular Spectroscopy, 1993, 162, 505–512.
(262) J. Ceponkus, G. Karlström and B. Nelander, The Journal of Physical Chemistry A, 2005, 109, 7859–7864.
(263) Y.-P. Li, J. Gomes, S. Mallikarjun Sharada, A. T. Bell and M. Head-Gordon, The Journal of Physical Chem-istry C, 2015, 119, 1840–1850.
(264) P. Soulard and B. Tremblay, The Journal of Chemical Physics, 2019, 151, 124308.
(265) D. Mihrin, J. Andersen, P. Jakobsen and R. W. Larsen, Physical Chemistry Chemical Physics, 2019, 21, 1717–1723.