Embed Size (px)
Citation preview

General rights Copyright and moral rights for the publications made accessible in the public portal are retained by the authors and/or other copyright owners and it is a condition of accessing publications that users recognise and abide by the legal requirements associated with these rights.
Users may download and print one copy of any publication from the public portal for the purpose of private study or research.
You may not further distribute the material or use it for any profit-making activity or commercial gain
You may freely distribute the URL identifying the publication in the public portal If you believe that this document breaches copyright please contact us providing details, and we will remove access to the work immediately and investigate your claim.
Downloaded from orbit.dtu.dk on: Jan 31, 2022
Next Generation Rechargeable Zn-Air Batteries: Sustainable and Abundant Materials
Christensen, Mathias Kjærgård
Publication date:2018
Document VersionPublisher's PDF, also known as Version of record
Link back to DTU Orbit
Citation (APA):Christensen, M. K. (2018). Next Generation Rechargeable Zn-Air Batteries: Sustainable and AbundantMaterials. Technical University of Denmark.

Next Generation RechargeableZn-Air Batteries:
Sustainable and Abundant Materials
Mathias Kjærgaard ChristensenNovember 30 - 2018
Next Generation Rechargeable Zn-Air Batteries:Sustianable and Aboundant Materails
AuthorMathias Kjærgaard ChristensenDepartment of Energy Conversion and StorageTechnical University of DenmarkE-mail: [email protected]
Main SupervisorProf. Poul NorbyDepartment of Energy Conversion and StorageTechnical University of Denmark
Co-supervisorProf. Tejs VeggeDepartment of Energy Conversion and StorageTechnical University of Denmark
Co-supervisorProf. Harry HosterDepartment of ChemistryLancaster University
i
Preface
This thesis is submitted in candidacy for the PhD degree from the Tech-nical University of Denmark, DTU. The work was carried out betweenthe 1st of December 2015 and the 30th of November 2018, initially at thesection for atomic scale modelling, ASC, and since 1st of January 2017 atthe section for Electrochemical Materials, EMA, both sections at DTU.
A part of the project was carried out at Lancaster University's Depart-ment of Chemistry, from November 2017 to February of 2018. The mainsupervisor of the project was Prof. Poul Norby, with co-supervision fromProf. Tejs Vegge, head of the ASC section, and Prof. Harry Hoster,director of energy Lancaster. The project was �nancially supportedby the Horizon 2020 Framework project ZAS, grant number 646186.The synchrotron XRD experiments were possible due to funding fromMAX4ESSFUN and DANSCATT.
ii
Abstract
Due to the increased focus on implementing renewable energy and theconsequences of the intermittent aspects of these technologies, energystorage has received a lot of attention. Heavy technological progressionin recent decades resulted in an apparent solution in the form of batteries.Despite the success of the Li-ion batteries and its variants, there is a pushtowards developing high capacity, low-cost batteries due to the sheeramount of energy that needs to be stored if the energy sector commitsto a full transition to renewable energy generation.
A candidate for this role is the Zn-air battery, a battery with high en-ergy density made from cheap and abundant materials that are alreadyavailable commercially, but only as a primary battery. Aside from dif-�culties in recharging, the Zn-air batteries su�er form self-corrosion ofthe anode in alkaline media, dendrite formation. The aim of this thesiswas to investigate Zn-air batteries using in situ techniques and therebyprovide the information required to meet these challenges.
A �ow cell setup was developed to investigate dissolution of typical Zn-air anode current collectors. It was found that Ti, Cu, Sn and W are allsuitable current collectors in alkaline media. Ti appeared to be the moststable, while Cu, Sn and W all dissolve quickly above the dissolutionpotential for Zn, with the two latter materials dissolving the fastest.
Using a Di�erential Electrochemical Mass Spectrometer (DEMS), Zn-air batteries with four di�erent electrolytes were investigated with thegoal of correlating electrochemical properties to gas evolution. Electronnumbers were determined for a KOH electrolyte and an optimised KOHelectrolyte with the additives KF and K2CO3. Furthermore, a ZnCl2 �
electrolyte at pH 8 and a neutral electrolyte composed of Zn(TFSI) andLi(TFSI) were found not to evolve O2.
iii

Using the same technique, the e�ect of dopants on the Hydrogen Evolu-tion Reaction (HER) at a Zn surface was investigated. It was determinedthat a combination of In and Bi was superior to the dopants by them-selves. It was also shown how Ag has detrimental e�ects, as it enhancesthe HER while it inhibits the Oxygen Evolution Reaction (OER). Theseresults were used to support a Density Functional Theory (DFT) modelthat explains why these dopants a�ect these properties.
Finally, a Zn-air capillary cell was developed. Using spatially and time-resolved X-Ray Di�raction (XRD) synchrotron radiation, it was demon-strated that a Zn/ZnO paste anode developed to promote homogeneousZnO deposition over time actually lead to inhomogeneous distribution ofZn and ZnO, with the former being preferred in the interface betweenthe anode and electrolyte. The results were supported by time-resolvedX-ray computed tomography.
iv
Resume
I de seneste år, hvor bæredygtig energi er blevet mere og mere almindeligt,og videnskabelige undersøgelser viser, at implementerering af bæredygtigenergi skal gå endnu hurtigere, er der kommet et stort fokus på energilag-ring. En ulempe ved de mest normale bæredygtige energiformer er nemlig,at den ikke kan styres centralt og tilpasses det øjeblikkelige forbrug, somsamfundet har. Den teknologiske udvikling har i den forbindelse gjorten mulig løsning, batterier, meget nærværende i vores dagligdag. Udfor-dringen er dog, at den dominerende batteritype lige nu, Li-ion-batteriet,forlader sig på ressourcer som er relativt dyre i forhold til, hvor megetder skal bruges til at lagre en betydelig del af vores energibehov.
Et alternativ er Zn-luft-batteriet, der har eksisteret kommercielt siden1936 og i dag bruges i høreapparater. Zn-luft-batterier har høj energi-tæthed og samtidig er Zn relativt billigt. De fungerer ved at optage iltfra luften som via en katalysator bliver opløst som hydroxid-ioner i bat-teriet der sammen med Zn danner ZnO. Det er gennem dette princip,at typen opnår høje energitætheder. Denne batteritype er dog et såkaldtprimærtbatteri - det kan ikke genoplades elektrisk. For at være en tekniskfornuftig løsning, skal batterierne gerne kunne oplades mindst 200 gangeuden at miste mere end 20 procent kapacitet.
I dette projekt er der fokuseret på at forstå og bevise, hvilke forhindrin-ger der er i forhold til at opnå det antal genopladninger. For at forstådisse udfordringer benyttes der primært in-situ teknikker, der kan korre-lere elektrokemiske parametre med et anden fysisk parameter - som foreksempel tryk. På den måde kan det belyses, hvordan batteriet opførersig i de forskellige faser at dets operation.
Da disse batterier under a�adning optager og binder ilt i deres anode ogafgiver det under opladning, kan man anvende et di�erentielt elektroke-
v
misk massespektrometer til at kvanti�cere sammenhængen mellem denstrøm der passerer gennem batteriet og den mængde gas der forbruges ogfrigives. Denne teknik blev brugt til at undersøge et lille udvalg af elek-trolytter, inklusiv den mest almindelige, der bliver brugt i feltet. Denneteknik benyttes også til at undersøge, hvordan legeringer af Zn, der in-deholder In og Bi, er gavnligt i forhold til at mindske udvikling af brintfra batteriet som følge af den meget basiske elektrolyt. Disse målingerbliver sammenlignet med teoretiske udregninger, der beskriver, hvordanZn-overfalden, med legering, opfører sig på fundementalt niveau.
Ved at bygge fungerende Zn-luft-batterier i et kapilarrør benyttes røng-tendi�raktion til at demonstrere, hvordan en Zn/ZnO elektrode ville æn-dre form under af- og opladning. Det demonstreres, hvordan der i heleprøven er ubalance i, hvor hurtigt a�adning og opladningsprodukt bliverkonverteret, men hvordan der lokalt er endnu større ubalance i Zn/ZnOforholdet med en overvægt af Zn i toppen af anoden. Disse målingerunderstøttes med røntgentomogra�.
Via elektrokemisk cyclisk voltametri, CV, vises det at den basiske elek-trolyt kan korrodere de resterende dele i batteriet over tid. Disse målingerunderstøttes ved brug af en kombination af CV og optisk spektrometrikan korrelere strømmen fra CV-teknikken med en koncentration af detopløse materiale.
vi

Acknowledgements
First and foremost, I have to thank my main supervisor Prof. PoulNorby. It is hard to overstate how much I enjoyed and learned fromour many conversations about batteries, X-rays, science and many othersubjects. I am grateful for your open door policy, and all the quickinformal meeting we have had over the past three years. They have beeninvaluable, especially in the �nal months. Your optimism and interest inall things science was encouraging when things, inevitably, did not go asplanned.
I am also very grateful to Prof. Tejs Vegge for great academic discussionsand advice. I always bene�ted from our meetings, your feedback andthe advice you provided. It constantly challenged me and brought meforward.
The �nal member of my supervisor team, Prof. Harry Hoster, who duringmy time at Lancaster University provided exciting challenges, advice andencouragement, both on work and life in general.
A special mention to Jonathan Højberg. I enjoyed building the DEMSwith you, which now feels like a long time ago. I am sure I would neverhave had the PhD-experience if it were not for that project. Thank youfor that opportunity.
I also have to express my gratitude to Shahin Nikman, who throughoutthe last three years has been a great friend and collaborator. I enjoyedthe time we spent in the laboratory at Risø, as well as at LancasterUniversity, all the discussions about Zn-air batteries and everything else.I will miss going to the pub after work with you.
To all the members of the ZAS project, who were a constant source ofgreat discussions, challenges and nice atmosphere at our projects meet-ings. Of these members I have to thank Alexander Kube from DLR and
vii

Kaushik Jayasayee from SINTEF for their helpfulness and many greatconversations.
To all my wonderful colleagues at DTU, present and former, who havemade the three years feel like they went by in an instant. Especially Doriswho was always helpful and patient when I needed to vent my frustrationsabout science, lab-problems, Python or life in general. Also Jette andKatrine for all the co�ee breaks, lunches and good times. I look forwardto seeing you outside work. I also have to thank former colleagues Ane,Mie and Kristian, who when I started taught me everything there wasto know about batteries and working at Risø. Also thanks to my o�cemates Anastasiia, Prasanna and Jessica. Also thanks to the secretariesAnne, Karina and research technician Mike Wichmann, for all the timesyou helped me �x problems, big and small, thank you.
To my mom and dad for more than once asking me about my projectand listening to answers that were longer and more complicated thannecessary. Especially when I was frustrated about a leaking O-ring, short-circuits and workloads.
Finally, to Mette Signe, my MS, for your support and understandingwhen all I could think about was batteries and my experiments. Thankyou for visiting me while I was in Lancaster, supporting my long hoursin the o�ce and listening patiently to, most of, my explanation aboutwhat I was currently working on. I love you.
viii
List of Publications
This thesis includes following papers:
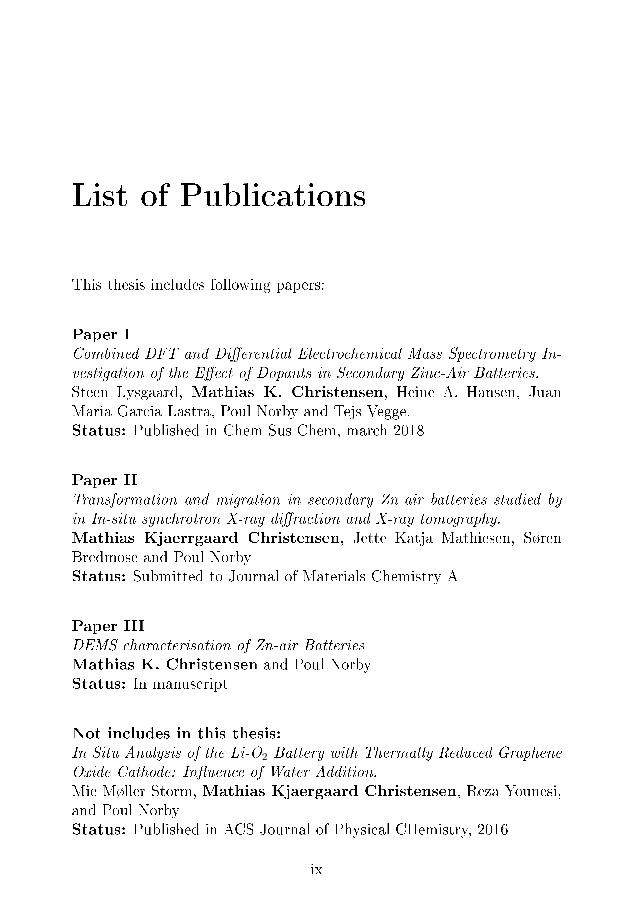
Paper ICombined DFT and Di�erential Electrochemical Mass Spectrometry In-vestigation of the E�ect of Dopants in Secondary Zinc-Air Batteries.Steen Lysgaard, Mathias K. Christensen, Heine A. Hansen, JuanMaria Garcia Lastra, Poul Norby and Tejs Vegge.Status: Published in Chem Sus Chem, march 2018
Paper IITransformation and migration in secondary Zn-air batteries studied byin In-situ synchrotron X-ray di�raction and X-ray tomography.Mathias Kjaerrgaard Christensen, Jette Katja Mathiesen, SørenBredmose and Poul NorbyStatus: Submitted to Journal of Materials Chemistry A
Paper IIIDEMS characterisation of Zn-air BatteriesMathias K. Christensen and Poul NorbyStatus: In manuscript
Not includes in this thesis:In Situ Analysis of the Li-O2 Battery with Thermally Reduced GrapheneOxide Cathode: In�uence of Water Addition.Mie Møller Storm, Mathias Kjaergaard Christensen, Reza Younesi,and Poul NorbyStatus: Published in ACS Journal of Physical CHemistry, 2016
ix

Comment on my contribution to the appended
list of papers
Paper IAll of the experimental work, analysis of said experimental work andwriting about this part. The DFT simulations and main part of writingwas done by Steen Lysgaard. I am the second author of this paper.
Paper IIAll of the experimental work apart from con�guring the beam parametersparameters at XRD beamline and for the tomography experiments. Alsoperformed the analysis and the main part of writing. I am the �rst authorof this paper.
Paper IIIAll of the experimental work, analysis and writing. I am the �rst authorof this paper.
x

List of Acronyms andAbbreviations
AEI Anode Electrolyte InterfaceCMC Carboxymethyl CelluloseCV Cyclic VoltametryDEMS Di�erential Electrochemical Mass SpectrometryEV Electrical VehiclesHER Hydrogen Evolution ReactionICE Internal Combustion EngineICP-OES Inductively Coupled Plasma - Optical Emission SpectroscopyIPCC International Panel on Climate ChangeMS Mass SpectrometerNCO NiCo2O4
OCV Open Circuit VoltageOER Oxygen Evolution ReactionORR Oxygen Reduction ReactionXRD X-Ray Di�raction
Table 1: List of acronyms
xi
Contents
Preface ii
Abstract iii
Resume v
Acknowledgements vii
List of Publications ix
List of Acronyms and Abbreviations xi
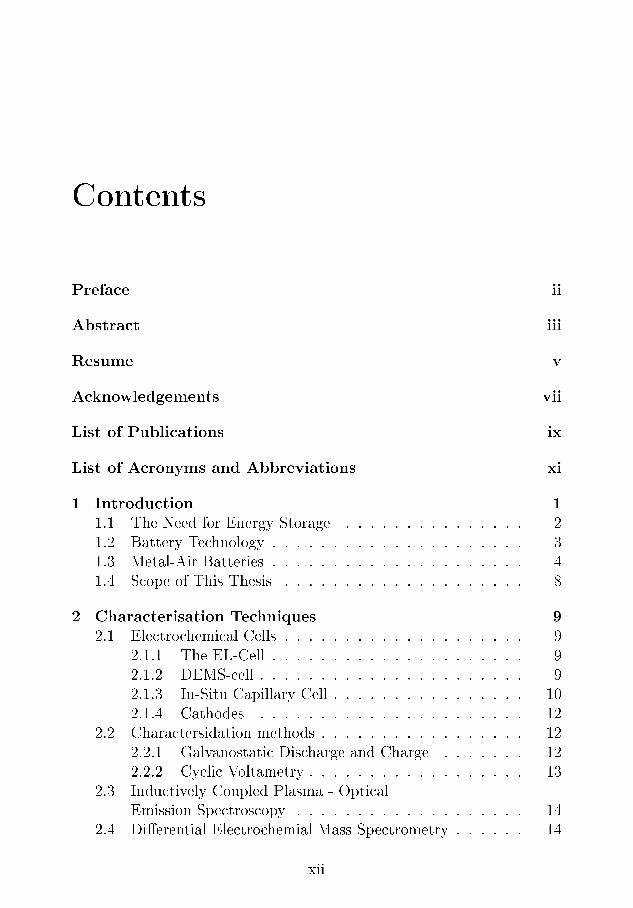
1 Introduction 11.1 The Need for Energy Storage . . . . . . . . . . . . . . . 21.2 Battery Technology . . . . . . . . . . . . . . . . . . . . . 31.3 Metal-Air Batteries . . . . . . . . . . . . . . . . . . . . . 41.4 Scope of This Thesis . . . . . . . . . . . . . . . . . . . . 8
2 Characterisation Techniques 92.1 Electrochemical Cells . . . . . . . . . . . . . . . . . . . . 9
2.1.1 The EL-Cell . . . . . . . . . . . . . . . . . . . . . 92.1.2 DEMS-cell . . . . . . . . . . . . . . . . . . . . . . 92.1.3 In-Situ Capillary Cell . . . . . . . . . . . . . . . . 102.1.4 Cathodes . . . . . . . . . . . . . . . . . . . . . . 12
2.2 Charactersidation methods . . . . . . . . . . . . . . . . . 122.2.1 Galvanostatic Discharge and Charge . . . . . . . 122.2.2 Cyclic Voltametry . . . . . . . . . . . . . . . . . . 13
2.3 Inductively Coupled Plasma - OpticalEmission Spectroscopy . . . . . . . . . . . . . . . . . . . 14
2.4 Di�erential Electrochemial Mass Spectrometry . . . . . . 14
xii
Contents
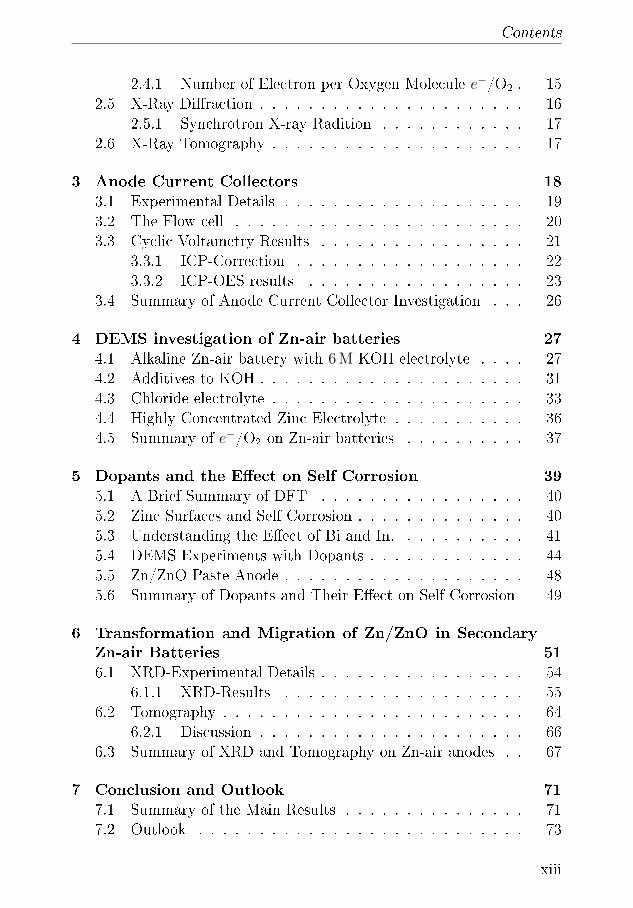
2.4.1 Number of Electron per Oxygen Molecule e−/O2 . 152.5 X-Ray Di�raction . . . . . . . . . . . . . . . . . . . . . . 16
2.5.1 Synchrotron X-ray Radition . . . . . . . . . . . . 172.6 X-Ray Tomography . . . . . . . . . . . . . . . . . . . . . 17
3 Anode Current Collectors 183.1 Experimental Details . . . . . . . . . . . . . . . . . . . . 193.2 The Flow cell . . . . . . . . . . . . . . . . . . . . . . . . 203.3 Cyclic Voltametry Results . . . . . . . . . . . . . . . . . 21
3.3.1 ICP-Correction . . . . . . . . . . . . . . . . . . . 223.3.2 ICP-OES results . . . . . . . . . . . . . . . . . . 23
3.4 Summary of Anode Current Collector Investigation . . . 26
4 DEMS investigation of Zn-air batteries 274.1 Alkaline Zn-air battery with 6 M KOH electrolyte . . . . 274.2 Additives to KOH . . . . . . . . . . . . . . . . . . . . . . 314.3 Chloride electrolyte . . . . . . . . . . . . . . . . . . . . . 334.4 Highly Concentrated Zinc Electrolyte . . . . . . . . . . . 364.5 Summary of e−/O2 on Zn-air batteries . . . . . . . . . . 37
5 Dopants and the E�ect on Self Corrosion 395.1 A Brief Summary of DFT . . . . . . . . . . . . . . . . . 405.2 Zinc Surfaces and Self Corrosion . . . . . . . . . . . . . . 405.3 Understanding the E�ect of Bi and In. . . . . . . . . . . 415.4 DEMS Experiments with Dopants . . . . . . . . . . . . . 445.5 Zn/ZnO Paste Anode . . . . . . . . . . . . . . . . . . . . 485.6 Summary of Dopants and Their E�ect on Self Corrosion 49
6 Transformation and Migration of Zn/ZnO in SecondaryZn-air Batteries 516.1 XRD-Experimental Details . . . . . . . . . . . . . . . . . 54
6.1.1 XRD-Results . . . . . . . . . . . . . . . . . . . . 556.2 Tomography . . . . . . . . . . . . . . . . . . . . . . . . . 64
6.2.1 Discussion . . . . . . . . . . . . . . . . . . . . . . 666.3 Summary of XRD and Tomography on Zn-air anodes . . 67
7 Conclusion and Outlook 717.1 Summary of the Main Results . . . . . . . . . . . . . . . 717.2 Outlook . . . . . . . . . . . . . . . . . . . . . . . . . . . 73
xiii

Contents
Bibliography 73
8 Appendix 838.1 Calibration of the Mass Spectrometer . . . . . . . . . . . 838.2 XRD - appendix . . . . . . . . . . . . . . . . . . . . . . 83
Paper I 86
Paper II 102
Paper III 119
xiv

Chapter 1
Introduction
A de�ning challenge of the 21st century is addressing climate change.The International Panel on Climate Change (IPCC) has estimated thatthe anthropogenic emission of greenhouse gasses has caused an increasein the global average temperature by approximately 1 ◦C compared topre-industrial levels [1]. The heating originates from increased levels ofCO2 and other greenhouse gasses in the atmosphere. The primary emis-sion of greenhouse gasses originates from the use of fossil fuel in energyproduction and manufacturing of chemicals, plastic products and otherproducts [2]. With the demand for energy and electricity expected toincrease towards the middle of the century, the temperature could in-crease beyond the limit of 1.5 ◦C agreed upon in the Paris accord. Whilethe transition to renewable energy has been underway since the previouscentury, the IPCC recommends even further-reaching reforms to the en-ergy sector [1]. This is especially true since the energy consumption, andthus CO2-emissions, of the world is still increasing, due to the popula-tion of developing countries getting access to the energy grid. In 2017,global annual energy consumption rose 2.1 %, with almost 40 % of thisbeing driven by China and India. One quarter of this increased energydemand was met by renewable energy and a few percent by nuclear. Asa result, the CO2 emission rose by 1.4 % [3]. By 2050, the energy demandwill have increased even further to 43 TW[4] and will increase even moretowards 2100 [5].Aside from climate change, there are other reasons to decrease relianceon fossil fuels, such as the resources being tied up in geopolitical issues,scarcity and economics.
1
Chapter 1. Introduction
1.1 The Need for Energy Storage
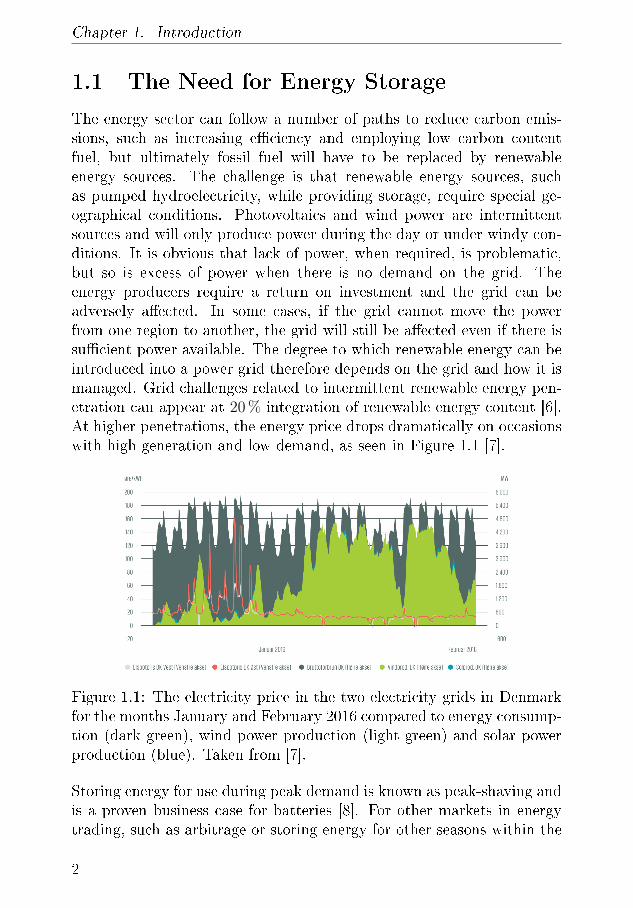
The energy sector can follow a number of paths to reduce carbon emis-sions, such as increasing e�ciency and employing low carbon contentfuel, but ultimately fossil fuel will have to be replaced by renewableenergy sources. The challenge is that renewable energy sources, suchas pumped hydroelectricity, while providing storage, require special ge-ographical conditions. Photovoltaics and wind power are intermittentsources and will only produce power during the day or under windy con-ditions. It is obvious that lack of power, when required, is problematic,but so is excess of power when there is no demand on the grid. Theenergy producers require a return on investment and the grid can beadversely a�ected. In some cases, if the grid cannot move the powerfrom one region to another, the grid will still be a�ected even if there issu�cient power available. The degree to which renewable energy can beintroduced into a power grid therefore depends on the grid and how it ismanaged. Grid challenges related to intermittent renewable energy pen-etration can appear at 20 % integration of renewable energy content [6].At higher penetrations, the energy price drops dramatically on occasionswith high generation and low demand, as seen in Figure 1.1 [7].
Figure 1.1: The electricity price in the two electricity grids in Denmarkfor the months January and February 2016 compared to energy consump-tion (dark green), wind power production (light green) and solar powerproduction (blue). Taken from [7].
Storing energy for use during peak demand is known as peak-shaving andis a proven business case for batteries [8]. For other markets in energytrading, such as arbitrage or storing energy for other seasons within the
2
1.2. Battery Technology
grid, prices would have to decrease dramatically due to the large amountof material required to manufacture such batteries. For this purpose,only abundant and cheap materials will be economically feasible [9].
However, electricity is just a part of the total energy consumption. Inareas such as transport, there is a heavy focus on internal combustionengine (ICE) cars to be replaced by electric vehicles (EVs). Subsidisationcould be a means of introducing more EVs, but generally better batteriesare required. Gasoline is a very good energy carrier with a speci�c energydensity of 12.3 kWh/kg and an energy density of 9.0 kWh/L. However,ICE rely on Carnot processes, which means the theoretical maximumenergy that can be used to perform work, i.e. move the car, is limitedby the temperature di�erence between the cool and hot temperaturereservoir. Conventional Li-ion batteries, which use a LiCoO2 cathode,have a theoretical energy density of 470 Wh/kg and are projected to havea practical maximum of 400 Wh/kg [10]. For airplanes, where weightand space demands are even more severe, the development of even betterenergy storage technologies is necessary.
Regardless of the application, there is a need to develop new technolo-gies for energy storage. Current battery technologies, and to a largedegree Li-ion, are prevalent in the conversation, but over time it is likelythat di�erent applications will favour di�erent technologies, such as fuelcells, supercapacitors, synthetic fuel from electrolysis and other batterychemistries and types.
1.2 Battery Technology
The commonly used word battery actually refers to one or more electro-chemical cells that are electrically connected to allow them to act as acombined power source. An electrochemical cell consists of several parts:anode, cathode, electrolyte, separator, casing and connectors. In thisdocument, the words battery and cell will appear interchangeably, dueto the fact that all batteries herein consist of a single electrochemical cell.The three main parts of an electrochemical cell are:
� Anode - The negative electrode: A material that is oxidised anddelivers electrons to the circuit during discharge of the cell.
� Cathode - The positive electrode: The material that is reduced andaccepts electrons during discharge of the cell.
3
Chapter 1. Introduction
� Electrolyte - The ionically conducting medium: The medium thatpasses ions between the electrodes to balance charge.
These de�nitions apply to the spontaneous reaction in the electrochemi-cal cells. Battery cells where these reactions are irreversible are called pri-mary batteries, i.e. non-rechargeable. Systems where the reactions canbe reversed are called secondary batteries and are rechargeable. However,this implies that the cathode and anode switch places due to oxidationand reduction now occurring at the opposite side. In the present docu-ment, the terms will be applied as though the studied cells are alwaysdischarging [11].
The �rst battery created was the voltaic pile, described by AlessandroVolta in 1799, and is essentially a Cu-Zn battery. Since then a plethora ofbatteries have been developed with di�erent capacities, geometries andmaterials. Today the most prevalent battery is the Li-ion battery thatwas developed in the 1991 [12], which o�ers excellent capacity in a smallform factor and retains performance over hundreds of cycles.
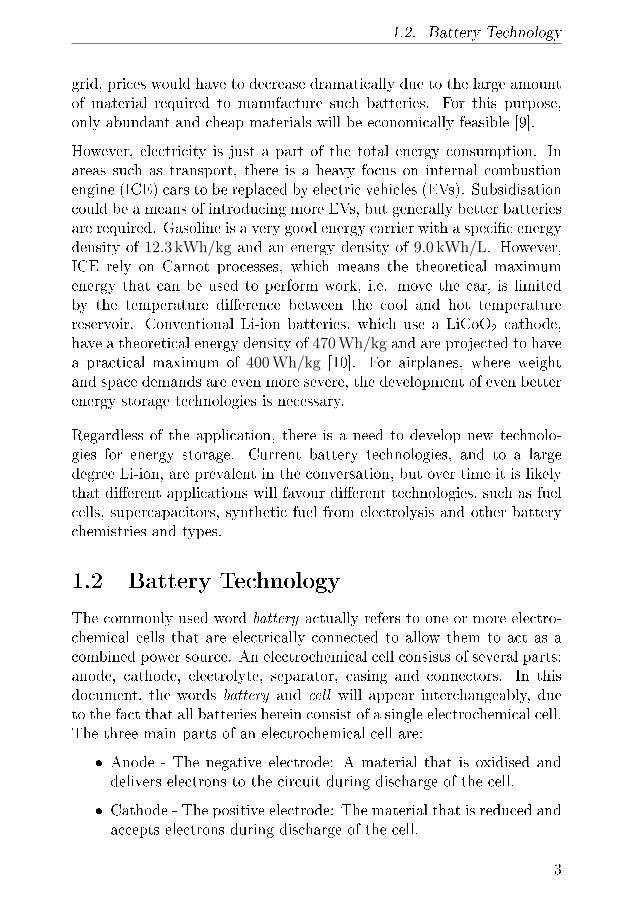
The primary characteristics of a good battery are high speci�c energy,high discharge voltage, reliable cyclability and high speci�c power. Theideal battery would perform well in all of these parameters, but as these ainterconnected, the ideal battery for an speci�c application has to be op-timised for that application. Achieving higher capacity could be achievedby employing a larger anode, but this would be detrimental to the poweroutput due to transport limitations in the electrodes. This is a funda-mental challenge for most battery types, as illustrated by the Ragoneplot in Figure 1.2.
1.3 Metal-Air Batteries
The family of batteries know as metal-air batteries can obtain very hightheoretical energy densities and capacities. They do so by foregoing theneed for heavy intercalation electrodes, relying instead of pure metalanodes. On the positive side of the battery there is only an air cathodethat contributes to the weight, as the oxygen participating in the cathodereactions is outside the battery. As such, the resulting electrochemicaldevice is very light in its charged state as it will gain weight duringdischarge as it consumes oxygen. Capacities are therefore generally givenas open or closed, with the latter including the weight of oxygen.
4
1.3. Metal-Air Batteries
Figure 1.2: A Ragone plot that describes the relation between speci�cenergy and -power for di�erent battery technologies.[13]
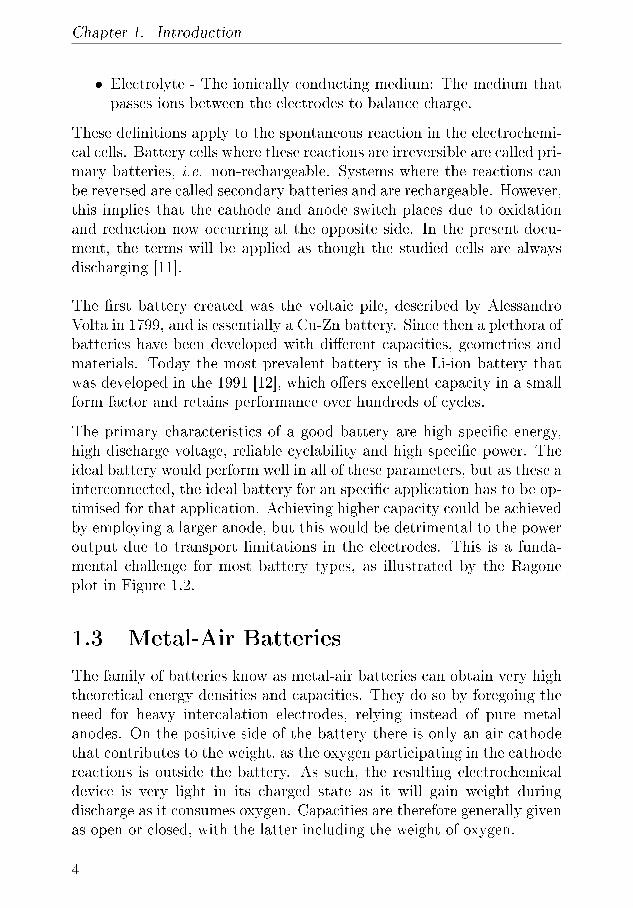
Figure 1.3: Schematic representation of an alkaline Zn-air battery witha porous Zn anode during discharge.
5
Chapter 1. Introduction
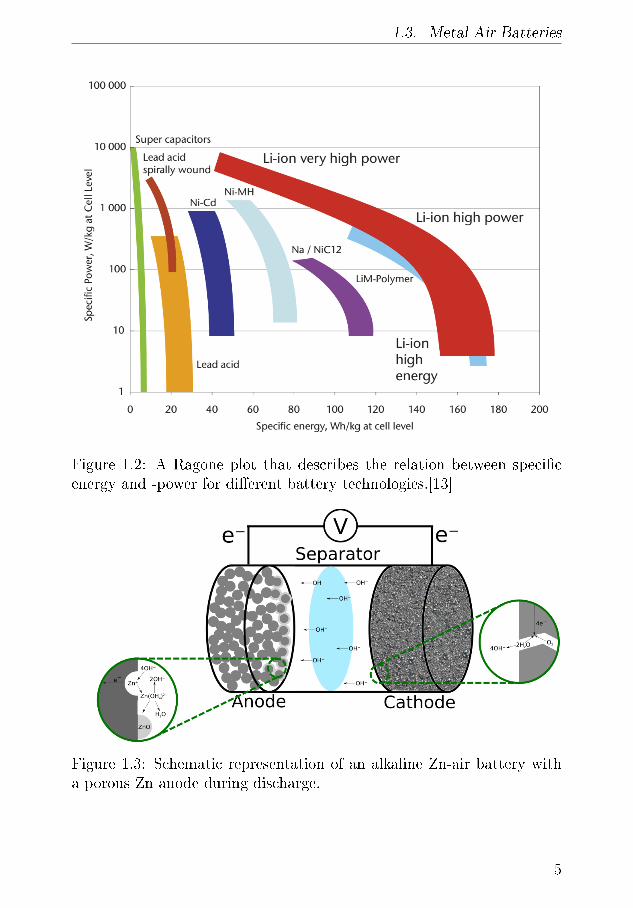
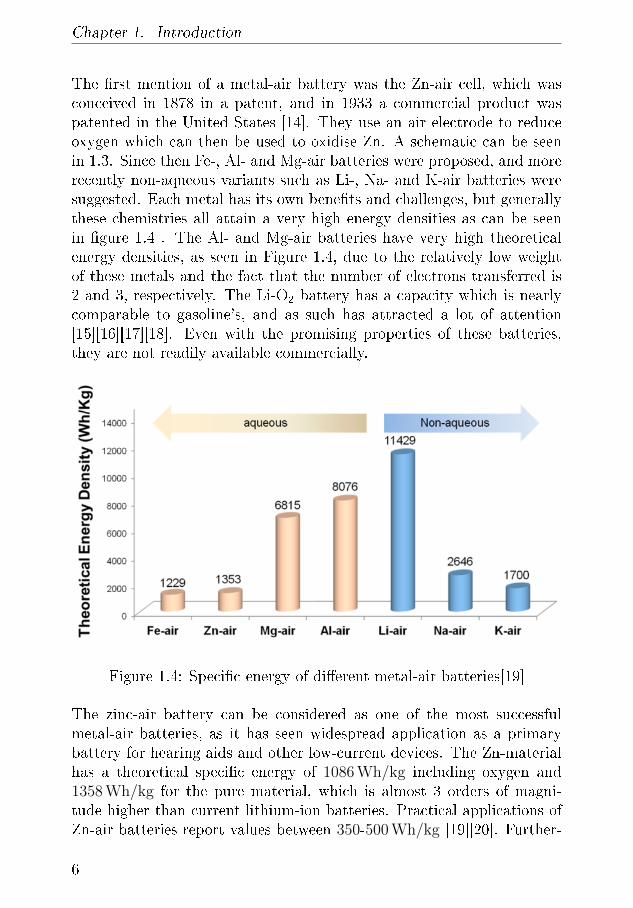
The �rst mention of a metal-air battery was the Zn-air cell, which wasconceived in 1878 in a patent, and in 1933 a commercial product waspatented in the United States [14]. They use an air electrode to reduceoxygen which can then be used to oxidise Zn. A schematic can be seenin 1.3. Since then Fe-, Al- and Mg-air batteries were proposed, and morerecently non-aqueous variants such as Li-, Na- and K-air batteries weresuggested. Each metal has its own bene�ts and challenges, but generallythese chemistries all attain a very high energy densities as can be seenin �gure 1.4 . The Al- and Mg-air batteries have very high theoreticalenergy densities, as seen in Figure 1.4, due to the relatively low weightof these metals and the fact that the number of electrons transferred is2 and 3, respectively. The Li-O2 battery has a capacity which is nearlycomparable to gasoline's, and as such has attracted a lot of attention[15][16][17][18]. Even with the promising properties of these batteries,they are not readily available commercially.
Figure 1.4: Speci�c energy of di�erent metal-air batteries[19]
The zinc-air battery can be considered as one of the most successfulmetal-air batteries, as it has seen widespread application as a primarybattery for hearing aids and other low-current devices. The Zn-materialhas a theoretical speci�c energy of 1086 Wh/kg including oxygen and1358 Wh/kg for the pure material, which is almost 3 orders of magni-tude higher than current lithium-ion batteries. Practical applications ofZn-air batteries report values between 350-500 Wh/kg [19][20]. Further-
6
1.3. Metal-Air Batteries
more, Zn is very abundant, has a low cost of 2 USD/kg, compared to Liat 8 USD/kg (in 2010), and it can be fully recycled [21]. The theoret-ical discharge potential is 1.65 V, but practical values are lower due tooverpotentials.
Thus far, electrical recharging of these batteries is a challenge that canbe circumvented by mechanically replacing the anode or using a �owsystem, in which case it could be considered as a zinc-air fuel cell[22].
Principle of Zinc-Air Batteries
Zn-air batteries convert O2 and Zn during discharge to create ZnO. Dur-ing charge the ZnO is split up, oxygen is emitted from the battery andZn is redeposited. This process requires the use of an air electrode thatemploys a catalyst to split O2. The overall reaction is:
Zn + O2 −−→ 2 ZnO
At the air electrode, the Oxygen Reduction Reaction (ORR) turns O2
into OH� on the surface of a wetted catalyst.
O2 + 2H2O + 4 e� ←−→ 4OH�
At the anode, the hydroxide is consumed when it reacts with Zn to createthe soluble intermediate zincate and releases electrons to the circuit,leading to the overall reaction:
Zn + 4OH� ←−→ [Zn(OH)4]2� + 2 e�
Since the electrolyte is constantly replenished, the zincate concentrationwill continue to increase until it reaches the solubility limit and ZnO pre-cipitates.
Zn(OH)42� ←−→ ZnO + H2O + 2 OH�
However, in alkaline electrolytes the Zn anode corrodes, which formsZn-hydroxide and forms hydrogen according to the reaction:
Zn + 2H2O −−→ Zn(OH)2 + H2
This depletes the Zn-anode and the electrolyte during the battery's shelf-life. Another side-e�ect of the alkaline electrolyte is that K2CO3 (hydrox-ide is provided in the form of a an alkaline electrolyte. precipitates inthe pores of the cathode due to hydroxide reacting with the CO2 in the
7
Chapter 1. Introduction
air. Moreover the alkaline electrolyte can, redistribute Zncate throughthe electrolyte which can lead to deposition of ZnO outside the anode orcause dendrite formation.
1.4 Scope of This Thesis
Given the challenges and opportunities in Zn-air batteries and the pursuitof long cycle life, it is essential to develop and apply capable character-isation techniques. Through these techniques, it is possible to improvenot only the fundamental materials, but also the the larger cell design.
For the materials that support the electrodes, it is essential that theyare stable within the entire life of the battery. Some of the commonchoices are investigated here by developing in situ optical spectroscopytechniques to investigate dissolution of these. An Alkaline electrolyte wasinvestigated for O2 and H2 evolution and compared to another alkalineelectrolyte with additives. A pH 8 bu�er stabilised ZnCl2 and a neutralelectrolyte where investigated using the same techniques. The mechanismfor H2-evolution and means to mitigate it is investigated, by doping thesurface with In and Bi. Finally, the structure of a Zn/ZnO anode isinvestigated during cycling with the intent to visualise how Zn and ZnOis deposited within the battery.
8
Chapter 2
Characterisation Techniques
The chapter describes the methods and equipment used in this thesis.
2.1 Electrochemical Cells
2.1.1 The EL-Cell
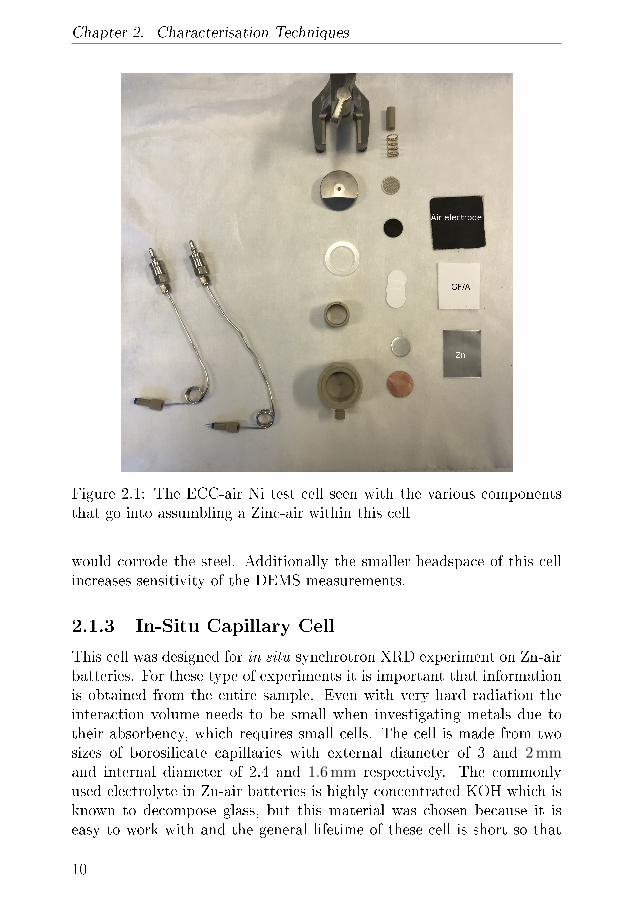
For paper I and II the ECC-air Ni cell, commonly referred to as the EL-cell, was used. It is a hermetically sealed commercial 3-electrode cell withair in and outlets. In the present document it was only used in 2 electrode.The body of the cell is made out of PEEK in order to resist the alkalineenvironment of the electrolyte. The metal anode is contacted throughthe bottom of the cell through a Ni pin. The air cathode is contactedthrough a Ni spacer. The cell is connected to DEMS setup through metaltubes using quick connects. The cell is seen in �gure 2.1 with the normalparts that goes into it in various stages.
2.1.2 DEMS-cell
A few measurements in this thesis employs the DEMS swagelok cell.This cell is developed by [23] [24] with the intention of mimicking the asystem described By Macloskey et al. in [25]. The cell consist of numberof swagelok parts, custom made steel parts and a glass tube. In this thesisit was used to perform DEMS measurements on the Highly ConcentratedZinc Electrolyte (HCZE) measurements as the other system in this thesis
9
Chapter 2. Characterisation Techniques
Figure 2.1: The ECC-air Ni test cell seen with the various componentsthat go into assumbling a Zinc-air within this cell
would corrode the steel. Additionally the smaller headspace of this cellincreases sensitivity of the DEMS measurements.
2.1.3 In-Situ Capillary Cell
This cell was designed for in situ synchrotron XRD experiment on Zn-airbatteries. For these type of experiments it is important that informationis obtained from the entire sample. Even with very hard radiation theinteraction volume needs to be small when investigating metals due totheir absorbency, which requires small cells. The cell is made from twosizes of borosilicate capillaries with external diameter of 3 and 2 mmand internal diameter of 2.4 and 1.6 mm respectively. The commonlyused electrolyte in Zn-air batteries is highly concentrated KOH which isknown to decompose glass, but this material was chosen because it iseasy to work with and the general lifetime of these cell is short so that
10
2.1. Electrochemical Cells
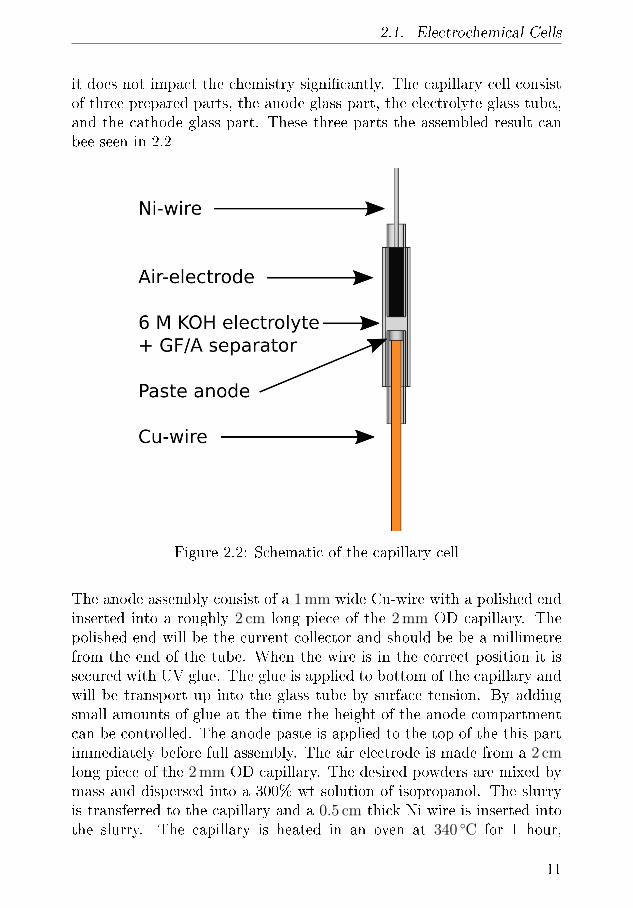
it does not impact the chemistry signi�cantly. The capillary cell consistof three prepared parts, the anode glass part, the electrolyte glass tube�and the cathode glass part. These three parts the assembled result canbee seen in 2.2
Figure 2.2: Schematic of the capillary cell
The anode assembly consist of a 1 mm wide Cu-wire with a polished endinserted into a roughly 2 cm long piece of the 2 mm OD capillary. Thepolished end will be the current collector and should be be a millimetrefrom the end of the tube. When the wire is in the correct position it issecured with UV glue. The glue is applied to bottom of the capillary andwill be transport up into the glass tube by surface tension. By addingsmall amounts of glue at the time the height of the anode compartmentcan be controlled. The anode paste is applied to the top of the this partimmediately before full assembly. The air electrode is made from a 2 cmlong piece of the 2 mm OD capillary. The desired powders are mixed bymass and dispersed into a 300% wt solution of isopropanol. The slurryis transferred to the capillary and a 0.5 cm thick Ni wire is inserted intothe slurry. The capillary is heated in an oven at 340 ◦C for 1 hour,
11
Chapter 2. Characterisation Techniques
after which the Ni wire is secured in place and will act as the currentcollector. With these parts a full battery can now be prepared The pasteanode is applied to the anode glass piece and is inserted into a 2 cm longpiece of the 3 mm OD glass tube and secured in place using UV glue.Again the glue is applied by using surface tension, it is important thatthis glue seal is watertight. A 2 cm long 1 mm wide piece of WhatmanGF/A glass�ber is applied to serve as a separator. It is advise to add theseparator before the electrolyte. When the electrolyte is applied assemblethe cathode parts is inserted into the wider tube with electrolyte andseparator without bubble formation and secured in place via UV-glue.The cell can now be mounted and contacted through the bottom Cu andthe Ni top wire.
2.1.4 Cathodes
Aside from the capillary cell air electrodes, all air electrode, such asthe one seen in 2.1, were supplied by a partner in the the ZAS project,Alexander Niederstrasse from DLR. The cathodes mixture was made bydry mixing powders (catalyst, additives if any and binder) and subject itto hydraulic pressing on a Ni grid a 3 bar after which they were heated into 340 ◦C for 1 h. For each experiment a piece from the supplied sheetswere wrapped in paper and cut using an MTI disc cutter with the gridfacing the piston. The resulting size for the cathodes would be to 18 mmfor the EL-Cell and 10 mm for the Swagelok DEMS cell. Each 18 mmanode would weigh between 500 and 560 mg and would only be usedonce. No relation between OCV and air electrode mass was found. Eachcathode represented herein is only used once.
2.2 Charactersidation methods
2.2.1 Galvanostatic Discharge and Charge
A simple and intuitive measurement to investigate is galvanostatic dis-charge and charge. By employing voltage or time limits to these mea-surement provides an easy means to control or determine capacity. It isalso an easy means to measure degradation as capacity loss or overpo-tentials. Discharge and charge is determined by the current between theelectrode.
12
2.2. Charactersidation methods
2.2.2 Cyclic Voltametry
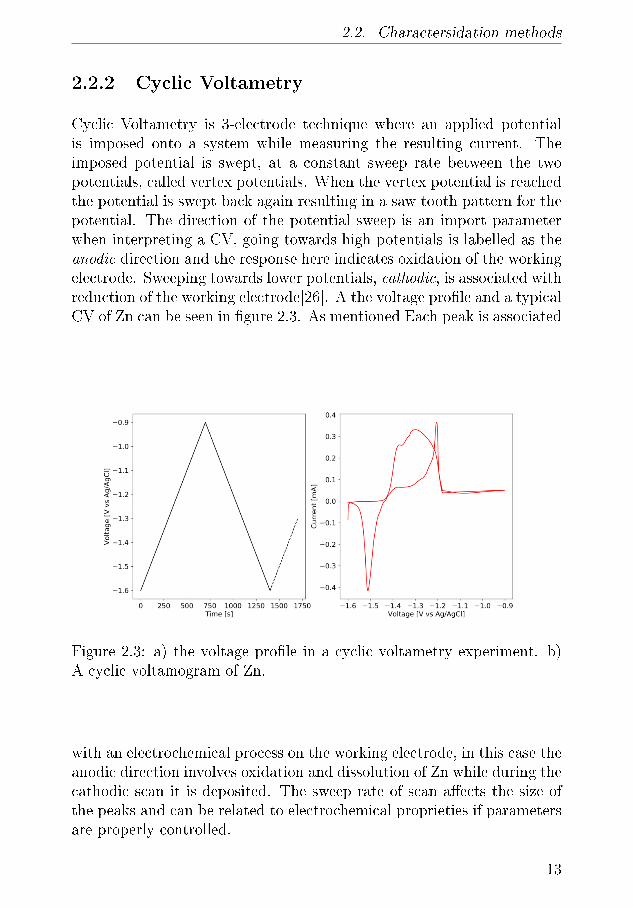
Cyclic Voltametry is 3-electrode technique where an applied potentialis imposed onto a system while measuring the resulting current. Theimposed potential is swept, at a constant sweep rate between the twopotentials, called vertex potentials. When the vertex potential is reachedthe potential is swept back again resulting in a saw tooth pattern for thepotential. The direction of the potential sweep is an import parameterwhen interpreting a CV, going towards high potentials is labelled as theanodic direction and the response here indicates oxidation of the workingelectrode. Sweeping towards lower potentials, cathodic, is associated withreduction of the working electrode[26]. A the voltage pro�le and a typicalCV of Zn can be seen in �gure 2.3. As mentioned Each peak is associated
Figure 2.3: a) the voltage pro�le in a cyclic voltametry experiment. b)A cyclic voltamogram of Zn.
with an electrochemical process on the working electrode, in this case theanodic direction involves oxidation and dissolution of Zn while during thecathodic scan it is deposited. The sweep rate of scan a�ects the size ofthe peaks and can be related to electrochemical proprieties if parametersare properly controlled.
13
Chapter 2. Characterisation Techniques
2.3 Inductively Coupled Plasma - Optical
Emission Spectroscopy
Inductively Coupled Plasma and Optical Emission Spectroscopy is tech-nique that can identify metallic compounds in liquids in very low con-centrations. The liquid is vaporised in a nozzle with a high �ow of argon.The vapour is transferred into an RF coil where it is heated to 10 000 Kusing electromagnetic �elds. The hot plasma produces radiation whichcan then be used to identify the compounds within stream by their emis-son lines. The concentration of the compounds can be quanti�ed by theuse of calibration solutions with a well de�ned content of these materials.
2.4 Di�erential Electrochemial Mass Spec-
trometry
Di�erential Electrochemical Mass Spectrometry (DEMS) is a measure-ment technique that can quantitatively characterise the emission of evolvedgaseous species in an electrochemical device. The method can be datedback to Bruckenstien et. al. [27], but the term DEMS originates fromWolter et. al. in 1984 [28]. Since then several variations and modi�cationhave been made to these setups but the one used in the present documentcan be traced to McCloskey et. al. who re�ned the method to investi-gate Li-O2 batteries[25]. This version of the technique is specialised forfull electrohcemical cells that employ electrolytes with high vapour pres-sures where evaporation is critical and as such it uses a six-way rotationvalve. The particular setup was developed by Jonathan Højberg for useto investigate Li-O2[23].
This setup has two operation modes, one that measures pressure changeduring cycling, and one that employs the MS. The latter mode �ushesthe evolved gasses in the head space of cell with Ar into the volumeof VMS and its content is then lead to the MS for analysis. The valvemovement and the the Ar a�ects the pressure in the setup so that gettingelectron numbers is not possible, therefore to get both electron numbersand MS data two identical experiments have to be conducted. MS data isonly possible to obtain during OCV and charge, even when �using withoxygen as the discharge potential is related to O2 partial pressure.
14
2.4. Di�erential Electrochemial Mass Spectrometry
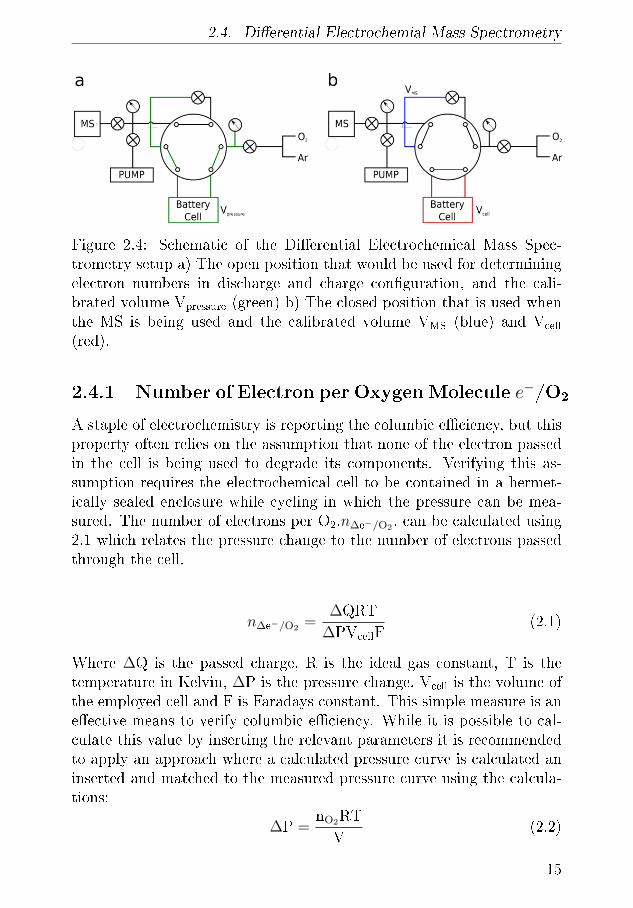
Figure 2.4: Schematic of the Di�erential Electrochemical Mass Spec-trometry setup a) The open position that would be used for determiningelectron numbers in discharge and charge con�guration, and the cali-brated volume Vpressure (green) b) The closed position that is used whenthe MS is being used and the calibrated volume VMS (blue) and Vcell
(red).
2.4.1 Number of Electron per Oxygen Molecule e−/O2
A staple of electrochemistry is reporting the columbic e�ciency, but thisproperty often relies on the assumption that none of the electron passedin the cell is being used to degrade its components. Verifying this as-sumption requires the electrochemical cell to be contained in a hermet-ically sealed enclosure while cycling in which the pressure can be mea-sured. The number of electrons per O2,n∆e−/O2 , can be calculated using2.1 which relates the pressure change to the number of electrons passedthrough the cell.
n∆e−/O2 =∆QRT
∆PVcellF(2.1)
Where ∆Q is the passed charge, R is the ideal gas constant, T is thetemperature in Kelvin, ∆P is the pressure change, Vcell is the volume ofthe employed cell and F is Faradays constant. This simple measure is ane�ective means to verify columbic e�ciency. While it is possible to cal-culate this value by inserting the relevant parameters it is recommendedto apply an approach where a calculated pressure curve is calculated aninserted and matched to the measured pressure curve using the calcula-tions:
∆P =nO2RTV
(2.2)
15
Chapter 2. Characterisation Techniques
nO2 =It
n∆e−/O2F(2.3)
Where ∆P is the resulting pressure, which is a function of the numbermoles O2, nO2 , developed or consumed in running a current through thecell, T is the temperature, V is the Volume of the cell and tubing, I isthe current, t is the length of the experiment, F is Faradays constantand n∆e−/O2 the variable that is controlled to adjust the �t. By usingthis approach, di�erent regimes of of the pressure curve can be �ttedindividually. The mass spectrometer requires purging of the cell and as
such when it is employed measuring electron numbers is not possible.Qaudropole Mass Spectrometers, QMS, measures the amount of ionisedgas that reaches the �lament for a givenmass-to-charge ratio -m/z, whichis unitless. In this document m/z values are converted and referred to thechemical equivalent, e.g. CO2 would correspond to the m/z= 44. Thisimplies calibration of the sensitivity of the MS using reference gasseswith known amounts of each constituent and investigation that thereare no overlapping m/z for evolved gasses. Given a m/z value that isnot covered by the calibration gasses the sensitivity parameters for theclosest neighbour with a known sensitivityapplied. As an example m/z= 31 would be converted through the use of the m/z = 32, which is usingan O2 calibration gas.
2.5 X-Ray Di�raction
X-rays provide a convenient means of investigating materials as theyprovide the ability to probe very small structures. X-rays can largelybe considered to be non destructive depending on your sample. Thewavelength of X-rays often in the order 1× 10⁻¹⁰ m, which is comparableto the inter atomic distances in most crystal lattices. Crystal latticesare made from a large array of well ordered atoms. The structures aredescribed by a unit cell, which is the smallest structure that can describethe larger array in all directions. This unit will contain six parameters,the length of its axes (a,b,c) and the angles between these (α,β,γ). Byconsidering this unit cell in all directions it is possible to identify planesin the lattice along each axis, which can be described in 3 dimensionalspace by Miller indecencies hkl and a characterised by a lattice constant.
Using a monochromatic beam, X-rays can be elastically scattered on suchan lattice plane. The scattered beam interacts with itself and produce
16
2.6. X-Ray Tomography
strong re�ections where constructive interference conditions is ful�lled.Braggs law can be used to calculate at which angles θ constructive inter-ference is obtained:
nλ = 2dsinθ (2.4)
Where d is the lattice constant, n is a positive integer that describes theorder, and λ is wavelength the incident X-rays.
2.5.1 Synchrotron X-ray Radition
Synchrotrons are large facilities where electrons are accelerated to highspeeds in an evacuated ring. By altering the path of the electron throughmagnetic �eld created by devices such as wigglers or undulators X-rayradiation is created. Through this method the wavelength of the X-rayradiation can be tuned, with higher intensity and resolution than in-house sources. Using these beamlines it is possible to perform very fastmeasurements on battery materials.
2.6 X-Ray Tomography
Tomography refers to imagining a subject by a penetrating nondestruc-tive waves, in this case X-rays. The technique requires obtaining severaltransmission images of the sample while the samples is being rotated insmall increments between each image. By correlating the these imagesand the angles they were obtained at, the geometry and structure of thesample can be recreated. When the reconstruction is obtained it can becut and or segmented so that di�erent phases of can be identi�ed andquanti�ed or simply to create images of the a cross section in the sample.Performing these measurements requires small samples, high intensity,relatively hard X-rays or long exposure times to ensure a statistical sig-ni�cant signal which determines the resolution.
17
Chapter 3
Anode Current Collectors
In the transitioning from primary to secondary Zn-air batteries each cellwill be expected to operate for hundreds of cycles [29]. Which createshigh demands for the active battery components but also current col-lectors, separators and contact pins. As these have to withstand thecycling and the electrolyte environment throughout the cells lifetime.The commonly applied electrolyte KOH restrict the choices of materialssigni�cantly, common materials such as steel, carbon and glass corrodein this electrolyte. In this chapter the focus is on developing a methodfor correlating electrochemistry with degradation e�ects, and using iton a subset of current collector materials. That means employing cyclicvoltametry could with ICP-OES analysis of the resulting products, whichmeans developing af cell where electrolyte can be reliably extracted andanalysed in real time.
An important part of the battery is the anode current collector, it willhave to support the anode throughout the cells life and will have to retainits shape, and conductive properties while not interfering detrimentallyin the battery. A secondary Zn air battery has potential window of 2 Vin aqueous solution which also means that gassing can occur.
A variety of materials have been suggested for Zn-air batteries but Cuor Sn are commonly applied [30][31]. Other materials such Ni, Ti, W andstainless steel have also been proposed for various purposes [32][33][34][35][36].
18
3.1. Experimental Details
3.1 Experimental Details
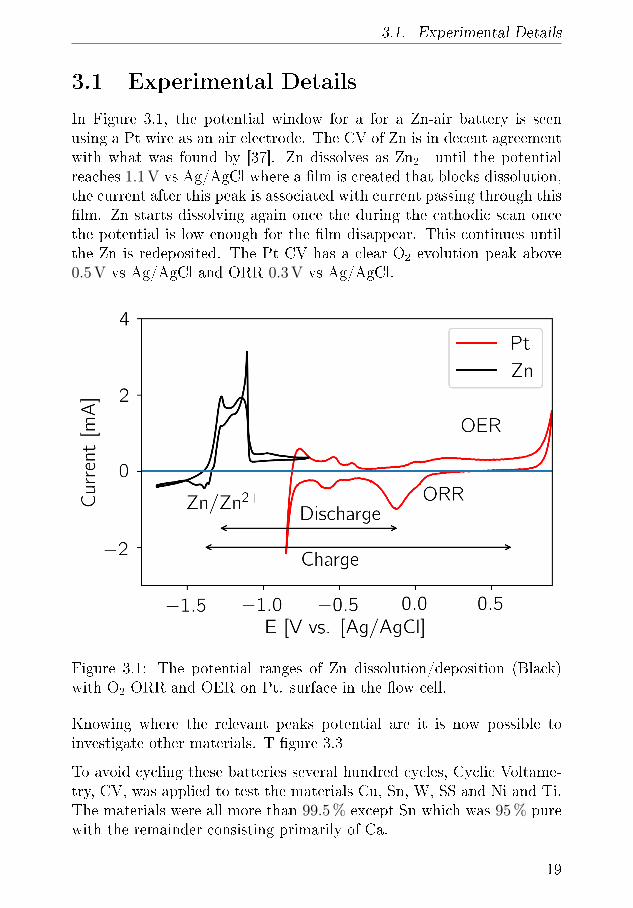
In Figure 3.1, the potential window for a for a Zn-air battery is seenusing a Pt wire as an air electrode. The CV of Zn is in decent agreementwith what was found by [37]. Zn dissolves as Zn2+ until the potentialreaches 1.1 V vs Ag/AgCl where a �lm is created that blocks dissolution,the current after this peak is associated with current passing through this�lm. Zn starts dissolving again once the during the cathodic scan oncethe potential is low enough for the �lm disappear. This continues untilthe Zn is redeposited. The Pt CV has a clear O2 evolution peak above0.5 V vs Ag/AgCl and ORR 0.3 V vs Ag/AgCl.
Figure 3.1: The potential ranges of Zn dissolution/deposition (Black)with O2 ORR and OER on Pt. surface in the �ow cell.
Knowing where the relevant peaks potential are it is now possible toinvestigate other materials. T �gure 3.3
To avoid cycling these batteries several hundred cycles, Cyclic Voltame-try, CV, was applied to test the materials Cu, Sn, W, SS and Ni and Ti.The materials were all more than 99.5 % except Sn which was 95 % purewith the remainder consisting primarily of Ca.
19
Chapter 3. Anode Current Collectors
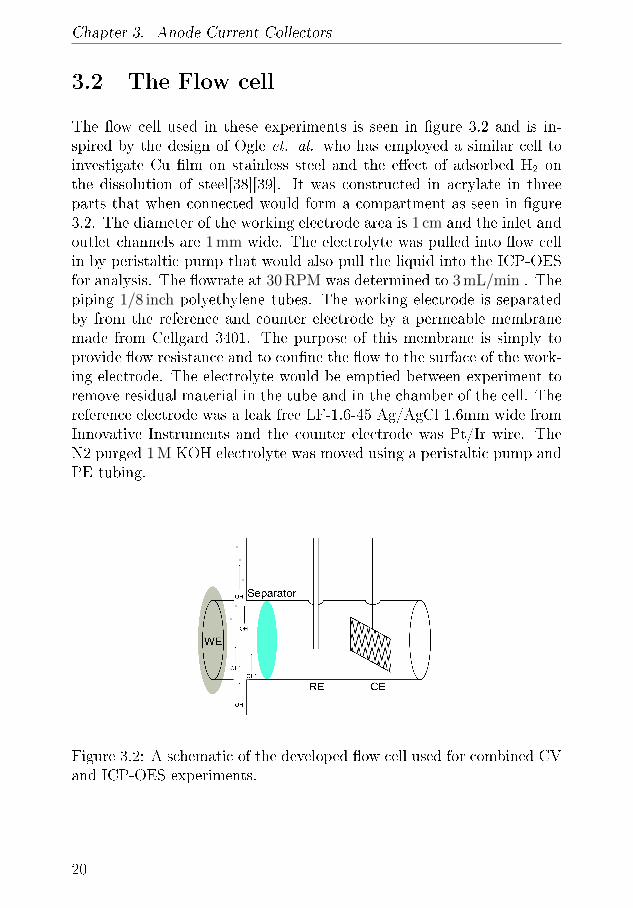
3.2 The Flow cell
The �ow cell used in these experiments is seen in �gure 3.2 and is in-spired by the design of Ogle et. al. who has employed a similar cell toinvestigate Cu �lm on stainless steel and the e�ect of adsorbed H2 onthe dissolution of steel[38][39]. It was constructed in acrylate in threeparts that when connected would form a compartment as seen in �gure3.2. The diameter of the working electrode area is 1 cm and the inlet andoutlet channels are 1 mm wide. The electrolyte was pulled into �ow cellin by peristaltic pump that would also pull the liquid into the ICP-OESfor analysis. The �owrate at 30 RPM was determined to 3 mL/min . Thepiping 1/8 inch polyethylene tubes. The working electrode is separatedby from the reference and counter electrode by a permeable membranemade from Cellgard 3401. The purpose of this membrane is simply toprovide �ow resistance and to con�ne the �ow to the surface of the work-ing electrode. The electrolyte would be emptied between experiment toremove residual material in the tube and in the chamber of the cell. Thereference electrode was a leak free LF-1.6-45 Ag/AgCl 1.6mm wide fromInnovative Instruments and the counter electrode was Pt/Ir wire. TheN2 purged 1 M KOH electrolyte was moved using a peristaltic pump andPE tubing.
Figure 3.2: A schematic of the developed �ow cell used for combined CVand ICP-OES experiments.
20
3.3. Cyclic Voltametry Results
3.3 Cyclic Voltametry Results
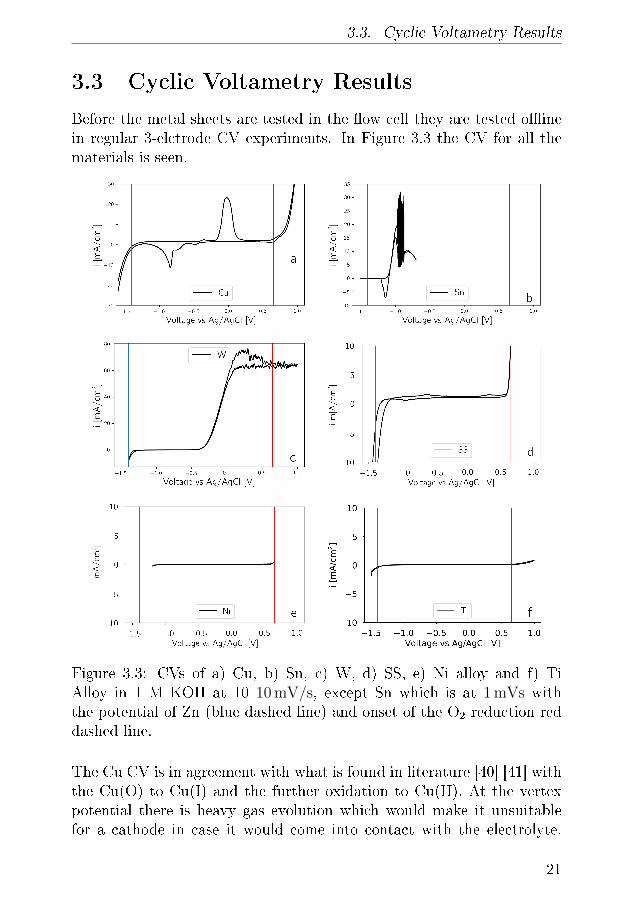
Before the metal sheets are tested in the �ow cell they are tested o�inein regular 3-elctrode CV experiments. In Figure 3.3 the CV for all thematerials is seen.
Figure 3.3: CVs of a) Cu, b) Sn, c) W, d) SS, e) Ni alloy and f) TiAlloy in 1 M KOH at 10 10 mV/s, except Sn which is at 1 mVs withthe potential of Zn (blue dashed line) and onset of the O2 reduction reddashed line.
The Cu CV is in agreement with what is found in literature [40] [41] withthe Cu(O) to Cu(I) and the further oxidation to Cu(II). At the vertexpotential there is heavy gas evolution which would make it unsuitablefor a cathode in case it would come into contact with the electrolyte.
21
Chapter 3. Anode Current Collectors
On cathodic scan the reduction of Cu(II) to Cu(I) and later Cu(I) toCu(0) are clearly visible before hydrogen evolution starts, which slightlyoverlaps with the Zn deposition potential.
W exhibits signi�cant oxidation above −0.5 V vs. Ag/AgCl where itultimately dissolves into WO4
2� . until it reaches a plateau which isslightly noise due to the surface changing quickly.[42] [43]
Sn which is a common current collector oxidises and dissolves throughSn(II) to Sn(IV) at 1.1 V vs. Ag/AgCl until a passivisation �lm is formedand the current goes down until the vertex potential. The static above−1 V vs. Ag/AgCl is due to the very high current which makes it di�cultfor the potentiostat to measure the voltage. The static subsides at morepositive potentials due to passivisation of the Sn surface. is On thecathodic scan the Sn foil exhibits a reduction peak at 1.15 VvsAg/AgCland exhibits no gas evolution at the lower vertex potential.[44]
Stainless steel can immediately be disquali�ed for the anode current col-lector since there is signi�cant gas evolution already from the initial ver-tex potential. After which there are few small peaks on the way to thesecond positive vertex potential which could dissolution of Chromium orother chemical in the steel. At the positive vertex potential there is againsigni�cant gas evolution which also disquali�es for the cathode. On theback scan there is a single cathodic reduction peak imitate before the gasevolution commences.
The Ni CV is started higher than the others as it already exhibits signif-icant gas evolution already at −1 VvsAg/AgCl. Scanning more anodicthe CV is completely until a slight oxidation of Ni(OH)2 to NiOOH at0.5 VvsAg/AgCl[45]. Which with is followed by signi�cant gas evolution,which is expected as Ni is a known OER catalyst.
Ti is very stable and has no reduction or oxidation peaks within thetwo vertex potentials an exhibits only slight gas evolution beyond thepotential of Zn deposition and O2 evolution.
3.3.1 ICP-Correction
From the cyclic voltamograms it is possible to understand at what po-tentials processes occur on the surface on the metals. Some reaction likeoxidation of Cu(O) to Cu(1) is not associated dissolution while oxidation
22
3.3. Cyclic Voltametry Results
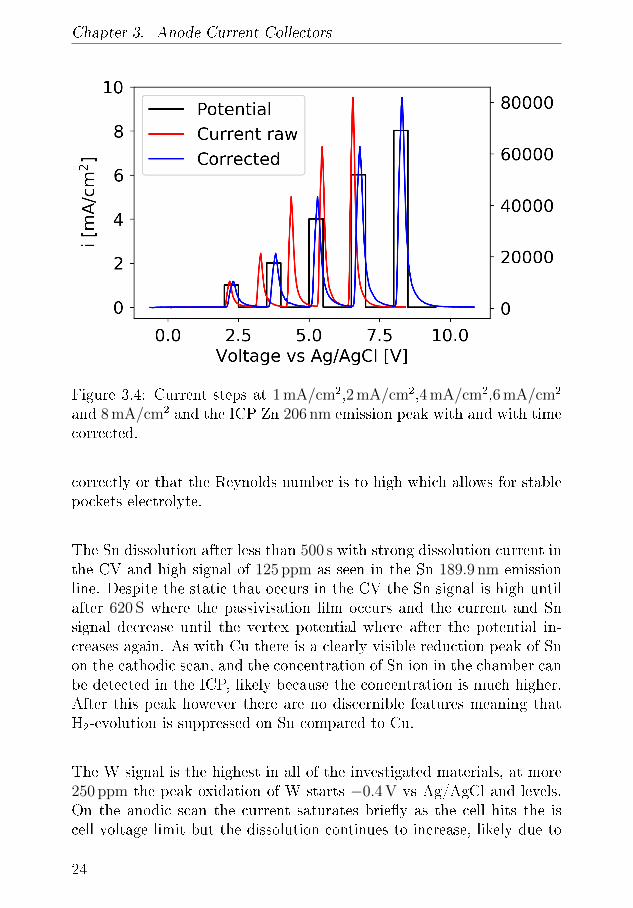
of the Cu(I) to Cu(II) is. Using the �ow cell these the exact rate at whichthe dissolution occurs. The distance between the working electrode com-partment and the ICP detection chamber is kept as small as possible,the tubing will delay the signal. Additionally the ICP response will ex-perience broadened due to mixing and resistance in the tube. ThereforeCV and ICP signals have to be aligned. This is done through a seriesof current steps and measuring the ICP response signal. Using a stopwatch the delay was determined to be 10.78 s. From �gure 3.4 it is seenthat the ICP further correction is needed as there is a between the timesignals. The delay was determined to be 30 s while the time of set was0.93 at 30 RPM. For each current step, the ICP signal peaks after 24seconds and is almost entirely gone by the next current step.
3.3.2 ICP-OES results
Ni and Ti are not tested in the �ow due to their early onset of HER and�at voltage pro�le respectively. The other material Cu, Sn, W and SSwere investigated in the �ow cell under a �ow of 3 mL/min and a scan rateof 1 mVs on fresh metal foils. The vertex potential where chosen to spanthe full potential window of the Zn-air battery. Except for materials thathad gas signi�cant gas evolution within this window, to avoid damage totorch and vaporisation source in the ICP-OES.
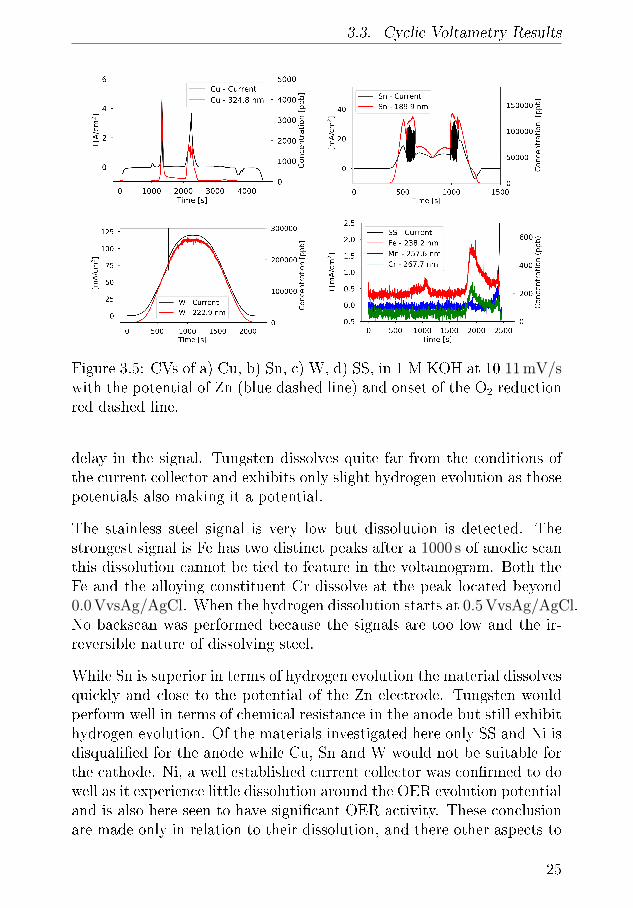
In �gure 3.5 the CV voltamograms for Cu, Sn, W and SS are plottedover time to avoid confusion between anodic and cathode current. ForNi and Ti no species were detected despite being exposed to multiplelong cycles.
In the ICP-OES, the Cu 324 emission peak can be collrected to peaks arein the anodic scan of the CV. Scanning anodically there is no signi�cantdissolution until the Cu(I) and Cu(II) and after more than 2000 s of scan-ning anodically there is a signi�cant dissolution peak but this is is relatedto the O2 evolution from the Cu anode. The O2 bubbles in mixes thesolution better and empties any dead volume in valves and bends thatcontain Cu. On the cathodic no dissolution can occur although there isthe presence of a reduction peak after 3800 s indicating that there is Cuavailable for deposition. This indicates that the interaction volume withthe working electrode is to large as it can hold Cu-ions, or that therestatic volumes along the �ow. When are not detected in the ICP thisindicates that at the �ow is not �ushing the �ow cell and tube volume
23
Chapter 3. Anode Current Collectors
Figure 3.4: Current steps at 1 mA/cm2,2 mA/cm2,4 mA/cm2,6 mA/cm2
and 8 mA/cm2 and the ICP Zn 206 nm emission peak with and with timecorrected.
correctly or that the Reynolds number is to high which allows for stablepockets electrolyte.
The Sn dissolution after less than 500 s with strong dissolution current inthe CV and high signal of 125 ppm as seen in the Sn 189.9 nm emissionline. Despite the static that occurs in the CV the Sn signal is high untilafter 620 S where the passivisation �lm occurs and the current and Snsignal decrease until the vertex potential where after the potential in-creases again. As with Cu there is a clearly visible reduction peak of Snon the cathodic scan, and the concentration of Sn ion in the chamber canbe detected in the ICP, likely because the concentration is much higher.After this peak however there are no discernible features meaning thatH2-evolution is suppressed on Sn compared to Cu.
The W signal is the highest in all of the investigated materials, at more250 ppm the peak oxidation of W starts −0.4 V vs Ag/AgCl and levels.On the anodic scan the current saturates brie�y as the cell hits the iscell voltage limit but the dissolution continues to increase, likely due to
24
3.3. Cyclic Voltametry Results
Figure 3.5: CVs of a) Cu, b) Sn, c) W, d) SS, in 1 M KOH at 10 11 mV/swith the potential of Zn (blue dashed line) and onset of the O2 reductionred dashed line.
delay in the signal. Tungsten dissolves quite far from the conditions ofthe current collector and exhibits only slight hydrogen evolution as thosepotentials also making it a potential.
The stainless steel signal is very low but dissolution is detected. Thestrongest signal is Fe has two distinct peaks after a 1000 s of anodic scanthis dissolution cannot be tied to feature in the voltamogram. Both theFe and the alloying constituent Cr dissolve at the peak located beyond0.0 VvsAg/AgCl. When the hydrogen dissolution starts at 0.5 VvsAg/AgCl.No backscan was performed because the signals are too low and the ir-reversible nature of dissolving steel.
While Sn is superior in terms of hydrogen evolution the material dissolvesquickly and close to the potential of the Zn electrode. Tungsten wouldperform well in terms of chemical resistance in the anode but still exhibithydrogen evolution. Of the materials investigated here only SS and Ni isdisquali�ed for the anode while Cu, Sn and W would not be suitable forthe cathode. Ni, a well established current collector was con�rmed to dowell as it experience little dissolution around the OER evolution potentialand is also here seen to have signi�cant OER activity. These conclusionare made only in relation to their dissolution, and there other aspects to
25
Chapter 3. Anode Current Collectors
account for such as conductivity and price. This line of experiments hascon�rmed that the produced �ow cell is working and that it can be usedto investigate current collectors for Zn-air batteries. It would be idealto improve the cell design by reducing the interaction area and volumeof the cell to avoid high currents and di�culty controlling the potential.Another modi�cation would be to improve the �ow over the workingelectrode to become more laminar, this could be achieved by taperingthe inlet and outlet or perhaps adopt a geometry similar to Schuppertet. al. [46].
3.4 Summary of Anode Current Collector In-
vestigation
Through the development of the a �ow cell combined with ICP-OES thedissolution of Zn and stability of Cu, Sn, Stainless steel, W, Ni alloy, andTi alloy in alkaline solutions were investigated. The emission peaks couldbe correlated to the CV data by calibrating the ICP-OES for time andconcentration. The CV for each material exhibited CV similar to what isfound in literature apart from static and artefacts related to di�culties incontrolling current or voltage. Which was suggest could be remedied bylowering the active area of the cell and applying a new geometry. Furtherwork would also include investigating air-electrodes.
O� these materials stainless steel were unsuitable for both the anode andcathode current collector as it exhibits a strong gas evolution at both theanode and cathode, but no chromium or other metal were detected withthe ICP-OES. From these it was found that Ni and Ti could be suitablefor cathode current collectors, and in the case of Ti also the anode. Inagreement with literature Cu and Sn are quite well suited for Zn-airbattery anodes. W would be suited for anode current collector also.
26
Chapter 4
DEMS investigation of Zn-airbatteries
The �rst section in this chapter covers Paper III with some additionalresults. The electrolyte of choice for Zn-air batteries is highly concen-trated KOH, various values are reported but generally molarities higherthan 5 M are found. It provides high conductivity, high oxygen di�usioncoe�cients and with the high concentration the vapour pressure of H2Ois reduced which is good for open systems as it reduces the requirementfor water management[47]. However, the KOH does present challenges,such as reaction with CO2 in their air, self corrosion and the tendency tocreate dendrites. Quite a few other electrolytes have been proposed overthe years with various advantages challenges.
4.1 Alkaline Zn-air battery with 6M KOH
electrolyte
A constant challenge when dealing with highly alkaline electrolytes is selfcorrosion. This process is occurring whether the battery is in storage orin use. For small disposable batteries the amount of hydrogen is canbe overlook but in larger system such as power storage the problem hasto be accounted for as it depletes both Zn surface and the electrolyte.Additionally when characterising Zn-air batteries the experiment is con-stantly a�ected by this conversion. The self corrosion can of a materialis easily determined by collecting the evolved gasses a Zn sample in an
27
Chapter 4. DEMS investigation of Zn-air batteries
electrolyte container. For full cells the however, the surface is constantlychanging and the gassing will be a�ected by this. There are means tomigitate self corrosion as will be demonstrated later but as long as it isno zero it is important to understand how to investigate and correct forit. To this end Zn-air batteries where assembled in the EL-cell with a18 mm diameter 0.125 mm Zn foil anode, supported on Cu was tested in6 M KOH against aNiCo2O4 cathode.
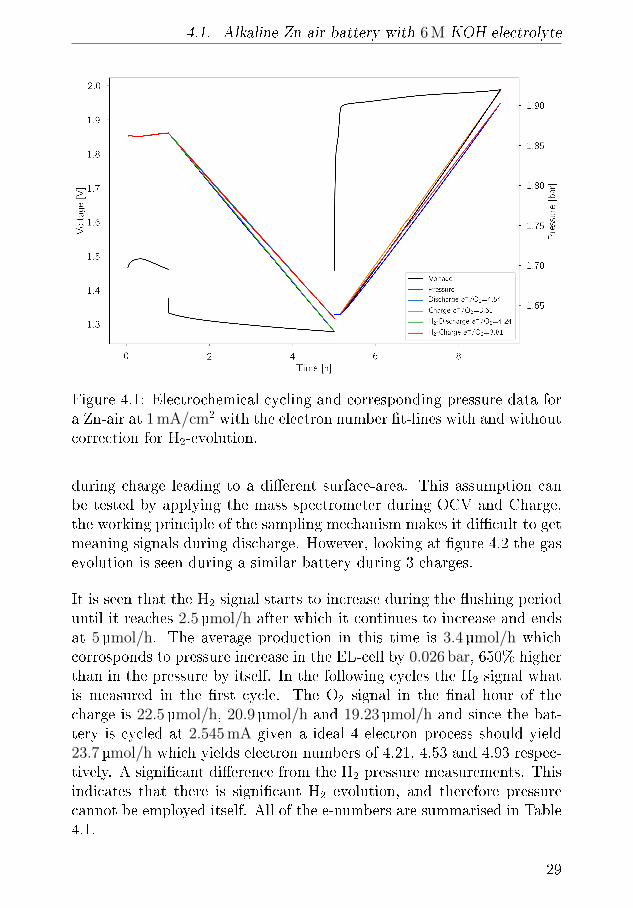
In �gure 4.1 the electrochemical cycling data and measured pressures forsuch a Zn-air battery is seen. During the initial 1 h of OCV the pres-sure increases by 0.004 bar and the OCV which initially increases, peaksafter about 20 min and decreases again to its original value just beforethe discharge starts. The initial increase is believed to be related to thewetting of the cathode while the decrease is related to self-corrosion ofthe surface. The operating pressure of the DEMS, in this case, 1.85 barof pure oxygen is likely responsible for the increase. During discharge thevoltage is �at at more 1.3 V while pressure decreases linearly. On chargethere is a small bump in the charging pro�le before it �attens out andin this time the pressure is static, this bump appears at 1.8 V and is anoxidation of the air electrode because the high OCV will persist if reusedin a new battery, although it decreases slightly over time. It is notedthat until the voltage reaches ∼1.95 V the pressure does not increase.By measuring the pressure during discharge and applying equation 2.1electron numbers can be obtained. During discharge the measured elec-tron number is 4.53 on discharge and 3.61 on charge which is quite farfrom the ideal 4.00. This is indicative of di�culty of making bi-functionalair electrodes, but also resembles that H2 evolution is occurring. How-ever, since the pressure sensors cannot distinguish between O2 and H2
and a signi�cant portion will drive the numbers away from the ideal.Assuming that the rate discovered in the OCV measurement is constantthis amount can subtracted from the pressure and yield ratios of 4.24and 3.81 for discharge and charge respectively, much closer the ideal 4that is expected for the OER. The electron number for the charge takesinto account that some of the electron spent on some oxidation processin the cathode, as these do not contribute to gas evolution. The batterywas cycled for at total of 3 times total and the adjusted discharge andcharge values are 4.32 and 3.68 in the second cycle and 4.5 and 3.82 forthe third cycle. It could be argued that the H2 evolution is not constant,the Zn surface will passivate during OCV leading to reduced availableactive area, during discharge the surface will dissolve and redepositing
28
4.1. Alkaline Zn-air battery with 6 M KOH electrolyte
Figure 4.1: Electrochemical cycling and corresponding pressure data fora Zn-air at 1 mA/cm2 with the electron number �t-lines with and withoutcorrection for H2-evolution.
during charge leading to a di�erent surface-area. This assumption canbe tested by applying the mass spectrometer during OCV and Charge,the working principle of the sampling mechanism makes it di�cult to getmeaning signals during discharge. However, looking at �gure 4.2 the gasevolution is seen during a similar battery during 3 charges.
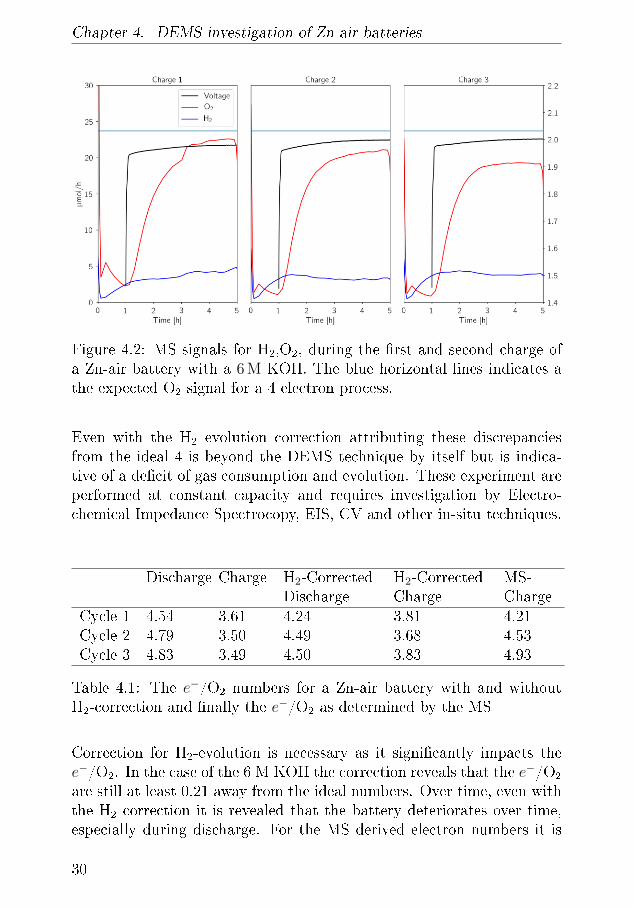
It is seen that the H2 signal starts to increase during the �ushing perioduntil it reaches 2.5µmol/h after which it continues to increase and endsat 5 µmol/h. The average production in this time is 3.4 µmol/h whichcorrosponds to pressure increase in the EL-cell by 0.026 bar, 650% higherthan in the pressure by itself. In the following cycles the H2 signal whatis measured in the �rst cycle. The O2 signal in the �nal hour of thecharge is 22.5 µmol/h, 20.9 µmol/h and 19.23µmol/h and since the bat-tery is cycled at 2.545 mA given a ideal 4 electron process should yield23.7 µmol/h which yields electron numbers of 4.21, 4.53 and 4.93 respec-tively. A signi�cant di�erence from the H2 pressure measurements. Thisindicates that there is signi�cant H2 evolution, and therefore pressurecannot be employed itself. All of the e-numbers are summarised in Table4.1.
29
Chapter 4. DEMS investigation of Zn-air batteries
Figure 4.2: MS signals for H2,O2, during the �rst and second charge ofa Zn-air battery with a 6 M KOH. The blue horizontal lines indicates athe expected O2 signal for a 4 electron process.
Even with the H2 evolution correction attributing these discrepanciesfrom the ideal 4 is beyond the DEMS technique by itself but is indica-tive of a de�cit of gas consumption and evolution. These experiment areperformed at constant capacity and requires investigation by Electro-chemical Impedance Spectrocopy, EIS, CV and other in-situ techniques.
Discharge Charge H2-CorrectedDischarge
H2-CorrectedCharge
MS-Charge
Cycle 1 4.54 3.61 4.24 3.81 4.21Cycle 2 4.79 3.50 4.49 3.68 4.53Cycle 3 4.83 3.49 4.50 3.83 4.93
Table 4.1: The e−/O2 numbers for a Zn-air battery with and withoutH2-correction and �nally the e−/O2 as determined by the MS
Correction for H2-evolution is necessary as it signi�cantly impacts thee−/O2. In the case of the 6 M KOH the correction reveals that the e−/O2
are still at least 0.21 away from the ideal numbers. Over time, even withthe H2 correction it is revealed that the battery deteriorates over time,especially during discharge. For the MS derived electron numbers it is
30
4.2. Additives to KOH
obvious that the H2 evolution is important to correct for as the pressureassumption is not su�cient the longer an experiment goes on.
4.2 Additives to KOH
As alkaline electrolytes have been widely applied there have been a seriesof investigation where adding various additives to KOH such as ZnO,KF and K2CO3 has been investigated in literature. As is investigatedlater in this document, adding the discharge product ZnO to the elec-trolyte is bene�cial as it reduces Zn-dissolution and minimises migrationof Zn(OH)42� and this way create more uniform deposition of ZnO [48].Adding K2CO3 to an alkaline electrolyte in concentrations as high as ∼30 mol% does enables higher DoD due because it reduces the electrolytesreaction with CO2 in the air [49][50]. Adler et. al. con�rmed that KFbene�ted the battery cell overall by retarding the appearance of dendriteseven though it impacts and others have suggested that this additive alsobene�ted the overpotenial of ORR and OER on a α−MnO2 [51] [52].Mainar et. al. investigated mixtures of these additives and found anoptimal formulation for a full Zn air battery. A cell with this 7 M KOH+ 1.4 M KF + 1.4 M K2CO3 electrolyte was made with Zn foil supportedon Cu and a NCO air electrode with a Ni current collector. Since the
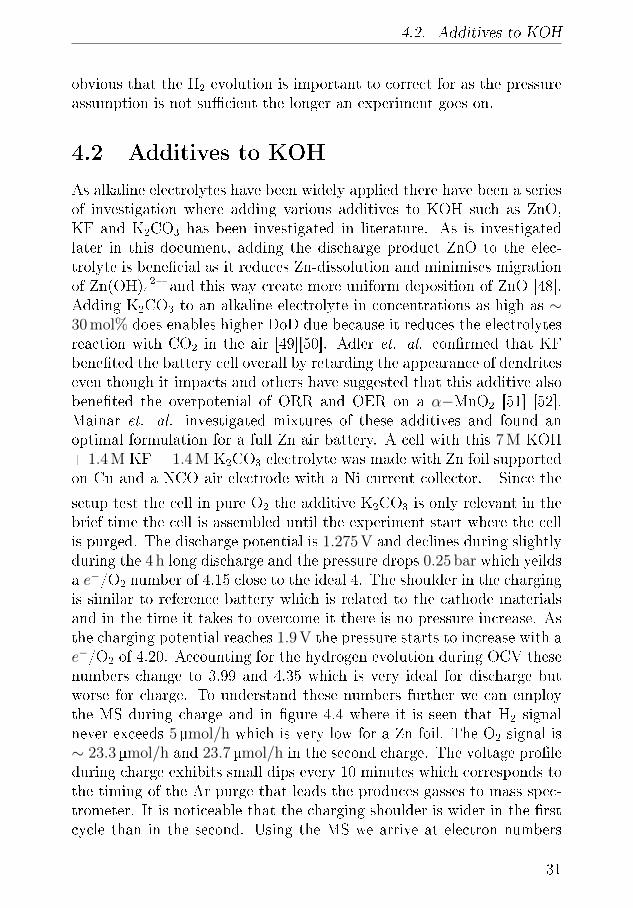
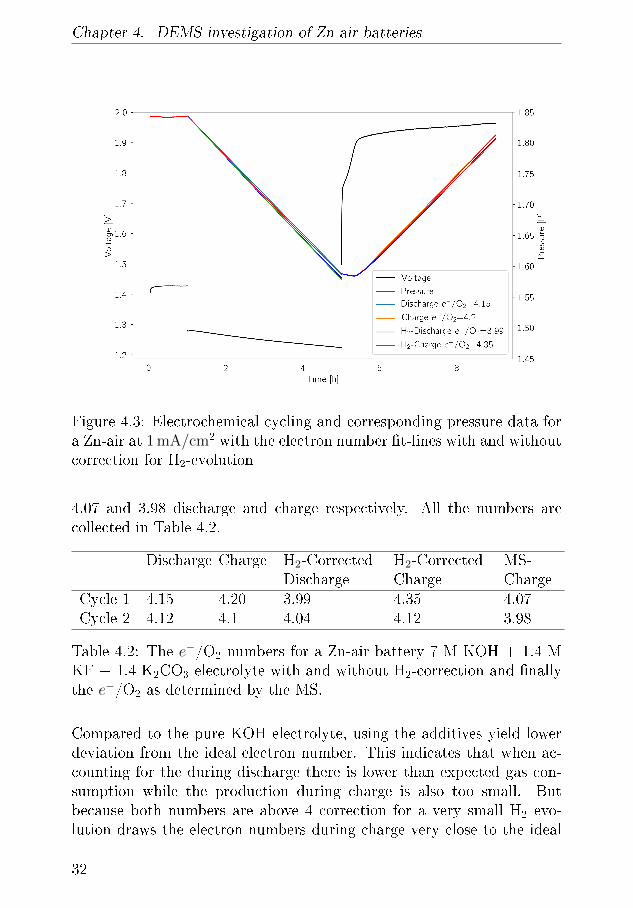
setup test the cell in pure O2 the additive K2CO3 is only relevant in thebrief time the cell is assembled until the experiment start where the cellis purged. The discharge potential is 1.275 V and declines during slightlyduring the 4 h long discharge and the pressure drops 0.25 bar which yeildsa e−/O2 number of 4.15 close to the ideal 4. The shoulder in the chargingis similar to reference battery which is related to the cathode materialsand in the time it takes to overcome it there is no pressure increase. Asthe charging potential reaches 1.9 V the pressure starts to increase with ae−/O2 of 4.20. Accounting for the hydrogen evolution during OCV thesenumbers change to 3.99 and 4.35 which is very ideal for discharge butworse for charge. To understand these numbers further we can employthe MS during charge and in �gure 4.4 where it is seen that H2 signalnever exceeds 5µmol/h which is very low for a Zn foil. The O2 signal is∼ 23.3 µmol/h and 23.7 µmol/h in the second charge. The voltage pro�leduring charge exhibits small dips every 10 minutes which corresponds tothe timing of the Ar purge that leads the produces gasses to mass spec-trometer. It is noticeable that the charging shoulder is wider in the �rstcycle than in the second. Using the MS we arrive at electron numbers
31
Chapter 4. DEMS investigation of Zn-air batteries
Figure 4.3: Electrochemical cycling and corresponding pressure data fora Zn-air at 1 mA/cm2 with the electron number �t-lines with and withoutcorrection for H2-evolution
4.07 and 3.98 discharge and charge respectively. All the numbers arecollected in Table 4.2.
Discharge Charge H2-CorrectedDischarge
H2-CorrectedCharge
MS-Charge
Cycle 1 4.15 4.20 3.99 4.35 4.07Cycle 2 4.12 4.1 4.04 4.12 3.98
Table 4.2: The e−/O2 numbers for a Zn-air battery 7 M KOH + 1.4 MKF + 1.4 K2CO3 electrolyte with and without H2-correction and �nallythe e−/O2 as determined by the MS.
Compared to the pure KOH electrolyte, using the additives yield lowerdeviation from the ideal electron number. This indicates that when ac-counting for the during discharge there is lower than expected gas con-sumption while the production during charge is also too small. Butbecause both numbers are above 4 correction for a very small H2 evo-lution draws the electron numbers during charge very close to the ideal
32
4.3. Chloride electrolyte
Figure 4.4: MS signals for H2,O2, during the �rst and second charge ofa Zn-air battery with a 7 M KOH + 1.4 M KF + 1.4 M K2CO3. Theblue horizontal lines indicates a the expected O2 signal for a 4 electronprocess.
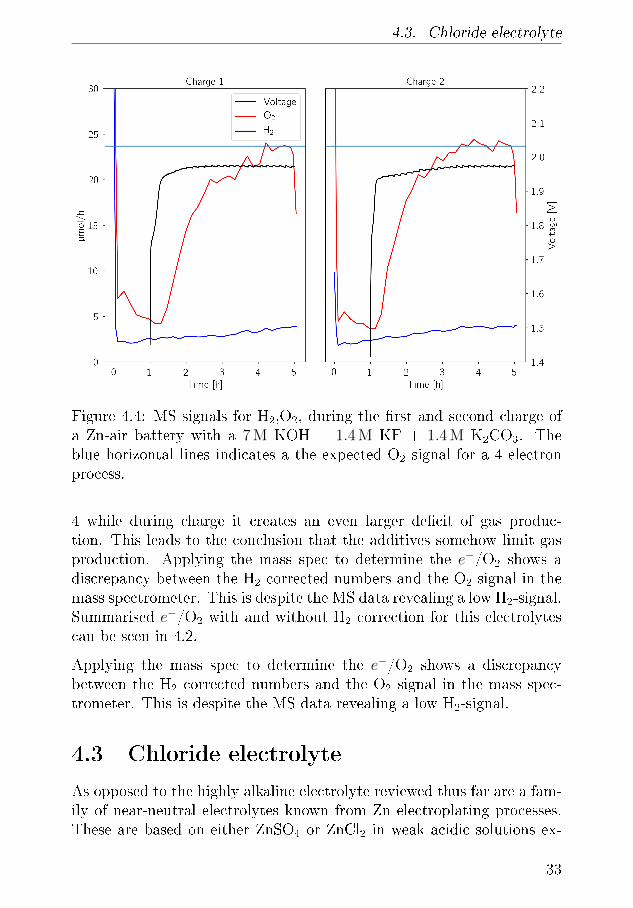
4 while during charge it creates an even larger de�cit of gas produc-tion. This leads to the conclusion that the additives somehow limit gasproduction. Applying the mass spec to determine the e−/O2 shows adiscrepancy between the H2 corrected numbers and the O2 signal in themass spectrometer. This is despite the MS data revealing a low H2-signal.Summarised e−/O2 with and without H2 correction for this electrolytescan be seen in 4.2.
Applying the mass spec to determine the e−/O2 shows a discrepancybetween the H2 corrected numbers and the O2 signal in the mass spec-trometer. This is despite the MS data revealing a low H2-signal.
4.3 Chloride electrolyte
As opposed to the highly alkaline electrolyte reviewed thus far are a fam-ily of near-neutral electrolytes known from Zn electroplating processes.These are based on either ZnSO4 or ZnCl2 in weak acidic solutions ex-
33
Chapter 4. DEMS investigation of Zn-air batteries
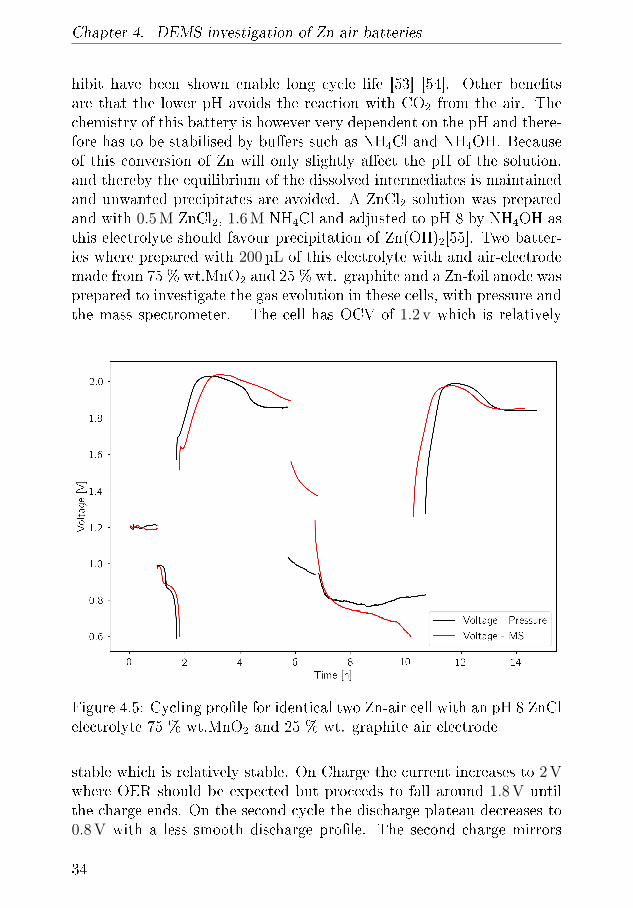
hibit have been shown enable long cycle life [53] [54]. Other bene�tsare that the lower pH avoids the reaction with CO2 from the air. Thechemistry of this battery is however very dependent on the pH and there-fore has to be stabilised by bu�ers such as NH4Cl and NH4OH. Becauseof this conversion of Zn will only slightly a�ect the pH of the solution,and thereby the equilibrium of the dissolved intermediates is maintainedand unwanted precipitates are avoided. A ZnCl2 solution was preparedand with 0.5 M ZnCl2, 1.6 M NH4Cl and adjusted to pH 8 by NH4OH asthis electrolyte should favour precipitation of Zn(OH)2[55]. Two batter-ies where prepared with 200µL of this electrolyte with and air-electrodemade from 75 % wt.MnO2 and 25 % wt. graphite and a Zn-foil anode wasprepared to investigate the gas evolution in these cells, with pressure andthe mass spectrometer. The cell has OCV of 1.2 v which is relatively
Figure 4.5: Cycling pro�le for identical two Zn-air cell with an pH 8 ZnClelectrolyte 75 % wt.MnO2 and 25 % wt. graphite air electrode
stable which is relatively stable. On Charge the current increases to 2 Vwhere OER should be expected but proceeds to fall around 1.8 V untilthe charge ends. On the second cycle the discharge plateau decreases to0.8 V with a less smooth discharge pro�le. The second charge mirrors
34
4.3. Chloride electrolyte
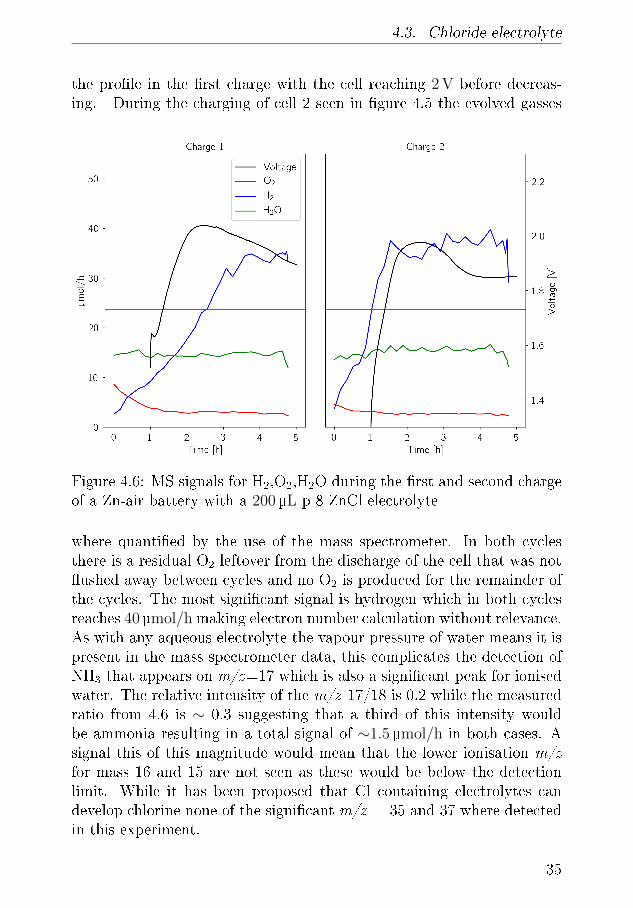
the pro�le in the �rst charge with the cell reaching 2 V before decreas-ing. During the charging of cell 2 seen in �gure 4.5 the evolved gasses
Figure 4.6: MS signals for H2,O2,H2O during the �rst and second chargeof a Zn-air battery with a 200µL p 8 ZnCl electrolyte
where quanti�ed by the use of the mass spectrometer. In both cyclesthere is a residual O2 leftover from the discharge of the cell that was not�ushed away between cycles and no O2 is produced for the remainder ofthe cycles. The most signi�cant signal is hydrogen which in both cyclesreaches 40µmol/h making electron number calculation without relevance.As with any aqueous electrolyte the vapour pressure of water means it ispresent in the mass spectrometer data, this complicates the detection ofNH3 that appears on m/z=17 which is also a signi�cant peak for ionisedwater. The relative intensity of the m/z 17/18 is 0.2 while the measuredratio from 4.6 is ∼ 0.3 suggesting that a third of this intensity wouldbe ammonia resulting in a total signal of ∼1.5 µmol/h in both cases. Asignal this of this magnitude would mean that the lower ionisation m/zfor mass 16 and 15 are not seen as these would be below the detectionlimit. While it has been proposed that Cl containing electrolytes candevelop chlorine none of the signi�cant m/z = 35 and 37 where detectedin this experiment.
35
Chapter 4. DEMS investigation of Zn-air batteries
4.4 Highly Concentrated Zinc Electrolyte
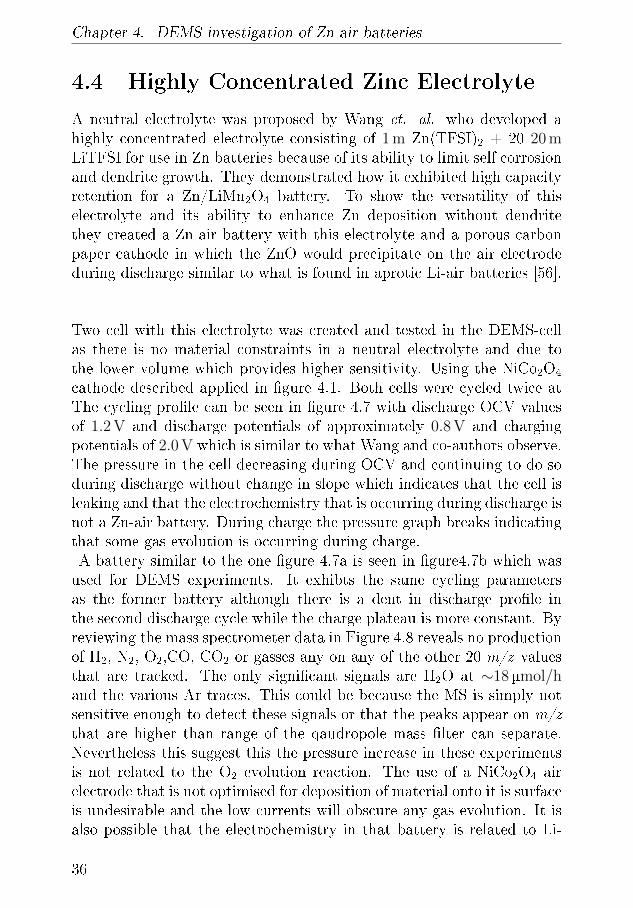
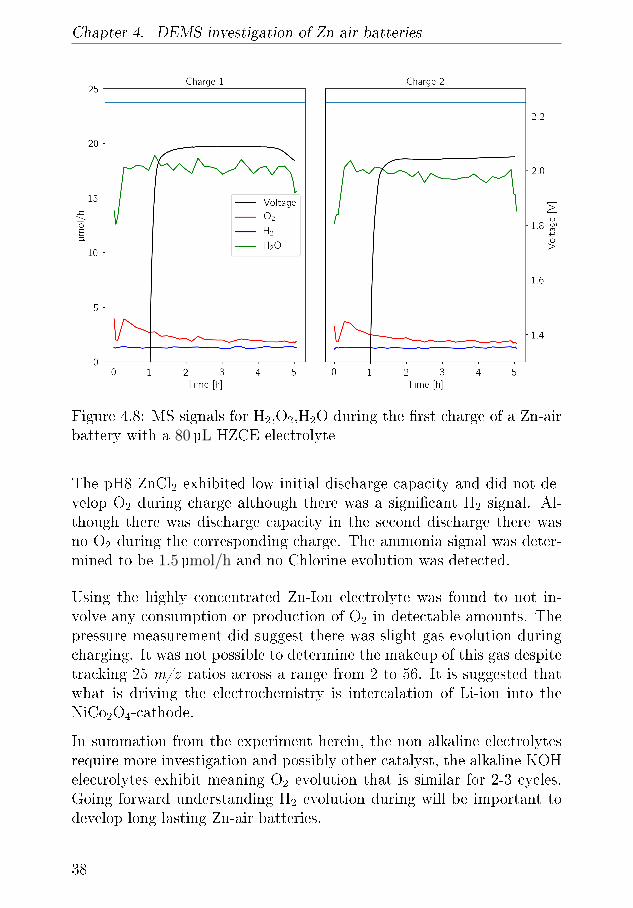
A neutral electrolyte was proposed by Wang et. al. who developed ahighly concentrated electrolyte consisting of 1 m Zn(TFSI)2 + 20 20 mLiTFSI for use in Zn batteries because of its ability to limit self corrosionand dendrite growth. They demonstrated how it exhibited high capacityretention for a Zn/LiMn2O4 battery. To show the versatility of thiselectrolyte and its ability to enhance Zn deposition without dendritethey created a Zn-air battery with this electrolyte and a porous carbonpaper cathode in which the ZnO would precipitate on the air electrodeduring discharge similar to what is found in aprotic Li-air batteries [56].
Two cell with this electrolyte was created and tested in the DEMS-cellas there is no material constraints in a neutral electrolyte and due tothe lower volume which provides higher sensitivity. Using the NiCo2O4
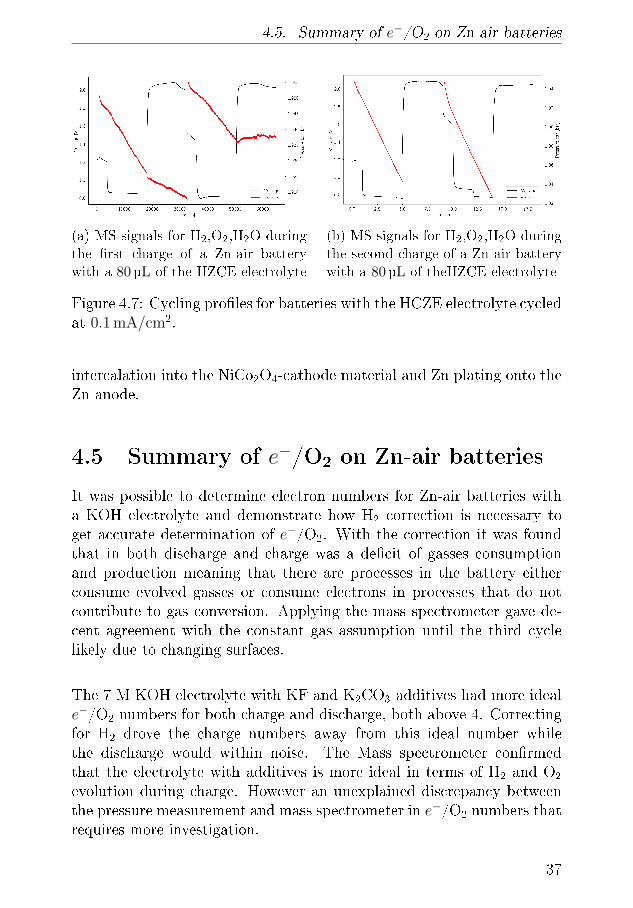
cathode described applied in �gure 4.1. Both cells were cycled twice atThe cycling pro�le can be seen in �gure 4.7 with discharge OCV valuesof 1.2 V and discharge potentials of approximately 0.8 V and chargingpotentials of 2.0 V which is similar to what Wang and co-authors observe.The pressure in the cell decreasing during OCV and continuing to do soduring discharge without change in slope which indicates that the cell isleaking and that the electrochemistry that is occurring during discharge isnot a Zn-air battery. During charge the pressure graph breaks indicatingthat some gas evolution is occurring during charge.A battery similar to the one �gure 4.7a is seen in �gure4.7b which wasused for DEMS experiments. It exhibts the same cycling parametersas the former battery although there is a dent in discharge pro�le inthe second discharge cycle while the charge plateau is more constant. Byreviewing the mass spectrometer data in Figure 4.8 reveals no productionof H2, N2, O2,CO, CO2 or gasses any on any of the other 20 m/z valuesthat are tracked. The only signi�cant signals are H2O at ∼18µmol/hand the various Ar traces. This could be because the MS is simply notsensitive enough to detect these signals or that the peaks appear on m/zthat are higher than range of the qaudropole mass �lter can separate.Nevertheless this suggest this the pressure increase in these experimentsis not related to the O2 evolution reaction. The use of a NiCo2O4 airelectrode that is not optimised for deposition of material onto it is surfaceis undesirable and the low currents will obscure any gas evolution. It isalso possible that the electrochemistry in that battery is related to Li-
36
4.5. Summary of e−/O2 on Zn-air batteries
(a) MS signals for H2,O2,H2O during
the �rst charge of a Zn-air battery
with a 80 µL of the HZCE electrolyte
(b) MS signals for H2,O2,H2O during
the second charge of a Zn-air battery
with a 80 µL of theHZCE electrolyte
Figure 4.7: Cycling pro�les for batteries with the HCZE electrolyte cycledat 0.1 mA/cm2.
intercalation into the NiCo2O4-cathode material and Zn plating onto theZn anode.
4.5 Summary of e−/O2 on Zn-air batteries
It was possible to determine electron numbers for Zn-air batteries witha KOH electrolyte and demonstrate how H2 correction is necessary toget accurate determination of e−/O2. With the correction it was foundthat in both discharge and charge was a de�cit of gasses consumptionand production meaning that there are processes in the battery eitherconsume evolved gasses or consume electrons in processes that do notcontribute to gas conversion. Applying the mass spectrometer gave de-cent agreement with the constant gas assumption until the third cyclelikely due to changing surfaces.
The 7 M KOH electrolyte with KF and K2CO3 additives had more ideale−/O2 numbers for both charge and discharge, both above 4. Correctingfor H2 drove the charge numbers away from this ideal number whilethe discharge would within noise. The Mass spectrometer con�rmedthat the electrolyte with additives is more ideal in terms of H2 and O2
evolution during charge. However an unexplained discrepancy betweenthe pressure measurement and mass spectrometer in e−/O2 numbers thatrequires more investigation.
37
Chapter 4. DEMS investigation of Zn-air batteries
Figure 4.8: MS signals for H2,O2,H2O during the �rst charge of a Zn-airbattery with a 80µL HZCE electrolyte
The pH8 ZnCl2 exhibited low initial discharge capacity and did not de-velop O2 during charge although there was a signi�cant H2 signal. Al-though there was discharge capacity in the second discharge there wasno O2 during the corresponding charge. The ammonia signal was deter-mined to be 1.5 µmol/h and no Chlorine evolution was detected.
Using the highly concentrated Zn-Ion electrolyte was found to not in-volve any consumption or production of O2 in detectable amounts. Thepressure measurement did suggest there was slight gas evolution duringcharging. It was not possible to determine the makeup of this gas despitetracking 25 m/z ratios across a range from 2 to 56. It is suggested thatwhat is driving the electrochemistry is intercalation of Li-ion into theNiCo2O4-cathode.
In summation from the experiment herein, the non alkaline electrolytesrequire more investigation and possibly other catalyst, the alkaline KOHelectrolytes exhibit meaning O2 evolution that is similar for 2-3 cycles.Going forward understanding H2 evolution during will be important todevelop long lasting Zn-air batteries.
38
Chapter 5
Dopants and the E�ect on SelfCorrosion
This chapter will cover the content of paper II with focus on the ex-perimental part, including some additional measurements and �gures toclarify and underline the results presented therein. As the content ofpaper is a combination of theory and experiments, the theory part willbe explained here and related to the results in order to convey the fullmessage.
The challenge of preventing self corrosion was initially addressed byadding Hg to the anode material of at least 100 g/cm2, which was patentedand applied in Zn batteries [57][58]. As the toxicity of Hg became in-creasingly apparent, legislation was put into place to curtail its use anda replacement was needed. A number of materials were considered asreplacements, and in 1994 various mixtures of Al, Bi, In, Ca and Liadded to Zn powder in dopant levels were patented [59]. These mixtureshave since been applied and investigated in a number of publications.Indium, while soluble in Zn [60], was proven to segregate between thegrain boundaries of Zn, which promotes Zn dissolution and decreases theHydrogen Evolution reaction, (HER) rate [61]. Alloying Zn with Ni andIn can in certain combination reduce dendrite formation and shift theHER towards more negative potentials [62]. Another commonly founddopant in Zn powders, Bi, has a very low solubility of 0.1 % in Zn [63]and can be used to improve the conductivity of Zn particles [64][65]. Ithas been suggested that Bi is mostly bene�cial in combination with otherdopants, as it was found to precipitate into the grain boundaries of Zn
39
Chapter 5. Dopants and the E�ect on Self Corrosion
in the soldering material Sn8Zn3Bi[66] where it cannot a�ect the Zn sur-face. In combination with Ca(OH)2, Bi has been suggested to increasethe number of cycles achievable by reducing dendrite growth [67][68].The co-dopant e�ciency of In and Bi was investigated by Yano et. al.and it was found that the dopants reduced the HER rate by the sameamount as a Hg dopant.
The way these elements a�ect the HER is understood once the mech-anism is investigated. However, this requires a reiteration of how Znbehaves during cycling. Zincate formation originates from Zn atoms ac-cepting OH� until it goes into solution as Zn(OH)3 � , where it can acceptanother hydroxide ion to form Zn(OH)42� , as summed up in the followingequations:
Zn4OH− ↔ Zn(OH) + 3OH− + e− ↔ Zn(OH)2 + 2OH− + 2e− (5.1)
Zn(OH)2+2OH−+2e− ↔ [Zn(OH)3]−+OH−+2e− ↔ [Zn(OH)4]2−+2e−
(5.2)
5.1 A Brief Summary of DFT
It is beyond the scope of this thesis to cover in detail the fundamentalsof Density Functional Theory (DFT). In very short, DFT is a frameworkby which the ground state electronic density of a quantum mechanicalsystem can be calculated numerically, the required chemical propertiesincluding the energy can be determined with the density. By dealingwith the electronic density rather than individual electrons, the size theof the calculation required is reduced to within supercomputer levels.The procedure is in principle exact apart from an approximated exchangecorrelation functional that exists in many �avors and forms. Picking theright functional for your system is a compromise between accuracy andcomputational cost.
5.2 Zinc Surfaces and Self Corrosion
In paper I, the impact of dopants in the Zn electrode self corrosion orgassing was investigated. The active material, Zn, is consumed by re-action with water, leaving Zn(OH)2 according to reaction 1.3. This is
40
5.3. Understanding the E�ect of Bi and In.
detrimental for both primary and secondary Zn air batteries, as it re-duces the discharge capacity. For secondary batteries it is a recurringproblem, because the zinc hydroxide is converted back during charge.However, this presents another problem over the life of the battery, asidefrom the reduced coulombic e�ciency and capacity loss; the electrolyteis consumed during gassing.
In 2013, Siahrostami et al. applied DFT to investigate the dissolution ofZn on pure Zn surfaces[69] and found that kink sites were favourable fordissolution of Zn compared to a surface site. The Zn (0001) surface bindseach atom strongly, and creating a vacancy is furthermore associated withan energy barrier. At the edge of a Zn surface, while the atom is notnearly as strongly bound as at the surface, there is still an associatedenergy barrier, unlike at the kink sites where the surface is the samebefore and after the outermost Zn atom is removed. Even so, the freeenergy diagram shown in Figure 5.1 reveals that the kink site and edgehave a very similar potential. When accounting for the formation ofthe vacancy in the two �nal steps in reaction step 5.2, determined to be0.35 eV, the kink sites become favourable.
With the mechanism for Zn dissolution clari�ed, there is now a basis forintroducing dopants and evaluating their e�ect on the HER and zincateformation. However, since these reactions are con�ned to the surface, itis essential to determine if a dopant will remain at the surface. Duringcharging, Zn atoms will continuously be added to the kinks, driving awayany dopants from the reaction sites and thus diminishing their e�ect.Reviewing the relative energy of di�erent sites in the Zn surface in Figure5.2, it is seen that Ag is unlikely to stay at the surface, as the energy forbulk sites, coordination 9-12, is very similar to lower coordinated sites.Silver was included in this study because it is a promising catalyst incombination with Co3O4, which could leech into the anode during cycling[70]. In contrast, the established dopants Bi and In largely favour kinkand edge sites. As such, these elements that are applied in primarybatteries can be used in secondary batteries as well.
5.3 Understanding the E�ect of Bi and In.
When reviewing the patents on Zn powders, most of the described mix-tures contain some quantity of both Bi and In, as does the commercial
41
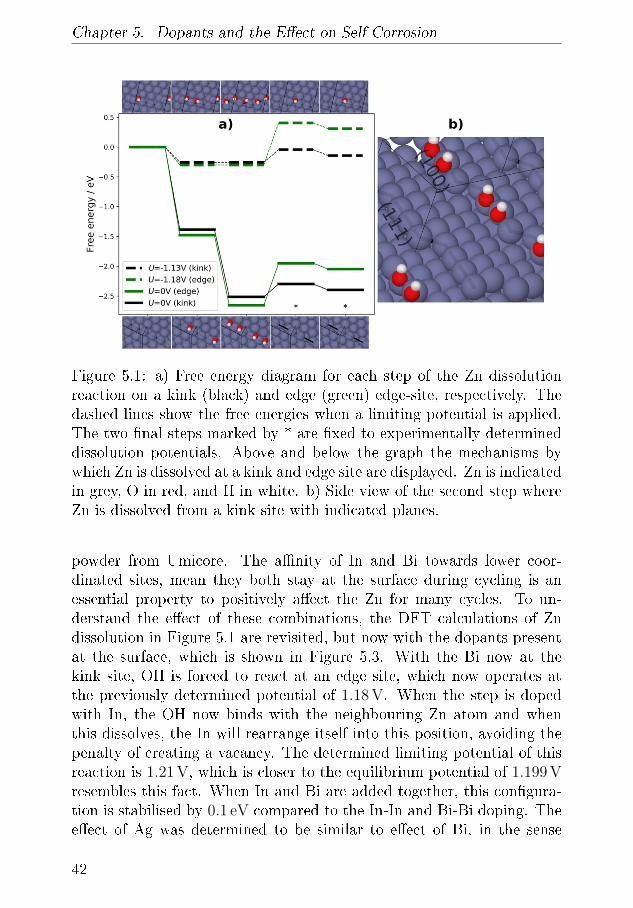
Chapter 5. Dopants and the E�ect on Self Corrosion
Figure 5.1: a) Free energy diagram for each step of the Zn dissolutionreaction on a kink (black) and edge (green) edge-site, respectively. Thedashed lines show the free energies when a limiting potential is applied.The two �nal steps marked by * are �xed to experimentally determineddissolution potentials. Above and below the graph the mechanisms bywhich Zn is dissolved at a kink and edge site are displayed. Zn is indicatedin grey, O in red, and H in white. b) Side view of the second step whereZn is dissolved from a kink site with indicated planes.
powder from Umicore. The a�nity of In and Bi towards lower coor-dinated sites, mean they both stay at the surface during cycling is anessential property to positively a�ect the Zn for many cycles. To un-derstand the e�ect of these combinations, the DFT calculations of Zndissolution in Figure 5.1 are revisited, but now with the dopants presentat the surface, which is shown in Figure 5.3. With the Bi now at thekink site, OH is forced to react at an edge site, which now operates atthe previously determined potential of 1.18 V. When the step is dopedwith In, the OH now binds with the neighbouring Zn atom and whenthis dissolves, the In will rearrange itself into this position, avoiding thepenalty of creating a vacancy. The determined limiting potential of thisreaction is 1.21 V, which is closer to the equilibrium potential of 1.199 Vresembles this fact. When In and Bi are added together, this con�gura-tion is stabilised by 0.1 eV compared to the In-In and Bi-Bi doping. Thee�ect of Ag was determined to be similar to e�ect of Bi, in the sense
42
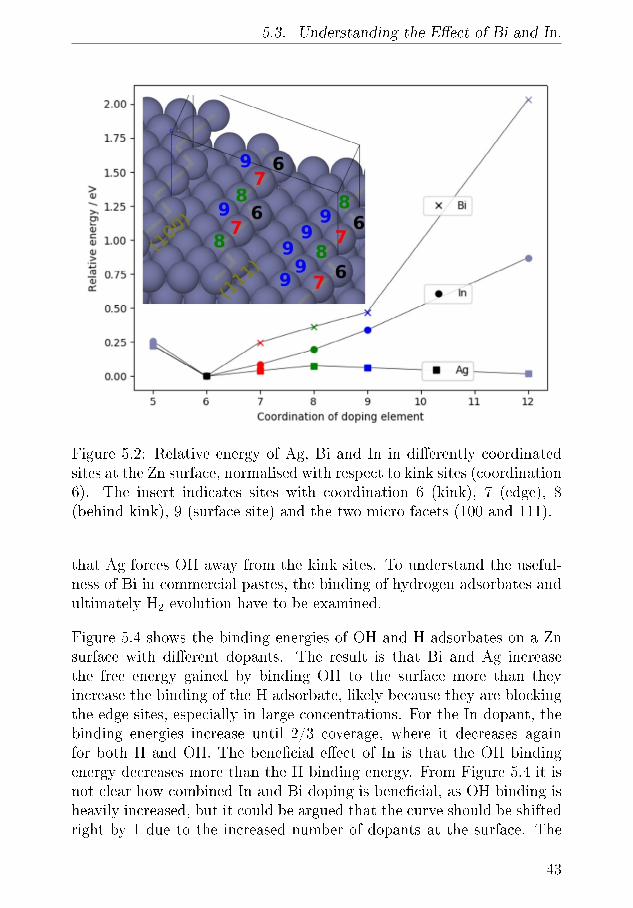
5.3. Understanding the E�ect of Bi and In.
Figure 5.2: Relative energy of Ag, Bi and In in di�erently coordinatedsites at the Zn surface, normalised with respect to kink sites (coordination6). The insert indicates sites with coordination 6 (kink), 7 (edge), 8(behind kink), 9 (surface site) and the two micro facets (100 and 111).
that Ag forces OH away from the kink sites. To understand the useful-ness of Bi in commercial pastes, the binding of hydrogen adsorbates andultimately H2 evolution have to be examined.
Figure 5.4 shows the binding energies of OH and H adsorbates on a Znsurface with di�erent dopants. The result is that Bi and Ag increasethe free energy gained by binding OH to the surface more than theyincrease the binding of the H adsorbate, likely because they are blockingthe edge sites, especially in large concentrations. For the In dopant, thebinding energies increase until 2/3 coverage, where it decreases againfor both H and OH. The bene�cial e�ect of In is that the OH bindingenergy decreases more than the H binding energy. From Figure 5.4 it isnot clear how combined In and Bi doping is bene�cial, as OH binding isheavily increased, but it could be argued that the curve should be shiftedright by 1 due to the increased number of dopants at the surface. The
43
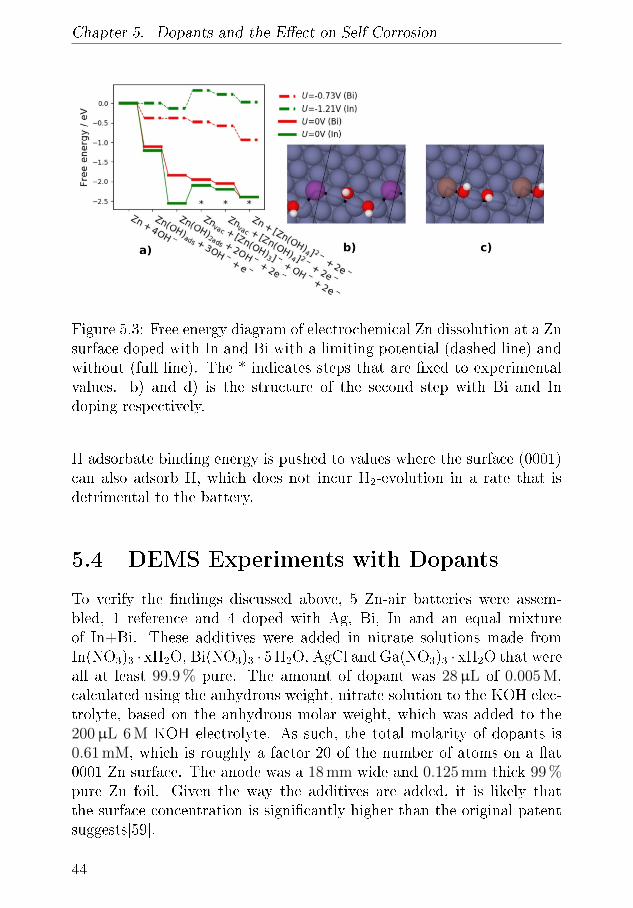
Chapter 5. Dopants and the E�ect on Self Corrosion
Figure 5.3: Free energy diagram of electrochemical Zn dissolution at a Znsurface doped with In and Bi with a limiting potential (dashed line) andwithout (full line). The * indicates steps that are �xed to experimentalvalues. b) and d) is the structure of the second step with Bi and Indoping respectively.
H adsorbate binding energy is pushed to values where the surface (0001)can also adsorb H, which does not incur H2-evolution in a rate that isdetrimental to the battery.
5.4 DEMS Experiments with Dopants
To verify the �ndings discussed above, 5 Zn-air batteries were assem-bled, 1 reference and 4 doped with Ag, Bi, In and an equal mixtureof In+Bi. These additives were added in nitrate solutions made fromIn(NO3)3 · xH2O, Bi(NO3)3 · 5H2O, AgCl and Ga(NO3)3 · xH2O that wereall at least 99.9 % pure. The amount of dopant was 28µL of 0.005 M,calculated using the anhydrous weight, nitrate solution to the KOH elec-trolyte, based on the anhydrous molar weight, which was added to the200µL 6 M KOH electrolyte. As such, the total molarity of dopants is0.61 mM, which is roughly a factor 20 of the number of atoms on a �at0001 Zn surface. The anode was a 18 mm wide and 0.125 mm thick 99 %pure Zn foil. Given the way the additives are added, it is likely thatthe surface concentration is signi�cantly higher than the original patentsuggests[59].
44
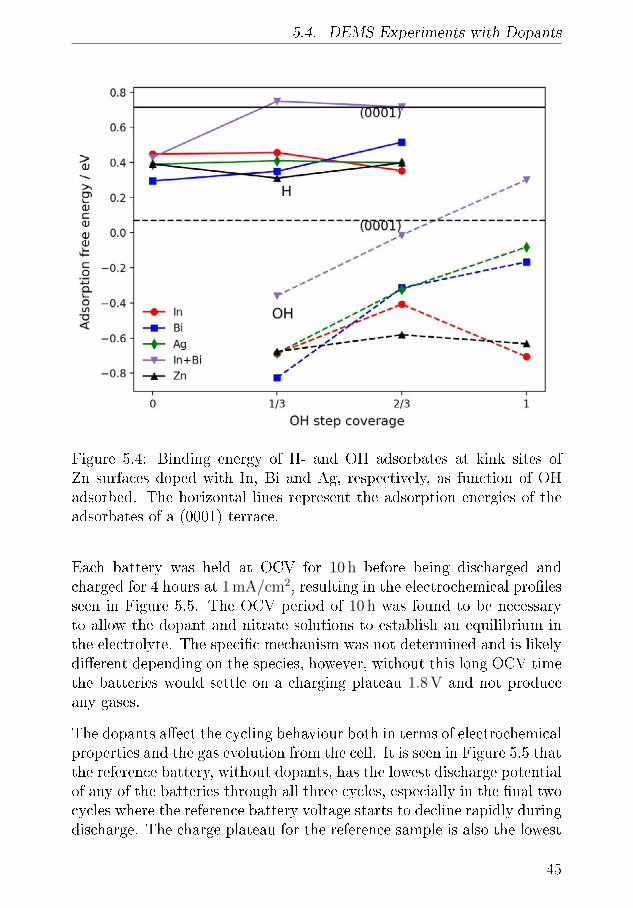
5.4. DEMS Experiments with Dopants
Figure 5.4: Binding energy of H- and OH adsorbates at kink sites ofZn surfaces doped with In, Bi and Ag, respectively, as function of OHadsorbed. The horizontal lines represent the adsorption energies of theadsorbates of a (0001) terrace.
Each battery was held at OCV for 10 h before being discharged andcharged for 4 hours at 1 mA/cm2, resulting in the electrochemical pro�lesseen in Figure 5.5. The OCV period of 10 h was found to be necessaryto allow the dopant and nitrate solutions to establish an equilibrium inthe electrolyte. The speci�c mechanism was not determined and is likelydi�erent depending on the species, however, without this long OCV timethe batteries would settle on a charging plateau 1.8 V and not produceany gases.
The dopants a�ect the cycling behaviour both in terms of electrochemicalproperties and the gas evolution from the cell. It is seen in Figure 5.5 thatthe reference battery, without dopants, has the lowest discharge potentialof any of the batteries through all three cycles, especially in the �nal twocycles where the reference battery voltage starts to decline rapidly duringdischarge. The charge plateau for the reference sample is also the lowest
45

Chapter 5. Dopants and the E�ect on Self Corrosion
Figure 5.5: Galvanostatic cycling data for 5 Zn-air batteries, 1 referencewithout any dopants (black) and 4 with di�erent dopants. The additivesare Ag (blue), Bi (red), In (green) and a 50:50 mixture of In and Bi(magenta). The initial OCV measurement time was 10 h and 1 h OCVwas held between cycles. Discharge and charge times were limited to 4 h.
of the samples throughout cycling. In the third and �nal cycle, the chargecontinues well beyond what would be expected the because the dischargewas cut short by almost two hours. That means that there is leftover ZnOand Zincate in the cell. It is conceivable that the charge continues dueto competition between Zn(OH)2 produced by the HER and conversionof ZnO produced during discharge. The battery with Ag dopants hasthe second lowest potential of all the batteries and its performance isvery similar to the reference battery's. In the �rst charge the Ag-dopedbattery has the third highest potential, surpassed by the batteries withIn. In the second and third cycle the potential decreases slightly. TheIn-doped batteries exhibit the highest OCV, discharge potentials andcharging potentials, although with only In doping the discharge potentialwanes with time.
The oxygen and hydrogen evolution for each battery during each chargeis shown in Figure 5.6 broken down into hourly average production, with
46
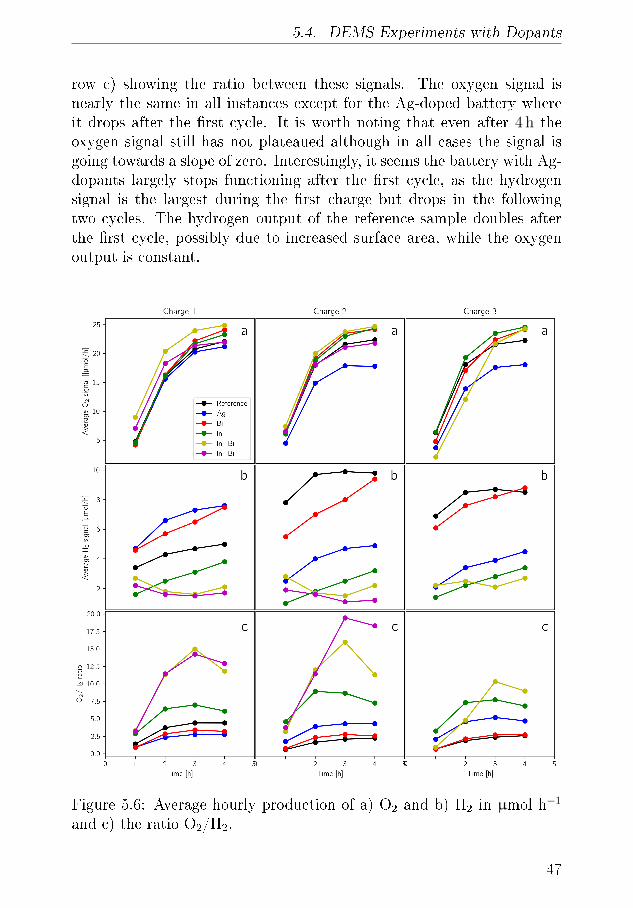
5.4. DEMS Experiments with Dopants
row c) showing the ratio between these signals. The oxygen signal isnearly the same in all instances except for the Ag-doped battery whereit drops after the �rst cycle. It is worth noting that even after 4 h theoxygen signal still has not plateaued although in all cases the signal isgoing towards a slope of zero. Interestingly, it seems the battery with Ag-dopants largely stops functioning after the �rst cycle, as the hydrogensignal is the largest during the �rst charge but drops in the followingtwo cycles. The hydrogen output of the reference sample doubles afterthe �rst cycle, possibly due to increased surface area, while the oxygenoutput is constant.
Figure 5.6: Average hourly production of a) O2 and b) H2 in µmol h−1
and c) the ratio O2/H2.
47
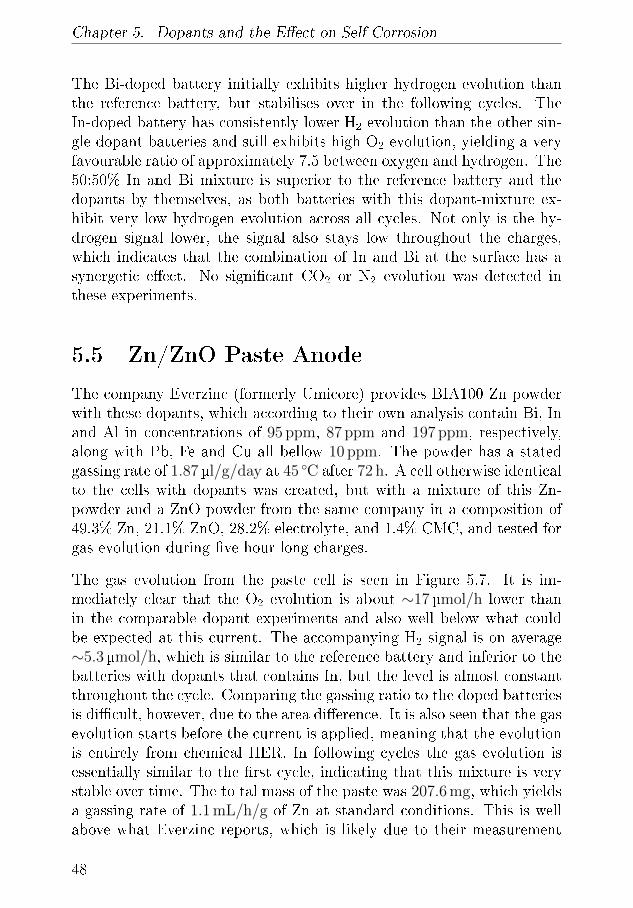
Chapter 5. Dopants and the E�ect on Self Corrosion
The Bi-doped battery initially exhibits higher hydrogen evolution thanthe reference battery, but stabilises over in the following cycles. TheIn-doped battery has consistently lower H2 evolution than the other sin-gle dopant batteries and still exhibits high O2 evolution, yielding a veryfavourable ratio of approximately 7.5 between oxygen and hydrogen. The50:50% In and Bi mixture is superior to the reference battery and thedopants by themselves, as both batteries with this dopant-mixture ex-hibit very low hydrogen evolution across all cycles. Not only is the hy-drogen signal lower, the signal also stays low throughout the charges,which indicates that the combination of In and Bi at the surface has asynergetic e�ect. No signi�cant CO2 or N2 evolution was detected inthese experiments.
5.5 Zn/ZnO Paste Anode
The company Everzinc (formerly Umicore) provides BIA100 Zn powderwith these dopants, which according to their own analysis contain Bi, Inand Al in concentrations of 95 ppm, 87 ppm and 197 ppm, respectively,along with Pb, Fe and Cu all bellow 10 ppm. The powder has a statedgassing rate of 1.87µl/g/day at 45 ◦C after 72 h. A cell otherwise identicalto the cells with dopants was created, but with a mixture of this Zn-powder and a ZnO powder from the same company in a composition of49.3% Zn, 21.1% ZnO, 28.2% electrolyte, and 1.4% CMC, and tested forgas evolution during �ve hour long charges.
The gas evolution from the paste cell is seen in Figure 5.7. It is im-mediately clear that the O2 evolution is about ∼17µmol/h lower thanin the comparable dopant experiments and also well below what couldbe expected at this current. The accompanying H2 signal is on average∼5.3 µmol/h, which is similar to the reference battery and inferior to thebatteries with dopants that contains In, but the level is almost constantthroughout the cycle. Comparing the gassing ratio to the doped batteriesis di�cult, however, due to the area di�erence. It is also seen that the gasevolution starts before the current is applied, meaning that the evolutionis entirely from chemical HER. In following cycles the gas evolution isessentially similar to the �rst cycle, indicating that this mixture is verystable over time. The to tal mass of the paste was 207.6 mg, which yieldsa gassing rate of 1.1 mL/h/g of Zn at standard conditions. This is wellabove what Everzinc reports, which is likely due to their measurement
48
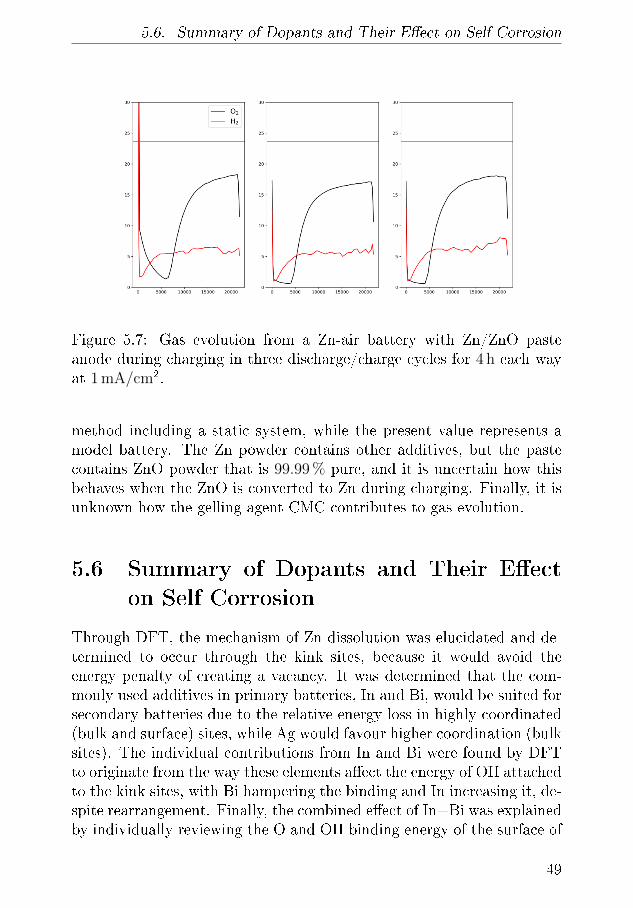
5.6. Summary of Dopants and Their E�ect on Self Corrosion
Figure 5.7: Gas evolution from a Zn-air battery with Zn/ZnO pasteanode during charging in three discharge/charge cycles for 4 h each wayat 1 mA/cm2.
method including a static system, while the present value represents amodel battery. The Zn powder contains other additives, but the pastecontains ZnO powder that is 99.99 % pure, and it is uncertain how thisbehaves when the ZnO is converted to Zn during charging. Finally, it isunknown how the gelling agent CMC contributes to gas evolution.
5.6 Summary of Dopants and Their E�ect
on Self Corrosion
Through DFT, the mechanism of Zn dissolution was elucidated and de-termined to occur through the kink sites, because it would avoid theenergy penalty of creating a vacancy. It was determined that the com-monly used additives in primary batteries, In and Bi, would be suited forsecondary batteries due to the relative energy loss in highly coordinated(bulk and surface) sites, while Ag would favour higher coordination (bulksites). The individual contributions from In and Bi were found by DFTto originate from the way these elements a�ect the energy of OH attachedto the kink sites, with Bi hampering the binding and In increasing it, de-spite rearrangement. Finally, the combined e�ect of In+Bi was explainedby individually reviewing the O and OH binding energy of the surface of
49
Chapter 5. Dopants and the E�ect on Self Corrosion
Zn.
A reference Zn-air battery was cycled 3 times and determined to have aO2/H2 ratio of almost 5 in the �rst cycle, after which it would decreaseto below 2.5. This showed how a pure Zn surface is unable to reachhigh cycling numbers in highly alkaline media. Adding Bi and In isbene�cial to the discharge voltage, but alone the e�ect deteriorates overtime. In terms of gas evolution, Bi is similar to Ag with very high H2
evolution, while In has almost no hydrogen evolution. Ag dopants werefound to be detrimental to the batteries' performance as they resultedin high hydrogen evolution and lower oxygen evolution, although it wassuggested to move away from the Zn-surface over time due Zn plating.Adding Bi and In together was bene�cial for the discharge plateau, andnow the e�ect lasts through all three cycles. Adding any dopant with Inincreased the charging plateau by roughly 0.025 V by the end of the cycle.The hydrogen signals were, however, the lowest of all the dopants at levelsbelow 3 µmol/h, a level which was maintained over all three cycles. Thisleads to the conclusion that In and Bi co-doping is the superior of theinvestigated dopants, in agreement with the DFT simulations.
A Zn-air battery with a Zn/ZnO oxide paste anode was tested, withthe commercial Zn powder containing In and Bi in 95 ppm and 197 ppmconcentrations, respectively. This battery was to evolve H2 at a levelof 5 µmol/h, slightly higher than for the Zn foil experiments. The rateof H2 evolution was determined to be 1.1 mL/h/g of Zn, which workedout to be was considerable higher than the raw materails, gassing rate.Indicating that in a full battery testing gassing is increased. Unlike thefoils these levels were constant and similar in each cycle indicating therobustness of these dopants.
Further improvement of this work would include conducting more cycleson each single battery with the di�erent dopants. Preferably, the dopantscould be added in other chemicals such as acetates or dry mixing and anoxidised dopant powder with Zn powder. It would also be bene�cial toconduct experiment with lower concentrations of dopants than appliedin these experiment to elucidate the co-dopant e�ect of In and Bi.
50
Chapter 6
Transformation and Migrationof Zn/ZnO in Secondary Zn-airBatteries
A fundamental mechanism of the alkaline Zn-air battery is the conversionof the anode through precipitation of ZnO and dissolution of Zn. Bothmechanisms rely on the intermediate Zn(OH)42� . As such, the transportand concentration of this species determines the structure of the anode,and thereby the voltage pro�le and cycle life of the battery. Since there
are only a few commercial and proposed batteries that employ Zn intheir chemistry, such as the Zn-Ag, Ni-Zn, Zn-MnO and �nally Zn-airbatteries, the structure and growth of Zn has been investigated in liter-ature by both XRD, tomography and other in situ techniques. Horn et.al. investigated the Zn-MnO battery using SEM and found that ZnOdeposition is heavily in�uenced by the current applied to the anode [71].Commercial Zn-air batteries have been investigated by Schröder et. al.using tomography, who determined that Zn conversion begins at the sep-arator and progresses away from this interface. In the process, it wasfound that the structural expansion ratio could be as high as 1.5 [72]. Byalso applying tomography, Arlt et. al. developed a custom battery cellfor Zn-air batteries and found that the pores of the air electrode wouldbe �ooded by the electrolyte as the anode expands, leading to early endof life [73]. Improving on the same technique, Franke-Lang et. al. foundit was bene�cial to decrease the Zn anode size, as in would let the an-ode accommodate the expansion during discharge. It was also suggested
51
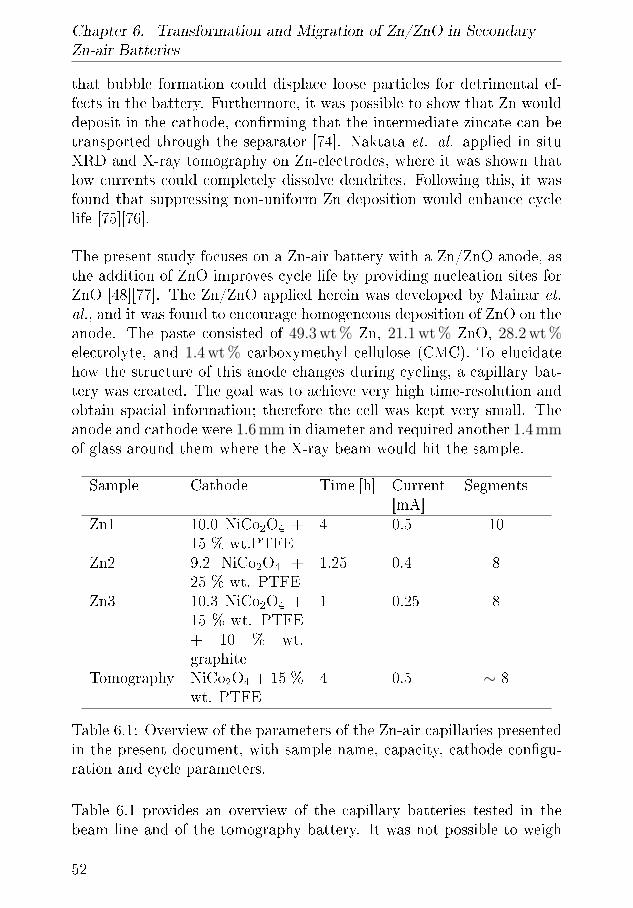
Chapter 6. Transformation and Migration of Zn/ZnO in SecondaryZn-air Batteries
that bubble formation could displace loose particles for detrimental ef-fects in the battery. Furthermore, it was possible to show that Zn woulddeposit in the cathode, con�rming that the intermediate zincate can betransported through the separator [74]. Naktata et. al. applied in situXRD and X-ray tomography on Zn-electrodes, where it was shown thatlow currents could completely dissolve dendrites. Following this, it wasfound that suppressing non-uniform Zn deposition would enhance cyclelife [75][76].
The present study focuses on a Zn-air battery with a Zn/ZnO anode, asthe addition of ZnO improves cycle life by providing nucleation sites forZnO [48][77]. The Zn/ZnO applied herein was developed by Mainar et.al., and it was found to encourage homogeneous deposition of ZnO on theanode. The paste consisted of 49.3 wt % Zn, 21.1 wt % ZnO, 28.2 wt %electrolyte, and 1.4 wt % carboxymethyl cellulose (CMC). To elucidatehow the structure of this anode changes during cycling, a capillary bat-tery was created. The goal was to achieve very high time-resolution andobtain spacial information; therefore the cell was kept very small. Theanode and cathode were 1.6 mm in diameter and required another 1.4 mmof glass around them where the X-ray beam would hit the sample.
Sample Cathode Time [h] Current[mA]
Segments
Zn1 10.0 NiCo2O4 +15 % wt.PTFE
4 0.5 10
Zn2 9.2 NiCo2O4 +25 % wt. PTFE
1.25 0.4 8
Zn3 10.3 NiCo2O4 +15 % wt. PTFE+ 10 % wt.graphite
1 0.25 8
Tomography NiCo2O4 + 15 %wt. PTFE
4 0.5 ∼ 8
Table 6.1: Overview of the parameters of the Zn-air capillaries presentedin the present document, with sample name, capacity, cathode con�gu-ration and cycle parameters.
Table 6.1 provides an overview of the capillary batteries tested in thebeam line and of the tomography battery. It was not possible to weigh
52
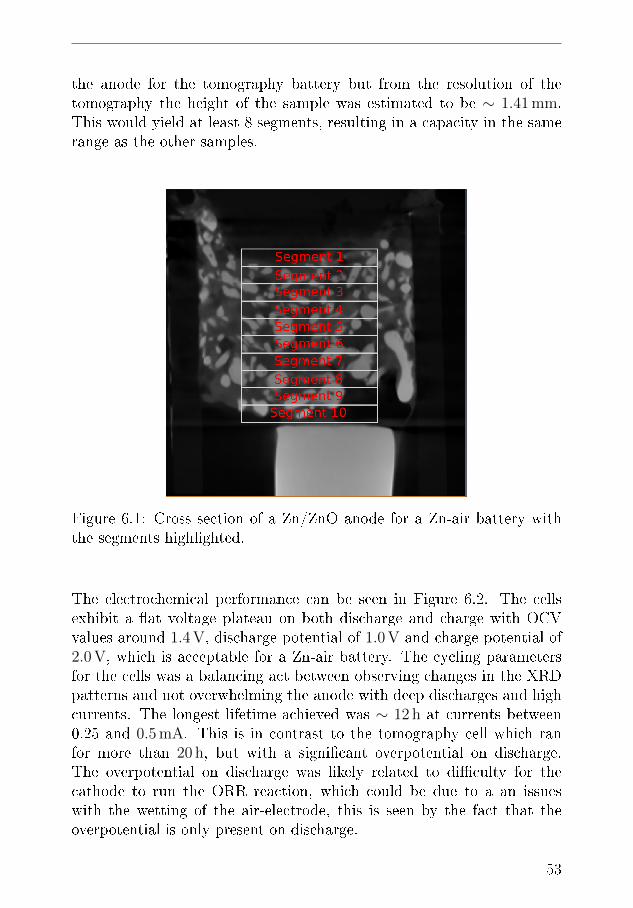
the anode for the tomography battery but from the resolution of thetomography the height of the sample was estimated to be ∼ 1.41 mm.This would yield at least 8 segments, resulting in a capacity in the samerange as the other samples.
Figure 6.1: Cross section of a Zn/ZnO anode for a Zn-air battery withthe segments highlighted.
The electrochemical performance can be seen in Figure 6.2. The cellsexhibit a �at voltage plateau on both discharge and charge with OCVvalues around 1.4 V, discharge potential of 1.0 V and charge potential of2.0 V, which is acceptable for a Zn-air battery. The cycling parametersfor the cells was a balancing act between observing changes in the XRDpatterns and not overwhelming the anode with deep discharges and highcurrents. The longest lifetime achieved was ∼ 12 h at currents between0.25 and 0.5 mA. This is in contrast to the tomography cell which ranfor more than 20 h, but with a signi�cant overpotential on discharge.The overpotential on discharge was likely related to di�culty for thecathode to run the ORR reaction, which could be due to a an issueswith the wetting of the air-electrode, this is seen by the fact that theoverpotential is only present on discharge.
53
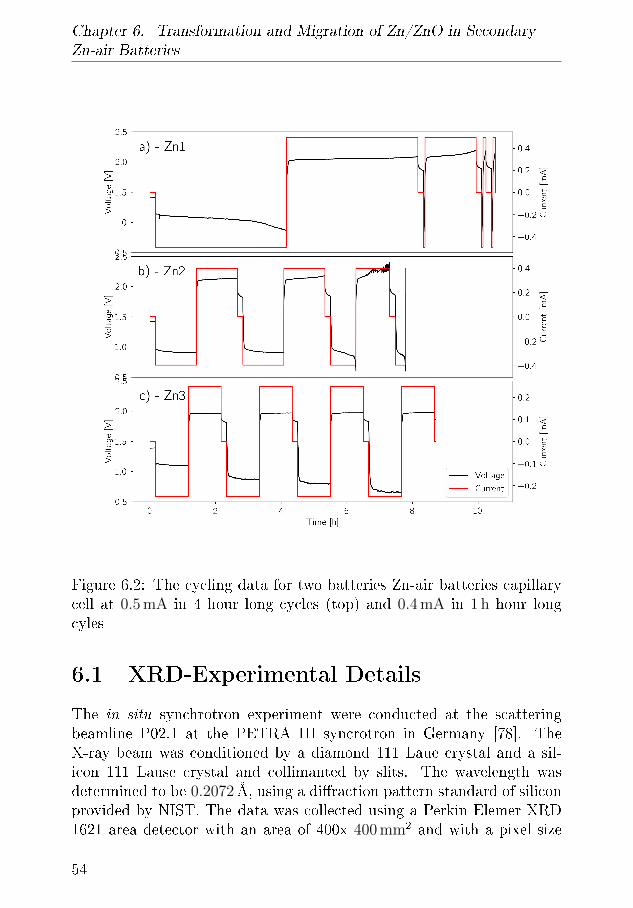
Chapter 6. Transformation and Migration of Zn/ZnO in SecondaryZn-air Batteries
Figure 6.2: The cycling data for two batteries Zn-air batteries capillarycell at 0.5 mA in 4 hour long cycles (top) and 0.4 mA in 1 h hour longcyles
6.1 XRD-Experimental Details
The in situ synchrotron experiment were conducted at the scatteringbeamline P02.1 at the PETRA III syncrotron in Germany [78]. TheX-ray beam was conditioned by a diamond 111 Laue crystal and a sil-icon 111 Lause crystal and collimanted by slits. The wavelength wasdetermined to be 0.2072Å, using a di�raction pattern standard of siliconprovided by NIST. The data was collected using a Perkin Elemer XRD1621 area detector with an area of 400x 400 mm2 and with a pixel size
54
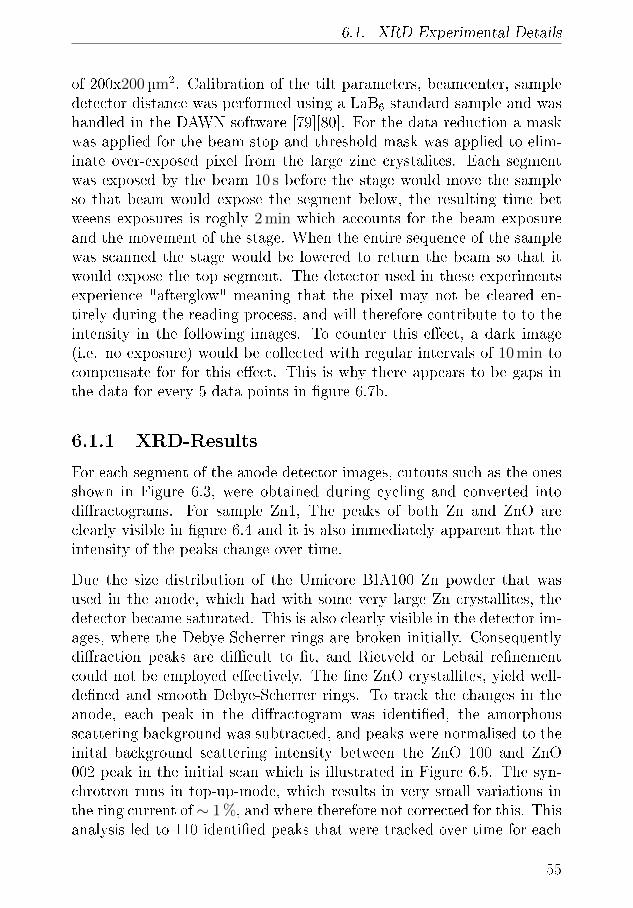
6.1. XRD-Experimental Details
of 200x200µm2. Calibration of the tilt parameters, beamcenter, sampledetector distance was performed using a LaB6 standard sample and washandled in the DAWN software [79][80]. For the data reduction a maskwas applied for the beam stop and threshold mask was applied to elim-inate over-exposed pixel from the large zinc crystalites. Each segmentwas exposed by the beam 10 s before the stage would move the sampleso that beam would expose the segment below, the resulting time betweens exposures is roghly 2 min which accounts for the beam exposureand the movement of the stage. When the entire sequence of the samplewas scanned the stage would be lowered to return the beam so that itwould expose the top segment. The detector used in these experimentsexperience "afterglow" meaning that the pixel may not be cleared en-tirely during the reading process, and will therefore contribute to to theintensity in the following images. To counter this e�ect, a dark image(i.e. no exposure) would be collected with regular intervals of 10 min tocompensate for for this e�ect. This is why there appears to be gaps inthe data for every 5 data points in �gure 6.7b.
6.1.1 XRD-Results
For each segment of the anode detector images, cutouts such as the onesshown in Figure 6.3, were obtained during cycling and converted intodi�ractograms. For sample Zn1, The peaks of both Zn and ZnO areclearly visible in �gure 6.4 and it is also immediately apparent that theintensity of the peaks change over time.
Due the size distribution of the Umicore BIA100 Zn powder that wasused in the anode, which had with some very large Zn crystallites, thedetector became saturated. This is also clearly visible in the detector im-ages, where the Debye-Scherrer rings are broken initially. Consequentlydi�raction peaks are di�cult to �t, and Rietveld or Lebail re�nementcould not be employed e�ectively. The �ne ZnO crystallites, yield well-de�ned and smooth Debye-Scherrer rings. To track the changes in theanode, each peak in the di�ractogram was identi�ed, the amorphousscattering background was subtracted, and peaks were normalised to theinital background scattering intensity between the ZnO 100 and ZnO002 peak in the initial scan which is illustrated in Figure 6.5. The syn-chrotron runs in top-up-mode, which results in very small variations inthe ring current of ∼ 1 %, and where therefore not corrected for this. Thisanalysis led to 110 identi�ed peaks that were tracked over time for each
55
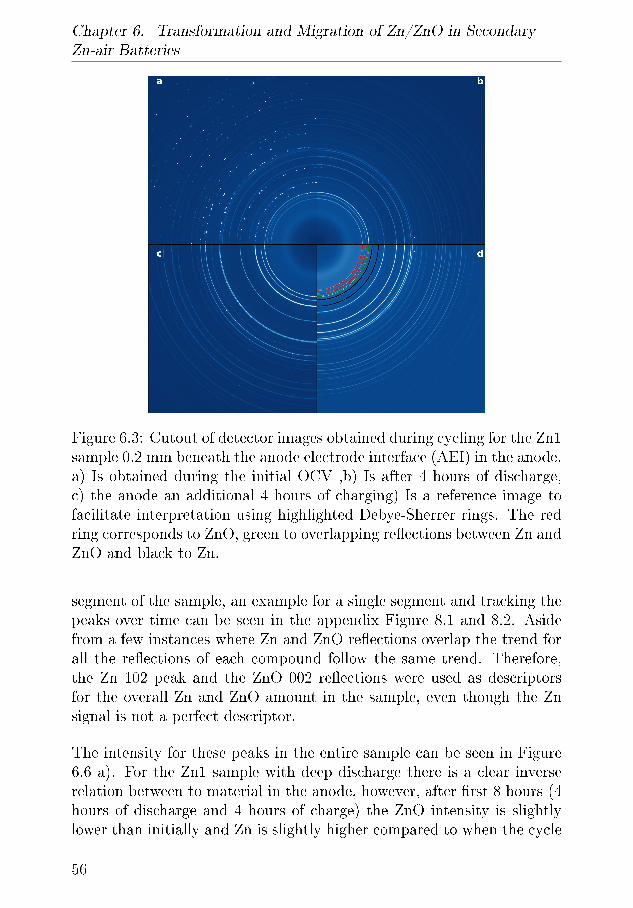
Chapter 6. Transformation and Migration of Zn/ZnO in SecondaryZn-air Batteries
Figure 6.3: Cutout of detector images obtained during cycling for the Zn1sample 0.2 mm beneath the anode electrode interface (AEI) in the anode.a) Is obtained during the initial OCV ,b) Is after 4 hours of discharge,c) the anode an additional 4 hours of charging) Is a reference image tofacilitate interpretation using highlighted Debye-Sherrer rings. The redring corresponds to ZnO, green to overlapping re�ections between Zn andZnO and black to Zn.
segment of the sample, an example for a single segment and tracking thepeaks over time can be seen in the appendix Figure 8.1 and 8.2. Asidefrom a few instances where Zn and ZnO re�ections overlap the trend forall the re�ections of each compound follow the same trend. Therefore,the Zn 102 peak and the ZnO 002 re�ections were used as descriptorsfor the overall Zn and ZnO amount in the sample, even though the Znsignal is not a perfect descriptor.
The intensity for these peaks in the entire sample can be seen in Figure6.6 a). For the Zn1 sample with deep discharge there is a clear inverserelation between to material in the anode, however, after �rst 8 hours (4hours of discharge and 4 hours of charge) the ZnO intensity is slightlylower than initially and Zn is slightly higher compared to when the cycle
56
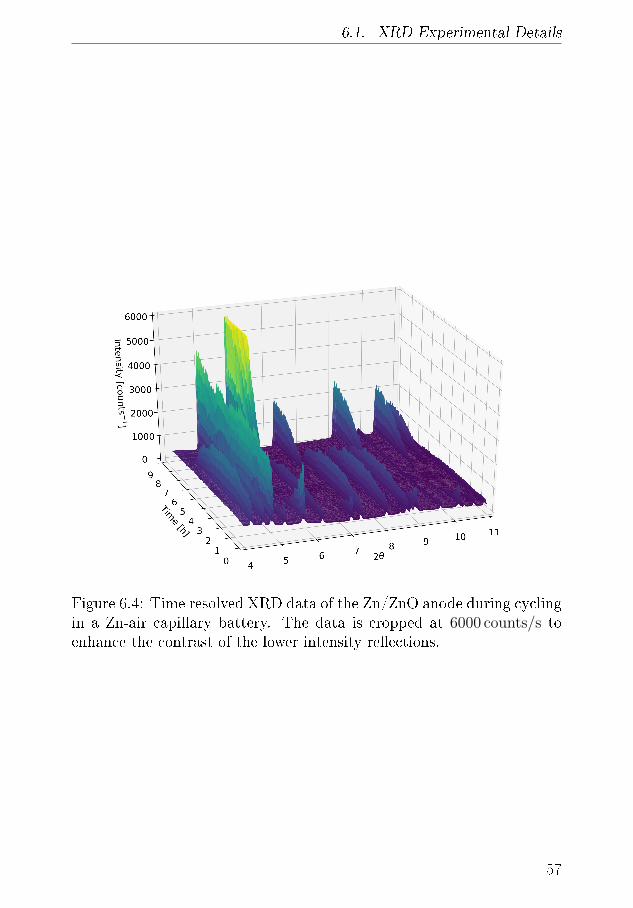
6.1. XRD-Experimental Details
Figure 6.4: Time resolved XRD data of the Zn/ZnO anode during cyclingin a Zn-air capillary battery. The data is cropped at 6000 counts/s toenhance the contrast of the lower intensity re�ections.
57
Chapter 6. Transformation and Migration of Zn/ZnO in SecondaryZn-air Batteries
Figure 6.5: Example of XRD data that show how a peak value wasbackground subtracted and the values to which they where normalised
started. After a brief attempt to discharge the cell, which was unsuccess-ful despite there being available Zn and ZnO nucleation sites, the chargeresumes. The increase in Zn signal continues until around the 10 h.
For the other sample in 6.6 b) where the discharge depth of dischargewas 1/4 of the �rst sample, the ZnO intensity increased during dischargebut decreased more during charge. After 6 hours the amount of ZnO theanode was reduced by half, with the remainder of the ZnO located in thebottom. Meaning that both samples experience an overall loss of ZnOin the anode. The Zn signal is seemingly constant which is likely due tothe error associated with the very large crystalites in the Zn powder.
To further understand the conversion and the change in Zn and ZnO,the segments were reviewed individually. The top segment containingthe anode-separator interface is shown in Figure 6.7a and 6.7b. Thethe top segments require special attention as the amount of materialis small due to curvature of the sample and di�culty with identifyingthe interface. Which makes it di�cult to get reliable conclusions. Theinitial intensities indicate that the amount of material in the interfaceis about 10 % of the segments below, which results in dramatic changesin the intensities. For the Zn1 sample, the Zn signal levels out aftertwo hours but does not deplete entirely, which could indicate that some
58
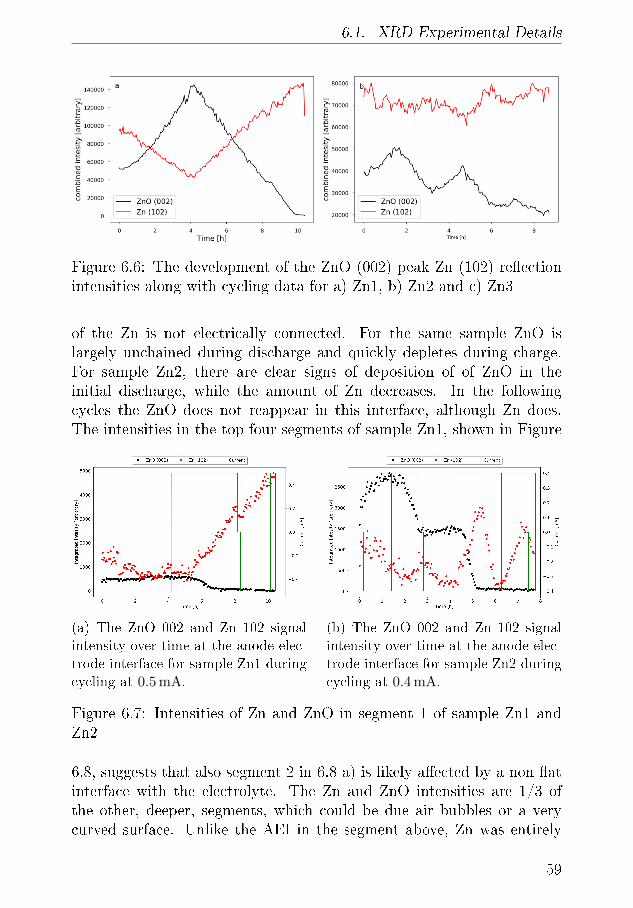
6.1. XRD-Experimental Details
Figure 6.6: The development of the ZnO (002) peak Zn (102) re�ectionintensities along with cycling data for a) Zn1, b) Zn2 and c) Zn3
of the Zn is not electrically connected. For the same sample ZnO islargely unchained during discharge and quickly depletes during charge.For sample Zn2, there are clear signs of deposition of of ZnO in theinitial discharge, while the amount of Zn decreases. In the followingcycles the ZnO does not reappear in this interface, although Zn does.The intensities in the top four segments of sample Zn1, shown in Figure
(a) The ZnO 002 and Zn 102 signal
intensity over time at the anode elec-
trode interface for sample Zn1 during
cycling at 0.5mA.
(b) The ZnO 002 and Zn 102 signal
intensity over time at the anode elec-
trode interface for sample Zn2 during
cycling at 0.4mA.
Figure 6.7: Intensities of Zn and ZnO in segment 1 of sample Zn1 andZn2
6.8, suggests that also segment 2 in 6.8 a) is likely a�ected by a non �atinterface with the electrolyte. The Zn and ZnO intensities are 1/3 ofthe other, deeper, segments, which could be due air bubbles or a verycurved surface. Unlike the AEI in the segment above, Zn was entirely
59
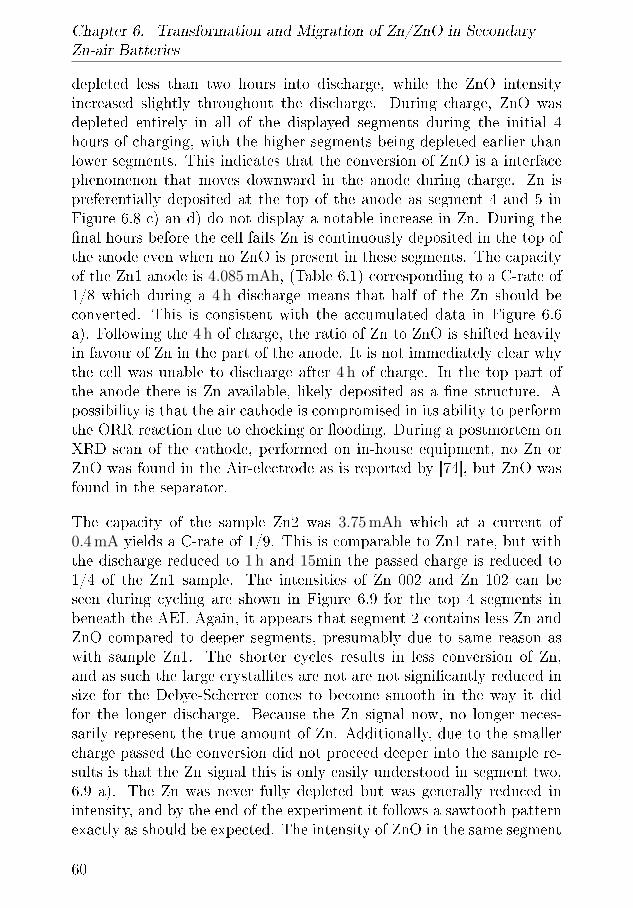
Chapter 6. Transformation and Migration of Zn/ZnO in SecondaryZn-air Batteries
depleted less than two hours into discharge, while the ZnO intensityincreased slightly throughout the discharge. During charge, ZnO wasdepleted entirely in all of the displayed segments during the initial 4hours of charging, with the higher segments being depleted earlier thanlower segments. This indicates that the conversion of ZnO is a interfacephenomenon that moves downward in the anode during charge. Zn ispreferentially deposited at the top of the anode as segment 4 and 5 inFigure 6.8 c) an d) do not display a notable increase in Zn. During the�nal hours before the cell fails Zn is continuously deposited in the top ofthe anode even when no ZnO is present in these segments. The capacityof the Zn1 anode is 4.085 mAh, (Table 6.1) corresponding to a C-rate of1/8 which during a 4 h discharge means that half of the Zn should beconverted. This is consistent with the accumulated data in Figure 6.6a). Following the 4 h of charge, the ratio of Zn to ZnO is shifted heavilyin favour of Zn in the part of the anode. It is not immediately clear whythe cell was unable to discharge after 4 h of charge. In the top part ofthe anode there is Zn available, likely deposited as a �ne structure. Apossibility is that the air cathode is compromised in its ability to performthe ORR reaction due to chocking or �ooding. During a postmortem onXRD scan of the cathode, performed on in-house equipment, no Zn orZnO was found in the Air-electrode as is reported by [74], but ZnO wasfound in the separator.
The capacity of the sample Zn2 was 3.75 mAh which at a current of0.4 mA yields a C-rate of 1/9. This is comparable to Zn1 rate, but withthe discharge reduced to 1 h and 15min the passed charge is reduced to1/4 of the Zn1 sample. The intensities of Zn 002 and Zn 102 can beseen during cycling are shown in Figure 6.9 for the top 4 segments inbeneath the AEI. Again, it appears that segment 2 contains less Zn andZnO compared to deeper segments, presumably due to same reason aswith sample Zn1. The shorter cycles results in less conversion of Zn,and as such the large crystallites are not are not signi�cantly reduced insize for the Debye-Scherrer cones to become smooth in the way it didfor the longer discharge. Because the Zn signal now, no longer neces-sarily represent the true amount of Zn. Additionally, due to the smallercharge passed the conversion did not proceed deeper into the sample re-sults is that the Zn signal this is only easily understood in segment two,6.9 a). The Zn was never fully depleted but was generally reduced inintensity, and by the end of the experiment it follows a sawtooth patternexactly as should be expected. The intensity of ZnO in the same segment
60
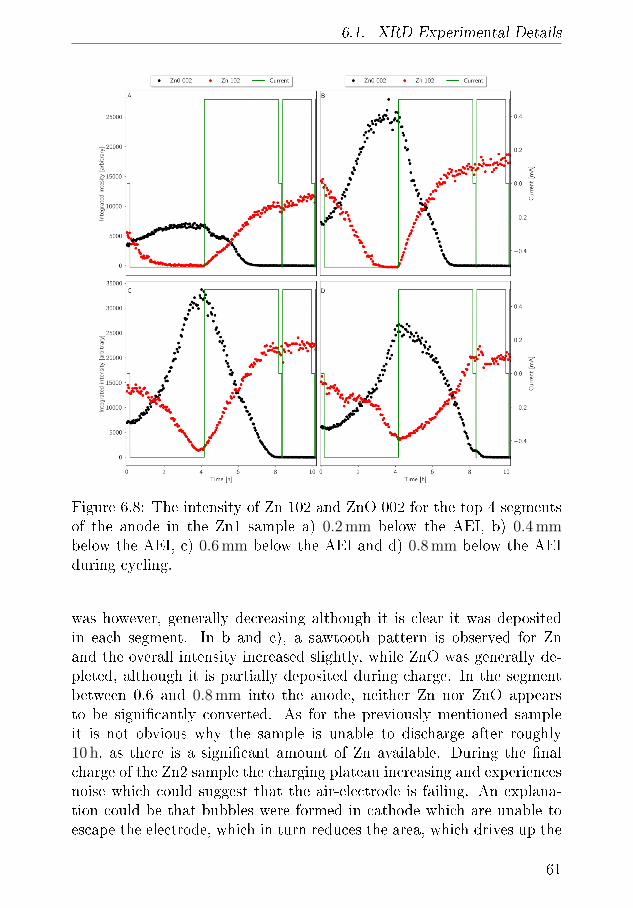
6.1. XRD-Experimental Details
Figure 6.8: The intensity of Zn 102 and ZnO 002 for the top 4 segmentsof the anode in the Zn1 sample a) 0.2 mm below the AEI, b) 0.4 mmbelow the AEI, c) 0.6 mm below the AEI and d) 0.8 mm below the AEIduring cycling.
was however, generally decreasing although it is clear it was depositedin each segment. In b and c), a sawtooth pattern is observed for Znand the overall intensity increased slightly, while ZnO was generally de-pleted, although it is partially deposited during charge. In the segmentbetween 0.6 and 0.8 mm into the anode, neither Zn nor ZnO appearsto be signi�cantly converted. As for the previously mentioned sampleit is not obvious why the sample is unable to discharge after roughly10 h, as there is a signi�cant amount of Zn available. During the �nalcharge of the Zn2 sample the charging plateau increasing and experiencesnoise which could suggest that the air-electrode is failing. An explana-tion could be that bubbles were formed in cathode which are unable toescape the electrode, which in turn reduces the area, which drives up the
61
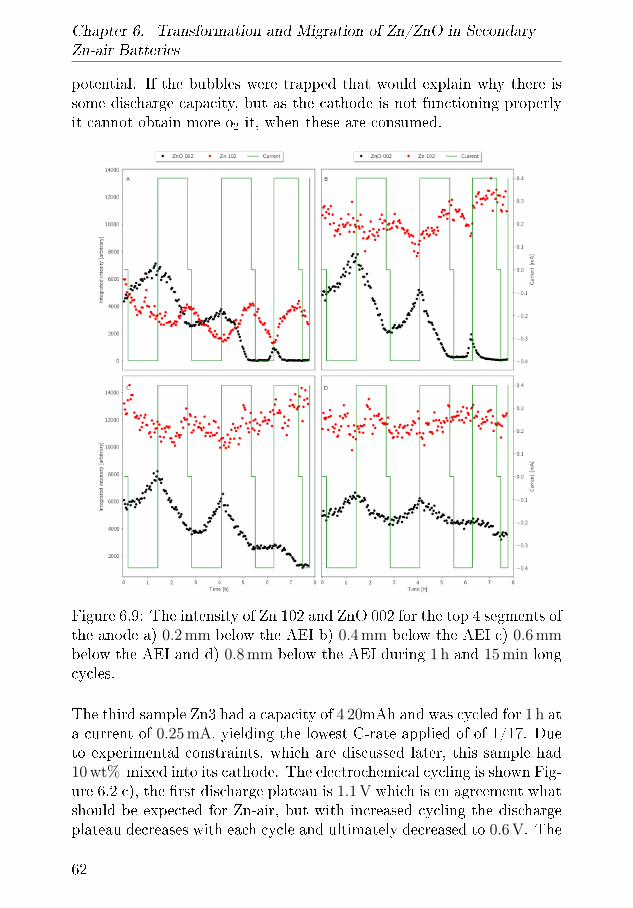
Chapter 6. Transformation and Migration of Zn/ZnO in SecondaryZn-air Batteries
potential. If the bubbles were trapped that would explain why there issome discharge capacity, but as the cathode is not functioning properlyit cannot obtain more o2 it, when these are consumed.
Figure 6.9: The intensity of Zn 102 and ZnO 002 for the top 4 segments ofthe anode a) 0.2 mm below the AEI b) 0.4 mm below the AEI c) 0.6 mmbelow the AEI and d) 0.8 mm below the AEI during 1 h and 15 min longcycles.
The third sample Zn3 had a capacity of 4 20mAh and was cycled for 1 h ata current of 0.25 mA, yielding the lowest C-rate applied of of 1/17. Dueto experimental constraints, which are discussed later, this sample had10 wt% mixed into its cathode. The electrochemical cycling is shown Fig-ure 6.2 c), the �rst discharge plateau is 1.1 V which is en agreement whatshould be expected for Zn-air, but with increased cycling the dischargeplateau decreases with each cycle and ultimately decreased to 0.6 V. The
62
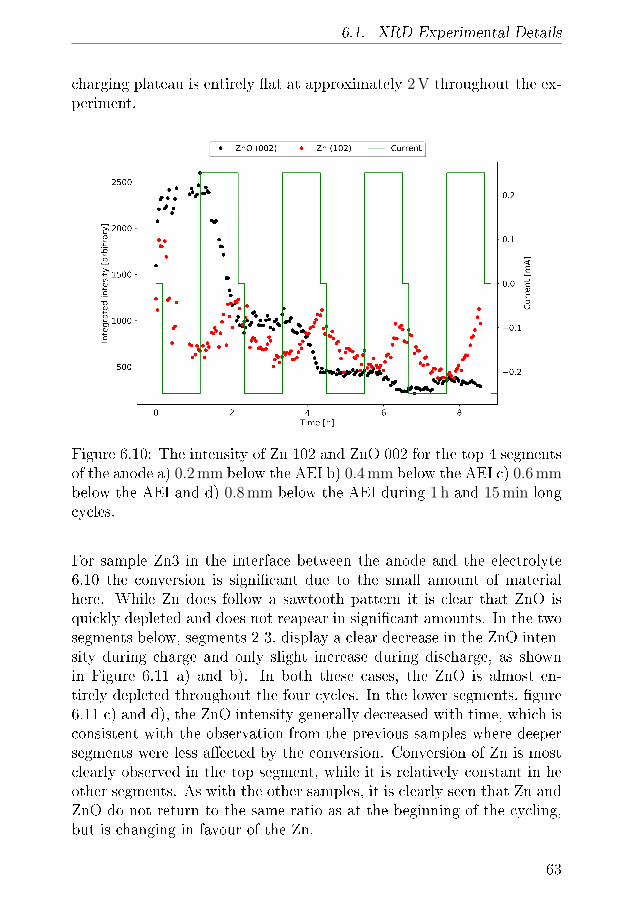
6.1. XRD-Experimental Details
charging plateau is entirely �at at approximately 2 V throughout the ex-periment.
Figure 6.10: The intensity of Zn 102 and ZnO 002 for the top 4 segmentsof the anode a) 0.2 mm below the AEI b) 0.4 mm below the AEI c) 0.6 mmbelow the AEI and d) 0.8 mm below the AEI during 1 h and 15 min longcycles.
For sample Zn3 in the interface between the anode and the electrolyte6.10 the conversion is signi�cant due to the small amount of materialhere. While Zn does follow a sawtooth pattern it is clear that ZnO isquickly depleted and does not reapear in signi�cant amounts. In the twosegments below, segments 2-3, display a clear decrease in the ZnO inten-sity during charge and only slight increase during discharge, as shownin Figure 6.11 a) and b). In both these cases, the ZnO is almost en-tirely depleted throughout the four cycles. In the lower segments, �gure6.11 c) and d), the ZnO intensity generally decreased with time, which isconsistent with the observation from the previous samples where deepersegments were less a�ected by the conversion. Conversion of Zn is mostclearly observed in the top segment, while it is relatively constant in heother segments. As with the other samples, it is clearly seen that Zn andZnO do not return to the same ratio as at the beginning of the cycling,but is changing in favour of the Zn.
63
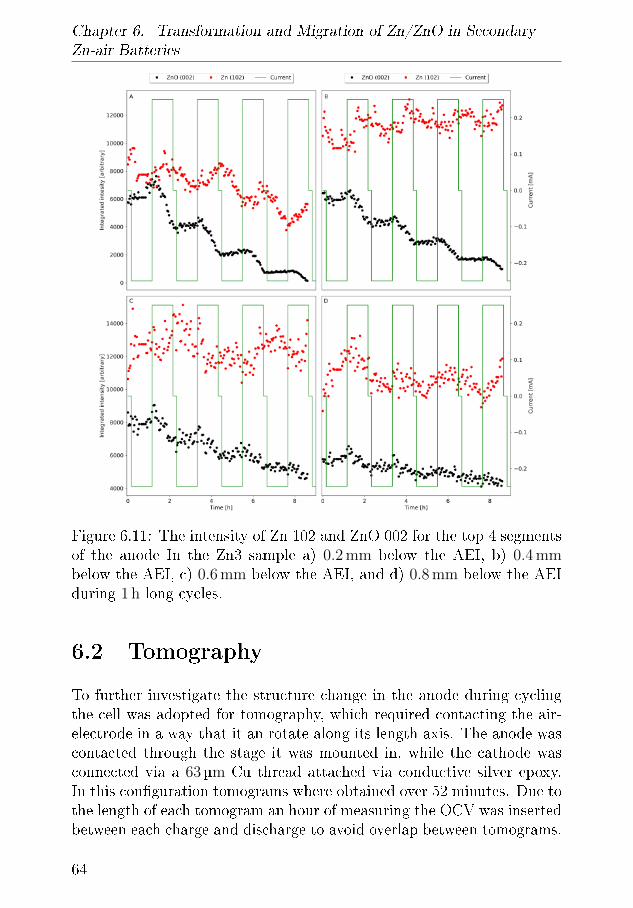
Chapter 6. Transformation and Migration of Zn/ZnO in SecondaryZn-air Batteries
Figure 6.11: The intensity of Zn 102 and ZnO 002 for the top 4 segmentsof the anode In the Zn3 sample a) 0.2 mm below the AEI, b) 0.4 mmbelow the AEI, c) 0.6 mm below the AEI, and d) 0.8 mm below the AEIduring 1 h long cycles.
6.2 Tomography
To further investigate the structure change in the anode during cyclingthe cell was adopted for tomography, which required contacting the air-electrode in a way that it an rotate along its length axis. The anode wascontacted through the stage it was mounted in, while the cathode wasconnected via a 63µm Cu thread attached via conductive silver epoxy.In this con�guration tomograms where obtained over 52 minutes. Due tothe length of each tomogram an hour of measuring the OCV was insertedbetween each charge and discharge to avoid overlap between tomograms.
64
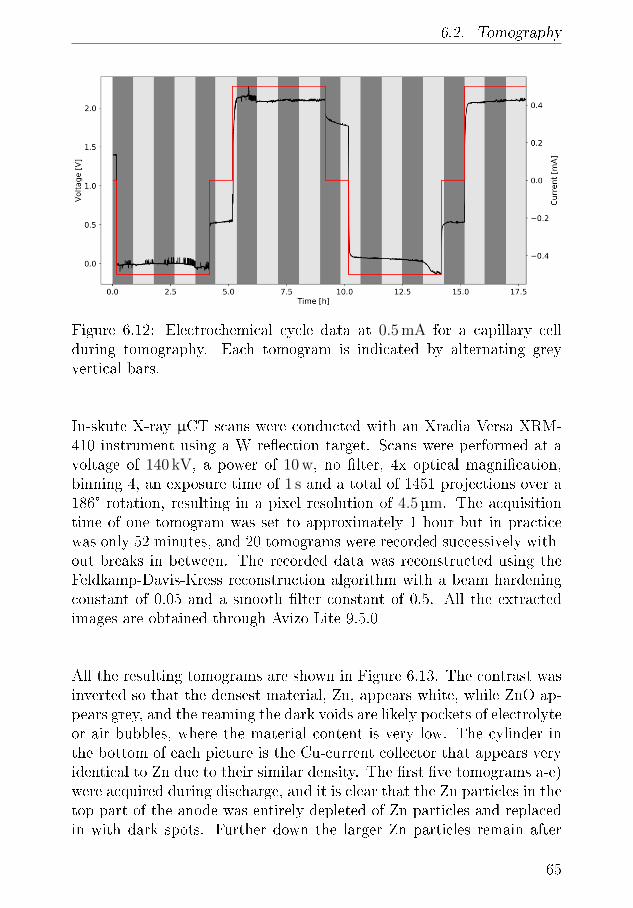
6.2. Tomography
Figure 6.12: Electrochemical cycle data at 0.5 mA for a capillary cellduring tomography. Each tomogram is indicated by alternating greyvertical bars.
In-skute X-ray µCT scans were conducted with an Xradia Versa XRM-410 instrument using a W re�ection target. Scans were performed at avoltage of 140 kV, a power of 10 w, no �lter, 4x optical magni�cation,binning 4, an exposure time of 1 s and a total of 1451 projections over a186° rotation, resulting in a pixel resolution of 4.5 µm. The acquisitiontime of one tomogram was set to approximately 1 hour but in practicewas only 52 minutes, and 20 tomograms were recorded successively with-out breaks in between. The recorded data was reconstructed using theFeldkamp-Davis-Kress reconstruction algorithm with a beam hardeningconstant of 0.05 and a smooth �lter constant of 0.5. All the extractedimages are obtained through Avizo Lite 9.5.0
All the resulting tomograms are shown in Figure 6.13. The contrast wasinverted so that the densest material, Zn, appears white, while ZnO ap-pears grey, and the reaming the dark voids are likely pockets of electrolyteor air bubbles, where the material content is very low. The cylinder inthe bottom of each picture is the Cu-current collector that appears veryidentical to Zn due to their similar density. The �rst �ve tomograms a-e)were acquired during discharge, and it is clear that the Zn particles in thetop part of the anode was entirely depleted of Zn particles and replacedin with dark spots. Further down the larger Zn particles remain after
65
Chapter 6. Transformation and Migration of Zn/ZnO in SecondaryZn-air Batteries
the discharge ends, but are severely reduced in size. Here the conversionof Zn does not result in hollow spots.
Once the charge started in Figure 6.13 g) Zn was deposited at the inter-face between the previously hollow anode, with a lower brightness. Znand ZnO are already close in density so if the Zn is deposited as �neparticles, as the XRD data suggest, and porous structures it will appearcloser to ZnO. Larger particles in the lower part of the anode only regrowslightly. Once the Second discharge starts in Figure 6.14 k) the entireanode starts to shrink as the entire top layer is depleted as Zn is con-verted, and no discernible redeposition of ZnO is observed. In the �nalthree cros s sections, during charge, Zn is once again deposited in the topof the anode. But the with now even less ZnO in the structure. Whilethe Zn does build up in the top of the anode it does not resemble theconventional depiction of dendrites as pointy elongated structures.
6.2.1 Discussion
The capillary batteries were assembled by hand, and therefore each cellwill exhibit di�erences to each other. These di�erences include the length,or total mass of the anode and air-electrode, homogeneity of anode andcathode, alignment of the glass capillaries, and alignment of current col-lectors and contact. Furthermore, the cathode is very fragile and needs tobe handled carefully when contacted. Finally, when assembling the cell,bubble formation needs to be avoided. Each cell was made from pre-fabricated cathode and anode assemblies, which only needed Zn/ZnO,electrolyte and separator to function. Each cell was assembled carefullyand was rejected if the anode or cathode were damaged in any way.Despite these di�culties, the results herein are believed to accuratelyrepresent the processes occurring in a Zn-air, such as in conventionalbutton cell, during discharge, or testing cells as seen in previous chaptersof this thesis.
The results are also comparable to results obtained from several capillarycells tested on in-house equipment during the development of the cell.The XRD results from the three capillary cells presented herein representa subset of 16 experiments that were conducted at the beam line, ofwhich more than half were cycled at di�erent currents, all supporting theconclusion is this section. The three experiments presented herein wereselected from the obtained electrochemical data with highest quality that
66
6.3. Summary of XRD and Tomography on Zn-air anodes
still support each other without using identical cycle parameters. Thethree experiments each employed a di�erent cathode mixture, which isdue to the fragile nature of the cathode, despite preparing more than 120cathodes (60 of which were NCO + 15 %wt PTFE) were prepared andinability to produce new cathode glass parts at the beamline.
Similarly for the tomography cell, with the addition of the Cu wire to thesample and Ni current collector, it is the author's opinion that the chem-istry is representative of the real electrochemistry and the data herein isa subset of 3 experiments that all support the conclusions herein, evenwith the relatively high overpotential during discharge. From these ob-servations, it is clear that a more robust cathode is a highly desiredimprovement for this cell architecture. This could likely be achieved byinvestigating di�erent mixtures and preparation procedures of the cata-lyst slurry to obtain a less brittle composition. Another approach couldbe to coat the inside of the capillary with a conductive �lm, preferablyNi, by means of physical vapour deposition. A cathode like this couldprovide longer cycle life, which could more accurately elucidate the fail-ure mode of the transformations seen in the experiments. This could alsoreduce the discharge overpotential observed in the tomography experi-ments to resemble the values observed in the other investigated cells. Afurther modi�cation of these experiments would be to use �ner and moreuniform Zn powder, which would provide accurate Zn signal throughoutthe experiments and smaller conversion rates.
6.3 Summary of XRD and Tomography on
Zn-air anodes
A functioning Zn-air capillary cell small enough for in situ character-isation using XRD and tomography was developed and employed. Bytracking the intensity of ZnO 002 and Zn 102 peaks, the conversion ofthese materials was tracked and resolved, even when the Zn peaks do notexactly represent the amount, due to detector saturation. It was foundthat the conversion of Zn initially occurs closest to the separator and pro-ceeds away from the this interface, in agreement with the �ndings of Arltet. al. [73]. During charge, the Zn was preferentially deposited closer tothe separator, and similarly to its counterpart, ZnO was also convertedclosest to the separator. ZnO did however not precipitate at the samerate as it was depleted, resulting in a di�erent Zn/ZnO ratio than the
67
Chapter 6. Transformation and Migration of Zn/ZnO in SecondaryZn-air Batteries
initial value, skewed toward Zn. This was revealed to be a consequenceof ZnO entirely disappearing from the top layers and being found in theseparator, as shown for experiments with a 50% DoD at C-rates of C1/8and 12.5% DoD at an almost similar C-rate of C1/9. Even so, depletionof the anode was not clearly shown to be the reason for the failure ofthese cells, which is suspected to originate from the anode, possible dueto �ooding or a loose connection resulting from the way the anode is�xated.
Using a similar cell, quasi in situ tomography data was obtained with atime resolution of 52 minutes and pixel resolution of 4.5 µm. This cellworked for more than 20 h, despite having a high overpotential duringdischarge, which was likely related to the air electrode. Using this cell,it was shown that the interface was converted �rst during discharge andthat Zn was preferentially deposited here, while ZnO was depleted overtime. While the Zn is deposited at the top of the anode, it does notappear as dendrites, but rather in larger particles that could be porous.
68
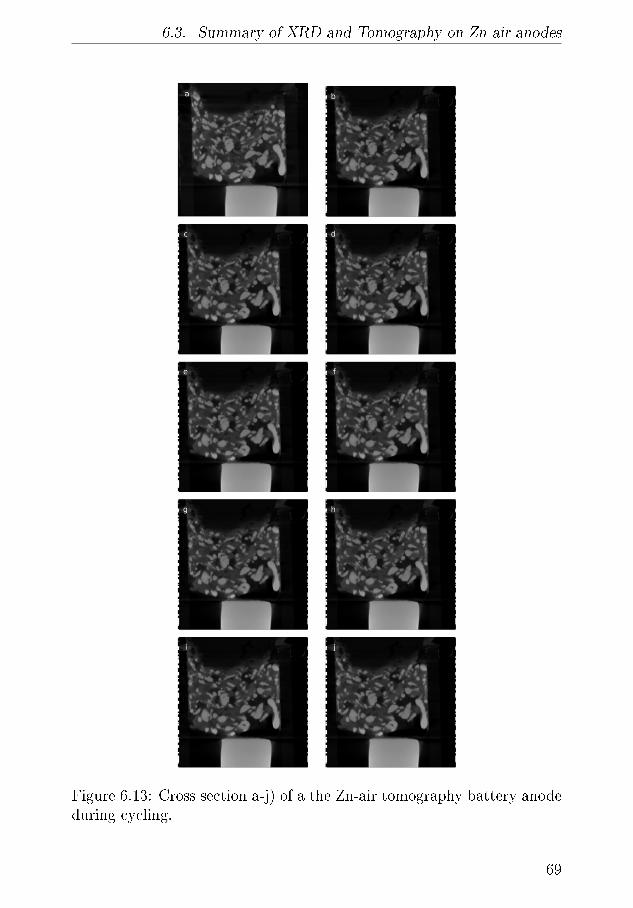
6.3. Summary of XRD and Tomography on Zn-air anodes
Figure 6.13: Cross section a-j) of a the Zn-air tomography battery anodeduring cycling.
69
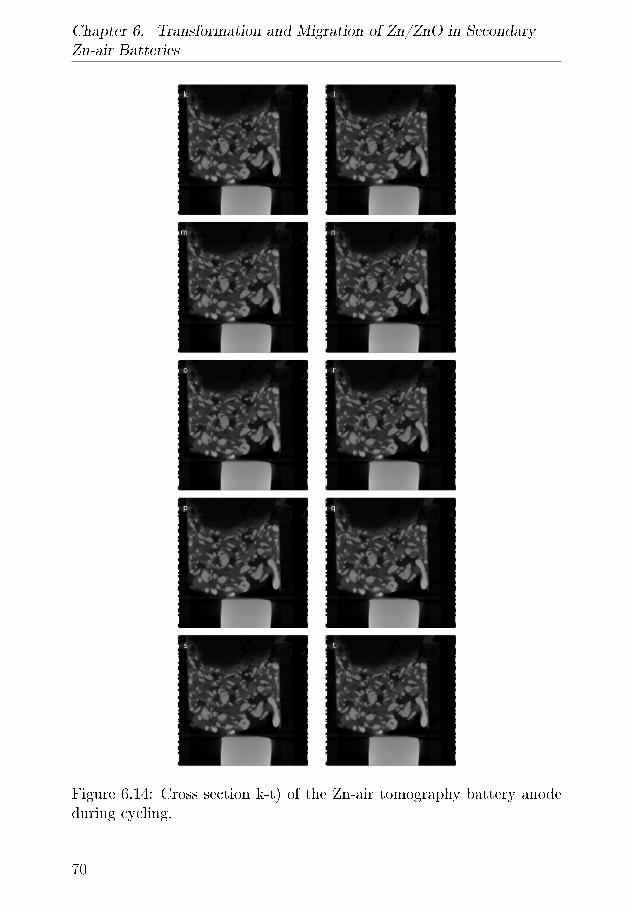
Chapter 6. Transformation and Migration of Zn/ZnO in SecondaryZn-air Batteries
Figure 6.14: Cross section k-t) of the Zn-air tomography battery anodeduring cycling.
70
Chapter 7
Conclusion and Outlook
7.1 Summary of the Main Results
The aim of this project was to investigate the operation of Zn-air batteriesusing in situ techniques and determine how the fundamental mechanismsof these batteries a�ect cycle life and performance.
Materials that are commonly found as current collectors were tested fordissolution within the potential window of a Zn-air battery. This studyshowed that Ti, Cu, W and Sn were suited for the anode current collector,but only two, Ni and Ti, would be suitable for the cathode. It wasdemonstrated that stainless steel would not be stable for neither theanode nor cathode current collector. It was found that, while successful,the in situ ICP-OES �ow cell setup needed improvement to gain betterresolution with lower noise.
In alkaline Zn-air batteries the conversion of Zn to ZnO occurs throughthe soluble intermediate zincate, Zn(OH)42� . During discharge, this in-termediate is free to di�use into the battery and deposit as ZnO in theseparator as the solubility limit of the intermediate is reached. An anodewill therefore over time preferentially deposit Zn in the interface betweenthe anode and the separator. Adding ZnO can alleviate this problemsomewhat, because it provides nucleation sites and saturates the solu-tion with zincate. Having developed a Zn-air capillary battery with suchan anode, and by using time and spatially resolved synchrotron XRD,it was proven that initially ZnO is indeed deposited in the anode. Dur-
71
Chapter 7. Conclusion and Outlook
ing charging, however, more ZnO was converted back to Zn than wasproduced during discharge, skewing the ratio in favour of Zn. Using thespatial resolution of this cell, it was shown that this e�ect was exacer-bated because the Zn/ZnO ratio would be skewed in favour of the Zncloser to the separator. This was con�rmed to be true for 3 DoDs andat two very di�erent C-rates. It was suggested that during long termcycling this e�ect would signi�cantly alter the structure of the anode.Which could compromise the battery performance.
Using the DEMS setup, a neutral, a slightly alkaline ZnCl2 and a highlyalkaline electrolyte with additives were investigated. It was found thatthe neutral and ZnCl2 electrolytes despite cycling did not evolve O2, theydid however develop signi�cant amounts of H2. A neutral electrolyte withvery high content of Li(TFSI) and Zn(TFSI)2 was investigated, and wasfound not to develop O2, likely due to intercalation of Li into the cath-ode. By applying the same technique for a Zn-air battery with an alkalineelectrolyte, the ne−/O2 ratio was determined, and it was found that ac-counting for the H2 evolution from the battery is essential to get accuratemeasurements. It was also suggested that using static measurements forH2 evolution will lose its e�cacy over time, likely due to changing areaduring cycling. Finally, an alkaline electrolyte with the additives KF andK2CO3 was found to reduce the severity of H2 evolution with a very idealne−/O2 ratio, once corrected for H2.
By applying DEMS on Zn-air batteries with dopants, the e�ect of dopantswas investigated and compared to DFT results. The experiments andDFT models demonstrated that In and Bi each a�ect the battery, withIn limiting hydrogen evolution while Bi would bene�t the battery byoptimising the potential characteristics. It was shown how these dopantsare useful in secondary Zn-air batteries, as they would be able to stay atthe surface during Zn-plating due to the materials favouring the kink sitesat the Zn surface. By co-doping Zn with both In and Bi, their bene�ciale�ect were compounded and led to consistently low H2 evolution. Itwas shown that Ag was detrimental to the battery, as it would amplifythe HER, and at the same time Ag would be buried during Zn platingbecause it favours higher coordinated sites. Finally, it was shown how acommercial Zn powder with these dopants, among others, had consistentlow H2 evolution.
72
7.2. Outlook
7.2 Outlook
To achieve fully rechargeable Zn-air batteries, self corrosion needs to beentirely mitigated. Not only does it interfere with the electrical e�ciencyof the battery, it also depletes the electrolyte, which increases the needfor water management in a system that already gives o� water. Betterunderstanding of the Zn surface by modeling and con�rmation by experi-mental techniques could help reduce this e�ect even further by suggestingnew additives, co-doping, optimal dosage and methods in which to applythem. Another option could be moving to more neutral electrolytes, witha system that has high ionic conductivity and low solubility of intermedi-ate species, which would increase ZnO precipitation. Additives to KOHwhich show promise need to be investigated for long term detrimentale�ects.
Another important feature is to develop an anode that allows deep dis-charges, while being able retain a structure that ensures homogeneousdeposition of Zn and ZnO. By developing tools such as the capillary cellseven further, it would be possible to investigate the changes in di�erentanode structures at high cycle numbers. This could be done throughdetermining a optimal way cycle Zn-air batteries to avoid inhomoge-nous deposition of Zn-air. Perhaps charging the battery slower or in apulsed produce to allow the internal concentration gradients time to evenout. Additionally, by improving this cell, the cathode and its long termdegradation could be investigated by tracking the wetting and oxida-tion/reduction cycle experienced air electrode, as seen with the NiCo2O4
and Ni cathode.
73
Bibliography
[1] IPCC. IPCC special report on the impacts of global warming of 1.5°C - Summary for policy makers. (October 2018), 2018.
[2] Thomas R. Anderson, Ed Hawkins, and Philip D. Jones. Co2, thegreenhouse e�ect and global warming: from the pioneering work ofarrhenius and callendar to today's earth system models. Endeavour,40(3):178 � 187, 2016.
[3] IEA Internation Energy Agency. Global energy & co2 status report.Technical report, IEA, 2017.
[4] Nathan S. Lewis and Daniel G. Nocera. Powering the planet: Chem-ical challenges in solar energy utilization. Proceedings of the NationalAcademy of Sciences, 103(43):15729�15735, 2006.
[5] IEA Internation Energy Agency. World energy outlook 2017. Tech-nical report, IEA, 2017.
[6] NREL. HAWAII SOLAR INTEGRATION STUDY : ExecutiveSummary.
[7] Energikommissiones anbefalninger til fremtiden energipolitik, 2017.
[8] Mathew Aneke and Meihong Wang. Energy storage technologiesand real life applications � a state of the art review. Applied Energy,179:350 � 377, 2016.
[9] Bruce Dunn, Haresh Kamath, and Jean-Marie Tarascon. Electri-cal energy storage for the grid: A battery of choices. Science,334(6058):928�935, 2011.
[10] Andrew Ulvestad. A Brief Review of Current Lithium Ion BatteryTechnology and Potential Solid State Battery Technologies. eprintArXiv, page https://arxiv.org/pdf/1803.04317.pdf, 2018.
74
Bibliography
[11] Thomas B. Reddy David Linden. Handbook of Batteries. McGraw-Hill, 2001.
[12] George E. Blomgren. The development and future of lithium ionbatteries. Journal of The Electrochemical Society, 164(1):A5019�A5025, 2017.
[13] IEA Internation Energy Agency. Electric and plug-in hybrid electricvehicles. Technical report, IEA, 2011.
[14] G W Heise. Aug. 29, 1933. 1933.
[15] G. Girishkumar, B. McCloskey, A. C. Luntz, S. Swanson, andW. Wilcke. Lithium-air battery: Promise and challenges. The Jour-nal of Physical Chemistry Letters, 1(14):2193�2203, 2010.
[16] Tejs Vegge, Juan Maria Garcia-Lastra, and Donald J. Siegel.Lithium�oxygen batteries: At a crossroads? Current Opinion inElectrochemistry, 6(1):100 � 107, 2017.
[17] Jake Christensen, Paul Albertus, Roel S. Sanchez-Carrera, TimmLohmann, Boris Kozinsky, Ralf Liedtke, Jasim Ahmed, and Alek-sandar Kojic. A critical review of li/air batteries. Journal of TheElectrochemical Society, 159(2):R1�R30, 2011.
[18] Kevin G. Gallagher, Steven Goebel, Thomas Greszler, Mark Math-ias, Wolfgang Oelerich, Damla Eroglu, and Venkat Srinivasan.Quantifying the promise of lithium�air batteries for electric vehi-cles. Energy Environ. Sci., 7:1555�1563, 2014.
[19] Yanguang Li and Jun Lu. Metal�air batteries: Will they be thefuture electrochemical energy storage device of choice? ACS EnergyLetters, 2(6):1370�1377, 2017.
[20] E. Davari and D. G. Ivey. Bifunctional electrocatalysts for zn�airbatteries. Sustainable Energy Fuels, 2:39�67, 2018.
[21] Peter C K Vesborg and Thomas F. Jaramillo. Addressing the ter-awatt challenge: Scalability in the supply of chemical elements forrenewable energy. RSC Advances, 2(21):7933�7947, 2012.
[22] Prabal Sapkota and Honggon Kim. Zinc�air fuel cell, a potentialcandidate for alternative energy. Journal of Industrial and Engi-neering Chemistry, 15(4):445 � 450, 2009.
75
Bibliography
[23] J. Hojberg, K. B. Knudsen, J. Hjelm, and T. Vegge. Reactions andSEI Formation during Charging of Li-O2 Cells. ECS Electrochem-istry Letters, 4(7):A63�A66, 2015.
[24] Jonathan Højberg, Tejs Vegge, Poul Norby, and Keld Johansen. Fun-damental mechanisms in li-air battery electrochemistry, 2015.
[25] B. D. McCloskey, D. S. Bethune, R. M. Shelby, G. Girishkumar, andA. C. Luntz. Solvents critical role in nonaqueous Lithium-Oxygenbattery electrochemistry. Journal of Physical Chemistry Letters,2(10):1161�1166, 2011.
[26] Noémie Elgrishi, Kelley J. Rountree, Brian D. McCarthy, Eric S.Rountree, Thomas T. Eisenhart, and Jillian L. Dempsey. A prac-tical beginner's guide to cyclic voltammetry. Journal of ChemicalEducation, 95(2):197�206, 2018.
[27] Stanley Bruckenstein and R. Rao Gadde. Use of a porous elec-trode for in situ mass spectrometric determination of volatile elec-trode reaction products. Journal of the American Chemical Society,93(3):793�794, 1971.
[28] O. Wolter and J. Heitbaum. Di�erential electrochemical mass spec-troscopy (dems) � a new method for the study of electrode pro-cesses. Berichte der Bunsengesellschaft für physikalische Chemie,88(1):2�6, 1984.
[29] ZAS consorstium. Zinc air secondary innovative nanotech based bat-teries for e�cient energy storage. Technical report, HORIZON2020,2015.
[30] Patrick Bonnick and J. R. Dahn. A simple coin cell design for testingrechargeable zinc-air or alkaline battery systems. Journal of TheElectrochemical Society, 159(7):A981�A989, 2012.
[31] Joseph F. Parker, Christopher N. Chervin, Irina R. Pala, MeinradMachler, Michael F. Burz, Je�rey W. Long, and Debra R. Rolison.Rechargeable nickel�3d zinc batteries: An energy-dense, safer alter-native to lithium-ion. Science, 356(6336):415�418, 2017.
[32] Ze Ma, Pucheng Pei, Keliang Wang, Xizhong Wang, Huachi Xu,Yongfeng Liu, and Guanlin peng. Degradation characteristics of aircathode in zinc air fuel cells. Journal of Power Sources, 274:56 � 64,2015.
76
Bibliography
[33] D. Kundu, B. D. Adams, V. Du�ort, S. H. Vajargah, and L. F.Nazar. A high-capacity and long-life aqueous rechargeable zincbattery using a metal oxide intercalation cathode. Nature Energy,1:16119, October 2016.
[34] Qingfang Shi, Louis J. Rendek, Wen-Bin Cai, and Daniel A. Scher-son. In situ raman spectroscopy of single particle microelectrodes:Zinc passivation in alkaline electrolytes. Electrochemical and Solid-State Letters, 6(11):E35�E39, 2003.
[35] Qingfang Shi, Louis J. Rendek, Wen-Bin Cai, and Daniel A. Scher-son. Avoiding short circuits from zinc metal dendrites in anode bybackside-plating con�guration. 7(11801), 2016.
[36] Zhao Yan, Erdong Wang, Luhua Jiang, and Gongquan Sun. Superiorcycling stability and high rate capability of three-dimensional zn/cufoam electrodes for zinc-based alkaline batteries. RSC Adv., 5:83781�83787, 2015.
[37] D. C. W. Kannangara and B. E. Conway. Zinc oxidation and rede-position processes in aqueous alkali and carbonate solutions: I . phand carbonate ion e�ects in �lm formation and dissolution. Journalof The Electrochemical Society, 134(4):894�906, 1987.
[38] K. Ogle and S. Weber. Anodic dissolution of 304 stainless steelusing atomic emission spectroelectrochemistry. Journal of the Elec-trochemical Society, 147(5):1770�1780, 2000. cited By 71.
[39] K. Ogle, J. Baeyens, J. Swiatowska, and P. Volovitch. Atomic emis-sion spectroelectrochemistry applied to dealloying phenomena: I.the formation and dissolution of residual copper �lms on stainlesssteel. Electrochimica Acta, 54(22):5163 � 5170, 2009. ELECTRO-CHEMISTRY DOWN TO THE MOLECULAR LEVEL INTER-FACIAL SCIENCE FOR LIFE AND TECHNOLOGY Selection ofpapers from the 59th Annual Meetingof the International Society ofElectrochemistry7-12 September 2008, Seville, Spain.
[40] B. Miller. Split-ring disk study of the anodic processes at a cop-per electrode in alkaline solution. Journal of The ElectrochemicalSociety, 116(12):1675�1680, 1969.
77
Bibliography
[41] Chong-Hong Pyun and Su-Moon Park. In situ spectroelectrochemi-cal studies on anodic oxidation of copper in alkaline solution. Journalof The Electrochemical Society, 133(10):2024�2030, 1986.
[42] T. Tuvi¢, I. Pa²ti, and S. Mentus. Tungsten electrochemistry in al-kaline solutions�anodic dissolution and oxygen reduction reaction.Russian Journal of Physical Chemistry A, 85(13):2399�2405, Dec2011.
[43] G. Stephen Kelsey. The anodic oxidation of tungsten in aqueousbase. Journal of The Electrochemical Society, 124(6):814�819, 1977.
[44] D. Kwa±niewski and M. Grde«. Electrochemical behaviour of tinin alkaline electrolyte. Electrochemistry Communications, 61:125 �128, 2015.
[45] Jianqiang Kang, Yifu Yang, Fengshan Jiang, and Huixia Shao.Study on the anodic reaction of ni in an alkaline solution by transientph detection based on scanning electrochemical microscopy (secm).Surface and Interface Analysis, 39(11):877�884.
[46] Anna K. Schuppert, Angel A. Topalov, Ioannis Katsounaros, Se-bastian O. Klemm, and Karl J. J. Mayrhofer. A scanning �ow cellsystem for fully automated screening of electrocatalyst materials.Journal of The Electrochemical Society, 159(11):F670�F675, 2012.
[47] Yanguang Li and Hongjie Dai. Recent advances in Zinc-air batteries.Chemical Society Reviews, 43(15):5257�5275, 2014.
[48] Johannes Stamm, Alberto Varzi, Arnulf Latz, and BirgerHorstmann. Modeling nucleation and growth of zinc oxide duringdischarge of primary zinc-air batteries. Journal of Power Sources,360:136�149, 2017.
[49] Daniel Schröder, Neeraj Nitin Sinai Borker, Michael König, and Ul-rike Krewer. Performance of zinc air batteries with addedk2co3in thealkaline electrolyte. Journal of Applied Electrochemistry, 45(5):427�437, May 2015.
[50] Lars Kucka, Eugeny Y. Kenig, and Andrzej Górak. Kinetics of thegas-liquid reaction between carbon dioxide and hydroxide ions. In-dustrial & Engineering Chemistry Research, 41(24):5952�5957, 2002.
78
Bibliography
[51] T. C. Adler, F. R. McLarnon, and E. J. Cairns. Investiga-tions of a new family of alkaline-�uoride-carbonate electrolytes forzinc/nickel oxide cells. Industrial & Engineering Chemistry Re-search, 37(8):3237�3241, 1998.
[52] Fei Wang, Oleg Borodin, Tao Gao, Xiulin Fan, Wei Sun, FudongHan, Antonio Faraone, Joseph A. Dura, Kang Xu, and ChunshengWang. Highly reversible zinc metal anode for aqueous batteries.Nature Materials, 17(6):543�549, 2018.
[53] Afriyanti Sumboja, Xiaoming Ge, Guangyuan Zheng, F. W.ThomasGoh, T. S.Andy Hor, Yun Zong, and Zhaolin Liu. Durable recharge-able zinc-air batteries with neutral electrolyte and manganese oxidecatalyst. Journal of Power Sources, 332:330�336, 2016.
[54] F. W. Thomas Goh, Z. Liu, T. S. A. Hor, J. Zhang, X. Ge, Y. Zong,A. Yu, and W. Khoo. A Near-Neutral Chloride Electrolyte for Elec-trically Rechargeable Zinc-Air Batteries. Journal of the Electrochem-ical Society, 161(14):A2080�A2086, 2014.
[55] Simon Clark, Arnulf Latz, and Birger Horstmann. Rational De-velopment of Neutral Aqueous Electrolytes for Zinc�Air Batteries.ChemSusChem, 10(23):4735�4747, 2017.
[56] Fei Wang, Oleg Borodin, Tao Gao, Xiulin Fan, Wei Sun, FudongHan, Antonio Faraone, Joseph A. Dura, Kang Xu, and ChunshengWang. Highly reversible zinc metal anode for aqueous batteries.Nature Materials, 17(6):543�549, 2018.
[57] L M BAUGH, F L TYE, and N C WHITE. Corrosion and Polar-ization Characteristics of Zinc in Battery Electrolyte Analogs andthe E�ect of Amalgamation. Journal of Applied Electrochemistry,13(5):623�635, 1983.
[58] Marcel L. Meeus IvanA. J. Strauven. Horst-udo dipl ing josegerddipl chem jung (varta batterie ag), 1989.
[59] Marcel L. Meeus (Union Miniere) IvanA. J. Strauven. Zn-powderfor alkaline batteries, 1994.
[60] J. Dutkiewicz and W. Zakulski. The in-zn (indium-zinc) system.Bulletin of Alloy Phase Diagrams, 5(3):284�289, Jun 1984.
79
Bibliography
[61] A. G. Muoz, S. B. Saidman, and J. B. Bessone. In�uence of In onthe corrosion of Zn-In alloys. Corrosion Science, 43(7):1245�1265,2001.
[62] Chang Woo Lee, K. Sathiyanarayanan, Seung Wook Eom, andMun Soo Yun. Novel alloys to improve the electrochemical behav-ior of zinc anodes for zinc/air battery. Journal of Power Sources,160(2):1436 � 1441, 2006. Special issue including selected paperspresented at the International Workshop on Molten Carbonate FuelCells and Related Science and Technology 2005 together with regu-lar papers.
[63] Jiri Vizdal, Maria Helena Braga, Ales Kroupa, Klaus W. Richter,Del�m Soares, Luís Filipe Malheiros, and Jorge Ferreira. Thermo-dynamic assessment of the bi�sn�zn system. Calphad, 31(4):438 �448, 2007.
[64] Roger Shepard (Gillette) Lifun Lin. Zinc/air cell, 2001.
[65] Yichun Wang Joseph E. Sunstrom In Tae Bae (Gillette)Cahit Eylem, Paul A. Christian. Primary alkaline battery containingbismuth metal oxide, 2008.
[66] M. Y. Chiu, S. S. Wang, and T. H. Chuang. Intermetallic compoundsformed during interfacial reactions between liquid sn-8zn-3bi soldersand ni substrates. Journal of Electronic Materials, 31(5):494�499,May 2002.
[67] J. McBreen and E. Gannon. Bismuth oxide as an additive in pastedzinc electrodes. Journal of Power Sources, 15(2):169 � 177, 1985.
[68] C. Zhang, J.M. Wang, L. Zhang, J.Q. Zhang, and C.N. Cao. Study ofthe performance of secondary alkaline pasted zinc electrodes. Jour-nal of Applied Electrochemistry, 31(9):1049�1054, Sep 2001.
[69] Samira Siahrostami, Vladimir Tripkovi¢, Keld T. Lundgaard, Kris-tian E. Jensen, Heine A. Hansen, Jens S. Hummelshøj, Jón S.G.Mýrdal, Tejs Vegge, Jens K. Nørskov, and Jan Rossmeisl. Firstprinciples investigation of zinc-anode dissolution in zinc-air batter-ies. Physical Chemistry Chemical Physics, 15(17):6416�6421, 2013.
[70] Dennis Wittmaier, Natalia A. Cañas, Indro Biswas, and Kaspar An-dreas Friedrich. Highly stable carbon-free ag/co3o4-cathodes for
80
Bibliography
lithium-air batteries: Electrochemical and structural investigations.Advanced Energy Materials, 5(19):1500763.
[71] Quinn C. Horn and Yang Shao-Horn. Morphology and Spatial Dis-tribution of ZnO Formed in Discharged Alkaline Zn/MnO[sub 2] AACells. Journal of The Electrochemical Society, 150(5):A652, 2003.
[72] Daniel Schröder, Tobias Arlt, Ulrike Krewer, and Ingo Manke. An-alyzing transport paths in the air electrode of a zinc air batteryusing X-ray tomography. Electrochemistry Communications, 40:88�91, 2014.
[73] Tobias Arlt, Daniel Schröder, Ulrike Krewer, and Ingo Manke. Inoperando monitoring of the state of charge and species distributionin zinc air batteries using X-ray tomography and model-based simu-lations. Physical Chemistry Chemical Physics, 16(40):22273�22280,2014.
[74] Robert Franke-Lang, Tobias Arlt, Ingo Manke, and Julia Kowal. X-ray tomography as a powerful method for zinc-air battery research.Journal of Power Sources, 370:45�51, 2017.
[75] Akiyoshi Nakata, Haruno Murayama, Katsutoshi Fukuda,Tomokazu Yamane, Hajime Arai, Toshiro Hirai, YoshiharuUchimoto, Jun Ichi Yamaki, and Zempachi Ogumi. Transforma-tion of leaf-like zinc dendrite in oxidation and reduction cycle.Electrochimica Acta, 166:82�87, 2015.
[76] Akiyoshi Nakata, Hajime Arai, Haruno Murayama, KatsutoshiFukuda, Tomokazu Yamane, Toshiro Hirai, Yoshiharu Uchimoto,Jun Ichi Yamaki, and Zempachi Ogumi. In situ Zn/ZnO mappingelucidating for "shape change" of zinc electrode. APL Materials,6(4), 2018.
[77] Aroa R Mainar, Elena Iruin, and Luis C Colmenares. Systematiccycle life assessment of a secondary zinc - air battery as a functionof the alkaline electrolyte composition Keywords.
[78] Ann-Christin Dippel, Hanns-Peter Liermann, Jan Torben Delitz,Peter Walter, Horst Schulte-Schrepping, Oliver H. Seeck, and Her-mann Franz. Beamline P02.1 at PETRA III for high-resolution andhigh-energy powder di�raction. Journal of Synchrotron Radiation,22(3):675�687, May 2015.
81

Bibliography
[79] Mark Basham, Jacob Filik, Michael T. Wharmby, Peter C.Y. Chang,Baha El Kassaby, Matthew Gerring, Jun Aishima, Karl Levik,Bill C.A. Pulford, Irakli Sikharulidze, Duncan Sneddon, MatthewWebber, Sarnjeet S. Dhesi, Francesco Maccherozzi, Olof Svensson,Sandor Brockhauser, Gabor Náray, and Alun W. Ashton. DataAnalysis WorkbeNch (DAWN). Journal of Synchrotron Radiation,22:853�858, 2015.
[80] J. Filik, A. W. Ashton, P. C.Y. Chang, P. A. Chater, S. J. Day,M. Drakopoulos, M. W. Gerring, M. L. Hart, O. V. Magdysyuk,S. Michalik, A. Smith, C. C. Tang, N. J. Terrill, M. T. Wharmby,and H. Wilhelm. Processing two-dimensional X-ray di�raction andsmall-angle scattering data in DAWN 2. Journal of Applied Crys-tallography, 50(3):959�966, 2017.
82

Chapter 8
Appendix
8.1 Calibration of the Mass Spectrometer
In the present document we relay heavily on the quantitative measure-ment by the mass spectrometer that is employed in the DEMS. Thisequipment requires careful calibration using calibration gasses with knowquantities. A mixture of 5 % O2 and 5% CO2 in 90 % Ar was used forthis purpose. The process is well described by ref[24], and the intent ofhere is just to add this procedure and explain some of the underlyingassumptions. Mass spectrometers are very sensitive towards changes inoperation and it is recommended that they are always left on when notin use. Even so they cannot be expected to maintain constant sensitivity.For instance over a period of two months where the mass spectrometerwas not being used the correction factor for O2 drifted by 0.133. There-fore it is recommend to calibrate mass spectrometers as often as possible.In this document this process has been entirely hidden from the reader,but was performed about once per month or if the mass spec underwentpower cycling due to maintenance or power cuts.
8.2 XRD - appendix
83
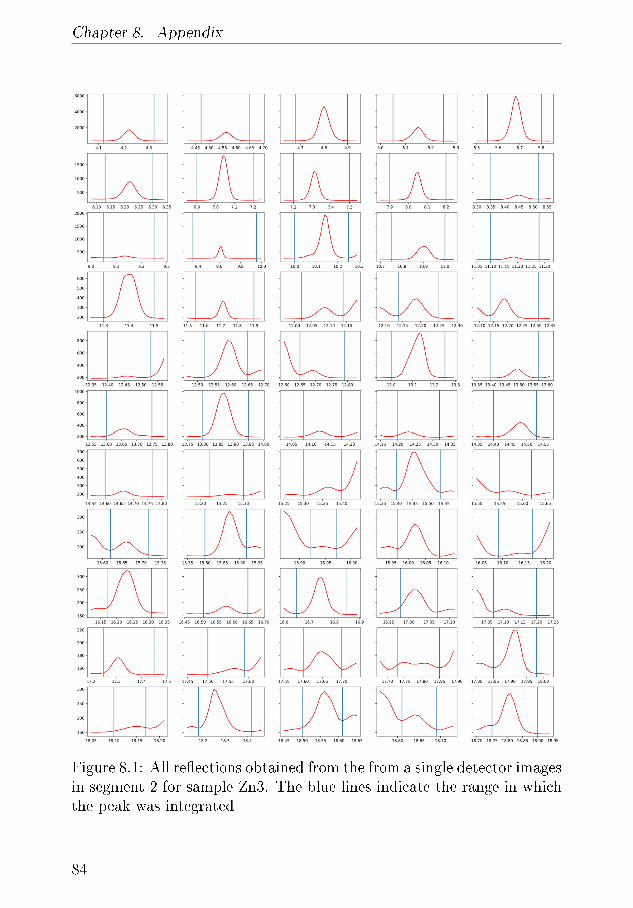
Chapter 8. Appendix
Figure 8.1: All re�ections obtained from the from a single detector imagesin segment 2 for sample Zn3. The blue lines indicate the range in whichthe peak was integrated
84
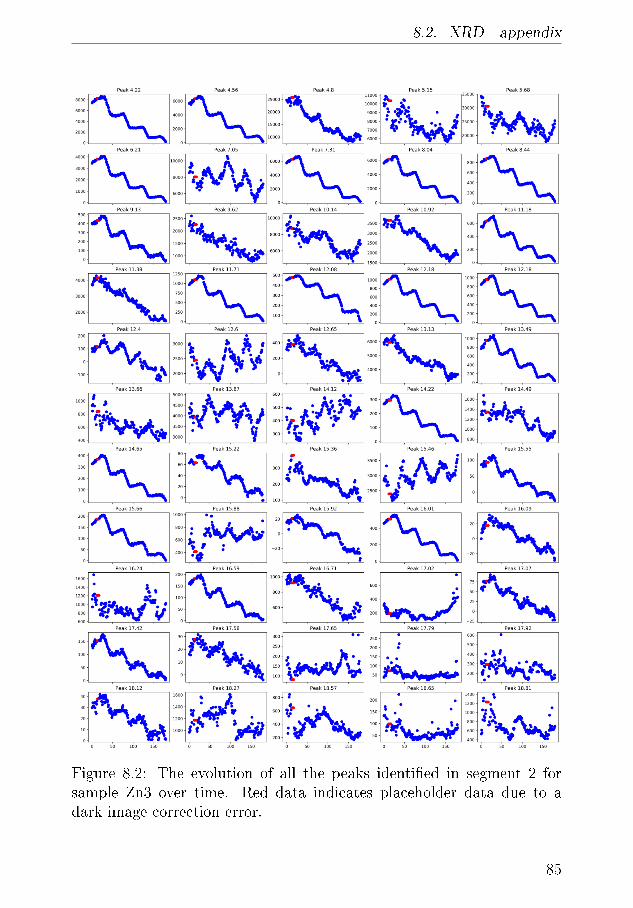
8.2. XRD - appendix
Figure 8.2: The evolution of all the peaks identi�ed in segment 2 forsample Zn3 over time. Red data indicates placeholder data due to adark image correction error.
85

Paper I
86
Combined DFT and Differential Electrochemical MassSpectrometry Investigation of the Effect of Dopants inSecondary Zinc–Air BatteriesSteen Lysgaard,* Mathias K. Christensen, Heine A. Hansen, Juan Maria Garc&a Lastra,Poul Norby, and Tejs Vegge*[a]
Introduction
Today’s challenge of transforming society from fossil fuel-based into one that is based on renewable energy requires the
advent of more efficient and reliable energy storage media,both for transportation and to balance fluctuating clean
energy sources such as wind and solar power. To this end, mul-tiple technologies are currently under consideration, and sec-
ondary batteries are currently receiving a large amount of at-
tention, primarily because of the widely successful Li-ion bat-tery.[1] For large-scale storage, other battery types such asredox flow and metal–air batteries also hold promise.[2–4]
The commercially most successful metal–air battery is the
primary Zn–air battery, widely used for small appliances thatrequire a small amount of power for longer durations such as
hearing aids. Zn–air batteries are attractive alternatives owing
to the benign chemistry and high theoretical specific energy of1086 Wh kg@1, much higher than that of Li-ion batteries and
only rivalled by few other chemistries such as Li–air,[5–8] Thetheoretical specific energy includes only the weight of Zn and
the theoretical voltage. For practical purposes, the specificenergy attainable in a typical Zn–air hearing-aid battery is cur-rently 350–500 Wh kg@1,[9] which is approximately double of
what is currently possible with Li-ion technology. For a secon-dary Zn–air battery the specific energy is lower because of re-strictions with regard to the level of charge and discharge ofthe Zn electrode.[10] Rechargeable Zn–air batteries are especial-
ly promising for stationary storage of electricity because of itsabundance in the earth crust and availability of Zn.[11]
In an alkaline Zn–air battery, reduction of oxygen to hydrox-
yl takes place at the cathode during discharge. The hydroxylions in the electrolyte then participate in the main reactions
on the negative Zn electrode, which are:
Znþ 4 OH@ Ð ZnðOHÞ þ 3 OH@ þ e@ Ð ZnðOHÞ2 þ 2 OH@ þ 2 e@
ð1ÞZnðOHÞ2 þ 2 OH@þ2 e@ Ð ½ZnðOHÞ3A@ þ OH@ þ 2 e@
Ð ½ZnðOHÞ4A2@ þ 2 e@ð2Þ
The first two OH adsorption steps [Eq. (1)] are the electro-
chemical formation of zinc hydroxide (Zn(OH)2), whereas thelast two steps [Eq. (2)] are the chemical formation of zincate
Zinc–air batteries offer the potential of low-cost energy storagewith high specific energy, but at present secondary Zn–air bat-teries suffer from poor cyclability. To develop economically
viable secondary Zn–air batteries, several properties need tobe improved: choking of the cathode, catalyzing the oxygenevolution and reduction reactions, limiting dendrite formationand suppressing the hydrogen evolution reaction (HER). Un-derstanding and alleviating HER at the negative electrode in asecondary Zn–air battery is a substantial challenge, for which it
is necessary to combine computational and experimental re-search. Here, we combine differential electrochemical massspectrometry (DEMS) and density functional theory (DFT) cal-culations to investigate the fundamental role and stabilitywhen cycling in the presence of selected beneficial additives,
that is, In and Bi, and Ag as a potentially unfavorable additive.We show that both In and Bi have the desired property for a
secondary battery, that is, upon recharging they will remain on
the surface, thereby retaining the beneficial effects on Zn dis-solution and suppression of HER. This is confirmed by DEMS,
where it is observed that In reduces HER and Bi affects the dis-charge potential beneficially compared to a battery without
additives. Using a simple procedure based on adsorption ener-gies calculated with DFT, it is found that Ag suppresses OH ad-
sorption, but, unlike In and Bi, it does not hinder HER. Finally,
it is shown that mixing In and Bi is beneficial compared to theadditives by themselves as it improves the electrochemical per-
formance and cyclic stability of the secondary Zn–air battery.
[a] Dr. S. Lysgaard, M. K. Christensen, Prof. H. A. Hansen,Prof. J. M. Garc&a Lastra, Prof. P. Norby, Prof. T. VeggeDepartment of Energy Conversion and StorageTechnical University of Denmark2800 Kgs. Lyngby (Denmark)E-mail : [email protected]
[email protected]: http ://www.asc.energy.dtu.dk/
Supporting Information and the ORCID identification number(s) for theauthor(s) of this article can be found under https://doi.org/10.1002/cssc.201800225.
This publication is part of a Special Issue on Interfacing Theory andExperiment for the Development of Energy Materials.Please visit the issue at http://doi.org/10.1002/cssc.v11.12.
ChemSusChem 2018, 11, 1933 – 1941 T 2018 Wiley-VCH Verlag GmbH & Co. KGaA, Weinheim1933
Full PapersDOI: 10.1002/cssc.201800225

ions ([Zn(OH)4]2@) in solution.[12] However, the dissolution of Znstarts already at [Zn(OH)3]@ .[13] The zincate precipitates above
its solubility limit as ZnO according to Equation (3):
ZnðOHÞ42@ Ð ZnOþ H2Oþ 2 OH@ ð3Þ
The overall reaction is represented by Equation (4):
Znþ 2 OH@ Ð ZnOþ H2Oþ 2 e@ ð4Þ
Secondary Zn–air batteries face various challenges that arisefrom cycling the battery, including:
· dendrite formation:[14] as the zincate is dissolved it has no
connection to the Zn electrode and is, therefore, free toadhere anywhere to the conducting electrode during charg-ing. This can lead to dendrite formation, which in the worstcase as some cycles can short circuit the battery.
· bifunctional cathode:[6, 15, 16] as the positive electrode should
reduce and evolve oxygen during discharge and charge, re-spectively, a catalyst for both reactions needs to be em-
ployed (bifunctional catalyst). As an alternative, two sepa-rate electrodes could be used, but that would complicate
the battery cell design and reduce the specific energy.
· precipitation of K2CO3 in the cathode as a side-effect of thealkaline electrolyte
· flooding of the cathode if the hydrophobic properties ofthe cathode are not retained[17]
· corrosion caused by hydrogen evolution
Hydrogen evolution follows the following overall chemical
reaction [Eq. (5)]:
Znþ 2 H2O! ZnðOHÞ2 þ H2ðgÞ ð5Þ
Here, the active material, Zn, is thus consumed without anyelectrons being transferred and Zn(OH)2 is left.
As corrosion is also an issue in primary Zn–air batteries, it
was previously alleviated through the addition of Hg to the Znelectrode.[18] Legislation has now limited the use of Hg in bat-
teries because of its toxicity ; therefore, other additives havebeen sought. At present, the negative electrode material in
state-of-the-art primary Zn–air batteries consists of Zn withppm doping levels of In, Bi, and Al.[19] The effect of these addi-
tives on long-term cycling is, however, poorly understood.Here follows a brief survey of the published effects of thedoping elements and possible pollutants investigated in this
study.Indium: The In–Zn phase diagram[20] shows a very small solu-
bility of In in Zn, that is, no mixing occurs except some solidsolubility in mixtures with up to 0.2 % In. Using Ni–In additives
resulted in an apparent decrease in both hydrogen evolution
reaction (HER) and dendrite formation.[21] In Ref. [22] In isshown to segregate to grain boundaries of Zn particles and
decrease HER.Bismuth: Bi is also used in Zn electrode alloys (always in
conjunction with another element though) in low doping con-centration. The Bi–Zn phase diagram shows a very small solu-
bility of 0.1 % Bi in Zn.[23] Bi is used as binder of particulate Znto improve conductivity of Zn particles.[24, 25] Plate-like Zn pre-
cipitates are found in Sn8Zn3Bi solder;[26] thus, it seems Bi doesnot have any positive effect on dendrite formation. McBreen
and Gannon[27] reported that a metallic Bi matrix (used togeth-er with Ca(OH)2 in Ref. [28]) is responsible for increasing thecycle lifetime of a Zn electrode.
Indium + bismuth: Yano et al.[29] reported a surface alloy ofIn and Bi to be responsible for suppressing HER on the same
level as a Hg additive. Many patents already exist for differentmixtures of In and Bi with Zn for use in primary batteries. Theyare primarily for use in Zn electrodes in alkaline electrochemi-cal cells or paint.[19, 30–32] The materials in these patents can in-
clude dopant levels of the following elements as well : Pb, Al,Ga, Cd, Li, Ca, Fe, and Mg. Although In and Bi are the most im-
portant additives, the other elements can play an important
role as well if they have a preference for interacting with theactive kink sites for Zn dissolution[12] as these sites can be infre-
quent on the Zn surface. Zn powders produced by Umicore,which were used to prepare the Zn electrode paste, contain
approximately 100 ppm of the elements Bi, In, and Al.[33]
Silver: Ag in the negative Zn electrode is known to be re-
sponsible for greatly increasing hydrogen evolution, eventually
making the battery effectively useless. Ag/Co3O4 is a promisingcatalyst for both the oxygen reduction reaction (ORR) and the
oxygen evolution reaction (OER)[34, 35] and thus perfectly suitedfor Zn–air batteries. For this reason, we have included Ag in
this study as it may be transferred from the cathodic catalystthrough the electrolyte to the anode, thereby influencing the
electrochemical reactions.
Herein, we systematically investigate the possible effects ofIn, Bi, and Ag in a secondary Zn–air battery, focusing specifical-
ly on the behavior of the doping element on battery cyclingand the effect of the dopant on especially the Zn dissolution
and the HER. First, we will investigate the dissolution reactionon pure Zn surfaces using DFT and compare the results with
previous studies to establish that our method is suitable. Next,
we perform segregation studies to analyze how the surface isaffected by different doping elements. Only elements that will
stay on the surface during battery cycling will retain theireffect in a secondary battery. We follow this by experimentally
measuring the charge and discharge behavior of batteries withthe theoretically determined additives on the negative elec-trode and quantifying the evolution of H2 and O2 using DEMS.Subsequently we use DFT to model adsorption of hydroxyl(OH) and hydrogen (H) to investigate Zn dissolution and HER,
respectively, on doped Zn electrodes. As both reactions[Eqs. (1) and (5)] involve the formation of Zn(OH)2, we compare
the affinity of the Zn surface to both OH and H to evaluatewhich reaction is preferred and thereby explain why some ad-
ditives inhibit and others enhance HER. Thus, by studying the
doped Zn electrode with a combination of DFT calculationsand DEMS measurements, we can pinpoint the effect of the
doping elements and determine if the effect is retained uponcycling.
ChemSusChem 2018, 11, 1933 – 1941 www.chemsuschem.org T 2018 Wiley-VCH Verlag GmbH & Co. KGaA, Weinheim1934
Full Papers
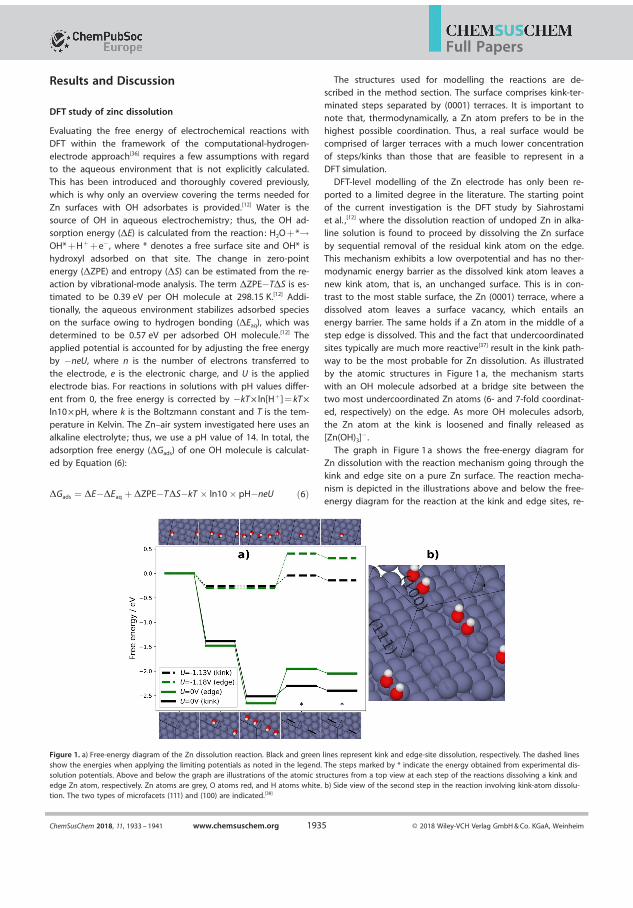
Results and Discussion
DFT study of zinc dissolution
Evaluating the free energy of electrochemical reactions withDFT within the framework of the computational-hydrogen-electrode approach[36] requires a few assumptions with regardto the aqueous environment that is not explicitly calculated.This has been introduced and thoroughly covered previously,
which is why only an overview covering the terms needed forZn surfaces with OH adsorbates is provided.[12] Water is the
source of OH in aqueous electrochemistry ; thus, the OH ad-sorption energy (DE) is calculated from the reaction: H2O + *!OH* + H+ + e@ , where * denotes a free surface site and OH* ishydroxyl adsorbed on that site. The change in zero-point
energy (DZPE) and entropy (DS) can be estimated from the re-
action by vibrational-mode analysis. The term DZPE@TDS is es-timated to be 0.39 eV per OH molecule at 298.15 K.[12] Addi-
tionally, the aqueous environment stabilizes adsorbed specieson the surface owing to hydrogen bonding (DEaq), which was
determined to be 0.57 eV per adsorbed OH molecule.[12] Theapplied potential is accounted for by adjusting the free energy
by @neU, where n is the number of electrons transferred to
the electrode, e is the electronic charge, and U is the appliedelectrode bias. For reactions in solutions with pH values differ-
ent from 0, the free energy is corrected by @kT V ln[H+] = kT Vln10 V pH, where k is the Boltzmann constant and T is the tem-
perature in Kelvin. The Zn–air system investigated here uses analkaline electrolyte; thus, we use a pH value of 14. In total, the
adsorption free energy (DGads) of one OH molecule is calculat-
ed by Equation (6):
DGads ¼ DE@DEaq þ DZPE@TDS@kT > ln10> pH@neU ð6Þ
The structures used for modelling the reactions are de-scribed in the method section. The surface comprises kink-ter-
minated steps separated by (0001) terraces. It is important tonote that, thermodynamically, a Zn atom prefers to be in the
highest possible coordination. Thus, a real surface would becomprised of larger terraces with a much lower concentration
of steps/kinks than those that are feasible to represent in aDFT simulation.
DFT-level modelling of the Zn electrode has only been re-
ported to a limited degree in the literature. The starting pointof the current investigation is the DFT study by Siahrostami
et al. ,[12] where the dissolution reaction of undoped Zn in alka-line solution is found to proceed by dissolving the Zn surface
by sequential removal of the residual kink atom on the edge.This mechanism exhibits a low overpotential and has no ther-
modynamic energy barrier as the dissolved kink atom leaves a
new kink atom, that is, an unchanged surface. This is in con-trast to the most stable surface, the Zn (0001) terrace, where a
dissolved atom leaves a surface vacancy, which entails anenergy barrier. The same holds if a Zn atom in the middle of a
step edge is dissolved. This and the fact that undercoordinatedsites typically are much more reactive[37] result in the kink path-
way to be the most probable for Zn dissolution. As illustrated
by the atomic structures in Figure 1 a, the mechanism startswith an OH molecule adsorbed at a bridge site between the
two most undercoordinated Zn atoms (6- and 7-fold coordinat-ed, respectively) on the edge. As more OH molecules adsorb,
the Zn atom at the kink is loosened and finally released as[Zn(OH)3]@ .
The graph in Figure 1 a shows the free-energy diagram for
Zn dissolution with the reaction mechanism going through thekink and edge site on a pure Zn surface. The reaction mecha-
nism is depicted in the illustrations above and below the free-energy diagram for the reaction at the kink and edge sites, re-
Figure 1. a) Free-energy diagram of the Zn dissolution reaction. Black and green lines represent kink and edge-site dissolution, respectively. The dashed linesshow the energies when applying the limiting potentials as noted in the legend. The steps marked by * indicate the energy obtained from experimental dis-solution potentials. Above and below the graph are illustrations of the atomic structures from a top view at each step of the reactions dissolving a kink andedge Zn atom, respectively. Zn atoms are grey, O atoms red, and H atoms white. b) Side view of the second step in the reaction involving kink-atom dissolu-tion. The two types of microfacets (111) and (100) are indicated.[38]
ChemSusChem 2018, 11, 1933 – 1941 www.chemsuschem.org T 2018 Wiley-VCH Verlag GmbH & Co. KGaA, Weinheim1935
Full Papers
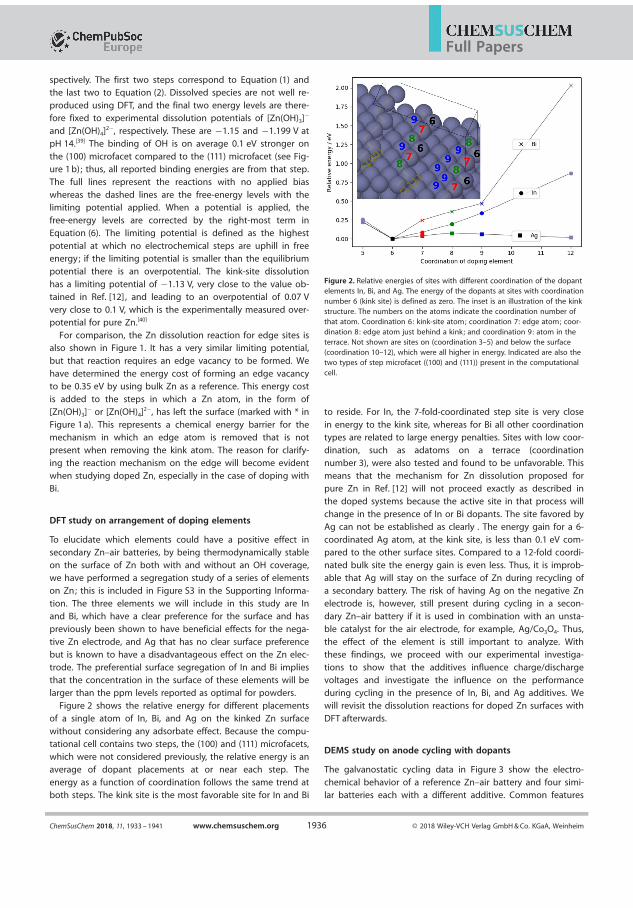
spectively. The first two steps correspond to Equation (1) andthe last two to Equation (2). Dissolved species are not well re-
produced using DFT, and the final two energy levels are there-fore fixed to experimental dissolution potentials of [Zn(OH)3]@
and [Zn(OH)4]2@, respectively. These are @1.15 and @1.199 V atpH 14.[39] The binding of OH is on average 0.1 eV stronger onthe (100) microfacet compared to the (111) microfacet (see Fig-ure 1 b); thus, all reported binding energies are from that step.The full lines represent the reactions with no applied bias
whereas the dashed lines are the free-energy levels with thelimiting potential applied. When a potential is applied, the
free-energy levels are corrected by the right-most term inEquation (6). The limiting potential is defined as the highestpotential at which no electrochemical steps are uphill in freeenergy; if the limiting potential is smaller than the equilibrium
potential there is an overpotential. The kink-site dissolutionhas a limiting potential of @1.13 V, very close to the value ob-tained in Ref. [12] , and leading to an overpotential of 0.07 Vvery close to 0.1 V, which is the experimentally measured over-potential for pure Zn.[40]
For comparison, the Zn dissolution reaction for edge sites isalso shown in Figure 1. It has a very similar limiting potential,
but that reaction requires an edge vacancy to be formed. We
have determined the energy cost of forming an edge vacancyto be 0.35 eV by using bulk Zn as a reference. This energy cost
is added to the steps in which a Zn atom, in the form of[Zn(OH)3]@ or [Zn(OH)4]2@, has left the surface (marked with * in
Figure 1 a). This represents a chemical energy barrier for themechanism in which an edge atom is removed that is not
present when removing the kink atom. The reason for clarify-
ing the reaction mechanism on the edge will become evidentwhen studying doped Zn, especially in the case of doping with
Bi.
DFT study on arrangement of doping elements
To elucidate which elements could have a positive effect in
secondary Zn–air batteries, by being thermodynamically stableon the surface of Zn both with and without an OH coverage,
we have performed a segregation study of a series of elementson Zn; this is included in Figure S3 in the Supporting Informa-
tion. The three elements we will include in this study are Inand Bi, which have a clear preference for the surface and haspreviously been shown to have beneficial effects for the nega-
tive Zn electrode, and Ag that has no clear surface preferencebut is known to have a disadvantageous effect on the Zn elec-
trode. The preferential surface segregation of In and Bi impliesthat the concentration in the surface of these elements will belarger than the ppm levels reported as optimal for powders.
Figure 2 shows the relative energy for different placementsof a single atom of In, Bi, and Ag on the kinked Zn surface
without considering any adsorbate effect. Because the compu-tational cell contains two steps, the (100) and (111) microfacets,
which were not considered previously, the relative energy is anaverage of dopant placements at or near each step. Theenergy as a function of coordination follows the same trend atboth steps. The kink site is the most favorable site for In and Bi
to reside. For In, the 7-fold-coordinated step site is very close
in energy to the kink site, whereas for Bi all other coordinationtypes are related to large energy penalties. Sites with low coor-
dination, such as adatoms on a terrace (coordination
number 3), were also tested and found to be unfavorable. Thismeans that the mechanism for Zn dissolution proposed for
pure Zn in Ref. [12] will not proceed exactly as described inthe doped systems because the active site in that process will
change in the presence of In or Bi dopants. The site favored byAg can not be established as clearly . The energy gain for a 6-
coordinated Ag atom, at the kink site, is less than 0.1 eV com-
pared to the other surface sites. Compared to a 12-fold coordi-nated bulk site the energy gain is even less. Thus, it is improb-
able that Ag will stay on the surface of Zn during recycling ofa secondary battery. The risk of having Ag on the negative Zn
electrode is, however, still present during cycling in a secon-dary Zn–air battery if it is used in combination with an unsta-
ble catalyst for the air electrode, for example, Ag/Co3O4. Thus,
the effect of the element is still important to analyze. Withthese findings, we proceed with our experimental investiga-
tions to show that the additives influence charge/dischargevoltages and investigate the influence on the performance
during cycling in the presence of In, Bi, and Ag additives. Wewill revisit the dissolution reactions for doped Zn surfaces with
DFT afterwards.
DEMS study on anode cycling with dopants
The galvanostatic cycling data in Figure 3 show the electro-
chemical behavior of a reference Zn–air battery and four simi-lar batteries each with a different additive. Common features
Figure 2. Relative energies of sites with different coordination of the dopantelements In, Bi, and Ag. The energy of the dopants at sites with coordinationnumber 6 (kink site) is defined as zero. The inset is an illustration of the kinkstructure. The numbers on the atoms indicate the coordination number ofthat atom. Coordination 6: kink-site atom; coordination 7: edge atom; coor-dination 8: edge atom just behind a kink; and coordination 9: atom in theterrace. Not shown are sites on (coordination 3–5) and below the surface(coordination 10–12), which were all higher in energy. Indicated are also thetwo types of step microfacet ((100) and (111)) present in the computationalcell.
ChemSusChem 2018, 11, 1933 – 1941 www.chemsuschem.org T 2018 Wiley-VCH Verlag GmbH & Co. KGaA, Weinheim1936
Full Papers
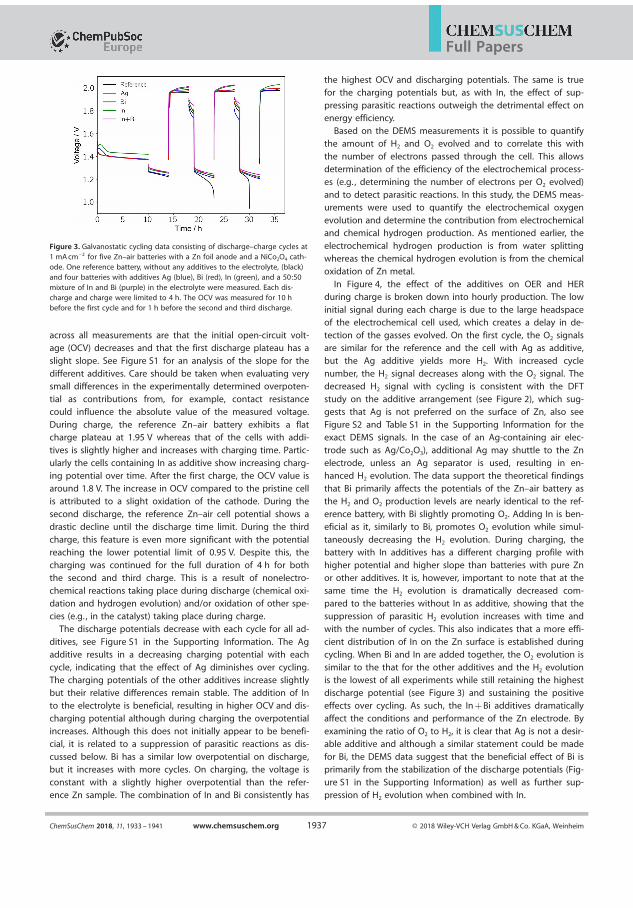
across all measurements are that the initial open-circuit volt-age (OCV) decreases and that the first discharge plateau has a
slight slope. See Figure S1 for an analysis of the slope for the
different additives. Care should be taken when evaluating verysmall differences in the experimentally determined overpoten-
tial as contributions from, for example, contact resistancecould influence the absolute value of the measured voltage.
During charge, the reference Zn–air battery exhibits a flatcharge plateau at 1.95 V whereas that of the cells with addi-
tives is slightly higher and increases with charging time. Partic-
ularly the cells containing In as additive show increasing charg-ing potential over time. After the first charge, the OCV value is
around 1.8 V. The increase in OCV compared to the pristine cellis attributed to a slight oxidation of the cathode. During the
second discharge, the reference Zn–air cell potential shows adrastic decline until the discharge time limit. During the third
charge, this feature is even more significant with the potential
reaching the lower potential limit of 0.95 V. Despite this, thecharging was continued for the full duration of 4 h for both
the second and third charge. This is a result of nonelectro-chemical reactions taking place during discharge (chemical oxi-dation and hydrogen evolution) and/or oxidation of other spe-cies (e.g. , in the catalyst) taking place during charge.
The discharge potentials decrease with each cycle for all ad-ditives, see Figure S1 in the Supporting Information. The Agadditive results in a decreasing charging potential with eachcycle, indicating that the effect of Ag diminishes over cycling.The charging potentials of the other additives increase slightly
but their relative differences remain stable. The addition of Into the electrolyte is beneficial, resulting in higher OCV and dis-
charging potential although during charging the overpotentialincreases. Although this does not initially appear to be benefi-cial, it is related to a suppression of parasitic reactions as dis-
cussed below. Bi has a similar low overpotential on discharge,but it increases with more cycles. On charging, the voltage is
constant with a slightly higher overpotential than the refer-ence Zn sample. The combination of In and Bi consistently has
the highest OCV and discharging potentials. The same is truefor the charging potentials but, as with In, the effect of sup-
pressing parasitic reactions outweigh the detrimental effect onenergy efficiency.
Based on the DEMS measurements it is possible to quantifythe amount of H2 and O2 evolved and to correlate this withthe number of electrons passed through the cell. This allowsdetermination of the efficiency of the electrochemical process-es (e.g. , determining the number of electrons per O2 evolved)and to detect parasitic reactions. In this study, the DEMS meas-urements were used to quantify the electrochemical oxygenevolution and determine the contribution from electrochemicaland chemical hydrogen production. As mentioned earlier, the
electrochemical hydrogen production is from water splittingwhereas the chemical hydrogen evolution is from the chemical
oxidation of Zn metal.
In Figure 4, the effect of the additives on OER and HERduring charge is broken down into hourly production. The low
initial signal during each charge is due to the large headspaceof the electrochemical cell used, which creates a delay in de-
tection of the gasses evolved. On the first cycle, the O2 signalsare similar for the reference and the cell with Ag as additive,
but the Ag additive yields more H2. With increased cycle
number, the H2 signal decreases along with the O2 signal. Thedecreased H2 signal with cycling is consistent with the DFT
study on the additive arrangement (see Figure 2), which sug-gests that Ag is not preferred on the surface of Zn, also see
Figure S2 and Table S1 in the Supporting Information for theexact DEMS signals. In the case of an Ag-containing air elec-
trode such as Ag/Co2O3), additional Ag may shuttle to the Zn
electrode, unless an Ag separator is used, resulting in en-hanced H2 evolution. The data support the theoretical findings
that Bi primarily affects the potentials of the Zn–air battery asthe H2 and O2 production levels are nearly identical to the ref-
erence battery, with Bi slightly promoting O2. Adding In is ben-eficial as it, similarly to Bi, promotes O2 evolution while simul-taneously decreasing the H2 evolution. During charging, the
battery with In additives has a different charging profile withhigher potential and higher slope than batteries with pure Znor other additives. It is, however, important to note that at thesame time the H2 evolution is dramatically decreased com-pared to the batteries without In as additive, showing that thesuppression of parasitic H2 evolution increases with time and
with the number of cycles. This also indicates that a more effi-cient distribution of In on the Zn surface is established duringcycling. When Bi and In are added together, the O2 evolution is
similar to the that for the other additives and the H2 evolutionis the lowest of all experiments while still retaining the highest
discharge potential (see Figure 3) and sustaining the positiveeffects over cycling. As such, the In + Bi additives dramatically
affect the conditions and performance of the Zn electrode. By
examining the ratio of O2 to H2, it is clear that Ag is not a desir-able additive and although a similar statement could be made
for Bi, the DEMS data suggest that the beneficial effect of Bi isprimarily from the stabilization of the discharge potentials (Fig-
ure S1 in the Supporting Information) as well as further sup-pression of H2 evolution when combined with In.
Figure 3. Galvanostatic cycling data consisting of discharge–charge cycles at1 mA cm@2 for five Zn–air batteries with a Zn foil anode and a NiCo2O4 cath-ode. One reference battery, without any additives to the electrolyte, (black)and four batteries with additives Ag (blue), Bi (red), In (green), and a 50:50mixture of In and Bi (purple) in the electrolyte were measured. Each dis-charge and charge were limited to 4 h. The OCV was measured for 10 hbefore the first cycle and for 1 h before the second and third discharge.
ChemSusChem 2018, 11, 1933 – 1941 www.chemsuschem.org T 2018 Wiley-VCH Verlag GmbH & Co. KGaA, Weinheim1937
Full Papers
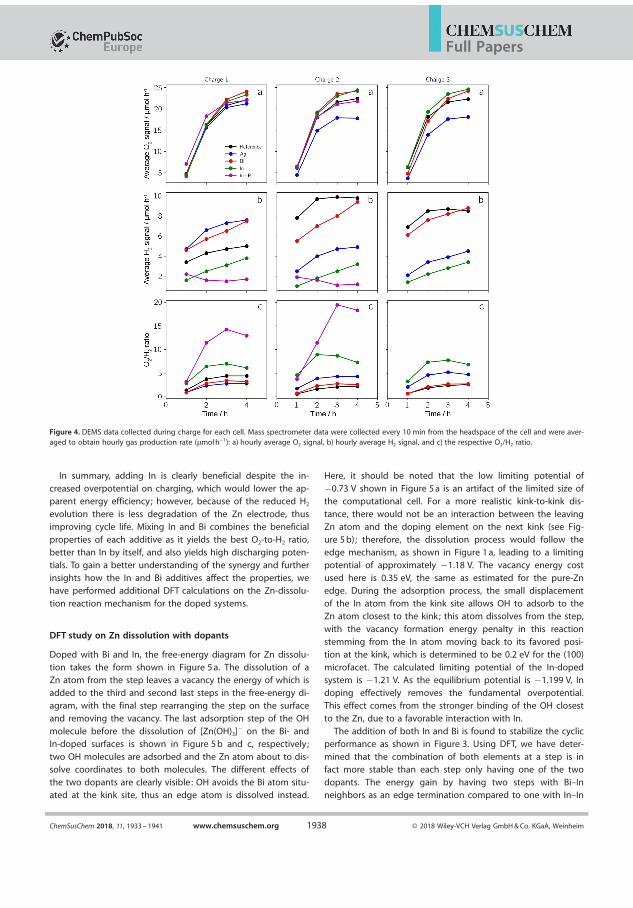
In summary, adding In is clearly beneficial despite the in-
creased overpotential on charging, which would lower the ap-parent energy efficiency; however, because of the reduced H2
evolution there is less degradation of the Zn electrode, thusimproving cycle life. Mixing In and Bi combines the beneficial
properties of each additive as it yields the best O2-to-H2 ratio,
better than In by itself, and also yields high discharging poten-tials. To gain a better understanding of the synergy and furtherinsights how the In and Bi additives affect the properties, wehave performed additional DFT calculations on the Zn-dissolu-
tion reaction mechanism for the doped systems.
DFT study on Zn dissolution with dopants
Doped with Bi and In, the free-energy diagram for Zn dissolu-
tion takes the form shown in Figure 5 a. The dissolution of aZn atom from the step leaves a vacancy the energy of which is
added to the third and second last steps in the free-energy di-agram, with the final step rearranging the step on the surface
and removing the vacancy. The last adsorption step of the OH
molecule before the dissolution of [Zn(OH)3]@ on the Bi- andIn-doped surfaces is shown in Figure 5 b and c, respectively;
two OH molecules are adsorbed and the Zn atom about to dis-solve coordinates to both molecules. The different effects of
the two dopants are clearly visible: OH avoids the Bi atom situ-ated at the kink site, thus an edge atom is dissolved instead.
Here, it should be noted that the low limiting potential of
@0.73 V shown in Figure 5 a is an artifact of the limited size ofthe computational cell. For a more realistic kink-to-kink dis-
tance, there would not be an interaction between the leavingZn atom and the doping element on the next kink (see Fig-
ure 5 b); therefore, the dissolution process would follow the
edge mechanism, as shown in Figure 1 a, leading to a limitingpotential of approximately @1.18 V. The vacancy energy costused here is 0.35 eV, the same as estimated for the pure-Znedge. During the adsorption process, the small displacement
of the In atom from the kink site allows OH to adsorb to theZn atom closest to the kink; this atom dissolves from the step,
with the vacancy formation energy penalty in this reactionstemming from the In atom moving back to its favored posi-tion at the kink, which is determined to be 0.2 eV for the (100)
microfacet. The calculated limiting potential of the In-dopedsystem is @1.21 V. As the equilibrium potential is @1.199 V, In
doping effectively removes the fundamental overpotential.This effect comes from the stronger binding of the OH closest
to the Zn, due to a favorable interaction with In.
The addition of both In and Bi is found to stabilize the cyclicperformance as shown in Figure 3. Using DFT, we have deter-
mined that the combination of both elements at a step is infact more stable than each step only having one of the two
dopants. The energy gain by having two steps with Bi–Inneighbors as an edge termination compared to one with In–In
Figure 4. DEMS data collected during charge for each cell. Mass spectrometer data were collected every 10 min from the headspace of the cell and were aver-aged to obtain hourly gas production rate (mmol h@1): a) hourly average O2 signal, b) hourly average H2 signal, and c) the respective O2/H2 ratio.
ChemSusChem 2018, 11, 1933 – 1941 www.chemsuschem.org T 2018 Wiley-VCH Verlag GmbH & Co. KGaA, Weinheim1938
Full Papers
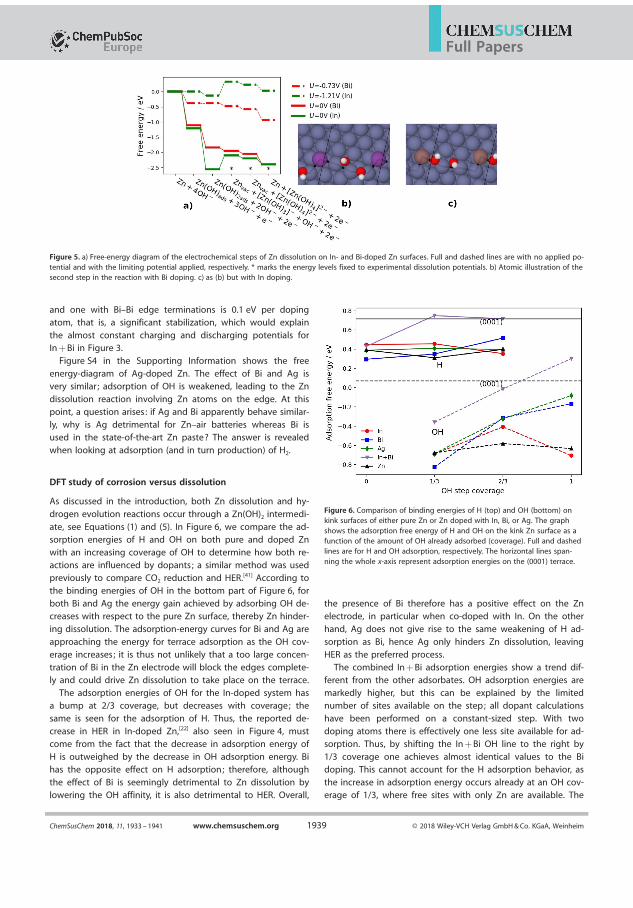
and one with Bi–Bi edge terminations is 0.1 eV per dopingatom, that is, a significant stabilization, which would explain
the almost constant charging and discharging potentials forIn + Bi in Figure 3.
Figure S4 in the Supporting Information shows the free
energy-diagram of Ag-doped Zn. The effect of Bi and Ag isvery similar ; adsorption of OH is weakened, leading to the Zn
dissolution reaction involving Zn atoms on the edge. At thispoint, a question arises: if Ag and Bi apparently behave similar-
ly, why is Ag detrimental for Zn–air batteries whereas Bi isused in the state-of-the-art Zn paste? The answer is revealed
when looking at adsorption (and in turn production) of H2.
DFT study of corrosion versus dissolution
As discussed in the introduction, both Zn dissolution and hy-
drogen evolution reactions occur through a Zn(OH)2 intermedi-
ate, see Equations (1) and (5). In Figure 6, we compare the ad-sorption energies of H and OH on both pure and doped Zn
with an increasing coverage of OH to determine how both re-actions are influenced by dopants; a similar method was used
previously to compare CO2 reduction and HER.[41] According tothe binding energies of OH in the bottom part of Figure 6, for
both Bi and Ag the energy gain achieved by adsorbing OH de-creases with respect to the pure Zn surface, thereby Zn hinder-
ing dissolution. The adsorption-energy curves for Bi and Ag areapproaching the energy for terrace adsorption as the OH cov-erage increases; it is thus not unlikely that a too large concen-
tration of Bi in the Zn electrode will block the edges complete-ly and could drive Zn dissolution to take place on the terrace.
The adsorption energies of OH for the In-doped system hasa bump at 2/3 coverage, but decreases with coverage; the
same is seen for the adsorption of H. Thus, the reported de-
crease in HER in In-doped Zn,[22] also seen in Figure 4, mustcome from the fact that the decrease in adsorption energy of
H is outweighed by the decrease in OH adsorption energy. Bihas the opposite effect on H adsorption; therefore, although
the effect of Bi is seemingly detrimental to Zn dissolution bylowering the OH affinity, it is also detrimental to HER. Overall,
the presence of Bi therefore has a positive effect on the Znelectrode, in particular when co-doped with In. On the other
hand, Ag does not give rise to the same weakening of H ad-sorption as Bi, hence Ag only hinders Zn dissolution, leavingHER as the preferred process.
The combined In + Bi adsorption energies show a trend dif-ferent from the other adsorbates. OH adsorption energies are
markedly higher, but this can be explained by the limitednumber of sites available on the step; all dopant calculations
have been performed on a constant-sized step. With twodoping atoms there is effectively one less site available for ad-sorption. Thus, by shifting the In + Bi OH line to the right by1/3 coverage one achieves almost identical values to the Bidoping. This cannot account for the H adsorption behavior, as
the increase in adsorption energy occurs already at an OH cov-erage of 1/3, where free sites with only Zn are available. The
Figure 5. a) Free-energy diagram of the electrochemical steps of Zn dissolution on In- and Bi-doped Zn surfaces. Full and dashed lines are with no applied po-tential and with the limiting potential applied, respectively. * marks the energy levels fixed to experimental dissolution potentials. b) Atomic illustration of thesecond step in the reaction with Bi doping. c) as (b) but with In doping.
Figure 6. Comparison of binding energies of H (top) and OH (bottom) onkink surfaces of either pure Zn or Zn doped with In, Bi, or Ag. The graphshows the adsorption free energy of H and OH on the kink Zn surface as afunction of the amount of OH already adsorbed (coverage). Full and dashedlines are for H and OH adsorption, respectively. The horizontal lines span-ning the whole x-axis represent adsorption energies on the (0001) terrace.
ChemSusChem 2018, 11, 1933 – 1941 www.chemsuschem.org T 2018 Wiley-VCH Verlag GmbH & Co. KGaA, Weinheim1939
Full Papers

decrease must then come down to an electronic effect of com-bining In and Bi. Only the combination of both In and Bi can
switch the most favorable adsorption site for H to the (0001)terrace where HER is not considered an issue.[2] For all other
dopants, the adsorption energy of H on Zn (0001) is still 0.2 eVhigher than the highest energy on the kink.
Conclusions
The Zn dissolution and parasitic hydrogen evolution reaction
(HER) at the negative electrode in secondary Zn–air batterieswere modelled using density functional theory (DFT) and mea-sured experimentally using differential electrochemical massspectrometry (DEMS) on In-, Bi-, and Ag-doped as well as pureZn surfaces. To influence the negative electrode chemistryupon cycling of the battery, the doping elements need to be
thermodynamically or kinetically stabilized on the surface asZn is plated on the negative electrode during charging. DFTcalculations showed that In and Bi strongly prefers the kink
site, whereas there was no clear driving force for Ag to remainon the surface. This is also confirmed experimentally, where In
and Bi change the potential characteristics as well as O2/H2
evolution consistently through cycling, compared to pure Zn
foil, and the effect of Ag is lost after a few cycles. Both DFT cal-
culations and DEMS measurements show that In decreases theoverpotential for Zn dissolution. The primary effect of Bi is
found to be stabilizing In on the Zn surface; DEMS measure-ments with both dopants show a constant behavior of the
charge/discharge potentials with cycling. The DFT calculationsconfirm that steps with both Bi and In are 0.1 eV per doping
atom more stable than individual steps with only one of the
doping elements. The codoping of both In and Bi decreasedthe HER dramatically (Figure 4), and the decrease in HER was
explained using DFT to stem from a much weaker H adsorp-tion on Bi- and In-codoped steps. In the same manner, Ag was
found to increase the HER, demonstrating a weakening of theOH binding energy, but has no effect on H binding, leaving
HER as the preferred reaction.
Experimental Section
Computational details
The density functional theory calculations were all performedusing the GPAW (v0.11.0) code,[42, 43] which is a real-space imple-mentation of the PAW method.[44] Structure manipulation and postanalysis of calculations were performed using ASE (v3.9.1).[45] TheRPBE functional[46] was used, this functional was developed to pro-vide accurate adsorption energies for molecules on surfaces. All re-ported energies were calculated using the finite difference (fd)mode in GPAW, working on the real-space grid.All geometrical relaxations of clean surfaces were performed in atwo-step procedure, where the linear combination of atomic orbi-tals (LCAO) mode in GPAW[47] was used for the initial relaxation fol-lowed by a relaxation in fd mode. This allowed the computational-ly cheaper LCAO mode to do the heavy lifting of the geometricalrelaxation of the Zn surface that, because of its low surface energy,tended to require many relaxation steps. For calculations of ad-sorbed species, this approach was not found to be advantageous,
thus a full relaxation in fd mode was performed. It is known thatthe basis set superposition error (BSSE),[48] present in LCAO modecalculations, artificially enhances the interaction between adsor-bate and substrate. This could lead to incorrect geometries as thecorrection scheme is not applicable when extracting forces fromGPAW calculations at the moment.The free-energy diagram of zinc dissolution was calculated fromthe adsorption energies using a well-known method[36] and alsoused in a previous DFT study on Zn dissolution.[12] We assumed thetemperature to be 298.15 K and the pH value to be 14.All adsorption energies, except the edge dissolution pathway illus-trated in the lower part of Figure 1 a, were reported from a struc-ture with 4 atoms on each step in the unit cell, each step was ter-minated by a kink, which corresponds to a sixfold coordinatedatom. For a representative illustration see Figure 1 b and the insetin Figure 2. As previously mentioned, the computational cell con-tained two steps with microfacets of the types (100) and (111). Ifnot stated otherwise, the reported energies stemmed from adsorp-tion on the (100) step, as these are more stable. To avoid interac-tion between steps they were separated by 3 and 4 terrace rows.The interaction between a kink atom and its periodic image wasminimal. The unit cell had four close-packed Zn atomic layers,during geometrical relaxation the bottom two were fixed to thebulk structure and lattice constant. We used the experimental lat-tice constant of a = 2.66 a and c = 4.94 a.[49] Perpendicular to thesurface a vacuum of 12 a was inserted to prevent interaction be-tween computational slabs. We used a (3,3,1) k-point sampling in aMonkhorst–Pack scheme[50] and a grid spacing of 0.18 a.
DEMS measurements
All electrochemical measurements were performed using a twoelectrode Air–Ni cell of the ECC series from EL-Cell. The cathodewas NiCo2O4 (NCO) with PTFE for hydrophobicity and micrometer-sized Ni particles for conductivity supported on a Ni 40 mesh. Theelectrolyte was 200 mL 6 m KOH and contained two 260 mm thickGF/A Whatman glass fiber separators. The additives Ag, Bi, and Inwere added from 5 mm Ag/Bi/In-nitrate aqueous solutions. In oneexperiment, an additive containing 2.5 mm In nitrate and 2.5 mmBi nitrate was added to a Zn–air cell. The metal nitrate salts wereacquired from Sigma–Aldrich of at least 99.9 % purity, and theirconcentrations were calculated from the anhydrous weight. Bi ni-trate, which is not completely soluble in water, was sonicated andstirred before use to ensure that the particles were dispersed wellin solution. 28 mL of the additive solution were added to the cellbetween the two separators before electrolyte was added. The cur-rent collector for the positive electrode was a perforated Ni platefrom EL-Cell. The current collector for the negative electrode was a8 mm thick 99.99 % Cu foil from MTI corp.
Experimental procedure
Each cell was cycled three times for OCV measurements prior toeach discharge–charge experiment. The Initial OCV time was 10 hwhereas the flowing OCV measurement time was 1 h. The galvano-static cycling was performed for 4 h at a current density of1 mA cm@2 (geometric area) for both discharge and charge. DEMSmeasurements were performed during charging with the setup de-scribed in Refs. [51–53]. The gas was collected every 10 min. Aftereach discharge the cell was flushed for 1 h to remove oxygen inthe headspace of the cell.
ChemSusChem 2018, 11, 1933 – 1941 www.chemsuschem.org T 2018 Wiley-VCH Verlag GmbH & Co. KGaA, Weinheim1940
Full Papers

Anode preparation
Zn foil electrodes were stamped from a 0.125 mm-thick Zn sheet(Goodfellow, 99.95 %). After stamping, the foil was washed by sub-mersion in a beaker with purified water, then in a beaker with eth-anol and dried in a fumehood to remove any dustparticles fromthe packing.
Cathode preparation
The NCO cathodes were prepared on Ni 40 mesh (Alfa Aesar) using39 wt % NiCo2O4 powder (Cerpotech), 23 wt % Ni powder (StremChemicals, 3–7 mm), 23 wt % Ni powder (Alfa Aesar, 150–200mesh), and 15 wt % PTFE (Sigma–Aldrich) with a total loading of157:25 g cm@2. The powders were mixed, compressed at 3 barper 18 cm2 and heated at 340 8C for 1 h.[28]
Acknowledgements
This work was supported by the Horizon 2020 framework project
ZAS, grant number 646186. We would also like to acknowledgeProf. Peter Holtappels and Dr. Vladimir Tripkovic for valuable dis-
cussions. Furthermore, Dr. Alexander Kube is acknowledged forproviding the NiCo2O4 catalyst.
Conflict of interest
The authors declare no conflict of interest.
Keywords: batteries · density functional theory calculations ·differential electrochemical mass spectrometry · doping · zinc
[1] V. Caramia, B. Bozzini, Mater. Renewable Sustainable Energy 2014, 3, 28.[2] P. Gu, M. Zheng, Q. Zhao, X. Xiao, H. Xue, H. Pang, J. Mater. Chem. A
2017, 5, 7651 – 7666.[3] M. A. Rahman, X. Wang, C. Wen, J. Electrochem. Soc. 2013, 160, A1759 –
A1771.[4] J. Fu, Z. P. Cano, M. G. Park, A. Yu, M. Fowler, Z. Chen, Adv. Mater. 2017,
29, 1604685.[5] Y. Li, H. Dai, Chem. Soc. Rev. 2014, 43, 5257 – 5275.[6] E. Davari, D. Ivey, Sustainable Energy Fuels 2018, 2, 39 – 67.[7] K. G. Gallagher, S. Goebel, T. Greszler, M. Mathias, W. Oelerich, D. Eroglu,
V. Srinivasan, Energy Environ. Sci. 2014, 7, 1555.[8] T. Vegge, J. M. Garcia-Lastra, D. J. Siegel, Curr. Opin. Electrochem. 2017,
6, 100 – 107.[9] Y. Li, J. Lu, ACS Energy Lett. 2017, 2, 1370 – 1377.
[10] O. Haas, J. Van Wesemael, Encyclopedia of Electrochemical Power Sour-ces, Elsevier, 2009.
[11] P. C. K. Vesborg, T. F. Jaramillo, RSC Adv. 2012, 2, 7933.[12] S. Siahrostami, V. Tripkovic, K. T. Lundgaard, K. E. Jensen, H. A. Hansen,
J. S. Hummelshøj, J. S. G. Myrdal, T. Vegge, J. K. Nørskov, J. Rossmeisl,Phys. Chem. Chem. Phys. 2013, 15, 6416 – 6421.
[13] Y.-C. Chang, G. Prentice, J. Electrochem. Soc. 1984, 131, 1465.[14] A. L. Zhu, D. P. Wilkinson, X. Zhang, Y. Xing, A. G. Rozhin, S. A. Kulinich,
J. Energy Storage 2016, 8, 35 – 50.[15] V. Tripkovic, H. A. Hansen, T. Vegge, ChemSusChem 2018, 11, 629 – 637.[16] V. Tripkovic, H. A. Hansen, T. Vegge, ACS Catal. 2017, 7, 8558 – 8571.[17] D. Schrçder, T. Arlt, U. Krewer, I. Manke, Electrochem. Commun. 2014, 40,
88 – 91.
[18] L. M. Baugh, F. L. Tye, N. C. White, J. Appl. Electrochem. 1983, 13, 623 –635.
[19] I. A. J. Strauven, M. L. Meeus, (Union Miniere), CA2153330 A1, 1994.[20] J. Dutkiewicz, W. Zakulski, Bull. Alloy Phase Diagrams 1984, 5, 284 – 289.[21] C. W. Lee, K. Sathiyanarayanan, S. W. Eom, H. S. Kim, M. S. Yun, J. Power
Sources 2006, 159, 1474 – 1477.[22] A. G. MuÇoz, S. B. Saidman, J. B. Bessone, Corros. Sci. 2001, 43, 1245 –
1265.[23] J. Vizdal, M. H. Braga, A. Kroupa, K. W. Richter, D. Soares, L. F. Malheiros,
J. Ferreira, CALPHAD Comput. Coupling Phase Diagrams Thermochem2007, 31, 438 – 448.
[24] L. Lin, R. Shepard, (Gillette), US6300011 B1, 2001.[25] R. E. Durkot, L. Lin, P. B. Harris, (Duracell), US6284410 B1, 2001.[26] M. Y. Chiu, S. S. Wang, T. H. Chuang, J. Electron. Mater. 2002, 31, 494 –
499.[27] J. McBreen, E. Gannon, J. Power Sources 1985, 15, 169 – 177.[28] C. Zhang, J. M. Wang, L. Zhang, J. Q. Zhang, C. N. Cao, J. Appl. Electro-
chem. 2001, 31, 1049 – 1054.[29] M. Yano, S. Fujitani, K. Nishio, Y. Akai, M. Kurimura, J. Power Sources
1998, 74, 129 – 134.[30] C. Henninot, Y. Strauven, (Umicore), US20120096989 A1, 2012.[31] K. Kuwayama, J. Nakagawa, K. Tomii, K. Hagimori, (Toho Zinc),
US4432937, 1984.[32] H. W. Sarkas, I. V Barsukov, (Nanophase Tech), US9105923 B2, 2015.[33] The contents of “Zn BIA100” is from the chemical analysis in a Umi-
core—Certificate of Analysis obtained during the purchase of thepowder.
[34] R. Gao, Z. Yang, L. Zheng, L. Gu, L. Liu, Y. L. Lee, Z. Hu, X. Liu, ACS Catal.2018, 8, 1955 – 1963.
[35] D. Wittmaier, N. A. CaÇas, I. Biswas, K. A. Friedrich, Adv. Energy Mater.2015, 5, 1500763.
[36] J. K. Nørskov, J. Rossmeisl, A. Logadottir, L. Lindqvist, J. R. Kitchin, T. Bli-gaard, H. Jjnsson, J. Phys. Chem. B 2004, 108, 17886 – 17892.
[37] S. H. Brodersen, U. Grønbjerg, B. Hvolbæk, J. Schiøtz, J. Catal. 2011, 284,34 – 41.
[38] M. A. Van Hove, G. A. Somorjai, Surf. Sci. 1980, 92, 489 – 518.[39] M. Cai, S.-M. Park, J. Electrochem. Soc. 1996, 143, 2125.[40] J. C. Salas-Morales, J. W. Evans, J. Appl. Electrochem. 1994, 24, 858 – 862.[41] Y.-J. Zhang, V. Sethuraman, R. Michalsky, A. A. Peterson, ACS Catal. 2014,
4, 3742 – 3748.[42] J. J. Mortensen, L. B. Hansen, K. W. Jacobsen, Phys. Rev. B 2005, 71,
35109 – 35111.[43] J. Enkovaara, C. Rostgaard, J. J. Mortensen, J. Chen, M. Dulak, L. Ferrighi,
J. Gavnholt, C. Glinsvad, V. Haikola, H. A. Hansen, et al. , J. Phys. Con-densed Matter 2010, 22, 253202.
[44] P. Blçchl, Phys. Rev. B 1994, 50, 17953 – 17979.[45] A. Hjorth Larsen, J. J. Mortensen, J. Blomqvist, I. E. Castelli, R. Christen-
sen, M. Dułak, J. Friis, M. N. Groves, B. Hammer, C. Hargus, et al. , J. Phys.Condens. Matter 2017, 29, 273002.
[46] B. Hammer, L. Hansen, J. Nørskov, Phys. Rev. B 1999, 59, 7413 – 7421.[47] A. H. Larsen, M. Vanin, J. J. Mortensen, K. S. Thygesen, K. W. Jacobsen,
Phys. Rev. B 2009, 80, 195112.[48] F. B. van Duijneveldt, J. G. C. M. van Duijneveldt-van de Rijdt, J. H. van
Lenthe, Chem. Rev. 1994, 94, 1873 – 1885.[49] N. W. Ashcroft, N. D. Mermin, Solid State Physics, Saunders, 1976.[50] H. J. Monkhorst, J. D. Pack, Phys. Rev. B 1976, 13, 5188 – 5192.[51] J. Højberg, K. B. Knudsen, J. Hjelm, T. Vegge, ECS Electrochem. Lett.
2015, 4, A63 – A66.[52] J. Højberg, PhD Thesis, Technical University of Denmark, 2015.[53] J. Højberg, B. D. McCloskey, J. Hjelm, T. Vegge, K. Johansen, P. Norby,
A. C. Luntz, ACS Appl. Mater. Interfaces 2015, 7, 4039 – 4047.
Manuscript received: January 31, 2018Revised manuscript received: March 23, 2018
Accepted manuscript online: March 30, 2018Version of record online: May 2, 2018
ChemSusChem 2018, 11, 1933 – 1941 www.chemsuschem.org T 2018 Wiley-VCH Verlag GmbH & Co. KGaA, Weinheim1941
Full Papers

Supporting Information
Combined DFT and Differential Electrochemical MassSpectrometry Investigation of the Effect of Dopants inSecondary Zinc–Air BatteriesSteen Lysgaard,* Mathias K. Christensen, Heine A. Hansen, Juan Maria Garc�a Lastra,Poul Norby, and Tejs Vegge*[a]
cssc_201800225_sm_miscellaneous_information.pdf
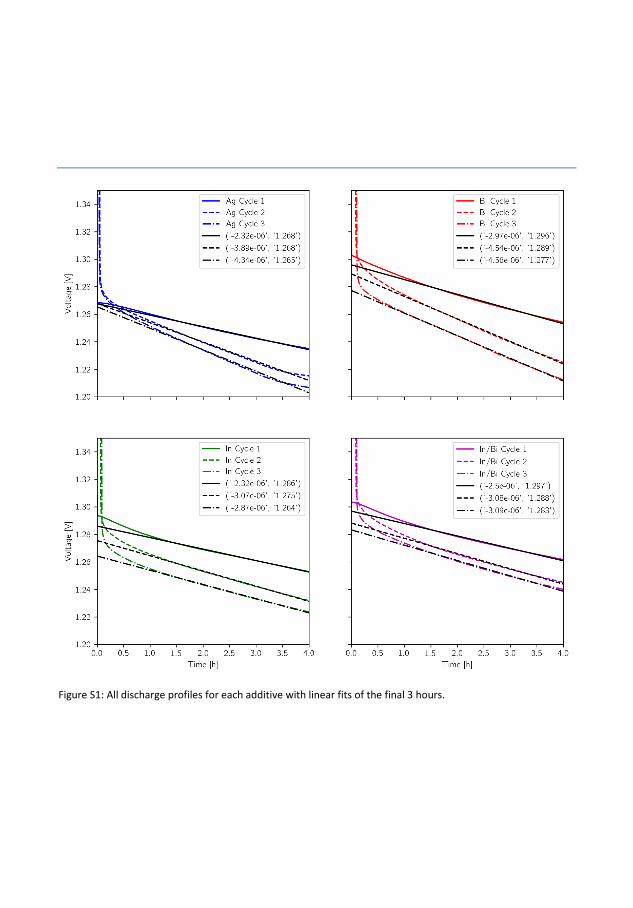
Figure S1: All discharge profiles for each additive with linear fits of the final 3 hours.
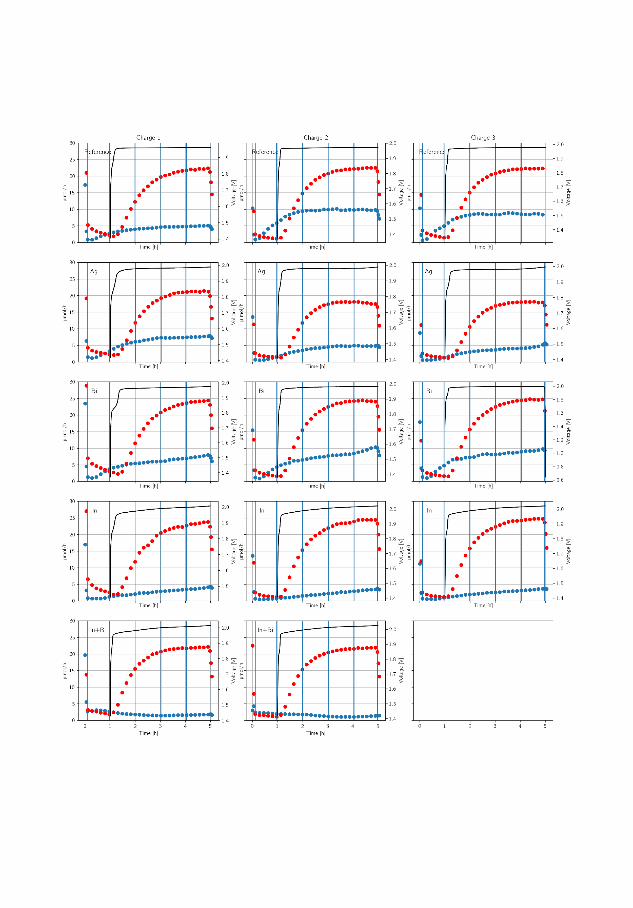
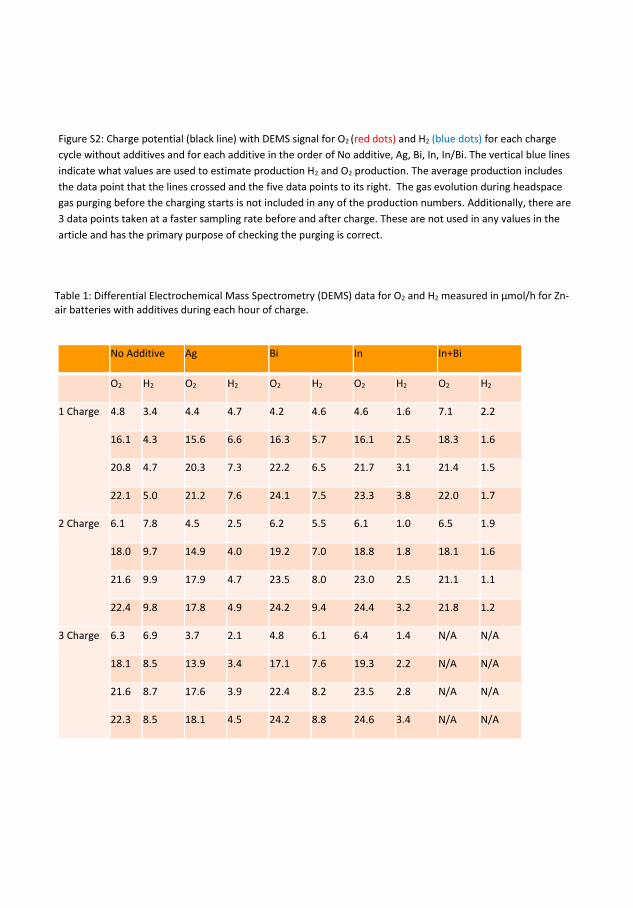
Figure S2: Charge potential (black line) with DEMS signal for O2 (red dots) and H2 (blue dots) for each charge
cycle without additives and for each additive in the order of No additive, Ag, Bi, In, In/Bi. The vertical blue lines
indicate what values are used to estimate production H2 and O2 production. The average production includes
the data point that the lines crossed and the five data points to its right. The gas evolution during headspace
gas purging before the charging starts is not included in any of the production numbers. Additionally, there are
3 data points taken at a faster sampling rate before and after charge. These are not used in any values in the
article and has the primary purpose of checking the purging is correct.
Table 1: Differential Electrochemical Mass Spectrometry (DEMS) data for O2 and H2 measured in µmol/h for Zn-air batteries with additives during each hour of charge.
No Additive Ag Bi In In+Bi
O2 H2 O2 H2 O2 H2 O2 H2 O2 H2
1 Charge 4.8 3.4 4.4 4.7 4.2 4.6 4.6 1.6 7.1 2.2
16.1 4.3 15.6 6.6 16.3 5.7 16.1 2.5 18.3 1.6
20.8 4.7 20.3 7.3 22.2 6.5 21.7 3.1 21.4 1.5
22.1 5.0 21.2 7.6 24.1 7.5 23.3 3.8 22.0 1.7
2 Charge 6.1 7.8 4.5 2.5 6.2 5.5 6.1 1.0 6.5 1.9
18.0 9.7 14.9 4.0 19.2 7.0 18.8 1.8 18.1 1.6
21.6 9.9 17.9 4.7 23.5 8.0 23.0 2.5 21.1 1.1
22.4 9.8 17.8 4.9 24.2 9.4 24.4 3.2 21.8 1.2
3 Charge 6.3 6.9 3.7 2.1 4.8 6.1 6.4 1.4 N/A N/A
18.1 8.5 13.9 3.4 17.1 7.6 19.3 2.2 N/A N/A
21.6 8.7 17.6 3.9 22.4 8.2 23.5 2.8 N/A N/A
22.3 8.5 18.1 4.5 24.2 8.8 24.6 3.4 N/A N/A
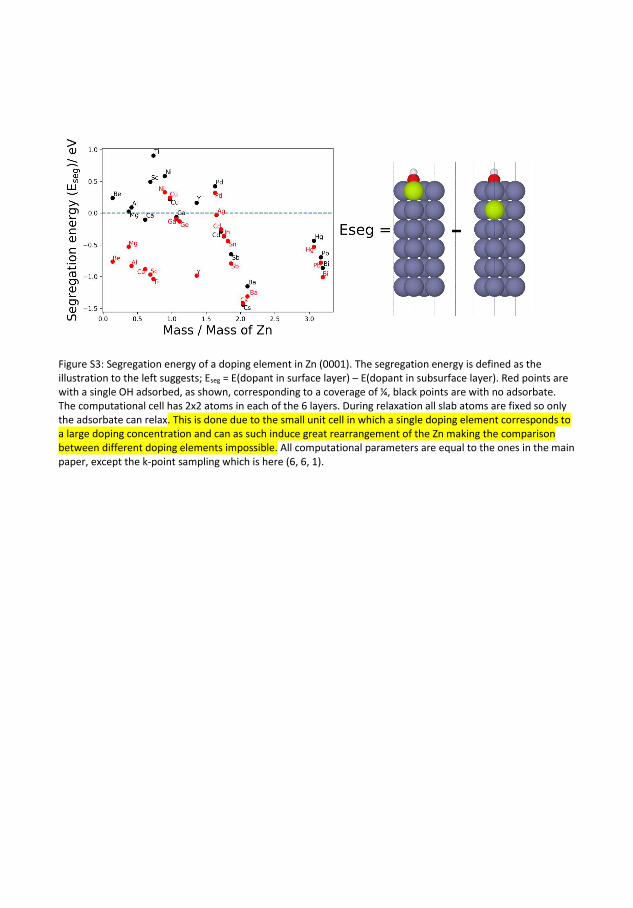
Figure S3: Segregation energy of a doping element in Zn (0001). The segregation energy is defined as the illustration to the left suggests; Eseg = E(dopant in surface layer) – E(dopant in subsurface layer). Red points are with a single OH adsorbed, as shown, corresponding to a coverage of ¼, black points are with no adsorbate. The computational cell has 2x2 atoms in each of the 6 layers. During relaxation all slab atoms are fixed so only the adsorbate can relax. This is done due to the small unit cell in which a single doping element corresponds to a large doping concentration and can as such induce great rearrangement of the Zn making the comparison between different doping elements impossible. All computational parameters are equal to the ones in the main paper, except the k-point sampling which is here (6, 6, 1).
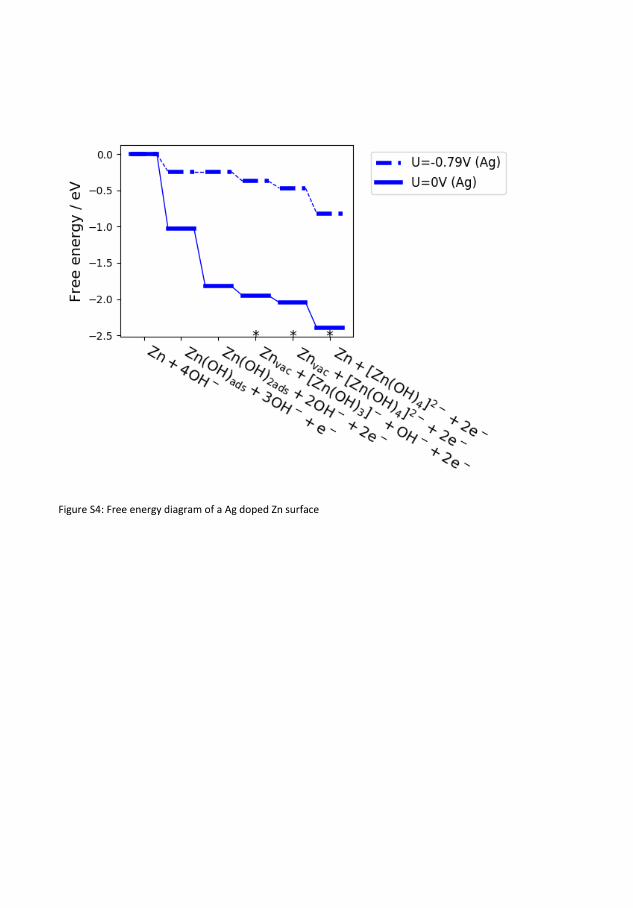
Figure S4: Free energy diagram of a Ag doped Zn surface

Paper II
102

Journal of Materials Chemistry A
ARTICLE
Please do not adjust margins
Please do not adjust margins
a. Department of Energy Conversion and Storage, Technical University of Denmark, 4000 Roskilde (Denmark).
b. Department of Chemistry and Nanoscience Center, University of Copenhagen, 2100, Copenhagen (Denmark)
c. * Corresponding author Electronic Supplementary Information (ESI) available: [details of any supplementary information available should be included here]. See DOI: 10.1039/x0xx00000x
Received 00th January 20xx, Accepted 00th January 20xx
DOI: 10.1039/x0xx00000x
www.rsc.org/
Transformation and migration in secondary zinc-air batteries studied by in situ synchrotron X-ray diffraction and X-ray tomography Mathias K. Christensen,a Jette Katja Mathiesen b, Søren Bredmose Simonsena and Poul Norby*a
There are numerous challenges associated with developing secondary Zn-air batteries regarding e.g. power density and cycle life. Some of the challenges are related to morphological changes in the anode during cycling due to combined electrochemical and chemical processes involved in the reversible Zn – ZnO transformation. We present a unique in situ synchrotron X-ray diffraction study, where a combination of time and spatial resolution allows information about transformation and transport in a Zn/ZnO anode during discharge/charge operation. By tracking Zn and ZnO reflections during cycling of two Zn-air batteries we see that the conversion of these phases is accompanied by transport into the anode and the anode configuration does not return to its initial state after recharge due to ZnO migration to other parts of the battery. During charge Zn metal is deposited as microcrystalline material, changing the morphology and phase distribution in the anode. The XRD results were supported by qualitative in situ X-ray computed tomography that confirms depletion of ZnO and non-homogeneous distribution of Zn.
Introduction With the increasing prevalence of intermittent renewable energy generation, the need for energy storage is becoming more important. Batteries are already being used towards this purpose and are anticipated in the future to contribute to an even larger degree1. The two most common battery types for this purpose are Li-ion and lead-acid batteries because of their high capacity and low price, respectively. With the ever-increasing demand, a battery that provides high energy storage capacity at low cost is needed. The Zn-air battery is an ideal candidate, due to the low price of zinc metal2 and the high theoretical specific energy (1300 Wh/kg). The specific energy obtained for current Zn-air batteries are reported between 350 and 500 Wh/kg1.3.4. Zn-air batteries obtain these high capacities due to the open nature configuration of the cell, where the cathode (O2) is outside the battery, leaving only an air electrode, electrolyte, separator and the active material to contribute to the weight. During discharge oxygen is reduced at the cathode:
O2 + 4 e- + 2H2O → 4OH-
The hydroxide ions migrate toward the anode and create zincate ions in the electrochemical reaction with Zn according to the reaction:
Zn + 4OH- → Zn(OH)42- + 2e-
Non-electrochemical precipitation of ZnO from zincate occurs according to:
Zn(OH)42-↔ ZnO + H2O + 2 OH-
Yielding the overall reaction (which is thereby a combination of an electrochemical and a chemical reaction):
2 Zn + O2 → 2 ZnO Zn has a long history of being applied in batteries and the Zn-air battery has been well-established commercially since 1933, although only as a primary battery as electrical rechargeability is challenging5. In order for secondary Zn-air battery technology to reach large scale application in the market it needs to have high cycle stability. Consequently, to achieve long cycle-life a number of challenges need to be overcome:
1. Obtain highly stable, efficient and bi-functional catalysts.
2. Reduce reaction of alkaline electrolytes with CO2, which leads to precipitation of K2CO3 in the pores and thereby choking of the air electrode.
3. Improve water management to reduce evaporation. 4. Hinder zinc dendrite formation. 5. Reduce self-corrosion and hydrogen formation of the
anode. 6. Control and anticipate shape/morphology changes
and redistribution of material in the anode during discharge/charge cycling.
This journal is © The Royal Society of Chemistry 20xx J. Name., 2013, 00, 1-3 | 1

ARTICLE Journal Name
Please do not adjust margins
Please do not adjust margins
Shape changes in the negative electrode are caused by: 1) Chemical expansion occurring due to the reaction of Zn to ZnO, causing the anode to expand and contract during cycling. Chemical expansion is the reason why commercial primary Zn-air button cells have a headspace to accommodate volume expansion6. 2) Transport of Zn species happens because the conversion between Zn and ZnO occurs through dissolved zincate ions, enabling non-electrochemical deposition of ZnO. This could lead to redistribution inside the electrode or migration to e.g. the separator or positive electrode. A secondary zinc-air cell would therefore experience not only expansion and contraction of the negative electrode but also morphology changes. Anodes need to be carefully designed and well understood to retain performance over many cycles. As shape changes and transport has a direct effect on the performance and reversibility of the Zn-air battery, this is an important parameter to investigate, and in situ studies are necessary in order to obtain detailed information in real time about the processes involved. Zn-air batteries have been investigated with the aim of understanding the mechanism of both primary and secondary batteries. Schröder et al. has applied tomography to commercial ZA13 button cell primary batteries to verify simulation results and found that zinc oxide formation initially occurs close to the separator and that Zn particles closest to the current collector would oxidize last during discharge. Associated with the conversion of Zn to ZnO a structural expansion factor for the Zn electrode of 1.5 was found. 7 In 2014 Arlt et. al. developed a Zn-air battery design suitable for x-ray computed tomography and used it to investigate electrolyte redistribution during discharge. They observed that flooding of the pores in the air electrode contributed to end of life for the cell8. Franke-Lang et. al. improved on the technique and demonstrated that modifying the density of the Zn-matrix in the anode to accommodate expansion could reduce the stress induced by the structural expansion. They also highlighted how parasitic reactions could result in gassing that would also deteriorate the anode 9. Nakata et. al. investigated artificially grown zinc dendrites and their effect on cycle life. It was shown that the zinc dendrites can be completely dissolved using low oxidation currents. Later they used in situ X-ray diffraction (XRD ) to investigate in-plane changes in the Zn electrode of a Zn/NiOOH battery and found that suppressing non-uniform Zn deposition would enhance cycle life.10,11
Zn/MnO batteries with an ionic liquid electrolyte have been investigated by Abad et. al. using synchrotron X-ray diffraction and XPS to study how Zn was converted to ZnO through a Zn(OH)2 intermediate12. In the present study we investigate morphology changes in a Zn-air battery and redistribution through the anode using time- and spatially resolved synchrotron X-ray diffraction. The anode is a mixture of Zn, ZnO in a paste-electrode; addition of ZnO to the anode facilitates ZnO deposition as it provides additional nucleation sites6. The goal is to increase the understanding of the redistribution and transport in the paste
anode and through this to be able to increase the cycle life of the battery.
Experimental In situ battery cells
The capillary-based in situ battery cell used in these experiments consisted of two sizes of borosilicate capillaries (Hilgenberg GmbH) with an OD of 3 mm and 2.4 mm and ID of 2 mm and 1.6 mm, respectively. The anode and cathode were contained in two pieces of the smaller capillary, which were inserted in a piece of the larger capillary, using a glass fiber separator and held in place with UV-glue U3200 and U3600 Cyberbond. The anode current collector was a 1.8 mm Cu-wire, which were inserted in the bottom of the glass pieces and held in place by UV glue. The Cu-wire was polished on the top to provide a smooth surface. The anode paste was made from 49.3wt. % Zn (Umicore BIA100), 21.1 wt. % ZnO (Umicore Pharma B) 28.2 wt. % electrolyte and 1.4 wt. % Cekol 30000P (CP Kelco), sodium Carboyxmethyl cellulose, gelling agent13. The electrolyte was added to the powders immediately before use and the entire anode glass part was weighed to determine the capacity. The weight of the anode for the two batteries used (named Zn1 and Zn2) was 10 mg and 9.2 mg, respectively, which yields an initial capacity of 4.0 mA and 3.75 mA. The cathode was made from NiCo2O4 and PTFE with a 0.5 mm thick Ni wire inserted into as a current collector. The cathode was prepared from a powder mixture of 85 wt. % NiCo2O4 powder (Cerpotech) and 15 wt. % PTFE (Sigma Aldrich) powder. The mixture was dispersed in 300 wt. % of isopropanol and homogenized using a magnetic stirrer for 10 minutes. The resulting slurry was filled into the capillary to a height of at least 1 cm and the nickel wire was inserted all the way through. The glass capillary with wet slurry and Ni wire was heated to 340 ° C for one hour in a furnace. The procedure was adapted from Wittmaier et al14. For XRD measurements at a synchrotron, the capillary cell was mounted in 3D printed PLA plastic frame, which holds the wires and contact clips (Figure 1a). The electrolyte was 6 M aqueous solution of KOH from pellets (Sigma Aldrich). The separator was made using 20 mm long 1 mm wide Whatman GF/A separator. The batteries were assembled immediately before being mounted at the beamline.
2 | J. Name., 2012, 00, 1-3 This journal is © The Royal Society of Chemistry 20xx
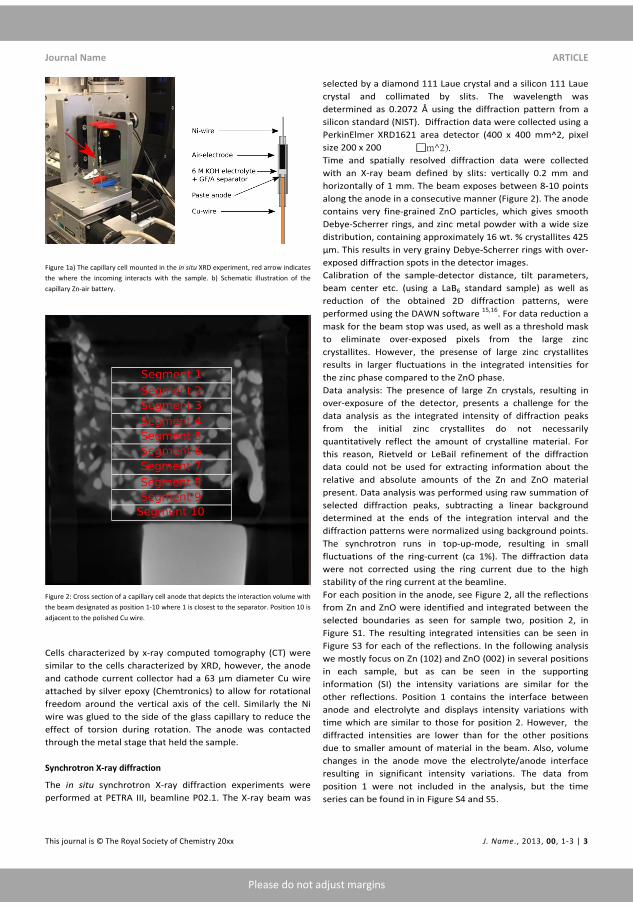
Journal Name ARTICLE
Please do not adjust margins
Please do not adjust margins
Figure 1a) The capillary cell mounted in the in situ XRD experiment, red arrow indicates the where the incoming interacts with the sample. b) Schematic illustration of the capillary Zn-air battery.
Figure 2: Cross section of a capillary cell anode that depicts the interaction volume with the beam designated as position 1-10 where 1 is closest to the separator. Position 10 is adjacent to the polished Cu wire.
Cells characterized by x-ray computed tomography (CT) were similar to the cells characterized by XRD, however, the anode and cathode current collector had a 63 μm diameter Cu wire attached by silver epoxy (Chemtronics) to allow for rotational freedom around the vertical axis of the cell. Similarly the Ni wire was glued to the side of the glass capillary to reduce the effect of torsion during rotation. The anode was contacted through the metal stage that held the sample. Synchrotron X-ray diffraction
The in situ synchrotron X-ray diffraction experiments were performed at PETRA III, beamline P02.1. The X-ray beam was
selected by a diamond 111 Laue crystal and a silicon 111 Laue crystal and collimated by slits. The wavelength was determined as 0.2072 Å using the diffraction pattern from a silicon standard (NIST). Diffraction data were collected using a PerkinElmer XRD1621 area detector (400 x 400 mm^2, pixel size 200 x 200 m^2). Time and spatially resolved diffraction data were collected with an X-ray beam defined by slits: vertically 0.2 mm and horizontally of 1 mm. The beam exposes between 8-10 points along the anode in a consecutive manner (Figure 2). The anode contains very fine-grained ZnO particles, which gives smooth Debye-Scherrer rings, and zinc metal powder with a wide size distribution, containing approximately 16 wt. % crystallites 425 µm. This results in very grainy Debye-Scherrer rings with over-exposed diffraction spots in the detector images. Calibration of the sample-detector distance, tilt parameters, beam center etc. (using a LaB6 standard sample) as well as reduction of the obtained 2D diffraction patterns, were performed using the DAWN software 15,16. For data reduction a mask for the beam stop was used, as well as a threshold mask to eliminate over-exposed pixels from the large zinc crystallites. However, the presense of large zinc crystallites results in larger fluctuations in the integrated intensities for the zinc phase compared to the ZnO phase. Data analysis: The presence of large Zn crystals, resulting in over-exposure of the detector, presents a challenge for the data analysis as the integrated intensity of diffraction peaks from the initial zinc crystallites do not necessarily quantitatively reflect the amount of crystalline material. For this reason, Rietveld or LeBail refinement of the diffraction data could not be used for extracting information about the relative and absolute amounts of the Zn and ZnO material present. Data analysis was performed using raw summation of selected diffraction peaks, subtracting a linear background determined at the ends of the integration interval and the diffraction patterns were normalized using background points. The synchrotron runs in top-up-mode, resulting in small fluctuations of the ring-current (ca 1%). The diffraction data were not corrected using the ring current due to the high stability of the ring current at the beamline. For each position in the anode, see Figure 2, all the reflections from Zn and ZnO were identified and integrated between the selected boundaries as seen for sample two, position 2, in Figure S1. The resulting integrated intensities can be seen in Figure S3 for each of the reflections. In the following analysis we mostly focus on Zn (102) and ZnO (002) in several positions in each sample, but as can be seen in the supporting information (SI) the intensity variations are similar for the other reflections. Position 1 contains the interface between anode and electrolyte and displays intensity variations with time which are similar to those for position 2. However, the diffracted intensities are lower than for the other positions due to smaller amount of material in the beam. Also, volume changes in the anode move the electrolyte/anode interface resulting in significant intensity variations. The data from position 1 were not included in the analysis, but the time series can be found in in Figure S4 and S5.
This journal is © The Royal Society of Chemistry 20xx J. Name., 2013, 00, 1-3 | 3
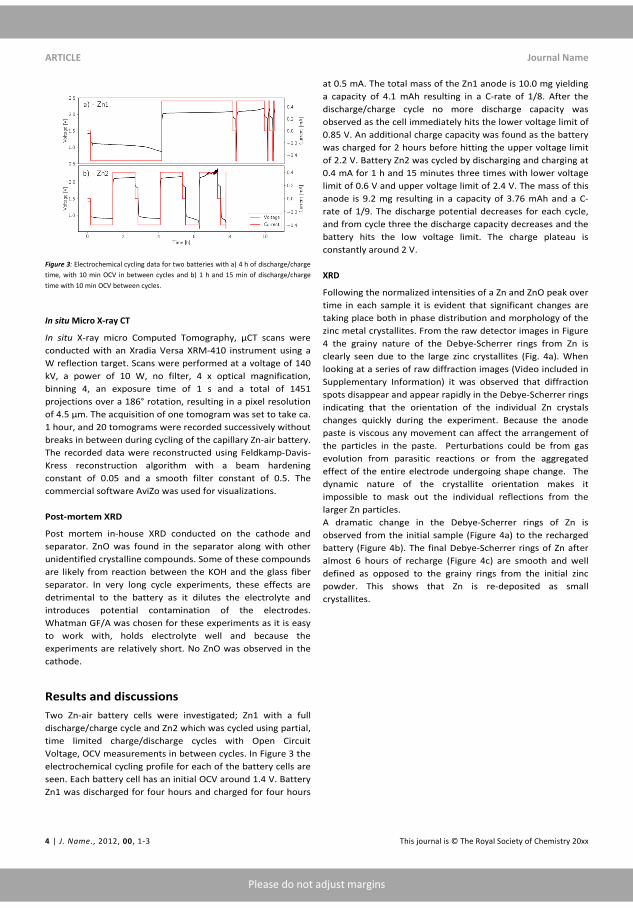
ARTICLE Journal Name
Please do not adjust margins
Please do not adjust margins
Figure 3: Electrochemical cycling data for two batteries with a) 4 h of discharge/charge time, with 10 min OCV in between cycles and b) 1 h and 15 min of discharge/charge time with 10 min OCV between cycles.
In situ Micro X-ray CT
In situ X-ray micro Computed Tomography, µCT scans were conducted with an Xradia Versa XRM-410 instrument using a W reflection target. Scans were performed at a voltage of 140 kV, a power of 10 W, no filter, 4 x optical magnification, binning 4, an exposure time of 1 s and a total of 1451 projections over a 186° rotation, resulting in a pixel resolution of 4.5 μm. The acquisition of one tomogram was set to take ca. 1 hour, and 20 tomograms were recorded successively without breaks in between during cycling of the capillary Zn-air battery. The recorded data were reconstructed using Feldkamp-Davis-Kress reconstruction algorithm with a beam hardening constant of 0.05 and a smooth filter constant of 0.5. The commercial software AviZo was used for visualizations. Post-mortem XRD
Post mortem in-house XRD conducted on the cathode and separator. ZnO was found in the separator along with other unidentified crystalline compounds. Some of these compounds are likely from reaction between the KOH and the glass fiber separator. In very long cycle experiments, these effects are detrimental to the battery as it dilutes the electrolyte and introduces potential contamination of the electrodes. Whatman GF/A was chosen for these experiments as it is easy to work with, holds electrolyte well and because the experiments are relatively short. No ZnO was observed in the cathode.
Results and discussions Two Zn-air battery cells were investigated; Zn1 with a full discharge/charge cycle and Zn2 which was cycled using partial, time limited charge/discharge cycles with Open Circuit Voltage, OCV measurements in between cycles. In Figure 3 the electrochemical cycling profile for each of the battery cells are seen. Each battery cell has an initial OCV around 1.4 V. Battery Zn1 was discharged for four hours and charged for four hours
at 0.5 mA. The total mass of the Zn1 anode is 10.0 mg yielding a capacity of 4.1 mAh resulting in a C-rate of 1/8. After the discharge/charge cycle no more discharge capacity was observed as the cell immediately hits the lower voltage limit of 0.85 V. An additional charge capacity was found as the battery was charged for 2 hours before hitting the upper voltage limit of 2.2 V. Battery Zn2 was cycled by discharging and charging at 0.4 mA for 1 h and 15 minutes three times with lower voltage limit of 0.6 V and upper voltage limit of 2.4 V. The mass of this anode is 9.2 mg resulting in a capacity of 3.76 mAh and a C-rate of 1/9. The discharge potential decreases for each cycle, and from cycle three the discharge capacity decreases and the battery hits the low voltage limit. The charge plateau is constantly around 2 V. XRD
Following the normalized intensities of a Zn and ZnO peak over time in each sample it is evident that significant changes are taking place both in phase distribution and morphology of the zinc metal crystallites. From the raw detector images in Figure 4 the grainy nature of the Debye-Scherrer rings from Zn is clearly seen due to the large zinc crystallites (Fig. 4a). When looking at a series of raw diffraction images (Video included in Supplementary Information) it was observed that diffraction spots disappear and appear rapidly in the Debye-Scherrer rings indicating that the orientation of the individual Zn crystals changes quickly during the experiment. Because the anode paste is viscous any movement can affect the arrangement of the particles in the paste. Perturbations could be from gas evolution from parasitic reactions or from the aggregated effect of the entire electrode undergoing shape change. The dynamic nature of the crystallite orientation makes it impossible to mask out the individual reflections from the larger Zn particles. A dramatic change in the Debye-Scherrer rings of Zn is observed from the initial sample (Figure 4a) to the recharged battery (Figure 4b). The final Debye-Scherrer rings of Zn after almost 6 hours of recharge (Figure 4c) are smooth and well defined as opposed to the grainy rings from the initial zinc powder. This shows that Zn is re-deposited as small crystallites.
4 | J. Name., 2012, 00, 1-3 This journal is © The Royal Society of Chemistry 20xx
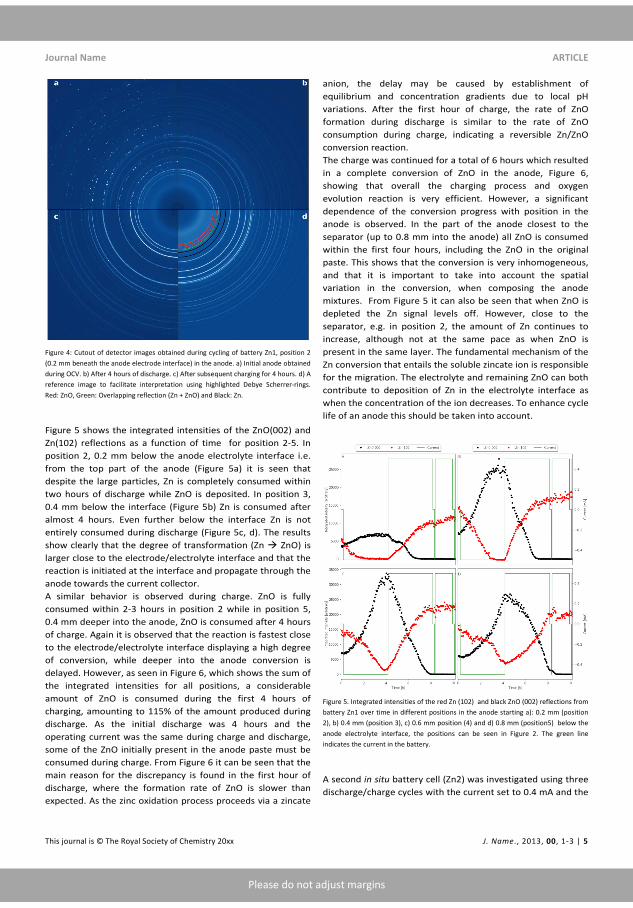
Journal Name ARTICLE
Please do not adjust margins
Please do not adjust margins
Figure 4: Cutout of detector images obtained during cycling of battery Zn1, position 2 (0.2 mm beneath the anode electrode interface) in the anode. a) Initial anode obtained during OCV. b) After 4 hours of discharge. c) After subsequent charging for 4 hours. d) A reference image to facilitate interpretation using highlighted Debye Scherrer-rings. Red: ZnO, Green: Overlapping reflection (Zn + ZnO) and Black: Zn.
Figure 5 shows the integrated intensities of the ZnO(002) and Zn(102) reflections as a function of time for position 2-5. In position 2, 0.2 mm below the anode electrolyte interface i.e. from the top part of the anode (Figure 5a) it is seen that despite the large particles, Zn is completely consumed within two hours of discharge while ZnO is deposited. In position 3, 0.4 mm below the interface (Figure 5b) Zn is consumed after almost 4 hours. Even further below the interface Zn is not entirely consumed during discharge (Figure 5c, d). The results show clearly that the degree of transformation (Zn ZnO) is larger close to the electrode/electrolyte interface and that the reaction is initiated at the interface and propagate through the anode towards the current collector. A similar behavior is observed during charge. ZnO is fully consumed within 2-3 hours in position 2 while in position 5, 0.4 mm deeper into the anode, ZnO is consumed after 4 hours of charge. Again it is observed that the reaction is fastest close to the electrode/electrolyte interface displaying a high degree of conversion, while deeper into the anode conversion is delayed. However, as seen in Figure 6, which shows the sum of the integrated intensities for all positions, a considerable amount of ZnO is consumed during the first 4 hours of charging, amounting to 115% of the amount produced during discharge. As the initial discharge was 4 hours and the operating current was the same during charge and discharge, some of the ZnO initially present in the anode paste must be consumed during charge. From Figure 6 it can be seen that the main reason for the discrepancy is found in the first hour of discharge, where the formation rate of ZnO is slower than expected. As the zinc oxidation process proceeds via a zincate
anion, the delay may be caused by establishment of equilibrium and concentration gradients due to local pH variations. After the first hour of charge, the rate of ZnO formation during discharge is similar to the rate of ZnO consumption during charge, indicating a reversible Zn/ZnO conversion reaction. The charge was continued for a total of 6 hours which resulted in a complete conversion of ZnO in the anode, Figure 6, showing that overall the charging process and oxygen evolution reaction is very efficient. However, a significant dependence of the conversion progress with position in the anode is observed. In the part of the anode closest to the separator (up to 0.8 mm into the anode) all ZnO is consumed within the first four hours, including the ZnO in the original paste. This shows that the conversion is very inhomogeneous, and that it is important to take into account the spatial variation in the conversion, when composing the anode mixtures. From Figure 5 it can also be seen that when ZnO is depleted the Zn signal levels off. However, close to the separator, e.g. in position 2, the amount of Zn continues to increase, although not at the same pace as when ZnO is present in the same layer. The fundamental mechanism of the Zn conversion that entails the soluble zincate ion is responsible for the migration. The electrolyte and remaining ZnO can both contribute to deposition of Zn in the electrolyte interface as when the concentration of the ion decreases. To enhance cycle life of an anode this should be taken into account.
Figure 5. Integrated intensities of the red Zn (102) and black ZnO (002) reflections from battery Zn1 over time in different positions in the anode starting a): 0.2 mm (position 2), b) 0.4 mm (position 3), c) 0.6 mm position (4) and d) 0.8 mm (position5) below the anode electrolyte interface, the positions can be seen in Figure 2. The green line indicates the current in the battery.
A second in situ battery cell (Zn2) was investigated using three discharge/charge cycles with the current set to 0.4 mA and the
This journal is © The Royal Society of Chemistry 20xx J. Name., 2013, 00, 1-3 | 5
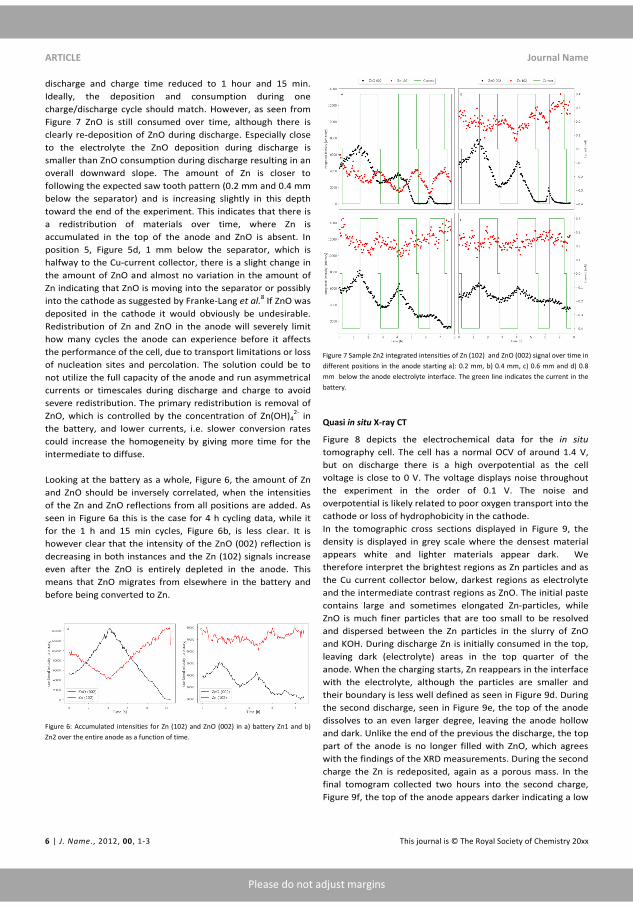
ARTICLE Journal Name
Please do not adjust margins
Please do not adjust margins
discharge and charge time reduced to 1 hour and 15 min. Ideally, the deposition and consumption during one charge/discharge cycle should match. However, as seen from Figure 7 ZnO is still consumed over time, although there is clearly re-deposition of ZnO during discharge. Especially close to the electrolyte the ZnO deposition during discharge is smaller than ZnO consumption during discharge resulting in an overall downward slope. The amount of Zn is closer to following the expected saw tooth pattern (0.2 mm and 0.4 mm below the separator) and is increasing slightly in this depth toward the end of the experiment. This indicates that there is a redistribution of materials over time, where Zn is accumulated in the top of the anode and ZnO is absent. In position 5, Figure 5d, 1 mm below the separator, which is halfway to the Cu-current collector, there is a slight change in the amount of ZnO and almost no variation in the amount of Zn indicating that ZnO is moving into the separator or possibly into the cathode as suggested by Franke-Lang et al.8 If ZnO was deposited in the cathode it would obviously be undesirable. Redistribution of Zn and ZnO in the anode will severely limit how many cycles the anode can experience before it affects the performance of the cell, due to transport limitations or loss of nucleation sites and percolation. The solution could be to not utilize the full capacity of the anode and run asymmetrical currents or timescales during discharge and charge to avoid severe redistribution. The primary redistribution is removal of ZnO, which is controlled by the concentration of Zn(OH)4
2- in the battery, and lower currents, i.e. slower conversion rates could increase the homogeneity by giving more time for the intermediate to diffuse. Looking at the battery as a whole, Figure 6, the amount of Zn and ZnO should be inversely correlated, when the intensities of the Zn and ZnO reflections from all positions are added. As seen in Figure 6a this is the case for 4 h cycling data, while it for the 1 h and 15 min cycles, Figure 6b, is less clear. It is however clear that the intensity of the ZnO (002) reflection is decreasing in both instances and the Zn (102) signals increase even after the ZnO is entirely depleted in the anode. This means that ZnO migrates from elsewhere in the battery and before being converted to Zn.
Figure 6: Accumulated intensities for Zn (102) and ZnO (002) in a) battery Zn1 and b) Zn2 over the entire anode as a function of time.
Figure 7 Sample Zn2 integrated intensities of Zn (102) and ZnO (002) signal over time in different positions in the anode starting a): 0.2 mm, b) 0.4 mm, c) 0.6 mm and d) 0.8 mm below the anode electrolyte interface. The green line indicates the current in the battery.
Quasi in situ X-ray CT
Figure 8 depicts the electrochemical data for the in situ tomography cell. The cell has a normal OCV of around 1.4 V, but on discharge there is a high overpotential as the cell voltage is close to 0 V. The voltage displays noise throughout the experiment in the order of 0.1 V. The noise and overpotential is likely related to poor oxygen transport into the cathode or loss of hydrophobicity in the cathode. In the tomographic cross sections displayed in Figure 9, the density is displayed in grey scale where the densest material appears white and lighter materials appear dark. We therefore interpret the brightest regions as Zn particles and as the Cu current collector below, darkest regions as electrolyte and the intermediate contrast regions as ZnO. The initial paste contains large and sometimes elongated Zn-particles, while ZnO is much finer particles that are too small to be resolved and dispersed between the Zn particles in the slurry of ZnO and KOH. During discharge Zn is initially consumed in the top, leaving dark (electrolyte) areas in the top quarter of the anode. When the charging starts, Zn reappears in the interface with the electrolyte, although the particles are smaller and their boundary is less well defined as seen in Figure 9d. During the second discharge, seen in Figure 9e, the top of the anode dissolves to an even larger degree, leaving the anode hollow and dark. Unlike the end of the previous the discharge, the top part of the anode is no longer filled with ZnO, which agrees with the findings of the XRD measurements. During the second charge the Zn is redeposited, again as a porous mass. In the final tomogram collected two hours into the second charge, Figure 9f, the top of the anode appears darker indicating a low
6 | J. Name., 2012, 00, 1-3 This journal is © The Royal Society of Chemistry 20xx
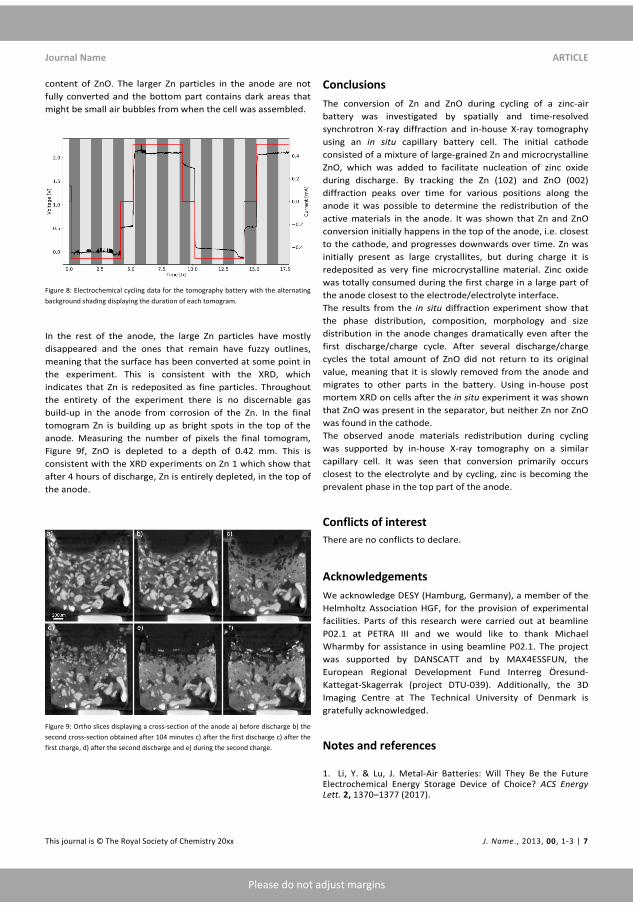
Journal Name ARTICLE
Please do not adjust margins
Please do not adjust margins
content of ZnO. The larger Zn particles in the anode are not fully converted and the bottom part contains dark areas that might be small air bubbles from when the cell was assembled.
Figure 8: Electrochemical cycling data for the tomography battery with the alternating background shading displaying the duration of each tomogram.
In the rest of the anode, the large Zn particles have mostly disappeared and the ones that remain have fuzzy outlines, meaning that the surface has been converted at some point in the experiment. This is consistent with the XRD, which indicates that Zn is redeposited as fine particles. Throughout the entirety of the experiment there is no discernable gas build-up in the anode from corrosion of the Zn. In the final tomogram Zn is building up as bright spots in the top of the anode. Measuring the number of pixels the final tomogram, Figure 9f, ZnO is depleted to a depth of 0.42 mm. This is consistent with the XRD experiments on Zn 1 which show that after 4 hours of discharge, Zn is entirely depleted, in the top of the anode.
Figure 9: Ortho slices displaying a cross-section of the anode a) before discharge b) the second cross-section obtained after 104 minutes c) after the first discharge c) after the first charge, d) after the second discharge and e) during the second charge.
Conclusions The conversion of Zn and ZnO during cycling of a zinc-air battery was investigated by spatially and time-resolved synchrotron X-ray diffraction and in-house X-ray tomography using an in situ capillary battery cell. The initial cathode consisted of a mixture of large-grained Zn and microcrystalline ZnO, which was added to facilitate nucleation of zinc oxide during discharge. By tracking the Zn (102) and ZnO (002) diffraction peaks over time for various positions along the anode it was possible to determine the redistribution of the active materials in the anode. It was shown that Zn and ZnO conversion initially happens in the top of the anode, i.e. closest to the cathode, and progresses downwards over time. Zn was initially present as large crystallites, but during charge it is redeposited as very fine microcrystalline material. Zinc oxide was totally consumed during the first charge in a large part of the anode closest to the electrode/electrolyte interface. The results from the in situ diffraction experiment show that the phase distribution, composition, morphology and size distribution in the anode changes dramatically even after the first discharge/charge cycle. After several discharge/charge cycles the total amount of ZnO did not return to its original value, meaning that it is slowly removed from the anode and migrates to other parts in the battery. Using in-house post mortem XRD on cells after the in situ experiment it was shown that ZnO was present in the separator, but neither Zn nor ZnO was found in the cathode. The observed anode materials redistribution during cycling was supported by in-house X-ray tomography on a similar capillary cell. It was seen that conversion primarily occurs closest to the electrolyte and by cycling, zinc is becoming the prevalent phase in the top part of the anode.
Conflicts of interest There are no conflicts to declare.
Acknowledgements We acknowledge DESY (Hamburg, Germany), a member of the Helmholtz Association HGF, for the provision of experimental facilities. Parts of this research were carried out at beamline P02.1 at PETRA III and we would like to thank Michael Wharmby for assistance in using beamline P02.1. The project was supported by DANSCATT and by MAX4ESSFUN, the European Regional Development Fund Interreg Öresund-Kattegat-Skagerrak (project DTU-039). Additionally, the 3D Imaging Centre at The Technical University of Denmark is gratefully acknowledged.
Notes and references 1. Li, Y. & Lu, J. Metal-Air Batteries: Will They Be the Future Electrochemical Energy Storage Device of Choice? ACS Energy Lett. 2, 1370–1377 (2017).
This journal is © The Royal Society of Chemistry 20xx J. Name., 2013, 00, 1-3 | 7

ARTICLE Journal Name
Please do not adjust margins
Please do not adjust margins
2. Vesborg, P. C. K. & Jaramillo, T. F. Addressing the terawatt challenge: Scalability in the supply of chemical elements for renewable energy. RSC Adv. 2, 7933–7947 (2012). 3. Davari, E. & Ivey, D. Bifunctional Electrocatalysts for Zn-air Batteries. Sustain. Energy Fuels 39–67 (2017). doi:10.1039/C7SE00413C 4. Xu, M., Ivey, D. G., Xie, Z. & Qu, W. Rechargeable Zn-air batteries: Progress in electrolyte development and cell configuration advancement. J. Power Sources 283, 358–371 (2015). 5. Heise, G. W. Air depolarized primary battery. (1933). 6. Stamm, J., Varzi, A., Latz, A. & Horstmann, B. Modeling nucleation and growth of zinc oxide during discharge of primary zinc-air batteries. J. Power Sources 360, 136–149 (2017). 7. Arlt, T., Schröder, D., Krewer, U. & Manke, I. In operando monitoring of the state of charge and species distribution in zinc air batteries using X-ray tomography and model-based simulations. Phys. Chem. Chem. Phys. 16, 22273–22280 (2014). 8. Franke-Lang, R., Arlt, T., Manke, I. & Kowal, J. X-ray tomography as a powerful method for zinc-air battery research. J. Power Sources 370, 45–51 (2017). 9. Schröder, D., Arlt, T., Krewer, U. & Manke, I. Analyzing transport paths in the air electrode of a zinc air battery using X-ray tomography. Electrochem. commun. 40, 88–91 (2014). 10. Nakata, A. et al. Transformation of leaf-like zinc dendrite in oxidation and reduction cycle. Electrochim. Acta 166, 82–87 (2015). 11. Nakata, A. et al. In situ Zn/ZnO mapping elucidating for ‘shape change’ of zinc electrode. APL Mater. 6, (2018). 12. Abad, J. et al. A synchrotron x-ray diffraction and hard x-ray photoelectron spectroscopy study of Zn negative electrodes at different charge and discharge states of Zn/MnO2batteries using an ionic liquid-based gel polymer electrolyte. J. Power Sources 363, 199–208 (2017). 13. Mainar, A. R., Iruin, E., Colmenares, L. C., Blázquez, J. A. & Grande, H. Systematic cycle life assessment of a secondary zinc – air battery as a function of the alkaline electrolyte composition. (2018). doi:10.1002/ese3.191 14. Wittmaier, D., Cañas, N. A., Biswas, I. & Friedrich, K. A. Highly Stable Carbon-Free Ag/Co3O4-Cathodes for Lithium-Air Batteries: Electrochemical and Structural Investigations. Adv. Energy Mater. 5, 1–8 (2015). 15. Filik, J. et al. Processing two-dimensional X-ray diffraction and small-angle scattering data in DAWN 2. J. Appl. Crystallogr. 50, 959–966 (2017). 16. Basham, M. et al. Data Analysis WorkbeNch (DAWN). J. Synchrotron Radiat. 22, 853–858 (2015).
8 | J. Name., 2012, 00, 1-3 This journal is © The Royal Society of Chemistry 20xx

Supporting information
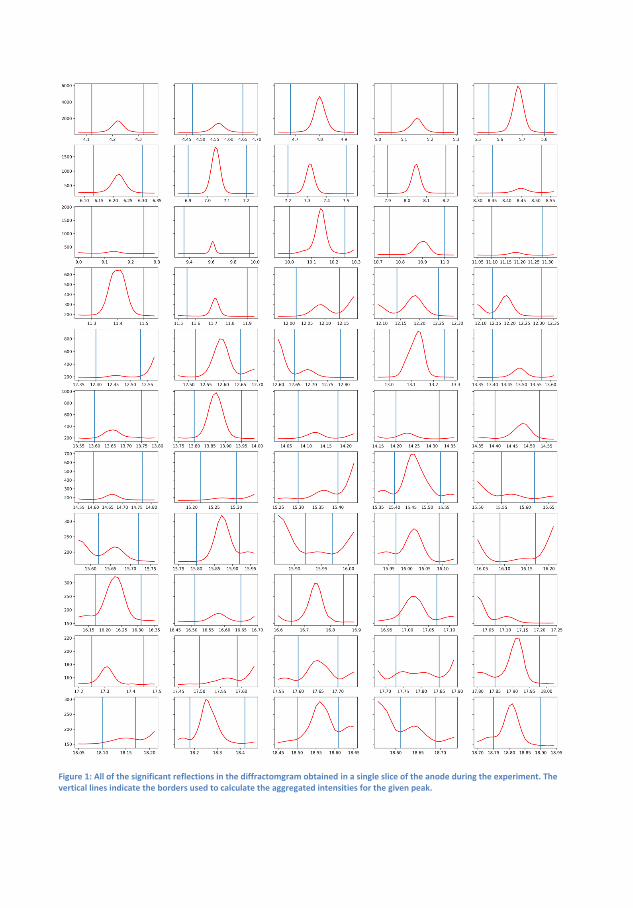
Figure 1: All of the significant reflections in the diffractomgram obtained in a single slice of the anode during the experiment. The vertical lines indicate the borders used to calculate the aggregated intensities for the given peak.
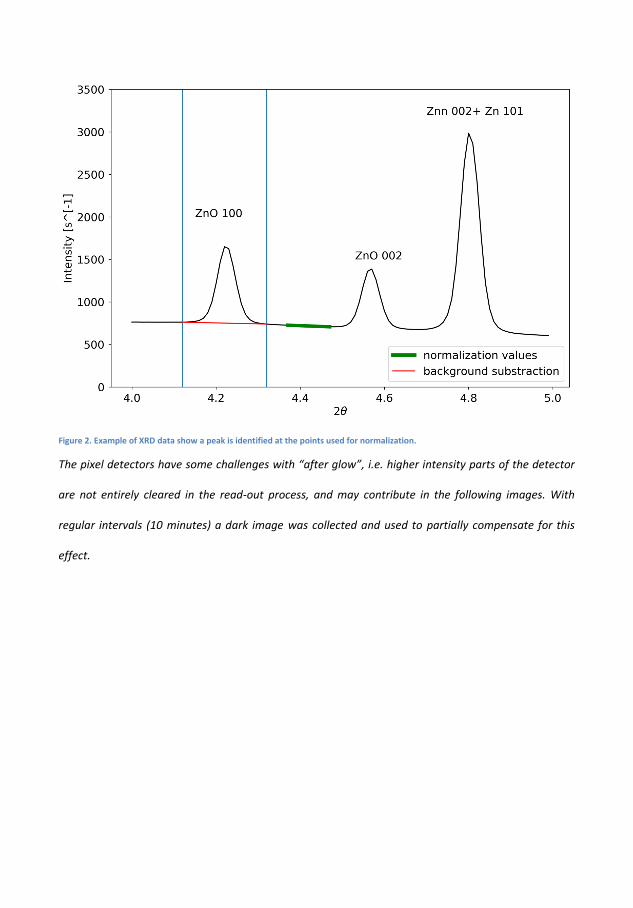
Figure 2. Example of XRD data show a peak is identified at the points used for normalization.
The pixel detectors have some challenges with “after glow”, i.e. higher intensity parts of the detector
are not entirely cleared in the read-out process, and may contribute in the following images. With
regular intervals (10 minutes) a dark image was collected and used to partially compensate for this
effect.
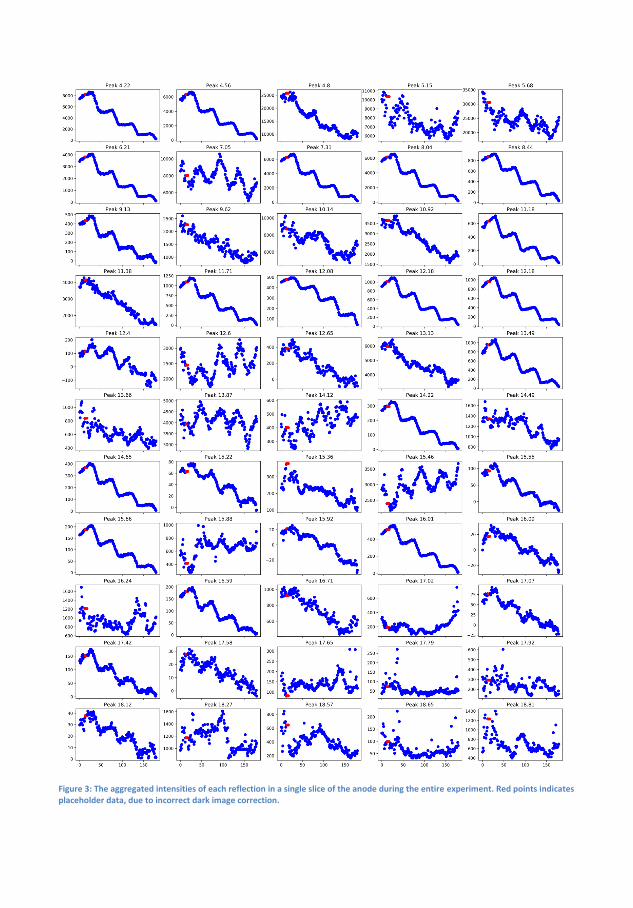
Figure 3: The aggregated intensities of each reflection in a single slice of the anode during the entire experiment. Red points indicates placeholder data, due to incorrect dark image correction.
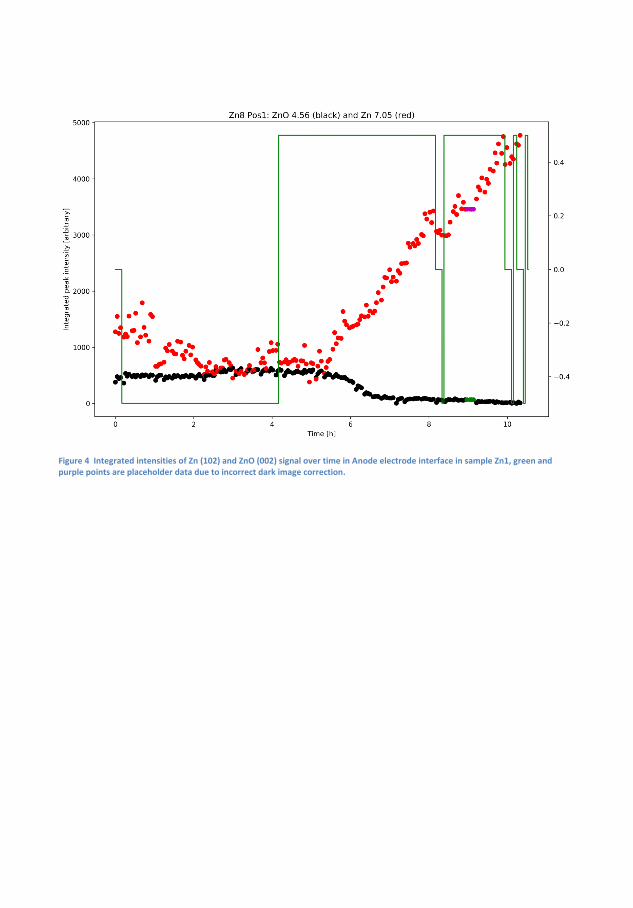
Figure 4 Integrated intensities of Zn (102) and ZnO (002) signal over time in Anode electrode interface in sample Zn1, green and purple points are placeholder data due to incorrect dark image correction.
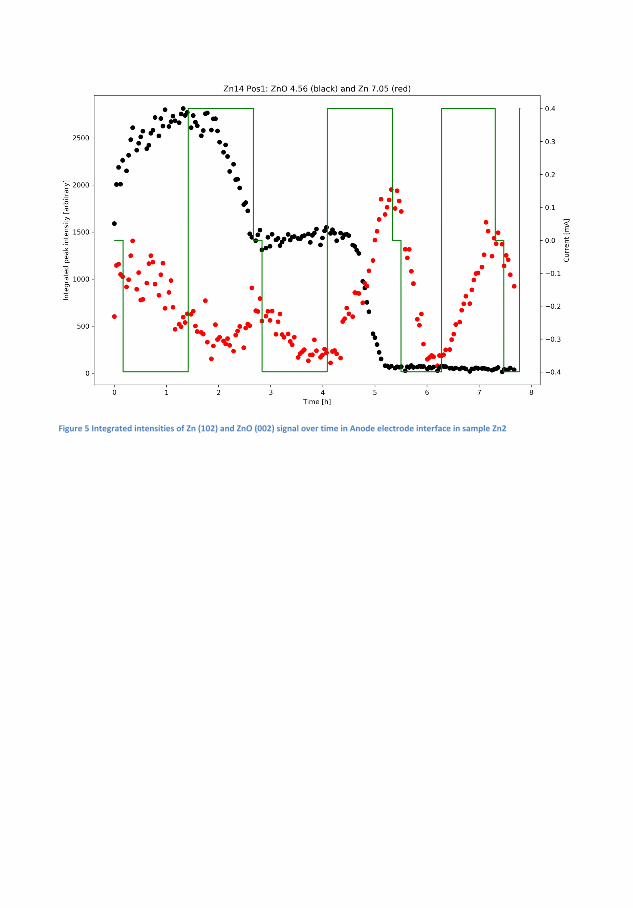
Figure 5 Integrated intensities of Zn (102) and ZnO (002) signal over time in Anode electrode interface in sample Zn2
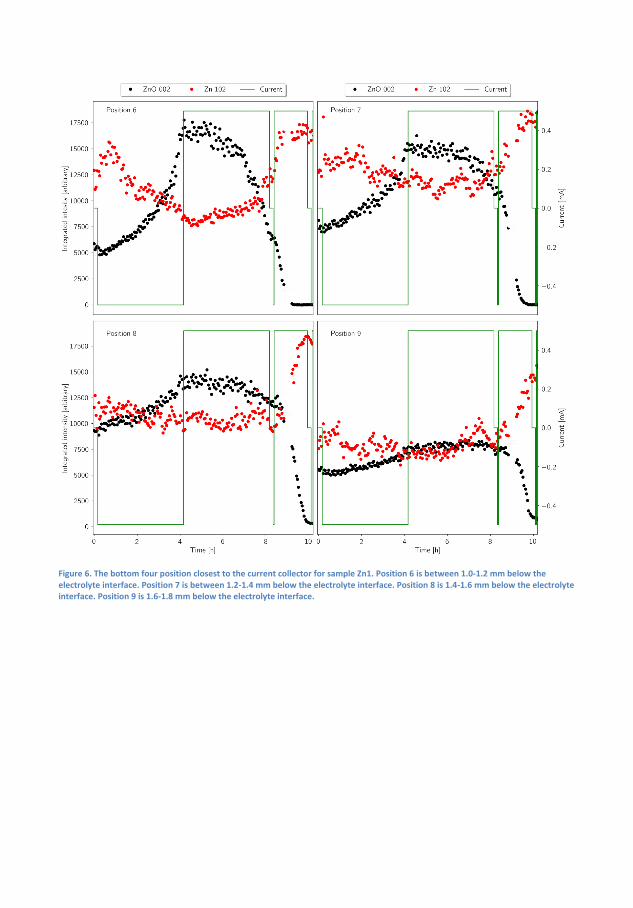
Figure 6. The bottom four position closest to the current collector for sample Zn1. Position 6 is between 1.0-1.2 mm below the electrolyte interface. Position 7 is between 1.2-1.4 mm below the electrolyte interface. Position 8 is 1.4-1.6 mm below the electrolyte interface. Position 9 is 1.6-1.8 mm below the electrolyte interface.
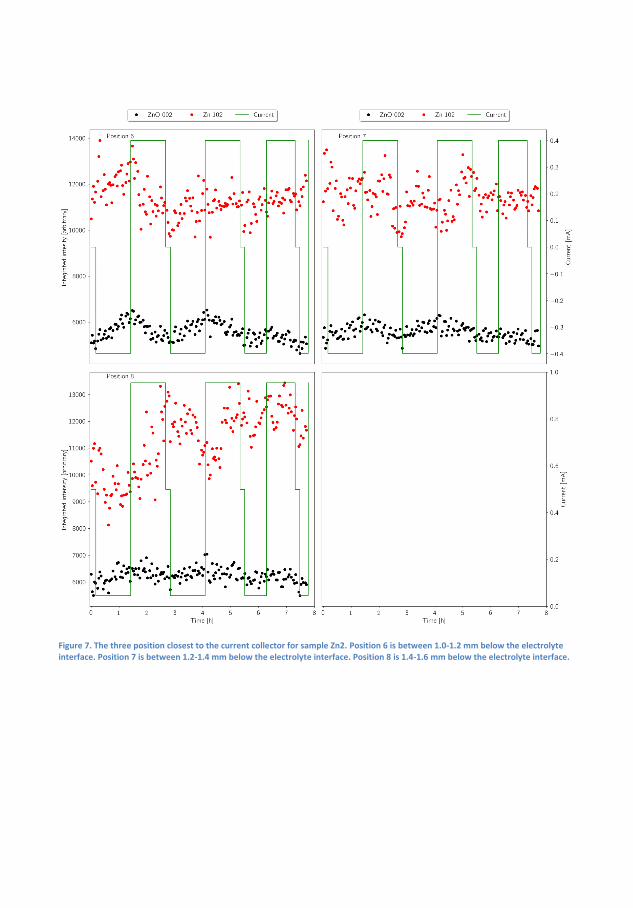
Figure 7. The three position closest to the current collector for sample Zn2. Position 6 is between 1.0-1.2 mm below the electrolyte interface. Position 7 is between 1.2-1.4 mm below the electrolyte interface. Position 8 is 1.4-1.6 mm below the electrolyte interface.

Paper III
119
DEMS investigation of Alkaline Zn-air
batteries
Mathias K. Christensen [a] and Poul Norby* [a]
[a] Department of Energy Conversion and Storage
Technical University of Denmark, 4000 Roskilde (Denmark)
Email: M. K. Christensen: [email protected], P. Norby: [email protected]
ORCID: P. Norby 0000-0002-2590-7050
Introduction
Electrochemical energy storage has received increasing attention in recent years due to the increasing
prevalence of intermittent renewable energy. A solution such as pumped hydroelectricity is the largest
contributor to stored energy, but this technology is hard to implement in some locations. Electrochemical
energy is therefore considered to become increasingly important for this role. There is a variety of possible
solutions such as the lead-acid battery or the Li-ion, where the focus is increasingly on the latter. However,
both of these technologies are reaching their limit [reference] and sufficient availability of raw materials such
as Co, for current Li-ion batteries is not certain. Other electrochemical devices such as metal-air batteries or
organic flow batteries could provide high capacity, low cost storage with relatively abundant materials.
Metal-air batteries while attractive due to their high energy storage capacity are difficult to realize.
Additionally, they are not considered ideal for vehicular or mobile applications due to power limitations and
need for air purification. Zn-air batteries are considered the most commercially successful as they have been
commercially available as primary batteries since 19331. The theoretical specific energy is about 3 times higher
than current Li-ion batteries, although practical applications are roughly comparable. However, for these
batteries to obtain a central role as secondary batteries and energy storage devices improved energy
efficiency, higher power density and long cycle life are required. Currently this is limited by self corrosion,
dendrite formation, CO2 absorption in the air electrode and the need for high performance bi-functional
catalysts for ORR (Oxygen reduction) and OER (Oxygen evolution) reactions.
To gain insights into these problems in situ techniques can be applied to elucidate various effects. X-rays can be
applied to find structural or surface information. Methods such as Rotating disc electrode, RDE, can be applied
to characterize and quantify what species are in solution. This has been done e.g. by Goh et al, who
investigated an Ag nanoparticle-MnO2 air electrode and determined the electron transfer numbers for this
catalyst to be 3.7 during ORR 2. Hu et. al. studied a similar Ag-MnO2/Single Wall carbon nanotube catalyst and
found values between 3.4 and 3.83. This was suggested to originate from the MnO catalyst’s slight affinity
towards partial oxidation of O2 to HO2- , a two electron reaction4. While Ag provides excellent activity towards
the 4 electron pathway for ORR5, it is not ideal for alkaline Zn-air batteries as Ag enhances the self-corrosion
when mixed into the Zn-surface6. In the present paper we apply Differential Electrochemical Mass
Spectrometry DEMS7,8 to investigate gas output and composition and determine the electron transfer numbers
of full Zn-air batteries using pressure measurements and mass spectrometer analysis. Using this setup it is
possible to determine the electron to oxygen ratio using the formula:
𝑛𝑒−/𝑂2=
∆ 𝑄 ∗ 𝑅 ∗ 𝑇
∆𝑃 ∗ 𝑉 ∗ 𝐹
Where Q is the charge passed during the measurement, F is faradays constant, P is the pressure, R is the Ideal
gas constant and T is the temperature in K. In practice rather than calculating these numbers by insertion, a
pressure line is created and linear regression is used to determine 𝑛𝑒−/𝑂2 from agreement between the
calculated and measured pressure profiles.
Experimental
Two Zn-air batteries were assembled in an ECC-Air-Ni battery test cell from EL-Cell Gmbh and tested
galvanostatically in a two-electrode configuration. The anode was a 18 mm diameter, 0.125 mm thick 99.95 %
pure Zn foil (Goodfellow) punched out using an MTI disc cutting tool. The anode was placed on 99.99% pure 8
m thick Cu foil from MTI Corp. The electrolyte was 200 L 6 M KOH made from >85 % pure KOH pellets (Sigma
Aldrich). Two Whatman GF/A separators were used.
The cathode was made with 39 wt % NiCo2O4 powder(Cerpotech), 23 wt % Ni powder (Strem Chemicals, 3-
7m), 23 % Ni powder (Alfa Aesar, 150-200 mesh) and 15 wt % PTFE (Sigma-Aldrich) with a total loading of 157
±25 mg cm-2. The powders were dry mixed, compressed at 3 bar per 18 cm2 onto a Ni 40 mesh (Alfa Aesar) and
heated at 340 OC for 1 hour. Each cathode was cut to 18 mm diameter on a MTI disc cutting tool.
The electrochemical cycling was conducted using galvanostatic cycling at 2.54 mA (1 mA/cm2 for the
electrodes) for 4 hours with voltage limits of 0.95 V and 2.2 V. The cycling was preceded by 1 h of OCV
measurement. Battery 1 had 40 minutes of wait time between each transition to check for leaks. For battery 2
the cell was purged for 1 h before the charge started to remove trace O2. The gas evolution that was collected
in the headspace of the cell was collected and quantified every 10 minutes throughout the 4 hour charge. To
quantify the gas evolution using the mass spectrometer the volumes of the setup and the EL-cell were
determined using calibration gasses using known quantities of the relevant gasses.
Results and discussion
The first Zn-air battery was cycled 3 times at 1mA/cm2 while connected to a hermetically sealed compartment
of the DEMS setup filled with pure O2. The cycling profile can be seen in Figure 1, where a flat discharge plateau
above 1.3 V is observed in all three cycles although the voltage decreases to just below this value after the full
discharge time. During charge there is a slight shoulder in the charging profile above 1.8 V before stabilization
into a plateau that starts at 1.94 V and increases to almost 2 V by the end of the charge. Between the first
charge and second discharge there is a shoulder similar to the one for the first charge. This shoulder is found to
be to related to the cathode: When a charged air electrode is transferred to a pristine battery it displays the
same feature around 1.7V before the initial discharge. This indicates that the surface of the air electrode is
slightly oxidized during charge and needs to be reduced before discharge. In the subsequent charge cycles the
profile is the same with slight increases in overpotential as the cycle number grows.
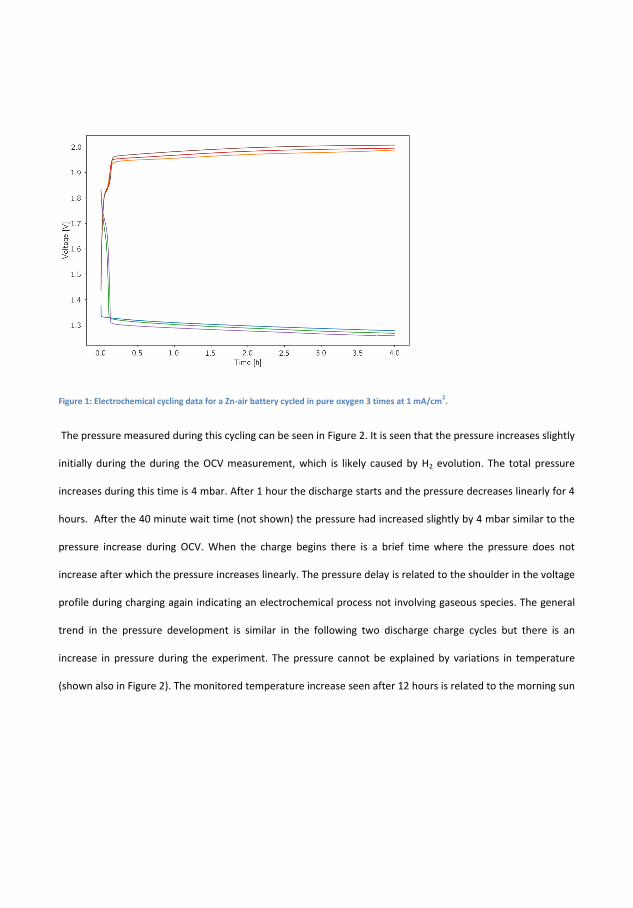
Figure 1: Electrochemical cycling data for a Zn-air battery cycled in pure oxygen 3 times at 1 mA/cm2.
The pressure measured during this cycling can be seen in Figure 2. It is seen that the pressure increases slightly
initially during the during the OCV measurement, which is likely caused by H2 evolution. The total pressure
increases during this time is 4 mbar. After 1 hour the discharge starts and the pressure decreases linearly for 4
hours. After the 40 minute wait time (not shown) the pressure had increased slightly by 4 mbar similar to the
pressure increase during OCV. When the charge begins there is a brief time where the pressure does not
increase after which the pressure increases linearly. The pressure delay is related to the shoulder in the voltage
profile during charging again indicating an electrochemical process not involving gaseous species. The general
trend in the pressure development is similar in the following two discharge charge cycles but there is an
increase in pressure during the experiment. The pressure cannot be explained by variations in temperature
(shown also in Figure 2). The monitored temperature increase seen after 12 hours is related to the morning sun
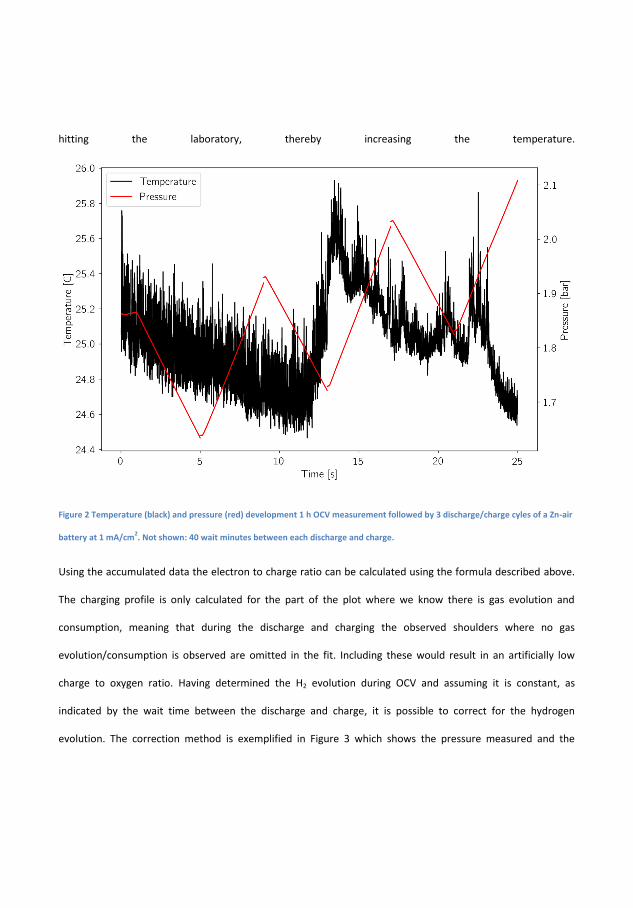
hitting the laboratory, thereby increasing the temperature.
Figure 2 Temperature (black) and pressure (red) development 1 h OCV measurement followed by 3 discharge/charge cyles of a Zn-air
battery at 1 mA/cm2. Not shown: 40 wait minutes between each discharge and charge.
Using the accumulated data the electron to charge ratio can be calculated using the formula described above.
The charging profile is only calculated for the part of the plot where we know there is gas evolution and
consumption, meaning that during the discharge and charging the observed shoulders where no gas
evolution/consumption is observed are omitted in the fit. Including these would result in an artificially low
charge to oxygen ratio. Having determined the H2 evolution during OCV and assuming it is constant, as
indicated by the wait time between the discharge and charge, it is possible to correct for the hydrogen
evolution. The correction method is exemplified in Figure 3 which shows the pressure measured and the
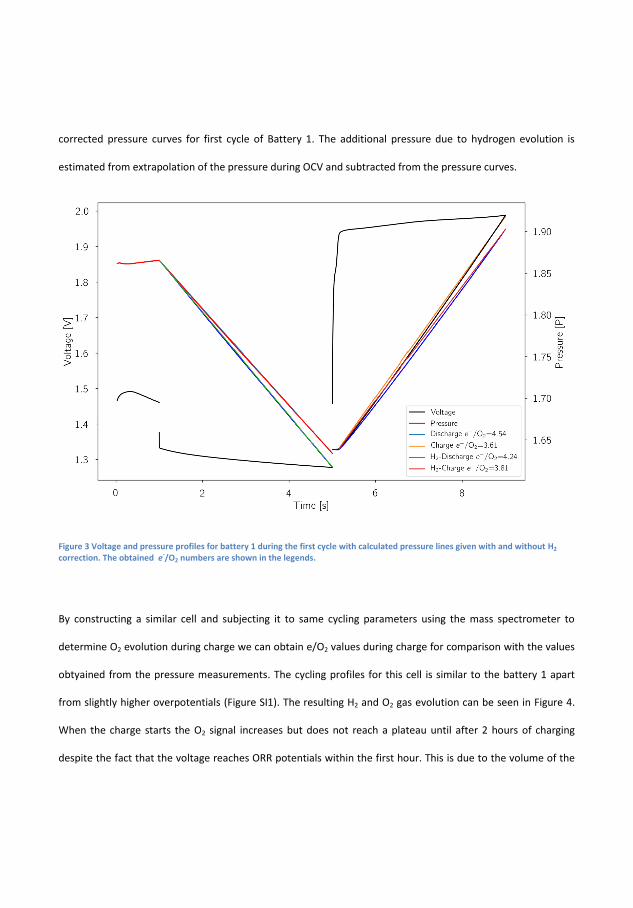
corrected pressure curves for first cycle of Battery 1. The additional pressure due to hydrogen evolution is
estimated from extrapolation of the pressure during OCV and subtracted from the pressure curves.
Figure 3 Voltage and pressure profiles for battery 1 during the first cycle with calculated pressure lines given with and without H2 correction. The obtained e
-/O2 numbers are shown in the legends.
By constructing a similar cell and subjecting it to same cycling parameters using the mass spectrometer to
determine O2 evolution during charge we can obtain e/O2 values during charge for comparison with the values
obtyained from the pressure measurements. The cycling profiles for this cell is similar to the battery 1 apart
from slightly higher overpotentials (Figure SI1). The resulting H2 and O2 gas evolution can be seen in Figure 4.
When the charge starts the O2 signal increases but does not reach a plateau until after 2 hours of charging
despite the fact that the voltage reaches ORR potentials within the first hour. This is due to the volume of the
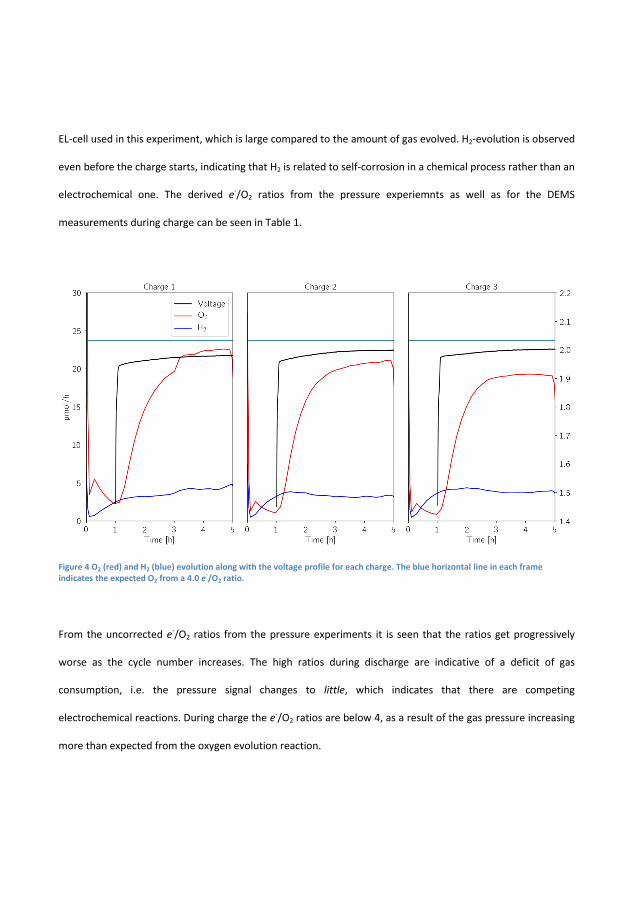
EL-cell used in this experiment, which is large compared to the amount of gas evolved. H2-evolution is observed
even before the charge starts, indicating that H2 is related to self-corrosion in a chemical process rather than an
electrochemical one. The derived e-/O2 ratios from the pressure experiemnts as well as for the DEMS
measurements during charge can be seen in Table 1.
Figure 4 O2 (red) and H2 (blue) evolution along with the voltage profile for each charge. The blue horizontal line in each frame indicates the expected O2 from a 4.0 e
-/O2 ratio.
From the uncorrected e-/O2 ratios from the pressure experiments it is seen that the ratios get progressively
worse as the cycle number increases. The high ratios during discharge are indicative of a deficit of gas
consumption, i.e. the pressure signal changes to little, which indicates that there are competing
electrochemical reactions. During charge the e-/O2 ratios are below 4, as a result of the gas pressure increasing
more than expected from the oxygen evolution reaction.
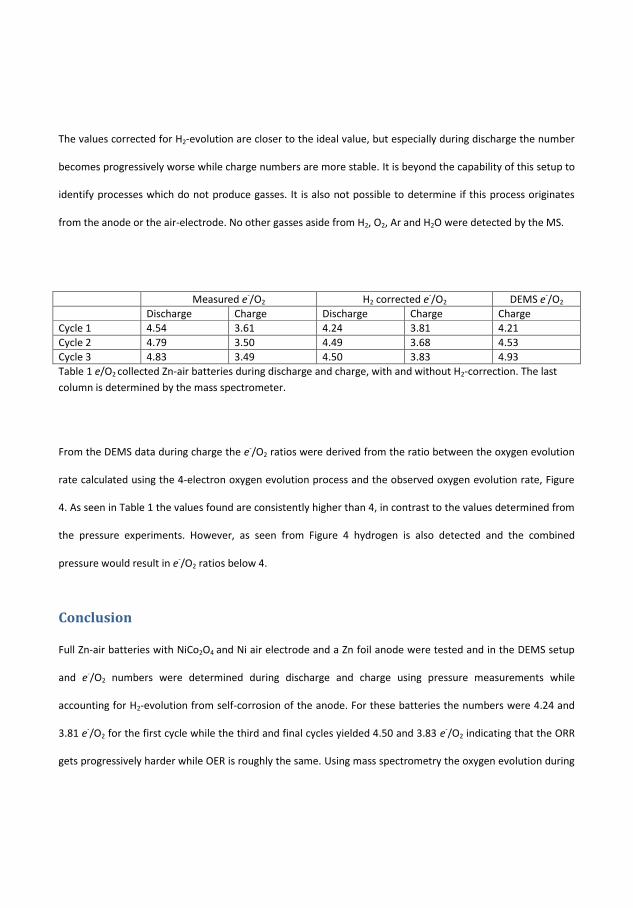
The values corrected for H2-evolution are closer to the ideal value, but especially during discharge the number
becomes progressively worse while charge numbers are more stable. It is beyond the capability of this setup to
identify processes which do not produce gasses. It is also not possible to determine if this process originates
from the anode or the air-electrode. No other gasses aside from H2, O2, Ar and H2O were detected by the MS.
Measured e-/O2 H2 corrected e-/O2 DEMS e-/O2
Discharge Charge Discharge Charge Charge
Cycle 1 4.54 3.61 4.24 3.81 4.21
Cycle 2 4.79 3.50 4.49 3.68 4.53
Cycle 3 4.83 3.49 4.50 3.83 4.93
Table 1 e/O2 collected Zn-air batteries during discharge and charge, with and without H2-correction. The last
column is determined by the mass spectrometer.
From the DEMS data during charge the e-/O2 ratios were derived from the ratio between the oxygen evolution
rate calculated using the 4-electron oxygen evolution process and the observed oxygen evolution rate, Figure
4. As seen in Table 1 the values found are consistently higher than 4, in contrast to the values determined from
the pressure experiments. However, as seen from Figure 4 hydrogen is also detected and the combined
pressure would result in e-/O2 ratios below 4.
Conclusion
Full Zn-air batteries with NiCo2O4 and Ni air electrode and a Zn foil anode were tested and in the DEMS setup
and e-/O2 numbers were determined during discharge and charge using pressure measurements while
accounting for H2-evolution from self-corrosion of the anode. For these batteries the numbers were 4.24 and
3.81 e-/O2 for the first cycle while the third and final cycles yielded 4.50 and 3.83 e-/O2 indicating that the ORR
gets progressively harder while OER is roughly the same. Using mass spectrometry the oxygen evolution during

charge was quantified and showed significantly higher electron numbers, above 4 e-/O2. Hydrogen was
detected by the MS during charge and when taking this into account an agreement with the electron numbers
determined from the pressure experiments was found.
Comparison between the results from the pressure and the DEMS experiments shows that while pressure
experiments are very efficient for determination of electron numbers for electrochemical reactions involving
gas formation care must be taken to identify and quantify all reactions taking place. By combining quantitative
mass spectrometry and pressure evaluation a better understanding of the performance of the cells electrodes
can be obtained.
Bibliography
1. Heise, G. W. Air depolarized primary battery. (1933).
2. Goh, F. W. T. et al. Ag nanoparticle-modified MnO2 nanorods catalyst for use as an air electrode in zinc-air battery. Electrochim. Acta 114, 598–604 (2013).
3. Hu, F. P., Zhang, X. G., Xiao, F. & Zhang, J. L. Oxygen reduction on Ag-MnO2/SWNT and Ag-MnO2/AB electrodes. Carbon N. Y. 43, 2931–2936 (2005).
4. Liden, D. & Reddy, T. Handbook of batteries. Cell (2004). doi:10.1016/0378-7753(86)80059-3
5. Spendelow, J. S. & Wieckowski, A. Electrocatalysis of oxygen reduction and small alcohol oxidation in alkaline media. Phys. Chem. Chem. Phys. 9, 2654–2675 (2007).
6. Lysgaard, S. et al. Combined DFT and Differential Electrochemical Mass Spectrometry Investigation of the Effect of Dopants in Secondary Zinc–Air Batteries. ChemSusChem 11, 1933–1941 (2018).
7. Højberg, J. Fundamental mechanisms in Li-air battery electrochemistry. (Technical University Of Denmark, 2015).
8. Højberg, J. et al. An electrochemical impedance spectroscopy investigation of the overpotentials in Li-O2 batteries. ACS Appl. Mater. Interfaces 7, 4039–4047 (2015).
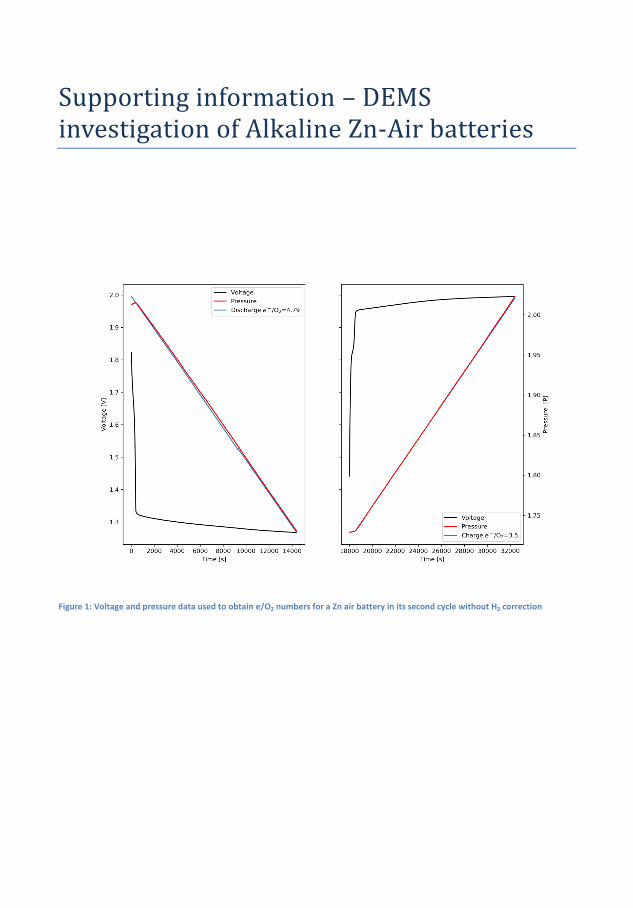
Supporting information – DEMS investigation of Alkaline Zn-Air batteries
Figure 1: Voltage and pressure data used to obtain e/O2 numbers for a Zn air battery in its second cycle without H2 correction
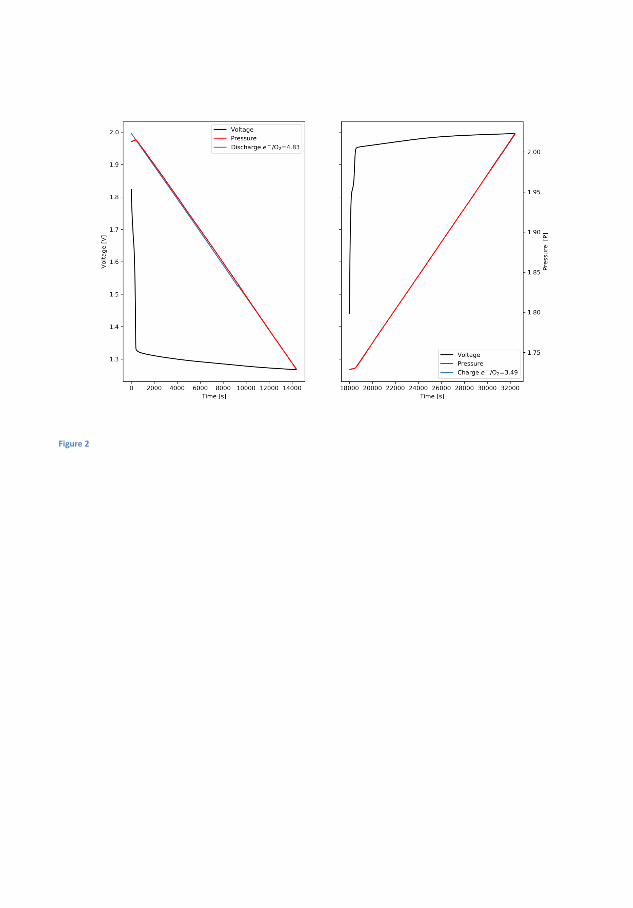
Figure 2
Figure 3 Voltage and pressure data used to obtain e/O2 numbers for a Zn air battery in its first cycle without H2 correction
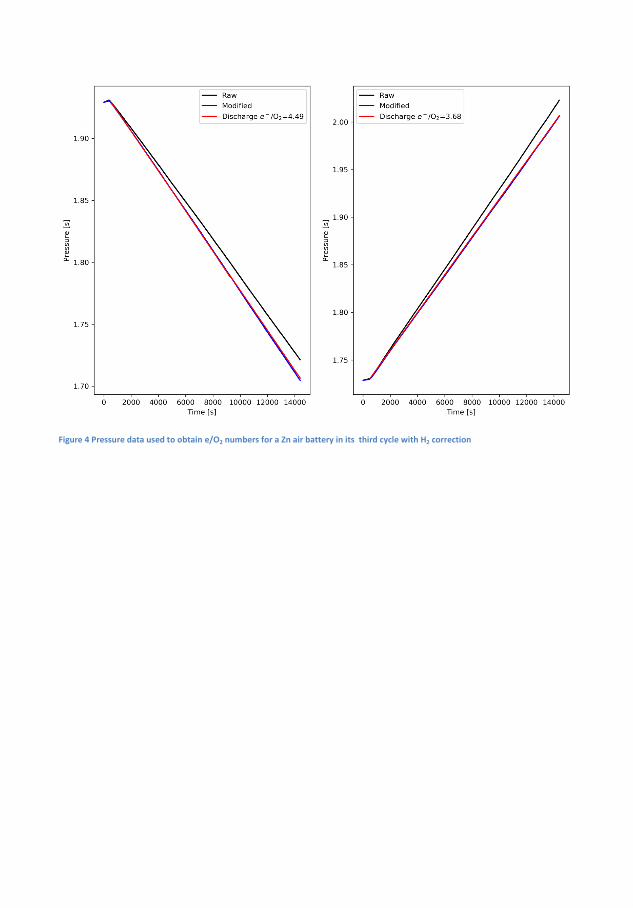
Figure 4 Pressure data used to obtain e/O2 numbers for a Zn air battery in its third cycle with H2 correction
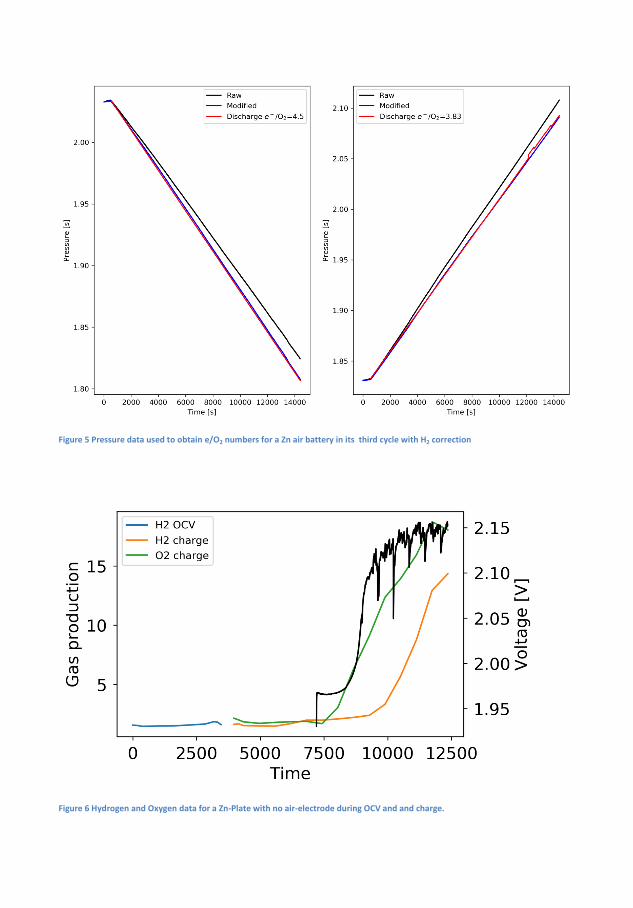
Figure 5 Pressure data used to obtain e/O2 numbers for a Zn air battery in its third cycle with H2 correction
Figure 6 Hydrogen and Oxygen data for a Zn-Plate with no air-electrode during OCV and and charge.