Embed Size (px)
Citation preview
General rights Copyright and moral rights for the publications made accessible in the public portal are retained by the authors and/or other copyright owners and it is a condition of accessing publications that users recognise and abide by the legal requirements associated with these rights.
Users may download and print one copy of any publication from the public portal for the purpose of private study or research.
You may not further distribute the material or use it for any profit-making activity or commercial gain
You may freely distribute the URL identifying the publication in the public portal If you believe that this document breaches copyright please contact us providing details, and we will remove access to the work immediately and investigate your claim.
Downloaded from orbit.dtu.dk on: Jul 14, 2022
Agglomeration during Fluidized Bed Combustion and Gasification of Biomass
Zhao, Liyan
Publication date:2021
Document VersionPublisher's PDF, also known as Version of record
Link back to DTU Orbit
Citation (APA):Zhao, L. (2021). Agglomeration during Fluidized Bed Combustion and Gasification of Biomass. TechnicalUniversity of Denmark.
Agglomeration during Fluidized Bed
Combustion and Gasification of Biomass
Liyan Zhao
PhD thesis
May 2021
Supervisors Hao Wu (DTU, Chemical and Biochemical Engineering)
Weigang Lin (DTU, Chemical and Biochemical Engineering)
Kim Dam-Johansen (DTU, Chemical and Biochemical Engineering)

Preface and Acknowledgments
I
Preface and Acknowledgments
This dissertation is the results of three years of research, from May 15th 2018 to May 14th 2021, carried
out in the Combustion and Harmful Emission Control (CHEC) research center, at the Department of
Chemical & Biochemical Engineering (KT), Technical University of Denmark (DTU). This work
was performed under the supervision of Associate Professor Hao Wu, Associate Professor Weigang
Lin, and Professor Kim Dam-Johansen from KT-DTU.
I would like to sincerely thank my supervisors for their patient guidance and great support throughout
the project. Thanks to Hao Wu for giving me valuable suggestions and comprehensive comments on
the project. Thanks to Weigang Lin for the practical help on my experimental work, as well as for a
lot discussion and constructive suggestions on the project at any time. Thanks to Kim Dam-Johansen
for the continuous support and fruitful discussion. I want to express my gratitude to Ulrik Birk
Henriksen and Jesper Ahrenfeldt for providing the two batches of wheat straw used in this work.
I would like to thank all CHEC technicians and the technicians from the workshop. Thanks to Søren
Post, Anders Kjersgaard, and Nikolaj Vinterberg Nissen for their technical support on the fluidized
bed rector. Thanks to Malene Hessellund Dinesen for helping to order the laboratory supplies. I would
like to thank Lilian Beenfeldt Holgersen and Brian Brun Hansen for their assistance on TGA
experiments. Thanks to Lars Møller for helping to solve various electric related issues. Thanks to IT
Helpdesk team in KT for their assistance on the computer and software related issues. Thanks to
Hanne Mikkelsen for answering all kinds of questions in the work.
I would like to thank all of my colleagues at KT who make the three years so wonderful. Thanks to
Burak Ulusoy and Božidar Aničić for their guidance and assistance on the fluidized bed experiments.
I also would like to thank Burak for his help on translation of the abstract to Danish. Thanks to my
Chinese friends for bringing so much fun to my life in Denmark. A special thanks goes to my friend
Yu Zhang for being with me and sharing my happiness and sadness, as well as the discussions about
the project in the past three years.
Lastly, I would like to thank my families for their supporting and encouraging, as well as the
understanding and caring during these three years.
Liyan Zhao
May 2021

Agglomeration during Fluidized Bed Combustion and Gasification of Biomass
II
Summary
III
Summary
Biomass is considered as a renewable and carbon-neutral energy source, and has been utilized as a
substitute for fossil fuels. Fluidized bed combustion and gasification are promising technologies for
biomass utilization. However, agglomeration in fluidized bed combustion and gasification of biomass,
caused by the presence of molten phase originated from biomass, affects the operation of the reactors,
and may eventually lead to defluidization and unscheduled shut down of the plant. Therefore, an in-
depth understanding of agglomeration in fluidized bed combustion and gasification of biomass and
the development of countermeasures for minimizing the operational problems caused by
agglomeration are important.
Systematic experiments on agglomeration during combustion and gasification of biomass were
carried in a lab-scale bubbling fluidized bed reactor. The experiments focused on the influence of
equivalence ratio (ER) in air blown, air/steam and air/carbon dioxide gasification. The influence of
biomass type on agglomeration was studied in the same way. Different techniques, such as scanning
electron microscopy with energy-dispersive X-ray spectroscopy (SEM-EDX), X-ray diffraction
(XRD), and thermogravimetric analysis (TGA), were applied for characterization of agglomerates,
biomass ash, and char. The fusion behaviors of the ash were investigated a fixed bed reactor under
combustion and gasification conditions to further understand the influence of gas atmosphere on
agglomeration. The thermodynamic equilibrium calculations were carried out to shed light upon the
distribution of potassium in the ash under the experimental conditions. A pulsed flow was applied to
explore the possibility of mitigating the agglomeration in fluidized bed combustion/gasification of
biomass and its effect on the conversion process.
Combustion and gasification of wheat straw at different ERs in the fluidized bed reveal a trend that
the agglomeration tendency first increases gradually with decreasing ER. When ER reaches a critical
value, the agglomeration tendency decreases with further decreasing ER. It has been observed that
the amount of unconverted carbon in the bed increases as ER decreases. By adding a high
concentration of steam to the fluidized bed, the agglomeration is promoted. However, when carbon
dioxide is added, slightly lower agglomeration tendency is observed. The visual examination of the
fusion behaviors of wheat straw ash in the fixed bed indicates that the ash obtained from gasification
with steam has the highest fusion tendency followed by the ash from combustion with presence of
steam and lastly the ash from normal combustion. The experimental results indicate that an enhanced
reducing atmosphere may result in a slightly higher agglomeration tendency, probably due to an
increased melting of ash. The inhibition effect of residual carbon on the agglomeration is probably
attributed to a reduced fusion tendency and melting flow behavior of ash and a retarded interaction
between ash and bed material. The competition between an enhanced reducing atmosphere and an
Agglomeration during Fluidized Bed Combustion and Gasification of Biomass
IV
increased amount of unconverted carbon by lowering ER results in the occurrence of a maximal
agglomeration tendency at a critical ER. The presence of high concentration of steam accelerates the
agglomeration probably due to an increased carbon conversion and a lowered ash viscosity, which
also leads to a lower critical ER value.
Combustion and gasification of sunflower husk in the fluidized bed indicate that a reducing
atmosphere, a high concentration of steam, and the residual carbon show consistent influences on the
agglomeration of sunflower husk and wheat straw, although the agglomeration tendency of sunflower
husk ash is higher than that of wheat straw ash in both combustion and gasification. In the air blown
system, the critical ERs of sunflower husk and wheat straw are 0.04 and 0.36, respectively. The
differences in agglomeration characteristics of these two types of biomass may be attributed to their
different char reactivity and different molar ratios of silicon to potassium, which are 1.56 and 0.04,
respectively, for wheat straw and sunflower husk. Different with wheat straw, the accelerated
agglomeration of sunflower husk under a reducing atmosphere and a high concentration of steam may
be attributed to their promotive effect on the interaction between sunflower husk ash and bed material.
The results of TGA experiments indicate that sunflower husk has a higher char reactivity than wheat
straw, leading to a less amount of residual carbon during gasification of biomass, and thereby causing
a reduced inhibition effect of residual carbon. Compared to wheat straw, the lower critical ER of
sunflower husk may be attributed to a higher char reactivity and a different mechanism of reducing
atmosphere on agglomeration results from a lower molar ratio of silicon to potassium in sunflower
husk. Gasification of two batches of wheat straw show that the straw with a lower char reactivity has
a lower agglomeration tendency in gasification at low ERs due to a more pronounced inhibition effect
caused by a higher amount of residual carbon.
The results of pulsed fluidized bed experiments suggest that the introducing of a pulsed flow in the
primary gas mitigates the agglomeration in fluidized bed combustor and gasifier, and the pulsed flow
shows a minor effect on the combustion behaviors. Among the parameters that have been studied, the
pulsation duty cycle shows the most significant effect on the agglomeration tendency, while the
pulsation frequency shows the least impact. Under the combination of pulsation flow rate ratio of 0.4,
pulsation frequency of 1.5 Hz and pulsation duty cycle of 25/75, the amounts of straw fed for inducing
defluidization are 151.7% and 137.5% of that at the condition with the continuous flow for
combustion and gasification, respectively.
The results of this work reveal that the agglomeration in fluidized bed combustion and gasification
of biomass can be promoted by a reducing atmosphere and mitigated by the residual carbon. A
decrease in ER results in an enhanced reducing atmosphere and an increased amount of residual
carbon, and the competition between two factors results in the occurrence of a maximal agglomeration
tendency at a critical ER. The presence of high concentration of steam accelerates the agglomeration
tendency of biomass. A higher char reactivity leads to a reduced inhibition effect of residual carbon,
thus causing a promoted agglomeration. An increase in steam concentration and char reactivity will

Summary
V
result in a decreased critical ER. The different molar ratios of silicon to potassium for different types
of biomass may result in different agglomeration tendency and mechanisms. The observed results
indicate that the application of pulsed fluidized bed of promising to mitigate the agglomeration during
combustion and gasification of biomass and shows insignificant effect on conversion behaviors.

Agglomeration during Fluidized Bed Combustion and Gasification of Biomass
VI
Dansk resumé
VII
Dansk resumé
Biomasse betragtes som en vedvarende og kulstofneutral energikilde og er blevet brugt som erstatning
for fossile brændstoffer. Forbrænding of forgasning i fluid bed reaktorer er lovende teknologier til
anvendelse af biomasse. Imidlertid forårsager tilstedeværelsen af smeltet fase fra biomasseaske
agglomerering under forbrænding og forgasning, hvilket i værste fald kan føre til defluidisering og
uønsket lukning af anlægget. Det er derfor yderst vigtigt at opnå en dybtgående forståelse af
agglomerering under fluid bed forbrænding og forgasning af biomasse for dermed at kunne udvikle
modforanstaltninger for at minimere de operationelle problemer forårsaget af agglomerering.
Systematiske eksperimenter med agglomerering under forbrænding og forgasning af biomasse blev
udført i en boblende fluid bed-reaktor i laboratorieskala. Eksperimenterne fokuserede på indflydelsen
af ækvivalensforholdet (ER) under luft, luft/damp og luft/carbondioxid -forgasning. Indflydelsen af
biomassetype på agglomereringen blev undersøgt på samme måde. Forskellige teknikker, såsom
scanningelektronmikroskopi med energidispersiv røntgenspektroskopi (SEM-EDX),
røntgendiffraktion (XRD) og termogravimetrisk analyse (TGA) blev anvendt til karakterisering af
agglomerater, biomasseaske og kul. Askens smelteadfærd blev undersøgt i en fixed bed reaktor under
forbrændings- og forgasningsbetingelser for yderligere at forstå indflydelsen af gasatmosfære på
agglomerering. Termodynamiske ligevægtsberegninger blev udført for at belyse fordelingen af
kalium i asken under de eksperimentelle betingelser. En pulserende strøm blev anvendt for at
undersøge muligheden for at reducere agglomerering i fluid bed forbrænding/forgasning af biomasse
og dens virkning på omdannelsesprocessen.
Fluid bed forbrænding og forgasning af hvedehalm ved forskellige ER afslører, at
agglomereringstendensen først øges gradvist med faldende ER. Når ER når en kritisk værdi, begynder
agglomereringstendensen at falde med yderligere faldende ER. Det blev observeret, at mængden af
ureageret kulstof i beden stiger, når ER falder. Ved at tilføje en høj koncentration af damp til fluid
beden fremmes agglomerering. Når carbondioxid tilsættes, observeres der dog en lidt lavere
agglomereringstendens. Den visuelle undersøgelse af smelteadfærden af hvedehalmaske i beden
indikerer, at asken opnået ved forgasning med damp har den højeste fusionstendens efterfulgt af asken
fra forbrænding med tilstedeværelse af damp og sidst af asken fra normal forbrænding. De
eksperimentelle resultater indikerer, at en i høj grad reducerende atmosfære kan resultere i en lidt
højere agglomereringstendens sandsynligvis på grund af en øget smeltning af asken.
Inhiberingseffekten af resterende kulstof på agglomerationen tilskrives sandsynligvis en reduceret
fusionstendens og askensmeltens strømningsadfærd og en forsinket interaktion mellem aske og
bedmaterialet. Konkurrencen mellem en meget reducerende atmosfære og en øget mængde ikke-
omdannet kulstof ved at sænke ER resulterer i forekomsten af en maksimal agglomereringstendens
Agglomeration during Fluidized Bed Combustion and Gasification of Biomass
VIII
ved en kritisk ER. Tilstedeværelsen af en høj dampkoncentration fremskynder agglomereringen
sandsynligvis på grund af en øget kulstofomdannelse og en sænket askeviskositet, hvilket også fører
til en lavere kritisk ER-værdi.
Fluid bed forbrænding og forgasning af solsikkefrøskal indikerer, at en reducerende atmosfære, en
høj koncentration af damp og det resterende kulstof viser ensartet indflydelse på agglomereringen af
solsikkefrøskal og hvedehalm, skønt agglomereringstendensen for solsikkefrøskal er højere end af
hvedehalmaske i både forbrænding og forgasning. I det luftblæste system er de kritiske ER værdier
af solsikkefrøskal og hvedehalm henholdsvis 0,04 og 0,36. Forskellene i
agglomereringskarakteristika for disse to typer af biomasse kan tilskrives deres forskellige silicium
til kalium molforhold og koks-reaktivitet. De signifikant forskellige molforhold mellem silicium til
kalium, som henholdsvis er 1,56 og 0,04 for hvedehalm og solsikkefrøskal. Forskellig fra hvedehalm
kan den accelererede agglomerering af solsikkefrøskal under en reducerende atmosfære og en høj
koncentration af damp tilskrives deres promoverende virkning på interaktionen mellem
solsikkefrøskal og bedmateriale. Resultaterne af TGA-eksperimenter indikerer, at solsikkefrøskal har
en højere koks-reaktivitet end hvedehalm, hvilket fører til en mindre mængde resterende kulstof under
forgasning af biomasse og derved forårsager en reduceret inhiberingseffekt af resterende kulstof.
Sammenlignet med hvedehalm kan den lavere kritiske ER værdi for solsikkefrøskal tilskrives en
højere koks-reaktivitet, og en alternativ mekanisme for agglomereringen, der er relevant ved
reducerende betingelser forårsaget af et lavere molforhold mellem silicium til kalium i solsikkefrøskal.
Forgasning af to batch hvedehalm viser, at halmen med en lavere koksreaktivitet har en lavere
agglomereringstendens i forgasning ved lave ER værdier på grund af en mere udtalt inhiberingseffekt
forårsaget af en større mængde restkulstof.
Resultaterne af puls-forsøg i fluid bed reaktoren antyder, at indførelsen af en pulserende strøm i den
primære gas dæmper agglomerationen under fluid bed forbrænding og gasificering, og det pulserende
flow har en mindre effekt på forbrænding. Blandt de parametre, der er blevet undersøgt, viser
pulseringscyklus sig at være den mest signifikante på agglomereringstendensen, mens
pulsationsfrekvensen udviser mindst påvirkning. Ved at benytte et pulseringsflowhastighedsforhold
på 0,4, pulsationsfrekvens på 1,5 Hz og pulsationscyklus på 25/75 er mængderne af halm, der tilføres
før af defluidisering, 151,7% og 137,5% højere sammenlignet med forholdene uden pulsering dvs.
med en kontinuerlig strøm under forbrænding henholdsvis forgasning.
Resultaterne af dette arbejde viser, at agglomerering i fluid bed forbrænding og forgasning af
biomasse kan fremmes ved en reducerende atmosfære og mindskes af tilstedeværelsen af resterende
kulstof. En reduktion i ER forårsager en øget reducerende atmosfære og en øget mængde ikke-
omdannet kulstof, og konkurrencen mellem disse to faktorer resulterer i forekomsten af en maksimal
agglomereringstendens ved en kritisk ER. Tilstedeværelsen af en høj koncentration af damp
fremskynder biomassens agglomereringstendens. En højere koks-reaktivitet fører til en reduceret
inhiberingseffekt af resterende carbon, hvilket forårsager en fremmet agglomerering. En stigning i
Dansk resumé
IX
dampkoncentration og kulreaktivitet vil resultere i en nedsat kritisk ER. De forskellige molforhold
mellem silicium til kalium for forskellige typer biomasse kan resultere i forskellige
agglomereringstendenser og mekanismer. De observerede resultater indikerer, at anvendelsen af en
pulserende fluid bed udviser potentiale til at mindske agglomerering under forbrænding og forgasning
af biomasse med en ubetydelig effekt på forbrændingen.

Agglomeration during Fluidized Bed Combustion and Gasification of Biomass
X
List of Figures
XI
List of Figures
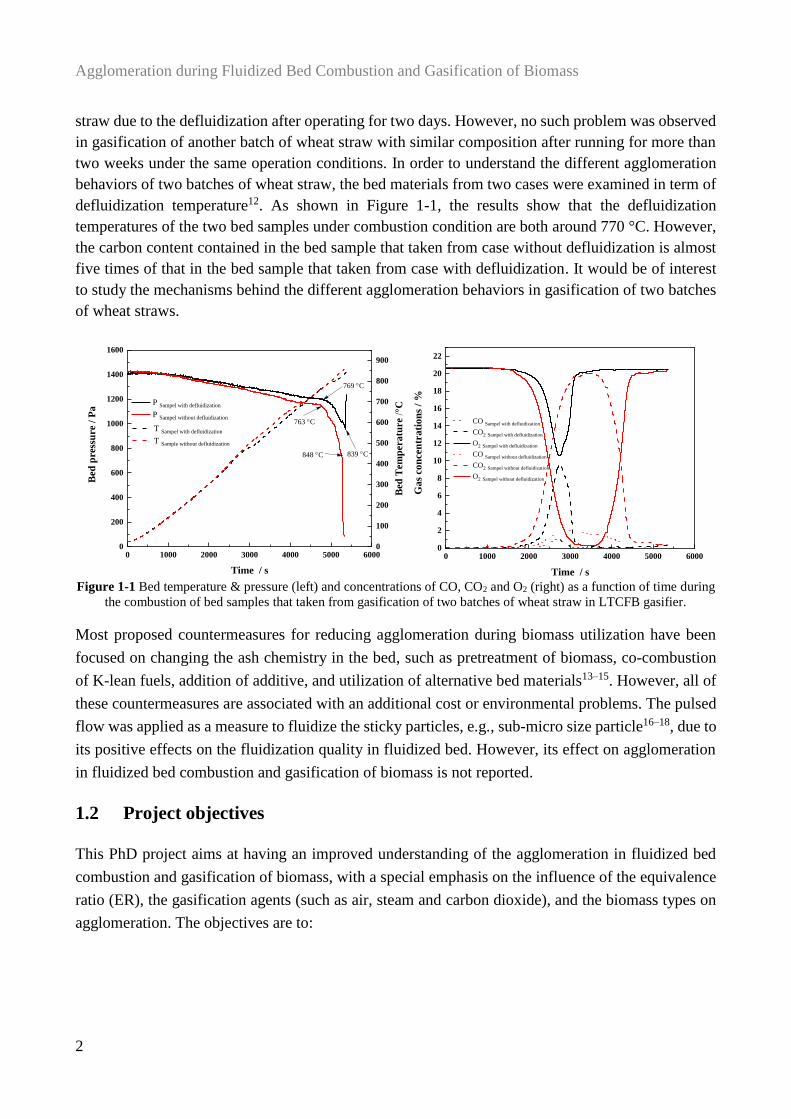
Figure 1-1 Bed temperature & pressure (left) and concentrations of CO, CO2 and O2 (right) as a
function of time during the combustion of bed samples that taken from gasification of two batches of
wheat straw in LTCFB gasifier. ........................................................................................................... 2
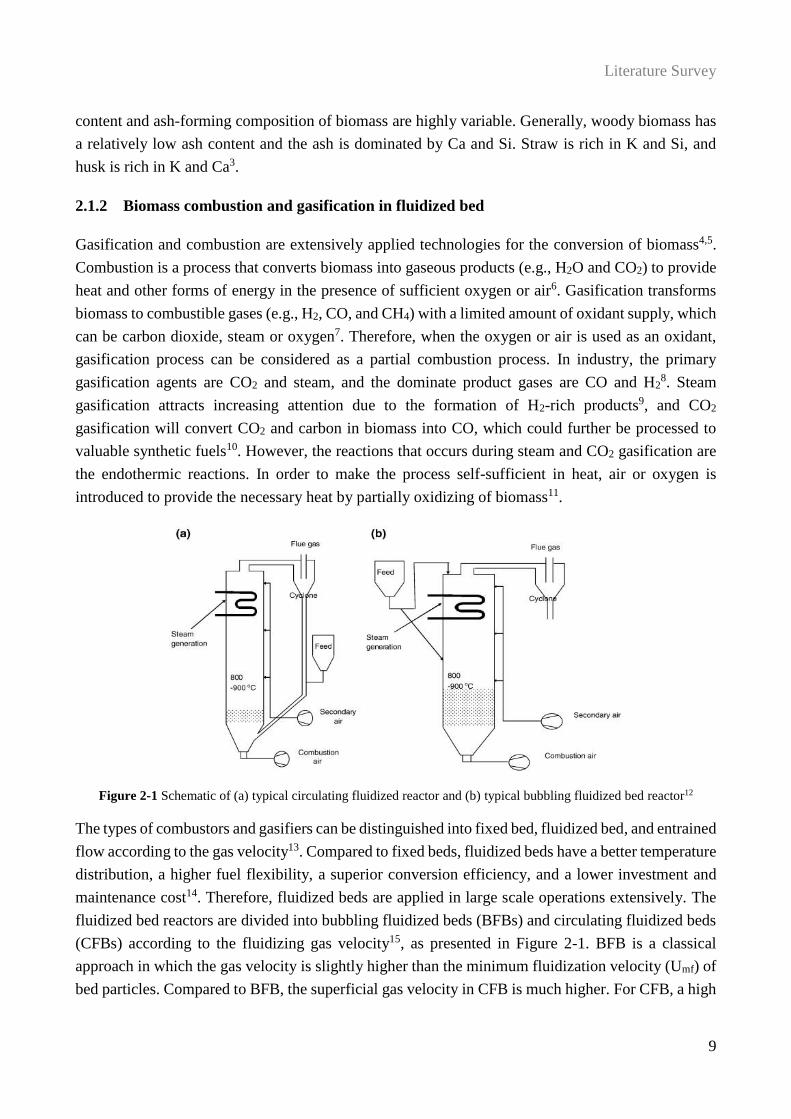
Figure 2-1 Schematic of (a) typical circulating fluidized reactor and (b) typical bubbling fluidized
bed reactor12 ......................................................................................................................................... 9
Figure 2-2 Illustration of agglomeration and bed defluidization, redrawn from23 ............................ 10
Figure 2-3 (a) “Melt-induced” agglomeration mechanism and (b) “coating-induced” agglomeration
mechanism in a system with a SiO2-based bed material, adopted from26 .......................................... 11
Figure 2-4 Illustration of typical cross sections of bed particles (a) taken after 40 hour of operation
in the bench-scale rig during the combustion of olive residue46 and (b) taken from CFB at 122 MWth
versus operation times of 4 days during the combustion of 40% bark and 60% sawdust & logging
residues47 ............................................................................................................................................ 13
Figure 2-5 Silicate melt formation in ash coatings35 ......................................................................... 14
Figure 2-6 Illustration of the important chemical sub-processes of the bed agglomeration
mechanism50. ...................................................................................................................................... 14
Figure 2-7 Possible reaction paths and release mechanism of potassium in biomass during
combustion92 ...................................................................................................................................... 20
Figure 2-8 Remained potassium in ash at different combustion temperatures. Redraw based on data
from107,109 ........................................................................................................................................... 21
Figure 2-9 Calculated potassium distribution of biomass combustion. Calculation composition (wt.%
on dry basis) and condition: H-5.9%, C-47.5%, N-0.7%, Si-0.8%, K-1.0, Cl-0.4%,Ca-0.4%, Mg-
0.07%, Na-0.05%, S-0.15%, and P-0.08% at the excess air ratio of 1.492. ........................................ 22
Figure 3-1 A schematic drawing of the lab-scale fluidized bed reactor ........................................... 57
Figure 3-2 Diagram of determination of defluidization during gasification with an ER of 0.14 and a
SFR of 1.15. ....................................................................................................................................... 59
Figure 3-3 Amount of dry basis straw fed for inducing defluidization at various equivalence ratios in
an air blown system............................................................................................................................ 61
Figure 3-4 Amount of dry basis straw fed for inducing defluidization during gasification as a function
of steam to fuel ratio at an equivalence ratio in the range of 0 - 0.36. ............................................... 61
Figure 3-5 Impact of CO2 on amount of dry basis straw fed for inducing defluidization during
gasification with an equivalence ratio in the range of 0 – 0.36 (top: SFR = 0, bottom: SFR = 1.15).
............................................................................................................................................................ 62
Figure 3-6 Amount of dry basis straw fed for inducing defluidization in the performed experiments.
............................................................................................................................................................ 63
Figure 3-7 Bed samples taken from the cold reactor under condition of (a) ER = 1.45 & SFR = 0, (b)
ER = 0 & SFR = 1.15, and (c) ER = 0.14 & SFR = 1.15. .................................................................. 64
Agglomeration during Fluidized Bed Combustion and Gasification of Biomass
XII
Figure 3-8 Morphology (SEM: SE mode) of (a) raw silica sand, and agglomerates sampled (b) from
gasification with an ER of 0.14 and a SFR of 1.15, (c) and (e) from combustion with an ER of 1.45,
as well as (d) and (f) from gasification with an ER of 0 and SFR of 1.15. ........................................ 65
Figure 3-9 Impact of equivalence ratio on the thermodynamic equilibrium calculations of relative
distribution of elemental C, CO, CO2, H2, O2, H2O, and N2 at 850 °C. ............................................ 66
Figure 3-10 Impact of (a) steam to fuel ratio and (b) CO2 concentration on the thermodynamic
equilibrium calculations of relative distribution of elemental C, CO, CO2, H2, O2, H2O, and N2 at
850 °C. ............................................................................................................................................... 66
Figure 3-11 Impact of (a) equivalence ratio, (b) steam to fuel ratio and (c) CO2 concentration on the
thermodynamic equilibrium calculation of K-species distribution at 850 °C. ................................... 67
Figure 3-12 Bed temperature (T4), bed pressure (P2) and the concentrations of CO and CO2 in flue
gas during stepwise gasification. ....................................................................................................... 69
Figure 3-13 K2Si4O9 pellets (a) before and after heating for 3 hours at 850 °C in a fixed bed reactor
under (b) 100% air and (c) 50 vol.% steam and 50 vol.% N2. ........................................................... 70
Figure 3-14 A plausible agglomeration mechanism of wheat straw during gasification in fluidized
bed. ..................................................................................................................................................... 71
Figure 4-1 A schematic drawing of the lab-scale fixed bed reactor ................................................. 81
Figure 4-2 Temperature profile along with the reactor with a set temperature of 850 °C ................ 82
Figure 4-3 Concentrations of CO, CO2 and O2 in the flue gas during the formation of ash from wheat
straw under conditions of 100% air, 50% steam/50% air, and 50% steam/50% N2 at 850 °C. ......... 84
Figure 4-4 The appearances of (a) raw straw sample and HTA formed under (b) 100% air; (c) 50%
steam/50% air; and (d) 50% steam/50% N2. ...................................................................................... 85
Figure 4-5 Crystalline phases in HTA(100% air), HTA(50% steam/50% air), and HTA(50%
steam/50% N2). .................................................................................................................................. 85
Figure 4-6 Morphology (SEM: SE mode) of ashes from wheat straw under (a) 100% air; (b) 50%
steam/50% air; and (c) 50% steam/50% N2. ...................................................................................... 87
Figure 4-7 Appearances of (a-0) the obtained char samples from pyrolysis, (a) the char samples
before heated and ash from char sample under (b) 100% air after char conversion stage; (c) 100% air
after ash heating stage; (d) 50% steam/50% air after char conversion stage; (e) 50% steam/50% air
after ash heating stage; (f) 50% steam/50% N2 after char conversion stage; and (g) 50% steam/50%
N2 after ash heating stage. .................................................................................................................. 88
Figure 4-8 Mixture of straw and sand (a) before heated and agglomerates formed under (b) 100% air;
(c) 50% steam/50% air; (d) 50% steam/50% N2 in the fixed bed reactor. ......................................... 89
Figure 4-9 Morphology (SEM: SE mode) of agglomerates formed under (a) 100% air; (b) 50%
steam/50% air; (c) 50% steam/50% N2 for 3 h. ................................................................................. 90
Figure 5-1 Amount of dry basis fuel fed and the amount of ash in the fed fuel for inducing
defluidization during combustion with an ER of 1.45. .................................................................... 100
Figure 5-2 Amount of ash in the fed fuel for inducing defluidization at various equivalence ratio in
air blown gasification and combustion. ........................................................................................... 101
List of Figures
XIII
Figure 5-3 Influence of steam to fuel ratio on amount of ash in the fed fuel during gasification with
an ER in the range of 0 – 0.36.......................................................................................................... 102
Figure 5-4 TG/DTG results of WS-1 char (red), WS-2 char (black) and SFH char (blue) under (a) 4
vol.% of O2 in N2 and (b) 20 vol.% of CO2 in N2 (TG: solid line and DTG: Dash line). ................ 103
Figure 5-5 XRD results of the ash samples of (a) WS-1, (b) WS-2 and (c) SFH that prepared at 550 °C
and 850 °C under air condition. ....................................................................................................... 104
Figure 5-6 SEM-EDX elemental mapping of surfaces of (a) WS-1 char and (b) SFH ash produced
during CO2 gasification in TGA experiments (elemental analyses are presented as atom% on C-O-
free basis). ........................................................................................................................................ 105
Figure 5-7 Morphology (SEM: SE mode) of (a) WS-1 char and (b) SFH ash produced during CO2
gasification in TGA experiments. .................................................................................................... 106
Figure 5-8 Morphology (SEM: SE mode) of agglomerates from (a) WS-1 and (b) SFH combustion
with an ER of 1.45. .......................................................................................................................... 107
Figure 5-9 Morphology (SEM: SE mode) (left) and EDX analysis of selected point (right) of
agglomerates from SFH gasification with an ER of 0 and a SFR of 2.3. ........................................ 108
Figure 5-10 Predicated K-species in three ashes at various equivalence ratio by thermodynamic
equilibrium calculations at 850 °C. .................................................................................................. 109
Figure 5-11 Predicated molar ratios of Si to K in the slag phase during WS-1 conversion at various
equivalence ratio by thermodynamic equilibrium calculations at 850 °C. ...................................... 109
Figure 5-12 Predicted distribution of K-species during conversion of WS-1 and SFH in fluidized bed
at 850 °C at various equivalence ratio by thermodynamic equilibrium calculations. ..................... 110
Figure 6-1 A schematic drawing of the lab-scale pulsed fluidized bed reactor .............................. 118
Figure 6-2 A schematic of square wave of gas pulsation. Ut: total flow rat of primary gas; Up: flow
rate of pulsed flow; Uc: flow rate of continuous flow; TON: time of “flow-ON” period; TOFF: time of
“flow-OFF” period ........................................................................................................................... 118
Figure 6-3 Influcence of flow rate ratio of pulsation (0.2-0.4) on amount of straw fed for inducing
defluidization during combustion. Pulsation frequency = 1.5 Hz; pulsation duty cycle = 50/50. ... 122
Figure 6-4 Fluctuation amplitudes and standard deviations of (a) pressure in the air-plenum (P1) and
(b) bed pressure drop (P2) in the pulsed fluidized bed without feeding at different flow rate ratios of
pulsation (0.2-0.4). Pulsation frequency =1.5 Hz; pulsation duty cycle = 50/50. ........................... 123
Figure 6-5 Influence of pulsation frequency (0.5-3 Hz) on amount of straw fed for inducing
defluidization during combustion. Flow rate ratio of pulsaiton = 0.3 and 0.4; pulsation duty cycle =
50/50................................................................................................................................................. 124
Figure 6-6 Fluctuation amplitudes and standard deviations of (a) pressure in the air-plenum (P1) and
(b) bed pressure drop (P2) in the pulsed fluidized bed without feeding at different pulsation
frequencies (0.5-3Hz). Flow rate ratio of pulsaiton = 0.3 and 0.4; pulsation duty cycle = 50/50. .. 124
Figure 6-7 Influence of duty cycle of pulsation (25/75, 50/50, and 75/25) on amount of straw fed for
inducing defluidization during combustion. Pulsation flow rate ratio Up/Ut = 0.4; pulsation frequency
= 1.5 Hz. ........................................................................................................................................... 125
Agglomeration during Fluidized Bed Combustion and Gasification of Biomass
XIV
Figure 6-8 Fluctuation amplitudes and standard deviations of (a) pressure in the air-plenum (P1) and
(b) bed pressure drop (P2) in a pulsed fluidized bed without feeding at different pulsation duty cycles.
Flow rate ratio of pulsation Up/Ut = 0.4; pulsation frequency = 1.5 Hz. ......................................... 126
Figure 6-9 Influence of (a) flow rate of pulsation, (b) pulsation frequency and (c) pulsation duty cycle
on amount of straw fed for inducing defluidization during gasification. (a) pulsation frequency = 1.5
Hz; pulsation duty cycle = 50/50; (b) pulsation flow rate ratio = 0.2 and 0.4; pulsation duty cycle
=50/50; (c) pulsation flow rate ratio =0.4; pulsation frequency = 1.5 Hz. ...................................... 127
Figure 6-10 Fluctuation amplitudes and standard deviations of (a-1) pressure in the air-plenum (P1)
and (a-2) bed pressure drop (P2) at different flow ratios of pulsaiton, (b-1) pressure in the air-plenum
(P1) and (b-2) bed pressure drop (P2) at different pulsation frequencies, (c-1) pressure in the air-
plenum (P1) and (c-2) bed pressure drop (P2) at different duty cycles in a pulsed fluidized bed without
feeding during gasification. (a) pulsation frequency = 1.5 Hz; pulsation duty cycle = 50/50; (b)
pulsation flow rate ratio = 0.2 and 0.4; pulsation duty cycle = 50/50; (c) pulsation flow rate ratio =
0.4; pulsation frequency = 1.5 Hz. ................................................................................................... 128
Figure 6-11 Influence of (a) flow rate of pulsation (b) & (c) pulsation frequency, and (d) pulsation
duty cycle on flue gas (CO, CO2, O2, NO, and SO2) compositions during stable combustion period.
(a) pulsation frequency = 1.5 Hz; pulsation duty cycle = 50/50; (b) pulsation flow rate ratio = 0.3;
pulsation duty cycle = 50/50; (c) pulsation flow rate ratio = 0.4; pulsation duty cycle = 50/50; (d)
pulsation flow rate ratio = 0.4; pulsation frequency = 1.5 Hz. ........................................................ 130
Figure A-1 Influence of bed particles size on straw amount fed for inducing defluidization under
combustion with an ER of 1.45, gasification with an ER of 0.14 and a SFR of 1.15, and gasification
with an ER of 0 and SFR of 1.15 using the fuel with a size range of 2 – 4 mm. ............................. 141
Figure A-2 Temperature profile during stable combustion of straw with a size range of 2 – 4 µm for
different particle size. ....................................................................................................................... 142
Figure A-3 Influence of fuel particles size on straw amount fed for inducing defluidization under
combustion with an ER of 1.45, gasification with an ER of 0.14 and a SFR of 1.15, and gasification
with an ER of 0 and SFR of 1.15 using silica sand with a size range of 355 – 500 µm. ................. 143
Figure A-4 Straw amount fed for inducing defluidization under combustion with an ER of 1.45 using
silica sand with a size range of 355 – 500 µm. ................................................................................ 144
Figure A-5 Impact of (a) equivalence ratio, (b) steam to fuel ratio and (c) CO2 concentration on the
thermodynamic equilibrium calculation of slag phase compositions at 850 °C. ............................. 145
Figure B-1 CO, CO2 and NO concentrations in flue gas during char samples formed at 850 °C .. 147
Figure C-1 Amount of ash in the fuel fed for inducing defluidization as functions of equivalence ratio
in gasification with a SFR of 1.15 and 2.30 (solid symbols: defluidization occurred, open symbols:
no defluidization occurred). ............................................................................................................. 148
Figure C-2 Predicated slag phase compositions during conversion of WS-1 at various equivalence
ratio by thermodynamic equilibrium calculations at 850 °C without bed material. ........................ 149
Figure C-3 Predicated slag phase compositions during conversion of (a) WS-1 and (b) SFH at various
equivalence ratio by thermodynamic equilibrium calculations at 850 °C with bed material. ......... 149
List of Tables
XV
List of Tables
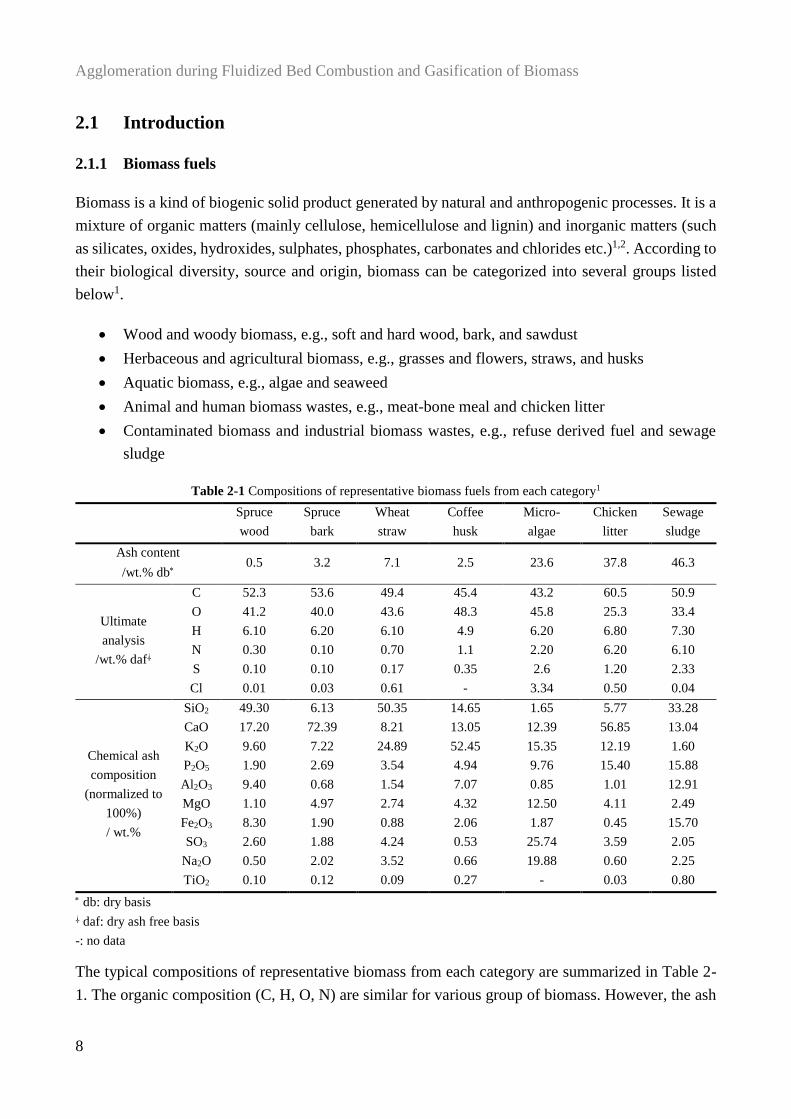
Table 2-1 Compositions of representative biomass fuels from each category1 .................................. 8
Table 2-2 Typical crystalline phase species detected by XRD in wheat straw ashes from combustion
............................................................................................................................................................ 22
Table 2-3 Melting temperature of typical K-species ......................................................................... 23
Table 2-4 Agglomeration tendency and mechanisms of K-species under air condition (oxidizing
condition) ........................................................................................................................................... 23
Table 2-5 Impact of reducing atmospheres (H2) on agglomeration temperature and mechanisms of K
slats127................................................................................................................................................. 24
Table 2-6 Influence of steam atmosphere on agglomeration tendency and mechanisms of K/Na salts
and K/Na doped wood........................................................................................................................ 25
Table 3-1 Characteristics of wheat straw .......................................................................................... 55
Table 3-2 Typical operating parameters during experiments. ........................................................... 58
Table 3-3 Gas compositions used in the experiments ....................................................................... 58
Table 3-4 Carbon content, carbon conversion, and amount of fed straw for the cases shown in Figure
3-7 ...................................................................................................................................................... 64
Table 3-5 EDX analysis of selected point of the agglomerates shown in Figure 3-8 (atom% on C-O-
free basis) ........................................................................................................................................... 65
Table 4-1 EDX analysis of selected point of the ashes shown in Figure 4-6 (atom% on C-O-free basis)
............................................................................................................................................................ 87
Table 4-2 Ash ratios at different stages under conditions of 100% air; 50% steam/50% air; and 50%
steam/50% N2. .................................................................................................................................... 88
Table 4-3 EDX analysis of selected point of the agglomerates shown in Figure 4-9 (atom% on C-O-
free basis) ........................................................................................................................................... 90
Table 5-1 Properties of the fuels used in the experiments ................................................................ 97
Table 5-2 Experiments matrix ........................................................................................................... 98
Table 5-3 Maximum weight loss rates (DTGmax) and temperature of maximum weight loss rates (Tp)
of three char samples ........................................................................................................................ 103
Table 5-4 EDX analysis of selected point of the residues shown in Figure 5-7 (atom% on C-O-free
basis) ................................................................................................................................................ 106
Table 5-5 EDX analysis of selected point of the agglomerates shown in Figure 5-8 (atom%) ...... 107
Table 6-1 Experiments matrix ......................................................................................................... 120
Table A-1 Ratio between superficial gas velocity (Ug) and minimal fluidization velocity (Umf) of
sand particles at 850 °C .................................................................................................................... 142
Table C-1 Raw EDX analysis of selected point of the residues shown in Figure 5-6 (atom%) ..... 148
Agglomeration during Fluidized Bed Combustion and Gasification of Biomass
XVI
Abbreviations and Symbols
XVII
Abbreviations and Symbols
Abbreviations
AFT Standard Ash Fusion Temperatures
atom% Atom percent
AGG Agglomerates
BFB Bubbling Fluidized Bed
CFB Circulating Fluidized Bed
Def. Defluidization
DEM Discrete Element Method
Exp. Experiment
ER Equivalence Ratio
HTA High Temperature Ash (prepared at 850 °C)
ICP-OES Inductively Coupled Plasma - Optical Emission Spectrometry
IDT Initial Deformation Temperature
LTA Low Temperature Ash (prepared at 550 °C)
LTCFB Low-Temperature Circulating Fluidized Bed
MFC Mass Flow Controller
mol.% Molar percent
No. Number
ODA Optical Dilatometry Analysis
Ref. Reference
SFH Sunflower Husk
SFR Steam To Fuel Ratio
SEM-EDX Scanning Electron Microscopy with Energy-Dispersive X-ray spectroscopy
TMA Thermal Mechanical Analysis
TGA Thermogravimetric Analysis
TG/DSC Thermo-Gravimetric/Differential Scanning Calorimetry
TG/DTA Thermogravimetry/Differential Thermal Analysis
TG/DTG Thermogravimetry/Derivative Thermogravimetry
vol.% Volume percent
WS Wheat Straw
wt.% Weight percent
XRD X-Ray Diffraction
Agglomeration during Fluidized Bed Combustion and Gasification of Biomass
XVIII
Symbols
dp10 µm The portion of particles with diameters smaller than this value is 10%.
dp90 µm The portion of particles with diameters below this value is 90%.
Hmf m Static bed height
g m⸱s-2 Gravitational acceleration
TDef. °C Defluidization temperature
Tmelting °C Melting temperature
Umf m/s Minimum fluidization velocity
Ug m/s Superficial gas velocity
Ut m/s Total flow rat of primary gas
Up m/s Flow rate of pulsed flow
Uc m/s Flow rate of continuous flow
TON ms Time of “flow-ON” period
TOFF ms Time of “flow-OFF” period
DTGmax %⸱min-1 Maximum weight loss rates
Tp °C Temperature of maximum weight loss rates
Greek letters
ƒ Hz Pulsation frequency
ƒN Hz Natural frequency of fluidized bed
Contents
XIX
Contents
Preface and Acknowledgments ......................................................................................................... I
Summary .......................................................................................................................................... III
Dansk resumé ................................................................................................................................. VII
List of Figures .................................................................................................................................. XI
List of Tables .................................................................................................................................. XV
Abbreviations and Symbols........................................................................................................ XVII
Contents ......................................................................................................................................... XIX
1. Introduction ................................................................................................................................ 1
1.1 Background......................................................................................................................... 1
1.2 Project objectives ............................................................................................................... 2
1.3 Structure of this thesis ....................................................................................................... 3
2. Literature Survey ....................................................................................................................... 7
Abstract ........................................................................................................................................... 7
2.1 Introduction ........................................................................................................................ 8
2.1.1 Biomass fuels ................................................................................................................... 8
2.1.2 Biomass combustion and gasification in fluidized bed .................................................... 9
2.1.3 Challenges in fluidized bed combustion and gasification of biomass ........................... 10
2.1.4 Outline of review ........................................................................................................... 10
2.2 Mechanisms of agglomeration ........................................................................................ 11
2.2.1 “Melt-induced” agglomeration ...................................................................................... 11
2.2.2 “Coating-induced” agglomeration ................................................................................. 12
2.3 Agglomeration in combustion and gasification ............................................................. 14
2.3.1 Influencing parameters on agglomeration in combustion .............................................. 15
2.3.2 Influencing parameters on agglomeration in gasification .............................................. 16
2.3.3 Comparison of agglomeration in combustion and gasification ..................................... 18
2.3.4 Influence of gas environment on ash transformation ..................................................... 19
2.4 Countermeasures of agglomeration ............................................................................... 27
2.4.1 Altering ash chemistry ................................................................................................... 28
Agglomeration during Fluidized Bed Combustion and Gasification of Biomass
XX
2.4.2 Improving fluidization quality in the bed ...................................................................... 32
2.5 Summary ........................................................................................................................... 35
3. Agglomeration in Fluidized Bed Gasification of Wheat Straw............................................ 53
Abstract ......................................................................................................................................... 53
3.1 Introduction ...................................................................................................................... 54
3.2 Experimental section........................................................................................................ 55
3.2.1 Fuel and bed material ..................................................................................................... 55
3.2.2 Experimental apparatus .................................................................................................. 56
3.2.3 Experimental conditions and procedure ......................................................................... 57
3.2.4 Characterization ............................................................................................................. 59
3.2.5 Thermodynamic equilibrium calculations ..................................................................... 60
3.3 Results ............................................................................................................................... 60
3.3.1 Agglomeration tendency in an air blown system ........................................................... 60
3.3.2 Influence of steam on agglomeration tendency ............................................................. 61
3.3.3 Influence of CO2 on agglomeration tendency ................................................................ 62
3.3.4 Summary of all fluidized bed experiments .................................................................... 62
3.3.5 Residual char in the bed ................................................................................................. 63
3.3.6 Morphology and elemental composition of agglomerate samples ................................. 64
3.3.7 Thermodynamic equilibrium calculations ..................................................................... 66
3.4 Discussion .......................................................................................................................... 67
3.4.1 Reducing atmosphere ..................................................................................................... 68
3.4.2 Influence of char residuals (unconverted carbon) on the agglomeration ....................... 68
3.4.3 Effect of steam ............................................................................................................... 69
3.4.4 Role of in-bed high concentration CO2 .......................................................................... 70
3.4.5 Plausible mechanism for agglomeration in fluidized bed gasification of wheat straw .. 71
3.5 Conclusions ....................................................................................................................... 72
4. Fusion Behavior of Wheat Straw Ash under Combustion and Gasification Conditions .. 79
Abstract ......................................................................................................................................... 79
4.1 Introduction ...................................................................................................................... 80
4.2 Experimental section........................................................................................................ 81
4.2.1 Materials......................................................................................................................... 81
4.2.2 Experimental apparatus .................................................................................................. 81
4.2.3 Experimental conditions and procedures ....................................................................... 82
4.2.4 Characterization ............................................................................................................. 83
Contents
XXI
4.3 Results and discussion ..................................................................................................... 83
4.3.1 Fusion behavior of high temperature ashes (HTA) ........................................................ 83
4.3.2 Agglomerates of mixture of wheat straw and sand ........................................................ 89
4.4 Conclusion......................................................................................................................... 90
5. Influence of Biomass Types on Agglomeration during Combustion and Gasification ..... 95
Abstract ......................................................................................................................................... 95
5.1 Introduction ...................................................................................................................... 96
5.2 Methodology ..................................................................................................................... 97
5.2.1 Fuel and bed material ..................................................................................................... 97
5.2.2 Experimental apparatus .................................................................................................. 98
5.2.3 Experimental conditions and procedures ....................................................................... 98
5.2.4 Characterization of ashes ............................................................................................... 99
5.2.5 Thermodynamic equilibrium calculations ..................................................................... 99
5.3 Results ............................................................................................................................. 100
5.3.1 Agglomeration tendency during combustion ............................................................... 100
5.3.2 Agglomeration tendency during air blown gasification ............................................... 100
5.3.3 Agglomeration tendency during steam gasification ..................................................... 101
5.3.4 Reactivity of chars from WSs and SFH in combustion and CO2 gasification ............. 102
5.3.5 Characterization of ash and agglomerates ................................................................... 103
5.3.6 K distribution predicted by thermodynamic equilibrium calculations ......................... 108
5.4 Discussion ........................................................................................................................ 110
5.4.1 Influence of Si/K on ash chemistry and agglomeration ............................................... 110
5.4.2 Influence of char reactivity on agglomeration ............................................................. 111
5.5 Conclusions ..................................................................................................................... 112
6. Application of Pulse Flow to a Fluidized Bed for Combustion and Gasification of Wheat
Straw ............................................................................................................................................... 115
Abstract ....................................................................................................................................... 115
6.1 Introduction .................................................................................................................... 116
6.2 Experimental section...................................................................................................... 117
6.2.1 Fuel and bed material ................................................................................................... 117
6.2.2 Experimental apparatus ................................................................................................ 117
6.2.3 Experimental conditions and procedures ..................................................................... 118
6.3 Results and discussion ................................................................................................... 121
6.3.1 Influence of pulsed flow on defluidization tendency during combustion .................... 121
Agglomeration during Fluidized Bed Combustion and Gasification of Biomass
XXII
6.3.2 Application of pulsed flow on defluidization tendency during gasification ................ 126
6.3.3 Influence of pulsed flow on combustion behaviors ..................................................... 129
6.4 Conclusions ..................................................................................................................... 131
7. Conclusions and suggestions for future work...................................................................... 137
7.1 Conclusions ..................................................................................................................... 137
7.2 Suggestion for future work............................................................................................ 139
Appendix A ..................................................................................................................................... 141
Appendix B ..................................................................................................................................... 147
Appendix C ..................................................................................................................................... 148
Introduction
1
1. Introduction
1.1 Background
Biomass is a renewable and carbon neutral energy resource, and it is considered as a good substitute
to fossil fuels. More than 35% of Denmark’s energy consumption comes from renewable in 20181,
and Denmark is striving to be 100% independent of fossil fuels by 20502. Biomass is one of important
renewable energy sources in Denmark, especially woody biomass and straw. In 2018, woody biomass
and straw account for 48% and 7% of the consumption of renewable energy in Denmark1. More than
50% of the demand of woody biomass in Denmark depends on import, while straw is produced
domestically1.
Fluidized bed combustor and gasifier are widely applied to biomass combustion and gasification
owing to their characteristics of homogeneous temperature and high fuel flexibility. However, the
utilization of biomass in fluidized bed faces the challenge of agglomeration, which can strongly
influence the performance of the reactors and may eventually lead to defluidization and unscheduled
plant shutdown3–6. The agglomeration in a fluidized bed is mainly caused by the presence of molten
phase, i.e. the alkali containing compounds, from biomass ash and/or the interaction between biomass
ash and bed materials. Because of the high content of potassium, the herbaceous biomass is especially
problematic regarding the agglomeration. For example, the agglomeration was observed at as low as
700 °C in a straw fired fluidized bed7. The agglomeration in fluidized bed conversion of biomass at
high temperatures is a complex process4,8. The occurrence and the degree of agglomeration depend
on biomass properties (such as ash content and ash-forming composition), bed material properties
(such as size and material type), operation parameters (such as temperature and gas velocity), and
reaction environment (such as combustion and gasification)8–10.
Although the agglomeration in biomass combustion and gasification are extensively studied in the
past decades, the detailed agglomeration tendency and mechanisms in gasification are still not fully
understood. In particular, the effect of equivalence ratio (ER), which one of the most important
parameter for the yield and quality of the producer gas11, on the agglomeration is unclear. Moreover,
steam is introduced to a gasifier alone or together with air/O2, depending on the gasification is
allothermal or autothermal. The effect of a high concentration of steam on agglomeration in fluidized
bed gasification of biomass is unknown. A systematically investigation on the influence of these two
factors on agglomeration could provide more knowledge for design and operation of biomass gasifiers.
At the beginning of this project, a low-temperature circulating fluidized bed (LTCFB) gasifier at
CHEC in Risø campus experienced an unscheduled shutdown in gasification of a batch of wheat
Agglomeration during Fluidized Bed Combustion and Gasification of Biomass
2
straw due to the defluidization after operating for two days. However, no such problem was observed
in gasification of another batch of wheat straw with similar composition after running for more than
two weeks under the same operation conditions. In order to understand the different agglomeration
behaviors of two batches of wheat straw, the bed materials from two cases were examined in term of
defluidization temperature12. As shown in Figure 1-1, the results show that the defluidization
temperatures of the two bed samples under combustion condition are both around 770 °C. However,
the carbon content contained in the bed sample that taken from case without defluidization is almost
five times of that in the bed sample that taken from case with defluidization. It would be of interest
to study the mechanisms behind the different agglomeration behaviors in gasification of two batches
of wheat straws.
Figure 1-1 Bed temperature & pressure (left) and concentrations of CO, CO2 and O2 (right) as a function of time during
the combustion of bed samples that taken from gasification of two batches of wheat straw in LTCFB gasifier.
Most proposed countermeasures for reducing agglomeration during biomass utilization have been
focused on changing the ash chemistry in the bed, such as pretreatment of biomass, co-combustion
of K-lean fuels, addition of additive, and utilization of alternative bed materials13–15. However, all of
these countermeasures are associated with an additional cost or environmental problems. The pulsed
flow was applied as a measure to fluidize the sticky particles, e.g., sub-micro size particle16–18, due to
its positive effects on the fluidization quality in fluidized bed. However, its effect on agglomeration
in fluidized bed combustion and gasification of biomass is not reported.
1.2 Project objectives
This PhD project aims at having an improved understanding of the agglomeration in fluidized bed
combustion and gasification of biomass, with a special emphasis on the influence of the equivalence
ratio (ER), the gasification agents (such as air, steam and carbon dioxide), and the biomass types on
agglomeration. The objectives are to:
0 1000 2000 3000 4000 5000 60000
200
400
600
800
1000
1200
1400
1600
Bed
pre
ssu
re /
Pa
Time / s
P Sampel with defluidization
P Sampel without defluidization
0
100
200
300
400
500
600
700
800
900
T Sampel with defluidization
T Sample without defluidization
Bed
Tem
per
atu
re /
°C
763 C
848 C
769 C
839 C
0 1000 2000 3000 4000 5000 60000
2
4
6
8
10
12
14
16
18
20
22
CO Sampel with defluidization
CO2 Sampel with defluidization
O2 Sampel with defluidization
CO Sampel without defluidization
CO2 Sampel without defluidization
O2 Sampel without defluidization
Gas
con
cen
trati
on
s /
%
Time / s
Introduction
3
Investigate the tendency and mechanism of agglomeration in combustion/gasification of
wheat straw, focusing on the impacts of varying ER, as well as addition of steam and carbon
dioxide in the bed on agglomeration.
Explore the fusion behavior of ashes from wheat straw under combustion and gasification
conditions to further understand the agglomeration in biomass gasification, highlighting the
influence of gas atmosphere on the melting of wheat straw ash.
Study the agglomeration of different types of biomass in combustion/gasification, underlining
the influences of ash-forming elements and char reactivity of different biomasses on
agglomeration characteristics. Investigate the agglomeration of different batches of same type
of biomass (two batches of wheat straw described in Section 1.1) to understand the mechanism
of their different agglomeration behaviors during gasification.
Evaluate the pulsed flow as a potential economic countermeasure for mitigating
agglomeration in combustion and gasification of biomass.
1.3 Structure of this thesis
This thesis is divided into seven chapters, including introduction. The content of each chapter is listed
below:
Chapter 2: Literature Survey
This chapter provides an overview of agglomeration in fluidized bed combustion and gasification of
biomass. Two extensively reported mechanisms of agglomeration in biomass combustion and
gasification are introduced. The factors that influencing agglomeration, including operating
conditions, fuel property, bed material property, and gas atmosphere, are reviewed. In addition, the
countermeasures for retarding agglomeration are discussed.
Chapter 3: Agglomeration in Fluidized Bed Gasification of Wheat Straw
This chapter presents the investigations on the agglomeration during combustion and gasification of
a wheat straw (the wheat straw that caused defluidization in LTCFB gasifier, as described in Section
1.1) in a lab-scale fluidized bed reactor, with an emphasis on the influence of equivalence ratio (ER)
on agglomeration in gasification air blown, air/steam and air/carbon dioxide gasification. The
influence of gasification agents, such as steam and carbon dioxide, on agglomeration tendency are
discussed.
Chapter 4: Fusion Behavior of Wheat Straw Ash under Combustion and Gasification
Conditions
In this chapter, the fusion behaviors of the ashes from wheat straw (the straw used in Chapter 3),
straw char and mixture of straw and silica sand under combustion conditions (100% air, and a mixture
Agglomeration during Fluidized Bed Combustion and Gasification of Biomass
4
of 50 vol.% steam and 50 vol.% air) and gasification condition (a mixture of 50 vol.% steam and 50
vol.% N2) are investigated in a fixed bed reactor at 850 °C. The influences of a high concentration of
steam and a reducing atmosphere on the fusion tendency of wheat straw ash are studied to further
understand of the agglomeration tendency in gasification of wheat straw described in Chapter 3.
Chapter 5: Influence of Biomass Types on Agglomeration during Combustion and Gasification
In this chapter, the tendencies and mechanisms of agglomeration during combustion and gasification
of two types of biomass, including two batches of wheat straw used in LTCFB gasifier and one
sunflower husk, are studied in a lab-scale fluidized bed. The influence of ash-forming elements of
biomass, especially the molar ratio of silicon to potassium, on the distribution of potassium during
combustion and gasification, as well as their further effect on the tendency and mechanism of
agglomeration are discussed. In addition, the effect of char reactivity of biomass on agglomeration
are investigated, providing an improved understanding for the different agglomeration behaviors of
two wheat straws in LTCFB gasifier that has been described in Section 1.1.
Chapter 6: Application of Pulse Flow to a Fluidized Bed for Combustion and Gasification of
Wheat Straw
The experimental results of application of a pulsed flow to the fluidized bed combustion and
gasification of wheat straw (the one used in Chapter 3) are summarized in this chapter. The potential
of pulsed fluidized bed on mitigating agglomeration is presented. The effects of important operating
parameters, such as flow rate ratio of pulsation, pulsation frequency, and pulsation duty cycle on
agglomeration tendency, are investigated.
Chapter 7: Conclusions and future work
In this chapter, the main conclusions obtained in this PhD project are summarized. Some suggestions
for the future work are put forward based on the findings of this work.
Appendix
Appendix A-C contain supporting information for Chapters 3, 4, and 5.
Introduction
5
Reference
(1) Danish Energy Agency. Energy Statistics 2018; Copenhagen, Denmark, 2020.
(2) Gregg, J. S.; Bolwig, S.; Ola, S.; Vejlgaard, L.; Gundersen, S. H.; Grohnheit, P. E. Experiences
with Biomass in Denmark; Herrmann, I. T., Karlsson, K. B., Eds.; DTU Management
Engineering, 2014.
(3) Anicic, B.; Lin, W.; Dam-Johansen, K.; Wu, H. Agglomeration Mechanism in Biomass
Fluidized Bed Combustion – Reaction between Potassium Carbonate and Silica Sand. Fuel
Process. Technol. 2018, 173, 182–190.
(4) Michel, R.; Kaknics, J.; De Bilbao, E.; Poirier, J. The Mechanism of Agglomeration of the
Refractory Materials in a Fluidized-Bed Reactor. Ceram. Int. 2016, 42 (2), 2570–2581.
(5) Gatternig, B.; Karl, J. Investigations on the Mechanisms of Ash-Induced Agglomeration in
Fluidized-Bed Combustion of Biomass. Energy & Fuels 2015, 29, 931–941.
(6) Grimm, A.; Skoglund, N.; Boström, D.; Öhman, M.; Bostr, D.; Ohman, M.; Boström, D.;
Öhman, M.; Bostr, D.; Ohman, M. Bed Agglomeration Characteristics in Fluidized Quartz Bed
Combustion of Phosphorus-Rich Biomass Fuels. Energy & Fuels 2011, 25 (3), 937–947.
(7) Grubor, B.D.; Oka, S.N.; Ilic, M.S.; Dakic, D.V.; Arsic, B. .; Grubor, B. D.; Oka, S. N.; Ilic,
M. S.; Dakic, D. V.; Arsic, B. T. Biomass FBC Combustion - Bed Agglomeration Problems.
In Proceedings of the 13th International Conference on Fluidized Bed Combustion; American
Society of Mechanical Engineers: United States, 1995; Vol. 1, pp 515–522.
(8) Scala, F.; Chirone, R.; Consiglio, C.; Tecchio, P. V.; July, R. V; Re, V.; Recei, M.; October,
V. Characterization and Early Detection of Bed Agglomeration during the Fluidized Bed
Combustion of Olive Husk. Energy & Fuels 2006, 20 (10), 120–132.
(9) Lin, W.; Dam-Johansen, K.; Frandsen, F. Agglomeration in Bio-Fuel Fired Fluidized Bed
Combustors. Chem. Eng. J. 2003, 96 (1–3), 171–185.
(10) Öhman, M.; Pommer, L.; Nordin, A. Bed Agglomeration Characteristics and Mechanisms
during Gasification and Combustion of Biomass Fuels. Energy & Fuels 2005, 19 (4), 1742–
1748.
(11) Alauddin, Z. A. B. Z.; Lahijani, P.; Mohammadi, M.; Mohamed, A. R. Gasification of
Lignocellulosic Biomass in Fluidized Beds for Renewable Energy Development: A Review.
Renew. Sustain. Energy Rev. 2010, 14, 2852–2862.
(12) Aničić, B. Agglomeration Mechanisms during Fluidized Bed Combustion of Biomass,
Technical University of Denmark, 2018.
(13) Niu, Y.; Tan, H. Ash-Related Issues during Biomass Combustion : Alkali-Induced Slagging ,
Silicate Melt-Induced Slagging ( Ash Fusion ), Agglomeration , Corrosion , Ash Utilization ,
and Related Countermeasures. Prog. Energy Combust. Sci. 2016, 52, 1–61.
(14) Scala, F. Particle Agglomeration during Fluidized Bed Combustion: Mechanisms, Early
Agglomeration during Fluidized Bed Combustion and Gasification of Biomass
6
Detection and Possible Countermeasures. Fuel Process. Technol. 2018, 171, 31–38.
(15) Bartels, M.; Lin, W.; Nijenhuis, J.; Kapteijn, F.; van Ommen, J. R. Agglomeration in Fluidized
Beds at High Temperatures: Mechanisms, Detection and Prevention. Prog. Energy Combust.
Sci. 2008, 34 (5), 633–666.
(16) Guo, Q.; Wang, M.; Li, Y.; Yang, C. Fluidization of Ultrafine Particles in a Bubbling Fluidized
Bed with Sound Assistance. Chem. Eng. Technol. 2005, 28 (10), 1117–1124.
(17) Ali, S. S.; Asif, M. Fluidization of Nano-Powders: Effect of Flow Pulsation. Powder Technol.
2012, 225, 86–92.
(18) Akhavan, A.; Rahman, F.; Wang, S.; Rhodes, M. Enhanced Fluidization of Nanoparticles with
Gas Phase Pulsation Assistance. Powder Technol. 2015, 284, 521–529.
Literature Survey
7
2. Literature Survey
Abstract
This chapter provides an overview of the agglomeration in fluidized bed combustion and gasification
of biomass. The agglomeration mechanisms, factors influencing agglomeration, and countermeasures
for mitigating agglomeration are reviewed. It has been shown that the agglomeration in fluidized bed
combustion and gasification is aggravated by a high bed temperature, a small ratio of superficial gas
velocity to the minimum fluidization velocity (Ug/Umf), and a high alkali content in biomass. The
different gas atmospheres in the bed, such as the concentrations of H2, CO, steam, CO2, and O2, may
be responsible for the different agglomeration characteristics in combustion and gasification. The
influence of gas atmosphere on the agglomeration tendency of model compounds (alkali chloride,
carbonate, and sulfate and biomass ashes) has been investigated, showing that a reducing atmosphere
and a high concentration of steam in the bed accelerate the agglomeration of these alkali salts and
biomass ashes. However, the agglomeration tendency and mechanism in biomass gasification with
different gasification agents and equivalence ratios are unclear. Some countermeasures, such as
utilization of alternative bed materials, application of additives, pretreatment of biomass, and co-
combustion/gasification with alkali-lean fuels, have been proposed for retarding agglomeration in
fluidized bed combustion and gasification by altering of ash chemistry to reduce the formation of
low-melting temperature compounds. However, most of these countermeasures lead to an additional
operation cost. An effective and economic countermeasure for the agglomeration shows great
practical implication for the utilization of biomass fluidized bed. Due to the improvement of
fluidization quality in the bed by imposing of a pulsed flow in a conventional fluidized bed, the
application of pulsed fluidized bed has great potential on mitigating agglomeration in biomass
combustion and gasification.
Agglomeration during Fluidized Bed Combustion and Gasification of Biomass
8
2.1 Introduction
2.1.1 Biomass fuels
Biomass is a kind of biogenic solid product generated by natural and anthropogenic processes. It is a
mixture of organic matters (mainly cellulose, hemicellulose and lignin) and inorganic matters (such
as silicates, oxides, hydroxides, sulphates, phosphates, carbonates and chlorides etc.)1,2. According to
their biological diversity, source and origin, biomass can be categorized into several groups listed
below1.
Wood and woody biomass, e.g., soft and hard wood, bark, and sawdust
Herbaceous and agricultural biomass, e.g., grasses and flowers, straws, and husks
Aquatic biomass, e.g., algae and seaweed
Animal and human biomass wastes, e.g., meat-bone meal and chicken litter
Contaminated biomass and industrial biomass wastes, e.g., refuse derived fuel and sewage
sludge
Table 2-1 Compositions of representative biomass fuels from each category1
Spruce
wood
Spruce
bark
Wheat
straw
Coffee
husk
Micro-
algae
Chicken
litter
Sewage
sludge
Ash content
/wt.% db 0.5 3.2 7.1 2.5 23.6 37.8 46.3
Ultimate
analysis
/wt.% daf⸸
C 52.3 53.6 49.4 45.4 43.2 60.5 50.9
O 41.2 40.0 43.6 48.3 45.8 25.3 33.4
H 6.10 6.20 6.10 4.9 6.20 6.80 7.30
N 0.30 0.10 0.70 1.1 2.20 6.20 6.10
S 0.10 0.10 0.17 0.35 2.6 1.20 2.33
Cl 0.01 0.03 0.61 - 3.34 0.50 0.04
Chemical ash
composition
(normalized to
100%)
/ wt.%
SiO2 49.30 6.13 50.35 14.65 1.65 5.77 33.28
CaO 17.20 72.39 8.21 13.05 12.39 56.85 13.04
K2O 9.60 7.22 24.89 52.45 15.35 12.19 1.60
P2O5 1.90 2.69 3.54 4.94 9.76 15.40 15.88
Al2O3 9.40 0.68 1.54 7.07 0.85 1.01 12.91
MgO 1.10 4.97 2.74 4.32 12.50 4.11 2.49
Fe2O3 8.30 1.90 0.88 2.06 1.87 0.45 15.70
SO3 2.60 1.88 4.24 0.53 25.74 3.59 2.05
Na2O 0.50 2.02 3.52 0.66 19.88 0.60 2.25
TiO2 0.10 0.12 0.09 0.27 - 0.03 0.80
db: dry basis
⸸ daf: dry ash free basis
-: no data
The typical compositions of representative biomass from each category are summarized in Table 2-
1. The organic composition (C, H, O, N) are similar for various group of biomass. However, the ash
Literature Survey
9
content and ash-forming composition of biomass are highly variable. Generally, woody biomass has
a relatively low ash content and the ash is dominated by Ca and Si. Straw is rich in K and Si, and
husk is rich in K and Ca3.
2.1.2 Biomass combustion and gasification in fluidized bed
Gasification and combustion are extensively applied technologies for the conversion of biomass4,5.
Combustion is a process that converts biomass into gaseous products (e.g., H2O and CO2) to provide
heat and other forms of energy in the presence of sufficient oxygen or air6. Gasification transforms
biomass to combustible gases (e.g., H2, CO, and CH4) with a limited amount of oxidant supply, which
can be carbon dioxide, steam or oxygen7. Therefore, when the oxygen or air is used as an oxidant,
gasification process can be considered as a partial combustion process. In industry, the primary
gasification agents are CO2 and steam, and the dominate product gases are CO and H28. Steam
gasification attracts increasing attention due to the formation of H2-rich products9, and CO2
gasification will convert CO2 and carbon in biomass into CO, which could further be processed to
valuable synthetic fuels10. However, the reactions that occurs during steam and CO2 gasification are
the endothermic reactions. In order to make the process self-sufficient in heat, air or oxygen is
introduced to provide the necessary heat by partially oxidizing of biomass11.
Figure 2-1 Schematic of (a) typical circulating fluidized reactor and (b) typical bubbling fluidized bed reactor12
The types of combustors and gasifiers can be distinguished into fixed bed, fluidized bed, and entrained
flow according to the gas velocity13. Compared to fixed beds, fluidized beds have a better temperature
distribution, a higher fuel flexibility, a superior conversion efficiency, and a lower investment and
maintenance cost14. Therefore, fluidized beds are applied in large scale operations extensively. The
fluidized bed reactors are divided into bubbling fluidized beds (BFBs) and circulating fluidized beds
(CFBs) according to the fluidizing gas velocity15, as presented in Figure 2-1. BFB is a classical
approach in which the gas velocity is slightly higher than the minimum fluidization velocity (Umf) of
bed particles. Compared to BFB, the superficial gas velocity in CFB is much higher. For CFB, a high
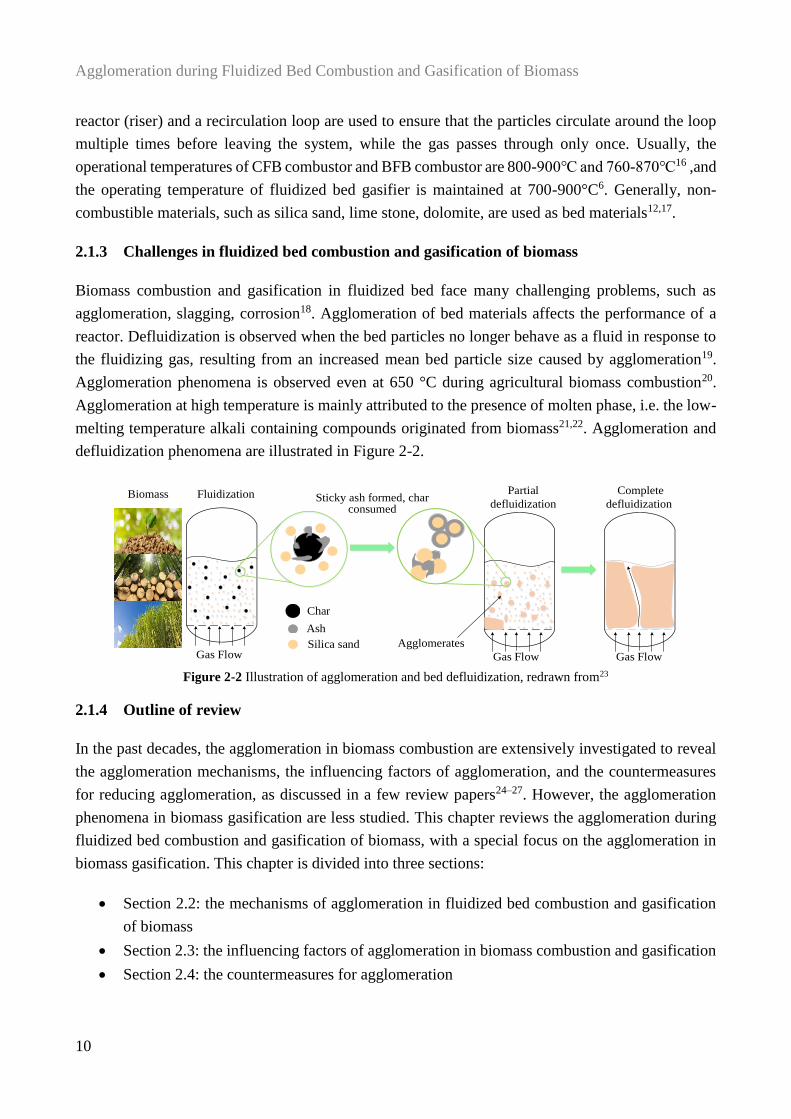
Agglomeration during Fluidized Bed Combustion and Gasification of Biomass
10
reactor (riser) and a recirculation loop are used to ensure that the particles circulate around the loop
multiple times before leaving the system, while the gas passes through only once. Usually, the
operational temperatures of CFB combustor and BFB combustor are 800-900℃ and 760-870℃16 ,and
the operating temperature of fluidized bed gasifier is maintained at 700-900°C6. Generally, non-
combustible materials, such as silica sand, lime stone, dolomite, are used as bed materials12,17.
2.1.3 Challenges in fluidized bed combustion and gasification of biomass
Biomass combustion and gasification in fluidized bed face many challenging problems, such as
agglomeration, slagging, corrosion18. Agglomeration of bed materials affects the performance of a
reactor. Defluidization is observed when the bed particles no longer behave as a fluid in response to
the fluidizing gas, resulting from an increased mean bed particle size caused by agglomeration19.
Agglomeration phenomena is observed even at 650 °C during agricultural biomass combustion20.
Agglomeration at high temperature is mainly attributed to the presence of molten phase, i.e. the low-
melting temperature alkali containing compounds originated from biomass21,22. Agglomeration and
defluidization phenomena are illustrated in Figure 2-2.
Figure 2-2 Illustration of agglomeration and bed defluidization, redrawn from23
2.1.4 Outline of review
In the past decades, the agglomeration in biomass combustion are extensively investigated to reveal
the agglomeration mechanisms, the influencing factors of agglomeration, and the countermeasures
for reducing agglomeration, as discussed in a few review papers24–27. However, the agglomeration
phenomena in biomass gasification are less studied. This chapter reviews the agglomeration during
fluidized bed combustion and gasification of biomass, with a special focus on the agglomeration in
biomass gasification. This chapter is divided into three sections:
Section 2.2: the mechanisms of agglomeration in fluidized bed combustion and gasification
of biomass
Section 2.3: the influencing factors of agglomeration in biomass combustion and gasification
Section 2.4: the countermeasures for agglomeration
Gas Flow
Complete
defluidization
Gas Flow
Partial
defluidization
Agglomerates
Sticky ash formed, char consumed
Gas Flow
FluidizationBiomass
Char
Ash
Silica sand
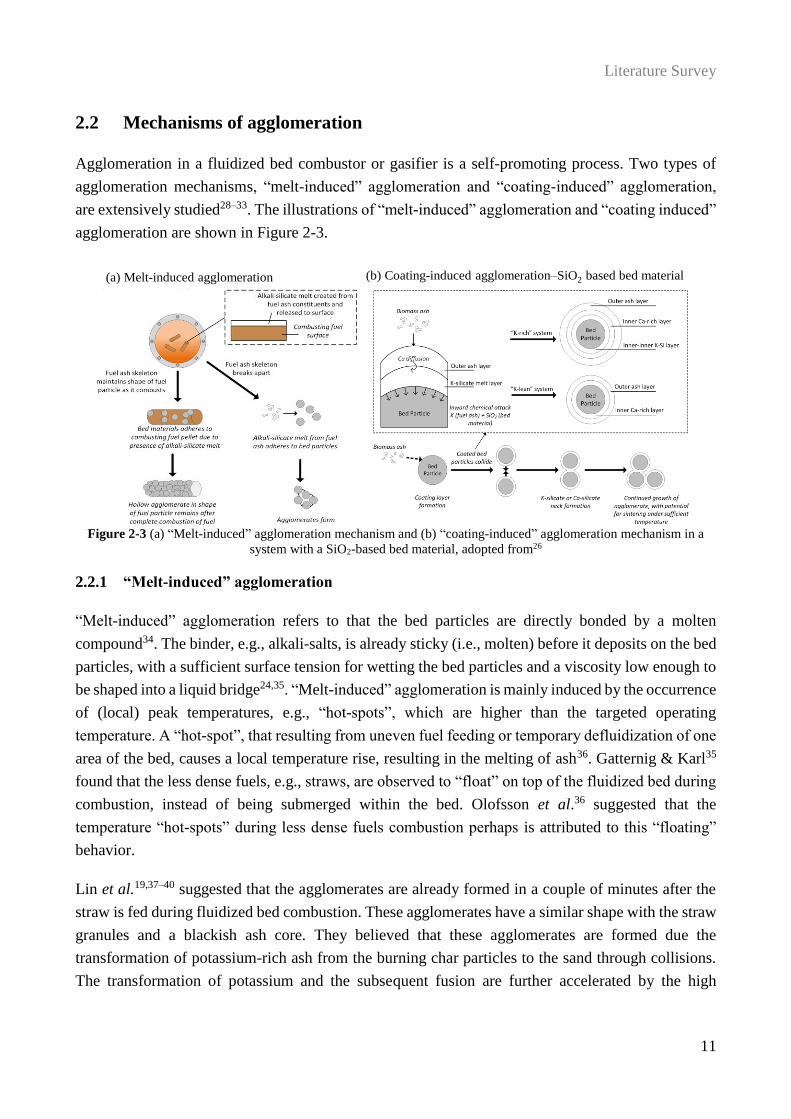
Literature Survey
11
2.2 Mechanisms of agglomeration
Agglomeration in a fluidized bed combustor or gasifier is a self-promoting process. Two types of
agglomeration mechanisms, “melt-induced” agglomeration and “coating-induced” agglomeration,
are extensively studied28–33. The illustrations of “melt-induced” agglomeration and “coating induced”
agglomeration are shown in Figure 2-3.
Figure 2-3 (a) “Melt-induced” agglomeration mechanism and (b) “coating-induced” agglomeration mechanism in a
system with a SiO2-based bed material, adopted from26
2.2.1 “Melt-induced” agglomeration
“Melt-induced” agglomeration refers to that the bed particles are directly bonded by a molten
compound34. The binder, e.g., alkali-salts, is already sticky (i.e., molten) before it deposits on the bed
particles, with a sufficient surface tension for wetting the bed particles and a viscosity low enough to
be shaped into a liquid bridge24,35. “Melt-induced” agglomeration is mainly induced by the occurrence
of (local) peak temperatures, e.g., “hot-spots”, which are higher than the targeted operating
temperature. A “hot-spot”, that resulting from uneven fuel feeding or temporary defluidization of one
area of the bed, causes a local temperature rise, resulting in the melting of ash36. Gatternig & Karl35
found that the less dense fuels, e.g., straws, are observed to “float” on top of the fluidized bed during
combustion, instead of being submerged within the bed. Olofsson et al.36 suggested that the
temperature “hot-spots” during less dense fuels combustion perhaps is attributed to this “floating”
behavior.
Lin et al.19,37–40 suggested that the agglomerates are already formed in a couple of minutes after the
straw is fed during fluidized bed combustion. These agglomerates have a similar shape with the straw
granules and a blackish ash core. They believed that these agglomerates are formed due the
transformation of potassium-rich ash from the burning char particles to the sand through collisions.
The transformation of potassium and the subsequent fusion are further accelerated by the high
(a) Melt-induced agglomeration (b) Coating-induced agglomeration–SiO2 based bed material
Agglomeration during Fluidized Bed Combustion and Gasification of Biomass
12
temperature of burning char particles. Scala et al.21,41–44 investigated the role of fine char particles on
agglomeration during biomass combustion. They found that a large fraction of char particles are
converted to fine particles due to the attrition/percolative fragmentation process in the bed during
biomass combustion even when coarsely grained fuel is used41,42. The conversion of fixed carbon
takes place essentially along two competitive pathways: (1) direct coarse char combustion and (2)
generation of elutriable carbon fines by attrition of the coarse char, followed by their post-combustion.
The second pathway is negligible for low-volatile solid fuels (such as Snibston coal), while is
important for high-volatile biomass fuels (such as Robinia Pseudoacacia). About half of the fixed
carbon burns along the second pathway, and the remainder is burnt directly as coarse char carbon41.
The attrited char may experience, upon further burn-off, peak temperatures that largely exceeding the
bed temperature, whilst coarse particles burn at temperatures only slightly above the bed temperature.
The combination of attrition-induced generation of fines particles and combustion-induced
overheating of char particles is responsible for the formation of ash-layered bed material, eventually
leading to bed agglomeration and defluidization43. It is suggested that the combustion mechanism of
char fines is that the formation of a “captive” solid carbon phase by adhesion of char fines onto bed
solids42, implying that the burning char particles could cause a “hot-spot” and could act as a platform
for agglomerates to grow19. The ash on the char fragment are molten at around 900 °C and attached
on the sands in the collisions with bed materials. Eventually, the char fragment fully combusts,
typically leaving an agglomerate with a hollow center in the shape of the initial fuel fragment45.
2.2.2 “Coating-induced” agglomeration
“Coating-induced” agglomeration is caused by a coating layer on the sand surface, which is formed
via continuous deposition of gaseous phase inorganic compounds or solid phase ash on the bed
materials34. The agglomeration is initiated with the bonding of coated particles when the coating
thickness or temperature is achieved34. Therefore, “coating-induced” agglomeration is often observed
under the condition with long operating time29. In addition, the agglomerates formed by “coating-
induced” mechanism usually are easily crushed or fall apart, meaning that the mechanical strength
between agglomerates is very limited29. Öhman et al.30,46 proposed that a multiple-layers (two- or
three-layers) coating is formed during agglomeration in fluidized bed combustion and gasification.
The illustrations of typical cross sections of bed particles are shown in Figure 2-446,47.
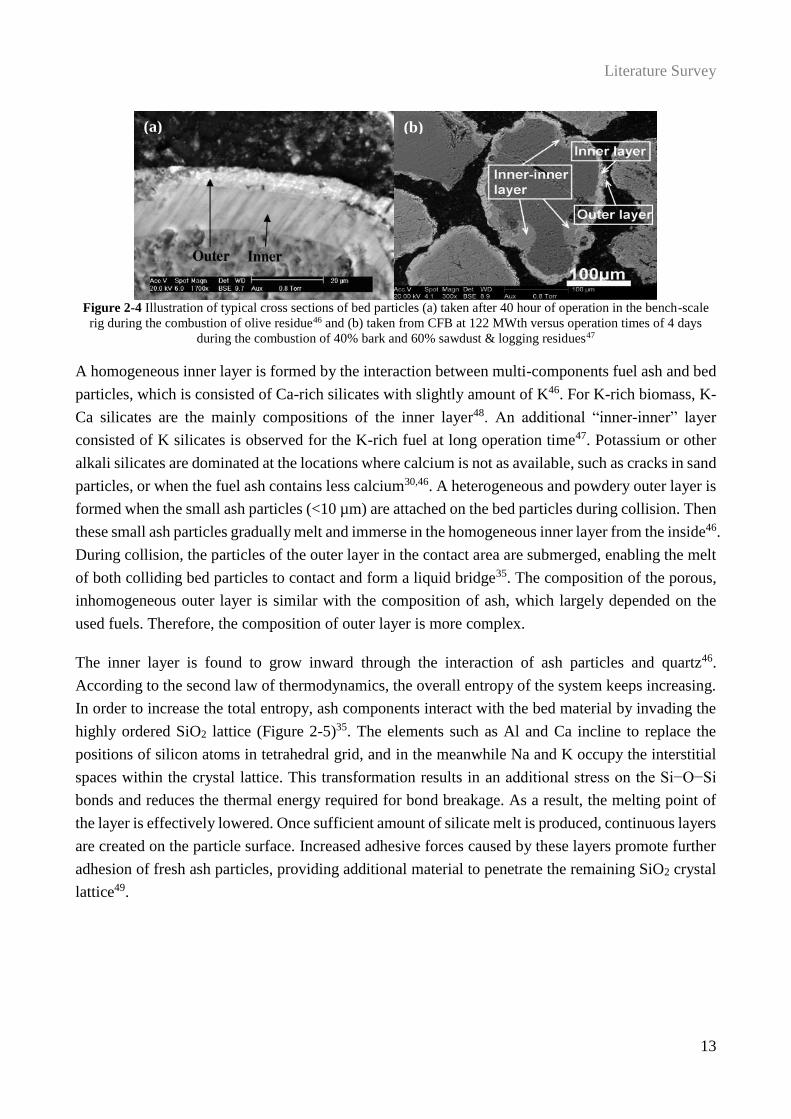
Literature Survey
13
Figure 2-4 Illustration of typical cross sections of bed particles (a) taken after 40 hour of operation in the bench-scale
rig during the combustion of olive residue46 and (b) taken from CFB at 122 MWth versus operation times of 4 days
during the combustion of 40% bark and 60% sawdust & logging residues47
A homogeneous inner layer is formed by the interaction between multi-components fuel ash and bed
particles, which is consisted of Ca-rich silicates with slightly amount of K46. For K-rich biomass, K-
Ca silicates are the mainly compositions of the inner layer48. An additional “inner-inner” layer
consisted of K silicates is observed for the K-rich fuel at long operation time47. Potassium or other
alkali silicates are dominated at the locations where calcium is not as available, such as cracks in sand
particles, or when the fuel ash contains less calcium30,46. A heterogeneous and powdery outer layer is
formed when the small ash particles (<10 µm) are attached on the bed particles during collision. Then
these small ash particles gradually melt and immerse in the homogeneous inner layer from the inside46.
During collision, the particles of the outer layer in the contact area are submerged, enabling the melt
of both colliding bed particles to contact and form a liquid bridge35. The composition of the porous,
inhomogeneous outer layer is similar with the composition of ash, which largely depended on the
used fuels. Therefore, the composition of outer layer is more complex.
The inner layer is found to grow inward through the interaction of ash particles and quartz46.
According to the second law of thermodynamics, the overall entropy of the system keeps increasing.
In order to increase the total entropy, ash components interact with the bed material by invading the
highly ordered SiO2 lattice (Figure 2-5)35. The elements such as Al and Ca incline to replace the
positions of silicon atoms in tetrahedral grid, and in the meanwhile Na and K occupy the interstitial
spaces within the crystal lattice. This transformation results in an additional stress on the Si−O−Si
bonds and reduces the thermal energy required for bond breakage. As a result, the melting point of
the layer is effectively lowered. Once sufficient amount of silicate melt is produced, continuous layers
are created on the particle surface. Increased adhesive forces caused by these layers promote further
adhesion of fresh ash particles, providing additional material to penetrate the remaining SiO2 crystal
lattice49.
(a) (b)
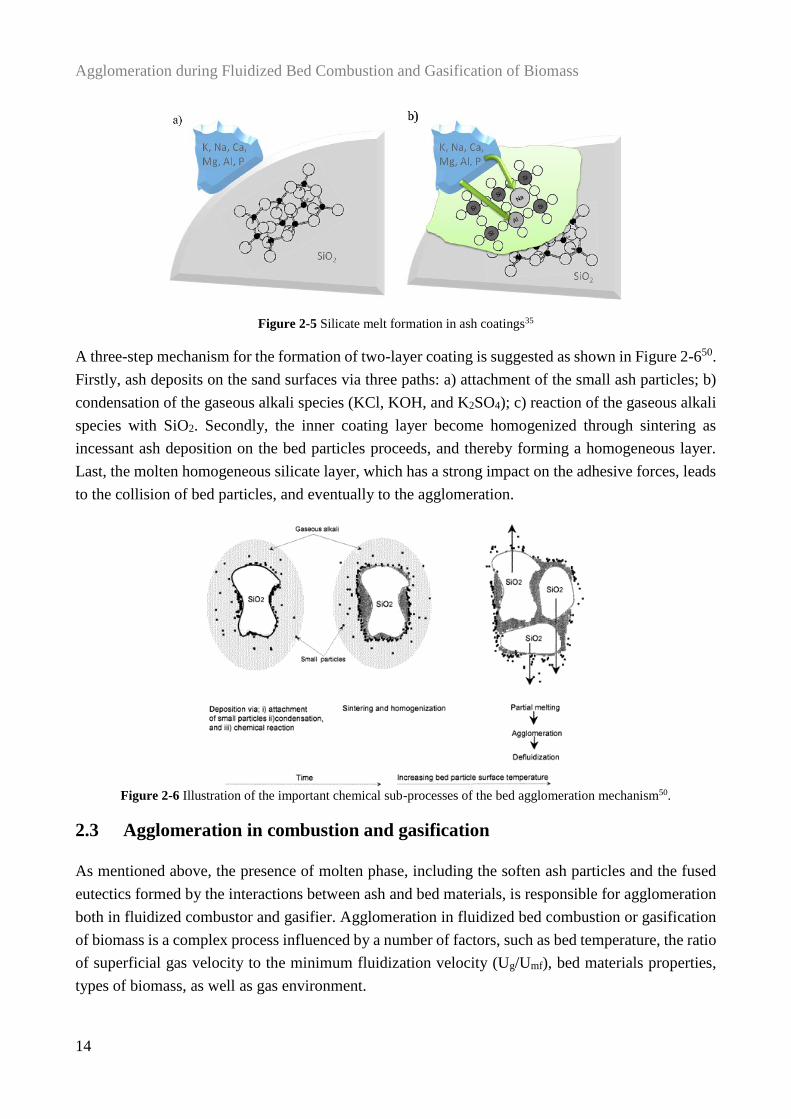
Agglomeration during Fluidized Bed Combustion and Gasification of Biomass
14
Figure 2-5 Silicate melt formation in ash coatings35
A three-step mechanism for the formation of two-layer coating is suggested as shown in Figure 2-650.
Firstly, ash deposits on the sand surfaces via three paths: a) attachment of the small ash particles; b)
condensation of the gaseous alkali species (KCl, KOH, and K2SO4); c) reaction of the gaseous alkali
species with SiO2. Secondly, the inner coating layer become homogenized through sintering as
incessant ash deposition on the bed particles proceeds, and thereby forming a homogeneous layer.
Last, the molten homogeneous silicate layer, which has a strong impact on the adhesive forces, leads
to the collision of bed particles, and eventually to the agglomeration.
Figure 2-6 Illustration of the important chemical sub-processes of the bed agglomeration mechanism50.
2.3 Agglomeration in combustion and gasification
As mentioned above, the presence of molten phase, including the soften ash particles and the fused
eutectics formed by the interactions between ash and bed materials, is responsible for agglomeration
both in fluidized combustor and gasifier. Agglomeration in fluidized bed combustion or gasification
of biomass is a complex process influenced by a number of factors, such as bed temperature, the ratio
of superficial gas velocity to the minimum fluidization velocity (Ug/Umf), bed materials properties,
types of biomass, as well as gas environment.
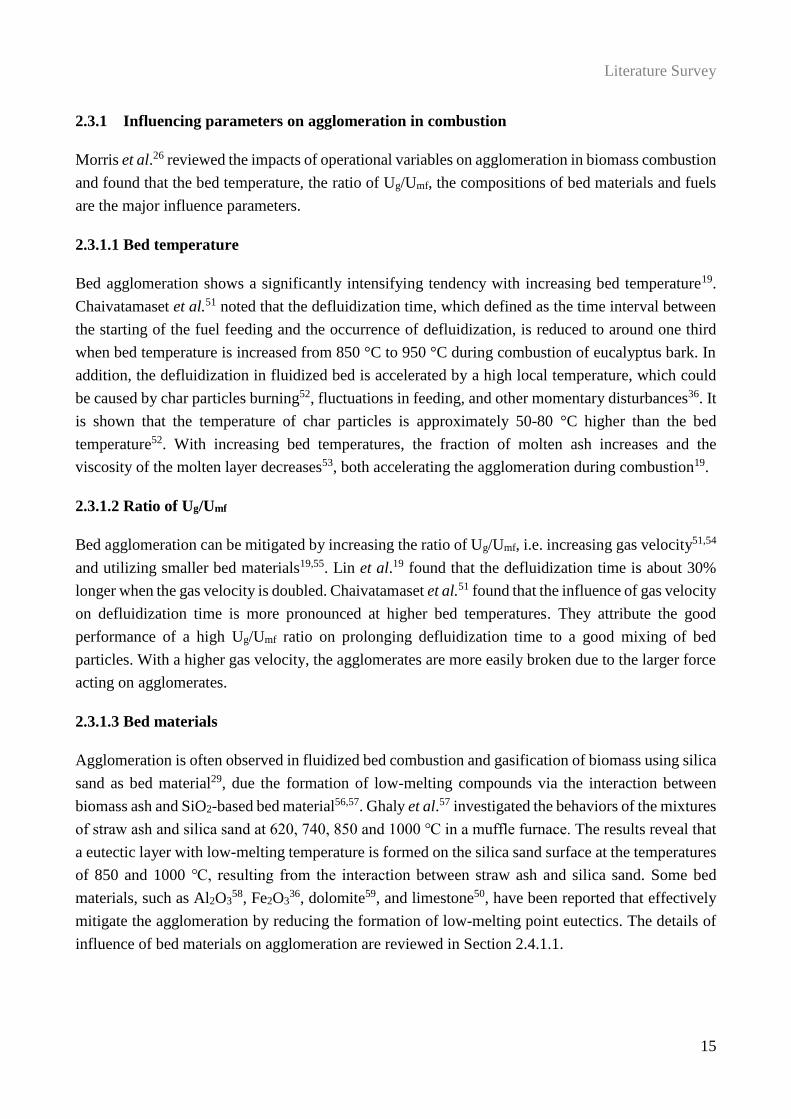
Literature Survey
15
2.3.1 Influencing parameters on agglomeration in combustion
Morris et al.26 reviewed the impacts of operational variables on agglomeration in biomass combustion
and found that the bed temperature, the ratio of Ug/Umf, the compositions of bed materials and fuels
are the major influence parameters.
2.3.1.1 Bed temperature
Bed agglomeration shows a significantly intensifying tendency with increasing bed temperature19.
Chaivatamaset et al.51 noted that the defluidization time, which defined as the time interval between
the starting of the fuel feeding and the occurrence of defluidization, is reduced to around one third
when bed temperature is increased from 850 °C to 950 °C during combustion of eucalyptus bark. In
addition, the defluidization in fluidized bed is accelerated by a high local temperature, which could
be caused by char particles burning52, fluctuations in feeding, and other momentary disturbances36. It
is shown that the temperature of char particles is approximately 50-80 °C higher than the bed
temperature52. With increasing bed temperatures, the fraction of molten ash increases and the
viscosity of the molten layer decreases53, both accelerating the agglomeration during combustion19.
2.3.1.2 Ratio of Ug/Umf
Bed agglomeration can be mitigated by increasing the ratio of Ug/Umf, i.e. increasing gas velocity51,54
and utilizing smaller bed materials19,55. Lin et al.19 found that the defluidization time is about 30%
longer when the gas velocity is doubled. Chaivatamaset et al.51 found that the influence of gas velocity
on defluidization time is more pronounced at higher bed temperatures. They attribute the good
performance of a high Ug/Umf ratio on prolonging defluidization time to a good mixing of bed
particles. With a higher gas velocity, the agglomerates are more easily broken due to the larger force
acting on agglomerates.
2.3.1.3 Bed materials
Agglomeration is often observed in fluidized bed combustion and gasification of biomass using silica
sand as bed material29, due the formation of low-melting compounds via the interaction between
biomass ash and SiO2-based bed material56,57. Ghaly et al.57 investigated the behaviors of the mixtures
of straw ash and silica sand at 620, 740, 850 and 1000 ℃ in a muffle furnace. The results reveal that
a eutectic layer with low-melting temperature is formed on the silica sand surface at the temperatures
of 850 and 1000 ℃, resulting from the interaction between straw ash and silica sand. Some bed
materials, such as Al2O358, Fe2O3
36, dolomite59, and limestone50, have been reported that effectively
mitigate the agglomeration by reducing the formation of low-melting point eutectics. The details of
influence of bed materials on agglomeration are reviewed in Section 2.4.1.1.
Agglomeration during Fluidized Bed Combustion and Gasification of Biomass
16
2.3.1.4 Types of biomass
As mentioned above, agglomeration during biomass conversion is mainly ascribed to the alkali (K/Na)
containing compounds originated from biomass60. The agglomeration tendency of K/Na-rich biomass,
therefore, could be high60. The formation of Ca/Mg silicates and K-Ca/Mg phosphates with high-
melting temperatures61 inhibit the agglomeration in combustion of Ca- and Mg-rich biomass62,63.
Generally, the biomass that has a high fraction of K/Na and a lower fraction of Ca/Mg favors
agglomeration21,64.
In addition to the alkali (K and Na) and alkaline earth metals (Mg and Ca), other inorganic elements,
such as Si, Al, Fe, P, and S, also affect the agglomeration during biomass combustion. A biomass
with an initial fuel ash composition that is close to the low-melting point eutectic composition appears
to enhance agglomeration64. The softening of wheat straw ash, which is originally rich in both alkali
and silicon, may start before the ash encounters the sand particles35,65. The presence of a high
phosphorous content in biomass influences the ash chemistry, resulting in the formed ash is
dominated by phosphates instead of silicates, and thereby affecting the agglomeration phenomenon
in combustion of biomass. Piotrowska et al.66 found that the defluidization temperature of bark is
lowered by co-combustion with rapeseed cake, which is rich in K and P. The low defluidization
temperature of rapeseed cake is attributed to the formation of sticky ash, which is dominated by K-
Ca/Mg phosphates. Boström et al.67 observed that the co-combustion of bark and rapeseed meal
causes a low initial defluidization temperature than the pure fuels, implying that an interaction
between the phosphates and the silicates probably exists that reduces the melting temperature of the
ash during co-combustion. Billen et al.28 studied the combustion of poultry litter, which is a P-rich
fuel. It is suggested that the agglomerates found at the walls of freeboard above the fluidized bed are
caused by K-silicates, while the agglomerates in the bed are caused by a solid bridge of Ca3(PO4)2
between bed materials formed via the interaction between CaO or Ca and molten HPO42- or H2PO4
-
salts. The impact of sulfur on agglomeration in biomass combustion are limitedly reported. Some
studies68,69 showed that co-combustion of high-sulfur coals and biomass could prevented
agglomeration. Varol et al.69 suggested that the sulfur in the coal may react with alkali oxides forming
alkali sulfates. Therefore, sulfur is an alternative reactant for alkali metals, generating a competitive
reaction to the reactions of Si and alkali oxides or salts. In addition, the existence of iron and
aluminum content will slow down the agglomeration due to the formation of eutectic with high-
melting point36.
2.3.2 Influencing parameters on agglomeration in gasification
The number of studies on agglomeration in fluidized bed gasification appears lower compared to
combustion, although the studies started earlier for gasification of coal70 and biomass71. In addition
to the factors that have been discussed for the combustion process, the equivalence ratio (ER, also
Literature Survey
17
called air ratio), which will affect the yield and composition of the producer gas in gasification72, is
an important operational parameter.
2.3.2.1 Bed temperature, ratio of Ug/Umf, bed materials, and types of biomass
In biomass gasification, the influences of bed temperature33,71, ratio of Ug/Umf73, bed material
types74,75, and biomass types74,76–80 have been investigated. Nisamaneenate et al.33 observed that the
defluidization time extends to 3 - 6 times by decreasing the bed temperature from 900 °C to 700 °C
in gasification of rice straw. Lin et al. 73 found that the defluidization time can be prolonged at a larger
ratio of Ug/Umf, resulting from either decreasing particle size of bed material or increasing gas velocity.
Ergudenler et al.71,81 reported that the agglomeration temperature of alumina sand in gasification of
wheat straw is higher than that of silica sand. Although alumina sand could mitigate agglomeration,
it is difficult to fluidize due to its high density82. The alkali-rich fuels often show high agglomeration
tendency. The defluidization is observed at temperatures of 750 °C76 and 780 °C77 during gasification
of palm empty fruit bunches and cardoon, whose K content in the ash are 50.8 wt.% and 30.6 wt.%
respectively. Kittivech et al.76 found that the defluidization time of rubber wood sawdust is more than
5 times of palm empty fruit bunch, although the ash content of rubber wood sawdust is only three
tenths of palm empty fruit bunch. This may be attributed to the high Ca and Mg content contained in
the rubber wood sawdust. Lin et al.73 investigated the effect of Na concentration on the agglomeration
in gasification of the mixture of sawdust and polyethylene by adding NaNO3 solution. The results
reveal that the addition of NaNO3 sharply reduces the defluidization time of the mixture, and this
effect becomes less pronounced with increasing Na concentration in the range of 0.2% - 3%. The
addition of Mg(NO3)2 and Ca(NO3)2 could prolong the defluidization time at the Na concentration
below 1%, whilst the addition of Mg and Ca shows insignificant effect on the defluidization time at
Na concentration of 3%.
In general, the bed temperature, the ratio of Ug/Umf, the fuel composition, and bed material type show
consistent effects on the agglomeration tendency in biomass gasification and combustion. Therefore,
the countermeasures that effective for retarding agglomeration in combustion usually also are
effective for the gasification process76,83,84, such as co-gasification of alkali-lean fuel and utilization
of alternative bed materials.
2.3.2.2 Equivalence Ratio (ER)
The influence of ER on agglomeration in gasification is limitedly studied. Ergudenler and Ghaly71,81
investigated the impact of ER on the agglomeration in wheat straw gasification using silica sand or
alumina sand as bed material. It is found that a severe agglomeration is observed in silica sand bed as
long as the temperature is above 800 °C, thus influence of ER on the agglomeration characteristics is
hardly to observe at the ER in a range of 0.26 - 0.76. In addition, no agglomeration is found for
alumina sand at ER in the range of 0.18 - 0.26. In their works, the ER is varied by adjusting the fuel
Agglomeration during Fluidized Bed Combustion and Gasification of Biomass
18
feeding rate with a constant gas flow rate or changing gas flow rate at a same fuel feeding rate.
Therefore, the bed temperature or the ratio of Ug/Umf seems to be difficult to keep at the same level
in investigation. Nisamaneenate et al.33 studied the influence of ER on defluidization time of rice
straw using bed materials with different alumina sand to silica sand ratios at temperature between 700
and 900 °C. They found that the influence of ER on agglomeration is related to the bed material
composition and bed temperature. For the pure silica sand or alumina sand, the ER shows negligible
effect on the defluidization time at 700 and 800 °C. However, the defluidization time is prolonged at
900 °C by increasing the ER from 0.2 to 0.4. For the mixture of alumina sand and silica sand in
different proportions, the influence of ER on agglomeration tendency is different.
2.3.3 Comparison of agglomeration in combustion and gasification
Different with the oxidizing atmosphere produced in combustion process, the gas environment
formed during gasification is mainly composed of CO, H2, CH4, H2O, and CO2, and the content of
each composition strongly depends on the ER and the gasify agent, e.g., air, oxygen, steam and carbon
dioxide10,85–87. The agglomeration tendencies and mechanisms in biomass gasification and
combustion may be different, resulting from the different gas environment in the two processes.
The comparison of agglomeration tendency in biomass combustion and gasification is limitedly
explored in the literatures. The agglomeration behaviors of several biomasses under gasification and
combustion atmospheres are compared in fluidized bed using silica sand as bed material by Öhman
et al.30,88. In their work, the ashes from combustion and gasification are firstly produced with 1.06
and 0.3/0.35 stoichiometric air, respectively. Then the initial agglomeration temperature of biomass
ash is determined at the point that the occurrence of agglomeration during heating process under
combustion and gasification atmospheres. The combustion atmosphere is simulated by the
combustion products of propane-air mixture, and the gasification atmosphere is simulated by the
products of a gas mixture containing CO, CO2, H2 and N2 that passes through the preheater and
platinum catalyst. The initial agglomeration temperatures of bark, olive flesh, and cane trash under
gasification atmosphere are tens of degrees lower than that under combustion atmosphere. However,
the reed cancan grass shows the opposite trend. It is suggested that no major difference in the
agglomeration mechanisms of these fuels is observed between the two different operational modes,
and the reason for the differences in their agglomeration temperatures under two gas atmospheres is
not investigated. It is noticed that the agglomeration temperature of Lucerne, which riches in S but
lean in Si, under gasification condition is much higher (180 °C) than that of combustion. They
attribute this to the formation of low-melting point KCl and K2SO4 eutectic under combustion
condition, whilst K2SO4 is unstable at reducing atmospheres. The eutectic mixture of KCl and K2SO4
is as low as 690 °C89. However, it is noteworthy that the inner layers of agglomerates from combustion
and gasification of Lucerne are dominated by K and Si, although Lucerne is a Si-lean fuel. The K
silicates may be produced by the interaction between Lucerne ash and bed material.
Literature Survey
19
Ma et al.90 investigated the defluidization temperatures of several straw ashes (wheat straw, rice straw
and corn straw) in fluidized bed under air, CO2, H2 and steam atmospheres, which was used for
simulation of combustion and gasification conditions. It is found that the defluidization temperatures
of the ash samples, which were prepared at 550 °C under air condition, in four atmospheres decrease
in the order of: air ≈ CO2 > H2 > steam, indicating that the reducing gas and steam promote the
agglomeration tendency of the straw ashes. The low defluidization temperatures of the straw ashes
under H2 atmosphere may be attributed to the transformation of K2SO4 into K silicates by interacting
with bed materials. However, the mechanism of the influence of steam on agglomeration is unclear.
In addition, these studies were carried out under the simulated gas atmospheres using the biomass
ashes as material, and the difference in agglomeration characteristics in a continuously feeding
combustion and gasification system is still unclear.
2.3.4 Influence of gas environment on ash transformation
Agglomeration in fluidized bed during thermal conversion process is an ash-related problem,
especially relates to the molten alkali (K and Na) containing compounds in biomass ash. Compared
to sodium, potassium plays a more crucial role in agglomeration due to its significant amount in
biomass91. K may be both organically and inorganically associated in biomass92–98. The chemical
forms of potassium in woody biomass and wheat straw have been investigated using chemical
fractionation analysis method99,100. It is suggested that the mainly water-soluble salts contained in
woody biomass may be KCl, K2SO4, K2HPO4 and KH2PO499, and the potassium in wheat straw may
present in the forms of KCl, K2SO4 and K silicates100. During biomass conversion, the potassium in
biomass can be transformed into gaseous phase (such as KCl and KOH vapor) and/or into condensed
phase (such as K2SO4 aerosols and K silicates particles)101–105, and then interacts with the bed
materials, resulting in agglomeration35. Although the comparison of agglomeration tendency in
combustion and gasification of biomass is limitedly studied, the influence of gas atmospheres, such
as oxidizing atmosphere, reducing atmosphere (i.e. CO and H2), high concentration of steam, and
high concentration of CO2, on transformation of K, e.g., the release of K and the reactions of K-
species and SiO2, and the ash behaviors, e.g., melting temperature and viscosity of the ashes, are
extensively investigated.
2.3.4.1 Release of K
Oxidizing atmospheres
During combustion, the release of potassium mainly takes place at two main stages: devolatilization
stage and char burnout stage92,106, as shown in Figure 2-7. In the devolatilization stage, the biomass
bonded potassium, for example, K-carboxylates and K-phenols, can be decomposed at temperature
below 700 ℃ to release atomic potassium. During the char oxidation stage, the residual char bonded
potassium is favored to be transformed to K2CO3 and K2SO4. K2CO3 starts to decompose at
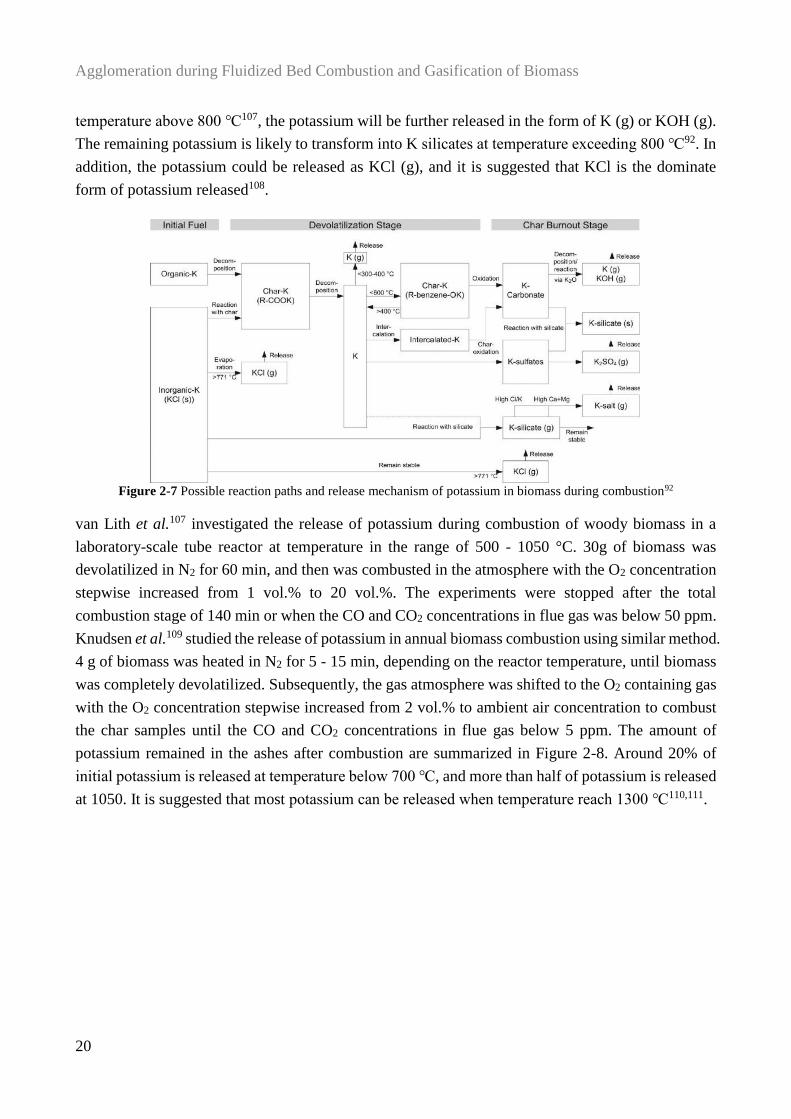
Agglomeration during Fluidized Bed Combustion and Gasification of Biomass
20
temperature above 800 ℃107, the potassium will be further released in the form of K (g) or KOH (g).
The remaining potassium is likely to transform into K silicates at temperature exceeding 800 ℃92. In
addition, the potassium could be released as KCl (g), and it is suggested that KCl is the dominate
form of potassium released108.
Figure 2-7 Possible reaction paths and release mechanism of potassium in biomass during combustion92
van Lith et al.107 investigated the release of potassium during combustion of woody biomass in a
laboratory-scale tube reactor at temperature in the range of 500 - 1050 °C. 30g of biomass was
devolatilized in N2 for 60 min, and then was combusted in the atmosphere with the O2 concentration
stepwise increased from 1 vol.% to 20 vol.%. The experiments were stopped after the total
combustion stage of 140 min or when the CO and CO2 concentrations in flue gas was below 50 ppm.
Knudsen et al.109 studied the release of potassium in annual biomass combustion using similar method.
4 g of biomass was heated in N2 for 5 - 15 min, depending on the reactor temperature, until biomass
was completely devolatilized. Subsequently, the gas atmosphere was shifted to the O2 containing gas
with the O2 concentration stepwise increased from 2 vol.% to ambient air concentration to combust
the char samples until the CO and CO2 concentrations in flue gas below 5 ppm. The amount of
potassium remained in the ashes after combustion are summarized in Figure 2-8. Around 20% of
initial potassium is released at temperature below 700 ℃, and more than half of potassium is released
at 1050. It is suggested that most potassium can be released when temperature reach 1300 ℃110,111.
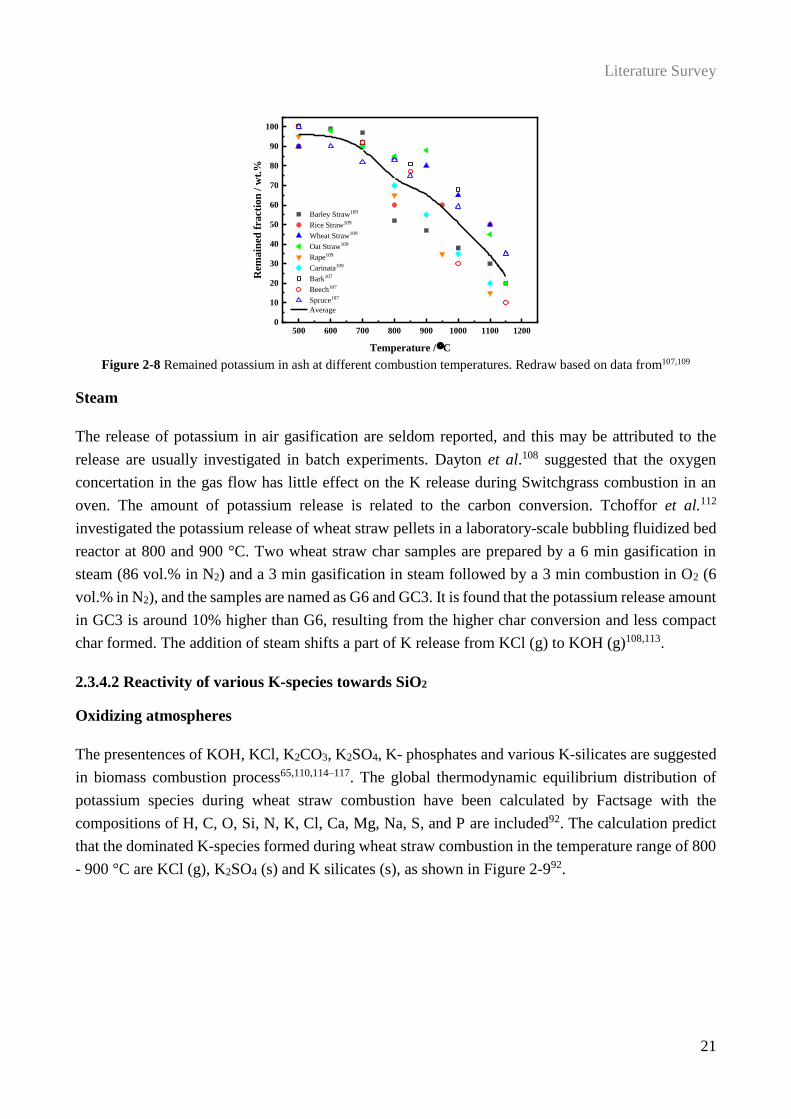
Literature Survey
21
Figure 2-8 Remained potassium in ash at different combustion temperatures. Redraw based on data from107,109
Steam
The release of potassium in air gasification are seldom reported, and this may be attributed to the
release are usually investigated in batch experiments. Dayton et al.108 suggested that the oxygen
concertation in the gas flow has little effect on the K release during Switchgrass combustion in an
oven. The amount of potassium release is related to the carbon conversion. Tchoffor et al.112
investigated the potassium release of wheat straw pellets in a laboratory-scale bubbling fluidized bed
reactor at 800 and 900 °C. Two wheat straw char samples are prepared by a 6 min gasification in
steam (86 vol.% in N2) and a 3 min gasification in steam followed by a 3 min combustion in O2 (6
vol.% in N2), and the samples are named as G6 and GC3. It is found that the potassium release amount
in GC3 is around 10% higher than G6, resulting from the higher char conversion and less compact
char formed. The addition of steam shifts a part of K release from KCl (g) to KOH (g)108,113.
2.3.4.2 Reactivity of various K-species towards SiO2
Oxidizing atmospheres
The presentences of KOH, KCl, K2CO3, K2SO4, K- phosphates and various K-silicates are suggested
in biomass combustion process65,110,114–117. The global thermodynamic equilibrium distribution of
potassium species during wheat straw combustion have been calculated by Factsage with the
compositions of H, C, O, Si, N, K, Cl, Ca, Mg, Na, S, and P are included92. The calculation predict
that the dominated K-species formed during wheat straw combustion in the temperature range of 800
- 900 °C are KCl (g), K2SO4 (s) and K silicates (s), as shown in Figure 2-992.
500 600 700 800 900 1000 1100 12000
10
20
30
40
50
60
70
80
90
100
Barley Straw109
Rice Straw109
Wheat Straw109
Oat Straw109
Rape109
Carinata109
Bark107
Beech107
Spruce107
Average
Rem
ain
ed f
ract
ion
/ w
t.%
Temperature / C
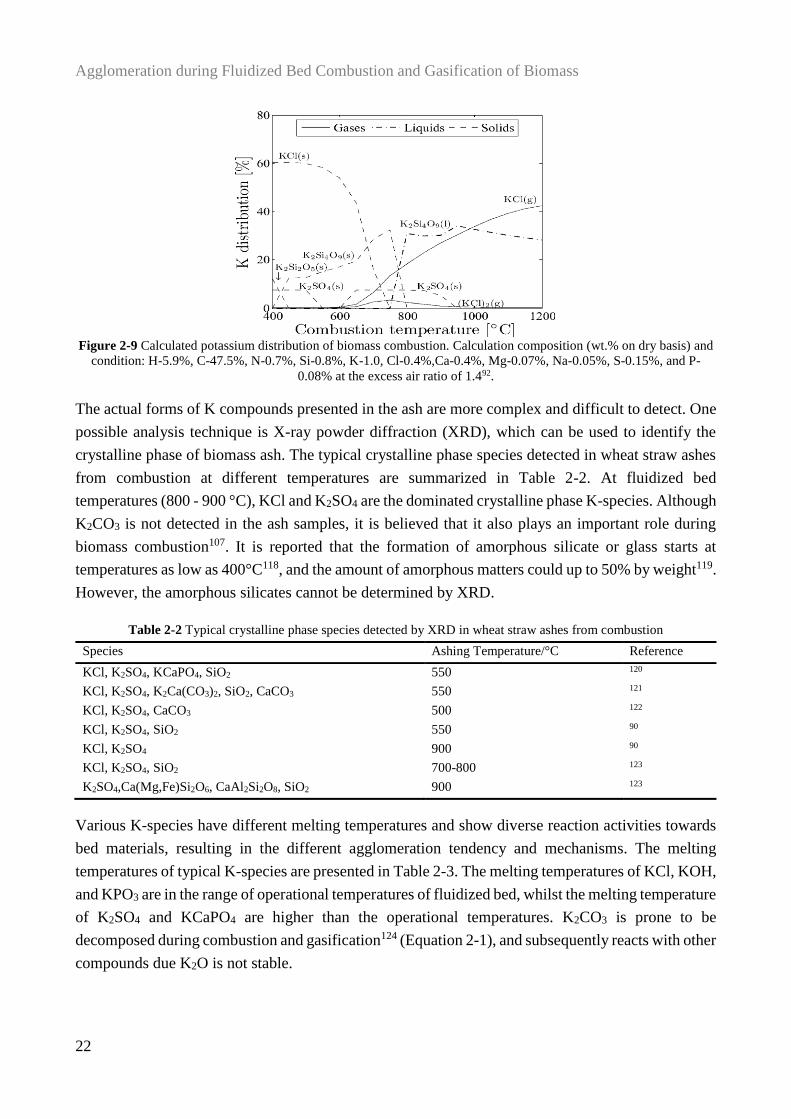
Agglomeration during Fluidized Bed Combustion and Gasification of Biomass
22
Figure 2-9 Calculated potassium distribution of biomass combustion. Calculation composition (wt.% on dry basis) and
condition: H-5.9%, C-47.5%, N-0.7%, Si-0.8%, K-1.0, Cl-0.4%,Ca-0.4%, Mg-0.07%, Na-0.05%, S-0.15%, and P-
0.08% at the excess air ratio of 1.492.
The actual forms of K compounds presented in the ash are more complex and difficult to detect. One
possible analysis technique is X-ray powder diffraction (XRD), which can be used to identify the
crystalline phase of biomass ash. The typical crystalline phase species detected in wheat straw ashes
from combustion at different temperatures are summarized in Table 2-2. At fluidized bed
temperatures (800 - 900 °C), KCl and K2SO4 are the dominated crystalline phase K-species. Although
K2CO3 is not detected in the ash samples, it is believed that it also plays an important role during
biomass combustion107. It is reported that the formation of amorphous silicate or glass starts at
temperatures as low as 400°C118, and the amount of amorphous matters could up to 50% by weight119.
However, the amorphous silicates cannot be determined by XRD.
Table 2-2 Typical crystalline phase species detected by XRD in wheat straw ashes from combustion
Species Ashing Temperature/°C Reference
KCl, K2SO4, KCaPO4, SiO2 550 120
KCl, K2SO4, K2Ca(CO3)2, SiO2, CaCO3 550 121
KCl, K2SO4, CaCO3 500 122
KCl, K2SO4, SiO2 550 90
KCl, K2SO4 900 90
KCl, K2SO4, SiO2 700-800 123
K2SO4,Ca(Mg,Fe)Si2O6, CaAl2Si2O8, SiO2 900 123
Various K-species have different melting temperatures and show diverse reaction activities towards
bed materials, resulting in the different agglomeration tendency and mechanisms. The melting
temperatures of typical K-species are presented in Table 2-3. The melting temperatures of KCl, KOH,
and KPO3 are in the range of operational temperatures of fluidized bed, whilst the melting temperature
of K2SO4 and KCaPO4 are higher than the operational temperatures. K2CO3 is prone to be
decomposed during combustion and gasification124 (Equation 2-1), and subsequently reacts with other
compounds due K2O is not stable.
Literature Survey
23
𝐾2𝐶𝑂3(𝑠,𝑙) → 𝐶𝑂2(𝑔) + 𝐾2𝑂(𝑠,𝑙) Equation 2-1
Table 2-3 Melting temperature of typical K-species
K-species Melting temperature (°C) K-species Melting temperature (°C)
KCl 770 K2SO4 1069
KOH 360 KPO3 810125
K2CO3 891(Decomposes) KCaPO4 1560125
The agglomeration of typical K-species and their mixture under air condition (oxidizing atmosphere)
are summarized in Table 2-4. The defluidization mechanisms of these K-salts can be categorized into
two groups: direct melting of K-salts (e.g., KCl and KCl/K2SO4 eutectic mixture) and formation of K
silicates by interaction between K-salts (e.g., K2CO3) and SiO2-based bed materials (Equation 2-2).
The agglomeration temperatures of the salts that cause defluidization by direct melting are close to
their melting temperatures. For the salts that cause agglomeration by the interaction between slats and
bed material, the agglomeration temperatures of the salts depend on the operation conditions of
experiments, such as heating rate, salts amount, and ratio of Ug/Umf. It is noteworthy to highlight that
no defluidization is observed when around 10 wt.% of K2Si4O9 is added in fluidized bed at 850 °C
due to the high viscosity of K2Si4O9. Some agglomerates are formed in the bed, being attributed to
the soften K2Si4O9 could acts a binder for silica sand89.
𝐾2𝐶𝑂3(𝑠) + nSiO2(𝑠) → 𝐾2𝑂 ∙ nSiO2(𝑙) + 3𝐶𝑂2(𝑔) (𝑛 = 1, 2 𝑎𝑛𝑑 4) Equation 2-2
Table 2-4 Agglomeration tendency and mechanisms of K-species under air condition (oxidizing condition)
Salts Def. TDef.
(°C)
Tmelting
(°C)
Fed Salts
(wt.%) Defluidization Mechanism Ref.
KCl Yes -⸸ 770 3.0 KCl melting 126
K2CO3 Yes -⸸ 891 0.97 K2CO3 interact with SiO2 126
K2SO4 No -⸸ 1069 3.60 - 126
KCl Yes 750 770 1.2 KCl melting 127
K2CO3 Yes 670 891 2.85 K2CO3 interact with SiO2 127
K2SO4 No n/a 1069 2.25 - 127
KCl Yes 773 770 0.94 KCl melting 89
KCl/K2SO4=54/46 wt.%* Yes 675 690 1.53 Salts melting 89
KCl/K2SO4=11/89 wt.% Yes 713 960 5.78 Salts melting 89
K2CO3 Yes 802 891 1.44 K2CO3 interact with SiO2 89
KCl/K2CO3=49/51 wt.% Yes 771 629 1.37 Both KCl melting and K2CO3 interact
with SiO2, KCl melting dominant 89
K2Si4O9 No n/a 764 9.68 - 89
⸸ The defluidization tendency are investigated at 800, 850 and 900 °C * The eutectic composition is corrected from KCl/K2SO4=46/54 wt.%
Agglomeration during Fluidized Bed Combustion and Gasification of Biomass
24
Reducing atmospheres
The agglomeration mechanisms and tendencies of KCl, K2SO4, and K2CO3 under reducing and
oxidizing atmospheres are compared by Ma et al.127, as shown in Table 2-5. The reducing atmosphere
promotes the agglomeration of K2SO4 and K2CO3 due to the improvement of their reactivity towards
silica sand. The interaction between K2CO3 and SiO2 is promoted in reducing atmosphere. K2SO4
may transform into K silicates by reacting with silica sand according to Equation 2-3 under a reducing
atmosphere124.
𝐾2𝑆𝑂4(𝑠) + nSiO2(𝑠) + 4𝐻2(𝑔)
→ 𝐾2𝑂 ∙ nSiO2(𝑙) + 𝐻2𝑆(𝑔) + 3𝐻2𝑂(𝑔) (𝑛 = 2 𝑎𝑛𝑑 4) Equation 2-3
Table 2-5 Impact of reducing atmospheres (H2) on agglomeration temperature and mechanisms of K slats127
K -species Agglomeration temperatures compared to
oxidizing atmosphere Agglomeration mechanisms
KCl Almost same Melting of KCl
K2CO3 Lower Faster the formation of alkali silicates and alkali-
hydroxide is formed
K2SO4 Lower Formation of K2Si4O9
Steam
The agglomeration tendency and mechanism of pure K/Na slats124,126–128 and K/Na slats-doped
wood129 under steam atmosphere are compared to oxidizing atmosphere, and the results are
summarized in Table 2-6. The presence of steam accelerates the agglomeration tendency of the K/Na-
chloride and K/Na-carbonate. Zhao et al.124 found that the KCl in the mixture of KCl and SiO2 is
almost released to gas phase at the temperatures in the range from 800 to 1000 °C under an inert gas
environment (pure N2). With addition of 10 vol.% of steam in N2, significant amount of insoluble K-
species, which is believed to be K-silicates, is produced. The amount of insoluble K-species decrease
with the increasing temperature. The addition of steam shifts a part of released K from KCl (g) to
KOH (g)108,113 (Equation 2-4), and K-silicates are produced through interaction between KCl and bed
materials according to Equation 2-5127. Agglomeration of KCl under steam condition may be caused
by the molten KOH and K-silicates127.
KCl(𝑔) + 𝐻2𝑂(𝑔) → 𝐾𝑂𝐻(𝑔) + HCl(𝑔) Equation 2-4
2KCl(𝑔) + nSiO2(𝑠) + 𝐻2𝑂(𝑔) → 𝐾2𝑂 ∙ nSiO2(𝑙) + 2HCl(𝑔) (𝑛 = 1, 2 𝑎𝑛𝑑 4) Equation 2-5
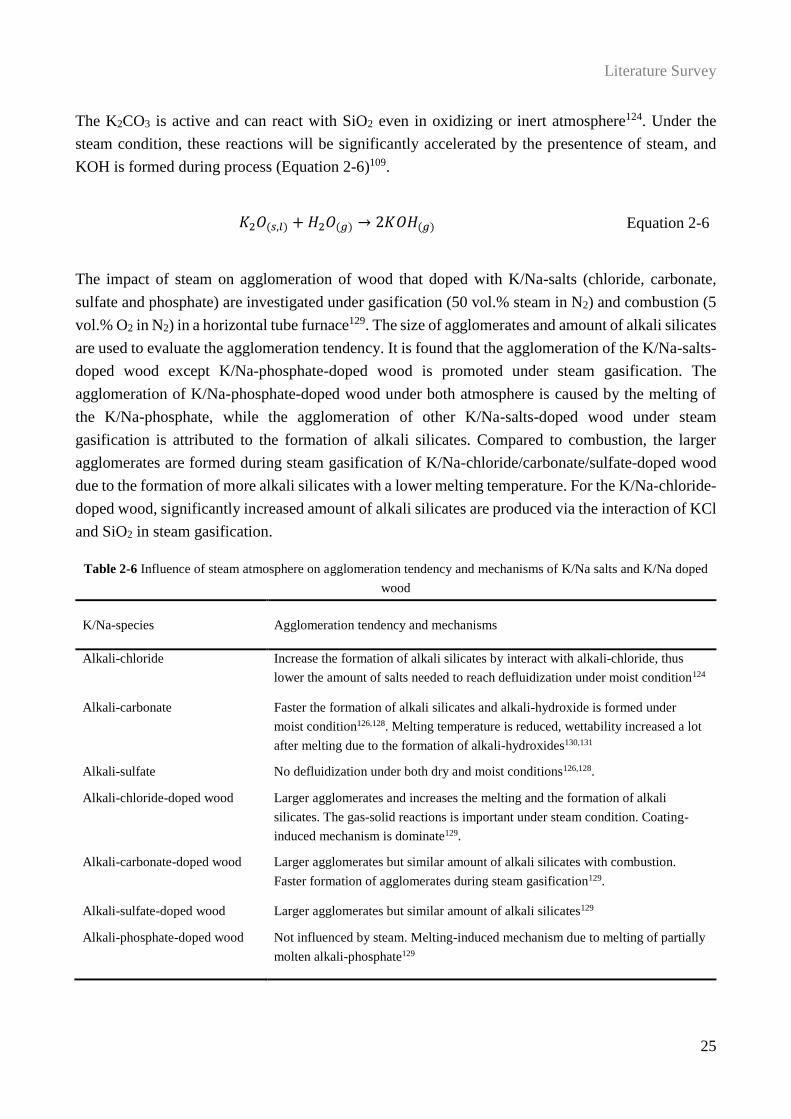
Literature Survey
25
The K2CO3 is active and can react with SiO2 even in oxidizing or inert atmosphere124. Under the
steam condition, these reactions will be significantly accelerated by the presentence of steam, and
KOH is formed during process (Equation 2-6)109.
𝐾2𝑂(𝑠,𝑙) + 𝐻2𝑂(𝑔) → 2𝐾𝑂𝐻(𝑔) Equation 2-6
The impact of steam on agglomeration of wood that doped with K/Na-salts (chloride, carbonate,
sulfate and phosphate) are investigated under gasification (50 vol.% steam in N2) and combustion (5
vol.% O2 in N2) in a horizontal tube furnace129. The size of agglomerates and amount of alkali silicates
are used to evaluate the agglomeration tendency. It is found that the agglomeration of the K/Na-salts-
doped wood except K/Na-phosphate-doped wood is promoted under steam gasification. The
agglomeration of K/Na-phosphate-doped wood under both atmosphere is caused by the melting of
the K/Na-phosphate, while the agglomeration of other K/Na-salts-doped wood under steam
gasification is attributed to the formation of alkali silicates. Compared to combustion, the larger
agglomerates are formed during steam gasification of K/Na-chloride/carbonate/sulfate-doped wood
due to the formation of more alkali silicates with a lower melting temperature. For the K/Na-chloride-
doped wood, significantly increased amount of alkali silicates are produced via the interaction of KCl
and SiO2 in steam gasification.
Table 2-6 Influence of steam atmosphere on agglomeration tendency and mechanisms of K/Na salts and K/Na doped
wood
K/Na-species Agglomeration tendency and mechanisms
Alkali-chloride Increase the formation of alkali silicates by interact with alkali-chloride, thus
lower the amount of salts needed to reach defluidization under moist condition124
Alkali-carbonate Faster the formation of alkali silicates and alkali-hydroxide is formed under
moist condition126,128. Melting temperature is reduced, wettability increased a lot
after melting due to the formation of alkali-hydroxides130,131
Alkali-sulfate No defluidization under both dry and moist conditions126,128.
Alkali-chloride-doped wood Larger agglomerates and increases the melting and the formation of alkali
silicates. The gas-solid reactions is important under steam condition. Coating-
induced mechanism is dominate129.
Alkali-carbonate-doped wood Larger agglomerates but similar amount of alkali silicates with combustion.
Faster formation of agglomerates during steam gasification129.
Alkali-sulfate-doped wood Larger agglomerates but similar amount of alkali silicates129
Alkali-phosphate-doped wood Not influenced by steam. Melting-induced mechanism due to melting of partially
molten alkali-phosphate129
Agglomeration during Fluidized Bed Combustion and Gasification of Biomass
26
CO2
The impact of high concentration of CO2 in the system on the agglomeration are limitedly discussed
in the literatures. Anicic et. al.132 found that the reaction reactivity of K2CO3 towards silica sand
decreases with increasing CO2 concentration in TGA experiments, because the conversion of K2CO3
is less favorable in the presence of CO2.
2.3.4.3 Melting temperature and viscosity of ash
Oxidizing atmospheres
Agglomeration occurs when a critical layer thickness and viscosity are reached50. As is obvious, a
low-melting temperature ash, which would result in a high amount of liquid phase in the bed, will
promote agglomeration. In addition, it is suggested that the liquid with low viscosity is likely to
migrate to the surface of the agglomerates133,134, and thus easier forming a coating layer on the bed
particles. The chemical compositions in ashes can be divided into three categories: network formers,
network modifiers and amphoteric according to the network theory of molten slag at high
temperature49. The network formers (e.g., Si4+ and Ti4+), which become the polymers, increase the
slag viscosity; the network modifiers (e.g., Na+, K+, Mg2+, Ca2+ and Fe2+), which destroy the polymers,
decrease the slag viscosity; and the amphoteric cation (e.g., Al3+ and Fe3+) can play as network
formers or network modifiers in different system135. An increase in Al3+ concentration increases the
viscosity of silicate glass at Al2O3/(M2O+MeO) ratio below 1, whilst reduce the viscosity of silicate
glass when the Al2O3/(M2O+MeO) ratio higher than 1 (where M could be Na+, K+, and Me could be
Mg2+, Ca2+). Mostly studies with respect to the ash viscosity are performed based on the coal ashes.
It is found that the viscosity of coal ashes is strongly affected by the ash compositions and
temperature136–139.
Reducing atmospheres
The reduction of Fe3+ to Fe2+ under reducing atmosphere at high temperature results in an decrease
in the viscosity of slag140,141. As mentioned above, in a system with high contents of alkali and alkane
earth metals, Fe3+ tends to enhance the three-dimensional structure of the melt and increases the slag
viscosity. Fe2+ is likely to disrupt the connectivity of network by providing non-bridging oxygen
(NBO), thus lowering the slag viscosity140.
The melting temperature of coal ash under reducing atmosphere is lower than that under oxidizing
atmosphere142–145. Similar with ash viscosity, the decreasing of sintering temperature of coal ash is
related to the states of the iron ion. A part of Fe3+ will be converted to Fe2+, which may react with
other ash constituents, leading to the formation of the eutectics with low-melting point146,147. Wei et
al.148 found that a more pronounced decreased is observed for the coal with high Fe content under
Literature Survey
27
reducing atmosphere. However, these studies focus on the coal ashes, which usually contain higher
iron content than biomass ashes149.
The investigations on the melting of biomass ashes under gasification atmosphere are not as
extensively as coal ashes. Niu et al.150 investigated the melting tendency of the gasified ash of a
mixture of straw, waste carton, plastic and spent mushroom compost, which is papered in an air blown
fluidized bed reactor at 800 °C with an equivalence ratio of 0.2, under different gas atmospheres. It
is found that the melting tendency of gasified ash under reducing condition (a mixture of 50 vol.%
N2, 30 vol.% CO and 20 vol.% CO2) is higher than that under oxidizing condition (100% air). In
addition to the reduction of Fe3+ to Fe2+, the conversion of CaSO4 to CaO and the subsequent
formation of low melting eutectics via interaction between CaO with other compounds are considered
to be one of the reasons that responsible for the high melting tendency of the mixture under reducing
atmosphere.
Steam
The viscosity of ash relates to the polymerization degree and network structure of ash141,151. Folkedahl
et al.141 reported that for the viscous and glassy slag contains high silica, who is expected to have a
three-dimensional network silicate structure, the addition of water vapor could lower its viscosity. It
is attributed to the cleavage of Si-O-Si bonds by the water molecules according to the following
reaction:
−Si − O − Si − + 𝐻2𝑂 → 2 − SiOH Equation 2-7
The depolymerization of the melt caused by water could reduce the viscosity of slag at a given
temperature. This result agrees what have been found by Cao et al.151. In addition, the addition of
water vapor also influence the structure of Al-O bonds. Cao et al.151 found that the ratio of [AlO4]5-
/[AlO4]5-+[AlO6]
9- in the slag structure decreases with increasing steam concentration, indicating that
the presence of water vapor weakens the polymerization degree of the slag, thus decreasing the
viscosity of slag.
The impact of steam on the melting of ashes is not widely investigated. Mao et al.152,153 suggested
that the addition of water vapor lowered the sintering temperature of coal ash significantly. It is
attributed to that the presence of water vapor promotes the formation of low-melting point eutectics
by the interaction between K species and bed materials, thus lowering sintering temperature. The
impact of high steam concentration on the viscosity and melting of biomass ash is still unclear.
2.4 Countermeasures of agglomeration
Agglomeration during Fluidized Bed Combustion and Gasification of Biomass
28
Based on the mechanisms of agglomeration and the factors influencing agglomeration discussed
above, some effective and applicable countermeasures are put forward to decelerate the
agglomeration in combustion and gasification of biomass18,24,25. These countermeasures can be
categorized into two groups according to their basic mechanisms: reducing the formation of
compounds with low-melting point via altering the ash chemistry and improving of hydrodynamics
in the bed.
2.4.1 Altering ash chemistry
The agglomeration during fluidized bed combustion and gasification of biomass is primarily
attributed to the formation of low-melting point compounds. Therefore, the techniques that avoid or
lessen the production of low-melting point compounds by altering ash chemistry, such as utilizing
alternative bed materials, applying additives, pretreatment of biomass, and co-combustion with alkali-
lean fuels are effective for reducing agglomeration in fluidized bed.
2.4.1.1 Alternative bed materials
The interaction between biomass ash and SiO2-based bed material is one of main origins of low-
melting point eutectics. The replacement of SiO2-based bed material by alternative bed materials,
aluminum (Al), calcium (Ca), magnesium (Mg), and iron (Fe) containing compounds, could retard
the agglomeration tendency in fluidized bed.
Aluminum compounds
Al-containing compounds are widely applied as the bed materials to substitute the SiO2-based bed
material in fluidized bed combustion and gasification, such as Al2O358,71, mullite (3Al2O3·2SiO2 and
2Al2O3·SiO2)36, sillimanite (Al2SiO5) and Bauxite (Al(OH)3)
61,154,155. Ghaly et al.71 found that the
agglomeration temperature of alumina sand (85-90% Al2O3 and 8-10% SiO2) during wheat straw
gasification, which is 920 °C, is significant higher than that of silica sand, which is 800 °C. It is
proposed that the agglomeration is caused by the alumina sands are bonded by the sticky molten straw
ash58,71. Both sillimanite (Al2SiO5) and Bauxite (Al(OH)3) could extend the defluidization time during
coal combustion compared to silica sand61,155. The addition of Al2O3 in K2O-SiO2 system results in
an increased melting temperature. The liquidus temperatures of K2O⸱4SiO2 and K2O⸱Al2O3⸱SiO2 are
around 770 and 990 °C, respectively58.
Calcium/Magnesium compounds
During biomass combustion and gasification, calcium and magnesium show consistent influence on
the agglomeration behaviors due to their similar properties. Ca-containing compounds, such as
limestone (CaCO3)55,88,156,157, dolomite (CaCO3·MgCO3)
55, bone ash (45% CaO, 29% P2O3, 8% SiO2,
5% Fe2O3, and rest others)36 and blast furnace slag (32% CaO, 18% MgO, 34% SiO2, 12% Al2O3)48,
Literature Survey
29
as well as Mg-containing compounds, such as magnesium oxide (MgO)158, magnesite
(MgCO3)36,61,78,156, and Olivine ((MgFe)2SiO4)
74,78,159,160, have been utilized as alternative bed
materials in fluidized bed combustion of biomass. The limestone and magnesite are likely to be in the
calcined state, lime and magnesium oxide, at the typical operating temperature of fluidized bed
combustor and gasifier. When calcite (CaCO3) and magnesite are used as bed materials, the
defluidization times are prolonged to 8-12 times of that using silica bed material during coal
combustion at 800 °C156, due to the formation of eutectics with a higher melting point156.
Iron compounds
Ferric oxide (Fe2O3)20,161 can be used as alternative bed material in fluidized bed combustion. The
agglomerates are observed when the mixture of KNaC4H4O6⸱4H2O and silica sand was heated in a
laboratory furnace at 700 °C, whereas no agglomerate are observed during the heating of the mixture
of KNaC4H4O6⸱4H2O and Fe2O3 at 900 ℃. It is attributed to the formation of high-melting
temperature eutectics (K2Fe2O4 and Na2Fe2O4) through the interaction between Fe2O3 and the alkali
(K or Na) compounds in biomass ash161.
2.4.1.2 Additives
Bed additives can be applied to fluidized bed combustion and gasification to reduce or avoid
agglomeration. Similar with alternative bed materials, the basic underlying mechanism of influence
of bed additives on agglomeration is to prevent the formation of low-melting point compounds by
changing the ash chemistry. Generally, the effective additives can be grouped into Al-Si-based, Ca-
based, P-based, and S-based additives.
Al-Si-based additives
Kaolin, a clay mineral consisting of alumina silicate (Al2Si2O5(OH)4), is the most common tested Al-
Si-based additive121,162–165. It is found that the addition of kaolin increases the defluidization
temperature of wheat straw from 739 ℃ to 886 ℃162. It is attributed to the fact that the released
potassium is effectively captured by kaolin via the interaction between kaolin and potassium163,
according to Equation 2-8164. The formation of K-Al silicates with a high-melting temperature
reduces the agglomeration. In attrition to kaolin, pulverized coal ash166 is also used as additive due to
it high Al and Si content.
𝐴𝑙2𝑂3 ∙ 2𝑆𝑖𝑂2(𝑠) + 2𝐾𝐶𝑙(𝑔) + 𝐻2𝑂(𝑔) → 𝐾2𝑂 ∙ 𝐴𝑙2𝑂3 ∙ 2𝑆𝑖𝑂2(𝑠) + 2 𝐻𝐶𝑙(𝑔) Equation 2-8
Ca/Mg-based additives
Agglomeration during Fluidized Bed Combustion and Gasification of Biomass
30
Ca/Mg-based additives, such as CaO167, Ca (NO3)2167, CaCO3
167,168, MgCO389, and marble sludge
(95.47% CaO and rest others)169, are used during fluidized bed combustion/gasification to reduce the
agglomeration tendency. Ca-based additives effectively prolong defluidization time due to the
formation of high-melting temperature Ca silicates and K-Ca phosphates168. Chou et al.167 found that
the aqueous-phase Ca(NO3)2 is more effective than powder-phase CaO on reducing the agglomeration
risk in the fluidized bed combustion, which may be attributed to the lager contact area between bed
particles and aqueous-phase additives.
P-based additives
Grimm et al.65,170 investigated the influence of P-based additive, H3PO4, on agglomeration tendency
in bench scale fluidized bed combustion of logging residue and wheat straw. The results reveal that
the addition of a certain amount of phosphorus could significantly reduce the formation of volatilized
deposits and fine particles, whose mainly composition is KCl, for both fuels. For the fuel contains
relatively high fraction of Ca in comparison to K, such as logging residue, the agglomeration necks
are mainly composed of Ca-K silicates. The P-based additives will accelerate agglomeration by
lowering the Ca/K ratio of the Ca-K silicates, since a part of Ca is associated by P. For the K- and Si-
rich wheat straw, increasing amount of potassium presents as K-Ca/Mg phosphates, such as KMgPO4,
CaK2P2O, and CaKPO4, with addition of P-based additive. The melting temperature of ash is therefore
increased, thus reducing the agglomeration tendency. However, an excessive amount of phosphorus
additives will promote the formation of alkali-rich phosphates with low-melting point and leads to
the risk of bed agglomeration.
S-based additives
S-based additives, S165 and (NH4)2SO489, are reported that could decrease agglomeration tendency
during combustion of straw and wood pellets, resulting from the formation of K2SO4 with high-
melting point. Ulusoy171 studied the influence of a series of S-based additives, including
(NH4)2Fe(SO4)2, NH4Fe(SO4)2, and AlNH4(SO4)2, on agglomeration during wheat straw combustion,
and found that these additives effectively mitigate the agglomeration during combustion of straw.
2.4.1.3 Biomass pretreatment
Pretreatment of biomass is a potential way to prolong the defluidization time. Leaching and
fractionation are two potential methods reported.
Leaching
Leaching, a pretreatment method by removing water-soluble and ion exchangeable inorganic
elements in biomass using water before combustion, is a possible way to slow down the
agglomeration tendency172–175. It is found that both the ash content and the contents of alkali species
Literature Survey
31
(Na and K), chlorine, and sulfur in washed biomass are much lower than the untreated biomass176–179.
Said et al.180 suggested that the decrease in ash content of straw could be as high as around 20% after
washing. The removal ratios of chlorine and potassium in washed straw reach to about 87% and 50%,
respectively. Consequently, the washed straw shows no ash sintering tendency at the temperature in
the range of 900 - 1000 ℃, where the untreated straw is strongly sintered. However, leaching largely
increases the cost of process, especially on the drying.
Fractionation
Fractionation is a method that splitting of the fuels into two fractions: a “coarse” fraction that particle
size is larger than the average grain width size and a “meal” fraction that particle size is smaller than
the average grain width size181. Although the ash content significantly decreases (up to 50 wt.% for
olive residue) with increasing fuel particles size, the potassium content in the ash increases a lot and
other elements (Ca, Mg, Al etc.) decreases174,175,181,182. Therefore, the fractionation should be used
with care. In order to overcome the disadvantages of fractionation, the combination of the two
pretreatment techniques, fractionation and leaching, are applied to prolong the defluidization time
during biomass combustion.
2.4.1.4 Co-combustion
Co-combust the alkali-rich fuels with an alkali-lean one is an effective way to reduce the
agglomeration tendency during biomass combustion. Coal, woody biomass and sewage sludge are
suitable co-combustion fuels due to their low potassium content.
Coal
Co-combustion biomass and coal is an effective way to reduce the risk of agglomeration183–185. Lin
and Dam-Johansen37,38 found that the defluidization time of straw is largely prolonged when wheat
straw is co-combusted with a fraction of 20 - 30 wt.% coal at temperature below 900 ℃. The coal
ash, which is mainly consisted of silicon, aluminum and calcium, has a much higher melting point
than the straw ash, which is mainly composed of silicon and potassium. The K-Al silicates are formed
by the interaction of coal ash and straw ash during co-combustion process, and thereby reducing the
agglomeration tendency.
Woody biomass
Compared to the herbaceous and agricultural biomass (e.g., straw), woody biomass (e.g., bark)
usually has lower ash yield and potassium content in the ash3. Therefore, some woody biomass is co-
combusted with herbaceous biomass to reduce the agglomeration risk66,76,186,187. Nordgren et al. 186
found that the defluidization time of co-combustion of a mixture of straw and woody biomass (bark
and wood) is longer than that of pure straw combustion. Two reasons can explain this tendency: a)
Agglomeration during Fluidized Bed Combustion and Gasification of Biomass
32
the ash forming elements of straw (K, Si, Cl etc.) are diluted by the woody biomass; b) the change of
ash composition (decrease in K, Si and increase in Ca) leads to a higher melting point of ash.
Sewage sludge
The agglomeration tendency is significantly reduced when the sewage sludge is added during
potassium-rich fuel combustion123,188,189. The high content of P and S in the sewage sludge causes the
ash of mixture of sewage sludge and straw is dominated by phosphates and sulfates188. In addition,
increased amounts of hematite and aluminosilicates are formed during co-combustion of sewage
sludge and straw compared to pure straw combustion due to the high content of aluminum, calcium,
and iron in the sewage sludge189. Therefore, the ash with high-melting temperature, which is
dominated by alkali phosphates (e.g., Ca9MgK(PO4)7) and potassium aluminosilicates (e.g.,
KAlSi2O6 and KAlSi3O8)123, is formed during co-combustion of sewage sludge and straw, thus
reducing the agglomeration tendency.
2.4.2 Improving fluidization quality in the bed
2.4.2.1 Controlling of operational conditions
The fluidization quality in bed can be improved by raising the ratio of superficial gas velocity to
minimum fluidization velocity (Ug/Umf), such as selecting small bed particles38 and applying high
fluidizing gas velocity190. However, these methods will result in a higher bed particles entrainment
during operation190.
2.4.2.2 Pulsed fluidized bed
In past decades, the pulsed flow gas, as an external assistant, has been reported that could improve
the fluidization quality of the Geldart Group A/B/C particles191,192. Pulsed fluidization is a method
that using an on-and-off fluidizing gas to fluidize the bed particles. The pulsed flow fluidization has
shown the potential for enhancing the heating transfer in fluidized bed193–196, accelerating the drying
of biomass and pharmaceutical products197–199, improving the mixing of particles200, and reducing the
agglomerates size of nanoparticles201. The influences of some key parameters of pulsation, such as
frequency, duty cycle, and flow rate, are extensively discussed.
Frequency of pulsation is one of most extensively investigated parameters for the pulsed flow gas,
and its effects on the hydrodynamics in the fluidized bed, mixing of particles, heating transfer and
drying rate has been reported. A series of studies investigated the effects of pulsed flow on the
hydrodynamics characteristics in the bed202–205, covering the minimum fluidization velocity (Umf),
bubble sizes, bubble velocity, and bed expansion. Pulsed fluidized beds are frequently reported in
reducing the minimum fluidization velocity (Umf) of particles, especially for the nanoparticles, which
Literature Survey
33
are difficult to fluidize204,206,207. The bubble properties, such as size and velocity, in the bed are used
as the indicators of bed behavior204. The bed expansion may be used as an indicator of particles
displacement in the fluidized bed193. The minimum fluidization velocity decreases with the increasing
pulsation frequency208. It is suggested that the minimum fluidization velocity of Group B particles
can be reduced by up to a third of the minimum fluidization velocity required in continuous flow at a
frequency of 10 Hz204. Generally, the reduction of bubble size by imposing pulsed flow in the
conventional fluidized bed is closely related to the pulsation frequency204,207. The bubble size
decreases with increasing pulsation frequency, and it may be attributed to the reduction of air amount
that enters in each cycle204. It is found that the size of bubbles formed at a frequency of 10 Hz is same
as the bubbles formed in the continuous flow at the halfway height point of the bed, but bubbles are
smaller at positions above this204, indicating that the bubbles formed under continuous flow are easily
to coalesce at greater distance from the distributor, while are likely to remain scattered and coalesce
less under the pulsed fluidization204,207. Consistent with the bubble size, the bubble velocity is reduced
at high pulsation frequency204. It has been found both in experimental work and numerical simulation
that increasing particles displacement is found at low pulsation frequencies204,209. Bizhaem &
Tabrizi204 suggests that the great particle displacement is related to the high pressure build up during
“OFF” period. Zhang &Koksal193 attributes the larger bed expansion at lower frequencies to the larger
amount of gas that goes into the bed during each “ON” period and the greater extent bed collapses
during the longer “OFF” periods. Generally, the fluidization quality of the bed particles can be
improved by increasing the pulsation frequency204.
Hadi et al.200 investigate the effect of the pulsation on the mixing of the particles with a wide particle
size distribution (dp10 =42 μm and dp90 =650 μm) at a pulsation frequency in the range of 0.5 - 5 Hz.
The static bed height is 200 mm. It is found that the introducing of pulsed flow could improve the
mixing of the particles, and the optimal mixing behaviors is observed at the pulsation frequency of 3
Hz due to the formation of the maximum bubble size and highest bubble frequency.
The influence of pulsation frequency on heat transfer and drying process are also investigated. Jia et
al.194,195,197 studied the heat transfer coefficient and drying rate of various biomass particles in a pulsed
fluidized bed at a pulsation frequency in the range of 0.5 Hz - 6 Hz. They suggested that the heat
transfer coefficient and drying rate are strongly affected the pulsation frequency. It is found that the
optimum frequency are close to the natural frequency of the system (ƒN), which is calculated
according to the theory proposed by Hao and Bi205:
1ƒ
2N
mf
g
H Equation 2-9
Agglomeration during Fluidized Bed Combustion and Gasification of Biomass
34
where Hmf (m) is the static bed height. For a bed with a static bed height of 150 mm, the natural
frequency is 1.28 Hz. They attribute the good performance of the frequency closed to natural
frequency to the occurrence of resonance effect could enhance the motion of particles and mass
transfer. Although a better fluidization is achieved at a higher pulsation frequency, the optimum
performance of a pulsed flow for biomass drying and particles mixing in fluidized bed is usually
observed at a frequency in the range of 1 to 3 Hz. Jia et al.210 proposed that the fluidized bed appears
only will be fluidized intermittently at the frequencies below 3 Hz, resulting in the formation of slugs
above the distributer and formation of the gas channels in the bed. The larger bubbles instead of gas
channel are formed at the frequency of 3 Hz, and the bubble sizes will be reduced by increasing
pulsation frequency. At an even higher frequency, the behaviors of the pulsed fluidized bed are similar
to a conventional one.
The effect of flow rate on the biomass drying and heat transfer coefficient are less reported in the
literatures. It is found that an increase in gas flow rate results in a higher heat transfer coefficient and
drying rate197,210 due to the better fluidization at a high total flow rate.
The influence of pulsation duty cycle, which is defined as the time of “flow-ON” period divided by
the “flow-OFF” period, on heat transfer has been investigated. Kobayashi et al.211 investigated the
heat transfer of the glass beads with a static bed height of 300 mm. They found that the highest heat
transfer coefficient for the glass beads with an average diameter of 138 µm is observed at a pulsation
duty cycle of 50/50 (a combination of “ON” and “OFF” period of 0.5s and 0.5 s), while for the glass
beads with an average diameter of 301 µm, the optimum pulsation duty cycle is 25/75 (a combination
of “ON” and “OFF” period of 0.25 s and 0.75 s). Nishimura et al.212 studied the heat transfer of glass
beads bed with a static bed height of 700 mm. For the glass beads with an average diameter of 90 and
340 µm, the optimum heat transfer is observed at the combination of a “OFF” period of 2 s and 3 s
and an “ON” period of 1 s, namely the duty cycle of 33/66 and 25/75, respectively. It is attributed to
the formation of larger bubbles at longer “OFF” period. In addition, it is addressed the increasing
pressure build-up at longer “OFF” period will result in a higher instantaneous gas velocity. The
instantaneous gas velocity is reduced by increasing duty cycle, since the same amount of gas enters
in the bed over a longer “ON” period. However, the excessive increase in “OFF” period brings a
disadvantage for heat transfer, since the bed will be in a static condition in the latter stage of “OFF”
period. Jia et al.194 investigated the effect of duty cycle on heat transfer of Douglas fir sawdust in the
range of 10/90 to 90/10 at various frequency with different gas velocity. It is found that the optimum
duty cycle are related to the pulsation frequency and gas velocity. By decreasing the pulsation
frequency or increasing the gas velocity, the optimum duty cycle is increased. This may be attributed
to the air amount introducing into the bed are together decided by the pulsation frequency, the gas
flow rate and duty cycle.
The pulsed fluidized bed reactor may be a potential countermeasure for mitigating agglomeration
tendency during biomass combustion and gasification. The potential of pulsed flow on tackling
Literature Survey
35
defluidization of Group B particles has been proved by the discrete element method (DEM)
simulation213. However, the effect of pulsed flow on the agglomeration is not clearly.
2.5 Summary
Biomass is a renewable energy resource and is considered as a substitute for fossil fuels. In Denmark,
wheat straw is one of the main biomass resources. However, the utilization of wheat straw in fluidized
bed combustion and gasification is challenging due to the high content of potassium and silicon in
wheat straw. Agglomeration, which influences the operation of a fluidized bed reactor, can be
observed even at temperature below 700 °C in a straw fired fluidized bed. Although the agglomeration
behaviors in fluidized bed combustion of wheat straw has been investigated extensively, the
agglomeration tendency and mechanisms during wheat straw gasification are limitedly studied. A
reducing atmosphere and a high concentration of steam could promote the agglomeration of straw
ashes, due to their influences on the ash chemistry and physical properties. However, the
agglomeration behaviors during continuous wheat straw gasification is still unclear, especially the
influences of gasification agents and equivalence ratio on agglomeration behaviors.
Agglomeration tendency is closely related to biomass composition. Different biomass types result in
different agglomeration tendency. The contents of other inorganic elements, such as Si, S, P, and Cl,
in biomass also have different effects on agglomeration during combustion. The difference in the
agglomeration temperatures of an S-rich but Si-lean fuel, Lucerne, under combustion and gasification
atmospheres is more pronounced compared to other fuel. The agglomeration behaviors during
gasification of different types of biomass are unclear.
A series of countermeasures have been evaluated based on the mechanism of reducing the formation
of compounds with low-melting point via utilizing alternative bed materials, applying additives,
pretreatment of biomass, and co-combustion with alkali-lean fuels. Most of these countermeasures
lead to an additional operation cost. An effective and economic countermeasure for the agglomeration
is lacking. The imposing of pulsed flow in the fluidized bed improves the fluidization quality in the
bed, indicating that pulsed fluidized bed may be a potential countermeasure for mitigating the
agglomeration in fluidized bed combustion and gasification.
Agglomeration during Fluidized Bed Combustion and Gasification of Biomass
36
Reference
(1) Vassilev, S. V.; Baxter, D.; Andersen, L. K.; Vassileva, C. G. An Overview of the Chemical
Composition of Biomass. Fuel 2010, 89 (5), 913–933.
(2) Vassilev, S. V.; Baxter, D.; Andersen, L. K.; Vassileva, C. G.; Morgan, T. J. An Overview of
the Organic and Inorganic Phase Composition of Biomass. Fuel 2012, 94, 1–33.
(3) Vassilev, S. V.; Vassileva, C. G.; Song, Y. C.; Li, W. Y.; Feng, J. Ash Contents and Ash-
Forming Elements of Biomass and Their Significance for Solid Biofuel Combustion. Fuel
2017, 208, 377–409.
(4) Bridgwater, A. V.; Peacocke, G. V. C. Fast Pyrolysis Processes for Biomass. Renew. Sustain.
energy Rev. 2000, 4 (1), 1–73.
(5) Bridgwater, A. V. Renewable Fuels and Chemicals by Thermal Processing of Biomass. Chem.
Eng. J. 2003, 91 (2–3), 87–102.
(6) Zhang, L.; Xu, C. (Charles); Champagne, P. Overview of Recent Advances in Thermo-
Chemical Conversion of Biomass. Energy Convers. Manag. 2010, 51 (5), 969–982.
(7) McKendry, P. Energy Production from Biomass (Part 2): Conversion Technologies. Bioresour.
Technol. 2002, 83 (1), 47–54.
(8) Wang, Y.; Bell, D. A. Competition between H2O and CO2 during the Gasification of Powder
River Basin Coal. Fuel 2017, 187, 94–102.
(9) Dong, J.; Nzihou, A.; Chi, Y.; Weiss-Hortala, E.; Ni, M.; Lyczko, N.; Tang, Y.; Ducousso, M.
Hydrogen-Rich Gas Production from Steam Gasification of Bio-Char in the Presence of CaO.
Waste and Biomass Valorization 2017, 8 (8), 2735–2746.
(10) Mauerhofer, A. M.; Fuchs, J.; Müller, S.; Benedikt, F.; Schmid, J. C.; Hofbauer, H. CO2
Gasification in a Dual Fluidized Bed Reactor System: Impact on the Product Gas Composition.
Fuel 2019, 253, 1605–1616.
(11) Campoy, M.; Gómez-Barea, A.; Vidal, F. B.; Ollero, P. Air-Steam Gasification of Biomass in
a Fluidised Bed: Process Optimisation by Enriched Air. Fuel Process. Technol. 2009, 90 (5),
677–685.
(12) Khan, A. A.; de Jong, W.; Jansens, P. J.; Spliethoff, H. Biomass Combustion in Fluidized Bed
Boilers: Potential Problems and Remedies. Fuel Process. Technol. 2009, 90 (1), 21–50.
(13) Nussbaumer, T. Combustion and Co-Combustion of Biomass: Fundamentals, Technologies,
and Primary Measures for Emission Reduction. Energy & Fuels 2003, 17 (6), 1510–1521.
(14) Wiltsee, G. A. J.; McGowin, C. R.; Hughes, E. E. Biomass Combustion Technologies for
Power Generation; National Renewable Energy Lab., Golden, CO: Burlington, Vermont,
United States, 1993.
(15) Yang, W.-C. Handbook of Fluidization and Fluid-Particles Systems; CRC Press, 2003.
Literature Survey
37
(16) Koornneef, J.; Junginger, M.; Faaij, A. Development of Fluidized Bed Combustion-An
Overview of Trends, Performance and Cost. Prog. Energy Combust. Sci. 2007, 33 (1), 19–55.
(17) Romeo, L. M.; Díez, L. I.; Guedea, I.; Bolea, I.; Lupiáñez, C.; González, A.; Pallarés, J.; Teruel,
E. Design and Operation Assessment of an Oxyfuel Fluidized Bed Combustor. Exp. Therm.
Fluid Sci. 2011, 35 (3), 477–484.
(18) Niu, Y.; Tan, H. Ash-Related Issues during Biomass Combustion : Alkali-Induced Slagging ,
Silicate Melt-Induced Slagging ( Ash Fusion ), Agglomeration , Corrosion , Ash Utilization ,
and Related Countermeasures. Prog. Energy Combust. Sci. 2016, 52, 1–61.
(19) Lin, W.; Dam-Johansen, K.; Frandsen, F. Agglomeration in Bio-Fuel Fired Fluidized Bed
Combustors. Chem. Eng. J. 2003, 96 (1–3), 171–185.
(20) Grubor, B.D.; Oka, S.N.; Ilic, M.S.; Dakic, D.V.; Arsic, B. .; Grubor, B. D.; Oka, S. N.; Ilic,
M. S.; Dakic, D. V.; Arsic, B. T. Biomass FBC Combustion - Bed Agglomeration Problems.
In Proceedings of the 13th International Conference on Fluidized Bed Combustion; American
Society of Mechanical Engineers: United States, 1995; Vol. 1, pp 515–522.
(21) Scala, F.; Chirone, R.; Consiglio, C.; Tecchio, P. V.; July, R. V; Re, V.; Recei, M.; October,
V. Characterization and Early Detection of Bed Agglomeration during the Fluidized Bed
Combustion of Olive Husk. Energy & Fuels 2006, 20 (10), 120–132.
(22) Michel, R.; Kaknics, J.; De Bilbao, E.; Poirier, J. The Mechanism of Agglomeration of the
Refractory Materials in a Fluidized-Bed Reactor. Ceram. Int. 2016, 42 (2), 2570–2581.
(23) Balland, M.; Froment, K.; Ratel, G.; Valin, S.; Roussely, J.; Michel, R.; Poirier, J.; Kara, Y.;
Galnares, A. Biomass Ash Fluidised-Bed Agglomeration: Hydrodynamic Investigations.
Waste and Biomass Valorization 2017, 8 (8), 2823–2841.
(24) Scala, F. Particle Agglomeration during Fluidized Bed Combustion: Mechanisms, Early
Detection and Possible Countermeasures. Fuel Process. Technol. 2018, 171, 31–38.
(25) Bartels, M.; Lin, W.; Nijenhuis, J.; Kapteijn, F.; van Ommen, J. R. Agglomeration in Fluidized
Beds at High Temperatures: Mechanisms, Detection and Prevention. Prog. Energy Combust.
Sci. 2008, 34 (5), 633–666.
(26) Morris, J. D.; Sheraz, S.; Chilton, S.; Nimmo, W. Mechanisms and Mitigation of
Agglomeration during Fluidize Bed Combustion of Biomass : A Review. Fuel 2018, 230, 452–
473.
(27) Mettanant, V.; Basu, P.; Butler, J. Agglomeration of Biomass Fired Fluidized Bed Gasifier and
Combustor. Can. J. Chem. Eng. 2009, 87 (5), 656–684.
(28) Billen, P.; Creemers, B.; Costa, J.; Van Caneghem, J.; Vandecasteele, C. Coating and Melt
Induced Agglomeration in a Poultry Litter Fired Fluidized Bed Combustor. Biomass and
Bioenergy 2014, 69, 71–79.
(29) Visser, H. J. M.; Hofmans, H.; Huijnen, H.; Kastelein, R.; Kiel, J. H. A. Biomass Ash - Bed
Material Interactions Leading to Agglomeration in Fluidised Bed Combustion and Gasification.
Agglomeration during Fluidized Bed Combustion and Gasification of Biomass
38
Prog. Thermochem. Biomass Convers. 2008, 272–286.
(30) Öhman, M.; Pommer, L.; Nordin, A. Bed Agglomeration Characteristics and Mechanisms
during Gasification and Combustion of Biomass Fuels. Energy & Fuels 2005, 19 (4), 1742–
1748.
(31) Mac an Bhaird, S. T.; Walsh, E.; Hemmingway, P.; Maglinao, A. L.; Capareda, S. C.;
McDonnell, K. P. Analysis of Bed Agglomeration during Gasification of Wheat Straw in a
Bubbling Fluidised Bed Gasifier Using Mullite as Bed Material. Powder Technol. 2014, 254,
448–459.
(32) Visser, H. J. M. H. J. M. The Influence of Fuel Composition on Agglomeration Behaviour in
Fluidised-Bed Combustion. ECN Rep. ECN-C–04-054 2004.
(33) Nisamaneenate, J.; Atong, D.; Seemen, A.; Sricharoenchaikul, V. Mitigating Bed
Agglomeration in a Fluidized Bed Gasifier Operating on Rice Straw. Energy Reports 2020, 6,
275–285.
(34) Visser, H. J. M. M.; van Lith, S. C.; Kiel, J. H. A. a. Biomass Ash-Bed Material Interactions
Leading to Agglomeration in FBC. J. Energy Resour. Technol. 2008, 130 (1), 1–6.
(35) Gatternig, B.; Karl, J. Investigations on the Mechanisms of Ash-Induced Agglomeration in
Fluidized-Bed Combustion of Biomass. Energy & Fuels 2015, 29, 931–941.
(36) Olofsson, G. G.; Ye, Z.; Bjerle, I.; Andersson, A. Bed Agglomeration Problems in Fluidized-
Bed Biomass Combustion. Ind. Eng. Chem. Res. 2002, 41 (12), 2888–2894.
(37) Lin, W.; Jensen, A. D.; Johnsson, J. E.; Dam-Johansen, K. Combustion of Biomass in Fluidized
Beds: Problems and Some Solutions Based on Danish Experiences. In Proceedings of the 17th
International Conference on Fluidized Bed Combustion; American Society of Mechanical
Engineers: Jacksonville, Florida USA, 2003; pp 945–953.
(38) Lin, W.; Dam-Johansen, K. Agglomeration in Fluidized Bed Combustion of Biomass--
Mechanisms and Co-Firing with Coal. In Proceedings of the 15h International Conference on
Fluidized Bed Combustion; American Society of Mechanical Engineers: Savannah, Georgia,
1999; pp 1188–1191.
(39) Lin, W.; Dam-Johansen, K. Modelling of Agglomeration in Straw Fired Fluidized Bed
Combustors. In Proceedings of the 16th International Conference on Fluidized Bed
Combustion; American Society of Mechanical Engineers: United States, 2001; pp 1–13.
(40) Lin, W.; Krusholm, G.; Dam-Johansen, K.; Musahl, E.; Bank, L. Agglomeration Phenomena
in Fluidized Bed Combustion of Straw. In Proceedings of the 14h International Conference
on Fluidized Bed Combustion; American Society of Mechanical Engineers: Canada, 1997; Vol.
2, pp 831–837.
(41) Salatino, P.; Scala, F.; Chirone, R. Fluidized-Bed Combustion of A Biomass Char: The
Influence of Carbon Attrition and Fines Postcombustion on Fixed Carbon Conversion. In
Proceedings of Twenty-Seventh Symposium (International) on Combustion; United States,
1998; pp 3103–3110.
Literature Survey
39
(42) Scala, F.; Salatino, P.; Chirone, R. Fluidized Bed Combustion of a Biomass Char (Robinia
Pseudoacacia). Energy & Fuels 2000, 14 (4), 781–790.
(43) Chirone, R.; Salatino, P.; Scala, F. The Relevance of Attrition to The Fate of Ashes During
Fluidized-Bed Combustion of A Biomass. Proc. Combust. Inst. 2000, 28, 2279–2286.
(44) Scala, F.; Chirone, R.; Salatino, P. The Influence of Fine Char Particles Burnout on Bed
Agglomeration during the Fluidized Bed Combustion of a Biomass Fuel. Fuel Process.
Technol. 2003, 84 (1–3), 229–241.
(45) Chirone, R.; Salatino, P.; Scala, F.; Solimene, R.; Urciuolo, M. Fluidized Bed Combustion of
Pelletized Biomass and Waste-Derived Fuels. Combust. Flame 2008, 155 (1–2), 21–36.
(46) Brus, E.; Öhman, M.; Nordin, A. Mechanisms of Bed Agglomeration during Fluidized-Bed
Combustion of Biomass Fuels. Energy & Fuels 2005, 19 (3), 825–832.
(47) He, H.; Bostro, D.; Marcus, O. Time Dependence of Bed Particle Layer Formation in Fluidized
Quartz Bed Combustion of Wood-Derived Fuels. Energy & Fuels 2014, 28, 3841–3848.
(48) Brus, E.; Öhman, M.; Nordin, A.; Boström, D.; Hedman, H.; Eklund, A. Bed Agglomeration
Characteristics of Biomass Fuels Using Blast-Furnace Slag as Bed Material. Energy & Fuels
2004, 18 (4), 1187–1193.
(49) Vargas, S.; Frandsen, F. J.; Dam-Johansen, K. Rheological Properties of High-Temperature
Melts of Coal Ashes and Other Silicates. Prog. Energy Combust. Sci. 2001, 27 (3), 237–429.
(50) Öhman, M.; Nordin, A.; Skrifvars, B. J.; Backman, R.; Hupa, M. Bed Agglomeration
Characteristics during Fluidized Bed Combustion of Biomass Fuels. Energy & Fuels 2000, 14
(1), 169–178.
(51) Chaivatamaset, P.; Tia, S. The Characteristics of Bed Agglomeration during Fluidized Bed
Combustion of Eucalyptus Bark. Appl. Therm. Eng. 2015, 75, 1134–1146.
(52) Park, D. Estimation of Temperature Difference between Char Particles and the Fluidized Bed
in Char Combustion. Fuel 1989, 68 (10), 1320–1324.
(53) Senior, C. L.; Srinivasachar, S. Viscosity of Ash Particles in Combustion Systems for
Prediction of Particle Sticking. Energy & Fuels 1995, 9 (2), 277–283.
(54) Chirone, R.; Miccio, F.; Scala, F. Mechanism and Prediction of Bed Agglomeration during
Fluidized Bed Combustion of a Biomass Fuel: Effect of the Reactor Scale. Chem. Eng. J. 2006,
123 (3), 71–80.
(55) Resjdues, C. Agglomeration of Turkish Lignites in Fluidised-Bed Combustion. Jouof Inst.
Energy 1989, March, 56–61.
(56) Hupa, M. Ash-Related Issues in Fluidized-Bed Combustion of Biomasses : Recent Research
Highlights. Energy & Fuels 2012, 26, 4–14.
(57) Ghaly, A. E.; Ergüdenler, A.; Laufer, E. Study of Agglomeration Characteristics of Silica
Agglomeration during Fluidized Bed Combustion and Gasification of Biomass
40
Sand-Straw Ash Mixtures Using Scanning Electronic Microscopy and Energy Dispersion X-
Ray Techniques. Bioresour. Technol. 1994, 48 (2), 127–134.
(58) Ghaly, A. E.; Ergüdenler, A.; Laufer, E. Agglomeration Characteristics of Alumina Sand-
Straw Ash Mixtures at Elevated Temperatures. Biomass and Bioenergy 1993, 5 (6), 467–480.
(59) van der Drift, A.; Olsen, A. Conversion of Biomass, Prediction and Solution Methods for Ash
Agglomeration and Related Problems. ECN (Energy Res. Cent. Netherlands) Rep. ECN-C–99-
090 1999.
(60) Olofsson, G.; Ye, Z.; Bjerle, I.; Andersson, A. Bed Agglomeration Problems in Fluidized-Bed
Biomass Combustion. Ind. Eng. Chem. Res. 2002, 41, 2888–2894.
(61) Vuthaluru, H. B.; Zhang, D. K. Remediation of Ash Problems in Fluidized-Bed Combustors.
Fuel 2001, 80 (4), 583–598.
(62) Liu, Z.; Peng, T.; Lin, C. Impact of CaO and CaCO3 Addition on Agglomeration /
Defluidization and Heavy Metal Emission during Waste Combustion in Fluidized-Bed. Fuel
Process. Technol. 2014, 118, 171–179.
(63) Lin, C.; Kuo, J.; Wey, M.; Chang, S.; Wang, K. Inhibition and Promotion : The Effect of Earth
Alkali Metals and Operating Temperature on Particle Agglomeration/Defluidization during
Incineration in Fluidized Bed. Powder Technol. 2009, 189 (1), 57–63.
(64) Scala, F.; Chirone, R. An SEM / EDX Study of Bed Agglomerates Formed during Fluidized
Bed Combustion of Three Biomass Fuels. Biomass and Bioenergy 2008, 32, 252–266.
(65) Grimm, A.; Skoglund, N.; Boström, D.; Öhman, M.; Bostr, D.; Ohman, M.; Boström, D.;
Öhman, M.; Bostr, D.; Ohman, M. Bed Agglomeration Characteristics in Fluidized Quartz Bed
Combustion of Phosphorus-Rich Biomass Fuels. Energy & Fuels 2011, 25 (3), 937–947.
(66) Piotrowska, P.; Grimm, A.; Skoglund, N.; Boman, C.; Öhman, M.; Zevenhoven, M.; Boström,
D.; Hupa, M. Fluidized-Bed Combustion of Mixtures of Rapeseed Cake and Bark: The
Resulting Bed Agglomeration Characteristics. Energy & Fuels 2012, 26 (4), 2028–2037.
(67) Boström, D.; Eriksson, G.; Boman, C.; Öhman, M. Ash Transformations in Fluidized-Bed
Combustion of Rapeseed Meal. Energy & Fuels 2009, 23, 2700–2706.
(68) Yang, T.; Kai, X.; Sun, Y.; He, Y.; Li, R. The Effect of Coal Sulfur on the Behavior of Alkali
Metals during Co-Firing Biomass and Coal. Fuel 2011, 90 (7), 2454–2460.
(69) Varol, M.; Atimtay, A. T. Bioresource Technology Effect of Biomass-Sulfur Interaction on
Ash Composition and Agglomeration for the Co-Combustion of High-Sulfur Lignite Coals and
Olive Cake in a Circulating Fluidized Bed Combustor. Bioresour. Technol. 2015, 198, 325–
331.
(70) Yerushalmi, J.; Kolodney, M.; Graff, R. A.; Squires, A. M.; Harvey, R. D. Agglomeration of
Ash in Fluidized Beds Gasifying Coal: The Godel Phenomenon. Science (80-. ). 1975, 187
(4177), 646–648.
Literature Survey
41
(71) Ergudenler, A.; Ghaly, A. E. Agglomeration of Alumina Sand in a Fluidized Bed Straw
Gasifier at Elevated Temperatures. Bioresour. Technol. 1993, 43 (3), 259–268.
(72) Alauddin, Z. A. B. Z.; Lahijani, P.; Mohammadi, M.; Mohamed, A. R. Gasification of
Lignocellulosic Biomass in Fluidized Beds for Renewable Energy Development: A Review.
Renew. Sustain. Energy Rev. 2010, 14, 2852–2862.
(73) Lin, C. L.; Wey, M. Y. The Effect of Mineral Compositions of Waste and Operating Conditions
on Particle Agglomeration/Defluidization during Incineration. Fuel 2004, 83 (17–18), 2335–
2343.
(74) Fryda, L. E.; Panopoulos, K. D.; Kakaras, E. Agglomeration in Fluidised Bed Gasification of
Biomass. Powder Technol. 2008, 181 (3), 307–320.
(75) Seemen, A.; Atong, D.; Sricharoenchaikul, V. Effect of Silica and Alumina Ratio on Bed
Agglomeration during Fluidized Bed Gasification of Rice Straw. Proc. - 2018 2nd Int. Conf.
Green Energy Appl. ICGEA 2018 2018, 268–272.
(76) Kittivech, T.; Fukuda, S. Investigating Agglomeration Tendency of Co-Gasification between
High Alkali Biomass and Woody Biomass in a Bubbling Fluidized Bed System. Energies 2020,
13 (56), 1–15.
(77) Process, C.; Hellas, T.; Plants, T. Agglomeration Problems During Cardoon Fluidized Bed
Gasification. Therm. Sci. 2014, 18 (2), 645–656.
(78) Liliedahl, T.; Sjöström, K.; Engvall, K.; Rosén, C. Defluidisation of Fluidised Beds during
Gasification of Biomass. Biomass and Bioenergy 2011, 35 (SUPPL. 1), 3–10.
(79) Zevenhoven-Onderwater, M.; Backman, R.; Skrifvars, B. J.; Hupa, M.; Liliendahl, T.; Rosén,
C.; Sjöström, K.; Engvall, K.; Hallgren, A. The Ash Chemistry in Fluidised Bed Gasification
of Biomass Fuels. Part I: Predicting the Chemistry of Melting Ashes and Ash-Bed Material
Interaction. Fuel 2001, 80 (10), 1489–1502.
(80) Zevenhoven-Onderwater, M.; Backman, R.; Skrifvars, B. J.; Hupa, M. The Ash Chemistry in
Fluidised Bed Gasification of Biomass Fuels. Part II: Ash Behaviour Prediction versus Bench
Scale Agglomeration Tests. Fuel 2001, 80 (10), 1503–1512.
(81) Ergudenler, A.; Ghaly, A. E. Agglomeration of Silica Sand in a Fluidized Bed Gasifier
Operating on Wheat Straw. Biomass and Bioenergy 1993, 4 (2), 135–147.
(82) Kittivech, T.; Fukuda, S. Effect of Bed Material on Bed Agglomeration for Palm Empty Fruit
Bunch (EFB) Gasification in a Bubbling Fluidised Bed System. Energies 2019, 12, 4336–4352.
(83) George, J.; Arun, P.; Muraleedharan, C. Experimental Investigation on Co-Gasification of
Coffee Husk and Sawdust in a Bubbling Fluidised Bed Gasifier. J. Energy Inst. 2019, 92 (6),
1977–1986.
(84) Zhang, H.; Hao, Z.; Li, J.; Yang, X.; Wang, Z.; Liu, Z.; Huang, J.; Zhang, Y.; Fang, Y. Effect
of Coal Ash Additive on Potassium Fixation and Melting Behaviors of the Mixture under
Simulated Biomass Gasification Condition. Renew. Energy 2021, 168, 806–814.
Agglomeration during Fluidized Bed Combustion and Gasification of Biomass
42
(85) Parthasarathy, P.; Narayanan, K. S. Hydrogen Production from Steam Gasification of Biomass:
Influence of Process Parameters on Hydrogen Yield - A Review. Renew. Energy 2014, 66,
570–579.
(86) Meng, F.; Ma, Q.; Wang, H.; Liu, Y.; Wang, D. Effect of Gasifying Agents on Sawdust
Gasification in a Novel Pilot Scale Bubbling Fluidized Bed System. Fuel 2019, 249 (March),
112–118.
(87) James, A. K.; Helle, S. S.; Thring, R. W.; Rutherford, P. M.; Masnadi, M. S. Investigation of
Air and Air-Steam Gasification of High Carbon Wood Ash in a Fluidized Bed Reactor. Energy
Environ. Res. 2014, 4 (1).
(88) Abra, M. G.; Ordin, A. N.; Iliedahl, T. L.; Ao, A. N. R. Experimental Determination of Bed
Agglomeration Tendencies of Some Common Agricultural Residues in Fluidized Bed
Combustion and Gasification. Biomass and Bioenergy 1998, 15 (2), 163–169.
(89) Aničić, B. Agglomeration Mechanisms during Fluidized Bed Combustion of Biomass,
Technical University of Denmark, 2018.
(90) Ma, T.; Fan, C.; Hao, L.; Li, S.; Song, W.; Lin, W. Biomass-Ash-Induced Agglomeration in a
Fluidized Bed. Part 1: Experimental Study on the Effects of a Gas Atmosphere. Energy &
Fuels 2016, 30 (8), 6395–6404.
(91) Vassilev, S. V.; Baxter, D.; Andersen, L. K.; Vassileva, C. G. An Overview of the Composition
and Application of Biomass Ash. Part 1. Phase-Mineral and Chemical Composition and
Classification. Fuel 2013, 105, 40–76.
(92) Johansen, J. M.; Jakobsen, J. G.; Frandsen, F. J.; Glarborg, P. Release of K, Cl, and S during
Pyrolysis and Combustion of High-Chlorine Biomass. Energy & Fuels 2011, 25 (11), 4961–
4971.
(93) Frandsen, F. J.; van Lith, S. C.; Korbee, R.; Yrjas, P.; Backman, R.; Obernberger, I.; Brunner,
T.; Jöller, M. Quantification of the Release of Inorganic Elements from Biofuels. Fuel Process.
Technol. 2007, 88 (11–12), 1118–1128.
(94) van Lith, S. C.; Alonso-Ramirez, V.; Jensen, P. A.; Frandsen, F. J.; Glarborg, P. Release to the
Gas Phase of Inorganic Elements during Wood Combustion. Part 1: Development and
Evaluation of Quantification Methods. Energy & Fuels 2006, 20 (3), 964–978.
(95) Wu, H.; Castro, M.; Jensen, P. A.; Frandsen, F. J.; Glarborg, P.; Dam-Johansen, K.; Røkke,
M.; Lundtorp, K. Release and Transformation of Inorganic Elements in Combustion of a High-
Phosphorus Fuel. Energy & Fuels 2011, 25 (7), 2874–2886.
(96) Khalil, R. A.; Seljeskog, M.; Hustad, J. E. Sulfur Abatement in Pyrolysis of Straw Pellets.
Energy & Fuels 2008, 22 (4), 2789–2795.
(97) Tortosa Masiá, A. A.; Buhre, B. J. P.; Gupta, R. P.; Wall, T. F. Characterising Ash of Biomass
and Waste. Fuel Process. Technol. 2007, 88 (11–12), 1071–1081.
(98) Wang, X.; Si, J.; Tan, H.; Ma, L.; Pourkashanian, M.; Xu, T. Nitrogen, Sulfur, and Chlorine
Literature Survey
43
Transformations during the Pyrolysis of Straw. Energy & Fuels 2010, 24 (9), 5215–5221.
(99) Werkelin, J.; Skrifvars, B. J.; Zevenhoven, M.; Holmbom, B.; Hupa, M. Chemical Forms of
Ash-Forming Elements in Woody Biomass Fuels. Fuel 2010, 89 (2), 481–493.
(100) Zhang, Y.; Xie, X.; Zhao, J.; Wei, X. The Alkali Metal Occurrence Characteristics and Its
Release and Conversion during Wheat Straw Pyrolysis. Renew. Energy 2019.
(101) Haynes, B. S.; Neville, M.; Quann, R. J.; Sarofim, A. F. Factors Governing the Surface
Enrichment of Fly Ash in Volatile Trace Species. J. Colloid Interface Sci. 1982, 87 (1), 266–
278.
(102) Wiinikka, H.; Gebart, R.; Boman, C.; Boström, D.; Öhman, M. Influence of Fuel Ash
Composition on High Temperature Aerosol Formation in Fixed Bed Combustion of Woody
Biomass Pellets. Fuel 2007, 86 (1–2), 181–193.
(103) Korbee, R.; Shah, K. V.; Cieplik, M. K.; Betrand, C. I.; Vuthaluru, H. B.; Van De Kamp, W.
L. First Line Ash Transformations of Coal and Biomass Fuels during PF Combustion. Energy
& Fuels 2010, 24 (2), 897–909.
(104) Frandsen, F. J. Ash Formation , Deposition and Corrosion When Utilizing Straw for Heat and
Power Production, Technical University of Denmark, 2011.
(105) Damoe, A. J.; Jensen, P. A.; Frandsen, F. J.; Wu, H.; Glarborg, P. Fly Ash Formation during
Suspension Firing of Biomass: Effects of Residence Time and Fuel Type. Energy & Fuels
2017, 31 (1), 555–570.
(106) Knudsen, J. N. Volatilization of Inorganic Matter during Combustion of Annual Biomass,
Technical University of Denmark, 2004.
(107) van Lith, S. C.; Jensen, P. A.; Frandsen, F.; Glarborg, P. Release to the Gas Phase of Inorganic
Elements during Wood Combustion. Part 2: Influence of Fuel Composition. Energy & Fuels
2008, 22 (6), 1598–1609.
(108) Dayton, D. C.; French, R. J.; Milne, T. A. Direct Observation of Alkali Vapor Release during
Biomass Combustion and Gasification. 1. Application of Molecular Beam/Mass Spectrometry
to Switchgrass Combustion. Energy & Fuels 1995, 9 (5), 855–865.
(109) Knudsen, J. N.; Jensen, P. A.; Dam-johansen, K. Transformation and Release to the Gas Phase
of Cl , K , and S during Combustion of Annual Biomass. Energy & Fuels 2004, 18, 1385–
1399.
(110) Johansen, J. M.; Aho, M.; Paakkinen, K.; Taipale, R.; Egsgaard, H.; Jakobsen, J. G.; Frandsen,
F. J.; Glarborg, P. Release of K, Cl, and S during Combustion and Co-Combustion with Wood
of High-Chlorine Biomass in Bench and Pilot Scale Fuel Beds. Proc. Combust. Inst. 2013, 34
(2), 2363–2372.
(111) Misra, M. K.; Ragland, K. W.; Baker, A. J. Wood Ash Composition as a Function of Furnace
Temperature. Biomass and Bioenergy 1993, 4 (2), 103–116.
Agglomeration during Fluidized Bed Combustion and Gasification of Biomass
44
(112) Tchoffor, P. A.; Davidsson, K. O.; Thunman, H. Effects of Steam on the Release of Potassium,
Chlorine, and Sulfur during Char Conversion, Investigated under Dual-Fluidized-Bed
Gasification Conditions. Energy & Fuels 2014, 28 (11), 6953–6965.
(113) Bläsing, M.; Müller, M. Investigations on the Influence of Steam on the Release of Sodium,
Potassium, Chlorine, and Sulphur Species during High Temperature Gasification of Coal. Fuel
2012, 94, 137–143.
(114) Mason, P. E.; Darvell, L. I.; Jones, J. M.; Williams, A. Observations on the Release of Gas-
Phase Potassium during the Combustion of Single Particles of Biomass. Fuel 2016, 182, 110–
117.
(115) Niu, Y.; Du, W.; Tan, H.; Xu, W.; Liu, Y.; Xiong, Y.; Hui, S. Further Study on Biomass Ash
Characteristics at Elevated Ashing Temperatures: The Evolution of K, Cl, S and the Ash
Fusion Characteristics. Bioresour. Technol. 2013, 129, 642–645.
(116) Jensen, P. A.; Frandsen, F. J.; Dam-Johansen, K.; Sander, B. Experimental Investigation of the
Transformation and Release to Gas Phase of Potassium and Chlorine during Straw Pyrolysis.
Energy & Fuels 2000, 14 (6), 1280–1285.
(117) Boström, D.; Skoglund, N.; Grimm, A.; Boman, C.; Öhman, M.; Broström, M.; Backman, R.
Ash Transformation Chemistry during Combustion of Biomass. Energy & Fuels 2012, 26 (1),
85–93.
(118) Vassilev, S. V; Baxter, D.; Vassileva, C. G. An Overview of the Behaviour of Biomass during
Combustion: Part I. Phase-Mineral Transformations of Organic and Inorganic Matter. Fuel
2013, 112, 391–449.
(119) Vassilev, S. V.; Baxter, D.; Vassileva, C. G. An Overview of the Behaviour of Biomass during
Combustion: Part II. Ash Fusion and Ash Formation Mechanisms of Biomass Types. Fuel
2014, 117, 152–183.
(120) Čepauskiene, D.; Pedišius, N.; Milčius, D. Chemical Composition of Agromass Ash and Its
Influence on Ash Melting Characteristics. Agron. Res. 2018, 16 (2), 357–364.
(121) Steenari, B. M.; Lindqvist, O. High-Temperature Reactions of Straw Ash and the Anti-
Sintering Additives Kaolin and Dolomite. Biomass and Bioenergy 1998, 14 (1), 67–76.
(122) Dodson, J. R.; Hunt, A. J.; Budarin, V. L.; Matharu, A. S.; Clark, J. H. The Chemical Value of
Wheat Straw Combustion Residues. RSC Adv. 2011, 1 (3), 523–530.
(123) Li, L.; Ren, Q.; Li, S.; Lu, Q. Effect of Phosphorus on the Behavior of Potassium during the
Co-Combustion of Wheat Straw with Municipal Sewage Sludge. Energy & Fuels 2013, 27
(10), 5923–5930.
(124) Zhao, H.; Xu, W.; Song, Q.; Zhuo, J.; Yao, Q. Effect of Steam and SiO2 on the Release and
Transformation of K2CO3 and KCl during Biomass Thermal Conversion. Energy & Fuels 2018,
32 (9), 9633–9639.
(125) Novakovic, A.; Lith, S. C. Van; Frandsen, F. J.; Jensen, P. a; Holgersen, L. B. Release of
Literature Survey
45
Potassium from the Systems K-Ca-Si and K-Ca-P. Energy & Fuels 2009, No. 3, 3423–3428.
(126) Sevonius, C.; Yrjas, P.; Hupa, M. Defluidization of a Quartz Bed - Laboratory Experiments
with Potassium Salts. Fuel 2014, 127, 161–168.
(127) Ma, T.; Fan, C.; Hao, L.; Li, S.; Jensen, P. A.; Song, W.; Lin, W.; Dam-Johansen, K. Biomass
Ash Induced Agglomeration in Fluidized Bed. Part 2: Effect of Potassium Salts in Different
Gas Composition. Fuel Process. Technol. 2018, 180, 130–139.
(128) Sevonius, C.; Yrjas, P.; Lindberg, D.; Hupa, L. Impact of Sodium Salts on Agglomeration in
a Laboratory Fluidized Bed. Fuel 2019, 245, 305–315.
(129) He, Z.; Saw, W. L.; Eyk, P. J. Van; Nathan, G. J.; Ashman, P. J. Interactions between Quartz
Sand and Wood Doped with Either K or Na Salts under Steam Gasification and Combustion
Atmospheres. Ind. Eng. Chem. Res. 2020, 59, 1712–1722.
(130) Song, B. H.; Kim, S. D. Catalytic Activity of Alkali and Iron Salt Mixtures for Steam-Char
Gasification. Fuel 1993, 72 (6), 797–803.
(131) Huttinger, K. J.; Minges, R. Catalytic Carbon Water Vapour Gasification and Wetting. Fuel
1985, 64, 491–494.
(132) Anicic, B.; Lin, W.; Dam-Johansen, K.; Wu, H. Agglomeration Mechanism in Biomass
Fluidized Bed Combustion – Reaction between Potassium Carbonate and Silica Sand. Fuel
Process. Technol. 2018, 173, 182–190.
(133) Kumar, L.; Pougatch, K.; Salcudean, M.; Grace, J.; Grecov, D.; Mcmillan, J. Population
Balance Modeling for the Growth of Agglomerates via Primary and Secondary Agglomeration
in Gas-Fluidized Beds. Powder Technol. 2017, 321, 499–513.
(134) Yuksel, H.; Dirim, S. N. Agglomeration Process in the Fluidized Bed , the Effecting
Parameters and Some Applications. Croat. J. Food Technol. Biotechnol. Nutr. 2018, 13 (3–4),
159–163.
(135) Gao, J.; Wen, G.; Huang, T.; Tang, P.; Liu, Q. Effects of the Composition on the Structure and
Viscosity of the CaO–SiO2-Based Mold Flux. J. Non. Cryst. Solids 2016, 435, 33–39.
(136) Ilyushechkin, A. Y.; Hla, S. S. Viscosity of High-Iron Slags from Australian Coals. Energy &
Fuels 2013, 27, 3736–3742.
(137) Hsieh, P. Y.; Kwong, K.; Bennett, J. Correlation between the Critical Viscosity and Ash Fusion
Temperatures of Coal Gasifier Ashes. Fuel Process. Technol. 2016, 142, 13–26.
(138) Xu, J.; Zhao, F.; Guo, Q.; Yu, G.; Liu, X.; Wang, F. Characterization of the Melting Behavior
of High-Temperature and Low-Temperature Ashes. Fuel Process. Technol. 2015, 134, 441–
448.
(139) Tsuruda, A.; Hakim, L.; Takebe, H. Viscosity Measurement and Prediction of Gasified and
Synthesized Coal Slag Melts. Fuel 2017, 200, 521–528.
Agglomeration during Fluidized Bed Combustion and Gasification of Biomass
46
(140) Wu, X.; Zhang, Z.; Piao, G.; He, X.; Chen, Y.; Kobayashi, N.; Mori, S.; Itaya, Y. Behavior of
Mineral Matters in Chinese Coal Ash Melting during Char-CO2/H2O Gasification Reaction.
Energy & Fuels 2009, 23, 2420–2428.
(141) Folkedahl, B. C.; Schobert, H. H. Effects of Atmosphere on Viscosity of Selected Bituminous
and Low-Rank Coal Ash Slags. Energy & Fuels 2005, 19, 208–215.
(142) Jing, N.; Wang, Q.; Luo, Z.; Cen, K. Effect of Different Reaction Atmospheres on the Sintering
Temperature of Jincheng Coal Ash under Pressurized Conditions. Fuel 2011, 90 (8), 2645–
2651.
(143) Schimpke, R.; Klinger, M.; Krzack, S.; Meyer, B. Determination of the Initial Ash Sintering
Temperature by Cold Compression Strength Tests with Regard to Mineral Transitions. Fuel
2017, 194, 157–165.
(144) Jing, N.; Wang, Q.; Yang, Y.; Cheng, L.; Luo, Z.; Cen, K. Influence of Ash Composition on
the Sintering Behavior during Pressurized Combustion and Gasification Process. J Zhejiang
Univ-Sci A (Appl Phys Eng) 2012, 13 (3), 230–238.
(145) Bryant, G. W.; Browning, G. J.; Emanuel, H.; Gupta, S. K.; Gupta, R. P.; Lucas, J. A.; Wall,
T. F. The Fusibility of Blended Coal Ash. 2000, No. 5, 316–325.
(146) Song, W. J.; Tang, L. H.; Zhu, X. D.; Wu, Y. Q.; Zhu, Z. B. Prediction of Chinese Coal Ash
Fusion Temperatures in Ar and H2 Atmospheres. Energy & Fuels 2009, 23, 1990–1997.
(147) Dyk, J. C. Van; Benson, S. A.; Laumb, M. L.; Waanders, B. Coal and Coal Ash Characteristics
to Understand Mineral Transformations and Slag Formation. Fuel 2009, 88 (6), 1057–1063.
(148) Wei, B.; Tan, H.; Wang, X.; Yang, T.; Wang, Y.; Ruan, R.; Wei, B.; Tan, H.; Wang, X.; Yang,
T.; et al. Impact of Complex Reacting Atmosphere on Ash Fusion Characteristics and Minerals
Conversion in Coal Combustion Process. Combust. Sci. Technol. 2018, 190 (7), 1178–1193.
(149) Vassilev, S. V.; Vassileva, C. G.; Vassilev, V. S. Advantages and Disadvantages of
Composition and Properties of Biomass in Comparison with Coal: An Overview. Fuel 2015,
158, 330–350.
(150) Miaomiao, N.; Dong, Q.; Huang, Y.; Jin, B.; Wang, H.; Gu, H. Characterization of Ash Melting
Behaviour at High Temperatures under Conditions Simulating Combustible Solid Waste
Gasification. Waste Manag. Res. 2018, 36 (5), 415–425.
(151) Cao, X.; Kong, L.; Bai, J.; Ge, Z.; Li, H.; Bai, Z. Effect of Water Vapor on Coal Ash Slag
Viscosity under Gasification Condition. Fuel 2019, 237, 18–27.
(152) Mao, Y.; Jin, Y.; Li, K.; Bi, J.; Li, J.; Xin, F. Sintering Characteristic in Catalytic Gasification
of China Inner Mongolia Bituminous Coal Ash. Energy & Fuels 2016, 30, 3975–3985.
(153) Mao, Y.; Jin, Y.; Li, K.; Bi, J.; Li, J.; Xin, F. Analysis of Influencing Factors on Sintering
Temperature of Inner Mongolia Wangjiata Bituminous Coal Ash during Catalytic Coal
Gasification (in Chinese). Huagong Xuebao/CIESC J. 2015, 66, 1080–1087.
Literature Survey
47
(154) Vuthaluru, H. B.; Linjewile, T. M.; Zhang, D. ke; Manzoori, A. R. Investigations into the
Control of Agglomeration and Defluidisation during Fluidised-Bed Combustion of Low-Rank
Coals. Fuel 1999, 78 (4), 419–425.
(155) Vuthaluru, H. B.; Zhang, D. K. Control Methods for Remediation of Ash-Related Problems in
Fluidised-Bed Combustors. Fuel Process. Technol. 1999, 60 (2), 145–156.
(156) Vuthaluru, H. B.; Zhang, D. K. Effect of Ca- and Mg-Bearing Minerals on Particle
Agglomeration Defluidization during Fluidized-Bed Combustion of a South Australian Lignite.
Fuel Process. Technol. 2001, 69 (1), 13–27.
(157) Fernández Llorente, M. J.; Escalada Cuadrado, R.; Murillo Laplaza, J. M.; Carrasco García, J.
E. Combustion in Bubbling Fluidised Bed with Bed Material of Limestone to Reduce the
Biomass Ash Agglomeration and Sintering. Fuel 2006, 85 (14–15), 2081–2092.
(158) van Ommen, J. R.; Schouten, J. C.; Coppens, M.-O.; Lin, W.; Dam-Johansen, K.; van den
Bleek, C. M. Timely Detection of Agglomeration in Biomass Fired Fluidized Beds. In
Proceedings of the 16th International Conference on Fluidized Bed Combustion; American
Society of Mechanical Engineers: United States, 2001; pp 1–14.
(159) Nuutinen, L. H.; Tiainen, M. S.; Virtanen, M. E.; Enestam, S. H.; Laitinen, R. S. Coating
Layers on Bed Particles during Biomass Fuel Combustion in Fluidized-Bed Boilers. Energy &
Fuels 2004, 18 (1), 127–139.
(160) De Geyter, S.; Öhman, M.; Boström, D.; Eriksson, M.; Nordin, A. Effects of Non-Quartz
Minerals in Natural Bed Sand on Agglomeration Characteristics during Fluidized Bed
Combustion of Biomass Fuels. Energy & Fuels 2007, 21 (5), 2663–2668.
(161) Werther, J.; Saenger, M.; Hartge, E. U.; Ogada, T.; Siagi, Z. Combustion of Agricultural
Residues. Prog. Energy Combust. Sci. 2000, 26 (1), 1–27.
(162) Öhman, M.; Nordin, A. The Role of Kaolin in Prevention of Bed Agglomeration during
Fluidized Bed Combustion of Biomass Fuels. Energy & Fuels 2000, 14 (3), 618–624.
(163) Öhman, M.; Nordin, A.; Lundholm, K.; Boström, D.; Hedman, H.; Lundberg, M. Ash
Transformations during Combustion of Meat-, Bonemeal, and RDF in a (Bench-Scale)
Fluidized Bed Combustor. Energy & Fuels 2003, 17 (5), 1153–1159.
(164) Davidsson, K. O.; Steenari, B. M.; Eskilsson, D. Kaolin Addition during Biomass Combustion
in a 35 MW Circulating Fluidized-Bed Boiler. Energy & Fuels 2007, 21 (4), 1959–1966.
(165) Davidsson, K. O.; Åmand, L. E.; Steenari, B. M.; Elled, A. L.; Eskilsson, D.; Leckner, B.
Countermeasures against Alkali-Related Problems during Combustion of Biomass in a
Circulating Fluidized Bed Boiler. Chem. Eng. Sci. 2008, 63 (21), 5314–5329.
(166) Barišić, V.; Peltola, K.; Coda Zabetta, E. Role of Pulverized Coal Ash against Agglomeration,
Fouling, and Corrosion in Circulating Fluidized-Bed Boilers Firing Challenging Biomass.
Energy & Fuels 2013, 27 (10), 5706–5713.
(167) Chou, J. D.; Lin, C. L. Inhibition of Agglomeration/Defluidization by Different Calcium
Agglomeration during Fluidized Bed Combustion and Gasification of Biomass
48
Species during Fluidized Bed Incineration under Different Operating Conditions. Powder
Technol. 2012, 219, 165–172.
(168) Billen, P.; Costa, J.; Van Der Aa, L.; Westdorp, L.; Van Caneghem, J.; Vandecasteele, C. An
Agglomeration Index for CaO Addition (as CaCO3) to Prevent Defluidization: Application to
a Full-Scale Poultry Litter Fired FBC. Energy & Fuels 2014, 28 (8), 5455–5462.
(169) Wang, L.; Skjevrak, G.; Hustad, J. E.; Skreiberg, Ø. Investigation of Biomass Ash Sintering
Characteristics and the Effect of Additives. Energy & Fuels 2014, 28 (1), 208–218.
(170) Grimm, A.; Skoglund, N.; Boström, D.; Boman, C.; Öhman, M. Influence of Phosphorus on
Alkali Distribution during Combustion of Logging Residues and Wheat Straw in a Bench-
Scale Fluidized Bed. Energy & Fuels 2012, 26 (5), 3012–3023.
(171) Ulusoy, B. NOx Formation and Reduction in Fluidized Bed Combustion of Biomass,
Technical University of Denmark, 2019.
(172) Jenkins, B. M.; Bakker, R. R.; Wei, J. B. On the Properties of Washed Straw. Biomass and
Bioenergy 1996, 10 (4), 177–200.
(173) Arvelakis, S.; Vourliotis, P.; Kakaras, E.; Koukios, E. G. Effect of Leaching on the Ash
Behavior of Wheat Straw and Olive Residue during Uidized Bed Combustion. Biomass and
Bioenergy 2001, 20, 459–470.
(174) Arvelakis, S.; Gehrmann, H.; Beckmann, M.; Koukios, E. G. Agglomeration Problems during
Fluidized Bed Gasification of Olive-Oil Residue : Evaluation of Fractionation and Leaching
as Pre-Treatments. Fuel 2003, 82, 1261–1270.
(175) Arvelakis, S.; Gehrmann, H.; Beckmann, M.; Koukios, E. G. Preliminary Results on the Ash
Behavior of Peach Stones during Fluidized Bed Gasification : Evaluation of Fractionation and
Leaching as Pre-Treatments. Biomass and Bioenergy 2005, 28, 331–338.
(176) Carrillo, M. A.; Staggenborg, S. A.; Pineda, J. A. Washing Sorghum Biomass with Water to
Improve Its Quality for Combustion. Fuel 2014, 116, 427–431.
(177) Deng, L.; Zhang, T.; Che, D. Effect of Water Washing on Fuel Properties , Pyrolysis and
Combustion Characteristics , and Ash Fusibility of Biomass. Fuel Process. Technol. 2013, 106,
712–720.
(178) Link, S.; Arvelakis, S.; Paist, A.; Liliedahl, T. Effect of Leaching Pretreatment on the
Gasification of Wine and Vine ( Residue ) Biomass. Renew. Energy 2018, 115, 1–5.
(179) Yu, C.; Thy, P.; Wang, L.; Anderson, S. N.; Vandergheynst, J. S.; Upadhyaya, S. K.; Jenkins,
B. M. Influence of Leaching Pretreatment on Fuel Properties of Biomass. Fuel Process.
Technol. 2014, 128, 43–53.
(180) Said, N.; Bishara, T.; García-maraver, A.; Zamorano, M. Effect of Water Washing on the
Thermal Behavior of Rice Straw. Waste Manag. 2013, 33 (11), 2250–2256.
(181) Arvelakis, S.; Koukios, E. G. Physicochemical Upgrading of Agroresidues as Feedstocks for
Literature Survey
49
Energy Production via Thermochemical Conversion Methods. Biomass and Bioenergy 2002,
22, 331–348.
(182) Taralas, G.; Kontominas, M. G. Thermochemical Treatment of Solid and Wastewater Effluents
Originating from the Olive Oil Food Industry. Energy & Fuels 2005, 19, 1179–1185.
(183) Datta, S.; Chauhan, V.; Sahu, G.; Chavan, P. D.; Saha, S.; Gupta, P. K.; Dutta, P. Co-
Gasification of High Ash Indian Coal-Biomass Blends in a Pilot-Scale Fluidized Bed Gasifier.
Biomass Convers. Biorefinery 2020, 10 (4), 831–838.
(184) Teixeira, P.; Lopes, H.; Gulyurtlu, I.; Lapa, N.; Abelha, P. Evaluation of Slagging and Fouling
Tendency during Biomass Co-Firing with Coal in a Fluidized Bed. Biomass and Bioenergy
2012, 39, 192–203.
(185) Teixeira, P.; Lopes, H.; Gulyurtlu, I.; Lapa, N.; Abelha, P.; Ed, J. Slagging and Fouling during
Coal and Biomass Co Fi Ring : Chemical Equilibrium Model Applied to FBC. Energy & Fuels
2014.
(186) Nordgren, D.; Hedman, H.; Padban, N.; Boström, D.; Öhman, M. Ash Transformations in
Pulverised Fuel Co-Combustion of Straw and Woody Biomass. Fuel Process. Technol. 2013,
105, 52–58.
(187) Thy, P.; Jenkins, B. M.; Williams, R. B.; Lesher, C. E.; Bakker, R. R. Bed Agglomeration in
Fluidized Combustor Fueled by Wood and Rice Straw Blends. Fuel Process. Technol. 2010,
91 (11), 1464–1485.
(188) Elled, A. L.; Davidsson, K. O.; Åmand, L. E. Sewage Sludge as a Deposit Inhibitor When Co-
Fired with High Potassium Fuels. Biomass and Bioenergy 2010, 34 (11), 1546–1554.
(189) Skoglund, N.; Grimm, A.; Öhman, M.; Boström, D. Effects on Ash Chemistry When Co-Firing
Municipal Sewage Sludge and Wheat Straw in a Fluidized Bed: Influence on the Ash
Chemistry by Fuel Mixing. Energy & Fuels 2013, 27 (10), 5725–5732.
(190) Ryabov, G.; Litoun, D.; Dik, E. Agglomeration of Bed Material: Influence on Efficiency of
Biofuel Fluidized Bed Boiler. Therm. Sci. 2003, 7 (1), 5–16.
(191) Saidi, M.; Basirat Tabrizi, H.; Grace, J. R. A Review on Pulsed Flow in Gas-Solid Fluidized
Beds and Spouted Beds: Recent Work and Future Outlook. Adv. Powder Technol. 2019, 30
(6), 1121–1130.
(192) Ireland, E.; Pitt, K.; Smith, R. A Review of Pulsed Flow Fluidisation; the Effects of Intermittent
Gas Flow on Fluidised Gas-Solid Bed Behaviour. Powder Technol. 2016, 292, 108–121.
(193) Zhang, D.; Koksal, M. Heat Transfer in a Pulsed Bubbling Fluidized Bed. Powder Technol.
2006, 168 (1), 21–31.
(194) Jia, D.; Bi, X.; Lim, C. J.; Sokhansanj, S.; Tsutsumi, A. Heat Transfer in a Tapered Fluidized
Bed of Biomass Particles with Pulsed Gas Flow. Particuology 2019, 42, 2–14.
(195) Jia, D.; Bi, X.; Lim, C. J.; Sokhansanj, S.; Tsutsumi, A. Heat Transfer in a Pulsed Fluidized
Agglomeration during Fluidized Bed Combustion and Gasification of Biomass
50
Bed of Biomass Particles. Ind. Eng. Chem. Res. 2017, 56 (13), 3740–3756.
(196) Liu, Y.; Liu, Z.; Ohara, H. Heat Transfer and Fluidization Characteristics of Lignite in a
Pulsation-Assisted Fluidized Bed. Ind. Eng. Chem. Res. 2017, 56 (31), 8995–9005.
(197) Jia, D.; Bi, X.; Lim, C. J.; Sokhansanj, S.; Tsutsumi, A. Biomass Drying in a Pulsed Fluidized
Bed without Inert Bed Particles. Fuel 2016, 186, 270–284.
(198) Akhavan, A.; Van Ommen, J. R.; Nijenhuis, J.; Wang, X. S.; Coppens, M. O.; Rhodes, M. J.
Improved Drying in a Pulsation-Assisted Fluidized Bed. Ind. Eng. Chem. Res. 2009, 48 (1),
302–309.
(199) Nitz, M.; Taranto, O. P. Drying of Beans in a Pulsed Fluid Bed Dryer: Drying Kinetics, Fluid-
Dynamic Study and Comparisons with Conventional Fluidization. J. Food Eng. 2007, 80 (1),
249–256.
(200) Hadi, B.; Van Ommen, J. R.; Coppens, M. O. Enhanced Particle Mixing in Pulsed Fluidized
Beds and the Effect of Internals. Ind. Eng. Chem. Res. 2012, 51 (4), 1713–1720.
(201) Ali, S. S.; Asif, M. Fluidization of Nano-Powders: Effect of Flow Pulsation. Powder Technol.
2012, 225, 86–92.
(202) Li, Z.; Su, W.; Wu, Z.; Wang, R.; Mujumdar, A. S. Investigation of Flow Behaviors and Bubble
Characteristics of a Pulse Fluidized Bed via CFD Modeling. Dry. Technol. 2010, 28 (1), 78–
93.
(203) Khosravi Bizhaem, H.; Basirat Tabrizi, H. Investigating Effect of Pulsed Flow on
Hydrodynamics of Gas-Solid Fluidized Bed Using Two-Fluid Model Simulation and
Experiment. Powder Technol. 2017, 311, 328–340.
(204) Khosravi Bizhaem, H.; Basirat Tabrizi, H. Experimental Study on Hydrodynamic
Characteristics of Gas-Solid Pulsed Fluidized Bed. Powder Technol. 2013, 237, 14–23.
(205) Hao, B.; Bi, H. T. Forced Bed Mass Oscillations in Gas-Solid Fluidized Beds. Powder Technol.
2005, 149 (2–3), 51–60.
(206) Ali, S. S.; Asif, M.; Ajbar, A. Bed Collapse Behavior of Pulsed Fluidized Beds of Nano-
Powder. Adv. Powder Technol. 2014, 25 (1), 331–337.
(207) Akhavan, A.; Rahman, F.; Wang, S.; Rhodes, M. Enhanced Fluidization of Nanoparticles with
Gas Phase Pulsation Assistance. Powder Technol. 2015, 284, 521–529.
(208) Sobrino, C.; Almendros-Ibañez, J. A.; Santana, D.; de Vega, M. Fluidization of Group B
Particles with a Rotating Distributor. Powder Technol. 2008, 181 (3), 273–280.
(209) Gui, N.; Fan, J. R. Numerical Simulation of Pulsed Fluidized Bed with Immersed Tubes Using
DEM-LES Coupling Method. Chem. Eng. Sci. 2009, 64 (11), 2590–2598.
(210) Jia, D.; Cathary, O.; Peng, J.; Bi, X.; Lim, C. J.; Sokhansanj, S.; Liu, Y.; Wang, R.; Tsutsumi,
A. Fluidization and Drying of Biomass Particles in a Vibrating Fluidized Bed with Pulsed Gas
Literature Survey
51
Flow. Fuel Process. Technol. 2015, 138, 471–482.
(211) Kobayashi, M.; Ramaswasi, D.; Brazelton, W. T. HEAT TRANSFER FROM AN INTERNAL
SURFACE TO A PULSED BED. Chem. Eng. Prog. Symp. Ser. 1970, 66 (105), 58–67.
(212) Nishimura, A.; Deguchi, S.; Matsuda, H.; Hasatani, M.; Mujumdar, A. S. Heat Transfer
Characteristics in a Pulsating Fluidized Bed in Relation to Bubble Characteristics. Heat Transf.
- Asian Res. 2002, 31 (4), 307–319.
(213) Wang, X. S.; Rhodes, M. J. Using Pulsed Flow to Overcome Defluidization. Chem. Eng. Sci.
2005, 60 (18), 5177–5181.

Agglomeration during Fluidized Bed Combustion and Gasification of Biomass
52
Agglomeration in Fluidized Bed Gasification of Wheat Straw
This chapter has been written in a manuscript format. A slightly modified version of this chapter will
be submitted to a peer-reviewed journal.
3. Agglomeration in Fluidized Bed
Gasification of Wheat Straw
Abstract
In this chapter, the agglomeration during combustion and gasification of wheat straw in an air blown
system at different equivalence ratios (ERs) was studied in a lab-scale fluidized bed reactor at 850 °C
using silica sand as bed material. The influence of gasification agents, such as steam and carbon
dioxide, on agglomeration was further investigated by varying the concentrations of steam and CO2
in the primary gas. The results reveal that the agglomeration tendency in the fluidized bed increases
first to a maximum tendency as ER decreases, and then decreases with a decrease of ER. By
decreasing ER in the primary gas, the produced reducing atmosphere accelerates the agglomeration
probably due to an increased melting tendency of ash. Meanwhile, an increased residual carbon
amount in the bed results from a decreased ER will mitigate the agglomeration possibly by reducing
the fusion tendency and the melting flow behaviors of the straw ash and by retarding the interaction
between ash and bed material. The competition between an enhanced reducing atmosphere and an
increased amount of residual carbon caused by lowering ER results in the occurrence of a maximal
agglomeration tendency at a critical ER. The promoted agglomeration of wheat straw under the
condition with a high concentration of steam may be attributed to a decreased residual carbon amount
in the bed and a lowered viscosity of straw ash. However, the addition of CO2 in primary gas slightly
slows down the agglomeration. A mechanism for agglomeration in fluidized bed gasification of wheat
straw with respect to the effect of ER and steam is proposed based on the results from this study.
Agglomeration during Fluidized Bed Combustion and Gasification of Biomass
54
3.1 Introduction
Fluidized bed combustion and gasification of biomass are promising technologies for production of
power and chemicals from renewable resources1–3. However, the occurrence of bed agglomeration
can affect the stable and efficient operation of fluidized beds4,5, and may lead to defluidization and
unscheduled plant shutdown in severe cases 6. In the past decades, the mechanisms of agglomeration
in fluidized bed combustion of biomass have been investigated extensively from many aspects,
covering the mechanisms of agglomerate formation at particle scale5,7–9, the influence of biomass
type10–12 and operation parameters13,14, and the methods for mitigating the problems caused by
agglomeration15–17. It has been widely accepted that the agglomeration in biomass fired fluidized beds
results from the interaction between bed material and ash in the presence of a molten phase, e.g., low
melting temperature alkali containing compounds originated from biomass. Therefore, the
herbaceous biomass with a high alkali (mainly potassium) content, such as straws and Miscanthus, is
problematic in connection to agglomeration. The agglomeration phenomena in fluidized bed
combustion of biomass have been extensively discussed in several review papers18–22.
Compared to combustion, the study on agglomeration in fluidized bed gasification appears less
extensive, although the agglomeration studies started earlier for gasification of coal23 and biomass24.
The studies on agglomeration in biomass gasification investigate the influence of biomass type and
the operation parameters, such as temperature on the agglomeration tendency24–26, and propose the
countermeasures for mitigating agglomeration27–29. The methodologies applied for gasification
studies are normally similar to those for combustion studies, which can be categorized into the
following groups: predicting the ash behavior via thermodynamic equilibrium calculations30;
determining the defluidization tendency in trial tests and analyzing the formed agglomerates by
scanning electron microscopy with energy-dispersive X-ray (SEM-EDX)31,32; the combination of the
trial tests in fluidized bed and the thermodynamic equilibrium calculations25; estimating the
agglomeration tendency of the agglomerates formed in fixed beds at designed temperatures33; and
evaluating of defluidization temperatures of ashes at simulated gasification conditions5,34.
In the gasification process, biomass converts at reducing conditions, which will result in a different
ash chemistry from that under combustion. Therefore, the characteristics of biomass ash formed at
gasification conditions may behave differently from that at combustion conditions with respect to
fusion, which is strongly related to the agglomeration phenomena. It has been reported that the fusion
temperature of the coal ash under reducing condition is lower than that under oxidizing condition35–
39, due to the reduction of iron(III) to iron(II) in coal ash. For biomass, the trend is not consistent,
depending on the types of biomass from limited results5,34,40. Öhman et al.5,40 reported that the
agglomeration temperatures of bark, olive flesh, cane trash, and rice husk under gasification condition
are slightly lower than that under combustion condition, while reed cancan grass and Lucerne show
the opposite trend. Ma et al.34 showed that the defluidization temperatures of three straw ashes (wheat,
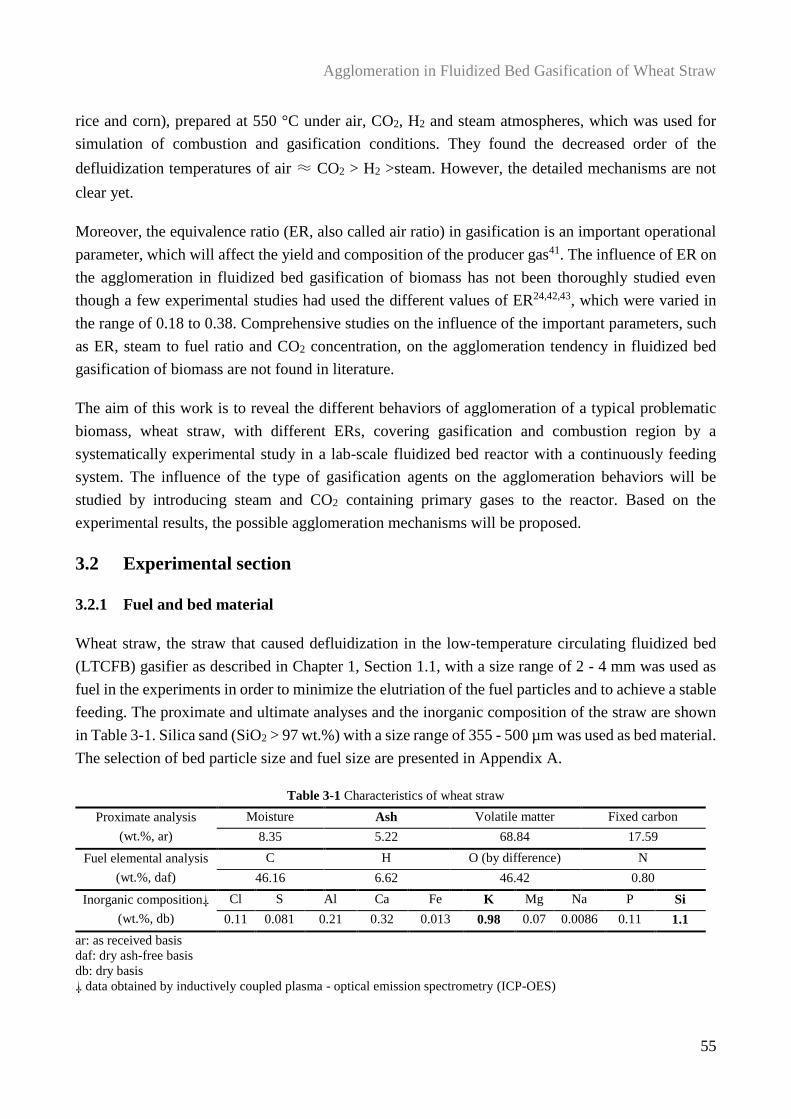
Agglomeration in Fluidized Bed Gasification of Wheat Straw
55
rice and corn), prepared at 550 °C under air, CO2, H2 and steam atmospheres, which was used for
simulation of combustion and gasification conditions. They found the decreased order of the
defluidization temperatures of air ≈ CO2 > H2 >steam. However, the detailed mechanisms are not
clear yet.
Moreover, the equivalence ratio (ER, also called air ratio) in gasification is an important operational
parameter, which will affect the yield and composition of the producer gas41. The influence of ER on
the agglomeration in fluidized bed gasification of biomass has not been thoroughly studied even
though a few experimental studies had used the different values of ER24,42,43, which were varied in
the range of 0.18 to 0.38. Comprehensive studies on the influence of the important parameters, such
as ER, steam to fuel ratio and CO2 concentration, on the agglomeration tendency in fluidized bed
gasification of biomass are not found in literature.
The aim of this work is to reveal the different behaviors of agglomeration of a typical problematic
biomass, wheat straw, with different ERs, covering gasification and combustion region by a
systematically experimental study in a lab-scale fluidized bed reactor with a continuously feeding
system. The influence of the type of gasification agents on the agglomeration behaviors will be
studied by introducing steam and CO2 containing primary gases to the reactor. Based on the
experimental results, the possible agglomeration mechanisms will be proposed.
3.2 Experimental section
3.2.1 Fuel and bed material
Wheat straw, the straw that caused defluidization in the low-temperature circulating fluidized bed
(LTCFB) gasifier as described in Chapter 1, Section 1.1, with a size range of 2 - 4 mm was used as
fuel in the experiments in order to minimize the elutriation of the fuel particles and to achieve a stable
feeding. The proximate and ultimate analyses and the inorganic composition of the straw are shown
in Table 3-1. Silica sand (SiO2 > 97 wt.%) with a size range of 355 - 500 µm was used as bed material.
The selection of bed particle size and fuel size are presented in Appendix A.
Table 3-1 Characteristics of wheat straw
Proximate analysis
(wt.%, ar)
Moisture Ash Volatile matter Fixed carbon
8.35 5.22 68.84 17.59
Fuel elemental analysis
(wt.%, daf)
C H O (by difference) N
46.16 6.62 46.42 0.80
Inorganic composition⸸
(wt.%, db)
Cl S Al Ca Fe K Mg Na P Si
0.11 0.081 0.21 0.32 0.013 0.98 0.07 0.0086 0.11 1.1
ar: as received basis
daf: dry ash-free basis
db: dry basis
⸸ data obtained by inductively coupled plasma - optical emission spectrometry (ICP-OES)
Agglomeration during Fluidized Bed Combustion and Gasification of Biomass
56
3.2.2 Experimental apparatus
Experiments were conducted in a lab-scale bubbling fluidized bed reactor system, which consists of
a gas supplying system, a fuel feeding system, a fluidized bed reactor, a gas sampling and analysis
system and a data acquisition system, as illustrated in Figure 3-1. The flow rates of air, N2, and CO2
were controlled by a series of precision mass flow controllers (MFCs). The steam was generated by
a steam generator (VEIT 2365) and its flow rate was controlled by a needle valve with pre-calibrated
data. An electric heat trace with a setting temperature of 150 °C was applied to the steam line to the
reactor to prevent the steam from condensation. Two streams of gas were introduced to the reactor,
fluidizing gas (or primary gas), which is introduced at the bottom of the reactor, and feeding gas (or
secondary gas), which is introduced with fuel particles. The reactor was made of high temperature
stainless steel with a total height of 1400 mm. The reactor has three zones: preheating zone, bubbling
bed and freeboard. The preheating zone is located below the gas distributor, above which is the
bubbling fluidized bed reactor. The inner diameter of the bubbling bed is 62.5 mm. The reactor was
externally heated by four independently controlled heating elements to achieve desired temperature
profile in the reactor. A loss-in-weight gravimetric feeder with twin screws (K-ML-KT20, Coperion
K-Tron) was used to feed the fuel particles to the reactor continuously. The feed position is located
at 300 mm above the gas distributor. The inner diameter of the freeboard 500 mm above the dense
bed is 100 mm to reduce elutriation of fine particles. After the exit of the flue gas at the reactor top,
a cyclone was used to remove the fine particles in the gas stream. A small amount of flue gas was
sampled from a port located in the downstream of the cyclone by a gas sampling system, consisting
of a filter, a pump, and a cooler for water condensation. The concentrations of CO2, CO, O2, NO and
SO2 in the flue gas were continuously monitored by a series of gas analyzers (Emerson, NGA 2000
Analyser, FLSmidth A/S). The reactor was equipped with four thermocouples to measure the
temperatures right below the gas distributor (T1), right above the gas distributor (T2), 7.5 cm above
the distributor (T3), and 5 cm above the distributor (T4), and two pressure transducers for monitoring
the pressure drop over the bed and pressure below the gas distributor. The signals from the
thermocouples and pressure transducers, as well as from gas analyzers were continuously logged to
a computer by a data acquisition system during experiments.
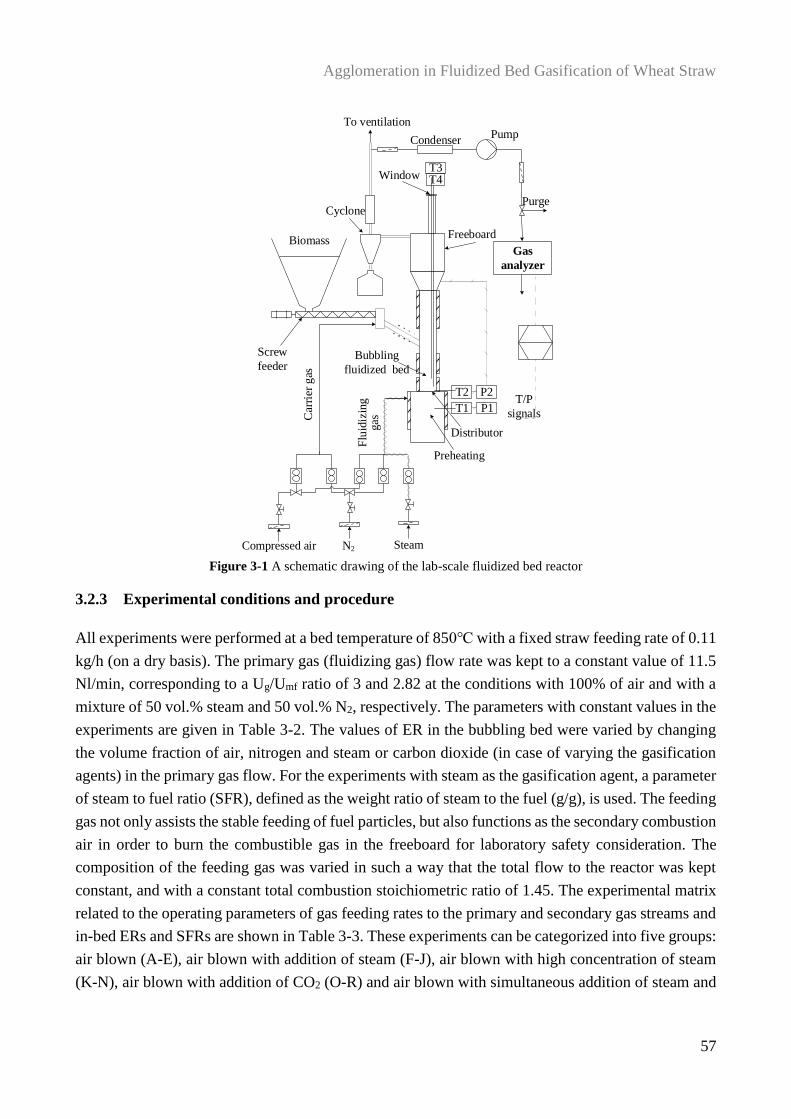
Agglomeration in Fluidized Bed Gasification of Wheat Straw
57
Figure 3-1 A schematic drawing of the lab-scale fluidized bed reactor
3.2.3 Experimental conditions and procedure
All experiments were performed at a bed temperature of 850℃ with a fixed straw feeding rate of 0.11
kg/h (on a dry basis). The primary gas (fluidizing gas) flow rate was kept to a constant value of 11.5
Nl/min, corresponding to a Ug/Umf ratio of 3 and 2.82 at the conditions with 100% of air and with a
mixture of 50 vol.% steam and 50 vol.% N2, respectively. The parameters with constant values in the
experiments are given in Table 3-2. The values of ER in the bubbling bed were varied by changing
the volume fraction of air, nitrogen and steam or carbon dioxide (in case of varying the gasification
agents) in the primary gas flow. For the experiments with steam as the gasification agent, a parameter
of steam to fuel ratio (SFR), defined as the weight ratio of steam to the fuel (g/g), is used. The feeding
gas not only assists the stable feeding of fuel particles, but also functions as the secondary combustion
air in order to burn the combustible gas in the freeboard for laboratory safety consideration. The
composition of the feeding gas was varied in such a way that the total flow to the reactor was kept
constant, and with a constant total combustion stoichiometric ratio of 1.45. The experimental matrix
related to the operating parameters of gas feeding rates to the primary and secondary gas streams and
in-bed ERs and SFRs are shown in Table 3-3. These experiments can be categorized into five groups:
air blown (A-E), air blown with addition of steam (F-J), air blown with high concentration of steam
(K-N), air blown with addition of CO2 (O-R) and air blown with simultaneous addition of steam and
SteamN2Compressed air
To ventilation
CondenserPump
Purge
Gas
analyzer
T/P
signals
Window
Cyclone
Biomass
Screw
feederBubbling
fluidized bed
Distributor
Freeboard
T4T3
T2
T1
P2
P1
Flu
idiz
ing
gasC
arri
er g
as
Preheating
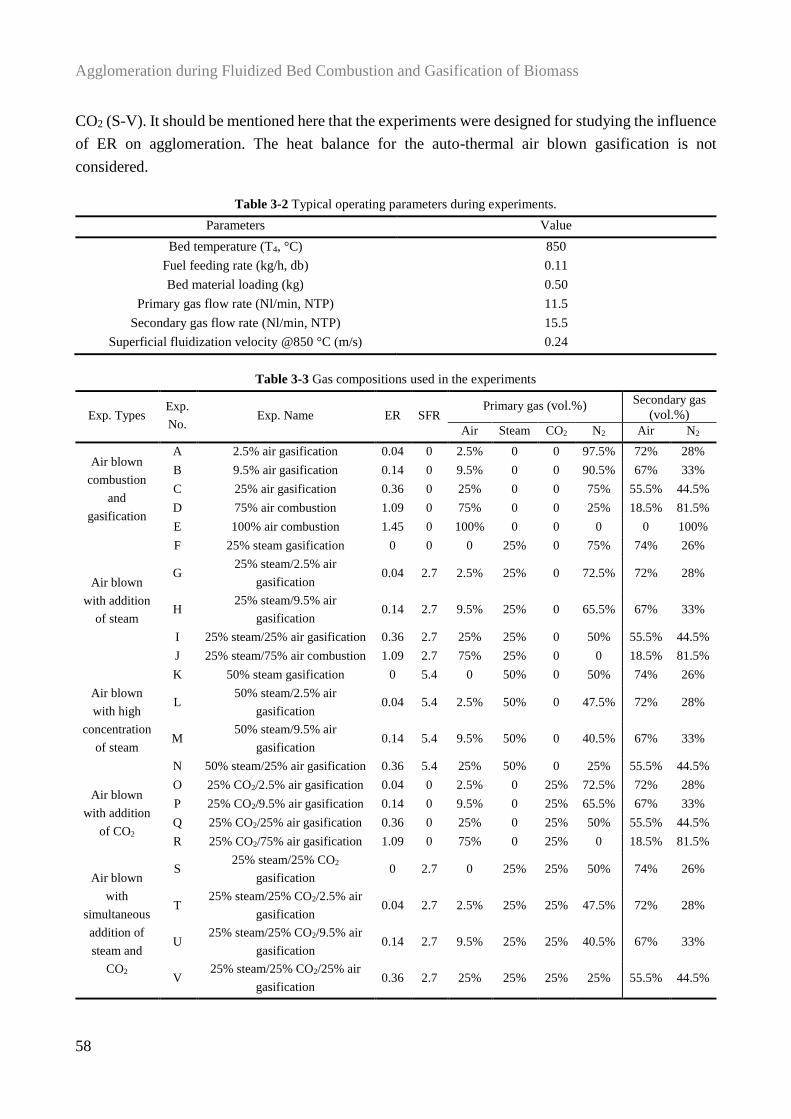
Agglomeration during Fluidized Bed Combustion and Gasification of Biomass
58
CO2 (S-V). It should be mentioned here that the experiments were designed for studying the influence
of ER on agglomeration. The heat balance for the auto-thermal air blown gasification is not
considered.
Table 3-2 Typical operating parameters during experiments.
Parameters Value
Bed temperature (T4, °C) 850
Fuel feeding rate (kg/h, db) 0.11
Bed material loading (kg) 0.50
Primary gas flow rate (Nl/min, NTP) 11.5
Secondary gas flow rate (Nl/min, NTP) 15.5
Superficial fluidization velocity @850 °C (m/s) 0.24
Table 3-3 Gas compositions used in the experiments
Exp. Types Exp.
No. Exp. Name ER SFR
Primary gas (vol.%) Secondary gas
(vol.%)
Air Steam CO2 N2 Air N2
Air blown
combustion
and
gasification
A 2.5% air gasification 0.04 0 2.5% 0 0 97.5% 72% 28%
B 9.5% air gasification 0.14 0 9.5% 0 0 90.5% 67% 33%
C 25% air gasification 0.36 0 25% 0 0 75% 55.5% 44.5%
D 75% air combustion 1.09 0 75% 0 0 25% 18.5% 81.5%
E 100% air combustion 1.45 0 100% 0 0 0 0 100%
Air blown
with addition
of steam
F 25% steam gasification 0 0 0 25% 0 75% 74% 26%
G 25% steam/2.5% air
gasification 0.04 2.7 2.5% 25% 0 72.5% 72% 28%
H 25% steam/9.5% air
gasification 0.14 2.7 9.5% 25% 0 65.5% 67% 33%
I 25% steam/25% air gasification 0.36 2.7 25% 25% 0 50% 55.5% 44.5%
J 25% steam/75% air combustion 1.09 2.7 75% 25% 0 0 18.5% 81.5%
Air blown
with high
concentration
of steam
K 50% steam gasification 0 5.4 0 50% 0 50% 74% 26%
L 50% steam/2.5% air
gasification 0.04 5.4 2.5% 50% 0 47.5% 72% 28%
M 50% steam/9.5% air
gasification 0.14 5.4 9.5% 50% 0 40.5% 67% 33%
N 50% steam/25% air gasification 0.36 5.4 25% 50% 0 25% 55.5% 44.5%
Air blown
with addition
of CO2
O 25% CO2/2.5% air gasification 0.04 0 2.5% 0 25% 72.5% 72% 28%
P 25% CO2/9.5% air gasification 0.14 0 9.5% 0 25% 65.5% 67% 33%
Q 25% CO2/25% air gasification 0.36 0 25% 0 25% 50% 55.5% 44.5%
R 25% CO2/75% air gasification 1.09 0 75% 0 25% 0 18.5% 81.5%
Air blown
with
simultaneous
addition of
steam and
CO2
S 25% steam/25% CO2
gasification 0 2.7 0 25% 25% 50% 74% 26%
T 25% steam/25% CO2/2.5% air
gasification 0.04 2.7 2.5% 25% 25% 47.5% 72% 28%
U 25% steam/25% CO2/9.5% air
gasification 0.14 2.7 9.5% 25% 25% 40.5% 67% 33%
V 25% steam/25% CO2/25% air
gasification 0.36 2.7 25% 25% 25% 25% 55.5% 44.5%
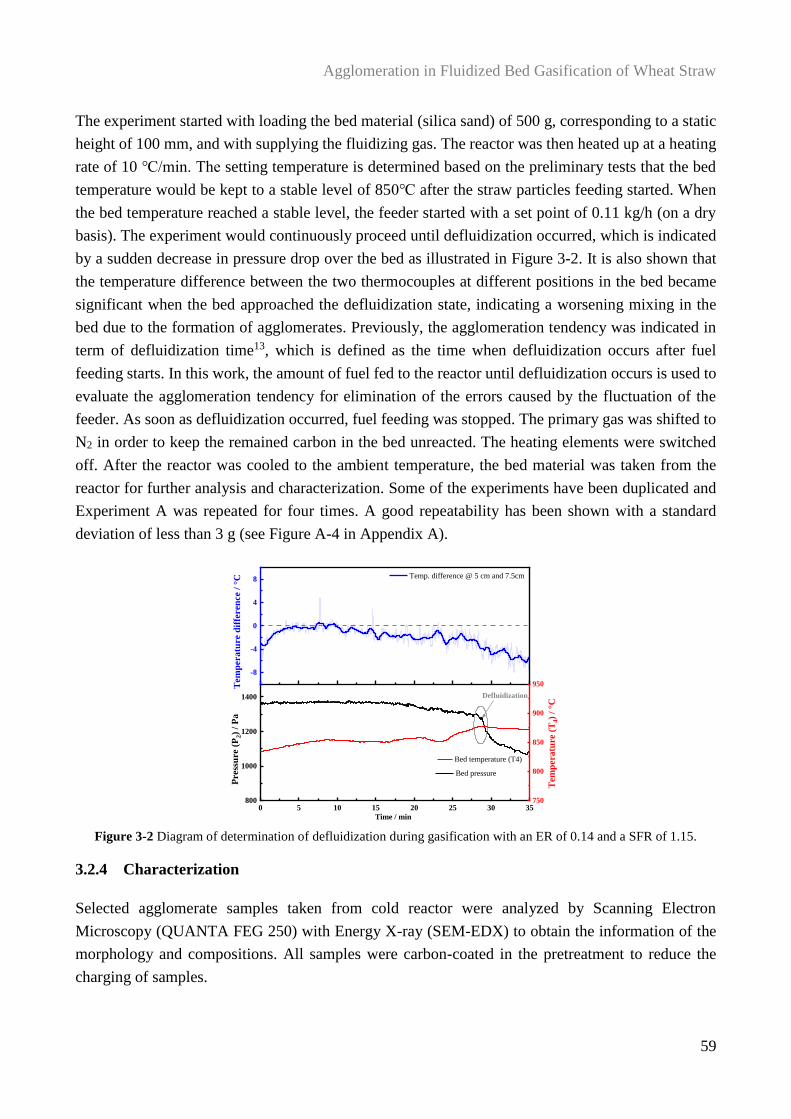
Agglomeration in Fluidized Bed Gasification of Wheat Straw
59
The experiment started with loading the bed material (silica sand) of 500 g, corresponding to a static
height of 100 mm, and with supplying the fluidizing gas. The reactor was then heated up at a heating
rate of 10 ℃/min. The setting temperature is determined based on the preliminary tests that the bed
temperature would be kept to a stable level of 850℃ after the straw particles feeding started. When
the bed temperature reached a stable level, the feeder started with a set point of 0.11 kg/h (on a dry
basis). The experiment would continuously proceed until defluidization occurred, which is indicated
by a sudden decrease in pressure drop over the bed as illustrated in Figure 3-2. It is also shown that
the temperature difference between the two thermocouples at different positions in the bed became
significant when the bed approached the defluidization state, indicating a worsening mixing in the
bed due to the formation of agglomerates. Previously, the agglomeration tendency was indicated in
term of defluidization time13, which is defined as the time when defluidization occurs after fuel
feeding starts. In this work, the amount of fuel fed to the reactor until defluidization occurs is used to
evaluate the agglomeration tendency for elimination of the errors caused by the fluctuation of the
feeder. As soon as defluidization occurred, fuel feeding was stopped. The primary gas was shifted to
N2 in order to keep the remained carbon in the bed unreacted. The heating elements were switched
off. After the reactor was cooled to the ambient temperature, the bed material was taken from the
reactor for further analysis and characterization. Some of the experiments have been duplicated and
Experiment A was repeated for four times. A good repeatability has been shown with a standard
deviation of less than 3 g (see Figure A-4 in Appendix A).
Figure 3-2 Diagram of determination of defluidization during gasification with an ER of 0.14 and a SFR of 1.15.
3.2.4 Characterization
Selected agglomerate samples taken from cold reactor were analyzed by Scanning Electron
Microscopy (QUANTA FEG 250) with Energy X-ray (SEM-EDX) to obtain the information of the
morphology and compositions. All samples were carbon-coated in the pretreatment to reduce the
charging of samples.
0 5 10 15 20 25 30 35800
1000
1200
1400
-8
-4
0
4
8
Tem
pera
ture (
T4)
/ °C
Press
ure (
P2)
/ P
a
Time / min
Bed pressure
Defluidization
Tem
pera
ture d
iffe
ren
ce /
°C Temp. difference @ 5 cm and 7.5cm
750
800
850
900
950
Bed temperature (T4)
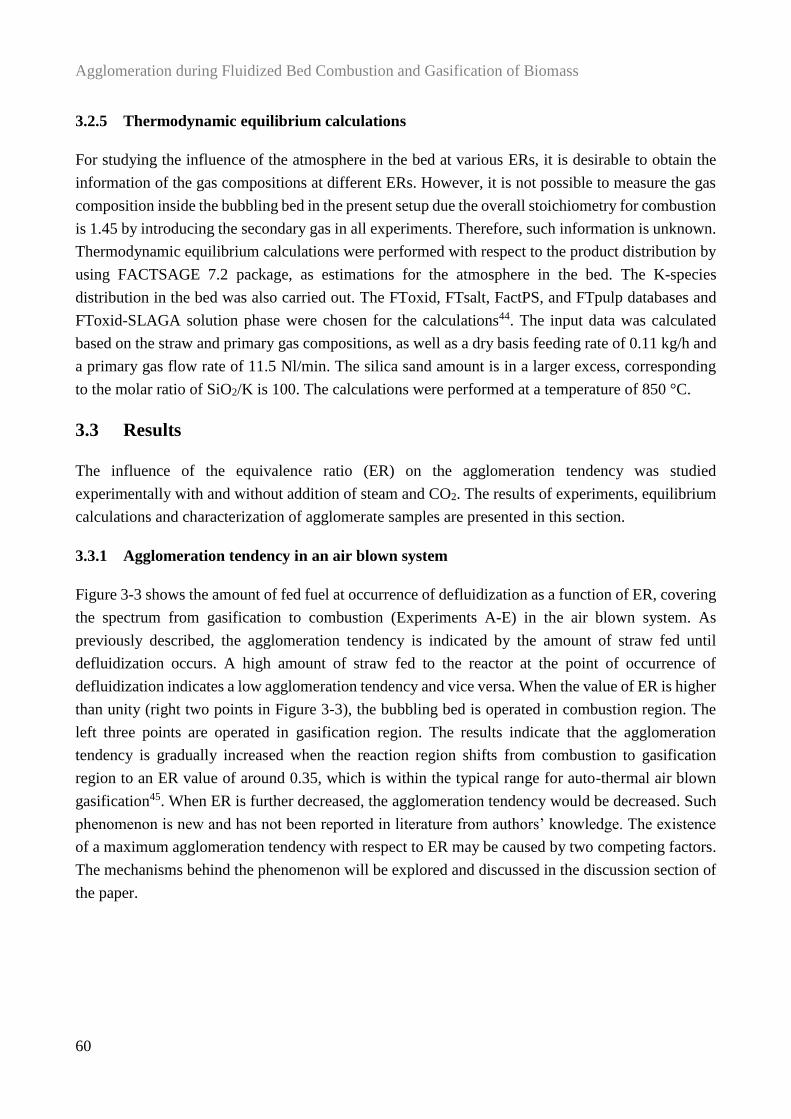
Agglomeration during Fluidized Bed Combustion and Gasification of Biomass
60
3.2.5 Thermodynamic equilibrium calculations
For studying the influence of the atmosphere in the bed at various ERs, it is desirable to obtain the
information of the gas compositions at different ERs. However, it is not possible to measure the gas
composition inside the bubbling bed in the present setup due the overall stoichiometry for combustion
is 1.45 by introducing the secondary gas in all experiments. Therefore, such information is unknown.
Thermodynamic equilibrium calculations were performed with respect to the product distribution by
using FACTSAGE 7.2 package, as estimations for the atmosphere in the bed. The K-species
distribution in the bed was also carried out. The FToxid, FTsalt, FactPS, and FTpulp databases and
FToxid-SLAGA solution phase were chosen for the calculations44. The input data was calculated
based on the straw and primary gas compositions, as well as a dry basis feeding rate of 0.11 kg/h and
a primary gas flow rate of 11.5 Nl/min. The silica sand amount is in a larger excess, corresponding
to the molar ratio of SiO2/K is 100. The calculations were performed at a temperature of 850 °C.
3.3 Results
The influence of the equivalence ratio (ER) on the agglomeration tendency was studied
experimentally with and without addition of steam and CO2. The results of experiments, equilibrium
calculations and characterization of agglomerate samples are presented in this section.
3.3.1 Agglomeration tendency in an air blown system
Figure 3-3 shows the amount of fed fuel at occurrence of defluidization as a function of ER, covering
the spectrum from gasification to combustion (Experiments A-E) in the air blown system. As
previously described, the agglomeration tendency is indicated by the amount of straw fed until
defluidization occurs. A high amount of straw fed to the reactor at the point of occurrence of
defluidization indicates a low agglomeration tendency and vice versa. When the value of ER is higher
than unity (right two points in Figure 3-3), the bubbling bed is operated in combustion region. The
left three points are operated in gasification region. The results indicate that the agglomeration
tendency is gradually increased when the reaction region shifts from combustion to gasification
region to an ER value of around 0.35, which is within the typical range for auto-thermal air blown
gasification45. When ER is further decreased, the agglomeration tendency would be decreased. Such
phenomenon is new and has not been reported in literature from authors’ knowledge. The existence
of a maximum agglomeration tendency with respect to ER may be caused by two competing factors.
The mechanisms behind the phenomenon will be explored and discussed in the discussion section of
the paper.
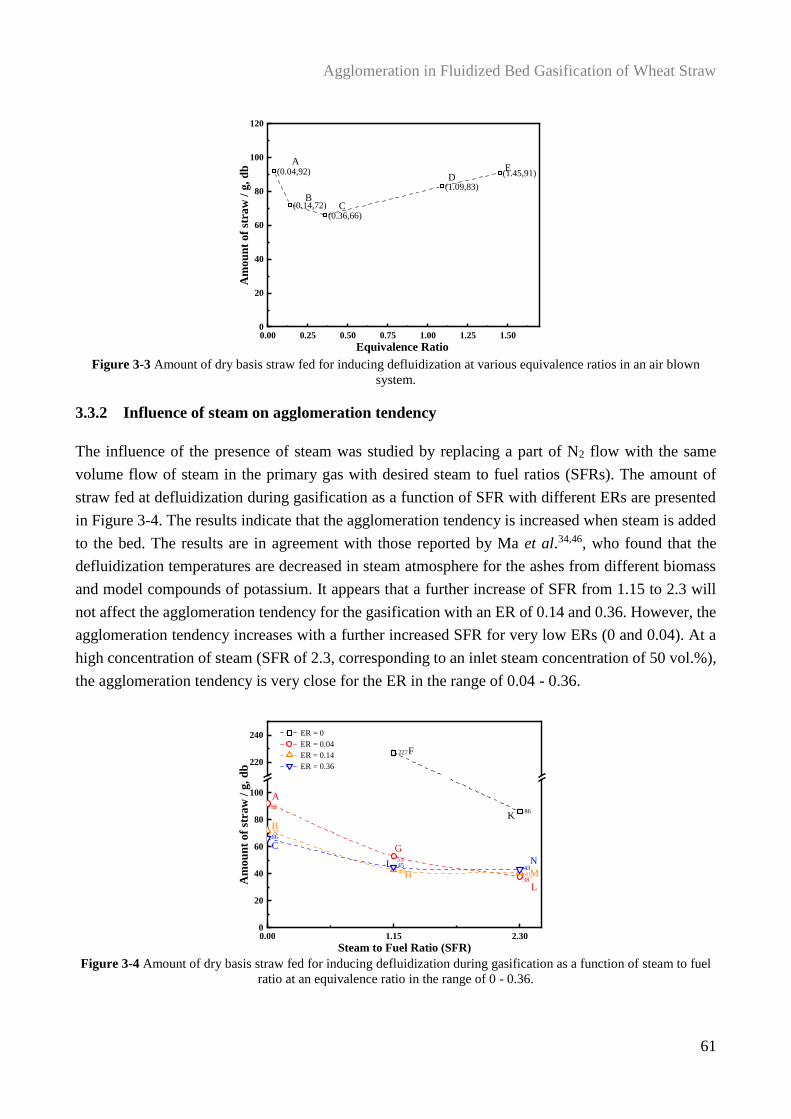
Agglomeration in Fluidized Bed Gasification of Wheat Straw
61
Figure 3-3 Amount of dry basis straw fed for inducing defluidization at various equivalence ratios in an air blown
system.
3.3.2 Influence of steam on agglomeration tendency
The influence of the presence of steam was studied by replacing a part of N2 flow with the same
volume flow of steam in the primary gas with desired steam to fuel ratios (SFRs). The amount of
straw fed at defluidization during gasification as a function of SFR with different ERs are presented
in Figure 3-4. The results indicate that the agglomeration tendency is increased when steam is added
to the bed. The results are in agreement with those reported by Ma et al.34,46, who found that the
defluidization temperatures are decreased in steam atmosphere for the ashes from different biomass
and model compounds of potassium. It appears that a further increase of SFR from 1.15 to 2.3 will
not affect the agglomeration tendency for the gasification with an ER of 0.14 and 0.36. However, the
agglomeration tendency increases with a further increased SFR for very low ERs (0 and 0.04). At a
high concentration of steam (SFR of 2.3, corresponding to an inlet steam concentration of 50 vol.%),
the agglomeration tendency is very close for the ER in the range of 0.04 - 0.36.
Figure 3-4 Amount of dry basis straw fed for inducing defluidization during gasification as a function of steam to fuel
ratio at an equivalence ratio in the range of 0 - 0.36.
0.00 0.25 0.50 0.75 1.00 1.25 1.500
20
40
60
80
100
120
(0.04,92)
(0.14,72)(0.36,66)
(1.09,83)
(1.45,91)
Am
ou
nt
of
stra
w /
g,
db
Equivalence Ratio
A
D
CB
E
0.00 1.15 2.300
20
40
60
80
100
220
240
227
8692
53
38
72
43 41
66
45 43
Am
ou
nt
of
stra
w /
g,
db
Steam to Fuel Ratio (SFR)
ER = 0
ER = 0.04
ER = 0.14
ER = 0.36
A
B
C G
F
HI
K
L
M
N
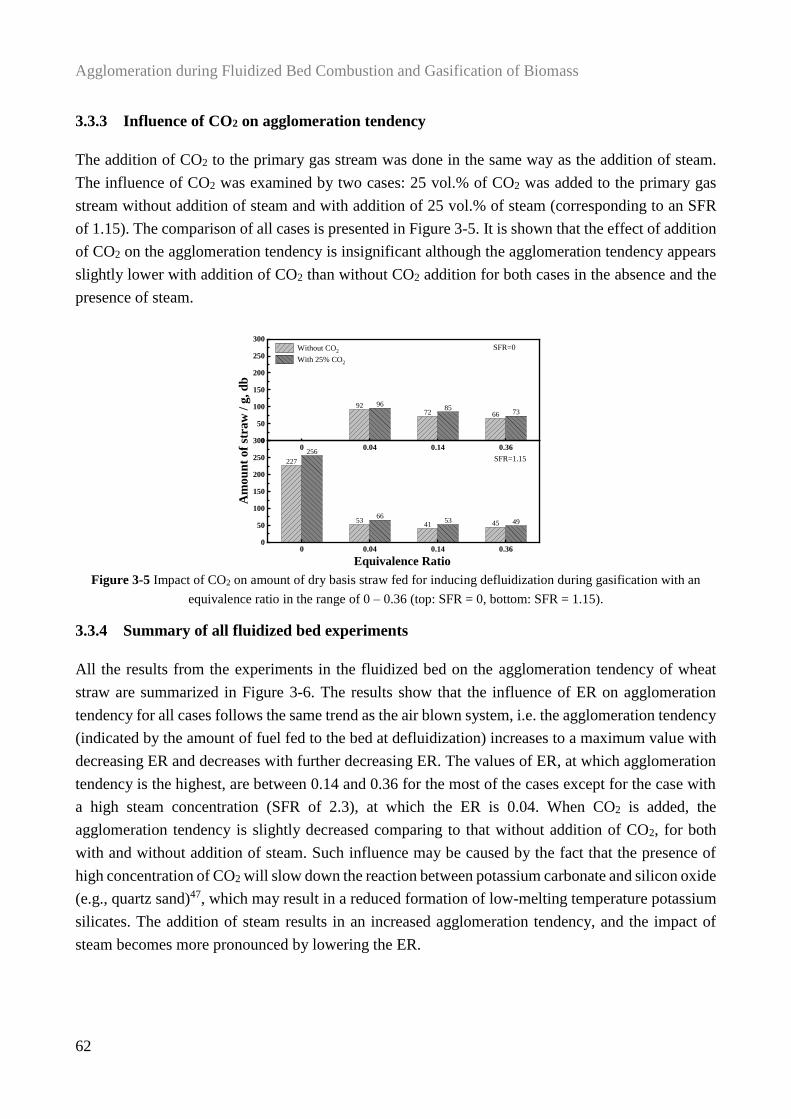
Agglomeration during Fluidized Bed Combustion and Gasification of Biomass
62
3.3.3 Influence of CO2 on agglomeration tendency
The addition of CO2 to the primary gas stream was done in the same way as the addition of steam.
The influence of CO2 was examined by two cases: 25 vol.% of CO2 was added to the primary gas
stream without addition of steam and with addition of 25 vol.% of steam (corresponding to an SFR
of 1.15). The comparison of all cases is presented in Figure 3-5. It is shown that the effect of addition
of CO2 on the agglomeration tendency is insignificant although the agglomeration tendency appears
slightly lower with addition of CO2 than without CO2 addition for both cases in the absence and the
presence of steam.
Figure 3-5 Impact of CO2 on amount of dry basis straw fed for inducing defluidization during gasification with an
equivalence ratio in the range of 0 – 0.36 (top: SFR = 0, bottom: SFR = 1.15).
3.3.4 Summary of all fluidized bed experiments
All the results from the experiments in the fluidized bed on the agglomeration tendency of wheat
straw are summarized in Figure 3-6. The results show that the influence of ER on agglomeration
tendency for all cases follows the same trend as the air blown system, i.e. the agglomeration tendency
(indicated by the amount of fuel fed to the bed at defluidization) increases to a maximum value with
decreasing ER and decreases with further decreasing ER. The values of ER, at which agglomeration
tendency is the highest, are between 0.14 and 0.36 for the most of the cases except for the case with
a high steam concentration (SFR of 2.3), at which the ER is 0.04. When CO2 is added, the
agglomeration tendency is slightly decreased comparing to that without addition of CO2, for both
with and without addition of steam. Such influence may be caused by the fact that the presence of
high concentration of CO2 will slow down the reaction between potassium carbonate and silicon oxide
(e.g., quartz sand)47, which may result in a reduced formation of low-melting temperature potassium
silicates. The addition of steam results in an increased agglomeration tendency, and the impact of
steam becomes more pronounced by lowering the ER.
9272 66
8396
8573
85
227
5341 45
256
6653 49
0 0.04 0.14 0.360
50
100
150
200
250
300SFR=0 Without CO2
With 25% CO2
Am
ou
nt
of
stra
w /
g,
db
0 0.04 0.14 0.360
50
100
150
200
250
300
SFR=1.15
Equivalence Ratio
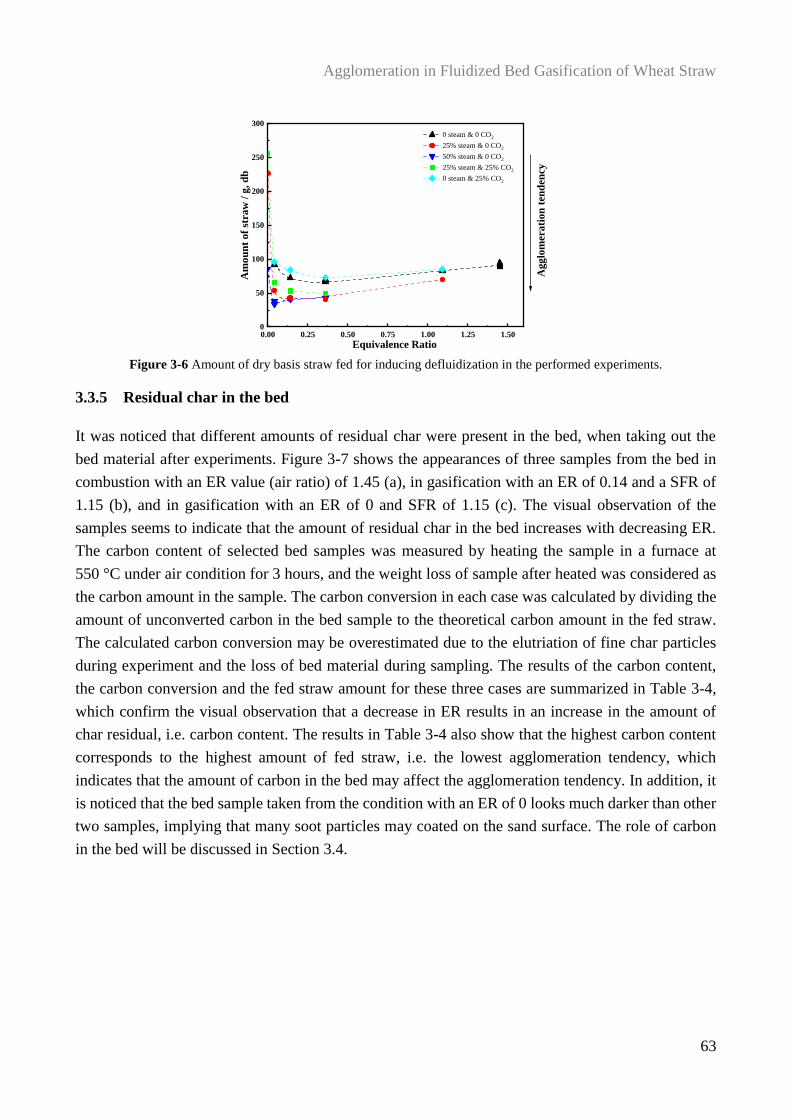
Agglomeration in Fluidized Bed Gasification of Wheat Straw
63
Figure 3-6 Amount of dry basis straw fed for inducing defluidization in the performed experiments.
3.3.5 Residual char in the bed
It was noticed that different amounts of residual char were present in the bed, when taking out the
bed material after experiments. Figure 3-7 shows the appearances of three samples from the bed in
combustion with an ER value (air ratio) of 1.45 (a), in gasification with an ER of 0.14 and a SFR of
1.15 (b), and in gasification with an ER of 0 and SFR of 1.15 (c). The visual observation of the
samples seems to indicate that the amount of residual char in the bed increases with decreasing ER.
The carbon content of selected bed samples was measured by heating the sample in a furnace at
550 °C under air condition for 3 hours, and the weight loss of sample after heated was considered as
the carbon amount in the sample. The carbon conversion in each case was calculated by dividing the
amount of unconverted carbon in the bed sample to the theoretical carbon amount in the fed straw.
The calculated carbon conversion may be overestimated due to the elutriation of fine char particles
during experiment and the loss of bed material during sampling. The results of the carbon content,
the carbon conversion and the fed straw amount for these three cases are summarized in Table 3-4,
which confirm the visual observation that a decrease in ER results in an increase in the amount of
char residual, i.e. carbon content. The results in Table 3-4 also show that the highest carbon content
corresponds to the highest amount of fed straw, i.e. the lowest agglomeration tendency, which
indicates that the amount of carbon in the bed may affect the agglomeration tendency. In addition, it
is noticed that the bed sample taken from the condition with an ER of 0 looks much darker than other
two samples, implying that many soot particles may coated on the sand surface. The role of carbon
in the bed will be discussed in Section 3.4.
0.00 0.25 0.50 0.75 1.00 1.25 1.500
50
100
150
200
250
300
Am
ou
nt
of
stra
w /
g,
db
Equivalence Ratio
0 steam & 0 CO2
25% steam & 0 CO2
50% steam & 0 CO2
25% steam & 25% CO2
0 steam & 25% CO2
Ag
glo
mer
ati
on
ten
den
cy
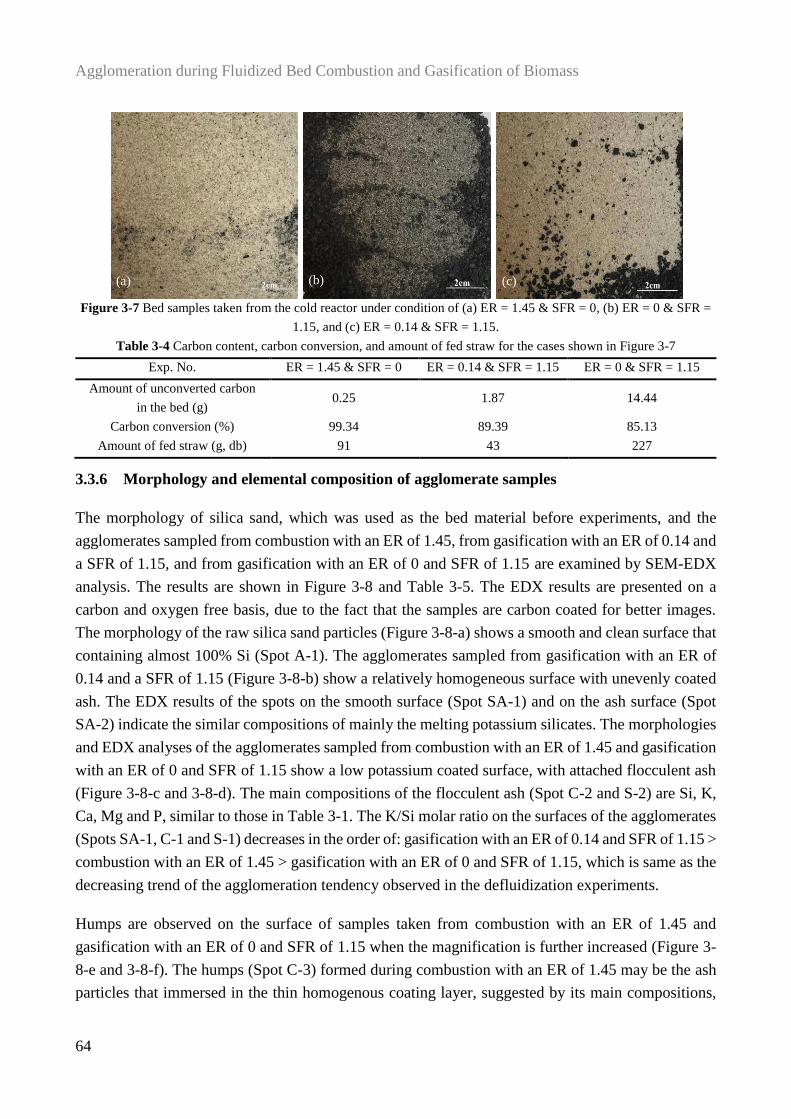
Agglomeration during Fluidized Bed Combustion and Gasification of Biomass
64
Figure 3-7 Bed samples taken from the cold reactor under condition of (a) ER = 1.45 & SFR = 0, (b) ER = 0 & SFR =
1.15, and (c) ER = 0.14 & SFR = 1.15.
Table 3-4 Carbon content, carbon conversion, and amount of fed straw for the cases shown in Figure 3-7
Exp. No. ER = 1.45 & SFR = 0 ER = 0.14 & SFR = 1.15 ER = 0 & SFR = 1.15
Amount of unconverted carbon
in the bed (g) 0.25 1.87 14.44
Carbon conversion (%) 99.34 89.39 85.13
Amount of fed straw (g, db) 91 43 227
3.3.6 Morphology and elemental composition of agglomerate samples
The morphology of silica sand, which was used as the bed material before experiments, and the
agglomerates sampled from combustion with an ER of 1.45, from gasification with an ER of 0.14 and
a SFR of 1.15, and from gasification with an ER of 0 and SFR of 1.15 are examined by SEM-EDX
analysis. The results are shown in Figure 3-8 and Table 3-5. The EDX results are presented on a
carbon and oxygen free basis, due to the fact that the samples are carbon coated for better images.
The morphology of the raw silica sand particles (Figure 3-8-a) shows a smooth and clean surface that
containing almost 100% Si (Spot A-1). The agglomerates sampled from gasification with an ER of
0.14 and a SFR of 1.15 (Figure 3-8-b) show a relatively homogeneous surface with unevenly coated
ash. The EDX results of the spots on the smooth surface (Spot SA-1) and on the ash surface (Spot
SA-2) indicate the similar compositions of mainly the melting potassium silicates. The morphologies
and EDX analyses of the agglomerates sampled from combustion with an ER of 1.45 and gasification
with an ER of 0 and SFR of 1.15 show a low potassium coated surface, with attached flocculent ash
(Figure 3-8-c and 3-8-d). The main compositions of the flocculent ash (Spot C-2 and S-2) are Si, K,
Ca, Mg and P, similar to those in Table 3-1. The K/Si molar ratio on the surfaces of the agglomerates
(Spots SA-1, C-1 and S-1) decreases in the order of: gasification with an ER of 0.14 and SFR of 1.15 >
combustion with an ER of 1.45 > gasification with an ER of 0 and SFR of 1.15, which is same as the
decreasing trend of the agglomeration tendency observed in the defluidization experiments.
Humps are observed on the surface of samples taken from combustion with an ER of 1.45 and
gasification with an ER of 0 and SFR of 1.15 when the magnification is further increased (Figure 3-
8-e and 3-8-f). The humps (Spot C-3) formed during combustion with an ER of 1.45 may be the ash
particles that immersed in the thin homogenous coating layer, suggested by its main compositions,
(a) (b) (c)
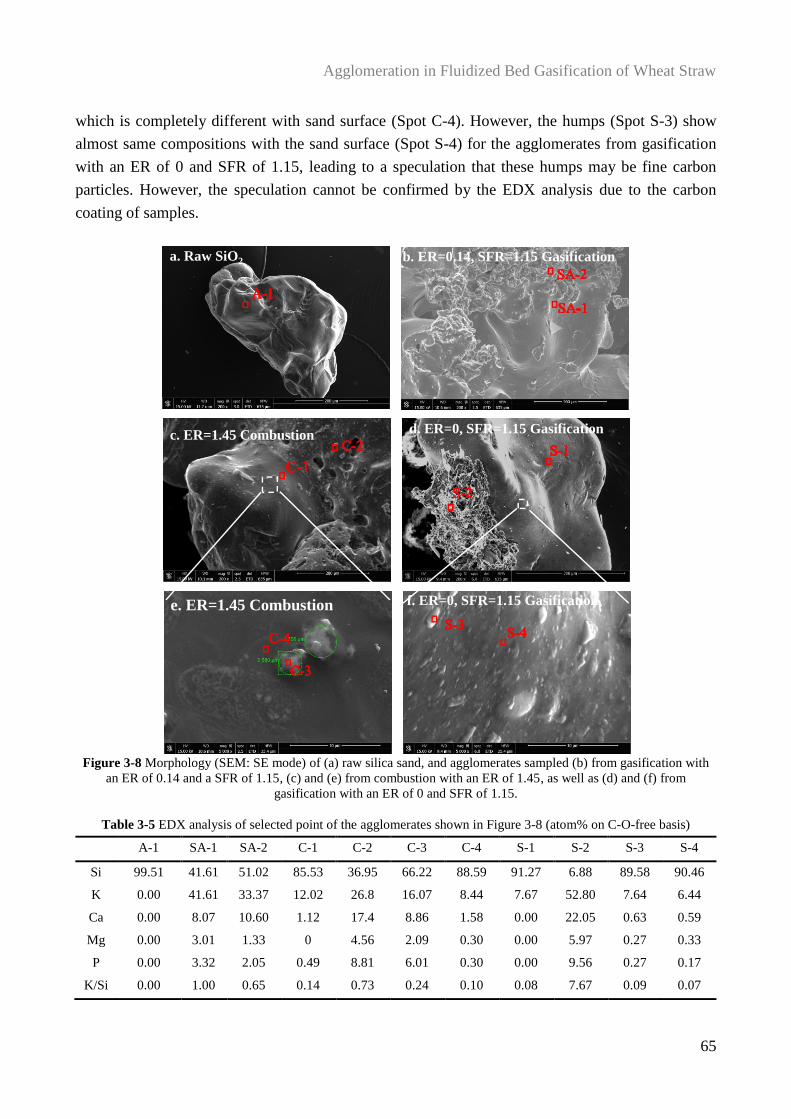
Agglomeration in Fluidized Bed Gasification of Wheat Straw
65
which is completely different with sand surface (Spot C-4). However, the humps (Spot S-3) show
almost same compositions with the sand surface (Spot S-4) for the agglomerates from gasification
with an ER of 0 and SFR of 1.15, leading to a speculation that these humps may be fine carbon
particles. However, the speculation cannot be confirmed by the EDX analysis due to the carbon
coating of samples.
Figure 3-8 Morphology (SEM: SE mode) of (a) raw silica sand, and agglomerates sampled (b) from gasification with
an ER of 0.14 and a SFR of 1.15, (c) and (e) from combustion with an ER of 1.45, as well as (d) and (f) from
gasification with an ER of 0 and SFR of 1.15.
Table 3-5 EDX analysis of selected point of the agglomerates shown in Figure 3-8 (atom% on C-O-free basis)
A-1 SA-1 SA-2 C-1 C-2 C-3 C-4 S-1 S-2 S-3 S-4
Si 99.51 41.61 51.02 85.53 36.95 66.22 88.59 91.27 6.88 89.58 90.46
K 0.00 41.61 33.37 12.02 26.8 16.07 8.44 7.67 52.80 7.64 6.44
Ca 0.00 8.07 10.60 1.12 17.4 8.86 1.58 0.00 22.05 0.63 0.59
Mg 0.00 3.01 1.33 0 4.56 2.09 0.30 0.00 5.97 0.27 0.33
P 0.00 3.32 2.05 0.49 8.81 6.01 0.30 0.00 9.56 0.27 0.17
K/Si 0.00 1.00 0.65 0.14 0.73 0.24 0.10 0.08 7.67 0.09 0.07
c. ER=1.45 Combustion
e. ER=1.45 Combustion
a. Raw SiO2 b. ER=0.14, SFR=1.15 Gasification
d. ER=0, SFR=1.15 Gasification
f. ER=0, SFR=1.15 Gasification
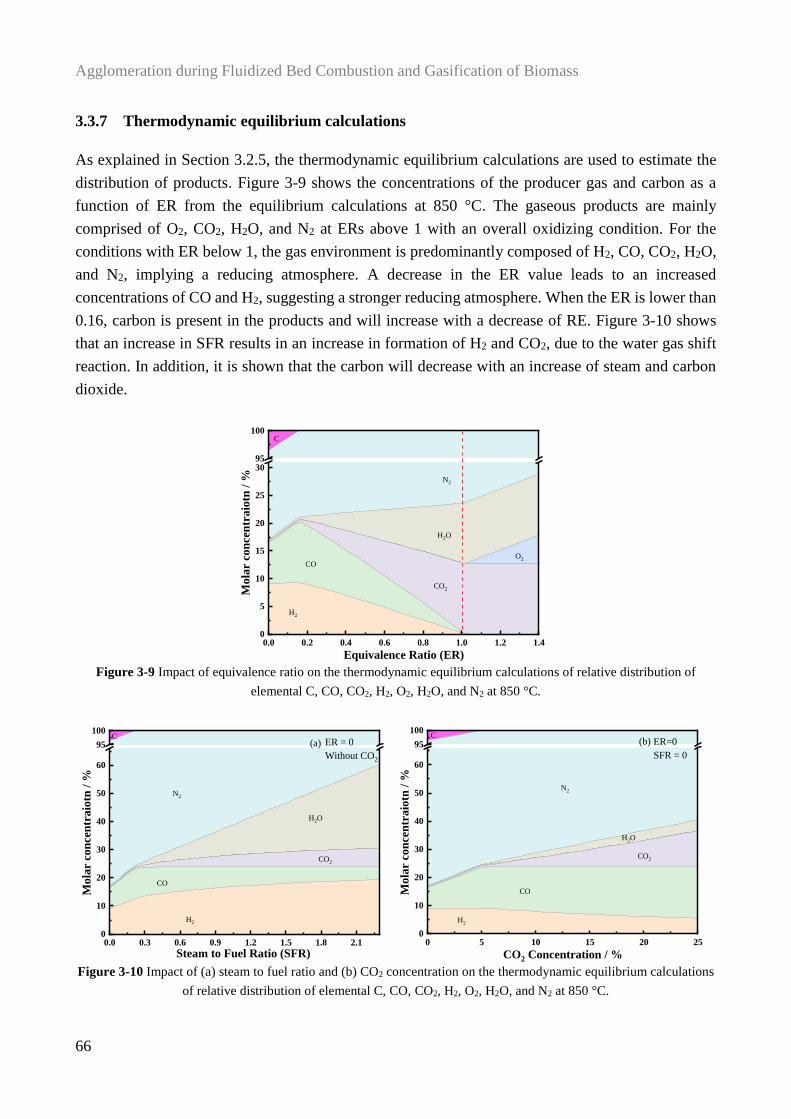
Agglomeration during Fluidized Bed Combustion and Gasification of Biomass
66
3.3.7 Thermodynamic equilibrium calculations
As explained in Section 3.2.5, the thermodynamic equilibrium calculations are used to estimate the
distribution of products. Figure 3-9 shows the concentrations of the producer gas and carbon as a
function of ER from the equilibrium calculations at 850 °C. The gaseous products are mainly
comprised of O2, CO2, H2O, and N2 at ERs above 1 with an overall oxidizing condition. For the
conditions with ER below 1, the gas environment is predominantly composed of H2, CO, CO2, H2O,
and N2, implying a reducing atmosphere. A decrease in the ER value leads to an increased
concentrations of CO and H2, suggesting a stronger reducing atmosphere. When the ER is lower than
0.16, carbon is present in the products and will increase with a decrease of RE. Figure 3-10 shows
that an increase in SFR results in an increase in formation of H2 and CO2, due to the water gas shift
reaction. In addition, it is shown that the carbon will decrease with an increase of steam and carbon
dioxide.
Figure 3-9 Impact of equivalence ratio on the thermodynamic equilibrium calculations of relative distribution of
elemental C, CO, CO2, H2, O2, H2O, and N2 at 850 °C.
Figure 3-10 Impact of (a) steam to fuel ratio and (b) CO2 concentration on the thermodynamic equilibrium calculations
of relative distribution of elemental C, CO, CO2, H2, O2, H2O, and N2 at 850 °C.
0.0 0.2 0.4 0.6 0.8 1.0 1.2 1.40
5
10
15
20
25
3095
100
Mo
lar
con
cen
tra
iotn
/ %
Equivalence Ratio (ER)
H2
CO
CO2
H2O
O2
C
N2
0.0 0.3 0.6 0.9 1.2 1.5 1.8 2.10
10
20
30
40
50
60
95
100
Mo
lar
con
cen
tra
iotn
/ %
Steam to Fuel Ratio (SFR)
H2
CO
CO2
H2O
CER = 0
Without CO2
(a)
N2
0 5 10 15 20 250
10
20
30
40
50
60
95
100
Mo
lar
con
cen
tra
iotn
/ %
CO2 Concentration / %
H2
CO
CO2
H2O
CER=0
SFR = 0
(b)
N2
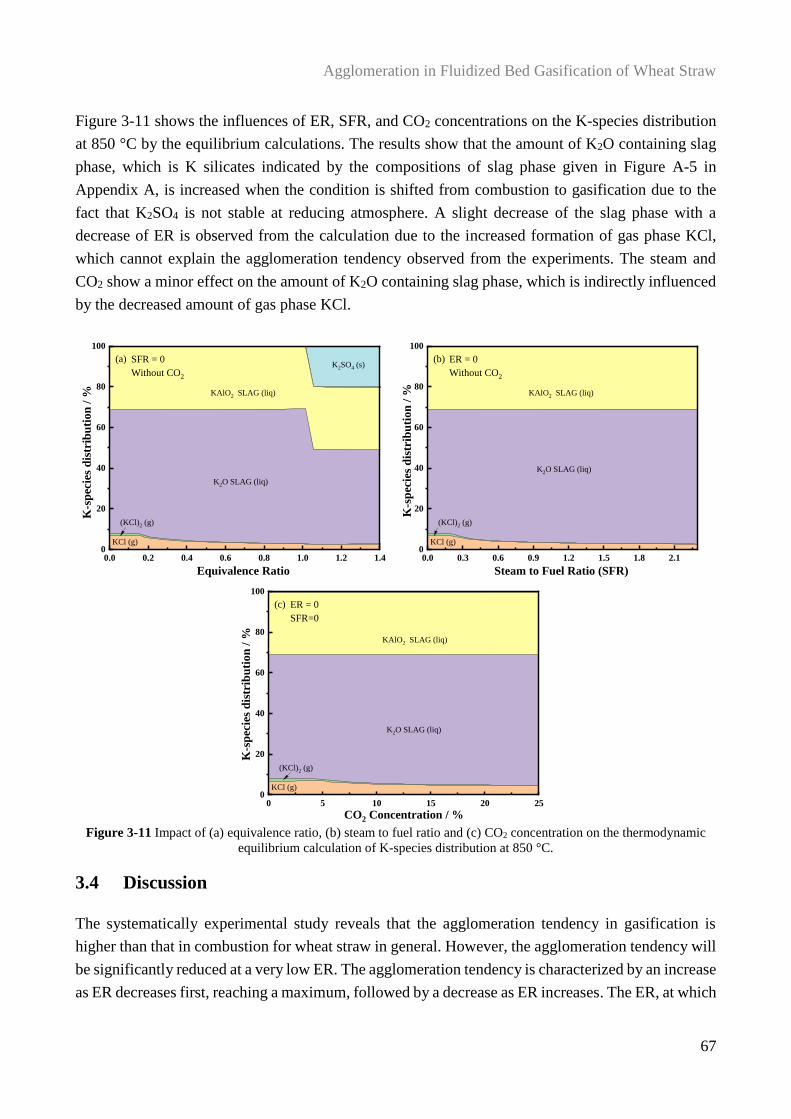
Agglomeration in Fluidized Bed Gasification of Wheat Straw
67
Figure 3-11 shows the influences of ER, SFR, and CO2 concentrations on the K-species distribution
at 850 °C by the equilibrium calculations. The results show that the amount of K2O containing slag
phase, which is K silicates indicated by the compositions of slag phase given in Figure A-5 in
Appendix A, is increased when the condition is shifted from combustion to gasification due to the
fact that K2SO4 is not stable at reducing atmosphere. A slight decrease of the slag phase with a
decrease of ER is observed from the calculation due to the increased formation of gas phase KCl,
which cannot explain the agglomeration tendency observed from the experiments. The steam and
CO2 show a minor effect on the amount of K2O containing slag phase, which is indirectly influenced
by the decreased amount of gas phase KCl.
Figure 3-11 Impact of (a) equivalence ratio, (b) steam to fuel ratio and (c) CO2 concentration on the thermodynamic
equilibrium calculation of K-species distribution at 850 °C.
3.4 Discussion
The systematically experimental study reveals that the agglomeration tendency in gasification is
higher than that in combustion for wheat straw in general. However, the agglomeration tendency will
be significantly reduced at a very low ER. The agglomeration tendency is characterized by an increase
as ER decreases first, reaching a maximum, followed by a decrease as ER increases. The ER, at which
0.0 0.2 0.4 0.6 0.8 1.0 1.2 1.40
20
40
60
80
100
K2SO4 (s)
KAlO2 SLAG (liq)
K2O SLAG (liq)
KCl (g)
Equivalence Ratio
K-s
pec
ies
dis
trib
uti
on
/ %
(a) SFR = 0
Without CO2
(KCl)2 (g)
0.0 0.3 0.6 0.9 1.2 1.5 1.8 2.10
20
40
60
80
100
KAlO2 SLAG (liq)
KCl (g)
Steam to Fuel Ratio (SFR)
K-s
pec
ies
dis
trib
uti
on
/ %
(b) ER = 0
Without CO2
(KCl)2 (g)
K2O SLAG (liq)
0 5 10 15 20 250
20
40
60
80
100
KCl (g)
CO2 Concentration / %
K-s
pec
ies
dis
trib
uti
on
/ %
(c) ER = 0
SFR=0
(KCl)2 (g)
KAlO2 SLAG (liq)
K2O SLAG (liq)
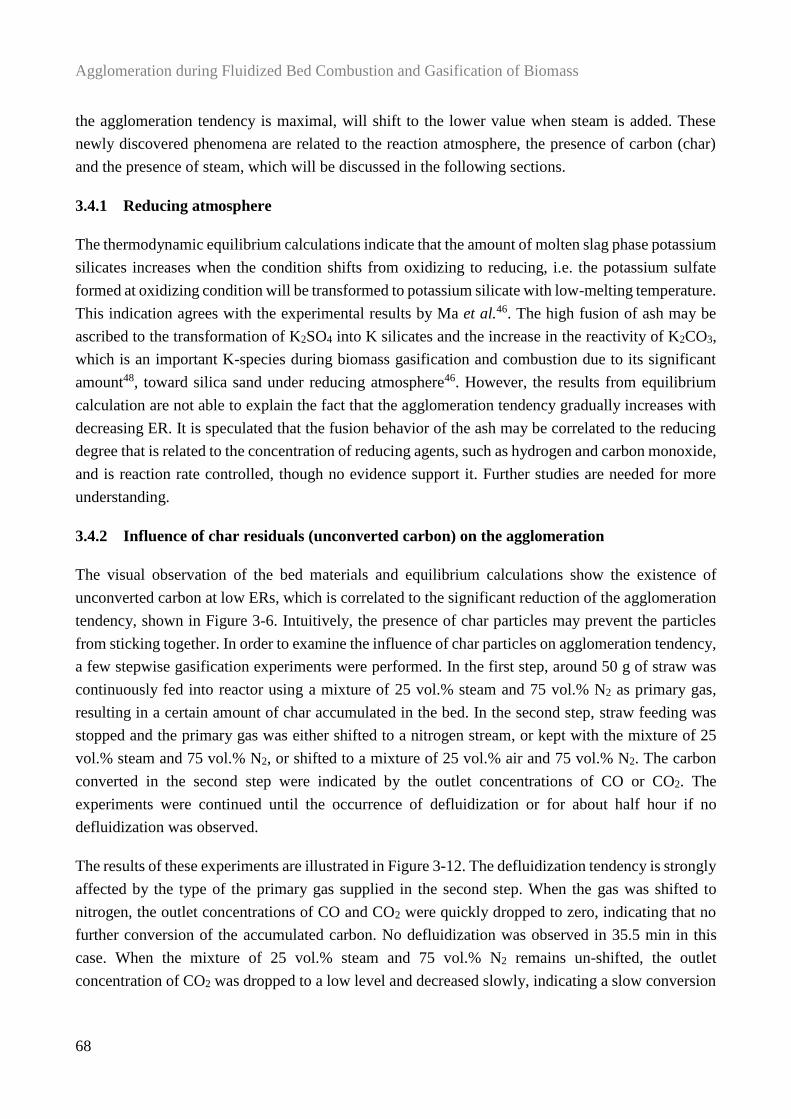
Agglomeration during Fluidized Bed Combustion and Gasification of Biomass
68
the agglomeration tendency is maximal, will shift to the lower value when steam is added. These
newly discovered phenomena are related to the reaction atmosphere, the presence of carbon (char)
and the presence of steam, which will be discussed in the following sections.
3.4.1 Reducing atmosphere
The thermodynamic equilibrium calculations indicate that the amount of molten slag phase potassium
silicates increases when the condition shifts from oxidizing to reducing, i.e. the potassium sulfate
formed at oxidizing condition will be transformed to potassium silicate with low-melting temperature.
This indication agrees with the experimental results by Ma et al.46. The high fusion of ash may be
ascribed to the transformation of K2SO4 into K silicates and the increase in the reactivity of K2CO3,
which is an important K-species during biomass gasification and combustion due to its significant
amount48, toward silica sand under reducing atmosphere46. However, the results from equilibrium
calculation are not able to explain the fact that the agglomeration tendency gradually increases with
decreasing ER. It is speculated that the fusion behavior of the ash may be correlated to the reducing
degree that is related to the concentration of reducing agents, such as hydrogen and carbon monoxide,
and is reaction rate controlled, though no evidence support it. Further studies are needed for more
understanding.
3.4.2 Influence of char residuals (unconverted carbon) on the agglomeration
The visual observation of the bed materials and equilibrium calculations show the existence of
unconverted carbon at low ERs, which is correlated to the significant reduction of the agglomeration
tendency, shown in Figure 3-6. Intuitively, the presence of char particles may prevent the particles
from sticking together. In order to examine the influence of char particles on agglomeration tendency,
a few stepwise gasification experiments were performed. In the first step, around 50 g of straw was
continuously fed into reactor using a mixture of 25 vol.% steam and 75 vol.% N2 as primary gas,
resulting in a certain amount of char accumulated in the bed. In the second step, straw feeding was
stopped and the primary gas was either shifted to a nitrogen stream, or kept with the mixture of 25
vol.% steam and 75 vol.% N2, or shifted to a mixture of 25 vol.% air and 75 vol.% N2. The carbon
converted in the second step were indicated by the outlet concentrations of CO or CO2. The
experiments were continued until the occurrence of defluidization or for about half hour if no
defluidization was observed.
The results of these experiments are illustrated in Figure 3-12. The defluidization tendency is strongly
affected by the type of the primary gas supplied in the second step. When the gas was shifted to
nitrogen, the outlet concentrations of CO and CO2 were quickly dropped to zero, indicating that no
further conversion of the accumulated carbon. No defluidization was observed in 35.5 min in this
case. When the mixture of 25 vol.% steam and 75 vol.% N2 remains un-shifted, the outlet
concentration of CO2 was dropped to a low level and decreased slowly, indicating a slow conversion
Agglomeration in Fluidized Bed Gasification of Wheat Straw
69
of accumulated carbon. The defluidization occurred in 7 min when the carbon content in the bed is
low in this case. Once the primary gas was shifted to a mixture of 25 vol.% air and 75 vol.% N2, the
defluidization occurred in 2 min accompanied by a fast conversion of the carbon in the bed. During
the gas stream sifting, the bed temperature was kept unchanged, indicating that the occurrence of
defluidization is caused by reduction of the carbon content in the bed. These results confirm that the
accumulated char in the bed could inhibit the agglomeration process. It has been reported that the
presence of residual carbon in the ash can significantly increase of the fusion temperatures and reduce
the melting flow behaviors of biomass ash49 and coal ash50. In addition, the occurrence of adhesion
of carbon onto bed solids, indicated by the SEM image in Figure 3-8, may inhibit the formation of
agglomerates upon the interaction between ash and bed material.
Figure 3-12 Bed temperature (T4), bed pressure (P2) and the concentrations of CO and CO2 in flue gas during stepwise
gasification.
3.4.3 Effect of steam
The experimental results in Figure 3-4 show that the presence of a high concentration of steam
promotes the agglomeration tendency. This is partly due to the enhanced gasification rate at low ERs,
leading to the low carbon content. Another reason may be caused by the effect of steam on the
viscosity of the molten phase. It was reported that the presence of steam (water vapor) can
significantly affect the viscosity of the coal ash slag from gasification51–53. The SEM-EDX analysis
in Figure 3-8 shows the significant amount of potassium silicate melting on the surface sand from
combustion and gasification. Experiments were performed to exam the effect of steam on the fusion
behaviors of potassium silicates (K2Si4O9). The K2Si4O9 pellets with the mass of around 1 g were
0 5 10 15 20 25 30 35 40 45 50 55 600
400
800
1200
16000
400
800
1200
16000
400
800
1200
1600
Time / min
Defludization
Defludization
Bed
press
ure (
P2)
/ P
a &
Tem
pera
ture (
T4)
/ C
Temperature
Pressure
Step 1: Contionously biomass gasification 48g
Step 1: Contionously biomass gasification 50g
Step 2: Char gasification with 25 % steam
Step 2: Char gasification with 25 % air
Step 1: Contionously biomass gasification 47g Step 2: Continuous introducing of N2
0
3
6
9
12
0
3
6
9
12
CO
& C
O2 C
on
cen
tra
tio
n /
%
0
3
6
9
12
CO2
CO
25% steam- 100% N2
25% steam- 25% steam
25% steam-25% air
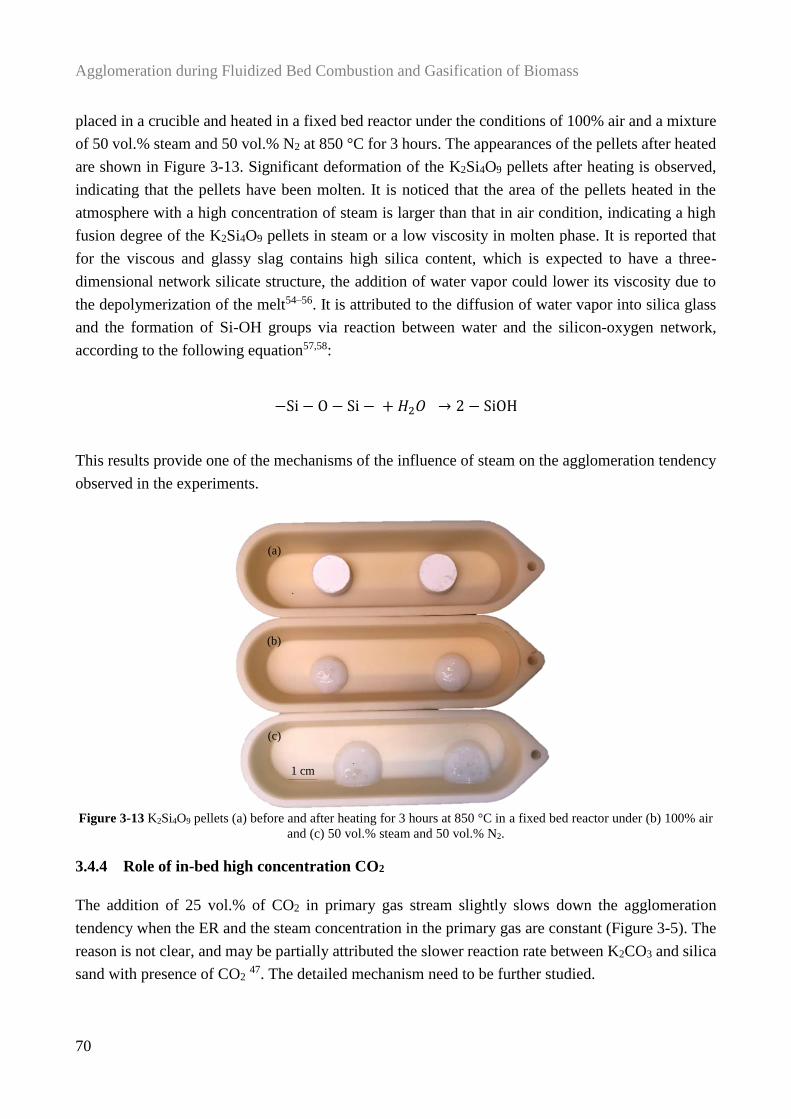
Agglomeration during Fluidized Bed Combustion and Gasification of Biomass
70
placed in a crucible and heated in a fixed bed reactor under the conditions of 100% air and a mixture
of 50 vol.% steam and 50 vol.% N2 at 850 °C for 3 hours. The appearances of the pellets after heated
are shown in Figure 3-13. Significant deformation of the K2Si4O9 pellets after heating is observed,
indicating that the pellets have been molten. It is noticed that the area of the pellets heated in the
atmosphere with a high concentration of steam is larger than that in air condition, indicating a high
fusion degree of the K2Si4O9 pellets in steam or a low viscosity in molten phase. It is reported that
for the viscous and glassy slag contains high silica content, which is expected to have a three-
dimensional network silicate structure, the addition of water vapor could lower its viscosity due to
the depolymerization of the melt54–56. It is attributed to the diffusion of water vapor into silica glass
and the formation of Si-OH groups via reaction between water and the silicon-oxygen network,
according to the following equation57,58:
−Si − O − Si − + 𝐻2𝑂 → 2 − SiOH
This results provide one of the mechanisms of the influence of steam on the agglomeration tendency
observed in the experiments.
Figure 3-13 K2Si4O9 pellets (a) before and after heating for 3 hours at 850 °C in a fixed bed reactor under (b) 100% air
and (c) 50 vol.% steam and 50 vol.% N2.
3.4.4 Role of in-bed high concentration CO2
The addition of 25 vol.% of CO2 in primary gas stream slightly slows down the agglomeration
tendency when the ER and the steam concentration in the primary gas are constant (Figure 3-5). The
reason is not clear, and may be partially attributed the slower reaction rate between K2CO3 and silica
sand with presence of CO2 47. The detailed mechanism need to be further studied.
1 cm
(a)
(b)
(c)
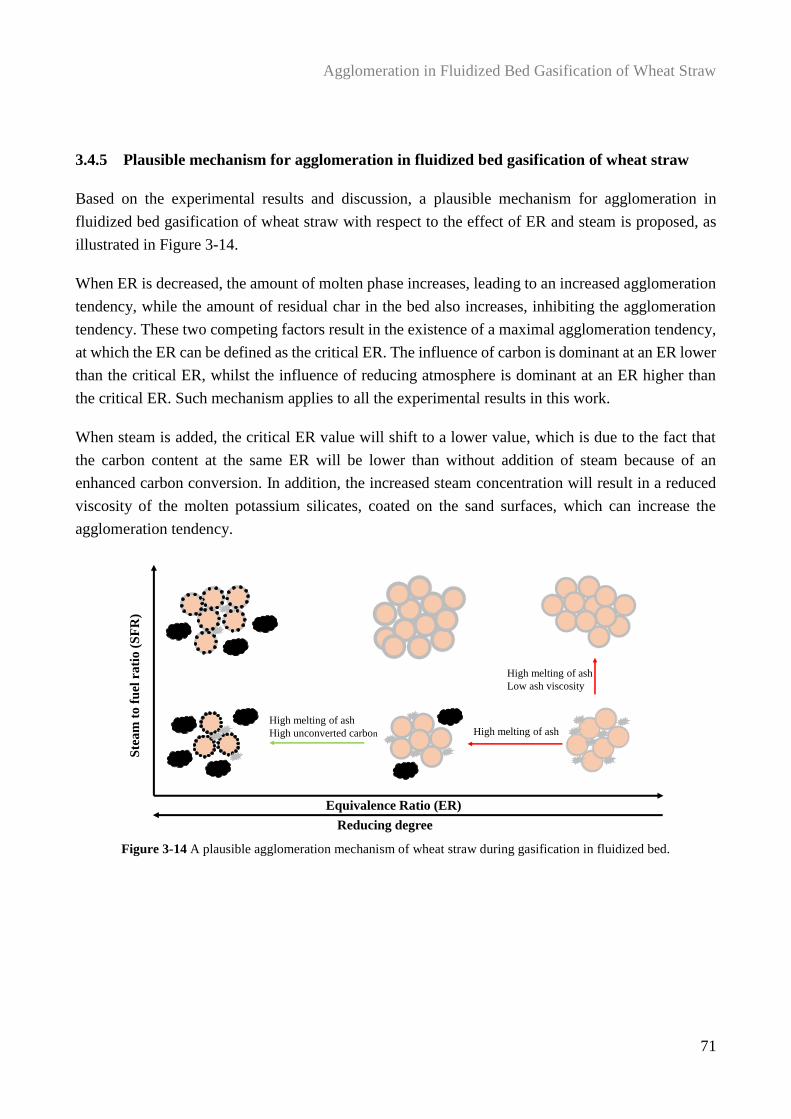
Agglomeration in Fluidized Bed Gasification of Wheat Straw
71
3.4.5 Plausible mechanism for agglomeration in fluidized bed gasification of wheat straw
Based on the experimental results and discussion, a plausible mechanism for agglomeration in
fluidized bed gasification of wheat straw with respect to the effect of ER and steam is proposed, as
illustrated in Figure 3-14.
When ER is decreased, the amount of molten phase increases, leading to an increased agglomeration
tendency, while the amount of residual char in the bed also increases, inhibiting the agglomeration
tendency. These two competing factors result in the existence of a maximal agglomeration tendency,
at which the ER can be defined as the critical ER. The influence of carbon is dominant at an ER lower
than the critical ER, whilst the influence of reducing atmosphere is dominant at an ER higher than
the critical ER. Such mechanism applies to all the experimental results in this work.
When steam is added, the critical ER value will shift to a lower value, which is due to the fact that
the carbon content at the same ER will be lower than without addition of steam because of an
enhanced carbon conversion. In addition, the increased steam concentration will result in a reduced
viscosity of the molten potassium silicates, coated on the sand surfaces, which can increase the
agglomeration tendency.
Figure 3-14 A plausible agglomeration mechanism of wheat straw during gasification in fluidized bed.
Ste
am
to
fu
el r
ati
o (
SF
R)
Equivalence Ratio (ER)
High melting of ashHigh melting of ash
High unconverted carbon
High melting of ash
Low ash viscosity
Reducing degree
Agglomeration during Fluidized Bed Combustion and Gasification of Biomass
72
3.5 Conclusions
Systematic experiments have been conducted in a lab-scale fluidized bed reactor the study the
agglomeration phenomena in biomass gasification with a focus on the effect ER and SFR. The
following conclusions can be drawn from the study:
(1) The agglomeration tendency of wheat straw in fluidized bed is strongly influenced by the ER. The
agglomeration tendency increases first to the maximal tendency with a decrease of ER, and then the
agglomeration tendency decreases with the further deceasing ER. A decrease in ER will result in an
increase both in the degree of reducing atmosphere and the amount of unconverted carbon, which
will promote the agglomeration and mitigate the agglomeration, respectively. The competition
between these two factors results in a maximal agglomeration tendency occurs at a critical ER. A
reducing atmosphere formed during gasification could accelerate the agglomeration probably due to
its promotive effect on the melting tendency of ash. The residual carbon may reduce the fusion
tendency and the melting flow behaviors of the ash, and the carbon attached on the sand surface may
inhibit the agglomeration by preventing the interaction between ash and bed material, thus mitigating
the agglomeration tendency.
(2) The gasification agents affect the agglomeration tendency of wheat straw in the fluidized bed
gasification. The presence of steam in primary gas significantly promotes the agglomeration. The
promoted agglomeration under a high concentration of steam may be attributed to a higher carbon
conversion, i.e. a lower amount of residual carbon, and a lowered ash viscosity induced by water
vapor. An increase in steam concentration will result in a decrease in critical ER value due to a
reduced inhibition effect of residual carbon resulting from a decreased amount of residual carbon.
The addition of CO2 in primary gas slightly mitigates the agglomeration. The detailed mechanism of
influence of CO2 on agglomeration need to be further studied.
Agglomeration in Fluidized Bed Gasification of Wheat Straw
73
Reference
(1) Anthony, E. J. Fluidized Bed Combustion of Alternative Solid Fuels; Status, Successes and
Problems of the Technology. Prog. Energy Combust. Sci. 1995, 21 (3), 239–268.
(2) Khan, A. A.; de Jong, W.; Jansens, P. J.; Spliethoff, H. Biomass Combustion in Fluidized Bed
Boilers: Potential Problems and Remedies. Fuel Process. Technol. 2009, 90 (1), 21–50.
(3) Motta, I. L.; Miranda, N. T.; Maciel Filho, R.; Wolf Maciel, M. R. Biomass Gasification in
Fluidized Beds: A Review of Biomass Moisture Content and Operating Pressure Effects.
Renew. Sustain. Energy Rev. 2018, 94 (May), 998–1023.
(4) Visser, H. J. M.; Hofmans, H.; Huijnen, H.; Kastelein, R.; Kiel, J. H. A. Biomass Ash - Bed
Material Interactions Leading to Agglomeration in Fluidised Bed Combustion and Gasification.
Prog. Thermochem. Biomass Convers. 2008, 272–286.
(5) Öhman, M.; Pommer, L.; Nordin, A. Bed Agglomeration Characteristics and Mechanisms
during Gasification and Combustion of Biomass Fuels. Energy & Fuels 2005, 19 (4), 1742–
1748.
(6) Lin, W.; Jensen, A. D.; Johnsson, J. E.; Dam-Johansen, K. Combustion of Biomass in Fluidized
Beds: Problems and Some Solutions Based on Danish Experiences. In Proceedings of the 17th
International Conference on Fluidized Bed Combustion; American Society of Mechanical
Engineers: Jacksonville, Florida USA, 2003; pp 945–953.
(7) Öhman, M.; Nordin, A.; Skrifvars, B. J.; Backman, R.; Hupa, M. Bed Agglomeration
Characteristics during Fluidized Bed Combustion of Biomass Fuels. Energy & Fuels 2000, 14
(1), 169–178.
(8) Brus, E.; Öhman, M.; Nordin, A. Mechanisms of Bed Agglomeration during Fluidized-Bed
Combustion of Biomass Fuels. Energy & Fuels 2005, 19 (3), 825–832.
(9) Visser, H. J. M. M.; van Lith, S. C.; Kiel, J. H. A. a. Biomass Ash-Bed Material Interactions
Leading to Agglomeration in FBC. J. Energy Resour. Technol. 2008, 130 (1), 1–6.
(10) Chirone, R.; Salatino, P.; Scala, F.; Solimene, R.; Urciuolo, M. Fluidized Bed Combustion of
Pelletized Biomass and Waste-Derived Fuels. Combust. Flame 2008, 155 (1–2), 21–36.
(11) Visser, H. J. M. H. J. M. The Influence of Fuel Composition on Agglomeration Behaviour in
Fluidised-Bed Combustion. ECN Rep. ECN-C–04-054 2004.
(12) Lin, W.; Krusholm, G.; Dam-Johansen, K.; Musahl, E.; Bank, L. Agglomeration Phenomena
in Fluidized Bed Combustion of Straw. In Proceedings of the 14h International Conference
on Fluidized Bed Combustion; American Society of Mechanical Engineers: Canada, 1997; Vol.
2, pp 831–837.
(13) Lin, W.; Dam-Johansen, K.; Frandsen, F. Agglomeration in Bio-Fuel Fired Fluidized Bed
Combustors. Chem. Eng. J. 2003, 96 (1–3), 171–185.
(14) Chaivatamaset, P.; Tia, S. The Characteristics of Bed Agglomeration during Fluidized Bed
Agglomeration during Fluidized Bed Combustion and Gasification of Biomass
74
Combustion of Eucalyptus Bark. Appl. Therm. Eng. 2015, 75, 1134–1146.
(15) Davidsson, K. O.; Åmand, L. E.; Steenari, B. M.; Elled, A. L.; Eskilsson, D.; Leckner, B.
Countermeasures against Alkali-Related Problems during Combustion of Biomass in a
Circulating Fluidized Bed Boiler. Chem. Eng. Sci. 2008, 63 (21), 5314–5329.
(16) De Geyter, S.; Öhman, M.; Boström, D.; Eriksson, M.; Nordin, A. Effects of Non-Quartz
Minerals in Natural Bed Sand on Agglomeration Characteristics during Fluidized Bed
Combustion of Biomass Fuels. Energy & Fuels 2007, 21 (5), 2663–2668.
(17) Davidsson, K. O.; Steenari, B. M.; Eskilsson, D. Kaolin Addition during Biomass Combustion
in a 35 MW Circulating Fluidized-Bed Boiler. Energy & Fuels 2007, 21 (4), 1959–1966.
(18) Morris, J. D.; Sheraz, S.; Chilton, S.; Nimmo, W. Mechanisms and Mitigation of
Agglomeration during Fluidize Bed Combustion of Biomass : A Review. Fuel 2018, 230, 452–
473.
(19) Scala, F. Particle Agglomeration during Fluidized Bed Combustion: Mechanisms, Early
Detection and Possible Countermeasures. Fuel Process. Technol. 2018, 171, 31–38.
(20) Bartels, M.; Lin, W.; Nijenhuis, J.; Kapteijn, F.; van Ommen, J. R. Agglomeration in Fluidized
Beds at High Temperatures: Mechanisms, Detection and Prevention. Prog. Energy Combust.
Sci. 2008, 34 (5), 633–666.
(21) Gatternig, B.; Karl, J. Investigations on the Mechanisms of Ash-Induced Agglomeration in
Fluidized-Bed Combustion of Biomass. Energy & Fuels 2015, 29, 931–941.
(22) Hupa, M. Ash-Related Issues in Fluidized-Bed Combustion of Biomasses : Recent Research
Highlights. Energy & Fuels 2012, 26, 4–14.
(23) Yerushalmi, J.; Kolodney, M.; Graff, R. A.; Squires, A. M.; Harvey, R. D. Agglomeration of
Ash in Fluidized Beds Gasifying Coal: The Godel Phenomenon. Science (80-. ). 1975, 187
(4177), 646–648.
(24) Ergudenler, A.; Ghaly, A. E. Agglomeration of Alumina Sand in a Fluidized Bed Straw
Gasifier at Elevated Temperatures. Bioresour. Technol. 1993, 43 (3), 259–268.
(25) Fryda, L. E.; Panopoulos, K. D.; Kakaras, E. Agglomeration in Fluidised Bed Gasification of
Biomass. Powder Technol. 2008, 181 (3), 307–320.
(26) Seemen, A.; Atong, D.; Sricharoenchaikul, V. Effect of Silica and Alumina Ratio on Bed
Agglomeration during Fluidized Bed Gasification of Rice Straw. Proc. - 2018 2nd Int. Conf.
Green Energy Appl. ICGEA 2018 2018, 268–272.
(27) George, J.; Arun, P.; Muraleedharan, C. Experimental Investigation on Co-Gasification of
Coffee Husk and Sawdust in a Bubbling Fluidised Bed Gasifier. J. Energy Inst. 2019, 92 (6),
1977–1986.
(28) Kittivech, T.; Fukuda, S. Investigating Agglomeration Tendency of Co-Gasification between
High Alkali Biomass and Woody Biomass in a Bubbling Fluidized Bed System. Energies 2020,
Agglomeration in Fluidized Bed Gasification of Wheat Straw
75
13 (56), 1–15.
(29) Zhang, H.; Hao, Z.; Li, J.; Yang, X.; Wang, Z.; Liu, Z.; Huang, J.; Zhang, Y.; Fang, Y. Effect
of Coal Ash Additive on Potassium Fixation and Melting Behaviors of the Mixture under
Simulated Biomass Gasification Condition. Renew. Energy 2021, 168, 806–814.
(30) Zevenhoven-Onderwater, M.; Backman, R.; Skrifvars, B. J.; Hupa, M.; Liliendahl, T.; Rosén,
C.; Sjöström, K.; Engvall, K.; Hallgren, A. The Ash Chemistry in Fluidised Bed Gasification
of Biomass Fuels. Part I: Predicting the Chemistry of Melting Ashes and Ash-Bed Material
Interaction. Fuel 2001, 80 (10), 1489–1502.
(31) Arvelakis, S.; Gehrmann, H.; Beckmann, M.; Koukios, E. G. Agglomeration Problems during
Fluidized Bed Gasification of Olive-Oil Residue : Evaluation of Fractionation and Leaching
as Pre-Treatments. Fuel 2003, 82, 1261–1270.
(32) Zevenhoven-Onderwater, M.; Backman, R.; Skrifvars, B. J.; Hupa, M. The Ash Chemistry in
Fluidised Bed Gasification of Biomass Fuels. Part II: Ash Behaviour Prediction versus Bench
Scale Agglomeration Tests. Fuel 2001, 80 (10), 1503–1512.
(33) Ergudenler, A.; Ghaly, A. E. Agglomeration of Silica Sand in a Fluidized Bed Gasifier
Operating on Wheat Straw. Biomass and Bioenergy 1993, 4 (2), 135–147.
(34) Ma, T.; Fan, C.; Hao, L.; Li, S.; Song, W.; Lin, W. Biomass-Ash-Induced Agglomeration in a
Fluidized Bed. Part 1: Experimental Study on the Effects of a Gas Atmosphere. Energy &
Fuels 2016, 30 (8), 6395–6404.
(35) Nowok, J. W.; Kalmanovitch, D. P.; Benson, A.; Jones, L. Sintering Behaviour and Strength
Development in Various Coal Ashes. Fuel 1990, 69, 1020–1028.
(36) Huffman, G. P.; Huggins, F. E.; Dunmyre, G. R. Investigation of the High-Temperature
Behaviour of Coal Ash in Reducing and Oxidizing Atmospheres. Fuel 1981, 60 (7), 585–597.
(37) Backman, R. Sintering of FBC Ashes. Fuel 1994, 73 (2), 171–176.
(38) Bryant, G. W.; Browning, G. J.; Emanuel, H.; Gupta, S. K.; Gupta, R. P.; Lucas, J. A.; Wall,
T. F. The Fusibility of Blended Coal Ash. 2000, No. 5, 316–325.
(39) Song, W. J.; Tang, L. H.; Zhu, X. D.; Wu, Y. Q.; Zhu, Z. B. Prediction of Chinese Coal Ash
Fusion Temperatures in Ar and H2 Atmospheres. Energy & Fuels 2009, 23, 1990–1997.
(40) Abra, M. G.; Ordin, A. N.; Iliedahl, T. L.; Ao, A. N. R. Experimental Determination of Bed
Agglomeration Tendencies of Some Common Agricultural Residues in Fluidized Bed
Combustion and Gasification. Biomass and Bioenergy 1998, 15 (2), 163–169.
(41) Alauddin, Z. A. B. Z.; Lahijani, P.; Mohammadi, M.; Mohamed, A. R. Gasification of
Lignocellulosic Biomass in Fluidized Beds for Renewable Energy Development: A Review.
Renew. Sustain. Energy Rev. 2010, 14, 2852–2862.
(42) Yao, X.; Hu, Y.; Ge, J.; Ma, X.; Mao, J.; Sun, L.; Xu, K. K.; Xu, K. K. A Comprehensive
Study on Influence of Operating Parameters on Agglomeration of Ashes during Biomass
Agglomeration during Fluidized Bed Combustion and Gasification of Biomass
76
Gasification in a Laboratory-Scale Gasification System. Fuel 2020, 276, 118083.
(43) Xue, G.; Kwapinska, M.; Horvat, A.; Li, Z.; Dooley, S.; Kwapinski, W.; Leahy, J. J.
Gasification of Miscanthus x Giganteus in an Air-Blown Bubbling Fluidized Bed: A
Preliminary Study of Performance and Agglomeration. Energy & Fuels 2014, 28 (2), 1121–
1131.
(44) Aničić, B. Agglomeration Mechanisms during Fluidized Bed Combustion of Biomass,
Technical University of Denmark, 2018.
(45) Arena, U. Fluidized Bed Gasification. In Fluidized Bed Technologies for Near-Zero Emission
Combustion and Gasification; Elsevier Ltd., 2013; pp 765–812.
(46) Ma, T.; Fan, C.; Hao, L.; Li, S.; Jensen, P. A.; Song, W.; Lin, W.; Dam-Johansen, K. Biomass
Ash Induced Agglomeration in Fluidized Bed. Part 2: Effect of Potassium Salts in Different
Gas Composition. Fuel Process. Technol. 2018, 180, 130–139.
(47) Anicic, B.; Lin, W.; Dam-Johansen, K.; Wu, H. Agglomeration Mechanism in Biomass
Fluidized Bed Combustion – Reaction between Potassium Carbonate and Silica Sand. Fuel
Process. Technol. 2018, 173, 182–190.
(48) Tchoffor, P. A.; Davidsson, K. O.; Thunman, H. Transformation and Release of Potassium,
Chlorine, and Sulfur from Wheat Straw under Conditions Relevant to Dual Fluidized Bed
Gasification. Energy & Fuels 2013, 27 (12), 7510–7520.
(49) Dai, X.; Jin, B.; Lu, P.; Wang, X.; Huang, Y. The Role of Residual Carbon on Fusibility and
Flow Properties of Rice Straw Ash. Fuel 2019, 253 (May), 1512–1520.
(50) CHEN, D. xia; TANG, L. hua; ZHOU, Y. ming; WANG, W. mei; WU, Y. qiang; ZHU, Z. bin.
Effect of Char on the Melting Characteristics of Coal Ash. Ranliao Huaxue Xuebao/Journal
Fuel Chem. Technol. 2007, 35 (2), 136–140.
(51) Folkedahl, B. C.; Schobert, H. H. Effects of Atmosphere on Viscosity of Selected Bituminous
and Low-Rank Coal Ash Slags. Energy & Fuels 2005, 19, 208–215.
(52) Cao, X.; Kong, L.; Bai, J.; Ge, Z.; Li, H.; Bai, Z. Effect of Water Vapor on Coal Ash Slag
Viscosity under Gasification Condition. Fuel 2019, 237, 18–27.
(53) Kong, L.; Bai, J.; Li, W. Viscosity-Temperature Property of Coal Ash Slag at the Condition of
Entrained Flow Gasification: A Review. Fuel Process. Technol. 2021, 215 (November 2020),
106751.
(54) Buerger, M. J. The Role of Temperature in Mineralogy. Am. Mineral. 1948, 33 (3–4), 101–
121.
(55) Fisher, R. V.; Schmincke, H.-U. Pyroclastic Rocks; Springer-Verlag, 1984.
(56) Brown;, G. M. Melting Relations of Tertiary Granitic Rocks in Skye and Rhum. Mineral. Mag.
J. Mineral. Soc. 1963, 33 (262), 533–562.
Agglomeration in Fluidized Bed Gasification of Wheat Straw
77
(57) Shelby, J. E. Handbook of Gas Diffusion in Solids and Melts; ASM International, 1996.
(58) Doremus, R. H. Diffusion of Water in Silica Glass. J. Mater. Res. 1995, 10 (9), 2379–2389.

Agglomeration during Fluidized Bed Combustion and Gasification of Biomass
78
Fusion Behavior of Wheat Straw Ash under Combustion and Gasification Conditions
79
4. Fusion Behavior of Wheat Straw Ash under
Combustion and Gasification Conditions
Abstract
The fusion behavior of biomass ash affects the agglomeration tendency in fluidized bed combustion
and gasification. In this chapter, the fusion behaviors of the ashes from wheat straw, as well as a
mixture of wheat straw and silica sand, were investigated in a fixed bed reactor at 850 C under the
atmospheres of 100% air, a mixture of 50 vol.% steam and 50 vol.% air, and a mixture 50 vol.% of
steam and 50 vol.% N2. Visual observation and scanning electron microscopy with energy-dispersive
X-ray spectroscopy (SEM-EDX) analysis show that the fusion tendency of the ashes obtained from
wheat straw under gasification conditions is higher than that under combustion conditions. In addition,
the fusion tendency of the ash from combustion with presence of a high concentration of steam is
higher than that from normal combustion. The results indicate that a reducing atmosphere and a high
concentration of steam will promote the fusion behaviors of the wheat straw. The fusion tendency of
ashes from a mixture of wheat straw and silica sand is consistent with the fusion tendency of ashes
from wheat straw. The mixture that contains the ash with a highest fusion tendency shows a most
severe agglomeration tendency. The fusion tendency of the wheat straw ash under combustion and
gasification conditions is consistent with the agglomeration tendency that has been observed in
fluidized bed combustion and gasification of wheat straw in Chapter 3.
Agglomeration during Fluidized Bed Combustion and Gasification of Biomass
80
4.1 Introduction
In Chapter 3, it is found that the agglomeration in fluidized bed gasification of wheat straw is
accelerated by a reducing atmosphere and a high concentration of steam in the bed. Since the fusibility
of ash has been considered as a key parameter affecting agglomeration tendency1–3, evaluating the
fusion behavior of wheat straw ash under combustion and gasification conditions may provide an
improving understanding of agglomeration.
The fusibility of ash has been extensively investigated by various methods, such as standard ash
fusion temperatures (AFTs) test4,5, thermal mechanical analysis (TMA)6,7, thermo-gravimetric and
differential scanning calorimetry (TG/DSC) or differential thermal analysis (TG/DTA)8–11, and
optical dilatometry analysis (ODA)12–14. Huffman et al.15 studied the fusibility of a series of coal
ashes under reducing atmosphere (a mixture of 60 vol.% CO and 40 vol.% CO2) and oxidizing
atmosphere (air) by measuring their AFTs. It is found the AFTs of the ashes under the reducing
atmosphere are 50 to 200 °C lower than that under the oxidizing atmosphere. And the partial melting
of ash, which starts at a temperature 200 to 400 °C below the initial deformation temperature (IDT),
is significantly increased under the reducing atmosphere compared to the oxidizing atmosphere15.
Similar results have been observed by other researchers2,5,16–18. However, most of these investigations
focus on coal ashes with a relative high Fe content. The increase in fusion tendency of ashes under
the reducing condition is probably attributed to the reduction of Fe3+ to Fe2+, which may subsequent
react with other ash constituents to form the eutectics with low-melting temperature19,20. Mao et
al.21,22 suggested that the addition of water vapor significantly promotes the melting of coal ash due
to the formation of K containing compounds with low-melting temperature, such as KOH, and the
subsequently production of low-temperature eutectics via the interaction between K species in the
ash and bed material.
The investigations on the fusion tendency of biomass ashes under different atmospheres are not as
extensively as coal ashes. Niu et al.23 investigated the melting tendency of the gasified ash of a
mixture of straw, waste carton, plastic and spent mushroom compost in a fixed bed furnace under
reducing condition (a mixture of 50 vol.% N2, 30 vol.% CO and 20 vol.% CO2) and oxidizing
condition (air). The gasified ash was produced in an air blown fluidized bed gasifier at 800 °C with
an equivalence ratio of 0.2. Based on SEM analysis, it is found that the melting tendency of gasified
ash under the reducing condition is higher than that under the oxidizing condition. In addition to the
reduction of Fe3+ to Fe2+, the formation of CaO from CaSO4 and afterwards the production of low-
melting eutectics via interaction between CaO with other compounds are considered to be additional
reason for the high melting tendency of the gasified ash under the reducing atmosphere. The fusion
behaviors of wheat straw ash under combustion and gasification condition are still unclear.
In this chapter, the ashes will be produced from the wheat straw that used in Chapter 3 under
combustion and gasification conditions in a lab-scale fixed bed reactor. The influence of a reducing
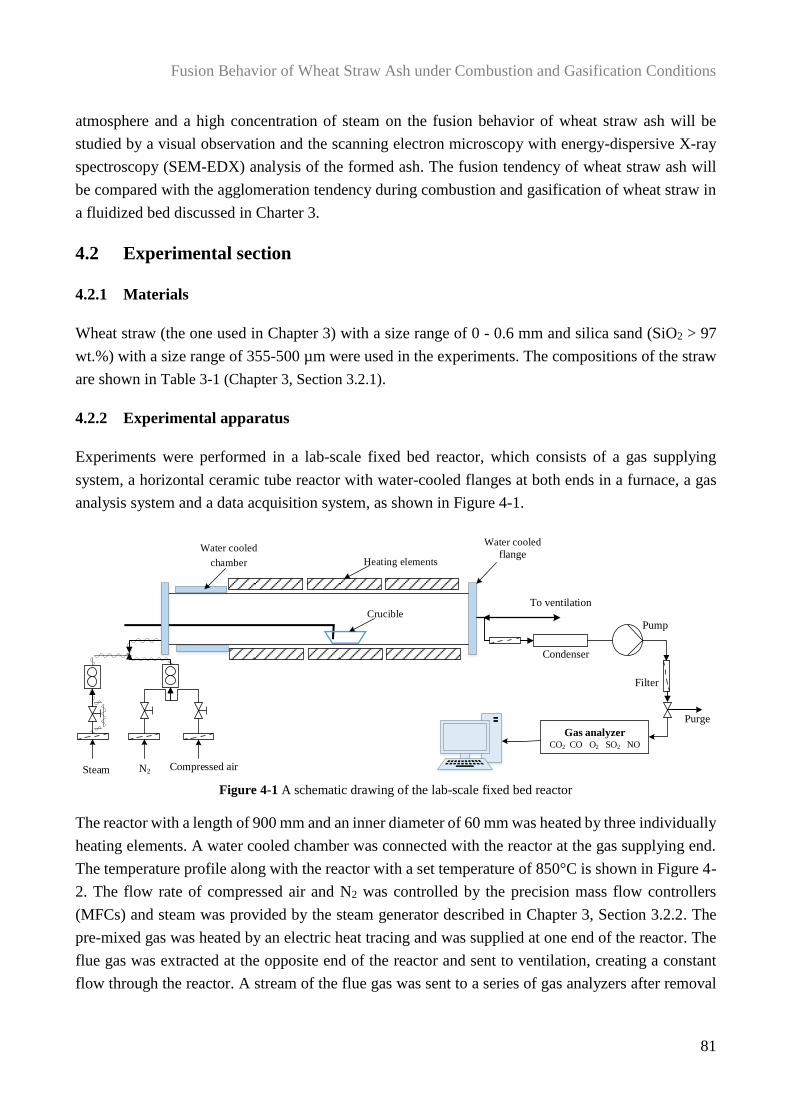
Fusion Behavior of Wheat Straw Ash under Combustion and Gasification Conditions
81
atmosphere and a high concentration of steam on the fusion behavior of wheat straw ash will be
studied by a visual observation and the scanning electron microscopy with energy-dispersive X-ray
spectroscopy (SEM-EDX) analysis of the formed ash. The fusion tendency of wheat straw ash will
be compared with the agglomeration tendency during combustion and gasification of wheat straw in
a fluidized bed discussed in Charter 3.
4.2 Experimental section
4.2.1 Materials
Wheat straw (the one used in Chapter 3) with a size range of 0 - 0.6 mm and silica sand (SiO2 > 97
wt.%) with a size range of 355-500 µm were used in the experiments. The compositions of the straw
are shown in Table 3-1 (Chapter 3, Section 3.2.1).
4.2.2 Experimental apparatus
Experiments were performed in a lab-scale fixed bed reactor, which consists of a gas supplying
system, a horizontal ceramic tube reactor with water-cooled flanges at both ends in a furnace, a gas
analysis system and a data acquisition system, as shown in Figure 4-1.
Figure 4-1 A schematic drawing of the lab-scale fixed bed reactor
The reactor with a length of 900 mm and an inner diameter of 60 mm was heated by three individually
heating elements. A water cooled chamber was connected with the reactor at the gas supplying end.
The temperature profile along with the reactor with a set temperature of 850°C is shown in Figure 4-
2. The flow rate of compressed air and N2 was controlled by the precision mass flow controllers
(MFCs) and steam was provided by the steam generator described in Chapter 3, Section 3.2.2. The
pre-mixed gas was heated by an electric heat tracing and was supplied at one end of the reactor. The
flue gas was extracted at the opposite end of the reactor and sent to ventilation, creating a constant
flow through the reactor. A stream of the flue gas was sent to a series of gas analyzers after removal
Steam N2Compressed air
Condenser
Pump
Purge
Gas analyzerCO2 CO O2 SO2 NO
To ventilation
Heating elements
Crucible
Filter
Water cooled
chamber
Water cooled
flange
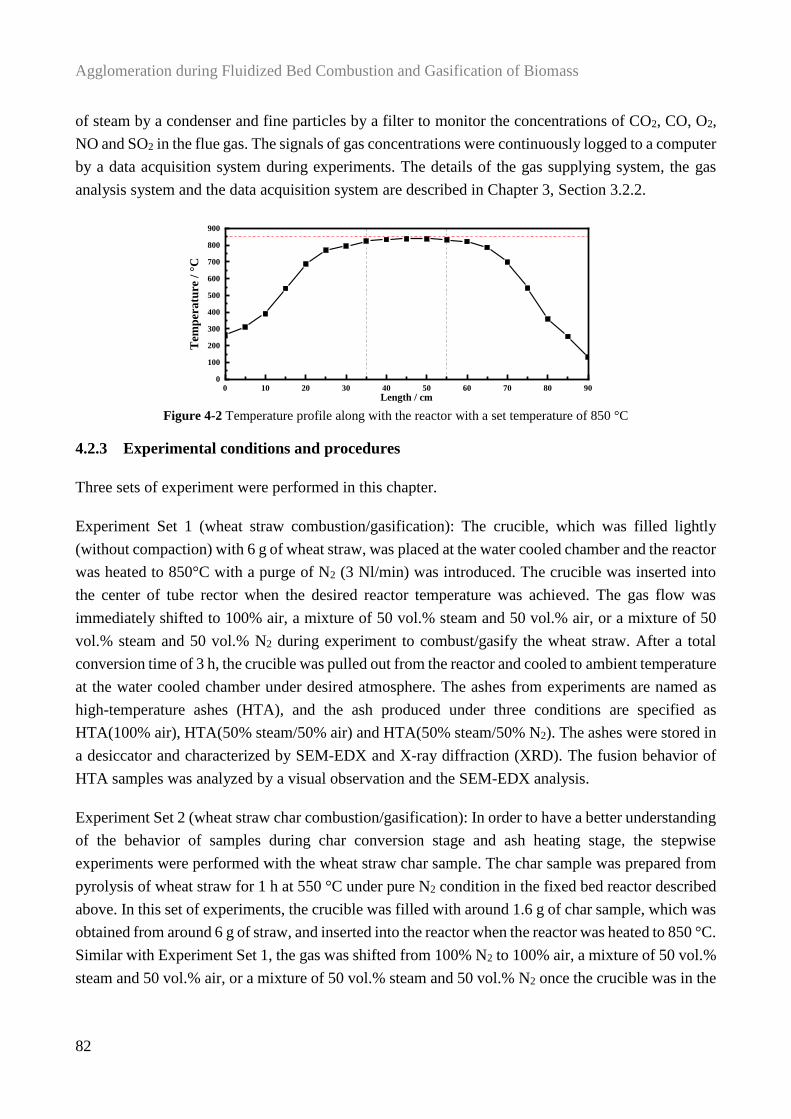
Agglomeration during Fluidized Bed Combustion and Gasification of Biomass
82
of steam by a condenser and fine particles by a filter to monitor the concentrations of CO2, CO, O2,
NO and SO2 in the flue gas. The signals of gas concentrations were continuously logged to a computer
by a data acquisition system during experiments. The details of the gas supplying system, the gas
analysis system and the data acquisition system are described in Chapter 3, Section 3.2.2.
Figure 4-2 Temperature profile along with the reactor with a set temperature of 850 °C
4.2.3 Experimental conditions and procedures
Three sets of experiment were performed in this chapter.
Experiment Set 1 (wheat straw combustion/gasification): The crucible, which was filled lightly
(without compaction) with 6 g of wheat straw, was placed at the water cooled chamber and the reactor
was heated to 850°C with a purge of N2 (3 Nl/min) was introduced. The crucible was inserted into
the center of tube rector when the desired reactor temperature was achieved. The gas flow was
immediately shifted to 100% air, a mixture of 50 vol.% steam and 50 vol.% air, or a mixture of 50
vol.% steam and 50 vol.% N2 during experiment to combust/gasify the wheat straw. After a total
conversion time of 3 h, the crucible was pulled out from the reactor and cooled to ambient temperature
at the water cooled chamber under desired atmosphere. The ashes from experiments are named as
high-temperature ashes (HTA), and the ash produced under three conditions are specified as
HTA(100% air), HTA(50% steam/50% air) and HTA(50% steam/50% N2). The ashes were stored in
a desiccator and characterized by SEM-EDX and X-ray diffraction (XRD). The fusion behavior of
HTA samples was analyzed by a visual observation and the SEM-EDX analysis.
Experiment Set 2 (wheat straw char combustion/gasification): In order to have a better understanding
of the behavior of samples during char conversion stage and ash heating stage, the stepwise
experiments were performed with the wheat straw char sample. The char sample was prepared from
pyrolysis of wheat straw for 1 h at 550 °C under pure N2 condition in the fixed bed reactor described
above. In this set of experiments, the crucible was filled with around 1.6 g of char sample, which was
obtained from around 6 g of straw, and inserted into the reactor when the reactor was heated to 850 °C.
Similar with Experiment Set 1, the gas was shifted from 100% N2 to 100% air, a mixture of 50 vol.%
steam and 50 vol.% air, or a mixture of 50 vol.% steam and 50 vol.% N2 once the crucible was in the
0 10 20 30 40 50 60 70 80 900
100
200
300
400
500
600
700
800
900
Tem
per
atu
re /
°C
Length / cm
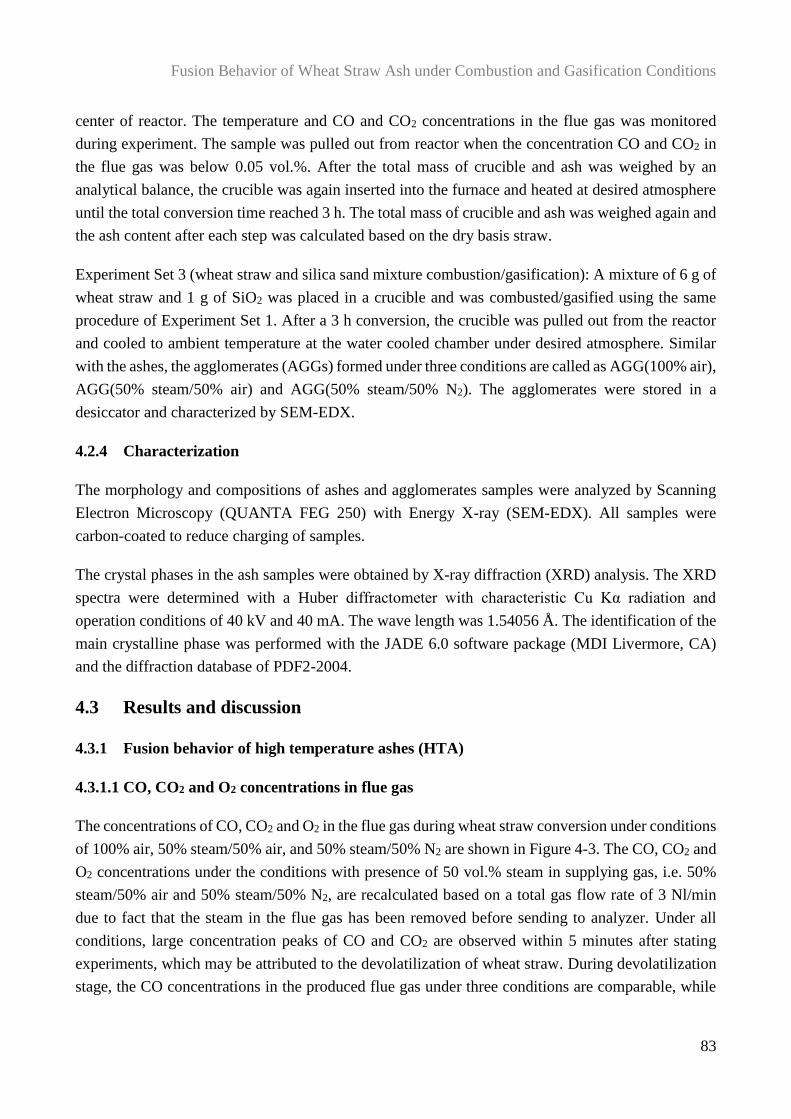
Fusion Behavior of Wheat Straw Ash under Combustion and Gasification Conditions
83
center of reactor. The temperature and CO and CO2 concentrations in the flue gas was monitored
during experiment. The sample was pulled out from reactor when the concentration CO and CO2 in
the flue gas was below 0.05 vol.%. After the total mass of crucible and ash was weighed by an
analytical balance, the crucible was again inserted into the furnace and heated at desired atmosphere
until the total conversion time reached 3 h. The total mass of crucible and ash was weighed again and
the ash content after each step was calculated based on the dry basis straw.
Experiment Set 3 (wheat straw and silica sand mixture combustion/gasification): A mixture of 6 g of
wheat straw and 1 g of SiO2 was placed in a crucible and was combusted/gasified using the same
procedure of Experiment Set 1. After a 3 h conversion, the crucible was pulled out from the reactor
and cooled to ambient temperature at the water cooled chamber under desired atmosphere. Similar
with the ashes, the agglomerates (AGGs) formed under three conditions are called as AGG(100% air),
AGG(50% steam/50% air) and AGG(50% steam/50% N2). The agglomerates were stored in a
desiccator and characterized by SEM-EDX.
4.2.4 Characterization
The morphology and compositions of ashes and agglomerates samples were analyzed by Scanning
Electron Microscopy (QUANTA FEG 250) with Energy X-ray (SEM-EDX). All samples were
carbon-coated to reduce charging of samples.
The crystal phases in the ash samples were obtained by X-ray diffraction (XRD) analysis. The XRD
spectra were determined with a Huber diffractometer with characteristic Cu Kα radiation and
operation conditions of 40 kV and 40 mA. The wave length was 1.54056 Å. The identification of the
main crystalline phase was performed with the JADE 6.0 software package (MDI Livermore, CA)
and the diffraction database of PDF2-2004.
4.3 Results and discussion
4.3.1 Fusion behavior of high temperature ashes (HTA)
4.3.1.1 CO, CO2 and O2 concentrations in flue gas
The concentrations of CO, CO2 and O2 in the flue gas during wheat straw conversion under conditions
of 100% air, 50% steam/50% air, and 50% steam/50% N2 are shown in Figure 4-3. The CO, CO2 and
O2 concentrations under the conditions with presence of 50 vol.% steam in supplying gas, i.e. 50%
steam/50% air and 50% steam/50% N2, are recalculated based on a total gas flow rate of 3 Nl/min
due to fact that the steam in the flue gas has been removed before sending to analyzer. Under all
conditions, large concentration peaks of CO and CO2 are observed within 5 minutes after stating
experiments, which may be attributed to the devolatilization of wheat straw. During devolatilization
stage, the CO concentrations in the produced flue gas under three conditions are comparable, while
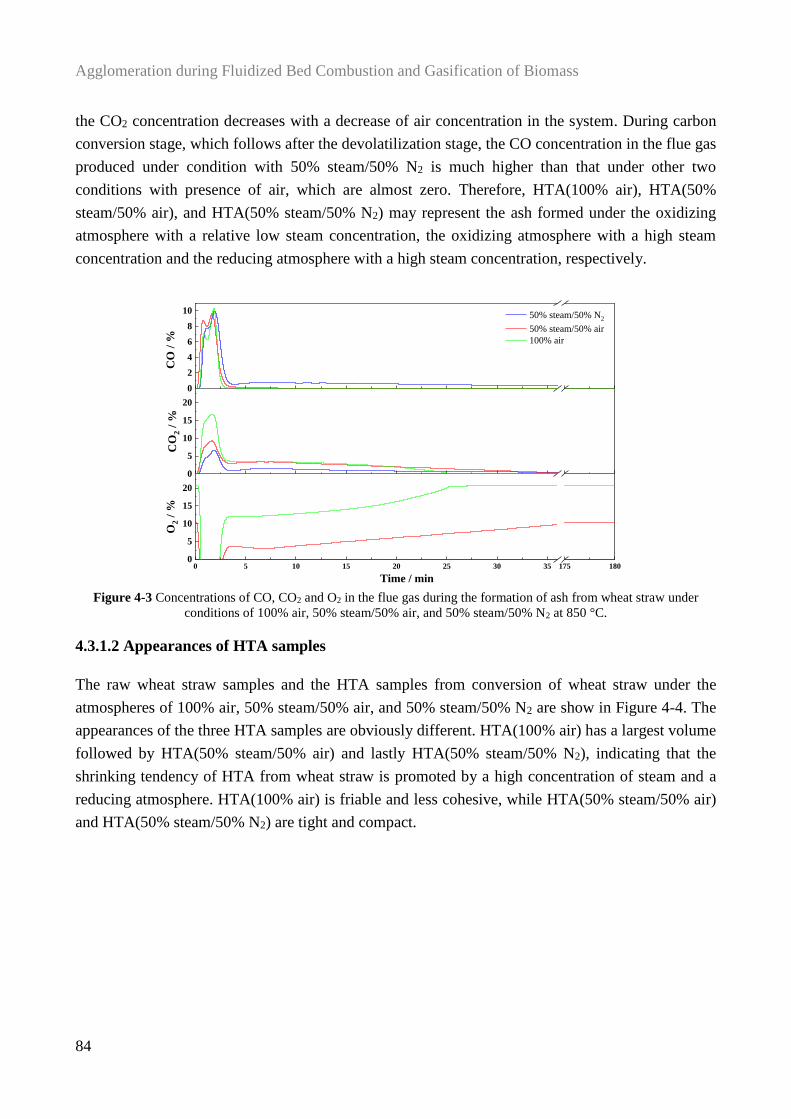
Agglomeration during Fluidized Bed Combustion and Gasification of Biomass
84
the CO2 concentration decreases with a decrease of air concentration in the system. During carbon
conversion stage, which follows after the devolatilization stage, the CO concentration in the flue gas
produced under condition with 50% steam/50% N2 is much higher than that under other two
conditions with presence of air, which are almost zero. Therefore, HTA(100% air), HTA(50%
steam/50% air), and HTA(50% steam/50% N2) may represent the ash formed under the oxidizing
atmosphere with a relative low steam concentration, the oxidizing atmosphere with a high steam
concentration and the reducing atmosphere with a high steam concentration, respectively.
Figure 4-3 Concentrations of CO, CO2 and O2 in the flue gas during the formation of ash from wheat straw under
conditions of 100% air, 50% steam/50% air, and 50% steam/50% N2 at 850 °C.
4.3.1.2 Appearances of HTA samples
The raw wheat straw samples and the HTA samples from conversion of wheat straw under the
atmospheres of 100% air, 50% steam/50% air, and 50% steam/50% N2 are show in Figure 4-4. The
appearances of the three HTA samples are obviously different. HTA(100% air) has a largest volume
followed by HTA(50% steam/50% air) and lastly HTA(50% steam/50% N2), indicating that the
shrinking tendency of HTA from wheat straw is promoted by a high concentration of steam and a
reducing atmosphere. HTA(100% air) is friable and less cohesive, while HTA(50% steam/50% air)
and HTA(50% steam/50% N2) are tight and compact.
0
2
4
6
8
10
0
5
10
15
20
0 5 10 15 20 25 30 35 175 1800
5
10
15
20
CO
/ %
50% steam/50% N2
50% steam/50% air
100% air
CO
2 /
%
O2 /
%
Time / min
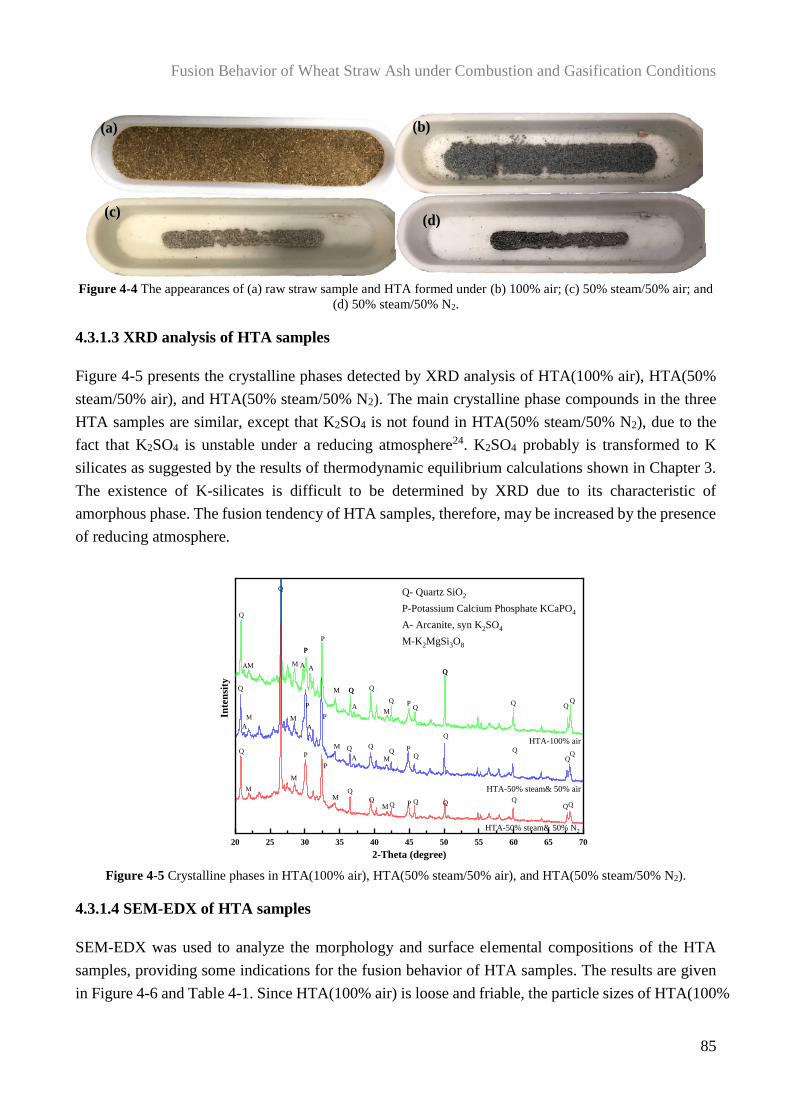
Fusion Behavior of Wheat Straw Ash under Combustion and Gasification Conditions
85
Figure 4-4 The appearances of (a) raw straw sample and HTA formed under (b) 100% air; (c) 50% steam/50% air; and
(d) 50% steam/50% N2.
4.3.1.3 XRD analysis of HTA samples
Figure 4-5 presents the crystalline phases detected by XRD analysis of HTA(100% air), HTA(50%
steam/50% air), and HTA(50% steam/50% N2). The main crystalline phase compounds in the three
HTA samples are similar, except that K2SO4 is not found in HTA(50% steam/50% N2), due to the
fact that K2SO4 is unstable under a reducing atmosphere24. K2SO4 probably is transformed to K
silicates as suggested by the results of thermodynamic equilibrium calculations shown in Chapter 3.
The existence of K-silicates is difficult to be determined by XRD due to its characteristic of
amorphous phase. The fusion tendency of HTA samples, therefore, may be increased by the presence
of reducing atmosphere.
Figure 4-5 Crystalline phases in HTA(100% air), HTA(50% steam/50% air), and HTA(50% steam/50% N2).
4.3.1.4 SEM-EDX of HTA samples
SEM-EDX was used to analyze the morphology and surface elemental compositions of the HTA
samples, providing some indications for the fusion behavior of HTA samples. The results are given
in Figure 4-6 and Table 4-1. Since HTA(100% air) is loose and friable, the particle sizes of HTA(100%
(a) (b)
(d)(c)
20 25 30 35 40 45 50 55 60 65 70
Q
Inte
nsi
ty
2-Theta (degree)
Q- Quartz SiO2
P-Potassium Calcium Phosphate KCaPO4
A- Arcanite, syn K2SO4
M-K2MgSi3O8
HTA-50% steam& 50% N2
HTA-50% steam& 50% air
HTA-100% air
Q
QQQ
Q
Q
P
Q
P
P
AA A
A
P
P
Q
Q
Q
Q Q Q
Q
Q
Q
QP
P
Q
Q
Q
A
P
P
A
Q
M
M
M
M
M
M
M
M
M
M
M
M
P
Q
Q
A
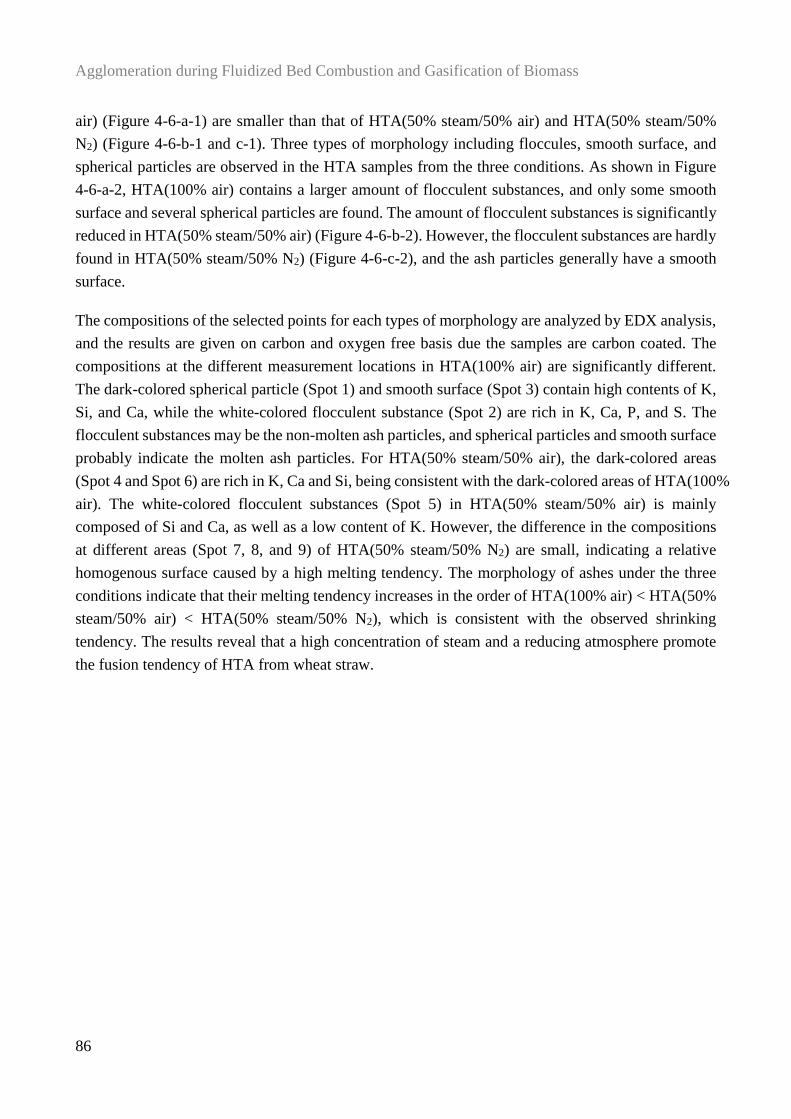
Agglomeration during Fluidized Bed Combustion and Gasification of Biomass
86
air) (Figure 4-6-a-1) are smaller than that of HTA(50% steam/50% air) and HTA(50% steam/50%
N2) (Figure 4-6-b-1 and c-1). Three types of morphology including floccules, smooth surface, and
spherical particles are observed in the HTA samples from the three conditions. As shown in Figure
4-6-a-2, HTA(100% air) contains a larger amount of flocculent substances, and only some smooth
surface and several spherical particles are found. The amount of flocculent substances is significantly
reduced in HTA(50% steam/50% air) (Figure 4-6-b-2). However, the flocculent substances are hardly
found in HTA(50% steam/50% N2) (Figure 4-6-c-2), and the ash particles generally have a smooth
surface.
The compositions of the selected points for each types of morphology are analyzed by EDX analysis,
and the results are given on carbon and oxygen free basis due the samples are carbon coated. The
compositions at the different measurement locations in HTA(100% air) are significantly different.
The dark-colored spherical particle (Spot 1) and smooth surface (Spot 3) contain high contents of K,
Si, and Ca, while the white-colored flocculent substance (Spot 2) are rich in K, Ca, P, and S. The
flocculent substances may be the non-molten ash particles, and spherical particles and smooth surface
probably indicate the molten ash particles. For HTA(50% steam/50% air), the dark-colored areas
(Spot 4 and Spot 6) are rich in K, Ca and Si, being consistent with the dark-colored areas of HTA(100%
air). The white-colored flocculent substances (Spot 5) in HTA(50% steam/50% air) is mainly
composed of Si and Ca, as well as a low content of K. However, the difference in the compositions
at different areas (Spot 7, 8, and 9) of HTA(50% steam/50% N2) are small, indicating a relative
homogenous surface caused by a high melting tendency. The morphology of ashes under the three
conditions indicate that their melting tendency increases in the order of HTA(100% air) < HTA(50%
steam/50% air) < HTA(50% steam/50% N2), which is consistent with the observed shrinking
tendency. The results reveal that a high concentration of steam and a reducing atmosphere promote
the fusion tendency of HTA from wheat straw.
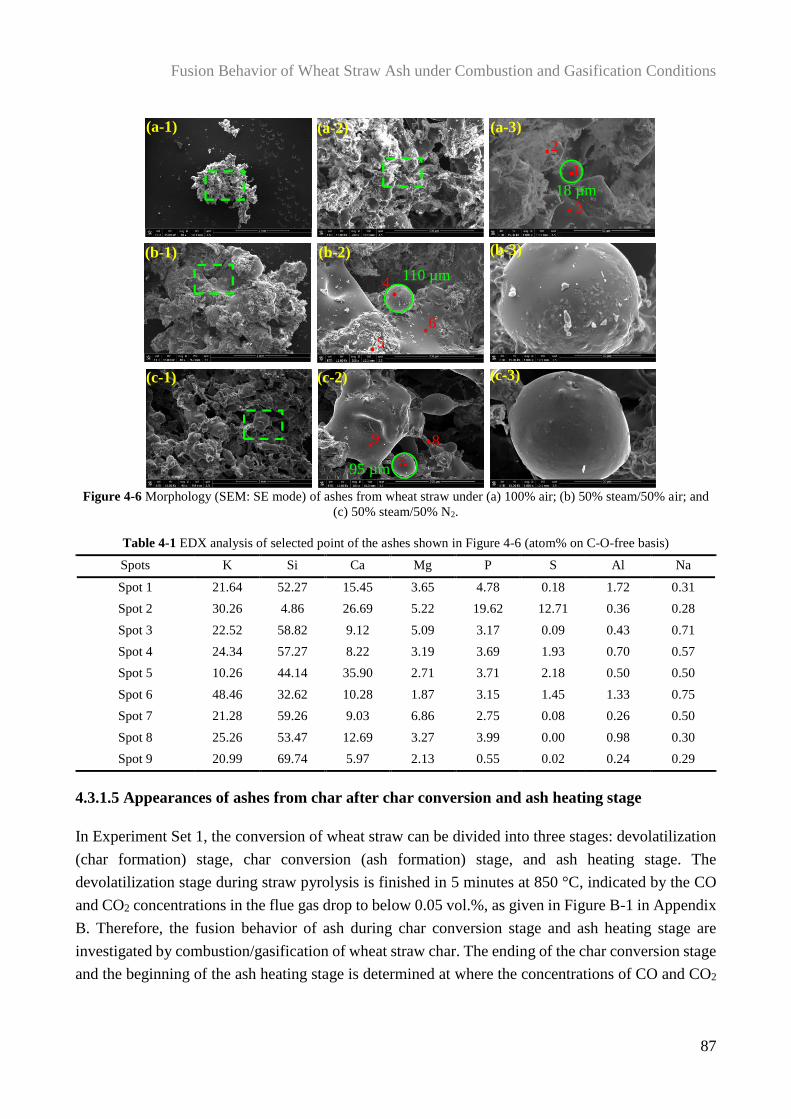
Fusion Behavior of Wheat Straw Ash under Combustion and Gasification Conditions
87
Figure 4-6 Morphology (SEM: SE mode) of ashes from wheat straw under (a) 100% air; (b) 50% steam/50% air; and
(c) 50% steam/50% N2.
Table 4-1 EDX analysis of selected point of the ashes shown in Figure 4-6 (atom% on C-O-free basis)
Spots K Si Ca Mg P S Al Na
Spot 1 21.64 52.27 15.45 3.65 4.78 0.18 1.72 0.31
Spot 2 30.26 4.86 26.69 5.22 19.62 12.71 0.36 0.28
Spot 3 22.52 58.82 9.12 5.09 3.17 0.09 0.43 0.71
Spot 4 24.34 57.27 8.22 3.19 3.69 1.93 0.70 0.57
Spot 5 10.26 44.14 35.90 2.71 3.71 2.18 0.50 0.50
Spot 6 48.46 32.62 10.28 1.87 3.15 1.45 1.33 0.75
Spot 7 21.28 59.26 9.03 6.86 2.75 0.08 0.26 0.50
Spot 8 25.26 53.47 12.69 3.27 3.99 0.00 0.98 0.30
Spot 9 20.99 69.74 5.97 2.13 0.55 0.02 0.24 0.29
4.3.1.5 Appearances of ashes from char after char conversion and ash heating stage
In Experiment Set 1, the conversion of wheat straw can be divided into three stages: devolatilization
(char formation) stage, char conversion (ash formation) stage, and ash heating stage. The
devolatilization stage during straw pyrolysis is finished in 5 minutes at 850 °C, indicated by the CO
and CO2 concentrations in the flue gas drop to below 0.05 vol.%, as given in Figure B-1 in Appendix
B. Therefore, the fusion behavior of ash during char conversion stage and ash heating stage are
investigated by combustion/gasification of wheat straw char. The ending of the char conversion stage
and the beginning of the ash heating stage is determined at where the concentrations of CO and CO2
(b-1)
(c-1)
(a-1)
7
9 8
95 µm
(c-2) (c-3)
4
6
5
110 µm
(b-2) (b-3)
(a-2)
1
2
318 µm
(a-3)
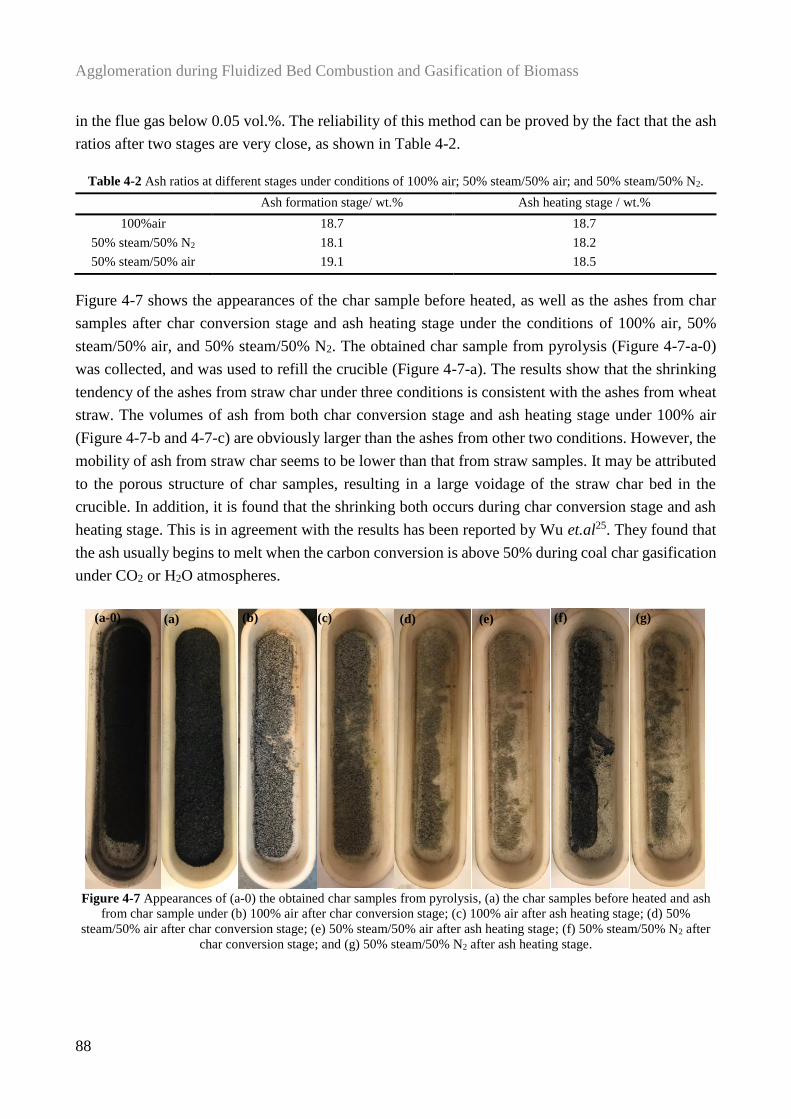
Agglomeration during Fluidized Bed Combustion and Gasification of Biomass
88
in the flue gas below 0.05 vol.%. The reliability of this method can be proved by the fact that the ash
ratios after two stages are very close, as shown in Table 4-2.
Table 4-2 Ash ratios at different stages under conditions of 100% air; 50% steam/50% air; and 50% steam/50% N2.
Ash formation stage/ wt.% Ash heating stage / wt.%
100%air 18.7 18.7
50% steam/50% N2 18.1 18.2
50% steam/50% air 19.1 18.5
Figure 4-7 shows the appearances of the char sample before heated, as well as the ashes from char
samples after char conversion stage and ash heating stage under the conditions of 100% air, 50%
steam/50% air, and 50% steam/50% N2. The obtained char sample from pyrolysis (Figure 4-7-a-0)
was collected, and was used to refill the crucible (Figure 4-7-a). The results show that the shrinking
tendency of the ashes from straw char under three conditions is consistent with the ashes from wheat
straw. The volumes of ash from both char conversion stage and ash heating stage under 100% air
(Figure 4-7-b and 4-7-c) are obviously larger than the ashes from other two conditions. However, the
mobility of ash from straw char seems to be lower than that from straw samples. It may be attributed
to the porous structure of char samples, resulting in a large voidage of the straw char bed in the
crucible. In addition, it is found that the shrinking both occurs during char conversion stage and ash
heating stage. This is in agreement with the results has been reported by Wu et.al25. They found that
the ash usually begins to melt when the carbon conversion is above 50% during coal char gasification
under CO2 or H2O atmospheres.
Figure 4-7 Appearances of (a-0) the obtained char samples from pyrolysis, (a) the char samples before heated and ash
from char sample under (b) 100% air after char conversion stage; (c) 100% air after ash heating stage; (d) 50%
steam/50% air after char conversion stage; (e) 50% steam/50% air after ash heating stage; (f) 50% steam/50% N2 after
char conversion stage; and (g) 50% steam/50% N2 after ash heating stage.
(a) (b) (c) (d) (e) (f) (g)(a-0)
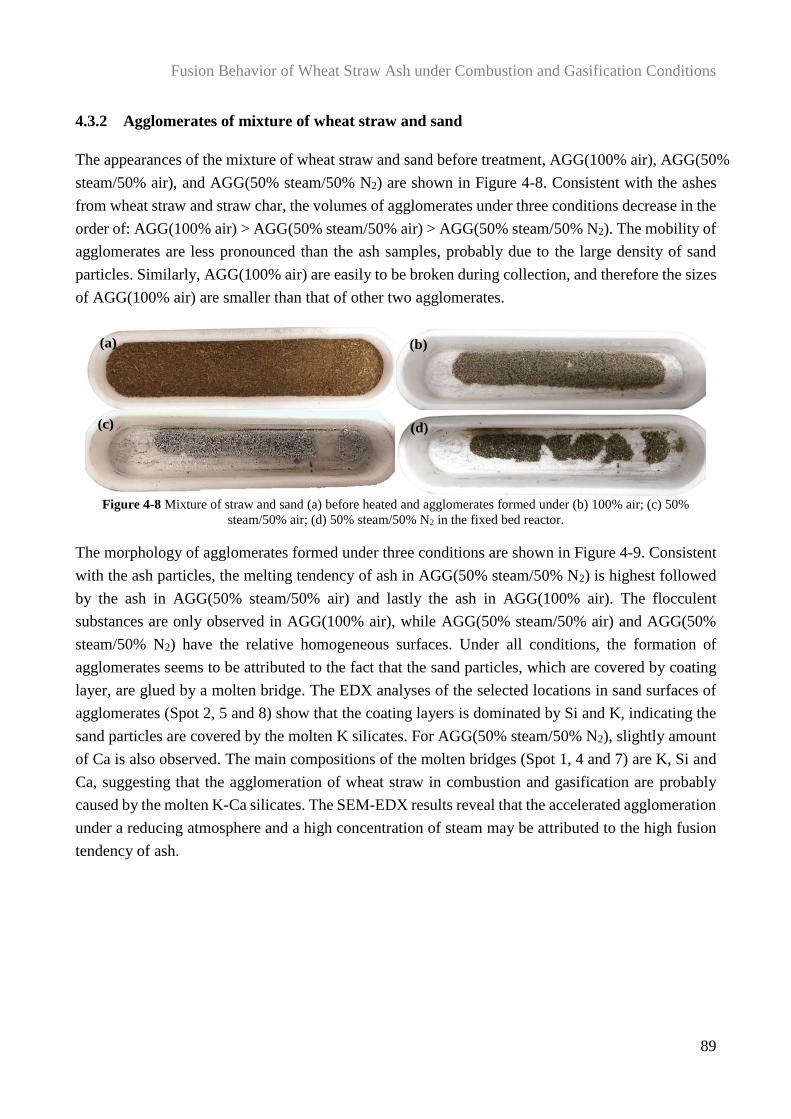
Fusion Behavior of Wheat Straw Ash under Combustion and Gasification Conditions
89
4.3.2 Agglomerates of mixture of wheat straw and sand
The appearances of the mixture of wheat straw and sand before treatment, AGG(100% air), AGG(50%
steam/50% air), and AGG(50% steam/50% N2) are shown in Figure 4-8. Consistent with the ashes
from wheat straw and straw char, the volumes of agglomerates under three conditions decrease in the
order of: AGG(100% air) > AGG(50% steam/50% air) > AGG(50% steam/50% N2). The mobility of
agglomerates are less pronounced than the ash samples, probably due to the large density of sand
particles. Similarly, AGG(100% air) are easily to be broken during collection, and therefore the sizes
of AGG(100% air) are smaller than that of other two agglomerates.
Figure 4-8 Mixture of straw and sand (a) before heated and agglomerates formed under (b) 100% air; (c) 50%
steam/50% air; (d) 50% steam/50% N2 in the fixed bed reactor.
The morphology of agglomerates formed under three conditions are shown in Figure 4-9. Consistent
with the ash particles, the melting tendency of ash in AGG(50% steam/50% N2) is highest followed
by the ash in AGG(50% steam/50% air) and lastly the ash in AGG(100% air). The flocculent
substances are only observed in AGG(100% air), while AGG(50% steam/50% air) and AGG(50%
steam/50% N2) have the relative homogeneous surfaces. Under all conditions, the formation of
agglomerates seems to be attributed to the fact that the sand particles, which are covered by coating
layer, are glued by a molten bridge. The EDX analyses of the selected locations in sand surfaces of
agglomerates (Spot 2, 5 and 8) show that the coating layers is dominated by Si and K, indicating the
sand particles are covered by the molten K silicates. For AGG(50% steam/50% N2), slightly amount
of Ca is also observed. The main compositions of the molten bridges (Spot 1, 4 and 7) are K, Si and
Ca, suggesting that the agglomeration of wheat straw in combustion and gasification are probably
caused by the molten K-Ca silicates. The SEM-EDX results reveal that the accelerated agglomeration
under a reducing atmosphere and a high concentration of steam may be attributed to the high fusion
tendency of ash.
(a) (b)
(c) (d)
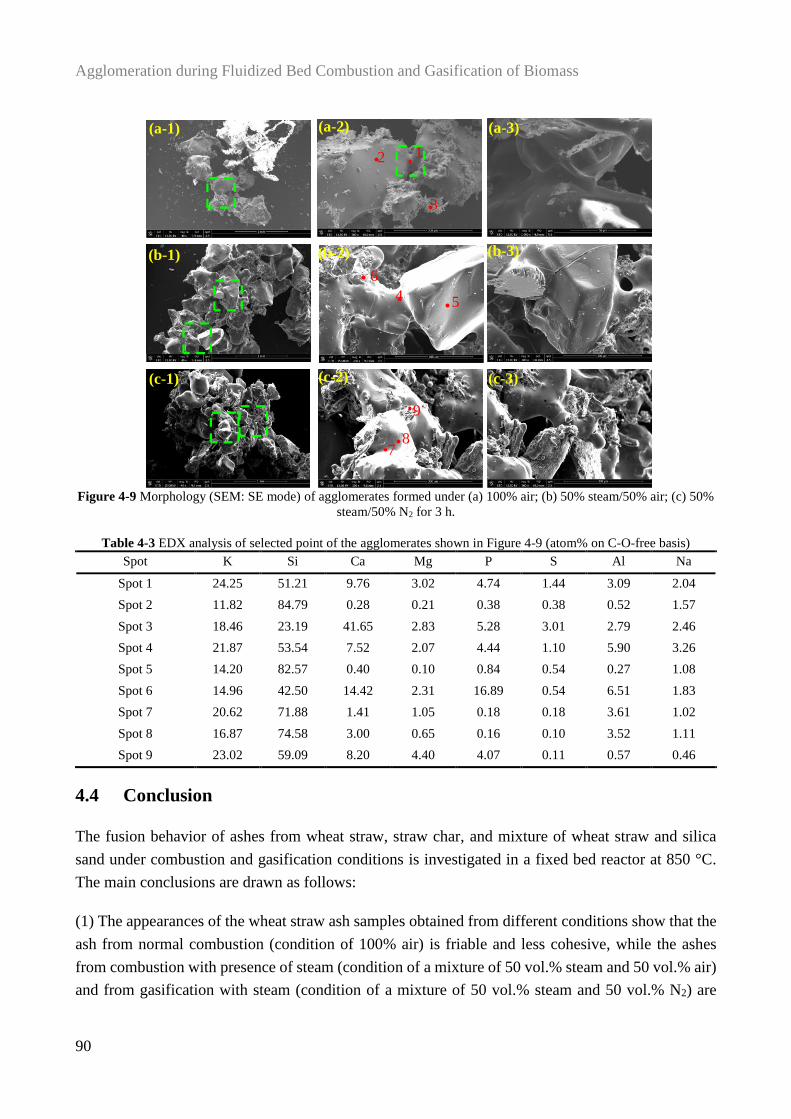
Agglomeration during Fluidized Bed Combustion and Gasification of Biomass
90
Figure 4-9 Morphology (SEM: SE mode) of agglomerates formed under (a) 100% air; (b) 50% steam/50% air; (c) 50%
steam/50% N2 for 3 h.
Table 4-3 EDX analysis of selected point of the agglomerates shown in Figure 4-9 (atom% on C-O-free basis)
Spot K Si Ca Mg P S Al Na
Spot 1 24.25 51.21 9.76 3.02 4.74 1.44 3.09 2.04
Spot 2 11.82 84.79 0.28 0.21 0.38 0.38 0.52 1.57
Spot 3 18.46 23.19 41.65 2.83 5.28 3.01 2.79 2.46
Spot 4 21.87 53.54 7.52 2.07 4.44 1.10 5.90 3.26
Spot 5 14.20 82.57 0.40 0.10 0.84 0.54 0.27 1.08
Spot 6 14.96 42.50 14.42 2.31 16.89 0.54 6.51 1.83
Spot 7 20.62 71.88 1.41 1.05 0.18 0.18 3.61 1.02
Spot 8 16.87 74.58 3.00 0.65 0.16 0.10 3.52 1.11
Spot 9 23.02 59.09 8.20 4.40 4.07 0.11 0.57 0.46
4.4 Conclusion
The fusion behavior of ashes from wheat straw, straw char, and mixture of wheat straw and silica
sand under combustion and gasification conditions is investigated in a fixed bed reactor at 850 °C.
The main conclusions are drawn as follows:
(1) The appearances of the wheat straw ash samples obtained from different conditions show that the
ash from normal combustion (condition of 100% air) is friable and less cohesive, while the ashes
from combustion with presence of steam (condition of a mixture of 50 vol.% steam and 50 vol.% air)
and from gasification with steam (condition of a mixture of 50 vol.% steam and 50 vol.% N2) are
(a-1)
4
6
5
(b-2)
7
9
8
(c-2)
(a-3)
(b-3)
(c-3)
12
3
(a-2)
(b-1)
(c-1)
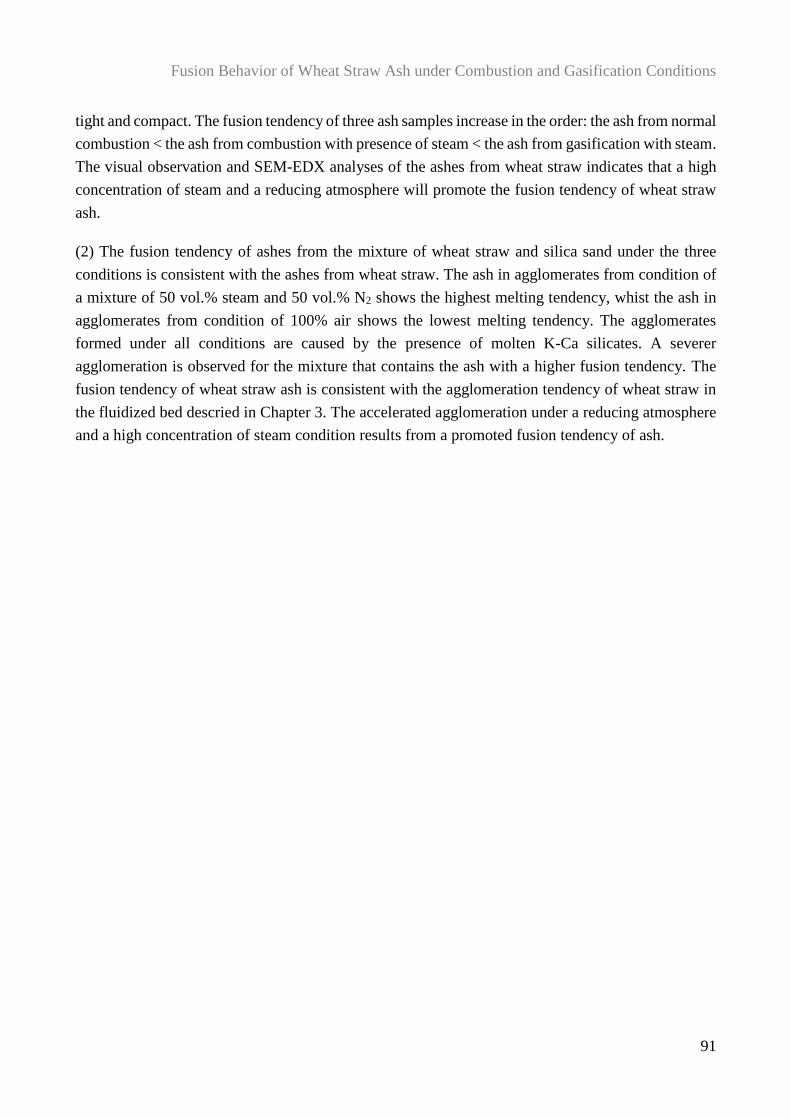
Fusion Behavior of Wheat Straw Ash under Combustion and Gasification Conditions
91
tight and compact. The fusion tendency of three ash samples increase in the order: the ash from normal
combustion < the ash from combustion with presence of steam < the ash from gasification with steam.
The visual observation and SEM-EDX analyses of the ashes from wheat straw indicates that a high
concentration of steam and a reducing atmosphere will promote the fusion tendency of wheat straw
ash.
(2) The fusion tendency of ashes from the mixture of wheat straw and silica sand under the three
conditions is consistent with the ashes from wheat straw. The ash in agglomerates from condition of
a mixture of 50 vol.% steam and 50 vol.% N2 shows the highest melting tendency, whist the ash in
agglomerates from condition of 100% air shows the lowest melting tendency. The agglomerates
formed under all conditions are caused by the presence of molten K-Ca silicates. A severer
agglomeration is observed for the mixture that contains the ash with a higher fusion tendency. The
fusion tendency of wheat straw ash is consistent with the agglomeration tendency of wheat straw in
the fluidized bed descried in Chapter 3. The accelerated agglomeration under a reducing atmosphere
and a high concentration of steam condition results from a promoted fusion tendency of ash.
Agglomeration during Fluidized Bed Combustion and Gasification of Biomass
92
Reference
(1) Ghaly, A. E.; Ergüdenler, A.; Laufer, E. Agglomeration Characteristics of Alumina Sand-
Straw Ash Mixtures at Elevated Temperatures. Biomass and Bioenergy 1993, 5 (6), 467–480.
(2) Backman, R. Sintering of FBC Ashes. Fuel 1994, 73 (2), 171–176.
(3) Mac an Bhaird, S. T.; Walsh, E.; Hemmingway, P.; Maglinao, A. L.; Capareda, S. C.;
McDonnell, K. P. Analysis of Bed Agglomeration during Gasification of Wheat Straw in a
Bubbling Fluidised Bed Gasifier Using Mullite as Bed Material. Powder Technol. 2014, 254,
448–459.
(4) Liu, Y.; Gupta, R.; Elliott, L.; Wall, T.; Fujimori, T. Thermomechanical Analysis of
Laboratory Ash, Combustion Ash and Deposits from Coal Combustion. Fuel Process. Technol.
2007, 88 (11–12), 1099–1107.
(5) Chen, X.; Kong, L.; Bai, J.; Bai, Z.; Li, W. Study on Fusibility of Coal Ash Rich in Sodium
and Sulfur by Synthetic Ash under Different Atmospheres. Fuel 2017, 202, 175–183.
(6) Ma, T.; Fan, C.; Hao, L.; Li, S.; Song, W.; Lin, W. Fusion Characterization of Biomass Ash.
Thermochim. Acta 2016, 638, 1–9.
(7) Gupta, S. K.; Gupta, R. P.; Bryant, G. W.; Wall, T. F. The Effect of Potassium on the Fusibility
of Coal Ashes with High Silica and Alumina Levels. Fuel 1998, 77 (11), 1195–1201.
(8) Gilbe, C.; Lindstróm, E.; Backman, R.; Samuelsson, R.; Burvall, J.; Öhman, M. Predicting
Slagging Tendencies for Biomass Pellets Fired in Residential Appliances: A Comparison of
Different Prediction Methods. Energy & Fuels 2008, 22 (6), 3680–3686.
(9) Schimpke, R.; Klinger, M.; Krzack, S.; Meyer, B. Determination of the Initial Ash Sintering
Temperature by Cold Compression Strength Tests with Regard to Mineral Transitions. Fuel
2017, 194, 157–165.
(10) Nel, M. V; Strydom, C. A.; Schobert, H. H.; Beukes, J. P.; Bunt, J. R. Comparison of Sintering
and Compressive Strength Tendencies of a Model Coal Mineral Mixture Heat-Treated in Inert
and Oxidizing Atmospheres. Fuel Process. Technol. 2011, 92 (5), 1042–1051.
(11) Du, S.; Yang, H.; Qian, K.; Wang, X.; Chen, H. Fusion and Transformation Properties of the
Inorganic Components in Biomass Ash. Fuel 2014, 117 (PARTB), 1281–1287.
(12) Adell, V.; Cheeseman, C. R.; Ferraris, M.; Salvo, M.; Smeacetto, F.; Boccaccini, A. R.
Characterising the Sintering Behaviour of Pulverised Fuel Ash Using Heating Stage
Microscopy. Mater. Charact. 2007, 58 (10), 980–988.
(13) Xu, J.; Zhao, F.; Guo, Q.; Yu, G.; Liu, X.; Wang, F. Characterization of the Melting Behavior
of High-Temperature and Low-Temperature Ashes. Fuel Process. Technol. 2015, 134, 441–
448.
(14) Lawrence, A.; Ilayaperumal, V.; Dhandapani, K. P.; Srinivasan, S. V.; Muthukrishnan, M.;
Sundararajan, S. A Novel Technique for Characterizing Sintering Propensity of Low Rank
Fusion Behavior of Wheat Straw Ash under Combustion and Gasification Conditions
93
Fuels for CFBC Boilers. Fuel 2013, 109, 211–216.
(15) Huffman, G. P.; Huggins, F. E.; Dunmyre, G. R. Investigation of the High-Temperature
Behaviour of Coal Ash in Reducing and Oxidizing Atmospheres. Fuel 1981, 60 (7), 585–597.
(16) Jing, N.; Wang, Q.; Luo, Z.; Cen, K. Effect of Different Reaction Atmospheres on the Sintering
Temperature of Jincheng Coal Ash under Pressurized Conditions. Fuel 2011, 90 (8), 2645–
2651.
(17) Jing, N.; Wang, Q.; Yang, Y.; Cheng, L.; Luo, Z.; Cen, K. Influence of Ash Composition on
the Sintering Behavior during Pressurized Combustion and Gasification Process. J Zhejiang
Univ-Sci A (Appl Phys Eng) 2012, 13 (3), 230–238.
(18) Bryant, G. W.; Browning, G. J.; Emanuel, H.; Gupta, S. K.; Gupta, R. P.; Lucas, J. A.; Wall,
T. F. The Fusibility of Blended Coal Ash. 2000, No. 5, 316–325.
(19) Song, W. J.; Tang, L. H.; Zhu, X. D.; Wu, Y. Q.; Zhu, Z. B. Prediction of Chinese Coal Ash
Fusion Temperatures in Ar and H2 Atmospheres. Energy & Fuels 2009, 23, 1990–1997.
(20) Dyk, J. C. Van; Benson, S. A.; Laumb, M. L.; Waanders, B. Coal and Coal Ash Characteristics
to Understand Mineral Transformations and Slag Formation. Fuel 2009, 88 (6), 1057–1063.
(21) Mao, Y.; Jin, Y.; Li, K.; Bi, J.; Li, J.; Xin, F. Sintering Characteristic in Catalytic Gasification
of China Inner Mongolia Bituminous Coal Ash. Energy & Fuels 2016, 30, 3975–3985.
(22) Mao, Y.; Jin, Y.; Li, K.; Bi, J.; Li, J.; Xin, F. Analysis of Influencing Factors on Sintering
Temperature of Inner Mongolia Wangjiata Bituminous Coal Ash during Catalytic Coal
Gasification (in Chinese). Huagong Xuebao/CIESC J. 2015, 66, 1080–1087.
(23) Miaomiao, N.; Dong, Q.; Huang, Y.; Jin, B.; Wang, H.; Gu, H. Characterization of Ash Melting
Behaviour at High Temperatures under Conditions Simulating Combustible Solid Waste
Gasification. Waste Manag. Res. 2018, 36 (5), 415–425.
(24) Ma, T.; Fan, C.; Hao, L.; Li, S.; Song, W.; Lin, W. Biomass-Ash-Induced Agglomeration in a
Fluidized Bed. Part 1: Experimental Study on the Effects of a Gas Atmosphere. Energy &
Fuels 2016, 30 (8), 6395–6404.
(25) Wu, X.; Zhang, Z.; Piao, G.; He, X.; Chen, Y.; Kobayashi, N.; Mori, S.; Itaya, Y. Behavior of
Mineral Matters in Chinese Coal Ash Melting during Char-CO2/H2O Gasification Reaction.
Energy & Fuels 2009, 23, 2420–2428.

Agglomeration during Fluidized Bed Combustion and Gasification of Biomass
94
Influence of Biomass Types on Agglomeration during Combustion and Gasification
This chapter has been written in a manuscript format. A slightly modified version of this chapter will
be submitted to a peer-reviewed journal.
5. Influence of Biomass Types on Agglomeration
during Combustion and Gasification
Abstract
In this chapter, the agglomeration during combustion and gasification of two types of biomass,
including two batches of wheat straw (WS, named as WS-1 and WS-2) and one sunflower husk (SFH),
was studied in a lab-scale fluidized bed reactor at 850 °C using silica sand as bed material. The char
reactivity of the biomasses was investigated by thermogravimetric analysis (TGA). Selected biomass
residues and bed agglomerates were characterized by X-ray diffraction (XRD) and scanning electron
microscopy with energy-dispersive X-ray spectroscopy (SEM-EDX). Thermodynamic equilibrium
calculations were performed to explore the distribution of potassium during conversion of the three
biomasses. Fluidized bed experiments show that the agglomeration tendency of SFH ash is higher
than that of WS ashes under both combustion and gasification conditions. This may be attributed to
their significantly different molar ratios of silicon to potassium (Si/K), which are 1.56, 2.60 and 0.04,
respectively, for WS-1, WS-2 and SFH. During gasification, varying the ER and addition of a high
concentration of steam in primary gas show consistent effects on the agglomeration of the three
biomasses. A reducing atmosphere and a high concentration of steam promote the agglomeration of
WS probably by increasing the melting of ashes. For SFH, the accelerated agglomeration under a
reducing atmosphere and a high concentration of steam may be attributed to their promotive effect
on the interaction between SFH ash and bed material. TGA experiments result show that SFH has the
highest char reactivity followed by WS-2 and lastly WS-1. An increase in char reactivity leads to a
decrease in the inhibition effect of accumulated carbon caused by decreasing ER during gasification
of biomass. The critical ER of SFH, which is 0.04, is lower than that of WSs, which are 0.36. This
may be attributed to a high char reactivity of SFH and the different mechanism of the influence of
reducing atmosphere on the agglomeration results from a low Si/K molar ratio of SFH.
Agglomeration during Fluidized Bed Combustion and Gasification of Biomass
96
5.1 Introduction
The agglomeration during combustion and gasification of biomass is mainly attributed to the presence
of the low-melting temperature alkali containing compounds originated from biomass and/or
interaction between biomass ash and bed materials1,2. Therefore, agglomeration tendencies and
mechanisms in fluidized bed are closely related to the biomass types due to their diverse ash content
and different ash-forming compositions3–6.
Wheat straw, a biomass that both rich in potassium and silicon, is problematic during combustion and
gasification in fluidized bed7–9 due to the severe agglomeration problem. It is generally accepted that
a K- and Si-rich ash may start melting before attaching to bed material, subsequently causing the
agglomeration3,4. The Si-lean husks, such as coffee husk and sunflower husk, also show a high
agglomeration tendency in combustion and gasification due to their high potassium content10,11.
Chaivatamaset et al.12 investigated the agglomeration in combustion of a Si-poor eucalyptus bark,
whose ash is dominated by Ca followed by K. It is found that the dominant agglomeration mechanism
is the presence of molten potassium silicates produced through the chemical reaction between the
potassium and calcium of the bark and the silicon from the silica sand. Öhman et al.5 found that the
agglomeration temperature of olive flesh, a biomass rich in K, Ca, Mg and Si, is 270 °C higher than
that of Lucerne, a biomass rich in K and Ca but lean in Si, during combustion. Chemical equilibrium
calculations suggest that K in olive flesh is likely to be transformed into silicates and sulfates during
combustion, while KCl, K2CO3, K2SO4, and K silicates are the dominant K compounds during
Lucerne combustion. It is suggested by Öhman et al. that the agglomeration of Lucerne during
combustion is caused by the melting of KCl and K2SO4 eutectic5. However, it is observed that the
dominate elements of the inner layer around the bed particles from Lucerne combustion are K and Si,
indicating that the interaction between Lucerne ash and bed material may be one important
agglomeration mechanism.
In Chapter 3, it has been shown that the agglomeration tendency of wheat straw first increases with a
decrease of ER to a maximal tendency, and then decreases with further decreasing ER. By decreasing
ER, the produced reducing atmosphere promotes the agglomeration, while an increased amount of
residual carbon in the bed will mitigate the agglomeration. The competition between these two factors
results in the occurrence of the maximal agglomeration tendency at a critical ER. The promoted
agglomeration by adding steam to the primary gas probably attributed to a decreased carbon amount
in the bed and a lowered ash viscosity. However, whether such phenomena occur to other biomass is
still unclear. In this chapter, the agglomeration behaviors of the wheat straw that without
defluidization in the low-temperature circulating fluidized bed (LTCFB) gasifier (described in
Chapter 1, Section 1.1) and a sunflower husk that rich in K but lean in Si will be investigated under
combustion and gasification conditions, subsequently compared to the agglomeration behavior of
wheat straw that used in Chapter 3. The influence of char reactivity and the molar ratio of Si/K on
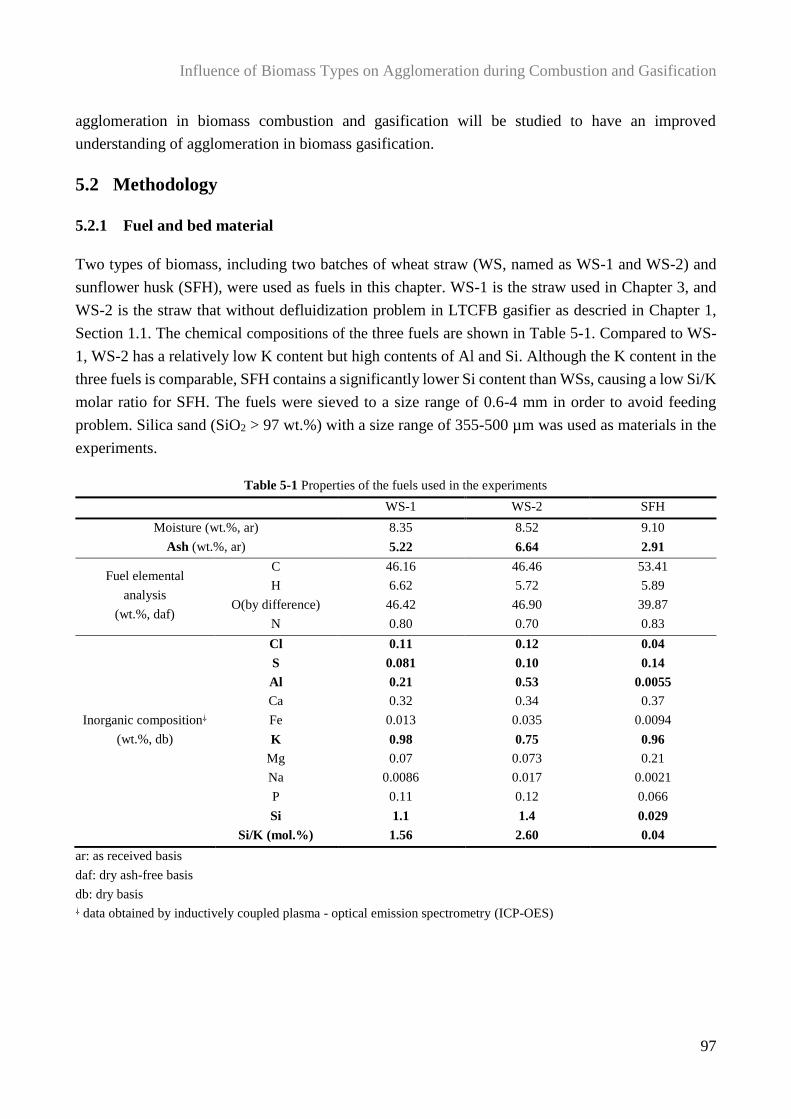
Influence of Biomass Types on Agglomeration during Combustion and Gasification
97
agglomeration in biomass combustion and gasification will be studied to have an improved
understanding of agglomeration in biomass gasification.
5.2 Methodology
5.2.1 Fuel and bed material
Two types of biomass, including two batches of wheat straw (WS, named as WS-1 and WS-2) and
sunflower husk (SFH), were used as fuels in this chapter. WS-1 is the straw used in Chapter 3, and
WS-2 is the straw that without defluidization problem in LTCFB gasifier as descried in Chapter 1,
Section 1.1. The chemical compositions of the three fuels are shown in Table 5-1. Compared to WS-
1, WS-2 has a relatively low K content but high contents of Al and Si. Although the K content in the
three fuels is comparable, SFH contains a significantly lower Si content than WSs, causing a low Si/K
molar ratio for SFH. The fuels were sieved to a size range of 0.6-4 mm in order to avoid feeding
problem. Silica sand (SiO2 > 97 wt.%) with a size range of 355-500 µm was used as materials in the
experiments.
Table 5-1 Properties of the fuels used in the experiments
WS-1 WS-2 SFH
Moisture (wt.%, ar) 8.35 8.52 9.10
Ash (wt.%, ar) 5.22 6.64 2.91
Fuel elemental
analysis
(wt.%, daf)
C 46.16 46.46 53.41
H 6.62 5.72 5.89
O(by difference) 46.42 46.90 39.87
N 0.80 0.70 0.83
Inorganic composition⸸
(wt.%, db)
Cl 0.11 0.12 0.04
S 0.081 0.10 0.14
Al 0.21 0.53 0.0055
Ca 0.32 0.34 0.37
Fe 0.013 0.035 0.0094
K 0.98 0.75 0.96
Mg 0.07 0.073 0.21
Na 0.0086 0.017 0.0021
P 0.11 0.12 0.066
Si 1.1 1.4 0.029
Si/K (mol.%) 1.56 2.60 0.04
ar: as received basis
daf: dry ash-free basis
db: dry basis ⸸ data obtained by inductively coupled plasma - optical emission spectrometry (ICP-OES)
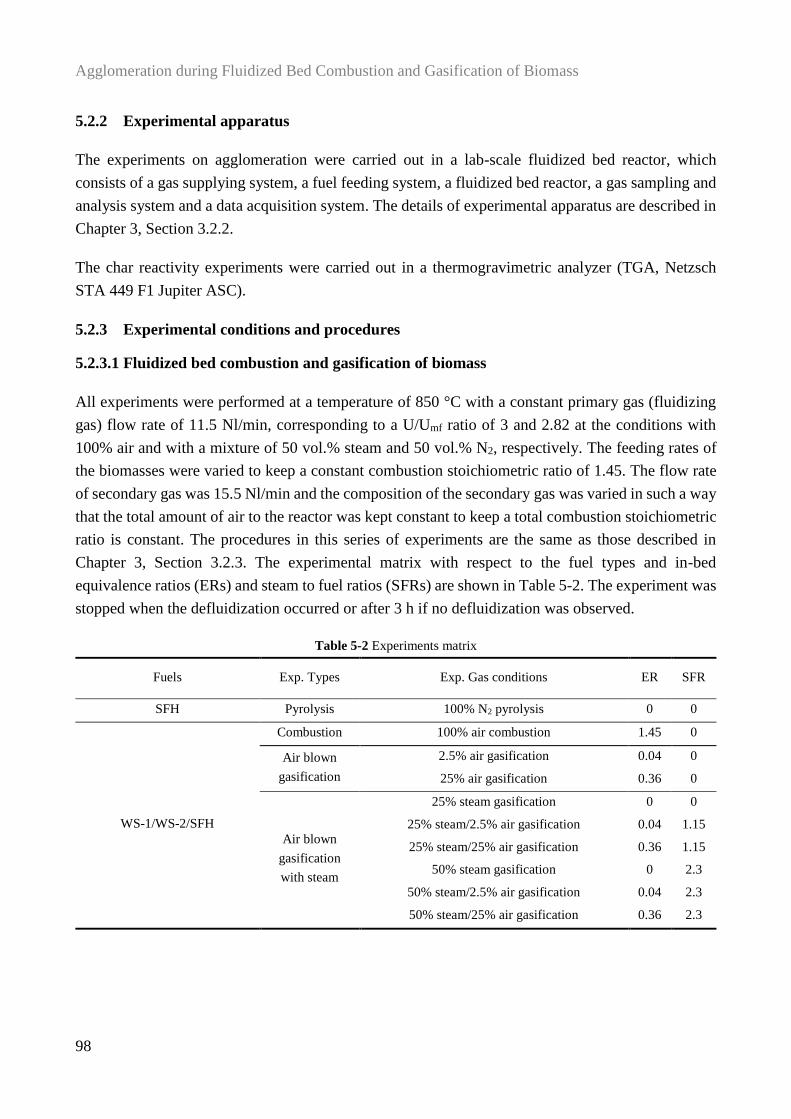
Agglomeration during Fluidized Bed Combustion and Gasification of Biomass
98
5.2.2 Experimental apparatus
The experiments on agglomeration were carried out in a lab-scale fluidized bed reactor, which
consists of a gas supplying system, a fuel feeding system, a fluidized bed reactor, a gas sampling and
analysis system and a data acquisition system. The details of experimental apparatus are described in
Chapter 3, Section 3.2.2.
The char reactivity experiments were carried out in a thermogravimetric analyzer (TGA, Netzsch
STA 449 F1 Jupiter ASC).
5.2.3 Experimental conditions and procedures
5.2.3.1 Fluidized bed combustion and gasification of biomass
All experiments were performed at a temperature of 850 °C with a constant primary gas (fluidizing
gas) flow rate of 11.5 Nl/min, corresponding to a U/Umf ratio of 3 and 2.82 at the conditions with
100% air and with a mixture of 50 vol.% steam and 50 vol.% N2, respectively. The feeding rates of
the biomasses were varied to keep a constant combustion stoichiometric ratio of 1.45. The flow rate
of secondary gas was 15.5 Nl/min and the composition of the secondary gas was varied in such a way
that the total amount of air to the reactor was kept constant to keep a total combustion stoichiometric
ratio is constant. The procedures in this series of experiments are the same as those described in
Chapter 3, Section 3.2.3. The experimental matrix with respect to the fuel types and in-bed
equivalence ratios (ERs) and steam to fuel ratios (SFRs) are shown in Table 5-2. The experiment was
stopped when the defluidization occurred or after 3 h if no defluidization was observed.
Table 5-2 Experiments matrix
Fuels Exp. Types Exp. Gas conditions ER SFR
SFH Pyrolysis 100% N2 pyrolysis 0 0
WS-1/WS-2/SFH
Combustion 100% air combustion 1.45 0
Air blown
gasification
2.5% air gasification 0.04 0
25% air gasification 0.36 0
Air blown
gasification
with steam
25% steam gasification 0 0
25% steam/2.5% air gasification 0.04 1.15
25% steam/25% air gasification 0.36 1.15
50% steam gasification 0 2.3
50% steam/2.5% air gasification 0.04 2.3
50% steam/25% air gasification 0.36 2.3
Influence of Biomass Types on Agglomeration during Combustion and Gasification
99
5.2.3.2 Thermogravimetric analysis (TGA) of char samples
The char samples were prepared in a fixed bed reactor described in Chapter 4. The biomass was filled
in a crucible and pyrolyzed at 850 °C under N2 condition for 1 h. The char sample was collected after
cooling to the ambient temperature and stored in a desiccator. Approximately 2 mg of char sample was
heated from ambient temperature to 850 ºC at a heating rate of 5 °C/min and kept at 850°C for 30 min in
the TGA setup. All experiments were performed with a total gas flow of 200 Nml/min. The char reactivity
of the three biomass in combustion and gasification was investigated under the conditions of 4 vol.% O2
in N2 and 20 vol.% CO2 in N2, respectively.
5.2.3.3 Low-temperature ash (LTA) and high-temperature ash (HTA) preparation
The biomass was dried in the oven at 105 °C and weighed by an analytical balance, which is sensitive
to 0.1 mg, several times until the mass of the sample varies by less than 0.3 mg from the previous
weighing. Afterwards, the biomass was heated in a fixed bed reactor under an air atmosphere from
ambient temperature to 250 °C at a rate of 10 °C/min and hold for 30 min. Following this, the sample
was heated to 550 °C or 850 °C at a rate of 5 °C/min and hold for another 3 h. The ash sample was
collected after cooling down and stored in a desiccator. The ashes obtained from 550 °C and 850 °C
are defined as low-temperature ash (LTA) and high-temperature ash (HTA) respectively.
5.2.4 Characterization of ashes
The crystalline phases in the LTA and HTA samples obtained in the fixed bed reactor were detected
by X-ray diffraction (XRD) analysis. The XRD spectra were determined with a Huber diffractometer
with characteristic Cu Kα radiation and operation conditions of 40 kV and 40 mA. The wave length
was 1.54056 Å. The identification of the main crystalline phase was performed with the JADE 6.0
software package (MDI Livermore, CA) and the diffraction database of PDF2-2004.
The morphology and compositions of selected residual samples from TGA experiments and
agglomerates from fluidized bed experiments were analyzed by Scanning Electron Microscopy
(QUANTA FEG 250) with Energy X-ray (SEM-EDX). All samples were Ag-coated to reduce
charging of samples.
5.2.5 Thermodynamic equilibrium calculations
The distribution of potassium in combustion and gasification of the three fuels at various ERs were
explored by the thermodynamic equilibrium calculations performed using FACTSAGE software
version 7.2. The FToxid, FTsalt, FactPS, and FTpulp databases, as well as FToxid-SLAGA solution
phase were chosen for the calculations44. The input data was calculated based on the primary gas
compositions with a flow rate of 11.5Nl/min and biomasses composition with a dry basis feeding rate
of 0.11 kg/h for WSs and 0.09 kg/h for SFH to maintain the stoichiometric ratio during combustion
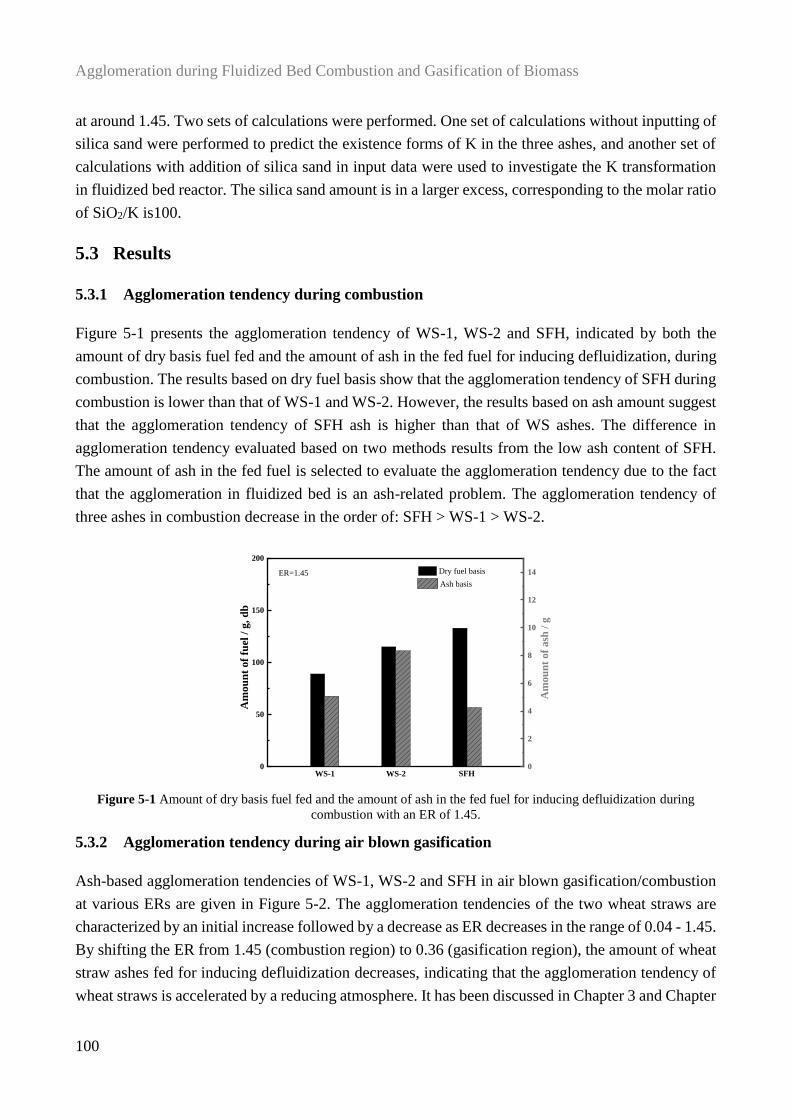
Agglomeration during Fluidized Bed Combustion and Gasification of Biomass
100
at around 1.45. Two sets of calculations were performed. One set of calculations without inputting of
silica sand were performed to predict the existence forms of K in the three ashes, and another set of
calculations with addition of silica sand in input data were used to investigate the K transformation
in fluidized bed reactor. The silica sand amount is in a larger excess, corresponding to the molar ratio
of SiO2/K is100.
5.3 Results
5.3.1 Agglomeration tendency during combustion
Figure 5-1 presents the agglomeration tendency of WS-1, WS-2 and SFH, indicated by both the
amount of dry basis fuel fed and the amount of ash in the fed fuel for inducing defluidization, during
combustion. The results based on dry fuel basis show that the agglomeration tendency of SFH during
combustion is lower than that of WS-1 and WS-2. However, the results based on ash amount suggest
that the agglomeration tendency of SFH ash is higher than that of WS ashes. The difference in
agglomeration tendency evaluated based on two methods results from the low ash content of SFH.
The amount of ash in the fed fuel is selected to evaluate the agglomeration tendency due to the fact
that the agglomeration in fluidized bed is an ash-related problem. The agglomeration tendency of
three ashes in combustion decrease in the order of: SFH > WS-1 > WS-2.
Figure 5-1 Amount of dry basis fuel fed and the amount of ash in the fed fuel for inducing defluidization during
combustion with an ER of 1.45.
5.3.2 Agglomeration tendency during air blown gasification
Ash-based agglomeration tendencies of WS-1, WS-2 and SFH in air blown gasification/combustion
at various ERs are given in Figure 5-2. The agglomeration tendencies of the two wheat straws are
characterized by an initial increase followed by a decrease as ER decreases in the range of 0.04 - 1.45.
By shifting the ER from 1.45 (combustion region) to 0.36 (gasification region), the amount of wheat
straw ashes fed for inducing defluidization decreases, indicating that the agglomeration tendency of
wheat straws is accelerated by a reducing atmosphere. It has been discussed in Chapter 3 and Chapter
0
50
100
150
200
Am
ou
nt
of
fuel
/ g
, d
b
Dry fuel basis
WS-1 WS-2 SFH
ER=1.45
0
2
4
6
8
10
12
14
Ash basis
Am
ou
nt
of
ash
/ g
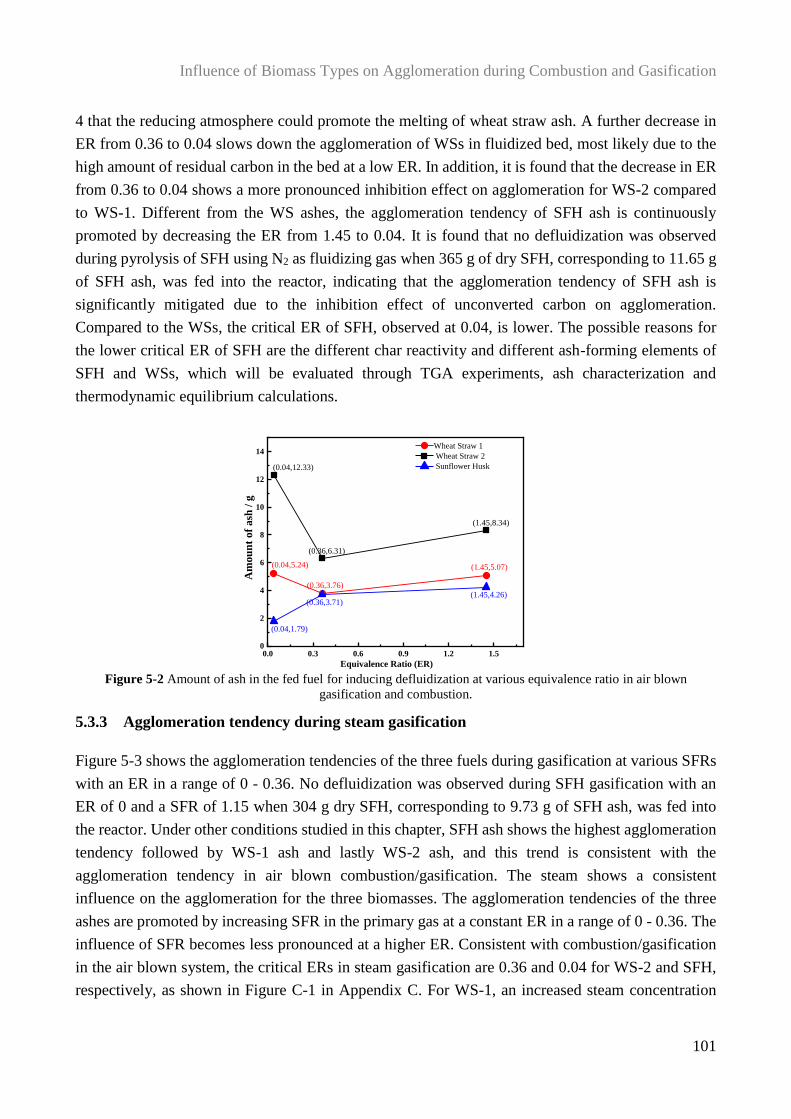
Influence of Biomass Types on Agglomeration during Combustion and Gasification
101
4 that the reducing atmosphere could promote the melting of wheat straw ash. A further decrease in
ER from 0.36 to 0.04 slows down the agglomeration of WSs in fluidized bed, most likely due to the
high amount of residual carbon in the bed at a low ER. In addition, it is found that the decrease in ER
from 0.36 to 0.04 shows a more pronounced inhibition effect on agglomeration for WS-2 compared
to WS-1. Different from the WS ashes, the agglomeration tendency of SFH ash is continuously
promoted by decreasing the ER from 1.45 to 0.04. It is found that no defluidization was observed
during pyrolysis of SFH using N2 as fluidizing gas when 365 g of dry SFH, corresponding to 11.65 g
of SFH ash, was fed into the reactor, indicating that the agglomeration tendency of SFH ash is
significantly mitigated due to the inhibition effect of unconverted carbon on agglomeration.
Compared to the WSs, the critical ER of SFH, observed at 0.04, is lower. The possible reasons for
the lower critical ER of SFH are the different char reactivity and different ash-forming elements of
SFH and WSs, which will be evaluated through TGA experiments, ash characterization and
thermodynamic equilibrium calculations.
Figure 5-2 Amount of ash in the fed fuel for inducing defluidization at various equivalence ratio in air blown
gasification and combustion.
5.3.3 Agglomeration tendency during steam gasification
Figure 5-3 shows the agglomeration tendencies of the three fuels during gasification at various SFRs
with an ER in a range of 0 - 0.36. No defluidization was observed during SFH gasification with an
ER of 0 and a SFR of 1.15 when 304 g dry SFH, corresponding to 9.73 g of SFH ash, was fed into
the reactor. Under other conditions studied in this chapter, SFH ash shows the highest agglomeration
tendency followed by WS-1 ash and lastly WS-2 ash, and this trend is consistent with the
agglomeration tendency in air blown combustion/gasification. The steam shows a consistent
influence on the agglomeration for the three biomasses. The agglomeration tendencies of the three
ashes are promoted by increasing SFR in the primary gas at a constant ER in a range of 0 - 0.36. The
influence of SFR becomes less pronounced at a higher ER. Consistent with combustion/gasification
in the air blown system, the critical ERs in steam gasification are 0.36 and 0.04 for WS-2 and SFH,
respectively, as shown in Figure C-1 in Appendix C. For WS-1, an increased steam concentration
0.0 0.3 0.6 0.9 1.2 1.50
2
4
6
8
10
12
14
(0.04,12.33)
(0.36,6.31)
(1.45,8.34)
(0.04,5.24)
(0.36,3.76)
(1.45,5.07)
(0.04,1.79)
(0.36,3.71)(1.45,4.26)
Am
ou
nt
of
ash
/ g
Equivalence Ratio (ER)
Wheat Straw 1
Wheat Straw 2
Sunflower Husk
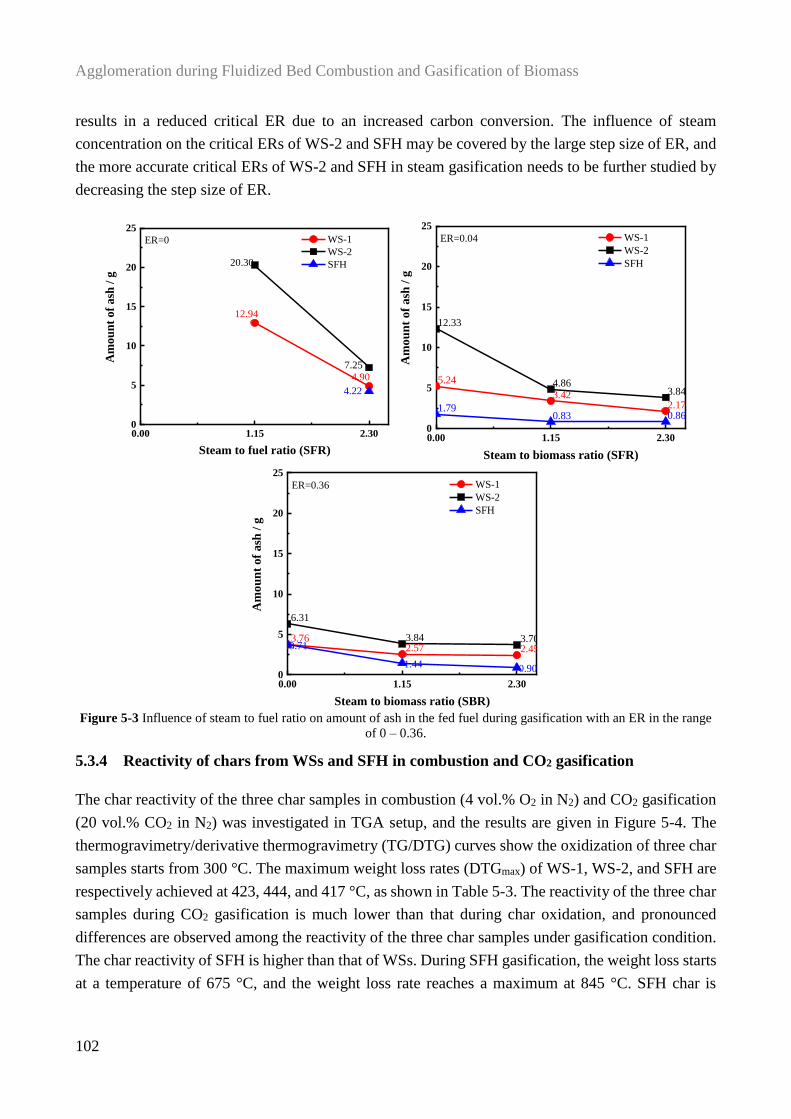
Agglomeration during Fluidized Bed Combustion and Gasification of Biomass
102
results in a reduced critical ER due to an increased carbon conversion. The influence of steam
concentration on the critical ERs of WS-2 and SFH may be covered by the large step size of ER, and
the more accurate critical ERs of WS-2 and SFH in steam gasification needs to be further studied by
decreasing the step size of ER.
Figure 5-3 Influence of steam to fuel ratio on amount of ash in the fed fuel during gasification with an ER in the range
of 0 – 0.36.
5.3.4 Reactivity of chars from WSs and SFH in combustion and CO2 gasification
The char reactivity of the three char samples in combustion (4 vol.% O2 in N2) and CO2 gasification
(20 vol.% CO2 in N2) was investigated in TGA setup, and the results are given in Figure 5-4. The
thermogravimetry/derivative thermogravimetry (TG/DTG) curves show the oxidization of three char
samples starts from 300 °C. The maximum weight loss rates (DTGmax) of WS-1, WS-2, and SFH are
respectively achieved at 423, 444, and 417 °C, as shown in Table 5-3. The reactivity of the three char
samples during CO2 gasification is much lower than that during char oxidation, and pronounced
differences are observed among the reactivity of the three char samples under gasification condition.
The char reactivity of SFH is higher than that of WSs. During SFH gasification, the weight loss starts
at a temperature of 675 °C, and the weight loss rate reaches a maximum at 845 °C. SFH char is
0.00 1.15 2.300
5
10
15
20
25
20.30
7.25
12.94
4.90
4.22
Am
ou
nt
of
ash
/ g
Steam to fuel ratio (SFR)
WS-1
WS-2
SFH
ER=0
0.00 1.15 2.300
5
10
15
20
25
12.33
4.863.84
5.24
3.422.171.79
0.83 0.86A
mo
un
t o
f a
sh /
g
Steam to biomass ratio (SFR)
WS-1
WS-2
SFH
ER=0.04
0.00 1.15 2.300
5
10
15
20
25
6.31
3.84 3.703.762.57 2.453.71
1.44 0.90
Am
ou
nt
of
ash
/ g
Steam to biomass ratio (SBR)
WS-1
WS-2
SFH
ER=0.36
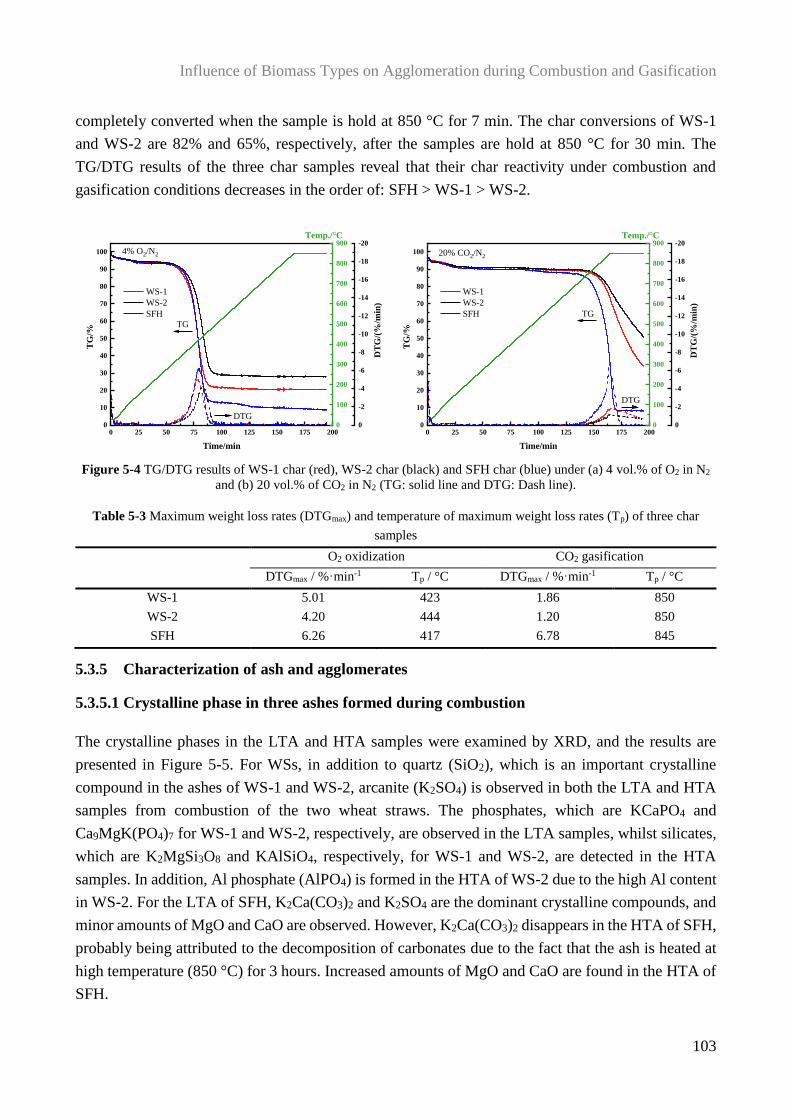
Influence of Biomass Types on Agglomeration during Combustion and Gasification
103
completely converted when the sample is hold at 850 °C for 7 min. The char conversions of WS-1
and WS-2 are 82% and 65%, respectively, after the samples are hold at 850 °C for 30 min. The
TG/DTG results of the three char samples reveal that their char reactivity under combustion and
gasification conditions decreases in the order of: SFH > WS-1 > WS-2.
Figure 5-4 TG/DTG results of WS-1 char (red), WS-2 char (black) and SFH char (blue) under (a) 4 vol.% of O2 in N2
and (b) 20 vol.% of CO2 in N2 (TG: solid line and DTG: Dash line).
Table 5-3 Maximum weight loss rates (DTGmax) and temperature of maximum weight loss rates (Tp) of three char
samples
O2 oxidization CO2 gasification
DTGmax / %⸱min-1 Tp / °C DTGmax / %⸱min-1 Tp / °C
WS-1 5.01 423 1.86 850
WS-2 4.20 444 1.20 850
SFH 6.26 417 6.78 845
5.3.5 Characterization of ash and agglomerates
5.3.5.1 Crystalline phase in three ashes formed during combustion
The crystalline phases in the LTA and HTA samples were examined by XRD, and the results are
presented in Figure 5-5. For WSs, in addition to quartz (SiO2), which is an important crystalline
compound in the ashes of WS-1 and WS-2, arcanite (K2SO4) is observed in both the LTA and HTA
samples from combustion of the two wheat straws. The phosphates, which are KCaPO4 and
Ca9MgK(PO4)7 for WS-1 and WS-2, respectively, are observed in the LTA samples, whilst silicates,
which are K2MgSi3O8 and KAlSiO4, respectively, for WS-1 and WS-2, are detected in the HTA
samples. In addition, Al phosphate (AlPO4) is formed in the HTA of WS-2 due to the high Al content
in WS-2. For the LTA of SFH, K2Ca(CO3)2 and K2SO4 are the dominant crystalline compounds, and
minor amounts of MgO and CaO are observed. However, K2Ca(CO3)2 disappears in the HTA of SFH,
probably being attributed to the decomposition of carbonates due to the fact that the ash is heated at
high temperature (850 °C) for 3 hours. Increased amounts of MgO and CaO are found in the HTA of
SFH.
0 25 50 75 100 125 150 175 2000
10
20
30
40
50
60
70
80
90
100
TG
/%
Time/min
WS-1
WS-2
SFH
4% O2/N2
0
100
200
300
400
500
600
700
800
900Temp./°C
0
-2
-4
-6
-8
-10
-12
-14
-16
-18
-20
DT
G/(
%/m
in)
DTG
TG
0 25 50 75 100 125 150 175 2000
10
20
30
40
50
60
70
80
90
100
TG
/%
Time/min
WS-1
WS-2
SFH
20% CO2/N2
DTG
TG
0
100
200
300
400
500
600
700
800
900Temp./°C
0
-2
-4
-6
-8
-10
-12
-14
-16
-18
-20
DT
G/(
%/m
in)
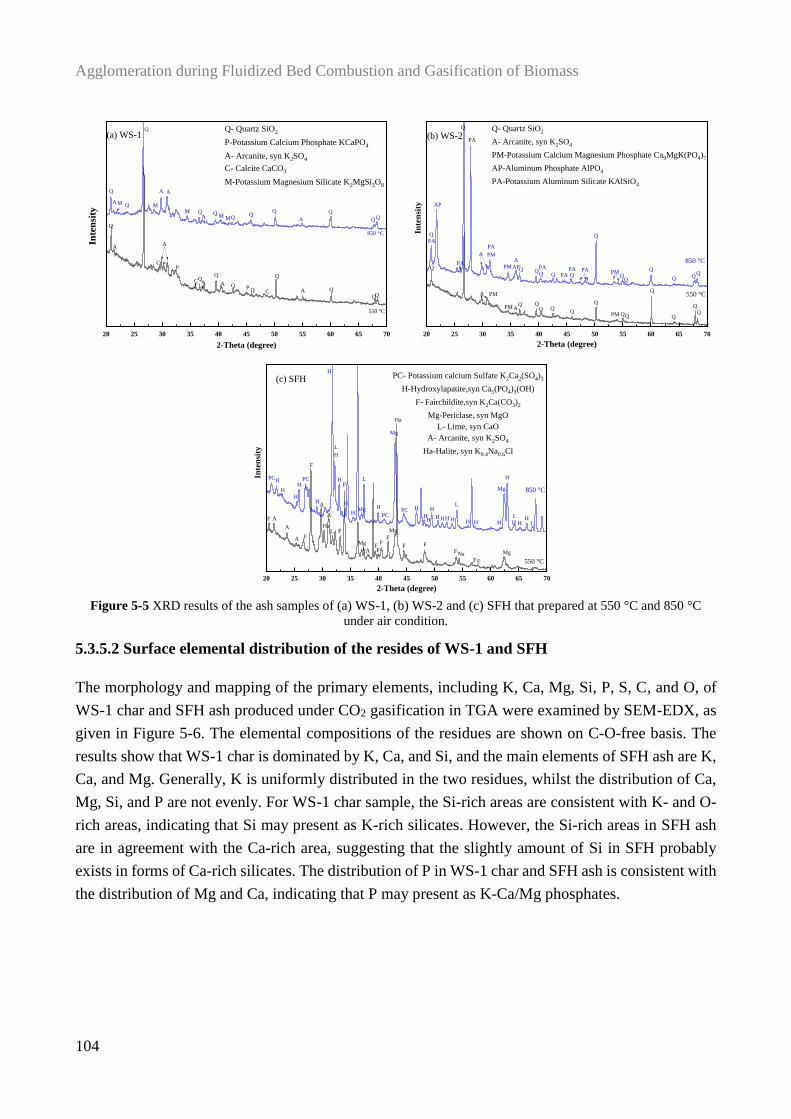
Agglomeration during Fluidized Bed Combustion and Gasification of Biomass
104
Figure 5-5 XRD results of the ash samples of (a) WS-1, (b) WS-2 and (c) SFH that prepared at 550 °C and 850 °C
under air condition.
5.3.5.2 Surface elemental distribution of the resides of WS-1 and SFH
The morphology and mapping of the primary elements, including K, Ca, Mg, Si, P, S, C, and O, of
WS-1 char and SFH ash produced under CO2 gasification in TGA were examined by SEM-EDX, as
given in Figure 5-6. The elemental compositions of the residues are shown on C-O-free basis. The
results show that WS-1 char is dominated by K, Ca, and Si, and the main elements of SFH ash are K,
Ca, and Mg. Generally, K is uniformly distributed in the two residues, whilst the distribution of Ca,
Mg, Si, and P are not evenly. For WS-1 char sample, the Si-rich areas are consistent with K- and O-
rich areas, indicating that Si may present as K-rich silicates. However, the Si-rich areas in SFH ash
are in agreement with the Ca-rich area, suggesting that the slightly amount of Si in SFH probably
exists in forms of Ca-rich silicates. The distribution of P in WS-1 char and SFH ash is consistent with
the distribution of Mg and Ca, indicating that P may present as K-Ca/Mg phosphates.
20 25 30 35 40 45 50 55 60 65 70
Q
Inte
nsi
ty
2-Theta (degree)
Q- Quartz SiO2
P-Potassium Calcium Phosphate KCaPO4
A- Arcanite, syn K2SO4
C- Calcite CaCO3
M-Potassium Magnesium Silicate K2MgSi3O8
Q
QQQ
Q
QPQ
Q
A
PC P
A
Q
AC
AC
A
Q
Q Q Q
Q QQ
A M Q
QQ A
M
A A
MA M M
(a) WS-1
850 °C
550 °C
20 25 30 35 40 45 50 55 60 65 70
Inte
nsi
ty
2-Theta (degree)
Q- Quartz SiO2
A- Arcanite, syn K2SO4
PM-Potassium Calcium Magnesium Phosphate Ca9MgK(PO4)7
AP-Aluminum Phosphate AlPO4
PA-Potassium Aluminum Silicate KAlSiO4
Q
Q Q Q
Q
Q
QQQ
Q
Q
Q
Q QQ Q
PA
A
PM
PMPA PM
Q
Q
QQ Q
A
PM
PM
850 °C
550 °C
AP
PA
PA
PA
PA
AP PAPA
(b) WS-2
PMA
A
20 25 30 35 40 45 50 55 60 65 70
Inte
nsi
ty
2-Theta (degree)
PC- Potassium calcium Sulfate K2Ca2(SO4)3
H-Hydroxylapatite,syn Ca5(PO4)3(OH)
F- Fairchildite,syn K2Ca(CO3)2
Mg-Periclase, syn MgO
L- Lime, syn CaO
A- Arcanite, syn K2SO4
Ha-Halite, syn K0.4Na0.6Cl
850 °C
550 °C
F
FF
FF
F
F
F
F
F F
F
FF
Mg
MgHa
Ha
Na
H
H
H
H
H
H
H
H
H
HH H
HH
H
H HH H H H H
H
H HH
L
PC PC
PCPC
(c) SFH
Mg
Mg
Mg
Mg
L
L
L
L
A
A
A
A
A
A
L
L
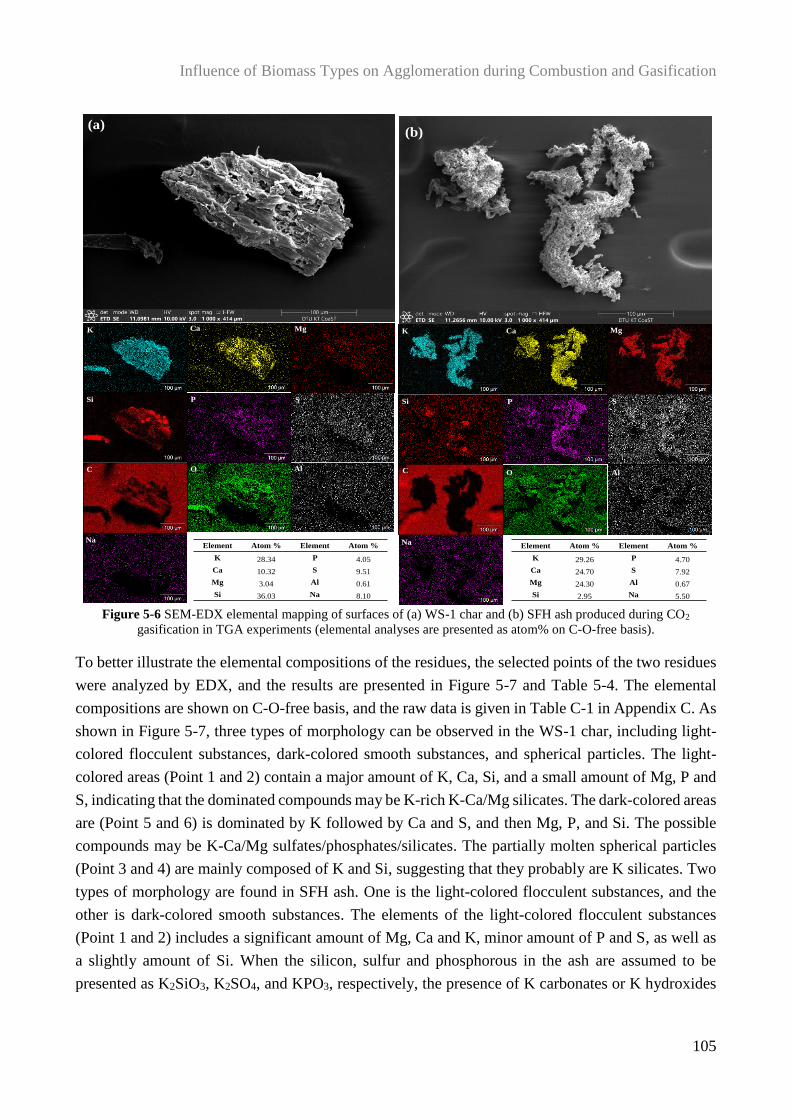
Influence of Biomass Types on Agglomeration during Combustion and Gasification
105
Figure 5-6 SEM-EDX elemental mapping of surfaces of (a) WS-1 char and (b) SFH ash produced during CO2
gasification in TGA experiments (elemental analyses are presented as atom% on C-O-free basis).
To better illustrate the elemental compositions of the residues, the selected points of the two residues
were analyzed by EDX, and the results are presented in Figure 5-7 and Table 5-4. The elemental
compositions are shown on C-O-free basis, and the raw data is given in Table C-1 in Appendix C. As
shown in Figure 5-7, three types of morphology can be observed in the WS-1 char, including light-
colored flocculent substances, dark-colored smooth substances, and spherical particles. The light-
colored areas (Point 1 and 2) contain a major amount of K, Ca, Si, and a small amount of Mg, P and
S, indicating that the dominated compounds may be K-rich K-Ca/Mg silicates. The dark-colored areas
are (Point 5 and 6) is dominated by K followed by Ca and S, and then Mg, P, and Si. The possible
compounds may be K-Ca/Mg sulfates/phosphates/silicates. The partially molten spherical particles
(Point 3 and 4) are mainly composed of K and Si, suggesting that they probably are K silicates. Two
types of morphology are found in SFH ash. One is the light-colored flocculent substances, and the
other is dark-colored smooth substances. The elements of the light-colored flocculent substances
(Point 1 and 2) includes a significant amount of Mg, Ca and K, minor amount of P and S, as well as
a slightly amount of Si. When the silicon, sulfur and phosphorous in the ash are assumed to be
presented as K2SiO3, K2SO4, and KPO3, respectively, the presence of K carbonates or K hydroxides
Element Atom % Element Atom %
K 28.34 P 4.05
Ca 10.32 S 9.51
Mg 3.04 Al 0.61
Si 36.03 Na 8.10
Mg
OC
SSi P
Ca
P
(a)
Al
K
Na
Mg
OC
SSi P
Ca
Al
K
(b)
NaElement Atom % Element Atom %
K 29.26 P 4.70
Ca 24.70 S 7.92
Mg 24.30 Al 0.67
Si 2.95 Na 5.50
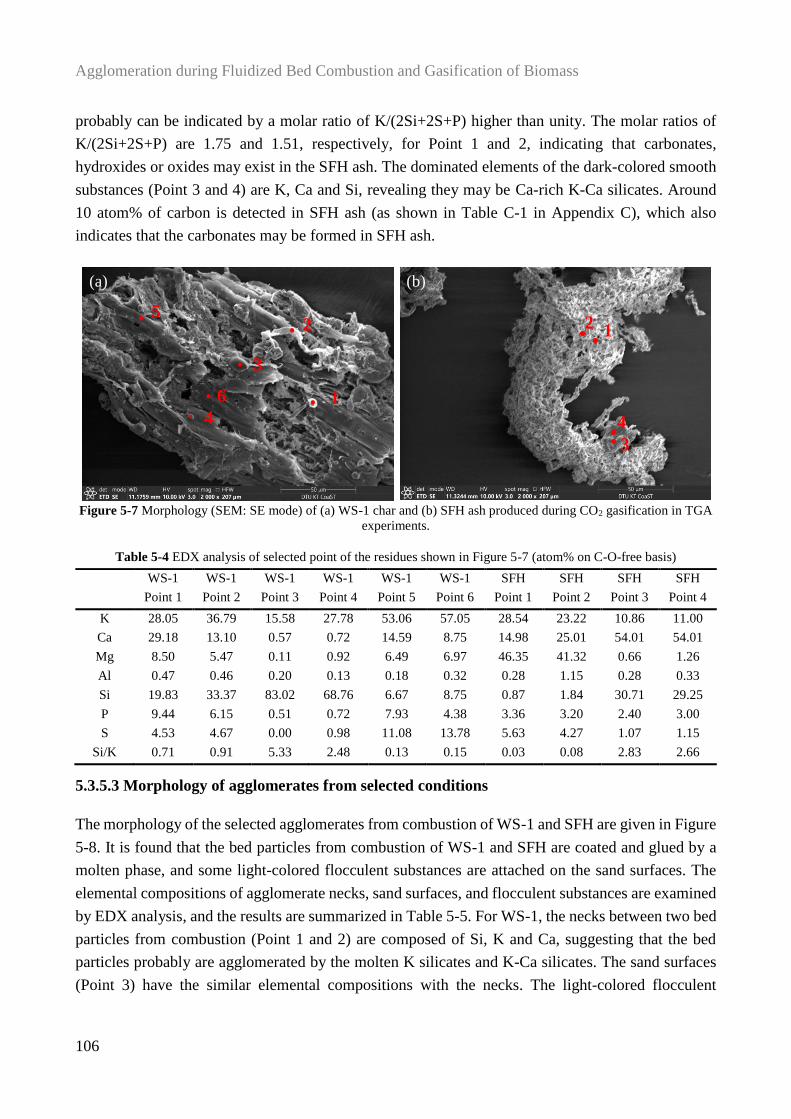
Agglomeration during Fluidized Bed Combustion and Gasification of Biomass
106
probably can be indicated by a molar ratio of K/(2Si+2S+P) higher than unity. The molar ratios of
K/(2Si+2S+P) are 1.75 and 1.51, respectively, for Point 1 and 2, indicating that carbonates,
hydroxides or oxides may exist in the SFH ash. The dominated elements of the dark-colored smooth
substances (Point 3 and 4) are K, Ca and Si, revealing they may be Ca-rich K-Ca silicates. Around
10 atom% of carbon is detected in SFH ash (as shown in Table C-1 in Appendix C), which also
indicates that the carbonates may be formed in SFH ash.
Figure 5-7 Morphology (SEM: SE mode) of (a) WS-1 char and (b) SFH ash produced during CO2 gasification in TGA
experiments.
Table 5-4 EDX analysis of selected point of the residues shown in Figure 5-7 (atom% on C-O-free basis)
WS-1
Point 1
WS-1
Point 2
WS-1
Point 3
WS-1
Point 4
WS-1
Point 5
WS-1
Point 6
SFH
Point 1
SFH
Point 2
SFH
Point 3
SFH
Point 4
K 28.05 36.79 15.58 27.78 53.06 57.05 28.54 23.22 10.86 11.00
Ca 29.18 13.10 0.57 0.72 14.59 8.75 14.98 25.01 54.01 54.01
Mg 8.50 5.47 0.11 0.92 6.49 6.97 46.35 41.32 0.66 1.26
Al 0.47 0.46 0.20 0.13 0.18 0.32 0.28 1.15 0.28 0.33
Si 19.83 33.37 83.02 68.76 6.67 8.75 0.87 1.84 30.71 29.25
P 9.44 6.15 0.51 0.72 7.93 4.38 3.36 3.20 2.40 3.00
S 4.53 4.67 0.00 0.98 11.08 13.78 5.63 4.27 1.07 1.15
Si/K 0.71 0.91 5.33 2.48 0.13 0.15 0.03 0.08 2.83 2.66
5.3.5.3 Morphology of agglomerates from selected conditions
The morphology of the selected agglomerates from combustion of WS-1 and SFH are given in Figure
5-8. It is found that the bed particles from combustion of WS-1 and SFH are coated and glued by a
molten phase, and some light-colored flocculent substances are attached on the sand surfaces. The
elemental compositions of agglomerate necks, sand surfaces, and flocculent substances are examined
by EDX analysis, and the results are summarized in Table 5-5. For WS-1, the necks between two bed
particles from combustion (Point 1 and 2) are composed of Si, K and Ca, suggesting that the bed
particles probably are agglomerated by the molten K silicates and K-Ca silicates. The sand surfaces
(Point 3) have the similar elemental compositions with the necks. The light-colored flocculent
3
2
1
5
6
4
(a)
12
3
4
(b)
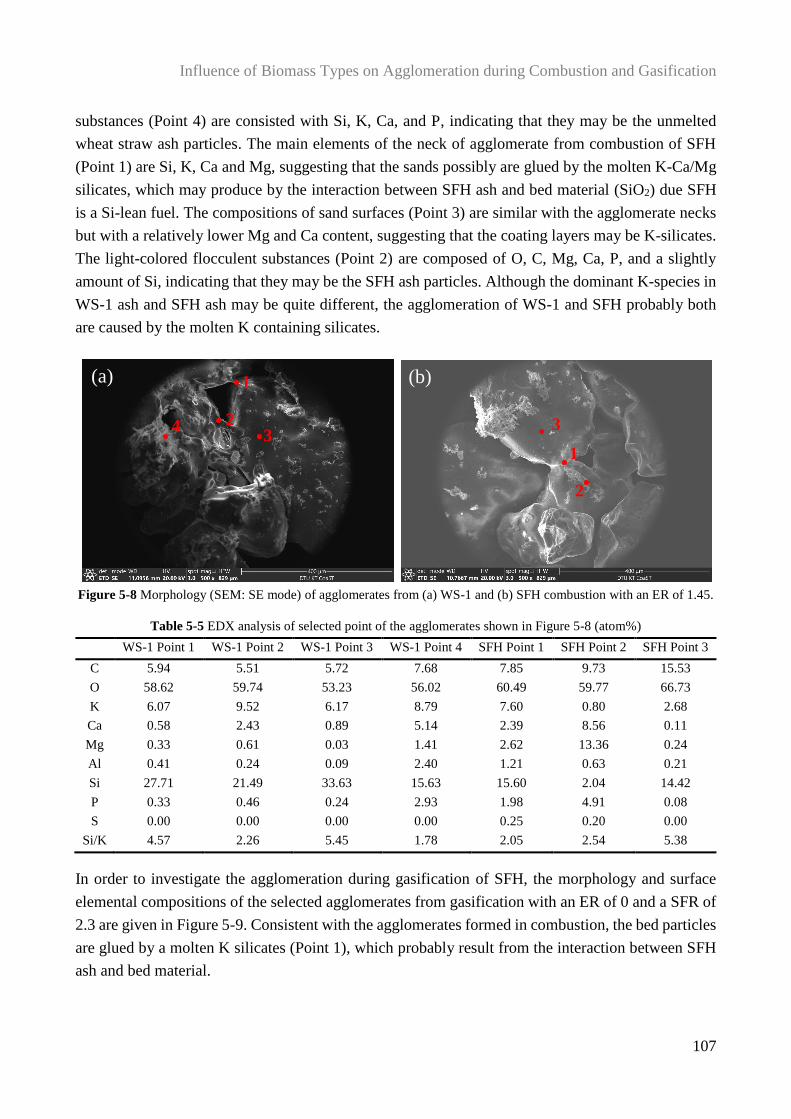
Influence of Biomass Types on Agglomeration during Combustion and Gasification
107
substances (Point 4) are consisted with Si, K, Ca, and P, indicating that they may be the unmelted
wheat straw ash particles. The main elements of the neck of agglomerate from combustion of SFH
(Point 1) are Si, K, Ca and Mg, suggesting that the sands possibly are glued by the molten K-Ca/Mg
silicates, which may produce by the interaction between SFH ash and bed material (SiO2) due SFH
is a Si-lean fuel. The compositions of sand surfaces (Point 3) are similar with the agglomerate necks
but with a relatively lower Mg and Ca content, suggesting that the coating layers may be K-silicates.
The light-colored flocculent substances (Point 2) are composed of O, C, Mg, Ca, P, and a slightly
amount of Si, indicating that they may be the SFH ash particles. Although the dominant K-species in
WS-1 ash and SFH ash may be quite different, the agglomeration of WS-1 and SFH probably both
are caused by the molten K containing silicates.
Figure 5-8 Morphology (SEM: SE mode) of agglomerates from (a) WS-1 and (b) SFH combustion with an ER of 1.45.
Table 5-5 EDX analysis of selected point of the agglomerates shown in Figure 5-8 (atom%)
WS-1 Point 1 WS-1 Point 2 WS-1 Point 3 WS-1 Point 4 SFH Point 1 SFH Point 2 SFH Point 3
C 5.94 5.51 5.72 7.68 7.85 9.73 15.53
O 58.62 59.74 53.23 56.02 60.49 59.77 66.73
K 6.07 9.52 6.17 8.79 7.60 0.80 2.68
Ca 0.58 2.43 0.89 5.14 2.39 8.56 0.11
Mg 0.33 0.61 0.03 1.41 2.62 13.36 0.24
Al 0.41 0.24 0.09 2.40 1.21 0.63 0.21
Si 27.71 21.49 33.63 15.63 15.60 2.04 14.42
P 0.33 0.46 0.24 2.93 1.98 4.91 0.08
S 0.00 0.00 0.00 0.00 0.25 0.20 0.00
Si/K 4.57 2.26 5.45 1.78 2.05 2.54 5.38
In order to investigate the agglomeration during gasification of SFH, the morphology and surface
elemental compositions of the selected agglomerates from gasification with an ER of 0 and a SFR of
2.3 are given in Figure 5-9. Consistent with the agglomerates formed in combustion, the bed particles
are glued by a molten K silicates (Point 1), which probably result from the interaction between SFH
ash and bed material.
43
2
1(a)
2
3
1
(b)
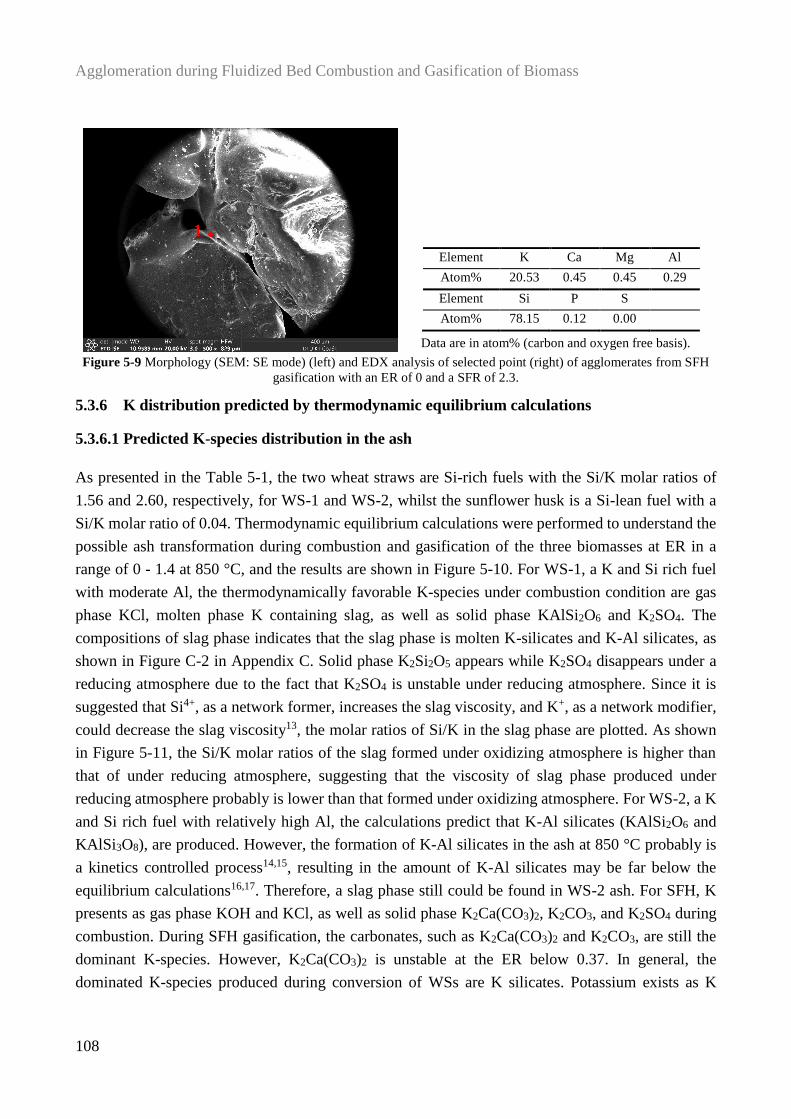
Agglomeration during Fluidized Bed Combustion and Gasification of Biomass
108
Element K Ca Mg Al
Atom% 20.53 0.45 0.45 0.29
Element Si P S
Atom% 78.15 0.12 0.00
Data are in atom% (carbon and oxygen free basis).
Figure 5-9 Morphology (SEM: SE mode) (left) and EDX analysis of selected point (right) of agglomerates from SFH
gasification with an ER of 0 and a SFR of 2.3.
5.3.6 K distribution predicted by thermodynamic equilibrium calculations
5.3.6.1 Predicted K-species distribution in the ash
As presented in the Table 5-1, the two wheat straws are Si-rich fuels with the Si/K molar ratios of
1.56 and 2.60, respectively, for WS-1 and WS-2, whilst the sunflower husk is a Si-lean fuel with a
Si/K molar ratio of 0.04. Thermodynamic equilibrium calculations were performed to understand the
possible ash transformation during combustion and gasification of the three biomasses at ER in a
range of 0 - 1.4 at 850 °C, and the results are shown in Figure 5-10. For WS-1, a K and Si rich fuel
with moderate Al, the thermodynamically favorable K-species under combustion condition are gas
phase KCl, molten phase K containing slag, as well as solid phase KAlSi2O6 and K2SO4. The
compositions of slag phase indicates that the slag phase is molten K-silicates and K-Al silicates, as
shown in Figure C-2 in Appendix C. Solid phase K2Si2O5 appears while K2SO4 disappears under a
reducing atmosphere due to the fact that K2SO4 is unstable under reducing atmosphere. Since it is
suggested that Si4+, as a network former, increases the slag viscosity, and K+, as a network modifier,
could decrease the slag viscosity13, the molar ratios of Si/K in the slag phase are plotted. As shown
in Figure 5-11, the Si/K molar ratios of the slag formed under oxidizing atmosphere is higher than
that of under reducing atmosphere, suggesting that the viscosity of slag phase produced under
reducing atmosphere probably is lower than that formed under oxidizing atmosphere. For WS-2, a K
and Si rich fuel with relatively high Al, the calculations predict that K-Al silicates (KAlSi2O6 and
KAlSi3O8), are produced. However, the formation of K-Al silicates in the ash at 850 °C probably is
a kinetics controlled process14,15, resulting in the amount of K-Al silicates may be far below the
equilibrium calculations16,17. Therefore, a slag phase still could be found in WS-2 ash. For SFH, K
presents as gas phase KOH and KCl, as well as solid phase K2Ca(CO3)2, K2CO3, and K2SO4 during
combustion. During SFH gasification, the carbonates, such as K2Ca(CO3)2 and K2CO3, are still the
dominant K-species. However, K2Ca(CO3)2 is unstable at the ER below 0.37. In general, the
dominated K-species produced during conversion of WSs are K silicates. Potassium exists as K
1
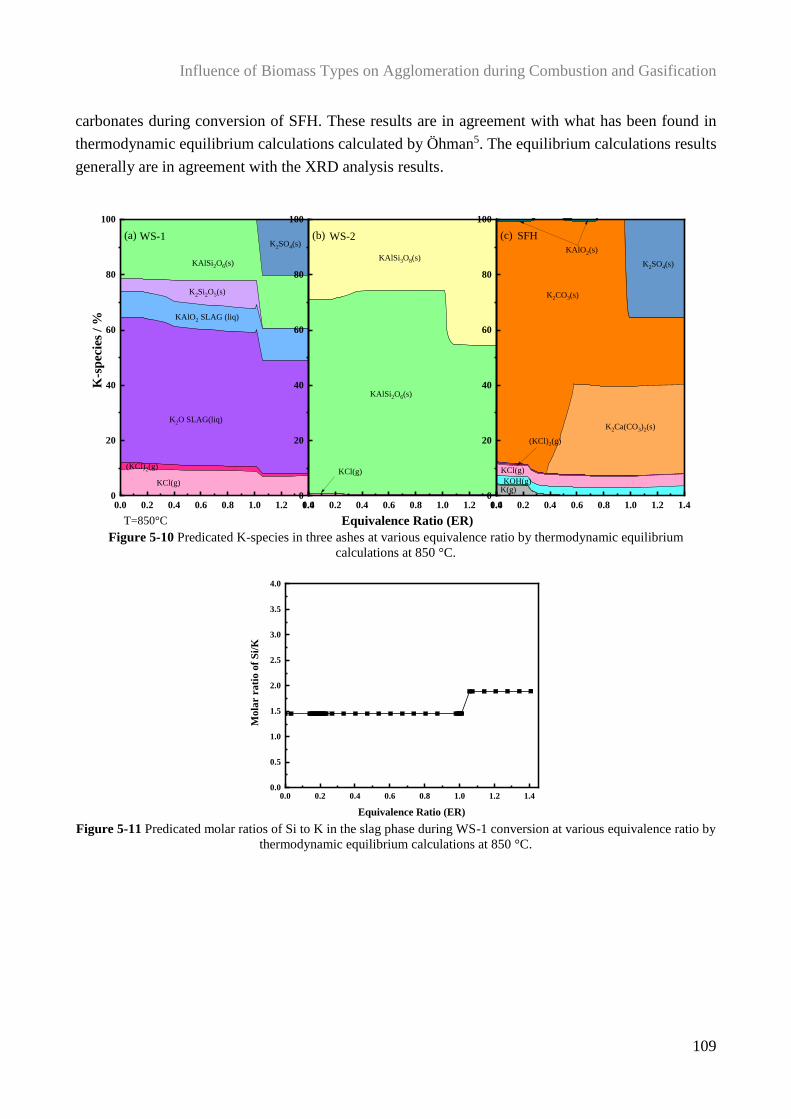
Influence of Biomass Types on Agglomeration during Combustion and Gasification
109
carbonates during conversion of SFH. These results are in agreement with what has been found in
thermodynamic equilibrium calculations calculated by Öhman5. The equilibrium calculations results
generally are in agreement with the XRD analysis results.
Figure 5-10 Predicated K-species in three ashes at various equivalence ratio by thermodynamic equilibrium
calculations at 850 °C.
Figure 5-11 Predicated molar ratios of Si to K in the slag phase during WS-1 conversion at various equivalence ratio by
thermodynamic equilibrium calculations at 850 °C.
0.0 0.2 0.4 0.6 0.8 1.0 1.2 1.40
20
40
60
80
100
KCl(g)
K2SO4(s)
T=850°C
(a) WS-1
K-s
pec
ies
/ %
KAlSi2O6(s)
(KCl)2(g)
K2O SLAG(liq)
KAlO2 SLAG (liq)
K2Si2O5(s)
0.0 0.2 0.4 0.6 0.8 1.0 1.2 1.40
20
40
60
80
100
KAlSi2O6(s)
Equivalence Ratio (ER)
(b) WS-2
KAlSi3O8(s)
KCl(g)
0.0 0.2 0.4 0.6 0.8 1.0 1.2 1.40
20
40
60
80
100
(c) SFH
K2SO4(s)
K2CO3(s)
K2Ca(CO3)2(s)
K(g) KOH(g)
KCl(g)
KAlO2(s)
(KCl)2(g)
0.0 0.2 0.4 0.6 0.8 1.0 1.2 1.40.0
0.5
1.0
1.5
2.0
2.5
3.0
3.5
4.0
Mo
lar
ra
tio
of
Si/
K
Equivalence Ratio (ER)
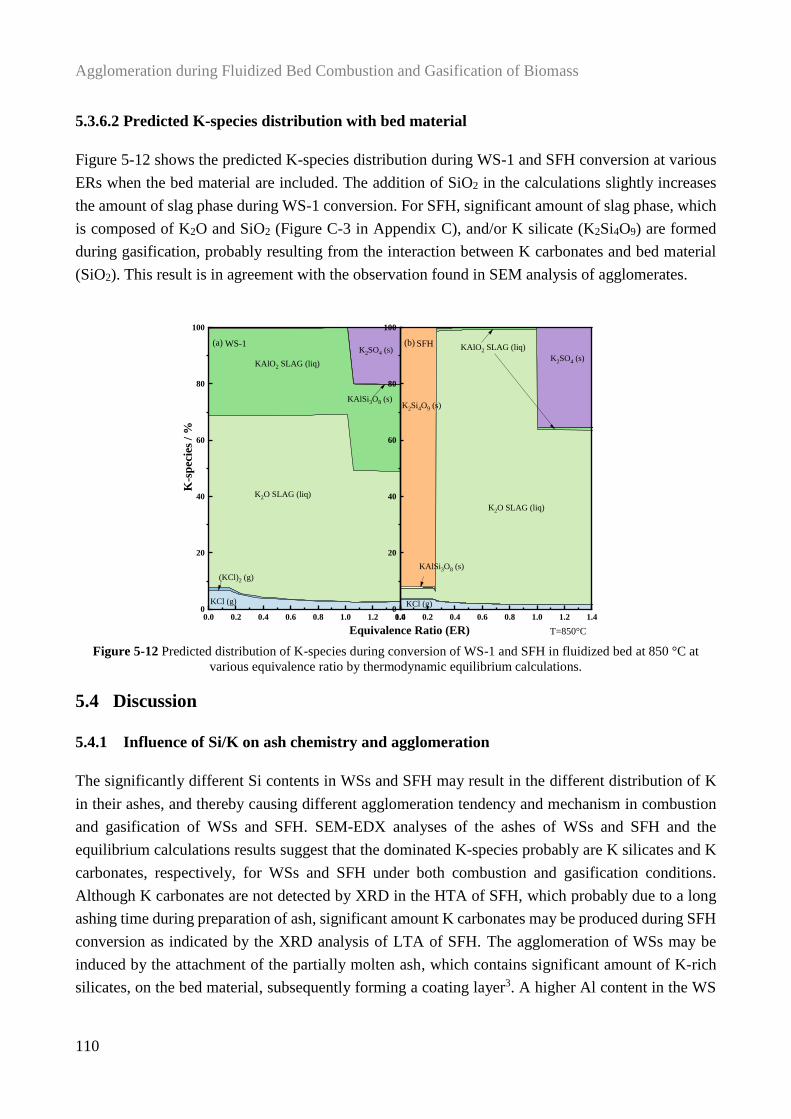
Agglomeration during Fluidized Bed Combustion and Gasification of Biomass
110
5.3.6.2 Predicted K-species distribution with bed material
Figure 5-12 shows the predicted K-species distribution during WS-1 and SFH conversion at various
ERs when the bed material are included. The addition of SiO2 in the calculations slightly increases
the amount of slag phase during WS-1 conversion. For SFH, significant amount of slag phase, which
is composed of K2O and SiO2 (Figure C-3 in Appendix C), and/or K silicate (K2Si4O9) are formed
during gasification, probably resulting from the interaction between K carbonates and bed material
(SiO2). This result is in agreement with the observation found in SEM analysis of agglomerates.
Figure 5-12 Predicted distribution of K-species during conversion of WS-1 and SFH in fluidized bed at 850 °C at
various equivalence ratio by thermodynamic equilibrium calculations.
5.4 Discussion
5.4.1 Influence of Si/K on ash chemistry and agglomeration
The significantly different Si contents in WSs and SFH may result in the different distribution of K
in their ashes, and thereby causing different agglomeration tendency and mechanism in combustion
and gasification of WSs and SFH. SEM-EDX analyses of the ashes of WSs and SFH and the
equilibrium calculations results suggest that the dominated K-species probably are K silicates and K
carbonates, respectively, for WSs and SFH under both combustion and gasification conditions.
Although K carbonates are not detected by XRD in the HTA of SFH, which probably due to a long
ashing time during preparation of ash, significant amount K carbonates may be produced during SFH
conversion as indicated by the XRD analysis of LTA of SFH. The agglomeration of WSs may be
induced by the attachment of the partially molten ash, which contains significant amount of K-rich
silicates, on the bed material, subsequently forming a coating layer3. A higher Al content in the WS
0.0 0.2 0.4 0.6 0.8 1.0 1.2 1.40
20
40
60
80
100
T=850°C
(a) WS-1
K-s
pec
ies
/ %
KCl (g)
K2O SLAG (liq)
KAlO2 SLAG (liq)
(KCl)2 (g)
KAlSi3O8 (s)
K2SO4 (s)
0.0 0.2 0.4 0.6 0.8 1.0 1.2 1.40
20
40
60
80
100
Equivalence Ratio (ER)
(b) SFH
KCl (g)
KAlSi3O8 (s)
K2SO4 (s)
K2Si4O9 (s)
K2O SLAG (liq)
KAlO2 SLAG (liq)
Influence of Biomass Types on Agglomeration during Combustion and Gasification
111
ash may increase the melting temperature of ash18, causing a decrease in the agglomeration tendency
of WS ash. Therefore, WS-2 ash has a lower agglomeration tendency than WS-1 ash. Although SFH
is a Si-lean fuel, the dominated compositions of agglomeration necks still are molten K silicates.
Therefore, the agglomeration during conversion of SFH may be caused by the interaction between
SFH ash, whose ash may contain significant amount of K carbonates, and SiO2. It is has be shown
that K2CO3 may induce agglomeration under air condition by forming molten K silicates though
reaction between K2CO3 and silica sand19.
A reducing atmosphere and a high concentration of steam in gasification accelerate the agglomeration
of WS ashes and SFH ash (as shown in Figure 5-2 and 5-3). As discussed in Chapter 3 and Chapter
4, the reducing atmosphere promotes the melting of the WS ashes, and thereby accelerating the
agglomeration of WSs. The presence of steam most likely to decrease the residual carbon amount in
the bed and to lower the viscosity of WS ashes, resulting in an accelerated agglomeration. The SEM-
EDX analyses of agglomerates from gasification (Figure5-9) indicates that the formation of K
silicates via the interaction between SFH ash and bed material may be the dominant agglomeration
mechanism during SFH gasification. It is speculated that the reactivity of K2CO3 towards SiO2 is
promoted by the reducing atmosphere19. In addition, it is suggested that K2CO3 can be converted into
KOH by reacting with steam19,21,22, resulting in the reactivity of K2CO3 towards SiO2 is strongly
enhanced by the presence of steam22. It also has been speculated that SiO2 probably could be glued
by a molten KOH, which has a melting temperature of 360 °C, in a K2CO3/SiO2 system under a steam
containing atmosphere19. The promoted agglomeration of SFH caused by a reducing atmosphere and
a high concentration of steam in this study may be related to these speculations. The melting of SFH
ash may be promoted by the reducing atmosphere, due to the fact that K2SO4 with a melting
temperature of 1069 °C is unstable under reducing atmosphere (as shown in Figure 5-10). Meanwhile,
the reducing atmosphere probably accelerate the interaction between SFH ash and bed material, thus
promoting the agglomeration. Under the condition with a high concentration of steam, the accelerated
agglomeration probably caused by an increased melting of ashes and a promoted interaction between
SFH ash and bed material. In addition, the viscosity of the produced K silicates may also be lowered
by the steam. However, the detailed mechanism of influence of reducing atmosphere and steam on
agglomeration of SFH needs to be further studied.
5.4.2 Influence of char reactivity on agglomeration
During gasification of biomass, the inhibition effect of residual carbon caused by decreasing ER
decreases with increasing char reactivity. A higher char reactivity will result in a low amount of
residual carbon in the bed and thereby causes a less inhibition effect on agglomeration during
gasification, thus may increase the agglomeration tendency of biomass. The char reactivity of the
three biomasses is consistent with their agglomeration tendency observed in fluidized bed gasification
experiments with a low ER. Therefore, the higher amount of residual carbon in the bed in LTCFB
gasification of WS-2, caused by the lower char reactivity of WS-2, may be the dominate reason for
Agglomeration during Fluidized Bed Combustion and Gasification of Biomass
112
the different agglomeration behaviors of WS-1 and WS-2 in LTCFB gasifier described in Chapter 1,
Section 1.1. In the air blown gasification system, the lower critical ER of SFH compared to the WSs
may be partially attributed to the higher char reactivity of SFH.
5.5 Conclusions
The agglomeration of two types of biomass (two batches of wheat straws and one sunflower husk) in
fluidized bed combustion and gasification are investigated in this chapter. The effects of char
reactivity and molar ratio of Si/K on the agglomeration of biomass at various ERs and SFRs are
studied. The following conclusions can be drawn:
(1) The difference in the molar ratios of Si/K in WSs and SFH may result in the different
agglomeration tendency and mechanisms of WSs and SFH. During combustion and gasification of
WSs, the agglomeration may be caused by the partially molten ashes adhere on the bed particles and
subsequently form a coating layer. The SFH ash may lead to the agglomeration by forming K silicates
via interacting with bed particles (SiO2) during SFH conversion. For WSs, the higher Al content in
WS-2 compared to WS-1 may result in a decrease in the melting of ash, and thereby causing a
decrease in the agglomeration tendency during conversion.
(2) A reducing atmosphere, a high concentration of steam, and the residual carbon in the bed show
consistent effect on the agglomeration of the three fuels. However, the reducing atmosphere and
steam probably promote the agglomeration of Si-rich wheat straws and Si-lean sunflower husk by
different routes due to their different agglomeration mechanisms. For SFH, the promoted
agglomeration under a reducing atmosphere and a high concentration of steam probably results from
an increased melting of ash and a promoted interaction between ash and bed particles. The detailed
mechanism of influence of reducing atmosphere and steam on agglomeration of SFH needs to be
further studied.
(3) During gasification of biomass, the inhibition effect of residual carbon caused by decreasing ER
reduces with increasing char reactivity. The high char reactivity of SFH results in less residual carbon
in the bed, thus causing a high agglomeration tendency of SFH during gasification with a low ER.
(4) The critical ER of SFH, which is 0.04, is lower than that of WSs, which are 0.36. The low critical
ER of SFH is probably attributed to the high char reactivity of SFH and the different agglomeration
mechanism of SFH from WSs caused by a low Si/K molar ratio.
Influence of Biomass Types on Agglomeration during Combustion and Gasification
113
Reference
(1) Scala, F. Particle Agglomeration during Fluidized Bed Combustion: Mechanisms, Early
Detection and Possible Countermeasures. Fuel Process. Technol. 2018, 171, 31–38.
(2) Morris, J. D.; Sheraz, S.; Chilton, S.; Nimmo, W. Mechanisms and Mitigation of
Agglomeration during Fluidize Bed Combustion of Biomass : A Review. Fuel 2018, 230, 452–
473.
(3) Grimm, A.; Skoglund, N.; Boström, D.; Öhman, M.; Bostr, D.; Ohman, M.; Boström, D.;
Öhman, M.; Bostr, D.; Ohman, M. Bed Agglomeration Characteristics in Fluidized Quartz Bed
Combustion of Phosphorus-Rich Biomass Fuels. Energy & Fuels 2011, 25 (3), 937–947.
(4) Brus, E.; Öhman, M.; Nordin, A. Mechanisms of Bed Agglomeration during Fluidized-Bed
Combustion of Biomass Fuels. Energy & Fuels 2005, 19 (3), 825–832.
(5) Öhman, M.; Pommer, L.; Nordin, A. Bed Agglomeration Characteristics and Mechanisms
during Gasification and Combustion of Biomass Fuels. Energy & Fuels 2005, 19 (4), 1742–
1748.
(6) Gatternig, B.; Karl, J. Investigations on the Mechanisms of Ash-Induced Agglomeration in
Fluidized-Bed Combustion of Biomass. Energy & Fuels 2015, 29, 931–941.
(7) Lin, W.; Dam-Johansen, K.; Frandsen, F. Agglomeration in Bio-Fuel Fired Fluidized Bed
Combustors. Chem. Eng. J. 2003, 96 (1–3), 171–185.
(8) Lin, W.; Jensen, A. D.; Johnsson, J. E.; Dam-Johansen, K. Combustion of Biomass in Fluidized
Beds: Problems and Some Solutions Based on Danish Experiences. In Proceedings of the 17th
International Conference on Fluidized Bed Combustion; American Society of Mechanical
Engineers: Jacksonville, Florida USA, 2003; pp 945–953.
(9) Lin, W.; Krusholm, G.; Dam-Johansen, K.; Musahl, E.; Bank, L. Agglomeration Phenomena
in Fluidized Bed Combustion of Straw. In Proceedings of the 14h International Conference
on Fluidized Bed Combustion; American Society of Mechanical Engineers: Canada, 1997; Vol.
2, pp 831–837.
(10) George, J.; Arun, P.; Muraleedharan, C. Experimental Investigation on Co-Gasification of
Coffee Husk and Sawdust in a Bubbling Fluidised Bed Gasifier. J. Energy Inst. 2019, 92 (6),
1977–1986.
(11) Werther, J.; Saenger, M.; Hartge, E. U.; Ogada, T.; Siagi, Z. Combustion of Agricultural
Residues. Prog. Energy Combust. Sci. 2000, 26 (1), 1–27.
(12) Chaivatamaset, P.; Tia, S. The Characteristics of Bed Agglomeration during Fluidized Bed
Combustion of Eucalyptus Bark. Appl. Therm. Eng. 2015, 75, 1134–1146.
(13) Gao, J.; Wen, G.; Huang, T.; Tang, P.; Liu, Q. Effects of the Composition on the Structure and
Viscosity of the CaO–SiO2-Based Mold Flux. J. Non. Cryst. Solids 2016, 435, 33–39.
(14) Wang, G.; Jensen, P. A.; Wu, H.; Frandsen, F. J.; Sander, B.; Glarborg, P. Potassium Capture
Agglomeration during Fluidized Bed Combustion and Gasification of Biomass
114
by Kaolin, Part 1: KOH. Energy & Fuels 2018, 32 (2), 1851–1862.
(15) Wang, G.; Jensen, P. A.; Wu, H.; Frandsen, F. J.; Sander, B.; Glarborg, P. Potassium Capture
by Kaolin, Part 2: K2CO3, KCl, and K2SO4. Energy & Fuels 2018, 32 (3), 3566–3578.
(16) Wang, G.; Jensen, P. A.; Wu, H.; Frandsen, F. J.; Laxminarayan, Y.; Sander, B.; Glarborg, P.
KOH Capture by Coal Fly Ash. Fuel 2019, 242, 828–836.
(17) Wang, G.; Jensen, P. A.; Wu, H.; Frandsen, F. J.; Laxminarayan, Y.; Sander, B.; Glarborg, P.
Potassium Capture by Coal Fly Ash: K2CO3, KCl and K2SO4. Fuel Process. Technol. 2019,
194.
(18) Olofsson, G.; Ye, Z.; Bjerle, I.; Andersson, A. Bed Agglomeration Problems in Fluidized-Bed
Biomass Combustion. Ind. Eng. Chem. Res. 2002, 41, 2888–2894.
(19) Ma, T.; Fan, C.; Hao, L.; Li, S.; Jensen, P. A.; Song, W.; Lin, W.; Dam-Johansen, K. Biomass
Ash Induced Agglomeration in Fluidized Bed. Part 2: Effect of Potassium Salts in Different
Gas Composition. Fuel Process. Technol. 2018, 180, 130–139.
(20) Aničić, B. Agglomeration Mechanisms during Fluidized Bed Combustion of Biomass,
Technical University of Denmark, 2018.
(21) Sevonius, C.; Yrjas, P.; Hupa, M. Defluidization of a Quartz Bed - Laboratory Experiments
with Potassium Salts. Fuel 2014, 127, 161–168.
(22) Zhao, H.; Xu, W.; Song, Q.; Zhuo, J.; Yao, Q. Effect of Steam and SiO2 on the Release and
Transformation of K2CO3 and KCl during Biomass Thermal Conversion. Energy & Fuels 2018,
32 (9), 9633–9639.
Application of Pulse Flow to a Fluidized Bed for Combustion and Gasification of Wheat Straw
This chapter has been written in a manuscript format. A slightly modified version of this chapter will
be submitted to a peer-reviewed journal.
6. Application of Pulse Flow to a Fluidized Bed for
Combustion and Gasification of Wheat Straw
Abstract
Agglomeration may cause severe problems in operation of biomass combustion and gasification in
fluidized beds. Improving fluidization quality by external forces may be one of the options as the
potential countermeasure to mitigate the agglomeration problem. In this chapter, the pulsed flow is
applied to the fluidized bed reactor to examine the possibility for mitigation of agglomeration in
combustion and gasification of wheat straw. The effects of parameters related to pulsed flow, such as
flow rate ratio of pulsation (defined as the flow rate of pulsed flow divided by the total flow rate of
primary gas), pulsation frequency and pulsation duty cycle (defined as the time of “flow-ON” period
divided by the “flow-OFF” period in a pulsation), on the agglomeration tendency were studied in a
lab-scale bubbling fluidized bed reactor at 850 °C using silica sand as bed material. The results reveal
that the introducing of a pulsed flow to the reactor mitigates the agglomeration in fluidized bed
combustor and gasifier. Among the parameters studied, the pulsation duty cycle shows the most
significant effect on reducing the agglomeration tendency, while the pulsation frequency shows the
least impact. At the condition of pulsation flow rate ratio of 0.4, pulsation frequency of 1.5 Hz and
pulsation duty cycle of 25/75, the amounts of straw fed for inducing defluidization is 151.7% and
137.5% of that under the condition with the continuous flow for in combustion and gasification,
respectively. Moreover, the effect of application of the pulsed flow to the reaction process is
negligible.
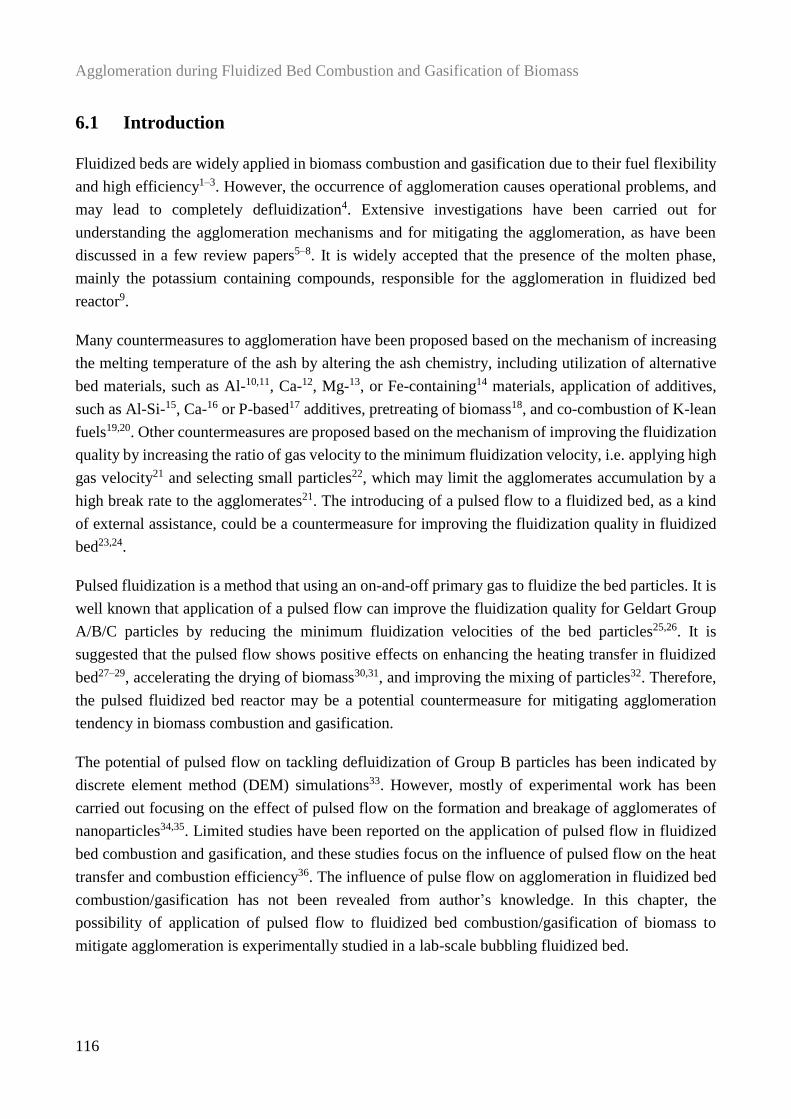
Agglomeration during Fluidized Bed Combustion and Gasification of Biomass
116
6.1 Introduction
Fluidized beds are widely applied in biomass combustion and gasification due to their fuel flexibility
and high efficiency1–3. However, the occurrence of agglomeration causes operational problems, and
may lead to completely defluidization4. Extensive investigations have been carried out for
understanding the agglomeration mechanisms and for mitigating the agglomeration, as have been
discussed in a few review papers5–8. It is widely accepted that the presence of the molten phase,
mainly the potassium containing compounds, responsible for the agglomeration in fluidized bed
reactor9.
Many countermeasures to agglomeration have been proposed based on the mechanism of increasing
the melting temperature of the ash by altering the ash chemistry, including utilization of alternative
bed materials, such as Al-10,11, Ca-12, Mg-13, or Fe-containing14 materials, application of additives,
such as Al-Si-15, Ca-16 or P-based17 additives, pretreating of biomass18, and co-combustion of K-lean
fuels19,20. Other countermeasures are proposed based on the mechanism of improving the fluidization
quality by increasing the ratio of gas velocity to the minimum fluidization velocity, i.e. applying high
gas velocity21 and selecting small particles22, which may limit the agglomerates accumulation by a
high break rate to the agglomerates21. The introducing of a pulsed flow to a fluidized bed, as a kind
of external assistance, could be a countermeasure for improving the fluidization quality in fluidized
bed23,24.
Pulsed fluidization is a method that using an on-and-off primary gas to fluidize the bed particles. It is
well known that application of a pulsed flow can improve the fluidization quality for Geldart Group
A/B/C particles by reducing the minimum fluidization velocities of the bed particles25,26. It is
suggested that the pulsed flow shows positive effects on enhancing the heating transfer in fluidized
bed27–29, accelerating the drying of biomass30,31, and improving the mixing of particles32. Therefore,
the pulsed fluidized bed reactor may be a potential countermeasure for mitigating agglomeration
tendency in biomass combustion and gasification.
The potential of pulsed flow on tackling defluidization of Group B particles has been indicated by
discrete element method (DEM) simulations33. However, mostly of experimental work has been
carried out focusing on the effect of pulsed flow on the formation and breakage of agglomerates of
nanoparticles34,35. Limited studies have been reported on the application of pulsed flow in fluidized
bed combustion and gasification, and these studies focus on the influence of pulsed flow on the heat
transfer and combustion efficiency36. The influence of pulse flow on agglomeration in fluidized bed
combustion/gasification has not been revealed from author’s knowledge. In this chapter, the
possibility of application of pulsed flow to fluidized bed combustion/gasification of biomass to
mitigate agglomeration is experimentally studied in a lab-scale bubbling fluidized bed.
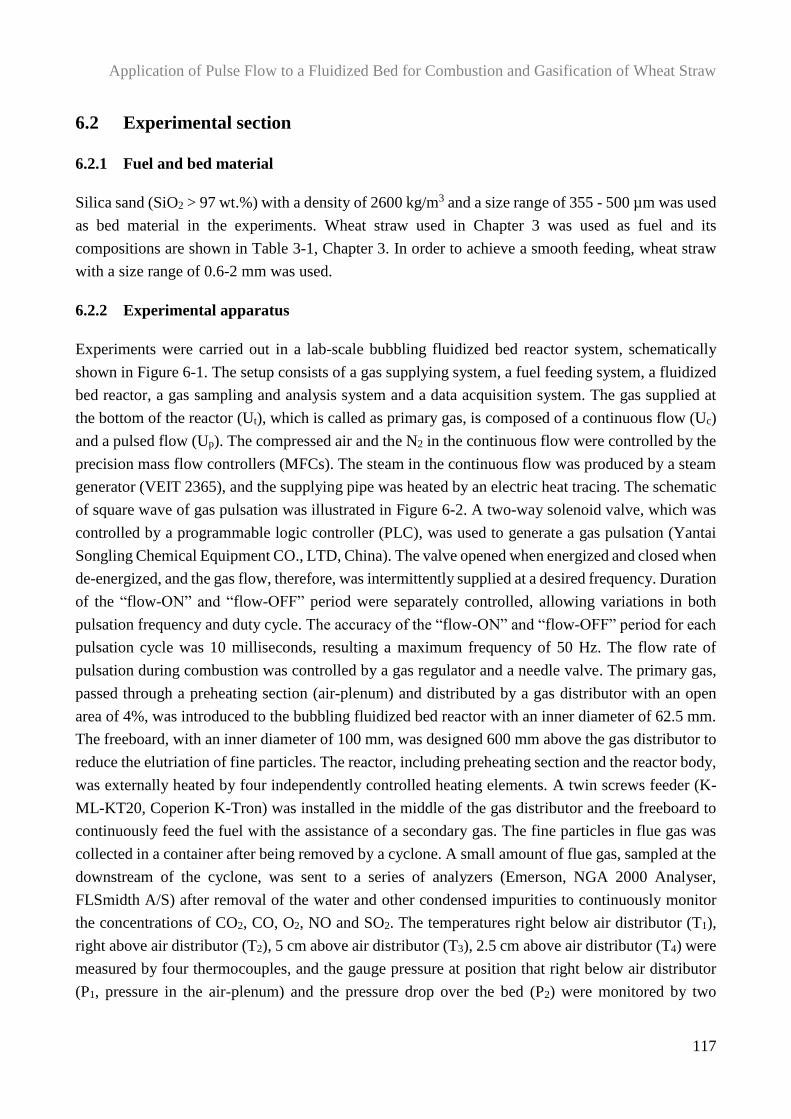
Application of Pulse Flow to a Fluidized Bed for Combustion and Gasification of Wheat Straw
117
6.2 Experimental section
6.2.1 Fuel and bed material
Silica sand (SiO2 > 97 wt.%) with a density of 2600 kg/m3 and a size range of 355 - 500 µm was used
as bed material in the experiments. Wheat straw used in Chapter 3 was used as fuel and its
compositions are shown in Table 3-1, Chapter 3. In order to achieve a smooth feeding, wheat straw
with a size range of 0.6-2 mm was used.
6.2.2 Experimental apparatus
Experiments were carried out in a lab-scale bubbling fluidized bed reactor system, schematically
shown in Figure 6-1. The setup consists of a gas supplying system, a fuel feeding system, a fluidized
bed reactor, a gas sampling and analysis system and a data acquisition system. The gas supplied at
the bottom of the reactor (Ut), which is called as primary gas, is composed of a continuous flow (Uc)
and a pulsed flow (Up). The compressed air and the N2 in the continuous flow were controlled by the
precision mass flow controllers (MFCs). The steam in the continuous flow was produced by a steam
generator (VEIT 2365), and the supplying pipe was heated by an electric heat tracing. The schematic
of square wave of gas pulsation was illustrated in Figure 6-2. A two-way solenoid valve, which was
controlled by a programmable logic controller (PLC), was used to generate a gas pulsation (Yantai
Songling Chemical Equipment CO., LTD, China). The valve opened when energized and closed when
de-energized, and the gas flow, therefore, was intermittently supplied at a desired frequency. Duration
of the “flow-ON” and “flow-OFF” period were separately controlled, allowing variations in both
pulsation frequency and duty cycle. The accuracy of the “flow-ON” and “flow-OFF” period for each
pulsation cycle was 10 milliseconds, resulting a maximum frequency of 50 Hz. The flow rate of
pulsation during combustion was controlled by a gas regulator and a needle valve. The primary gas,
passed through a preheating section (air-plenum) and distributed by a gas distributor with an open
area of 4%, was introduced to the bubbling fluidized bed reactor with an inner diameter of 62.5 mm.
The freeboard, with an inner diameter of 100 mm, was designed 600 mm above the gas distributor to
reduce the elutriation of fine particles. The reactor, including preheating section and the reactor body,
was externally heated by four independently controlled heating elements. A twin screws feeder (K-
ML-KT20, Coperion K-Tron) was installed in the middle of the gas distributor and the freeboard to
continuously feed the fuel with the assistance of a secondary gas. The fine particles in flue gas was
collected in a container after being removed by a cyclone. A small amount of flue gas, sampled at the
downstream of the cyclone, was sent to a series of analyzers (Emerson, NGA 2000 Analyser,
FLSmidth A/S) after removal of the water and other condensed impurities to continuously monitor
the concentrations of CO2, CO, O2, NO and SO2. The temperatures right below air distributor (T1),
right above air distributor (T2), 5 cm above air distributor (T3), 2.5 cm above air distributor (T4) were
measured by four thermocouples, and the gauge pressure at position that right below air distributor
(P1, pressure in the air-plenum) and the pressure drop over the bed (P2) were monitored by two
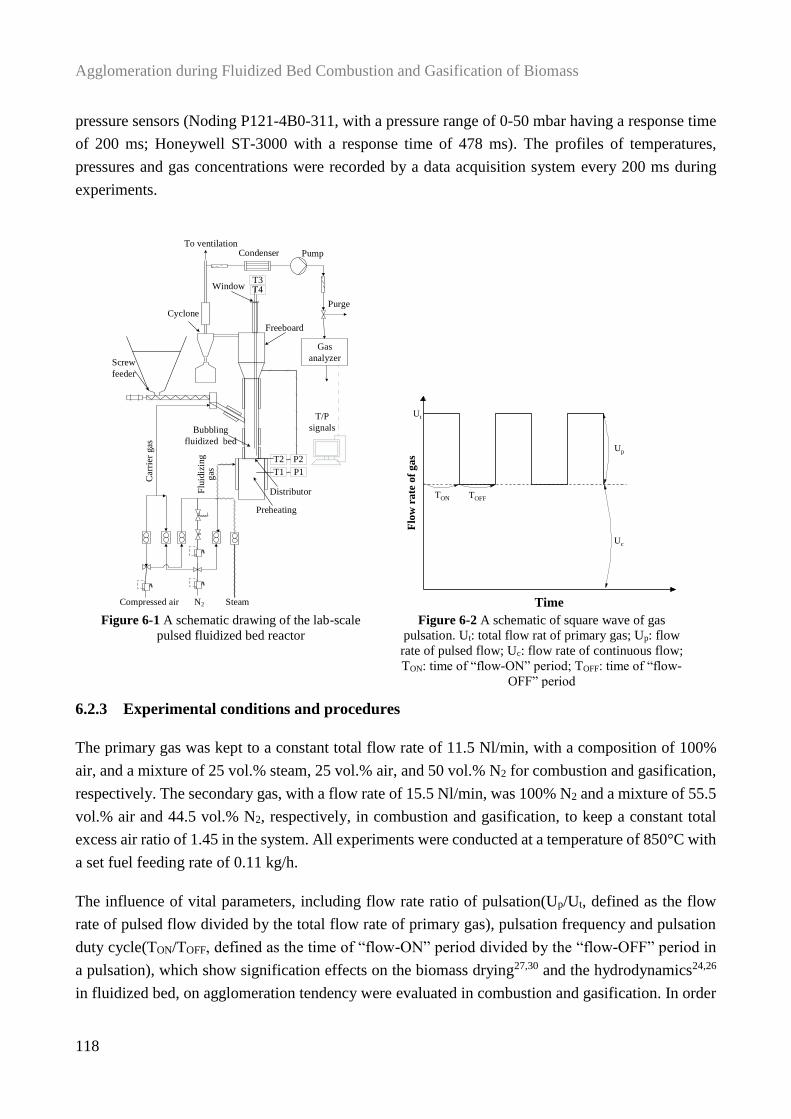
Agglomeration during Fluidized Bed Combustion and Gasification of Biomass
118
pressure sensors (Noding P121-4B0-311, with a pressure range of 0-50 mbar having a response time
of 200 ms; Honeywell ST-3000 with a response time of 478 ms). The profiles of temperatures,
pressures and gas concentrations were recorded by a data acquisition system every 200 ms during
experiments.
Figure 6-1 A schematic drawing of the lab-scale
pulsed fluidized bed reactor
Figure 6-2 A schematic of square wave of gas
pulsation. Ut: total flow rat of primary gas; Up: flow
rate of pulsed flow; Uc: flow rate of continuous flow;
TON: time of “flow-ON” period; TOFF: time of “flow-
OFF” period
6.2.3 Experimental conditions and procedures
The primary gas was kept to a constant total flow rate of 11.5 Nl/min, with a composition of 100%
air, and a mixture of 25 vol.% steam, 25 vol.% air, and 50 vol.% N2 for combustion and gasification,
respectively. The secondary gas, with a flow rate of 15.5 Nl/min, was 100% N2 and a mixture of 55.5
vol.% air and 44.5 vol.% N2, respectively, in combustion and gasification, to keep a constant total
excess air ratio of 1.45 in the system. All experiments were conducted at a temperature of 850°C with
a set fuel feeding rate of 0.11 kg/h.
The influence of vital parameters, including flow rate ratio of pulsation(Up/Ut, defined as the flow
rate of pulsed flow divided by the total flow rate of primary gas), pulsation frequency and pulsation
duty cycle(TON/TOFF, defined as the time of “flow-ON” period divided by the “flow-OFF” period in
a pulsation), which show signification effects on the biomass drying27,30 and the hydrodynamics24,26
in fluidized bed, on agglomeration tendency were evaluated in combustion and gasification. In order
SteamN2Compressed air
To ventilationCondenser Pump
Purge
Gas
analyzer
T/P
signals
Window
Cyclone
Screw
feeder
Bubbling
fluidized bed
Distributor
Freeboard
T4T3
T2
T1
P2
P1
Flu
idiz
ing
g
as
Car
rier
gas
Preheating
Up
Flo
w r
ate
of
gas
Time
Uc
TON TOFF
Ut
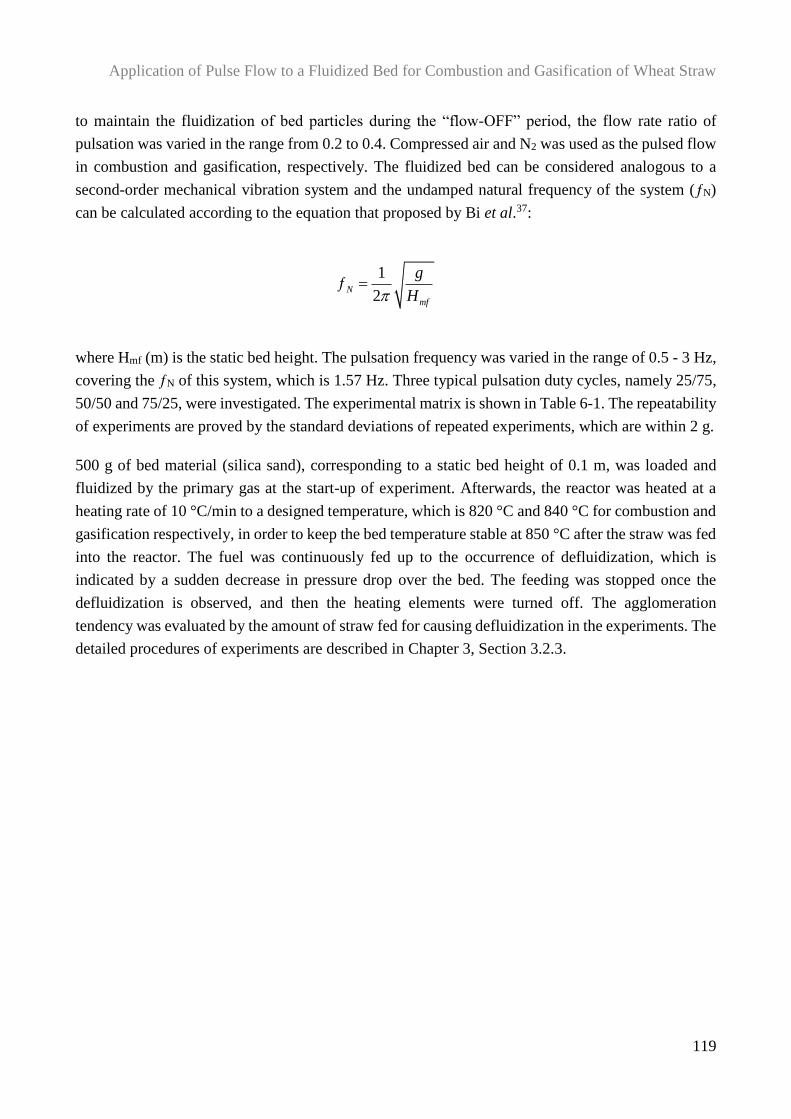
Application of Pulse Flow to a Fluidized Bed for Combustion and Gasification of Wheat Straw
119
to maintain the fluidization of bed particles during the “flow-OFF” period, the flow rate ratio of
pulsation was varied in the range from 0.2 to 0.4. Compressed air and N2 was used as the pulsed flow
in combustion and gasification, respectively. The fluidized bed can be considered analogous to a
second-order mechanical vibration system and the undamped natural frequency of the system (ƒN)
can be calculated according to the equation that proposed by Bi et al.37:
1ƒ
2N
mf
g
H
where Hmf (m) is the static bed height. The pulsation frequency was varied in the range of 0.5 - 3 Hz,
covering the ƒN of this system, which is 1.57 Hz. Three typical pulsation duty cycles, namely 25/75,
50/50 and 75/25, were investigated. The experimental matrix is shown in Table 6-1. The repeatability
of experiments are proved by the standard deviations of repeated experiments, which are within 2 g.
500 g of bed material (silica sand), corresponding to a static bed height of 0.1 m, was loaded and
fluidized by the primary gas at the start-up of experiment. Afterwards, the reactor was heated at a
heating rate of 10 °C/min to a designed temperature, which is 820 °C and 840 °C for combustion and
gasification respectively, in order to keep the bed temperature stable at 850 °C after the straw was fed
into the reactor. The fuel was continuously fed up to the occurrence of defluidization, which is
indicated by a sudden decrease in pressure drop over the bed. The feeding was stopped once the
defluidization is observed, and then the heating elements were turned off. The agglomeration
tendency was evaluated by the amount of straw fed for causing defluidization in the experiments. The
detailed procedures of experiments are described in Chapter 3, Section 3.2.3.
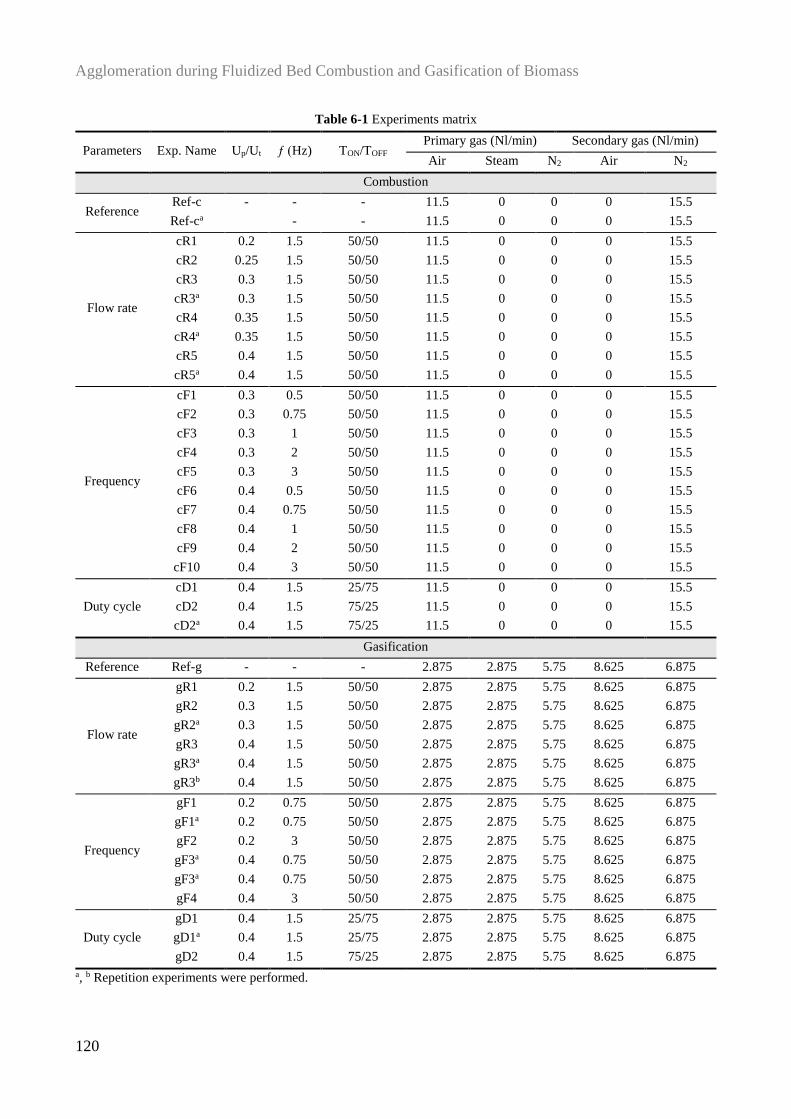
Agglomeration during Fluidized Bed Combustion and Gasification of Biomass
120
Table 6-1 Experiments matrix
Parameters Exp. Name Up/Ut ƒ (Hz) TON/TOFF Primary gas (Nl/min) Secondary gas (Nl/min)
Air Steam N2 Air N2
Combustion
Reference Ref-c - - - 11.5 0 0 0 15.5
Ref-ca - - 11.5 0 0 0 15.5
Flow rate
cR1 0.2 1.5 50/50 11.5 0 0 0 15.5
cR2 0.25 1.5 50/50 11.5 0 0 0 15.5
cR3 0.3 1.5 50/50 11.5 0 0 0 15.5
cR3a 0.3 1.5 50/50 11.5 0 0 0 15.5
cR4 0.35 1.5 50/50 11.5 0 0 0 15.5
cR4a 0.35 1.5 50/50 11.5 0 0 0 15.5
cR5 0.4 1.5 50/50 11.5 0 0 0 15.5
cR5a 0.4 1.5 50/50 11.5 0 0 0 15.5
Frequency
cF1 0.3 0.5 50/50 11.5 0 0 0 15.5
cF2 0.3 0.75 50/50 11.5 0 0 0 15.5
cF3 0.3 1 50/50 11.5 0 0 0 15.5
cF4 0.3 2 50/50 11.5 0 0 0 15.5
cF5 0.3 3 50/50 11.5 0 0 0 15.5
cF6 0.4 0.5 50/50 11.5 0 0 0 15.5
cF7 0.4 0.75 50/50 11.5 0 0 0 15.5
cF8 0.4 1 50/50 11.5 0 0 0 15.5
cF9 0.4 2 50/50 11.5 0 0 0 15.5
cF10 0.4 3 50/50 11.5 0 0 0 15.5
Duty cycle
cD1 0.4 1.5 25/75 11.5 0 0 0 15.5
cD2 0.4 1.5 75/25 11.5 0 0 0 15.5
cD2a 0.4 1.5 75/25 11.5 0 0 0 15.5
Gasification
Reference Ref-g - - - 2.875 2.875 5.75 8.625 6.875
Flow rate
gR1 0.2 1.5 50/50 2.875 2.875 5.75 8.625 6.875
gR2 0.3 1.5 50/50 2.875 2.875 5.75 8.625 6.875
gR2a 0.3 1.5 50/50 2.875 2.875 5.75 8.625 6.875
gR3 0.4 1.5 50/50 2.875 2.875 5.75 8.625 6.875
gR3a 0.4 1.5 50/50 2.875 2.875 5.75 8.625 6.875
gR3b 0.4 1.5 50/50 2.875 2.875 5.75 8.625 6.875
Frequency
gF1 0.2 0.75 50/50 2.875 2.875 5.75 8.625 6.875
gF1a 0.2 0.75 50/50 2.875 2.875 5.75 8.625 6.875
gF2 0.2 3 50/50 2.875 2.875 5.75 8.625 6.875
gF3a 0.4 0.75 50/50 2.875 2.875 5.75 8.625 6.875
gF3a 0.4 0.75 50/50 2.875 2.875 5.75 8.625 6.875
gF4 0.4 3 50/50 2.875 2.875 5.75 8.625 6.875
Duty cycle
gD1 0.4 1.5 25/75 2.875 2.875 5.75 8.625 6.875
gD1a 0.4 1.5 25/75 2.875 2.875 5.75 8.625 6.875
gD2 0.4 1.5 75/25 2.875 2.875 5.75 8.625 6.875
a, b Repetition experiments were performed.
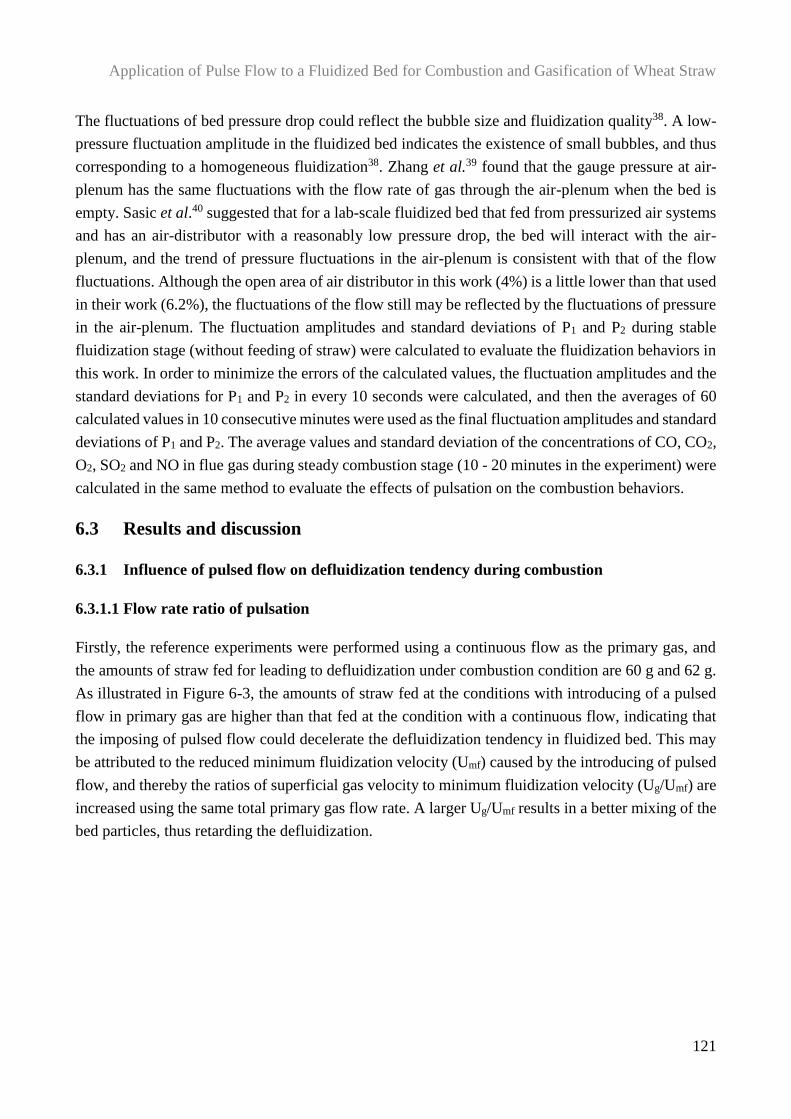
Application of Pulse Flow to a Fluidized Bed for Combustion and Gasification of Wheat Straw
121
The fluctuations of bed pressure drop could reflect the bubble size and fluidization quality38. A low-
pressure fluctuation amplitude in the fluidized bed indicates the existence of small bubbles, and thus
corresponding to a homogeneous fluidization38. Zhang et al.39 found that the gauge pressure at air-
plenum has the same fluctuations with the flow rate of gas through the air-plenum when the bed is
empty. Sasic et al.40 suggested that for a lab-scale fluidized bed that fed from pressurized air systems
and has an air-distributor with a reasonably low pressure drop, the bed will interact with the air-
plenum, and the trend of pressure fluctuations in the air-plenum is consistent with that of the flow
fluctuations. Although the open area of air distributor in this work (4%) is a little lower than that used
in their work (6.2%), the fluctuations of the flow still may be reflected by the fluctuations of pressure
in the air-plenum. The fluctuation amplitudes and standard deviations of P1 and P2 during stable
fluidization stage (without feeding of straw) were calculated to evaluate the fluidization behaviors in
this work. In order to minimize the errors of the calculated values, the fluctuation amplitudes and the
standard deviations for P1 and P2 in every 10 seconds were calculated, and then the averages of 60
calculated values in 10 consecutive minutes were used as the final fluctuation amplitudes and standard
deviations of P1 and P2. The average values and standard deviation of the concentrations of CO, CO2,
O2, SO2 and NO in flue gas during steady combustion stage (10 - 20 minutes in the experiment) were
calculated in the same method to evaluate the effects of pulsation on the combustion behaviors.
6.3 Results and discussion
6.3.1 Influence of pulsed flow on defluidization tendency during combustion
6.3.1.1 Flow rate ratio of pulsation
Firstly, the reference experiments were performed using a continuous flow as the primary gas, and
the amounts of straw fed for leading to defluidization under combustion condition are 60 g and 62 g.
As illustrated in Figure 6-3, the amounts of straw fed at the conditions with introducing of a pulsed
flow in primary gas are higher than that fed at the condition with a continuous flow, indicating that
the imposing of pulsed flow could decelerate the defluidization tendency in fluidized bed. This may
be attributed to the reduced minimum fluidization velocity (Umf) caused by the introducing of pulsed
flow, and thereby the ratios of superficial gas velocity to minimum fluidization velocity (Ug/Umf) are
increased using the same total primary gas flow rate. A larger Ug/Umf results in a better mixing of the
bed particles, thus retarding the defluidization.
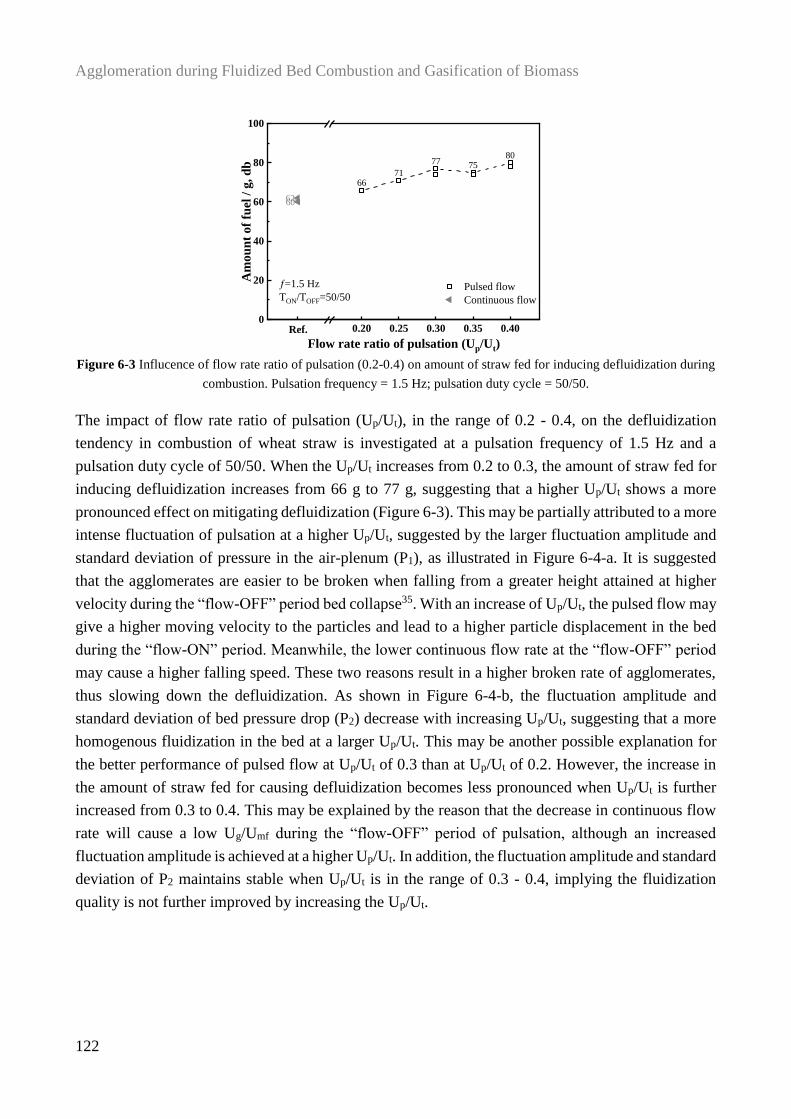
Agglomeration during Fluidized Bed Combustion and Gasification of Biomass
122
Figure 6-3 Influcence of flow rate ratio of pulsation (0.2-0.4) on amount of straw fed for inducing defluidization during
combustion. Pulsation frequency = 1.5 Hz; pulsation duty cycle = 50/50.
The impact of flow rate ratio of pulsation (Up/Ut), in the range of 0.2 - 0.4, on the defluidization
tendency in combustion of wheat straw is investigated at a pulsation frequency of 1.5 Hz and a
pulsation duty cycle of 50/50. When the Up/Ut increases from 0.2 to 0.3, the amount of straw fed for
inducing defluidization increases from 66 g to 77 g, suggesting that a higher Up/Ut shows a more
pronounced effect on mitigating defluidization (Figure 6-3). This may be partially attributed to a more
intense fluctuation of pulsation at a higher Up/Ut, suggested by the larger fluctuation amplitude and
standard deviation of pressure in the air-plenum (P1), as illustrated in Figure 6-4-a. It is suggested
that the agglomerates are easier to be broken when falling from a greater height attained at higher
velocity during the “flow-OFF” period bed collapse35. With an increase of Up/Ut, the pulsed flow may
give a higher moving velocity to the particles and lead to a higher particle displacement in the bed
during the “flow-ON” period. Meanwhile, the lower continuous flow rate at the “flow-OFF” period
may cause a higher falling speed. These two reasons result in a higher broken rate of agglomerates,
thus slowing down the defluidization. As shown in Figure 6-4-b, the fluctuation amplitude and
standard deviation of bed pressure drop (P2) decrease with increasing Up/Ut, suggesting that a more
homogenous fluidization in the bed at a larger Up/Ut. This may be another possible explanation for
the better performance of pulsed flow at Up/Ut of 0.3 than at Up/Ut of 0.2. However, the increase in
the amount of straw fed for causing defluidization becomes less pronounced when Up/Ut is further
increased from 0.3 to 0.4. This may be explained by the reason that the decrease in continuous flow
rate will cause a low Ug/Umf during the “flow-OFF” period of pulsation, although an increased
fluctuation amplitude is achieved at a higher Up/Ut. In addition, the fluctuation amplitude and standard
deviation of P2 maintains stable when Up/Ut is in the range of 0.3 - 0.4, implying the fluidization
quality is not further improved by increasing the Up/Ut.
6671
77 7580
6062
0.00 0.20 0.25 0.30 0.35 0.400
20
40
60
80
100
Pulsed flow
Continuous flow
Am
ou
nt
of
fuel
/ g
, d
b
Flow rate ratio of pulsation (Up/Ut)
Ref.
¦=1.5 Hz
TON/TOFF=50/50
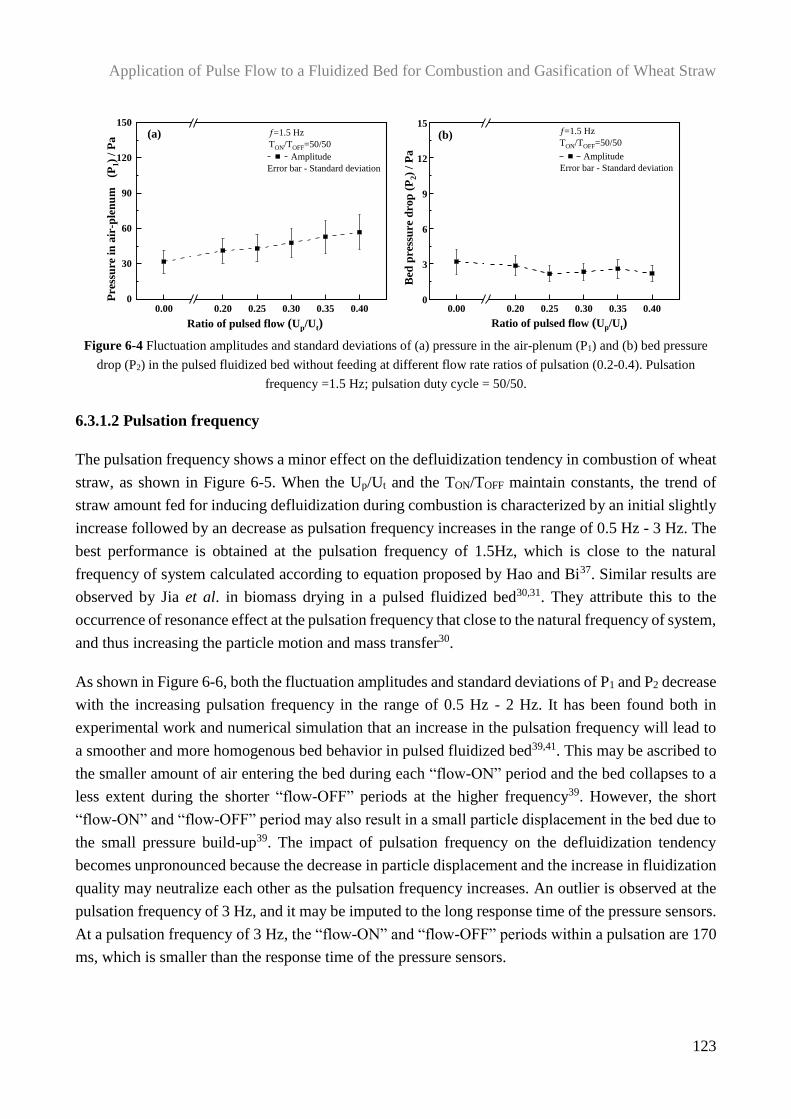
Application of Pulse Flow to a Fluidized Bed for Combustion and Gasification of Wheat Straw
123
Figure 6-4 Fluctuation amplitudes and standard deviations of (a) pressure in the air-plenum (P1) and (b) bed pressure
drop (P2) in the pulsed fluidized bed without feeding at different flow rate ratios of pulsation (0.2-0.4). Pulsation
frequency =1.5 Hz; pulsation duty cycle = 50/50.
6.3.1.2 Pulsation frequency
The pulsation frequency shows a minor effect on the defluidization tendency in combustion of wheat
straw, as shown in Figure 6-5. When the Up/Ut and the TON/TOFF maintain constants, the trend of
straw amount fed for inducing defluidization during combustion is characterized by an initial slightly
increase followed by an decrease as pulsation frequency increases in the range of 0.5 Hz - 3 Hz. The
best performance is obtained at the pulsation frequency of 1.5Hz, which is close to the natural
frequency of system calculated according to equation proposed by Hao and Bi37. Similar results are
observed by Jia et al. in biomass drying in a pulsed fluidized bed30,31. They attribute this to the
occurrence of resonance effect at the pulsation frequency that close to the natural frequency of system,
and thus increasing the particle motion and mass transfer30.
As shown in Figure 6-6, both the fluctuation amplitudes and standard deviations of P1 and P2 decrease
with the increasing pulsation frequency in the range of 0.5 Hz - 2 Hz. It has been found both in
experimental work and numerical simulation that an increase in the pulsation frequency will lead to
a smoother and more homogenous bed behavior in pulsed fluidized bed39,41. This may be ascribed to
the smaller amount of air entering the bed during each “flow-ON” period and the bed collapses to a
less extent during the shorter “flow-OFF” periods at the higher frequency39. However, the short
“flow-ON” and “flow-OFF” period may also result in a small particle displacement in the bed due to
the small pressure build-up39. The impact of pulsation frequency on the defluidization tendency
becomes unpronounced because the decrease in particle displacement and the increase in fluidization
quality may neutralize each other as the pulsation frequency increases. An outlier is observed at the
pulsation frequency of 3 Hz, and it may be imputed to the long response time of the pressure sensors.
At a pulsation frequency of 3 Hz, the “flow-ON” and “flow-OFF” periods within a pulsation are 170
ms, which is smaller than the response time of the pressure sensors.
0.00 0.20 0.25 0.30 0.35 0.400
30
60
90
120
150
0.00 0.20 0.25 0.30 0.35 0.400
3
6
9
12
15
Amplitude
Error bar - Standard deviation
Pre
ssu
re i
n a
ir-p
len
um
(P
1)
/ P
a
Ratio of pulsed flow (Up/Ut)
(a) (b)
Ratio of pulsed flow (Up/Ut)
Amplitude
Error bar - Standard deviation
¦=1.5 Hz
TON/TOFF=50/50
¦=1.5 Hz
TON/TOFF=50/50
Bed
pre
ssu
re d
rop
(P
2)
/ P
a
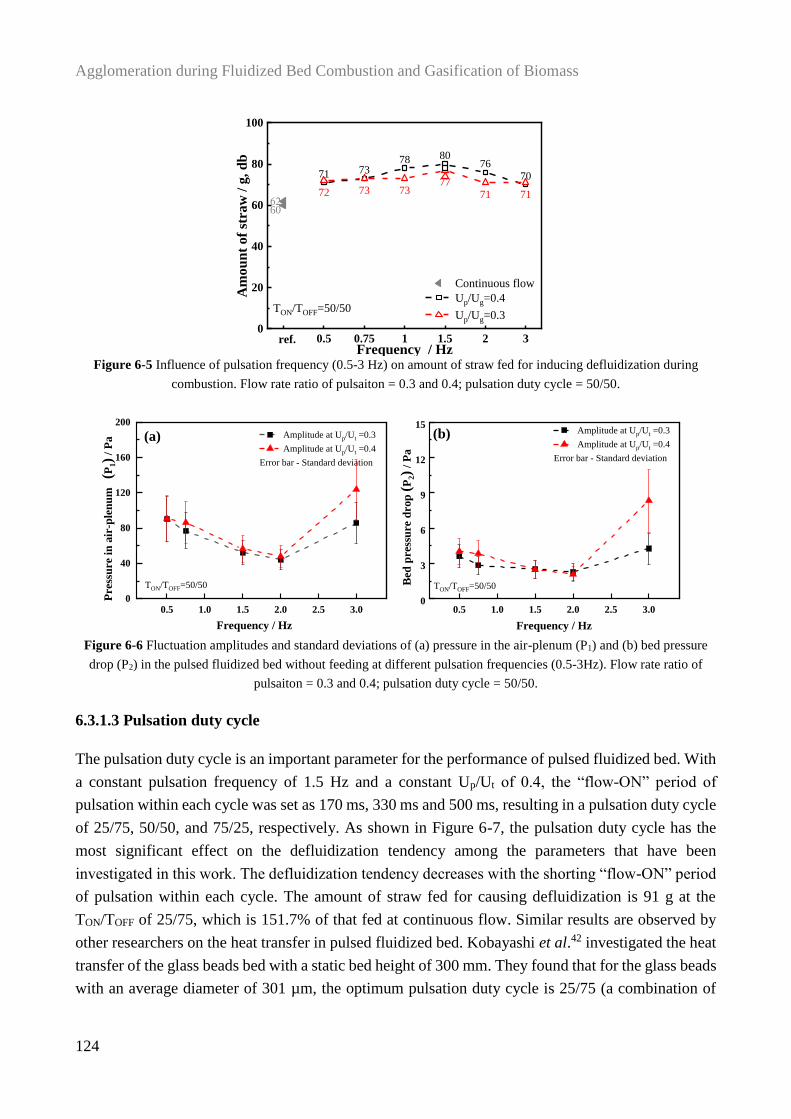
Agglomeration during Fluidized Bed Combustion and Gasification of Biomass
124
Figure 6-5 Influence of pulsation frequency (0.5-3 Hz) on amount of straw fed for inducing defluidization during
combustion. Flow rate ratio of pulsaiton = 0.3 and 0.4; pulsation duty cycle = 50/50.
Figure 6-6 Fluctuation amplitudes and standard deviations of (a) pressure in the air-plenum (P1) and (b) bed pressure
drop (P2) in the pulsed fluidized bed without feeding at different pulsation frequencies (0.5-3Hz). Flow rate ratio of
pulsaiton = 0.3 and 0.4; pulsation duty cycle = 50/50.
6.3.1.3 Pulsation duty cycle
The pulsation duty cycle is an important parameter for the performance of pulsed fluidized bed. With
a constant pulsation frequency of 1.5 Hz and a constant Up/Ut of 0.4, the “flow-ON” period of
pulsation within each cycle was set as 170 ms, 330 ms and 500 ms, resulting in a pulsation duty cycle
of 25/75, 50/50, and 75/25, respectively. As shown in Figure 6-7, the pulsation duty cycle has the
most significant effect on the defluidization tendency among the parameters that have been
investigated in this work. The defluidization tendency decreases with the shorting “flow-ON” period
of pulsation within each cycle. The amount of straw fed for causing defluidization is 91 g at the
TON/TOFF of 25/75, which is 151.7% of that fed at continuous flow. Similar results are observed by
other researchers on the heat transfer in pulsed fluidized bed. Kobayashi et al.42 investigated the heat
transfer of the glass beads bed with a static bed height of 300 mm. They found that for the glass beads
with an average diameter of 301 µm, the optimum pulsation duty cycle is 25/75 (a combination of
0.5 0.75 1 1.5 2 30
20
40
60
80
100
6260
71 7378 80
7670
72 73 7377
71 71
TON/TOFF=50/50
Continuous flow
Up/Ug=0.4
Up/Ug=0.3
Am
ou
nt
of
stra
w /
g, d
b
Frequency / Hzref.
0.5 1.0 1.5 2.0 2.5 3.00
40
80
120
160
200
0.5 1.0 1.5 2.0 2.5 3.00
3
6
9
12
15 Amplitude at Up/Ut =0.3
Amplitude at Up/Ut =0.4
Error bar - Standard deviation
Pre
ssu
re i
n a
ir-p
len
um
(
P1)
/ P
a (a) (b)
Frequency / Hz Frequency / Hz
TON/TOFF=50/50 TON/TOFF=50/50
Amplitude at Up/Ut =0.3
Amplitude at Up/Ut =0.4
Error bar - Standard deviation
Bed
pre
ssu
re d
rop
(P
2)
/ P
a
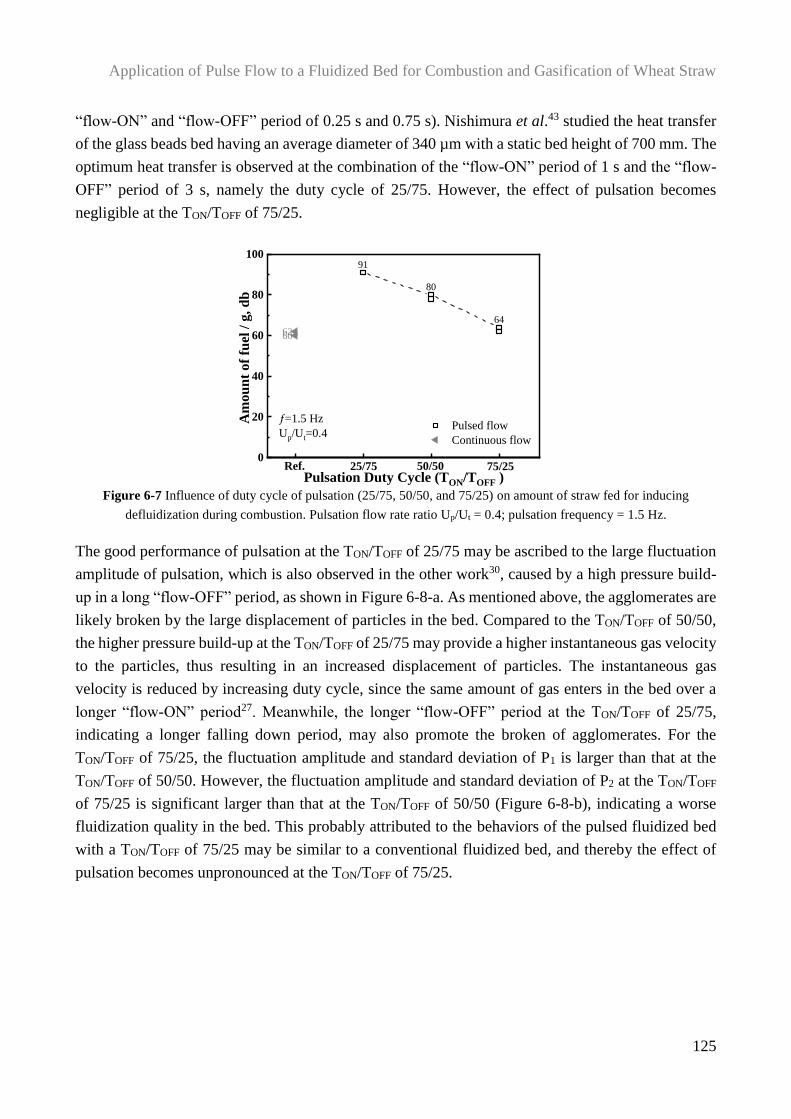
Application of Pulse Flow to a Fluidized Bed for Combustion and Gasification of Wheat Straw
125
“flow-ON” and “flow-OFF” period of 0.25 s and 0.75 s). Nishimura et al.43 studied the heat transfer
of the glass beads bed having an average diameter of 340 µm with a static bed height of 700 mm. The
optimum heat transfer is observed at the combination of the “flow-ON” period of 1 s and the “flow-
OFF” period of 3 s, namely the duty cycle of 25/75. However, the effect of pulsation becomes
negligible at the TON/TOFF of 75/25.
Figure 6-7 Influence of duty cycle of pulsation (25/75, 50/50, and 75/25) on amount of straw fed for inducing
defluidization during combustion. Pulsation flow rate ratio Up/Ut = 0.4; pulsation frequency = 1.5 Hz.
The good performance of pulsation at the TON/TOFF of 25/75 may be ascribed to the large fluctuation
amplitude of pulsation, which is also observed in the other work30, caused by a high pressure build-
up in a long “flow-OFF” period, as shown in Figure 6-8-a. As mentioned above, the agglomerates are
likely broken by the large displacement of particles in the bed. Compared to the TON/TOFF of 50/50,
the higher pressure build-up at the TON/TOFF of 25/75 may provide a higher instantaneous gas velocity
to the particles, thus resulting in an increased displacement of particles. The instantaneous gas
velocity is reduced by increasing duty cycle, since the same amount of gas enters in the bed over a
longer “flow-ON” period27. Meanwhile, the longer “flow-OFF” period at the TON/TOFF of 25/75,
indicating a longer falling down period, may also promote the broken of agglomerates. For the
TON/TOFF of 75/25, the fluctuation amplitude and standard deviation of P1 is larger than that at the
TON/TOFF of 50/50. However, the fluctuation amplitude and standard deviation of P2 at the TON/TOFF
of 75/25 is significant larger than that at the TON/TOFF of 50/50 (Figure 6-8-b), indicating a worse
fluidization quality in the bed. This probably attributed to the behaviors of the pulsed fluidized bed
with a TON/TOFF of 75/25 may be similar to a conventional fluidized bed, and thereby the effect of
pulsation becomes unpronounced at the TON/TOFF of 75/25.
91
80
64
6062
0
20
40
60
80
100
Pulsed flow
Continuous flow
Am
ou
nt
of
fuel
/ g
, d
b
Pulsation Duty Cycle (TON/TOFF )25/75 50/50 75/25
¦=1.5 Hz
Up/Ut=0.4
Ref.
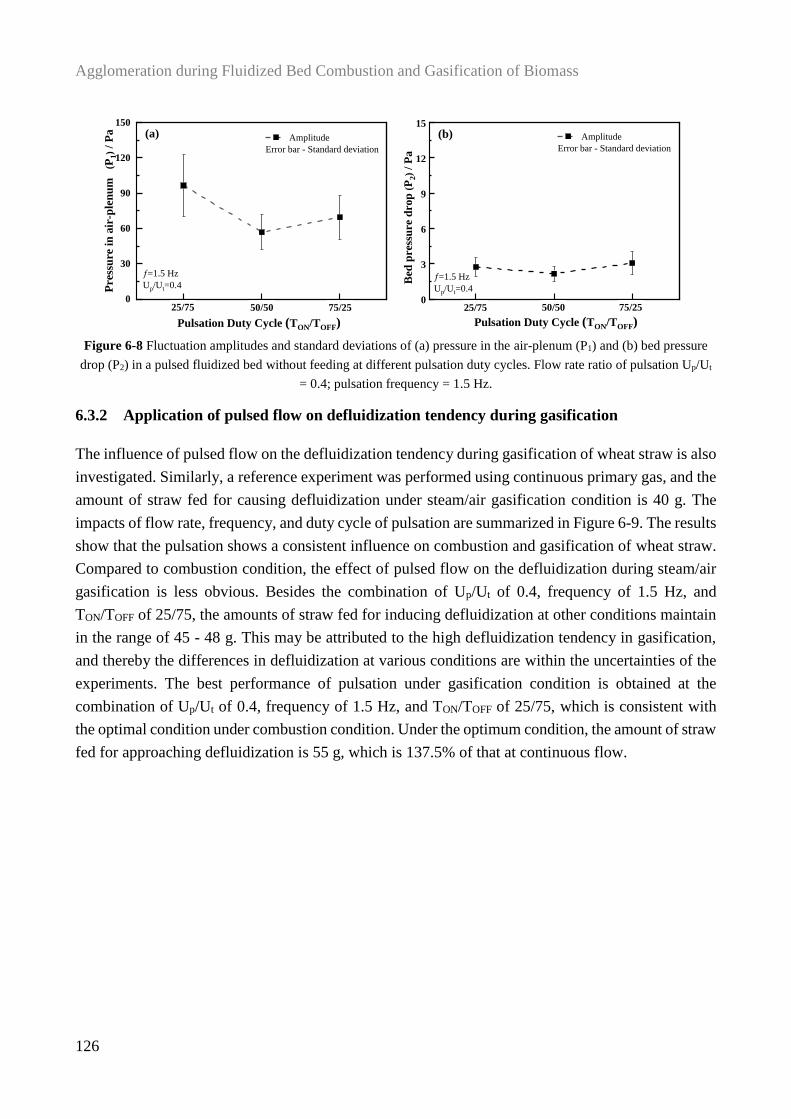
Agglomeration during Fluidized Bed Combustion and Gasification of Biomass
126
Figure 6-8 Fluctuation amplitudes and standard deviations of (a) pressure in the air-plenum (P1) and (b) bed pressure
drop (P2) in a pulsed fluidized bed without feeding at different pulsation duty cycles. Flow rate ratio of pulsation Up/Ut
= 0.4; pulsation frequency = 1.5 Hz.
6.3.2 Application of pulsed flow on defluidization tendency during gasification
The influence of pulsed flow on the defluidization tendency during gasification of wheat straw is also
investigated. Similarly, a reference experiment was performed using continuous primary gas, and the
amount of straw fed for causing defluidization under steam/air gasification condition is 40 g. The
impacts of flow rate, frequency, and duty cycle of pulsation are summarized in Figure 6-9. The results
show that the pulsation shows a consistent influence on combustion and gasification of wheat straw.
Compared to combustion condition, the effect of pulsed flow on the defluidization during steam/air
gasification is less obvious. Besides the combination of Up/Ut of 0.4, frequency of 1.5 Hz, and
TON/TOFF of 25/75, the amounts of straw fed for inducing defluidization at other conditions maintain
in the range of 45 - 48 g. This may be attributed to the high defluidization tendency in gasification,
and thereby the differences in defluidization at various conditions are within the uncertainties of the
experiments. The best performance of pulsation under gasification condition is obtained at the
combination of Up/Ut of 0.4, frequency of 1.5 Hz, and TON/TOFF of 25/75, which is consistent with
the optimal condition under combustion condition. Under the optimum condition, the amount of straw
fed for approaching defluidization is 55 g, which is 137.5% of that at continuous flow.
0
30
60
90
120
150
0
3
6
9
12
15
Amplitude
Error bar - Standard deviation
Pre
ssu
re i
n a
ir-p
len
um
(
P1)
/ P
a (a) (b) Amplitude
Error bar - Standard deviation
25/75 50/50 75/25
Pulsation Duty Cycle (TON/TOFF)
50/5025/75 75/25
Pulsation Duty Cycle (TON/TOFF)
¦=1.5 Hz
Up/Ut=0.4¦=1.5 Hz
Up/Ut=0.4
Bed
pre
ssu
re d
rop
(P
2)
/ P
a
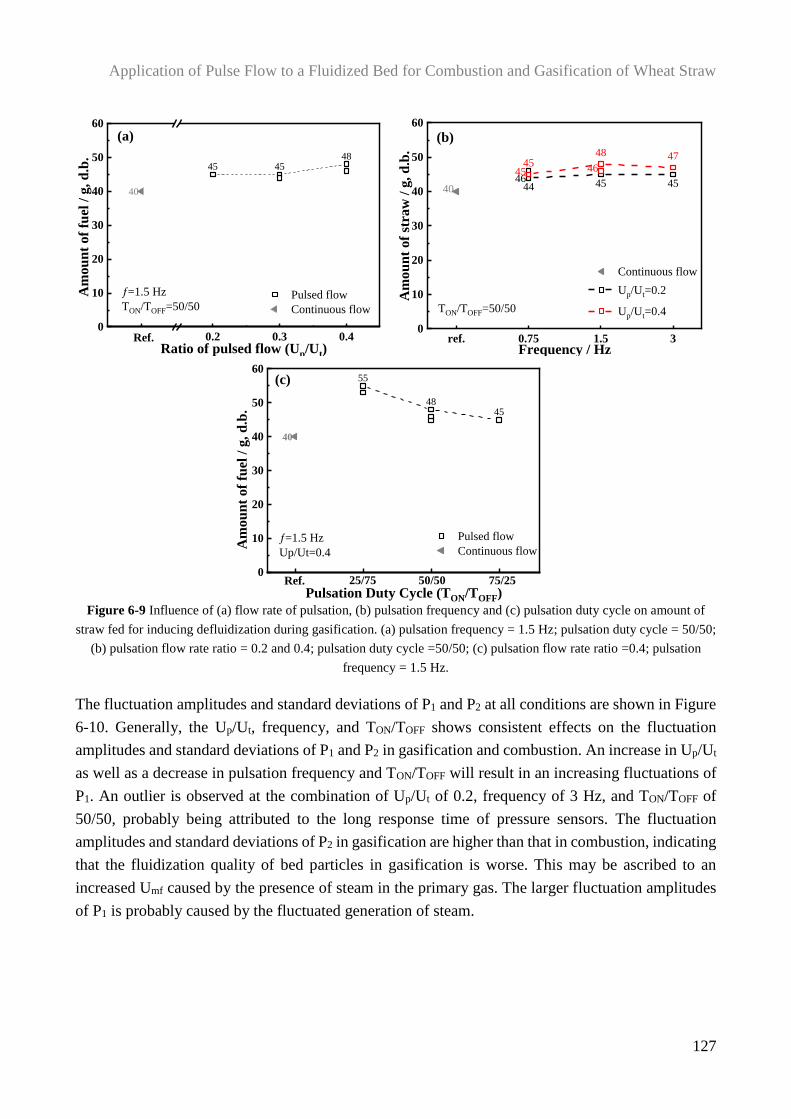
Application of Pulse Flow to a Fluidized Bed for Combustion and Gasification of Wheat Straw
127
Figure 6-9 Influence of (a) flow rate of pulsation, (b) pulsation frequency and (c) pulsation duty cycle on amount of
straw fed for inducing defluidization during gasification. (a) pulsation frequency = 1.5 Hz; pulsation duty cycle = 50/50;
(b) pulsation flow rate ratio = 0.2 and 0.4; pulsation duty cycle =50/50; (c) pulsation flow rate ratio =0.4; pulsation
frequency = 1.5 Hz.
The fluctuation amplitudes and standard deviations of P1 and P2 at all conditions are shown in Figure
6-10. Generally, the Up/Ut, frequency, and TON/TOFF shows consistent effects on the fluctuation
amplitudes and standard deviations of P1 and P2 in gasification and combustion. An increase in Up/Ut
as well as a decrease in pulsation frequency and TON/TOFF will result in an increasing fluctuations of
P1. An outlier is observed at the combination of Up/Ut of 0.2, frequency of 3 Hz, and TON/TOFF of
50/50, probably being attributed to the long response time of pressure sensors. The fluctuation
amplitudes and standard deviations of P2 in gasification are higher than that in combustion, indicating
that the fluidization quality of bed particles in gasification is worse. This may be ascribed to an
increased Umf caused by the presence of steam in the primary gas. The larger fluctuation amplitudes
of P1 is probably caused by the fluctuated generation of steam.
45 4548
40
0.0 0.2 0.3 0.40
10
20
30
40
50
60
Pulsed flow
Continuous flow
Am
ou
nt
of
fuel
/ g
, d
.b.
Ratio of pulsed flow (Up/Ut)Ref.
(a)
¦=1.5 Hz
TON/TOFF=50/50
ref. 0.75 1.5 30
10
20
30
40
50
60
40 44 45 45
4548 47
4645 46
Am
ou
nt
of
stra
w /
g, d
.b.
Frequency / Hz
(b)
Continuous flow
Up/Ut=0.2
Up/Ut=0.4TON/TOFF=50/50
55
4845
40
0
10
20
30
40
50
60
Am
ou
nt
of
fuel
/ g
, d
.b.
Pulsation Duty Cycle (TON/TOFF)25/75 50/50 75/25
Pulsed flow
Continuous flow
(c)
¦=1.5 Hz
Up/Ut=0.4
Ref.
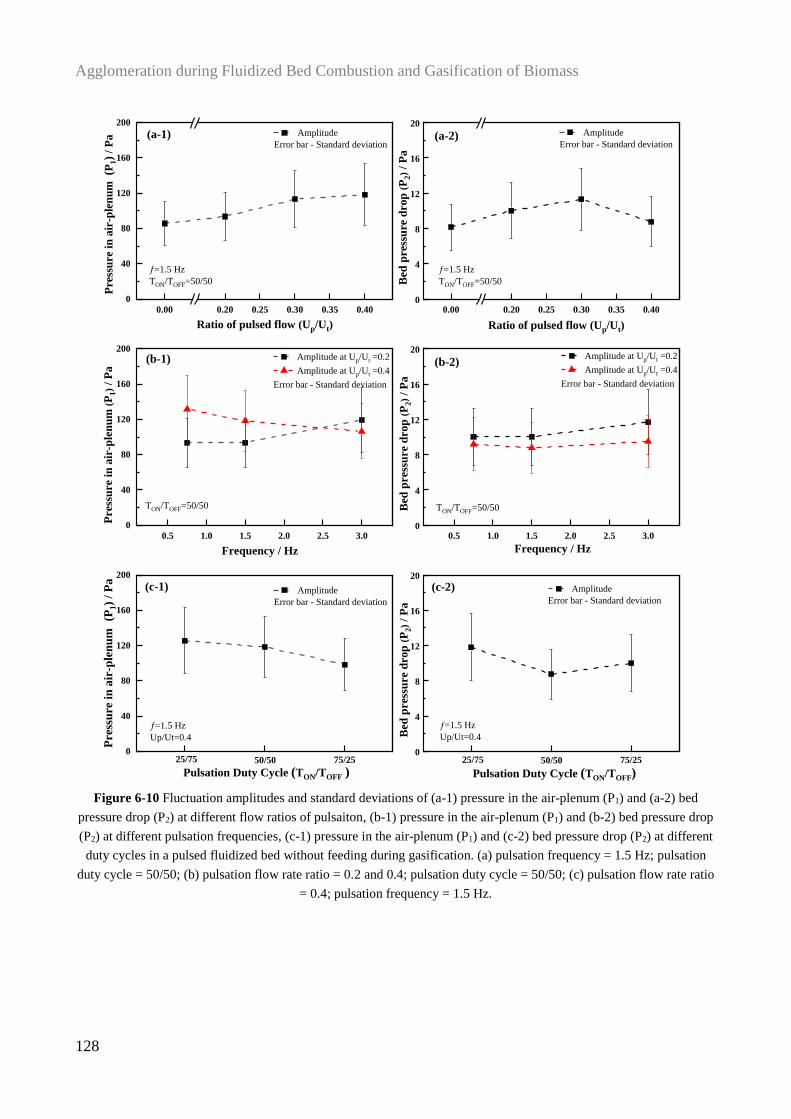
Agglomeration during Fluidized Bed Combustion and Gasification of Biomass
128
Figure 6-10 Fluctuation amplitudes and standard deviations of (a-1) pressure in the air-plenum (P1) and (a-2) bed
pressure drop (P2) at different flow ratios of pulsaiton, (b-1) pressure in the air-plenum (P1) and (b-2) bed pressure drop
(P2) at different pulsation frequencies, (c-1) pressure in the air-plenum (P1) and (c-2) bed pressure drop (P2) at different
duty cycles in a pulsed fluidized bed without feeding during gasification. (a) pulsation frequency = 1.5 Hz; pulsation
duty cycle = 50/50; (b) pulsation flow rate ratio = 0.2 and 0.4; pulsation duty cycle = 50/50; (c) pulsation flow rate ratio
= 0.4; pulsation frequency = 1.5 Hz.
0.00 0.20 0.25 0.30 0.35 0.40
0
40
80
120
160
200
0.00 0.20 0.25 0.30 0.35 0.400
4
8
12
16
20 Amplitude
Error bar - Standard deviation
Ratio of pulsed flow (Up/Ut)
(a-1) (a-2) Amplitude
Error bar - Standard deviation
¦=1.5 Hz
TON/TOFF=50/50
Pre
ssu
re i
n a
ir-p
len
um
(P
1)
/ P
a
Ratio of pulsed flow (Up/Ut)
Bed
pres
sure
dro
p (
P2)
/ P
a
¦=1.5 Hz
TON/TOFF=50/50
0.5 1.0 1.5 2.0 2.5 3.0
0
40
80
120
160
200
0.5 1.0 1.5 2.0 2.5 3.00
4
8
12
16
20 Amplitude at Up/Ut =0.2
Amplitude at Up/Ut =0.4
Error bar - Standard deviation
Pre
ssu
re i
n a
ir-p
len
um
(P
1)
/ P
a
(b-1) (b-2)
Frequency / Hz Frequency / Hz
TON/TOFF=50/50
Amplitude at Up/Ut =0.2
Amplitude at Up/Ut =0.4
Error bar - Standard deviation
Bed
pres
sure
dro
p (
P2)
/ P
a
TON/TOFF=50/50
0
40
80
120
160
200
0
4
8
12
16
20
Amplitude
Error bar - Standard deviation
Pre
ssu
re i
n a
ir-p
len
um
(P
1)
/ P
a
(c-1) (c-2) Amplitude
Error bar - Standard deviation
25/75 50/50 75/25
Pulsation Duty Cycle (TON/TOFF )50/5025/75 75/25
Pulsation Duty Cycle (TON/TOFF)
¦=1.5 Hz
Up/Ut=0.4
Bed
pres
sure
dro
p (
P2)
/ P
a
¦=1.5 Hz
Up/Ut=0.4
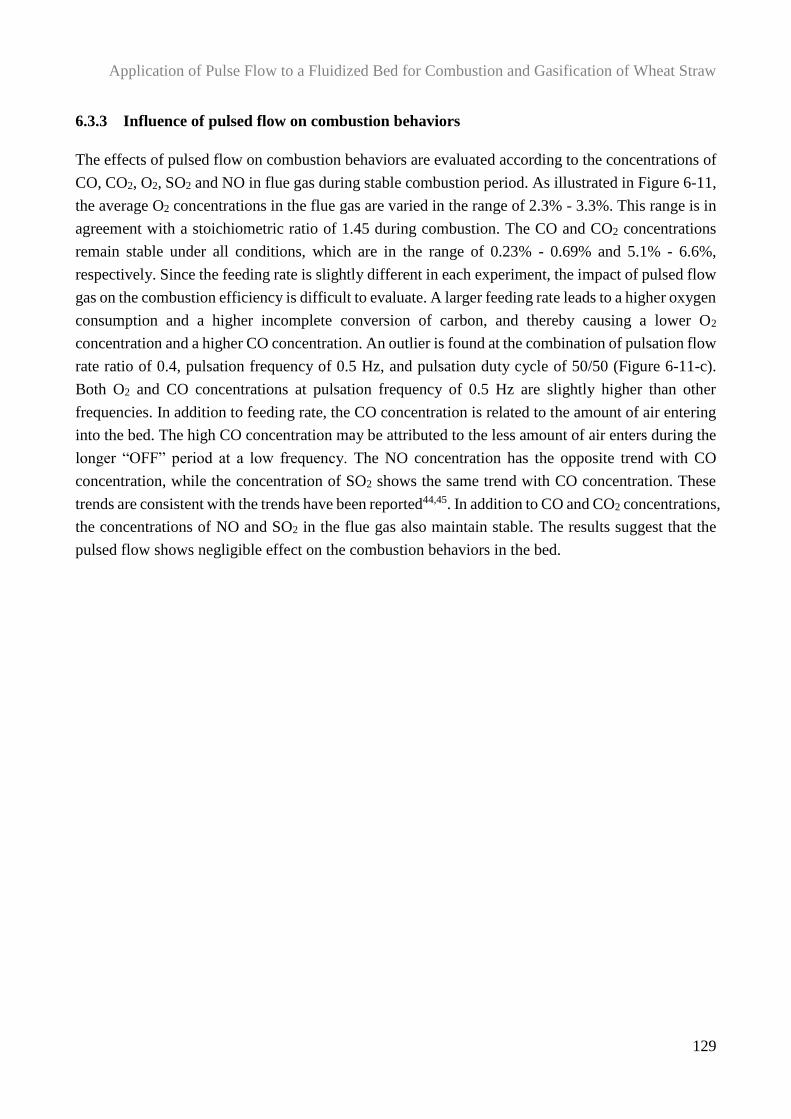
Application of Pulse Flow to a Fluidized Bed for Combustion and Gasification of Wheat Straw
129
6.3.3 Influence of pulsed flow on combustion behaviors
The effects of pulsed flow on combustion behaviors are evaluated according to the concentrations of
CO, CO2, O2, SO2 and NO in flue gas during stable combustion period. As illustrated in Figure 6-11,
the average O2 concentrations in the flue gas are varied in the range of 2.3% - 3.3%. This range is in
agreement with a stoichiometric ratio of 1.45 during combustion. The CO and CO2 concentrations
remain stable under all conditions, which are in the range of 0.23% - 0.69% and 5.1% - 6.6%,
respectively. Since the feeding rate is slightly different in each experiment, the impact of pulsed flow
gas on the combustion efficiency is difficult to evaluate. A larger feeding rate leads to a higher oxygen
consumption and a higher incomplete conversion of carbon, and thereby causing a lower O2
concentration and a higher CO concentration. An outlier is found at the combination of pulsation flow
rate ratio of 0.4, pulsation frequency of 0.5 Hz, and pulsation duty cycle of 50/50 (Figure 6-11-c).
Both O2 and CO concentrations at pulsation frequency of 0.5 Hz are slightly higher than other
frequencies. In addition to feeding rate, the CO concentration is related to the amount of air entering
into the bed. The high CO concentration may be attributed to the less amount of air enters during the
longer “OFF” period at a low frequency. The NO concentration has the opposite trend with CO
concentration, while the concentration of SO2 shows the same trend with CO concentration. These
trends are consistent with the trends have been reported44,45. In addition to CO and CO2 concentrations,
the concentrations of NO and SO2 in the flue gas also maintain stable. The results suggest that the
pulsed flow shows negligible effect on the combustion behaviors in the bed.
Agglomeration during Fluidized Bed Combustion and Gasification of Biomass
130
Figure 6-11 Influence of (a) flow rate of pulsation (b) & (c) pulsation frequency, and (d) pulsation duty cycle on flue
gas (CO, CO2, O2, NO, and SO2) compositions during stable combustion period. (a) pulsation frequency = 1.5 Hz;
pulsation duty cycle = 50/50; (b) pulsation flow rate ratio = 0.3; pulsation duty cycle = 50/50; (c) pulsation flow rate
ratio = 0.4; pulsation duty cycle = 50/50; (d) pulsation flow rate ratio = 0.4; pulsation frequency = 1.5 Hz.
0.00 0.20 0.25 0.30 0.35 0.400.0
0.4
0.8
1.20
2
4
60
2
4
60
10
20
30
400
30
60
90
120
CO
/ %
Flow rate ratio of pulsation (Up/Ut)
¦=1.5 Hz
TON/TOFF=50/50
CO
2 /
%
O2 /
%
SO
2 /
pp
m
NO
/ p
pm
(a) 0.5 1.0 1.5 2.0 2.5 3.00.0
0.4
0.8
1.20
2
4
60
2
4
60
10
20
30
400
30
60
90
120
CO
/ %
Frequency / Hz
CO
2 /
%
O2 /
%
SO
2 /
pp
m
NO
/ p
pm
(b)
Up/Ug=0.3
TON/TOFF=50/50
0.5 1.0 1.5 2.0 2.5 3.00.0
0.4
0.8
1.20
2
4
60
2
4
60
10
20
30
400
30
60
90
120
CO
/ %
Frequency / Hz
CO
2 /
%
O2 /
%
SO
2 /
pp
m
NO
/ p
pm
(c)
Up/Ug=0.4
TON/TOFF=50/50
0.0
0.4
0.8
1.20
2
4
60
2
4
60
10
20
30
400
30
60
90
120
CO
/ %
Up/Ug=0.4
¦=1.5 Hz
75/2550/5025/75
Pulsation Duty Cycle (TON/TOFF ratio)
CO
2 /
%
O2 /
%
SO
2 /
pp
m
NO
/ p
pm
(d)
Application of Pulse Flow to a Fluidized Bed for Combustion and Gasification of Wheat Straw
131
6.4 Conclusions
A pulsed fluidized bed reactor could be a potential countermeasure for retarding the defluidization
tendency during biomass combustion and gasification. The effects of operating parameters, including
flow rate ratio of pulsation, pulsation frequency, and pulsation duty cycle, on defluidization tendency
are investigated. Among the parameters have been investigated in this chapter, the pulsation duty
cycle shows the most pronounced effect on the defluidization, whilst the pulsation frequency shows
the least obvious influence. With imposing of a pulsed flow with pulsation flow rate ratio of 0.4,
pulsation frequency of 1.5 Hz and pulsation duty cycle of 25/75, the amounts of straw fed for inducing
defluidization are 151.6% and 137.5% of that during the conventional combustion and gasification,
respectively. The good performance of pulsed flow on mitigating defluidization may be attributed to
the large displacement of bed particles caused by a high moving velocity of particles during “flow-
ON” period and/or a long falling down time during “flow-OFF” period, as well as the homogeneous
fluidization in the bed resulted from a reduced minimum fluidization velocity. The mechanism of
mitigated effect of pulsed flow on defluidization needs to be further investigated. Introducing of
pulsed flow in primary gas shows negligible effect on the combustion behaviors.
Agglomeration during Fluidized Bed Combustion and Gasification of Biomass
132
Reference
(1) Shukla, S.; Murty, P.; Sanjay. Combined Heat and Power through Biomass - An Overview.
Sae Technical Papers. SAE International 2011.
(2) Khan, A. A.; de Jong, W.; Jansens, P. J.; Spliethoff, H. Biomass Combustion in Fluidized Bed
Boilers: Potential Problems and Remedies. Fuel Process. Technol. 2009, 90 (1), 21–50.
(3) Koornneef, J.; Junginger, M.; Faaij, A. Development of Fluidized Bed Combustion-An
Overview of Trends, Performance and Cost. Prog. Energy Combust. Sci. 2007, 33 (1), 19–55.
(4) Lin, W.; Jensen, A. D.; Johnsson, J. E.; Dam-Johansen, K. Combustion of Biomass in Fluidized
Beds: Problems and Some Solutions Based on Danish Experiences. In Proceedings of the 17th
International Conference on Fluidized Bed Combustion; American Society of Mechanical
Engineers: Jacksonville, Florida USA, 2003; pp 945–953.
(5) Scala, F. Particle Agglomeration during Fluidized Bed Combustion: Mechanisms, Early
Detection and Possible Countermeasures. Fuel Process. Technol. 2018, 171, 31–38.
(6) Bartels, M.; Lin, W.; Nijenhuis, J.; Kapteijn, F.; van Ommen, J. R. Agglomeration in Fluidized
Beds at High Temperatures: Mechanisms, Detection and Prevention. Prog. Energy Combust.
Sci. 2008, 34 (5), 633–666.
(7) Morris, J. D.; Sheraz, S.; Chilton, S.; Nimmo, W. Mechanisms and Mitigation of
Agglomeration during Fluidize Bed Combustion of Biomass : A Review. Fuel 2018, 230, 452–
473.
(8) Mettanant, V.; Basu, P.; Butler, J. Agglomeration of Biomass Fired Fluidized Bed Gasifier and
Combustor. Can. J. Chem. Eng. 2009, 87 (5), 656–684.
(9) Öhman, M.; Nordin, A.; Skrifvars, B. J.; Backman, R.; Hupa, M. Bed Agglomeration
Characteristics during Fluidized Bed Combustion of Biomass Fuels. Energy & Fuels 2000, 14
(1), 169–178.
(10) Ergudenler, A.; Ghaly, A. E. Agglomeration of Alumina Sand in a Fluidized Bed Straw
Gasifier at Elevated Temperatures. Bioresour. Technol. 1993, 43 (3), 259–268.
(11) Ghaly, A. E.; Ergüdenler, A.; Laufer, E. Agglomeration Characteristics of Alumina Sand-
Straw Ash Mixtures at Elevated Temperatures. Biomass and Bioenergy 1993, 5 (6), 467–480.
(12) Fernández Llorente, M. J.; Escalada Cuadrado, R.; Murillo Laplaza, J. M.; Carrasco García, J.
E. Combustion in Bubbling Fluidised Bed with Bed Material of Limestone to Reduce the
Biomass Ash Agglomeration and Sintering. Fuel 2006, 85 (14–15), 2081–2092.
(13) Vuthaluru, H. B.; Zhang, D. K. Effect of Ca- and Mg-Bearing Minerals on Particle
Agglomeration Defluidization during Fluidized-Bed Combustion of a South Australian Lignite.
Fuel Process. Technol. 2001, 69 (1), 13–27.
(14) Grubor, B.D.; Oka, S.N.; Ilic, M.S.; Dakic, D.V.; Arsic, B. .; Grubor, B. D.; Oka, S. N.; Ilic,
M. S.; Dakic, D. V.; Arsic, B. T. Biomass FBC Combustion - Bed Agglomeration Problems.
Application of Pulse Flow to a Fluidized Bed for Combustion and Gasification of Wheat Straw
133
In Proceedings of the 13th International Conference on Fluidized Bed Combustion; American
Society of Mechanical Engineers: United States, 1995; Vol. 1, pp 515–522.
(15) Öhman, M.; Nordin, A.; Lundholm, K.; Boström, D.; Hedman, H.; Lundberg, M. Ash
Transformations during Combustion of Meat-, Bonemeal, and RDF in a (Bench-Scale)
Fluidized Bed Combustor. Energy & Fuels 2003, 17 (5), 1153–1159.
(16) Chou, J. D.; Lin, C. L. Inhibition of Agglomeration/Defluidization by Different Calcium
Species during Fluidized Bed Incineration under Different Operating Conditions. Powder
Technol. 2012, 219, 165–172.
(17) Grimm, A.; Skoglund, N.; Boström, D.; Boman, C.; Öhman, M. Influence of Phosphorus on
Alkali Distribution during Combustion of Logging Residues and Wheat Straw in a Bench-
Scale Fluidized Bed. Energy & Fuels 2012, 26 (5), 3012–3023.
(18) Arvelakis, S.; Gehrmann, H.; Beckmann, M.; Koukios, E. G. Preliminary Results on the Ash
Behavior of Peach Stones during Fluidized Bed Gasification : Evaluation of Fractionation and
Leaching as Pre-Treatments. Biomass and Bioenergy 2005, 28, 331–338.
(19) Skoglund, N.; Grimm, A.; Öhman, M.; Boström, D. Effects on Ash Chemistry When Co-Firing
Municipal Sewage Sludge and Wheat Straw in a Fluidized Bed: Influence on the Ash
Chemistry by Fuel Mixing. Energy & Fuels 2013, 27 (10), 5725–5732.
(20) Nordgren, D.; Hedman, H.; Padban, N.; Boström, D.; Öhman, M. Ash Transformations in
Pulverised Fuel Co-Combustion of Straw and Woody Biomass. Fuel Process. Technol. 2013,
105, 52–58.
(21) Lin, W.; Dam-Johansen, K.; Frandsen, F. Agglomeration in Bio-Fuel Fired Fluidized Bed
Combustors. Chem. Eng. J. 2003, 96 (1–3), 171–185.
(22) Ryabov, G.; Litoun, D.; Dik, E. Agglomeration of Bed Material: Influence on Efficiency of
Biofuel Fluidized Bed Boiler. Therm. Sci. 2003, 7 (1), 5–16.
(23) Saidi, M.; Basirat Tabrizi, H.; Grace, J. R. A Review on Pulsed Flow in Gas-Solid Fluidized
Beds and Spouted Beds: Recent Work and Future Outlook. Adv. Powder Technol. 2019, 30
(6), 1121–1130.
(24) Ireland, E.; Pitt, K.; Smith, R. A Review of Pulsed Flow Fluidisation; the Effects of Intermittent
Gas Flow on Fluidised Gas-Solid Bed Behaviour. Powder Technol. 2016, 292, 108–121.
(25) Khosravi Bizhaem, H.; Basirat Tabrizi, H. Investigating Effect of Pulsed Flow on
Hydrodynamics of Gas-Solid Fluidized Bed Using Two-Fluid Model Simulation and
Experiment. Powder Technol. 2017, 311, 328–340.
(26) Khosravi Bizhaem, H.; Basirat Tabrizi, H. Experimental Study on Hydrodynamic
Characteristics of Gas-Solid Pulsed Fluidized Bed. Powder Technol. 2013, 237, 14–23.
(27) Jia, D.; Bi, X.; Lim, C. J.; Sokhansanj, S.; Tsutsumi, A. Heat Transfer in a Tapered Fluidized
Bed of Biomass Particles with Pulsed Gas Flow. Particuology 2019, 42, 2–14.
Agglomeration during Fluidized Bed Combustion and Gasification of Biomass
134
(28) Jia, D.; Bi, X.; Lim, C. J.; Sokhansanj, S.; Tsutsumi, A. Heat Transfer in a Pulsed Fluidized
Bed of Biomass Particles. Ind. Eng. Chem. Res. 2017, 56 (13), 3740–3756.
(29) Liu, Y.; Liu, Z.; Ohara, H. Heat Transfer and Fluidization Characteristics of Lignite in a
Pulsation-Assisted Fluidized Bed. Ind. Eng. Chem. Res. 2017, 56 (31), 8995–9005.
(30) Jia, D.; Bi, X.; Lim, C. J.; Sokhansanj, S.; Tsutsumi, A. Biomass Drying in a Pulsed Fluidized
Bed without Inert Bed Particles. Fuel 2016, 186, 270–284.
(31) Jia, D.; Cathary, O.; Peng, J.; Bi, X.; Lim, C. J.; Sokhansanj, S.; Liu, Y.; Wang, R.; Tsutsumi,
A. Fluidization and Drying of Biomass Particles in a Vibrating Fluidized Bed with Pulsed Gas
Flow. Fuel Process. Technol. 2015, 138, 471–482.
(32) Hadi, B.; Van Ommen, J. R.; Coppens, M. O. Enhanced Particle Mixing in Pulsed Fluidized
Beds and the Effect of Internals. Ind. Eng. Chem. Res. 2012, 51 (4), 1713–1720.
(33) Wang, X. S.; Rhodes, M. J. Using Pulsed Flow to Overcome Defluidization. Chem. Eng. Sci.
2005, 60 (18), 5177–5181.
(34) Ali, S. S.; Asif, M. Fluidization of Nano-Powders: Effect of Flow Pulsation. Powder Technol.
2012, 225, 86–92.
(35) Ali, S. S.; Asif, M.; Ajbar, A. Bed Collapse Behavior of Pulsed Fluidized Beds of Nano-
Powder. Adv. Powder Technol. 2014, 25 (1), 331–337.
(36) Yan, J.; Cen, K.; Kang, Q. Mechanism of Pulsating Fluidized Bed and Its Application in
Combustion of Coal (in Chinese). J. Zhejinag Univ. 1986, 20 (6), 123–131.
(37) Hao, B.; Bi, H. T. Forced Bed Mass Oscillations in Gas-Solid Fluidized Beds. Powder Technol.
2005, 149 (2–3), 51–60.
(38) Bi, H. T. A Critical Review of the Complex Pressure Fluctuation Phenomenon in Gas-Solids
Fluidized Beds. Chem. Eng. Sci. 2007, 62 (13), 3473–3493.
(39) Zhang, D.; Koksal, M. Heat Transfer in a Pulsed Bubbling Fluidized Bed. Powder Technol.
2006, 168 (1), 21–31.
(40) Sasic, S.; Leckner, B.; Johnsson, F. Fluctuations and Waves in Fluidized Bed Systems: The
Influence of the Air-Supply System. Powder Technol. 2005, 153 (3), 176–195.
(41) Gui, N.; Fan, J. R. Numerical Simulation of Pulsed Fluidized Bed with Immersed Tubes Using
DEM-LES Coupling Method. Chem. Eng. Sci. 2009, 64 (11), 2590–2598.
(42) Kobayashi, M.; Ramaswasi, D.; Brazelton, W. T. HEAT TRANSFER FROM AN INTERNAL
SURFACE TO A PULSED BED. Chem. Eng. Prog. Symp. Ser. 1970, 66 (105), 58–67.
(43) Nishimura, A.; Deguchi, S.; Matsuda, H.; Hasatani, M.; Mujumdar, A. S. Heat Transfer
Characteristics in a Pulsating Fluidized Bed in Relation to Bubble Characteristics. Heat Transf.
- Asian Res. 2002, 31 (4), 307–319.
Application of Pulse Flow to a Fluidized Bed for Combustion and Gasification of Wheat Straw
135
(44) Courtemanche, B.; Levendis, Y. A. A Laboratory Study on the NO, NO2, SO2, CO and CO2
Emissions from the Combustion of Pulverized Coal, Municipal Waste Plastics and Tires. Fuel
1998, 77 (3), 183–196.
(45) Kazanc, F.; Khatami, R.; Manoel Crnkovic, P.; Levendis, Y. A. Emissions of NOx and SO2
from Coals of Various Ranks, Bagasse, and Coal-Bagasse Blends Burning in O2/N2 and
O2/CO2 Environments. Energy & Fuels 2011, 25 (7), 2850–2861.

Agglomeration during Fluidized Bed Combustion and Gasification of Biomass
136
Conclusions and suggestions for future work
137
7. Conclusions and suggestions for future work
This chapter provides a summary of main conclusions, as well as the suggestions for the future work.
7.1 Conclusions
In this work, the agglomeration during combustion and gasification of biomass was investigated in a
lab-scale bubbling fluidized bed reactor at 850 °C using silica sand as bed material. The influences
of equivalence ratio (ER) and gasification agent (air, steam and carbon dioxide) on agglomeration of
wheat straw were systematically studied. In addition, the agglomeration of sunflower husk and
another batch of wheat straw was investigated to study the influences of type and property of biomass
on agglomeration in combustion and gasification. The fusion behaviors of wheat straw ash were
investigated a fixed bed reactor under combustion and gasification conditions to further understand
the influence of gas atmosphere on agglomeration. Different techniques, such as scanning electron
microscopy with energy-dispersive X-ray spectroscopy (SEM-EDX), X-ray diffraction (XRD), and
thermogravimetric analysis (TGA), were applied to characterize the selected agglomerates, biomass
ash, and char. The thermodynamic equilibrium calculations were carried out to shed light upon the
distribution of potassium in the biomass ashes under the experimental conditions. A pulsed flow was
applied to the fluidized bed to explore the possibility of mitigating the agglomeration in
combustion/gasification of biomass and its effect on the conversion process. The main conclusions
from this work are summarized as bellows.
The agglomeration in fluidized bed combustion and gasification of wheat straw is strongly influenced
by the ER and gasification agent in primary gas. In an air blown fluidized bed, the agglomeration
tendency of wheat straw first increases with decreasing ER, and then decreases as ER further
decreases. By shifting ER from combustion region (ER > 1) gradually to gasification region (ER <
1), the enhanced reducing atmosphere could accelerate the agglomeration, possibly resulting from an
increased melting of wheat straw ash. However, the increased amount of residual carbon caused by
decreasing ER mitigates the agglomeration in the bed. The residual carbon may reduce the fusion
tendency and melting flow behavior of ash, thus mitigating the agglomeration. In addition, the carbon
attached on the sand surface may inhibit the agglomeration by preventing the interaction between ash
and bed material. The competition between an enhanced reducing atmosphere and a higher amount
of residual carbon by lowering ER results in the occurrence of a maximal agglomeration tendency at
a critical ER. The critical ER would be lowered by adding steam to the primary gas, due to an
increased carbon conversion. In addition, the presence of steam in primary gas may significantly
Agglomeration during Fluidized Bed Combustion and Gasification of Biomass
138
lower the viscosity of wheat straw ash, and thereby promoting the agglomeration. The addition of
CO2 in primary gas slightly mitigates the agglomeration.
The appearances of the ashes from wheat straw under combustion conditions (100% air and a mixture
of 50 vol.% steam and 50 vol.% air) and gasification condition (a mixture of 50 vol.% steam and 50
vol.% N2) are significantly different. The ash from normal combustion is friable and less cohesive,
while the ashes from combustion with presence of steam and the ash from gasification with steam are
tight and compact. The visual observation and SEM-EDX results indicate that the ash obtained from
gasification with steam has the highest fusion tendency followed by the ash from combustion with
presence of steam and lastly the ash from normal combustion, indicating that a high concentration of
steam and a reducing atmosphere could promote the fusion behaviors of straw ashes. The fusion
tendency of the ashes from a mixture of wheat straw and silica sand under the three conditions is
consistent with the ashes from wheat straw. Although the formation of the agglomerates under all
conditions are caused by the molten K-Ca silicates, a severer agglomeration is observed for the
mixture that contains the ash with a higher fusion tendency. The fusion tendency of the ashes is
consistent with the agglomeration tendency in fluidized bed experiments.
Sunflower husk ash has a higher agglomeration than wheat straw ash in both combustion and
gasification. The different agglomeration tendency of two types of biomass probably result from the
significantly different Si/K molar ratios for wheat straw and sunflower husk, which may result in
different distribution of potassium in their ashes, thus causing different agglomeration mechanisms.
The agglomeration mechanism of the Si-rich wheat straw probably is that the partially molten ashes
adhere on the bed particles and subsequently form a coating layer, leading to agglomeration. The
agglomeration of the Si-lean sunflower husk may be caused by the formation of K silicates via the
interaction between sunflower husk ash and bed particles (SiO2). The influence of ER on
agglomeration tendency of sunflower husk follows the same trend as wheat straw, indicating that a
reducing atmosphere and the residual carbon in the bed show consistent effects on the agglomeration
of two types of biomass. In the air blown gasification, the critical ER of sunflower husk, which is
0.04, is lower than that of wheat straw, which is 0.36. Different from wheat straw, the accelerated
agglomeration of sunflower husk under a reducing atmosphere possibly is attributed to a promoted
reactivity of sunflower husk ash towards SiO2. During gasification of biomass, a higher char reactivity
results in a less amount of residual carbon in the bed. The inhibition effect of residual carbon caused
by decreasing ER decreases with increasing char reactivity. Compared to wheat straw, the char
reactivity of sunflower husk is higher, leading to a reduced inhibition effect of residual carbon. The
low critical ER of sunflower husk may be ascribed to its high char reactivity and the different
agglomeration mechanism from wheat straw caused by a low Si/K molar ratio of sunflower husk. The
agglomeration of two types of biomass is promoted by adding a high concentration of steam to the
primary gas. The accelerated agglomeration of sunflower husk under the condition with presence of
steam may be attributed to an increased melting of sunflower husk ash and a promoted interaction
Conclusions and suggestions for future work
139
between sunflower husk ash and bed particles. For different batches of wheat straw, the straw with a
higher Al content may has a slightly lower agglomeration tendency, probably due to a reduced
melting of ash. In addition, the straw with a lower char reactivity shows a significantly lower
agglomeration tendency during gasification, probably due to a more pronounced inhibition effect of
residual carbon.
The application of pulsed fluidized bed reactor is a potential countermeasure for retarding the
defluidization tendency during biomass combustion and gasification. Introducing of pulsed flow in
the primary gas shows minor effect on the combustion behaviors. Among the parameters that have
been studied, the pulsation duty cycle shows the most significant influence on the agglomeration,
while the pulsation frequency has the smallest influence. The most pronounced effect of pulsed flow
on defluidization tendency is observed at the condition of pulsation flow rate ratio of 0.4, pulsation
frequency of 1.5 Hz, and pulsation duty cycle of 25/75. Under the optimum condition, the amounts
of straw fed for inducing defluidization are 151.6% and 137.5% of that under the conventional
combustion and gasification, respectively. The good performance of pulsed fluidized bed on reducing
agglomeration may be attributed to an improved fluidization quality in the bed and an increased
displacement of bed particles.
7.2 Suggestion for future work
The results of this PhD project provide an improved understanding of agglomeration in fluidized bed
gasification of biomass, with a special emphasis on the influence of gasification agents, ER, and
biomass type. In addition, a potential countermeasure for reducing agglomeration, application of
pulsed fluidized bed, is preliminarily investigated. However, a few questions, such as the influence
of concentrations of reducing agents on the fusion behaviors of wheat straw ash, as well as the
influences of reducing atmosphere and steam on the fusion behaviors of sunflower husk ash and the
interaction between sunflower husk ash and silica sand, are still unclear. Some suggestions for future
work are shown as follows:
Influence of concentrations of reducing agents on the fusion behaviors of wheat straw ash
The results of fluidized bed experiments show that when the ER is higher than the critical ER, a
decrease in ER will result in a slightly increased agglomeration tendency. The gradually increased
agglomeration may be attributed to an increased melting of ash caused by an enhanced reducing
atmosphere. The results of fixed bed experiments indicate that the reducing atmosphere formed in
gasification could promote the fusion behaviors of wheat straw ash. However, the fusion behaviors
of wheat straw ash under a reducing atmosphere with different reducing agents, such as H2 and CO,
are still unknown, and could be further investigated in a fixed bed reactor. In addition, the influence
of concentrations of the reducing agents on the fusion behavior of wheat straw also of interest to be
studied to improve the understanding of agglomeration in gasification of wheat straw.
Agglomeration during Fluidized Bed Combustion and Gasification of Biomass
140
Influence of reducing atmosphere and steam on the fusion behaviors of sunflower husk ash
and the interaction between sunflower husk ash and silica sand
During gasification of sunflower husk, the reducing atmosphere and steam could promote the
agglomeration, probably due to their promotive effects on the interaction between sunflower husk ash
and bed material. However, no experimental evidence to this are found in this work. Therefore, the
influence of reducing atmosphere and steam on the interaction between sunflower husk ash and silica
sand could be studied in a fixed bed reactor. In addition, the fusion behaviors of wheat straw is
promoted by a reducing atmosphere and a high concentration of steam. However, whether such
phenomena occur to sunflower husk ash is still unclear. The further investigations on the influence
of reducing atmosphere and steam on the fusion behaviors of sunflower husk ash and the interaction
between sunflower husk ash and silica sand could provide an improved understanding of the
agglomeration in sunflower husk gasification.
Agglomeration behaviors in gasification of other types of biomass
The various molar ratios of Si/K in different types of biomass results in a different K distribution in
the ashes, and thereby causing a different agglomeration tendency and mechanism. For example, the
ash of P-rich biomass may be dominated by phosphates, which will behavior different under
gasification condition. Therefore, the agglomeration behaviors of other types of biomass, such as the
P-rich rapeseed meal, in gasification could be investigated to have a more comprehensive
understanding of agglomeration in fluidized bed gasification of biomass.
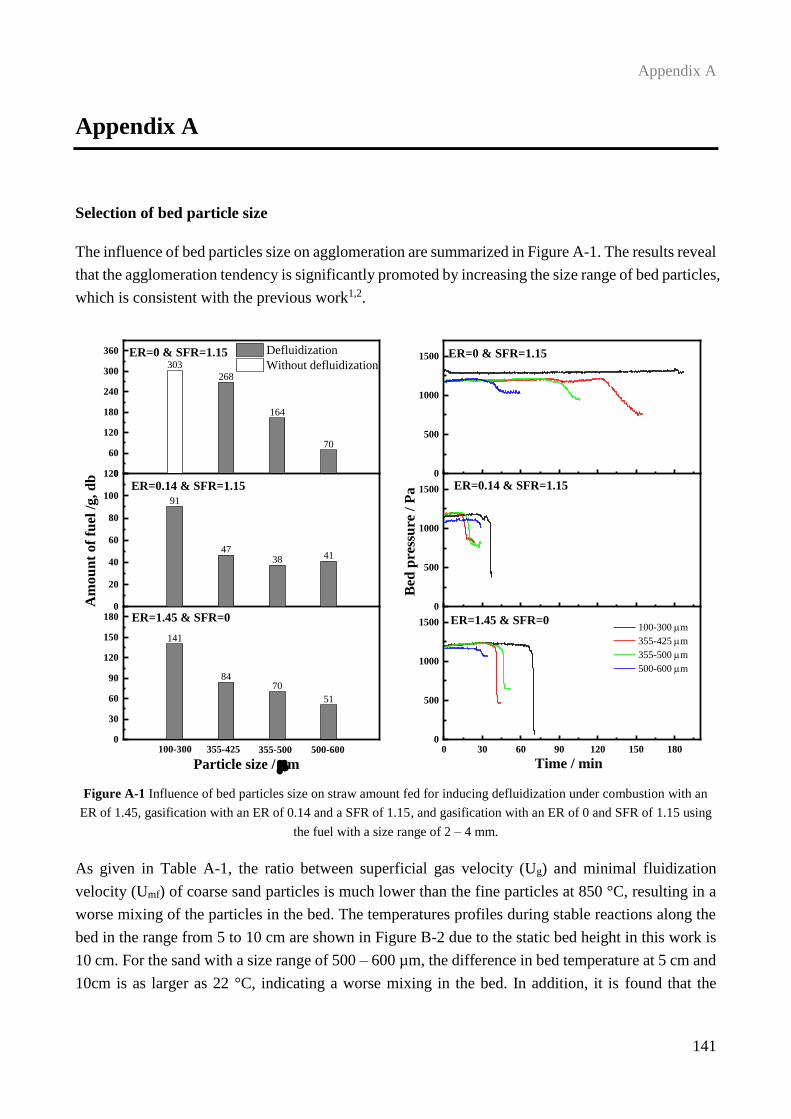
Appendix A
141
Appendix A
Selection of bed particle size
The influence of bed particles size on agglomeration are summarized in Figure A-1. The results reveal
that the agglomeration tendency is significantly promoted by increasing the size range of bed particles,
which is consistent with the previous work1,2.
Figure A-1 Influence of bed particles size on straw amount fed for inducing defluidization under combustion with an
ER of 1.45, gasification with an ER of 0.14 and a SFR of 1.15, and gasification with an ER of 0 and SFR of 1.15 using
the fuel with a size range of 2 – 4 mm.
As given in Table A-1, the ratio between superficial gas velocity (Ug) and minimal fluidization
velocity (Umf) of coarse sand particles is much lower than the fine particles at 850 °C, resulting in a
worse mixing of the particles in the bed. The temperatures profiles during stable reactions along the
bed in the range from 5 to 10 cm are shown in Figure B-2 due to the static bed height in this work is
10 cm. For the sand with a size range of 500 – 600 µm, the difference in bed temperature at 5 cm and
10cm is as larger as 22 °C, indicating a worse mixing in the bed. In addition, it is found that the
0
60
120
180
240
300
360
0
20
40
60
80
100
120
0
30
60
90
120
150
180
268
164
70
303
91
4738 41
141
8470
51
ER=0 & SFR=1.15 Defluidization
Without defluidization
ER=0.14 & SFR=1.15
ER=1.45 & SFR=0
Am
ou
nt
of
fuel
/g, d
b
Particle size / mm
100-300 355-425 355-500 500-600
0
500
1000
1500
0
500
1000
1500
0 30 60 90 120 150 1800
500
1000
1500
Bed
pre
ssu
re /
Pa
ER=0 & SFR=1.15
ER=0.14 & SFR=1.15
ER=1.45 & SFR=0
100-300 mm
355-425 mm
355-500 mm
500-600 mm
Time / min
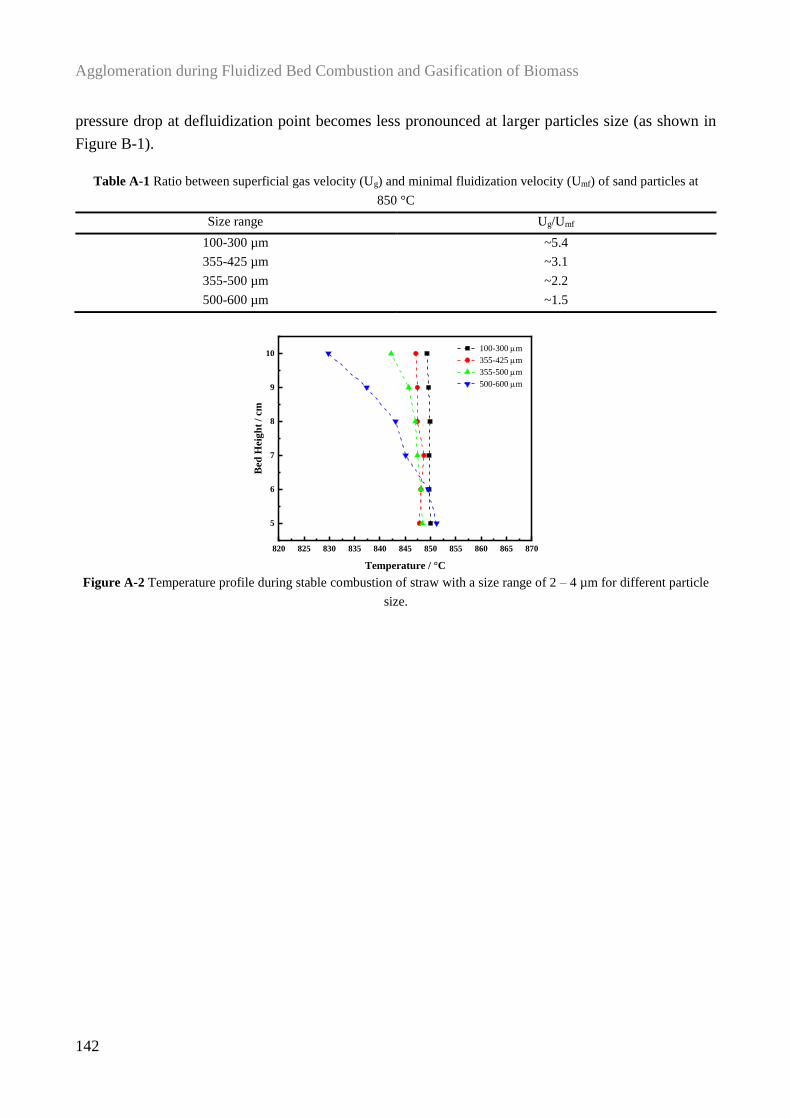
Agglomeration during Fluidized Bed Combustion and Gasification of Biomass
142
pressure drop at defluidization point becomes less pronounced at larger particles size (as shown in
Figure B-1).
Table A-1 Ratio between superficial gas velocity (Ug) and minimal fluidization velocity (Umf) of sand particles at
850 °C
Size range Ug/Umf
100-300 µm ~5.4
355-425 µm ~3.1
355-500 µm ~2.2
500-600 µm ~1.5
Figure A-2 Temperature profile during stable combustion of straw with a size range of 2 – 4 µm for different particle
size.
5
6
7
8
9
10
820 825 830 835 840 845 850 855 860 865 870
100-300 mm
355-425 mm
355-500 mm
500-600 mm
Temperature / °C
Bed
Hei
gh
t /
cm
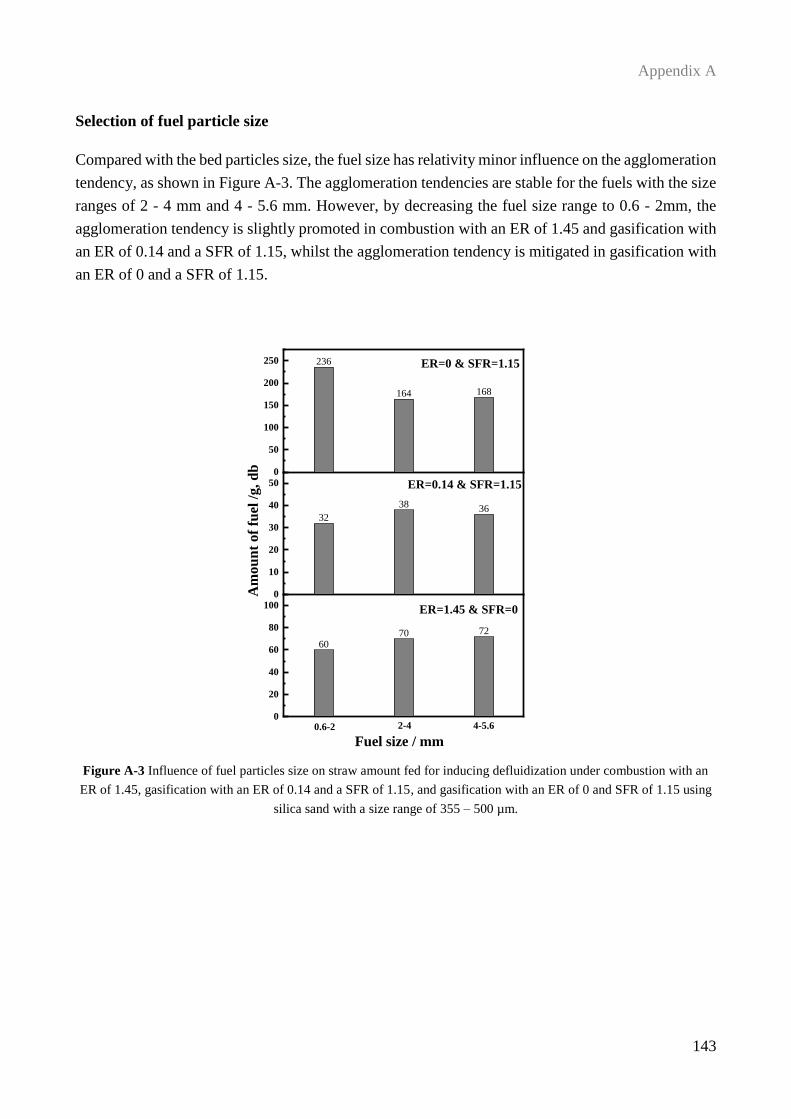
Appendix A
143
Selection of fuel particle size
Compared with the bed particles size, the fuel size has relativity minor influence on the agglomeration
tendency, as shown in Figure A-3. The agglomeration tendencies are stable for the fuels with the size
ranges of 2 - 4 mm and 4 - 5.6 mm. However, by decreasing the fuel size range to 0.6 - 2mm, the
agglomeration tendency is slightly promoted in combustion with an ER of 1.45 and gasification with
an ER of 0.14 and a SFR of 1.15, whilst the agglomeration tendency is mitigated in gasification with
an ER of 0 and a SFR of 1.15.
Figure A-3 Influence of fuel particles size on straw amount fed for inducing defluidization under combustion with an
ER of 1.45, gasification with an ER of 0.14 and a SFR of 1.15, and gasification with an ER of 0 and SFR of 1.15 using
silica sand with a size range of 355 – 500 µm.
0
20
40
60
80
1000
10
20
30
40
500
50
100
150
200
250
6070 72
32
38 36
236
164 168
Fuel size / mm
2-40.6-2 4-5.6
ER=0 & SFR=1.15
ER=0.14 & SFR=1.15
ER=1.45 & SFR=0
Am
ou
nt
of
fuel
/g,
db
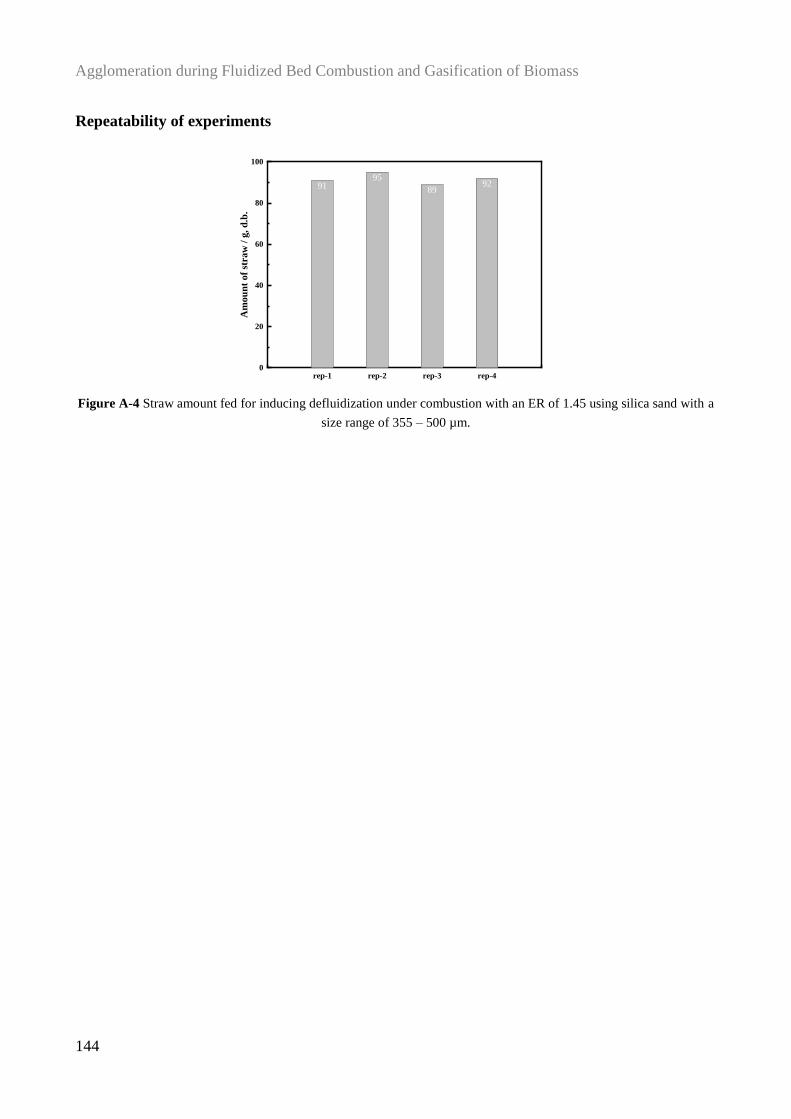
Agglomeration during Fluidized Bed Combustion and Gasification of Biomass
144
Repeatability of experiments
Figure A-4 Straw amount fed for inducing defluidization under combustion with an ER of 1.45 using silica sand with a
size range of 355 – 500 µm.
rep-1 rep-2 rep-3 rep-40
20
40
60
80
100
9195
8992
Am
ou
nt
of
stra
w /
g, d
.b.
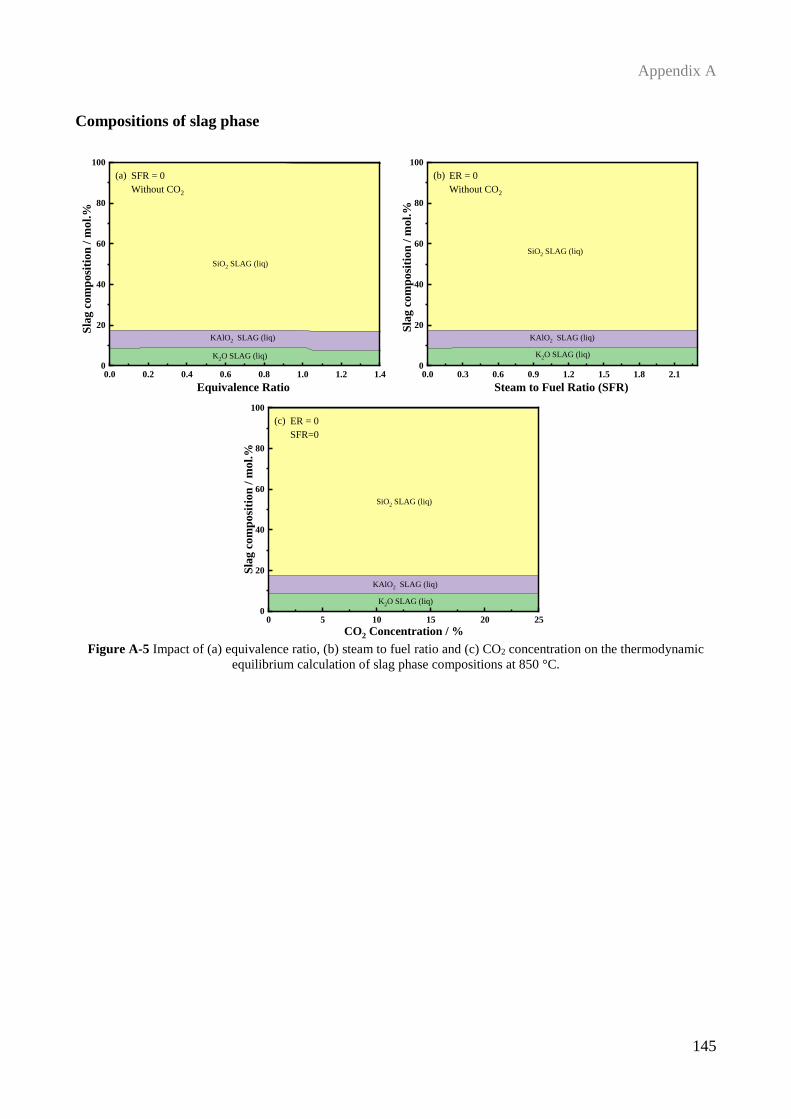
Appendix A
145
Compositions of slag phase
Figure A-5 Impact of (a) equivalence ratio, (b) steam to fuel ratio and (c) CO2 concentration on the thermodynamic
equilibrium calculation of slag phase compositions at 850 °C.
0.0 0.2 0.4 0.6 0.8 1.0 1.2 1.40
20
40
60
80
100
KAlO2 SLAG (liq)
K2O SLAG (liq)
Equivalence Ratio
Sla
g c
om
po
siti
on
/ m
ol.
%
(a) SFR = 0
Without CO2
SiO2 SLAG (liq)
0.0 0.3 0.6 0.9 1.2 1.5 1.8 2.10
20
40
60
80
100
KAlO2 SLAG (liq)
Steam to Fuel Ratio (SFR)
Sla
g c
om
po
siti
on
/ m
ol.
%
(b) ER = 0
Without CO2
K2O SLAG (liq)
SiO2 SLAG (liq)
0 5 10 15 20 250
20
40
60
80
100
CO2 Concentration / %
(c) ER = 0
SFR=0
KAlO2 SLAG (liq)
K2O SLAG (liq)
SiO2 SLAG (liq)
Sla
g c
om
po
siti
on
/ m
ol.
%
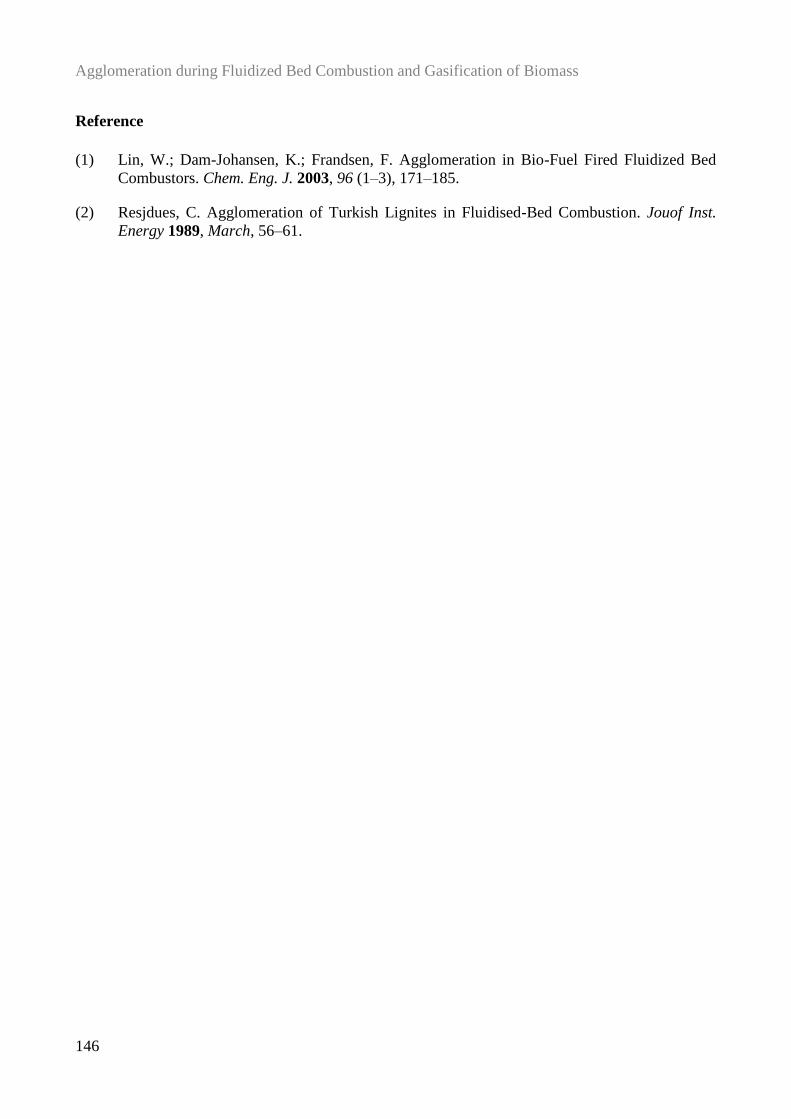
Agglomeration during Fluidized Bed Combustion and Gasification of Biomass
146
Reference
(1) Lin, W.; Dam-Johansen, K.; Frandsen, F. Agglomeration in Bio-Fuel Fired Fluidized Bed
Combustors. Chem. Eng. J. 2003, 96 (1–3), 171–185.
(2) Resjdues, C. Agglomeration of Turkish Lignites in Fluidised-Bed Combustion. Jouof Inst.
Energy 1989, March, 56–61.
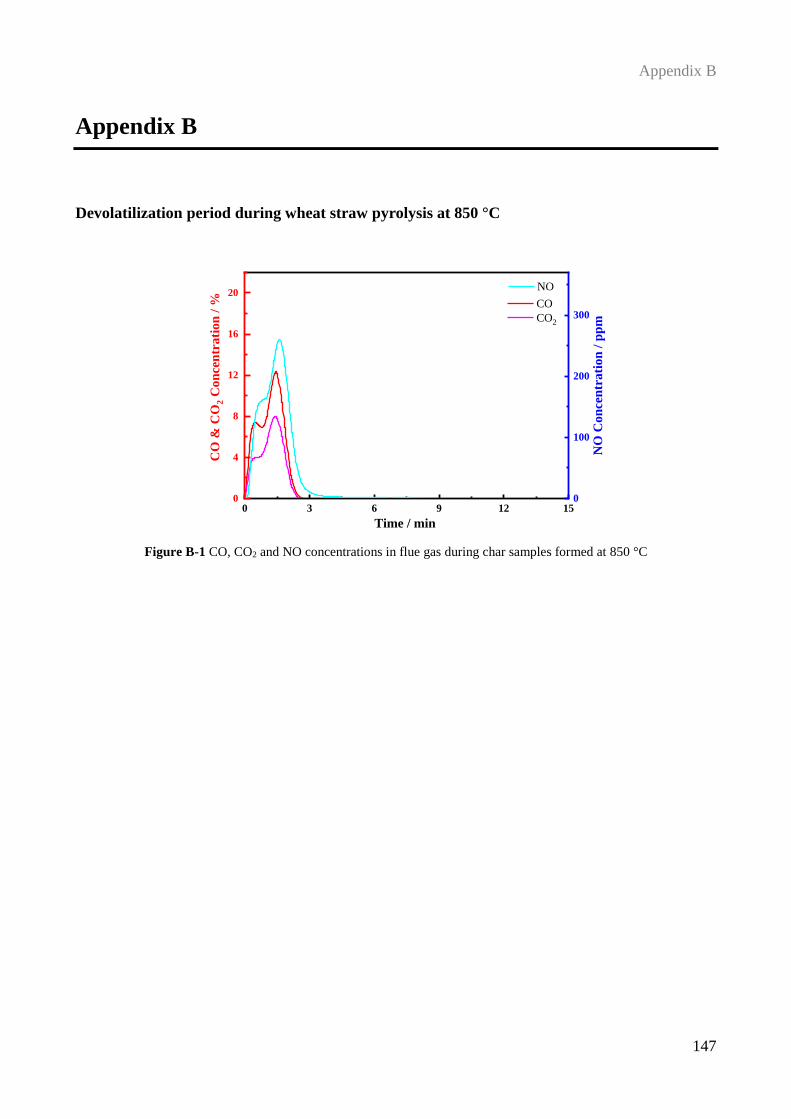
Appendix B
147
Appendix B
Devolatilization period during wheat straw pyrolysis at 850 °C
Figure B-1 CO, CO2 and NO concentrations in flue gas during char samples formed at 850 °C
0 3 6 9 12 150
4
8
12
16
20 CO
CO2
CO
& C
O2 C
on
cen
trati
on
/ %
Time / min
0
100
200
300
NO
NO
Con
cen
trati
on
/ p
pm
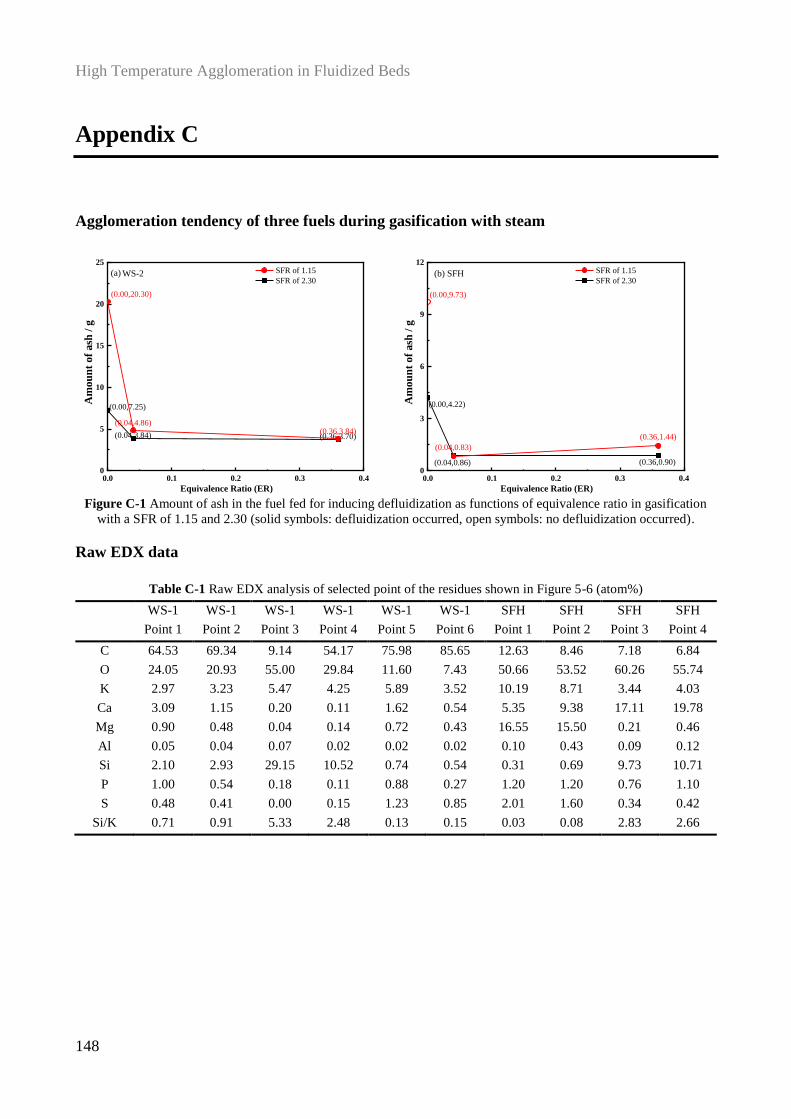
High Temperature Agglomeration in Fluidized Beds
148
Appendix C
Agglomeration tendency of three fuels during gasification with steam
Figure C-1 Amount of ash in the fuel fed for inducing defluidization as functions of equivalence ratio in gasification
with a SFR of 1.15 and 2.30 (solid symbols: defluidization occurred, open symbols: no defluidization occurred).
Raw EDX data
Table C-1 Raw EDX analysis of selected point of the residues shown in Figure 5-6 (atom%)
WS-1
Point 1
WS-1
Point 2
WS-1
Point 3
WS-1
Point 4
WS-1
Point 5
WS-1
Point 6
SFH
Point 1
SFH
Point 2
SFH
Point 3
SFH
Point 4
C 64.53 69.34 9.14 54.17 75.98 85.65 12.63 8.46 7.18 6.84
O 24.05 20.93 55.00 29.84 11.60 7.43 50.66 53.52 60.26 55.74
K 2.97 3.23 5.47 4.25 5.89 3.52 10.19 8.71 3.44 4.03
Ca 3.09 1.15 0.20 0.11 1.62 0.54 5.35 9.38 17.11 19.78
Mg 0.90 0.48 0.04 0.14 0.72 0.43 16.55 15.50 0.21 0.46
Al 0.05 0.04 0.07 0.02 0.02 0.02 0.10 0.43 0.09 0.12
Si 2.10 2.93 29.15 10.52 0.74 0.54 0.31 0.69 9.73 10.71
P 1.00 0.54 0.18 0.11 0.88 0.27 1.20 1.20 0.76 1.10
S 0.48 0.41 0.00 0.15 1.23 0.85 2.01 1.60 0.34 0.42
Si/K 0.71 0.91 5.33 2.48 0.13 0.15 0.03 0.08 2.83 2.66
0.0 0.1 0.2 0.3 0.40
5
10
15
20
25
(0.00,7.25)
(0.04,3.84) (0.36,3.70)
(0.00,20.30)
(0.04,4.86)(0.36,3.84)
Am
ou
nt
of
ash
/ g
Equivalence Ratio (ER)
SFR of 1.15
SFR of 2.30(a) WS-2
0.0 0.1 0.2 0.3 0.40
3
6
9
12
(0.00,4.22)
(0.04,0.86) (0.36,0.90)
(0.04,0.83)
(0.36,1.44)
(0.00,9.73)
Am
ou
nt
of
ash
/ g
Equivalence Ratio (ER)
SFR of 1.15
SFR of 2.30(b) SFH
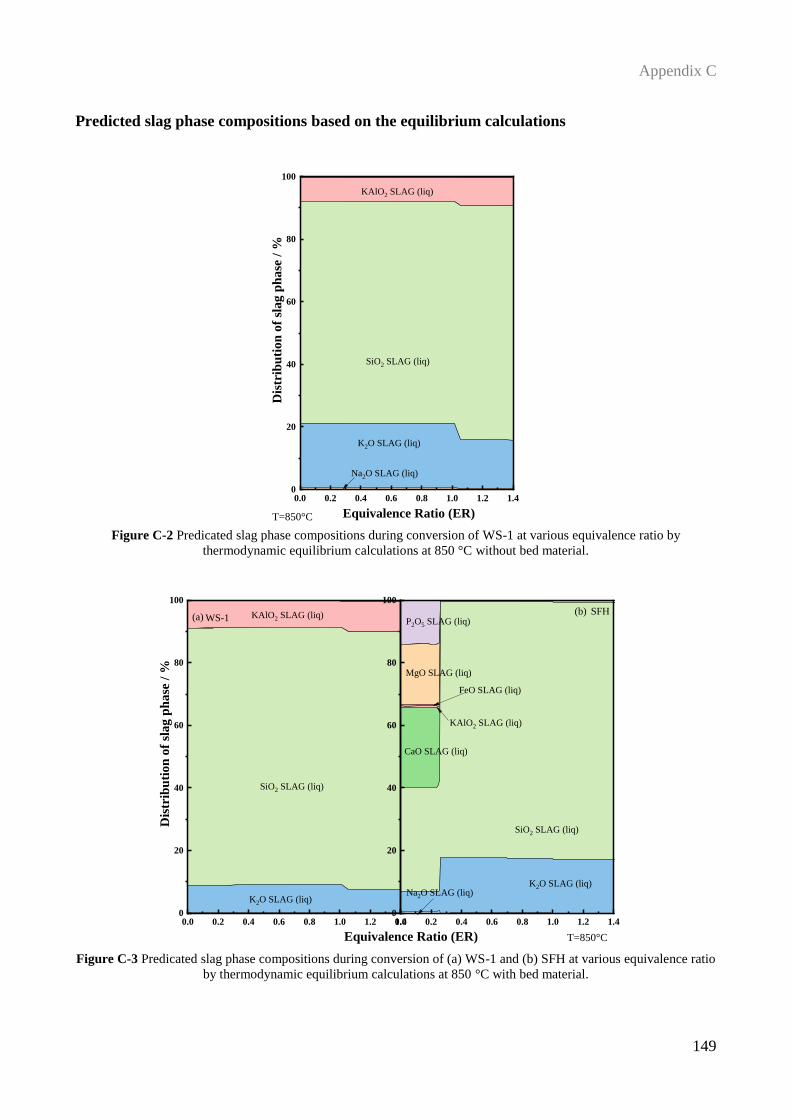
Appendix C
149
Predicted slag phase compositions based on the equilibrium calculations
Figure C-2 Predicated slag phase compositions during conversion of WS-1 at various equivalence ratio by
thermodynamic equilibrium calculations at 850 °C without bed material.
Figure C-3 Predicated slag phase compositions during conversion of (a) WS-1 and (b) SFH at various equivalence ratio
by thermodynamic equilibrium calculations at 850 °C with bed material.
0.0 0.2 0.4 0.6 0.8 1.0 1.2 1.40
20
40
60
80
100
T=850°C
Dis
trib
uti
on
of
slag
ph
ase
/ %
Na2O SLAG (liq)
KAlO2 SLAG (liq)
SiO2 SLAG (liq)
K2O SLAG (liq)
Equivalence Ratio (ER)
0.0 0.2 0.4 0.6 0.8 1.0 1.2 1.40
20
40
60
80
100
T=850°C
(a) WS-1
Dis
trib
uti
on
of
sla
g p
ha
se /
%
KAlO2 SLAG (liq)
SiO2 SLAG (liq)
K2O SLAG (liq)
0.0 0.2 0.4 0.6 0.8 1.0 1.2 1.40
20
40
60
80
100
Equivalence Ratio (ER)
(b) SFH
K2O SLAG (liq)Na2O SLAG (liq)
SiO2 SLAG (liq)
CaO SLAG (liq)
MgO SLAG (liq)
P2O5 SLAG (liq)
FeO SLAG (liq)
KAlO2 SLAG (liq)