Embed Size (px)
Citation preview

Subscriber access provided by UNIV DE BURGOS
Energy & Fuels is published by the American Chemical Society. 1155 Sixteenth StreetN.W., Washington, DC 20036
Article
Bed Agglomeration Characteristics duringFluidized Bed Combustion of Biomass Fuels
Marcus hman, Anders Nordin, Bengt-Johan Skrifvars, Rainer Backman, and Mikko HupaEnergy Fuels, 2000, 14 (1), 169-178• DOI: 10.1021/ef990107b • Publication Date (Web): 17 January 2000
Downloaded from http://pubs.acs.org on February 26, 2009
More About This Article
Additional resources and features associated with this article are available within the HTML version:
• Supporting Information• Links to the 8 articles that cite this article, as of the time of this article download• Access to high resolution figures• Links to articles and content related to this article• Copyright permission to reproduce figures and/or text from this article
Bed Agglomeration Characteristics during Fluidized BedCombustion of Biomass Fuels
Marcus Ohman* and Anders Nordin
Energy Technology Centre, Department of Chemistry, Inorganic Chemistry, Umeå University,P.O. Box 726, S-941 28 Piteå, Sweden
Bengt-Johan Skrifvars, Rainer Backman, and Mikko Hupa
Process Chemistry Group, University, FIN-20500 Turku, Finland
Received June 2, 1999
The in-bed behavior of ash-forming elements in fluidized bed combustion (FBC) of differentbiomass fuels was examined by SEM/EDS analysis of samples collected during controlledagglomeration test runs. Eight fuels were chosen for the test. To cover the variations in biomasscharacteristics and to represent as many combinations of ash-forming elements in biomass fuelsas possible, the selection was based on a principal-component analysis of some 300 biomass fuels,with respect to ash-forming elements. The fuels were then combusted in a bench-scale fluidizedbed reactor (5 kW), and their specific agglomeration temperatures were determined. Bed sampleswere collected throughout the tests, and coatings and necks formed were characterized by SEM/EDS analyses. On the basis of their compositions, the corresponding melting behaviors weredetermined, using data extracted from phase diagrams. The bench-scale reactor bed sampleswere finally compared with bed samples collected from biomass-fired full-scale fluidized bedboilers. In all the analyzed samples, the bed particles were coated with a relatively homogeneousash layer. The compositions of these coatings were most commonly constricted to the ternarysystem K2O-CaO-SiO2. Sulfur and chlorine were further found not to “participate” in theagglomeration mechanism. The estimated melting behavior of the bed coating generally correlatedwell with the measured agglomeration temperature, determined in the 5 kW bench-scale fluidizedbed reactor. Thus, the results indicate that partial melting of the coating of the bed particleswould be directly responsible for the agglomeration.
Introduction
The fate of ash-forming elements during combustionof biomass fuels is important for the efficiency andavailability of biomass-fired boilers. Ash-related operat-ing problems, such as slagging and fouling, have beenreported extensively in the literature for most conven-tional combustion technologies. Due to the inherentadvantages of low process temperatures, isothermaloperating conditions, and fuel flexibility, fluidized bedtechnology has been found to be the most suitableapproach to converting a wide range of biomass fuelsinto energy. With increasing operational experience offluidized bed boilers, however, bed agglomeration has,more than occasionally, been reported as a majorproblem.1-3 Bed agglomeration may, in the worst cases,result in total defluidization of the bed, resulting in anunscheduled plant shut down. Recent studies4-7 havefurther indicated that certain “new” biomass fuels, such
as different types of energy crop, would be especiallyproblematic. Several authors8-11 have identified differ-
* Corresponding author.(1) Skrifvars, B.-J.; Hupa, M.; Hiltunen, M. Ind. Eng. Chem. Res.
1992, 31, 1026-1030.(2) Dawson, M. R.; Brown, R. C. Fuel 1992, 71, 585-592.(3) Salour, D.; Jenkins, B. M.; Vafei, M.; Kayhaian, M. Biomass
Bioenergy 1993, 4, 117-133.(4) Nordin, A. Fuel 1995, 74, 615-622.(5) Viktoren, A. Thermal Engineering Research Foundation, Report
no. 416, 1991.
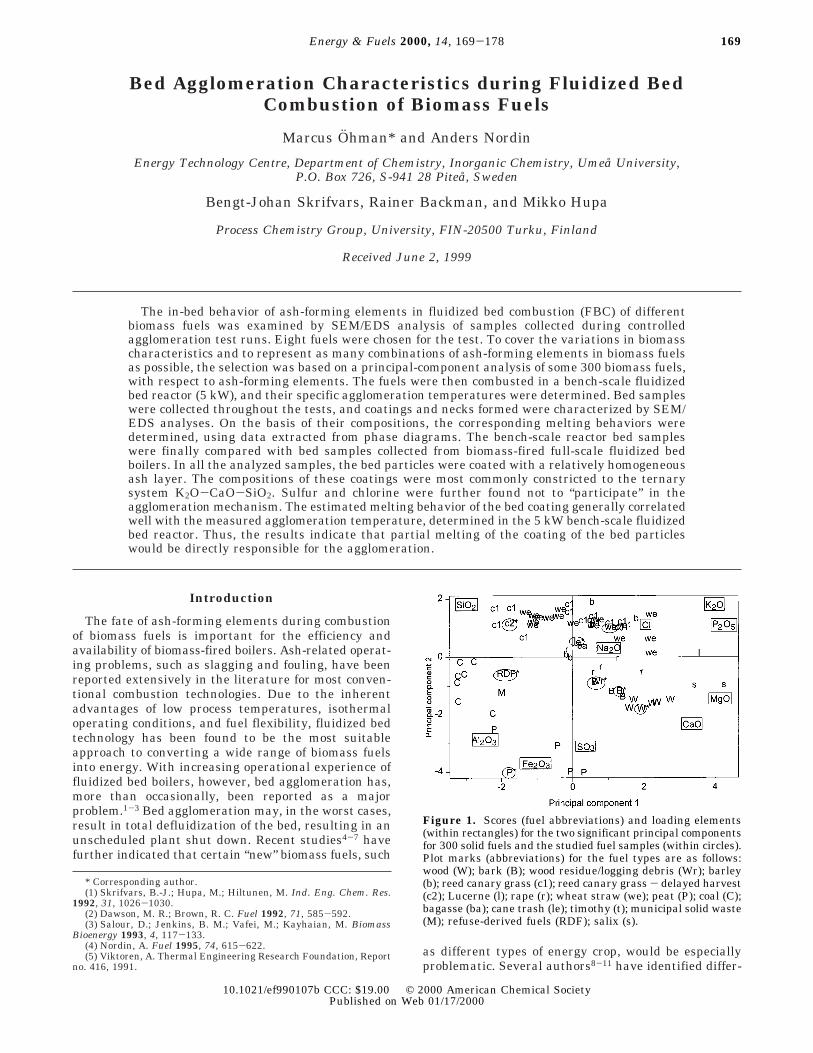
Figure 1. Scores (fuel abbreviations) and loading elements(within rectangles) for the two significant principal componentsfor 300 solid fuels and the studied fuel samples (within circles).Plot marks (abbreviations) for the fuel types are as follows:wood (W); bark (B); wood residue/logging debris (Wr); barley(b); reed canary grass (c1); reed canary grass - delayed harvest(c2); Lucerne (l); rape (r); wheat straw (we); peat (P); coal (C);bagasse (ba); cane trash (le); timothy (t); municipal solid waste(M); refuse-derived fuels (RDF); salix (s).
169Energy & Fuels 2000, 14, 169-178
10.1021/ef990107b CCC: $19.00 © 2000 American Chemical SocietyPublished on Web 01/17/2000
ent physical appearances of ash and bed-material in thebed, either a coating of the bed material by anothermaterial, or ash particles mixed with bed particles.Previous attempts to explain the mechanisms of bedagglomeration have included viscous flow (silicate melt)sintering,8,12,13 reactive liquid (salt melt) sintering,8,14,15
and chemical reaction sintering.16 Although they all mayoccur, a precise and quantitative description of bed
agglomeration processes, during fluidized bed combus-tion of biomass fuels, has not yet been presented. Thisinspired us to more closely study the characteristics ofthe bed particles during actual agglomeration processes.
Our main interest in the present work was to eluci-date the mechanism of bed agglomeration during com-bustion of different biomass fuels, particularly withrespect to the formation of a possible sticky coating onthe bed particles that could be responsible for thisprocess. Information was gathered by repeated samplingduring controlled agglomeration processing of severalrepresentative biomass fuels, as well as analysis ofcorresponding bed samples from full-scale trials.
Experimental Section
Fuels and Bed Material Used. Eight different types ofbiomass fuels were used in the study. The fuels were chosenbased on a principal component analysis 17 (PCA) of a compila-tion of about 300 different samples of Nordic biomass fuels,18
classified with respect to elements important for ash formation.The PCA resulted in two significant components, where the
(6) Baxter, L. L.; Miles, T. R.; Miles, T. R.; Jenkins, B. M.; Milne,T. A.; Dayton, D. C.; Bryers, R. W.; Oden, L. L. Sandia report SAND96-8587*UC-1301, 1996.
(7) Thambimuthu, K. V.; Clift, R. Proc. Fluidization VI, 547-554.(8) Nordin, A.; Ohman, M.; Skrifvars, B.-J.; Hupa, M. In Applications
of Advanced Technology to Ash-related Problems in Boilers. Baxter,L., DeSollar, R., Eds.; Plenum Press: New York, 1996, 353-366.
(9) Skrifvars, B.-J.; Sfiris, G.; Backman, R.; Widegren-Dafgård, K.;Hupa, M. Energy Fuel 1997, 11, 843-848.
(10) Manzoori, A. R. Thesis, University of Adelaide, Australia, 1990.(11) Latva-Somppi, J.; Kurkela, J.; Tapper, U.; Kauppinen, E. I.;
Jokiniemi, J. K.; Johanson, B. Proceedings of the International Confer-ence on Ash Behavior Control in Energy Conversion Systems, PacificoYokohama, Japan, 1998, pp 119-126.
(12) Lin, W.; Krusholm, G.; Johansen, K. D.; Musahl, E.; Bank, L.Proc. Fluidized Bed Combust. 1997, 2, 831-837.
(13) Ergudenler, A.; Ghaly, E. Biomass Bioenergy 1993, 4, 135-147.(14) Manzoori, A. R.; Agerwal, P. K. Fuel 1993, 72, 1069-1075.(15) Manzoori, A. R.; Agerwal, P. K. Fuel 1992, 71, 513-522.(16) Skrifvars, B. J.; Anthony, E. J.; Hupa, M. Proc. Fluidized Bed
Combust. 1997, 2, 819-821.(17) Wold, S. Technometrics 1978, 20, 397.(18) Nordin, A. Biomass Bioenergy 1994, 6, 339-347.
Table 1. Fuel and Bed Material Characteristics
wheatstraw wood peat
canetrash
woodresidue
reed canarygrass bark RDF
bedmaterial
dry substance 90.3 92.0 46.8 93.5 53.3 90.5 90.6 61.3asha 5.9 0.45 5.4 5.5 3.2 5.7 3.0 16.4Nab 0.596 2.80 0.629 0.222 0.603 0.907 1.16 3.04 0.0297Kb 20.7 3.91 1.41 13.3 5.89 2.96 6.36 2.53 0.0497Cab 6.90 15.3 14.8 4.79 21.7 3.92 27.6 12.4 0.0879Mgb 1.73 3.03 0.435 2.17 1.79 0.763 2.35 1.10 0.0778Alb 0.385 1.82 2.58 2.70 1.77 0.761 1.18 10.4 0.0957Feb 0.361 0.964 17.1 1.61 1.54 0.600 2.73 1.24 0.0860Sib 18.2 6.63 16.4 20.6 10.3 36.0 6.84 17.3 46.3Sb 2.88 2.22 7.41 1.8 1.25 1.75 1 0.976Clb 4.92 2.22 0.370 0.313 0.526 0.333 2.32Pb 2.52 1.65 0.946 1.00 1.35 0.911 1.24 <0.00523a Dry basis, wt %. b wt % of ash.
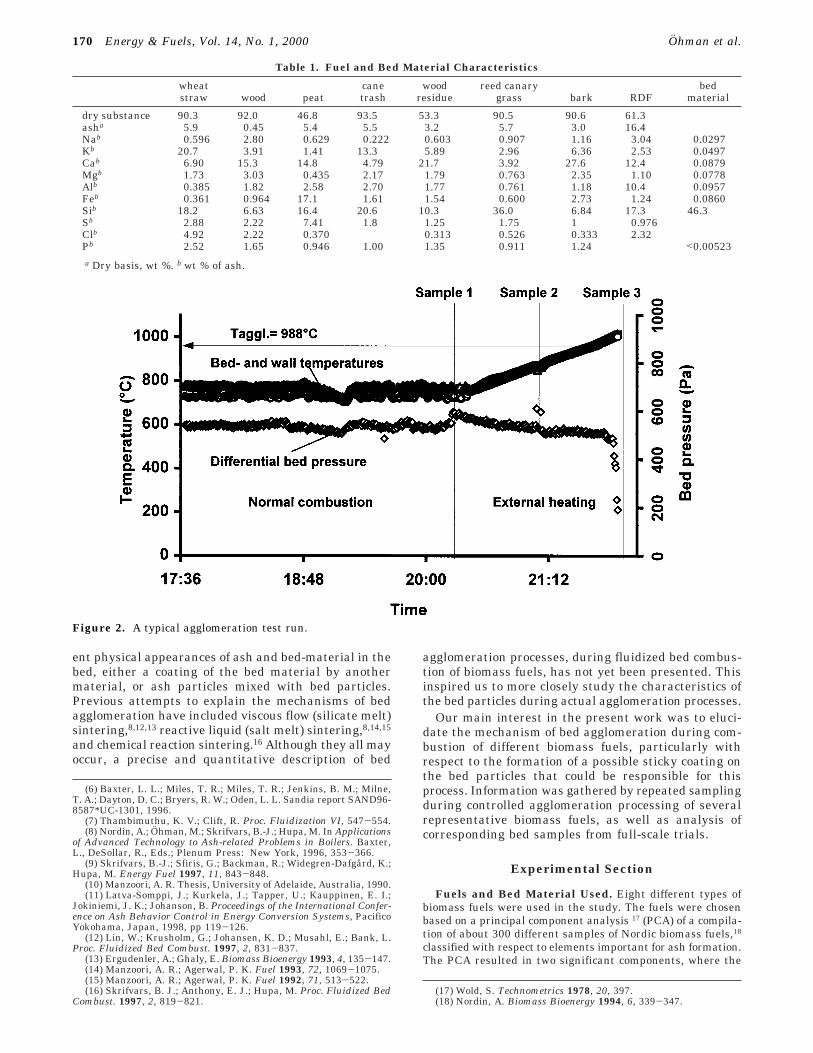
Figure 2. A typical agglomeration test run.
170 Energy & Fuels, Vol. 14, No. 1, 2000 Ohman et al.
statistical significance (32+22%) was determined by cross vali-dation.17 From the PCA, eight reference fuels were chosen torepresent most of the variation in the contents of ash-formingelements in normal biomass fuels. The results from the globalPCA of the 300 samples, including the eight reference fuels(circled) used in the present study, are illustrated in Figure1. This plot displays the directions of the maximum variationand co-variation in the multivariate space. As a result of thelarge number of samples, each point in the plot may representseveral samples. The corresponding loading plot, i.e., variableplot (denoted by squares), is superimposed on the score plot.The Figure shows that the fuel samples often separate intodifferent “groups” depending on the variation in the relativeamounts of different ash-forming elements. Fuels which con-tain relatively large amounts of alkali metals, chlorine, andphosphorus are found in the upper right quadrant, whereasfuels enriched in silicon are located at the upper left. Bark,wood, and salix, with relatively large alkaline earth metalcontents, are found in the lower right quadrant, whereas peatsamples, with relatively large amounts of aluminum, iron, andsulfur, are grouped in the lower left part of the Figure. Thecharacteristics of the eight reference fuels are also given inTable 1.
The fuels were further pelletized to a diameter of 6-8 mmand a length of 5-15 mm, and then used for the controlledbed agglomeration tests.19 The tendency to cause bed ag-glomeration in a normal sand bed was tested by determinationof the characteristic agglomeration temperature. The bedmaterial used during the experiments was normal quartz sand(see Table 1), initially sieved to a size between 200 and 250µm. The sand contained more than 98% SiO2 and only smallamounts of mineral impurities. The same type of quartz sandis used by a large number of FBC operators in Sweden.
Controlled Fluidized Bed Agglomeration Tests. Thecontrolled fluidized bed agglomeration method has previously
been more fully described by Ohman and Nordin (1998),19 andonly a brief description is given here. The bench-scale reactor(5 kW), is constructed from stainless steel, being 2 m high,100 mm and 200 mm in bed and freeboard diameters,respectively. To obtain isothermal conditions in the bed, andto minimize the significant influence of cold walls in such asmall-scale unit, the reactor is equipped with electrical wallheating elements, equalizing the wall and bed temperatures.The agglomeration tests were initiated by loading of the bedwith a certain ash-to-bed material ratio, under normal FBCconditions. The excess oxygen concentration was controlled to6%dry. A fluidization velocity of four times the minimumfluidization velocity was used, and the bed temperature wasmaintained at 760 °C for all fuels except wheat straw. To avoidagglomeration during the ashing procedure for this fuel, a bedtemperature of 650 °C was used. At an ash amount corre-sponding to 6 wt % ash in the bed, the fuel feeding was stoppedand the operation was switched to external heating. Severalinitial runs have shown that only 1.5% of ash in the bed issufficient for agglomeration to occur. The bed was then heated,at a rate of 3 °C/min, to the point where it agglomerated. Tomaintain a combustion atmosphere in the bed during theexternal heating phase, propane was mixed with the primaryair in a chamber prior to the air distributor.
The onset of bed agglomeration was determined by monitor-ing differential pressures and temperatures in the bed. Thedetection of initial bed particle cohesion was facilitated by PCAby considering all bed-related variables (three temperaturesand four differential pressures) simultaneously. A typicalillustration of fluctuations in temperatures and differential bedpressures versus time in a controlled bed agglomeration testrun is shown in Figure 2. The final defluidization can clearlybe seen here as a drop in the bed pressure.
Bed Samples and Bed Analyses. Throughout the experi-mental runs, representative samples of the bed material were
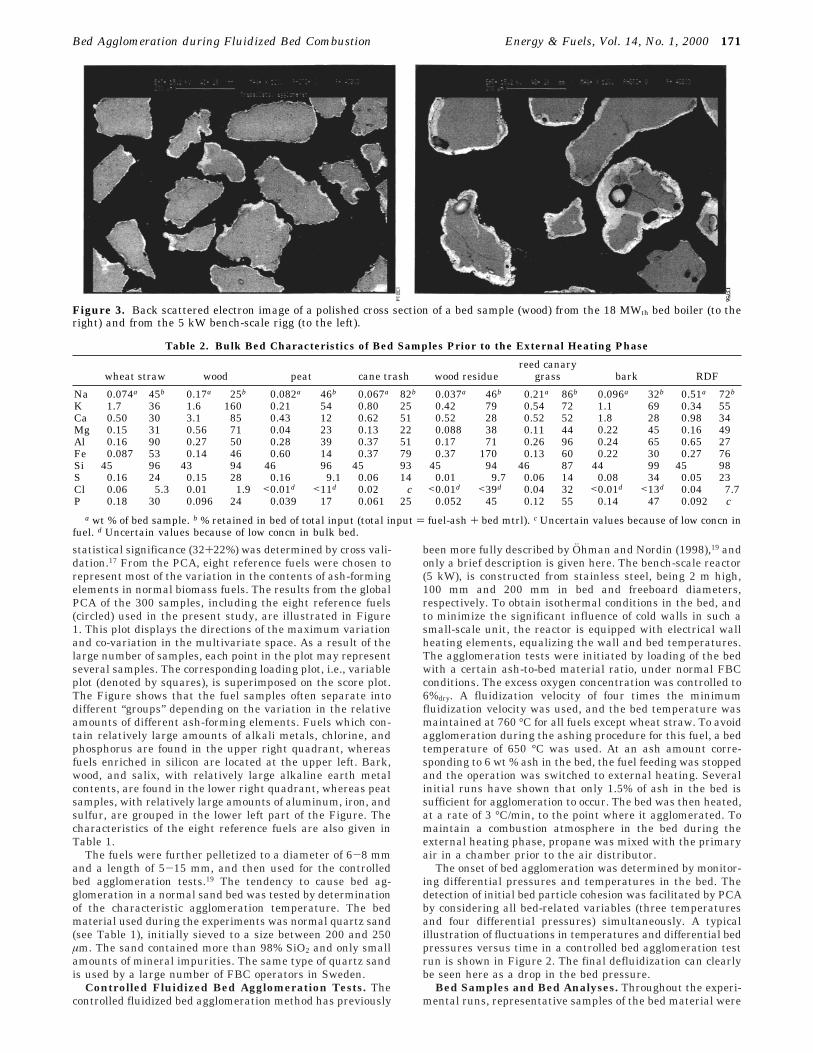
Figure 3. Back scattered electron image of a polished cross section of a bed sample (wood) from the 18 MWth bed boiler (to theright) and from the 5 kW bench-scale rigg (to the left).
Table 2. Bulk Bed Characteristics of Bed Samples Prior to the External Heating Phase
wheat straw wood peat cane trash wood residuereed canary
grass bark RDF
Na 0.074a 45b 0.17a 25b 0.082a 46b 0.067a 82b 0.037a 46b 0.21a 86b 0.096a 32b 0.51a 72b
K 1.7 36 1.6 160 0.21 54 0.80 25 0.42 79 0.54 72 1.1 69 0.34 55Ca 0.50 30 3.1 85 0.43 12 0.62 51 0.52 28 0.52 52 1.8 28 0.98 34Mg 0.15 31 0.56 71 0.04 23 0.13 22 0.088 38 0.11 44 0.22 45 0.16 49Al 0.16 90 0.27 50 0.28 39 0.37 51 0.17 71 0.26 96 0.24 65 0.65 27Fe 0.087 53 0.14 46 0.60 14 0.37 79 0.37 170 0.13 60 0.22 30 0.27 76Si 45 96 43 94 46 96 45 93 45 94 46 87 44 99 45 98S 0.16 24 0.15 28 0.16 9.1 0.06 14 0.01 9.7 0.06 14 0.08 34 0.05 23Cl 0.06 5.3 0.01 1.9 <0.01d <11d 0.02 c <0.01d <39d 0.04 32 <0.01d <13d 0.04 7.7P 0.18 30 0.096 24 0.039 17 0.061 25 0.052 45 0.12 55 0.14 47 0.092 c
a wt % of bed sample. b % retained in bed of total input (total input ) fuel-ash + bed mtrl). c Uncertain values because of low concn infuel. d Uncertain values because of low concn in bulk bed.
Bed Agglomeration during Fluidized Bed Combustion Energy & Fuels, Vol. 14, No. 1, 2000 171
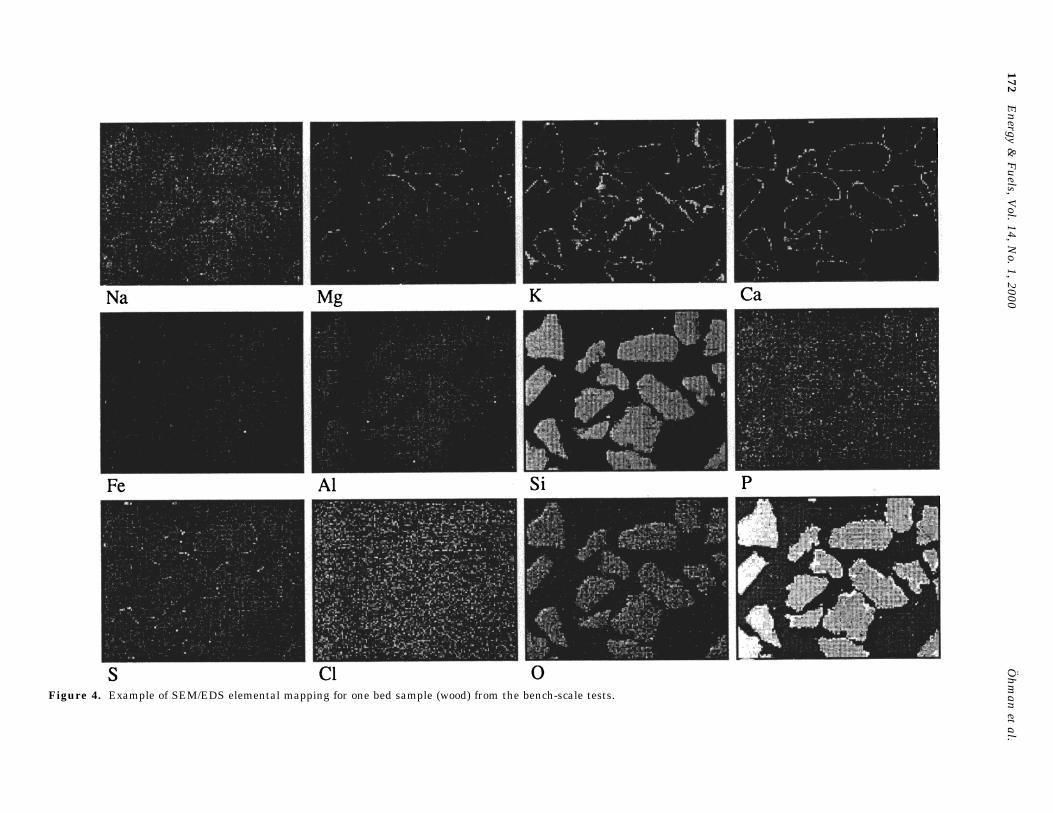
Figure 4. Example of SEM/EDS elemental mapping for one bed sample (wood) from the bench-scale tests.
172E
nergy
&F
uels,
Vol.
14,N
o.1,
2000O
hm
anet
al.
collected by an air-cooled suction probe, equipped with acyclone separator. These samples, as well as the final ag-glomerated beds, were subjected to elemental analysis byinductively coupled plasma atomic emission spectrometry(ICP-AES) and wet chemical methods. Both bed samples andagglomerates were also characterized with scanning electronmicroscopy (SEM) combined with energy-dispersive X-rayanalysis (EDS). The samples for the SEM/EDS analysis weremounted in epoxy, cut by a diamond saw, and polished, andthe resulting cross-sections were carefully examined by SEM/EDS spot and elemental mapping methods.
In addition, bed material samples from two full-scalebiomass fired boilers were characterized with SEM/EDS. Bothplants, an 18 MWth hot water boiler and a 125 MWth combinedheat and power plant, fired wood residues at bed temperaturesof approximately 850 °C. Details about these boilers, as wellas firing conditions and other tests performed during the bedsamplings, can be found in the literature.20,21
To avoid contributions from the bed material, special carewas taken not to collect EDS data from spots close to theinterface between coatings and particles. On the basis ofsemiquantitative SEM/EDS analyses of coatings on the bedparticles, the melting behavior of the coating material wasfinally estimated by extracting corresponding data from phase(19) Ohman, M.; Nordin, A. Energy Fuels 1998, 12, 90-94.
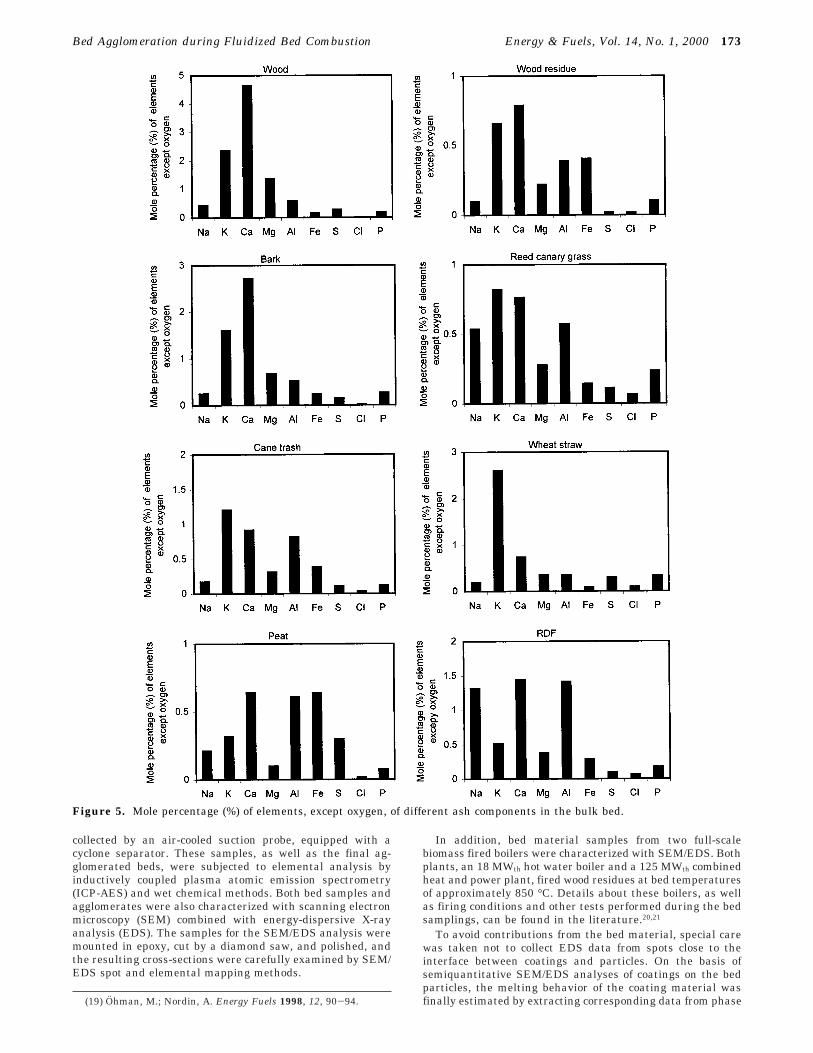
Figure 5. Mole percentage (%) of elements, except oxygen, of different ash components in the bulk bed.
Bed Agglomeration during Fluidized Bed Combustion Energy & Fuels, Vol. 14, No. 1, 2000 173
diagrams.22 The resulting melting behavior was then comparedwith the determined fuel specific agglomeration temperature.
Results and Discussion
The SEM examinations of the bed material samplesshowed that a coating with a thickness of 10-50 µmwas formed around all bed particles. An example of thiscoating can clearly be viewed from the SEM backscattermicrographs shown in Figure 3. To the right, a micro-graph of a bed sample from the 18 MWth CFB boiler isshown; to the left, a similar image is shown for a bed
sample collected from the 5 kW bench-scale reactorduring the controlled bed agglomeration test of wood.The coatings can be distinguished on the bed particlesas a lighter periphery surrounding the darker SiO2
cores. The black backgrounds seen in the micrographsare the epoxy in which the bed samples were mounted.
Figure 4 is an example of the SEM/EDS elementmapping analysis for the same bench-scale bed sampleas in Figure 3. A light area indicates a higher concen-tration of the element in question than a dark area.Corresponding element maps for all the other fuels
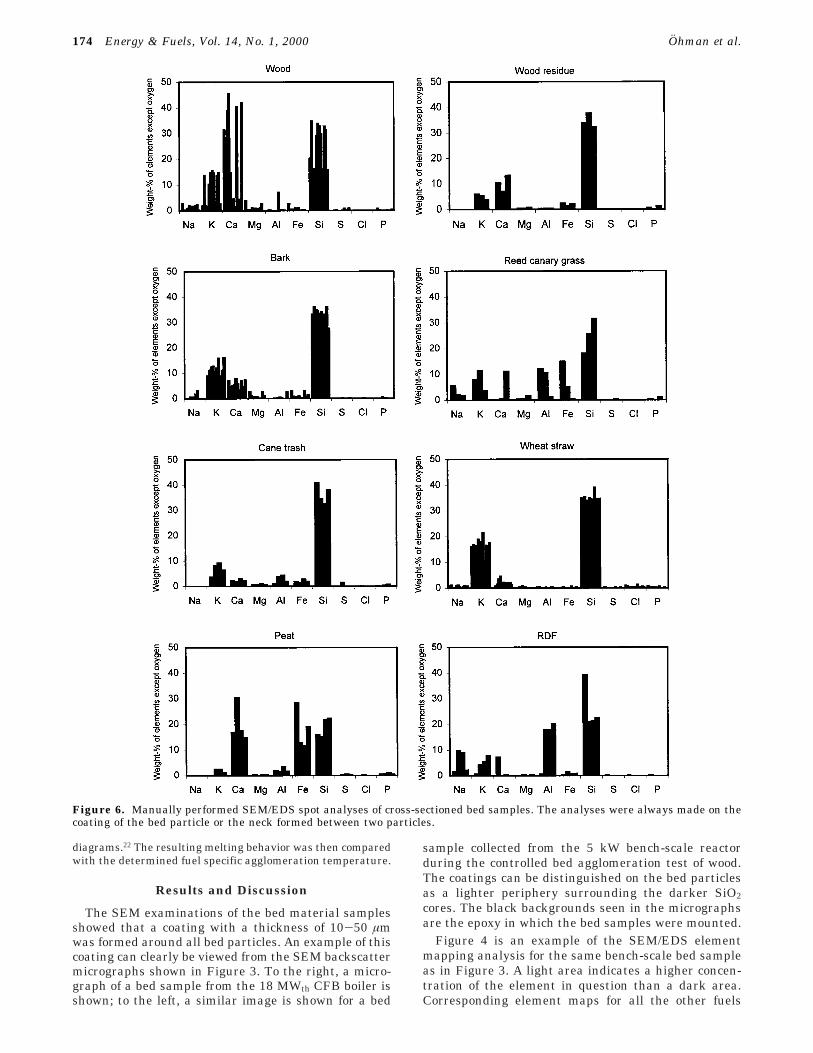
Figure 6. Manually performed SEM/EDS spot analyses of cross-sectioned bed samples. The analyses were always made on thecoating of the bed particle or the neck formed between two particles.
174 Energy & Fuels, Vol. 14, No. 1, 2000 Ohman et al.
showed that all coatings consisted of different ratios ofSi, K, Ca, Fe, Al, and Na, and thus different silicates.
The results of the elemental analyses of the bulk bedsamples are shown in Table 2 (column 1 for each fuel).As expected, the element silicon dominates the samplescomposition. Although a major fraction of the ash-forming elements introduced by the fuel was retained
in the bed, it was depleted by some elements, especiallysulfur and chlorine (see Table 2, column 2 for each fuel).The total concentrations of these elements in the bulkbed were low (see Figure 5), which also seems to be thecase for the full-scale boilers.9,20,21 This was furthersupported by a careful study of ash formation duringwaste sludge and bark incineration.23 The significant
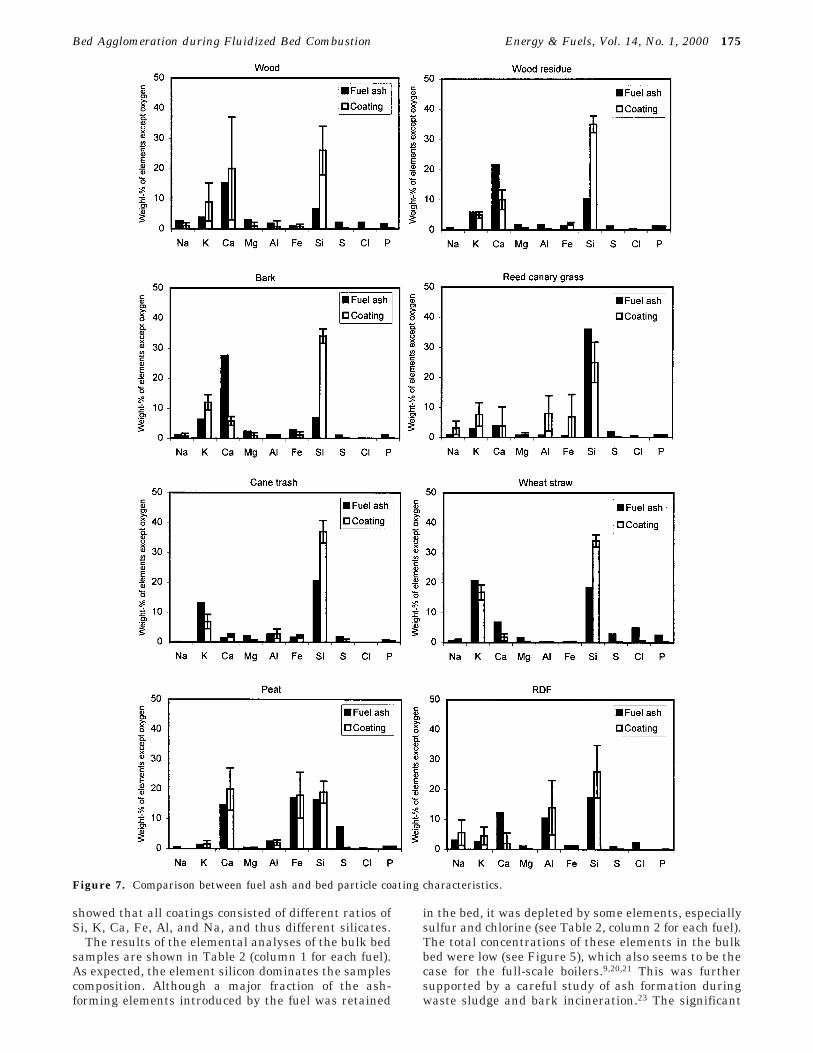
Figure 7. Comparison between fuel ash and bed particle coating characteristics.
Bed Agglomeration during Fluidized Bed Combustion Energy & Fuels, Vol. 14, No. 1, 2000 175
vaporization and transport of K, Na, Cl, and S from thebed was determined by impactor sampling and elemen-tal analysis for both full-scale FBC and correspondingruns in the bench-scale reactor. The vaporization duringcombustion in the bench-scale unit was also found toincrease linearly with increased bed temperature. Inaddition, no vaporization was found during the externalheating phase, even when the temperature was in-creased to 960 °C. Thus, the coating characteristics seemto be preserved during the external heating period andthe procedure is only an effective and reliable means todetermine the coating specific agglomeration tempera-ture.
To quantify the elemental amounts found in thecoatings, a large number of EDS spot analyses wereperformed on each bed sample and the results are
summarized in Figure 6. Each bar represents the resultof one spot analysis taken from the coating of a bedparticle or the neck formed between two bed particles.In all coatings, silicon proved to be the dominatingelement. Other elements most frequently detected werepotassium and calcium, but in significantly varyingproportions. For the peat bed coatings, iron was alsofound as a major element and for the RDF and reedcanary grass, the bed coatings further contained asignificant fraction of aluminum. For the RDF bedsample, sodium was also found in moderate amounts.
Further, by comparing the results from the analysesof the coatings with corresponding fuel ash elementaldata (see Figure 7), it can be seen that the distributionof the elements differs significantly. The implication ofthis comparison is that a standard ash analysis of thefuel may not provide a very reliable prediction of thebed agglomeration tendency since the elemental contentof the actual coating may differ considerably.
The results of the SEM/EDS analyses indicate thatthe layers covering the bed particles are homogeneous,but the elemental distributions in the coatings varysignificantly between bed samples from different fuels.
(20) Skrifvars, B.-J.; Backman, R.; Hupa, M.; Sfiris, G.; Åbyhammar,T.; Lyngfelt, A. Fuel 1998, 77, 65-70.
(21) Makdessi, R.; Johnson, J.; Hupa, M.; Skrifvars, B.-J.; Lauren,T.; Backman, R. Thermal Engineering Research Foundation, Reportno. 621, 1997.
(22) Morey, G. W.; Kracek, F. C.; Bowen, N. L. J. Soc. Glass Technol.1930, 14, 158.
(23) Latva-Somppi, J.; Kauppinen, E. I.; Kurkela, J.; Tapper, U.;Ohman, M.; Nordin, A.; Johanson, B. Combust. Sci. Technol. 1999,134, 433-456.
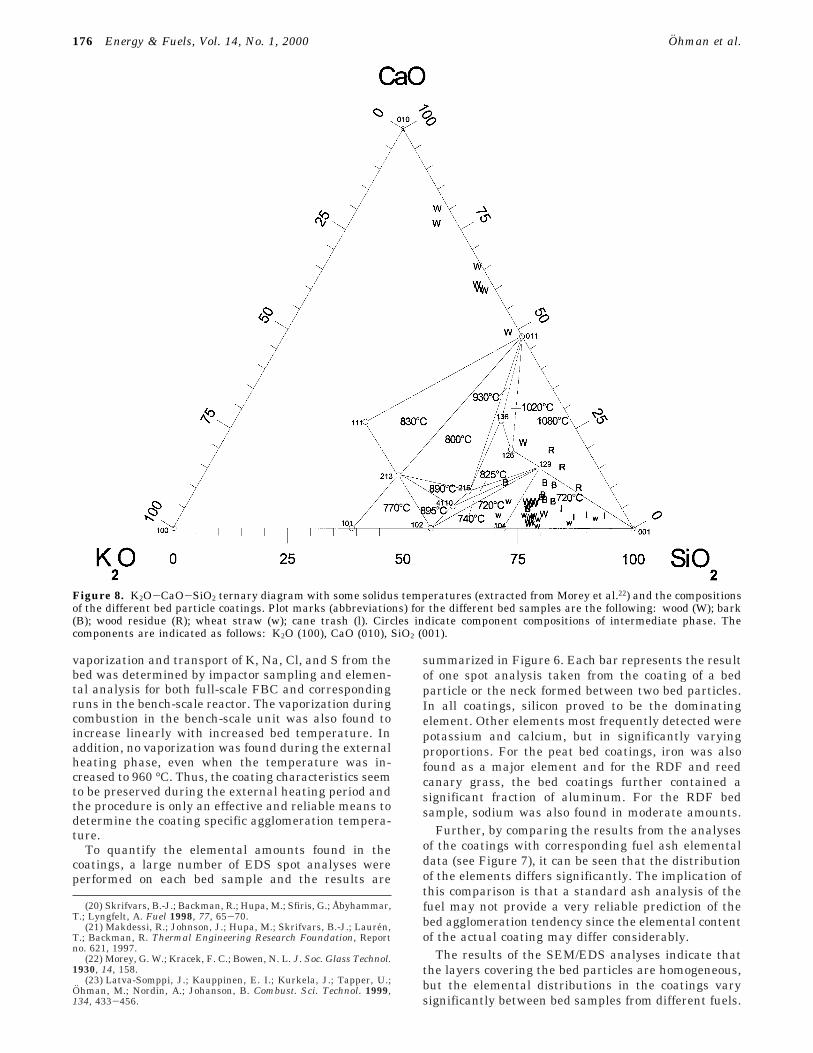
Figure 8. K2O-CaO-SiO2 ternary diagram with some solidus temperatures (extracted from Morey et al.22) and the compositionsof the different bed particle coatings. Plot marks (abbreviations) for the different bed samples are the following: wood (W); bark(B); wood residue (R); wheat straw (w); cane trash (l). Circles indicate component compositions of intermediate phase. Thecomponents are indicated as follows: K2O (100), CaO (010), SiO2 (001).
176 Energy & Fuels, Vol. 14, No. 1, 2000 Ohman et al.
However, the outermost layer of the coating may becomposed of a heterogeneous mixture of different par-ticles. With time, however, homogenization seems totake place. This seems to be in agreement with therecent SEM studies of agglomerates from burning forestresidue in a 35 MWth CFB boiler.24 Samples collectedwhen firing wood, bark, wood residues, cane trash, andwheat straw show that the overall compositional dis-tributions of the major fraction of the bed particlecoatings are mainly limited (>90% of the material) tothe ternary system K2O-CaO-SiO2.22 Figure 8 showsthe K2O-CaO-SiO2 ternary diagram with some solidus(initial melting) temperatures and the compositions ofthe bed material coatings from using different fuels. Thechemical compositions of these samples are mainlyrestricted to the SiO2 rich corner in Figure 8, andsilicates with these compositions have a first meltingtemperature of 720 °C, while a small addition of calciumwill shift this value to roughly 1080 °C.
Previous results8,19,25 have indicated that the chemicalcharacteristics, and thereby the melting behaviors of thecoatings, are very important for the bed agglomerationprocess. If the coating has a high enough fraction ofmolten phase, it will cause bed agglomeration, and, inthe most severe cases, defluidization. For silicate melts,the viscosity of the melt has to be taken into consider-ation to determine the fraction needed for “stickiness”.26
It was therefore of interest to determine the melting
behaviors of the different bed coatings, and compare themelting temperatures with the corresponding specificagglomeration temperatures.
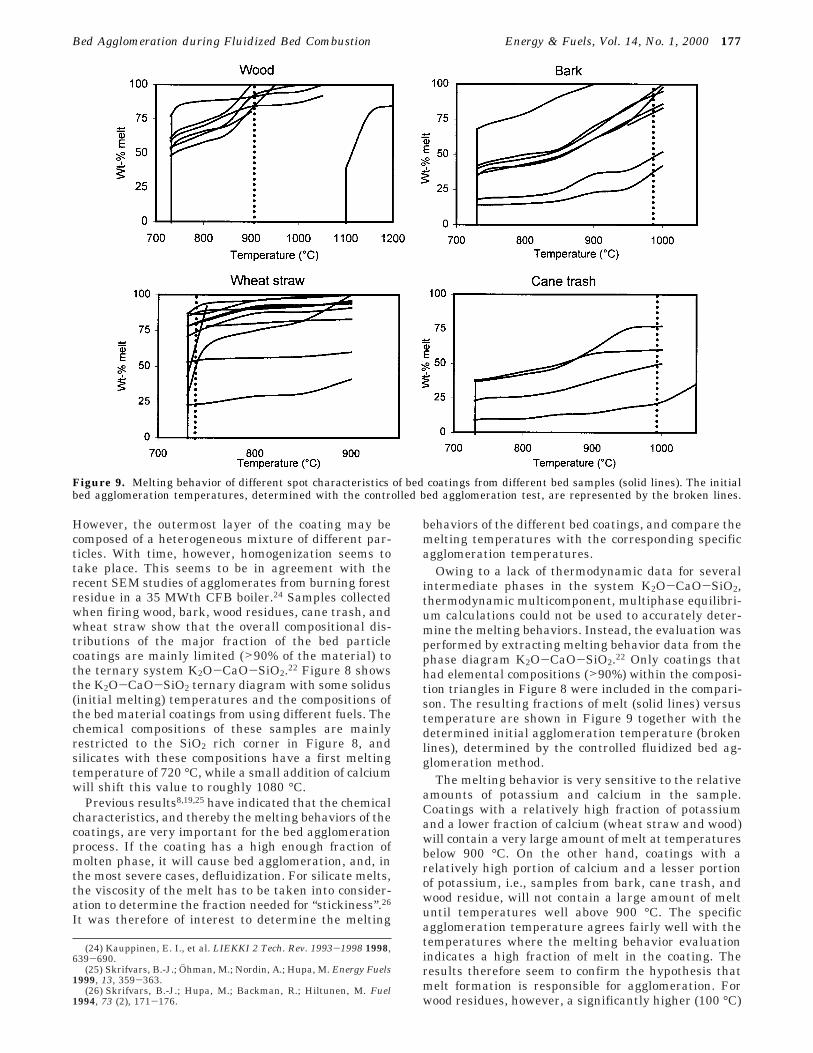
Owing to a lack of thermodynamic data for severalintermediate phases in the system K2O-CaO-SiO2,thermodynamic multicomponent, multiphase equilibri-um calculations could not be used to accurately deter-mine the melting behaviors. Instead, the evaluation wasperformed by extracting melting behavior data from thephase diagram K2O-CaO-SiO2.22 Only coatings thathad elemental compositions (>90%) within the composi-tion triangles in Figure 8 were included in the compari-son. The resulting fractions of melt (solid lines) versustemperature are shown in Figure 9 together with thedetermined initial agglomeration temperature (brokenlines), determined by the controlled fluidized bed ag-glomeration method.
The melting behavior is very sensitive to the relativeamounts of potassium and calcium in the sample.Coatings with a relatively high fraction of potassiumand a lower fraction of calcium (wheat straw and wood)will contain a very large amount of melt at temperaturesbelow 900 °C. On the other hand, coatings with arelatively high portion of calcium and a lesser portionof potassium, i.e., samples from bark, cane trash, andwood residue, will not contain a large amount of meltuntil temperatures well above 900 °C. The specificagglomeration temperature agrees fairly well with thetemperatures where the melting behavior evaluationindicates a high fraction of melt in the coating. Theresults therefore seem to confirm the hypothesis thatmelt formation is responsible for agglomeration. Forwood residues, however, a significantly higher (100 °C)
(24) Kauppinen, E. I., et al. LIEKKI 2 Tech. Rev. 1993-1998 1998,639-690.
(25) Skrifvars, B.-J.; Ohman, M.; Nordin, A.; Hupa, M. Energy Fuels1999, 13, 359-363.
(26) Skrifvars, B.-J.; Hupa, M.; Backman, R.; Hiltunen, M. Fuel1994, 73 (2), 171-176.
Figure 9. Melting behavior of different spot characteristics of bed coatings from different bed samples (solid lines). The initialbed agglomeration temperatures, determined with the controlled bed agglomeration test, are represented by the broken lines.
Bed Agglomeration during Fluidized Bed Combustion Energy & Fuels, Vol. 14, No. 1, 2000 177
initial melting temperature than agglomeration tem-perature was obtained, possibly because of the externalminerals introduced during processing of the fuel.
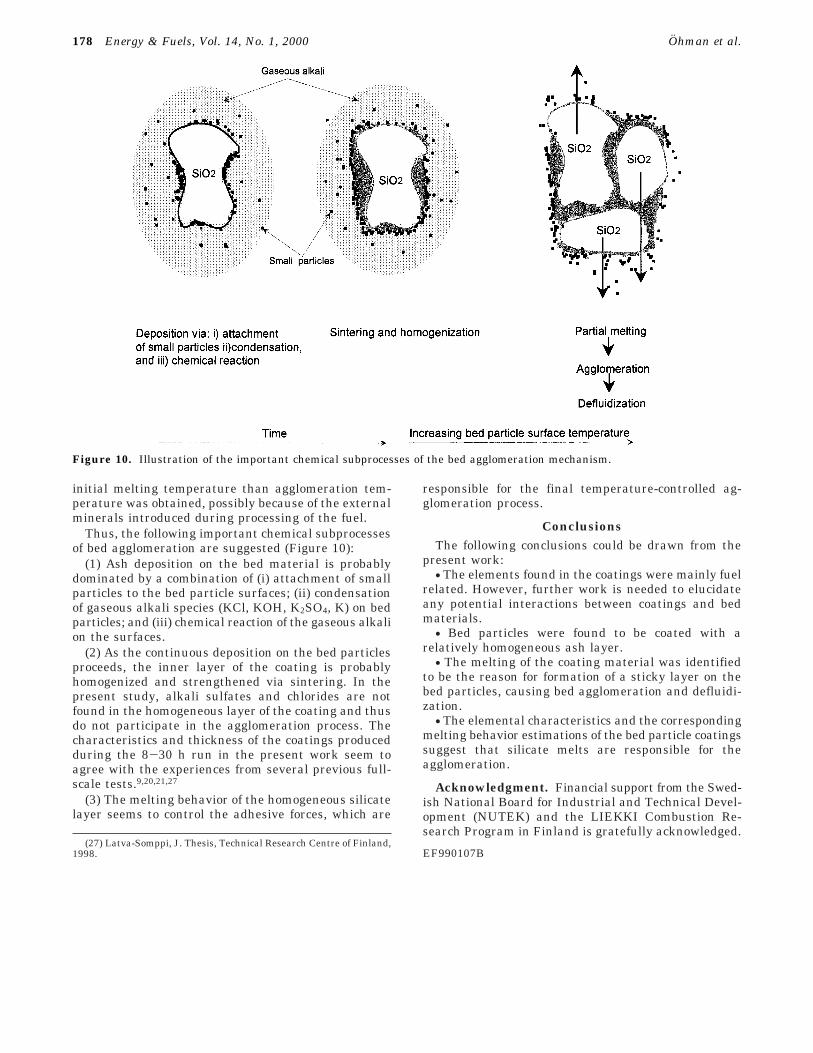
Thus, the following important chemical subprocessesof bed agglomeration are suggested (Figure 10):
(1) Ash deposition on the bed material is probablydominated by a combination of (i) attachment of smallparticles to the bed particle surfaces; (ii) condensationof gaseous alkali species (KCl, KOH, K2SO4, K) on bedparticles; and (iii) chemical reaction of the gaseous alkalion the surfaces.
(2) As the continuous deposition on the bed particlesproceeds, the inner layer of the coating is probablyhomogenized and strengthened via sintering. In thepresent study, alkali sulfates and chlorides are notfound in the homogeneous layer of the coating and thusdo not participate in the agglomeration process. Thecharacteristics and thickness of the coatings producedduring the 8-30 h run in the present work seem toagree with the experiences from several previous full-scale tests.9,20,21,27
(3) The melting behavior of the homogeneous silicatelayer seems to control the adhesive forces, which are
responsible for the final temperature-controlled ag-glomeration process.
ConclusionsThe following conclusions could be drawn from the
present work:• The elements found in the coatings were mainly fuel
related. However, further work is needed to elucidateany potential interactions between coatings and bedmaterials.
• Bed particles were found to be coated with arelatively homogeneous ash layer.
• The melting of the coating material was identifiedto be the reason for formation of a sticky layer on thebed particles, causing bed agglomeration and defluidi-zation.
• The elemental characteristics and the correspondingmelting behavior estimations of the bed particle coatingssuggest that silicate melts are responsible for theagglomeration.
Acknowledgment. Financial support from the Swed-ish National Board for Industrial and Technical Devel-opment (NUTEK) and the LIEKKI Combustion Re-search Program in Finland is gratefully acknowledged.
EF990107B(27) Latva-Somppi, J. Thesis, Technical Research Centre of Finland,
1998.
Figure 10. Illustration of the important chemical subprocesses of the bed agglomeration mechanism.
178 Energy & Fuels, Vol. 14, No. 1, 2000 Ohman et al.


