Embed Size (px)
Citation preview
AAPS PharmsciTech 2001; 2 (4) article 21 (http://www.pharmscitech.com/)
Process Analysis of Fluidized Bed Granulation Jukka Rantanen,1,2,* Anna Jørgensen,2 Eetu Räsänen,2 Pirjo Luukkonen,2 Sari Airaksinen,2 Johanna Raiman,2 Kaisa Hänninen,2 Osmo Antikainen,2 and Jouko Yliruusi1,2 1Viikki Drug Discovery Technology Center, Pharmaceutical Technology Division, University of Helsinki, Finland 2Pharmaceutical Technology Division, University of Helsinki, Finland Submitted: August 7, 2001; Accepted: October 2, 2001; Published: October 17, 2001.
ABSTRACT This study assesses the fluidized bed granulation process for the optimization of a model formulation using in-line near-infrared (NIR) spectroscopy for moisture determination. The granulation process was analyzed using an automated granulator and optimization of the verapamil hydrochloride formulation was performed using a mixture design. The NIR setup with a fixed wavelength detector was applied for moisture measurement. Information from other process measurements, temperature difference between process inlet air and granules (Tdiff), and water content of process air (AH), was also analyzed. The application of in- line NIR provided information related to the amount of water throughout the whole granulation process. This information combined with trend charts of Tdiff and AH enabled the analysis of the different process phases. By this means, we can obtain in-line documentation from all the steps of the processing. The choice of the excipient affected the nature of the solid-water interactions; this resulted in varying process times. NIR moisture measurement combined with temperature and humidity measurements provides a tool for the control of water during fluid bed granulation.
KEYWORDS: formulation, fluidized bed granulation, near-infrared (NIR) spectroscopy, moisture measurement, process control
*Corresponding Author: Dr. Jukka Rantanen, Viikki Drug Discovery Technology Center, Pharmaceutical Technology Division, Department of Pharmacy, PO Box 56, FIN-00014 University of Helsinki, Finland; Telephone: +358-9-191 59141; Facsimile: +358-9-191 59144; E-mail: [email protected]
INTRODUCTION The development of process analytical chemistry (PAC) will provide a window to the physicochemical phenomena occurring during pharmaceutical manufacture. The border between PAC and more traditional laboratory analysis is quite ambiguous. The terms in-line, on-line, at-line, off-line, noninvasive are often referred to in the literature. Definitions of these classes are as follows: in- line, the sample interface is located in the process stream; on-line, automated sampling and sample transfer to an automated analyzer; at-line, manual sampling with local transport to analyzer located in the manufacturing area; off-line, manual sampling with transport to a remote or centralized laboratory [1,2].
Solid-water interactions are one of the fundamental issues in the pharmaceutical technology [3]. The state of water in a solid material may be characterized using x-ray diffraction, microscopic methods, thermal analysis, vibrational spectroscopy, and nuclear magnetic resonance spectroscopy [4]. Traditionally, the control of fluidized bed granulation is based on indirect measurements. These control methods use the properties of process air [5-7]. The nondestructive character of vibrational spectroscopy techniques, such as near-infrared (NIR), makes it a novel tool for in-line quality assurance [8,9]. NIR has been widely applied for the measurement of water in various applications [10,11]. In the case of wet granulation of pharmaceutics, NIR can be applied for both quantitative analysis of water [12-16] and for determining the state of water in solid materials [17,18]. This enables us to understand the molecular level phenomena during manufacture of pharmaceutics. Further, NIR has been applied for studying the nature of water-solid interactions within various materials [19,20].

In this study, the NIR moisture measurement during fluidized bed granulation was applied for the optimization of a model formulation. The in-line moisture measurement was performed using a fixed wavelength (4-wavelength) NIR setup. Other process information (granule temperature and process air properties) was also analyzed. A model formulation of verapamil hydrochloride was optimized using a mixture design.
MATERIALS AND METHODS Granulations
All granulations were performed in an automated bench-scale fluid bed granulator (Glatt WSG 5, Glatt GmbH, Binzen, Germany). Details of instrumentation and in-line NIR setup are given elsewhere [21]. The in-line NIR setup is a prototype developed in cooperation with the Technical Research Centre of Finland (VTT Electronics, Oulu, Finland, http://www.vtt.fi/indexe.htm). The integrated detector technique was used instead of the traditional filter-wheel solution. A model formulation (batch size 3500 g) consisting of 48% wt/wt of verapamil hydrochloride (Orion Pharma, Espoo, Finland) and 48% wt/wt of filler was applied. The fillers studied were microcrystalline cellulose (MCC) (Emcocel 50M, Penwest Pharmaceuticals, Nastola, Finland), lactose monohydrate (Pharmatose 200M, DMV Pharma, Veghel, the Netherlands), and pregelatinized starch (Starch 1500, Colorcon, Indianapolis, IN). The composition of the filler in a formulation was optimized using mixture design (Figure 1). Seventeen granulations were performed in randomized order (coding A-Q in Figure 1). Polyvinylpyrrolidone (PVP) (Kollidon K25, BASF, Ludwigshafen, Germany) was used as a binder in the formulation (4% wt/wt). Solutions in water were prepared using 10% wt/wt of PVP (1400 g of granulation liquid used in 1 granulation). Granulations were performed with identical process set values (inlet air temperature 50°C, granulation liquid flow rate 0.1 kg/min, spraying pressure 0.15 MPa). The flow rate of inlet air was varied between 0.040 and 0.055 m3/s for optimum bed performance.
Material characterization
Off-line NIR spectra of the materials were measured with a Fourier Transform (FT)-NIR spectrometer (Bomem MD-160 DX, Hartmann & Braun, Quebec,
Canada) using Bomem-GRAMS software (v. 4.04, Galactic Industries Inc, Salem, NH) and Teflon as a reference (99% reflective Spectralon, Labsphere Inc, North Sutton, NH). The spectra were recorded over a range of 4000 to 10 000 cm-1 with a resolution of 8 cm-1, and an average of 32 scans was used.
The moisture contents of the fillers were determined by Karl Fisher (KF) titration on a Mettler KF titrator (model DL35, Mettler Toledo AG, Greifensee, Switzerland) using Hydranal Solvent and Hydranal Titrant 5 (Riedel-deHaën Laborchemikalien GmbH, Seelze, Germany). The titration vial was warmed to 50°C and samples of 500-1000 mg were used. The determinations were performed in triplicate. Granule particle size was determined by sieve analysis. The sample match was confirmed using a rotary sample divider (Fritsch laborette 27, Idar-Oberstein, Germany). Granules were first sieved through a 3.15-mm sieve; thereafter, samples (20 g) of the undersize fraction were vibrated with an automatic sieve shaker (Fritsch analysette, Idar-Oberstein, Germany) for 5 minutes. The sieve analysis (range 45-2000 µm with v2 increment) was performed in triplicate for each batch of granulation and average values for mass mean particle size were determined.
Design of experiments
The experiments were performed according to the mixture design (Figure 1). This centroid cubic design included 13 experiments. In addition, 3 corner point and 1 center point experiments were replicated. Thus, the number of experiments was 17 (Figure 1, batches A-Q). The effect of varying composition on the mean particle size was modeled using Modde software (Modde for Windows, v. 3.0, Umetri AB, Sweden). Mass fractions (0-1) of fillers (MCC, lactose monohydrate, starch) in a formulation were used as variables. Regression modeling was performed using the backward selection technique. The original mixture model with quadratic; interaction and linear terms was simplified by removing the least significant terms from the model as long as the predictive power of model was increasing. The predictive powers of the models were evaluated using cross-validation. The cross-validation was basing on the leave-one-out principle with Q2 as a measure of predictive power (Modde for Windows). Q2 can be described as a fraction of the variation of the response that can be predicted by a model.

RESULTS AND DISCUSSION
Properties of starting materials
The off-line FT-NIR spectra of the materials applied were measured to understand the varying levels of in-line NIR signals (materials in dry powder form, Figure 2). The excipients used in formulations A-Q were all carbohydrates; therefore, they showed to some extent similar spectral features in the region applied for in-line moisture measurement (1800-2200 nm). The band at around 1940 nm (a combination of water OH stretching and bending vibrations) was
applied for the calculation of in-line spectral response, apparent water absorbance (AWA) [21]. This combination band is widely used for PAC applications as a result of its relatively strong absorption and high selectivity. The application of the water band at around 1450 nm (the first overtone of OH stretching vibrations) is difficult, because this region has spectral features resulting from other OH groups available in formulations. The reflectance at 1813 nm was used for the baseline correction and the reflectance at 2214 nm for the normalization of water signal. The higher initial moisture content of starch (9.28%) in
Figure 1. Coding of the experiments (batches A-Q) according to mixture design (corner and center points duplicate). Lactose monohydrate (batches A and O), MCC indicates microcrystalline cellulose (batches B and P), and pregelatinized starch (batches C and Q).

comparison with lactose monohydrate and MCC (4.74% and 4.43%, respectively) was seen as a higher water absorbance maximum (Figure 2B). The state of water affects the NIR spectra [17-20]. The water of crystallization with lactose monohydrate resulted in a relatively narrow water band at around 1940 nm in comparison with the water band of MCC and starch (Figure 2). The broad band for adsorbed water of MCC and starch indicated a spread of energies of interaction, whereas the monohydrate water band is typical of a more uniform interaction. The binder effects have been previously evaluated [22].
Figure 2. FT-near infrared spectra. A. Verapamil hydrochloride. B. Fillers. Moisture content of the materials is shown in parenthesis (LOD-%, wet basis; n = 3, mean ± SD).
Evaluation of different phases of granulation
The corner points of the mixture design were used for the evaluation of the granulation behavior of each filler. The temperature difference (Tdiff) between inlet air and granules is a widely used indicator of the state of the granulation (Figure 3A) [5]. AWA is a useful tool for monitoring of water through all phases of granulation (Figure 3B). The AWA value can be calibrated against a reference technique (eg, loss on drying methods, KF titration), and in-line moisture content of granules may be plotted during all 3 process phases. Further, the absolute water content (AH) of process air (g H2O/m3 of dry air) was applied for the process monitoring (Figure 4). The measured values of Tdiff and AH are not directly obtained from the granules, as is the case with NIR. The evaporation of water requires energy, which is seen as a decrease in granule temperature (increase in Tdiff). The water evaporated is seen as an increase in outlet air AH (the spraying phase in Figure 4). The typical behavior of each formulation can be identified by combining information of Tdiff, AWA, and AH. An experienced process operator combines this information from various trend charts (eg, Tdiff, AWA, AH), and easily defines the state of the granulation process. Multivariate process monitoring methods can also be used [21,23].
During the first phase of granulation (mixing), the moisture content of formulations B and C decreased (300-second period plotted after settling of air flow, Figures 3 and 4). The Tdiff of these formulations increased slightly in comparison with the formulation containing lactose monohydrate (Figure 3A). The AWA of formulations B and C decreased during the mixing phase; that of formulation A remained constant (Figure 3B). This indicated loss of water with formulations B and C. Further, the AH of outlet air during the mixing phase was higher with the formulations containing MCC and starch (Figure 4). With increasing inlet air temperature, the relative humidity of inlet air decreased. The water of MCC and starch was loosened because of the decreased equilibrium-moisture content of materials. The water of crystallization in formulation A (lactose monohydrate) was not loosened during drying at 50°C. This fact may be used for materials containing water of crystallization. The presence of indicators described previously can be used to detect pseudopolymorphic changes. Morris et al [24]

introduced the use of accelerated fluid bed drying basing on NIR and temperature probes. They showed that no physical changes occurred in compounds during the fluid bed drying with process inlet air temperature above the melting point of a low-melting compound.
The spraying phase was seen as a decrease in granule temperature (increase in Tdiff) and an increase in the AH of outlet air (Figures 3A and 4). The moisture profile (AWA) with formulation C (starch) was displaced in parallel (Figure 3B). This was due to the higher initial water content of starch (Figure 2B).
Figure 3. The effect of formulation and the state of granulation on A. temperature difference (Tdiff), and B. apparent water absorbance (AWA) during the granulation of formulations A, B, and C.
Figure 4. The effect of formulation and the state of granulation on the absolute water content (AH) of process air. A. Formulation A. B. Formulation B. C. Formulation C.

A fixed wavelength NIR sensor (WET-EYE, Fuji Paudal Co., Ltd., Osaka, Japan) has been previously used by Watano et al [25,26] and Miwa et al [27]. Watano et al [26] evaluated the formulation effects on the NIR sensor output, and they found that the mixing ratio of the model formulation (lactose monohydrate: corn starch) affects the calibration. This was explained by the different states of water in the materials used. The water-absorbing potential of corn starch was higher than that of lactose monohydrate. Miwa et al [27] evaluated the wet massing behavior of different excipients. They classified the excipients they studied into 5 groups according to the output of the NIR sensor. The NIR sensor output was related to the inside/surface distribution of water in at-line samples. They also used this result to estimate the amount of granulation liquid needed for wet granulation.
In this study, no differences could be observed by visual perusal of AWA profiles (rate of increase in Figure 3B) during the spraying phase. The result is in contrast to the earlier results obtained by Watano et al [26], Miwa et al [27], and Luukkonen et al [17]. In these studies the spectral changes were greatest with materials that had a poor liquid retention capacity. In this case, however, the method of granulation was a low shear system (fluid bed granulation). It has been shown previously that MCC is able to immobilize more water during granulation if high shear forces are used compared to low shear forces [28]. More water is able to get into the internal structure of microcrystalline cellulose, and less water is present on the surface of the particles. During fluid bed granulation the shear forces are much lower compared to high shear granulation. Because of this, the influence of the different water absorbing potentials of the materials on the AWA profiles is minimized. Consequently, when evaluating water-solid interactions with NIR, the effect of shear forces on the state of water should be considered.
During the drying phase, differences in the drying rates were observed (Figures 3 and 4). The drying time needed for formulation A (lactose monohydrate) was 800 and 1000 seconds less than those for formulations B (MCC) and C (starch), respectively. The adsorbed water in the case of formulation A resulted in a faster drying rate in comparison with formulations B and C containing water-absorbing excipient. In the batch drying unit
operations, a constant-rate drying period could be identified from high Tdiff value (Figure 3A). The falling-rate drying period occurs during the decreasing Tdiff value. In the case of formulation A, both these periods were shorter than for formulations B and C.
The information gained with traditional methods from the state of the granules during the spraying phase and at the beginning of the drying phase is quite limited. The levels of variables Tdiff and AH stayed at a constant level throughout the spraying and some of the drying phases (Figures 3A and 4). The in-line information was measured with the NIR setup through all stages of the granulation process (Figure 3B). Using this information, we can obtain documentation for all the steps in the processing.
Granule particle size
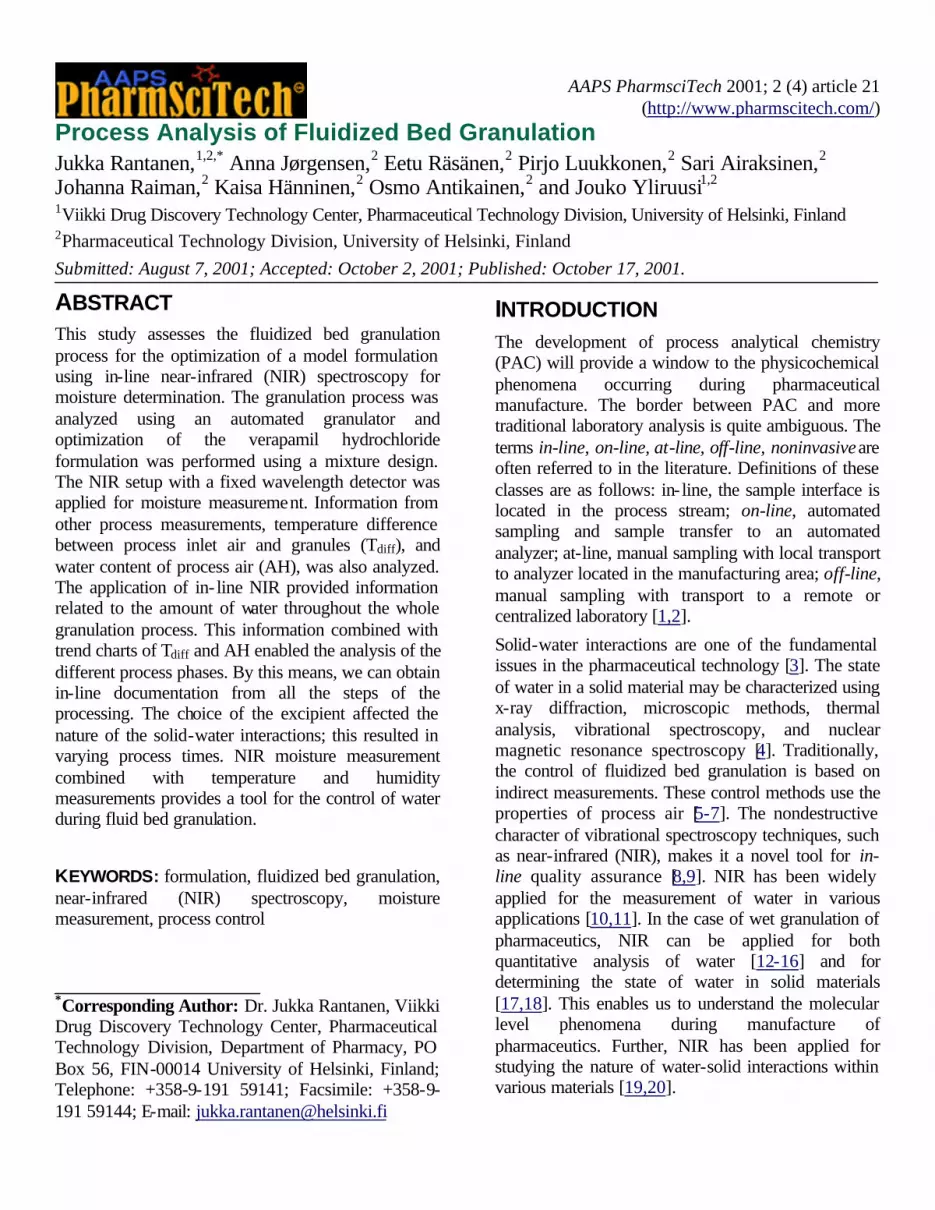
The model for mass mean granule particle size is presented in Figure 5. With the increasing amount of MCC, the mean particle size decreased. The largest granules were obtained with the formulations containing lactose monohydrate as a filler (batches A and O). The mean granule size with formulations containing starch was between these 2 cases. The water soluble filler (lactose monohydrate) resulted in an enhanced wetting of the powder mass, and by that means, a faster rate of agglomeration.
The shorter drying time with formulation A was one reason the particle size was affected. Both attrition and granule breakage occurred during the longer drying period, and the mean granule size of formulations B and C was smaller. The NIR signal was not affected by the particle size differences. The simultaneous detection of all wavelengths facilitates the application of NIR to process analysis.
CONCLUSIONS NIR moisture measurement combined with temperature and humidity measurements provides a novel tool for the monitoring of water during fluid bed granulation, and subsequently, to control the granulation process. The choice of excipient affected the solid-water interactions resulting in different processing times. The varying behavior of formulations during processing can be identified in a real-time mode. NIR spectroscopy offers unique information of granule moisture content during all phases of granulation.
ACKNOWLEDGEMENTS This study was financially supported by the Graduate School in Pharmaceutical Research (Ministry of Education, Finland), the National Technology Agency, TEKES (Finland), and Orion Pharma (Finland).
REFERENCES 1. Callis J, Illman D, Kowalski B. Process analytical chemistry. Anal Chem. 1987;59:624A-637A.
2. Beebe K, Blaser W, Bredeweg R, et al. Process analytical chemistry. Anal Chem. 1993;65:199R-216R.
3. Zografi G. States of water associated with solids. Drug Dev Ind Pharm. 1988;14:1905-1926.
4. Brittain H. Methods for the characterization of polymorphs and solvates. In: Brittain H, ed. Polymorphism in pharmaceutical solids. 1st ed. New York: Marcel Dekker Inc;1999:227-278.
5. Schaefer T, Wørts O. Control of fluidized bed granulation III. Effect of inlet air temperature and liquid flow rate on granule size and size distribution. Control of moisture content of granules in the drying phase. Arch Pharm Chem Sci. 1978;6:1-13.
6. Abberger T, Raneburger J, Egermann, H. Instrumentation of laboratory-scale fluid-bed granulator for critical moisture content and of free moisture. Sci Pharm. 1996;64:255-262.
7. Wöstheinrich K, Schmidt P. Evaluation and validation of a fully instrumented Hüttlin HKC 05-TJ laboratory-scale fluidized bed granulator. Drug Dev Ind Pharm. 2000;26:621-633.
8. Workman J, A review of process near infrared spectroscopy: 1980-1994. J Near Infrared Spectrosc. 1993;1:221-245.
9. Axon T, Brown R, Hammond S, Maris S, Ting F. Focusing near infrared spectroscopy on the business objectives of modern pharmaceutical production. J Near Infrared Spectrosc. 1998;6:A13-A19.
Figure 5. The mean particle size of granules as a function of the filler composition (regression model with R2 = 0.91, Q2 = 0.79). MCC indicates microcrystalline cellulose.

10. Kamat MS, Lodder RA, DeLuca PP. Near-infrared spectroscopic determination of residual moisture in lyophilized sucrose through intact glass vials. Pharm Res. 1989;6:961-965.
11. Osborne BG, Fearn T, Hindle PH. In: Practical NIR Spectroscopy with Applications in Food and Beverage Industry Analysis. 2nd ed. Harlow, UK: Longman;1993:227.
12. Watano S, Terashita K, Miyanami K. Development and application of infrared moisture sensor to complex granulation. Bull Univ Osaka Pref, Series A. 1990;39(2):187-197.
13. White J. On-line moisture detection for a microwave vacuum dryer. Pharm Res. 1994;11:728-732.
14. Frake P, Greenhalgh D, Grierson S, Hempenstall J, Rudd D. Process control and end-point determination of a fluid bed granulation by application of near infra-red spectroscopy. Int J Pharm. 1997;151:75-80.
15. Goebel S, Steffens K. Online-messung der Produktfeuchte und Korngröße in der Wirbelschnicht mit der Nah-Infrarot-Spektroskopie. Pharm Ind. 1998;60:889-895.
16. Rantanen J, Lehtola S, Rämet P, Mannermaa J-P, Yliruusi J. On-line monitoring of moisture content in an instrumented fluidized bed granulator with a multi-channel NIR moisture sensor. Powder Technol. 1998;99:163-170.
17. Luukkonen P, Rantanen J, Mäkelä K, Räsänen E, Tenhunen J, Yliruusi J. Characterization of silicified microcrystalline cellulose and a-lactose monohydrate wet masses using near infrared spectroscopy. Pharm Dev Technol. 2001;6:1-9.
18. Räsänen E, Rantanen J, Jørgensen A, Karjalainen M, Paakkari T, Yliruusi J. Novel identification of pseudopolymorphic changes of theophylline during wet granulation using near infrared spectroscopy. J Pharm Sci. 2001;90:389-396.
19. Iwamoto M, Uozumi J, Nishinari K. Preliminary investigation of the state of water in foods by near infrared spectroscopy. Budapest, Hungary. Intl NIR/NIT Conference;1987:3-12.
20. Delwiche S, Pitt R, Norris K. Examination of starch-water and cellulose-water interactions with near
infrared (NIR) diffuse reflectance spectroscopy. Starch/Stärke. 1991;43:415-422.
21. Rantanen J, Känsäkoski M, Suhonen J, et al. Next generation fluidized bed granulator automation. AAPS PharmSciTech 2000;1(2) Available from: http://www.aapspharmaceutica.com/scientificjournals/pharmscitech/volume1issue2/014/manuscript.htm.
22. Rantanen J, Räsänen E, Mannermaa J-P, Yliruusi J. In-line moisture measurement during granulation with a four wavelength near infrared sensor: an evaluation of particle size and binder effects. Eur J Pharm Biopharm. 2000;50:271-276.
23. Rantanen J, Laine S, Antikainen O, Mannermaa J-P, Simula O, Yliruusi, J. Visualization of pharmaceutical unit operations using self-organizing maps (SOM). J Pharm Biomed Anal. 2001;24:343-352.
24. Morris K, Stowell J, Byrn S, Placette A, Davis T, Peck G. Accelerated fluid bed drying using NIR monitoring and phenomenological modeling. Drug Dev Ind Pharm. 2000;26:985-988.
25. Watano S. Mechanism and control of granule growth in fluidized bed granulation [dissertation]. Osaka, Japan: College of Engineering, University of Osaka;1995.
26. Watano S, Takashima H, Sato Y, Miyanami K, Yasutomo T. IR absorption characteristics of an IR moisture sensor and mechanism of water transfer in fluidized bed granulation. Adv Powder Technol. 1996;7:279-289.
27. Miwa A, Yajima T, Itai S. Prediction of suitable amount of water addition for wet granulation. Int J Pharm. 2000;195:81-92.
28. Schmidt C, Kleinebudde P. Influence of the granulation step on pellets prepared by extrusion/spheronization. Chem Pharm Bull. 1999;47:405-412.


