Embed Size (px)
Citation preview
Waste Management 29 (2009) 783–791
Contents lists available at ScienceDirect
Waste Management
journal homepage: www.elsevier .com/locate /wasman
Tar removal during the fluidized bed gasification of plastic waste
Umberto Arena *, Lucio Zaccariello, Maria Laura MastelloneDepartment of Environmental Sciences, Second University of Naples, Via Antonio Vivaldi 43, 81100 Caserta, ItalyAMRA Scarl, Via Nuova Agnano 11, 80125 Napoli, Italy
a r t i c l e i n f o
Article history:Accepted 30 May 2008Available online 9 August 2008
0956-053X/$ - see front matter � 2008 Elsevier Ltd. Adoi:10.1016/j.wasman.2008.05.010
* Corresponding author. Tel.: +39 0823 274 414; faE-mail address: [email protected] (U. Aren
a b s t r a c t
A recycled polyethylene was fed in a pilot plant bubbling fluidized bed gasifier, having an internal diam-eter of 0.381 m and a maximum feeding capacity of 90 kg/h. The experimental runs were carried outunder various operating conditions: the bed temperature was kept at about 850 �C, the equivalence ratiovaried between 0.2 and 0.35, the amount of bed material was between 131 and 215 kg, the fluidizingvelocity was between 0.5 and 0.7 m/s, quartz sand and olivine were used as bed material, and air andsteam were used as fluidizing reactants.The results confirm that the tar removal treatments applied inside the gasifier (primary methods) caneliminate or strongly reduce the need for a further downstream cleanup of the syngas. In particular,the utilization of a natural olivine as an in situ tar reduction agent remarkably improves the quality ofthe product gas, in terms of both high hydrogen volumetric fraction and larger syngas yield.
� 2008 Elsevier Ltd. All rights reserved.
1. Introduction
The world needs more sustainable solid waste managementtechniques, which focus on greater value recovery from wasteand easier plant acceptance by the interested people. A numberof novel technologies utilizing gasification processes have recentlyemerged to address these issues and to improve the value of en-ergy or materials outputs (Livingston, 2002; Klein, 2002; Malkow,2004). Gasification has several advantages over traditional com-bustion of solid wastes: a limited formation of dioxins and of ni-trous and sulphur oxides; a strong reduction in the process gasvolume; production of an energy carrier that can be integratedwith combined cycle turbines or reciprocating engines (which con-vert fuel energy to electricity more than twice as efficiently as con-ventional steam boilers); a reduced amount of secondary wastes;and the possibility to apply the process at a smaller scale (Kleinet al., 2004; Arena and Mastellone, 2005). Moreover, gasificationprocesses have the possibility of combining the type of startingwaste, the operating conditions and the features of the specificreactor in order to obtain a syngas that can be utilized in differentapplications. The range of products immediately obtainable fromsyngas extends from bulk chemicals like ammonia and methanol,through industrial gases, to utilities such as clean fuel gas and elec-tricity (Higman and van der Burgt, 2003).
Among all waste gasification technologies, fluidization is one ofthe promising ones, for a number of reasons (Arena andMastellone, 2005, 2006; Basu, 2006). In particular, the greatoperating flexibility makes it possible to utilize different fluidizing
ll rights reserved.
x: +39 0823 274 592.a).
agents, reactor temperatures and gas residence times, to addreagents along the reactor freeboard or riser and to operate withor without a specific catalyst.
On the other hand, there is the main disadvantage of the riskassociated with a technology less proven in operation than conven-tional combustion technologies, particularly taking in mind thehighly heterogeneous nature of feeds like municipal solid wastes.One of the greatest technical challenges to overcome for the suc-cessful development of commercial advanced gasification technol-ogies is that of an improved syngas cleaning, able to meet definedspecifications (Dayton, 2002; Babu, 2006). During gasification, tars,heavy metals, halogens and alkaline compounds are released with-in the gas and can cause environmental and operational problems.The continual build-up of condensable organic compounds presentin the producer gas (usually referred to as tars) is the main prob-lem since it increases the occurrence of slagging in boilers andon other metal and refractory surfaces, can ruin reforming cata-lysts, sulphur removal systems, ceramic filters; can cause block-ages and corrosion and also reduces the overall efficiency of theprocess. Heavy metals are toxic and bioaccumulate if released intothe environment. Halogens are corrosive and are a cause of acidrain if emitted to the environment. Alkalis can create problemsto gas turbines and increase agglomeration in fluidized bed reac-tors (Klein et al., 2004; Higman and van der Burgt, 2003). Sincethe markets for gasifiers without gas cleaning are rather limited(Malkow, 2004; Nieminen, 2004; Juniper, 2007), the key to achiev-ing economically and environmentally efficient energy recoveryfrom solid waste gasification is to overcome problems associatedwith the formation and release of these contaminants. As a conse-quence, the economics are far away from clear; there still is a lackof reliable assessments on the best design solutions as well as on
Nomenclature
A/F (air-to-fuel ratio) ratio between the mass flow rate of air andthat of fuel
CCE (carbon conversion efficiency) ratio between the flow rate ofcarbon converted in gaseous products and that of car-bon fed with the fuel
CGE (cold gas efficiency, also known as apparent thermalefficiency) ratio between the chemical energy ofobtained syngas and that of daf fuel [syngas flowrate � LHVsyngas/fuel flow rate � LHVfuel]
ER (equivalence ratio) ratio between the oxygen content of airsupply and that required for the stoichiometric completecombustion of the fuel effectively fed to the reactor
GR (gasifying ratio) ratio between the sum of the mass flow ratesof steam and oxygen and that of fuel
LHV lower heating valuem3
N cubic meters under normal conditions (0 �C e 1 atm)Qair mass flow rate of fluidizing airQfuel mass flow rate of fuel fed into the gasifierQ0syngas specific volumetric flow rate of obtained syngas, under
normal conditionsQtar mass flow rate of tar as measured downstream of the
scrubber unitS/F, steam-to-fuel ratio ratio between the mass flow rate of
steam and that of fuelTbed temperature of fluidized bedU superficial fluidizing velocityWbed amount of bed material (sand or olivine particles)
Table 1Main design and operating features of the bubbling fluidized bed gasifier
Geometricalparameters
ID: 0.381 m; total height: 5.90 m; reactive zone height:4.64 m; wall thickness: 12.7 mm
Feedstock capacity 30–90 kg/h (depending on the type of fuel)Typical bed amount 131,145,215 kgFeeding equipment In-bed (water cooled) and over-bed (air cooled) screw
feedersGasifying agents Air, oxygen, steam, carbon dioxide (alone or as mixture)Range of operating
temperatures700–950 �C
Range of fluidizingvelocities
0.5–1 m/s
Flue gas treatments Cyclone, scrubber, flareSafety equipment Water seal, safety valves, rupture disks, alarms, nitrogen
line for safety inertingMain process variables Reactor temperature, bed height, fluidizing velocity, blast
flow rate, equivalence ratio
784 U. Arena et al. / Waste Management 29 (2009) 783–791
the scale and operating conditions under which a full economicconvenience of the fluidized bed gasification of wastes isobtainable.
Most research efforts address the main problem of gas cleaning,that of tar removal, conversion, or destruction, within or down-stream of the gasifier. Tar is a complex mixture of a large spectrumof condensable hydrocarbons, which includes single ring to multi-ple ring aromatic compounds along with other oxygen containinghydrocarbons. They are undesirable because of various problemsassociated with condensation, formation of tar aerosols and poly-merization of more complex structures, which cause problems inthe process equipment as well as in the devices for end-use appli-cation of the syngas. The approaches for reduction of tar formationand for tar removal from obtained syngas can substantially be di-vided into two categories (Dayton, 2002; Devi et al., 2003): treat-ment inside the gasifier (primary methods) and hot gas cleaningafter the gasifier (secondary methods). Secondary methods (thermalor catalytic tar cracking and mechanical methods such as use of cy-clones, ceramic filters, fabric or electrostatic filters, and scrubbers)are reported to be very effective in several cases, even though theyare not always economically viable and particularly complex whena considerably low tar content is required. On the other hand,treatments inside the gasifier (adequate selection of main operat-ing parameters, use of a proper bed additive or catalyst, specificgasifier design modifications) are gaining much attention for solidwaste gasification since they may eliminate or strongly reduce theneed for downstream cleanup. It is likely that an adequate combi-nation of different primary and secondary treatments may opti-mize the gasifier performance and allow production of a syngaswith minimum tar concentration.
The aim of this study was to evaluate the role of some operatingparameters (reactor temperature, fluidizing velocity, equivalenceratio, steam/fuel ratio, bed height) in the formation and decompo-sition of tar and the ability of a specific bed additive/catalyst (a nat-ural olivine) to act as in situ tar reduction agent during thefluidized bed gasification of a plastic waste. The paper presentsthe first results of a 3-year research program focused on fluidizedbed gasification of several alternative fuels. The experiments werecarried out by feeding a recycled polyethylene in a pilot plant bub-bling fluidized bed gasifier.
2. The bubbling fluidized bed gasifier and the utilized materialsand procedures
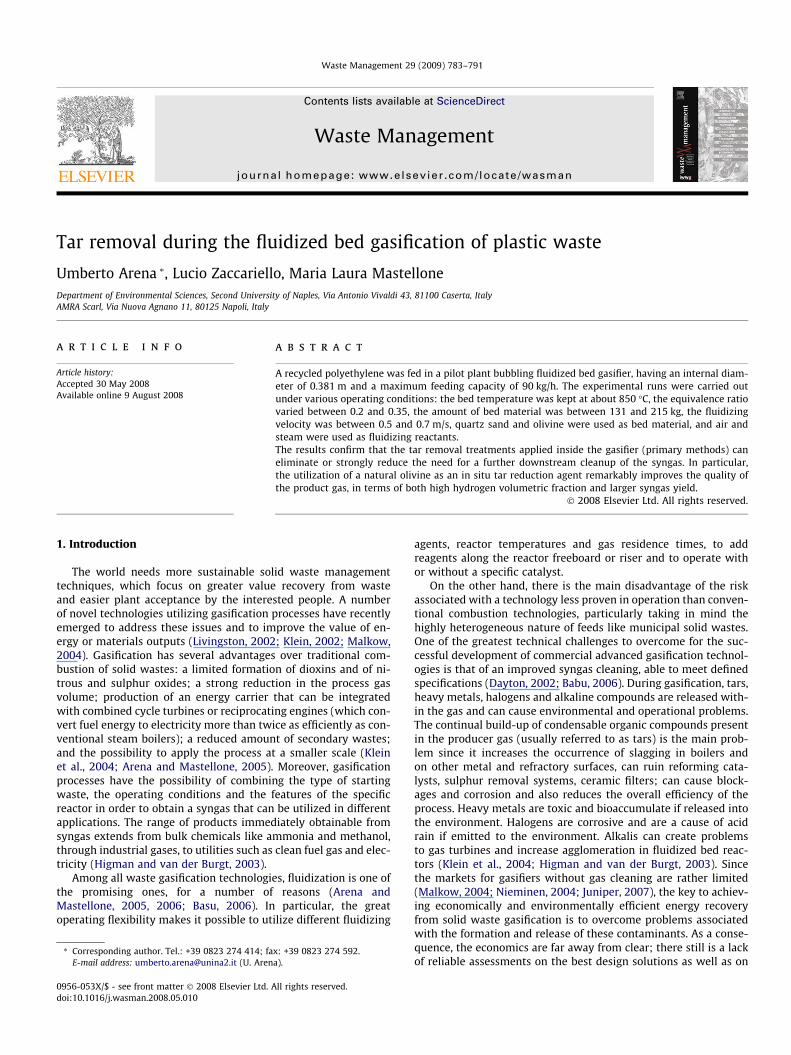
The pilot scale bubbling fluidized bed gasifier (BFBG) has thedesign and operating features schematically listed in Table 1. It
is composed of three main sections (the feeding system, the flu-idized bed gasifier and the syngas treatment unit), as shown bythe quantified process flow-sheet in Fig. 1. The feeding systemcan be divided into: blast feeding (measuring, mixing and injec-tion of gasification agents) and fuel feeding (measuring and injec-tion of solid feedstock). The blast feeding is heated up to 200 �Cby an electric heater, then sent to a mixing point with an optionalstream of steam at about 150 �C and finally heated by a secondelectric heater up to 600 �C before entering the reactor. The blastcan be supplied at different levels of the gasifier: at the bottom,as fluidizing gas and primary blast, and at two freeboard heights,as secondary blast. The fuel can be fed in-bed or over-bed, bymeans of two separate feeding systems. In the experiments re-ported here, air or an air/steam mixture are used as blast agentand always injected at the bed bottom while the fuel is alwaysfed by means of the over-bed feeding system. The fuel and theblast flow rates are mutually adjusted so that, at the fixed fluid-izing velocity, the desired equivalence ratio (ER) is obtained. Thegasification section is composed of a cylindrical bubbling fluid-ized bed (BFB) reactor, equipped with several control and protec-tion devices (Arena et al., 2008a), which is heated up to thereaction temperature thanks to the sensible heat of pre-heatedblast gases and to a set of three external electrical furnaces. Thegas generated in the reactor is sent to the syngas treatment sec-tion composed of a high efficiency cyclone, a wet scrubber (for re-moval of tars, residual fly ashes and acid gases) and a flare. Amore complete description of the plant can be found elsewhere(Arena et al., 2006, 2008a).
132 Nm³/h
DRAINS
50ºC ~ 1 bar
SCRUBBER
CH4
WATER
CO2
O2
N2
air
74 Nm³/h 20 ºC
~3 barG
HEAT 0120 ºC-200 ºC
74 Nm³/h 600 ºC ~3 barG
200 ºC ~3 barG
74 Nm³/h 180 ºC ~3barG
HEAT 02 180 ºC-600 ºC
GASIFIER 820 ºC ~ 1 barH2 = 30.1%CO = 18.4% CO2 = 1.6%N2 = 45%
HEAT
INERT BED MATERIAL
STEAM
PELLETIZER 28.6 kg/h
132 Nm³/h
800 ºC~ 1 bar
CYCLONE
FLARE
70 Nm³/h 20 ºC~3 barG
74 Nm³/h
600ºC ~ 1 bar
132 Nm³/h 250 ºC~ 1bar
4 m³/h 20 ºC
5 Nm³/h 0.3 barG
0 Nm³/h
0 Nm³/h
4 Nm³/h
FEEDSTOCK
Fig. 1. Quantified process flow-sheet of the gasification plant, for a typical run with a bed of olivine.
Table 2Main physical and chemical properties of the plastic waste tested
Recycled polyethylene (PE)
Ultimate analysisC (%) 85.0H (%) 13.8N (%) 0S (%) 0O (%) 0Ashes (%) 1.0Moisture (%) 0.2Low heating value (kJ/kg) 45,500Starting devolatilization temperature (�C) �250Devolatilization temperature (�C) �410Diameter and thickness of fuel pellets (mm) 5, 2Particle density (kg/m3) 940Bulk density (kg/m3) 570
U. Arena et al. / Waste Management 29 (2009) 783–791 785
The BFBG was fed with pellets of a recycled polyethylene (PE),coming from separate collection of municipal solid wastes. Theirphysical and chemical properties are reported in Table 2. Twotypes of bed materials were used during the experimental runs:a quartz sand, having a size range of 0.2–0.4 mm and a particledensity of 2600 kg/m3, and an olivine (a magnesium–iron silicatemineral), (Mg,Fe2)SiO4, having the same size range and a particledensity of 3100 kg/m3. The utilized olivine comes from Austriaand is composed of different oxides: MgO = 48–50%; SiO2 = 39–42%; Fe2O3 = 8–10.5%; (Al2O3 + Cr2O3 + Mg3O4 = 0.8); CaO < 0.4%(Magnolithe Ltd., 2006).
Each run has a start-up of about 3 h, during which the electricheaters raise the reactor temperature up to about 650 �C, whilethe bed is fluidized at the desired value of fluidizing velocity, U.At this point a limited amount of PE is injected into the reactorand utilized to reach, under combustion conditions, the tempera-ture of 850 �C along the whole reactor. The values of PE and airflow rate are then adjusted in order to obtain the desired valueof ER. The reactor is operated under these conditions until all thevalues of gas composition remain constant for about 1 h. The gasand solids sampling procedures are then activated and measure-ments of pressure, temperature, blast flow rates, syngas composi-tion, and fines collected at the cyclone are taken.
In all the runs, gas composition downstream of the syngastreatment section was measured on-line by means of two sys-
tems: the first utilizes IR analysers (Horiba VA-3115 for CO, CO2
and O2, Horiba VA-3001 for CH4 and Teledyne Anal. Instr.-2000for H2), the other uses an Agilent 3000 micro-gas-chromatograph.This double system allows a high reliability of measured gas com-position. Gas was also sampled in other two points by means ofTedlar bags: at a level of 2.3 m along the reactor and just afterthe gasifier exit. Because the tar content is one of the major con-cerns, two different methods of tar evaluation have been used.The first conservatively imputes to the tar amount (assumed tobe composed of all organic compounds with a molecular weightlarger than benzene, excluding soot and char) the whole carbonloading which, as a result of a mass balance on atomic specieswith an overall error <5%, cannot be attributed either to the pro-duced gas or to the solids collected at the cyclone or present in-side the bed. The second method evaluates the amount of CnHm
with n > 6 on the basis of quantitative determinations obtainedby sampling for a fixed time of 30 s by means of Supelco TenaxTA cartridges. These are then analyzed in a Perkin Elmer Clarus500 GC–MS coupled with Perkin Elmer Turbomatrix ATD thermaldesorber. Data reported in the following are those obtained withthe first method, which are generally larger that those comingfrom the second method.
Data obtained from on-line and off-line measurements andfrom chemical analyses are processed to develop for each run com-plete mass balances on atomic species and related energy balances.The flow rate of produced syngas is determined by the tie compo-nent method (Felder and Rousseau, 2000) applied to the value ofnitrogen content in the dry syngas, as obtained by (on-line andoff-line) GC measurements. Carbon balance allows the determina-tion of tar content on the basis of the above recalled assumptionwhile hydrogen balance, which takes into account also the tarhydrogen content as measured in some samples taken during therun, allows that of water content in the syngas (Basu, 2006). Thevalidity of the whole mass balance is verified by means of theatomic oxygen balance. For experiments carried out with olivine,a certain amount of carbon is present as a layer covering bed par-ticles or fines elutriated from the reactor and collected in the cy-clone. The latter are periodically collected, weighed andanalyzed, so that their amount is easily determined. The amountof carbon present in the bed is instead determined by establishingoxidizing conditions in the reactor at the end of each run, that is,after the stop of plastic feeding, and calculating the relatedamounts of correspondingly produced CO and CO2.
786 U. Arena et al. / Waste Management 29 (2009) 783–791
3. The effect of main operating parameters
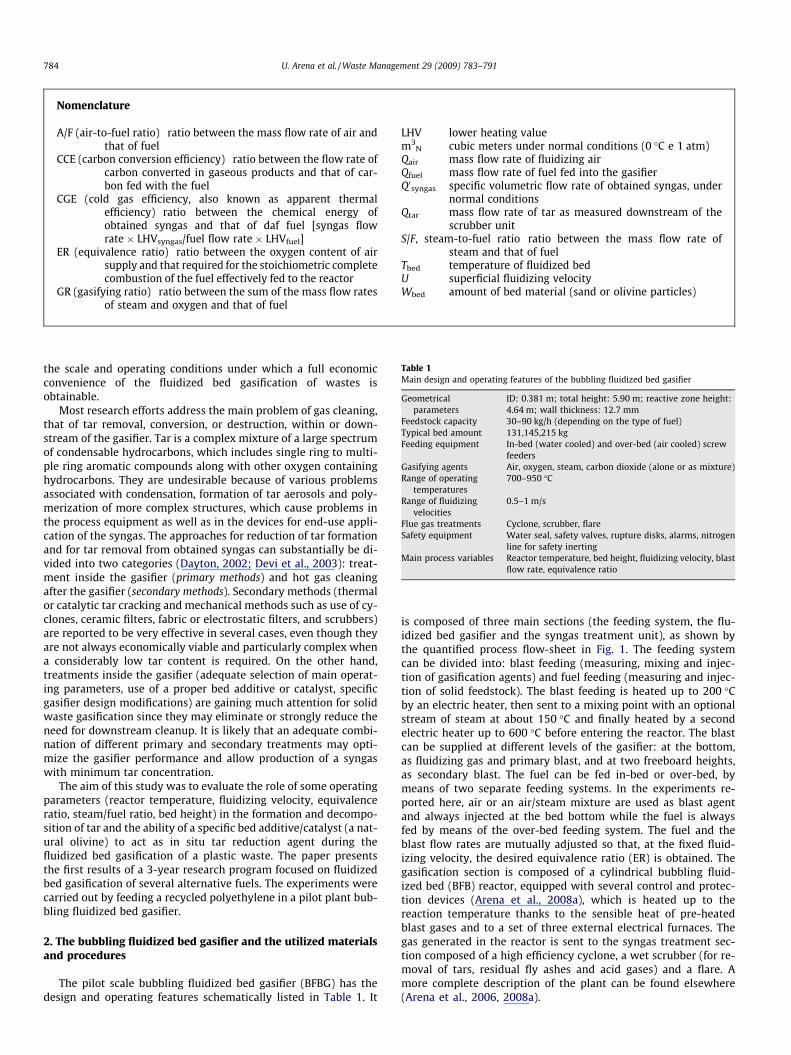
It has been already mentioned that primary methods can be de-fined as a series of techniques applied in the gasification step itselfand aimed at preventing tar formation or converting it inside thereactor. There is a great research effort in the development anddemonstration of primary methods, particularly for biomass gasifi-cation (Narvaez et al., 1996; Corella et al., 1999; Gil et al., 1999;Neeft et al., 1999; Dayton, 2002; Devi et al., 2003; Babu, 2006),but so far they are not yet fully understood and implemented com-mercially. The basic idea is that the values of main operatingparameters of a gasifier can be adequately selected so that the gas-ifier performance is optimized, and the quality of exit gas can meetthe requirements for the different end-use applications. The pilotscale BFBG was fed with a recycled PE under various experimentalconditions in order to obtain information about the role of mainoperating parameters (reactor temperature, residence time, gasify-ing agent, equivalence ratio, catalyst and additives) in the forma-tion and decomposition of tar. Table 3 lists the values chosen forthe complete set of experiments. It is also evident that the selec-tion of these parameters strongly depends on the type of gasifierused. For fluidized bed reactors, the quality of fluidization it is ofgreat interest so that specific hydrodynamic parameters (such asthe size of bed particles or the superficial gas velocity) have also
Table 3Operating conditions of experimental runs with recycled polyethylene
Run number Bed material Wbed (kg) Tbed (�C) U (m/s) Qair (kg/h
3 Sand 131 850 0.50 64.34 Sand 131 869 0.61 77.25 Sand 131 867 0.71 90.16 Sand 131 898 0.73 90.17 Sand 131 845 0.70 90.1A Sand 131 850 0.60 66.9B Sand 131 811 0.51 51.5C Sand 131 831 0.68 70.1D Sand 131 853 0.70 70.18 Olivine 145 813 0.68 90.19 Olivine 145 807 0.67 90.110 Olivine 145 819 0.68 90.111 Olivine 145 794 0.58 78.512 Olivine 145 816 0.68 90.113 Olivine 145 825 0.69 90.114 Olivine 215 783 0.47 64.315 Olivine 215 848 0.50 64.316 Olivine 215 815 0.69 90.1
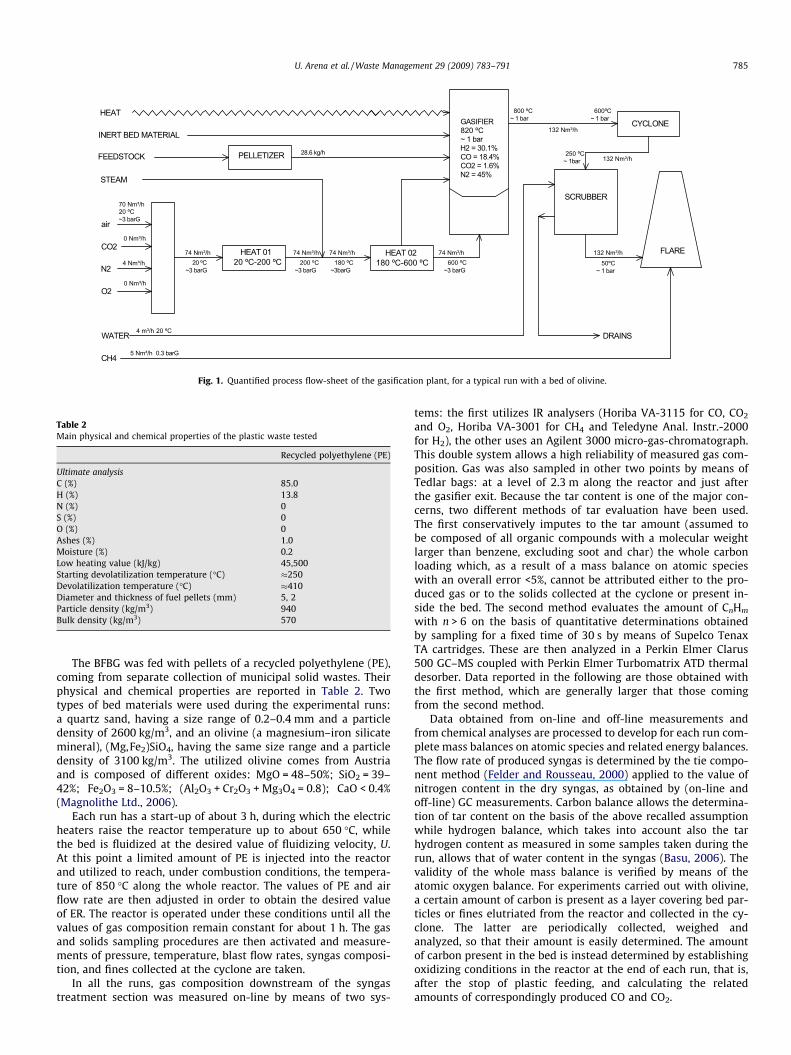
Table 4Main results of experimental runs with recycled polyethylene, as measured downstream
Run number Q0syngas (m3N/kgfuel) N2 (%) CO (%) H2 (%) CO2 (%)
3 3.8 68.7 2.7 7.4 9.54 3.6 65.7 2.5 9.1 9.65 3.3 64.6 2.4 9.6 9.66 4.3 69.0 2.3 8.3 10.47 3.0 63.9 2.8 9.1 9.1A 3.2 66.9 5.0 7.8 8.7B 2.6 65.1 3.4 7.2 7.5C 3.0 61.8 4.1 8.8 8.2D 3.3 66.4 3.7 7.7 8.98 5.0 45.2 18.0 32.2 1.29 5.4 48.5 20.0 26.9 1.410 4.2 45.0 18.4 30.1 1.611 5.2 46.8 19.3 29.2 1.812 5.6 48.4 20.1 27.1 1.713 6.0 50.0 19.5 24.0 3.314 5.3 47.3 18.2 29.3 1.715 5.6 50.0 21.3 25.4 0.916 4.8 43.8 19.0 30.8 1.6
to be taken into account. The experimental results are reportedin Table 4.
3.1. Temperature and residence time in the reactor
Reaction temperature strongly affects the performance of gasifi-ers, since the main gasification reactions are endothermic. Fluid-ized bed gasification experiments carried out with biomass(Narvaez et al., 1996; Gil et al., 1999; Pinto et al., 2003) indicatedthat variation in reactor temperature affects the composition of ob-tained syngas and, in particular, the tar yield. Gil et al. (1999) usedsmall pine wood chips in a pilot-scale reactor and observed an in-crease in H2 from 5% to 10% (vol.) together with a drastic decreasein tar content (about 74% less) as a result of an increase in bed tem-perature from 700 �C to 850 �C. Similar results were obtained byPinto et al. (2003) in experiments of co-gasification of coal, bio-mass and PE. They found that the rise of temperature favouredthe formation of further hydrogen and hydrocarbon reactions,which led to a reduction in hydrocarbons content in the productgas. As a consequence, they found an increase in H2 content andgas yield and a reduction of CH4 and C2Hm contents, as well as ofgas heating value. Results obtained in runs 7 and 5 of air gasifica-tion and C and D of air/steam gasification are in agreement. Theyconfirm, under the limited range of investigated values, that the
) Qfuel (kg/h) A/F (kgair/kgfuel) ER S/F (kgsteam/kgfuel) GR
16.7 3.85 0.26 0 0.9021.8 3.54 0.24 0 0.8327.9 3.23 0.22 0 0.7520.0 4.50 0.31 0 1.0531.0 2.91 0.20 0 0.6820.8 3.22 0.22 0.29 1.0420.8 2.47 0.17 0.48 1.0625.5 2.75 0.19 0.47 1.1121.4 3.28 0.22 0.56 1.3226.1 3.45 0.24 0 0.8022.6 3.99 0.27 0 0.9331.4 2.87 0.20 0 0.6721.4 3.67 0.25 0 0.8521.8 4.13 0.28 0 0.9619.8 4.54 0.31 0 1.0618.1 3.55 0.24 0 0.8316.2 3.97 0.27 0 0.9229.1 3.09 0.21 0 0.72
of the scrubber
CH4 (%) C2Hm (%) LHVsyngas (kJ/m3N) Qtar (kg/h) CGE CCE
8.3 3.4 6100 6.2 0.51 0.648.8 4.4 7000 7.8 0.56 0.669.1 4.6 7300 12.1 0.54 0.627.1 2.9 5500 7.0 0.52 0.68
10.4 4.8 7900 14.6 0.52 0.598.7 2.9 6300 9.2 0.45 0.57
10.4 6.5 8700 9.0 0.51 0.5610.3 6.9 9200 8.3 0.61 0.67
8.1 5.1 7200 7.7 0.53 0.642.5 0.7 7100 1.9 0.79 0.722.2 0.5 6500 0 0.78 0.793.4 1.4 7600 0 0.71 0.632.1 0.6 6700 0 0.77 0.772.1 0.5 6500 0 0.81 0.762.0 0.9 6300 0 0.84 0.822.5 0.5 6600 0 0.78 0.771.8 0.3 6200 0 0.78 n.a.3.2 1.1 7500 0 0.80 0.78
0
5
10
15
20
QTA
R, k
g/h
0
5
10
15
CH
4, %
0.15 0.20 0.25 0.30 0.35
ER, -
0
2
4
6
8
10C
2Hm
, %Sand - Air
Olivine - Ari
Sand - Air/Steam
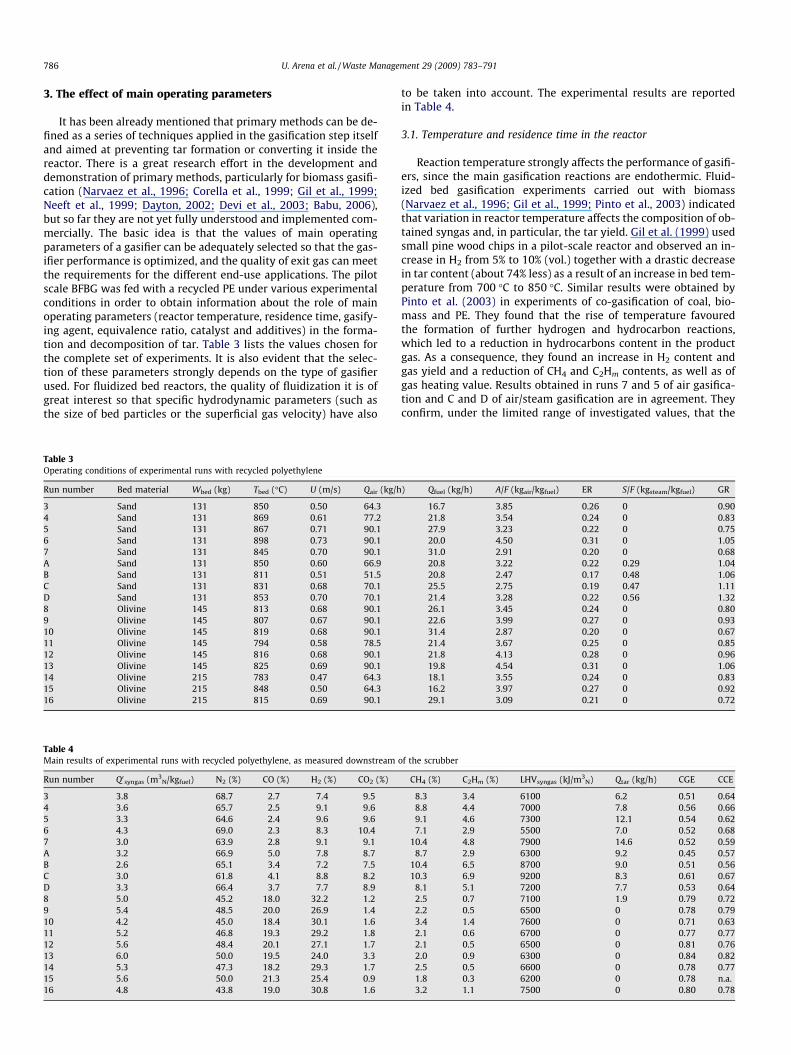
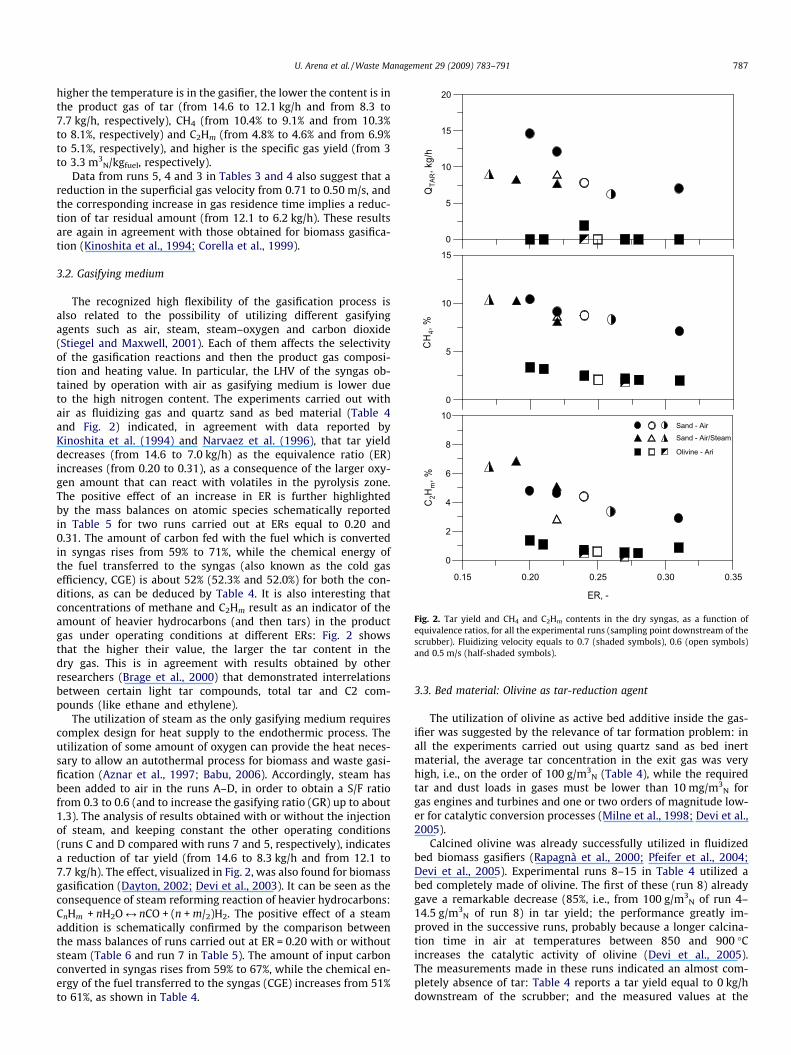
Fig. 2. Tar yield and CH4 and C2Hm contents in the dry syngas, as a function ofequivalence ratios, for all the experimental runs (sampling point downstream of thescrubber). Fluidizing velocity equals to 0.7 (shaded symbols), 0.6 (open symbols)and 0.5 m/s (half-shaded symbols).
U. Arena et al. / Waste Management 29 (2009) 783–791 787
higher the temperature is in the gasifier, the lower the content is inthe product gas of tar (from 14.6 to 12.1 kg/h and from 8.3 to7.7 kg/h, respectively), CH4 (from 10.4% to 9.1% and from 10.3%to 8.1%, respectively) and C2Hm (from 4.8% to 4.6% and from 6.9%to 5.1%, respectively), and higher is the specific gas yield (from 3to 3.3 m3
N/kgfuel, respectively).Data from runs 5, 4 and 3 in Tables 3 and 4 also suggest that a
reduction in the superficial gas velocity from 0.71 to 0.50 m/s, andthe corresponding increase in gas residence time implies a reduc-tion of tar residual amount (from 12.1 to 6.2 kg/h). These resultsare again in agreement with those obtained for biomass gasifica-tion (Kinoshita et al., 1994; Corella et al., 1999).
3.2. Gasifying medium
The recognized high flexibility of the gasification process isalso related to the possibility of utilizing different gasifyingagents such as air, steam, steam–oxygen and carbon dioxide(Stiegel and Maxwell, 2001). Each of them affects the selectivityof the gasification reactions and then the product gas composi-tion and heating value. In particular, the LHV of the syngas ob-tained by operation with air as gasifying medium is lower dueto the high nitrogen content. The experiments carried out withair as fluidizing gas and quartz sand as bed material (Table 4and Fig. 2) indicated, in agreement with data reported byKinoshita et al. (1994) and Narvaez et al. (1996), that tar yielddecreases (from 14.6 to 7.0 kg/h) as the equivalence ratio (ER)increases (from 0.20 to 0.31), as a consequence of the larger oxy-gen amount that can react with volatiles in the pyrolysis zone.The positive effect of an increase in ER is further highlightedby the mass balances on atomic species schematically reportedin Table 5 for two runs carried out at ERs equal to 0.20 and0.31. The amount of carbon fed with the fuel which is convertedin syngas rises from 59% to 71%, while the chemical energy ofthe fuel transferred to the syngas (also known as the cold gasefficiency, CGE) is about 52% (52.3% and 52.0%) for both the con-ditions, as can be deduced by Table 4. It is also interesting thatconcentrations of methane and C2Hm result as an indicator of theamount of heavier hydrocarbons (and then tars) in the productgas under operating conditions at different ERs: Fig. 2 showsthat the higher their value, the larger the tar content in thedry gas. This is in agreement with results obtained by otherresearchers (Brage et al., 2000) that demonstrated interrelationsbetween certain light tar compounds, total tar and C2 com-pounds (like ethane and ethylene).
The utilization of steam as the only gasifying medium requirescomplex design for heat supply to the endothermic process. Theutilization of some amount of oxygen can provide the heat neces-sary to allow an autothermal process for biomass and waste gasi-fication (Aznar et al., 1997; Babu, 2006). Accordingly, steam hasbeen added to air in the runs A–D, in order to obtain a S/F ratiofrom 0.3 to 0.6 (and to increase the gasifying ratio (GR) up to about1.3). The analysis of results obtained with or without the injectionof steam, and keeping constant the other operating conditions(runs C and D compared with runs 7 and 5, respectively), indicatesa reduction of tar yield (from 14.6 to 8.3 kg/h and from 12.1 to7.7 kg/h). The effect, visualized in Fig. 2, was also found for biomassgasification (Dayton, 2002; Devi et al., 2003). It can be seen as theconsequence of steam reforming reaction of heavier hydrocarbons:CnHm + nH2O M nCO + (n + m/2)H2. The positive effect of a steamaddition is schematically confirmed by the comparison betweenthe mass balances of runs carried out at ER = 0.20 with or withoutsteam (Table 6 and run 7 in Table 5). The amount of input carbonconverted in syngas rises from 59% to 67%, while the chemical en-ergy of the fuel transferred to the syngas (CGE) increases from 51%to 61%, as shown in Table 4.
3.3. Bed material: Olivine as tar-reduction agent
The utilization of olivine as active bed additive inside the gas-ifier was suggested by the relevance of tar formation problem: inall the experiments carried out using quartz sand as bed inertmaterial, the average tar concentration in the exit gas was veryhigh, i.e., on the order of 100 g/m3
N (Table 4), while the requiredtar and dust loads in gases must be lower than 10 mg/m3
N forgas engines and turbines and one or two orders of magnitude low-er for catalytic conversion processes (Milne et al., 1998; Devi et al.,2005).
Calcined olivine was already successfully utilized in fluidizedbed biomass gasifiers (Rapagnà et al., 2000; Pfeifer et al., 2004;Devi et al., 2005). Experimental runs 8–15 in Table 4 utilized abed completely made of olivine. The first of these (run 8) alreadygave a remarkable decrease (85%, i.e., from 100 g/m3
N of run 4–14.5 g/m3
N of run 8) in tar yield; the performance greatly im-proved in the successive runs, probably because a longer calcina-tion time in air at temperatures between 850 and 900 �Cincreases the catalytic activity of olivine (Devi et al., 2005).The measurements made in these runs indicated an almost com-pletely absence of tar: Table 4 reports a tar yield equal to 0 kg/hdownstream of the scrubber; and the measured values at the
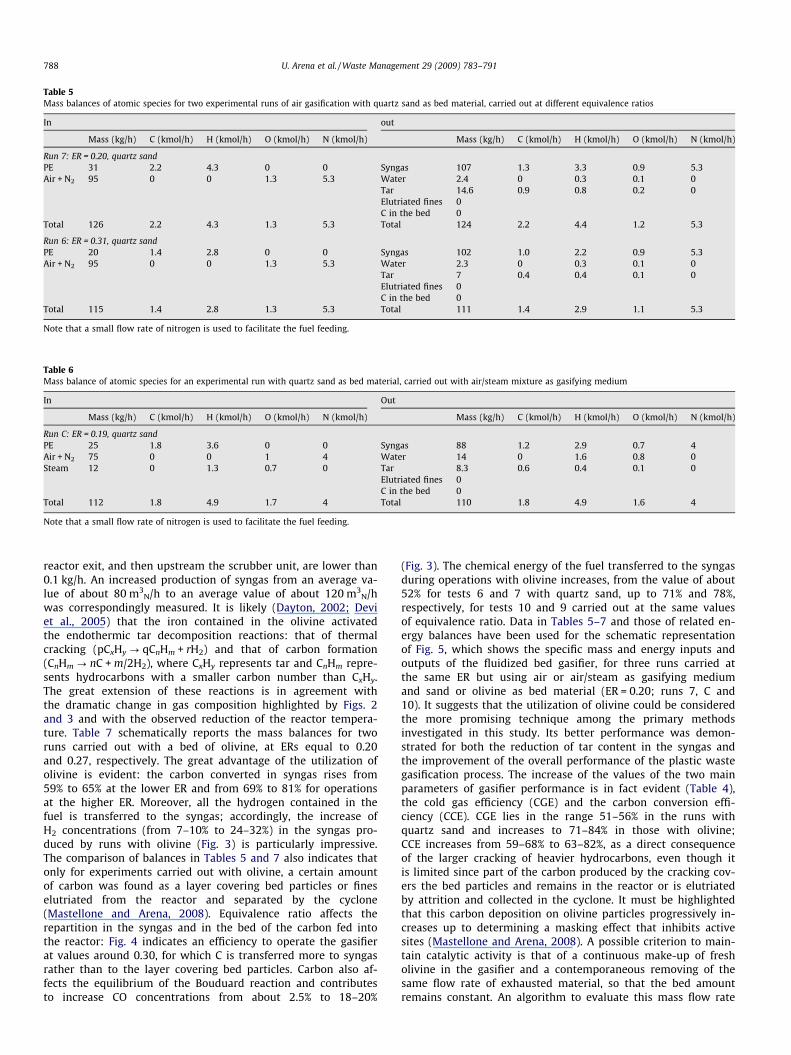
Table 5Mass balances of atomic species for two experimental runs of air gasification with quartz sand as bed material, carried out at different equivalence ratios
In out
Mass (kg/h) C (kmol/h) H (kmol/h) O (kmol/h) N (kmol/h) Mass (kg/h) C (kmol/h) H (kmol/h) O (kmol/h) N (kmol/h)
Run 7: ER = 0.20, quartz sandPE 31 2.2 4.3 0 0 Syngas 107 1.3 3.3 0.9 5.3Air + N2 95 0 0 1.3 5.3 Water 2.4 0 0.3 0.1 0
Tar 14.6 0.9 0.8 0.2 0Elutriated fines 0C in the bed 0
Total 126 2.2 4.3 1.3 5.3 Total 124 2.2 4.4 1.2 5.3
Run 6: ER = 0.31, quartz sandPE 20 1.4 2.8 0 0 Syngas 102 1.0 2.2 0.9 5.3Air + N2 95 0 0 1.3 5.3 Water 2.3 0 0.3 0.1 0
Tar 7 0.4 0.4 0.1 0Elutriated fines 0C in the bed 0
Total 115 1.4 2.8 1.3 5.3 Total 111 1.4 2.9 1.1 5.3
Note that a small flow rate of nitrogen is used to facilitate the fuel feeding.
Table 6Mass balance of atomic species for an experimental run with quartz sand as bed material, carried out with air/steam mixture as gasifying medium
In Out
Mass (kg/h) C (kmol/h) H (kmol/h) O (kmol/h) N (kmol/h) Mass (kg/h) C (kmol/h) H (kmol/h) O (kmol/h) N (kmol/h)
Run C: ER = 0.19, quartz sandPE 25 1.8 3.6 0 0 Syngas 88 1.2 2.9 0.7 4Air + N2 75 0 0 1 4 Water 14 0 1.6 0.8 0Steam 12 0 1.3 0.7 0 Tar 8.3 0.6 0.4 0.1 0
Elutriated fines 0C in the bed 0
Total 112 1.8 4.9 1.7 4 Total 110 1.8 4.9 1.6 4
Note that a small flow rate of nitrogen is used to facilitate the fuel feeding.
788 U. Arena et al. / Waste Management 29 (2009) 783–791
reactor exit, and then upstream the scrubber unit, are lower than0.1 kg/h. An increased production of syngas from an average va-lue of about 80 m3
N/h to an average value of about 120 m3N/h
was correspondingly measured. It is likely (Dayton, 2002; Deviet al., 2005) that the iron contained in the olivine activatedthe endothermic tar decomposition reactions: that of thermalcracking (pCxHy ? qCnHm + rH2) and that of carbon formation(CnHm ? nC + m/2H2), where CxHy represents tar and CnHm repre-sents hydrocarbons with a smaller carbon number than CxHy.The great extension of these reactions is in agreement withthe dramatic change in gas composition highlighted by Figs. 2and 3 and with the observed reduction of the reactor tempera-ture. Table 7 schematically reports the mass balances for tworuns carried out with a bed of olivine, at ERs equal to 0.20and 0.27, respectively. The great advantage of the utilization ofolivine is evident: the carbon converted in syngas rises from59% to 65% at the lower ER and from 69% to 81% for operationsat the higher ER. Moreover, all the hydrogen contained in thefuel is transferred to the syngas; accordingly, the increase ofH2 concentrations (from 7–10% to 24–32%) in the syngas pro-duced by runs with olivine (Fig. 3) is particularly impressive.The comparison of balances in Tables 5 and 7 also indicates thatonly for experiments carried out with olivine, a certain amountof carbon was found as a layer covering bed particles or fineselutriated from the reactor and separated by the cyclone(Mastellone and Arena, 2008). Equivalence ratio affects therepartition in the syngas and in the bed of the carbon fed intothe reactor: Fig. 4 indicates an efficiency to operate the gasifierat values around 0.30, for which C is transferred more to syngasrather than to the layer covering bed particles. Carbon also af-fects the equilibrium of the Bouduard reaction and contributesto increase CO concentrations from about 2.5% to 18–20%
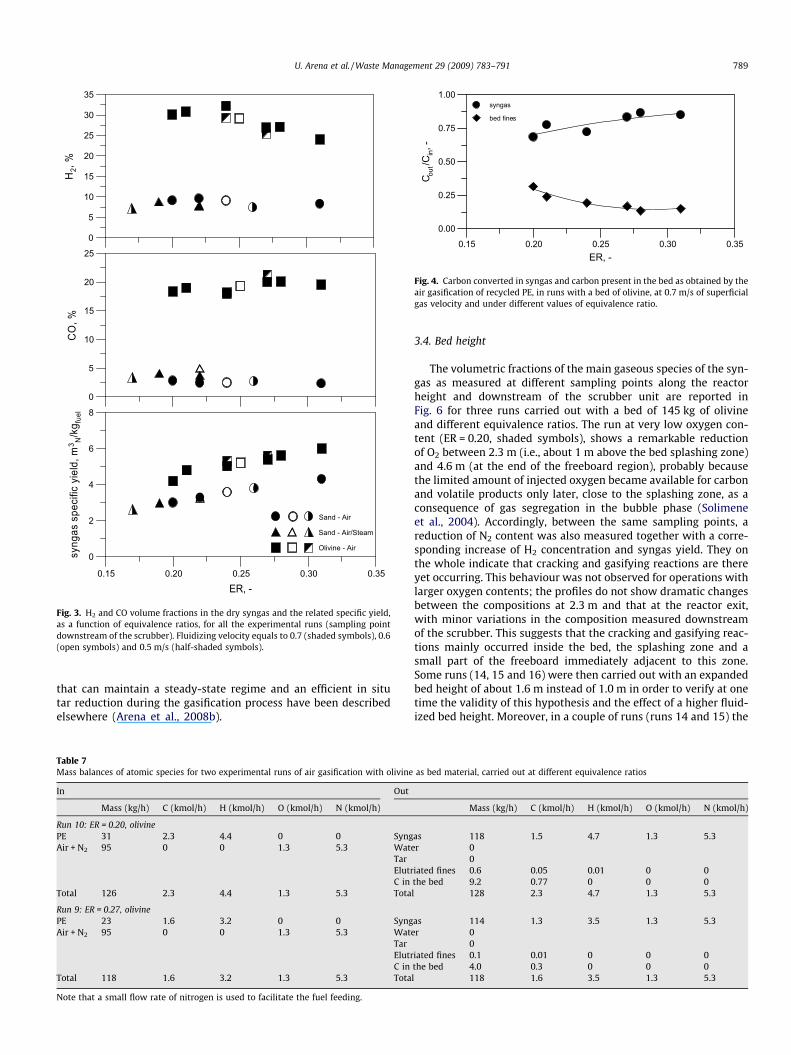
(Fig. 3). The chemical energy of the fuel transferred to the syngasduring operations with olivine increases, from the value of about52% for tests 6 and 7 with quartz sand, up to 71% and 78%,respectively, for tests 10 and 9 carried out at the same valuesof equivalence ratio. Data in Tables 5–7 and those of related en-ergy balances have been used for the schematic representationof Fig. 5, which shows the specific mass and energy inputs andoutputs of the fluidized bed gasifier, for three runs carried atthe same ER but using air or air/steam as gasifying mediumand sand or olivine as bed material (ER = 0.20; runs 7, C and10). It suggests that the utilization of olivine could be consideredthe more promising technique among the primary methodsinvestigated in this study. Its better performance was demon-strated for both the reduction of tar content in the syngas andthe improvement of the overall performance of the plastic wastegasification process. The increase of the values of the two mainparameters of gasifier performance is in fact evident (Table 4),the cold gas efficiency (CGE) and the carbon conversion effi-ciency (CCE). CGE lies in the range 51–56% in the runs withquartz sand and increases to 71–84% in those with olivine;CCE increases from 59–68% to 63–82%, as a direct consequenceof the larger cracking of heavier hydrocarbons, even though itis limited since part of the carbon produced by the cracking cov-ers the bed particles and remains in the reactor or is elutriatedby attrition and collected in the cyclone. It must be highlightedthat this carbon deposition on olivine particles progressively in-creases up to determining a masking effect that inhibits activesites (Mastellone and Arena, 2008). A possible criterion to main-tain catalytic activity is that of a continuous make-up of fresholivine in the gasifier and a contemporaneous removing of thesame flow rate of exhausted material, so that the bed amountremains constant. An algorithm to evaluate this mass flow rate
0
5
10
15
20
25
30
35
H2,
%
0
5
10
15
20
25
CO
, %
0.15 0.20 0.25 0.30 0.35
ER, -
0
2
4
6
8
syng
as s
peci
fic y
ield
, m3 N
/kg fu
el
Sand - Air
Sand - Air/Steam
Olivine - Air
Fig. 3. H2 and CO volume fractions in the dry syngas and the related specific yield,as a function of equivalence ratios, for all the experimental runs (sampling pointdownstream of the scrubber). Fluidizing velocity equals to 0.7 (shaded symbols), 0.6(open symbols) and 0.5 m/s (half-shaded symbols).
0.15 0.20 0.25 0.30 0.35ER, -
0.00
0.25
0.50
0.75
1.00
C out/C
in, -
syngas
bed fines
Fig. 4. Carbon converted in syngas and carbon present in the bed as obtained by theair gasification of recycled PE, in runs with a bed of olivine, at 0.7 m/s of superficialgas velocity and under different values of equivalence ratio.
U. Arena et al. / Waste Management 29 (2009) 783–791 789
that can maintain a steady-state regime and an efficient in situtar reduction during the gasification process have been describedelsewhere (Arena et al., 2008b).
Table 7Mass balances of atomic species for two experimental runs of air gasification with olivine
In Out
Mass (kg/h) C (kmol/h) H (kmol/h) O (kmol/h) N (kmol/h)
Run 10: ER = 0.20, olivinePE 31 2.3 4.4 0 0 SyngAir + N2 95 0 0 1.3 5.3 Wate
TarElutrC in
Total 126 2.3 4.4 1.3 5.3 Tota
Run 9: ER = 0.27, olivinePE 23 1.6 3.2 0 0 SyngAir + N2 95 0 0 1.3 5.3 Wate
TarElutrC in
Total 118 1.6 3.2 1.3 5.3 Tota
Note that a small flow rate of nitrogen is used to facilitate the fuel feeding.
3.4. Bed height
The volumetric fractions of the main gaseous species of the syn-gas as measured at different sampling points along the reactorheight and downstream of the scrubber unit are reported inFig. 6 for three runs carried out with a bed of 145 kg of olivineand different equivalence ratios. The run at very low oxygen con-tent (ER = 0.20, shaded symbols), shows a remarkable reductionof O2 between 2.3 m (i.e., about 1 m above the bed splashing zone)and 4.6 m (at the end of the freeboard region), probably becausethe limited amount of injected oxygen became available for carbonand volatile products only later, close to the splashing zone, as aconsequence of gas segregation in the bubble phase (Solimeneet al., 2004). Accordingly, between the same sampling points, areduction of N2 content was also measured together with a corre-sponding increase of H2 concentration and syngas yield. They onthe whole indicate that cracking and gasifying reactions are thereyet occurring. This behaviour was not observed for operations withlarger oxygen contents; the profiles do not show dramatic changesbetween the compositions at 2.3 m and that at the reactor exit,with minor variations in the composition measured downstreamof the scrubber. This suggests that the cracking and gasifying reac-tions mainly occurred inside the bed, the splashing zone and asmall part of the freeboard immediately adjacent to this zone.Some runs (14, 15 and 16) were then carried out with an expandedbed height of about 1.6 m instead of 1.0 m in order to verify at onetime the validity of this hypothesis and the effect of a higher fluid-ized bed height. Moreover, in a couple of runs (runs 14 and 15) the
as bed material, carried out at different equivalence ratios
Mass (kg/h) C (kmol/h) H (kmol/h) O (kmol/h) N (kmol/h)
as 118 1.5 4.7 1.3 5.3r 0
0iated fines 0.6 0.05 0.01 0 0the bed 9.2 0.77 0 0 0l 128 2.3 4.7 1.3 5.3
as 114 1.3 3.5 1.3 5.3r 0
0iated fines 0.1 0.01 0 0 0the bed 4.0 0.3 0 0 0l 118 1.6 3.5 1.3 5.3
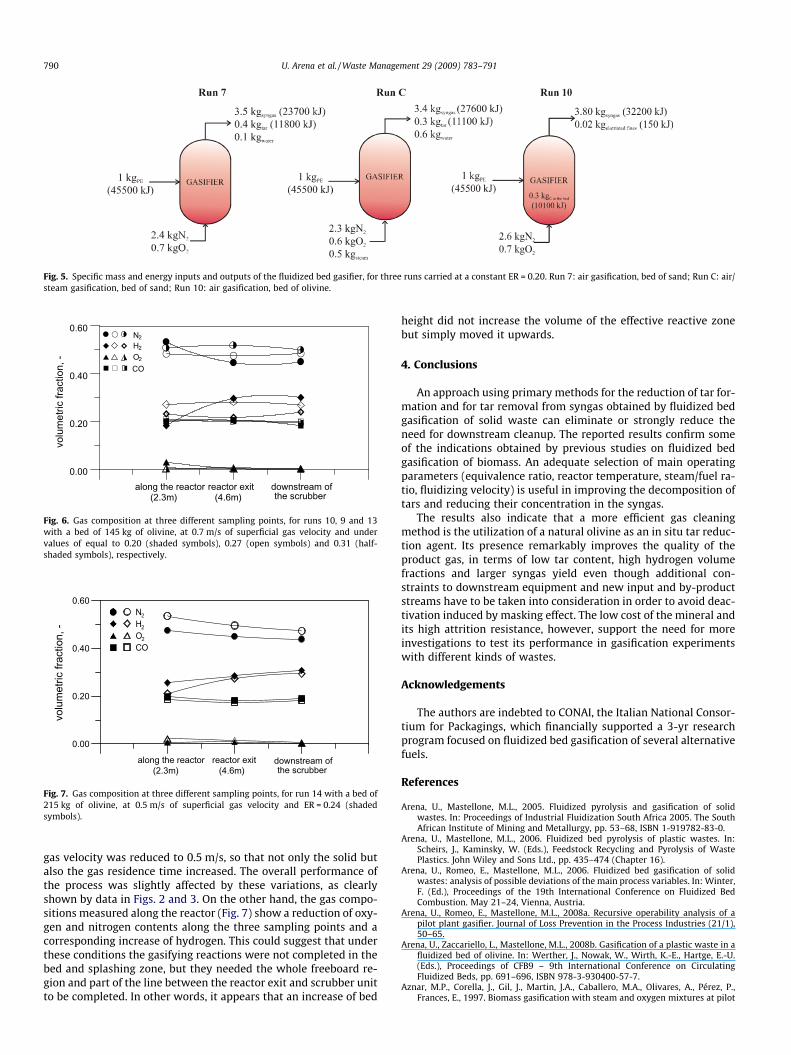
Fig. 5. Specific mass and energy inputs and outputs of the fluidized bed gasifier, for three runs carried at a constant ER = 0.20. Run 7: air gasification, bed of sand; Run C: air/steam gasification, bed of sand; Run 10: air gasification, bed of olivine.
0.00
0.20
0.40
0.60
volu
met
ric fr
actio
n, -
along the reactor(2.3m)
reactor exit(4.6m)
downstream ofthe scrubber
N2H2
O2
CO
Fig. 6. Gas composition at three different sampling points, for runs 10, 9 and 13with a bed of 145 kg of olivine, at 0.7 m/s of superficial gas velocity and undervalues of equal to 0.20 (shaded symbols), 0.27 (open symbols) and 0.31 (half-shaded symbols), respectively.
0.00
0.20
0.40
0.60
volu
met
ric fr
actio
n, -
along the reactor(2.3m)
reactor exit(4.6m)
downstream ofthe scrubber
N2
H2
O2
CO
Fig. 7. Gas composition at three different sampling points, for run 14 with a bed of215 kg of olivine, at 0.5 m/s of superficial gas velocity and ER = 0.24 (shadedsymbols).
790 U. Arena et al. / Waste Management 29 (2009) 783–791
gas velocity was reduced to 0.5 m/s, so that not only the solid butalso the gas residence time increased. The overall performance ofthe process was slightly affected by these variations, as clearlyshown by data in Figs. 2 and 3. On the other hand, the gas compo-sitions measured along the reactor (Fig. 7) show a reduction of oxy-gen and nitrogen contents along the three sampling points and acorresponding increase of hydrogen. This could suggest that underthese conditions the gasifying reactions were not completed in thebed and splashing zone, but they needed the whole freeboard re-gion and part of the line between the reactor exit and scrubber unitto be completed. In other words, it appears that an increase of bed
height did not increase the volume of the effective reactive zonebut simply moved it upwards.
4. Conclusions
An approach using primary methods for the reduction of tar for-mation and for tar removal from syngas obtained by fluidized bedgasification of solid waste can eliminate or strongly reduce theneed for downstream cleanup. The reported results confirm someof the indications obtained by previous studies on fluidized bedgasification of biomass. An adequate selection of main operatingparameters (equivalence ratio, reactor temperature, steam/fuel ra-tio, fluidizing velocity) is useful in improving the decomposition oftars and reducing their concentration in the syngas.
The results also indicate that a more efficient gas cleaningmethod is the utilization of a natural olivine as an in situ tar reduc-tion agent. Its presence remarkably improves the quality of theproduct gas, in terms of low tar content, high hydrogen volumefractions and larger syngas yield even though additional con-straints to downstream equipment and new input and by-productstreams have to be taken into consideration in order to avoid deac-tivation induced by masking effect. The low cost of the mineral andits high attrition resistance, however, support the need for moreinvestigations to test its performance in gasification experimentswith different kinds of wastes.
Acknowledgements
The authors are indebted to CONAI, the Italian National Consor-tium for Packagings, which financially supported a 3-yr researchprogram focused on fluidized bed gasification of several alternativefuels.
References
Arena, U., Mastellone, M.L., 2005. Fluidized pyrolysis and gasification of solidwastes. In: Proceedings of Industrial Fluidization South Africa 2005. The SouthAfrican Institute of Mining and Metallurgy, pp. 53–68, ISBN 1-919782-83-0.
Arena, U., Mastellone, M.L., 2006. Fluidized bed pyrolysis of plastic wastes. In:Scheirs, J., Kaminsky, W. (Eds.), Feedstock Recycling and Pyrolysis of WastePlastics. John Wiley and Sons Ltd., pp. 435–474 (Chapter 16).
Arena, U., Romeo, E., Mastellone, M.L., 2006. Fluidized bed gasification of solidwastes: analysis of possible deviations of the main process variables. In: Winter,F. (Ed.), Proceedings of the 19th International Conference on Fluidized BedCombustion. May 21–24, Vienna, Austria.
Arena, U., Romeo, E., Mastellone, M.L., 2008a. Recursive operability analysis of apilot plant gasifier. Journal of Loss Prevention in the Process Industries (21/1),50–65.
Arena, U., Zaccariello, L., Mastellone, M.L., 2008b. Gasification of a plastic waste in afluidized bed of olivine. In: Werther, J., Nowak, W., Wirth, K.-E., Hartge, E.-U.(Eds.), Proceedings of CFB9 – 9th International Conference on CirculatingFluidized Beds, pp. 691–696, ISBN 978-3-930400-57-7.
Aznar, M.P., Corella, J., Gil, J., Martin, J.A., Caballero, M.A., Olivares, A., Pérez, P.,Frances, E., 1997. Biomass gasification with steam and oxygen mixtures at pilot
U. Arena et al. / Waste Management 29 (2009) 783–791 791
scale and with catalytic gas upgrading Part I: performance of the gasifier. In:Bridgwater, A.V., Boocock, D.G.B. (Eds.), Developments in ThermochemicalBiomass Conversion. Blackie, London, pp. 1194–1208.
Babu, S.P., 2006. Perspectives on Biomass Gasification, Thermal Gasification ofBiomass. IEA Bioenergy Agreement Task 33, Work Shop No.1.
Basu, P., 2006. Combustion and Gasification in Fluidized Beds. CRC Press.Brage, C., Yu, Q., Chen, G., Sjostrom, K., 2000. Tar evolution profiles obtained from
gasification of biomass and coal. Biomass and Bioenergy 18, 87–91.Corella, J., Aznar, M.P., Gil, J., Caballero, M.A., 1999. Biomass gasification in fluidised
bed: where to locate the dolomite to improve gasification? Energy and Fuels 13,1122–1127.
Dayton, D., 2002. A Review of the Literature on Catalytic Biomass Tar Destruction,Milestone Completion Report, NREL/TP-510-32815 (Project No. DE-AC36-99-GO10337). National Energy Laboratory, Golden, Colorado, USA.
Devi, L., Ptasinski, K.J., Janssen, F.J.J.G., 2003. A review of the primary measures fortar elimination in biomass gasification processes. Biomass and Bioenergy 24,125–140.
Devi, L., Craje, M., Thune, P., Ptasinski, K.J., Janssen, F.J.J.G., 2005. Olivine as tarremoval catalyst for biomass gasifier: catalyst characterization. AppliedCatalysis 294, 68–79.
Felder, R.M., Rousseau, R.W., 2000. Elementary Principles of Chemical Processes,third ed. John Wiley and Sons.
Gil, J., Caballero, M.A., Martin, J.A., Aznar, M.P., Corella, J., 1999. Biomass gasificationwith air in a fluidized bed. Effect of the in-bed use of dolomite under differentoperating conditions. Industrial and Engineering Chemistry Research 38, 4226–4235.
Higman, C., van der Burgt, M., 2003. Gasification. Gulf Professional Publishing.Juniper Consultancy Services Ltd., 2007. Pyrolysis and Gasification Factsheet.Kinoshita, C.M., Wang, Y., Zhou, J., 1994. Tar formation under different biomass
gasification conditions. Journal of Analytical and Applied Pyrolysis 29, 169–181.Klein, A., 2002. Gasification: An Alternative Process for Energy Recovery and
Disposal of Municipal Solid Wastes. M.S. Thesis in Earth Resources Engineering,Columbia University.
Klein, A., Whiting, K., Archer, E., Schwager, J., 2004. Gasification and pyrolysis: whatis the current situation for waste management? Waste Management World, 71–75. September.
Livingston, W.R., 2002. Technical and Economic Assessment of Energy ConversionTechnologies for MSW, Report No. B/WM/00553/REP for DTI Sustainable EnergyProgramme PUB URN NO: 02/1347.
Magnolithe Ltd., 2006. Technical Datasheet of Olivine. St. Lorenzen 36, Austria.Malkow, T., 2004. Novel and innovative pyrolysis and gasification technologies for
energy efficient and environmentally sound MSW disposal. Waste Management24, 53–79.
Mastellone, M.L., Arena, U., 2008. Olivine as a tar removal catalyst during fluidizedbed gasification of plastic waste. AIChE Journal 54, 1656–1667.
Milne, T.A., Evans, R.J., Abatzoglou, N., 1998. Biomass Gasifier ‘Tars’: Their Nature,Formation and Conversion, NREL Technical Report (NREL/TP-570-25357).National Energy Laboratory, Golden, Colorado, USA.
Narvaez, I., Orio, A., Aznar, M.P., Corella, J., 1996. Biomass gasification with air in anatmospheric bubbling fluidized bed. Effect of six operational variables on thequality of produced raw gas. Industrial and Engineering Chemistry Research 35,2110–2120.
Neeft, J.P.A., Knoef. Ham, Onaji, P., 1999. Behaviour of tar in biomass gasificationsystem. Novem Report No. 9919. Energy from Waste and Biomass, TheNetherlands.
Nieminen, M., 2004. Fluidized Bed Gasification, Gas Cleaning and Fuel GasUtilization Systems, Thermal Gasification of Biomass (2001–2003). IEABioenergy Agreement Task 33, Technology Brief.
Pfeifer, C., Rauch, R., Hofbauer, H., 2004. In-bed catalytic tar reduction in a dualfluidized bed biomass steam gasifier. Industrial and Engineering ChemistryResearch 43, 1634–1640.
Pinto, F., Franco, C., André, R.N., Tavares, C., Dias, M., Gulyurtlu, I., Cabrita, I., 2003.Effect of experimental conditions on co-gasification of coal, biomass and plasticwastes with air/steam mixtures in a fluidized bed system. Fuel 82, 1967–1976.
Rapagnà, S., Jand, N., Kiennemann, A., Foscolo, P.U., 2000. Steam-gasification ofbiomass in a fluidised-bed of olivine particles. Biomass and Bioenergy 19, 187–197.
Solimene, R., Marzochella, A., Ragucci, R., Salatino, P., 2004. Flow structures and gas-mixing induced by bubble bursting at the surface of an incipiently gas-fluidizedbed. Industrial and Engineering Chemistry Research 43, 5738–5753.
Stiegel, G.J., Maxwell, R.C., 2001. Gasification technologies: the path to clean,affordable energy in the 21st century. Fuel Processing Technology 71, 79–97.


