Embed Size (px)
Citation preview
A
Ma
b
1
IsapapaiPtpaiCcefbbpnta
0h
chemical engineering research and design 9 2 ( 2 0 1 4 ) 471–480
Contents lists available at ScienceDirect
Chemical Engineering Research and Design
j ourna l h omepage: www.elsev ier .com/ locate /cherd
new model for bubbling fluidized bed reactors
.P. Jaina,∗, D. Sathiyamoorthya, V. Govardhana Raob
Bhabha Atomic Research Centre, Mumbai 400085, IndiaIndian Institute of Technology Bombay, Mumbai 400076, India
a b s t r a c t
Various mathematical models have been proposed in the past for estimating the conversions of reactant gases in
fluidized bed reactors. A new mathematical model is being proposed in this paper that gives relatively better results
compared to the prevailing models for bubbling fluidized bed reactors utilizing Geldart B particles. The new model
is named as JSR (Jain, Sathiyamoorthy, Rao) model and it is a modified version of bubble assemblage model of Kato
and Wen (1969). This paper discusses the development of JSR model and its verification by using data from chemical
engineering literature on fluidization and also experimental data from hydrochlorination of silicon in a fluidized bed
reactor. The new model is tested for five processes having operating temperatures from 130 ◦C to 450 ◦C, operating
velocities from 0.019 m s−1 to 0.19 m s−1 and solid particle sizes from 65 to 325 mesh.
© 2013 The Institution of Chemical Engineers. Published by Elsevier B.V. All rights reserved.
Keywords: Fluidization; Modelling; Reactors; Powder; Particles; Compartments
. Introduction
nitially two phase models consisting of bubble and emul-ion phases and then three phase models having one moredditional phase called cloud phase were proposed. Exam-les of two phase models are Davidson and Harrison (1963)nd Patridge and Rowe (1966) models, and examples of threehase models are Kunii and Levenspiel model (1968) and Katond Wen model (1969). Davidson and Harrison model had lim-tations with respect to high interphase mass transfer, andatridge and Rowe model due to excess bubble-cloud areahan actual. Therefore, both the two phase models could notrovide satisfactory results. Models by Fryer and Potter (1972)nd Werther (1980) were proposed. Fryer and Potter models known as countercurrent back-mixing model (CCBM). TheCBM model did not become popular because of the diffi-ulties associated with numerical solutions of the governingquations. The model used constant size bubble while it is aact that bubble diameter changes as it rises in the fluidizeded. Werther (1980) model took an analogy from gas–liquidehaviour. In the this model the reactant gas from the gashase to solid phase is assumed to be transported in a man-er similar to the diffusion of a gas through a thin film intohe bulk of a liquid in a gas–liquid interacting system. Kunii
nd Levenspiel (1968) and Kato and Wen (1969) models have∗ Corresponding author. Tel.: +91 22 25592537.E-mail address: [email protected] (M.P. Jain).Received 3 December 2012; Received in revised form 3 September 201
263-8762/$ – see front matter © 2013 The Institution of Chemical Engittp://dx.doi.org/10.1016/j.cherd.2013.09.006
been popularly used for design of bubbling fluidized bed reac-tors. There is still some scope for improvement for both thesemodels as reported by Chavarie and Grace (1975). A new model(JSR, i.e., Jain, Sathiyamoorthy and Rao) has been proposedto improve and scale up the gas–solid bubbling fluidized bedreactors. The JSR model has been further tested using fourreaction systems, viz. ammoxidation of propylene, hydro-genation of ethylene, oxidation of ammonia, decomposition ofnitrous oxide by using data from chemical engineering litera-ture. All the four reactions are confirmed to have first order asthat of hydrochlorination of silicon metal. Experiments werecarried out by us on hydrochlorination of silicon in a fluidizedbed reactor in order to verify the predictions of the new JSRmodel. Silicon powder used in our experimental work belongsto classification Geldart B. The conversions of reactant gasesin fluidized bed conditions are predicted utilizing JSR, Kuniiand Levenspiel, and Kato and Wen models and compared.
1.1. Minimum fluidization velocity
Minimum fluidization velocity for classification Geldart Bparticles can be evaluated with a good accuracy from the cor-relation of (Delebarre, 2004)
3; Accepted 15 September 2013
24.5Re2mf + 29, 400ε3
mf (1 − εmf )Remf = Ar (1)
neers. Published by Elsevier B.V. All rights reserved.
472 chemical engineering research and design 9 2 ( 2 0 1 4 ) 471–480
Nomenclature
A reactant gasAr Archimedes number, (d3
p�f (�s − �f )g/�g2), –CA concentration of reactant gas in cloud phase,
kg mol m−3
Ce concentration of reactant gas in emulsionphase, kg mol m−3
Cb concentration of reactant gas in bubble phase,kg mol m−3
CE concentration of reactant gas at reactor exit,kg mol m−3
Co concentration of reactant gas at entry of reac-tor, kg mol m−3
Cbh concentration of reactant gas in bubble phaseat height h, kg mol m−3
Cbhi concentration of reactant gas in bubble phaseat height h in ith compartment, kg mol m−3
CEn concentration of reactant gas at exit of nth com-partment, kg mol m−3
CEn−1 concentration of reactant gas at exit of (n − 1)thcompartment, kg mol m−3
D molecular diffusion coefficient of gas, m2 s−1
dbi initial bubble diameter, mdb bubble diameter, mdp particle diameter, mdt reactor ID, mdbm maximum bubble diameter, mF a parameter used in Eq. (5), –g gravitational acceleration, m s−2
�hi height of ith compartment, mID internal diameter of reactor, mKbc volume rate of gas exchange between bubble
and cloud phases per unit bubble volume, s−1
Kbe volume rate of gas exchange between bubbleand emulsion phases per unit bubble volume,s−1
Kbei volume rate of gas exchange between bubbleand emulsion phases in ith compartment perunit bubble volume, s−1
Kce volume rate of gas exchange between cloud-wake and emulsion phase per unit bubblevolume, s−1
Kr apparent fixed bed reaction rate constant,m3/m3 catalyst s−1
Kf apparent fluidized bed reaction rate constant,m3/m3 catalyst s−1
Lmf initial height of the solid bed, mM a parameter defined by Eq. (20)t time, sRemf Reynolds number at minimum fluidization
velocity (Remf = (dpUmf�f/�g)), –Uo, superficial velocity of fluidizing gas, m s−1
Umf superficial gas velocity at incipient fluidization,m s−1
Ub bubble velocity, m s−1
Ubr bubble rise velocity, m s−1
x a parameter defined by Eq. (35) in appendixXA conversion of reactant gas, –XAJSR conversion of reactant gas by JSR model, –XAKL conversion of reactant gas A by Kunii and Lev-
enspiel model, –
XAKW conversion of reactant gas A by bubble assem-blage model, –
˛ a parameter defined by Eq. (9), – ̌ a parameter defined by Eq. (12), –�c ratio of volume of solids in cloud-wake region
to volume of bubbles in bed�e ratio of volume of solids in emulsion phase to
volume of bubbles in bed�b ratio of volume of solids in bubble phase to vol-
ume of bubbles in bedıI bubble fraction of the HCl gas in the ith com-
partment a parameter defined by Eq. (14), –ϕ a parameter defined in Eq. (22), –�s density of solid particle, kg m−3
�f density of the reactant gas, kg m−3
εA fractional change in volume between nil andcomplete conversion of reactant A
εmf fraction of bed at incipient fluidization�g viscosity of the reactant gas, kg m−1 s−1
or,
Remf = [{600ε3mf (1 − εmf )}2 + 0.0408Ar]
0.5− 600ε3
mf (1 − εmf ) (2)
The above equation includes bed voids at minimum fluidiza-tion and helps better prediction of minimum fluidizationvelocity.
2. Development of an improved newmathematical model
Various phases in a bubbling bed model are shown in Fig. 1,and it is similar to Kunii and Levenspiel model. Three phaseshave been considered in the bubbling bed model. The modelconsiders all bubbles of equal size throughout the bed and nocounter-diffusion in the estimation of predicted conversionof the reactant. Kato and Wen (1969) have proposed a modelin which a bubbling bed is divided into several hypotheticalcompartments of different sizes based on factors like particledensity, gas velocity and particle diameter. New model bringsimportant concepts of both Kunii and Levenspiel, and Katoand Wen models together.
Assumptions for new model
1. The model assumes bubbles of perfectly spherical shape.2. It is assumed that in the cloud zone, wake is not a separate
entity.3. The reactant is assumed to diffuse from bubble phase to
emulsion phase.4. In any compartment the mass transfer is assumed to occur
from a bubble of diameter equivalent to the compartmentheight. The emulsion phase is considered to be at incipientstate of fluidization and considered to be well mixed upwith constant voids.
5. The solid particles present in the bubble are neglected andhence the reaction with the gas in the bubble phase isassumed to be nil.
The model is discussed here in five steps as follows,
(i) Derivation of equation for compartment height
chemical engineering research and design 9 2 ( 2 0 1 4 ) 471–480 473
ith
hdWierVs
bp
d
0(
(tfuhp
d
i
1
�
(
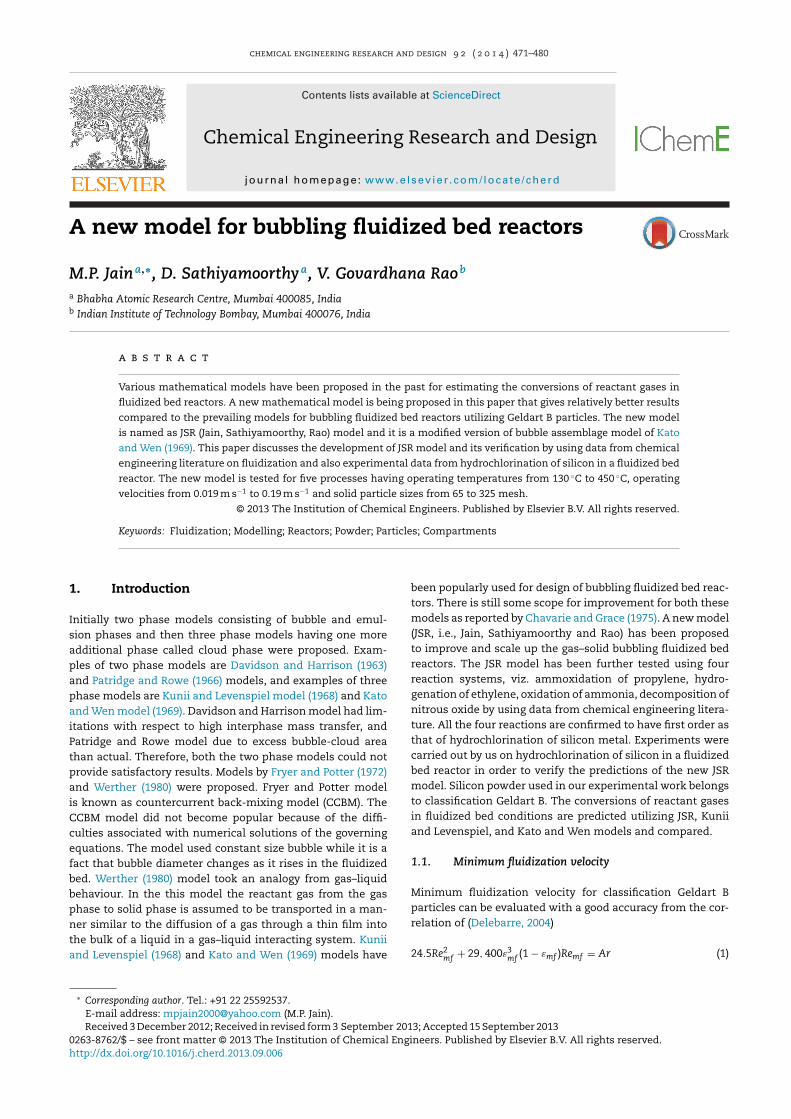
Fig. 1 – Transport of reactant from a bubble to emulsion w
The fluidized bed is assumed to be made up of severalypothetical compartments of size �hi which is same as theiameter of a single bubble in that compartment. Kato anden (1969) have mentioned in their paper that they are apply-
ng Kobayashi et al. (1965) correlation with possibility of somerror in the calculation of compartment height and this cor-elation can be used till a better correlation is found out.ishwanathan et al. (1982) also analysed and expressed theimilar views.
Empirical equation by Mori and Wen (1975) correlated bub-le diameter and reactor tube diameter for Geldart B and Dowders as given below,
bi = dbm − (dbm − do) exp(−0.3h
dt
)(3)
The range of conditions are dt ≤ 1.3 m,.005 ≤ Umf ≤ 0.20 m s−1, 60 ≤ dp ≤ 450 �m,Uo − Umf) ≤ 0.48 m s−1.
Bubble diameter is calculated for ith compartment from Eq.3). Maximum limit for reactor diameter is 1.3 m but accordingo GOLFERS (1982) Eq. (3) can be used for higher diameters alsoor designing and scaling up purposes. This equation will besed to find out compartment height as the bubble diameteras been considered to be equal to the height of ‘i’th com-artment at a particular level in the fluidized bed. Therefore,
bi = �hi for i = 1 to N compartments
Putting the value of dbi in Eq. (3), rearranging and integrat-ng
=∫ hi
hi−1
[1{
dbm − (dbm − do) exp(−0.3h
dt
)}]dh (4)
Taking, (0.3/dt) = p and (1 − (do/dbm))exp(phi−1) = F.On simplifying (details are given in the appendix),
hi =(
1p
)ln [F + (1 − F) exp(pdbm)] (5)
ii) Developing an expression for mass transfer of reactant gas‘A’ from bubble to cloud and cloud to emulsion
a hypothetical compartment of partitioned gas fluidized.
(a) Mass balance of reactant gas A over the cloudphase in a particular compartment: Transfer of A to cloudwake = reaction in cloud wake + transfer of A to emulsion
Kbc(Cb − Cc) = �cKrCc + Kce(Cc − Ce) (6)
Symbols have their usual meaning and have beendescribed in nomenclature.
No counter diffusion and no bulk flow are considered herein the above equation.
(b) Mass balance of A over the emulsion phase in a particu-lar compartment: Transfer of A to emulsion = reaction of A inemulsion
Kce(Cc − Ce) = �eKrCe (7)
or
Ce = KceCc(�eKr + Kce)
(8)
or,
Ce = ˛Cc (9)
From Eq. (6),
KbcCb = Cc{�cKr + Kce(1 − ˛) + Kbc} (10)
Therefore,
Cc = CbKbc{�cKr + Kce(1 − ˛) + Kbc}
(11)
or
Cc = ˇCb (12)
Therefore,
Ce = ˛ˇCb (13)
Taking, ˛ ̌ =
Ce = Cb (14)
474 chemical engineering research and design 9 2 ( 2 0 1 4 ) 471–480
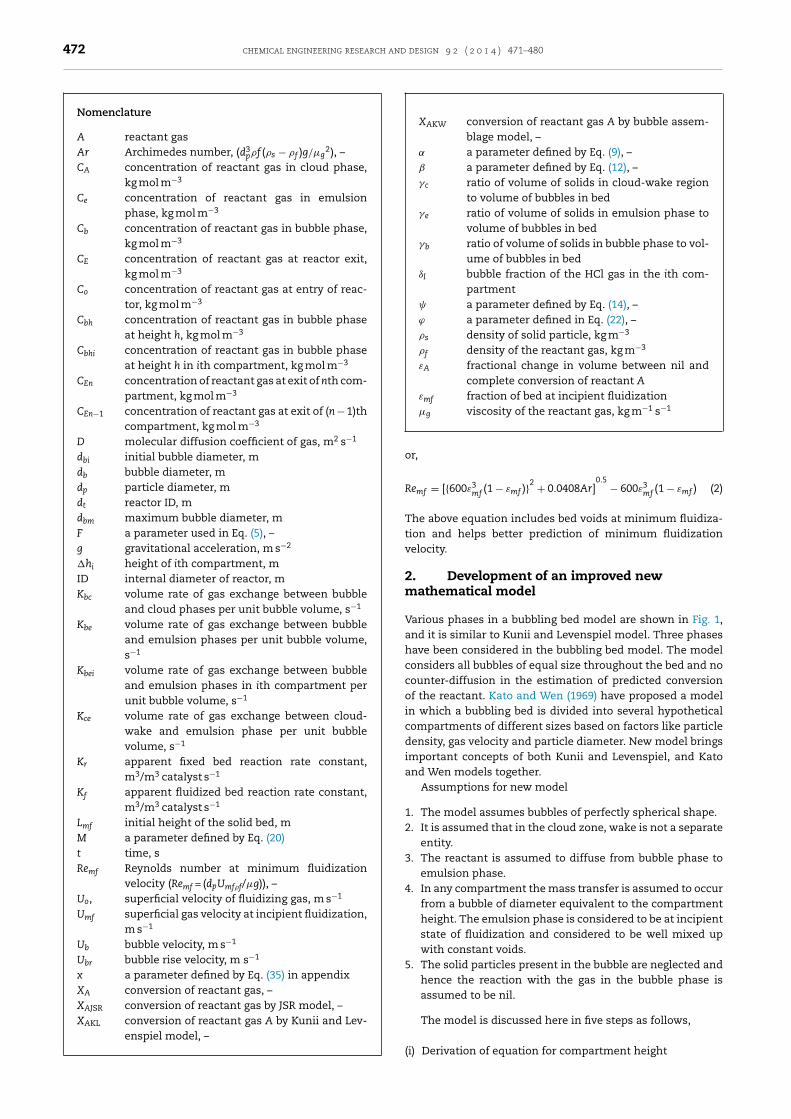
Fig. 2 – Reactant gas flow through a compartment in a
The terms ̨ and ̌ are calculated from the values of Kbc, Kce,�c, �e and Kr.
Kbc and Kce are calculated similar to the model of Kunii andLevenspiel and correlations are given below,
Kbc = 4.5Umf
db+ 5.85
(D0.5 g
0.25
d1.25b
)(15)
and
Kce = 6.77
(Umf DUbr
d3b
)(16)
(iii) Estimation of bubble phase exit concentration of A
Mass balance in bubble phase in �hi size compartment
Rate of change of reactant concentration in the bubbles
= Loss of reactant by exchange to emulsion
Solid particles inside the bubbles are neglected and it isit is assumed that no reaction takes place in bubbles. Onlybubble to emulsion reaction takes place for reactant gas A inthe compartment ‘i’
dCbdt
= −Kbe(Cb − Ce) (17)
(Here, for a particular compartment ‘i’, (1/Kbe) = (1/Kbc) + (1/Kce))
dCb = −Kbe(Cb − Ce)dt (18)
Putting the value of Ce from Eq. (14) and value of dt by itsdefinition in Eq. (18)
dCb = −Kbe(Cb − Cb)dhUbr
(19)
Integrating, and taking, ((Kbe(1 − ))/Ubr) = M
CbCo
= exp(−M �hi) (20)
(iv) Exit concentration for reactant A from the ith compart-ment
Referring to Fig. 2 mass balance for reactant gas A is givenbelow. Only bubble and emulsion phases are considered hereand gas volume in cloud phase is negligible
UoCECo
= Umf Ce
Co+ (Uo − Umf )Cb
Co(21)
Taking, ((Uo − Umf)/Uo) = ϕ
CECo
{(1 − ϕ) + ϕ}(CbCo
)(22)
For each compartment
CEiCo
= {(1 − ϕ) + ϕ}(CbiCo
)(23)
fluidized bed.
or,
CEiCo
= {(1 − ϕ) + ϕ} exp(−M �hi) (24)
(v) Evaluation of overall conversion
Concentration of reactant A exiting after all the ‘n’ numberof compartments, i.e., whole reactor is estimated as
CECo
=(CE1
Co
) (CE2
CE1
) (CE3
CE2
)· · ·
(CEnCEn−1
)(25)
Then conversion of reactant gas A is found out as given below,
XA =(
1 − CECo
)(26)
Eq. (26) is to be used along with other equations given abovefor finding out overall conversion of a gaseous reactant in afluidized bed reactor.
The model can be used for gas–solid bubbling fluidizedbed reactors involving Geldart B particles. Data from litera-ture for four processes utilizing fluidized bed reactors havebeen tested particularly oxidation of ammonia, ammoxida-tion of propylene, hydrogenation of ethylene and nitrousoxide decomposition and also our experimental data forhydrochlorination of silicon. It was found that JSR model givessatisfactory results compared to other prevailing models.
3. Verification of new model by takingexperimental data from literature
Data for four chemical reactions published in literature hasbeen picked up to study the universality of JSR model. Theproperties of the materials used and flow rates of reactants areconverted from standard conditions to operating conditions.
Data from experimental work for hydrochlorination of siliconis used as a fifth case for testing JSR model.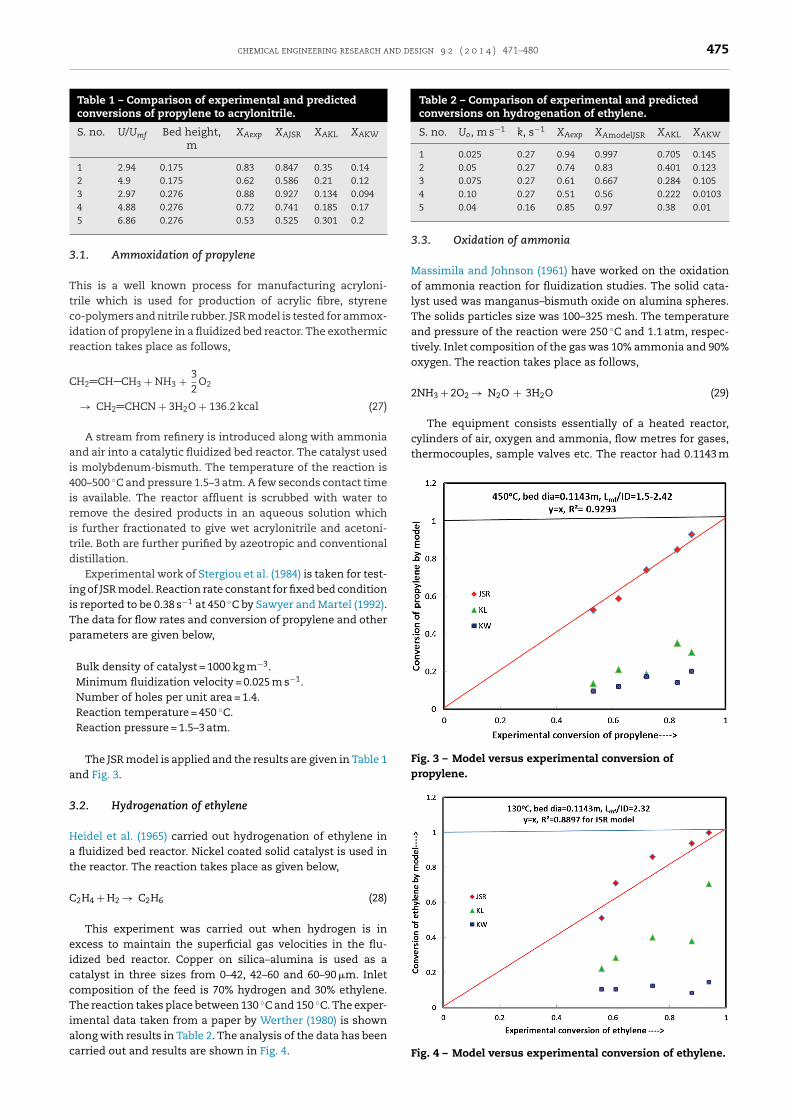
chemical engineering research and design 9 2 ( 2 0 1 4 ) 471–480 475
Table 1 – Comparison of experimental and predictedconversions of propylene to acrylonitrile.
S. no. U/Umf Bed height,m
XAexp XAJSR XAKL XAKW
1 2.94 0.175 0.83 0.847 0.35 0.142 4.9 0.175 0.62 0.586 0.21 0.123 2.97 0.276 0.88 0.927 0.134 0.0944 4.88 0.276 0.72 0.741 0.185 0.175 6.86 0.276 0.53 0.525 0.301 0.2
3
Ttcir
C
ai4iritd
iiTp
a
3
Hat
C
eiccTiac
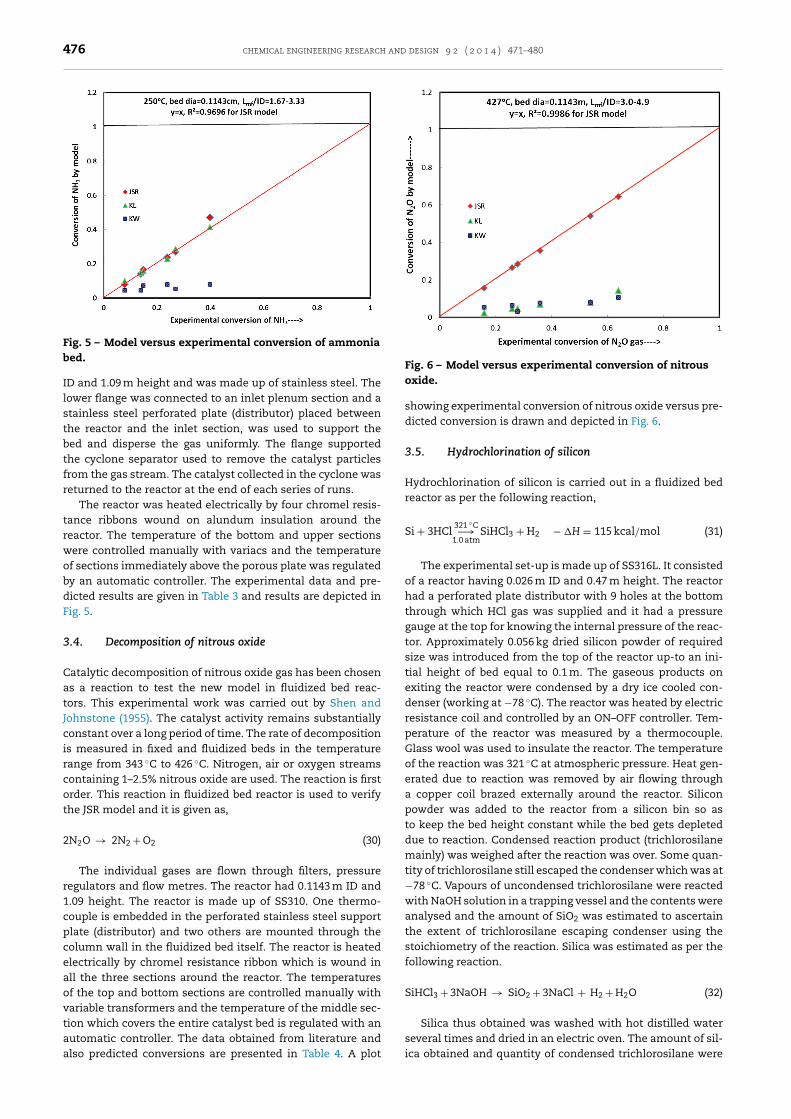
Table 2 – Comparison of experimental and predictedconversions on hydrogenation of ethylene.
S. no. Uo, m s−1 k, s−1 XAexp XAmodelJSR XAKL XAKW
1 0.025 0.27 0.94 0.997 0.705 0.1452 0.05 0.27 0.74 0.83 0.401 0.1233 0.075 0.27 0.61 0.667 0.284 0.1054 0.10 0.27 0.51 0.56 0.222 0.0103
cylinders of air, oxygen and ammonia, flow metres for gases,thermocouples, sample valves etc. The reactor had 0.1143 m
Fig. 3 – Model versus experimental conversion ofpropylene.
.1. Ammoxidation of propylene
his is a well known process for manufacturing acryloni-rile which is used for production of acrylic fibre, styreneo-polymers and nitrile rubber. JSR model is tested for ammox-dation of propylene in a fluidized bed reactor. The exothermiceaction takes place as follows,
H2 CH CH3 + NH3 + 32
O2
→ CH2 CHCN + 3H2O + 136.2 kcal (27)
A stream from refinery is introduced along with ammoniand air into a catalytic fluidized bed reactor. The catalyst useds molybdenum-bismuth. The temperature of the reaction is00–500 ◦C and pressure 1.5–3 atm. A few seconds contact times available. The reactor affluent is scrubbed with water toemove the desired products in an aqueous solution whichs further fractionated to give wet acrylonitrile and acetoni-rile. Both are further purified by azeotropic and conventionalistillation.
Experimental work of Stergiou et al. (1984) is taken for test-ng of JSR model. Reaction rate constant for fixed bed conditions reported to be 0.38 s−1 at 450 ◦C by Sawyer and Martel (1992).he data for flow rates and conversion of propylene and otherarameters are given below,
Bulk density of catalyst = 1000 kg m−3.Minimum fluidization velocity = 0.025 m s−1.Number of holes per unit area = 1.4.Reaction temperature = 450 ◦C.Reaction pressure = 1.5–3 atm.
The JSR model is applied and the results are given in Table 1nd Fig. 3.
.2. Hydrogenation of ethylene
eidel et al. (1965) carried out hydrogenation of ethylene in fluidized bed reactor. Nickel coated solid catalyst is used inhe reactor. The reaction takes place as given below,
2H4 + H2 → C2H6 (28)
This experiment was carried out when hydrogen is inxcess to maintain the superficial gas velocities in the flu-dized bed reactor. Copper on silica–alumina is used as aatalyst in three sizes from 0–42, 42–60 and 60–90 �m. Inletomposition of the feed is 70% hydrogen and 30% ethylene.he reaction takes place between 130 ◦C and 150 ◦C. The exper-
mental data taken from a paper by Werther (1980) is shown
long with results in Table 2. The analysis of the data has beenarried out and results are shown in Fig. 4.5 0.04 0.16 0.85 0.97 0.38 0.01
3.3. Oxidation of ammonia
Massimila and Johnson (1961) have worked on the oxidationof ammonia reaction for fluidization studies. The solid cata-lyst used was manganus–bismuth oxide on alumina spheres.The solids particles size was 100–325 mesh. The temperatureand pressure of the reaction were 250 ◦C and 1.1 atm, respec-tively. Inlet composition of the gas was 10% ammonia and 90%oxygen. The reaction takes place as follows,
2NH3 + 2O2 → N2O + 3H2O (29)
The equipment consists essentially of a heated reactor,
Fig. 4 – Model versus experimental conversion of ethylene.
476 chemical engineering research and design 9 2 ( 2 0 1 4 ) 471–480
Fig. 5 – Model versus experimental conversion of ammonia
Fig. 6 – Model versus experimental conversion of nitrous
bed.ID and 1.09 m height and was made up of stainless steel. Thelower flange was connected to an inlet plenum section and astainless steel perforated plate (distributor) placed betweenthe reactor and the inlet section, was used to support thebed and disperse the gas uniformly. The flange supportedthe cyclone separator used to remove the catalyst particlesfrom the gas stream. The catalyst collected in the cyclone wasreturned to the reactor at the end of each series of runs.
The reactor was heated electrically by four chromel resis-tance ribbons wound on alundum insulation around thereactor. The temperature of the bottom and upper sectionswere controlled manually with variacs and the temperatureof sections immediately above the porous plate was regulatedby an automatic controller. The experimental data and pre-dicted results are given in Table 3 and results are depicted inFig. 5.
3.4. Decomposition of nitrous oxide
Catalytic decomposition of nitrous oxide gas has been chosenas a reaction to test the new model in fluidized bed reac-tors. This experimental work was carried out by Shen andJohnstone (1955). The catalyst activity remains substantiallyconstant over a long period of time. The rate of decompositionis measured in fixed and fluidized beds in the temperaturerange from 343 ◦C to 426 ◦C. Nitrogen, air or oxygen streamscontaining 1–2.5% nitrous oxide are used. The reaction is firstorder. This reaction in fluidized bed reactor is used to verifythe JSR model and it is given as,
2N2O → 2N2 + O2 (30)
The individual gases are flown through filters, pressureregulators and flow metres. The reactor had 0.1143 m ID and1.09 height. The reactor is made up of SS310. One thermo-couple is embedded in the perforated stainless steel supportplate (distributor) and two others are mounted through thecolumn wall in the fluidized bed itself. The reactor is heatedelectrically by chromel resistance ribbon which is wound inall the three sections around the reactor. The temperaturesof the top and bottom sections are controlled manually withvariable transformers and the temperature of the middle sec-tion which covers the entire catalyst bed is regulated with an
automatic controller. The data obtained from literature andalso predicted conversions are presented in Table 4. A plotoxide.
showing experimental conversion of nitrous oxide versus pre-dicted conversion is drawn and depicted in Fig. 6.
3.5. Hydrochlorination of silicon
Hydrochlorination of silicon is carried out in a fluidized bedreactor as per the following reaction,
Si + 3HCl321 ◦C−→1.0 atm
SiHCl3 + H2 − �H = 115 kcal/mol (31)
The experimental set-up is made up of SS316L. It consistedof a reactor having 0.026 m ID and 0.47 m height. The reactorhad a perforated plate distributor with 9 holes at the bottomthrough which HCl gas was supplied and it had a pressuregauge at the top for knowing the internal pressure of the reac-tor. Approximately 0.056 kg dried silicon powder of requiredsize was introduced from the top of the reactor up-to an ini-tial height of bed equal to 0.1 m. The gaseous products onexiting the reactor were condensed by a dry ice cooled con-denser (working at −78 ◦C). The reactor was heated by electricresistance coil and controlled by an ON–OFF controller. Tem-perature of the reactor was measured by a thermocouple.Glass wool was used to insulate the reactor. The temperatureof the reaction was 321 ◦C at atmospheric pressure. Heat gen-erated due to reaction was removed by air flowing througha copper coil brazed externally around the reactor. Siliconpowder was added to the reactor from a silicon bin so asto keep the bed height constant while the bed gets depleteddue to reaction. Condensed reaction product (trichlorosilanemainly) was weighed after the reaction was over. Some quan-tity of trichlorosilane still escaped the condenser which was at−78 ◦C. Vapours of uncondensed trichlorosilane were reactedwith NaOH solution in a trapping vessel and the contents wereanalysed and the amount of SiO2 was estimated to ascertainthe extent of trichlorosilane escaping condenser using thestoichiometry of the reaction. Silica was estimated as per thefollowing reaction.
SiHCl3 + 3NaOH → SiO2 + 3NaCl + H2 + H2O (32)
Silica thus obtained was washed with hot distilled water
several times and dried in an electric oven. The amount of sil-ica obtained and quantity of condensed trichlorosilane were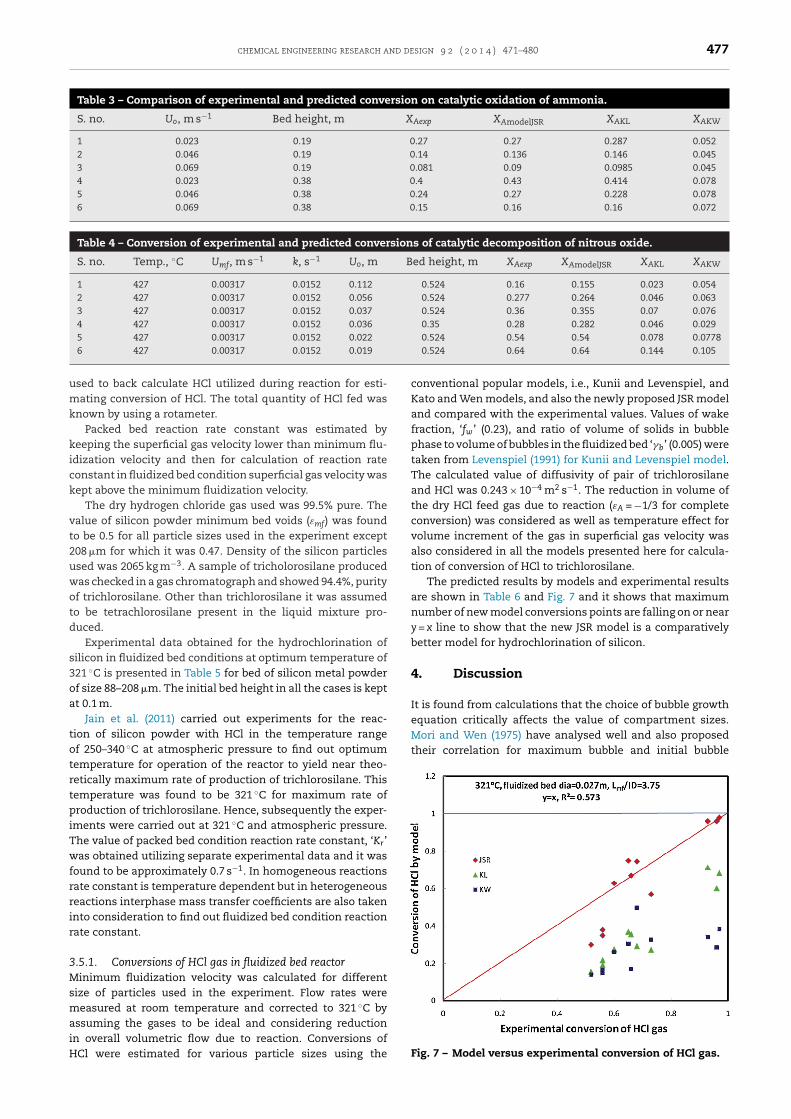
chemical engineering research and design 9 2 ( 2 0 1 4 ) 471–480 477
Table 3 – Comparison of experimental and predicted conversion on catalytic oxidation of ammonia.
S. no. Uo, m s−1 Bed height, m XAexp XAmodelJSR XAKL XAKW
1 0.023 0.19 0.27 0.27 0.287 0.0522 0.046 0.19 0.14 0.136 0.146 0.0453 0.069 0.19 0.081 0.09 0.0985 0.0454 0.023 0.38 0.4 0.43 0.414 0.0785 0.046 0.38 0.24 0.27 0.228 0.0786 0.069 0.38 0.15 0.16 0.16 0.072
Table 4 – Conversion of experimental and predicted conversions of catalytic decomposition of nitrous oxide.
S. no. Temp., ◦C Umf, m s−1 k, s−1 Uo, m Bed height, m XAexp XAmodelJSR XAKL XAKW
1 427 0.00317 0.0152 0.112 0.524 0.16 0.155 0.023 0.0542 427 0.00317 0.0152 0.056 0.524 0.277 0.264 0.046 0.0633 427 0.00317 0.0152 0.037 0.524 0.36 0.355 0.07 0.0764 427 0.00317 0.0152 0.036 0.35 0.28 0.282 0.046 0.0295 427 0.00317 0.0152 0.022 0.524 0.54 0.54 0.078 0.0778
umk
kick
vt2uwotd
s3oa
totrtpiTwfrrir
3MsmaiH
Mori and Wen (1975) have analysed well and also proposedtheir correlation for maximum bubble and initial bubble
6 427 0.00317 0.0152 0.019
sed to back calculate HCl utilized during reaction for esti-ating conversion of HCl. The total quantity of HCl fed was
nown by using a rotameter.Packed bed reaction rate constant was estimated by
eeping the superficial gas velocity lower than minimum flu-dization velocity and then for calculation of reaction rateonstant in fluidized bed condition superficial gas velocity wasept above the minimum fluidization velocity.
The dry hydrogen chloride gas used was 99.5% pure. Thealue of silicon powder minimum bed voids (εmf) was foundo be 0.5 for all particle sizes used in the experiment except08 �m for which it was 0.47. Density of the silicon particlessed was 2065 kg m−3. A sample of tricholorosilane producedas checked in a gas chromatograph and showed 94.4%, purityf trichlorosilane. Other than trichlorosilane it was assumedo be tetrachlorosilane present in the liquid mixture pro-uced.
Experimental data obtained for the hydrochlorination ofilicon in fluidized bed conditions at optimum temperature of21 ◦C is presented in Table 5 for bed of silicon metal powderf size 88–208 �m. The initial bed height in all the cases is keptt 0.1 m.
Jain et al. (2011) carried out experiments for the reac-ion of silicon powder with HCl in the temperature rangef 250–340 ◦C at atmospheric pressure to find out optimumemperature for operation of the reactor to yield near theo-etically maximum rate of production of trichlorosilane. Thisemperature was found to be 321 ◦C for maximum rate ofroduction of trichlorosilane. Hence, subsequently the exper-
ments were carried out at 321 ◦C and atmospheric pressure.he value of packed bed condition reaction rate constant, ‘Kr’as obtained utilizing separate experimental data and it was
ound to be approximately 0.7 s−1. In homogeneous reactionsate constant is temperature dependent but in heterogeneouseactions interphase mass transfer coefficients are also takennto consideration to find out fluidized bed condition reactionate constant.
.5.1. Conversions of HCl gas in fluidized bed reactorinimum fluidization velocity was calculated for different
ize of particles used in the experiment. Flow rates wereeasured at room temperature and corrected to 321 ◦C by
ssuming the gases to be ideal and considering reduction
n overall volumetric flow due to reaction. Conversions ofCl were estimated for various particle sizes using the0.524 0.64 0.64 0.144 0.105
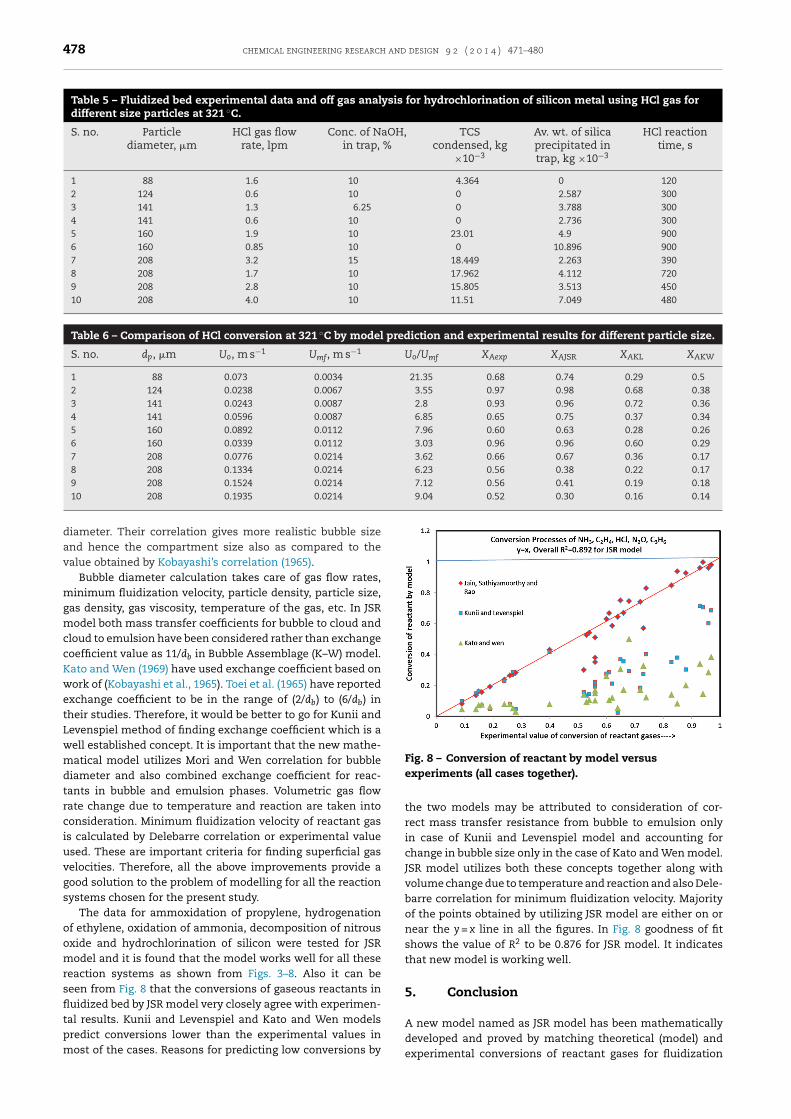
conventional popular models, i.e., Kunii and Levenspiel, andKato and Wen models, and also the newly proposed JSR modeland compared with the experimental values. Values of wakefraction, ‘fw’ (0.23), and ratio of volume of solids in bubblephase to volume of bubbles in the fluidized bed ‘�b’ (0.005) weretaken from Levenspiel (1991) for Kunii and Levenspiel model.The calculated value of diffusivity of pair of trichlorosilaneand HCl was 0.243 × 10⁻⁴ m2 s−1. The reduction in volume ofthe dry HCl feed gas due to reaction (εA = −1/3 for completeconversion) was considered as well as temperature effect forvolume increment of the gas in superficial gas velocity wasalso considered in all the models presented here for calcula-tion of conversion of HCl to trichlorosilane.
The predicted results by models and experimental resultsare shown in Table 6 and Fig. 7 and it shows that maximumnumber of new model conversions points are falling on or neary = x line to show that the new JSR model is a comparativelybetter model for hydrochlorination of silicon.
4. Discussion
It is found from calculations that the choice of bubble growthequation critically affects the value of compartment sizes.
Fig. 7 – Model versus experimental conversion of HCl gas.
478 chemical engineering research and design 9 2 ( 2 0 1 4 ) 471–480
Table 5 – Fluidized bed experimental data and off gas analysis for hydrochlorination of silicon metal using HCl gas fordifferent size particles at 321 ◦C.
S. no. Particlediameter, �m
HCl gas flowrate, lpm
Conc. of NaOH,in trap, %
TCScondensed, kg
×10−3
Av. wt. of silicaprecipitated intrap, kg ×10−3
HCl reactiontime, s
1 88 1.6 10 4.364 0 1202 124 0.6 10 0 2.587 3003 141 1.3 6.25 0 3.788 3004 141 0.6 10 0 2.736 3005 160 1.9 10 23.01 4.9 9006 160 0.85 10 0 10.896 9007 208 3.2 15 18.449 2.263 3908 208 1.7 10 17.962 4.112 7209 208 2.8 10 15.805 3.513 45010 208 4.0 10 11.51 7.049 480
Table 6 – Comparison of HCl conversion at 321 ◦C by model prediction and experimental results for different particle size.
S. no. dp, �m Uo, m s−1 Umf, m s−1 Uo/Umf XAexp XAJSR XAKL XAKW
1 88 0.073 0.0034 21.35 0.68 0.74 0.29 0.52 124 0.0238 0.0067 3.55 0.97 0.98 0.68 0.383 141 0.0243 0.0087 2.8 0.93 0.96 0.72 0.364 141 0.0596 0.0087 6.85 0.65 0.75 0.37 0.345 160 0.0892 0.0112 7.96 0.60 0.63 0.28 0.266 160 0.0339 0.0112 3.03 0.96 0.96 0.60 0.297 208 0.0776 0.0214 3.62 0.66 0.67 0.36 0.178 208 0.1334 0.0214 6.23 0.56 0.38 0.22 0.179 208 0.1524 0.0214 7.12 0.56 0.41 0.19 0.1810 208 0.1935 0.0214 9.04 0.52 0.30 0.16 0.14
Fig. 8 – Conversion of reactant by model versus
diameter. Their correlation gives more realistic bubble sizeand hence the compartment size also as compared to thevalue obtained by Kobayashi’s correlation (1965).
Bubble diameter calculation takes care of gas flow rates,minimum fluidization velocity, particle density, particle size,gas density, gas viscosity, temperature of the gas, etc. In JSRmodel both mass transfer coefficients for bubble to cloud andcloud to emulsion have been considered rather than exchangecoefficient value as 11/db in Bubble Assemblage (K–W) model.Kato and Wen (1969) have used exchange coefficient based onwork of (Kobayashi et al., 1965). Toei et al. (1965) have reportedexchange coefficient to be in the range of (2/db) to (6/db) intheir studies. Therefore, it would be better to go for Kunii andLevenspiel method of finding exchange coefficient which is awell established concept. It is important that the new mathe-matical model utilizes Mori and Wen correlation for bubblediameter and also combined exchange coefficient for reac-tants in bubble and emulsion phases. Volumetric gas flowrate change due to temperature and reaction are taken intoconsideration. Minimum fluidization velocity of reactant gasis calculated by Delebarre correlation or experimental valueused. These are important criteria for finding superficial gasvelocities. Therefore, all the above improvements provide agood solution to the problem of modelling for all the reactionsystems chosen for the present study.
The data for ammoxidation of propylene, hydrogenationof ethylene, oxidation of ammonia, decomposition of nitrousoxide and hydrochlorination of silicon were tested for JSRmodel and it is found that the model works well for all thesereaction systems as shown from Figs. 3–8. Also it can beseen from Fig. 8 that the conversions of gaseous reactants influidized bed by JSR model very closely agree with experimen-tal results. Kunii and Levenspiel and Kato and Wen models
predict conversions lower than the experimental values inmost of the cases. Reasons for predicting low conversions byexperiments (all cases together).
the two models may be attributed to consideration of cor-rect mass transfer resistance from bubble to emulsion onlyin case of Kunii and Levenspiel model and accounting forchange in bubble size only in the case of Kato and Wen model.JSR model utilizes both these concepts together along withvolume change due to temperature and reaction and also Dele-barre correlation for minimum fluidization velocity. Majorityof the points obtained by utilizing JSR model are either on ornear the y = x line in all the figures. In Fig. 8 goodness of fitshows the value of R2 to be 0.876 for JSR model. It indicatesthat new model is working well.
5. Conclusion
A new model named as JSR model has been mathematically
developed and proved by matching theoretical (model) andexperimental conversions of reactant gases for fluidization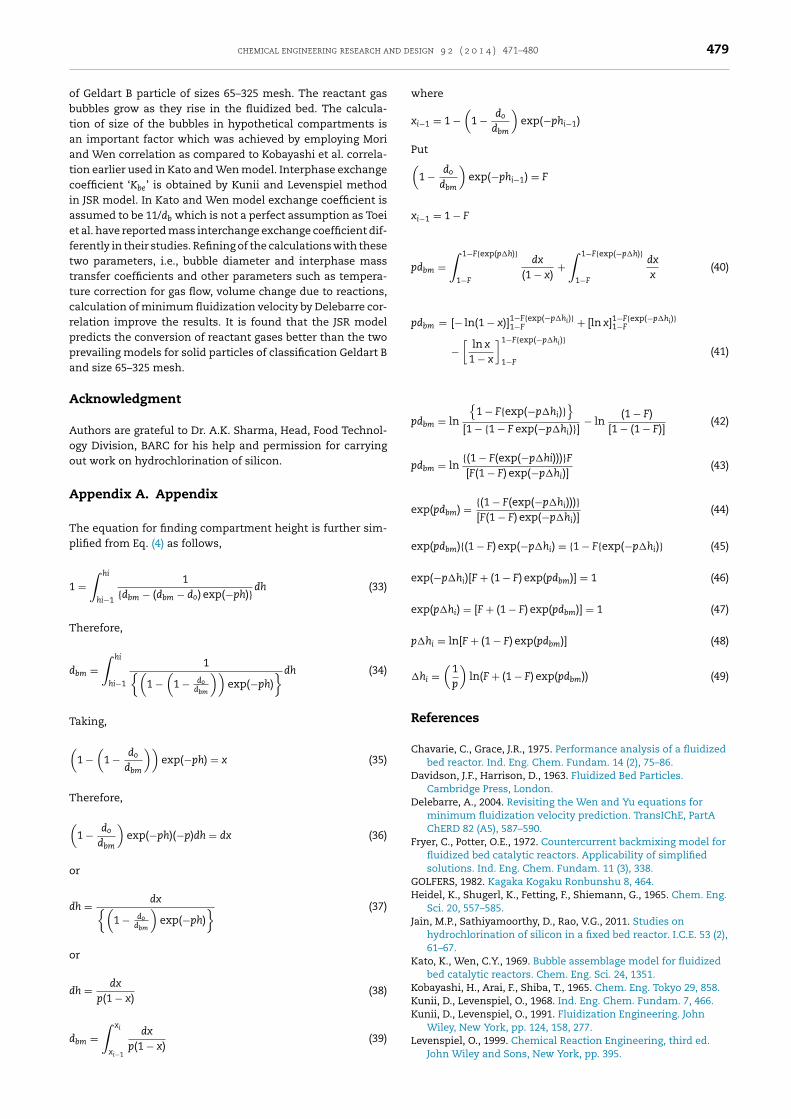
chemical engineering research and design 9 2 ( 2 0 1 4 ) 471–480 479
obtaatciaeftttcrppa
A
Aoo
A
Tp
1
T
d
T
(
T
(o
d
o
d
d
Kunii, D., Levenspiel, O., 1968. Ind. Eng. Chem. Fundam. 7, 466.Kunii, D., Levenspiel, O., 1991. Fluidization Engineering. John
Wiley, New York, pp. 124, 158, 277.
f Geldart B particle of sizes 65–325 mesh. The reactant gasubbles grow as they rise in the fluidized bed. The calcula-ion of size of the bubbles in hypothetical compartments isn important factor which was achieved by employing Morind Wen correlation as compared to Kobayashi et al. correla-ion earlier used in Kato and Wen model. Interphase exchangeoefficient ‘Kbe’ is obtained by Kunii and Levenspiel methodn JSR model. In Kato and Wen model exchange coefficient isssumed to be 11/db which is not a perfect assumption as Toeit al. have reported mass interchange exchange coefficient dif-erently in their studies. Refining of the calculations with thesewo parameters, i.e., bubble diameter and interphase massransfer coefficients and other parameters such as tempera-ure correction for gas flow, volume change due to reactions,alculation of minimum fluidization velocity by Delebarre cor-elation improve the results. It is found that the JSR modelredicts the conversion of reactant gases better than the tworevailing models for solid particles of classification Geldart Bnd size 65–325 mesh.
cknowledgment
uthors are grateful to Dr. A.K. Sharma, Head, Food Technol-gy Division, BARC for his help and permission for carryingut work on hydrochlorination of silicon.
ppendix A. Appendix
he equation for finding compartment height is further sim-lified from Eq. (4) as follows,
=∫ hi
hi−1
1{dbm − (dbm − do) exp(−ph)}dh (33)
herefore,
bm =∫ hi
hi−1
1{(1 −
(1 − do
dbm
))exp(−ph)
}dh (34)
aking,
1 −(
1 − dodbm
))exp(−ph) = x (35)
herefore,
1 − dodbm
)exp(−ph)(−p)dh = dx (36)
r
h = dx{(1 − do
dbm
)exp(−ph)
} (37)
r
h = dx
p(1 − x)(38)
∫ xi
bm =xi−1
dx
p(1 − x)(39)
where
xi−1 = 1 −(
1 − dodbm
)exp(−phi−1)
Put(1 − do
dbm
)exp(−phi−1) = F
xi−1 = 1 − F
pdbm =∫ 1−F{exp(p�h)}
1−F
dx
(1 − x)+
∫ 1−F{exp(−p�h)}
1−F
dx
x(40)
pdbm = [− ln(1 − x)]1−F{exp(−p�hi)}1−F + [ln x]1−F{exp(−p�hi)}
1−F
−[
ln x
1 − x
]1−F{exp(−p�hi)}
1−F(41)
pdbm = ln
{1 − F{exp(−p�hi)}
}[1 − {1 − F exp(−p�hi)}]
− ln(1 − F)
[1 − (1 − F)](42)
pdbm = ln{(1 − F(exp(−p�hi)))}F[F(1 − F) exp(−p�hi)]
(43)
exp(pdbm) = {(1 − F(exp(−p�hi)))}[F(1 − F) exp(−p�hi)]
(44)
exp(pdbm){(1 − F) exp(−p�hi) = {1 − F{exp(−p�hi)} (45)
exp(−p�hi)[F + (1 − F) exp(pdbm)] = 1 (46)
exp(p�hi) = [F + (1 − F) exp(pdbm)] = 1 (47)
p�hi = ln[F + (1 − F) exp(pdbm)] (48)
�hi =(
1p
)ln(F + (1 − F) exp(pdbm)) (49)
References
Chavarie, C., Grace, J.R., 1975. Performance analysis of a fluidizedbed reactor. Ind. Eng. Chem. Fundam. 14 (2), 75–86.
Davidson, J.F., Harrison, D., 1963. Fluidized Bed Particles.Cambridge Press, London.
Delebarre, A., 2004. Revisiting the Wen and Yu equations forminimum fluidization velocity prediction. TransIChE, PartAChERD 82 (A5), 587–590.
Fryer, C., Potter, O.E., 1972. Countercurrent backmixing model forfluidized bed catalytic reactors. Applicability of simplifiedsolutions. Ind. Eng. Chem. Fundam. 11 (3), 338.
GOLFERS, 1982. Kagaka Kogaku Ronbunshu 8, 464.Heidel, K., Shugerl, K., Fetting, F., Shiemann, G., 1965. Chem. Eng.
Sci. 20, 557–585.Jain, M.P., Sathiyamoorthy, D., Rao, V.G., 2011. Studies on
hydrochlorination of silicon in a fixed bed reactor. I.C.E. 53 (2),61–67.
Kato, K., Wen, C.Y., 1969. Bubble assemblage model for fluidizedbed catalytic reactors. Chem. Eng. Sci. 24, 1351.
Kobayashi, H., Arai, F., Shiba, T., 1965. Chem. Eng. Tokyo 29, 858.
Levenspiel, O., 1999. Chemical Reaction Engineering, third ed.John Wiley and Sons, New York, pp. 395.

480 chemical engineering research and design 9 2 ( 2 0 1 4 ) 471–480
Werther, J., 1980. Modeling and scale up of Industrial fluidized
Massimila, Johnson, 1961. Oxidation of ammonia. Chem. Eng. Sci.16, 105–115.
Mori, S., Wen, C.Y., 1975. AIChE J. 21, 109.Patridge, B.A., Rowe, P.N., 1966. Chemical reactions in bubbling
gas-fluidized beds. Trans. Inst. Chem. Eng. 44, T1351.Sawyer, D.T., Martel, A.E., 1992. Industrial Environment
Chemistry: Waste Minimization in Industrial Processes andRemediation of Hazardous Waste. Texas A&M University, VSeries, pp. 29.
Shen, C.Y., Johnstone, H.F., 1955. Gas–solid contacts in fluidizedbeds. AIChE J. 3, 349–354.
Stergiou, L., et al., 1984. A discrimination between some fluidizedbed reactor models for ammoxidation of propylene. Chem.Eng. Sci. 39 (4), 713–730.
Toei, R., Matsuno, R., Kojima, H., Nagai, Y., Nakagawa, K., 1965.Chem. Eng. Tokyo 29, 851.
Vishwanathan, K., Ramakrishna, T.S., Subba Rao, D., 1982.Compartment sizing for fluidized bed reactor. I.C.E. XXIV (4),28–32.
bed reactors. Chem. Eng. Sci. 35, 372.


