Embed Size (px)
Citation preview
i
BIOMASS FAST PYROLYSIS IN A FLUIDIZED BED
Product cleaning by in-situ filtration
ii
Promotion committee:
Prof.dr. W.H.M. Zijm, Chairman University of Twente Prof.dr.ir. W.P.M. van Swaaij, Promoter University of Twente Dr. ir. W. Prins, Assistant-promoter University of Twente/BTG BV Dr. S.R.A.Kersten, Assistant-promoter University of Twente Dr.ir. L. Petrus Shell Global Solutions International BV Prof.dr. H.J. Veringa University of Twente/ECN Prof.dr.ir. L. Lefferts University of Twente Prof.dr.ir. G. Brem University of Twente Prof.dr. A.V. Bridgwater Aston University, Birmingham,UK Dr. D. Meier Institute for Wood Chemistry and
Chemical Technology of Wood, Germany
The research reported in this thesis was executed under: 1) A grant of the Netherlands Organization for Scientific Research – Chemical
Sciences (NWO-CW) in the framework of the research program “Towards Sustainable Technologies”, subproject BIOCON with the financial contributions from Shell Global Solutions International b.v. and the Dutch Ministries of Economic Affairs (EZ/SenterNovem) and Environmental Affairs (VROM).
2) A grant of the European Commission in the 6th framework program “Bio-Electricity”.
Cover design: Xiaoquan Wang Front cover is a prototype of filter-assisted fluidized bed reactor
Publisher: Printpartners Ipskamp b.v., P.O.Box 333, 7500 AH Enschede
© 2006, Xiaoquan Wang, Enschede, The Netherlands.
No part of this work may be reproduced in any form by print, photocopy or any other means without written permission from the author.
ISBN 90-365-2322-2
iii
BIOMASS FAST PYROLYSIS IN A FLUIDIZED BED Product cleaning by in-situ filtration
Proefschrift
ter verkrijging van de graad van doctor aan de Universiteit Twente,
op gezag van de rector magnificus, prof. dr. W.H.M. Zijm,
volgens besluit van het College voor Promoties in het openbaar te verdedigen
op donderdag 9 februari 2006 om 13.15 uur
door
Xiaoquan Wang
geboren te Xishui, Hubei China
iv
Dit proefschrift is goedgekeurd door de promotor:
prof.dr.ir. W.P.M. van Swaaij
en de co-promotoren:
dr.ir. W. Prins dr. S.R.A. Kersten

v
To my beloved family

vi
vii
Contents
Summary and conclusions. 1 Samenvatting en conclusies. 7
13
Chapter 1 General introduction. 17
Chapter 2 Biomass pyrolysis in a fluidized bed reactor. 31 Part I: Literature review and model simulations.
Chapter 3 Biomass pyrolysis in a fluidized bed reactor. 73 Part II: Experimental validation of model results.
Chapter 4 Hydrodynamics of a fluidized bed with immersed 101 filters for extracting and cleaning of biomass fast pyrolysis vapors.
Chapter 5 Pyrolysis experiments in a bench-scale 135 filter-assisted fluidized bed.
Chapter 6 Preliminary design calculations for an industrial 155 (10 ton/h intake) fluid bed pyrolysis reactor with in-situ cleaning of the product vapors.
Appendix 1 Mixing of biomass particles in a fluid bed 183 under pyrolysis conditions.
Acknowledgements. 189
Curriculum Vitae. 191

viii
1
Summary and Conclusions
The use of biomass as a renewable source of energy has been stimulated strongly by
governments and international donor agencies during the last decennia for a number
of different reasons, the main ones being:
- the desired reduction of green house gas emissions to the atmosphere;
- the threat of depletion of traditional fossil fuels;
- national policies to secure the energy supply by diversification of the resources.
To replace fossil fuels in the production of heat, power, transportation fuels, and
chemicals, various biomass conversion routes are possible. Apart from the physical
(pressing of seeds or fruits) and biochemical (anaerobic digestion, fermentation) ones,
they all start with biomass combustion and gasification as a first step in the
conversion chain. Since the early eighties of the past century, a new thermo-chemical
conversion technique is being developed which is meant especially as a biomass pre-
treatment step to facilitate its transport over long distances and to simplify its
combustion and gasification. This technique is called “fast pyrolysis”. While slow
pyrolysis is known already for ages as a technique to produce charcoal, fast pyrolysis
is meant for the conversion of biomass to an intermediate, liquid bio-fuel that has a
significantly increased volumetric energy density and a much lower ash content than
the original biomass. The principle of fast pyrolysis is rapid heating of relatively small
biomass particles (> 5 mm) to approx. 500oC in absence of oxygen. Like in slow
pyrolysis, the biomass is decomposed to three products, viz. charcoal, condensable
vapors and permanent gases. However, the product distribution is completely different
in a sense that the production of condensable vapors is maximised at fast-pyrolysis
conditions. Up to 75 wt % of liquid product (bio-oil) can be collected, by passing the
hot vapors and permanent gas through an efficient condenser.
This thesis is dedicated to the subject of fast pyrolysis in a fluid bed reactor. A large
part of the work is related to reactor design aspects of fast pyrolysis, a subject that has
not been considered sufficiently. Past research efforts were focussed mainly on the
kinetics of wood pyrolysis and the testing of different reactor types by measuring the
bio-oil yield as a function of the reactor temperature. To enable a proper reactor and
process design, more knowledge is required concerning the relations between the
biomass feedstock type and the various reactor operating conditions (temperature,
2
biomass particle size, mixing conditions, residence times etc.) on the one hand, and
the yield and quality of the bio-oil on the other.
Special attention is paid in this thesis work to the removal of particulates from the hot
pyrolysis vapors. The presence of solid particles (char and minerals) in the condensed
liquid product is highly undesired because it increases the ash content of the oil and
promotes its instability, both hindering in the storage and in the application in e.g.
diesel engines or gas turbines. In this thesis, the concept of in-situ filtration of hot
vapors is explored. The use of cylindrical filter elements submerged in the fluid bed
reactor is investigated in a number of both, cold and hot-flow experiments, and also
by studying the consequences for the process design.
The literature review of Chapter 2 reveals that the information needed for reactor
calculations on basis of single-particle pyrolysis rates, is insufficient. A fluid bed set-
up was made to measure such rates for (mainly) cylindrical wood particles of different
sizes. These measurements are described in Chapter 3. Results are interpreted with a
generalized single-particle model, presented in Chapter 2 and designed to understand
the influence of the most important variables. It is first of all important to recognize
that biomass is a natural material with always differing features, which makes it very
difficult to reproduce decomposition measurements. Despite all the experimental
results and models published, the pyrolysis rate of biomass particles, and the related
product selectivity, can still not be predicted very well. Only in case of heat transfer
control the single particle pyrolysis rate can be calculated quite well. The yield and
quality of the products however, still remain related to the biomass nature, and can
therefore not be completely predicted.
The above observations explain why it is useless to apply complicated and detailed
models for the prediction of single-particle pyrolysis rates, pyrolysis times and
product yields, apart from learning. A simple one-dimensional model, accounting for
the pyrolysis decomposition kinetics and the heat transfer to and through the biomass
particle, provides sufficient accuracy for engineering calculations. From the literature
it also appeared that the relation between the pyrolysis conditions and the precise
composition of the products, either being charcoal, condensed vapors (bio-oil) or
permanent gases, has never been investigated systematically in a single research work.
To validate the various model simulations and explore the effects of pyrolysis
conditions on the product composition, an extensive experimental program has been
carried out using a small fluid bed as a pyrolysis reactor. Conversion times, product
yields, and product compositions were measured as a function of the biomass (pine
and beech wood, demolition wood and, bamboo) type, biomass particle size (up to 17
3
mm), the vapor residence time, the reactor temperature (350 - 800oC) and the biomass
position in the fluid bed. The following main conclusions could be drawn.
1. Existing single particle models have a limited predictive power with respect to
the product distribution and the conversion time of small particles (< 3 mm), due
to a wide variation in reported decomposition kinetics.
2. The pyrolysis time of biomass particles in the size range of 1 to 5 mm, usually
applied in full-scale reactors at 500oC, is influenced by all three mechanisms:
the pyrolysis kinetics, the heat transfer from the bulk of the reactor to the
particle, and the intra-particle heat conduction. Model calculations further show
that the external heat transfer rate affects the pyrolysis time and product yields
just slightly if > 250 W/m2K and dp >1 mm.
3. Variations in bio-oil quality (e.g. water content of liquid) cannot yet be predicted
by existing single particle models. Product quality is however an important
design parameter. Optimal process conditions for a maximal liquid yield may
differ from those for a certain desired bio-oil quality. A model is suggested that
can potentially deal with these problems.
4. Product yields of pine and beech wood are similar. The bio-oil yield is maximal
(65 wt % on wet basis) between 450oC and 550°C, when the water content of
the bio-oil is minimal (30 to 35 wt %).
5. In the set-up used, the residence time of the pyrolysis vapors is not very critical
with respect to the possible loss of condensable products; < 5 s seems
acceptable at 500°C.
6. Both, theory and experiments show that the particle size has only a minor effect
on the total liquid yield up to a diameter of 20 mm. However, for particles larger
than 3 mm the water content of the produced bio-oil increases substantially.
Chapter 4 deals with the effects of in-situ filtering on the fluid bed hydrodynamics.
The experimental work reported was out carried at ambient conditions in laboratory-
scale equipment, and had an explorative nature. Glass beads in the size range of 100
to 300 m were used as fluid bed particles. The purpose of the work was to study cake
formation (stagnant zone around the filter) and solids mixing under gas extraction
conditions.
A two dimensional air-fluidized bed of plexi-glass (12 x 3 cm cross sectional area)
was used to find the conditions for which cake formation around a cylindrical filter
element (sintered glass; 12 mm diameter; pore size 10 or 30 m) is avoided. And in a
second cold flow model, i.c. a cylindrical air-fluid bed (10 cm intern. diameter) made
of glass, experiments were carried out to determine the influence of extraction of the
4
fluidizing gas through submerged filter elements (ceramic, pore size 6 m) on the
fluid bed appearance and solids mixing. In these tests a vertically oriented filter
element has been used as well, next to horizontal ones. While the appearance of the
fluid bed was observed visually (bubble behavior, type of fluidization), the solids
mixing has been studied by measuring time dependent axial temperature profiles
inside the bed after adding a certain amount of hotter bed particles to the surface of
the bed at time zero.
Main conclusions of this chapter are:
1. Filter cake formation can be prevented in a fully fluidized bed;
2. If the velocity at the top of the fluid bed is used to correlate the solids dispersion
coefficient to, heat transport (solids mixing) in the tested fluid beds shows the
same dependency of the superficial gas velocity, with or without extraction of
gases through the filters. At equal top velocity, the heat-dispersion coefficient
with flow through the filter is ca. 2.5 times lower than without.
Chapter 5 describes how the concept of extracting and cleaning pyrolysis vapors by
means of filters immersed in a fluid bed has been tested experimentally. For this, a
batch-wise fed lab-scale fluid bed (20 g per batch) and a continuous bench-scale fluid
bed (1 kg/h) have been equipped with an immersed filter (pore size between 6 and 15
micron). In short batch experiments of approx. 2 minutes, pyrolysis oils have been
produced that did not contain any particles, magnesium or sodium.
While using the continuous bench-scale FB, approximately 5700 g of non-filtered oil
and 3000 g of filtered oil was produced. Filtered oil contained two times less particles
and 5 times less ash components than the non-filtered oil. The ash content of the
filtered oil was only 0.01 wt % resulting in a very low aging rate expressed as the
increase in viscosity per unit time. Silica was found on the inner walls of the filter and
the downstream tubing indicating that sand fines (bed material) slipped trough the
filter during long-term operation. There is evidence that the particles found in the
filtered bio-oil have different origins. Part of them slipped simply through the filter,
while others were formed by secondary processes (polymerization of vapors)
occurring after the filter.
The last chapter of this thesis (Chapter 6 contains preliminary design calculations of a
full-scale fast pyrolysis unit of 10 tons biomass per hour based on the principle of a
fluid bed reactor with submerged filter elements. Based on knowledge, gained in
Chapters 2 to 5 of this thesis, an engineering model has been developed to estimate
the volume of a FAFB reactor. For small particle sized feedstocks ( 1 mm), the
5
required reactor volume of a FAFB is 13 m3 including the freeboard, compared to 22
m3 for a regular FB. For larger sized feedstocks intensification is hardly possible,
because the lower reaction rate and therewith the hold-up of reacting particles
dominates the reactor design. Extracting large parts of gases and vapors through the
immersed filters does not result in significantly large intra-bed temperature gradients
due to less intense solids mixing.

6
7
Samenvatting en Conclusies
Het gebruik van biomassa als hernieuwbare energiebron wordt de laatste decennia om
verschillende redenen sterk gestimuleerd door nationale en internationale
overheidsinstanties. De belangrijkste redenen zijn:
de wens om de uitstoot van broeikasgassen te verminderen,
de verwachting dat fossiele bronnen uitgeput raken,
diversificatie van energiebronnen als nationaal beleid.
Er zijn verschillende mogelijkheden bekend, en reeds operationeel, om fossiele
brandstoffen te vervangen door biomassa bij de productie van warmte, elektriciteit,
transportbrandstoffen en chemicaliën. Voor de productie van warmte en elektriciteit is
verbranding of vergassing vaak de eerste conversie stap. Mechanische (uitpersen van
zaden of vruchten) en biochemische (anaerobische vergisting en fermentatie) routes
worden gebruikt voor de productie van transportbrandstoffen. Sinds het begin van de
jaren tachtig, is er een nieuwe thermo-chemische conversie methode in ontwikkeling.
Deze conversie methode wordt aangeduid met de term “snelle pyrolyse” en is bedoeld
als voorbehandeling van biomassa om het transport over lange afstanden efficiënter te
maken en de verbranding en vergassing te vereenvoudigen. Langzame pyrolyse is al
eeuwen bekend als een techniek om houtskool te produceren. Met snelle pyrolyse kan
een vloeibare biobrandstof worden gemaakt met een veel hogere energie-inhoud per
volume eenheid, en veel minder as, dan de oorspronkelijke biomassa. Het principe
behelst het snel opwarmen van kleine biomassa deeltjes (< 5mm) tot circa 500 °C in
afwezigheid van zuurstof. Net als bij langzame pyrolyse, wordt biomassa omgezet in
drie producten: houtskool, condenseerbare dampen en permanente gassen. De
verhouding van de producten verschilt echter in die zin dat de productie van
condenseerbare dampen wordt gemaximaliseerd bij snelle pyrolyse. Door de hete
dampen door een efficiënte condensor te leiden kan tot circa 75 gewicht % vloeibaar
product (bio-olie) uit de grondstof worden gevormd.
Dit proefschrift is gewijd aan snelle pyrolyse in een wervelbed. Een groot deel van het
werk heeft betrekking op aspecten van het reactorontwerp voor snelle pyrolyse, een
onderwerp dat tot nu toe onvoldoende aandacht heeft gekregen. Het onderzoek was in
het verleden vooral gericht op de kinetiek van hout pyrolyse, en het testen van
verschillende reactor types door meting van de bio-olie opbrengst als functie van de
reactortemperatuur.
8
Om de reactor en het proces goed te kunnen ontwerpen is er meer kennis nodig,
enerzijds met betrekking tot de relatie tussen het soort biomassa en de verschillende
bedrijfscondities van de reactor (temperatuur, grootte van de deeltjes biomassa,
menging, verblijftijd, etc.), en anderzijds de kwaliteit van de bio-olie.
Het proefschrift besteedt ook aandacht aan de afscheiding van vaste stof deeltjes uit
het hete pyrolyse gas. De aanwezigheid van zulke deeltjes (koolstof en mineralen) in
het gecondenseerde vloeibare product is ongewenst omdat het daardoor minder stabiel
wordt en tot problemen leidt bij toepassingen van het product in bijvoorbeeld motoren
en turbines. In dit proefschrift wordt het concept van iin-situ filtratie onderzocht. Het
gebruik van een cilindrisch filterelement ondergedompeld in een fluid-bed pyrolyse
reactor is onderzocht aan de hand van experimenten uitgevoerd bij kamertemperatuur
en bij verschillende pyrolyse temperaturen, en door bestudering van de gevolgen voor
het procesontwerp.
Uit het literatuuronderzoek van hoofdstuk 2 blijkt dat de kennis die nodig is voor
reactor berekeningen op basis van de pyrolyse snelheid van een enkel deeltje,
onvoldoende is. Daarom is er een fluid bed testopstelling gebouwd om de
pyrolysesnelheid voor (hoofdzakelijk) cilindrische houtdeeltjes van verschillende
afmetingen te meten. De metingen worden beschreven in hoofdstuk 3 en de resultaten
zijn geïnterpreteerd met het algemene rekenmodel voor enkele deeltjes dat in
hoofdstuk 2 is beschreven. Het model is speciaal ontworpen om de invloed van
belangrijke parameters te leren begrijpen. Het blijkt van het grootste belang te
onderkennen dat biomassa een natuurlijk materiaal is met steeds verschillende
eigenschappen, waardoor het erg moeilijk is om pyrolyse metingen te reproduceren.
Ondanks al het experimentele werk en de gepubliceerde modellen, kan de
pyrolysesnelheid van biomassa deeltjes en de bijbehorende productverdeling nog
steeds niet erg goed worden voorspeld. Alleen als de pyrolysesnelheid gelimiteerd
wordt door warmte overdracht, kan deze snelheid voor één enkel deeltje wel redelijk
goed worden berekend. Maar, de opbrengst en de kwaliteit van de producten blijven
steeds gerelateerd aan het type biomassa en kunnen ook in dat geval niet goed worden
voorspeld.
Het blijkt dus zinloos om ingewikkelde en gedetailleerde modellen toe te passen voor
het voorspellen van de pyrolysesnelheid van enkele deeltjes, van de pyrolysetijden, en
van de productopbrengst, behalve dan om van te leren. Een eenvoudig 1-dimensionaal
model dat rekening houdt met de pyrolysekinetiek en de warmteoverdracht naar en
door de biomassa, is voldoende nauwkeurig voor reactor en proces
9
ontwerpberekeningen. Uit de literatuur is bovendien gebleken dat het verband tussen
de toegepaste pyrolysecondities en de precieze samenstelling van de producten nooit
systematisch is onderzocht, of het nu gaat om houtskool, gecondenseerde damp (bio-
olie) of permanente gassen.
Er is tenslotte besloten om een uitgebreid experimenteel programma uit te voeren met
als doel om verschillende modellen te valideren en om onderzoek te doen naar de
effecten van pyrolysecondities op de productsamenstelling. Daarvoor is een
meetopstelling gebruikt met een klein fluid bed als pyrolysereactor. Conversietijden,
productopbrengst en productsamenstellingen zijn gemeten als functie van het soort
biomassa (grenen- en beukenhout, plus bamboe), de grootte van de deeltjes (tot
17 mm), de verblijftijd van de damp, de temperatuur van de reactor (350 tot 800°C)
en de positie van de biomassa in het fluid bed. Hieruit zijn de volgende
hoofdconclusies getrokken:
1. Door grote verschillen in de gerapporteerde pyrolysekinetiek kunnen de
productverdeling en de conversietijden voor kleine deeltjes niet goed met
bestaande modellen voor een enkel deeltje worden voorspeld
2. De pyrolysetijd van biomassadeeltjes met een grootte van 1 tot 5 mm, zoals
gebruikt in commerciële reactoren die worden bedreven bij 500°C, wordt
bepaald door drie factoren, n.l.: de pyrolysekinetiek, de warmteoverdracht van
het reactor bed naar het deeltje en de warmtegeleiding binnen het deeltje.
Modelberekeningen laten zien dat de externe warmteoverdracht een kleine
invloed heeft op de pyrolysetijd en de productopbrengst zolang >
250 W/m2K en dp > 1 mm.
3. Variaties in de bio-olie kwaliteit (bijvoorbeeld het watergehalte) kunnen niet
worden voorspeld door bestaande modellen voor enkele deeltjes. Maar de
productkwaliteit is wel een belangrijke ontwerpparameter. Optimale
procescondities voor een maximale olieopbrengst kunnen afwijken van de
optimale procescondities voor een gewenste oliekwaliteit.
4. De productopbrengst uit grenen- en beukenhout zijn gelijk. De bio-
olieopbrengst is maximaal (65 gew. % op natte basis) bij een temperatuur
tussen de 450 en 550°C, waarbij het watergehalte van de bio-olie minimaal is
(30 tot 45 gew. %).
10
5. In de gebruikte opstelling (met een lage houtskool inventaris) is de verblijftijd
van de pyrolyse dampen in verband met het mogelijke verlies aan
condenseerbaar product niet erg kritisch; t < 5 s lijkt acceptabel bij een
temperatuur van 500°C.
6. Zowel de theorie als de experimenten laten zien dat de deeltjesgrootte tot
20 mm slechts een kleine invloed heeft op de totale vloeistofopbrengst. Echter,
voor deeltjes groter dan 3 mm neemt het watergehalte in de bio-olie wel
substantieel toe.
Hoofdstuk 4 gaat over de effecten van in-situ filtratie op de hydrodynamica van het
wervelbed. De gerapporteerde experimenten zijn uitgevoerd op laboratoriumschaal
onder normale omgevingscondities. Glasparels met afmetingen van 100 tot 300 m
zijn toegepast als deeltjes voor het wervelbed. Het doel was de bestudering van de
vorming van filterkoek, en van de menging van deeltjes terwijl gas wordt onttrokken.
Een 2-dimensionaal, door lucht gefluïdiseerd wervelbed van plexiglas (12 x 3 cm in
dwarsdoorsnede) is gebruikt om de condities te vinden waarbij de vorming van een
filterkoek rond een cilindrisch filterelement (gesinterd glas; 12 mm diameter;
poriegrootte 10 of 30 m) wordt vermeden. In een tweede opstelling, een door lucht
gefluïdiseerd cilindrisch wervelbed (10 cm interne diameter) van glas, zijn
experimenten uitgevoerd ter bepaling van de invloed van gas onttrekking door filters
in het bed (keramisch, poriegrootte 6 m) op het zichtbare fluïdisatiegedrag van het
bed en de deeltjesmenging. In deze test zijn er naast verticale filters ook horizontale
filters getest. Terwijl het gedrag van het wervelbed visueel is beoordeeld (bellen
gedrag, type fluïdisatie), is de menging van deeltjes bestudeerd door meting van
tijdsafhankelijke temperatuurprofielen in het bed na toevoeging op tijdstip nul van een
bepaalde hoeveelheid deeltjes met een hogere temperatuur via het bedoppervlak.
De belangrijkste conclusies van dit hoofdstuk zijn:
1. De vorming van een filterkoek kan worden vermeden door het instellen van de
juiste fluïdisatiecondities (bv. de snelheid aan het bed oppervlak moet groter
zijn dan 7 maal de minimum fluidisatiesnelheid).
2. Wanneer de snelheid boven in het wervelbed wordt gebruikt om de
dispersiecoëfficiënt van de deeltjes te correleren, dan zal het warmtetransport
(menging van deeltjes) met en zonder extractie van de gassen door de filters
dezelfde correlatie met oppervlaktesnelheid van het gas vertonen. Er blijkt dat
als de snelheid van het gas boven in het bed dezelfde is, de
11
warmtegeleidingcoëfficiënt voor het geval met filter circa 2.5 keer lager is dan
zonder filter.
Hoofdstuk 5 beschrijft hoe het concept van de onttrekking en reiniging van
pyrolysedampen door middel van filters onder het oppervlak van een wervelbed
experimenteel is onderzocht. Voor dit onderzoek zijn er twee pyrolyseopstellingen
gebruikt waarbij de wervelbedreactor was uitgevoerd met een filter (poriegrootte 6 en
15 m) onder het bedoppervlak. In de eerste opstelling werd het wervelbed discontinu
gevoed (20 g voeding per batch), en de tweede opstelling werd continu bedreven (1
kg/h). In korte discontinue experimenten van ongeveer 2 minuten is er pyrolyse olie
geproduceerd die geen deeltjes, magnesium of natrium bevatte.
Bij het gebruik van het continue wervelbed is er ongeveer 5700 g ongefilterde en
3000 g gefilterde olie geproduceerd. De gefilterde olie bevatte een factor 2 minder
deeltjes en een factor 5 minder ascomponenten dan de niet gefilterde olie. De
gefilterde olie bevatte slechts 0.01 gew. %. Een laag asgehalte resulteert in stabiel
product dat slechts langzaam veroudert. (De veroudering is waarneembaar als een
toename van de viscositeit in de tijd.)
Op de binnenwand van het filter en de buizen stroomafwaarts is silicium gevonden,
hetgeen laat zien dat fijne zanddeeltjes (bedmateriaal) het filter kunnen passeren.
Vaste-stofdeeltjes die zijn teruggevonden in de bio-olie hebben een verschillende
oorsprong. Een deel is eenvoudigweg door het filter geslipt, terwijl andere deeltjes
zijn gevormd door secundaire processen (polymerisatie van dampen) die plaatsvinden
na het filter.
Hoofdstuk 6 van dit proefschrift bevat verkennende ontwerpberekeningen voor een
grootschalige installatie. Het betreft de pyrolyse van 10 ton biomassa per uur volgens
het principe van een wervelbed met ondergedompelde filters. Met de vergaarde kennis
beschreven in hoofdstukken 2 t/m 5 van dit proefschrift, is een ontwerpmodel
ontwikkeld om het volume van een FAFB (Filter Assisted Fluid Bed) reactor te
bepalen. Voor biomassa met kleine deeltjes (< 1mm), is het benodigde reactorvolume
van een FAFB 13 m3 inclusief de ruimte boven het bedoppervlak, in vergelijking met
22 m3 voor een gewoon wervelbed. Voor biomassa met grotere deeltjes is reactor
verkleining nauwelijks mogelijk, omdat de lagere reactiesnelheid, en de bijbehorende
langere verblijftijd, het reactorontwerp bepalen. Onttrekking van een groot aandeel
van de gassen en dampen via ondergedompelde filters veroorzaakt geen grote
temperatuurgradiënten in het bed als gevolg van minder intensieve deeltjesmenging.

12
13
5500oC
75
17 350oC 800oC
1<3
2 1 5 500oC
250W/m2K 1
3
14
4 450oC550oC 65 30wt
35wt5
500oC 56 20
3
100 300
12 312 10 30
106
12
2.5
20 1kg/h6 15 2
5700 30002 5 0.01wt%
10FAFB
1mm FAFB 1322

15

16
17
Chapter 1
General Introduction
Biomass and its Conversion
Biomass, one of the renewable resources, is a material of recent biological origin.
Examples of biomass are wood waste from the timber industry, agricultural, forestry
and plantation residues, animal waste (manure), and the organic components of
municipal and industrial waste. Ever since mankind obtained the control over fire,
biomass has been used as fuel. At present about 10% of the world’s need for energy is
directly derived from biomass, mainly in the developing countries and via traditional
methods [1-3].
A large fraction of the world population already relies on biomass as a main source of
energy. Nowadays renewable biomass, produced in a sustainable way, is recognized
as an attractive alternative to fossil fuels for which the resources are finite and in some
cases geographically restricted (e.g. crude oil). In principle biomass derived energy
has no net carbon dioxide (CO2) impact on the atmosphere and is therefore
advantageous in offering resistance to a climate change due to the greenhouse effect.
The bio-energy production chain is relatively labour-intensive and may provide many
local jobs, skilled and unskilled, also in developing countries. Moreover, biomass can
play a role in improving the countries’ energy security as part of a diversification
strategy. In recent decades, the need to meet the increasing energy demands, without
sacrificing the world’s resources too quickly and damaging the environment, gave an
important stimulus to the development of technologies for biomass conversion to
modern energy carriers such as electricity, liquid biofuels, syngas and hydrogen.
18
There are several ways to transfer the energy contained in biomass, ranging from
traditional combustion to gasification and liquefaction. Production of gaseous and
liquid fuels can be done by thermo-chemical and biological methods (methane,
alcohol). Here, only the thermo-chemical routes are discussed.
Direct combustion is the traditional way of using biomass and is widely practiced to
provide heat and power. The technology is commercially available and presents
minimum technological risks to investors. In combustion, the biomass is completely
transformed to heat, which must then be consumed or used for power generation
immediately, because storage is not a viable option. Overall efficiencies to power tend
to be rather low: typically 15% for small plants up to 35% for large modern plants.
Biomass combustion systems are currently only competitive when wastes are used as
feedstock material such as residues from the pulp and paper industry (black liquor),
plantations (bagasse), agriculture (malasse, rise husk), and forestry (thinnings).
Emissions and ash disposals need to be controlled carefully. Fluid bed and grate
combustors are, however, widely implemented throughout Asia, North America and
Europe, frequently utilizing forestry, agricultural and industrial wastes. Next to stand-
alone systems fuelled with biomass only, also co-combustion in coal fired furnaces of
power plants is practiced increasingly.
Biomass can be gasified at temperatures below 900°C by different technologies [4-6]
to produce a gas containing carbon monoxide (CO), hydrogen (H2), methane (CH4),
and a small amount of hydrocarbons including tars. If air is used as a gasification
agent the gas will be diluted with nitrogen and cannot be transported economically
over large distances, nor stored, and has to be used at once. Direct coupling of such an
air-blown gasifier to a combustor provides advantages in emissions and process
control, and allows for co-firing of biomass in existing fossil fuel based furnaces.
In principle it is also possible to produce syngas (an undiluted mixture of H2 and CO)
from biomass by entrained-flow gasification with pure oxygen or oxygen/steam
mixtures at high temperature (> 1300°C) en pressure (40 to 80 bar). Although for coal,
mineral oil, and natural gas many large-scale gasification plants have been built and
operated successfully over decades [7], the same technology is not yet available for
full-scale biomass operation. However, a start has been made with the development of
entrained-flow biomass gasifiers. Recently, successful runs at pilot and demonstration
scale have been carried out [8-10]. Indeed, methanol or Fischer-Tropsch diesel could
in principle be produced from biomass derived syngas [11,12]. For economical
19
reasons however, the existing Fischer-Tropsch and methanol plants have capacities of
over 106 ton/year. In case low-density (~ 100-300 kg/m3) agricultural or forestry
waste would be considered as a feedstock material, the collection, transport and
storage of the required large quantities represent a huge challenge. From an ecological
point of view, the withdrawal and movement of the minerals from the biomass
production areas to the industrials sites could become a serious threat to the
sustainability of this conversion route.
In the distant future, such large-scale plants based on solid biomass might be possible
and economically viable [13-15]. For the near future a simple and cheap liquefaction
process to be applied in the biomass production areas as a pre-treatment step, offers
many advantages.
Decentralized Liquefaction of Biomass
Biomass derived from agricultural and forestry waste, and consisting mainly of
lignocellulose, is typically produced in quantities of around 10 tons dry material per
hectare per annum [13,16] depending on various factors. Biomass grown especially
for energy production (miscanthus, willow, poplar, etc.) can have higher yields, viz.
up to 20 tons/ha. The highest potential is in the utilization of waste and residues,
which are cheap and altogether represent an energy content of half the crude oil
production [17]. Such resources are indeed abundant but dispersed over large areas,
depending on the soil condition and climate.
Biomass liquefaction to an intermediate energy carrier, at a scale that matches the
local logistics of collection and storage, seems to be beneficial in case it:
- has an energy density of up 10 times higher than the biomass bulk material of
which it has been made;
- can be handled and stored easily as a uniform low-viscosity liquid without any
risk of natural degradation;
- can be collected from various production areas and shipped easily over long
distances to central sites for further applications;
- can be traded in large quantities as a world wide commodity through the existing
infrastructure of bulk tankers and harbour facilities;
- can be pressurized and pumped through pipelines;
- can be used as a liquid fuel in modern conversion equipment (gas turbines,
diesel engines, oil and gas furnaces);
- can be used as a source of oxygenated chemicals;
20
- can be converted to syngas by the proven technology of oil gasification;
- can be co-fed to a traditional crude oil refinery after a proper pre-treatment (de-
oxygenation).
Such a liquefaction process should preferably:
- be safe, simple and easy to operate at atmospheric pressure and moderate
temperatures;
- produce a stable non-toxic uniform liquid, with a high energy density and
favorable transport, storage and combustion properties;
- have a high liquid yield and high thermal efficiency;
- have favorable economics even at low production capacities (10,000 - 50,000
ton/year);
- be omnivorous, accepting all kinds of biomass and residues;
- recover the minerals and allow them to be returned to the soil as essential
nutrients belonging to the production area.
A liquefaction process for biomass fulfilling all these wishes is not (yet) available.
Biological production of alcohol is very successful in countries like Brazil, the US
and Canada [18,19], but at industrial scale, only sugars and carbohydrates can be
converted in this way. New developments [20,22] have led to enzymatic conversion
of cellulose into sugars suitable for alcohol production. Future efficiencies, yields,
economics and scale of operation are not yet known. Recently, lingo-celluloses
materials have been converted successfully to bio-ethanol in the pilot facility of the
IOGEN company (EcoEthanol™ process) [23].
Hydrothermal liquefaction is process converting water/biomass slurries into light and
heavy products that contain significantly less oxygen than the original biomass due to
formation of H2O and CO2 during conversion. The process conditions are pretty
severe as high pressures are required (150 - 200 bar) and moderately high temperature
(250 - 350oC). In the hydrothermal liquefaction process, the products are called light
biocrude and heavy biocrude respectively. Without further treatment the products are
at least partially solid at ambient conditions. In The Netherlands, the process is being
developed since 1998 by a company called Biofuel BV [24], on pilot scale.
Fast pyrolysis is a liquefaction process that at least fulfils a large part of the list of
wishes given above. While still under development it is approaching the commercial
21
application. The present thesis is focused on further improvement of this process,
which will now be discussed in more detail.
Pyrolysis
Pyrolysis is a conversion technique in which biomass is transformed to gaseous, liquid
and solid products that can be used as improved fuels or intermediate energy carriers.
Essentially the method consists in heating the biomass in an inert atmosphere up to a
certain desired temperature. Both, during heating and at the final temperature,
decomposition of biomass takes place in a complex interaction of mass and heat
transfer with chemical reactions, resulting in the evaporation of water and vapors and
production of some non-condensable gases. A solid matrix (char) consisting of carbon
mainly, but including most of the minerals, is left. A large part of the produced vapors
can be condensed to a brown liquid, leaving the non-condensable gases as a
combustible fuel for immediate use. The precise distribution of products depends on
many factors like heating rate, final temperature, operating pressure, residence times
of the vapors and the converting biomass and their states of mixing. Moreover, several
feedstock properties like particle size, water and ash content, composition, structure
related properties, etc., are influencing the process and product compositions.
Mankind has used pyrolysis of biomass for ages, perhaps from shortly after gaining
the full control of fire making. In the past, pyrolysis processes were focussed on char
production in for example sand covered piles of wood, brick kilns and retorts, with
tars as a second product. Over the last two centuries pyrolysis processes for fuel gas
production from coal or biomass have been practiced on a rapidly increasing scale.
Also the production of wood chemicals (methanol, acetic acid) has been practiced in
the past.
Pyrolysis processes directed to the production of liquid fuels or intermediate energy
carriers became subject of study in the last quarter of the former century and during
the nineties the first pilot plants were realized [25-27].
They were based on the notion that for the production of mainly liquid fuels, biomass
should be heated up rapidly (“fast pyrolysis”) or even extremely fast (“flash
pyrolysis”) and that vapor products should be rapidly cooled to avoid secondary
conversion to carbon and permanent gases in consecutive reactions. Temperatures
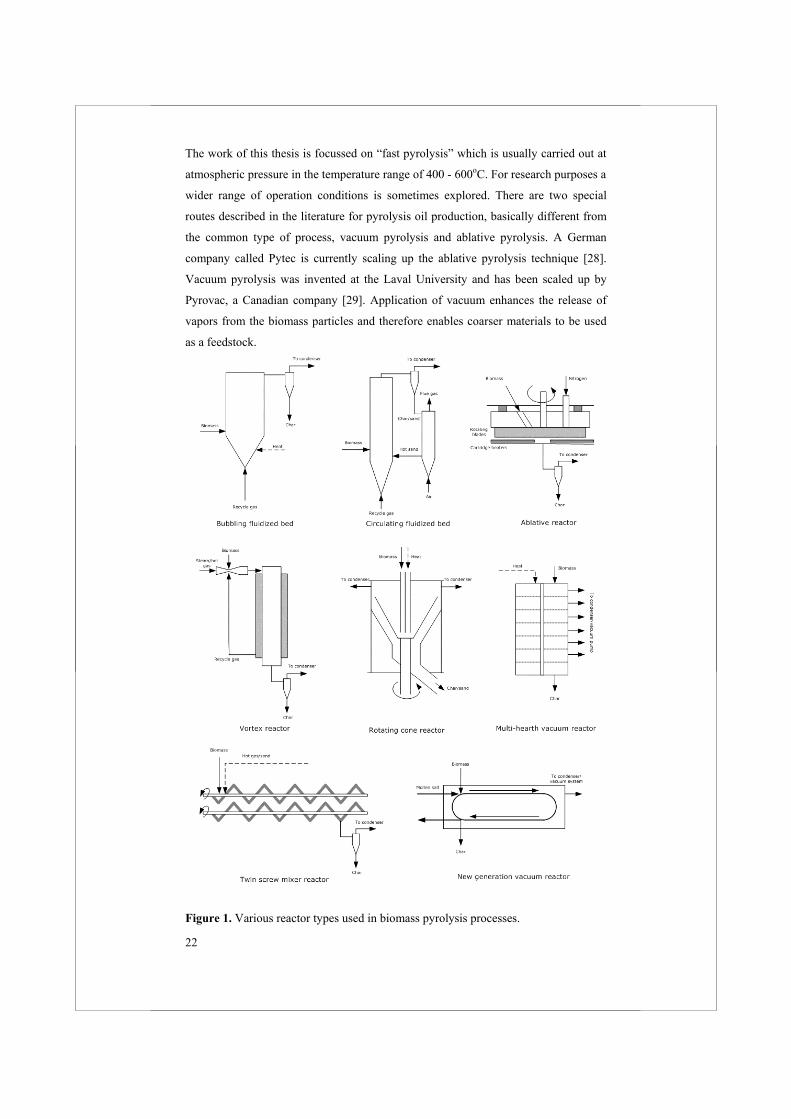
applied were in the range of 400 - 600oC and different reactor types were used (see
Figure 1).
22
The work of this thesis is focussed on “fast pyrolysis” which is usually carried out at
atmospheric pressure in the temperature range of 400 - 600oC. For research purposes a
wider range of operation conditions is sometimes explored. There are two special
routes described in the literature for pyrolysis oil production, basically different from
the common type of process, vacuum pyrolysis and ablative pyrolysis. A German
company called Pytec is currently scaling up the ablative pyrolysis technique [28].
Vacuum pyrolysis was invented at the Laval University and has been scaled up by
Pyrovac, a Canadian company [29]. Application of vacuum enhances the release of
vapors from the biomass particles and therefore enables coarser materials to be used
as a feedstock.
Figure 1. Various reactor types used in biomass pyrolysis processes.
23
The biomass is conveyed over a moving belt and heated indirectly by molten salts.
The application of vacuum and the way of heating make the process quite complex.
There is also an increased risk for explosion or fire as oxygen may be sucked into the
reducing atmosphere from outside in case of any leakage.
In ablative pyrolysis, which is based on the principle to press large biomass particles
(usually wood) against a moving heated wall, it is attempted to continuously remove
the product layers that are supposed to be formed at the surface of the biomass particle
during its conversion. In this way the resistance for rapid heating, otherwise caused by
the presence of a char product layer, is eliminated [30,31]. For regular fast pyrolysis
various pilot plants have been built, often based on dense or circulating fluid beds.
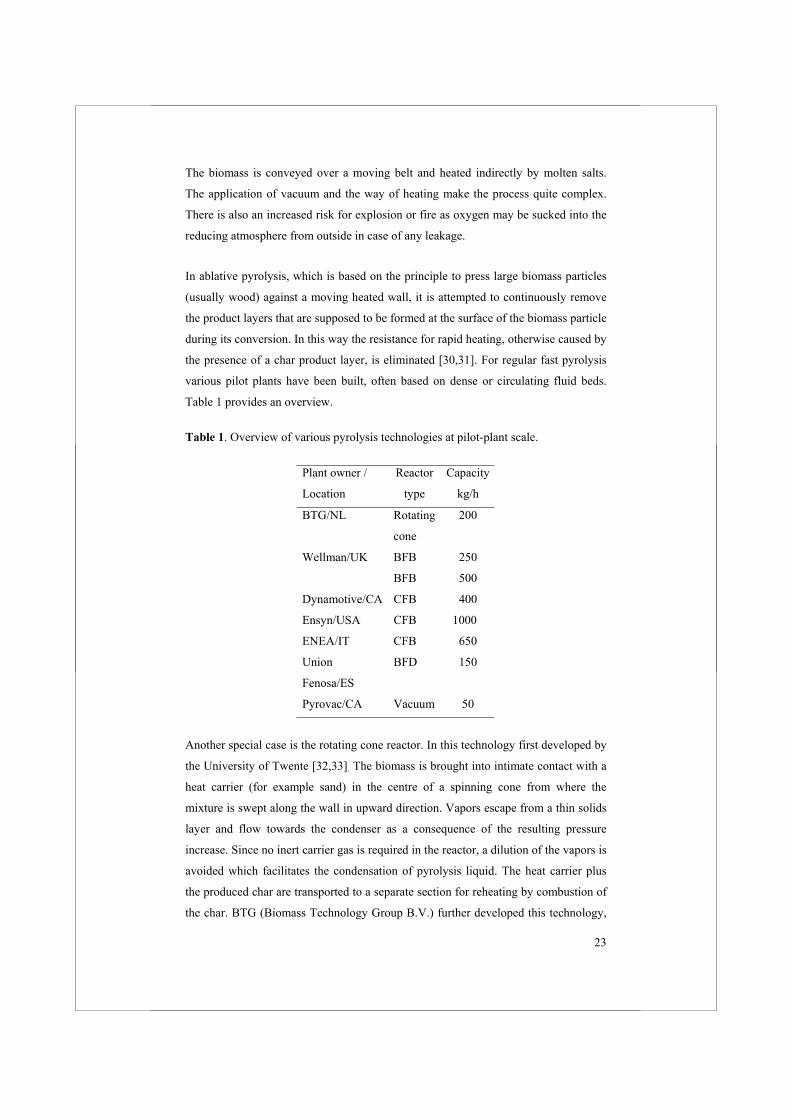
Table 1 provides an overview.
Table 1. Overview of various pyrolysis technologies at pilot-plant scale.
Plant owner /
Location
Reactor
type
Capacity
kg/h
BTG/NL Rotating
cone
200
Wellman/UK BFB 250
BFB 500
Dynamotive/CA CFB 400
Ensyn/USA CFB 1000
ENEA/IT CFB 650
Union
Fenosa/ES
BFD 150
Pyrovac/CA Vacuum 50
Another special case is the rotating cone reactor. In this technology first developed by
the University of Twente [32,33]. The biomass is brought into intimate contact with a
heat carrier (for example sand) in the centre of a spinning cone from where the
mixture is swept along the wall in upward direction. Vapors escape from a thin solids
layer and flow towards the condenser as a consequence of the resulting pressure
increase. Since no inert carrier gas is required in the reactor, a dilution of the vapors is
avoided which facilitates the condensation of pyrolysis liquid. The heat carrier plus
the produced char are transported to a separate section for reheating by combustion of
the char. BTG (Biomass Technology Group B.V.) further developed this technology,
24
and after a few years of pilot plant testing (5 ton/day intake), they recently delivered
the first commercial unit for the conversion of 50 tons/day palm plantation residues to
a client in Malaysia. At the time of writing this thesis, the first successful runs were
completed.
Apart from the small but attractive market for flavor production (commercial bio-oil
production by Ensyn for Red Arrows [34]), a bulk market for pyrolysis oil is still to be
developed. Important barriers are the lack of a completely demonstrated technology,
the fluctuating energy market for fossil fuels and some real and/or perceived problems
related to the bio-oil quality. The latter refers to phenomena like a high acidity
(corrosion), instability caused by re-polymerisation reactions, separation of a water
phase, and the presence of particulates (entrained char and ash particles).
The presence of solid particles in the oil may affect the oil quality by:
- promoting the instability due to settling;
- promoting the instability by the formation of nuclei/catalysts for polymerisation
or cracking reactions;
- increasing the ash content of the oil;
- hindering the combustion in e.g. diesel engines;
- reducing the re-evaporation properties in case of secondary processes
(reforming of bio-oil to hydrogen, combustion in gas turbines).
Filtering
Of course, the pyrolysis oil can in principle be filtered to remove the particles. This
however, is not an easy process. Part of the condensed bio-oil will stick to the
particles leading to losses, and filter cakes may cause problems in decreasing the
permeability (high pressure drops required) and complicating the washing. Moreover,
the ash removal efficiency may suffer from dissolved minerals (due a high water
content) passing through the filter anyway. A better approach might be high
temperature filtration of the vapors immediately after their formation. This could be
done in a separate unit, for example an assemblage of candle filters, placed between
the pyrolysis reactor and the bio-oil condenser. Hot gas filtration is under
development for advanced power generation systems and appears to be quite a
challenge, mainly because the filter materials need to withstand severe conditions
easily leading to corrosion, erosion, blocking, and rupture or cracking. Filter cleaning
is a particular problem that needs to be solved as well. In case of pyrolysis vapors an
25
additional difficulty is the presence of entrained char and aerosols that may condense
on the filter and cause sticky deposits.
Part of this thesis will be on integration of the production and filtration operation. It
may save a separate filtration unit and lead to intensification of the production
operation in case of a fluid bed pyrolyser.
The idea is to remove the produced gas and vapors mainly through an assemblage of
filter units submerged in the fluid bed, and just for a small part through the upper
surface area of the fluid bed. The filtered stream of gases and vapors are then sucked
away through a manifold to the condenser. An additional advantage could come from
the shorter residence time of the pyrolysis vapors which are largely by-passing (part
of) the bed, the entire freeboard and the cyclone(s) in this new concept.
The set-up of such a unit requires a careful and special design in which the
fluidization at each level in the bed is maintained by the formed vapors. Controlled
removal of product gases over the bed height is essential and dilution with additional
fluidization gases should be avoided.
Outline of the Thesis
The literature review included in Chapter 2 revealed that the information needed for
reactor calculations on basis of single particle conversion rates, is insufficient.
Therefore a special experimental set-up was made to measure such conversion rates
for (mainly) cylindrical wood particles of different sizes. The measurements are
reported in Chapter 3. Results are interpreted with a generalized particle model
(described in Chapter 2) and designed to understand the influence of the most
important variables. This model predicts the conversion rates of individual wood
particles with sufficient accuracy for design and engineering purposes.
To allow the study of filtering in a fluid bed, various measuring/visualisation set-ups
have been constructed and operated. Some filter design rules for the filters and the
limits for cake formation have been determined. The influence of the filtering on the
hydrodynamics of the fluid bed (including back mixing in the fluid bed) has been
considered. Results and first attempts on modelling are presented in Chapter 4.
Finally, a small pilot plant for continuous production of bio-oil from about 1 kg
biomass per hour has been designed and constructed in order to demonstrate the
concept of fluid pyrolysis with integrated filtration. Eventually, the production of
filtered and ash free pyrolysis oil succeeded; the results are given in Chapter 5.
26
The last chapter of this thesis (Chapter 6) contains the elements of a preliminary
design of a full-scale fast pyrolysis unit of 10 tons biomass per hour based on the
principle of a fluid bed reactor with submerged filter elements. The design
considerations reveal both the potential and the limits of the concept. Reactor
intensification is possible if the fast pyrolysis process is fast enough to keep the
biomass/char hold-up below reasonable limits.
References
1. World Energy Supply Scenario: 200-Year Picture Sustained Growth Scenario,
Royal Dutch Shell, 1995.
2. IEA, World Energy Outlook 1998, IEA/OECD, Paris, France, 1998.
3. Solantausta, Y., Podesser, E., Beckman, D., Ostman, A., Overend, R.P., IEA
Bioenergy task 22: Techno-economic assessments for bioenergy applications,
Final report, Technical Research Centre of Finland: Espoo, 2000.
4. Bridgwater, A.V., Ed. Thermo-Chemical Processing of Biomass; Butterworths:
London, UK, 1984.
5. Bridgwater, A.V., Toft, A.J., Brammer, J.G., A techno-economic comparison of
power production by biomass fast pyrolysis with gasification and combustion;
Renewable and Sustainable Energy Rev., 2002. 6, pp. 181-248.
6. Beenackers, A.A.C.M., Maniatis, K., Gasification technologies for heat and
power from biomass; In Biomass gasification and pyrolysis: state of the art and
future prospects, Kaltschmitt M., Bridgwater, A.V., Eds., CPL Press, UK, 1997,
pp. 24-52.
7. Higman, C., van der Burgt, M., Gasification; Gulf Professional Publishing,
Boston, USA, 2003, 391.
8. Henrich, E., Weirich, F., Pressurized Entrained Flow Gasifiers for Biomass;
Envir. Eng. Sci., 2004. 21, pp. 53-64.
9. Henrich, E., Dinjus, E. Tar-free, high pressure synthesis gas from biomass; In
Expert meeting on Pyrolysis and Gasification of Biomass and Waste, Strasbourg,
France: CPL Press, UK, 2002.
27
10. CHOREN, Electricity and heat from biomass: Carbon-V process.
11. Calis, H.-P., Haan, J.P., Boerrigter, H., van der Drift, A., Peppink, G., van den
Broek, R., Faaij, A.P.C., Venderbosch, R.H., Preliminary techno-economic
analysis of large-scale synthesis gas manufacturing from imported biomass; In
Expert meeting on Pyrolysis and Gasification of Biomass and Waste, Strasbourg,
France, CPL Press, UK, 2002.
12. Boerrigter, H., den Uil, H., Calis, H.-P., Green diesel from biomass via Fischer-
Tropsch synthesis: new lights in gas cleaning and process design; In Expert
meeting on Pyrolysis and Gasification of Biomass and Waste, Strasbourg,
France: CPL Press, UK, 2002.
13. Junginger, M., Faaij, A., van den Broek, R., Koopmans, A., Hulscher, W., Fuel
supply strategies for large-scale bio-energy projects in developing countries.
Electricity generation from agricultral and forest residues in Northeastern
Thailand, Biomass and Bioenergy, 2001, 21, pp. 259-275.
14. Hamelinck, C.N., Faaij, A.P.C., den Uil, H., Boerrigter, H., Production of FT
transportation fuels from biomass: technical options, process analysis and
optimisation, and development potential; Utrecht University, Utrecht, The
Netherlands, 2003.
15. Ouwens, C.D. Faaij, A. A comparison of the production costs and the market
introduction of Fischer-Tropsch oil and Ethanol; In Twelfth European Biomass
Conference: Biomass for Energy, Industry and Climate Protection, Amsterdam,
The Netherlands: ETA-Florence and WIP-Munich, 2002.
16. Toft, A.J., A comparison of integrated biomass to electricity systems, Ph.D.
Thesis, University of Aston, Birmingham, UK, 1996.
17. Groeneveld, M., personal communication with Michiel Groeneveld; Shell
Global Solutions, Amsterdam, 2004.
18. Rosillo-Calle, F., Cortez, L.A.B., Towards ProAlcool II - a review of the
Brazilian bio-ethanol programme; Biomass & Bioenergy, 1998, 14, pp. 115-124.
19. Ward, O.P., Singh, A., Bio-ethanol Technology: Developments and Perspectives;
Adv. Appl. Microbiology, 2002, 51, pp. 53-80.
28
20. Tassinari, T., Macy, C., Differential speed two roll mill pre-treatment of
cellulosic materials for enzymatic hydrolysis; Biotechnology and
Bioengineering, 2004, 19, pp. 1321-1330.
21. Schell, D.J., Farmer, J., Newman, M., McMillan, J.D., Dilute-Sulfuric Acid
Pretreatment of Corn Stover in Pilot-Scale Reactor: Investigation of Yields,
Kinetics, and Enzymatic Digestibilities of Solids; Applied Biochemistry and
Biotechnology, 2003, 105-108, pp. 69-85.
22. Palonen, H., Role of lignin in the enzymatic hydrolysis of lignocellulose;
Helsinki University of Technology: Espoo, Finland, 2004.
23. Lawford, H.G., Rousseau, J.D., Cellulosic Fuel Ethanol: Alternative
Fermentation Process Designs with Wild-Type and Recombinant Zymomonas
mobilis; Appl. Biochem. Biotechn., 2003, 106, pp. 457-470.
24. Naber, J.E., Goudriaan, F., van der Wal, S., Zeevalkink, J.A., van de Beld, B.,
The HTU Process for Biomass Liquefaction: R&D Strategy and Potential
Business Development; In The 4th Biomass Conference of the Americas.
Oakland, CA, USA, 1999.
25. Bridgwater, A.V., Bridge, S.A., A review of biomass pyrolysis and pyrolysis
technologies; In Biomass pyrolysis liquids upgrading and utilisation; Elsevier
Science Publishing Co., New York, 1991, pp. 11-92.
26. Bridgwater, A.V., Czernik, S., Diebold, J., Meier, D., Oasmaa, A., Peacocke, C.,
Piskorz, J., Radlein, D., Eds., Fast Pyrolysis of Biomass. A handbook. CPL
Press, UK, 1999.
27. Kersten, S.R.A., Wang, X., Prins, W., van Swaaij, W.P.M., Biomass pyrolysis in
a fluidized bed reactor: Part I. literature review and model simulations; Ind. Eng.
Chem. Res., 2005, pp. 8773-8785.
28. Meier, D., Schoell, S., Klaubert, H., New ablative pyrolyser in operation in
Germany; PyNe newsletter, 2004, Issue 17.
29. Roy, C., Morin, D., Dube, F., The biomass pyrocyclingTM process; In Biomass
gasification and pyrolysis: state of the art and future prospects; Kaltschmitt, M.,
Bridgwater, A.V., Eds., CPL Press, UK, 1997, pp. 307-315.
29
30. Lede, J., Comparison of contact and radiant ablative pyrolysis of biomass; J.
Anal. Appl. Pyrolysis, 2003, 70, pp. 601-618.
31. Lede, J., Panagopoulos, J., Li, H.Z., Villermaux, J., Fast Pyrolysis of Wood:
direct measurement and study of ablation rate; Fuel, 1985, 64, pp. 1514-1520.
32. Wagenaar, B.M., The rotating cone reactor: for rapid thermal solids processing;
Ph.D. Thesis, University of Twente, Enschede, The Netherlands, 1994.
33. Janse, A.M.C., A heat integrated rotating cone reactor system for flash
pyrolyisis of biomass; Ph.D. Thesis, University of Twente, Enschede, The
Netherlands, 2000.
34. Freel, B.A., Graham, R.G., Method and apparatus for a circulating bed transport
fast pyrolysis reactor system; US Patent 5,792,340, 1998.

30
31
Chapter 2
Biomass Pyrolysis in a Fluidized Bed
Reactor. Part I: Literature Review and
Model Simulations
Abstract
The literature on biomass pyrolysis regarding kinetics, models (single particle and
reactor), and experimental results is reviewed from an engineering point of view.
Predictions of existing single particle models derived from a detailed description of
the transport phenomena and literature data on measured intrinsic chemical kinetics
are presented. The main conclusions from the literature and modeling studies can be
summarized as follows: 1) the available knowledge on kinetics and transport
phenomena has not been integrated properly for reactor design, 2) complex two-
dimensional single particle models do not provide more accurate, or otherwise better,
information for engineering calculations than do the simple one-dimensional models,
and 3) single particle models predict (for all available kinetics) that the influence of
the particle size on the liquid yield is limited. This effect can be explained with the
effective pyrolysis temperature, a parameter that represents the particle’s average
temperature at which the conversion is essentially taking place.
32
1. Introduction
Biomass is becoming increasingly important as a renewable source. Fast pyrolysis is
one of the possible technologies facilitating the fuelling of biomass into a wide variety
of energy production installations. It is a high temperature (ca. 500oC) process in
which biomass is rapidly converted, in the absence of oxygen, to vapors, gases, and
charcoal. After cooling and condensation, a dark brown liquid is formed that is often
called bio-oil. The process is optimized toward maximal bio-oil production. Apart
from direct combustion in boilers or prime movers for the production of heat, shaft
power, or electricity, bio-oil is also considered for upgrading to blending components
for transportation fuel through either hydrogenation [1,2] or gasification followed by
Fischer-Tropsch or methanol synthesis [3–7].
From pyrolysis handbooks and overview papers [8-15], it is learned that for optimal
fast pyrolysis in terms of liquid yield, the temperature required is approximately
500oC, the biomass particle size should be small ( 2 mm), and the produced vapors
should be separated from the char and condensed immediately to prevent secondary
cracking to gaseous products.
The last two statements are insufficiently supported by theoretical or experimental
evidence. In some cases, even contradictory experimental findings have been reported
in the literature. These statements are, however, crucial for reactor and process design.
For instance, a reevaluation of the most suitable reactor configuration would be
required if larger biomass particles could be used. Moreover, it is insufficiently
recognized that the process temperature for a maximum liquid yield may differ from
the one for a specific bio-oil quality.
This research includes two separate parts. Part I is concerned with a literature review
and modeling studies, while part II [16] contains the experimental validation of model
results. It is meant to study fast pyrolysis in fluid beds and to clarify the reference
points for reactor design. Although the research is dealing mainly with pyrolysis in a
fluidized bed, application of the results presented is not restricted to it. The fluid bed
experiments reported in part II are representative for pyrolysis carried out under
known and spatially isotherm external conditions, and high heat transfer rates to the
particle. Apart from fluidized beds, those conditions prevail in many other reactor
types such as a circulating fluid bed, a transported bed reactor, a rotating cone, or a
cyclonic reactor. Fixed bed type reactors, screw reactors, and ablative reactors are,
however, of a different nature [17].
33
The behavior of the individual biomass particles inside the reactor is important for the
design of a pyrolysis reactor. Parameters such as the conversion time (reaction rate),
the time-averaged bio-oil yield and quality, and the particles’ residence time and
spatial distribution are essential. They are determined by the feedstock type and
dimensions, as well as by the prevailing reactor conditions (e.g., the external heat
transfer coefficient). The conversion time and the time-averaged yields can be
predicted with single particle pyrolysis models. Once the particles’ devolatilization
rate is known, the required hold-up of reacting particles (ranging from fresh biomass
to charcoal) in the reactor can be calculated for a certain biomass throughput. The
required hold-up of reacting particles determines, amongst others, the volume of the
reactor. Knowledge of the product selectivity observed for single particles, data on
secondary cracking of the vapor products, the overall mixing state of the gas phase,
and the char hold-up (tar cracking) are all required to determine the optimal process
temperature for a maximum bio-oil yield and/or a desired bio-oil quality.
In part I (this paper), the literature on biomass pyrolysis concerned with experimental
results, in particular the effect of the operating conditions, kinetics, and models is
reviewed from an engineering point of view. Predictions of existing single particle
models derived from a detailed description of the transport phenomena and literature
data on measured intrinsic chemical kinetics are presented. In part II [16] (subsequent
paper), experimental results of fluid bed pyrolysis are presented and compared with
predictions of these models.
2. Literature Review
The literature on biomass fast pyrolysis is quite extensive, and excellent technology
reviews [8-15] are available. In the following subsections, the available literature with
respect to the parameters important for reactor design will be briefly discussed. Four
types of investigations are especially relevant in this respect. Quite a number of
publications are dedicated to the intrinsic kinetics of primary and secondary
decomposition reactions and product distribution. A second type of published papers
is concerned with the development of single particle models in which the reaction
kinetics are combined with intraparticle transport phenomena and heat transfer from
the bulk to the particle. The third series of investigations deals with laboratory and
pilot-plant measurements of product distributions as a function of the reactor
34
temperature, the type/size of feedstock, and (occasionally) the vapor residence time.
We will focus here on results obtained for fluid beds, because the experimental part of
this work (part II [16]) also deals with fluid bed pyrolysis. Finally, a few publications
on reactor design that appeared recently in the literature will be discussed.
2.1. State of the Art of Fast Pyrolysis Technology
Although laboratory studies regarding the thermal decomposition of various organic
substances have been carried for a much longer period, the technology development
of “fast” and “flash” pyrolysis started only some 20 years ago when the advantages of
liquefying biomass in such a simple way were gradually recognized. During the 1980s
and the early 1990s, research was focused on the development of special reactors such
as the Vortex reactor [18,19], rotating blades reactor [20,21], rotating cone reactor
[22,23], cyclone reactor [24,25], transported bed reactor [26], vacuum reactor [27,28],
and the fluid bed reactor [26,29,30].
Since the late 1990s the process realization emerged, resulting in the construction of
pilot plants in Spain (Union Fenosa) [31,32], Italy (Enel) [26], UK (Wellman) [33],
Canada (Pyrovac, Dynamotive) [34,35], Finland (Fortum) [36], and The Netherlands
(BTG) [23]. In the U.S. and Canada, Ensyn’s entrained flow bed process [37] is
applied at a scale of around 1 ton/hr for commercial production of a food flavor called
“liquid smoke”. Dynamotive and BTG announced demonstration installations of 2 - 4
tons biomass throughput per hour to be under construction. These companies aim at
the utilization of bio-oil for energy production and, in a later stage, chemicals. Many
pilot-plant projects have stopped, soon or late after the initial testing. At the time of
writing (March 2005), the plants of Union Fenosa, Enel, Wellman, Fortum, and
Pyrovac’s large-scale installation in Jonquiere, Canada, were not in operation any
more. This may be caused by a lack of confidence in economic prospects and markets,
or by legislative limitations.
A successful co-firing test with 15 tons of bio-oil has been conducted in a 350 MWe
power station in The Netherlands [38]. Entrained flow gasification (high pressure,
oxygen blown) of bio-oil and bio-oil/char slurries has been demonstrated also on a
substantial scale [4].
35
2.2. Kinetics and Rate Expressions
A general concern in the measurement of pyrolysis kinetics is the exclusion of heat
transport limitations. Wagenaar et al. [39,40] concluded that the application of a
thermogravimetric analysis (TGA) is therefore limited to ca. 450°C. At higher
temperatures, he used small particles in a drop tube furnace. TGA is the most
frequently used tool for kinetic analysis of biomass conversion. Grønli et al. [41]
report on a Round-Robin study in which eight laboratories with access to five
different types of thermogravimetric analyzers performed pyrolysis experiments at
heating rates of 5 and 40oC/min while using Avicel PH-105 cellulose as feedstock.
The eight laboratories measured char yields in the range of 2.9 - 10.5 wt % (at
40oC/min). For a certain fixed value of the weight loss, the scatter in the temperature
measurement was about 17oC. Grønli et al. ascribed the differences in results
primarily to variations in the thermal lag of the instruments used, and to the different
heating rates applied. The thermal lag is defined as the difference between the
temperature of the direct environment of the sample, which is controlled by the TGA,
and the actual temperature of the sample [42]. This Round-Robin concludes that i)
biomass pyrolysis kinetics are inherently difficult to measure by any technique, but
that TGA gives the most reliable data, and ii) differences between studies using the
same feedstock are still significant and caused by systematic errors in the applied
methods. Similar discussions on the impact of systematic errors during the
determination of pyrolysis kinetics are reported by Antal and Várheghi [43-45].
Kinetic expressions describing merely the weight loss of biomass have been published
frequently in the literature [43, 46-51]. For woody biomass, however, kinetics
including the selectivity to the products are determined only by Wagenaar et al. [40],
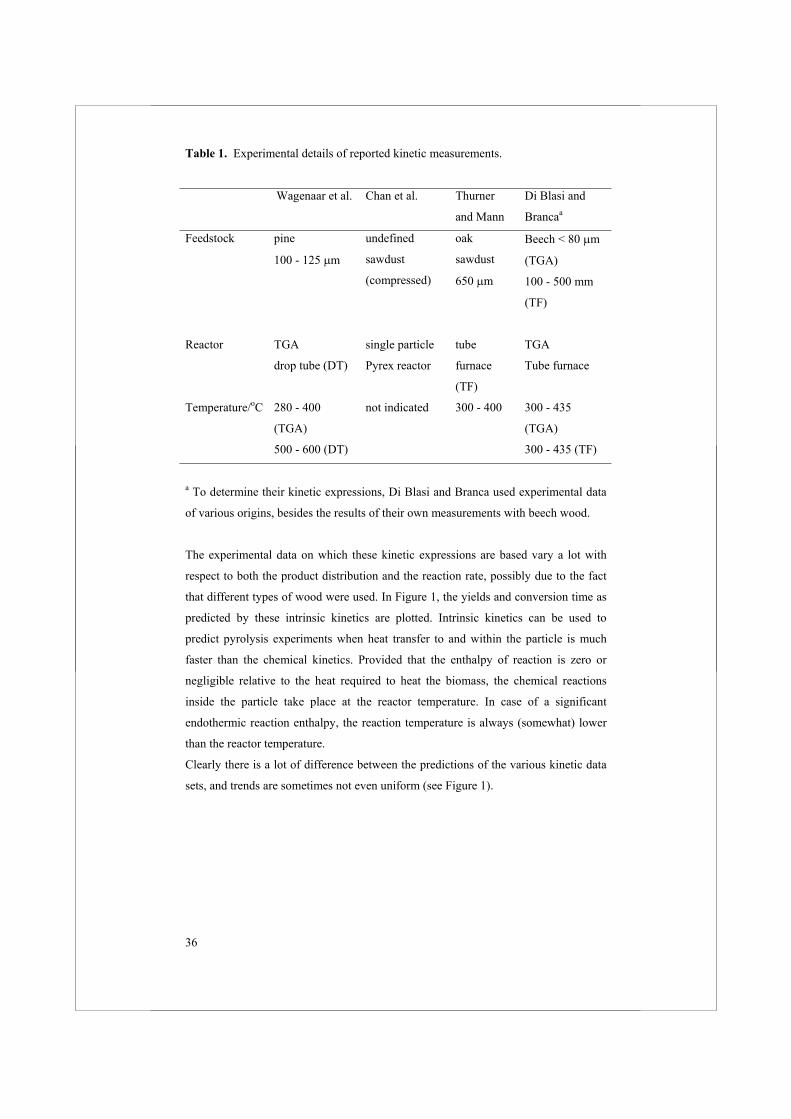
Chan et al. [52], Thurner and Mann [53], and Di Blasi and Branca. [54]. In Table 1,
the details of the experimental apparatuses and conditions used by these researchers
are summarized.
36
Table 1. Experimental details of reported kinetic measurements.
Wagenaar et al. Chan et al. Thurner
and Mann
Di Blasi and
Brancaa
Feedstock pine
100 - 125 m
undefined
sawdust
(compressed)
oak
sawdust
650 m
Beech < 80 m
(TGA)
100 - 500 mm
(TF)
Reactor TGA
drop tube (DT)
single particle
Pyrex reactor
tube
furnace
(TF)
TGA
Tube furnace
Temperature/oC 280 - 400
(TGA)
500 - 600 (DT)
not indicated 300 - 400 300 - 435
(TGA)
300 - 435 (TF)
a To determine their kinetic expressions, Di Blasi and Branca used experimental data
of various origins, besides the results of their own measurements with beech wood.
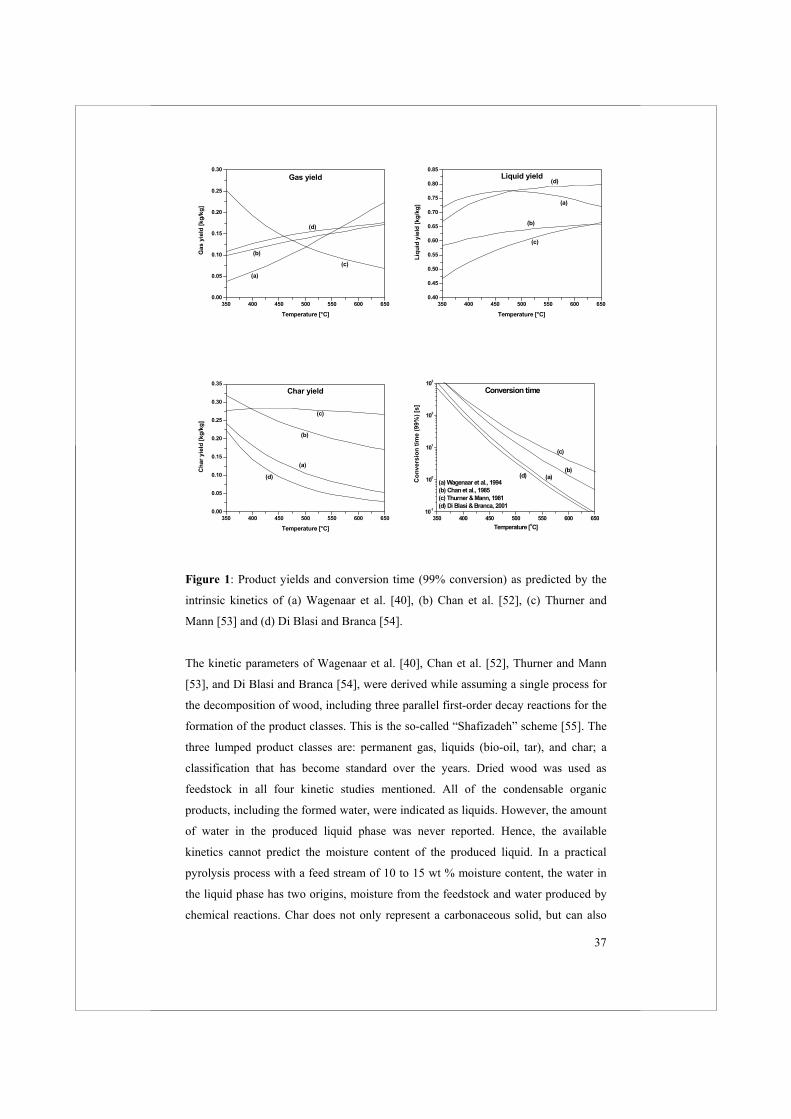
The experimental data on which these kinetic expressions are based vary a lot with
respect to both the product distribution and the reaction rate, possibly due to the fact
that different types of wood were used. In Figure 1, the yields and conversion time as
predicted by these intrinsic kinetics are plotted. Intrinsic kinetics can be used to
predict pyrolysis experiments when heat transfer to and within the particle is much
faster than the chemical kinetics. Provided that the enthalpy of reaction is zero or
negligible relative to the heat required to heat the biomass, the chemical reactions
inside the particle take place at the reactor temperature. In case of a significant
endothermic reaction enthalpy, the reaction temperature is always (somewhat) lower
than the reactor temperature.
Clearly there is a lot of difference between the predictions of the various kinetic data
sets, and trends are sometimes not even uniform (see Figure 1).
37
350 400 450 500 550 600 6500.00
0.05
0.10
0.15
0.20
0.25
0.30
(c)
(d)
(b)Gas
yie
ld [k
g/kg
]
Temperature [°C]
(a)
Gas yield
350 400 450 500 550 600 6500.40
0.45
0.50
0.55
0.60
0.65
0.70
0.75
0.80
0.85
(c)
(b)
(d)
Liqu
id y
ield
[kg/
kg]
Temperature [°C]
(a)
Liquid yield
350 400 450 500 550 600 6500.00
0.05
0.10
0.15
0.20
0.25
0.30
0.35
(c)
(b)
(d)
Cha
r yie
ld [k
g/kg
]
Temperature [°C]
(a)
Char yield
350 400 450 500 550 600 65010-1
100
101
102
103
(d) (a)
(c)
Con
vers
ion
time
(99%
) [s]
Temperature [oC]
(a) Wagenaar et al., 1994 (b) Chan et al., 1985(c) Thurner & Mann, 1981(d) Di Blasi & Branca, 2001
(b)
Conversion time
Figure 1: Product yields and conversion time (99% conversion) as predicted by the
intrinsic kinetics of (a) Wagenaar et al. [40], (b) Chan et al. [52], (c) Thurner and
Mann [53] and (d) Di Blasi and Branca [54].
The kinetic parameters of Wagenaar et al. [40], Chan et al. [52], Thurner and Mann
[53], and Di Blasi and Branca [54], were derived while assuming a single process for
the decomposition of wood, including three parallel first-order decay reactions for the
formation of the product classes. This is the so-called “Shafizadeh” scheme [55]. The
three lumped product classes are: permanent gas, liquids (bio-oil, tar), and char; a
classification that has become standard over the years. Dried wood was used as
feedstock in all four kinetic studies mentioned. All of the condensable organic
products, including the formed water, were indicated as liquids. However, the amount
of water in the produced liquid phase was never reported. Hence, the available
kinetics cannot predict the moisture content of the produced liquid. In a practical
pyrolysis process with a feed stream of 10 to 15 wt % moisture content, the water in
the liquid phase has two origins, moisture from the feedstock and water produced by
chemical reactions. Char does not only represent a carbonaceous solid, but can also
38
include high-molecular-weight tar components [56-61] and minerals. It should be
noticed that the kinetic selectivity expressions are obtained by regression of yield
versus temperature data. In the absence of any underlying mechanistic model,
extrapolation outside the experimentally validated regime is basically impossible.
Stenseng et al. [62] validated several reaction rate expressions against experimental
data of wheat straw pyrolysis, for conditions outside the range they were derived
from. They concluded that none of the rate expressions could be extrapolated outside
the range of applied conditions, and that a widely applicable kinetic model for
pyrolysis is still missing. In their analysis, they included: a first-order decay reaction,
a three parameter nucleation model, a distributed activation energy model, and a
superposition model based on first-order reactions. Of these reaction rate equations,
the distributed activation energy model showed the best performance. The others
failed completely when applied outside the validated regime, while the distributed
activation energy model could still predict trends. Distributed activation energy
models have also been discussed by Varhegyi et al. [63], Wojtowicz et al. [64] and
Rostami et al. [65]. They found again a good agreement between model predictions
and experimental results. Unfortunately, the reported kinetics using the distributed
activation energy approach only considered the total conversion of biomass and not
the selectivity toward the products.
The kinetic constants of tar conversion are determined by Antal [66], Diebold [67],
Liden et al. [68] and Boroson et al. [69,70]. Diebold, Liden et al., and Boroson et al.
interpreted their experimental results with a single first-order rate equation for the
cracking of tar to permanent gases. Antal, however, proposed a scheme of two parallel
(competing) first-order reactions to permanent gases and refractory condensable
materials. Antal [66], Diebold [67], Liden et al. [68] did measurements for different
limited temperature ranges. On the basis of these measurements Wagenaar et al.
[39,40] derived a rate expression for a much wider temperature range, from of 450 -
800°C. As explained further in section 2.4 “Vapor Residence Time”, char catalyzes
the decomposition of tar.
To conclude, there is wide variation in data published for combined values of the pre-
exponential factor and activation energy. Published rate and selectivity expressions
may be valuable in describing trends, but they can hardly ever be used for reliable
quantitative prediction of anything else than the corresponding original data. The
scatter in the reported results is caused by systematic errors in the measurement
technique, the type of biomass, and by the employed interpretation models. In view of
39
the complex reaction network including even catalytic effects of minerals, it is indeed
unrealistic to expect that the thermal degradation of biomass can be described
accurately with a simple set of rate/selectivity equations.
2.3. Single Particle Models
During the last 60 years, many models have been published concerning the thermal
degradation of a single biomass particle. In 1946, Bamford [71] formulated the first
model for the weight loss of wooden sheets being exposed to gas flames. Many
researchers subsequently used this basic model. Roberts et al. [72], for instance,
modified the model by incorporating the effect of internal convection. Publications
concerned with detailed modeling of biomass pyrolysis on particle level are those by,
for example, Di Blasi [73-75] and Bellan and co-workers [76]. These detailed models
include chemical kinetics, moisture evaporation, particle shrinkage, heat transfer to
and through the particle (conduction, convection and radiation), and convective mass
transfer inside the particle. It has been concluded by several researchers that the
contribution of the diffusion flux of the produced vapors, as compared to convective
flow, can be neglected [77-79]. In the single particle models, moisture evaporation is
described with an Arrhenius-type equation [77,80,81].
Pyle and Zaror [82] showed that it is relatively easy to identify the controlling steps of
wood pyrolysis. They gave guidelines for the simplification of a one-dimensional
pyrolysis model to models for 1) “kinetically controlled”, 2) “external heat transfer
controlled” (uniform particle temperature), and 3) “internal heat transfer controlled”
(shrinking core) pyrolysis. Py and Py' numbers were proposed, which can be used to
determine whether heat transfer or reaction is the faster mechanism. The model results
were validated successfully against experimental pyrolysis data of large cylindrical
pine wood particles with a high lp/dp ratio. The cooling effect of the outward flowing
vapors has been studied and quantified by Di Blasi [73,74], Janse [81], and Kersten
[77].
Most model results reported in the literature are difficult to apply directly with respect
to reactor design because they are focused on the description of intraparticle
phenomena rather than on the prediction of reaction rates and product distributions as
function of the operating conditions prevailing in practical pyrolysis reactors.
40
2.4. Continuous Laboratory Experiments in Fluid Beds
The first results of fluidized bed pyrolysis were those by Scott and his co-workers. In
a series of publications [12,29, 83-86], they presented data obtained in their Waterloo
bench-scale plant (~ 20 g/h) and pilot-plant (max 3 kg/h). The experimental program
involved variation of the feedstock, reactor temperature, vapor residence time, and
particle size. In the Waterloo plants, liquid yields (organics plus water) ranging from
60 - 85 wt % on moisture free feedstock basis were reported, depending on the
biomass type and the operating conditions. A selection of later publications concerned
with fluidized bed pyrolysis are those by Agblevor et al. [87], Horne and Williams
[88], Peacocke et al. [20,89,90], Hague [91], Bilbao et al. [92], Luo et al. [93], and
Olazar et al. [94]. Regarding the trends, the results obtained are in good agreement
with those reported in the original work of Scott et al. However, in later
investigations, the highest liquid yields of Scott and co-workers (> 80 wt %) could
never be reproduced anymore. In the following subsections, the reported effects of the
operating conditions are discussed. While analyzing the effect of the operating
conditions, it must be realized that the reported mass balance closure is typically
around 90 - 95%. Hence, rather small difference (say 3%) in results (e.g., yields)
cannot be interpreted as a distinct trend.
Reactor Temperature
Quite some experimental results can be found in the literature [12,20,29, 83-94]
regarding the influence of the fluid bed temperature on the product distribution,
particularly the bio-oil yield. As a function of temperature, the liquid yield goes
through a maximum. For a variety of feedstock types, it has been observed that the
maximum yield of bio-oil is obtained at temperatures of around 400 - 550oC.
However, taking into account the experimental errors, it can be argued that many
researchers actually observed a plateau in the liquid yield over several decades of
degrees centigrade within the range of 400 - 550oC. Over the whole temperature
range, generally, a monotonic decrease in char yield and corresponding increase in
gas yield was found.
According to Scott et al. [85], the best bio-oil quality in terms of caloric value and
hydrogen over carbon ration is also achieved at the maximum yield temperature. Over
the past decade, a number of authors, including Scholze et al. [95,96], and Oasmaa et
al. [97,98], discussed the quality of bio-oil in some more detail [99-101].
41
Biomass Particle Size
Surprisingly, the biomass particle size has hardly been a systematically varied
parameter in fluidized bed fast pyrolysis research. The attention was focussed mainly
on “flash” pyrolysis requiring heating rates over 1000oC/s and, consequently, very
small particles (dp < 1 mm). The published work regarding the influence of the
particle size on the yield and quality of bio-oil was limited to the size range from 44
m to 2 mm [29,83,102]. In this range, no significant influence of the particle size on
the product yields has been reported.
In fixed beds, the particle size has been varied over a wider range [61,103].
Fiqueiredo et al. [61] observed that oil yields of holm oak wood chips did not vary as
a function of the particle size in the range from 0.4 to 2 mm. Roy et al. [103] reported
that a yield of almost 74 wt % of bio-oil (total liquids including water) was obtained
from air-dried aspen saw dust at 450oC, while a yield of 67 wt % was achieved for 1
cm aspen wood chips. Kelbon et al. [104] did experiments with single particles heated
by an arc lamp at constant flux (W/m2). At a flux of 8.4 x 10⁴ W/m2, they found that
the liquid yield of 1.5, 1 and 0.5 cm (length) wood cylinders was 65, 48, and 38 wt %,
respectively. For fluxes of 16.8 and 25.2 W/m2, they observed nearly identical liquid
yields for all particle sizes.
Unfortunately, literature results regarding the effect of the particle size over a wide
range in a single reactor are not available. One could try to derive a relation on basis
of data from different reactor types. However, this relation would be very difficult to
interpret because of the fundamental differences between the reactors used,
particularly concerning the intra-reactor temperature gradients, the external heat
transfer coefficient, extra-particle vapor residence time, and the hold-up of char being
a cracking catalyst.
For this paper (part I), the particle size has been varied therefore over a wide range (dp
= 0.01 - 20 mm) in simulations with single particle models. In part II [16] these model
predictions are compared with results of real pyrolysis experiments in a fluid bed (dp
= 0.7 - 17 mm).
In some publications, the effect of the particle size on the conversion time [81, 105-
107] is discussed on basis of both measurements and modelling. Particle sizes up to a
few centimeters were used in the experiments. It was found that the observed
conversion times and intraparticle temperature gradients, as a function of the particle
size, could be well understood from simple one-dimensional single particle models
(Bamford’s model [63]).
42
Heating Rate and Heat Flux
The effect of the heating rate has only been studied: i.) in (semi-)batch fixed bed
reactors installed in a laboratory oven [108,109], ii.) by heating single particles in an
oven [105,110,111], iii.) by heating single particles with a lamp [104,112]. In all
experiments, the heating rate (°C/s) or the heat flux (W/m2) of the biomass sample is
controlled and monitored accurately. The general conclusion from the batch tests is
that the applied heating rate has a significant effect on the pyrolysis process,
particularly on the oil yield, which is reported to drop in case of lower heating rates at
otherwise constant conditions. Theoretical analysis of the effects of the heating rate
are also available in literature, for example in the work by Lede [113-115].
In practical pyrolysis reactors like fluid beds, neither the heating rate nor the heat flux
are independent variables. They are in fact nonstationary and dependent on local
conditions. It is not clear how experiments under “controlled” heating conditions can
be translated to continuous reactors.
Vapor Residence Time
Scott et al. [12] and Liden et al. [68] measured the effect of the vapor residence time
in a fluid bed reactor in the range of 0.2 - 0.9 s. At 525°C, they found that in this
range the liquid yield dropped from 75 to 60 wt %. Lower oil yields at prolonged
vapor residence time are ascribed to cracking and polymerization reactions of vapors
to gases and solids, respectively. On the basis of their measurements, Liden et al.
[116] derived the kinetic constants for tar cracking while assuming a first-order decay
reaction. Besides by Liden et al., cracking reactions of pyrolysis vapors have been
studied and quantified also by Boroson et al. [69], Antal [66], and Diebold [67].
However, they measured homogeneous tar cracking, whereas Liden at al. [116] used a
fluid bed with a considerable char hold-up. The first order kinetic constants (k) vary
between ~ 0.04 and 0.20 (s-1) at 500oC. This range is rather large; the lowest value
allows a vapor residence time of 5 s to keep the loss of primary tar limited to 10%, the
highest value only 1 s.
Vapor cracking rates cannot be compared on residence time and temperature basis
only, because also the amount of char in the reactor is reported to have a significant
effect on the extent of cracking. Boroson et al. [117] performed controlled
experiments in which they led pyrolysis vapors over a char bed. They found that
already at 400°C a fraction of wood tar is very reactive in the presence of wood char.
No “catalytic” rate equations, containing specific information on the char used, are
available in the literature.
43
An interesting observation was reported by Freel at al. [118], who showed that, at 650
and 850oC, the liquid yield decreased due to homogeneous gas-phase cracking for
vapor residence times increasing from 0.1 to 1 s. It remained, however, constant for
any longer residence times. This behavior cannot be explained with a single first-
order decay reaction for tar cracking. However, with the scheme of Antal [66] that
includes parallel reactions of primary tar to gases and refractory (less reactive) tar, it
can be explained indeed. According to this mechanism, primary tar can be converted
rapidly to gases and less reactive refractory tar that does not, or very slowly,
decompose. The explanation further assumes that primary tar and refractory tar form a
single liquid upon condensation.
Both the single reaction and the competing reactions scheme plea for a reactor design
in which the produced vapors are quenched rapidly as this maximizes the liquid yield.
In addition, the competing reactions scheme predicts that at increased vapor residence
time the composition of the liquid is changing from primary tar to refractory tar. This
adds an oil quality aspect to the discussion of the vapor residence time. If primary tar
would be a better bio-liquid constituent than refractory tar, short residence times
would be preferred even though the total liquid yield remains unaffected.
Unfortunately, there are no studies available that analyze the composition of the
recovered liquid as function of the vapor residence time.
2.5. Reactor Design and Modeling
The number of publications concerning fluid bed design and modeling is limited. Di
Blasi [74,107] presented a fluid bed model in which the emphasis is completely on the
single particle behavior. A reactor model is introduced via the external heat transfer
coefficient and an extra-particle residence time of the gas phase to account for vapor
cracking in the bulk. On the other hand, Lathouwers and Bellan [119] developed a
fluid bed reactor model based on a multi-fluid approach including the kinetic theory
of granular flow. In this model, a computational fluid dynamics description of a fluid
bed is coupled with the devolatilization characteristics of discrete particle classes. The
results of this comprehensive model are, however, not straightforward to interpret and
to use for reactor design. It is not clear how the energy required is brought into the
reactor and how, in practice, a preheated biomass feed (up to 225°C) could be created.
Gerhauser [120,121] employed CFD modeling to study fluidized bed reactor scale-up.
He concluded that the heat input into the fluidized bed is a major concern for
pyrolysis reactors with a size of 100 tons per day or larger.
44
3. Single Particle Model Calculations
Two models, adopted from the literature, are used in this work. Results of simulations
will be presented and compared with experimental results (part II [16]), to evaluate
the descriptive and predictive power of such single particle models.
1) The first is a two-dimensional (2D) model as described by Di Blasi [75]. In this
model, both conductive and convective heat transport are taken into account and
the physical properties (e.g., permeability, conductivity) can be anisotropic. The
convective fluxes of vapors and gases are modeled with Darcy’s law. For more
information regarding the model, the reader is referred to the original
publications [75,77].
2) The second is a one-dimensional (1D) model as proposed by Bamford [71] that
assumes the heat transfer within the particle to occur by conduction only.
The major assumptions of both models are that i) cylindrical particles are considered,
ii) the volume of the particle does not change during devolatilization, iii) there is
thermal equilibrium between the vapors and the solid matrix, and iv) the enthalpy of
the pyrolysis reaction is zero (the effects of an endothermic reaction will be discussed
to a certain extent). The pyrolysis reaction is described by the scheme proposed by
Shafizadeh [55]. As mentioned before, the liquid phase predicted by the used
pyrolysis kinetics includes, next to organics, all the water produced. The applied
kinetics were derived for dry wood, while wood with a moisture content of ca 7.5 wt
% was used in the experimental part of this work (part II [16]). Therefore, evaporation
of this moisture has been incorporated in the single particle models. Moisture
evaporation is described by an Arrhenius rate equation as proposed by Bryden and
Hagge [80]. The liquid yield resulting from the single particle models is thus made up
out of liquid predicted by the primary kinetics, plus the moisture evaporated from the
feed. The actual moisture content of this liquid cannot be predicted because the
formed water was not separately taken into account in the kinetic studies (see section
2.2). Cracking of vapors to gas is modeled as a first order reaction. In the model the
conversion time ( ) was defined as the time at which 99% (wt) of the initial biomass
is decomposed. The conversion is calculated using the equation below:
X W WW W
0
0
(1)
45
The coupled system of partial differential equations describing the model is solved by
applying the method of lines in a DAE solver environment in MATLAB©. Tests were
performed to ensure that the obtained results were grid independent and convergent.
For the 2D model, usually a grid of 40x40 spatial grid cells showed sufficient
accuracy. Table 2 gives the physical properties of the particles used in the
calculations. Dimensionless numbers used in this paper (e.g., Bi, ) are always based
on initial values of the involved parameters (e.g., , , Cp).
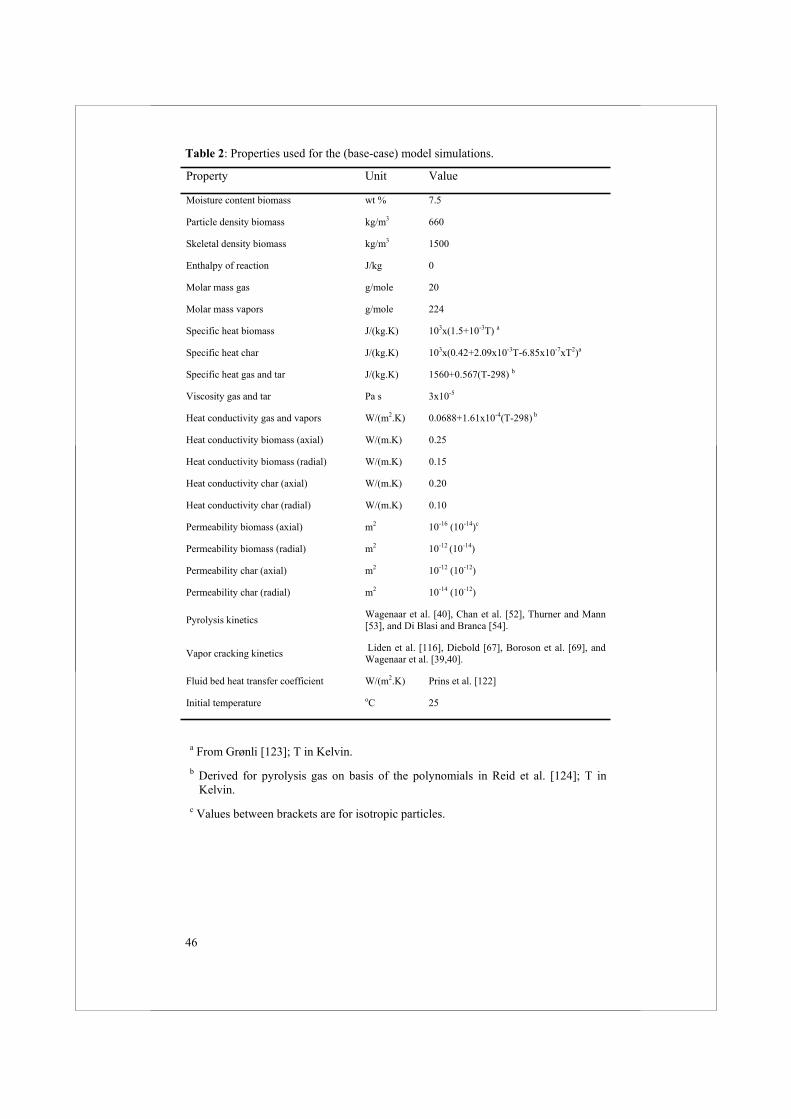
46
Table 2: Properties used for the (base-case) model simulations.
Property Unit Value
Moisture content biomass wt % 7.5
Particle density biomass kg/m3 660
Skeletal density biomass kg/m3 1500
Enthalpy of reaction J/kg 0
Molar mass gas g/mole 20
Molar mass vapors g/mole 224
Specific heat biomass J/(kg.K) 103x(1.5+10-3T) a
Specific heat char J/(kg.K) 103x(0.42+2.09x10⁻³T-6.85x10⁻⁷xT2)a
Specific heat gas and tar J/(kg.K) 1560+0.567(T-298) b
Viscosity gas and tar Pa s 3x10⁻⁵
Heat conductivity gas and vapors W/(m2.K) 0.0688+1.61x10⁻⁴(T-298) b
Heat conductivity biomass (axial) W/(m.K) 0.25
Heat conductivity biomass (radial) W/(m.K) 0.15
Heat conductivity char (axial) W/(m.K) 0.20
Heat conductivity char (radial) W/(m.K) 0.10
Permeability biomass (axial) m2 10-16 (10-14)c
Permeability biomass (radial) m2 10-12 (10-14)
Permeability char (axial) m2 10-12 (10-12)
Permeability char (radial) m2 10-14 (10-12)
Pyrolysis kinetics Wagenaar et al. [40], Chan et al. [52], Thurner and Mann [53], and Di Blasi and Branca [54].
Vapor cracking kinetics Liden et al. [116], Diebold [67], Boroson et al. [69], and Wagenaar et al. [39,40].
Fluid bed heat transfer coefficient W/(m2.K) Prins et al. [122]
Initial temperature oC 25
a From Grønli [123]; T in Kelvin. b Derived for pyrolysis gas on basis of the polynomials in Reid et al. [124]; T in
Kelvin. c Values between brackets are for isotropic particles.
47
4. Simulation Results and Discussions
In the first subsection, 4.1, the results of the 1D and 2D model will be compared. The
effects of the external heat transfer coefficient and the particle size will then be
discussed in subsections 4.2 and 4.3, respectively. In part II [16], more simulation
results will be presented to allow a proper comparison with experimental results of
fluid bed pyrolysis. In this work, we focus on the conversion time (reaction rate) and
the product yield. These particle-related parameters are important for reactor design.
The importance of a good estimate of the conversion time for reactor design becomes
clear when realizing that at a given feed rate the required hold-up of reacting particles
(from fresh biomass to char) is approximately proportional to the conversion time.
The hold-up of reacting particles determines, amongst others, the total reactor volume
and is important from an operational point of view. The amount of char in a fluid bed
in case of 3 mm biomass particles, for instance, is limited to ca. 5 wt % of the total
bed [125,126]; higher fractions cause fluidization problems (e.g., heavy segregation).
The product yield, in particular the oil yield, is important because the pyrolysis
process aims at a maximum oil production.
4.1. Comparison between 2D or 1D Models
Table 2 shows the predicted conversion time and product yields for a dry wood
particle with a diameter of 5mm that was supposed to be converted at a reactor
temperature of 527°C (800 K). Simulation results of the 2D- and 1D-model are
compared. The corresponding conversion time and yields of kinetically controlled
pyrolysis are also included in Table 3. With the 2D-model, the effects of isotropic
versus anisotropic permeability and the lp/dp has been analyzed. The 1D-model,
obviously, represents a particle with infinite lp/dp. The typical anisotropic structure of
wood causes all the produced vapors to flow out of the particle in axial direction near
the reaction front, parallel to the fibers. In case of particles with an isotropic structure,
the produced vapors flow out over the whole surface of the particle (see Di Blasi et al.
[75] and Kersten [77]). As a consequence of this difference in outflow pattern of
produced vapors, heating of anisotropic particles will not be counteracted so much by
the cooling effects of these vapors. Hence, when comparing identical particles with
different permeability orientation, the isotropic particle will have a longer conversion
time. For gasification conditions (T > 800°C), the difference in conversion time
between particles with isotropic and anisotropic permeability can be up to 50% (see
48
Kersten [77]). At pyrolysis conditions (say T < 550°C), however, this effect is
limited to 10% (see Table 3 and Kersten [77]), which is small in comparison with the
uncertainties in the chemical kinetics. The simulations indicate that, for typical
pyrolysis temperatures, the cooling effect of the out flowing produced vapors does not
have an important influence on the pyrolysis time. With respect to the product yields,
the influence of the permeability orientation is marginal (see Table 3). Kersten [77]
concluded on the basis of simulations with a full 2D model, including vapor cracking
kinetics [39], that under pyrolysis conditions (~500°C) intraparticle tar cracking does
not proceed to a significant extent.
Simulations with the 2D and 1D model give nearly identical conversion times in case
of particles with large aspect ratio (lp/dp 3) (see Table 3 and Figure 2). The effect on
the product distribution is marginal, and the conversion time is over predicted slightly
by the 1D model. This conclusion has been put forward also by Miller and Bellan
[127]. Particles with lp/dp < 3 require two-dimensional models for accurate prediction
of the conversion time because below this value a significant amount of heat
penetrates into the particle through the flat surface (see Figure 2). However, analysis
of the data in Figure 2 shows that for engineering purposes also a one-dimensional
model combined with a correction factor to account for the effect of lp/dp gives good
results. In this case, the one-dimensional model is used to calculate the conversion
time at lp/dp = , where after Fourier’s linear conductive heat equation is used to scale
the results to finite length over diameter ratios. With the Fourier equation, the heating
time ( H) of a particle with given lp/dp can be compared with the heating time of a
particle with the same diameter for lp/dp = at otherwise identical conditions. The
ratio of these heating times is used as correction factor (P) to scale the conversion
time calculated with the 1D model to finite lp/dp ratios. Analytical solutions of the
Fourier equation are available (see, e.g., Carlslaw and Jaeger [128]) to enable quick
calculation of P.
/( / ) (1D model) ( / )p pp p L d p pL d L d (2)
( / , , , )( / )
( / , , , )H p p p
p pH p p p
L d d BiL d
L d d Bi (3)
As mentioned before, the thermal diffusivity and the dimensionless number Bi are
based on initial conditions and can have different values for the radial and axial
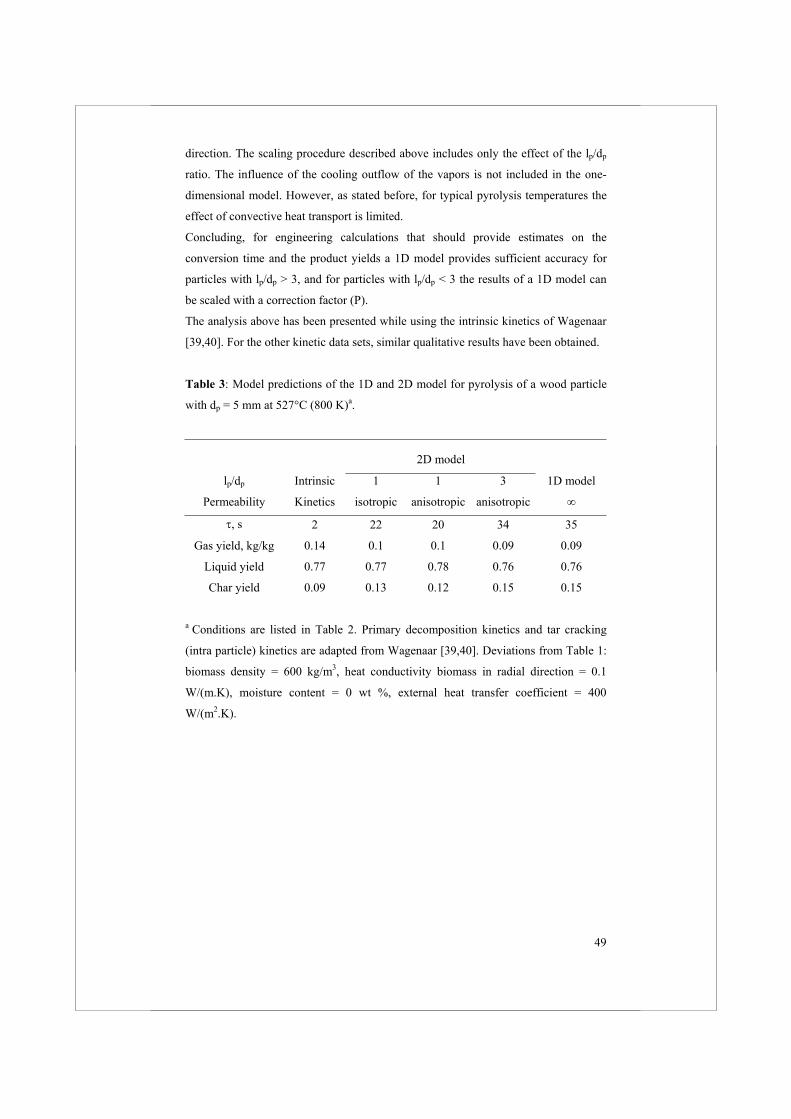
49
direction. The scaling procedure described above includes only the effect of the lp/dp
ratio. The influence of the cooling outflow of the vapors is not included in the one-
dimensional model. However, as stated before, for typical pyrolysis temperatures the
effect of convective heat transport is limited.
Concluding, for engineering calculations that should provide estimates on the
conversion time and the product yields a 1D model provides sufficient accuracy for
particles with lp/dp > 3, and for particles with lp/dp < 3 the results of a 1D model can
be scaled with a correction factor (P).
The analysis above has been presented while using the intrinsic kinetics of Wagenaar
[39,40]. For the other kinetic data sets, similar qualitative results have been obtained.
Table 3: Model predictions of the 1D and 2D model for pyrolysis of a wood particle
with dp = 5 mm at 527°C (800 K)a.
2D model
lp/dp
Permeability
Intrinsic
Kinetics
1
isotropic
1
anisotropic
3
anisotropic
1D model
, s 2 22 20 34 35
Gas yield, kg/kg 0.14 0.1 0.1 0.09 0.09
Liquid yield 0.77 0.77 0.78 0.76 0.76
Char yield 0.09 0.13 0.12 0.15 0.15
a Conditions are listed in Table 2. Primary decomposition kinetics and tar cracking
(intra particle) kinetics are adapted from Wagenaar [39,40]. Deviations from Table 1:
biomass density = 600 kg/m3, heat conductivity biomass in radial direction = 0.1
W/(m.K), moisture content = 0 wt %, external heat transfer coefficient = 400
W/(m2.K).
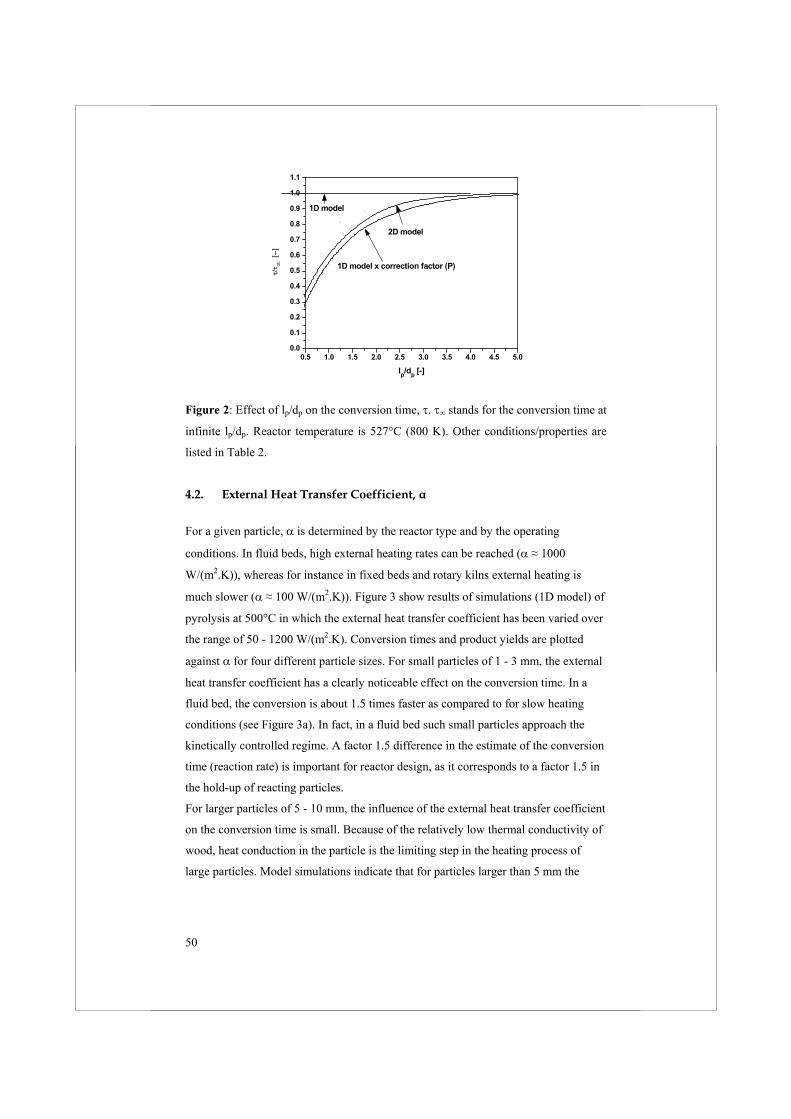
50
0.5 1.0 1.5 2.0 2.5 3.0 3.5 4.0 4.5 5.00.0
0.1
0.2
0.3
0.4
0.5
0.6
0.7
0.8
0.9
1.0
1.1
lp/dp [-]
1D model x correction factor (P)
2D model
1D model
Figure 2: Effect of lp/dp on the conversion time, . stands for the conversion time at
infinite lp/dp. Reactor temperature is 527°C (800 K). Other conditions/properties are
listed in Table 2.
4.2. External Heat Transfer Coefficient,
For a given particle, is determined by the reactor type and by the operating
conditions. In fluid beds, high external heating rates can be reached ( 1000
W/(m2.K)), whereas for instance in fixed beds and rotary kilns external heating is
much slower ( 100 W/(m2.K)). Figure 3 show results of simulations (1D model) of
pyrolysis at 500°C in which the external heat transfer coefficient has been varied over
the range of 50 - 1200 W/(m2.K). Conversion times and product yields are plotted
against for four different particle sizes. For small particles of 1 - 3 mm, the external
heat transfer coefficient has a clearly noticeable effect on the conversion time. In a
fluid bed, the conversion is about 1.5 times faster as compared to for slow heating
conditions (see Figure 3a). In fact, in a fluid bed such small particles approach the
kinetically controlled regime. A factor 1.5 difference in the estimate of the conversion
time (reaction rate) is important for reactor design, as it corresponds to a factor 1.5 in
the hold-up of reacting particles.
For larger particles of 5 - 10 mm, the influence of the external heat transfer coefficient
on the conversion time is small. Because of the relatively low thermal conductivity of
wood, heat conduction in the particle is the limiting step in the heating process of
large particles. Model simulations indicate that for particles larger than 5 mm the
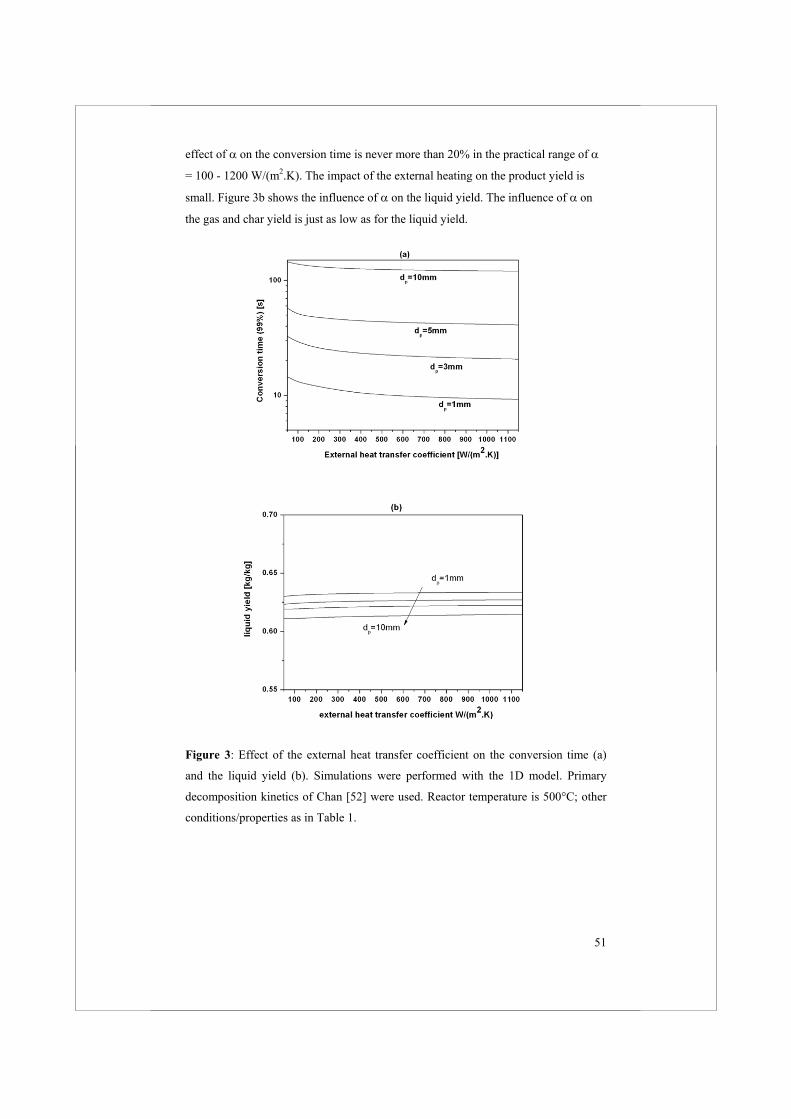
51
effect of on the conversion time is never more than 20% in the practical range of
= 100 - 1200 W/(m2.K). The impact of the external heating on the product yield is
small. Figure 3b shows the influence of on the liquid yield. The influence of on
the gas and char yield is just as low as for the liquid yield.
Figure 3: Effect of the external heat transfer coefficient on the conversion time (a)
and the liquid yield (b). Simulations were performed with the 1D model. Primary
decomposition kinetics of Chan [52] were used. Reactor temperature is 500°C; other
conditions/properties as in Table 1.
52
4.3. Particle Size Effect
In Figure 4a, the predicted liquid yield (1D model) is plotted versus the particle size
for a reactor temperature 500oC. Such a curve is of importance for fast pyrolysis
because it predicts at which particle size the liquid yield starts to decrease. The
calculations show a constant or nearly constant liquid yield at 500°C as a function of
the particle size up to 20 mm (see Figure 4a), irrespective of the kinetics applied. This
can be explained by combining the measured intrinsic kinetics with the knowledge
about the heat transport to and inside a pyrolyzing particle. To clarify this, an
effective pyrolysis temperature ( ) is defined that can explain the product distribution
for heat transfer limiting conditions on basis of the intrinsic kinetics (measured for
small particles). In analogy with the Thiele modulus concept [129], the effective
pyrolysis temperature allows using intrinsic kinetics, after a correction for transport
limitations, for predicting the product yields at the temperature of the bulk. Hence,
is the temperature at which the decomposition reactions are actually taking place
with respect to the product distribution. It turns out that the volume-averaged value of
the local temperature at which the reaction rate is maximal (T*) is a good estimator for
.
*( ) max( , )bioT Tt
x, y, z (4)
*( )V
T V
V
x,y, z (5)
The analysis on the effective pyrolysis temperature is similar to an earlier analysis by
Lede [114] regarding the reaction temperature of solid particles undergoing
volatilization. Lede did simulations for ablative and chemically controlled conditions.
In the first case, the reaction is taking place in a very thin layer close the surface of a
big particle, while in the second case the particle temperature is uniform. He
concluded that the temperature at which the reaction starts varies within narrow
limits, while the temperature at which the reaction proceeds stabilizes as a function of
the conversion degree. This was ascribed to both the endothermicity of the reaction
and the fact that the reaction is fast as compared to heat penetration. Apparently, the
latter effect must be dominant because simulations with H = 0 also yielded a nearly
constant temperature during the conversion. The observed stabilized reaction
temperature, with a range of ca. 100oC between the beginning and end of the
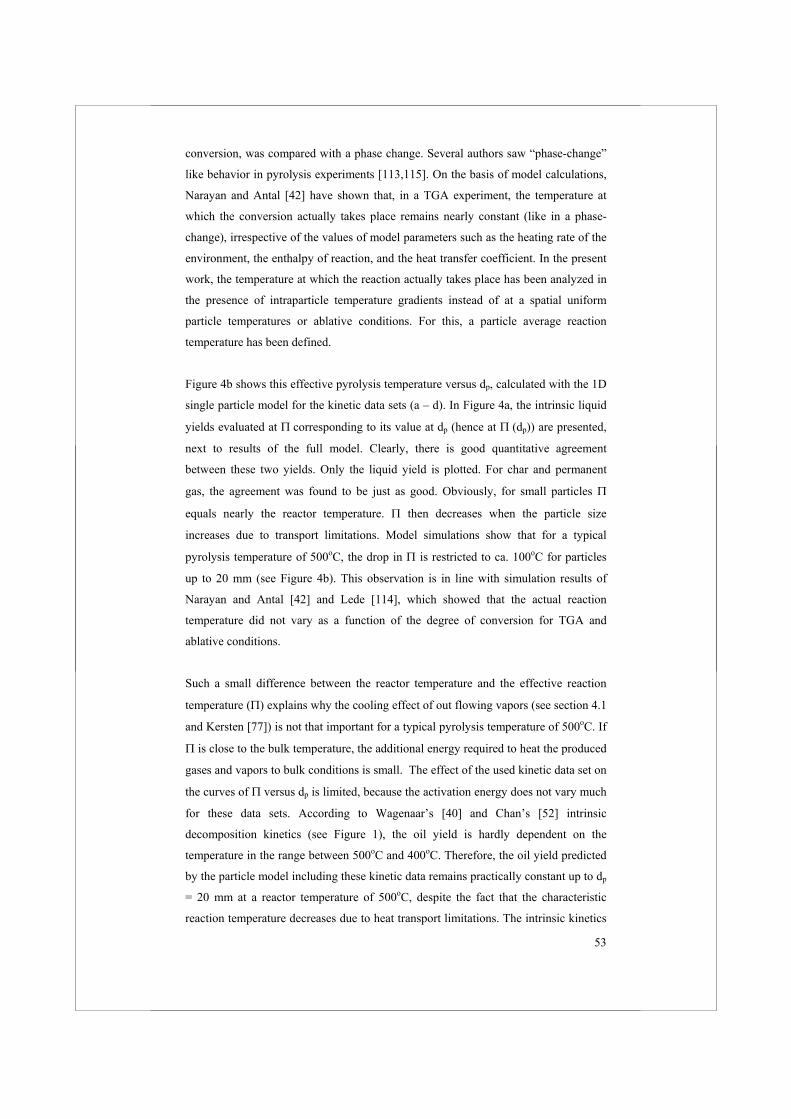
53
conversion, was compared with a phase change. Several authors saw “phase-change”
like behavior in pyrolysis experiments [113,115]. On the basis of model calculations,
Narayan and Antal [42] have shown that, in a TGA experiment, the temperature at
which the conversion actually takes place remains nearly constant (like in a phase-
change), irrespective of the values of model parameters such as the heating rate of the
environment, the enthalpy of reaction, and the heat transfer coefficient. In the present
work, the temperature at which the reaction actually takes place has been analyzed in
the presence of intraparticle temperature gradients instead of at a spatial uniform
particle temperatures or ablative conditions. For this, a particle average reaction
temperature has been defined.
Figure 4b shows this effective pyrolysis temperature versus dp, calculated with the 1D
single particle model for the kinetic data sets (a – d). In Figure 4a, the intrinsic liquid
yields evaluated at corresponding to its value at dp (hence at dp)) are presented,
next to results of the full model. Clearly, there is good quantitative agreement
between these two yields. Only the liquid yield is plotted. For char and permanent
gas, the agreement was found to be just as good. Obviously, for small particles
equals nearly the reactor temperature. then decreases when the particle size
increases due to transport limitations. Model simulations show that for a typical
pyrolysis temperature of 500oC, the drop in is restricted to ca. 100oC for particles
up to 20 mm (see Figure 4b). This observation is in line with simulation results of
Narayan and Antal [42] and Lede [114], which showed that the actual reaction
temperature did not vary as a function of the degree of conversion for TGA and
ablative conditions.
Such a small difference between the reactor temperature and the effective reaction
temperature ( explains why the cooling effect of out flowing vapors (see section 4.1
and Kersten [77]) is not that important for a typical pyrolysis temperature of 500oC. If
is close to the bulk temperature, the additional energy required to heat the produced
gases and vapors to bulk conditions is small. The effect of the used kinetic data set on
the curves of versus dp is limited, because the activation energy does not vary much
for these data sets. According to Wagenaar’s [40] and Chan’s [52] intrinsic
decomposition kinetics (see Figure 1), the oil yield is hardly dependent on the
temperature in the range between 500oC and 400oC. Therefore, the oil yield predicted
by the particle model including these kinetic data remains practically constant up to dp
= 20 mm at a reactor temperature of 500oC, despite the fact that the characteristic
reaction temperature decreases due to heat transport limitations. The intrinsic kinetics
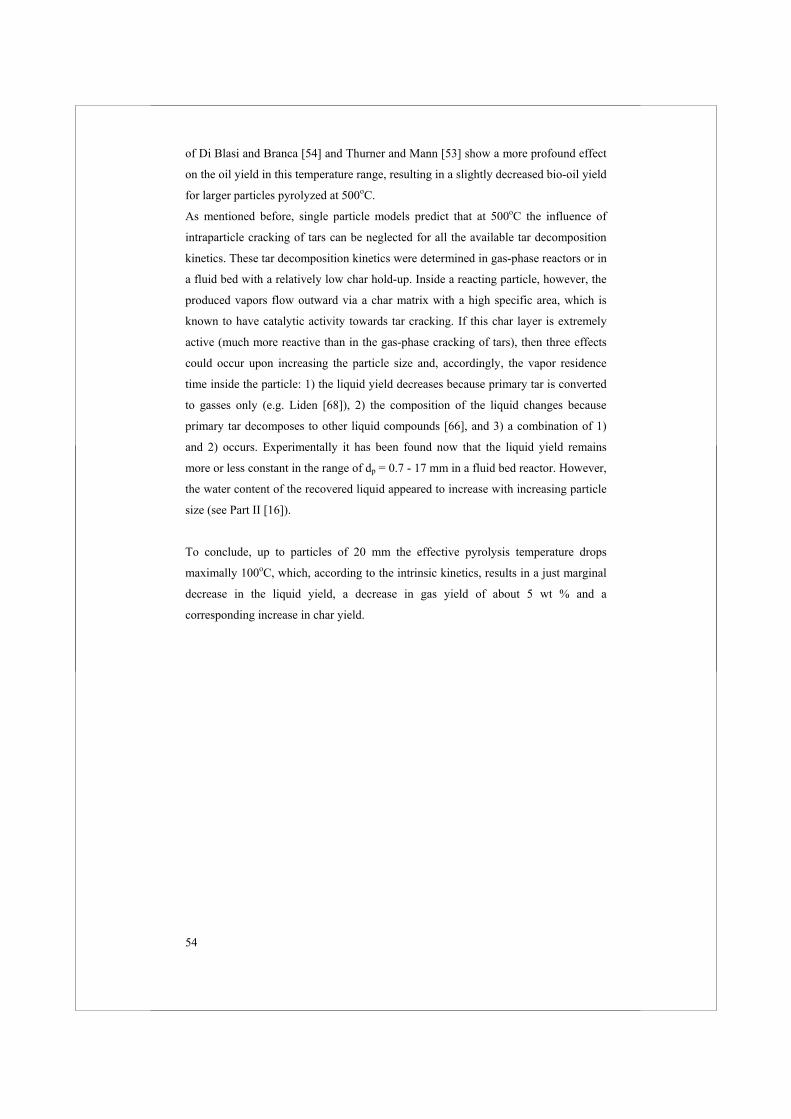
54
of Di Blasi and Branca [54] and Thurner and Mann [53] show a more profound effect
on the oil yield in this temperature range, resulting in a slightly decreased bio-oil yield
for larger particles pyrolyzed at 500oC.
As mentioned before, single particle models predict that at 500oC the influence of
intraparticle cracking of tars can be neglected for all the available tar decomposition
kinetics. These tar decomposition kinetics were determined in gas-phase reactors or in
a fluid bed with a relatively low char hold-up. Inside a reacting particle, however, the
produced vapors flow outward via a char matrix with a high specific area, which is
known to have catalytic activity towards tar cracking. If this char layer is extremely
active (much more reactive than in the gas-phase cracking of tars), then three effects
could occur upon increasing the particle size and, accordingly, the vapor residence
time inside the particle: 1) the liquid yield decreases because primary tar is converted
to gasses only (e.g. Liden [68]), 2) the composition of the liquid changes because
primary tar decomposes to other liquid compounds [66], and 3) a combination of 1)
and 2) occurs. Experimentally it has been found now that the liquid yield remains
more or less constant in the range of dp = 0.7 - 17 mm in a fluid bed reactor. However,
the water content of the recovered liquid appeared to increase with increasing particle
size (see Part II [16]).
To conclude, up to particles of 20 mm the effective pyrolysis temperature drops
maximally 100oC, which, according to the intrinsic kinetics, results in a just marginal
decrease in the liquid yield, a decrease in gas yield of about 5 wt % and a
corresponding increase in char yield.
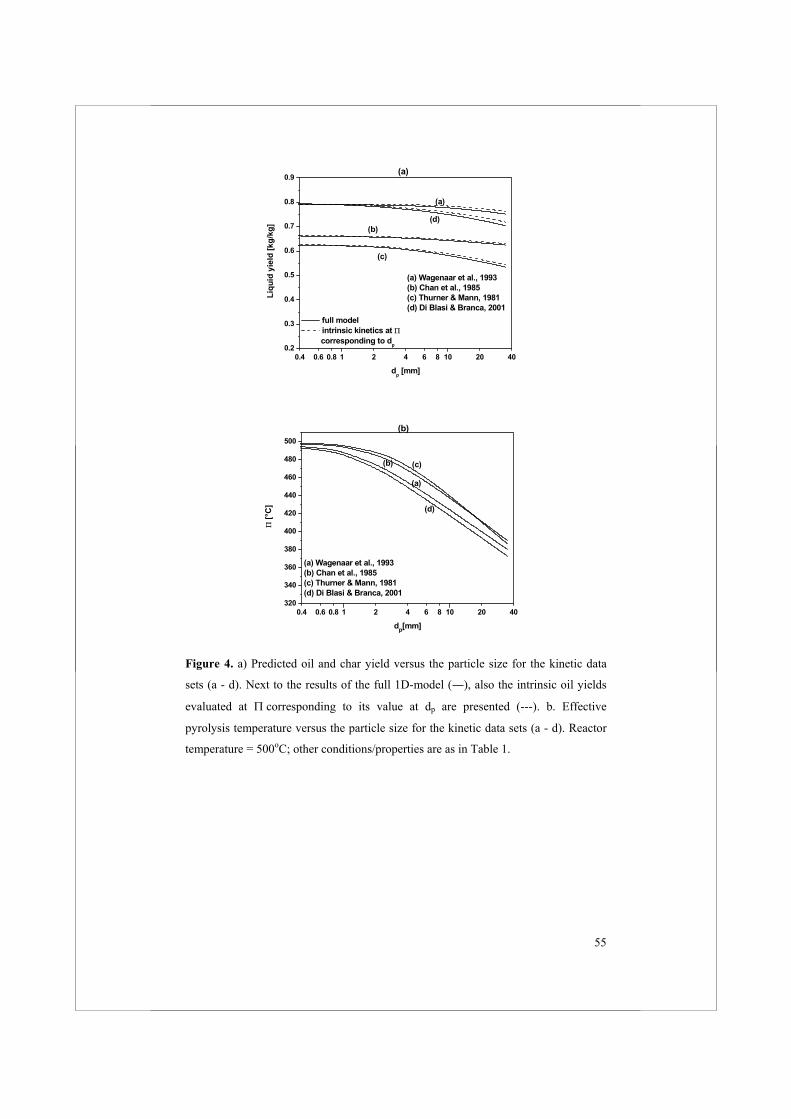
55
0.4 0.6 0.8 1 2 4 6 8 10 20 400.2
0.3
0.4
0.5
0.6
0.7
0.8
0.9
full model intrinsic kinetics at
corresponding to dp
(c)Li
quid
yie
ld [k
g/kg
]
dp [mm]
(a)
(d)(b)
(a)
(a) Wagenaar et al., 1993(b) Chan et al., 1985(c) Thurner & Mann, 1981(d) Di Blasi & Branca, 2001
0.4 0.6 0.8 1 2 4 6 8 10 20 40320
340
360
380
400
420
440
460
480
500
(d)
(a)
(b)
(a) Wagenaar et al., 1993(b) Chan et al., 1985(c) Thurner & Mann, 1981(d) Di Blasi & Branca, 2001
[°C
]
dp[mm]
(c)
(b)
Figure 4. a) Predicted oil and char yield versus the particle size for the kinetic data
sets (a - d). Next to the results of the full 1D-model ( ), also the intrinsic oil yields
evaluated at corresponding to its value at dp are presented (---). b. Effective
pyrolysis temperature versus the particle size for the kinetic data sets (a - d). Reactor
temperature = 500oC; other conditions/properties are as in Table 1.
56
5 Conclusions
The main conclusions can be summarized as follows:
(1) The literature on biomass pyrolysis has been reviewed. Many excellent studies
have been reported with a high level of detail. However, it appears to be rather
difficult to extract reliable quantitative information on conversion rates and
product yields required for process design.
(2) For kinetic studies, the pyrolysis products have been lumped into the classes
gas, liquid, and char. But the quality/composition of these classes (e.g., the
water content of the liquid) depends strongly on the operating conditions. For
practical application and optimization, kinetics should also be able to predict
the product quality. Such kinetic schemes are not available yet.
(3) There is a lot of scatter in the reported biomass kinetics and selectivity data.
For exactly the same feedstock, significant differences already occur because
of systematic errors in the experimental methods. Intrinsic reaction rates
published for different biomass types vary up to a decade, and even trends are
sometimes not uniform. This is probably related to differences in composition
and structure.
(4) For a given set of kinetics, one-dimensional single particle pyrolysis models
provide sufficient accuracy for engineering calculations. For particles with
lp/dp > 3, the one-dimensional will do, and for particles with lp/dp < 3 the
results of a 1D model can be scaled with a correction factor, P. P is the ratio of
the heating time of a particle with finite lp/dp over a particle with infinite lp/dp
at otherwise identical conditions. Also, the cooling effects of out flowing
vapors, the influence of anisotropy, and intraparticle tar cracking can be
neglected at fast pyrolysis conditions.
(5) Model calculations show that the external heat transfer coefficient (related to
the reactor type) has little influence on the product yields at typical fast
pyrolysis temperatures. Only for small particles (say 3 mm), and low values
of , the influence of on the conversion time is clearly notable.
(6) Contrary to the common belief, single particle models predict (for all available
kinetics) that the influence of the particle size on the liquid yield is very
limited. This phenomenon can be explained with an effective pyrolysis
temperature, a parameter that represents the temperature at which the
conversion is essentially taking place averaged over the particle’s volume.
(7) While the influence of the biomass particle size, its effective pyrolysis
temperature, and the vapor residence time, on the liquids yield is limited, the
liquid composition may change substantially.
57
Acknowledgement
The financial support from the European Commission and The Netherlands
Organization for Scientific Research (NWO) is gratefully acknowledged.
Notation
T Temperature K
pC Specific heat capacity /J Kg K
P Correction factor -
pd particle diameter m
BiBiot number cLBi , cL is the characteristic length of the particle
Py Pyrolysis number 2yp c
pC L
'Py Pyrolysis number (external) 'yp c
pC L
, 'y yp Bi p
1D One-dimensional
2D Two-dimensional
DAE Differential Algebraic Equation
MWe Million Watts equivalent
pl Particle length m
t Time s
V Volume 3m
X Conversion, defined as 0
0
W WW W
X
W Mass of the biomass particle kg
Greek Symbols
Effective pyrolysis temperature oC
Heat conductivity /( )J m s K
Density 3/Kg m
Thermal diffusivity
pC
58
Conversion time s
H Heating-up time s
External heat transfer coefficient 2/( )J m s K
Subscripts
H Heating up p Particle , ,x y z Coordinates
Infinite or final state
bio Biomass
0 Initial state
59
References
1. Baker, E.G., Elliott, D.C., Catalytic Hydrotreating of Biomass-Derived Oils;
ACS Symposium Ser., 1988, 376, pp. 228-240.
2. Baldauf, W., Balfanz, U., Upgrading of fast pyrolysis liquids at VEBA OEL
AG; In Biomass gasification and pyrolysis: state of the art and future
prospects, Kaltschmitt, M., Bridgwater, A.V., Eds., CPL Press, UK, 1997, pp.
392-398.
3. Boerrigter, H., den Uil, H., Calis, H.-P., Green diesel from biomass via
Fischer-Tropsch synthesis: new lights in gas cleaning and process design; In
Expert meeting on Pyrolysis and Gasification of Biomass and Waste,
Strasbourg, France, CPL Press, UK, 2002.
4. Henrich, E., Dinjus, E., Tar-free, high pressure synthesis gas from biomass; In
Expert meeting on Pyrolysis and Gasification of Biomass and Waste,
Strasbourg, France, CPL Press, UK, 2002.
5. Venderbosch, R.H., van de Beld, L., Prins, W., Entrained flow gasification of
bio-oil for synthesis gas; In Twelfth European Biomass Conference: Biomass
for Energy, Industry and Climate Protection, Amsterdam, The Netherlands:
ETA-Florence and WIP-Munich, 2002.
6. Van Swaaij, W.P.M., Prins, W., Kersten, S.R.A., Strategies for the future of
biomass for energy, industry and climate protection; In The 2nd World
Conference and Technology Exhibition on Biomass for Energy, Industry and
Climate Protection, Rome, Italy, 2004.
7. Van Swaaij, W.P.M., Kersten, S.R.A., van den Aarsen, F.G., Routes for
methanol from biomass; In International 2-Day Business Confence on
Sustainable Industrial Developments, Delfzijl, The Netherlands, 2004.
8. Bridge, S.A., Flash pyrolysis of biomass for liquid fuels; Master's Thesis, The
University of Aston, Birmingham, UK, 1990.
9. Bridgwater, A.V., et al., Eds., Fast pyrolysis of biomass: A handbook; CPL
Press, UK, 1990.
60
10. Bridgwater, A.V., Meier, D., Radlein, D., An overview of fast pyrolysis of
biomass; Org. Geochem., 1999, 30, pp. 1479-1493.
11. Meier, D., Faix, O., State of the art of applied fast pyrolysis of lignocellulosic
materials - a review; Bioresource Technology, 1999, 68, pp. 71-77.
12. Scott, D.S., et al., A second look at fast pyrolysis of biomass - the RTI
process; J. Anal. Appl. Pyrolysis, 1999, 51, pp. 23-37.
13. Bridgwater, A.V., Peacocke, G.V.C., Fast pyrolysis processes for biomass;
Renewable and Sustainable Energy Rev., 2000, 4, pp. 1-73.
14. Bridgwater, A.V., Ed., Fast pyrolysis of biomass: A handbook; CPL Press,
UK, vol. 2, 2002.
15. Bridgwater, A.V., Renewable fuels and chemicals by thermal processing of
biomass; Chem. Eng. J., 2003, 91, pp. 87-102.
16. Wang, X., et al., Biomass pyrolysis in a fluidized bed reactor: Part II.
Experimental validation of model results; Ind. Eng. Chem. Res., 2005, pp.
8786-8795.
17. Van Swaaij, W.P.M., van der Ham, A.G.J., Kronberg, A.E., Evolution patterns
and family relations in G-S reactors; Chem. Eng. J., 2002, 90, pp. 25-45.
18. Diebold, J., Scahill, J., Production of primary pyrolysis oils in a Vortex
reactor; In ACS Symposium Series 376: Pyrolysis oils from biomass
producing, analyzing, and upgrading; Soltes, E.J., Milne, T.A., Eds., 1988, pp.
31-40.
19. Diebold, J.P., Scahill, J.W., Improvements in the Vortex reactor design; In
Developments in thermochemical biomass conversion, Bridgwater, A.V.,
Boocock, D.G.B., Eds., 1997, Blackie Academic & Professional, London, UK,
1997, pp. 242-252.
20. Peacocke, G.V.C., Ablative pyrolysis of biomass; Ph.D. Thesis, Aston
University, Birmingham, UK, 1994.
21. Boutin, O., et al., Temperature of ablative pyrolysis of wood. Comparison of
spinning disc and rotating cylinder experiments; In Biomass gasification and
61
pyrolysis: state of the art and future prospects, Kaltschmitt, M., Bridgwater,
A.V., Eds., CPL Press, UK, 1997, pp. 336-344.
22. Wagenaar, B.M., Prins, W., van Swaaij, W.P.M., Pyrolysis of biomass in the
rotating cone reactor: modeling and experimental justification; Chem. Eng.
Sci., 1995, 49, pp. 5109-5126.
23. Prins, W., Wagenaar, B.M., Review of the rotating cone technology for flash
pyrolysis of biomass; In Biomass gasification and pyrolysis: state of the art
and future prospects, Kaltschmitt, M., Bridgwater, A.V., Eds., CPL Press, UK,
1997, pp. 316-326.
24. Bramer, E.A., Brem, G. A novel technology for fast pyrolysis of biomass:
Pyros reactor; In Twelfth European Biomass Conference: Biomass for Energy,
Industry and Climate Protection, Amsterdam, The Netherlands: ETA-Florence
and WIP-Munich, 2002.
25. Lede, J., Verzaro, F., Antoine, B., Villermaux, J., Flash pyrolysis of wood in a
cyclone reactor; Chem. Eng. Process., 1986, 20, pp. 309-317.
26. Rossi, C., Graham, R., Fast pyrolysis at ENEL, in Biomass gasification and
pyrolysis: state of the art and future prospects; Kaltschmitt, M., Bridgwater,
A.V., Eds., CPL Press, UK, 1997, pp. 300-306.
27. Roy, C., Lemeuix, R., de Caumia, B., Blanchette, D., Processing wood chips
in a semi-continuous multiple hearth reactor; In Pyrolysis Oils from Biomass,
Producing, Analyzing and Upgrading. ACS, Washington, DC, 1988.
28. Amen-Chen, C., Softwood bark vacuum pyrolysis oils-phenol-formaldehyde
resols for bonding oriented strand board (OSB); Ph.D. Thesis, Laval
University, Quebec, Canada, 2001.
29. Scott, D.S., Piskorz, J., The flash pyrolysis of Aspen-Polar wood; Can. J.
Chem. Eng., 1982, 60, pp. 666-674.
30. Lappas, A.A., et al., Biomass pyrolysis in a circulating fluid bed reactor for the
production of fuels and chemicals; Fuel, 2002, 81, pp. 2087-2095.
31. Report of the EU project, Production, Treatment and Utilization of Bio-Oils
from Pyrolysis, for Energy and Alternative Fuels and Chemicals; Contract No.
AIR2-CT93-1086; 1996.
62
32. Matas, A., Union Electrica Fenosa; In Pyrolysis Network Newsletter, Issue
No. 6, 1998, pp. 8-9.
33. McLellan, R., Wellman integrated fast pyrolysis pilot plant; In Pyrolysis
Network Newsletter, Issue No. 10, 2000, pp. 12.
34. Roy, C., Morin, D., Dube, F., The biomass pyrocyclingTM process; In Biomass
gasification and pyrolysis: state of the art and future prospects, Kaltschmitt,
M., Bridgwater, A.V., Eds., CPL Press, UK, 1997, pp. 307-315.
35. Dynamotive. BioThermTM: A system for continuous quality, fast pyrolysis bio-
oil; In The 4th Biomass Conference of the Americas, Oakland, CA, USA,
1999.
36. Gust, S., Nieminen, J.-P., Liquefied wood fuel could soon replace heavy oil!;
In Wood Energy, 2002, No. 6, pp. 24-34.
37. Freel, B.A., Graham, R.G., Apparatus for a circulating bed transport fast
pyrolysis reactor system; U.S. Patent 5,961,786. 1999.
38. Wagenaar, B.M., et al. Bio-oil as coal substitute in 600MWe power stations;
In Twelfth European Biomass Conference: Biomass for Energy, Industry and
Climate Protection, Amsterdam, The Netherlands, ETA-Florence and WIP-
Munich, 2002.
39. Wagenaar, B.M., The rotating cone reactor: for rapid thermal solids
processing; Ph.D. Thesis, University of Twente, Enschede, The Netherlands,
1994.
40. Wagenaar, B.M., Prins, W., van Swaaij, W.P.M., Flash pyrolysis kinetics of
pine wood; Fuel Process. Techn., 1993, 36, pp. 291-298.
41. Gronli, M., Antal, M.J., Varhegyi, G., A round-robin study of cellulose
pyrolysis kinetics by thermogravimetry; Ind. Eng. Chem. Res., 1999, 38, pp.
2238-2244.
42. Narayan, R., Antal, M.J., Thermal lag, fusion, and the compensation effect
during biomass pyrolysis; Ind. Eng. Chem. Res., 1996, 35, pp. 1711-1721.
63
43. Antal, M.J., Jr., Varhegyi, G., Cellulose pyrolysis kinetics: the current state of
knowledge; Ind. Eng. Chem. Res., 1995, 34, pp. 703-717.
44. Antal, M.J., Jr., Varhegyi, G., Impact of Systematic Errors on the
Determination of Cellulose Pyrolysis Kinetics; Energy & Fuels, 1997, 11, pp.
1309-1310.
45. Antal, M.J., Jr., Varhegyi, G., Jakab, E., Cellulose pyrolysis kinetics:
Revisited; Ind. Eng. Chem. Res., 1998, 37, pp. 1267-1275.
46. Knight, J.A., Gorton, C.W., Kovac, R.J., Oil production by entrained flow
pyrolysis of biomass; Biomass, 1984, 6, pp. 69-76.
47. Nunn, T.R., Howard, J.B., Longwell, J.P., Peters, W.A., Product composition
and kinetics in the rapid pyrolysis of sweet gum hardwood; Ind. Eng. Chem.
Prod. Res. Dev., 1985, 24, pp. 836-844.
48. Reina, J., Velo, E., Puigjaner, L., Thermogravimetric study of the pyrolysis of
waste wood; Thermochim. Acta, 1998, 320, pp. 161-167.
49. Samolada, M.C., Vasalos, I.A., A kinetic approach to the flash pyrolysis of
biomass in a fluidized bed reactor; Fuel, 1991, 70, pp. 883-889.
50. Lanzetta, M., Di Blasi, C., Pyrolysis kinetics of wheat and corn straw; J. Anal.
Appl. Pyrolysis, 1998, 44, pp. 181-192.
51. Branca, C., Di Blasi, C., Kinetics of isothermal degradation of wood in the
temperature range 528-708K; J. Anal. Appl. Pyrolysis, 2003, 67, pp. 207-219.
52. Chan, W.-C.R., Kelbon, M., Krieger, B.B., Modelling and experimental
verification of physical and chemical processes during pyrolysis of a large
biomass particle; Fuel, 1985, 64, pp. 1505-1513.
53. Thurner, F., Mann, U., Kinetic investigation of wood pyrolysis; Ind. Eng.
Chem. Process Des. Dev., 1981, 20, pp. 482-488.
54. Di Blasi, C., Branca, C., Kinetics of primary product formation from wood
pyrolysis; Ind. Eng. Chem. Res., 2001, 40, pp. 5547-5556.
55. Shafizadeh, F., Chin, Peter P.S., Thermal deterioration of wood; ACS Symp.
Series, 1977, 43, pp. 57-81.
64
56. Shafizadeh, F., Introduction to pyrolysis of biomass; J. Anal. Appl. Pyrolysis,
1982, 3, pp. 283-305.
57. Chan, W.-C.R., Kelbon, M., Krieger-Brockett, B., Single particle biomass
pyrolysis: Correlations of reaction products with process conditions; Ind. Eng.
Chem. Res., 1988, 27, pp. 2261-2275.
58. Hajaligol, M., Waymack, B., Kellogg, D., Low temperature formation of
aromatic hydrocarbon from pyrolysis of cellulosic materials; Fuel, 2001, 80,
pp. 1799-1807.
59. Rocca, P.A.D., et al., Pyrolysis of hardwoods residues: on kinetics and chars
characterization; Biomass and Bioenergy, 1999, 16, pp. 79-88.
60. Bonelli, P.R., et al., Effect of pyrolysis temperature on composition, surface
properties and thermal degradation rates of Brazil Nut shells; Bioresource
Technology, 2001, 76, pp. 15-22.
61. Figueiredo, J.L., et al., Pyrolysis of holm-oak wood: influence of temperature
and particle size; Fuel, 1989. 68, pp. 1012-1016.
62. Stenseng, M., Jensen, A., Dam-Johansen, K., Thermal analysis and kinetic
modelling of wheat straw pyrolysis; In Progress in Thermochemical Biomass
Conversion, Bridgwater, A.V., Ed., Blackwell Science, Oxford, UK, 2001, pp.
1061-1075.
63. Varhegyi, G., Szabo, P., Antal, M.J., Jr., Kinetics of charcoal devolatilzation;
Energy & Fuels, 2002, 16, pp. 724-731.
64. Wojtowicz, M.A., et al., Modeling the evolution of volatile species during
tobacco pyrolysis; J. Anal. Appl. Pyrolysis, 2003, 66, pp. 235-261.
65. Rostami, A.A., Hajaligol, M.R., Wrenn, S.E., A biomass pyrolysis sub-model
for CFD applications; Fuel, 2004, 83, pp. 1519-1525.
66. Antal, M.J., Jr., Effects of reactor severity on the gas phase pyrolysis of
cellulose and kraft lignin derived volatile matter; Ind. Eng. Chem. Prod. Res.
Dev., 1983, 22, pp. 366-375.
65
67. Diebold, J.P., The cracking kinetics of depolymerized biomass vapors in a
continuous tubular reactor; M.Sc. Thesis, Colorado school of mines, USA,
1985.
68. Liden, A.G., A kinetic and heat transfer modelling study of wood pyrolysis in
a fluidized bed; Master's Thesis, University of Waterloo, Ontario, Canada,
1985.
69. Boroson, M.L., et al., Product yields and kinetics from the vapor phase
cracking of wood pyrolysis tars; AIChE J., 1989, 35, pp. 120-128.
70. Boroson, M.L., Secondary reactions of tars from pyrolysis of sweet gum
hardwood, Ph.D. Thesis, Massachusetts Institute of Technology, 1987.
71. Bamford, C.H., Crank, J., Malan, H., The combustion of wood, part I; Proc.
Cambridge Philos. Soc., 1946, 42, pp. 166-182.
72. Roberts, A.F., Clough, G., Thermal decomposition of wood in an inert
atmosphere; In 9th International Symposium on combustion, Pittsburg, USA,
1963.
73. Di Blasi, C., Heat, momentum and mass transport through a shrinking biomass
particle exposed to thermal radiation; Chem. Eng. Sci., 1996, 51, pp. 1121-
1132.
74. Di Blasi, C., Modeling intra- and extra-particle processes of wood fast
pyrolysis; AIChE J., 2002, 48, pp. 2386-2397.
75. Di Blasi, C., A transient two-dimensional model of biomass pyrolysis;
Developments in thermochemical biomass conversion, Bridgwater A.V.,
Boocock, D.G.B., Eds., Blackie Academic & Professional; London, UK, 1997,
pp. 147-160.
76. Miller, R.S., Bellan, J., A generalized biomass pyrolysis model based on
superimposed cellulose, hemicellulose and lignin kinetics; Combust. Sci.
Tech., 1997, 126, pp. 97-137.
77. Kersten, S.R.A., Biomass gasification in circulating fluidized beds; Ph.D.
Thesis, University of Twente, Enschede, The Netherlands, 2002.
66
78. Kothari, V., Antal, M.J., Jr., Numerical studies of the flash pyrolysis of
cellulose; Fuel, 1985, 64, pp. 1487-1494.
79. Bliek, A., van Swaaij, W.P.M., van Beckum F.P.H., Effects of intraparticle
heat and mass transfer during devolatilization of a single coal particle; AIChE
J. 1985, 31, pp. 1666.
80. Bryden, K.M., Hagge, M.J., Modeling the combined impact of moisture and
char shrinkage on the pyrolysis of a biomass particle; Fuel, 2003, 82, pp.
1633-1644.
81. Janse, A.M.C., Westerhout, R.W.J., Prins, W., Modelling of flash pyrolysis of
a single wood particle; Chem. Eng. Proc., 2000, 39, pp. 239-252.
82. Pyle, D.L., Zaror, C.A., Heat transfer and kinetics in the low temperature
pyrolysis of solids; Chem. Eng. Sci., 1984, 39, pp. 147.
83. Scott, D.S., Piskorz, J., The continuous flash pyrolysis of biomass; Can. J.
Chem. Eng., 1984, 62, pp. 291-294.
84. Scott, D.S., Piskorz, J., Radlein, D., Liquid products from the continuous flash
pyrolysis of biomass; Ind. Eng. Chem. Prod. Res. Dev., 1985, 24, pp. 581-588.
85. Scott, D.S., Piskorz, J, Radlein, D., The role of temperature in the fast
pyrolysis of cellulose and wood; Ind. Eng. Chem. Res., 1988, 27, pp. 8-15.
86. Scott, D.S., et al., Flash pyrolysis of peat in a fluidized bed; Fuel Processing
Technology, 1988, 18, pp. 81-95.
87. Agblevor, F.A., Besler, S., Evans, R.J., Inorganic compounds in biomass
feedstocks: their role in char formation and effect on the quality of fast
pyrolysis oils; Proceedings of biomass pyrolysis oil properties and combustion
meeting; National Renewable Energy Laboratory, Estes Park, CO, USA, 1994.
88. Horne, P.A., Williams, P.T., Influence of temperature on the products from the
flash pyrolysis of biomass; Fuel, 1996, 75, pp. 1051-1059.
89. Peacocke, G.V.C., et al., Effect of reactor configuration on the yields and
structures of pine-wood derived pyrolysis liquids: A comparison between
ablative and wire-mesh pyrolysis; Biomass and Bioenergy, 1994, 7, pp. 155-
167.
67
90. Peacocke, G.V.C., et al., Comparison of ablative and fluid bed fast pyrolysis
products: yields and analysis; In Developments in thermochemical biomass
conversion, Bridgwater, A.V., Boocock, D.G.B., Eds., 1997, Blackie
Academic & Professional, London, UK, 1997, pp. 191-205.
91. Hague, R.A., The pre-treatment and pyrolysis of biomass for the production of
liquids for fuels and speciality chemicals; Ph.D. Thesis, Aston University,
Birmingham, UK, 1998.
92. Bilbao, R., et al., Experimental and theoretical study of the ignition and
smoldering of wood including convective effects; Combustion and Flame,
2001, 126, pp. 1363-1372.
93. Luo, Z., et al., Research on biomass fast pyrolysis for liquid fuel; Biomass and
Bioenergy, 2004, 26, pp. 455-462.
94. Olazar, M., et al., Kinetic study of fast pyrolysis of sawdust in a conical
spouted bed reactor in the range 400-500oC; J. Chem. Techn. Biotechn., 2001,
76, pp. 469-476.
95. Scholze, B., Hanser, C., Meier, D., Characterisation of the water-insoluble
fraction from fast pyrolysis liquids (pyrolytic lignin) Part II. GPC, carbonyl
groups, and 13C -NMR; J. Anal. Appl. Pyrolysis, 2001, 58-59, pp. 387-400.
96. Scholze, B., Long-term stability, catalytic upgrading, and application of
pyrolysis oils-improving the properties of a potential substitute of fossil fuels;
Ph.D. Thesis, University of Hamburg, Hamburg, Germany, 2002.
97. Oasmaa, A., et al., Physical characterisation of biomass-based pyrolysis
liquids: Application of standard fuel oil analyses; VTT, Technical Research
Center of Finland: Espoo, Finland, 1997, pp. 87.
98. Oasmaa, A., Czernik, S., Fuel oil quality of biomass pyrolysis oils: state-of-
the-art for the end users; Energy & Fuels, 1999, 13, pp. 914-921.
99. Minkova, V., et al., Effect of water vapor and biomass nature on the yield and
quality of the pyrolysis products from biomass; Fuel Proc. Techn., 2001, 70,
pp. 53-61.
68
100. Agblevor, F.A., Besler, S., Inorganic compounds in biomass feedstocks .1.
Effect on the quality of fast pyrolysis oils; Energy & Fuels, 1996, 10, pp. 293-
298.
101. Ghetti, P., Ricca, L., Angelini, L., Thermal analysis of biomass and
corresponding pyrolysis products; Fuel, 1996, 75, pp. 565-573.
102. Encinar, J.M., et al., Pyrolysis of two agricultural residues: Olive and Grape
bagasse, influence of particle size and temperature; Biomass & Bioenergy,
1996, 11, pp. 397-409.
103. Roy, C., et al., The pyrolysis under vacuum of Aspen-Poplar; In Fundamentals
of Thermochemical Biomass Conversion, Overend, R.P., Milne, T.A., Mudge,
L.K., Eds., Elsevier Applied Science Publisher, New York, 1985, pp. 237.
104. Kelbon, M., Bousman, S., Krieger-Brockett, B., Conditions that favor tar
production from pyrolysis of large moist wood particles; In ACS Symposium
Series 376; Pyrolysis oils from biomass producing, analyzing, and upgrading,
Soltes, E.J., Milne, T.A., Eds., 1988, American Chemical Society,
Washington, DC, 1988, pp. 41-54.
105. Pyle, D.L., Zaror, C.A., Heat transfer and kinetics in the low temperature
pyrolysis of solids; Chem. Eng. Sci., 1984, 39, pp. 147-158.
106. Babu, B.V., Chaurasia, A.S., Heat transfer and kinetics in the pyrolysis of
shrinking biomass particle; Chem. Eng. Sci., 2004, 59, pp. 1999-2012.
107. Di Blasi, C., Modelling the fast pyrolysis of cellulotic particles in fluid bed
reactors; Chem. Eng. Sci., 2000, 55, pp. 5999-6013.
108. Seebauer, V., Petek, J., Staudinger, G., Effects of particle size, heating rate
and pressure on measurement of pyrolysis kinetics by thermogravimetric
analysis; Fuel, 1997, 76, pp. 1277-1282.
109. Nik-Azar, M., et al., Effects of heating rate and particle size on the products
yields from rapid pyrolysis of beech wood. Fuel Sci. Techn. Intern., 1996, 14,
pp. 479-502.
110. Bilbao, R., Millera, A., Murrilo, M.B., Temperature profiles and weight loss in
the thermal decomposition of large spherical wood particles; Ind. Eng. Chem.
Res., 1993, 32, pp. 1811-1817.
69
111. Altun, N.E., Hicyilmaz, C., Kok, M.V., Effect of particle size and heating rate
on the pyrolysis of Silopi asphaltite; J. Anal. Appl. Pyrolysis, 2003, 67, pp.
369-379.
112. Chan, W.C.R., Kelbon, M., Kriegerbrockett, B., Single-particle biomass
pyrolysis - Correlations of reaction-products with process conditions; Ind. &
Eng. Chem. Res., 1988, 27, pp. 2261-2275.
113. Lede, J., et al., Fusion-like behavior of wood pyrolysis; J. of Anal. Appl.
Pyrolysis, 1987, 10, pp. 291-308.
114. Lede, J., Reaction temperature of solid particles undergoing an endothermal
volatilization. Application to the fast pyrolysis of biomass; Biomass and
Bioenergy, 1994, 7, pp. 49-60.
115. Lede, J., Blanchard, F., Boutin, O., Radiant flash pyrolysis of cellulose pellets:
products and mechanisms involved in transient and steady state conditions;
Fuel, 2002, 81, pp. 1269-1279.
116. Liden, A.G., Berruti, F., Scott, D.S., A kinetic model for the production of
liquids from the flash pyrolysis of biomass; Chem. Eng. Comm., 1988, 65, pp.
207-221.
117. Boroson, M.L., et al., Heterogeneous cracking of wood pyrolysis tars over
fresh wood char surfaces; Energy & Fuels, 1989, 3, pp. 735-740.
118. Freel, B.A., Graham, R.G., Bergougnou, M.A., The kinetics of the fast
pyrolysis (Ultrapyrolysis) of cellulose in a fast fluidized bed reactor; AIChE
Symposium Series, 1987, 83, pp. 105-111.
119. Lathouwers, D., Bellan, J., Modeling of dense gas-solid reactive mixtures
applied to biomass pyrolysis in a fluidized bed; Int. J. Multiphase Flow, 2001,
27, pp. 2155-2187.
120. Gerhauser, H., Bridgwater, A.V., Scale effects and distribution problems in
fluid bed fast pyrolysis using CFD models integrated with reaction kinetics; In
Expert meeting on Pyrolysis and Gasification of Biomass and Waste,
Strasbourg, France, CPL Press, UK, 2002.
70
121. Gerhauser, H., CFD applied to the fast pyrolysis of biomass in fluidized beds;
Ph.D. Thesis, Aston University, Birmingham, UK, 2003.
122. Prins, W., Draijer, W., van Swaaij, W.P.M., Heat transfer to immersed spheres
fixed or freely moving in a gas-fluidized bed; In Heat and Mass Transfer in
Fixed and Fluidized Beds, van Swaaij, W.P.M., Afgan, N.H., Eds.,
Hemisphere Publishing Corporation, Washington, USA, 1986, pp. 317-331.
123. Gronli, M., A theoretical and experimental study of the thermal degradation of
biomass; Ph.D. Thesis, Norweign University of Science and Technology
(NTNU), Trondheim, 1996.
124. Reid, R., The properties of gas and liquids; 2nd ed., McGraw Hill, New York,
1987.
125. Borman, G.L., Ragland, K.W., Combustion Engineering. McGraw-Hill, New
York, 1998.
126. Ramakers, B.J., de Ridder, R., Kerkhof, P.J.A.M., Fluidization behavior of
wood/sand mixtures; In Proceedings of the 14th International Drying
Symposium, Sao Paulo, Brazil, 2004.
127. Miller, R.S., Bellan, J., Numerical Simulation of Vortex Pyrolysis Reactors for
Condensable Tar Production from Biomass; Energy & Fuels, 1998, 12, pp. 25-
40.
128. Carslaw, H.S., Jaeger, J.C., Conduction of Heat in Solids; 2nd Ed., Clarendon
Press, Oxford, UK, 1959.
129. Thiele, E.W., Relation between Catalytic Activity and Size of Particle; Ind.
Eng. Chem., 1939, 31, pp. 916-920.

71

72
73
Chapter 3Biomass Pyrolysis in a Fluidized Bed
Reactor. Part II: Experimental Validation
of Model Results
Abstract
Various types of cylindrical biomass particles (pine, beech, bamboo, demolition
wood) have been pyrolyzed in a batch-wise operated fluid bed laboratory set-up.
Conversion times, product yields and product compositions were measured as a
function of the particle size (0.7 – 17 mm), the vapor’s residence time (0.25 to 6 s),
the position of the biomass particles in the bed (dense bed or splash zone), and the
fluid bed temperature (250 - 800oC). For pyrolysis temperatures between 450 and
550°C, the bio-oil yield appeared to be maximal (in this work: about 65 wt %) while
the water content of the bio-oil is minimal. The position of the biomass particles in the
fluid bed, either in the dense bed or in the splash zone, does not affect the conversion
time and product yields to a large extent during pyrolysis at 500°C. In the small fluid
bed used for this work, with a char hold-up of up to 5 vol. % (or 0.7 wt %), the
residence time of the pyrolysis vapors is not that critical. At typical fast pyrolysis
temperatures of around 500°C, it appeared sufficient to keep this residence time
below 5 s to prevent significant secondary cracking of the produced vapors to non-
condensable gas. Up to a diameter of 17 mm, the particle size has only a minor effect
on the total liquid yield. However, for particles larger than 3 mm, the water content of
the produced bio-oil increases significantly. The experimental results are further
compared with predictions from a one-dimensional (1D) and a two-dimensional (2D)
single-particle pyrolysis model. Such models appeared to have a limited predictive
power due to large uncertainties in the kinetics and selectivity of the biomass
decomposition. Moreover, the product quality cannot be predicted at all.
74
1. Introduction
The first part [1] of this work was concerned with the literature review on biomass
pyrolysis and pyrolysis modeling for the purpose of reactor design. In this companion
paper, experimental results of lab-scale fluidized bed pyrolysis will be presented. The
following parameters have been varied: the type of wood (beech, pine, bamboo,
palletized demolition wood), the reactor temperature (250 - 800oC), the particle size
(0.7 - 17 mm), the vapor residence time in the gas phase (0.25 - 6 s), and the position
of the biomass particles in the reactor (freeboard, splash zone, dense bed).
Experimental results are compared with predictions of existing single particle models
as described in the first part [1] of this research report. On basis of this comparison,
the predictive potential, and the minimal level of modeling detail still giving sufficient
accuracy for reactor design calculations, will be established. The significance of the
presented work with respect to the design of a (fluid bed type) reactor for the
pyrolysis of wood particles is discussed.
2. Experimental Equipment and Procedure
Fluidized bed pyrolysis of cylindrical wood particles has been carried out at ambient
pressure and temperatures in the range of 250 - 800oC. These particles were made
from beech, pine, bamboo or demolition wood, and their diameters were varied from
1.5 - 17 mm while keeping their length constant at 42 mm. In addition to these
cylindrical particles, saw dust with an average diameter of 0.7 mm has been used.
Other particle properties relevant for the interpretation of the experimental results are
listed in Table 1.
Figure 1 shows a sketch of the experimental setup. The fluidized bed reactor was
made of stainless steel and placed in an electric furnace for independent temperature
control. A 45 mm long cylindrical bottom section (26 mm internal diameter) was
connected with a 90 mm long wider top section (60 mm internal diameter) by a
conical part with a height of 125 mm. The incoming gas (nitrogen) was preheated by
passing it through a 400 mm long heating tube (10 mm internal diameter) coiled
around the fluid bed reactor. A sintered metal plate underneath the bottom section
served as a gas distributor.
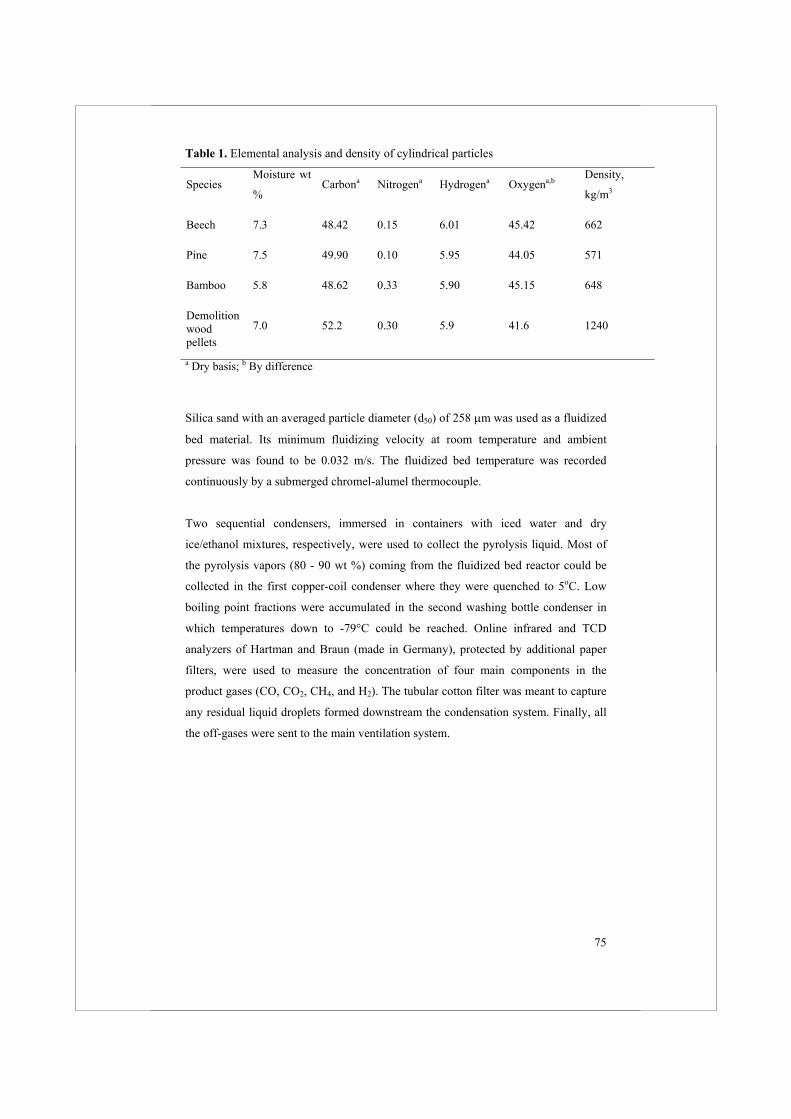
75
Table 1. Elemental analysis and density of cylindrical particles
SpeciesMoisture wt
%Carbona Nitrogena Hydrogena Oxygena,b Density,
kg/m3
Beech 7.3 48.42 0.15 6.01 45.42 662
Pine 7.5 49.90 0.10 5.95 44.05 571
Bamboo 5.8 48.62 0.33 5.90 45.15 648
Demolition wood pellets
7.0 52.2 0.30 5.9 41.6 1240
a Dry basis; b By difference
Silica sand with an averaged particle diameter (d50) of 258 m was used as a fluidized
bed material. Its minimum fluidizing velocity at room temperature and ambient
pressure was found to be 0.032 m/s. The fluidized bed temperature was recorded
continuously by a submerged chromel-alumel thermocouple.
Two sequential condensers, immersed in containers with iced water and dry
ice/ethanol mixtures, respectively, were used to collect the pyrolysis liquid. Most of
the pyrolysis vapors (80 - 90 wt %) coming from the fluidized bed reactor could be
collected in the first copper-coil condenser where they were quenched to 5oC. Low
boiling point fractions were accumulated in the second washing bottle condenser in
which temperatures down to -79°C could be reached. Online infrared and TCD
analyzers of Hartman and Braun (made in Germany), protected by additional paper
filters, were used to measure the concentration of four main components in the
product gases (CO, CO2, CH4, and H2). The tubular cotton filter was meant to capture
any residual liquid droplets formed downstream the condensation system. Finally, all
the off-gases were sent to the main ventilation system.
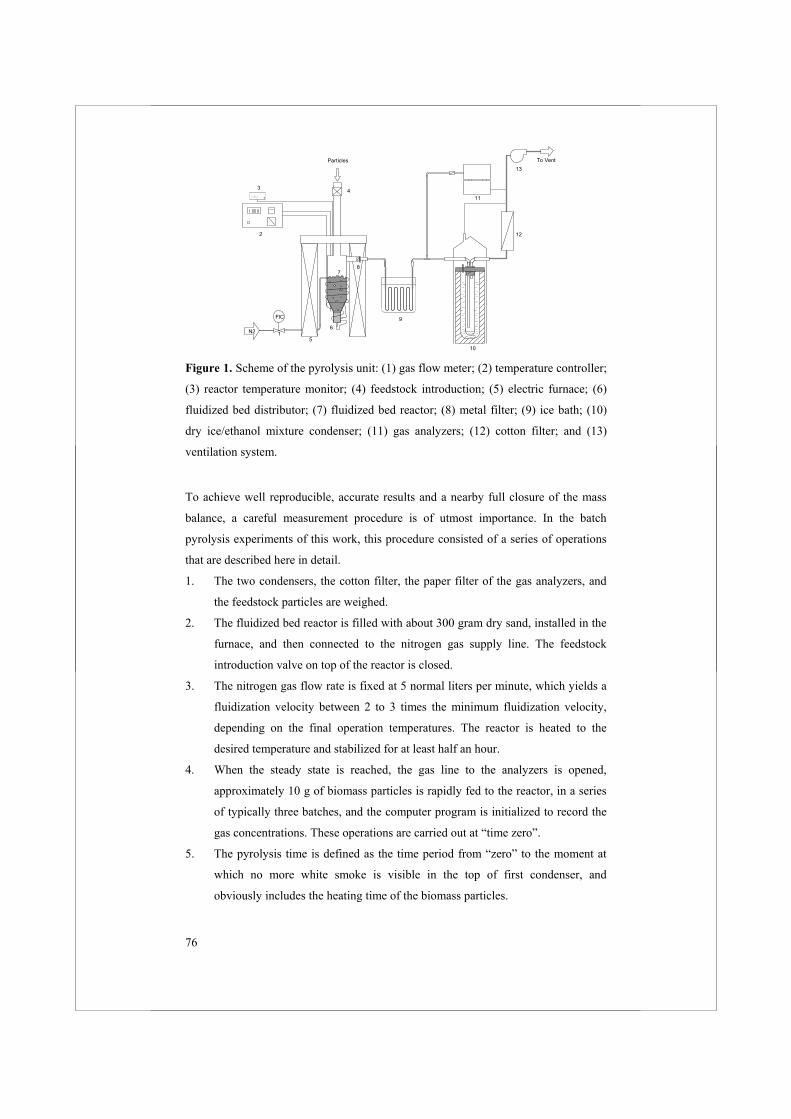
76
1
T
2
3
5
6
78
9
10
12
13
11
N2
Particles To Vent
4
FIC
Figure 1. Scheme of the pyrolysis unit: (1) gas flow meter; (2) temperature controller;
(3) reactor temperature monitor; (4) feedstock introduction; (5) electric furnace; (6)
fluidized bed distributor; (7) fluidized bed reactor; (8) metal filter; (9) ice bath; (10)
dry ice/ethanol mixture condenser; (11) gas analyzers; (12) cotton filter; and (13)
ventilation system.
To achieve well reproducible, accurate results and a nearby full closure of the mass
balance, a careful measurement procedure is of utmost importance. In the batch
pyrolysis experiments of this work, this procedure consisted of a series of operations
that are described here in detail.
1. The two condensers, the cotton filter, the paper filter of the gas analyzers, and
the feedstock particles are weighed.
2. The fluidized bed reactor is filled with about 300 gram dry sand, installed in the
furnace, and then connected to the nitrogen gas supply line. The feedstock
introduction valve on top of the reactor is closed.
3. The nitrogen gas flow rate is fixed at 5 normal liters per minute, which yields a
fluidization velocity between 2 to 3 times the minimum fluidization velocity,
depending on the final operation temperatures. The reactor is heated to the
desired temperature and stabilized for at least half an hour.
4. When the steady state is reached, the gas line to the analyzers is opened,
approximately 10 g of biomass particles is rapidly fed to the reactor, in a series
of typically three batches, and the computer program is initialized to record the
gas concentrations. These operations are carried out at “time zero”.
5. The pyrolysis time is defined as the time period from “zero” to the moment at
which no more white smoke is visible in the top of first condenser, and
obviously includes the heating time of the biomass particles.
77
6. A check on the visually observed pyrolysis time is obtained from the gas
analysis. The pyrolysis process is completed when the gas analyzer readings are
back on their base position. The response time of the analyzers has been
determined separately with tracer gas injection. It appeared to be in the order of
1 s, which is at least 20 times shorter than the pyrolysis times observed
experimentally (see Figure 3).
7. The furnace is switched off and left to cool.
8. The condensers, the paper filter, and the cotton filter are weighed again to
determine the accumulated liquids.
9. To separate the produced char from the bed material, and determine its weight,
the fluid bed inventory is carefully sieved.
10. Ethanol is used to clean the condensers.
11. Each experiment is repeated three times, and the measured values are averaged
to create the data points included in the results presented. A mass balance
closure over 95% is always considered necessary for accepting the results.
As shown in Figure 1, the biomass feed system is extremely simple. Each batch of
wood particles is caused to fall on top of the bed by the opening of valve 4 in Figure 1
at time zero. Because the terminal falling velocity is always, even for the smallest
wood particles, much higher (>1 m/s at 500 oC) than the applied fluidization velocity
(about 0.05 m/s at 500 oC), there is no reason to believe that the wood particle will
not reach the bed surface. Moreover, the falling time is always much less than 1 s.
Therefore, the wood particles will be mixed into the splash zone and fluid bed interior
before their pyrolysis vapors are added to the gas flow in the freeboard above the fluid
bed.
In separate experiments, the mixing of wood particles with a fluid bed (of the same
sand particles as used in the pyrolysis reactor) has been studied visually in a cold-flow
glass model. At room temperature, the large wood particles (dp > 5 mm) tend to float
on the bed; small particles (dp 3), however, are mixed well with a fully fluidized
bed.
Reported yields are based on the wet feedstock. The collected material in the first and
second condenser plus the weight increase of the cotton and paper filter is defined as
the liquid product. Typically, 80 - 90% was found in the first condenser, 10 - 20% in
the second condenser, and about 1% on the filters.
78
Elemental analyses of solids (the original feedstock and residual char) and liquids
samples were carried out (Flash EA 1112 ThermoQuest, Rodano, Italy). Carbon,
hydrogen, and nitrogen were measured directly, while oxygen was determined by
difference. The ash content of the feedstock was always very low, typically less than 1
wt %. The water content was determined by Karl-Fischer titration. It is important to
mention that only the liquid collected in the first condenser has been analyzed.
Liquids from the second condenser could not be analyzed, because of their small
amounts.
The fluidized bed setup could not be used for temperatures below 350oC, because of
the extremely long conversion time (24 h for 250°C). In this case, the condensation
system suffers from continuous and prolonged re-evaporation of the liquid, resulting
in a decreased recovery of bio-oil. To solve this problem, an autoclave reactor was
used for the lowest temperatures. This autoclave was externally heated under good
temperature control (heating jacket). It was divided horizontally into two parts by a
stainless steel mesh. Wood particles of known mass were placed on the mesh. After
an experiment, the autoclave was cooled in a nitrogen stream. Once at ambient
temperature, first the autoclave reactor was flushed with a known volume of nitrogen;
all the gases were collected in a sampling-bag and analyzed for its composition using
a GC. On basis of the GC analysis and the known amount of nitrogen added, the
produced permanent gases could be calculated. Afterward, the produced liquid was
collected from the bottom part, and weighted. Finally, the char that remained on the
mesh was weighted. The conversion time for T < 350°C was measured simply by
putting the biomass particles in a controlled oven and weighing the mass of the
sample every 15 min. Pressure built up during a pyrolysis experiment in the autoclave
as a result of vapor, and gas production never exceeded the value of 1 bar
(overpressure).
3. Results
3.1. Mass Balance
150 successful experiments were performed in total. Table 2 shows the mass balance
of eight typical experiments at different conditions. It should be noticed that in this
work the product yields are always based on the biomass “as received”. Therefore, the
liquid product includes the moisture present in the original biomass particle. The
obtained closure of the mass balance was always between 94% and 104%.
Experimental results outside this range have been rejected from the analysis. With this
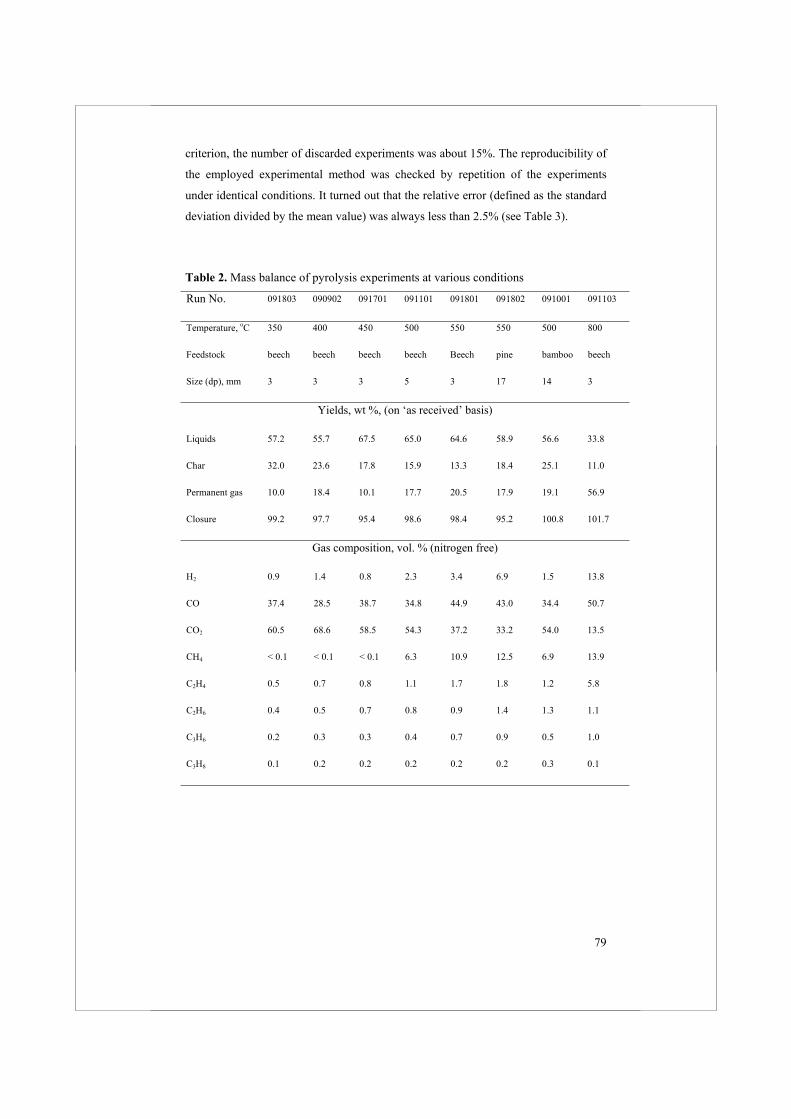
79
criterion, the number of discarded experiments was about 15%. The reproducibility of
the employed experimental method was checked by repetition of the experiments
under identical conditions. It turned out that the relative error (defined as the standard
deviation divided by the mean value) was always less than 2.5% (see Table 3).
Table 2. Mass balance of pyrolysis experiments at various conditions
Run No. 091803 090902 091701 091101 091801 091802 091001 091103
Temperature, oC 350 400 450 500 550 550 500 800
Feedstock beech beech beech beech Beech pine bamboo beech
Size (dp), mm 3 3 3 5 3 17 14 3
Yields, wt %, (on ‘as received’ basis)
Liquids 57.2 55.7 67.5 65.0 64.6 58.9 56.6 33.8
Char 32.0 23.6 17.8 15.9 13.3 18.4 25.1 11.0
Permanent gas 10.0 18.4 10.1 17.7 20.5 17.9 19.1 56.9
Closure 99.2 97.7 95.4 98.6 98.4 95.2 100.8 101.7
Gas composition, vol. % (nitrogen free)
H2 0.9 1.4 0.8 2.3 3.4 6.9 1.5 13.8
CO 37.4 28.5 38.7 34.8 44.9 43.0 34.4 50.7
CO2 60.5 68.6 58.5 54.3 37.2 33.2 54.0 13.5
CH4 < 0.1 < 0.1 < 0.1 6.3 10.9 12.5 6.9 13.9
C2H4 0.5 0.7 0.8 1.1 1.7 1.8 1.2 5.8
C2H6 0.4 0.5 0.7 0.8 0.9 1.4 1.3 1.1
C3H6 0.2 0.3 0.3 0.4 0.7 0.9 0.5 1.0
C3H8 0.1 0.2 0.2 0.2 0.2 0.2 0.3 0.1
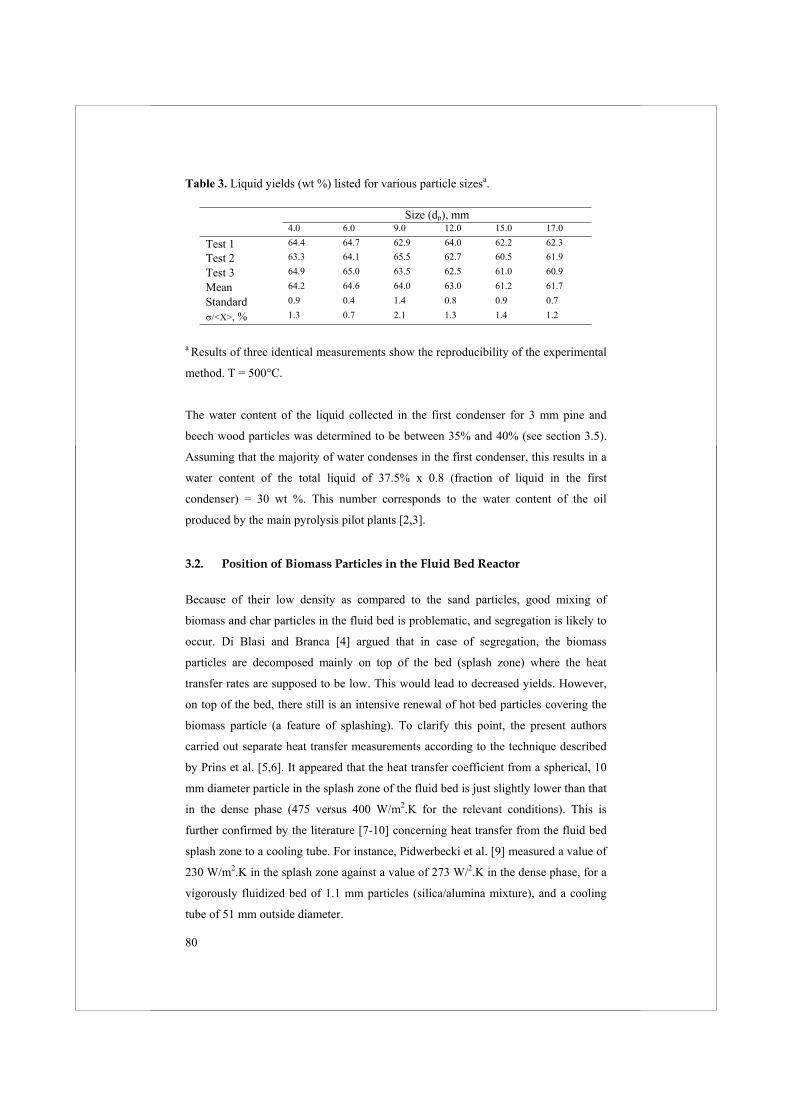
80
Table 3. Liquid yields (wt %) listed for various particle sizesa.
Size (dp), mm 4.0 6.0 9.0 12.0 15.0 17.0
Test 1 64.4 64.7 62.9 64.0 62.2 62.3
Test 2 63.3 64.1 65.5 62.7 60.5 61.9
Test 3 64.9 65.0 63.5 62.5 61.0 60.9
Mean 64.2 64.6 64.0 63.0 61.2 61.7
Standard 0.9 0.4 1.4 0.8 0.9 0.7
/<X>, % 1.3 0.7 2.1 1.3 1.4 1.2
a Results of three identical measurements show the reproducibility of the experimental
method. T = 500°C.
The water content of the liquid collected in the first condenser for 3 mm pine and
beech wood particles was determined to be between 35% and 40% (see section 3.5).
Assuming that the majority of water condenses in the first condenser, this results in a
water content of the total liquid of 37.5% x 0.8 (fraction of liquid in the first
condenser) = 30 wt %. This number corresponds to the water content of the oil
produced by the main pyrolysis pilot plants [2,3].
3.2. Position of Biomass Particles in the Fluid Bed Reactor
Because of their low density as compared to the sand particles, good mixing of
biomass and char particles in the fluid bed is problematic, and segregation is likely to
occur. Di Blasi and Branca [4] argued that in case of segregation, the biomass
particles are decomposed mainly on top of the bed (splash zone) where the heat
transfer rates are supposed to be low. This would lead to decreased yields. However,
on top of the bed, there still is an intensive renewal of hot bed particles covering the
biomass particle (a feature of splashing). To clarify this point, the present authors
carried out separate heat transfer measurements according to the technique described
by Prins et al. [5,6]. It appeared that the heat transfer coefficient from a spherical, 10
mm diameter particle in the splash zone of the fluid bed is just slightly lower than that
in the dense phase (475 versus 400 W/m2.K for the relevant conditions). This is
further confirmed by the literature [7-10] concerning heat transfer from the fluid bed
splash zone to a cooling tube. For instance, Pidwerbecki et al. [9] measured a value of
230 W/m2.K in the splash zone against a value of 273 W/2.K in the dense phase, for a
vigorously fluidized bed of 1.1 mm particles (silica/alumina mixture), and a cooling
tube of 51 mm outside diameter.
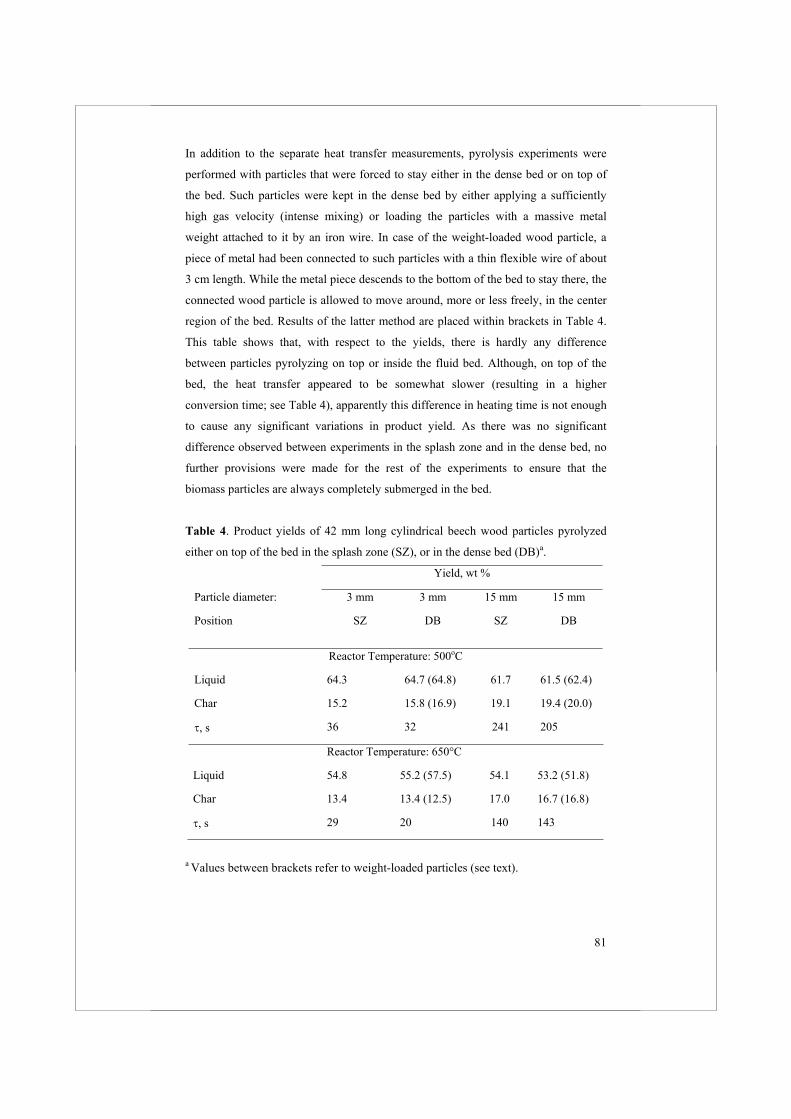
81
In addition to the separate heat transfer measurements, pyrolysis experiments were
performed with particles that were forced to stay either in the dense bed or on top of
the bed. Such particles were kept in the dense bed by either applying a sufficiently
high gas velocity (intense mixing) or loading the particles with a massive metal
weight attached to it by an iron wire. In case of the weight-loaded wood particle, a
piece of metal had been connected to such particles with a thin flexible wire of about
3 cm length. While the metal piece descends to the bottom of the bed to stay there, the
connected wood particle is allowed to move around, more or less freely, in the center
region of the bed. Results of the latter method are placed within brackets in Table 4.
This table shows that, with respect to the yields, there is hardly any difference
between particles pyrolyzing on top or inside the fluid bed. Although, on top of the
bed, the heat transfer appeared to be somewhat slower (resulting in a higher
conversion time; see Table 4), apparently this difference in heating time is not enough
to cause any significant variations in product yield. As there was no significant
difference observed between experiments in the splash zone and in the dense bed, no
further provisions were made for the rest of the experiments to ensure that the
biomass particles are always completely submerged in the bed.
Table 4. Product yields of 42 mm long cylindrical beech wood particles pyrolyzed
either on top of the bed in the splash zone (SZ), or in the dense bed (DB)a.
Yield, wt %
Particle diameter:
Position
3 mm
SZ
3 mm
DB
15 mm
SZ
15 mm
DB
Reactor Temperature: 500oC
Liquid 64.3 64.7 (64.8) 61.7 61.5 (62.4)
Char 15.2 15.8 (16.9) 19.1 19.4 (20.0)
, s 36 32 241 205
Reactor Temperature: 650°C
Liquid 54.8 55.2 (57.5) 54.1 53.2 (51.8)
Char 13.4 13.4 (12.5) 17.0 16.7 (16.8)
, s 29 20 140 143
a Values between brackets refer to weight-loaded particles (see text).
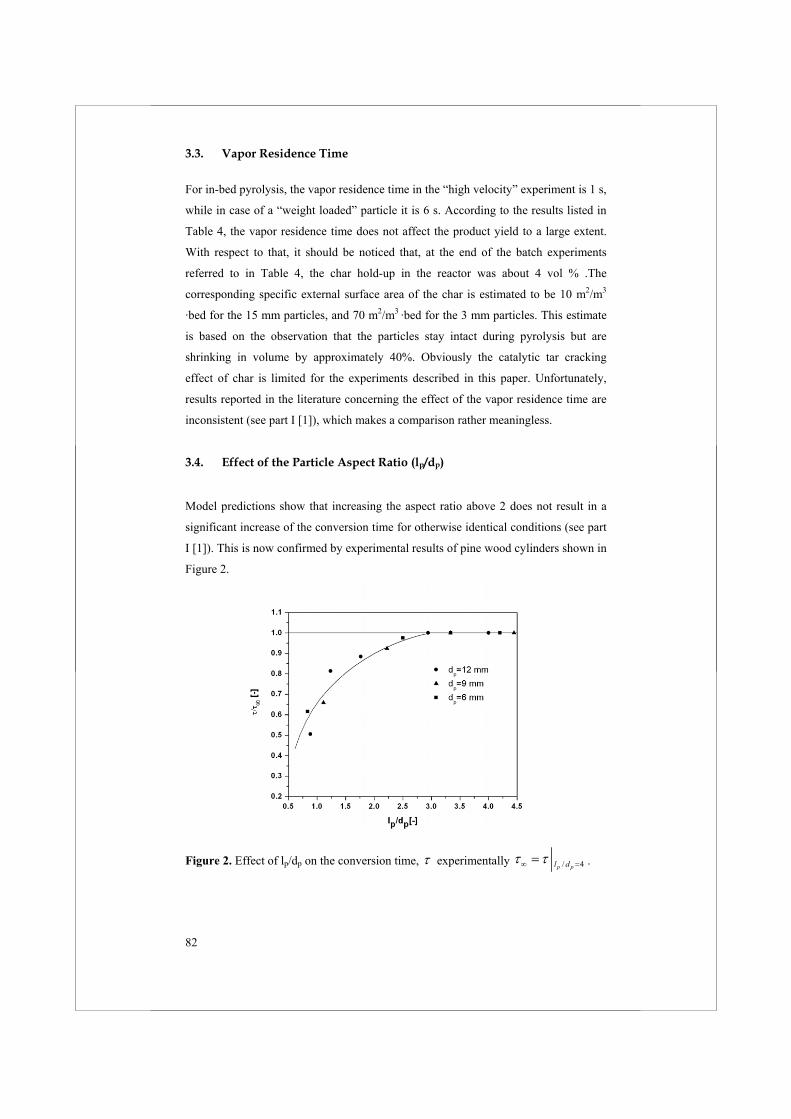
82
3.3. Vapor Residence Time
For in-bed pyrolysis, the vapor residence time in the “high velocity” experiment is 1 s,
while in case of a “weight loaded” particle it is 6 s. According to the results listed in
Table 4, the vapor residence time does not affect the product yield to a large extent.
With respect to that, it should be noticed that, at the end of the batch experiments
referred to in Table 4, the char hold-up in the reactor was about 4 vol % .The
corresponding specific external surface area of the char is estimated to be 10 m2/m3
·bed for the 15 mm particles, and 70 m2/m3 ·bed for the 3 mm particles. This estimate
is based on the observation that the particles stay intact during pyrolysis but are
shrinking in volume by approximately 40%. Obviously the catalytic tar cracking
effect of char is limited for the experiments described in this paper. Unfortunately,
results reported in the literature concerning the effect of the vapor residence time are
inconsistent (see part I [1]), which makes a comparison rather meaningless.
3.4. Effect of the Particle Aspect Ratio (lp/dp)
Model predictions show that increasing the aspect ratio above 2 does not result in a
significant increase of the conversion time for otherwise identical conditions (see part
I [1]). This is now confirmed by experimental results of pine wood cylinders shown in
Figure 2.
Figure 2. Effect of lp/dp on the conversion time, experimentally / 4p pl d .
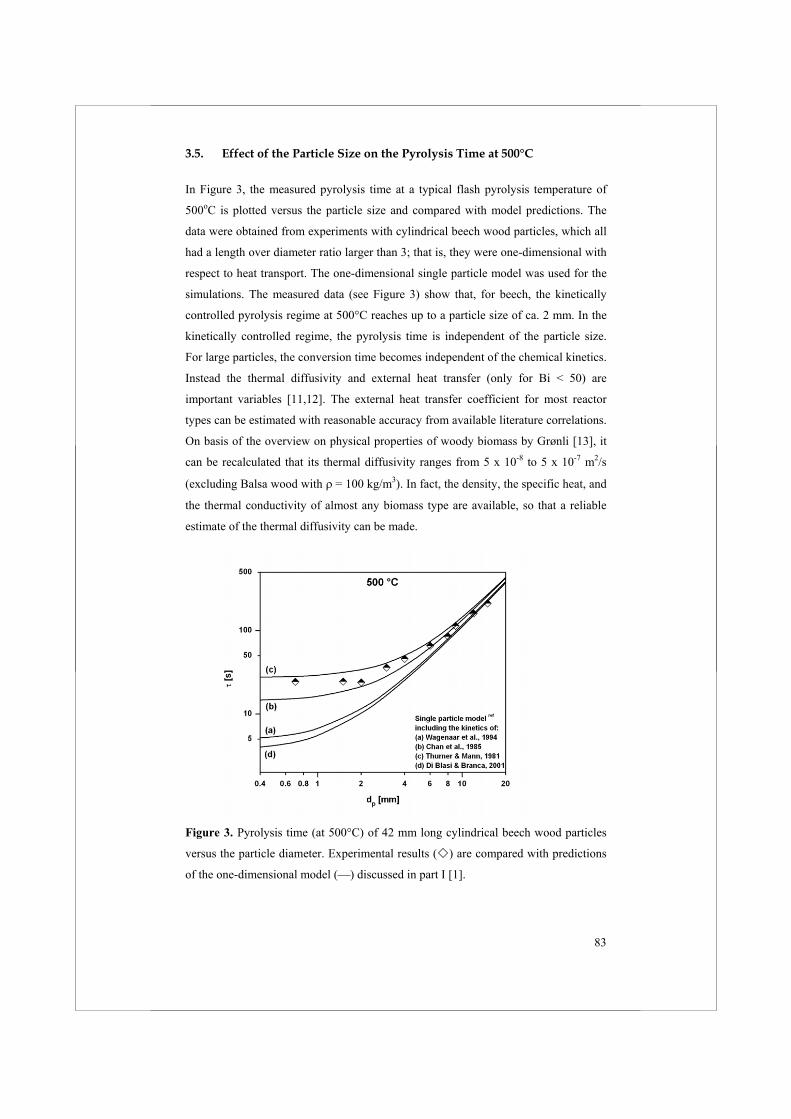
83
3.5. Effect of the Particle Size on the Pyrolysis Time at 500°C
In Figure 3, the measured pyrolysis time at a typical flash pyrolysis temperature of
500oC is plotted versus the particle size and compared with model predictions. The
data were obtained from experiments with cylindrical beech wood particles, which all
had a length over diameter ratio larger than 3; that is, they were one-dimensional with
respect to heat transport. The one-dimensional single particle model was used for the
simulations. The measured data (see Figure 3) show that, for beech, the kinetically
controlled pyrolysis regime at 500°C reaches up to a particle size of ca. 2 mm. In the
kinetically controlled regime, the pyrolysis time is independent of the particle size.
For large particles, the conversion time becomes independent of the chemical kinetics.
Instead the thermal diffusivity and external heat transfer (only for Bi < 50) are
important variables [11,12]. The external heat transfer coefficient for most reactor
types can be estimated with reasonable accuracy from available literature correlations.
On basis of the overview on physical properties of woody biomass by Grønli [13], it
can be recalculated that its thermal diffusivity ranges from 5 x 10⁻⁸ to 5 x 10⁻⁷ m2/s
(excluding Balsa wood with = 100 kg/m3). In fact, the density, the specific heat, and
the thermal conductivity of almost any biomass type are available, so that a reliable
estimate of the thermal diffusivity can be made.
Figure 3. Pyrolysis time (at 500°C) of 42 mm long cylindrical beech wood particles
versus the particle diameter. Experimental results ( ) are compared with predictions
of the one-dimensional model ( ) discussed in part I [1].
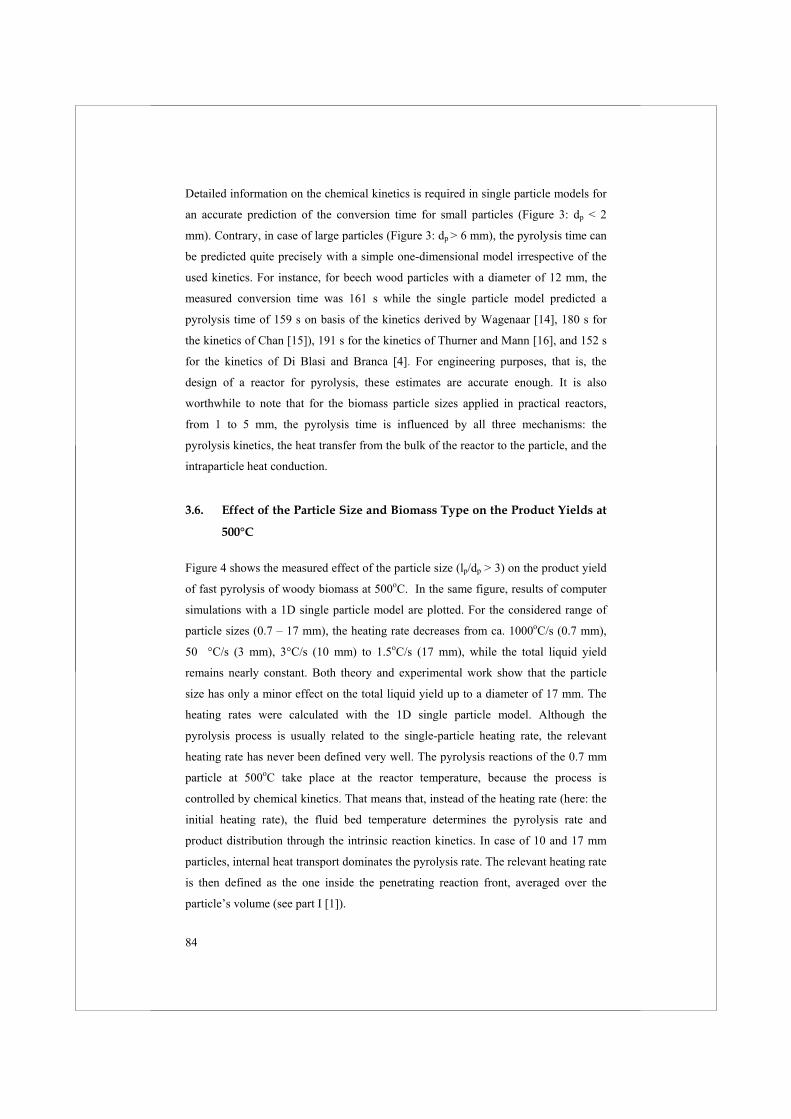
84
Detailed information on the chemical kinetics is required in single particle models for
an accurate prediction of the conversion time for small particles (Figure 3: dp < 2
mm). Contrary, in case of large particles (Figure 3: dp > 6 mm), the pyrolysis time can
be predicted quite precisely with a simple one-dimensional model irrespective of the
used kinetics. For instance, for beech wood particles with a diameter of 12 mm, the
measured conversion time was 161 s while the single particle model predicted a
pyrolysis time of 159 s on basis of the kinetics derived by Wagenaar [14], 180 s for
the kinetics of Chan [15]), 191 s for the kinetics of Thurner and Mann [16], and 152 s
for the kinetics of Di Blasi and Branca [4]. For engineering purposes, that is, the
design of a reactor for pyrolysis, these estimates are accurate enough. It is also
worthwhile to note that for the biomass particle sizes applied in practical reactors,
from 1 to 5 mm, the pyrolysis time is influenced by all three mechanisms: the
pyrolysis kinetics, the heat transfer from the bulk of the reactor to the particle, and the
intraparticle heat conduction.
3.6. Effect of the Particle Size and Biomass Type on the Product Yields at
500°C
Figure 4 shows the measured effect of the particle size (lp/dp > 3) on the product yield
of fast pyrolysis of woody biomass at 500oC. In the same figure, results of computer
simulations with a 1D single particle model are plotted. For the considered range of
particle sizes (0.7 – 17 mm), the heating rate decreases from ca. 1000oC/s (0.7 mm),
50 °C/s (3 mm), 3°C/s (10 mm) to 1.5oC/s (17 mm), while the total liquid yield
remains nearly constant. Both theory and experimental work show that the particle
size has only a minor effect on the total liquid yield up to a diameter of 17 mm. The
heating rates were calculated with the 1D single particle model. Although the
pyrolysis process is usually related to the single-particle heating rate, the relevant
heating rate has never been defined very well. The pyrolysis reactions of the 0.7 mm
particle at 500oC take place at the reactor temperature, because the process is
controlled by chemical kinetics. That means that, instead of the heating rate (here: the
initial heating rate), the fluid bed temperature determines the pyrolysis rate and
product distribution through the intrinsic reaction kinetics. In case of 10 and 17 mm
particles, internal heat transport dominates the pyrolysis rate. The relevant heating rate
is then defined as the one inside the penetrating reaction front, averaged over the
particle’s volume (see part I [1]).
85
Fluid bed pyrolysis of beech, bamboo, and pine gave nearly identical total liquid
yields. Presumably, also as a consequence of a higher density and lower thermal
diffusivity, significantly less liquid (and more char) was collected from 6 mm
demolition wood particles. Concerning the char yields, a clear difference could be
observed. For 3 mm particles, ca. 20 wt % of char was produced in case of bamboo,
whereas pine had a char yield of only 10 wt %. Large-particle char and liquids yields
are approximately the same for pine, beech, and bamboo.
Figure 4. Total liquid and char yield of beech ( ), pine ( ), bamboo ( ), and
demolition wood ( ) particles versus the particle size at 500°C. Experimental results
are plotted for different kinetic data sets and compared with predictions ( ) of the
one-dimensional model discussed in part I [1].
As a consequence of the wide variation in the reported kinetic data (partly due to a
variation in feedstock type), there is also quite some uncertainty in the model
predictions regarding the product distribution, despite the high level of detail applied
in the description of the mass and heat transfer processes (see model lines in Figure
4). However, contrary to the pyrolysis time, with respect to the product distribution
the differences between the kinetic data sets remain over the whole range of particle
sizes. In fact, it is still impossible to predict practical results regarding the product
yields of biomass pyrolysis by combining detailed transport models with the available
kinetics. Figure 4 shows that for the usual flash pyrolysis conditions, the calculated oil
yield varies from 60 to 80 wt % depending on the kinetic data set used.
86
Figure 4 also shows the limited value of the published kinetic relations when used for
the validation of experimentally observed product distributions. This is probably due
to the different wood types used in kinetic studies and their numerous uncontrollable
factors such as growth conditions and pretreatment. Thurner and Mann [16] measured
for oak sawdust, Chan [15] for unspecified sawdust, Wagenaar [14] for pine and Di
Blasi and Branca [4] for beech. Another aspect is the nature of the interpretation
scheme being based on lumped components, which is known to be very sensitive to
any applied experimental conditions and the type of reactor with its particular mixing
state [17,18].
For the beech wood used in this work, none of the available kinetic data sets could
describe the whole measured product yield satisfactorily (see Figure 4), not even the
kinetic data of Di Blasi and Branca that were actually derived for beech. Model
simulations including Wagenaar’s reaction kinetics cannot predict our results of fluid
bed pine wood correctly either, although they were actually measured for that wood
type. The agreement between the measured liquid yield of beech, pine, and bamboo
and the model predictions using the kinetics of Chan et al. is very good (see Figure 4).
However, the amount of beech-char is overpredicted by a factor 1.75 for the same
kinetics (see Figure 4). For beech-char, the model predicts the measured yield best
when the kinetics of Wagenaar et al. are included.
3.7 Effect of the Reactor Temperature on the Product Yields
Next to the particle size, the reactor temperature is also an important design
parameter. Figure 5 shows the measured product yields of relatively small particles
versus the reactor temperature, which was varied over a wide range. At low
temperatures (below 350oC), an autoclave instead of the fluidized bed reactor was
used, because the condenser system of the FB setup was not suited to capture the
liquids, due to the long pyrolysis time (2 - 3 days; see Experimental Section). Below
350oC, the conversion time is extremely long, up to 1.5 days for 250oC. The liquid
yield shows a maximum between 450 and 550oC. Over the whole temperature range,
yields of char and gas decrease and increase, respectively, upon increasing the reactor
temperature. The results are in good qualitative agreement with the fluidized bed
pyrolysis results of Scott and co-workers [19]. In Figure 5 also predictions of the 1D
single particle model are plotted, and, again, like for the effect of dp, the trends can be
predicted quite well, whereas a quantitative mapping is not achieved. Only the kinetic
data of Chan et al. [15] were used to calculate the model lines because these data
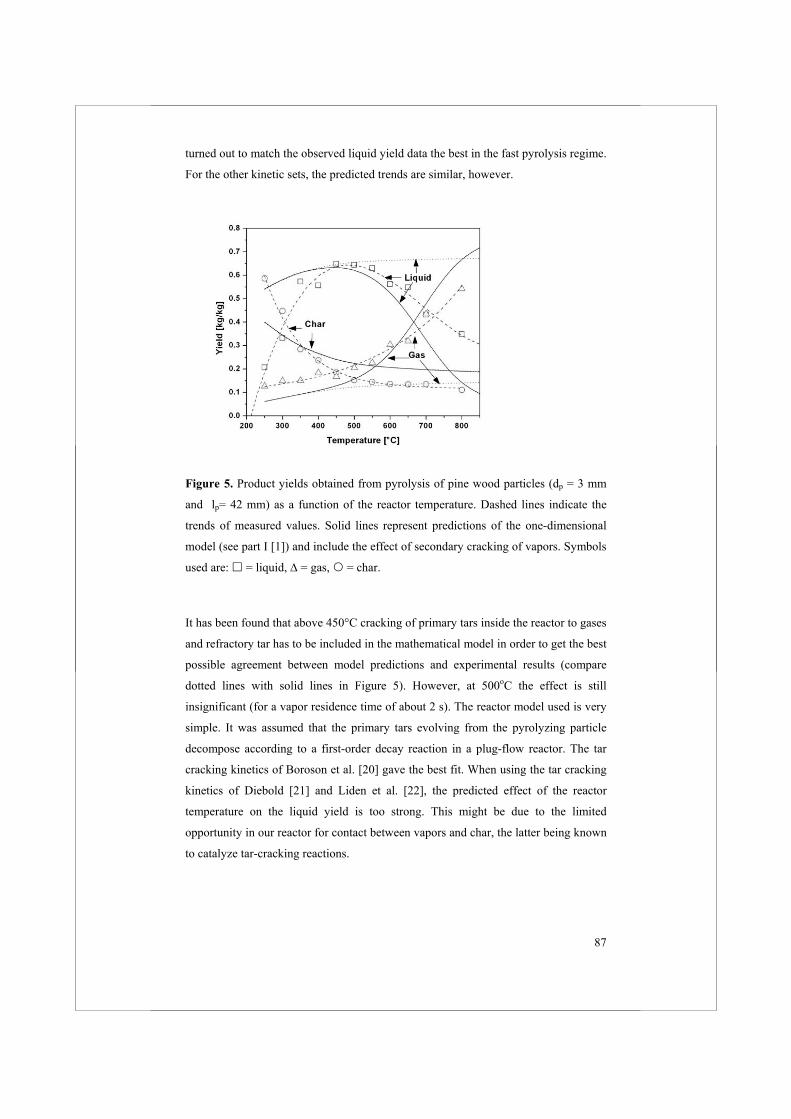
87
turned out to match the observed liquid yield data the best in the fast pyrolysis regime.
For the other kinetic sets, the predicted trends are similar, however.
Figure 5. Product yields obtained from pyrolysis of pine wood particles (dp = 3 mm
and lp= 42 mm) as a function of the reactor temperature. Dashed lines indicate the
trends of measured values. Solid lines represent predictions of the one-dimensional
model (see part I [1]) and include the effect of secondary cracking of vapors. Symbols
used are: = liquid, = gas, = char.
It has been found that above 450°C cracking of primary tars inside the reactor to gases
and refractory tar has to be included in the mathematical model in order to get the best
possible agreement between model predictions and experimental results (compare
dotted lines with solid lines in Figure 5). However, at 500oC the effect is still
insignificant (for a vapor residence time of about 2 s). The reactor model used is very
simple. It was assumed that the primary tars evolving from the pyrolyzing particle
decompose according to a first-order decay reaction in a plug-flow reactor. The tar
cracking kinetics of Boroson et al. [20] gave the best fit. When using the tar cracking
kinetics of Diebold [21] and Liden et al. [22], the predicted effect of the reactor
temperature on the liquid yield is too strong. This might be due to the limited
opportunity in our reactor for contact between vapors and char, the latter being known
to catalyze tar-cracking reactions.
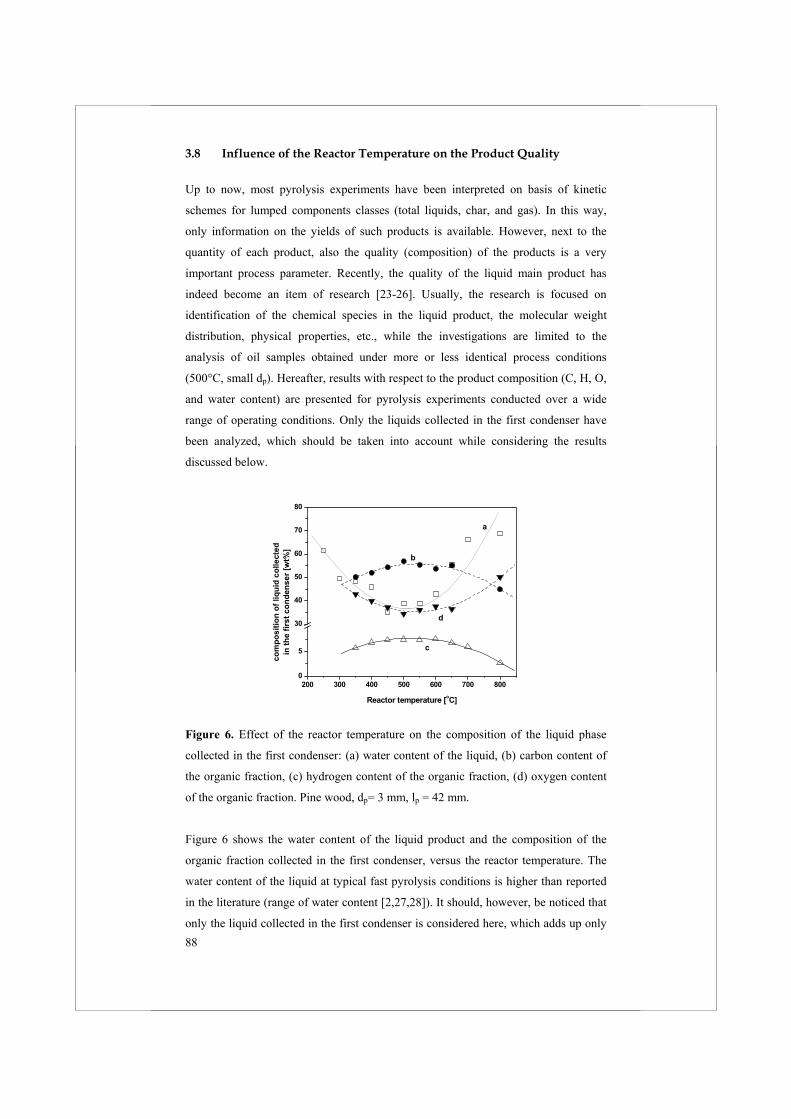
88
3.8 Influence of the Reactor Temperature on the Product Quality
Up to now, most pyrolysis experiments have been interpreted on basis of kinetic
schemes for lumped components classes (total liquids, char, and gas). In this way,
only information on the yields of such products is available. However, next to the
quantity of each product, also the quality (composition) of the products is a very
important process parameter. Recently, the quality of the liquid main product has
indeed become an item of research [23-26]. Usually, the research is focused on
identification of the chemical species in the liquid product, the molecular weight
distribution, physical properties, etc., while the investigations are limited to the
analysis of oil samples obtained under more or less identical process conditions
(500°C, small dp). Hereafter, results with respect to the product composition (C, H, O,
and water content) are presented for pyrolysis experiments conducted over a wide
range of operating conditions. Only the liquids collected in the first condenser have
been analyzed, which should be taken into account while considering the results
discussed below.
200 300 400 500 600 700 8000
5
30
40
50
60
70
80
com
posi
tion
ofliq
uid
colle
cted
in
the
first
con
dens
er [w
t%]
Reactor temperature [oC]
a
b
c
d
Figure 6. Effect of the reactor temperature on the composition of the liquid phase
collected in the first condenser: (a) water content of the liquid, (b) carbon content of
the organic fraction, (c) hydrogen content of the organic fraction, (d) oxygen content
of the organic fraction. Pine wood, dp= 3 mm, lp = 42 mm.
Figure 6 shows the water content of the liquid product and the composition of the
organic fraction collected in the first condenser, versus the reactor temperature. The
water content of the liquid at typical fast pyrolysis conditions is higher than reported
in the literature (range of water content [2,27,28]). It should, however, be noticed that
only the liquid collected in the first condenser is considered here, which adds up only
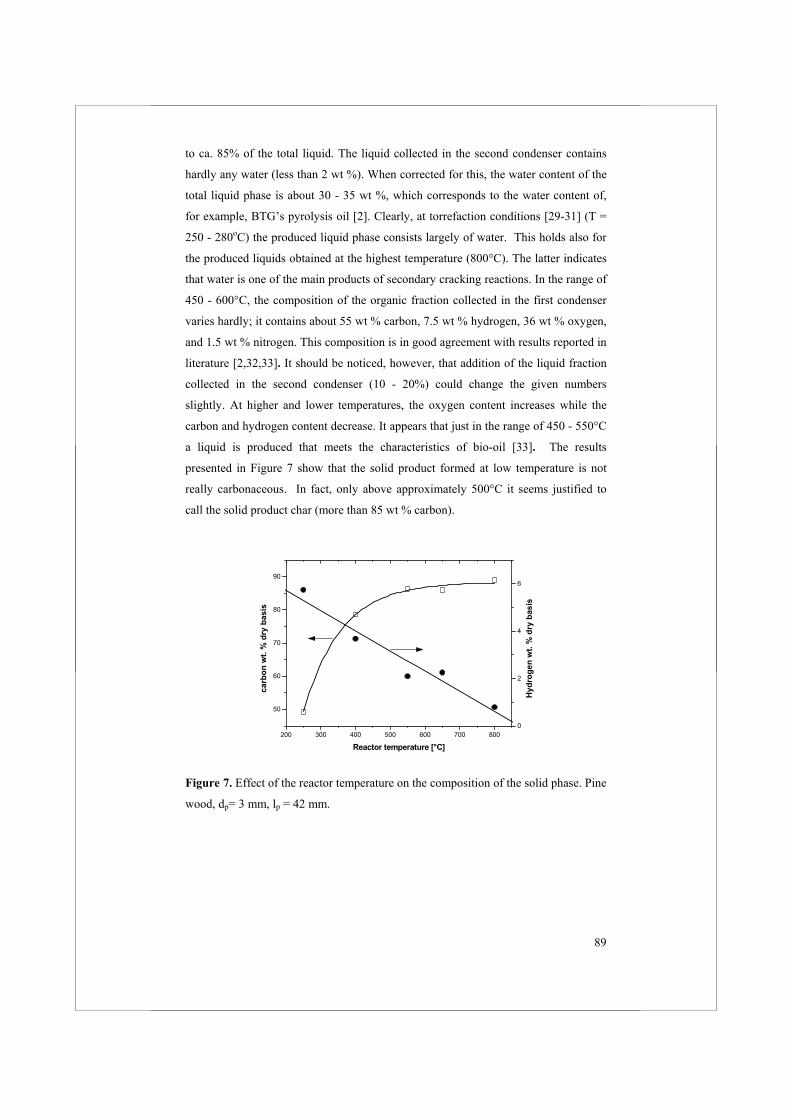
89
to ca. 85% of the total liquid. The liquid collected in the second condenser contains
hardly any water (less than 2 wt %). When corrected for this, the water content of the
total liquid phase is about 30 - 35 wt %, which corresponds to the water content of,
for example, BTG’s pyrolysis oil [2]. Clearly, at torrefaction conditions [29-31] (T =
250 - 280oC) the produced liquid phase consists largely of water. This holds also for
the produced liquids obtained at the highest temperature (800°C). The latter indicates
that water is one of the main products of secondary cracking reactions. In the range of
450 - 600°C, the composition of the organic fraction collected in the first condenser
varies hardly; it contains about 55 wt % carbon, 7.5 wt % hydrogen, 36 wt % oxygen,
and 1.5 wt % nitrogen. This composition is in good agreement with results reported in
literature [2,32,33]. It should be noticed, however, that addition of the liquid fraction
collected in the second condenser (10 - 20%) could change the given numbers
slightly. At higher and lower temperatures, the oxygen content increases while the
carbon and hydrogen content decrease. It appears that just in the range of 450 - 550°C
a liquid is produced that meets the characteristics of bio-oil [33]. The results
presented in Figure 7 show that the solid product formed at low temperature is not
really carbonaceous. In fact, only above approximately 500°C it seems justified to
call the solid product char (more than 85 wt % carbon).
200 300 400 500 600 700 800
50
60
70
80
90
Reactor temperature [°C]
carb
on w
t. %
dry
bas
is
0
2
4
6
Hyd
roge
n w
t. %
dry
bas
is
Figure 7. Effect of the reactor temperature on the composition of the solid phase. Pine
wood, dp= 3 mm, lp = 42 mm.
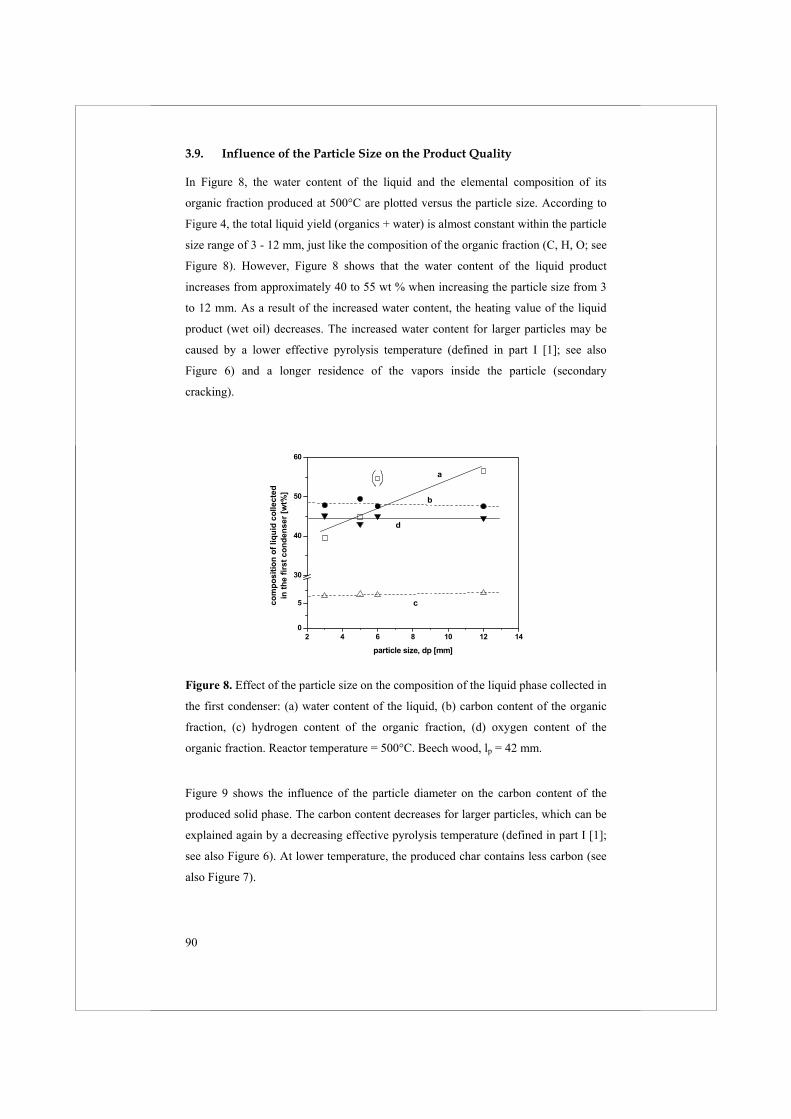
90
3.9. Influence of the Particle Size on the Product Quality
In Figure 8, the water content of the liquid and the elemental composition of its
organic fraction produced at 500°C are plotted versus the particle size. According to
Figure 4, the total liquid yield (organics + water) is almost constant within the particle
size range of 3 - 12 mm, just like the composition of the organic fraction (C, H, O; see
Figure 8). However, Figure 8 shows that the water content of the liquid product
increases from approximately 40 to 55 wt % when increasing the particle size from 3
to 12 mm. As a result of the increased water content, the heating value of the liquid
product (wet oil) decreases. The increased water content for larger particles may be
caused by a lower effective pyrolysis temperature (defined in part I [1]; see also
Figure 6) and a longer residence of the vapors inside the particle (secondary
cracking).
2 4 6 8 10 12 140
5
30
40
50
60
com
posi
tion
ofliq
uid
colle
cted
in
the
first
con
dens
er [w
t%]
particle size, dp [mm]
a
b
d
c
Figure 8. Effect of the particle size on the composition of the liquid phase collected in
the first condenser: (a) water content of the liquid, (b) carbon content of the organic
fraction, (c) hydrogen content of the organic fraction, (d) oxygen content of the
organic fraction. Reactor temperature = 500°C. Beech wood, lp = 42 mm.
Figure 9 shows the influence of the particle diameter on the carbon content of the
produced solid phase. The carbon content decreases for larger particles, which can be
explained again by a decreasing effective pyrolysis temperature (defined in part I [1];
see also Figure 6). At lower temperature, the produced char contains less carbon (see
also Figure 7).
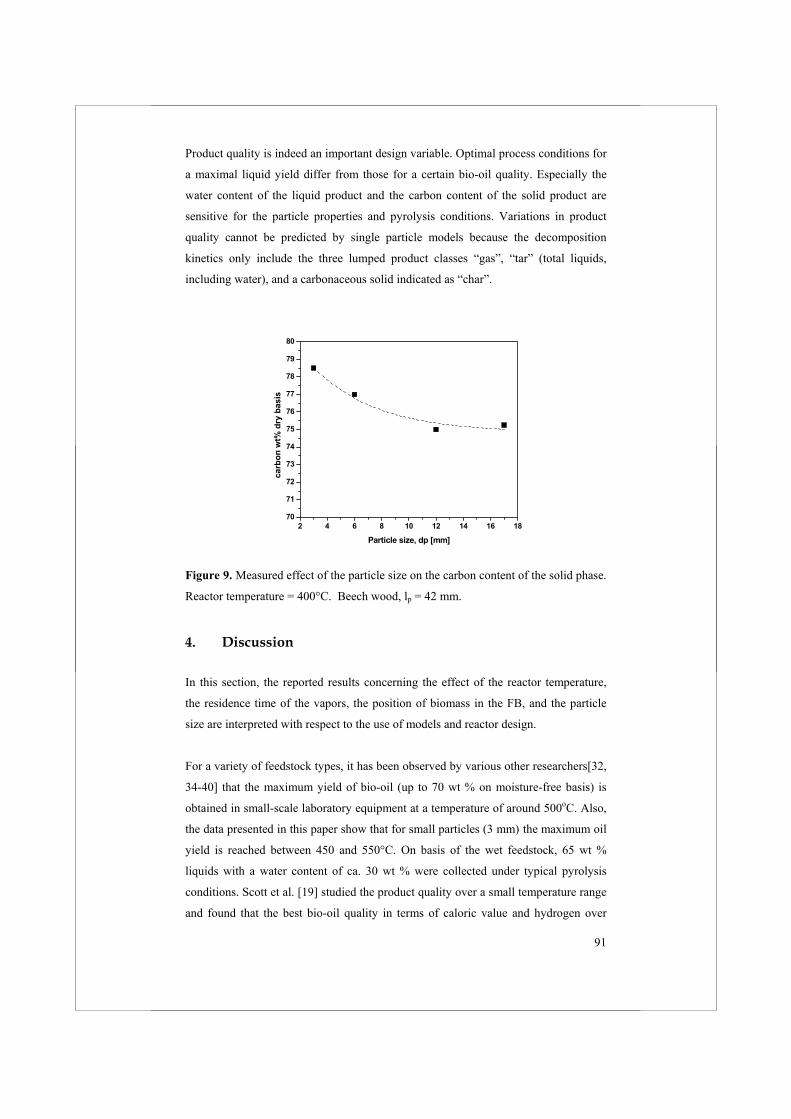
91
Product quality is indeed an important design variable. Optimal process conditions for
a maximal liquid yield differ from those for a certain bio-oil quality. Especially the
water content of the liquid product and the carbon content of the solid product are
sensitive for the particle properties and pyrolysis conditions. Variations in product
quality cannot be predicted by single particle models because the decomposition
kinetics only include the three lumped product classes “gas”, “tar” (total liquids,
including water), and a carbonaceous solid indicated as “char”.
2 4 6 8 10 12 14 16 1870
71
72
73
74
75
76
77
78
79
80
carb
on w
t% d
ry b
asis
Particle size, dp [mm]
Figure 9. Measured effect of the particle size on the carbon content of the solid phase.
Reactor temperature = 400°C. Beech wood, lp = 42 mm.
4. Discussion
In this section, the reported results concerning the effect of the reactor temperature,
the residence time of the vapors, the position of biomass in the FB, and the particle
size are interpreted with respect to the use of models and reactor design.
For a variety of feedstock types, it has been observed by various other researchers[32,
34-40] that the maximum yield of bio-oil (up to 70 wt % on moisture-free basis) is
obtained in small-scale laboratory equipment at a temperature of around 500oC. Also,
the data presented in this paper show that for small particles (3 mm) the maximum oil
yield is reached between 450 and 550°C. On basis of the wet feedstock, 65 wt %
liquids with a water content of ca. 30 wt % were collected under typical pyrolysis
conditions. Scott et al. [19] studied the product quality over a small temperature range
and found that the best bio-oil quality in terms of caloric value and hydrogen over
92
carbon ratio is also achieved at the maximum-yield temperature. We measured over
the temperature range of 250 - 800oC and found that the water content of the oil is
minimal, and the heating value maximal between 450 and 550°C.
Regarding the maximal permitted residence time of the produced vapors in the hot
section, the data reported in literature are contradictory. Some researchers found that
residence times exceeding 0.5 s already cause the oil yield to decrease, whereas others
found no effect of the residence time at all up to values of 2 - 3 s. Also, in the
laboratory-scale experiments reported in this paper, the gas phase residence time has
been varied. In a small fluid bed reactor at 500 °C, with a low char hold-up, the
residence time of the vapor phase was varied from 1 - 6 s, which appeared to have no
notable influence on the product yield. Especially at low temperatures, the contact
with char has presumably more effect on secondary cracking reactions than the actual
vapor residence time. While interpreting published results on secondary cracking of
the primary pyrolysis vapors, and for future studies, the char hold-up of the pyrolysis
reactor as well as the presence of entrained char in the hot parts between the reactor
and the condenser should therefore be taken into account explicitly.
The experimental data obtained in this study have revealed that the total liquid yield is
hardly affected by the particle size up to 17 mm. This effect can be explained on the
basis of intrinsic kinetics and the heat penetration into the particle. For particles up to
20 mm, the decrease in effective pyrolysis temperature as defined in part I [1] is
limited to 100oC for a reactor temperature of 500oC. In the range of 400 - 500oC, the
majority of the total liquid yields (small dp) reported in the literature are comparable.
The particle size, however, does have some effect on the oil quality. For increasing
particle sizes, the moisture content of the produced liquid was found to increase. This
can also be explained from the effective pyrolysis temperature, which is calculated to
be notably lower for larger particles. This observation corresponds to the fact that for
“kinetically controlled” pyrolysis of small particles, the moisture content of the liquid
product also increases upon lowering the temperature (see Figure 6, for T < 500oC).
The elemental composition of the organics in the oil does not change as a function of
the particle size.
As stated before, the particle size has a large influence on the conversion time. For
beech wood, the conversion time increases from 25 s for small particles ( 2 mm) up
to 220 s for particles of 15 mm. While considering reactor design, the increased
conversion time has two important consequences:
93
1) The residence time of biomass in the reactor should be increased to fulfill the
criterion that the residence time of the feed particles must be larger than their
conversion time to ensure complete conversion. In most reactors currently
applied for fast pyrolysis [3], it is difficult to create a biomass residence time of
more than 2 min as required for the pyrolysis of 1 cm diameter particles. For
instance, large particles fed to the bottom of a fluid bed rise with a constant
velocity and, once arrived at the top, do not mix back easily. This results in an
undesired accumulation of partially converted feedstock on top of the bed. In
such a case, most of the conversion takes place near the bed surface causing a
nonuniform, local vapor production and heat demand in large-scale reactors.
2) A limit may be reached upon increasing the biomass particle throughput above
which the specific hold-up of partially converted large particles becomes too
high for acceptable fluidization of the (sand) bed. Therefore, the limit with
respect to the maximum particle size for fast pyrolysis is imposed by the bio-oil
quality (water content) and the restrictions for reactor design rather than by a
loss in total liquid yield.
Finally, from the analysis reported in this paper, it has become evident that the value
of advanced single particle modeling is limited. If the reaction kinetics and selectivity
are known from special measurements, the conversion times of small particles, as well
as the product yields for all particle sizes, can be predicted in principle. However, the
variation in results of kinetic measurements is huge due to the facts that a) biomass is
a natural material with always varying properties, even for a single type, b) results are
always interpreted on basis of a lumped kinetic scheme, which is known for its
sensitivity to experimental conditions and equipment configuration, and c) accurate
measurement appears to be difficult. Mass balance closures are seldom good enough
to clearly determine the real trends of the product yields as a function of temperature
and biomass particle size.
Unfortunately, one has to conclude that the reaction kinetics reported until now
cannot be used to predict the product distribution or the conversion time of small
particles with sufficient accuracy. Only for large particles (dp > 6 mm), the conversion
time can be estimated quite well with single particle models. This is due to the fact of
heat transfer control. External and internal heat transfer properties of biomass are
known in sufficient detail. Future single particle models should focus more on the
description of the quality of the product classes. To include quality aspects, a new
kinetic scheme is required, for instance, starting from a molecular weight (MW)
94
distribution concept. It should be more consistent with the underlying chemistry of
thermolytic bond cleavage, recombination reactions, and volatilization of low MW
products. Such models are based on a continuous reaction and species spectra [41,42],
which are characterized by MW and functional groups. Similar models are used to
describe pyrolysis of synthetic polymers [43]. The challenge will be to find the
chemical and physical processes that define the specific boundaries and restrictions
for biomass pyrolysis. For instance, the model should account for the fact that a solid
matrix always remains. Wagenaar et al. [36] and Landau et al. [44,45] proposed such
a model already for biomass pyrolysis. Their early version, however, is too simple and
shows many shortcomings.
95
5. Conclusions
Wood particles (pine, beech, bamboo, demolition wood) have been pyrolyzed batch-
wise in a fluid bed laboratory setup. Conversion times, product yields, and product
composition were measured as a function of the particle size (0.7 - 17 mm), the
vapor’s residence time (0.25 - 6 s), the position of the biomass particles in the bed
(dense bed and splash zone), and the fluid bed temperature (350 - 800oC). The results
are compared with single particle model calculations. The main conclusions can be
summarized as follows:
- Wood particles stay intact during fluid bed pyrolysis but are shrinking in
volume by approximately 40%.
- Product yields of pine and beech wood obtained are quite similar. The bio-oil
yield is maximal (65 wt % on wet feedstock basis) for a wide temperature range
of 450 - 550°C, while the water content of the bio-oil is minimal (30 - 35 wt %).
More char is produced from bamboo particles (almost 20 wt %) and demolition
wood particles of 6 mm (25 wt %).
- As long as excessive accumulation of biomass and char on the bed surface is
avoided, the location of biomass particles in the fluid bed, either in the dense
bed or in the splash zone, does not effect their pyrolysis time and yields to a
large extent.
- In our fluid bed (with low char hold-up) at typical fast pyrolysis conditions, the
residence time of the pyrolysis vapors is not very critical with respect to the
possible loss of condensable products; < 5 s seems to be acceptable at 500°C.
- While considering the risk of pyrolysis vapor cracking, the char hold-up of the
reactor as well as the presence of entrained char in hot parts between the reactor
and the condenser should be taken into account explicitly.
- Both, theory and experimental work show that the particle size has only a minor
effect on the total liquid yield up to a diameter of 20 mm. However, for particles
larger than 3 mm, the water content of the produced bio-oil increases
substantially.
- The use of very small biomass particles as a feedstock for fast pyrolysis is not
an intrinsic requirement. A choice to use small particles is more related to the
desired oil quality and certain constraints concerning the reactor design.
- The pyrolysis time of biomass particles in the size range of 1 - 5 mm, usually
applied in full-scale reactors at 500oC, is influenced by all three mechanisms:
the pyrolysis kinetics, the heat transfer from the bulk of the reactor to the
particle, and the intra-particle heat conduction.
96
- Existing single particle models have a limited predictive power with respect to
the product distribution and the conversion time of small particles (< 3 mm),
due to a wide variation in reported decomposition kinetics.
- Variations in bio-oil quality (e.g., water content of liquid) cannot be predicted
by existing single particle models. Product quality is, however, an important
design parameter. Optimal process conditions for a maximal liquid yield may
differ from those for a certain desired bio-oil quality.
Acknowledgement
The financial support from the European Commission and The Netherlands
Organization for Scientific Research (NWO) is gratefully acknowledged. Dr. Detlef
Schmiedl from the Institute for Wood Chemistry and Chemical Technology of Wood
in Hamburg, Germany, is acknowledged for performing the analytical work.
References
1. Kersten, S.R.A., Wang, X., Prins, W., van Swaaij, W.P.M., Biomass pyrolysis
in a fluidized bed reactor: Part I. literature review and model simulations; Ind.
Eng. Chem. Res., 2005, 44, pp. 8773-8785.
2. Scholze, B., Long-term stability, catalytic upgrading, and application of
pyrolysis oils-improving the properties of a potential substitute of fossil fuels;
Ph.D. Thesis, University of Hamburg, Hamburg, Germany, 2002.
3. Bridgwater, A.V., Peacocke, G.V.C., Fast pyrolysis processes for biomass;
Renewable and Sustainable Energy Reviews, 2000, 4, pp. 1-73.
4. Di Blasi, C., Branca, C., Kinetics of primary product formation from wood
pyrolysis; Ind. Eng. Chem. Res., 2001, 40, pp. 5547-5556.
5. Prins, W., Fluidized bed combustion of a single carbon particle; Ph.D. Thesis,
University of Twente, Enschede, The Netherlands, 1987.
6. Prins, W., Draijer, W., van Swaaij, W.P.M., Heat transfer to immersed spheres
fixed or freely moving in a gas-fluidized bed; In Heat and Mass Transfer in
Fixed and Fluidized Beds, van Swaaij, W.P.M., Afgan, N.H., Eds., Hemisphere
Publishing Corporation, Washington, USA, 1986, pp. 317-331.
7. Dyrness, A., Glicksman, L.R., Yule, T., Heat transfer in the splash zone of a
fluidized bed; Int. J. Heat Mass Transfer, 1993, 35, pp. 847-860.
97
8. Wood, R.T., Kuwata, M., Staub, F.W., Heat transfer to horizontal tube banks in
the splash zone of a fluidized bed of large particles; In Fluidization, Grace, J.R.,
Matsen, J.M., Eds., Plenum, New York, 1980, pp. 235-243.
9. Pidwerbecki, D., Welty, J.R., Heat transfer to a horizontal tube in the splash
zone of a bubbling fluidized bed: an experimental study of particle size effects;
Experimental Thermal and Fluid Science, 1995, 10, pp. 307-317.
10. Pidwerbecki, D., Welty, J.R., Heat transfer to a horizontal tube in the splash
zone of a bubbling fluidized bed: an experimental study of temperature effects;
Experimental Thermal and Fluid Science; 1994, 9, pp. 356-365.
11. Pyle, D.L., Zaror, C.A., Heat transfer and kinetics in the low temperature
pyrolysis of solids; Chem. Eng. Sci., 1984, 39, pp. 147-158.
12. Lede, J., Chemical engineering aspects of solid (biomass) particle pyrolysis: a
review of the possible rate limiting factors; In Developments in thermochemical
biomass conversion, Bridgwater A.V., Boocock, D.G.B., Eds., Blackie
Academic & Professional, London, UK, 1997, pp. 104-116.
13. Gronli, M., A theoretical and experimental study of the thermal degradation of
biomass; Ph.D. Thesis, Norweign University of Science and Technology
(NTNU), Trondheim, 1996.
14. Wagenaar, B.M., Prins, W., van Swaaij, W.P.M., Flash pyrolysis kinetics of
pine wood; Fuel Processing Technology, 1993, 36, pp. 291-298.
15. Chan, W.-C.R., Kelbon, M., Krieger, B.B., Modelling and experimental
verification of physical and chemical processes during pyrolysis of a large
biomass particle; Fuel, 1985, 64, pp. 1505-1513.
16. Thurner, F., Mann, U., Kinetic investigation of wood pyrolysis; Ind. Eng. Chem.
Process Des. Dev., 1981, 20, pp. 482-488.
17. Luss, D., Golikeri, S.V., Grouping of many species each consumed by two
parallel first-order reactions; AIChE J., 1975, 21, pp. 865-872.
18. Golikeri, S.V., Luss, D., Analysis of activation energy of grouped parallel
reactions; AIChE J., 1972, 18, pp. 277-282.
19. Scott, D.S., Piskorz, J., Radlein, D., The role of temperature in the fast pyrolysis
of cellulose and wood; Ind. Eng. Chem. Res., 1988, 27, pp. 8-15.
20. Boroson, M.L., Howard, J.B., Longwell, J.P., Peters, B., Product yields and
kinetics from the vapor phase cracking of wood pyrolysis tars; AIChE J., 1989,
35, pp. 120-128.
98
21. Diebold, J.P., The cracking kinetcs of depolymerized biomass vapours in a
continuous tubular reactor; M.Sc. Thesis, Colorado school of Mines, USA,
1985.
22. Liden, A.G., Berruti, F., Scott, D.S., A kinetic model for the production of
liquids from the flash pyrolysis of biomass; Chem. Eng. Comm., 1988, 65, pp.
207-221.
23. Oasmaa, A., Czernik, S., Fuel oil quality of biomass pyrolysis oils: state-of-the-
art for the end users; Energy & Fuels, 1999, 13, pp. 914-921.
24. Agblevor, F.A., Besler, S., Evans, R.J., Inorganic compounds in biomass
feedstocks: their role in char formation and effect on the quality of fast pyrolysis
oils; In Proceedings of biomass pyrolysis oil properties and combustion
meeting, National Renewable Energy Laboratory, Estes Park, CO, 1994.
25. Minkova, V., Razvigorova, M., Bjornbom, E., Zanzi, R., Budinova, T., Petrov,
N., Effect of water vapour and biomass nature on the yield and quality of the
pyrolysis products from biomass; Fuel Process. Techn., 2001, 70, pp. 53-61.
26. Agblevor, F.A., Besler, S., Inorganic compounds in biomass feedstocks .1.
Effect on the quality of fast pyrolysis oils; Energy & Fuels, 1996, 10, pp. 293-
298.
27. Oasmaa, A., Leppamaki, E.A., Kopolen, P., Levander, J., Tapola, E., Physical
characterisation of biomass-based pyrolysis liquids: Application of standard fuel
oil analyses; VTT, Technical Research Center of Finland, Espoo, Finland, 1997,
pp. 87.
28. Bridgwater, A.V., Czernik, S., Diebold, J., Meier, D., Oasmaa, A., Peacocke, C.,
Piskorz, J., Radlein, D., Eds., Fast pyrolysis of biomass: A handbook, CPL
Press, 1999.
29. Bergman, P.C.A., Boersma, A.R., Kiel, J.H.A., Prins, M.J., Ptasinski, K.J.,
Janssen, F.J.J.G., Torrefaction for entrained-flow gasification of biomass; In
The 2nd World Conference and Technology Exhibition on Biomass for Energy,
Industry and Climate Protection, Rome, Italy, 2004.
30. Felfli, F.F., Luengo, C.A., Bezzon, G., Soler, P., Bench unit for biomass
residues torrefaction; In 10th European Biomass Conference and Technology
Exhibition, Biomass for Energy and Industry. Wurzburg, Germany:
C.A.R.M.E.N., Rimpar, Germany, 1998.
31. Prins, M.J., Thermodynamic analysis of biomass gasification and torrefaction;
Ph.D. Thesis, Technical University of Eindhoven, The Netherlands, 2005.
99
32. Peacocke, G.V.C., Ablative pyrolysis of biomass; Ph.D. Thesis, Aston
University: Birmingham, UK, 1994.
33. Bridgwater, A.V., Ed., Fast pyrolysis of biomass. A handbook, CPL Press,
2002, vol. 2.
34. Scott, D.S., Majerski, P., Piskorz, J., Radlein, D., A second look at fast
pyrolysis of biomass - the RTI process; J. Anal. Appl. Pyrolysis, 1999, 51, pp.
23-37.
35. Scott, D.S., Piskorz, J., The flash pyrolysis of Aspen-Polar wood; Can. J. Chem.
Eng., 1982, 60, pp. 666-674.
36. Scott, D.S., Piskorz, J., The continuous flash pyrolysis of biomass; Can. J.
Chem. Eng., 1984, 62, pp. 291-294.
37. Scott, D.S., Piskorz, J., Bergougnou, M.A., Graham, R., Overend, R.P., The role
of temperature in the fast pyrolysis of cellulose and wood; Ind. Eng. Chem.
Res., 1988, 27, pp. 8-15.
38. Horne, P.A., Williams, P.T., Influence of temperature on the products from the
flash pyrolysis of biomass; Fuel, 1996, 75, pp. 1051-1059.
39. Luo, Z., Wang, S., Liao, Y., Zhou, J., Gu, Y., Cen, K., Research on biomass fast
pyrolysis for liquid fuel; Biomass and Bioenergy, 2004, 26, pp. 455-462.
40. Bilbao, R., Mastral, J.F., Aldea, M.E., Ceamanos, J., Betran, M., Lana, J.A.,
Experimental and theoretical study of the ignition and smoldering of wood
including convective effects; Combustion and Flame, 2001, 126, pp. 1363-1372.
41. McCoy, B.J., Distribution kinetics for temperature-programmed pyrolysis; Ind.
Eng. Chem. Res., 1999, 38, pp. 4531-4537.
42. McCoy, B.J., Sterling, W. Jerome, Phase-Equilibrium Fraction of Continuous
Distributions; AIChE J., 2000, 46, pp. 751-757.
43. McCoy, B.J., Madras, G., Discrete and continuous models for polymerization
and depolymerization; Chem. Eng. Sci., 2001, 56, pp. 2831-2836.
44. Wagenaar, B.M., The rotating cone reactor: for rapid thermal solids processing;
Ph.D. Thesis, University of Twente, Enschede, The Netherlands, 1994.
45. Landau, R.N., Libanati, C., Klein, M.T. Monte Carlo simulation of lignin
pyrolysis: sensitivity to kinetic parameters; In Research in Thermal Chemical
Biomass Conversion, Elsevier Applied Science, New York, 1988.

100
101
Chapter 4
Hydrodynamics of a Fluidized Bed with
Immersed Filters for Extracting and
Cleaning of Biomass Fast Pyrolysis
Vapors
Abstract
In this chapter, the hydrodynamics of a fluid bed in which part of the ingoing gas flow
is extracted via immersed filters are investigated. This is a model-system for a fluid
bed pyrolysis reactor with immersed filters for extracting and cleaning of the
produced vapors. It has been investigated, in two- and three-dimensional cold-flow
fluid beds, how extraction of gas via filters influences intra-bed heat transport, and
under which conditions a stagnant layer of bed-particles is formed around the filters
(a so-called filter-cake).
If the velocity at the top of the fluid bed is used to correlate the data, heat transport in
the tested fluid beds shows the same dependency of the superficial gas velocity, with
or without extraction of gases through the filters. At equal top velocity the heat-
dispersion coefficient with flow through the filter is ca. 2.5 times lower than without.
Form visual observation, it is has become clear that the filter-cake on horizontal
filters is located primarily above the filter and is egg-shaped. By selecting a suitable
filter and combination of particle size, gas velocity and filter-flow, filter-cake
formation can be avoided in this model system while still removing large parts of the
ingoing gas (up to 80%). The effect of the operating conditions on the filter-cake area
can be explained with a simple force balance model including a drag and turbulent
force.
102
1. Introduction
Fast pyrolysis is a promising technology that converts solid biomass into a
transportable liquid energy carrier with a high energy bulk-density of ca. 20 GJ/m3 [1]
compared to ca. 6 GJ/m3 [2] for e.g. wood chips. This is an advantage, especially
when biomass resources are remote from the place where they are actually required. A
“liquid” biomass can be readily stored, transported, and utilized at different sites [3,4].
Another advantage of fast pyrolysis is that the liquid product is cleaner than the
original feedstock [5-7]. Minerals and metals in the feedstock are concentrated in the
solid by-product (char) due to the relatively low process temperature (ca. 500°C).
Because of this, the minerals remain in the production area with the possibility of
recycling it back to the soil. However, due to entrainment, pyrolysis oil still contains
between 0.1 - 1 wt % of char including minerals and metals. It is already known that
char particles inside the bio-oil act as a catalyst for re-polymerization reactions of bio-
oil components, making the oil unstable and subject to phase separation [4,8,9].
Metals inside the entrained char particles are believed to be a cause of problems in
bio-oil applications like corrosion, and erosion of turbine blades, as well as of steam
boilers and furnaces. However, char free bio-oil approaches the specifications of
sophisticated end-use applications like furnaces, turbines and (catalytic) oil-gasifiers
[10-12]. To produce such a clean product, it is crucial to separate the char from the oil.
In-situ removal of ash/char may be an attractive option for producing particle free bio-
oil (see Chapter 1). For this purpose, a fluidized bed with immersed filters for
extracting pyrolysis vapors is proposed [13] (also see Chapter 1.). This concept is
called the Filter Assisted Fluidized Bed (FAFB) pyrolysis reactor. The basic idea
behind the FAFB is that the produced pyrolysis vapors are cleaned and extracted via
immersed heat-resistant self-cleaning filters. In this chapter, results of cold-flow
measurements concerning the hydrodynamics of this novel reactor will be presented.
The measurements are indicative and are meant to support the concept of in-situ
cleaning of pyrolysis vapors.
2. Other Particle Separation Techniques
Extensive overviews of flue gas cleaning systems have been presented by Clift and
Seville [14], Thambimuthu [15], and Zevenboven and Kilpinen [16]. Because of
restrictions imposed by the fast pyrolysis process, only a limited number of
conventional cleaning devices are suitable for pyrolysis vapors. One typical problem
is that biomass pyrolysis vapors start to condense around 300oC.
103
Pyrolysis char has a low density and, due to attrition, part of it is present as sub-
micron particles. Traditionally, cyclones have been used to separate solid particles
from the vapor streams because of their low cost and reliable design. However, the
fraction of particles smaller than 5 micron can not be captured by cyclones [15]. In
recent pilot-plant developments [5], electrostatic precipitators (EP) and hot gas
filtration have been applied. EPs are very expensive [16], from both a capital and
operating point of view. Tests with baghouse filters placed in the hot product line
down stream of a pyrolysis reactor showed that their performance deteriorates in time
[17]. During these tests, it became more difficult in time to remove the accumulated
char. Generally, filters need complicated back-flushing systems to keep them clean.
Alternatively to cleaning the vapors at high temperature, it is also possible to filter the
condensed bio-oil. The main disadvantage of liquid filtration is that it generates a bio-
oil/char sludge. Disposal and or utilization of this sludge may require costly secondary
equipment. Besides, ashes dissolved in the bio-oil may slip through the filters.
Another type of in-situ particle removal pyrolysis reactor was introduced by Bramer
and Brem et al. [18]. In their so-called PyRos process the pyrolysis is carried out in a
cyclone reactor with an integrated hot gas filter to produce particle free bio-oil. Their
hot gas filtration system is based on the principle of the rotational particle separator
(US-patent No. 5073177). The PyRos reactor is still under development.
3. Filter Assisted Fluidized Bed (FAFB)
Different from traditional downstream hot gas cleaning technology, the in-situ
char/ash removal concept is based on the presence of self-cleaning heat resistant
filters, submerged in a fluidized bed pyrolysis reactor (see Figure 1). The majority of
the produced vapors are extracted through these filters. It is anticipated that due to the
scouring action of the bed particles, the filters are permanently cleaned.
The filter assisted fluidized bed pyrolysis reactor has two intensification aspects: i)
reaction and separation are integrated in a single apparatus and, ii) under flash
pyrolysis conditions (that is a very high reaction rate) a higher throughput per unit
volume reactor can be achieved, because the velocity in the bed is kept low by
extraction of the produced vapors from the bed through the filters.
A final design of a FAFB pyrolysis reactor, including the filter bank arrangement, has
not yet been made. Nevertheless, some design aspects are discussed in Chapter 6.
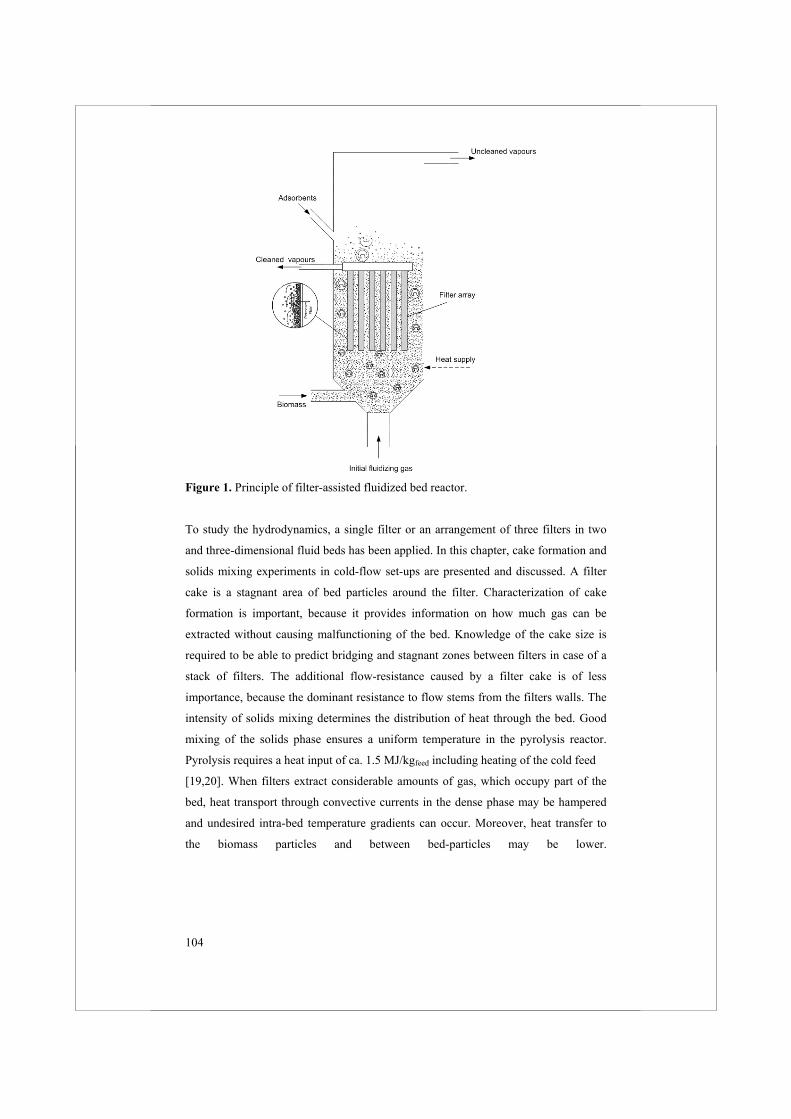
104
Figure 1. Principle of filter-assisted fluidized bed reactor.
To study the hydrodynamics, a single filter or an arrangement of three filters in two
and three-dimensional fluid beds has been applied. In this chapter, cake formation and
solids mixing experiments in cold-flow set-ups are presented and discussed. A filter
cake is a stagnant area of bed particles around the filter. Characterization of cake
formation is important, because it provides information on how much gas can be
extracted without causing malfunctioning of the bed. Knowledge of the cake size is
required to be able to predict bridging and stagnant zones between filters in case of a
stack of filters. The additional flow-resistance caused by a filter cake is of less
importance, because the dominant resistance to flow stems from the filters walls. The
intensity of solids mixing determines the distribution of heat through the bed. Good
mixing of the solids phase ensures a uniform temperature in the pyrolysis reactor.
Pyrolysis requires a heat input of ca. 1.5 MJ/kgfeed including heating of the cold feed
[19,20]. When filters extract considerable amounts of gas, which occupy part of the
bed, heat transport through convective currents in the dense phase may be hampered
and undesired intra-bed temperature gradients can occur. Moreover, heat transfer to
the biomass particles and between bed-particles may be lower.
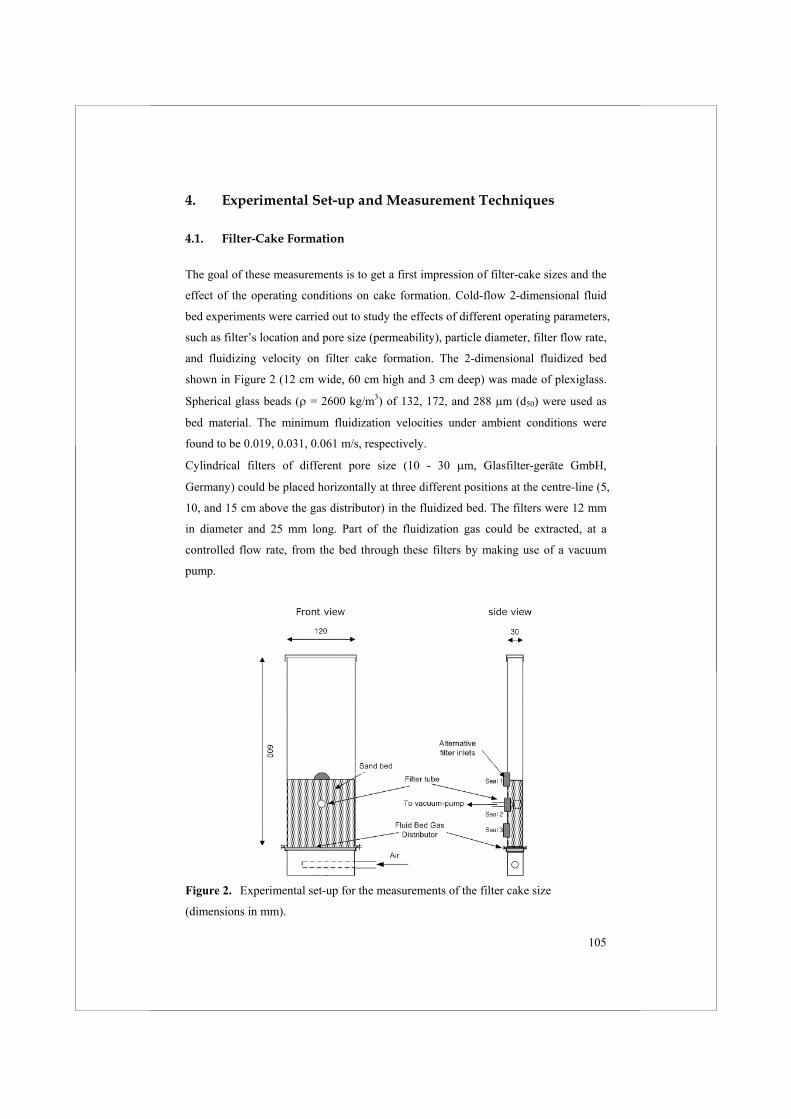
105
4. Experimental Set-up and Measurement Techniques
4.1. Filter-Cake Formation
The goal of these measurements is to get a first impression of filter-cake sizes and the
effect of the operating conditions on cake formation. Cold-flow 2-dimensional fluid
bed experiments were carried out to study the effects of different operating parameters,
such as filter’s location and pore size (permeability), particle diameter, filter flow rate,
and fluidizing velocity on filter cake formation. The 2-dimensional fluidized bed
shown in Figure 2 (12 cm wide, 60 cm high and 3 cm deep) was made of plexiglass.
Spherical glass beads ( = 2600 kg/m3) of 132, 172, and 288 m (d50) were used as
bed material. The minimum fluidization velocities under ambient conditions were
found to be 0.019, 0.031, 0.061 m/s, respectively.
Cylindrical filters of different pore size (10 - 30 m, Glasfilter-geräte GmbH,
Germany) could be placed horizontally at three different positions at the centre-line (5,
10, and 15 cm above the gas distributor) in the fluidized bed. The filters were 12 mm
in diameter and 25 mm long. Part of the fluidization gas could be extracted, at a
controlled flow rate, from the bed through these filters by making use of a vacuum
pump.
Figure 2. Experimental set-up for the measurements of the filter cake size
(dimensions in mm).
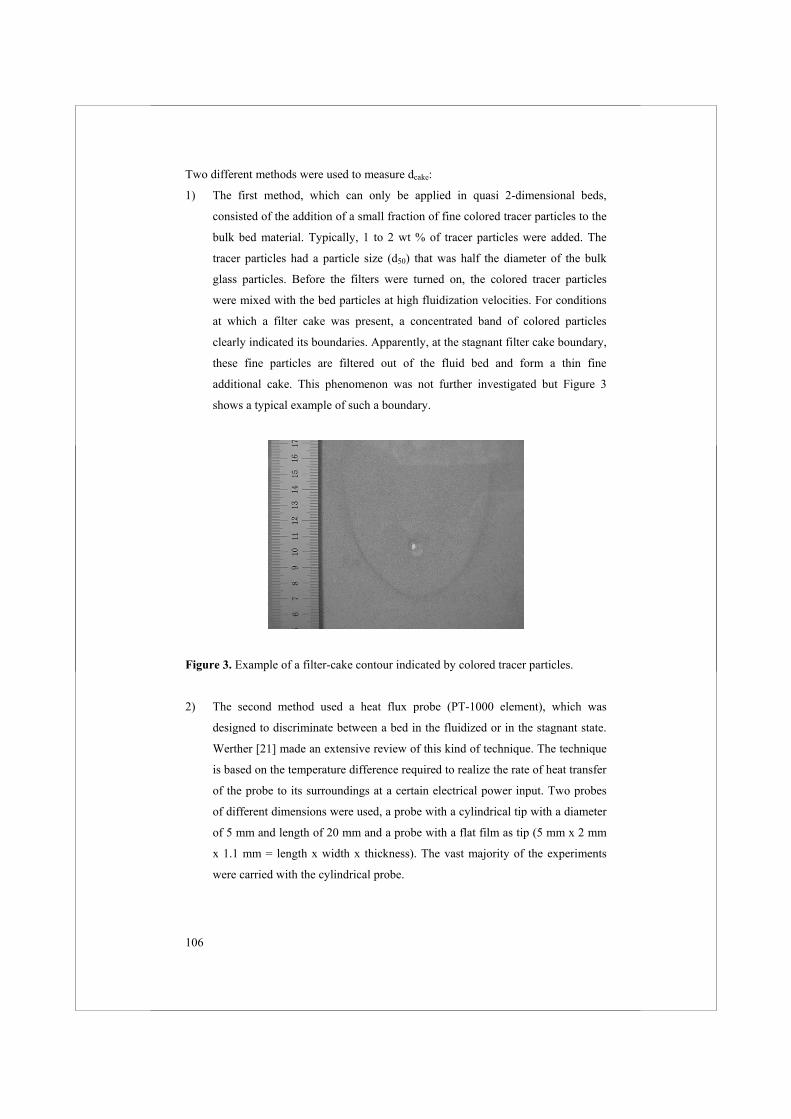
106
Two different methods were used to measure dcake:
1) The first method, which can only be applied in quasi 2-dimensional beds,
consisted of the addition of a small fraction of fine colored tracer particles to the
bulk bed material. Typically, 1 to 2 wt % of tracer particles were added. The
tracer particles had a particle size (d50) that was half the diameter of the bulk
glass particles. Before the filters were turned on, the colored tracer particles
were mixed with the bed particles at high fluidization velocities. For conditions
at which a filter cake was present, a concentrated band of colored particles
clearly indicated its boundaries. Apparently, at the stagnant filter cake boundary,
these fine particles are filtered out of the fluid bed and form a thin fine
additional cake. This phenomenon was not further investigated but Figure 3
shows a typical example of such a boundary.
Figure 3. Example of a filter-cake contour indicated by colored tracer particles.
2) The second method used a heat flux probe (PT-1000 element), which was
designed to discriminate between a bed in the fluidized or in the stagnant state.
Werther [21] made an extensive review of this kind of technique. The technique
is based on the temperature difference required to realize the rate of heat transfer
of the probe to its surroundings at a certain electrical power input. Two probes
of different dimensions were used, a probe with a cylindrical tip with a diameter
of 5 mm and length of 20 mm and a probe with a flat film as tip (5 mm x 2 mm
x 1.1 mm = length x width x thickness). The vast majority of the experiments
were carried with the cylindrical probe.
107
It is assumed that the electrical power put into the probe is transferred to the fluid bed.
PT PT bedE I=A (T -T ) (1)
The temperature of the probe is related to the current because the resistance of the PT-
1000 element, RPT, is well defined (see Equation 2). In our case the probe operated at
a constant direct current (DC) voltage of 20 V.
o oPT PT PT PT PT
E-1000IE=I R ,R =1000+3.85T T = (20 C T 80 C)3.85I
(2)
With TPT in Celsius. Combination of Equations 1 and 2 leads to an expression of the
heat transfer coefficient ( ).
2
PT bed
3.85E I=A E-I(1000+3.85T )
(3)
The equation above holds for the ideal case that only the probe’s resistance is
significant. If also other elements of the measuring system have a significant
resistance, the equation for becomes.
2
PT system bed
3.85E I=A E-I(1000+R +3.85T )
(4)
Equation 4 shows that by measurement of the current (I) the heat transfer coefficient
can be calculated, because APT, E, Rsystem, and Tbed can be determined separately. The
maximal (asymptotic) current of the electrical system, corresponding to infinitely fast
heat transfer, is:
asymbed system
EI =1000+3.85T +R
(5)
The current could be measured with a precision of 0.01 mA. Figure 4 shows the
curves of I versus for the cylindrical probe.
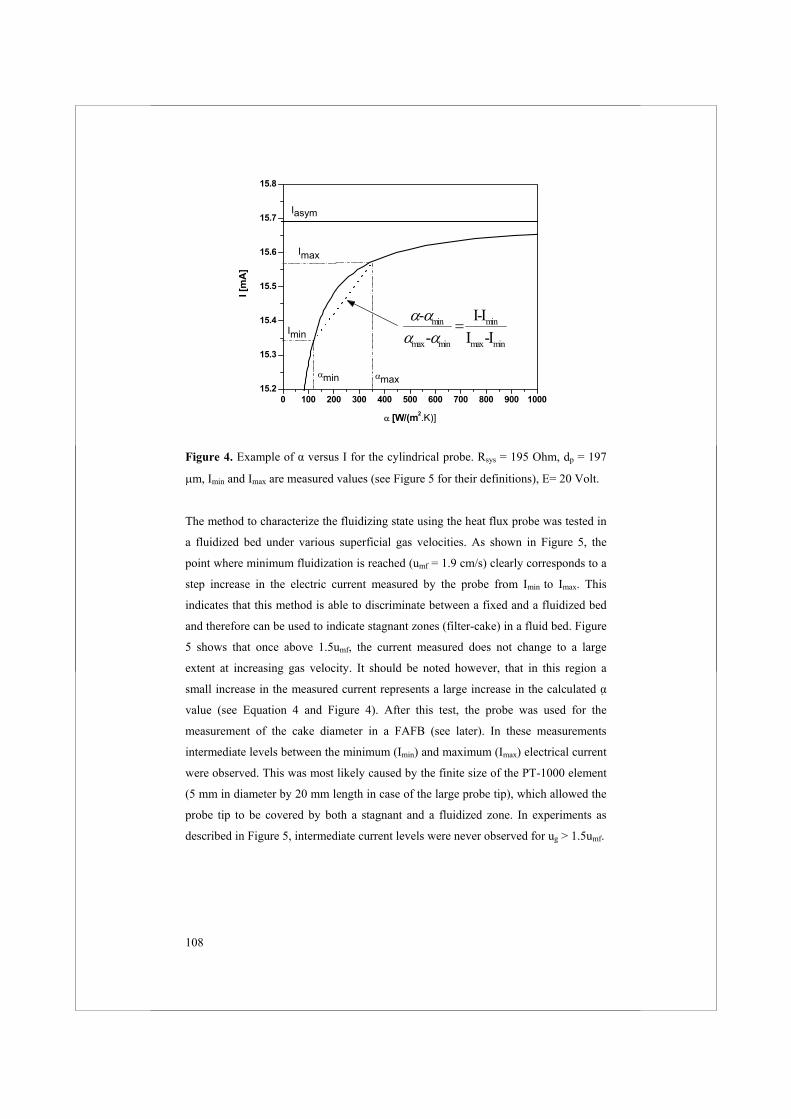
108
0 100 200 300 400 500 600 700 800 900 100015.2
15.3
15.4
15.5
15.6
15.7
15.8
maxmin
Imax
Iasym
Iminmin min
max min max min
- I-I- I -I
I [m
A]
[W/(m2.K)]
Figure 4. Example of versus I for the cylindrical probe. Rsys = 195 Ohm, dp = 197
m, Imin and Imax are measured values (see Figure 5 for their definitions), E= 20 Volt.
The method to characterize the fluidizing state using the heat flux probe was tested in
a fluidized bed under various superficial gas velocities. As shown in Figure 5, the
point where minimum fluidization is reached (umf = 1.9 cm/s) clearly corresponds to a
step increase in the electric current measured by the probe from Imin to Imax. This
indicates that this method is able to discriminate between a fixed and a fluidized bed
and therefore can be used to indicate stagnant zones (filter-cake) in a fluid bed. Figure
5 shows that once above 1.5umf, the current measured does not change to a large
extent at increasing gas velocity. It should be noted however, that in this region a
small increase in the measured current represents a large increase in the calculated
value (see Equation 4 and Figure 4). After this test, the probe was used for the
measurement of the cake diameter in a FAFB (see later). In these measurements
intermediate levels between the minimum (Imin) and maximum (Imax) electrical current
were observed. This was most likely caused by the finite size of the PT-1000 element
(5 mm in diameter by 20 mm length in case of the large probe tip), which allowed the
probe tip to be covered by both a stagnant and a fluidized zone. In experiments as
described in Figure 5, intermediate current levels were never observed for ug > 1.5umf.
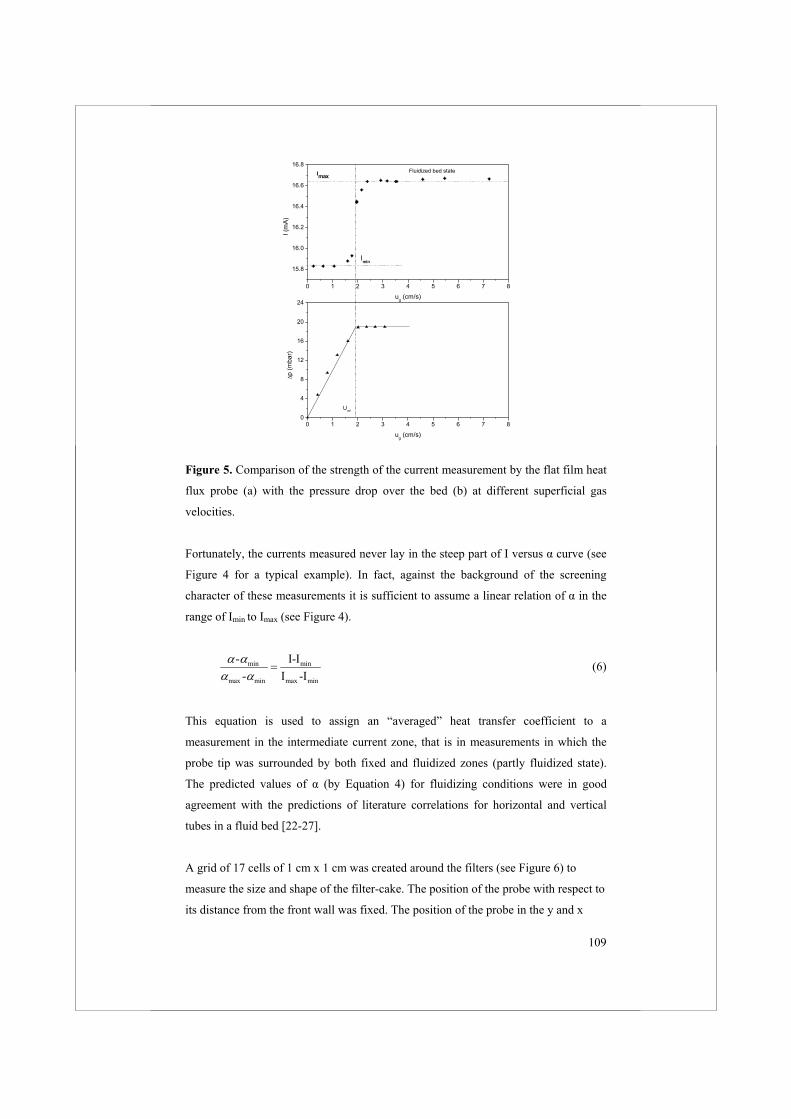
109
0 1 2 3 4 5 6 7 8
15.8
16.0
16.2
16.4
16.6
16.8
0 1 2 3 4 5 6 7 80
4
8
12
16
20
24
I (m
A)
ug (cm/s)
Fluidized bed stateImax
Imin
p (m
bar)
ug (cm/s)
Umf
Figure 5. Comparison of the strength of the current measurement by the flat film heat
flux probe (a) with the pressure drop over the bed (b) at different superficial gas
velocities.
Fortunately, the currents measured never lay in the steep part of I versus curve (see
Figure 4 for a typical example). In fact, against the background of the screening
character of these measurements it is sufficient to assume a linear relation of in the
range of Imin to Imax (see Figure 4).
min min
max min max min
- I-I- I -I
(6)
This equation is used to assign an “averaged” heat transfer coefficient to a
measurement in the intermediate current zone, that is in measurements in which the
probe tip was surrounded by both fixed and fluidized zones (partly fluidized state).
The predicted values of (by Equation 4) for fluidizing conditions were in good
agreement with the predictions of literature correlations for horizontal and vertical
tubes in a fluid bed [22-27].
A grid of 17 cells of 1 cm x 1 cm was created around the filters (see Figure 6) to
measure the size and shape of the filter-cake. The position of the probe with respect to
its distance from the front wall was fixed. The position of the probe in the y and x
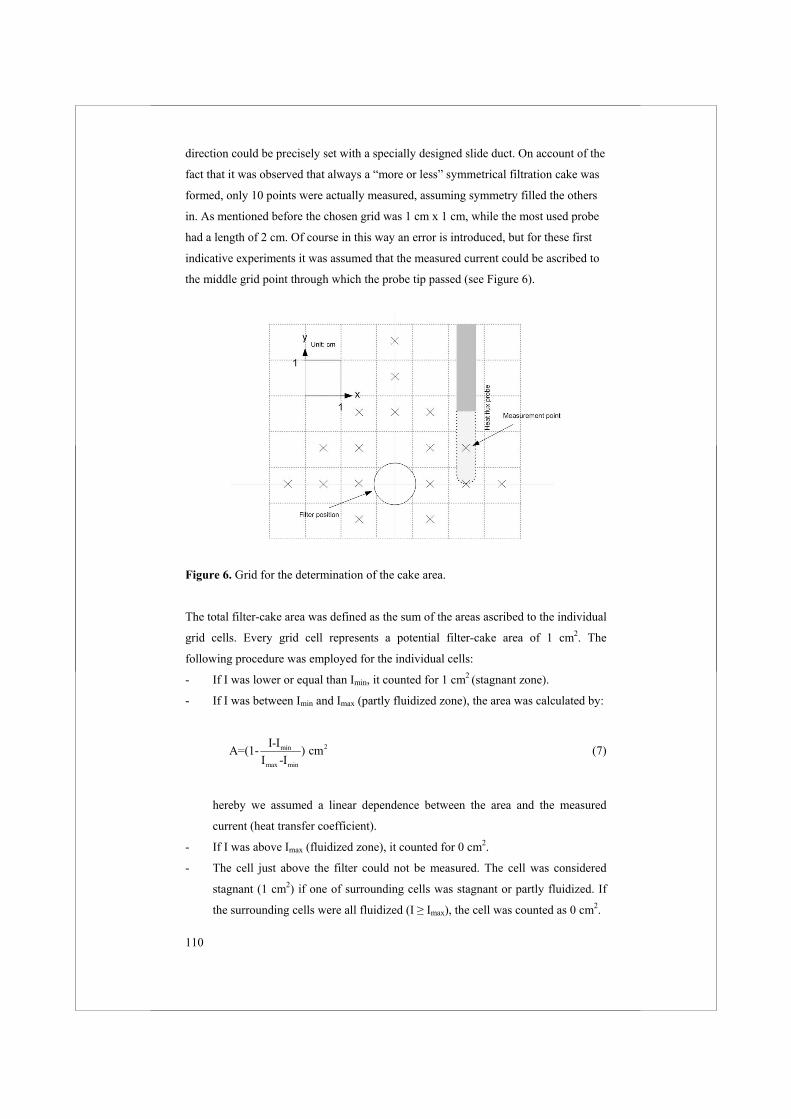
110
direction could be precisely set with a specially designed slide duct. On account of the
fact that it was observed that always a “more or less” symmetrical filtration cake was
formed, only 10 points were actually measured, assuming symmetry filled the others
in. As mentioned before the chosen grid was 1 cm x 1 cm, while the most used probe
had a length of 2 cm. Of course in this way an error is introduced, but for these first
indicative experiments it was assumed that the measured current could be ascribed to
the middle grid point through which the probe tip passed (see Figure 6).
Figure 6. Grid for the determination of the cake area.
The total filter-cake area was defined as the sum of the areas ascribed to the individual
grid cells. Every grid cell represents a potential filter-cake area of 1 cm2. The
following procedure was employed for the individual cells:
- If I was lower or equal than Imin, it counted for 1 cm2 (stagnant zone).
- If I was between Imin and Imax (partly fluidized zone), the area was calculated by:
2min
max min
I-IA=(1- ) cmI -I
(7)
hereby we assumed a linear dependence between the area and the measured
current (heat transfer coefficient).
- If I was above Imax (fluidized zone), it counted for 0 cm2.
- The cell just above the filter could not be measured. The cell was considered
stagnant (1 cm2) if one of surrounding cells was stagnant or partly fluidized. If
the surrounding cells were all fluidized (I Imax), the cell was counted as 0 cm2.
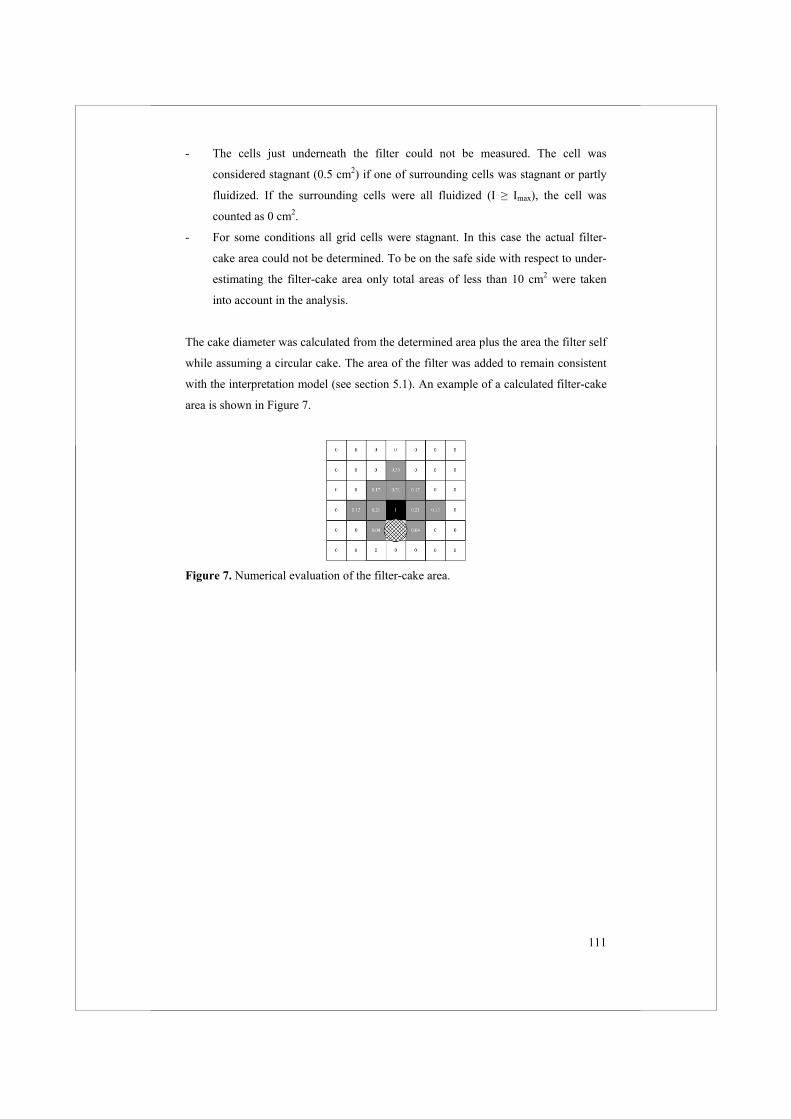
111
- The cells just underneath the filter could not be measured. The cell was
considered stagnant (0.5 cm2) if one of surrounding cells was stagnant or partly
fluidized. If the surrounding cells were all fluidized (I Imax), the cell was
counted as 0 cm2.
- For some conditions all grid cells were stagnant. In this case the actual filter-
cake area could not be determined. To be on the safe side with respect to under-
estimating the filter-cake area only total areas of less than 10 cm2 were taken
into account in the analysis.
The cake diameter was calculated from the determined area plus the area the filter self
while assuming a circular cake. The area of the filter was added to remain consistent
with the interpretation model (see section 5.1). An example of a calculated filter-cake
area is shown in Figure 7.
Figure 7. Numerical evaluation of the filter-cake area.
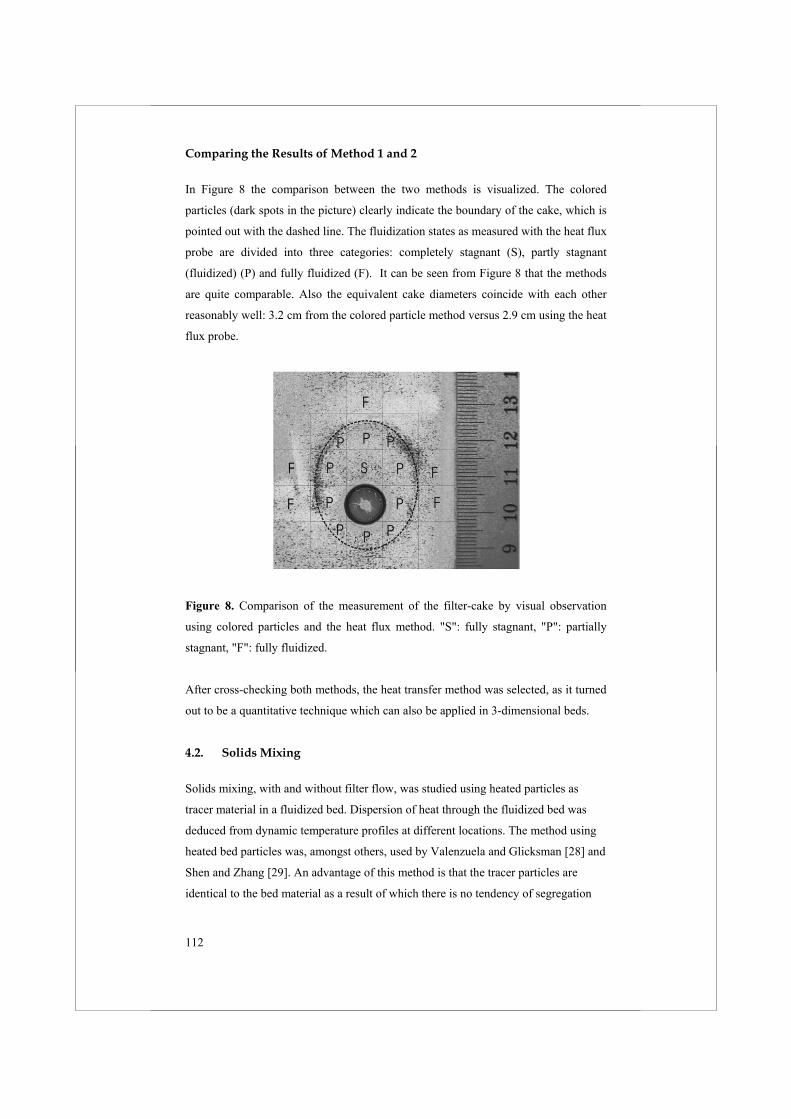
112
Comparing the Results of Method 1 and 2
In Figure 8 the comparison between the two methods is visualized. The colored
particles (dark spots in the picture) clearly indicate the boundary of the cake, which is
pointed out with the dashed line. The fluidization states as measured with the heat flux
probe are divided into three categories: completely stagnant (S), partly stagnant
(fluidized) (P) and fully fluidized (F). It can be seen from Figure 8 that the methods
are quite comparable. Also the equivalent cake diameters coincide with each other
reasonably well: 3.2 cm from the colored particle method versus 2.9 cm using the heat
flux probe.
Figure 8. Comparison of the measurement of the filter-cake by visual observation
using colored particles and the heat flux method. "S": fully stagnant, "P": partially
stagnant, "F": fully fluidized.
After cross-checking both methods, the heat transfer method was selected, as it turned
out to be a quantitative technique which can also be applied in 3-dimensional beds.
4.2. Solids Mixing
Solids mixing, with and without filter flow, was studied using heated particles as
tracer material in a fluidized bed. Dispersion of heat through the fluidized bed was
deduced from dynamic temperature profiles at different locations. The method using
heated bed particles was, amongst others, used by Valenzuela and Glicksman [28] and
Shen and Zhang [29]. An advantage of this method is that the tracer particles are
identical to the bed material as a result of which there is no tendency of segregation
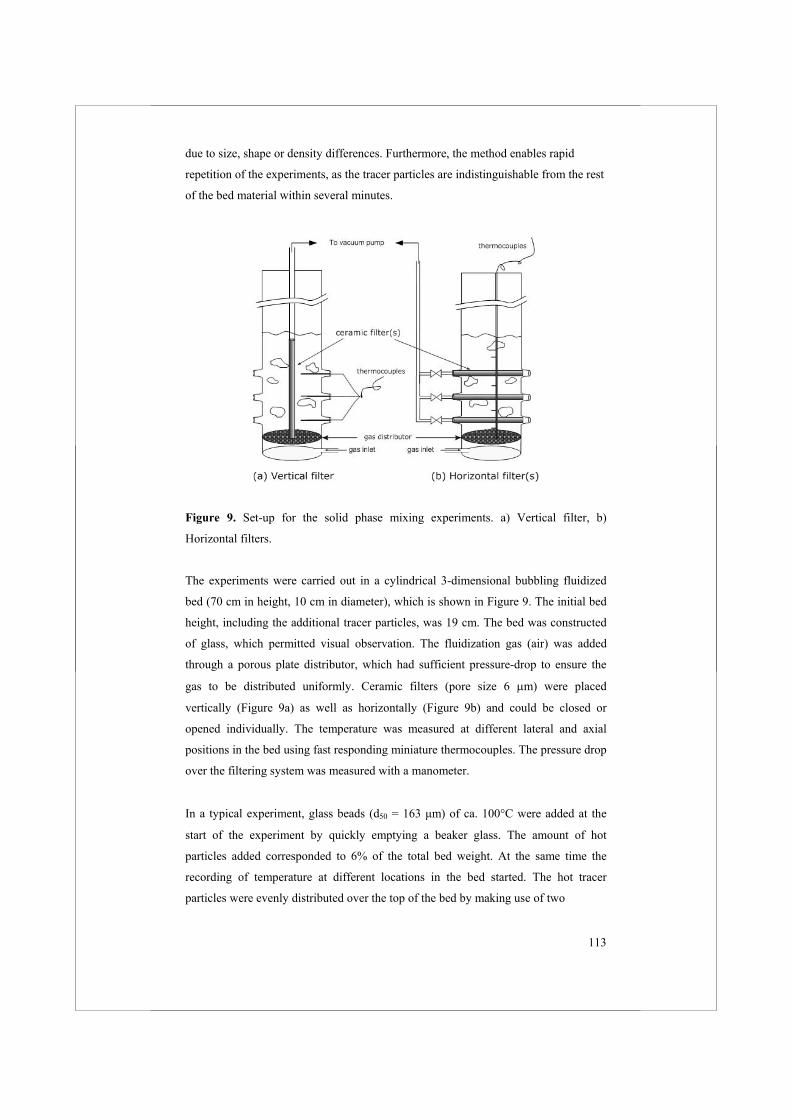
113
due to size, shape or density differences. Furthermore, the method enables rapid
repetition of the experiments, as the tracer particles are indistinguishable from the rest
of the bed material within several minutes.
Figure 9. Set-up for the solid phase mixing experiments. a) Vertical filter, b)
Horizontal filters.
The experiments were carried out in a cylindrical 3-dimensional bubbling fluidized
bed (70 cm in height, 10 cm in diameter), which is shown in Figure 9. The initial bed
height, including the additional tracer particles, was 19 cm. The bed was constructed
of glass, which permitted visual observation. The fluidization gas (air) was added
through a porous plate distributor, which had sufficient pressure-drop to ensure the
gas to be distributed uniformly. Ceramic filters (pore size 6 m) were placed
vertically (Figure 9a) as well as horizontally (Figure 9b) and could be closed or
opened individually. The temperature was measured at different lateral and axial
positions in the bed using fast responding miniature thermocouples. The pressure drop
over the filtering system was measured with a manometer.
In a typical experiment, glass beads (d50 = 163 µm) of ca. 100 C were added at the
start of the experiment by quickly emptying a beaker glass. The amount of hot
particles added corresponded to 6% of the total bed weight. At the same time the
recording of temperature at different locations in the bed started. The hot tracer
particles were evenly distributed over the top of the bed by making use of two
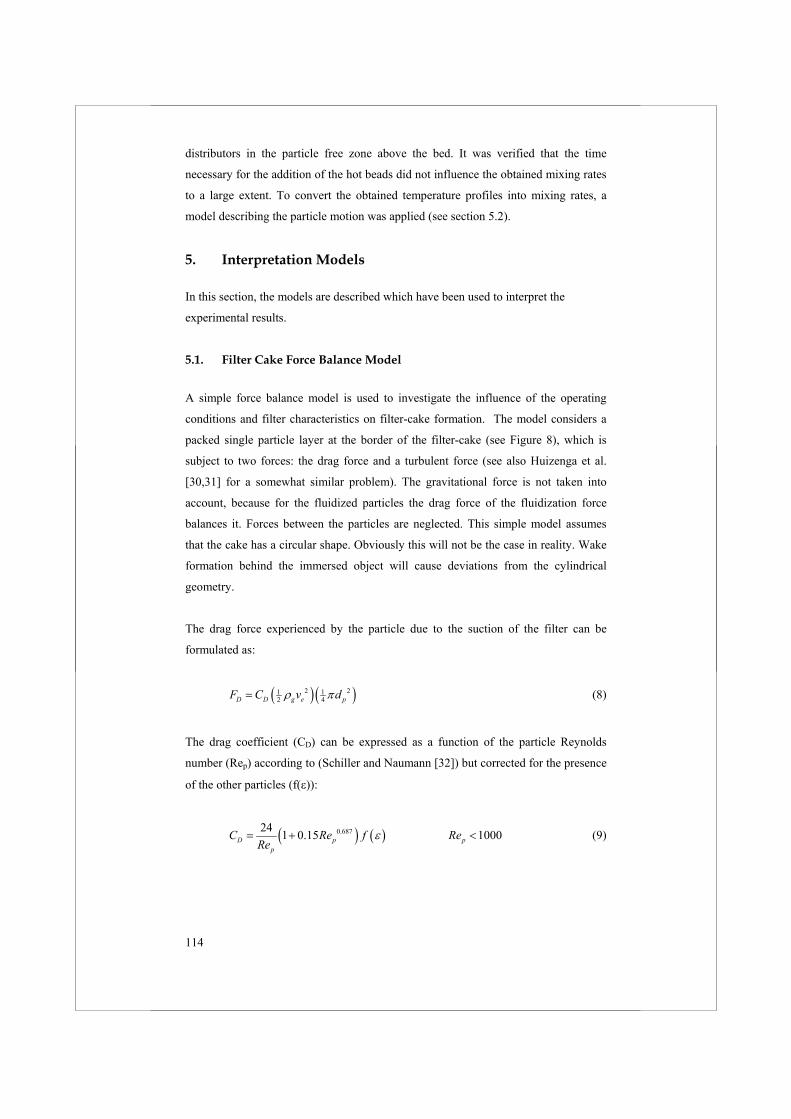
114
distributors in the particle free zone above the bed. It was verified that the time
necessary for the addition of the hot beads did not influence the obtained mixing rates
to a large extent. To convert the obtained temperature profiles into mixing rates, a
model describing the particle motion was applied (see section 5.2).
5. Interpretation Models
In this section, the models are described which have been used to interpret the
experimental results.
5.1. Filter Cake Force Balance Model
A simple force balance model is used to investigate the influence of the operating
conditions and filter characteristics on filter-cake formation. The model considers a
packed single particle layer at the border of the filter-cake (see Figure 8), which is
subject to two forces: the drag force and a turbulent force (see also Huizenga et al.
[30,31] for a somewhat similar problem). The gravitational force is not taken into
account, because for the fluidized particles the drag force of the fluidization force
balances it. Forces between the particles are neglected. This simple model assumes
that the cake has a circular shape. Obviously this will not be the case in reality. Wake
formation behind the immersed object will cause deviations from the cylindrical
geometry.
The drag force experienced by the particle due to the suction of the filter can be
formulated as:
2 21 12 4D D g e pF C v d (8)
The drag coefficient (CD) can be expressed as a function of the particle Reynolds
number (Rep) according to (Schiller and Naumann [32]) but corrected for the presence
of the other particles (f( )):
0.68724 1 0.15D pp
C Re fRe
1000pRe (9)
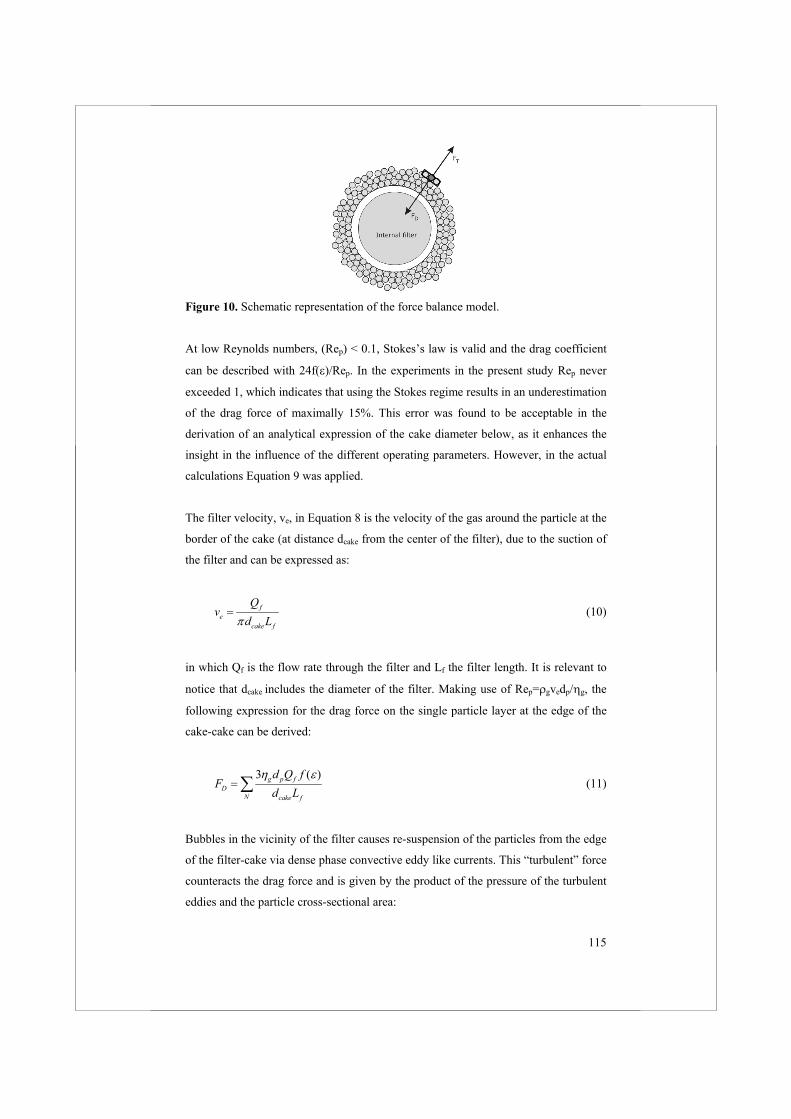
115
Figure 10. Schematic representation of the force balance model.
At low Reynolds numbers, (Rep) < 0.1, Stokes’s law is valid and the drag coefficient
can be described with 24f( )/Rep. In the experiments in the present study Rep never
exceeded 1, which indicates that using the Stokes regime results in an underestimation
of the drag force of maximally 15%. This error was found to be acceptable in the
derivation of an analytical expression of the cake diameter below, as it enhances the
insight in the influence of the different operating parameters. However, in the actual
calculations Equation 9 was applied.
The filter velocity, ve, in Equation 8 is the velocity of the gas around the particle at the
border of the cake (at distance dcake from the center of the filter), due to the suction of
the filter and can be expressed as:
fe
cake f
Qv
d L (10)
in which Qf is the flow rate through the filter and Lf the filter length. It is relevant to
notice that dcake includes the diameter of the filter. Making use of Rep= gvedp/ g, the
following expression for the drag force on the single particle layer at the edge of the
cake-cake can be derived:
3 ( )g p fD
N cake f
d Q fF
d L (11)
Bubbles in the vicinity of the filter causes re-suspension of the particles from the edge
of the filter-cake via dense phase convective eddy like currents. This “turbulent” force
counteracts the drag force and is given by the product of the pressure of the turbulent
eddies and the particle cross-sectional area:
116
2 214 ( ')T p fb
NF d u (12)
The pressure of the turbulence force is estimated with the density of the fluid bed.
The eddy fluctuation velocity, u’, is given for a pure fluid by Davies [33]:
13'u (13)
The energy dissipation rate, , is equal to the product of the gas flow rate and the
pressure drop over the fluid bed per unit of mass and equals: ug. Dense phase
movements only occur at velocities higher than the minimum fluidization and
therefore we will describe the energy dissipation rate, since no better knowledge is
currently available, as:
g mfu u g (14)
Equating the drag force and the turbulence force at the border of the filter cake yields
the following expression for the cake diameter:
23
12 ( )
( )g f
cake
fb p f g mf
Q fd
d L u u g (15)
The choice of the length scale of the eddies ( ) is by no means trivial. It is difficult to
estimate the length scale of the eddies responsible for the turbulent force. For liquid
slurries, Huizinga et al. [31] proposed to use the Kolmogorov length scale or the
particle size. In a fluidized bed also a direct proportionality to the bubble diameter,
which is the main cause of the eddies, is a possibility. The bubble size is described by
the correlation of Werther [34] for Geldart B solids:
13 1.210.00853 1 27.2( ) 1 6.84b g mfd u u h (16)
In this way the equation for the cake diameter becomes:
23
12
( ) ( )g f
cake
fb p f g mf b b
Qd
d L u u g C d (17)
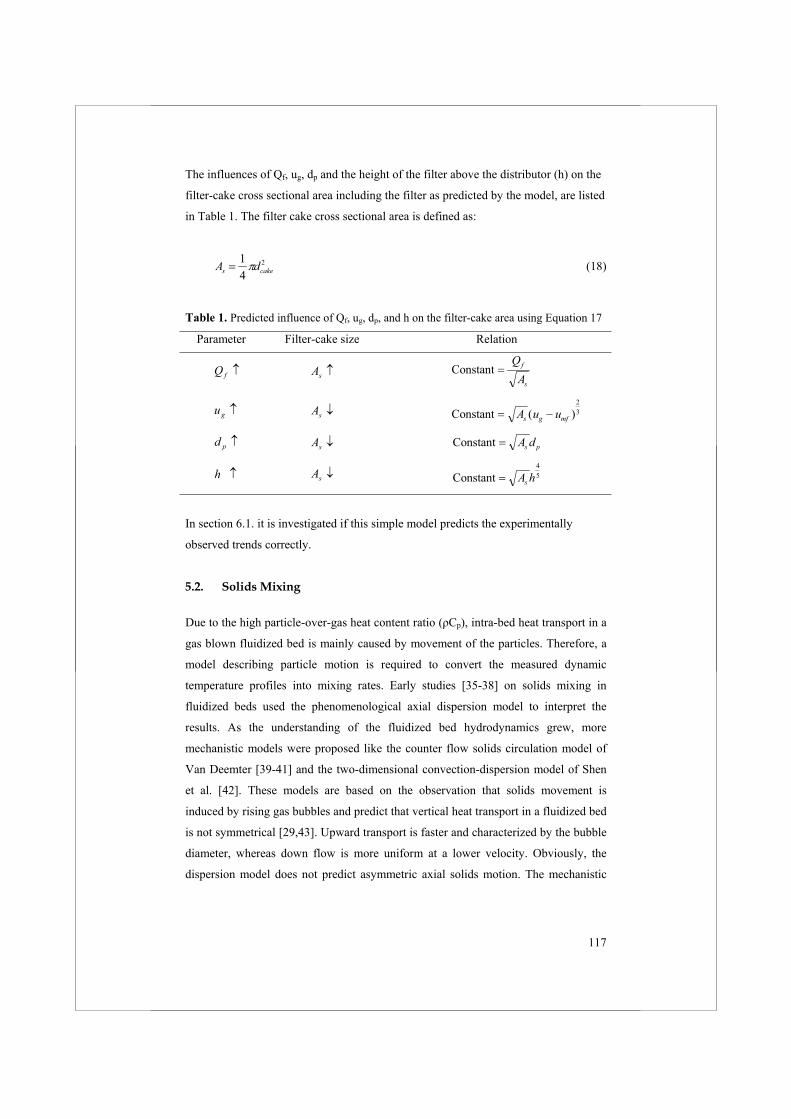
117
The influences of Qf, ug, dp and the height of the filter above the distributor (h) on the
filter-cake cross sectional area including the filter as predicted by the model, are listed
in Table 1. The filter cake cross sectional area is defined as:
A ds cake14
2 (18)
Table 1. Predicted influence of Qf, ug, dp, and h on the filter-cake area using Equation 17
Parameter Filter-cake size Relation
fQ sA ConstantQ
Af
s
gu sA Constant A u us g mf( )23
pd sA Constant A ds p
h sA Constant A hs
45
In section 6.1. it is investigated if this simple model predicts the experimentally
observed trends correctly.
5.2. Solids Mixing
Due to the high particle-over-gas heat content ratio ( Cp), intra-bed heat transport in a
gas blown fluidized bed is mainly caused by movement of the particles. Therefore, a
model describing particle motion is required to convert the measured dynamic
temperature profiles into mixing rates. Early studies [35-38] on solids mixing in
fluidized beds used the phenomenological axial dispersion model to interpret the
results. As the understanding of the fluidized bed hydrodynamics grew, more
mechanistic models were proposed like the counter flow solids circulation model of
Van Deemter [39-41] and the two-dimensional convection-dispersion model of Shen
et al. [42]. These models are based on the observation that solids movement is
induced by rising gas bubbles and predict that vertical heat transport in a fluidized bed
is not symmetrical [29,43]. Upward transport is faster and characterized by the bubble
diameter, whereas down flow is more uniform at a lower velocity. Obviously, the
dispersion model does not predict asymmetric axial solids motion. The mechanistic
118
models, however, contain parameters that are difficult to asses by direct and
independent measurements. In Van Deemter’s model [40], for instance, there are the
velocities and the fractions of the artificial upward and downward phases and the
exchange coefficient between them. Kunii et al. [44-46] proposed to use Davidson’s
bubble model for the exchange coefficient. The convection-dispersion model of Shen
at al. [42] has 7 parameters of which they fixed 6 by correlations derived to describe
the hydrodynamics of regular fluid beds (e.g. Darton et al. [47] for the bubble
diameter and Shi and Fan [48] for the radial dispersion coefficient), yielding, like the
axial dispersion model, a one-parameter fit equation. Such a model cannot be used for
the FAFB, because it has been observed that the fluidization pattern with gas
extraction via immersed filters differs significantly from the one of the same bed
without filter flow under otherwise identical conditions (see section 6.2).
The axial dispersion model is used here to quantify the difference between solids
mixing in a FB with and without extraction of gas via filters. It is recognized that the
axial dispersion model is not really suitable to characterize solids motion in a FB with
a small aspect ratio, it does, however, provide a direct comparison of the solids
mixing rate irrespective of the actual behavior of the bed. In this way the mixing
intensity of the bed with and without filter flow can be compared. Because in the
experimental method applied actually back mixing is measured, the obtained Ds
values should be interpreted as conservative estimates of the mixing power.
Because of the high specific area and heat transfer coefficient, the solids and gas
temperature are equal at all locations in the bed. The resulting combined energy
balance is then of the form:
2
, , , , ,2
4( )( ) ( ) w
g wc
s s p s g g p g s s s p s g g g p g g p gu T Td
dT d T dTC C D C D C Cdt dz dz
(19)
The solids motion is described by the dispersive term (1st term RHS). This term
describes the redistribution of the added hot particle layer over the rest of the bed. The
bed is cooled by the cold inflowing gas (2nd term RHS) and heat through the reactor
wall (3rd term RHS). At the start of the experiment (t = 0) the bed is at its initial
temperature, which is measured using thermocouples. The following boundary
conditions [49] apply:
at z = 0: , ( )g g in g s s g gdTu T u T D Ddz
(20)
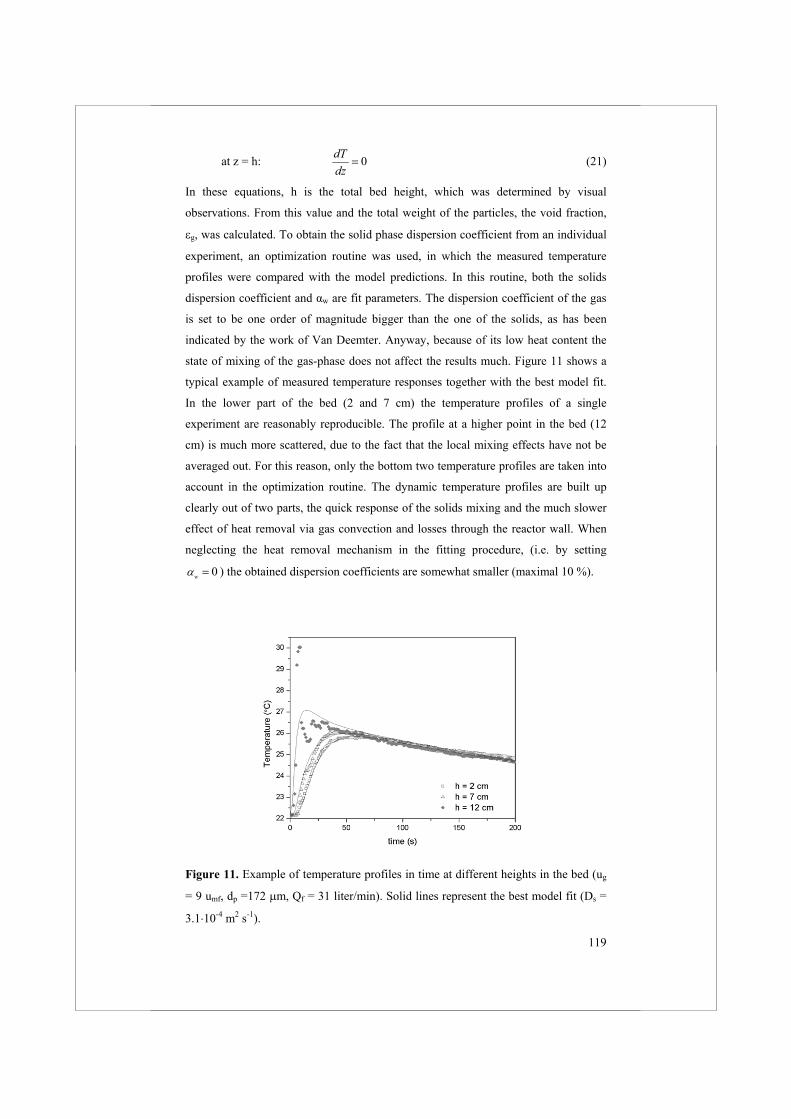
119
at z = h: 0dTdz
(21)
In these equations, h is the total bed height, which was determined by visual
observations. From this value and the total weight of the particles, the void fraction,
g, was calculated. To obtain the solid phase dispersion coefficient from an individual
experiment, an optimization routine was used, in which the measured temperature
profiles were compared with the model predictions. In this routine, both the solids
dispersion coefficient and w are fit parameters. The dispersion coefficient of the gas
is set to be one order of magnitude bigger than the one of the solids, as has been
indicated by the work of Van Deemter. Anyway, because of its low heat content the
state of mixing of the gas-phase does not affect the results much. Figure 11 shows a
typical example of measured temperature responses together with the best model fit.
In the lower part of the bed (2 and 7 cm) the temperature profiles of a single
experiment are reasonably reproducible. The profile at a higher point in the bed (12
cm) is much more scattered, due to the fact that the local mixing effects have not be
averaged out. For this reason, only the bottom two temperature profiles are taken into
account in the optimization routine. The dynamic temperature profiles are built up
clearly out of two parts, the quick response of the solids mixing and the much slower
effect of heat removal via gas convection and losses through the reactor wall. When
neglecting the heat removal mechanism in the fitting procedure, (i.e. by setting
0w ) the obtained dispersion coefficients are somewhat smaller (maximal 10 %).
Figure 11. Example of temperature profiles in time at different heights in the bed (ug
= 9 umf, dp =172 m, Qf = 31 liter/min). Solid lines represent the best model fit (Ds =
3.1 10-4 m2 s-1).
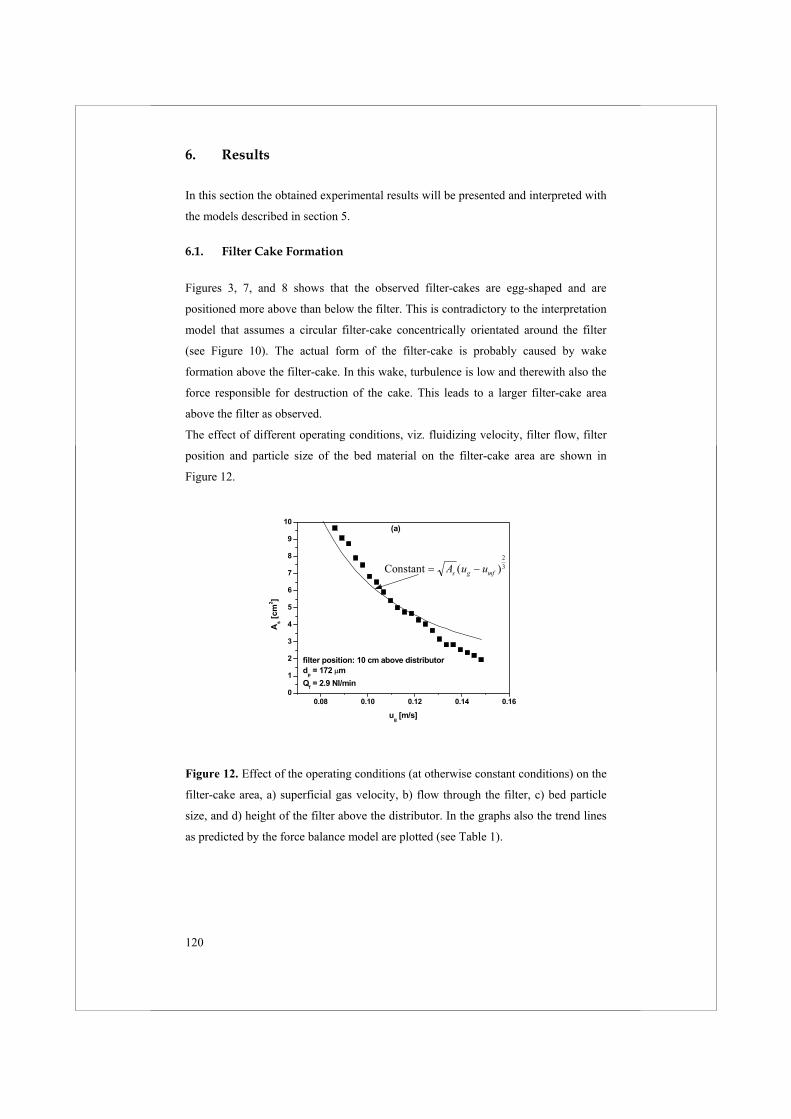
120
6. Results
In this section the obtained experimental results will be presented and interpreted with
the models described in section 5.
6.1. Filter Cake Formation
Figures 3, 7, and 8 shows that the observed filter-cakes are egg-shaped and are
positioned more above than below the filter. This is contradictory to the interpretation
model that assumes a circular filter-cake concentrically orientated around the filter
(see Figure 10). The actual form of the filter-cake is probably caused by wake
formation above the filter-cake. In this wake, turbulence is low and therewith also the
force responsible for destruction of the cake. This leads to a larger filter-cake area
above the filter as observed.
The effect of different operating conditions, viz. fluidizing velocity, filter flow, filter
position and particle size of the bed material on the filter-cake area are shown in
Figure 12.
0.08 0.10 0.12 0.14 0.160
1
2
3
4
5
6
7
8
9
10
Constant A u us g mf( )23
As [c
m2 ]
ug [m/s]
filter position: 10 cm above distributordp = 172 mQf = 2.9 Nl/min
(a)
Figure 12. Effect of the operating conditions (at otherwise constant conditions) on the
filter-cake area, a) superficial gas velocity, b) flow through the filter, c) bed particle
size, and d) height of the filter above the distributor. In the graphs also the trend lines
as predicted by the force balance model are plotted (see Table 1).
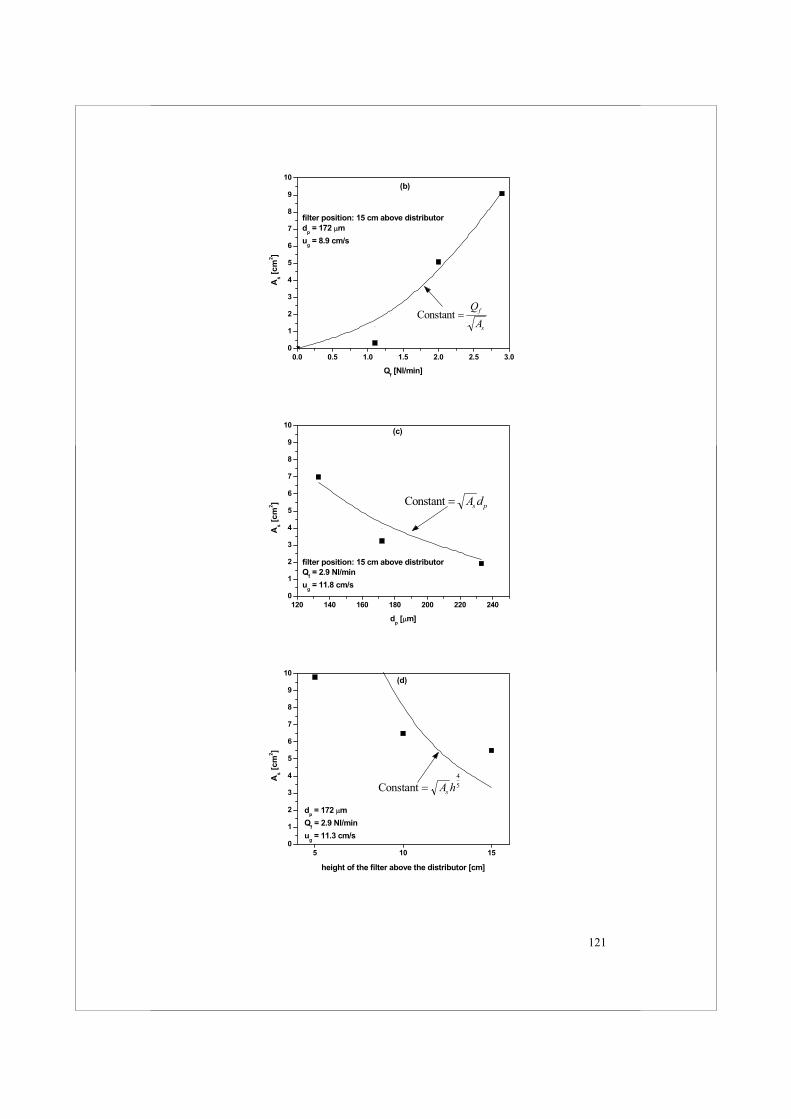
121
0.0 0.5 1.0 1.5 2.0 2.5 3.00
1
2
3
4
5
6
7
8
9
10
ConstantQAf
s
As [c
m2 ]
Qf [Nl/min]
(b)
filter position: 15 cm above distributordp = 172 mug = 8.9 cm/s
120 140 160 180 200 220 2400
1
2
3
4
5
6
7
8
9
10
Constant A ds p
filter position: 15 cm above distributorQf = 2.9 Nl/minug = 11.8 cm/s
As [c
m2 ]
dp [ m]
(c)
5 10 150
1
2
3
4
5
6
7
8
9
10
Constant A hs
45
dp = 172 mQf = 2.9 Nl/minug = 11.3 cm/s
As [c
m2 ]
height of the filter above the distributor [cm]
(d)
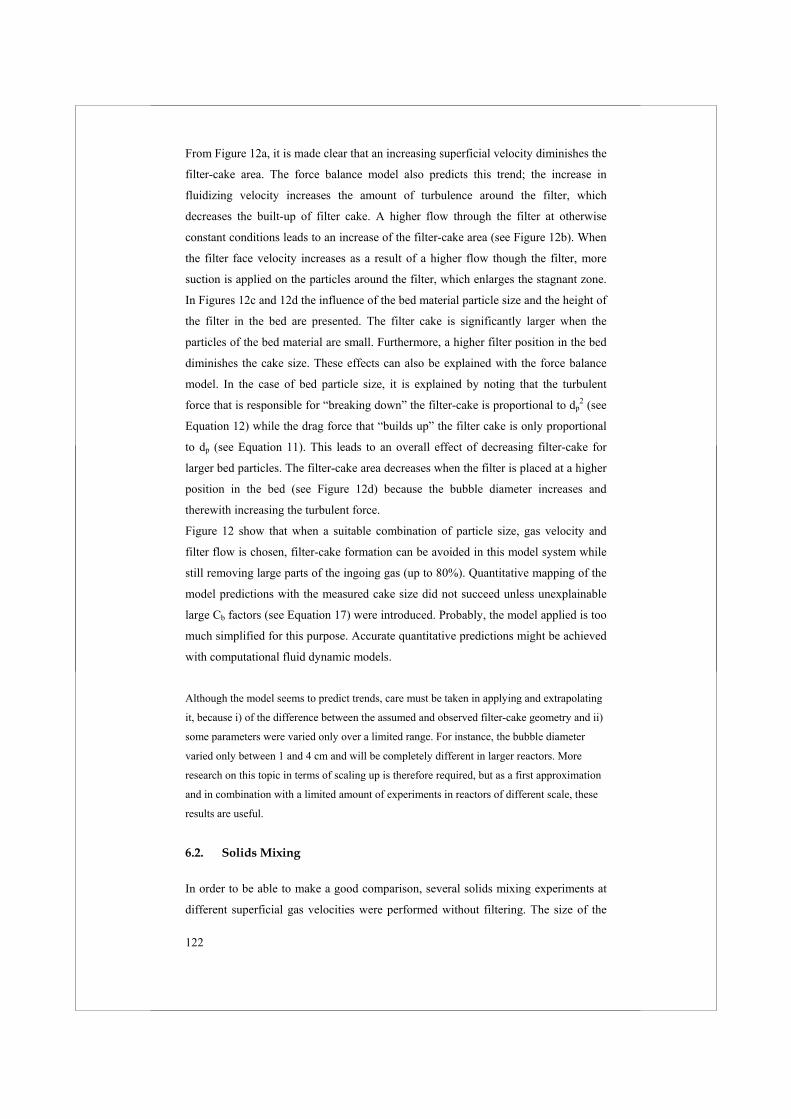
122
From Figure 12a, it is made clear that an increasing superficial velocity diminishes the
filter-cake area. The force balance model also predicts this trend; the increase in
fluidizing velocity increases the amount of turbulence around the filter, which
decreases the built-up of filter cake. A higher flow through the filter at otherwise
constant conditions leads to an increase of the filter-cake area (see Figure 12b). When
the filter face velocity increases as a result of a higher flow though the filter, more
suction is applied on the particles around the filter, which enlarges the stagnant zone.
In Figures 12c and 12d the influence of the bed material particle size and the height of
the filter in the bed are presented. The filter cake is significantly larger when the
particles of the bed material are small. Furthermore, a higher filter position in the bed
diminishes the cake size. These effects can also be explained with the force balance
model. In the case of bed particle size, it is explained by noting that the turbulent
force that is responsible for “breaking down” the filter-cake is proportional to dp2 (see
Equation 12) while the drag force that “builds up” the filter cake is only proportional
to dp (see Equation 11). This leads to an overall effect of decreasing filter-cake for
larger bed particles. The filter-cake area decreases when the filter is placed at a higher
position in the bed (see Figure 12d) because the bubble diameter increases and
therewith increasing the turbulent force.
Figure 12 show that when a suitable combination of particle size, gas velocity and
filter flow is chosen, filter-cake formation can be avoided in this model system while
still removing large parts of the ingoing gas (up to 80%). Quantitative mapping of the
model predictions with the measured cake size did not succeed unless unexplainable
large Cb factors (see Equation 17) were introduced. Probably, the model applied is too
much simplified for this purpose. Accurate quantitative predictions might be achieved
with computational fluid dynamic models.
Although the model seems to predict trends, care must be taken in applying and extrapolating
it, because i) of the difference between the assumed and observed filter-cake geometry and ii)
some parameters were varied only over a limited range. For instance, the bubble diameter
varied only between 1 and 4 cm and will be completely different in larger reactors. More
research on this topic in terms of scaling up is therefore required, but as a first approximation
and in combination with a limited amount of experiments in reactors of different scale, these
results are useful.
6.2. Solids Mixing
In order to be able to make a good comparison, several solids mixing experiments at
different superficial gas velocities were performed without filtering. The size of the
123
used glass beads was 163 m in all the experiments. The results are presented in
Figure 13 and 14. It has been verified that the presence of the filter itself (without
extracting gas) does not affect the solids dispersion coefficient. Furthermore, it has
turned out that the radial position of the thermocouples does not influence the
measured Ds, as long as their position is not inside the filter cake. The measured solid
dispersion coefficient is therefore representative for the solid particles that are moving,
which means that knowledge of both the filter-cake size and the dispersion coefficient
is required in order to describe the complete system.
The solid dispersion coefficients can be well described using a correlation of the form:
Ds = Constant (ug-umf), which was also suggested by Lee and Kim [51]. The constant
was in their work a function of bed material particle diameter, gas phase density and
viscosity and column diameter, which were not varied in the present study. The results
are quantitatively in good agreement with the data of Lewis et al. [52] who used a
steady state heat transfer method and a similar size of glass beads (155 m).
Visual observations have shown that the extraction of part of the fluidization gas by
in-situ filtering changed the bubbling behavior of the bed to a large extent. Already at
a low filter flow, much more large bubbles are observed at the reactor wall. At higher
amounts of extracted gas, the regime changes from bubbly flow into slug flow. This is
most likely caused by the presence of stagnant zones in the center of the vessel, which
result in a larger part of the gas to flow up in the vicinity of the wall and thereby
creating larger bubbles.
Figure 13. Solid phase axial dispersion coefficient as a function of the superficial gas
velocity with and without filtering (vertical filter).
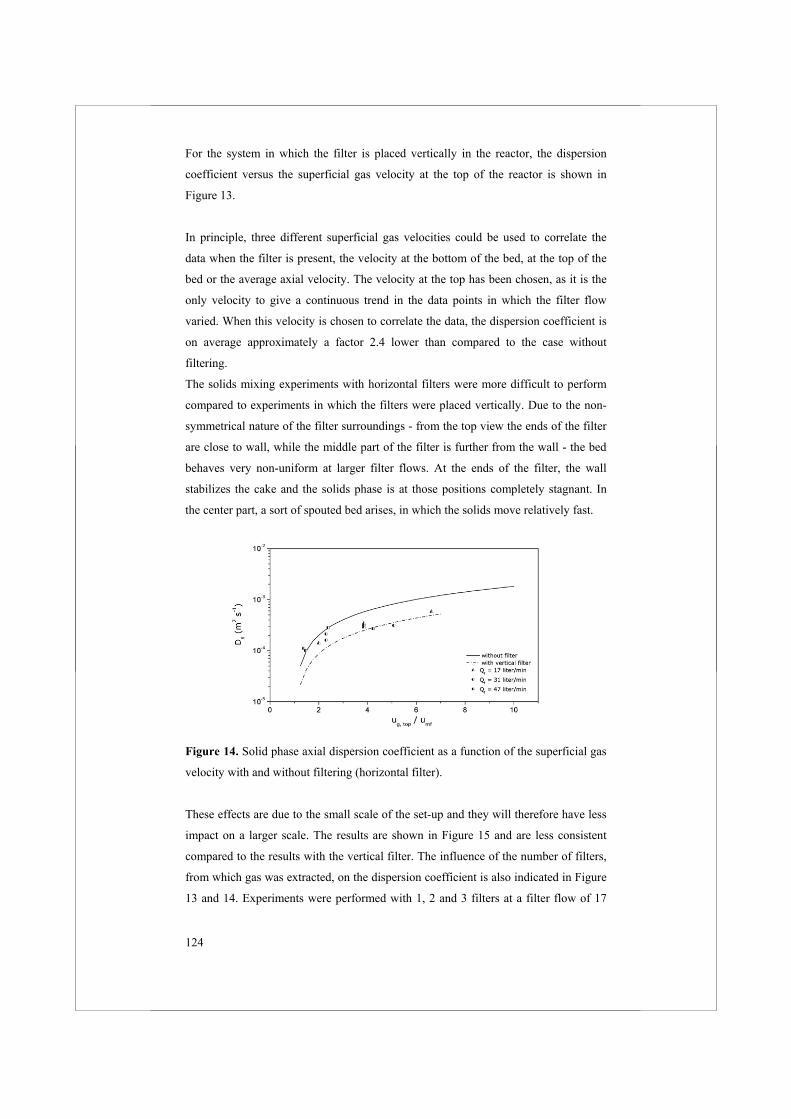
124
For the system in which the filter is placed vertically in the reactor, the dispersion
coefficient versus the superficial gas velocity at the top of the reactor is shown in
Figure 13.
In principle, three different superficial gas velocities could be used to correlate the
data when the filter is present, the velocity at the bottom of the bed, at the top of the
bed or the average axial velocity. The velocity at the top has been chosen, as it is the
only velocity to give a continuous trend in the data points in which the filter flow
varied. When this velocity is chosen to correlate the data, the dispersion coefficient is
on average approximately a factor 2.4 lower than compared to the case without
filtering.
The solids mixing experiments with horizontal filters were more difficult to perform
compared to experiments in which the filters were placed vertically. Due to the non-
symmetrical nature of the filter surroundings - from the top view the ends of the filter
are close to wall, while the middle part of the filter is further from the wall - the bed
behaves very non-uniform at larger filter flows. At the ends of the filter, the wall
stabilizes the cake and the solids phase is at those positions completely stagnant. In
the center part, a sort of spouted bed arises, in which the solids move relatively fast.
Figure 14. Solid phase axial dispersion coefficient as a function of the superficial gas
velocity with and without filtering (horizontal filter).
These effects are due to the small scale of the set-up and they will therefore have less
impact on a larger scale. The results are shown in Figure 15 and are less consistent
compared to the results with the vertical filter. The influence of the number of filters,
from which gas was extracted, on the dispersion coefficient is also indicated in Figure
13 and 14. Experiments were performed with 1, 2 and 3 filters at a filter flow of 17
125
liter/min and ug,top/umf = 3.8. Although the fluidized beds were very different in nature
for these cases, a large variation and a trend in Ds was not found.
7. Conclusions
The hydrodynamics of a fluid bed, in which part of the ingoing gas flow is extracted
via immersed filters, have been investigated. This system serves as a model-system
for a fluid bed pyrolysis reactor with immersed filters for extracting and cleaning of
the produced vapors. It must be noted, however, that the model-system is operated
with clean gases while in a real pyrolysis reactor fine char particles and aerosols are
presented, which may cause problems other then the ones discussed here. In this
chapter, it has been investigated under which conditions a stagnant layer of bed-
particles is formed around a filter (a so-called filter-cake), and how extraction of gas
via filters influences intra-bed heat transport. The results can be summarized as
follows:
- For horizontal filters the filter-cake is located primarily on top of the filter and is
egg-shaped.
- An increase in flow through the filter (Qf) increases the filter-cake cross
sectional area (As). An increase in the superficial fluidizing velocity (ug), the
particle diameter (dp) and the height of the filter in the bed (h) decreases the
filter-cake cross sectional area. These trends are also predicted by simple force
balance model including a drag force and a turbulent force.
- By selecting a suitable filter and combination of particle size, gas velocity and
filter-flow, filter-cake formation can be avoided altogether in this model system
while still removing large parts of the ingoing gas (up to 80%). The superficial
gas velocity is the most important parameter; at ug>7umf filter-cake formation
was never observed (ug is local velocity).
- If the velocity at the top of the fluid bed is used to correlate the data, heat
transport in the tested fluid beds shows the same dependency on the superficial
gas velocity, with or without extraction of gases through the filters. At equal top
velocity the heat dispersion coefficient with flow through the filter is ca. 2.5
times lower than without.
- Horizontal, vertical and a stack of filters have been tested. No effect on the heat
dispersion coefficient has been found at otherwise identical conditions, although
the fluidization behavior changed significantly.
126
Acknowledgement
The authors are grateful for the financial support from the European Commission and
the Scientific Research Organization of The Netherlands (NWO). We would also like
to thank Nina Woicke of the University of Stuttgart for performing part of the
experimental work.
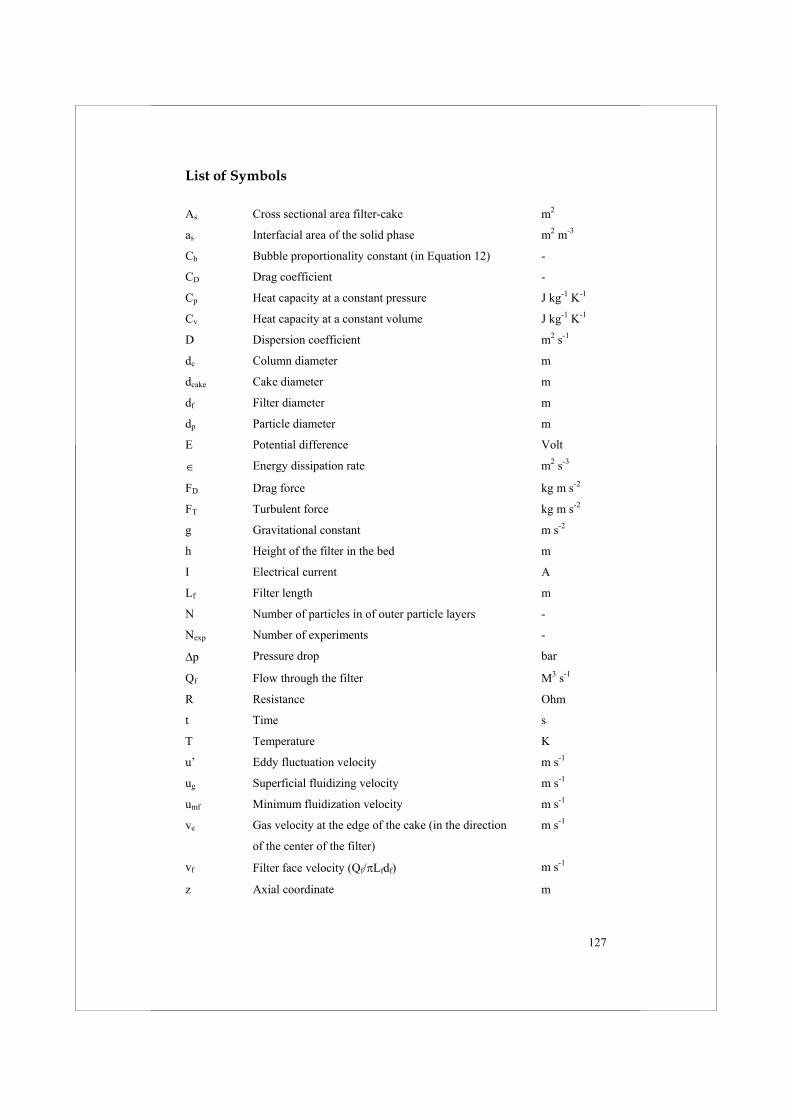
127
List of Symbols
As Cross sectional area filter-cake m2
as Interfacial area of the solid phase m2 m-3
Cb Bubble proportionality constant (in Equation 12) -
CD Drag coefficient -
Cp Heat capacity at a constant pressure J kg-1 K-1
Cv Heat capacity at a constant volume J kg-1 K-1
D Dispersion coefficient m2 s-1
dc Column diameter m
dcake Cake diameter m
df Filter diameter m
dp Particle diameter m
E Potential difference Volt
Energy dissipation rate m2 s-3
FD Drag force kg m s-2
FT Turbulent force kg m s-2
g Gravitational constant m s-2
h Height of the filter in the bed m
I Electrical current A
Lf Filter length m
N Number of particles in of outer particle layers -
Nexp Number of experiments -
p Pressure drop bar
Qf Flow through the filter M3 s-1
R Resistance Ohm
t Time s
T Temperature K
u’ Eddy fluctuation velocity m s-1
ug Superficial fluidizing velocity m s-1
umf Minimum fluidization velocity m s-1
ve Gas velocity at the edge of the cake (in the direction
of the center of the filter)
m s-1
vf Filter face velocity (Qf/ Lfdf) m s-1
z Axial coordinate m
128
Greek
Heat transfer coefficient W m-2 K-1
Fraction -
g Gas phase viscosity Pa s
Length scale of the turbulent eddies m
Density kg m-3
g Gas phase density kg m-3
Dimensionless numbers
Rep Particle based Reynolds number ( gdpv/ g) -
Subscripts
B Bubble
Fb Fluid bed
G Gas
In Inlet
Min Minimal: stagnant zone
Max Maximal: fluidization zone
PT PT-1000
S Solid
Top Top of the bed
W Wall of the fluidized bed
References
1. Oasmaa, A., Leppamaki, E.A., Kopolen, P., Levander, J., Tapola, E., Physical
characterisation of biomass-based pyrolysis liquids: Application of standard
fuel oil analyses; VTT, Technical Research Center of Finland, Espoo, Finland,
1997, pp. 87.
2. Fengel, D., Wegener, G., Wood - Chemistry, Ultra structure, Reactions;
Verlag Kessel, Germany, 2003.
129
3. Bridgwater, A.V., Bridge, S.A., A review of biomass pyrolysis and pyrolysis
technologies; In Biomass pyrolysis liquids upgrading and utilisation, Elsevier
Science Publishing Co., New York, 1991, pp. 11-92.
4. Bridgwater, A.V., Peacocke, G.V.C., Fast pyrolysis processes for biomass;
Renewable and Sustainable Energy Reviews, 2000, 4, pp. 1-73.
5. Bridgwater, A.V., Czernik, S., Diebold, J., Meier, D., Oasmaa, A., Peacocke,
C., Piskorz, J., Radlein, D., Eds., Fast pyrolysis of biomass, A handbook, CPL
Press, 1999.
6. Agblevor, F.A., Besler, S., Evans, R.J., Inorganic compounds in biomass
feedstocks: their role in char formation and effect on the quality of fast
pyrolysis oils; In Proceedings of biomass pyrolysis oil properties and
combustion meeting, National Renewable Energy Laboratory, Estes Park, CO,
USA, 1994.
7. Peacocke, G.V.C., Ablative pyrolysis of biomass; Ph.D. Thesis, Aston
University, Birmingham, UK, 1994.
8. Scholze, B., Long-term stability, catalytic upgrading, and application of
pyrolysis oils-improving the properties of a potential substitute of fossil fuels;
Ph.D. Thesis, University of Hamburg, Hamburg, Germany, 2002.
9. Diebold, J.P., A review of the chemical and physical mechanisms of the
storage stability of fast pyrolysis bio-oils; National Renewable Energy
Laboratory (NREL): Golden, CO, USA, 2004, pp. 59.
10. Wagenaar, B.M., Venderbosch, R.H., Prins, W., Penninks, F.W.M., Bio-oil as
coal substitute in 600 MWe power stations; In Twelfth European Biomass
Conference: Biomass for Energy, Industry and Climate Protection, Amsterdam,
The Netherlands, ETA-Florence and WIP-Munich, 2002.
11. Venderbosch, R.H., van de Beld, L., Prins, W., Entrained flow gasification of
bio-oil for synthesis gas; In Twelfth European Biomass Conference: Biomass
for Energy, Industry and Climate Protection, Amsterdam, The Netherlands,
ETA-Florence and WIP-Munich, 2002.
130
12. Van Swaaij, W.P.M., Kersten, S.R.A., van den Aarsen, F.G., Routes for
methanol from biomass; In International 2-Day Business Conference on
Sustainable Industrial Developments, Delfzijl, The Netherlands, 2004.
13. Wang, X., Kersten, S.R.A., Prins, W., van Swaaij, W.P.M., Biomass-syngas
from fast pyrolysis vapors or liquids; In Twelfth European Biomass
Conference: Biomass for Energy, Industry and Climate Protection, Amsterdam,
The Netherlands, ETA-Florence and WIP-Munich, 2002.
14. Clift, R., Seville, J.P.K., Eds., Gas cleaning at high temperatures; Blackie
Academic & Professional: London, UK, 1993.
15. Thambimuthu, K.V., Gas cleaning for advanced coal-based power generation;
IEACR/53, IEA Coal Research, London, UK, 1993.
16. Zevenboven, R., Kilpinen, P., Control of pollutants in flue gases and fuel
gases; 2nd Ed., Espoo/Turku, Finland, 2002.
17. Diebold, J.P., Czernik, S., Scahill, J.W., Phillips, S.D., Feik, C.J., Hot-gas
filtration to remove char from pyrolysis vapors produced in the Vortex reactor
at NREL; In Proceedings of biomass pyrolysis oil properties and combustion
meeting, National Renewable Energy Laboratory, Estes Park, CO, USA, 1994.
18. Bramer, E.A., Brem, G. A., novel technology for fast pyrolysis of biomass:
Pyros reactor; In Twelfth European Biomass Conference: Biomass for Energy,
Industry and Climate Protection, Amsterdam, The Netherlands, ETA-Florence
and WIP-Munich, 2002.
19. Daugaard, D.E., Brown, R.C., Enthalpy for pyrolysis for several types of
biomass; Energy & Fuels, 2003, 17, pp. 934-939.
20. Rath, J., Wolfinger, M.G., Steiner, G., Barontini, F., Cozzani, V., Heat of
wood pyrolysis; Fuel, 2003, 82, pp. 81-91.
21. Werther, J., Measurement techniques in fluidized beds; Powder Technology,
1999, 102, pp. 15-36.
22. Parmar, M.S., Hayhurst, A.N., The heat transfer coefficient for a freely
moving sphere in a bubbling fluidised bed; Chem. Eng. Sci., 2002, 57, pp.
3485-3494.
131
23. Prins, W., Draijer, W., van Swaaij, W.P.M., Heat transfer to immersed spheres
fixed or freely moving in a gas-fluidized bed; In Heat and Mass Transfer in
Fixed and Fluidized Beds, van Swaaij, W.P.M., Afgan, N.H., Eds.,
Hemisphere Publishing Co., Washington, USA, 1986, pp. 317-331.
24. Pidwerbecki, D., Welty, J.R., Heat transfer to a horizontal tube in the splash
zone of a bubbling fluidized bed: an experimental study of temperature effects;
Experimental Thermal and Fluid Science, 1994, 9, pp. 356-365.
25. Rios, G.M., Gibert, H., Heat transfer between gas fluidized bed and big bodies:
analysis and explanation of a big particle mobility effects;. In Proceedings of
the Fourth International Conference on Fluidization, Kashikojima, Japan,
Engineering Foundation, 1984.
26. Deshmukh, S.A.R.K., Volkers, S., van Sint Annaland, M., Kuipers, J.A.M.,
Heat transfer in a membrane assisted bubbling fluidized bed with immersed
horizontal tubes; Int. J. of Chem. Reactor Eng., 2005, 3, pp. A1.
27. Grewal, N.S., Saxena, S.C., Maximum heat transfer coefficient between a
horizontal tube and a gas-solid fluidized bed; Ind. Eng. Chem. Process Des.
Dev., 1981, 20, pp. 108-116.
28. Valenzuela, J.A., Glicksman, L.R., An experimental study of solids mixing in
a freely bubbling two-dimensional fluidized bed; Powder Technology, 1984,
38, pp. 63-72.
29. Shen, L., Zhang, M., Effect of particle size on solids mixing in bubbling
fluidized beds; Powder Technology, 1998, 97, pp. 170-177.
30. Huizenga, P., Kuipers, J.A.M., van Swaaij, W.P.M., Hydrodynamics of the
continuously filtering slurry reactor - the influence of the load of solids and
particle size distribution; Chem. Eng. Sci., 1997, 52, pp. 3869-3882.
31. Huizenga, P., Kuipers, J.A.M., van Swaaij, W.P.M., A two-dimensional
hydrodynamic model of a slurry system with immersed filters; Chem. Eng.
Sci., 2003, 58, pp. 457-472.
32. Schiller, L., Naumann, A., Uber die grundlegenden Berechnungen bei der
Schwerkraftaufbereitung; Z. Ver. Dtsch. Ing., 1935, 77, pp. 318.
132
33. Davis, J.T., Turbulence Phenomena; New York: Academic Press, New York,
1972.
34. Werther, J., Effect of Gas Distributor on the Hydrodynamics of Gas Fluidized
Beds; Ger. Chem. Eng., 1978, 1, pp. 166-174.
35. Gilliland, E.R., Mason, E.A., Gas and solid mixing in fluidized beds; Ind. Eng.
Chem., 1949, 41, pp. 1191-1196.
36. Mostoufi, N., Chaouki, J., Local solid mixing in gas-solid fluidized beds;
Powder Technology, 2001, 114, pp. 23-31.
37. Abanades, J.C., Atares, S., Garasa, G. A comparative analysis of two solid
mixing models suitable for coal fluidized bed combustors and gasifiers; In
Proceedings of the 15th International Conference on Fluidized Bed
Combustion., Savannah, Georgia, 1999.
38. Litka, T., Glicksman, L.R., The influence of particle mechanical properties on
bubble characteristics and solid mixing in fluidized beds; Powder Technology,
1985, 42, pp. 231-239.
39. Van Deemter, J.J., Mixing and contacting in gas-solid fluidized beds; Chem.
Eng. Sci., 1961, 13, pp. 143-154.
40. van Deemter, J.J., The counter-current flow model of a gas-solids fluidized
bed; In Proceedings of international symposium on fluidization, Eindhoven,
The Netherlands, University Press, Amsterdam, 1967.
41. van Deemter, J.J., Chapter 9: Mixing; In Fluidization, Davidson, J.F., Harrison,
D., Eds., Academic Press, London, UK, 1985, pp. 331-353.
42. Shen, L., Zhang, M., Xu, Y., Model for solids mixing in a two-dimensional
gas-fluidized bed; Chem. Eng. Sci., 1995, 50, pp. 1841-1844.
43. Shen, L., Zhang, M., Xu, Y., Solids mixing in fluidized beds; Powder
Technology, 1995, 84, pp. 207-212.
44. Kunii, D., Levenspiel, O., Bubbling bed model, model for the flow of gas
through a fluidized bed; Ind. Eng. Chem. Fundam., 1968, 7, pp. 446-452.
133
45. Kunii, D., Levenspiel, O., Bubbling model for kinetic processes in fluidized
beds, gas-solids mass and heat transfer and catalytic reactions; Ind. Eng. Chem.
Fundam., 1968, 7, pp. 481-492.
46. Kunii, D., Levenspiel, O., Fluidization Engineering; 1st Ed., New York, USA:
John Wiley & Sons, Inc., 1969.
47. Darton, R.C., LaNauze, R.D., Davidson, J.F., Harrison, D., Bubble growth due
to coalescence in fluidized beds; Transactions of the Institution of Chemical
Engineers (Great Britain), 1977, 55, pp. 274-280.
48. Shi, Y.-F., Fan, L.-T., Lateral mixing of solids in gas-solid fluidized beds with
continuous flow of solids; Powder Technology, 1985, 41, pp. 23-28.
49. Danckwerts, P.V., Continuous flow systems: Distribution of residence times;
Chem. Eng. Sci., 1953, 2, pp. 1-13.
50. Johnsson, F., Andersson, S., Leckner, B., Expansion of a freely bubbling
fluidized bed; Powder Technology, 1991, 68, pp. 117-123.
51. Lee, G.S., Kim, S.D., Axial mixing of solids in fluidized beds; Chem. Eng. J.,
1990, 44, pp. 1-9.
52. Lewis, W.K., Gilliland, E.R., Girouard, H., Heat transfer and solids mixing in
beds of fluidized solids; Chem. Eng. Progr. Symp. Series, 1962, 58, pp. 87-97.

134
135
Chapter 5
Pyrolysis Experiments in a Bench-Scale
Filter-Assisted Fluidized Bed
Abstract
This chapter describes how the concept of extracting and cleaning pyrolysis vapors by
means of filters immersed in a fluid bed (FAFB) has been tested experimentally. For
this, a batch-wise fed lab-scale FB (20 g per batch) and a continuous bench-scale FB
(1 kg/h) have been equipped with an immersed filter (pore size between 6 and 15
micron).
In short batch experiments of ca. 2 minutes, pyrolysis oils have been produced that
did not contain any particles, magnesium and sodium.
While using the continuous bench-scale FB, approximately 5700 grams of non-filtered
oil and 3000 g of filtered oil were produced. Filtered oil contained two times less
particles and 5 times less ash components than the non-filtered oil. The ash content of
the filtered oil was only 0.01 wt % resulting in a very low aging rate expressed as the
increase in viscosity per unit time. Silica was found on the inner walls of the filter and
the downstream tubing indicating that sand fines (bed material) slipped trough the
filter during long-term operation. There is evidence that the particles found in the
filtered bio-oil have different origins. Part of them slipped simply through the filter,
while others were formed by secondary processes (polymerization of vapors)
occurring after the filter.
With this preliminary work, the potential of the FAFB is shown, but at the same time
some problems are identified. Further research is needed to develop the FAFB
concept completely.
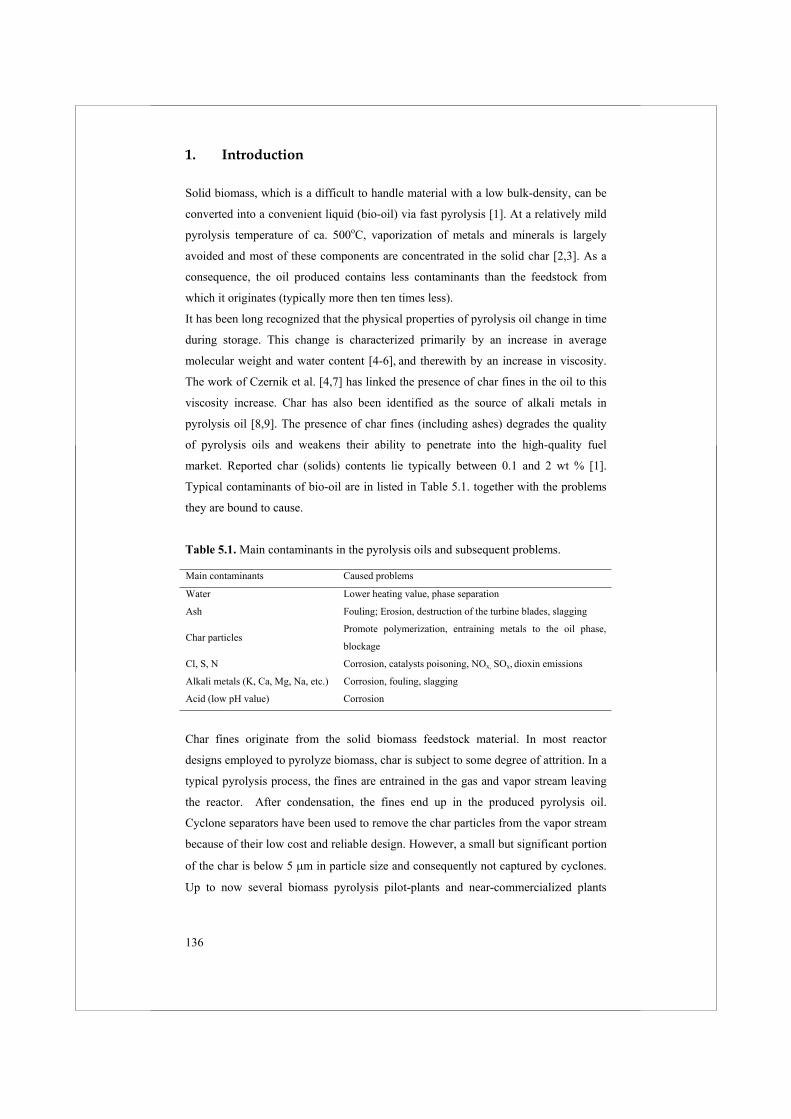
136
1. Introduction
Solid biomass, which is a difficult to handle material with a low bulk-density, can be
converted into a convenient liquid (bio-oil) via fast pyrolysis [1]. At a relatively mild
pyrolysis temperature of ca. 500oC, vaporization of metals and minerals is largely
avoided and most of these components are concentrated in the solid char [2,3]. As a
consequence, the oil produced contains less contaminants than the feedstock from
which it originates (typically more then ten times less).
It has been long recognized that the physical properties of pyrolysis oil change in time
during storage. This change is characterized primarily by an increase in average
molecular weight and water content [4-6], and therewith by an increase in viscosity.
The work of Czernik et al. [4,7] has linked the presence of char fines in the oil to this
viscosity increase. Char has also been identified as the source of alkali metals in
pyrolysis oil [8,9]. The presence of char fines (including ashes) degrades the quality
of pyrolysis oils and weakens their ability to penetrate into the high-quality fuel
market. Reported char (solids) contents lie typically between 0.1 and 2 wt % [1].
Typical contaminants of bio-oil are in listed in Table 5.1. together with the problems
they are bound to cause.
Table 5.1. Main contaminants in the pyrolysis oils and subsequent problems.
Main contaminants Caused problems
Water Lower heating value, phase separation
Ash Fouling; Erosion, destruction of the turbine blades, slagging
Char particles Promote polymerization, entraining metals to the oil phase,
blockage
Cl, S, N Corrosion, catalysts poisoning, NOx, SOx, dioxin emissions
Alkali metals (K, Ca, Mg, Na, etc.) Corrosion, fouling, slagging
Acid (low pH value) Corrosion
Char fines originate from the solid biomass feedstock material. In most reactor
designs employed to pyrolyze biomass, char is subject to some degree of attrition. In a
typical pyrolysis process, the fines are entrained in the gas and vapor stream leaving
the reactor. After condensation, the fines end up in the produced pyrolysis oil.
Cyclone separators have been used to remove the char particles from the vapor stream
because of their low cost and reliable design. However, a small but significant portion
of the char is below 5 m in particle size and consequently not captured by cyclones.
Up to now several biomass pyrolysis pilot-plants and near-commercialized plants
137
have been installed, but a method to remove char particles efficiently from the oil has
not been developed yet and filtration of the produced oil has several disadvantages
(see Chapter 1).
To meet the specification requirements of the sophisticated end-user applications,
high quality pyrolysis oil must have uniform and reproducible properties and be free
of char fines and ashes. Pyrolysis oils should therefore be produced in such a manner
that they will consistently meet the specifications required by the end-use application.
For this purpose, a fluidized bed with immersed filters for extracting pyrolysis vapors
is proposed in this thesis. This concept is called the Filter Assisted Fluidized Bed
(FAFB) pyrolysis reactor. The concept and its hydrodynamic characteristics were
presented in the previous chapters (Chapters 1, 3, and 4 of this thesis). In this chapter,
first preliminary results of actual pyrolysis experiments in a FAFB reactor are
presented. At this stage of development we will mainly focus on the solids and alkali
content in the produced bio-oils. Tests were carried out in 3 different set-ups, i) a
small batch-wise (20 gram per batch) operated FAFB reactor, ii) a continuous bench-
scale plant (1 kg/h) and, iii) a pilot plant of BTG. The filtered bio-oils were compared
with non-filtered oil produced in the bench-scale plant and with typical (non-filtered)
bio-oils produced in BTG’s pilot plant. Complete mass balances of tests carried out in
the bench-scale plant are presented.
2. Experimental Set-up and Materials
2.1. Feedstock Materials
Two types of biomass were used as pyrolysis feedstock, beech wood provided by
BTG and Lignocel 9, which is a small diameter (dp < 1 mm) material, purchased from
Rettenmaier and Söhne GmbH (Germany). The properties of these materials are given
in Table 5.2.
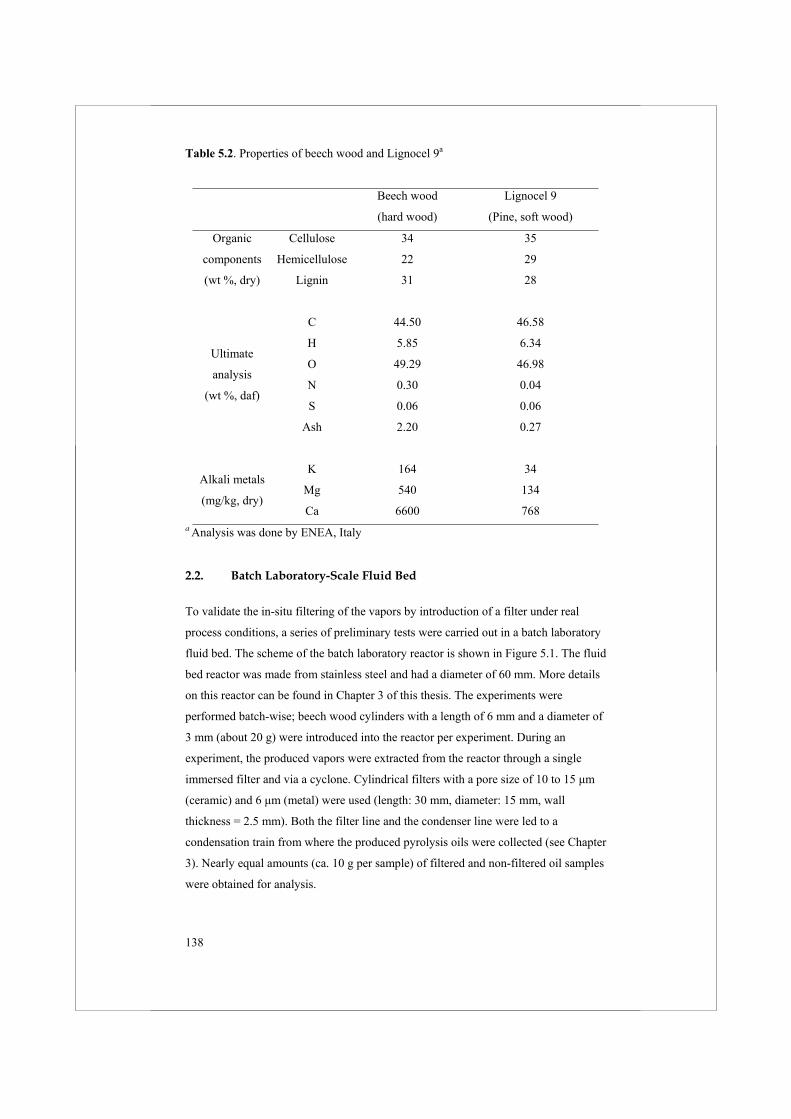
138
Table 5.2. Properties of beech wood and Lignocel 9a
Beech wood
(hard wood)
Lignocel 9
(Pine, soft wood)
Cellulose 34 35
Hemicellulose 22 29
Organic
components
(wt %, dry) Lignin 31 28
C 44.50 46.58
H 5.85 6.34
O 49.29 46.98
N 0.30 0.04
S 0.06 0.06
Ultimate
analysis
(wt %, daf)
Ash 2.20 0.27
K 164 34
Mg 540 134 Alkali metals
(mg/kg, dry) Ca 6600 768
a Analysis was done by ENEA, Italy
2.2. Batch Laboratory-Scale Fluid Bed
To validate the in-situ filtering of the vapors by introduction of a filter under real
process conditions, a series of preliminary tests were carried out in a batch laboratory
fluid bed. The scheme of the batch laboratory reactor is shown in Figure 5.1. The fluid
bed reactor was made from stainless steel and had a diameter of 60 mm. More details
on this reactor can be found in Chapter 3 of this thesis. The experiments were
performed batch-wise; beech wood cylinders with a length of 6 mm and a diameter of
3 mm (about 20 g) were introduced into the reactor per experiment. During an
experiment, the produced vapors were extracted from the reactor through a single
immersed filter and via a cyclone. Cylindrical filters with a pore size of 10 to 15 µm
(ceramic) and 6 µm (metal) were used (length: 30 mm, diameter: 15 mm, wall
thickness = 2.5 mm). Both the filter line and the condenser line were led to a
condensation train from where the produced pyrolysis oils were collected (see Chapter
3). Nearly equal amounts (ca. 10 g per sample) of filtered and non-filtered oil samples
were obtained for analysis.
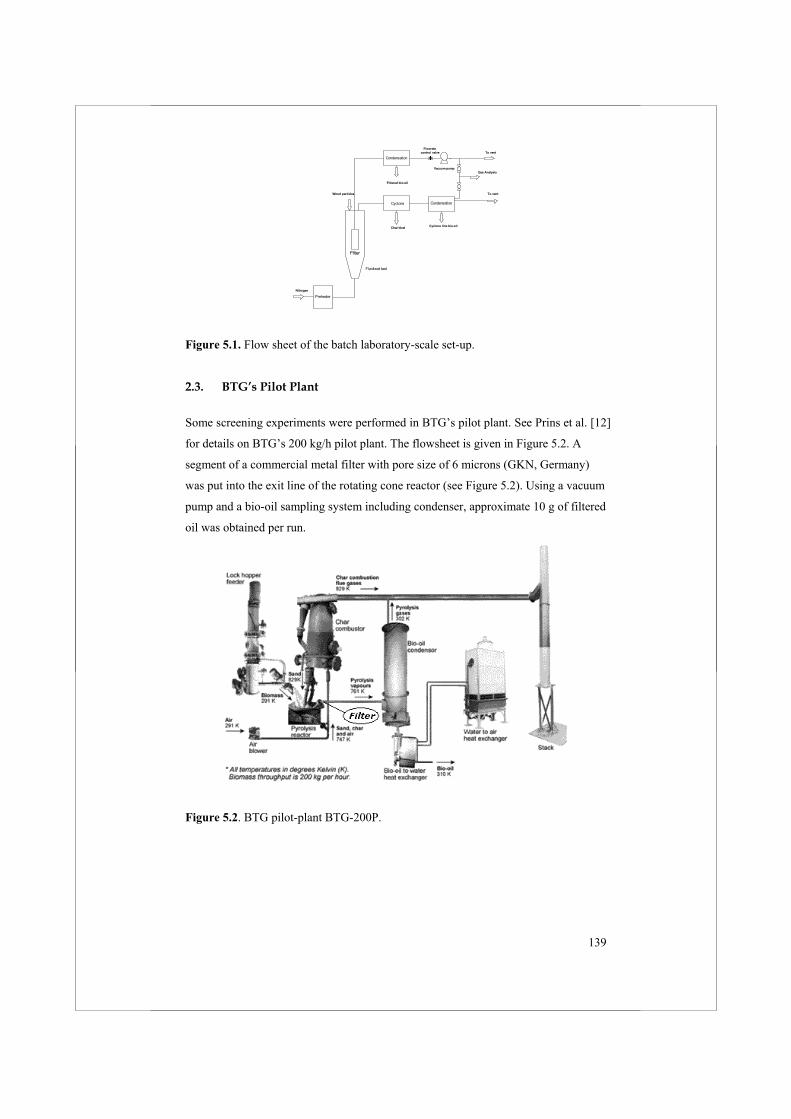
139
Preheater
Filter
Char/dust
Cyclone
To vent
Gas Analysis
Wood particles
To vent
Condensation
Condensation
Filtered bio-oil
Cyclone line bio-oil
Vacuum pump
Flowratecontrol valve
Nitrogen
Fluidized bed
Figure 5.1. Flow sheet of the batch laboratory-scale set-up.
2.3. BTG’s Pilot Plant
Some screening experiments were performed in BTG’s pilot plant. See Prins et al. [12]
for details on BTG’s 200 kg/h pilot plant. The flowsheet is given in Figure 5.2. A
segment of a commercial metal filter with pore size of 6 microns (GKN, Germany)
was put into the exit line of the rotating cone reactor (see Figure 5.2). Using a vacuum
pump and a bio-oil sampling system including condenser, approximate 10 g of filtered
oil was obtained per run.
Figure 5.2. BTG pilot-plant BTG-200P.
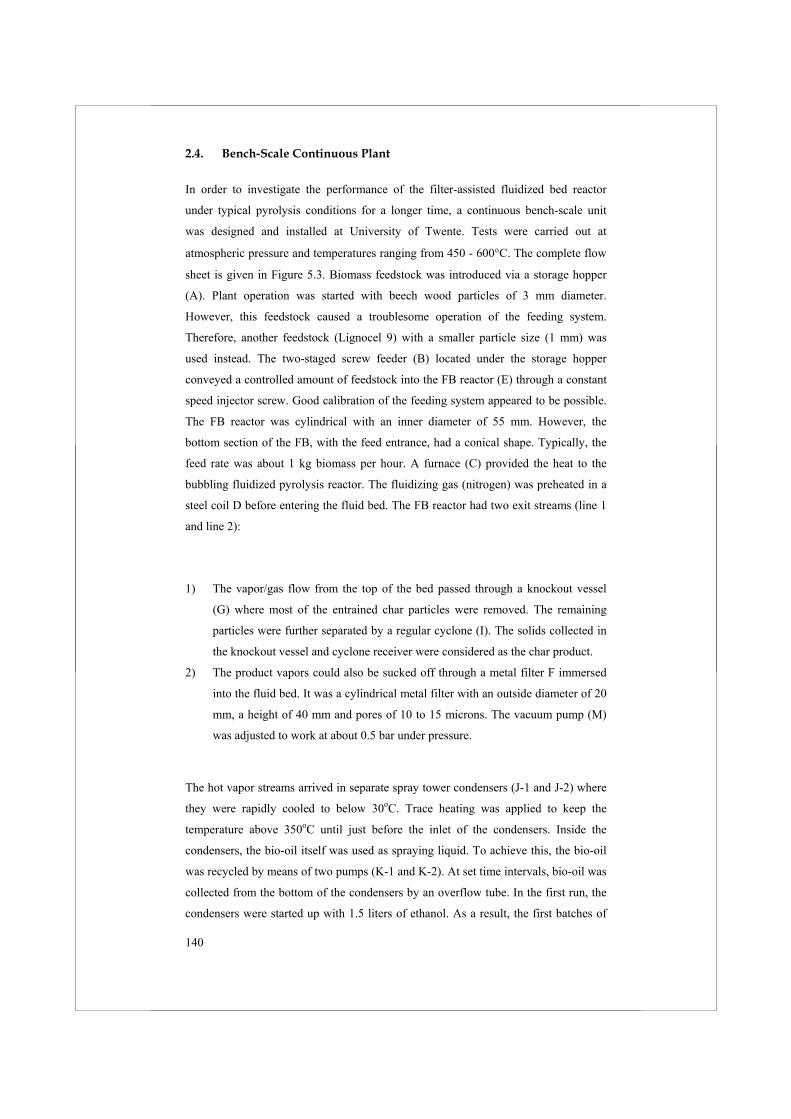
140
2.4. Bench-Scale Continuous Plant
In order to investigate the performance of the filter-assisted fluidized bed reactor
under typical pyrolysis conditions for a longer time, a continuous bench-scale unit
was designed and installed at University of Twente. Tests were carried out at
atmospheric pressure and temperatures ranging from 450 - 600 C. The complete flow
sheet is given in Figure 5.3. Biomass feedstock was introduced via a storage hopper
(A). Plant operation was started with beech wood particles of 3 mm diameter.
However, this feedstock caused a troublesome operation of the feeding system.
Therefore, another feedstock (Lignocel 9) with a smaller particle size (1 mm) was
used instead. The two-staged screw feeder (B) located under the storage hopper
conveyed a controlled amount of feedstock into the FB reactor (E) through a constant
speed injector screw. Good calibration of the feeding system appeared to be possible.
The FB reactor was cylindrical with an inner diameter of 55 mm. However, the
bottom section of the FB, with the feed entrance, had a conical shape. Typically, the
feed rate was about 1 kg biomass per hour. A furnace (C) provided the heat to the
bubbling fluidized pyrolysis reactor. The fluidizing gas (nitrogen) was preheated in a
steel coil D before entering the fluid bed. The FB reactor had two exit streams (line 1
and line 2):
1) The vapor/gas flow from the top of the bed passed through a knockout vessel
(G) where most of the entrained char particles were removed. The remaining
particles were further separated by a regular cyclone (I). The solids collected in
the knockout vessel and cyclone receiver were considered as the char product.
2) The product vapors could also be sucked off through a metal filter F immersed
into the fluid bed. It was a cylindrical metal filter with an outside diameter of 20
mm, a height of 40 mm and pores of 10 to 15 microns. The vacuum pump (M)
was adjusted to work at about 0.5 bar under pressure.
The hot vapor streams arrived in separate spray tower condensers (J-1 and J-2) where
they were rapidly cooled to below 30oC. Trace heating was applied to keep the
temperature above 350oC until just before the inlet of the condensers. Inside the
condensers, the bio-oil itself was used as spraying liquid. To achieve this, the bio-oil
was recycled by means of two pumps (K-1 and K-2). At set time intervals, bio-oil was
collected from the bottom of the condensers by an overflow tube. In the first run, the
condensers were started up with 1.5 liters of ethanol. As a result, the first batches of
141
produced ethanol contained large amounts of ethanol. After each experiment the
condensers were completely emptied, while before every run the condensers were
filled with oil obtained from the previous runs, up to the level of the overflow tube.
The oil that was sent for analysis contained less than 8 wt % ethanol. Electrostatic
precipitators (L-1 and L-2) were installed but not used in this preliminary work.
It appeared possible to operate the set-up with only the cyclone exit (line 1) open.
When using the filter, line 1 had to be open as well, in order to keep the bed fluidized.
The flow ratio through line 1 and 2 could be controlled by the applied vacuum and a
control valve in line 1. The input gas flow rates of the reactor were measured and
controlled by a set of mass flow controllers (MFC-1 and MFC-2), and the output gas
(product) flow rates were measured by dry-gas-meters. In some cases, they were
cross-checked based on the carrier gas (inert nitrogen) balance.
The temperatures in the reactor (4 axial equidistant points), transport lines and
condensers were logged by the data acquisition system. The composition of the
permanent gases was measured with a set of online gas analyzers. After an experiment,
the char fractions of the knock-out vessel, cyclone receiver and the reactor were
collected. The mass of net produced bio-oil and char was weighted and the produced
gas was calculated based on the measured gas composition and flow rate.
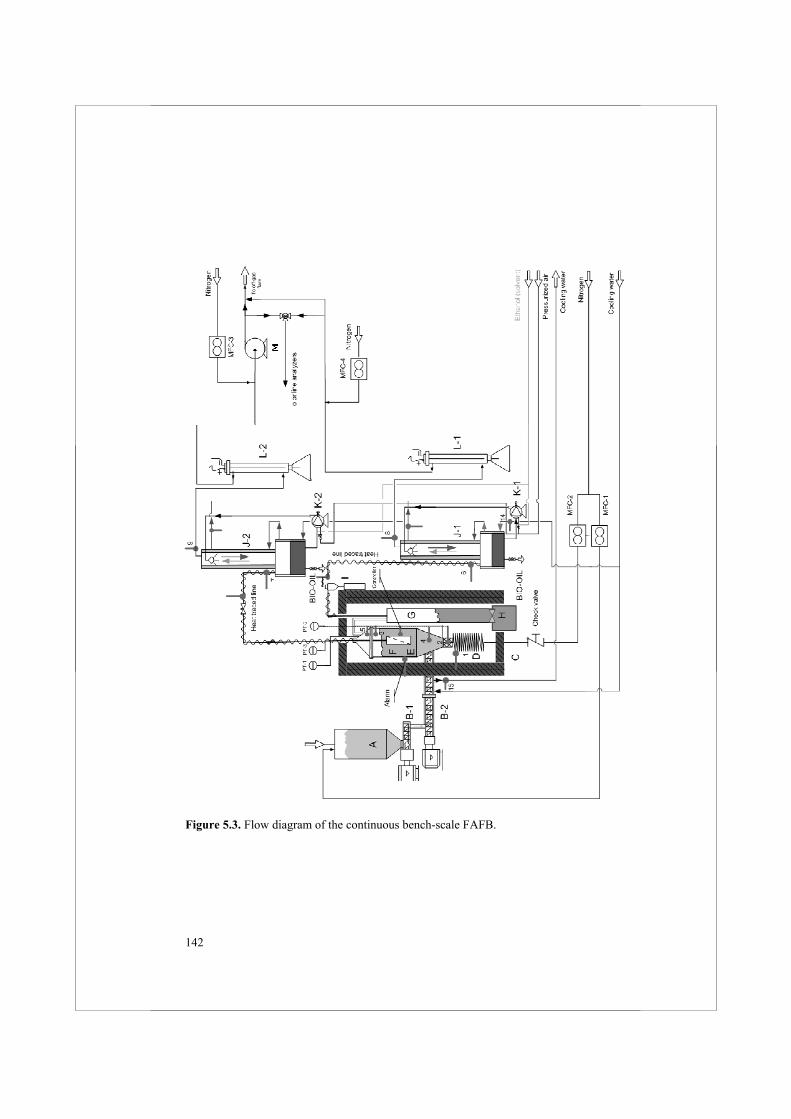
142
Figure 5.3. Flow diagram of the continuous bench-scale FAFB.
143
3. Analysis
The Italian National Agency for new Technology, Energy and Environment (ENEA),
and the Institute for Wood Chemistry (BFH) in Hamburg, Germany, have carried out
the analyses of the produced oils. In the table below the most important analysis
methods are listed together with the appropriate references.
Table 5.3. Analysis methods.
Analysis Method References
Solids content Gravimetric [6,13,14]
Ash content EN ISO6245 [13,14]
Alkali metals AAS [6,13,14]
Viscosity Capillary viscometers ASTM D445
To characterize the aging of the pyrolysis oils its increase in viscosity per unit time
was determined. This was done at room temperature (20oC), 40oC, and 90oC.
4. Experimental Results
4.1. Preliminary Testing in the Batch Lab-Scale FB and BTG’s Pilot Plant
For the batch lab-scale FB and BTG’s pilot plant it was not possible to complete the
mass balances. In these screening tests the focus was on the comparisons between
filtered and non-filtered oils with respect to total solids and alkali metal contents.
Table 5.4 shows a comparison between the solids content of filtered and non-filtered
oil. When feeding rather large beech wood particles (3 mm in diameter and 6 mm
long), the non-filtered oil contained about 0.1 wt % solids (Table 5.4, UT-1 and UT-2).
This is in agreement with results reported in literature [1]. In the filtered oil, no solids
could be detected at all (Table 5.4, UT-1 and UT-2) by gravimetric methods
(detection limit = 10-4 wt %). The same result was found for oil obtained via
immersed filters in BTG’s pilot plant (see Table 5.4, BTG plant).
To mimic the conditions of a real pyrolysis reactor, about 20 vol. % char was added to
the fluidized bed in a separate experiment. The char contained quite some fines
(smaller than 5 m) and had an average particle size of 100 m. With the additional
char in the reactor, the collected non-filtered oil contained much more solids (see
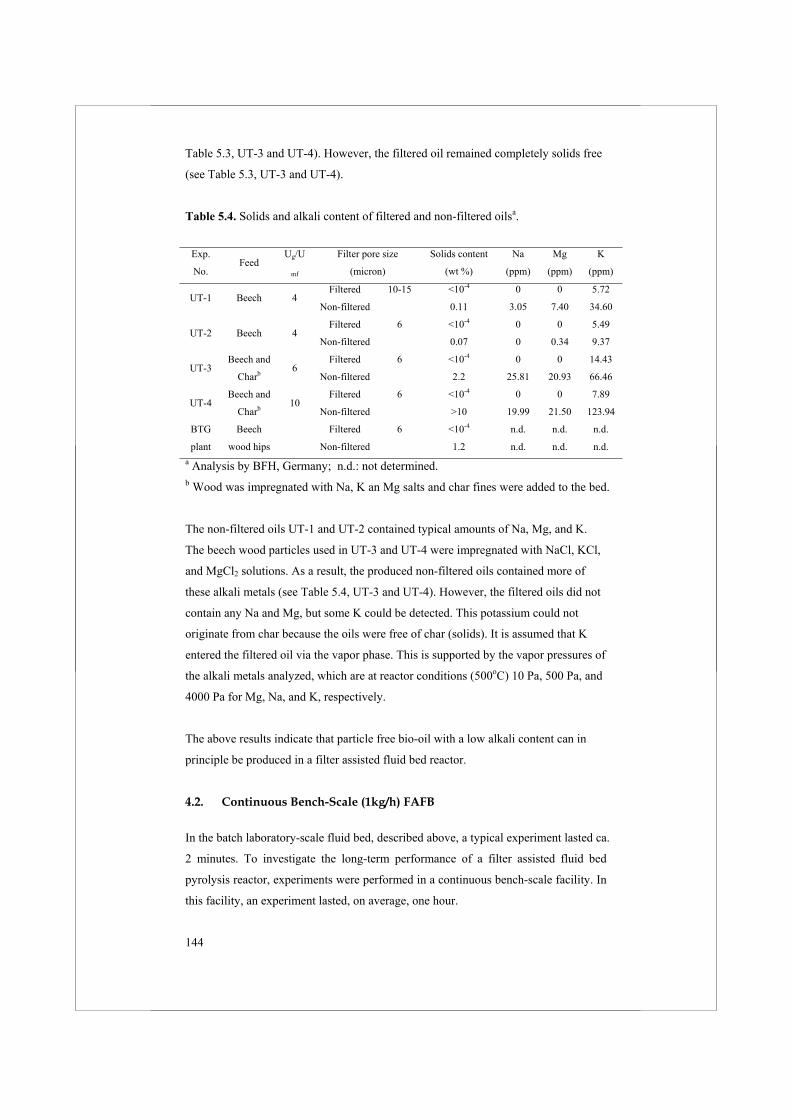
144
Table 5.3, UT-3 and UT-4). However, the filtered oil remained completely solids free
(see Table 5.3, UT-3 and UT-4).
Table 5.4. Solids and alkali content of filtered and non-filtered oilsa.
Exp.
No. Feed
Ug/U
mf
Filter pore size
(micron)
Solids content
(wt %)
Na
(ppm)
Mg
(ppm)
K
(ppm)
Filtered 10-15 <10-4 0 0 5.72 UT-1 Beech 4
Non-filtered 0.11 3.05 7.40 34.60
Filtered 6 <10-4 0 0 5.49 UT-2 Beech 4
Non-filtered 0.07 0 0.34 9.37
Filtered 6 <10-4 0 0 14.43 UT-3
Beech and
Charb 6Non-filtered 2.2 25.81 20.93 66.46
Filtered 6 <10-4 0 0 7.89 UT-4
Beech and
Charb 10Non-filtered >10 19.99 21.50 123.94
Filtered 6 <10-4 n.d. n.d. n.d. BTG
plant
Beech
wood hips Non-filtered 1.2 n.d. n.d. n.d. a Analysis by BFH, Germany; n.d.: not determined. b Wood was impregnated with Na, K an Mg salts and char fines were added to the bed.
The non-filtered oils UT-1 and UT-2 contained typical amounts of Na, Mg, and K.
The beech wood particles used in UT-3 and UT-4 were impregnated with NaCl, KCl,
and MgCl2 solutions. As a result, the produced non-filtered oils contained more of
these alkali metals (see Table 5.4, UT-3 and UT-4). However, the filtered oils did not
contain any Na and Mg, but some K could be detected. This potassium could not
originate from char because the oils were free of char (solids). It is assumed that K
entered the filtered oil via the vapor phase. This is supported by the vapor pressures of
the alkali metals analyzed, which are at reactor conditions (500oC) 10 Pa, 500 Pa, and
4000 Pa for Mg, Na, and K, respectively.
The above results indicate that particle free bio-oil with a low alkali content can in
principle be produced in a filter assisted fluid bed reactor.
4.2. Continuous Bench-Scale (1kg/h) FAFB
In the batch laboratory-scale fluid bed, described above, a typical experiment lasted ca.
2 minutes. To investigate the long-term performance of a filter assisted fluid bed
pyrolysis reactor, experiments were performed in a continuous bench-scale facility. In
this facility, an experiment lasted, on average, one hour.
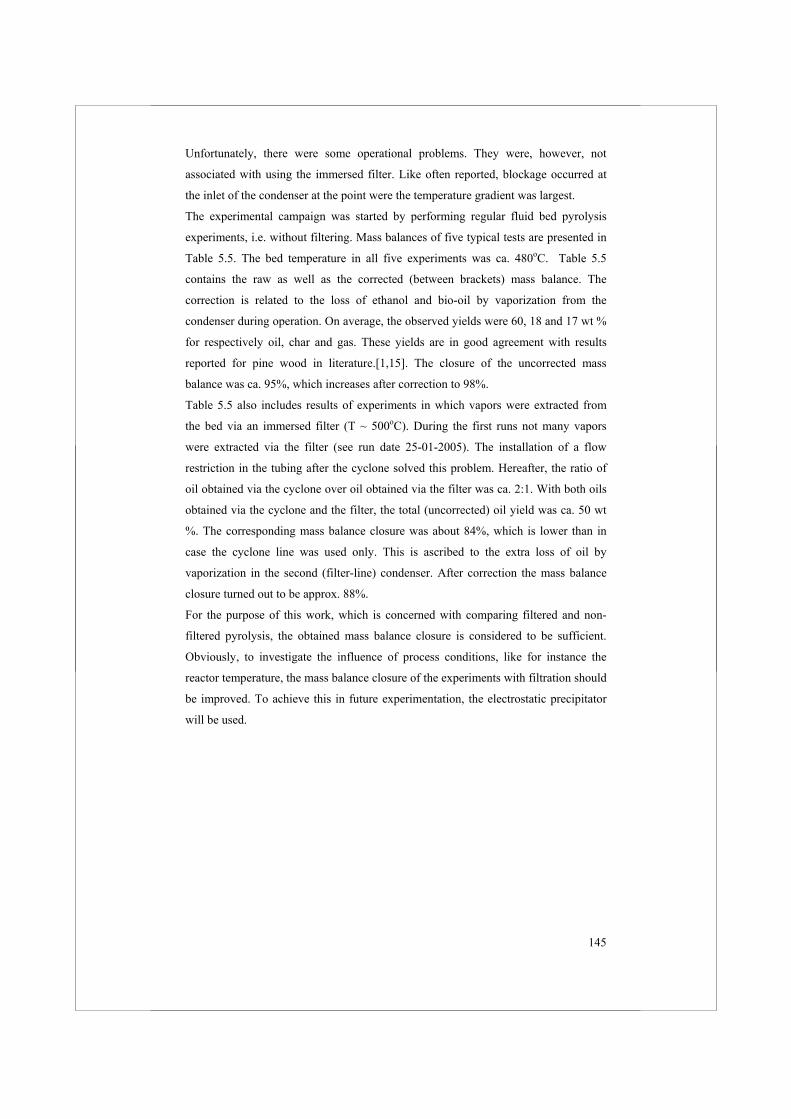
145
Unfortunately, there were some operational problems. They were, however, not
associated with using the immersed filter. Like often reported, blockage occurred at
the inlet of the condenser at the point were the temperature gradient was largest.
The experimental campaign was started by performing regular fluid bed pyrolysis
experiments, i.e. without filtering. Mass balances of five typical tests are presented in
Table 5.5. The bed temperature in all five experiments was ca. 480oC. Table 5.5
contains the raw as well as the corrected (between brackets) mass balance. The
correction is related to the loss of ethanol and bio-oil by vaporization from the
condenser during operation. On average, the observed yields were 60, 18 and 17 wt %
for respectively oil, char and gas. These yields are in good agreement with results
reported for pine wood in literature.[1,15]. The closure of the uncorrected mass
balance was ca. 95%, which increases after correction to 98%.
Table 5.5 also includes results of experiments in which vapors were extracted from
the bed via an immersed filter (T ~ 500oC). During the first runs not many vapors
were extracted via the filter (see run date 25-01-2005). The installation of a flow
restriction in the tubing after the cyclone solved this problem. Hereafter, the ratio of
oil obtained via the cyclone over oil obtained via the filter was ca. 2:1. With both oils
obtained via the cyclone and the filter, the total (uncorrected) oil yield was ca. 50 wt
%. The corresponding mass balance closure was about 84%, which is lower than in
case the cyclone line was used only. This is ascribed to the extra loss of oil by
vaporization in the second (filter-line) condenser. After correction the mass balance
closure turned out to be approx. 88%.
For the purpose of this work, which is concerned with comparing filtered and non-
filtered pyrolysis, the obtained mass balance closure is considered to be sufficient.
Obviously, to investigate the influence of process conditions, like for instance the
reactor temperature, the mass balance closure of the experiments with filtration should
be improved. To achieve this in future experimentation, the electrostatic precipitator
will be used.
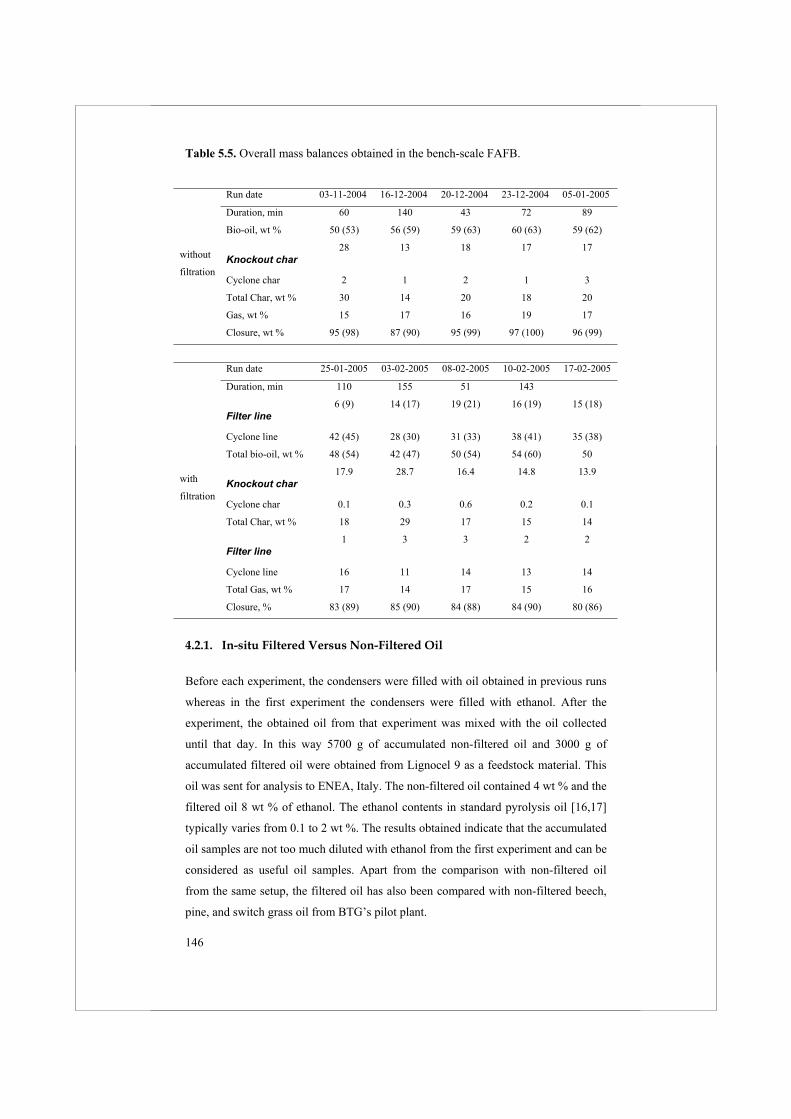
146
Table 5.5. Overall mass balances obtained in the bench-scale FAFB.
Run date 03-11-2004 16-12-2004 20-12-2004 23-12-2004 05-01-2005
Duration, min 60 140 43 72 89
Bio-oil, wt % 50 (53) 56 (59) 59 (63) 60 (63) 59 (62)
Knockout char 28 13 18 17 17
Cyclone char 2 1 2 1 3
Total Char, wt % 30 14 20 18 20
Gas, wt % 15 17 16 19 17
without
filtration
Closure, wt % 95 (98) 87 (90) 95 (99) 97 (100) 96 (99)
Run date 25-01-2005 03-02-2005 08-02-2005 10-02-2005 17-02-2005
Duration, min 110 155 51 143
Filter line 6 (9) 14 (17) 19 (21) 16 (19) 15 (18)
Cyclone line 42 (45) 28 (30) 31 (33) 38 (41) 35 (38)
Total bio-oil, wt % 48 (54) 42 (47) 50 (54) 54 (60) 50
Knockout char 17.9 28.7 16.4 14.8 13.9
Cyclone char 0.1 0.3 0.6 0.2 0.1
Total Char, wt % 18 29 17 15 14
Filter line 1 3 3 2 2
Cyclone line 16 11 14 13 14
Total Gas, wt % 17 14 17 15 16
with
filtration
Closure, % 83 (89) 85 (90) 84 (88) 84 (90) 80 (86)
4.2.1. In-situ Filtered Versus Non-Filtered Oil
Before each experiment, the condensers were filled with oil obtained in previous runs
whereas in the first experiment the condensers were filled with ethanol. After the
experiment, the obtained oil from that experiment was mixed with the oil collected
until that day. In this way 5700 g of accumulated non-filtered oil and 3000 g of
accumulated filtered oil were obtained from Lignocel 9 as a feedstock material. This
oil was sent for analysis to ENEA, Italy. The non-filtered oil contained 4 wt % and the
filtered oil 8 wt % of ethanol. The ethanol contents in standard pyrolysis oil [16,17]
typically varies from 0.1 to 2 wt %. The results obtained indicate that the accumulated
oil samples are not too much diluted with ethanol from the first experiment and can be
considered as useful oil samples. Apart from the comparison with non-filtered oil
from the same setup, the filtered oil has also been compared with non-filtered beech,
pine, and switch grass oil from BTG’s pilot plant.
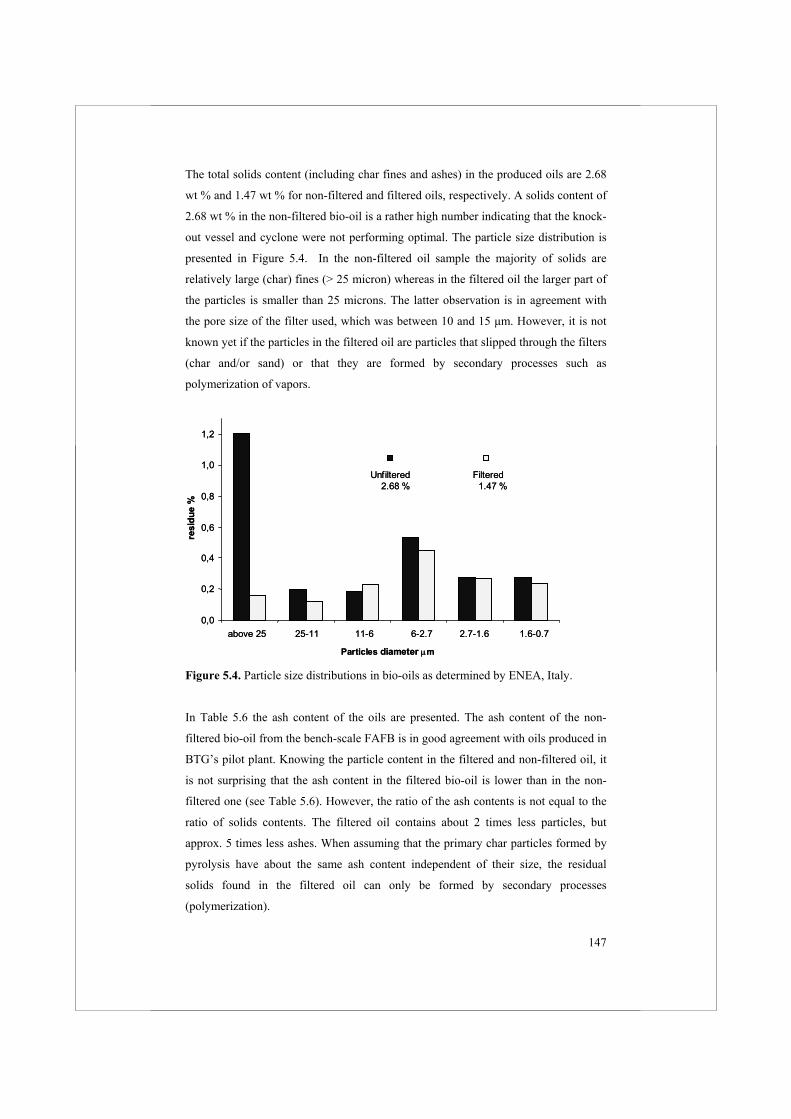
147
The total solids content (including char fines and ashes) in the produced oils are 2.68
wt % and 1.47 wt % for non-filtered and filtered oils, respectively. A solids content of
2.68 wt % in the non-filtered bio-oil is a rather high number indicating that the knock-
out vessel and cyclone were not performing optimal. The particle size distribution is
presented in Figure 5.4. In the non-filtered oil sample the majority of solids are
relatively large (char) fines (> 25 micron) whereas in the filtered oil the larger part of
the particles is smaller than 25 microns. The latter observation is in agreement with
the pore size of the filter used, which was between 10 and 15 µm. However, it is not
known yet if the particles in the filtered oil are particles that slipped through the filters
(char and/or sand) or that they are formed by secondary processes such as
polymerization of vapors.
0,0
0,2
0,4
0,6
0,8
1,0
1,2
above 25 25-11 11-6 6-2.7 2.7-1.6 1.6-0.7
resi
due
%
Unfiltered2.68 %
Filtered1.47 %
Particles diameter m
0,0
0,2
0,4
0,6
0,8
1,0
1,2
above 25 25-11 11-6 6-2.7 2.7-1.6 1.6-0.7
resi
due
%
Unfiltered2.68 %
Filtered1.47 %
Particles diameter m
Figure 5.4. Particle size distributions in bio-oils as determined by ENEA, Italy.
In Table 5.6 the ash content of the oils are presented. The ash content of the non-
filtered bio-oil from the bench-scale FAFB is in good agreement with oils produced in
BTG’s pilot plant. Knowing the particle content in the filtered and non-filtered oil, it
is not surprising that the ash content in the filtered bio-oil is lower than in the non-
filtered one (see Table 5.6). However, the ratio of the ash contents is not equal to the
ratio of solids contents. The filtered oil contains about 2 times less particles, but
approx. 5 times less ashes. When assuming that the primary char particles formed by
pyrolysis have about the same ash content independent of their size, the residual
solids found in the filtered oil can only be formed by secondary processes
(polymerization).
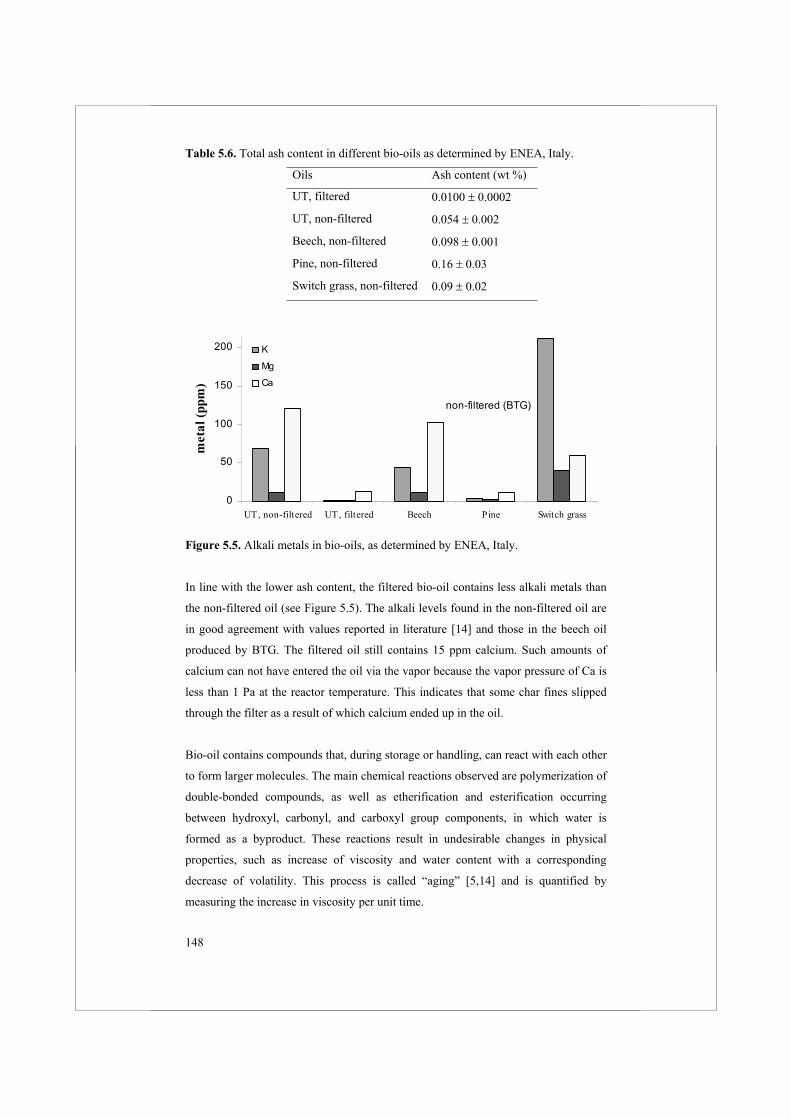
148
Table 5.6. Total ash content in different bio-oils as determined by ENEA, Italy.
Oils Ash content (wt %)
UT, filtered 0.0100 0.0002
UT, non-filtered 0.054 0.002
Beech, non-filtered 0.098 0.001
Pine, non-filtered 0.16 0.03
Switch grass, non-filtered 0.09 0.02
0
50
100
150
200
UT, non-filtered UT, filtered Beech Pine Switch grass
met
al (p
pm)
K
Mg
Ca
non-filtered (BTG)
Figure 5.5. Alkali metals in bio-oils, as determined by ENEA, Italy.
In line with the lower ash content, the filtered bio-oil contains less alkali metals than
the non-filtered oil (see Figure 5.5). The alkali levels found in the non-filtered oil are
in good agreement with values reported in literature [14] and those in the beech oil
produced by BTG. The filtered oil still contains 15 ppm calcium. Such amounts of
calcium can not have entered the oil via the vapor because the vapor pressure of Ca is
less than 1 Pa at the reactor temperature. This indicates that some char fines slipped
through the filter as a result of which calcium ended up in the oil.
Bio-oil contains compounds that, during storage or handling, can react with each other
to form larger molecules. The main chemical reactions observed are polymerization of
double-bonded compounds, as well as etherification and esterification occurring
between hydroxyl, carbonyl, and carboxyl group components, in which water is
formed as a byproduct. These reactions result in undesirable changes in physical
properties, such as increase of viscosity and water content with a corresponding
decrease of volatility. This process is called “aging” [5,14] and is quantified by
measuring the increase in viscosity per unit time.
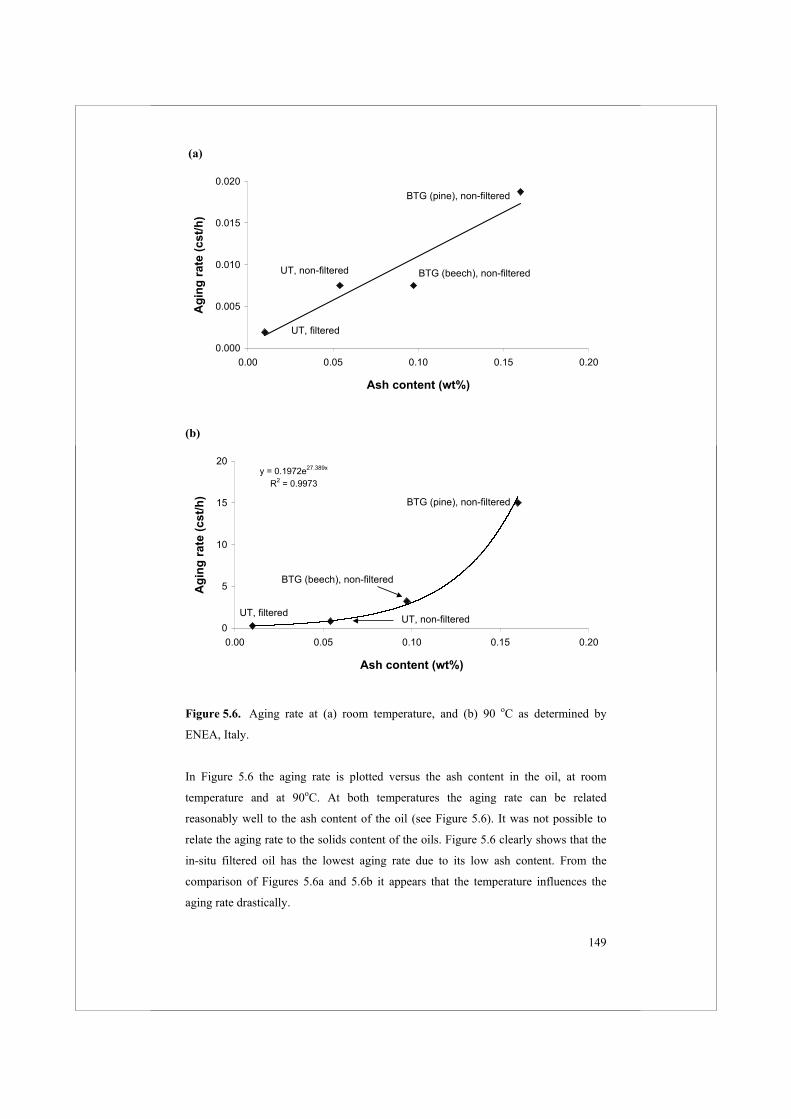
149
(a)
0.000
0.005
0.010
0.015
0.020
0.00 0.05 0.10 0.15 0.20
Ash content (wt%)
Agi
ng ra
te (c
st/h
)
UT, filtered
UT, non-filtered BTG (beech), non-filtered
BTG (pine), non-filtered
(b)
y = 0.1972e27.389x
R2 = 0.9973
0
5
10
15
20
0.00 0.05 0.10 0.15 0.20
Ash content (wt%)
Agi
ng ra
te (c
st/h
)
UT, filteredUT, non-filtered
BTG (beech), non-filtered
BTG (pine), non-filtered
Figure 5.6. Aging rate at (a) room temperature, and (b) 90 oC as determined by
ENEA, Italy.
In Figure 5.6 the aging rate is plotted versus the ash content in the oil, at room
temperature and at 90oC. At both temperatures the aging rate can be related
reasonably well to the ash content of the oil (see Figure 5.6). It was not possible to
relate the aging rate to the solids content of the oils. Figure 5.6 clearly shows that the
in-situ filtered oil has the lowest aging rate due to its low ash content. From the
comparison of Figures 5.6a and 5.6b it appears that the temperature influences the
aging rate drastically.
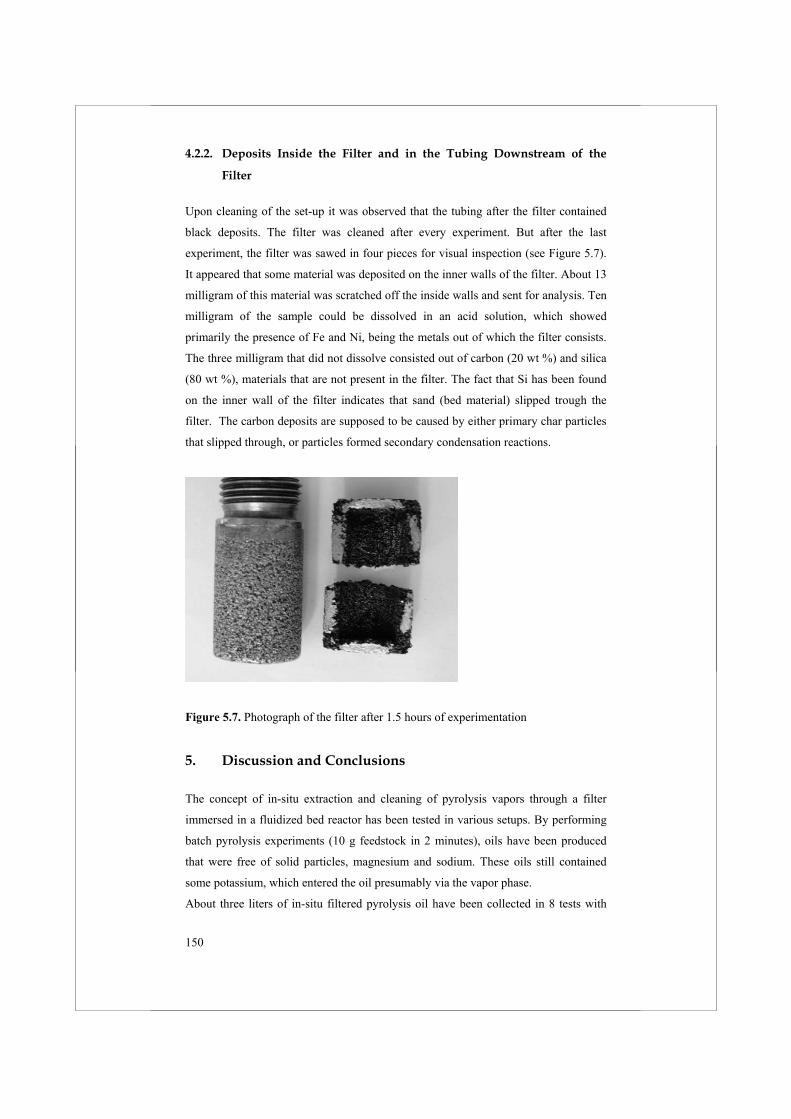
150
4.2.2. Deposits Inside the Filter and in the Tubing Downstream of the
Filter
Upon cleaning of the set-up it was observed that the tubing after the filter contained
black deposits. The filter was cleaned after every experiment. But after the last
experiment, the filter was sawed in four pieces for visual inspection (see Figure 5.7).
It appeared that some material was deposited on the inner walls of the filter. About 13
milligram of this material was scratched off the inside walls and sent for analysis. Ten
milligram of the sample could be dissolved in an acid solution, which showed
primarily the presence of Fe and Ni, being the metals out of which the filter consists.
The three milligram that did not dissolve consisted out of carbon (20 wt %) and silica
(80 wt %), materials that are not present in the filter. The fact that Si has been found
on the inner wall of the filter indicates that sand (bed material) slipped trough the
filter. The carbon deposits are supposed to be caused by either primary char particles
that slipped through, or particles formed secondary condensation reactions.
Figure 5.7. Photograph of the filter after 1.5 hours of experimentation
5. Discussion and Conclusions
The concept of in-situ extraction and cleaning of pyrolysis vapors through a filter
immersed in a fluidized bed reactor has been tested in various setups. By performing
batch pyrolysis experiments (10 g feedstock in 2 minutes), oils have been produced
that were free of solid particles, magnesium and sodium. These oils still contained
some potassium, which entered the oil presumably via the vapor phase.
About three liters of in-situ filtered pyrolysis oil have been collected in 8 tests with
151
the bench-scale FAFB at ca. 1 kg/h feeding rate. With respect to the filtering, no
severe operational problems have been encountered. The filtered bio-oil has been
compared with non-filtered oil produced in the same set-up. The filtered oil contained
two times less particles but 5 times less ashes than the non-filtered oil. The ash
content of the filtered oil was only 0.01 wt % resulting in a very low aging rate
expressed as the increase in viscosity per unit time. The fact that the ratio of solids in
the filtered oil over solids in the non-filtered oil (0.55) is much larger than the ratio of
ashes in the oils (0.19) indicates that some solids in the filtered oil are formed by
secondary processes, i.e. they are formed after the filter. There is strong evidence that
char fines and bed material fines slipped trough the 10 to 15 µm filter during 13 hours
of operation. This slip seems inevitable as the use of filters with a much smaller pore
size is unpractical because it would lead to either a high pressure drop or a large
required filter area.
With this work, the potential of the FAFB is shown but at the same time some
problems have been identified. Further research is needed to develop the FAFB
concept fully, with special attention to the filter design.
Acknowledgement
The Institute for Wood Chemistry (BFH) in Hamburg, Germany, and the Italian
National Agency for new Technology, Energy and Environment (ENEA) are
acknowledged for the performed analyses. The research was funded by the European
Commission (EC) and The Dutch Organization for Scientific Research (NWO).
References
1. Bridgwater, A.V., Czernik, S., Diebold, J., Meier, D., Oasmaa, A., Peacocke, C.,
Piskorz, J., Radlein, D., Eds., Fast pyrolysis of biomass; A handbook, CPL Press,
1999.
2. Helsen, L., van den Bulck, E., Mullens, S., Mullens, J., Low-temperature
pyrolysis of CCA-treated wood: thermogravimetric analysis; J. Anal. Appl.
Pyrolysis, 1999, 52, pp. 65-86.
3. Hansen, U., Strenziok, R., Meier, D., Achenbach, D., Energy from contaminated
waste wood; In Twelfth European Biomass Conference: Biomass for Energy,
Industry and Climate Protection, Amsterdam, The Netherlands, ETA-Florence
and WIP-Munich, 2002.
152
4. Czernik, S., Johnson, D.K., Black, S., Stability of wood fast pyrolysis oil;
Biomass and Bioenergy, 1994, 7, pp. 187-192.
5. Diebold, J.P., A review of the chemical and physical mechanisms of the storage
stability of fast pyrolysis bio-oils; National Renewable Energy Laboratory
(NREL), Golden, CO, USA, 2000, pp. 59.
6. Scholze, B., Long-term stability, catalytic upgrading, and application of
pyrolysis oils-improving the properties of a potential substitute of fossil fuels;
Ph.D. Thesis, University of Hamburg, Hamburg, Germany, 2002.
7. Czernik, S. Storage of Biomass Pyrolysis Oils; In Proceedings of Biomass
Pyrolysis Oil, Properties and Combustion Meeting, National Renewable Energy
Laboratory, Estes Park, CO, USA, Golden, CO, NREL-CP-430-7215, 1994, pp.
67-76.
8. Bridgwater, A.V., Cottam, M.-L., Opportunities for biomass pyrolysis liquids
production and upgrading; Energy & Fuels, 1992, 6, pp. 113-120.
9. Oasmaa, A., Czernik, S., Fuel oil quality of biomass pyrolysis oils: state-of-the-
art for the end users; Energy & Fuels, 1999, 13, pp. 914-921.
10. Elliott, D.C., Comparative analysis of gasification/pyrolysis condensates; In
Proceedings of the 1985 Biomass Thermochemical Conversion Contractors
Meeting, Minneapolis, Minnesota, USA, 1985.
11. Antonelli, L., Improvement of pyrolysis products: bio-oil and bio-
carbon/emulsion and slurries; In Energy from Biomass 4, Proceedings of the
Third Contractors Meeting, Paestum, London, Elsevier Applied Science, 1989.
12. Prins, W., Wagenaar, B.M., Review of the rotating cone technology for flash
pyrolysis of biomass; In Biomass gasification and pyrolysis: state of the art and
future prospects, Kaltschmitt, M., Bridgwater, A.V., Eds., CPL Press, Newbury,
UK, 1997, pp. 316-326.
13. Oasmaa, A., Meier, D., Analysis, characterization and test methods of fast
pyrolysis liquids; In Fast pyrolysis of biomass. A handbook, Bridgwater, A.V.,
Ed., CPL Press, 2002, pp. 23-40.
153
14. Oasmaa, A.,Peacocke, C., A guide to physical property characterisation of
biomass-derived pyrolysis liquids; VTT, Technical Research Center of Finland,
Espoo, Finland, 2001, pp. 102.
15. Meier, D., Faix, O., State of the art of applied fast pyrolysis of lignocellulosic
materials - a review; Bioresource Technology, 1999, 68, pp. 71-77.
16. Piskorz, J., Scott, D.S., Radlein, D., Composition of oils obtained by fast
pyrolysis of different woods; In ACS Symposium Series 376: Pyrolysis oils
from biomass producing, analyzing, and upgrading, Soltes, E.J., Milne, T.A.,
Eds., American Chemical Society, Washington, DC, 1988, pp. 167-178.
17. Aguado, R., Olazar, M., San Jose, M.J., Aguirre, G., Bilbao, J., Pyrolysis
sawdust in a conical spouted bed reactor: Yields and product composition; Ind.
Eng. Chem. Res., 2000, 39, pp. 1925-1933.

154
155
Chapter 6
Preliminary Design Calculations for an
Industrial (10 ton/h Intake) Fluid Bed
Pyrolysis Reactor with In-Situ Cleaning of
the Product Vapors (FAFB)
Abstract
Based on knowledge, gained in Chapters 2 to 5 of this thesis, an engineering model
has been developed to estimate the volume of a FAFB reactor for pyrolysis.
Calculations have been done for a system with a throughput of 10 tonnes biomass per
hour. For small particle sized feedstocks ( 1 mm), the required reactor volume of a
FAFB is 13 m3 including the freeboard, compared to 22 m3 for a regular FB. For
larger sized feedstocks intensification is hardly possible, because the lower reaction
rate and therewith the hold-up of reacting particles dominates the reactor design.
Extracting large parts of gases and vapors through the immersed filters does not
result in significantly large intra-bed temperature gradients due to less intense solids
mixing.
156
1. Introduction
A wide variety of reactor designs have been proposed and tested for fast pyrolysis of
biomass (see Chapter 1) after the first investigations concerning a fluidised bed
reactor by Scott and Piskorz [1-6]. In various connected papers [7-15], these concepts
are described in detail. While presenting their specific advantages, usually no results
are given of a proper reactor design including calculations.
Reactor design for the fast pyrolysis process is based on solving mass and energy
balances, first on a particle scale and subsequently on the scale of the entire reactor. A
variety of assumptions may be connected to the model in order to keep it simple and
soluble.
Reactor design simulations are meant primarily to decide on the size/shape of the
reactor and to evaluate its performance for the design conditions. But they are also
used to predict the effects of a change in operating parameters (like temperature and
particle size of the feed) and eventually to define the possible operation window.
As discussed in Chapter 2, the number of publications concerning pyrolysis reactor
design and modelling is limited. The models, developed and discussed so far, were
meant rather to understand some specific aspects of the reactor operation than to
design a reactor completely in relation to a full-scale process.
In this chapter, a model of the proposed fluid bed pyrolysis reactor with in-situ
cleaning of the produced vapors is described. This system is further indicated by the
abbreviation FAFB (Filter-Assisted Fluid Bed). The intention is to determine the
required reactor volume and to evaluate the performance as a function of the size of
the feed particles for a plant with an intake of 10 ton biomass per hour. The FAFB
systems are compared with regular fluid beds without filtering. An intake of 10 ton
per hour is chosen on the basis of economical/logistic reasons related to the transport
costs of raw biomass to the plant in the oil producing countries.
2. FAFB Design Criteria
The proposed reactor is based on fluid bed technology. Up to now, many reactor types
have been applied in biomass pyrolysis processes. Fluidized beds are suitable for
biomass pyrolysis because of the following advantages:
157
- High feedstock flexibility, especially in particle size and sorts;
- Intensive heat transfer rate, leading to nearly isothermal conditions;
- Rapid removal of produced pyrolysis vapors from the reaction zone.
Of course, in a regular fluidized bed a large amount of gas (inert or recycled product
gas in most cases) is needed to fluidize the solid particles. This dilutes the gaseous
products and consequently increases the load of the bio-oil condensation system. A
practical solution employed in the FAFB concept is to use a conical bottom section to
decrease the amount of the fluidization gas as much as possible. When doing so, in
principle, no additional gas supply is required during steady state operation, because
the bed is fluidized by the produced vapors and permanent gases.
Below, the main choices made in this preliminary design are discussed per item:
Particle Size of the Feedstock
The rising velocity of wood particles ( = 600 kg/m3) of different size has been
measured in a fluid bed (h=30 cm). It has been observed that large particles ( = 600
kg/m3, dp > 7 mm) fed to the bottom of a lab-scale fluid bed rise with a constant
velocity and once arrived at the top, do not mix back easily. The rising velocity of
these particles lies in the range of 10 to 30 cm/s. Although measured in a lab-scale
fluid bed, these values are also used for the industrial size as a conservative estimate.
This leads to a rising time in an industrial scale reactor (3 – 4 meters high) of 10 to 40
s, which is much less than the conversion time of larger particles (see Chapters 2 and
3). As a result, an undesired accumulation of partially converted feedstock on top of
the bed occurs. In this case, most of the conversion takes place near the bed surface
causing a non-uniform, local vapor production and heat demand. It has been observed
visually that wood particles with a size of up to 5 mm mix rather well with the fluid
bed particles under pyrolysis conditions (see Appendix 1). In this case, the vapors are
produced more or less uniformly over the bed’s volume and consequently also the
heat demand is spatially uniform. For these reasons the particle size of the feedstock is
limited to 5 mm in this design.
Velocity at the Top of the Bed
According to the results presented in Chapter 4, the superficial velocity at the top of
the bed must be larger than 7 x Umf to provide a good solids mixing (is important for a
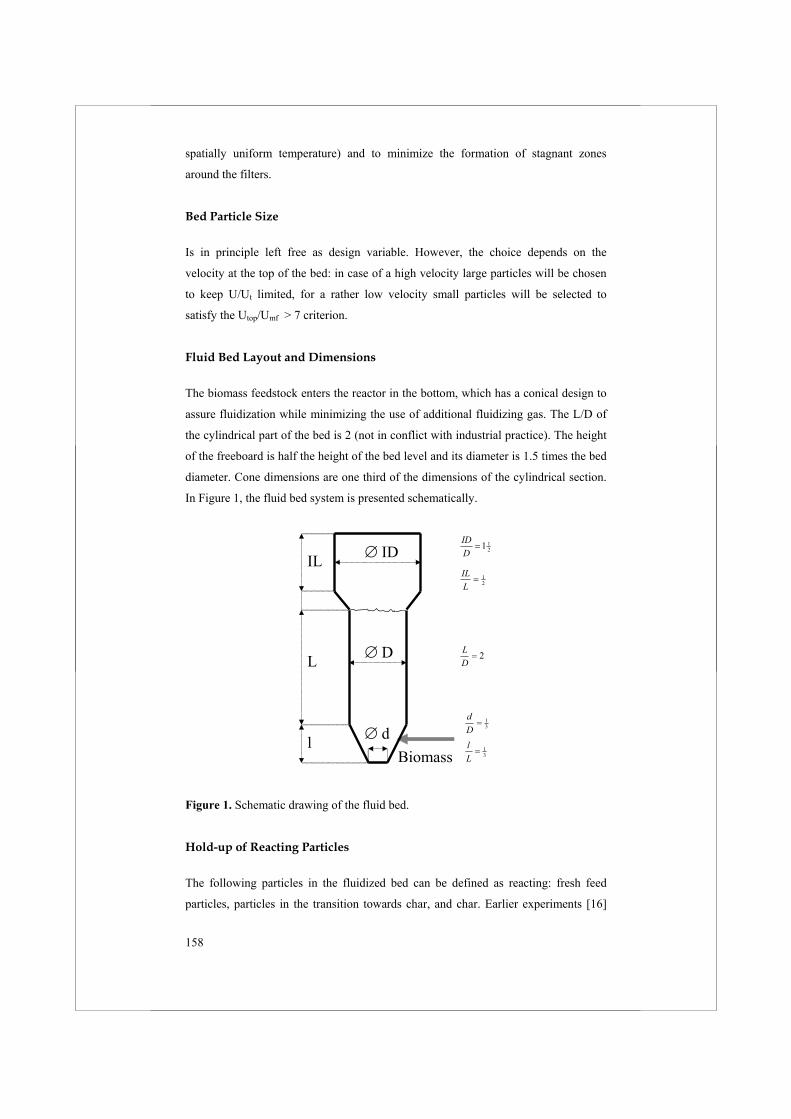
158
spatially uniform temperature) and to minimize the formation of stagnant zones
around the filters.
Bed Particle Size
Is in principle left free as design variable. However, the choice depends on the
velocity at the top of the bed: in case of a high velocity large particles will be chosen
to keep U/Ut limited, for a rather low velocity small particles will be selected to
satisfy the Utop/Umf > 7 criterion.
Fluid Bed Layout and Dimensions
The biomass feedstock enters the reactor in the bottom, which has a conical design to
assure fluidization while minimizing the use of additional fluidizing gas. The L/D of
the cylindrical part of the bed is 2 (not in conflict with industrial practice). The height
of the freeboard is half the height of the bed level and its diameter is 1.5 times the bed
diameter. Cone dimensions are one third of the dimensions of the cylindrical section.
In Figure 1, the fluid bed system is presented schematically.
dl
DL
IDIL
Biomass
211
DID
21
LIL
2DL
31
Dd
31
Ll
Figure 1. Schematic drawing of the fluid bed.
Hold-up of Reacting Particles
The following particles in the fluidized bed can be defined as reacting: fresh feed
particles, particles in the transition towards char, and char. Earlier experiments [16]
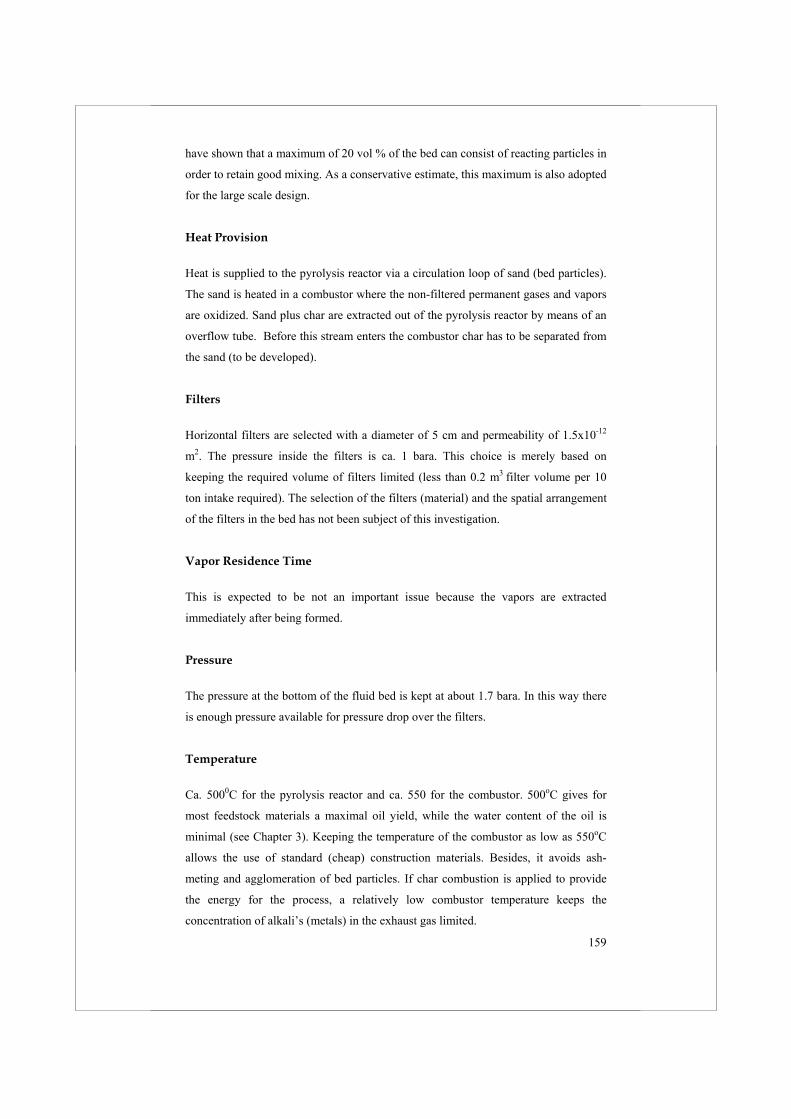
159
have shown that a maximum of 20 vol % of the bed can consist of reacting particles in
order to retain good mixing. As a conservative estimate, this maximum is also adopted
for the large scale design.
Heat Provision
Heat is supplied to the pyrolysis reactor via a circulation loop of sand (bed particles).
The sand is heated in a combustor where the non-filtered permanent gases and vapors
are oxidized. Sand plus char are extracted out of the pyrolysis reactor by means of an
overflow tube. Before this stream enters the combustor char has to be separated from
the sand (to be developed).
Filters
Horizontal filters are selected with a diameter of 5 cm and permeability of 1.5x10⁻¹²
m2. The pressure inside the filters is ca. 1 bara. This choice is merely based on
keeping the required volume of filters limited (less than 0.2 m3 filter volume per 10
ton intake required). The selection of the filters (material) and the spatial arrangement
of the filters in the bed has not been subject of this investigation.
Vapor Residence Time
This is expected to be not an important issue because the vapors are extracted
immediately after being formed.
Pressure
The pressure at the bottom of the fluid bed is kept at about 1.7 bara. In this way there
is enough pressure available for pressure drop over the filters.
Temperature
Ca. 5000C for the pyrolysis reactor and ca. 550 for the combustor. 500oC gives for
most feedstock materials a maximal oil yield, while the water content of the oil is
minimal (see Chapter 3). Keeping the temperature of the combustor as low as 550oC
allows the use of standard (cheap) construction materials. Besides, it avoids ash-
meting and agglomeration of bed particles. If char combustion is applied to provide
the energy for the process, a relatively low combustor temperature keeps the
concentration of alkali’s (metals) in the exhaust gas limited.
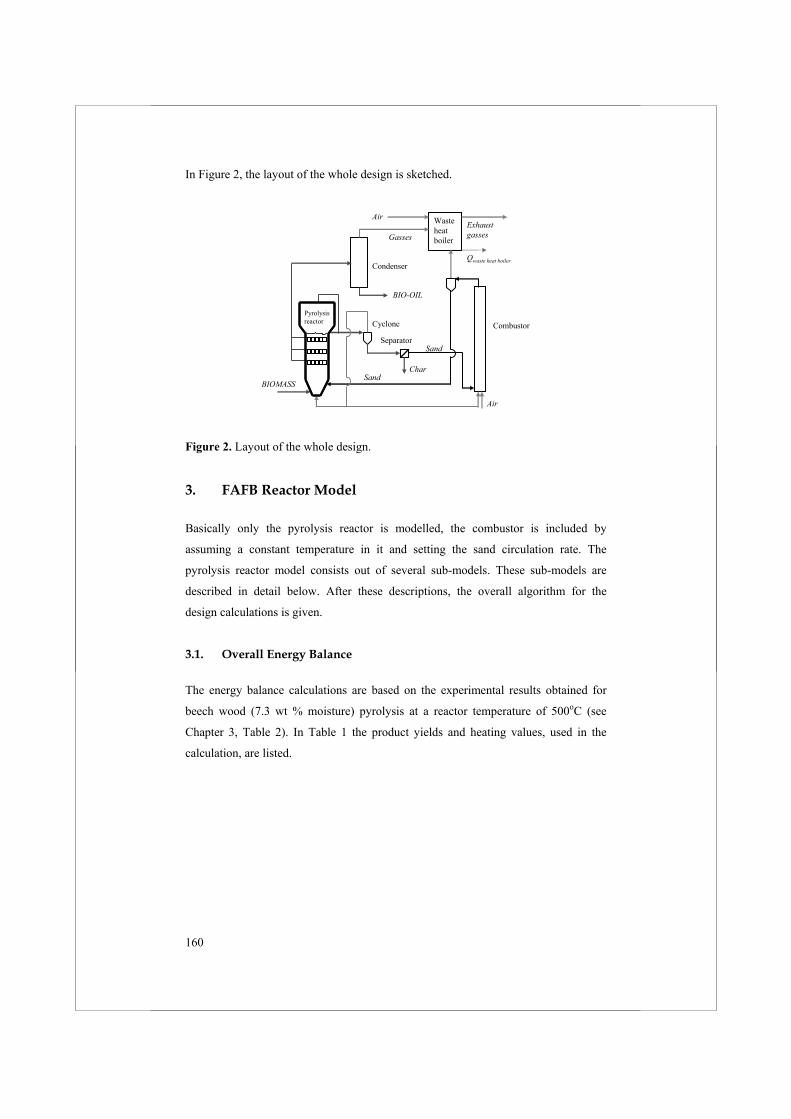
160
In Figure 2, the layout of the whole design is sketched.
Cyclone
Separator
CombustorPyrolysisreactor
Condenser
Sand
CharSand
BIO-OIL
BIOMASS
Wasteheatboiler
Exhaustgasses
Qwaste heat boiler
Air
Gasses
Air
Figure 2. Layout of the whole design.
3. FAFB Reactor Model
Basically only the pyrolysis reactor is modelled, the combustor is included by
assuming a constant temperature in it and setting the sand circulation rate. The
pyrolysis reactor model consists out of several sub-models. These sub-models are
described in detail below. After these descriptions, the overall algorithm for the
design calculations is given.
3.1. Overall Energy Balance
The energy balance calculations are based on the experimental results obtained for
beech wood (7.3 wt % moisture) pyrolysis at a reactor temperature of 500oC (see
Chapter 3, Table 2). In Table 1 the product yields and heating values, used in the
calculation, are listed.
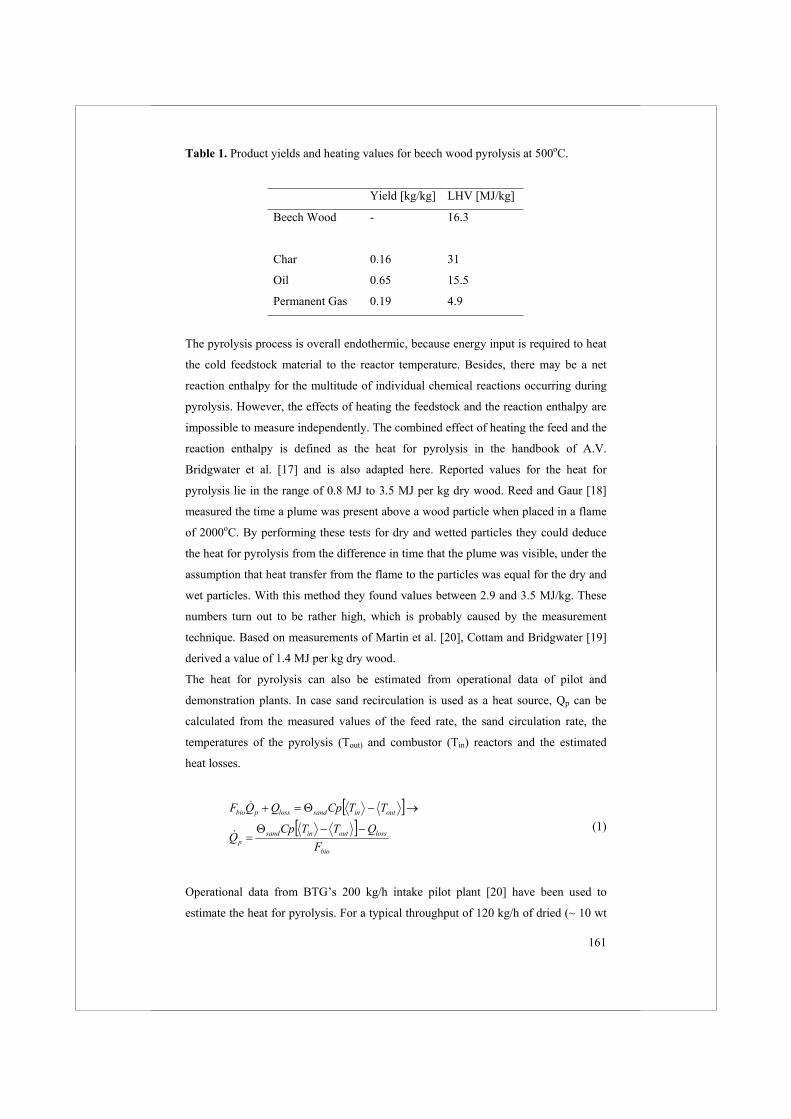
161
Table 1. Product yields and heating values for beech wood pyrolysis at 500oC.
Yield [kg/kg] LHV [MJ/kg]
Beech Wood - 16.3
Char 0.16 31
Oil 0.65 15.5
Permanent Gas 0.19 4.9
The pyrolysis process is overall endothermic, because energy input is required to heat
the cold feedstock material to the reactor temperature. Besides, there may be a net
reaction enthalpy for the multitude of individual chemical reactions occurring during
pyrolysis. However, the effects of heating the feedstock and the reaction enthalpy are
impossible to measure independently. The combined effect of heating the feed and the
reaction enthalpy is defined as the heat for pyrolysis in the handbook of A.V.
Bridgwater et al. [17] and is also adapted here. Reported values for the heat for
pyrolysis lie in the range of 0.8 MJ to 3.5 MJ per kg dry wood. Reed and Gaur [18]
measured the time a plume was present above a wood particle when placed in a flame
of 2000oC. By performing these tests for dry and wetted particles they could deduce
the heat for pyrolysis from the difference in time that the plume was visible, under the
assumption that heat transfer from the flame to the particles was equal for the dry and
wet particles. With this method they found values between 2.9 and 3.5 MJ/kg. These
numbers turn out to be rather high, which is probably caused by the measurement
technique. Based on measurements of Martin et al. [20], Cottam and Bridgwater [19]
derived a value of 1.4 MJ per kg dry wood.
The heat for pyrolysis can also be estimated from operational data of pilot and
demonstration plants. In case sand recirculation is used as a heat source, Qp can be
calculated from the measured values of the feed rate, the sand circulation rate, the
temperatures of the pyrolysis (Tout) and combustor (Tin) reactors and the estimated
heat losses.
bio
lossoutinsandp
outinsandlosspbio
FQTTCp
Q
TTCpQQF (1)
Operational data from BTG’s 200 kg/h intake pilot plant [20] have been used to
estimate the heat for pyrolysis. For a typical throughput of 120 kg/h of dried (~ 10 wt
162
% moisture) pine or beech wood, the sand circulation rate is 3600 kg/h and the
temperature difference between the combustor and the pyrolysis reactor is 50oC.
When neglecting the heat losses (the plant is well isolated), these data indicate that the
heat for pyrolysis for dry pine or beech wood is 1.2 MJ/kg.
The heat for pyrolysis is an essential property for the design of a pyrolysis plant. It
affects the choice of reactor system and the degree of heat integration in terms of
selecting the by-products to be burned for heat generation. Results will be presented
for a range of 1.0 - 2.5 MJ/kg. For a more detailed analysis a conservative estimate
from the pilot plant data of 1.5 MJ/kg is used, which is also used further in the design
calculations.
Energy balance calculations have been done for three process alternatives:
a) Char is burned to deliver the heat for pyrolysis and the produced permanent
gases are fed to a waste heat boiler (Qwaste heat boiler). In the combustor, steam
pipes are installed to produce steam from the energy surplus (Qsteam). The vapors
leaving the reactor via the cyclone are either considered to be a different product
or are recycled (with the permanent gases) and fed back to the reactor;
b) All produced permanent (non-condensable) gases are burned to deliver the heat
for pyrolysis. Char is collected and considered as a product of the process that is
sold on the market just like pyrolysis oil. The vapors leaving the reactor via the
cyclone are either considered to be a different product or are recycled (with the
permanent gases) and fed back to the reactor;
c) The part of the permanent gases and vapors that is not extracted via the filters
from the reactor is burned to deliver the heat for pyrolysis. If the amount of
energy in the permanent gases and vapors leaving the cyclone exceeds the
required heat for pyrolysis, the surplus is recycled to the reactor. The permanent
gases leaving the condenser are fed to a waste heat boiler. Char is collected and
considered as a product of the process.
These cases are also schematically drawn in Figure 3.
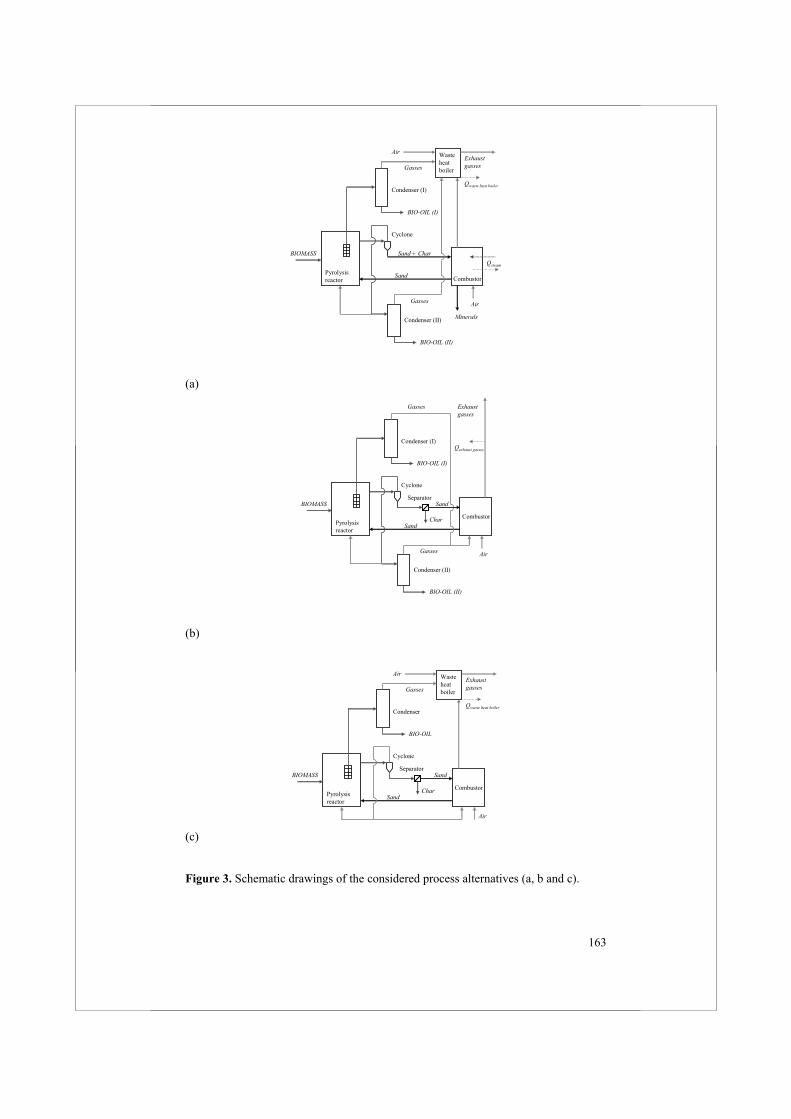
163
Cyclone
CombustorPyrolysisreactor
Condenser (I)
Wasteheatboiler
Sand + Char
Sand
Air
ExhaustgassesGasses
Qwaste heat boiler
BIO-OIL (I)
BIOMASS
BIO-OIL (II)
Condenser (II)
Qsteam
Gasses
Minerals
Air
(a)
Cyclone
CombustorPyrolysisreactor
Condenser (I)
Sand
Exhaustgasses
Gasses
BIO-OIL (I)
BIOMASS
BIO-OIL (II)
Condenser (II)
Char
SeparatorSand
Gasses
Qexhaust gasses
Air
(b)
Cyclone
Separator
CombustorPyrolysisreactor
Condenser
Sand
CharSand
BIO-OIL
BIOMASS
Wasteheatboiler
Exhaustgasses
Qwaste heat boiler
Air
Gasses
Air
(c)
Figure 3. Schematic drawings of the considered process alternatives (a, b and c).
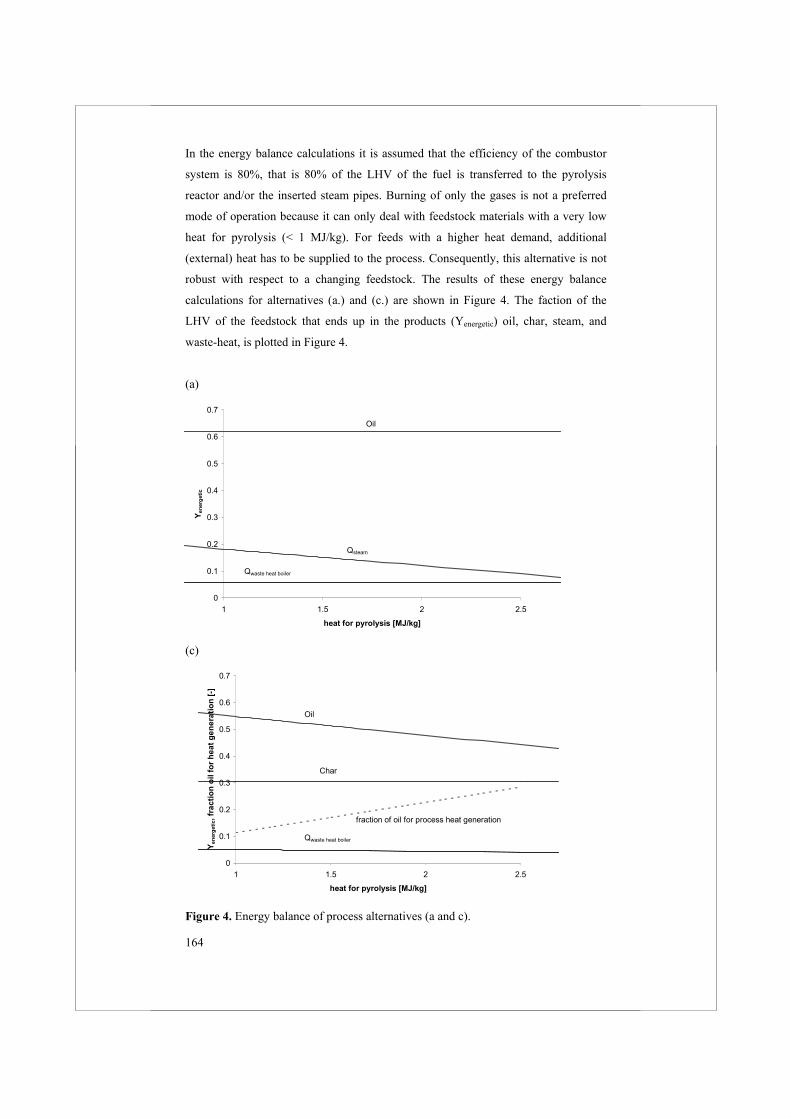
164
In the energy balance calculations it is assumed that the efficiency of the combustor
system is 80%, that is 80% of the LHV of the fuel is transferred to the pyrolysis
reactor and/or the inserted steam pipes. Burning of only the gases is not a preferred
mode of operation because it can only deal with feedstock materials with a very low
heat for pyrolysis (< 1 MJ/kg). For feeds with a higher heat demand, additional
(external) heat has to be supplied to the process. Consequently, this alternative is not
robust with respect to a changing feedstock. The results of these energy balance
calculations for alternatives (a.) and (c.) are shown in Figure 4. The faction of the
LHV of the feedstock that ends up in the products (Yenergetic) oil, char, steam, and
waste-heat, is plotted in Figure 4.
(a)
0
0.1
0.2
0.3
0.4
0.5
0.6
0.7
1 1.5 2 2.5
heat for pyrolysis [MJ/kg]
Y ene
rget
ic
Oil
Qsteam
Qwaste heat boiler
(c)
0
0.1
0.2
0.3
0.4
0.5
0.6
0.7
1 1.5 2 2.5
heat for pyrolysis [MJ/kg]
Y ene
rget
ic, f
ract
ion
oil f
or h
eat g
ener
atio
n [-]
Oil
Qwaste heat boiler
Char
fraction of oil for process heat generation
Figure 4. Energy balance of process alternatives (a and c).
165
The energy balances of the process alternative are assessed according to the following
criteria:
Value of the energetic yields of the products being in increasing order of value
Qwaste heat boiler, Qsteam, char and oil;
Robustness with respect to the delivery of heat for pyrolysis. This criterion
evaluates if the heat for pyrolysis can also be delivered if the feedstock and/or
the product distribution changes;
Technical feasibility.
Burning the char gives the highest oil yield and is very robust. The amount of heat
generated by combustion of the char is more than enough to run the endothermic
pyrolysis process. Therefore any changes in the feedstock (composition, moisture
content) and/or product distribution can be easily dealt with from an energy balance
point of view. Also the technical feasibility of this process is good. The only expected
problem is the accumulation of minerals in the system.
Using the part of the vapors and permanent gases that is not extracted via the filters to
provide the energy required for the pyrolysis process is an interesting alternative.
Obviously, the oil yield is lower compared to the alternative (a: combustion of char)
but not drastically. In this alternative, next to oil, a second high-valued product (char)
is produced, increasing the value of the total product slate. For an estimated heat for
pyrolysis of 1.5 MJ/kg, the yield of oil plus char adds up to 82% on energy basis (oil
= 51%, char 31%). Under these conditions, 83% of the produced vapors and
permanent gases have to be extracted via the filters. On lab-scale, it has been found
that this does not cause malfunctioning of the fluid bed as long as the velocity at the
top of the bed exceeds 7 x Umf (see Chapter 4). With respect to robustness of heat
supply this scheme has no problems. When the heat for pyrolysis increases for
instance, auto-thermal operation can be easily attained by increasing the amount of
extracted vapors and gases. Another benefit of this scheme is that the combustor can
be relative small because gases are combusted instead of char. Char combustion rates
are very low compared to gas combustion rates because they are controlled by mass
transport when using particles larger than 2 mm [21]. A drawback of this system is
that it requires a dedicated device to remove char from the system
166
Concluding, burning char gives the highest oil yield and its technology is developed.
Burning part of the vapors and the permanent gases, as in the proposed fluid bed with
in-situ filtering, lowers the oil yield a bit but gives a second high-valued product,
namely char. Char is an interesting side product in the oil producing countries, where
it is used as fertilizer. However, from a technological point of view, this alternative
has some challenges.
In the investigated design, the vapors and gases that are not extracted via the filters
are used to provide the heat. When assuming a heat for pyrolysis of 1.5 MJ/kg this
results in extracting 83% of the produced vapors and gases via the filters.
3.2 Energy Balance of the Pyrolysis Reactor
The system under consideration is large enough to assume a negligible relative heat
loss to the environment. Therefore, the macroscopic energy balance over the reactor
can be simplified to:
bio
sand
outinsandp
F
TTCpQ (2)
In this equation, Tin is the temperature of the hot sand coming from the combustor and
Tout the temperature of the sand leaving the pyrolysis reactor to the combustor. For the
microscopic energy balance over the reactor, the following assumptions have been
made:
The biomass (reacting) particles are distributed spatial uniformly in the reactor
leading to a spatial uniform volumetric heat for pyrolysis (Qp);
bed
pbiop V
QFQ (3)
Hot sand enters the reactor at the bottom (x = 0) and the cooled-down sand
leaves the reactor from the top of the bed level (x = L), or visa versa which
comes down to a similar mathematical model;
The flow of the sand through the reactor can be described with the standard axial
dispersion model;
167
The heat for pyrolysis is constant. Obviously this is not the case in practice, but
the model is applied only for a pyrolysis reactor operated at ca. 500oC with an
intra bed temperature gradient smaller than 50oC;
Additional fluidization gas is not required during stationary operation due to the
conical bottom section;
The conical section is not modelled. This section is intensely mixed and is
assumed to be of uniform temperature.
The microscopic energy balance becomes then:
r
biosand
psandsand
AFu
QdxdTCpu
dxTdCpD 02
2
(4)
By introducing the following dimensionless numbers:
CpDLQ
QD
LuPeLx p
p
2
,,
Equation 3 can be rewritten to:
02
2
pQddTPe
dTd (5)
Using the boundary conditions as proposed by Danckwerts [22]:
)0(1)0(
0)1(
ddT
PeTT
ddT
in
(6)
Equation 5 can be solved yielding:
PeePee
PeQ
TT Pe
Pep
in1)( (7)
168
With Equation 6, the axial temperature distribution inside the fluid bed can be
calculated. The intra-bed temperature gradient defined as [T( =0)-T( =1)] is then
given by:
PeePePeQ
TT Pep 111)]1()0([ (8)
The axial averaged bed temperature can be calculated from:
PeePePePeQ
Td
dTT Pe
pin
12111)(
)( 221
0
1
0 (9)
With Equations 2, 8 and 9, an intra-bed temperature gradient and the average
pyrolysis bed temperature can be calculated for a given combustor exit temperature
(inlet temperature of solids entering the pyrolysis FB, Tin), sand flux ratio ( ) and
pyrolysis reactor geometry. Alternatively, the required combustor exit temperature
can be calculated for a certain desired average pyrolysis bed temperature.
In Figure 5, the temperature profiles inside a regular fluid bed pyrolysis reactor
(without filtering) with an intake of 10 tons per hour are given as function of the
mixing intensity (Pe-number). A very conservative estimate of 2 MJ/kg for the heat
for pyrolysis is used. The volume of the bed is ca. 8 m3 leading to a volumetric heat
for pyrolysis (Qp) of 0.72 MJ/m3 bed. For the sand recirculation rate over the biomass
feed rate ratio, , 50 has been taken. The combustor operates at 550oC.
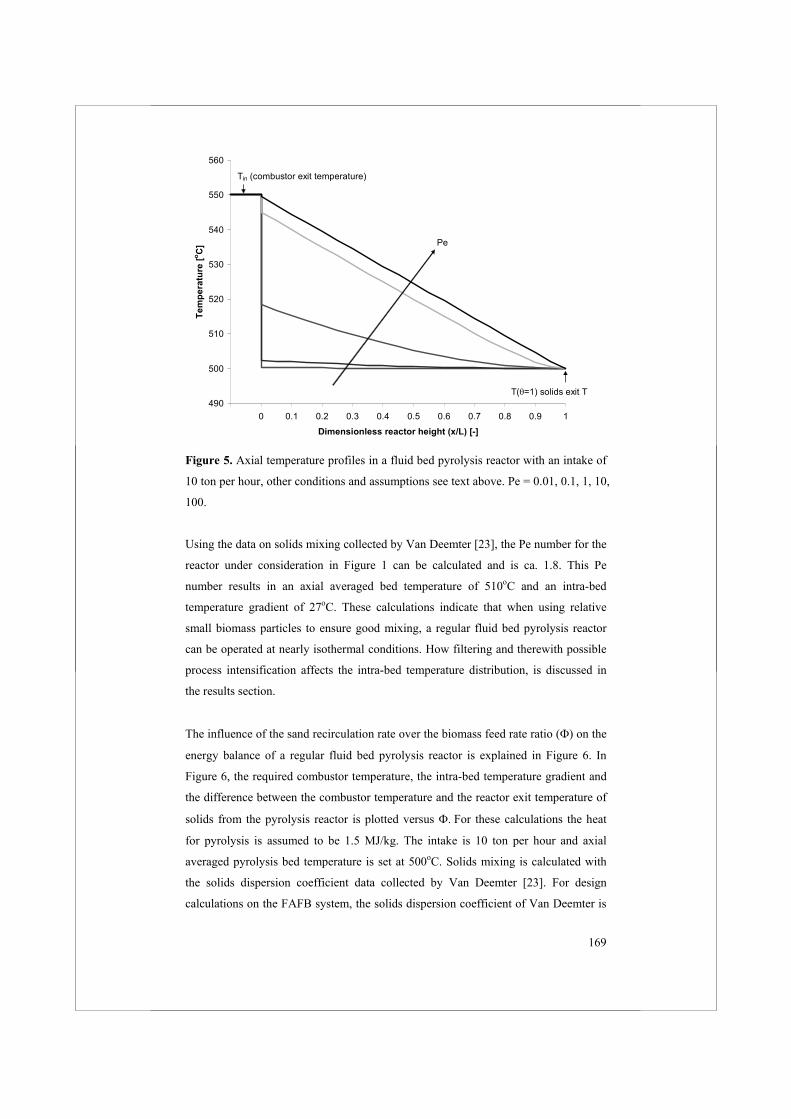
169
490
500
510
520
530
540
550
560
-0.1 0 0.1 0.2 0.3 0.4 0.5 0.6 0.7 0.8 0.9 1
Dimensionless reactor height (x/L) [-]
Tem
pera
ture
[o C]
Tin (combustor exit temperature)
Pe
T( =1) solids exit T
Figure 5. Axial temperature profiles in a fluid bed pyrolysis reactor with an intake of
10 ton per hour, other conditions and assumptions see text above. Pe = 0.01, 0.1, 1, 10,
100.
Using the data on solids mixing collected by Van Deemter [23], the Pe number for the
reactor under consideration in Figure 1 can be calculated and is ca. 1.8. This Pe
number results in an axial averaged bed temperature of 510oC and an intra-bed
temperature gradient of 27oC. These calculations indicate that when using relative
small biomass particles to ensure good mixing, a regular fluid bed pyrolysis reactor
can be operated at nearly isothermal conditions. How filtering and therewith possible
process intensification affects the intra-bed temperature distribution, is discussed in
the results section.
The influence of the sand recirculation rate over the biomass feed rate ratio ( ) on the
energy balance of a regular fluid bed pyrolysis reactor is explained in Figure 6. In
Figure 6, the required combustor temperature, the intra-bed temperature gradient and
the difference between the combustor temperature and the reactor exit temperature of
solids from the pyrolysis reactor is plotted versus For these calculations the heat
for pyrolysis is assumed to be 1.5 MJ/kg. The intake is 10 ton per hour and axial
averaged pyrolysis bed temperature is set at 500oC. Solids mixing is calculated with
the solids dispersion coefficient data collected by Van Deemter [23]. For design
calculations on the FAFB system, the solids dispersion coefficient of Van Deemter is
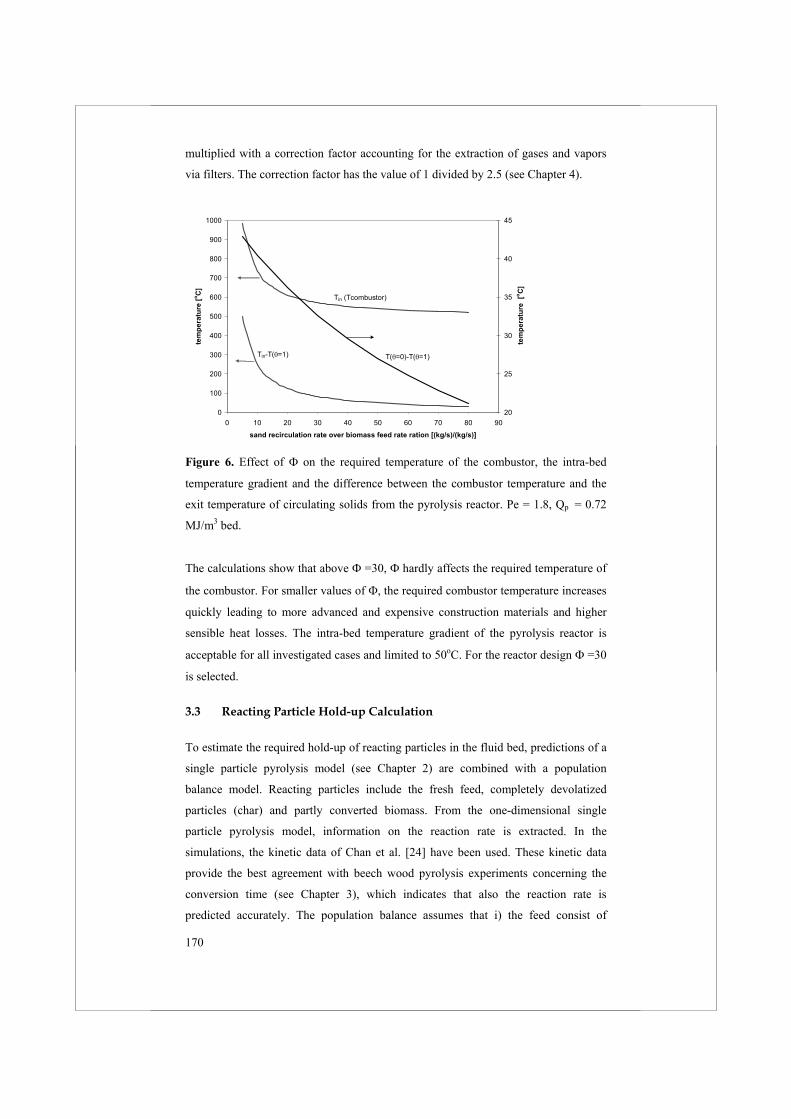
170
multiplied with a correction factor accounting for the extraction of gases and vapors
via filters. The correction factor has the value of 1 divided by 2.5 (see Chapter 4).
0
100
200
300
400
500
600
700
800
900
1000
0 10 20 30 40 50 60 70 80 90
sand recirculation rate over biomass feed rate ration [(kg/s)/(kg/s)]
tem
pera
ture
[o C]
20
25
30
35
40
45
tem
pera
ture
[o C
]
T( =0)-T( =1)Tin-T( =1)
Tin (Tcombustor)
Figure 6. Effect of on the required temperature of the combustor, the intra-bed
temperature gradient and the difference between the combustor temperature and the
exit temperature of circulating solids from the pyrolysis reactor. Pe = 1.8, Qp = 0.72
MJ/m3 bed.
The calculations show that above =30, hardly affects the required temperature of
the combustor. For smaller values of the required combustor temperature increases
quickly leading to more advanced and expensive construction materials and higher
sensible heat losses. The intra-bed temperature gradient of the pyrolysis reactor is
acceptable for all investigated cases and limited to 50oC. For the reactor design =30
is selected.
3.3 Reacting Particle Hold-up Calculation
To estimate the required hold-up of reacting particles in the fluid bed, predictions of a
single particle pyrolysis model (see Chapter 2) are combined with a population
balance model. Reacting particles include the fresh feed, completely devolatized
particles (char) and partly converted biomass. From the one-dimensional single
particle pyrolysis model, information on the reaction rate is extracted. In the
simulations, the kinetic data of Chan et al. [24] have been used. These kinetic data
provide the best agreement with beech wood pyrolysis experiments concerning the
conversion time (see Chapter 3), which indicates that also the reaction rate is
predicted accurately. The population balance assumes that i) the feed consist of
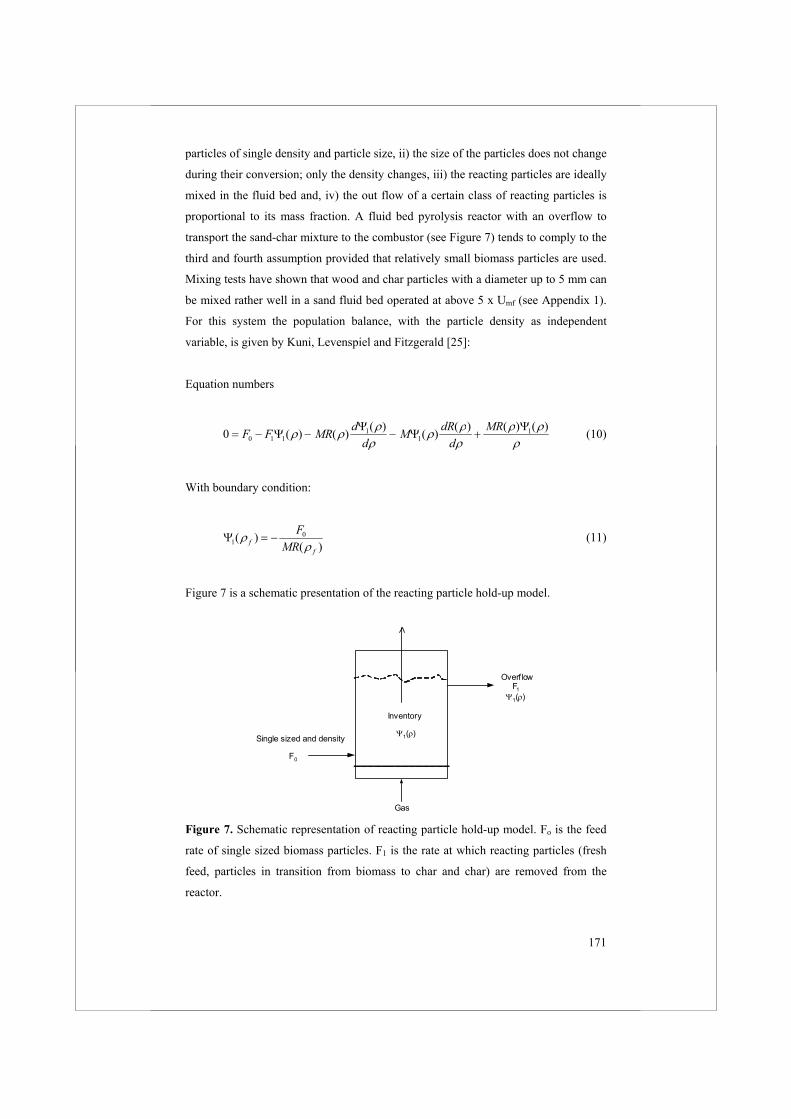
171
particles of single density and particle size, ii) the size of the particles does not change
during their conversion; only the density changes, iii) the reacting particles are ideally
mixed in the fluid bed and, iv) the out flow of a certain class of reacting particles is
proportional to its mass fraction. A fluid bed pyrolysis reactor with an overflow to
transport the sand-char mixture to the combustor (see Figure 7) tends to comply to the
third and fourth assumption provided that relatively small biomass particles are used.
Mixing tests have shown that wood and char particles with a diameter up to 5 mm can
be mixed rather well in a sand fluid bed operated at above 5 x Umf (see Appendix 1).
For this system the population balance, with the particle density as independent
variable, is given by Kuni, Levenspiel and Fitzgerald [25]:
Equation numbers
0 0 1 11
11F F MR d
dM dR
dMR( ) ( ) ( ) ( ) ( ) ( ) ( ) (10)
With boundary condition:
10( )( )f
f
FMR
(11)
Figure 7 is a schematic presentation of the reacting particle hold-up model.
Single sized and density
F0
OverflowF1
Inventory
1( )
Gas
1( )
Figure 7. Schematic representation of reacting particle hold-up model. Fo is the feed
rate of single sized biomass particles. F1 is the rate at which reacting particles (fresh
feed, particles in transition from biomass to char and char) are removed from the
reactor.
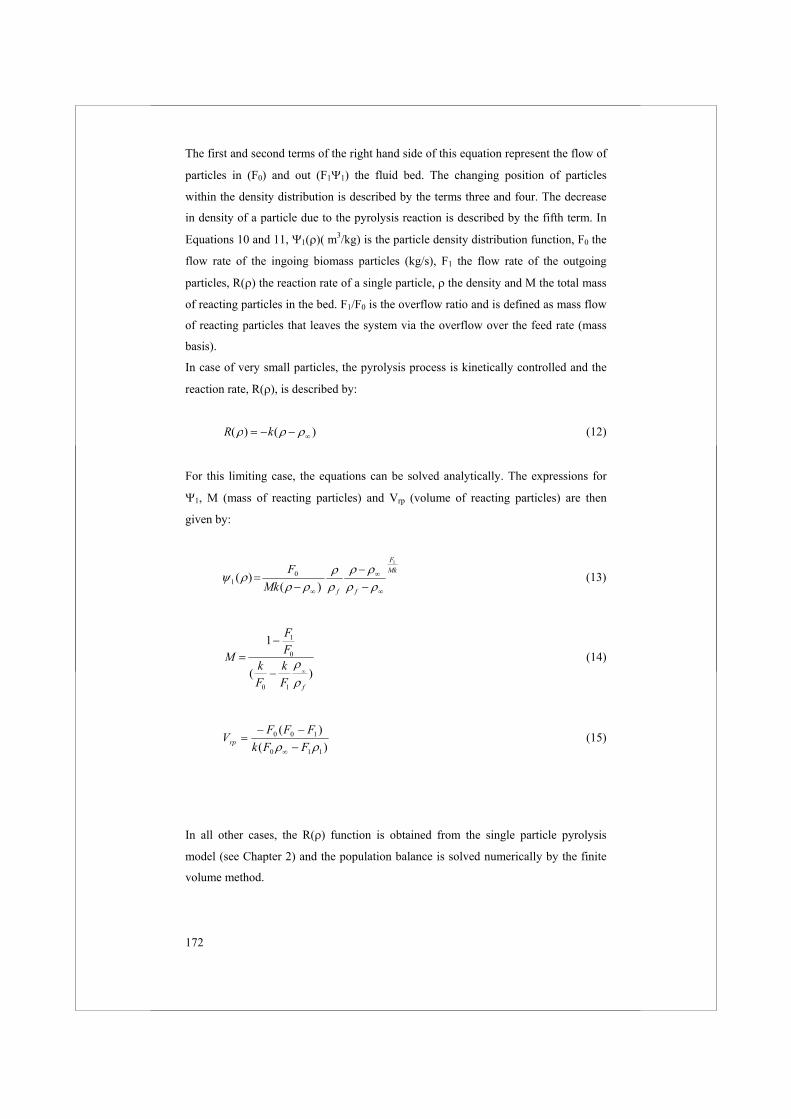
172
The first and second terms of the right hand side of this equation represent the flow of
particles in (F0) and out (F1 the fluid bed. The changing position of particles
within the density distribution is described by the terms three and four. The decrease
in density of a particle due to the pyrolysis reaction is described by the fifth term. In
Equations 10 and 11, m3/kg) is the particle density distribution function, F0 the
flow rate of the ingoing biomass particles (kg/s), F1 the flow rate of the outgoing
particles, R( ) the reaction rate of a single particle, the density and M the total mass
of reacting particles in the bed. F1/F0 is the overflow ratio and is defined as mass flow
of reacting particles that leaves the system via the overflow over the feed rate (mass
basis).
In case of very small particles, the pyrolysis process is kinetically controlled and the
reaction rate, R( ), is described by:
R k( ) ( ) (12)
For this limiting case, the equations can be solved analytically. The expressions for
, M (mass of reacting particles) and Vrp (volume of reacting particles) are then
given by:
MkF
ffMkF
1
)()( 0
1 (13)
M
FF
kF
kF f
1 1
0
0 1
( ) (14)
)()(
110
100
FFkFFF
Vrp (15)
In all other cases, the R( ) function is obtained from the single particle pyrolysis
model (see Chapter 2) and the population balance is solved numerically by the finite
volume method.
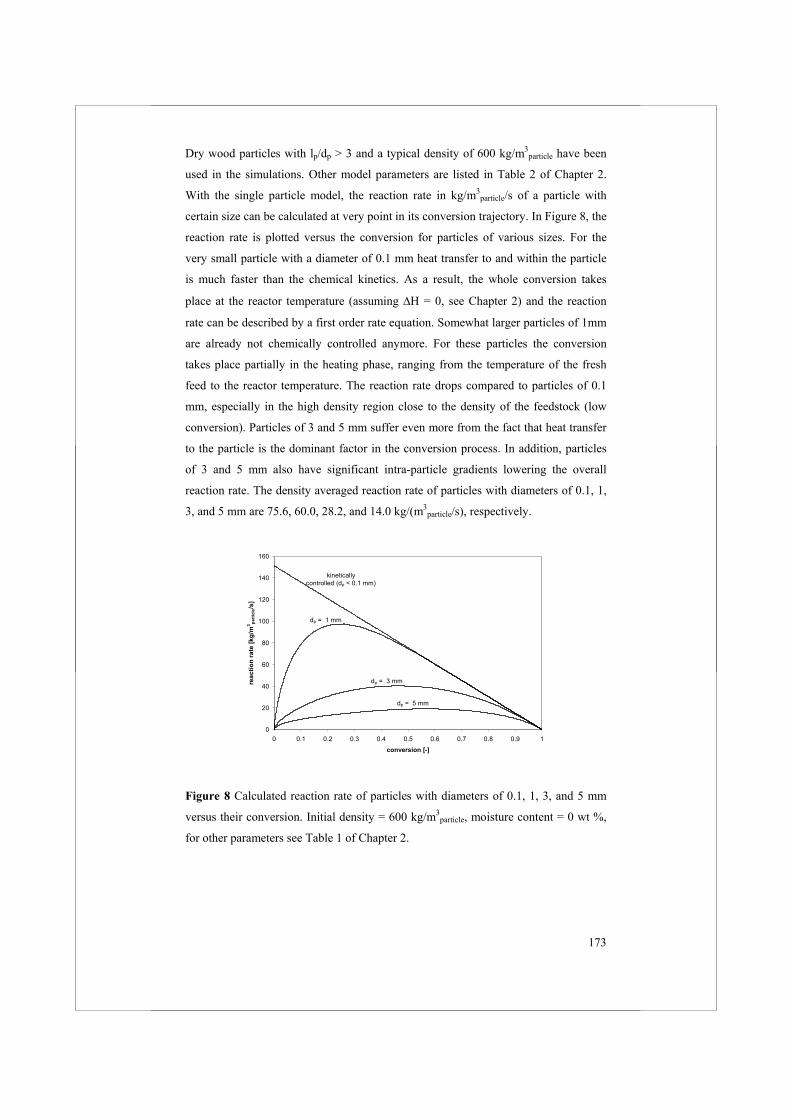
173
Dry wood particles with lp/dp > 3 and a typical density of 600 kg/m3particle have been
used in the simulations. Other model parameters are listed in Table 2 of Chapter 2.
With the single particle model, the reaction rate in kg/m3particle/s of a particle with
certain size can be calculated at very point in its conversion trajectory. In Figure 8, the
reaction rate is plotted versus the conversion for particles of various sizes. For the
very small particle with a diameter of 0.1 mm heat transfer to and within the particle
is much faster than the chemical kinetics. As a result, the whole conversion takes
place at the reactor temperature (assuming H = 0, see Chapter 2) and the reaction
rate can be described by a first order rate equation. Somewhat larger particles of 1mm
are already not chemically controlled anymore. For these particles the conversion
takes place partially in the heating phase, ranging from the temperature of the fresh
feed to the reactor temperature. The reaction rate drops compared to particles of 0.1
mm, especially in the high density region close to the density of the feedstock (low
conversion). Particles of 3 and 5 mm suffer even more from the fact that heat transfer
to the particle is the dominant factor in the conversion process. In addition, particles
of 3 and 5 mm also have significant intra-particle gradients lowering the overall
reaction rate. The density averaged reaction rate of particles with diameters of 0.1, 1,
3, and 5 mm are 75.6, 60.0, 28.2, and 14.0 kg/(m3particle/s), respectively.
0
20
40
60
80
100
120
140
160
0 0.1 0.2 0.3 0.4 0.5 0.6 0.7 0.8 0.9 1
conversion [-]
reac
tion
rate
[kg/
m3 pa
rtic
le/s
]
kinetically controlled (dp < 0.1 mm)
dp = 1 mm
dp = 3 mm
dp = 5 mm
Figure 8 Calculated reaction rate of particles with diameters of 0.1, 1, 3, and 5 mm
versus their conversion. Initial density = 600 kg/m3particle, moisture content = 0 wt %,
for other parameters see Table 1 of Chapter 2.
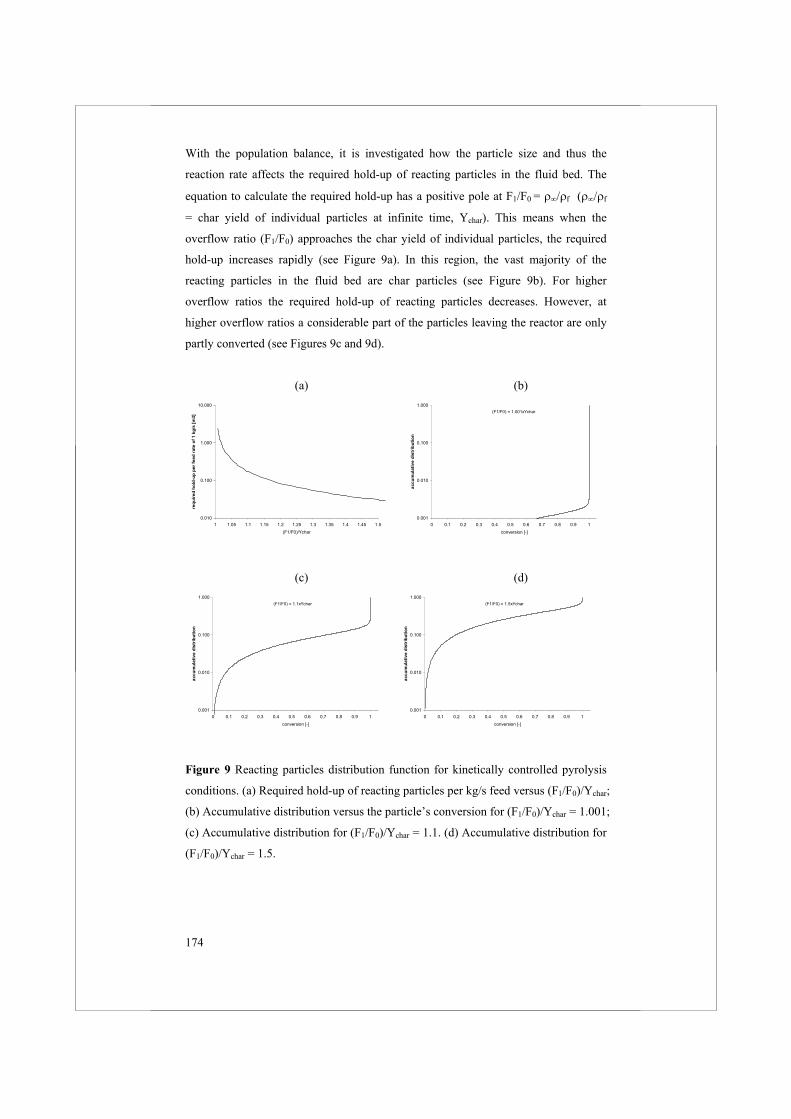
174
With the population balance, it is investigated how the particle size and thus the
reaction rate affects the required hold-up of reacting particles in the fluid bed. The
equation to calculate the required hold-up has a positive pole at F1/F0 = / f ( / f
= char yield of individual particles at infinite time, Ychar). This means when the
overflow ratio (F1/F0) approaches the char yield of individual particles, the required
hold-up increases rapidly (see Figure 9a). In this region, the vast majority of the
reacting particles in the fluid bed are char particles (see Figure 9b). For higher
overflow ratios the required hold-up of reacting particles decreases. However, at
higher overflow ratios a considerable part of the particles leaving the reactor are only
partly converted (see Figures 9c and 9d).
(a) (b)
0.010
0.100
1.000
10.000
1 1.05 1.1 1.15 1.2 1.25 1.3 1.35 1.4 1.45 1.5(F1/F0)/Ychar
requ
ired
hold
-up
per f
eed
rate
of 1
kg/
s [m
3]
0.001
0.010
0.100
1.000
0 0.1 0.2 0.3 0.4 0.5 0.6 0.7 0.8 0.9 1conversion [-]
accu
mul
ativ
e di
strib
utio
n (F1/F0) = 1.001xYchar
(c) (d)
0.001
0.010
0.100
1.000
0 0.1 0.2 0.3 0.4 0.5 0.6 0.7 0.8 0.9 1conversion [-]
accu
mul
ativ
e di
strib
utio
n
(F1/F0) = 1.1xYchar
0.001
0.010
0.100
1.000
0 0.1 0.2 0.3 0.4 0.5 0.6 0.7 0.8 0.9 1conversion [-]
accu
mul
ativ
e di
strib
utio
n
(F1/F0) = 1.5xYchar
Figure 9 Reacting particles distribution function for kinetically controlled pyrolysis
conditions. (a) Required hold-up of reacting particles per kg/s feed versus (F1/F0)/Ychar;
(b) Accumulative distribution versus the particle’s conversion for (F1/F0)/Ychar = 1.001;
(c) Accumulative distribution for (F1/F0)/Ychar = 1.1. (d) Accumulative distribution for
(F1/F0)/Ychar = 1.5.
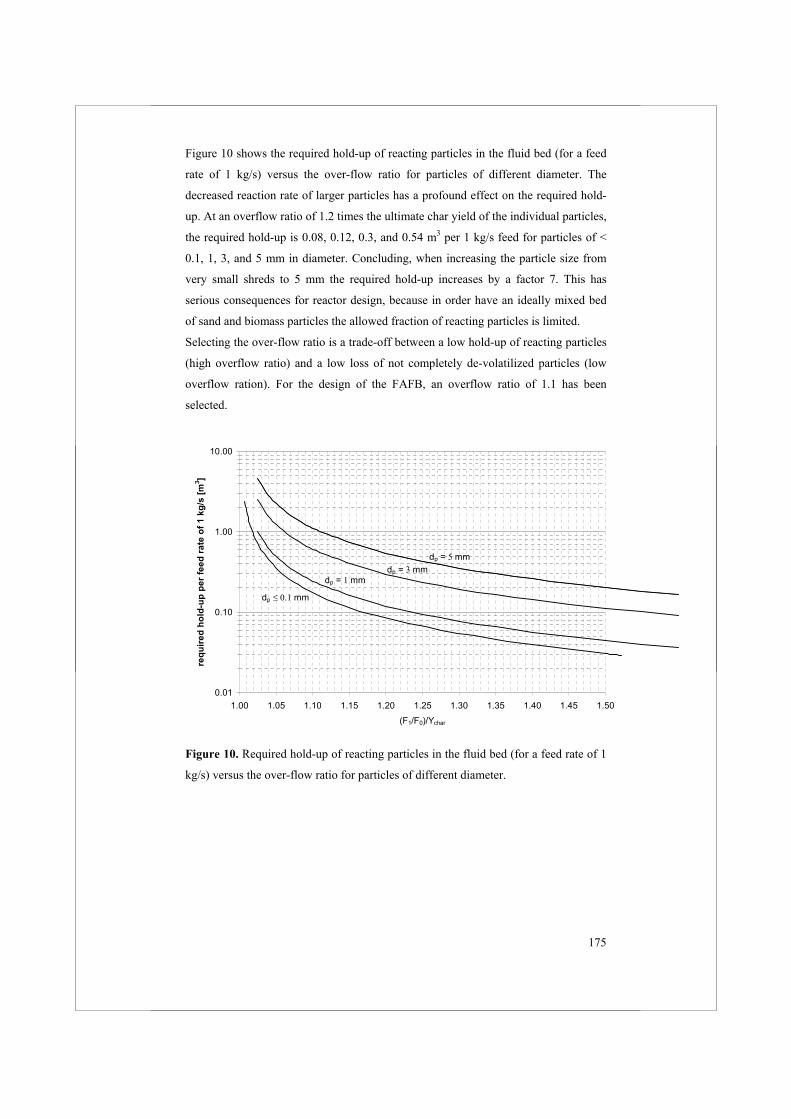
175
Figure 10 shows the required hold-up of reacting particles in the fluid bed (for a feed
rate of 1 kg/s) versus the over-flow ratio for particles of different diameter. The
decreased reaction rate of larger particles has a profound effect on the required hold-
up. At an overflow ratio of 1.2 times the ultimate char yield of the individual particles,
the required hold-up is 0.08, 0.12, 0.3, and 0.54 m3 per 1 kg/s feed for particles of <
0.1, 1, 3, and 5 mm in diameter. Concluding, when increasing the particle size from
very small shreds to 5 mm the required hold-up increases by a factor 7. This has
serious consequences for reactor design, because in order have an ideally mixed bed
of sand and biomass particles the allowed fraction of reacting particles is limited.
Selecting the over-flow ratio is a trade-off between a low hold-up of reacting particles
(high overflow ratio) and a low loss of not completely de-volatilized particles (low
overflow ration). For the design of the FAFB, an overflow ratio of 1.1 has been
selected.
0.01
0.10
1.00
10.00
1.00 1.05 1.10 1.15 1.20 1.25 1.30 1.35 1.40 1.45 1.50
(F1/F0)/Ychar
requ
ired
hold
-up
per f
eed
rate
of 1
kg/
s [m
3 ]
dp mm
dp = mmdp = mm
dp = mm
Figure 10. Required hold-up of reacting particles in the fluid bed (for a feed rate of 1
kg/s) versus the over-flow ratio for particles of different diameter.
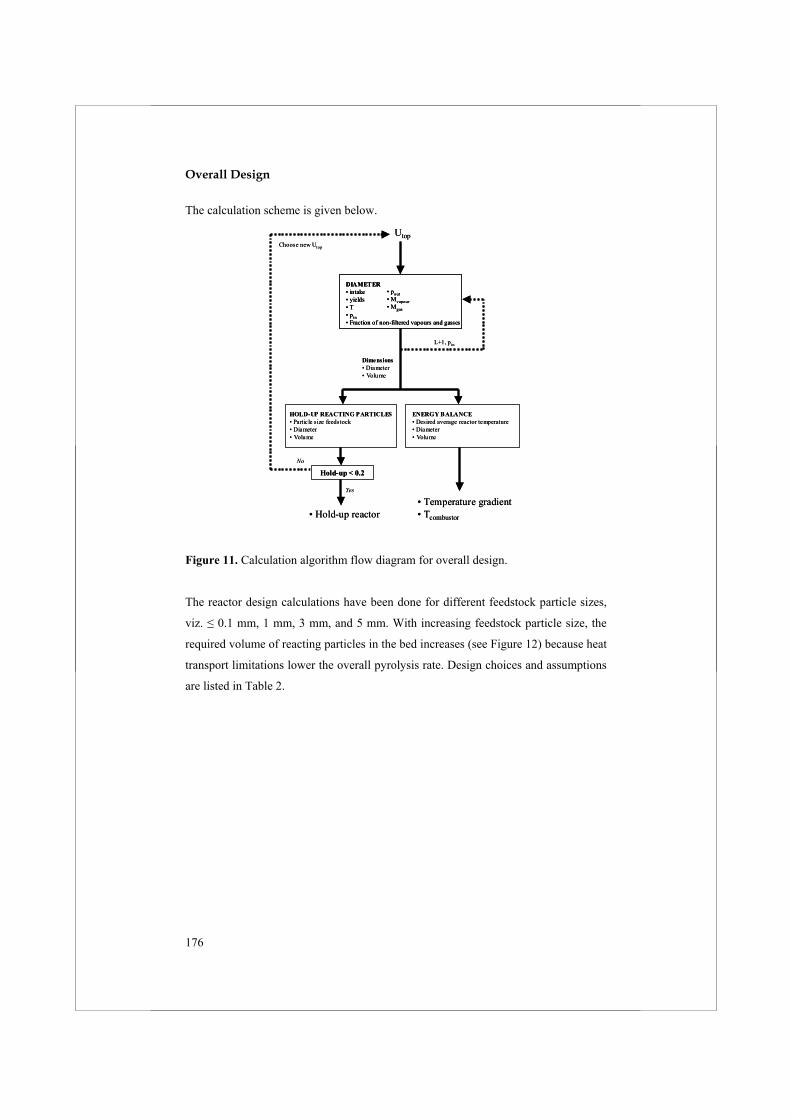
176
Overall Design
The calculation scheme is given below.
DIAMETER• intake• yields• T• pin• Fraction of non-filtered vapours and gasses
• pout• Mvapour• Mgas
L+1, pin
Dimensions• Diameter• Volume
ENERGY BALANCE• Desired average reactor temperature• Diameter• Volume
HOLD-UP REACTING PARTICLES• Particle size feedstock• Diameter• Volume
Utop
• Temperature gradient• Tcombustor• Hold-up reactor
Choose new Utop
Hold-up < 0.2
Yes
No
DIAMETER• intake• yields• T• pin• Fraction of non-filtered vapours and gasses
• pout• Mvapour• Mgas
DIAMETER• intake• yields• T• pin• Fraction of non-filtered vapours and gasses
• pout• Mvapour• Mgas
L+1, pin
Dimensions• Diameter• Volume
ENERGY BALANCE• Desired average reactor temperature• Diameter• Volume
HOLD-UP REACTING PARTICLES• Particle size feedstock• Diameter• Volume
Utop
• Temperature gradient• Tcombustor• Hold-up reactor
Choose new Utop
Hold-up < 0.2
Yes
No
Figure 11. Calculation algorithm flow diagram for overall design.
The reactor design calculations have been done for different feedstock particle sizes,
viz. 0.1 mm, 1 mm, 3 mm, and 5 mm. With increasing feedstock particle size, the
required volume of reacting particles in the bed increases (see Figure 12) because heat
transport limitations lower the overall pyrolysis rate. Design choices and assumptions
are listed in Table 2.
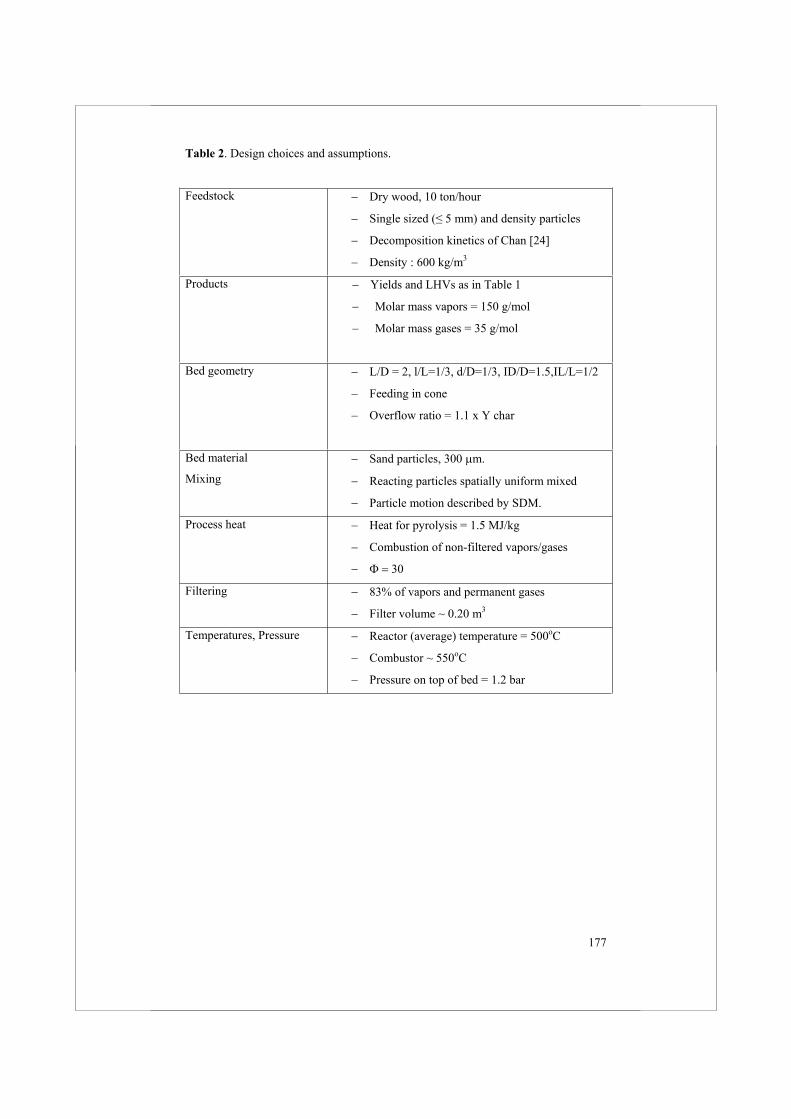
177
Table 2. Design choices and assumptions.
Feedstock Dry wood, 10 ton/hour
Single sized ( 5 mm) and density particles
Decomposition kinetics of Chan [24]
Density : 600 kg/m3
Products Yields and LHVs as in Table 1
Molar mass vapors = 150 g/mol
Molar mass gases = 35 g/mol
Bed geometry L/D = 2, l/L=1/3, d/D=1/3, ID/D=1.5,IL/L=1/2
Feeding in cone
Overflow ratio = 1.1 x Y char
Bed material
Mixing
Sand particles, 300 m.
Reacting particles spatially uniform mixed
Particle motion described by SDM.
Process heat Heat for pyrolysis = 1.5 MJ/kg
Combustion of non-filtered vapors/gases
Filtering 83% of vapors and permanent gases
Filter volume ~ 0.20 m3
Temperatures, Pressure Reactor (average) temperature = 500oC
Combustor ~ 550oC
Pressure on top of bed = 1.2 bar
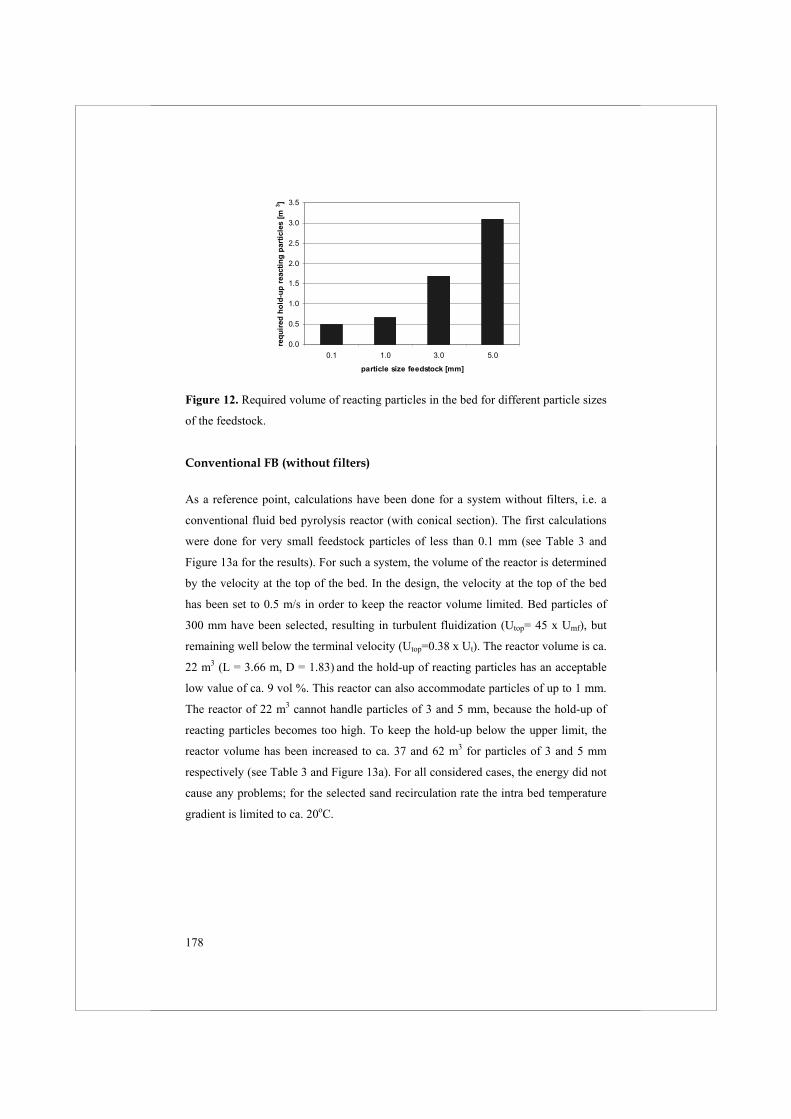
178
0.0
0.5
1.0
1.5
2.0
2.5
3.0
3.5
0.1 1.0 3.0 5.0
particle size feedstock [mm]
requ
ired
hol
d-up
rea
ctin
g pa
rtic
les
[m3 ]
Figure 12. Required volume of reacting particles in the bed for different particle sizes
of the feedstock.
Conventional FB (without filters)
As a reference point, calculations have been done for a system without filters, i.e. a
conventional fluid bed pyrolysis reactor (with conical section). The first calculations
were done for very small feedstock particles of less than 0.1 mm (see Table 3 and
Figure 13a for the results). For such a system, the volume of the reactor is determined
by the velocity at the top of the bed. In the design, the velocity at the top of the bed
has been set to 0.5 m/s in order to keep the reactor volume limited. Bed particles of
300 mm have been selected, resulting in turbulent fluidization (Utop= 45 x Umf), but
remaining well below the terminal velocity (Utop=0.38 x Ut). The reactor volume is ca.
22 m3 (L = 3.66 m, D = 1.83) and the hold-up of reacting particles has an acceptable
low value of ca. 9 vol %. This reactor can also accommodate particles of up to 1 mm.
The reactor of 22 m3 cannot handle particles of 3 and 5 mm, because the hold-up of
reacting particles becomes too high. To keep the hold-up below the upper limit, the
reactor volume has been increased to ca. 37 and 62 m3 for particles of 3 and 5 mm
respectively (see Table 3 and Figure 13a). For all considered cases, the energy did not
cause any problems; for the selected sand recirculation rate the intra bed temperature
gradient is limited to ca. 20oC.
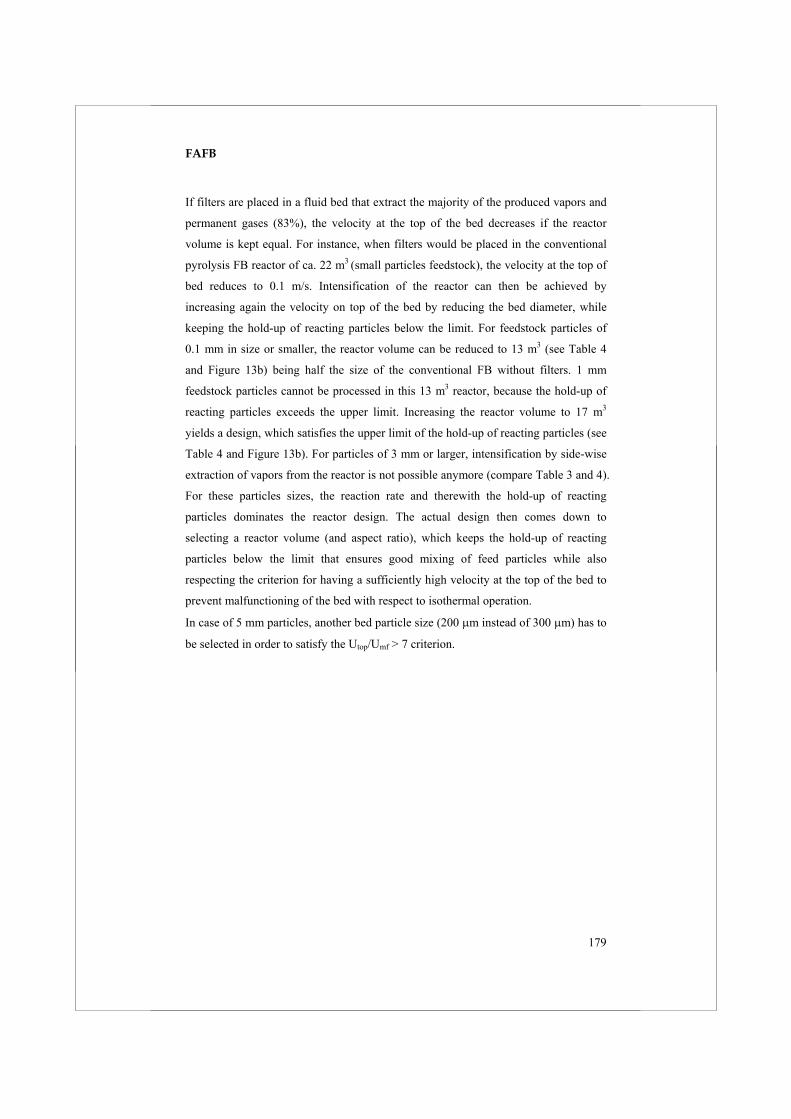
179
FAFB
If filters are placed in a fluid bed that extract the majority of the produced vapors and
permanent gases (83%), the velocity at the top of the bed decreases if the reactor
volume is kept equal. For instance, when filters would be placed in the conventional
pyrolysis FB reactor of ca. 22 m3 (small particles feedstock), the velocity at the top of
bed reduces to 0.1 m/s. Intensification of the reactor can then be achieved by
increasing again the velocity on top of the bed by reducing the bed diameter, while
keeping the hold-up of reacting particles below the limit. For feedstock particles of
0.1 mm in size or smaller, the reactor volume can be reduced to 13 m3 (see Table 4
and Figure 13b) being half the size of the conventional FB without filters. 1 mm
feedstock particles cannot be processed in this 13 m3 reactor, because the hold-up of
reacting particles exceeds the upper limit. Increasing the reactor volume to 17 m3
yields a design, which satisfies the upper limit of the hold-up of reacting particles (see
Table 4 and Figure 13b). For particles of 3 mm or larger, intensification by side-wise
extraction of vapors from the reactor is not possible anymore (compare Table 3 and 4).
For these particles sizes, the reaction rate and therewith the hold-up of reacting
particles dominates the reactor design. The actual design then comes down to
selecting a reactor volume (and aspect ratio), which keeps the hold-up of reacting
particles below the limit that ensures good mixing of feed particles while also
respecting the criterion for having a sufficiently high velocity at the top of the bed to
prevent malfunctioning of the bed with respect to isothermal operation.
In case of 5 mm particles, another bed particle size (200 m instead of 300 m) has to
be selected in order to satisfy the Utop/Umf > 7 criterion.
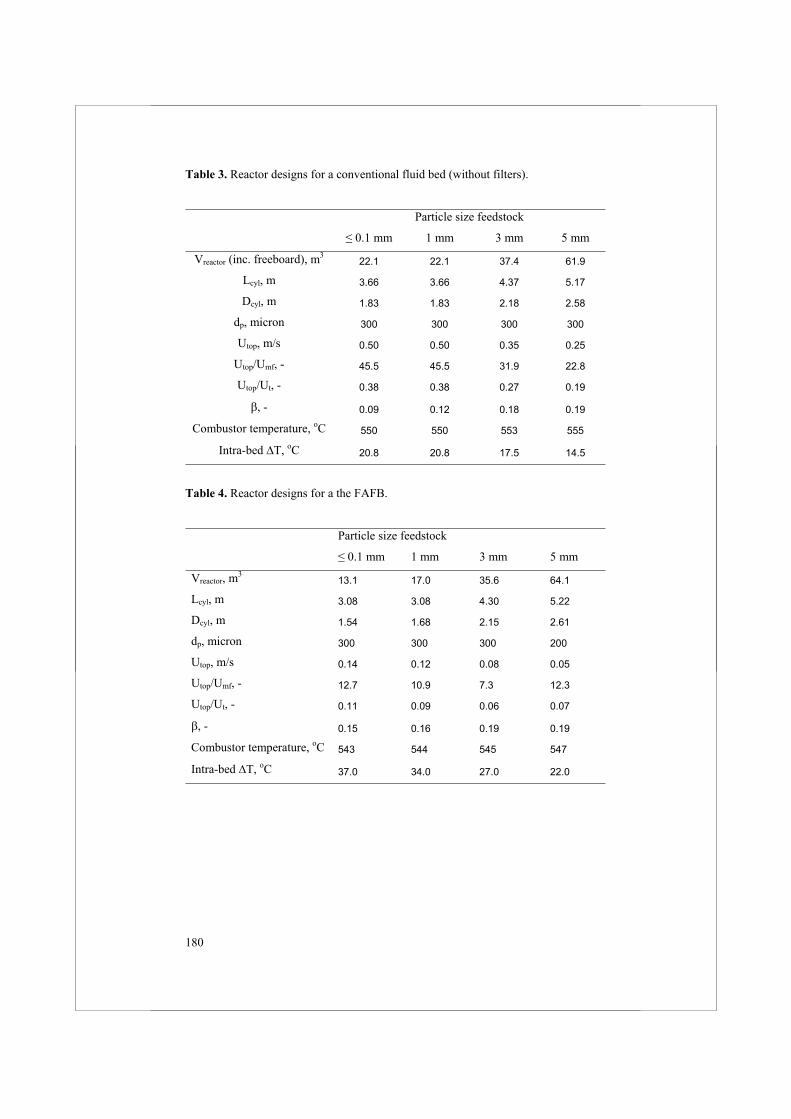
180
Table 3. Reactor designs for a conventional fluid bed (without filters).
Particle size feedstock
0.1 mm 1 mm 3 mm 5 mm
Vreactor (inc. freeboard), m322.1 22.1 37.4 61.9
Lcyl, m 3.66 3.66 4.37 5.17
Dcyl, m 1.83 1.83 2.18 2.58
dp, micron 300 300 300 300
Utop, m/s 0.50 0.50 0.35 0.25
Utop/Umf, - 45.5 45.5 31.9 22.8
Utop/Ut, - 0.38 0.38 0.27 0.19
, - 0.09 0.12 0.18 0.19
Combustor temperature, oC 550 550 553 555
Intra-bed T, oC 20.8 20.8 17.5 14.5
Table 4. Reactor designs for a the FAFB.
Particle size feedstock
0.1 mm 1 mm 3 mm 5 mm
Vreactor, m313.1 17.0 35.6 64.1
Lcyl, m 3.08 3.08 4.30 5.22
Dcyl, m 1.54 1.68 2.15 2.61
dp, micron 300 300 300 200
Utop, m/s 0.14 0.12 0.08 0.05
Utop/Umf, - 12.7 10.9 7.3 12.3
Utop/Ut, - 0.11 0.09 0.06 0.07
, - 0.15 0.16 0.19 0.19
Combustor temperature, oC 543 544 545 547
Intra-bed T, oC 37.0 34.0 27.0 22.0
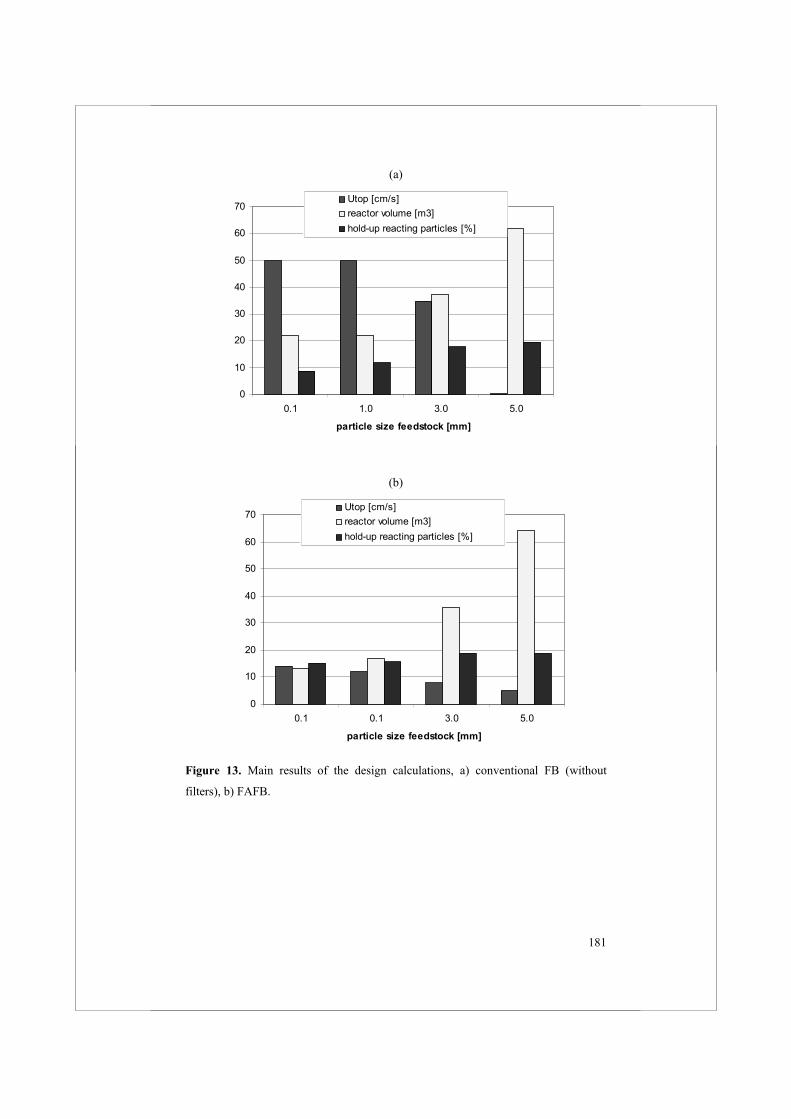
181
(a)
0
10
20
30
40
50
60
70
0.1 1.0 3.0 5.0
particle size feedstock [mm]
Utop [cm/s]reactor volume [m3]hold-up reacting particles [%]
(b)
0
10
20
30
40
50
60
70
0.1 0.1 3.0 5.0
particle size feedstock [mm]
Utop [cm/s]reactor volume [m3]hold-up reacting particles [%]
Figure 13. Main results of the design calculations, a) conventional FB (without
filters), b) FAFB.
182
Conclusions
Design calculations have been performed to estimate the volume of a FAFB pyrolysis
reactor with an intake of 10 tonnes biomass per hour. Experimental data on the
reaction rate and solids mixing while extracting large amounts of gases and vapors,
obtained in Chapters 3 and 4 respectively, have been incorporated in the model. The
conclusions can be summarized as follows.
- Burning the non-filtered gases and vapors (~17% of the totally produced amount)
can provide the heat for pyrolysis. In this way the oil yield is somewhat lowered
compared to the conventional case where char is burned (from 61 to 51%).
However, char, which presents ca. 30% of the LHV of the feedstock, is added to
the product slate;
- By feeding the biomass in the conical bottom section of the reactor, the use of
additional fluidization gas can be limited to a large extent;
- The volume of the installed filters can be neglected relatively to the bed volume;
- Under filtering conditions, mixing of solids remains good enough to keep the
intra-bed temperature gradient below 50°C;
- When feeding small particles of dp 1 mm and = 600 kg/m3 (typical for
wood), the required FAFB reactor volume is 13 m3 including the freeboard,
compared to 22 m3 for a regular fluid bed;
- For larger sized feedstocks intensification is hardly possible. The particle size of
the feedstock influences the required reactor volume. Larger particles have a
lower reaction (pyrolysis) rate, expressed in kg/m3particle, leading to a higher
required absolute hold-up of reacting particles (m3reacting particles) to accommodate
a certain intake. Because there is a maximum to the relative hold-up of reacting
particles ( m3reacting particles/m3
total bed particles) to ensure good solids mixing, the
required reaction volume increases for larger feedstock particles.
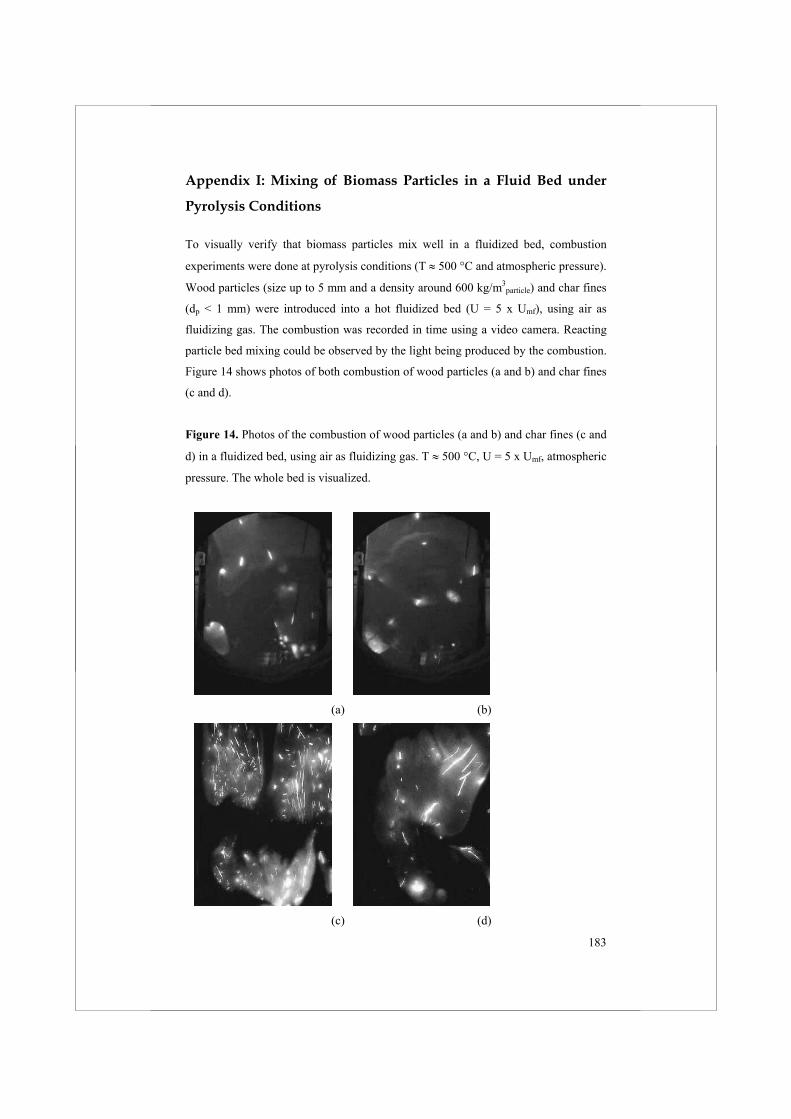
183
Appendix I: Mixing of Biomass Particles in a Fluid Bed under
Pyrolysis Conditions
To visually verify that biomass particles mix well in a fluidized bed, combustion
experiments were done at pyrolysis conditions (T 500 C and atmospheric pressure).
Wood particles (size up to 5 mm and a density around 600 kg/m3particle) and char fines
(dp < 1 mm) were introduced into a hot fluidized bed (U = 5 x Umf), using air as
fluidizing gas. The combustion was recorded in time using a video camera. Reacting
particle bed mixing could be observed by the light being produced by the combustion.
Figure 14 shows photos of both combustion of wood particles (a and b) and char fines
(c and d).
Figure 14. Photos of the combustion of wood particles (a and b) and char fines (c and
d) in a fluidized bed, using air as fluidizing gas. T 500 C, U = 5 x Umf, atmospheric
pressure. The whole bed is visualized.
(a) (b)
(c) (d)
184
As can be seen in Figure 14, the light production (i.e. combustion of reacting particle)
is distributed over the whole bed indicating good mixing of the reacting particles in
the fluidized bed.
List of Symbols
Ar Cross sectional area of the reactor m2
Cp Heat capacity J kg-1 K-1
D Dispersion coefficient bed material m2 s-1
Dcyl Diameter of cylinder m
dp Particle diameter m
F0 Reacting particle ingoing kg/s
F1 Reacting particle outgoing kg/s
Fbio Biomass intake kg/s
h Height fluid bed M
k Reaction rate of particle s-1
L Total reactor length m
Lcyl Length of cylinder m
lp Length particle m
M Mass of reacting particle kg .
pQ Heat for pyrolysis J/kgbiomass
pQ Dimensionless heat for pyrolysis (.
pQ L2 D-1 -1 -1
Cp-1)
K
Qloss Heat losses W
Qp Heat for pyrolysis W m-3
Qsteam Heat available from steam production W
Qwaste heat boiler Heat available from waste heat boiler W
R Reaction rate single particle kg m-3 s-1
T Temperature K
t Time s
Tin Temperature combustor K
Tout Temperature pyrolysis K
Umf Minimal fluidization velocity m s-1
usand Velocity of sand inside the reactor m s-1
Ut Terminal velocity m s-1
185
Utop Velocity at the top of the fluid bed m s-1
Vreactor Volume of reactor m3
Vrp Volume of reacting particles m3
x Reactor length (from 0 to L) m
Ychar Char yield at infinite time -
Yenergetic Fraction of the LHV of the feedstock that ends up in
the products oil, char, steam, and waste-heat
-
Greek
Solids fraction -
Ratio of sand recirculation rate over biomass intake -
Density kg m-3
f Density feed (biomass) kg m-3
Density char (complete devolitization) kg m-3
sand Sand circulation rate kg/s
Dimensionless length reactor (x L-1) -
1 Particle density distribution function -
Dimensionless Numbers
Pe Peclet number (L u -1 D-1) -
References
1. Scott, D.S., et al., A second look at fast pyrolysis of biomass - the RTI process;
J. Anal. Pyrolysis, 1999, 51, pp. 23-37.
2. Scott, D.S., Piskorz, J., The flash pyrolysis of Aspen-Polar wood; Can. J.
Chem. Eng., 1982, 60, pp. 666-674.
3. Scott, D.S., Piskorz, J., The continuous flash pyrolysis of biomass; Can. J.
Chem. Eng., 1984, 62, pp. 291-294.
4. Scott, D.S., Piskorz, J., Radlein, D., The role of temperature in the fast
pyrolysis of cellulose and wood; Ind. Eng. Chem. Res., 1988, 27, pp. 8-15.
5. Scott, D.S., Piskorz, J., Radlein, D., Liquid products from the continuous flash
pyrolysis of biomass; Ind. Eng. Chem. Prod., 1988, 24, pp. 581-588.
186
6. Scott, D.S, et al., Flash pyrolysis of peat in a fluidized bed, Fuel; Process.
Technol., 1988, 18, pp. 81-95.
7. Agblevor, F.A., Besler, S., Evans, R.J., Inorganic compounds in biomass
feedstocks: their role in char formation and effect on the quality of fast
pyrolysis oils; Proceedings of biomass pyrolysis oil properties and combustion
meeting; National Renewable Energy Laboratory, Estes Park, CO, 1994.
8. Horne, P.A., Williams, P.T., Influence of temperature on the products from the
flash pyrolysis of biomass; Fuel, 1996, 75, pp. 1051-1059.
9. Peacocke G.V.C., Ablative pyrolysis of biomass; Ph.D. Thesis, Aston
University, Birmingham, UK, 1994.
10. Peacocke G.V.C., et al., Effect of reactor configuration on the yields and
structures of pine-wood derived pyrolysis liquids: A comparison between
ablative and wire-mesh pyrolysis; Biomass Bioenergy, 1994, 7, pp. 155-167.
11. Peacocke G.V.C., et al., Comparison of ablative and fluid bed fast pyrolysis
products: yields and analysis, Developments in thermochemical biomass
conversion; Bridgwater, A.V., Boocock, D.G.B., Eds., Blackie Academic &
Professional, London, UK, 1997, pp 191-205.
12. Hague, R.A., The pre-treatment and pyrolysis of biomass for the production of
liquids for fuel and specialty chemicals; Ph.D. Thesis, Aston University,
Birmingham, UK, 1998.
13. Bilbao, R., et al., Experimental and theoretical study of the ignition and
smouldering of wood including convective effects; Combust. Flame, 2001,
126, pp. 1363-1372.
14. Luo, Z., et al., Research on biomass fast pyrolysis for liquid fuel; Biomass
Bioenergy, 2004, 26, pp. 455-462.
15. Olazar, M., et al., Kinetic study of fast pyrolysis of sawdust in a conical
spouted bed reactor in the range 400-500 C; J. Chem. Technol. Biotechnol.,
2001, 76, pp. 469-476.
16. Kersten S.R.A., Biomass gasification in circulating fluidized beds; Ph.D.
Thesis, Twente University, Enschede, The Netherlands, 2002.
187
17. Bridgwater, A.V., et al., Fast pyrolysis of biomass: a handbook; IEA
Bioenergy, CPL Press, Berkshire, UK 1999.
18. Reed, T.R., Gaur, S., The high heat of fast pyrolysis for large particles,
Developments in thermochemical biomass conversion; Bridgwater, A.V., Ed.,
Blackie Academic & Professional, London, UK, 1993, pp 1343-1357.
19. Cottam, M.L., Bridgwater A.V., Techno-economics of pyrolysis oil production
and upgrading, Developments in thermochemical biomass conversion;
Bridgwater, A.V., Boocock, D.G.B., Eds., Blackie Academic & Professional,
London, UK, 1997, pp 97-103.
20. Private communications with W. Prins.
21. Janse A.M.C., A heat integrated rotating cone reactor system for flash
pyrolysis of biomass; Ph.D. Thesis, Twente University, Enschede, The
Netherlands, 1998.
22. Danckwerts, P. V., Continuous flow systems; Chem. Eng. Sci. 1953, 2, pp. 1-
13.
23. Van Deemter, J.J., Chapter 9: Mixing; Proceedings of the international
symposium on fluidization, Netherlands University Press, Amsterdam, The
Netherlands, 1967, pp 331-355.
24. Chan, W.C.R., Kelbon, M., Krieger, B.B., Modelling and experimental
verification of physical and chemical processes during pyrolysis of a large
biomass particle; Fuel, 1985, 64, pp. 1505-1513.
25. Levenspiel, O., Kunii, D., Fitzgerald, T., The processing of solids of changing
size in bubbling fluidized beds; Powder Technology, 1968, 69, pp. 87-96.

188
189
AcknowledgementsAs early as in 2000, like many other young Chinese students, I was seeking an
opportunity to study abroad. Today, five years later, I feel completely satisfied with
this decision. It has been a wonderful experience working and meeting with people
with diversified backgrounds.
Culmination of this project has resulted not only in this dissertation but also in
sharpening the many facets of my personal and professional development. A great
number of people have contributed to this thesis, some by making direct contributions
and some by making life outside of my motherland more enjoyable. Herewith, I wish
to express my gratitude to all of these wonderful people.
Firstly, I would like to thank my academic supervisor Prof. dr.ir. Wim van Swaaij for
accepting me as an AIO student in his research group. His expertise in reactor
engineering and biomass conversion has provided new insights and elucidations to
many theoretical and practical problems during the course of this research. Next, I
would like to extend my thanks to Dr. Sascha Kersten and Dr.ir. Wolter Prins, my
daily advisors for their patience, guidance and moral supports. I still remember the
countless times we had discussion in the office room A 1.12 of Langezijds (CT)
building at the University of Twente. Their knowledge and enthusiasm have proven
an invaluable contribution to this research.
I am also indebted to Mr. Akse, time flies, but I can not forget my correspondence
with him during my application to the University of Twente in August, 2000. Later on
when I arrived in Twente, it was you who gave me lots of practical help. Thank you
Rik.
I was really fortunate to meet excellent undergraduate, graduate as well as many Ph.D.
students whose valuable work contributed to the successful realization of this project.
Nina Woicke from the University of Stuttgart, Germany, and Toine Cents did cold-
flow experiments. We spent several months together in the laboratory, and without
their support the comprehensive experimental program carried out in this part of the
thesis would not have been possible.
Dr. Marco Rep and Dragan Knezevic also helped me in deciphering many Dutch
documents. It was a great time working with Kim Jansen, Roel Westerhof, Evert
190
Leijenhorst, and particularly Daan Assink, an expert from BTG, who patiently
performed the hot flow experiments of biomass pyrolysis.
Johan Agterhorst and Jeffry Kastenberg facilitated the development of critical
experimental set-ups. Especially thanks to Bert Koning who helped me debugging the
data acquisition system. Dr. Detlef Schmiedl at BFH, Germany and the staff at ENEA,
Italy contributed to the analyses of the complicated bio-oil samples and various
feedstocks.
I enjoyed the time spent together with our TCCB group members (Biljana Potic,
Dragan Knezevic, Guus van Rossum, Mariken Bleeker, Marco Rep) as well as the
HDL staff (Gert Banis, Fred ter Borg, Karst van Bree). The delicious barbecue foods
and wonderful tours are unforgettable in my life.
It is important to acknowledge the secretarial support, provided in the most efficient
and effective manner, by Yvonne Bruggert - ter Huurne and Wies Elfers.
During the last stage of thesis preparation Yvonne, Guus and Dragan gave me lots of
help. Thanks a lot, Guys!
Because of the international character of my project, I had got opportunity to travel
within the European zone and it was possible to meet many leading authorities in this
research area.
During the hot summer of 2005 in Beijing, I was fortunate to get to know Mr. Jianjun
Tian, Dr. Megan Clark and Ms. Colleen Walker at BHP Billiton and their support and
encouragement is very much appreciated.
Last but not least, I wish to thank my family for their understanding and moral
support.
Xiaoquan Wang
Enschede & Beijing
Winter, 2005
191
Curriculum Vitae
Xiaoquan Wang was born on July 15th, 1969 in Xishui, Hubei Province of China. He
obtained his bachelors’ degree in Chemical Engineering in 1992 from East China
University of Science and Technology in Shanghai, China, followed by two years
working as a process engineer at Huangmailing Phosphate Chemical Corp., China
from August 1992 till August 1994.
After this he continued his studies in Chemical Engineering at Dalian University of
Technology, Liaoning, China, and received his masters’ degree in July 1997 with Prof.
Jieshan Qiu on the subject of 'Pulverized coal pyrolysis in thermal plasma'.
From September 1997 till January 2001 he was a research assistant in the group of
Prof. Jinghai Li and Prof Mooson Kwauk at Multiphase Reaction Laboratory, Institute
of Chemical Metallurgy, Chinese Academy of Sciences in the field of fluidization
application in clean coal technology.
In February 2001 MSc Wang started his Ph.D. work in the group of Prof. dr. ir. Wim
van Swaaij at the University of Twente on the subject of ‘In situ cleaning of flash-
pyrolysis vapours’.
Since September 1st, 2005 Xiaoquan has been employed by BHP Billiton in Beijing,
China as a senior scientist.