Embed Size (px)
Citation preview
Natural Hazards and Earth System Sciences (2002) 2: 3–14c© European Geophysical Society 2002 Natural Hazards
and EarthSystem Sciences
Impact of mapping errors on the reliability of landslide hazard maps
F. Ardizzone1, M. Cardinali 1, A. Carrara 2, F. Guzzetti1, and P. Reichenbach1
1CNR-IRPI, Via della Madonna Alta 126, I-06128 Perugia, Italy2CNR-CSITE, Viale Risorgimento 2, I-40136 Bologna, Italy
Received: 1 November 2001 – Accepted: 3 December 2001
Abstract. Identification and mapping of landslide depositsare an intrinsically difficult and subjective operation that re-quires a great effort to minimise the inherent uncertainty. Forthe Staffora Basin, which extends for almost 300 km2 in thenorthern Apennines, three landslide inventory maps were in-dependently produced by three groups of geomorphologists.In comparing each map with the others, large positional dis-crepancies arise (in the range of 55–65%). When all threemaps are overlain, the locational mismatch of landslide de-posit polygons increases to over 80%.
To assess the impact of these errors on predictive mod-els of landslide hazard, for the study area discriminantmodels were built up from the same set of geological-geomorphological factors as predictors, and the occurrenceof landslide deposits within each terrain-unit, derived fromeach inventory map, as dependent variable. The compari-son of these models demonstrates that statistical modellinggreatly minimises the impact of input data errors which re-main, however, a major limitation on the reliability of land-slide hazard maps.
1 Introduction
During the past two decades, investigators have highlightedthe inherent errors and uncertainties related to the identifi-cation and mapping of landslide deposits through geomor-phological techniques (Varnes, 1984; Hansen, 1984; Carraraet al., 1992; Van Westen, 1993; Cruden and Varnes, 1994).Well-trained investigators are capable of detecting and map-ping many or most landslides occurring in an area by ap-plying aerial photo-interpretation techniques and systematicfield checks (Brabb, 1984; Carrara et al., 1992; Hutchinson,1995). However, old dormant landslide deposits, landslidesintensively modified by farming activity or covered by densevegetation, cannot be easily identified and correctly mapped.
Correspondence to:F. Ardizzone([email protected])
All of this introduces a factor of uncertainty that cannot bereadily evaluated and explicitly incorporated in the subse-quent phases of assessing the hazard and risk affecting hu-man activities.
Such uncertainty largely depends on the skill and experi-ence of the surveyor, and on other factors such as the qualityand scale of the available aerial photographs and of the basetopographic maps, the typology of the landslide phenomena,and the environmental context.
In this paper, first, three landslide inventory maps, whichwere independently produced by three groups of geomor-phologists, are quantitatively compared, highlighting theirpositional similarities and discrepancies. Second, two land-slide predictive models, which were obtained using the sameset of geological-geomorphological factors as predictors, andthe occurrence of landslide deposits derived from each inven-tory map, are compared and discussed. Lastly, the impact ofsuch landslide map and model mismatches on land and urbanplanning are examined.
2 Data collection
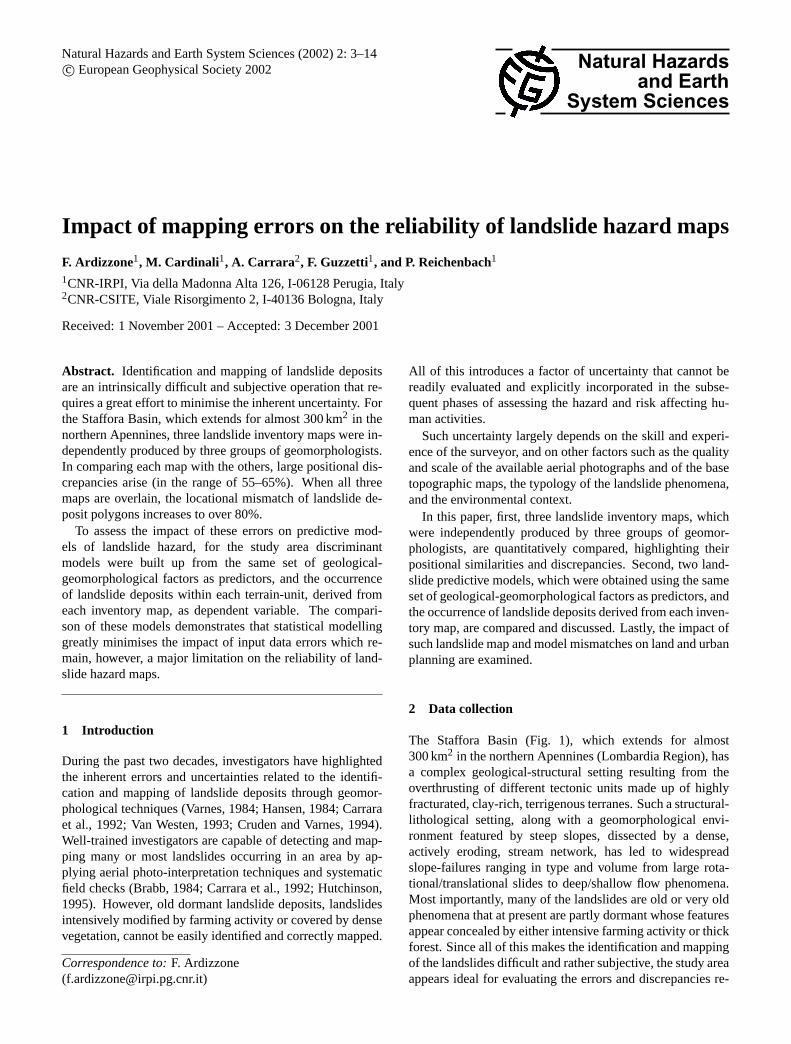
The Staffora Basin (Fig. 1), which extends for almost300 km2 in the northern Apennines (Lombardia Region), hasa complex geological-structural setting resulting from theoverthrusting of different tectonic units made up of highlyfracturated, clay-rich, terrigenous terranes. Such a structural-lithological setting, along with a geomorphological envi-ronment featured by steep slopes, dissected by a dense,actively eroding, stream network, has led to widespreadslope-failures ranging in type and volume from large rota-tional/translational slides to deep/shallow flow phenomena.Most importantly, many of the landslides are old or very oldphenomena that at present are partly dormant whose featuresappear concealed by either intensive farming activity or thickforest. Since all of this makes the identification and mappingof the landslides difficult and rather subjective, the study areaappears ideal for evaluating the errors and discrepancies re-
4 F. Ardizzone et al.: Impact of mapping errors on the reliability of landslide hazard maps
Table 1. Summary table of the positional mismatch between the three landslide inventories carried out in the Staffora Basin by the Milano,Perugia and Pavia teams
Unstable area Positional mismatch between maps Positional mismatchamong all maps
Milano map Perugia map Pavia map
Milano map 19.3% * 57.6% 67.7%
Perugia map 23.7% – * 67.2%
Pavia map 16.3% – – *
All maps 80.0%
Fig. 1
Fig. 1. Staffora Basin. Location of the study area. Thick dark linesand black polygons indicate road network and villages. Grey linesindicate stream network.
sulting from the mapping operations carried out by differentgeomorphologists.
As part of two different research projects aimed at as-sessing landslide hazard in the Lombardia Region (An-tonini et al., 2000), three landslide inventory maps for theStaffora Basin were independently produced by three groupsof geomorphologists from the University of Milano (Depart-ment of Geological Sciences and Geotechnology, Universityof Milano-Bicocca), the Italian National Research Council(CNR-IRPI, Perugia), and the Soil Conservation Office ofthe Province of Pavia, respectively.
To map the landslides, the investigators from the Uni-versity of Milan used colour, 1:15 000 in scale, aerial pho-tographs flown in 1981–1982; the laboratory work was in-
tegrated and tested by numerous field checks. The CNR-IRPI (Perugia) team used black-and-white, 1:25 000 in scale,aerial photos flown in 1994. Very limited field checks wereused to validate the photo-interpretation. Lastly, the Provinceof Pavia investigators used 1:20 000 in scale aerial pho-tographs and an unknown number of field surveys.
All maps were carefully digitised and to each landslide de-posit a list of attributes was assigned containing informationon the type of movement, estimated relative age (very old,old, recent), degree of activity (dormant and active) and de-gree of certainty (low, intermediate, high certainty), in theidentification of the failed mass. Since these attributes wereassigned to the landslides using somewhat different criteria,the comparison between the three inventories was mainlyconfined to their positional (or locational) matching.
3 Data analysis
3.1 Comparison of landslide inventory maps
Since all data were stored into a GIS (ArcGis by ESRI), itwas readily possible to compare landslide polygons derivedfrom the three inventories through the use of the “map over-lay” functions, now days available in any commercial GIS.
First, the comparison was performed pairwise (Figs. 2, 3and 4) then it was extended to all three maps (Fig. 5). Byapplying simple operations from set theory, the positionalmismatch (PM) was calculated as follows (see Carrara et al.,1992):
PM = [(‘A’ ∪ ‘B’ – ‘A’ ∩ ‘B’) / ‘A’ ∪ ‘B’] × 100
where:‘A’, ‘B’ Landslide inventory maps‘A’ ∪ ‘B’ Spatial union of landslide maps‘A’ ∩ ‘B’ Spatial intersection of landslide maps
The map resulting from the union operation (‘A’∪ ‘B’) in-corporates all the polygons classified as landslide deposits byeither the A inventory or the B inventory. While the map ob-tained by the intersection operation (‘A’∩ ‘B’) includes onlythe unstable area common to the two inventories. Clearly, theindex will approach 0% in the ideal case that inventory maps
F. Ardizzone et al.: Impact of mapping errors on the reliability of landslide hazard maps 5
0 4 8 Kilometers
Staffora Basin
Overall positionalmismatch: 57.6%
MI_Pg_unionMi_Pg_intersect
Fig. 2
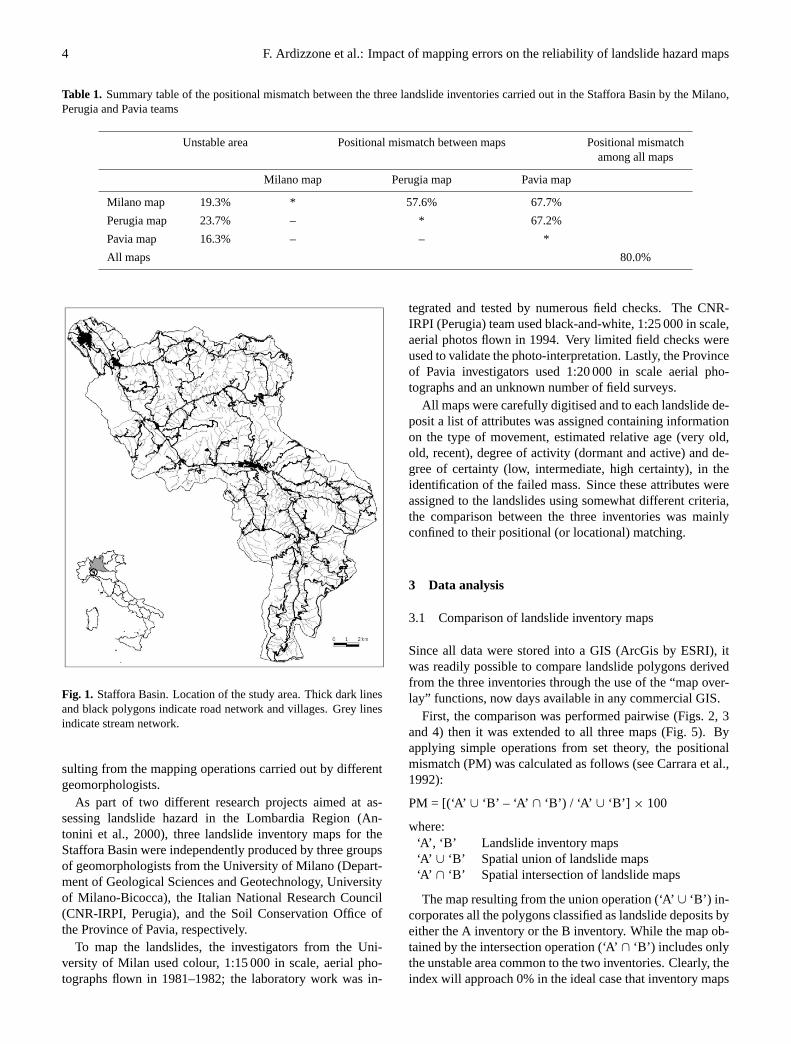
Fig. 2. Comparison of landslide inventory maps produced by theUniversity of Milano (Mi) and the CNR-IRPI in Perugia (Pg) re-search teams. Total area classified as unstable by either Milano orPerugia (union) is in grey. Unstable area common to the two inven-tories (intersection) is in black.
match exactly, and will assume large values, in the range of50–70%, for the more realistic circumstance that maps differ.
Therefore, the index of disagreement between landslidemaps represents the total error and uncertainty associatedwith landslide identification, interpretation, classification, to-pographic location, and aerial photograph-to-map data trans-fer and data digitizing.
The comparison of landslide maps produced by differentinvestigators indicated that the positional mismatch due tofactors resulting from photointerpreter skill or subjectivitydifferences, amounts to less than 10% (Carrara et al., 1992).Hence, to estimate the importance of the ability and expe-rience of the surveyor in map disagreement, the figures re-ported in Table 1 should be approximately reduced of thisvalue.
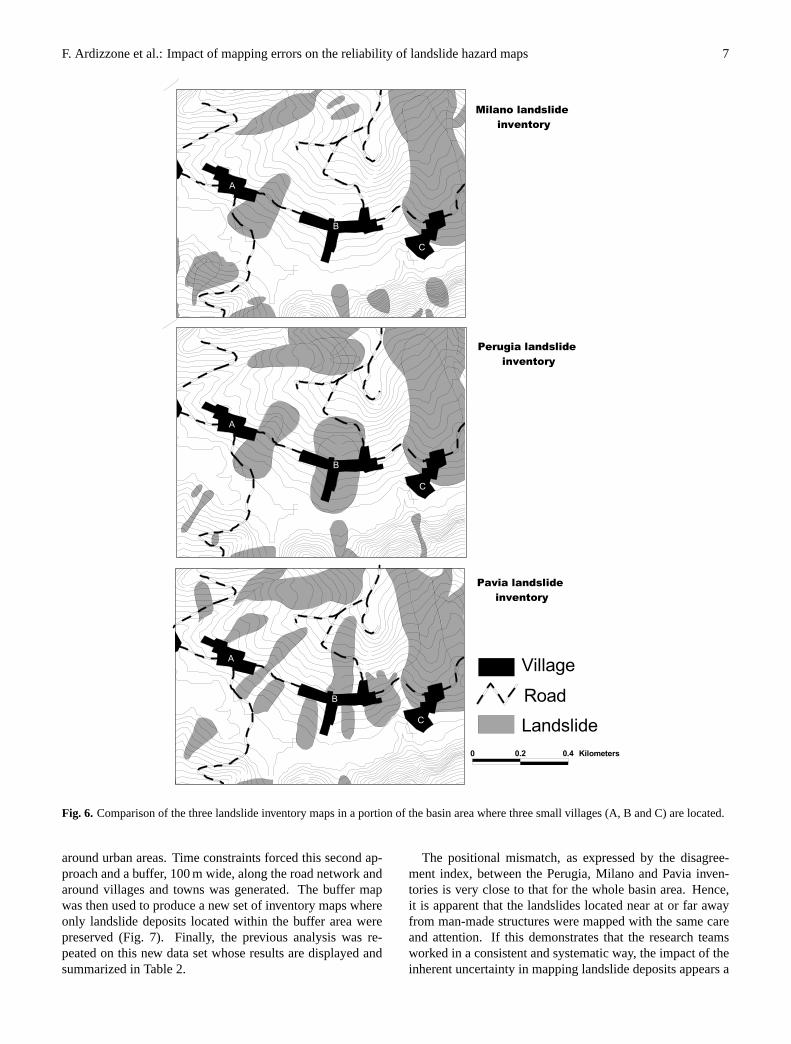
From the values summarised in Table 1, it is apparent thatthe overall percentage of unstable area of the Staffora Basinlargely differs among the three inventories. Likewise, thedisagreement between each map approaches 68%, while themismatch among the three data sets increases to 80%. Theselarge discrepancies can be accounted for by various factors.
First, the Milano and Perugia investigators used differentaerial photographs, namely colour, 1:15 000, photographsflown in 1981–1982 vs. black-and-white, 1:25 000, pho-tographs flown in 1994. The 1981–1982 set of photographswere taken shortly after an event of heavy rains that gen-
0 4 8 Kilometers
Staffora Basin
Overall positionalmismatch: 67.7%
Mi_pv_unionMi_pv_intersect
Fig. 3
Fig. 3. Comparison of landslide inventory maps produced by theUniversity of Milano (Mi) and the Province of Pavia (Pv) researchteams. Total area classified as unstable by either Milano or Pavia(union) is in grey. Unstable area common to the two inventories(intersection) is in black.
erated widespread surficial flow phenomena on cultivatedslopes. Hence, these failures were readily mapped by theMilano geomorphologists. At the time the second set of pho-tographs were flown (1994), most of these deposits were can-celled out by the farming activity and could not be detectedby the Perugia geomorphologists.
Second, the Milano teams integrated the laboratory workwith systematic field checks, while the Perugia team spentjust few days visiting the study area.
Despite of this, the mismatch between Milano and Pe-rugia inventory maps is smaller (57.6%) than that regard-ing both the Perugia-Pavia (67.2%) and the Milano-Pavia(67.7%) landslide maps where either the photographs or theamount of field work were comparable. Hence, all of thisleads to idea that the major cause of the positional mismatchis mainly linked to the way the investigator identifies, infersand interprets the geomorphological expression of landslidedeposits.
3.2 Positional mismatch and applicability of landslidemaps
The disagreement index provides a synthetic estimate of howthe landslide deposits mapped by the three research teamsoverlie each other throughout the basin, including both pop-ulated zones and mountain areas that today are totally aban-doned. Hence, the question may be to which extent the mis-
6 F. Ardizzone et al.: Impact of mapping errors on the reliability of landslide hazard maps
0 4 8 Kilometers
Staffora Basin
Overall positionalmismatch: 67.2%
Pg_pv_unionPg_pv_intersect
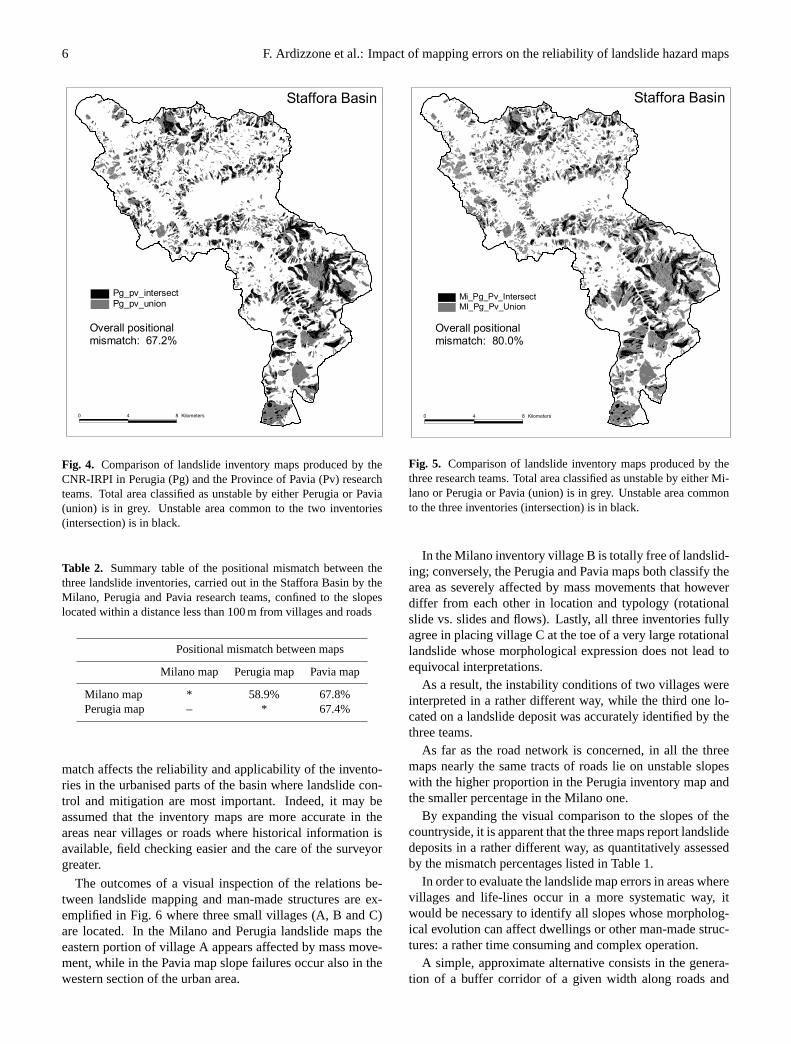
Fig. 4
Fig. 4. Comparison of landslide inventory maps produced by theCNR-IRPI in Perugia (Pg) and the Province of Pavia (Pv) researchteams. Total area classified as unstable by either Perugia or Pavia(union) is in grey. Unstable area common to the two inventories(intersection) is in black.
Table 2. Summary table of the positional mismatch between thethree landslide inventories, carried out in the Staffora Basin by theMilano, Perugia and Pavia research teams, confined to the slopeslocated within a distance less than 100 m from villages and roads
Positional mismatch between maps
Milano map Perugia map Pavia map
Milano map * 58.9% 67.8%Perugia map – * 67.4%
match affects the reliability and applicability of the invento-ries in the urbanised parts of the basin where landslide con-trol and mitigation are most important. Indeed, it may beassumed that the inventory maps are more accurate in theareas near villages or roads where historical information isavailable, field checking easier and the care of the surveyorgreater.
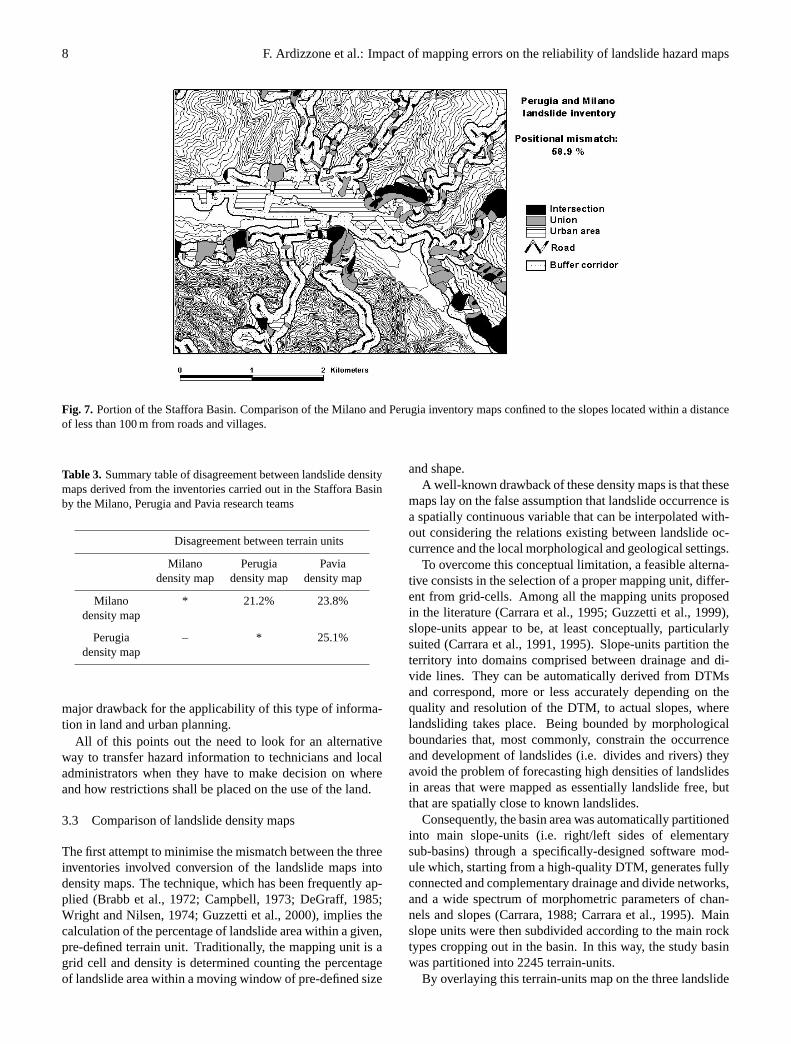
The outcomes of a visual inspection of the relations be-tween landslide mapping and man-made structures are ex-emplified in Fig. 6 where three small villages (A, B and C)are located. In the Milano and Perugia landslide maps theeastern portion of village A appears affected by mass move-ment, while in the Pavia map slope failures occur also in thewestern section of the urban area.
0 4 8 Kilometers
Staffora Basin
Overall positionalmismatch: 80.0%
MI_Pg_Pv_UnionMi_Pg_Pv_Intersect
Fig. 5
Fig. 5. Comparison of landslide inventory maps produced by thethree research teams. Total area classified as unstable by either Mi-lano or Perugia or Pavia (union) is in grey. Unstable area commonto the three inventories (intersection) is in black.
In the Milano inventory village B is totally free of landslid-ing; conversely, the Perugia and Pavia maps both classify thearea as severely affected by mass movements that howeverdiffer from each other in location and typology (rotationalslide vs. slides and flows). Lastly, all three inventories fullyagree in placing village C at the toe of a very large rotationallandslide whose morphological expression does not lead toequivocal interpretations.
As a result, the instability conditions of two villages wereinterpreted in a rather different way, while the third one lo-cated on a landslide deposit was accurately identified by thethree teams.
As far as the road network is concerned, in all the threemaps nearly the same tracts of roads lie on unstable slopeswith the higher proportion in the Perugia inventory map andthe smaller percentage in the Milano one.
By expanding the visual comparison to the slopes of thecountryside, it is apparent that the three maps report landslidedeposits in a rather different way, as quantitatively assessedby the mismatch percentages listed in Table 1.
In order to evaluate the landslide map errors in areas wherevillages and life-lines occur in a more systematic way, itwould be necessary to identify all slopes whose morpholog-ical evolution can affect dwellings or other man-made struc-tures: a rather time consuming and complex operation.
A simple, approximate alternative consists in the genera-tion of a buffer corridor of a given width along roads and
F. Ardizzone et al.: Impact of mapping errors on the reliability of landslide hazard maps 7
0 0.2 0.4 Kilometers
A
BB
C
Milano landslide inventory
Perugia landslide inventory
Pavia landslide inventory
A
BB
C
A
BB
C LandslideRoadVillage
Fig. 6
Fig. 6. Comparison of the three landslide inventory maps in a portion of the basin area where three small villages (A, B and C) are located.
around urban areas. Time constraints forced this second ap-proach and a buffer, 100 m wide, along the road network andaround villages and towns was generated. The buffer mapwas then used to produce a new set of inventory maps whereonly landslide deposits located within the buffer area werepreserved (Fig. 7). Finally, the previous analysis was re-peated on this new data set whose results are displayed andsummarized in Table 2.
The positional mismatch, as expressed by the disagree-ment index, between the Perugia, Milano and Pavia inven-tories is very close to that for the whole basin area. Hence,it is apparent that the landslides located near at or far awayfrom man-made structures were mapped with the same careand attention. If this demonstrates that the research teamsworked in a consistent and systematic way, the impact of theinherent uncertainty in mapping landslide deposits appears a
8 F. Ardizzone et al.: Impact of mapping errors on the reliability of landslide hazard maps
Fig. 7. Portion of the Staffora Basin. Comparison of the Milano and Perugia inventory maps confined to the slopes located within a distanceof less than 100 m from roads and villages.
Table 3. Summary table of disagreement between landslide densitymaps derived from the inventories carried out in the Staffora Basinby the Milano, Perugia and Pavia research teams
Disagreement between terrain units
Milano Perugia Paviadensity map density map density map
Milano * 21.2% 23.8%density map
Perugia – * 25.1%density map
major drawback for the applicability of this type of informa-tion in land and urban planning.
All of this points out the need to look for an alternativeway to transfer hazard information to technicians and localadministrators when they have to make decision on whereand how restrictions shall be placed on the use of the land.
3.3 Comparison of landslide density maps
The first attempt to minimise the mismatch between the threeinventories involved conversion of the landslide maps intodensity maps. The technique, which has been frequently ap-plied (Brabb et al., 1972; Campbell, 1973; DeGraff, 1985;Wright and Nilsen, 1974; Guzzetti et al., 2000), implies thecalculation of the percentage of landslide area within a given,pre-defined terrain unit. Traditionally, the mapping unit is agrid cell and density is determined counting the percentageof landslide area within a moving window of pre-defined size
and shape.A well-known drawback of these density maps is that these
maps lay on the false assumption that landslide occurrence isa spatially continuous variable that can be interpolated with-out considering the relations existing between landslide oc-currence and the local morphological and geological settings.
To overcome this conceptual limitation, a feasible alterna-tive consists in the selection of a proper mapping unit, differ-ent from grid-cells. Among all the mapping units proposedin the literature (Carrara et al., 1995; Guzzetti et al., 1999),slope-units appear to be, at least conceptually, particularlysuited (Carrara et al., 1991, 1995). Slope-units partition theterritory into domains comprised between drainage and di-vide lines. They can be automatically derived from DTMsand correspond, more or less accurately depending on thequality and resolution of the DTM, to actual slopes, wherelandsliding takes place. Being bounded by morphologicalboundaries that, most commonly, constrain the occurrenceand development of landslides (i.e. divides and rivers) theyavoid the problem of forecasting high densities of landslidesin areas that were mapped as essentially landslide free, butthat are spatially close to known landslides.
Consequently, the basin area was automatically partitionedinto main slope-units (i.e. right/left sides of elementarysub-basins) through a specifically-designed software mod-ule which, starting from a high-quality DTM, generates fullyconnected and complementary drainage and divide networks,and a wide spectrum of morphometric parameters of chan-nels and slopes (Carrara, 1988; Carrara et al., 1995). Mainslope units were then subdivided according to the main rocktypes cropping out in the basin. In this way, the study basinwas partitioned into 2245 terrain-units.
By overlaying this terrain-units map on the three landslide
F. Ardizzone et al.: Impact of mapping errors on the reliability of landslide hazard maps 9
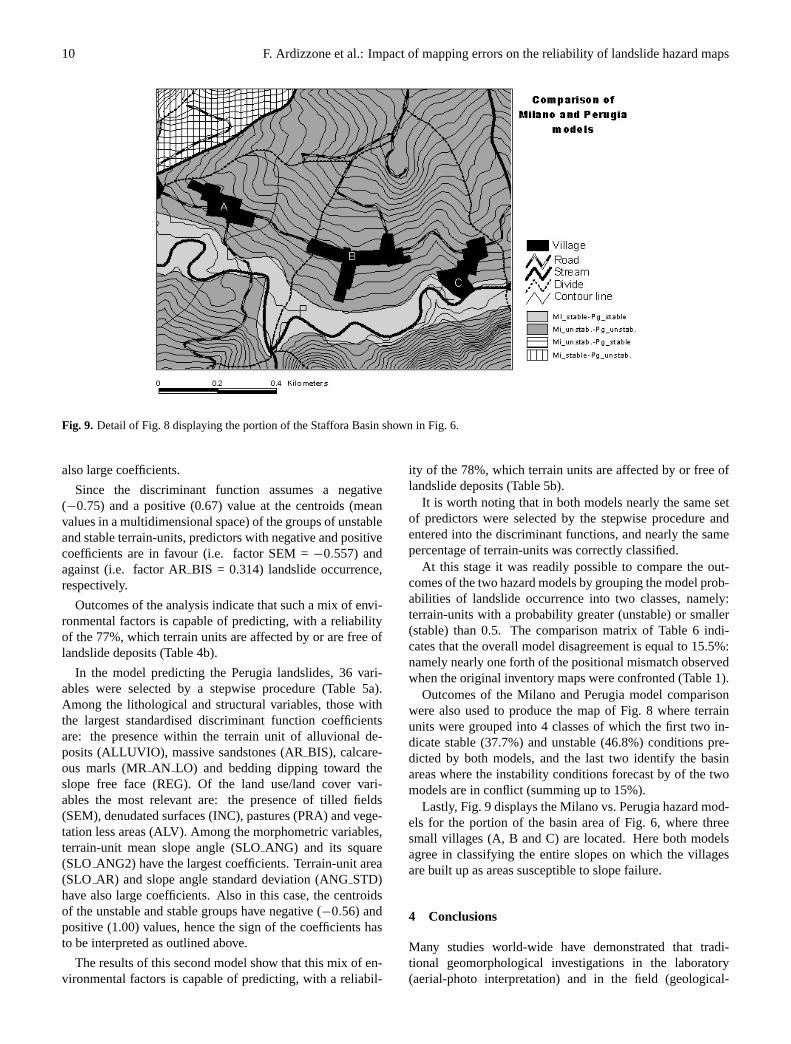
Fig. 8. Comparison of the landslide hazard maps derived from discriminant models for the Staffora Basin. Predicting variables are a set ofgeological-geomorphological factors of the basin (Tables 4 and 5) and predicted variables are the landslide inventory maps from either theMilano (Mi) or the Perugia (Pg) research teams.
inventories, the percentage of failed mass of each terrain-unitwas calculated and grouped into two classes: units with alandslide density greater or less than 5%. This class limitwas simply selected by estimating the maximum locationalerror due to the transfer of landslide polygons from the aerialphotographs to the base topographic maps.
The comparison of these reclassified density maps showedthat their differences range from 21.2 to 25.1%, nearly onethird of the positional mismatches observed when the origi-nal inventory maps were compared (Table 3).
This gain in agreement among different sources of land-slide data has a severe cost in terms of loss of spatial reso-lution, which should be compensated by introducing into thesystem new information derived from other data. This can beaccomplished by applying multivariate models.
3.4 Comparison of landslide multivariate models
The next phase of the investigation consisted in the devel-opment of multivariate models of landslide hazard for theStaffora Basin. The rationale and implementation of a statis-tical hazard model are described in detail in previous papers(Carrara et al., 1995, 1999; Guzzetti et al., 1999). Hence,here it will suffice to mention that a large (over 50 vari-ables) set of geological-morphological factors were acquired
and used as predictors of landslide hazard and the pres-ence/absence of landslide deposits within each terrain-unitas predicted (dependent) variable of a statistical multivariateprocedure (in the present work: discriminant analysis). Theoccurrence of landslide deposits was obtained from the in-ventory maps produced by research teams with the exclusionof the Pavia map because for this inventory the needed infor-mation on landslide characteristics could not be acquired.
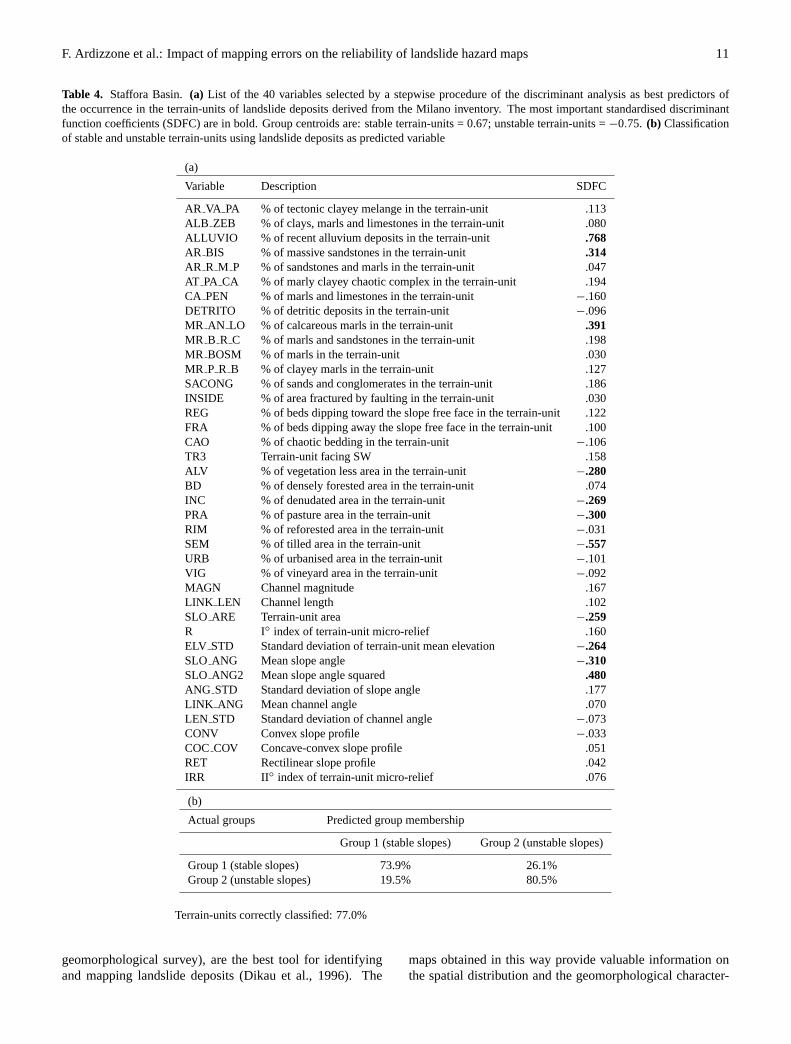
In the model predicting the Milano landslides, 40 variableswere selected by a stepwise procedure (Table 4a). Amongthe lithological variables, those with the largest standardiseddiscriminant function coefficients are: the presence withinthe terrain unit of alluvional deposits (ALLUVIO), massivesandstones (ARBIS) and calcareous marls (MRAN LO).Of the land use/land cover variables the most relevant are: thepresence of tilled fields (SEM), denudated surfaces (INC),pastures (PRA) and vegetation less areas (ALV). Amongthe morphometric variables, terrain-unit mean slope angle(SLO ANG) and its square (SLOANG2) have large coef-ficients witnessing a curvilinear relation between steepnessand landslide frequency, namely, landsliding first increaseswith slope angle up to a threshold value above which therelation does not hold true any more (Carrara et al., 1995).Terrain-unit area (SLOAR) and local relief (ELVSTD) have
10 F. Ardizzone et al.: Impact of mapping errors on the reliability of landslide hazard maps
Fig. 9. Detail of Fig. 8 displaying the portion of the Staffora Basin shown in Fig. 6.
also large coefficients.
Since the discriminant function assumes a negative(−0.75) and a positive (0.67) value at the centroids (meanvalues in a multidimensional space) of the groups of unstableand stable terrain-units, predictors with negative and positivecoefficients are in favour (i.e. factor SEM =−0.557) andagainst (i.e. factor ARBIS = 0.314) landslide occurrence,respectively.
Outcomes of the analysis indicate that such a mix of envi-ronmental factors is capable of predicting, with a reliabilityof the 77%, which terrain units are affected by or are free oflandslide deposits (Table 4b).
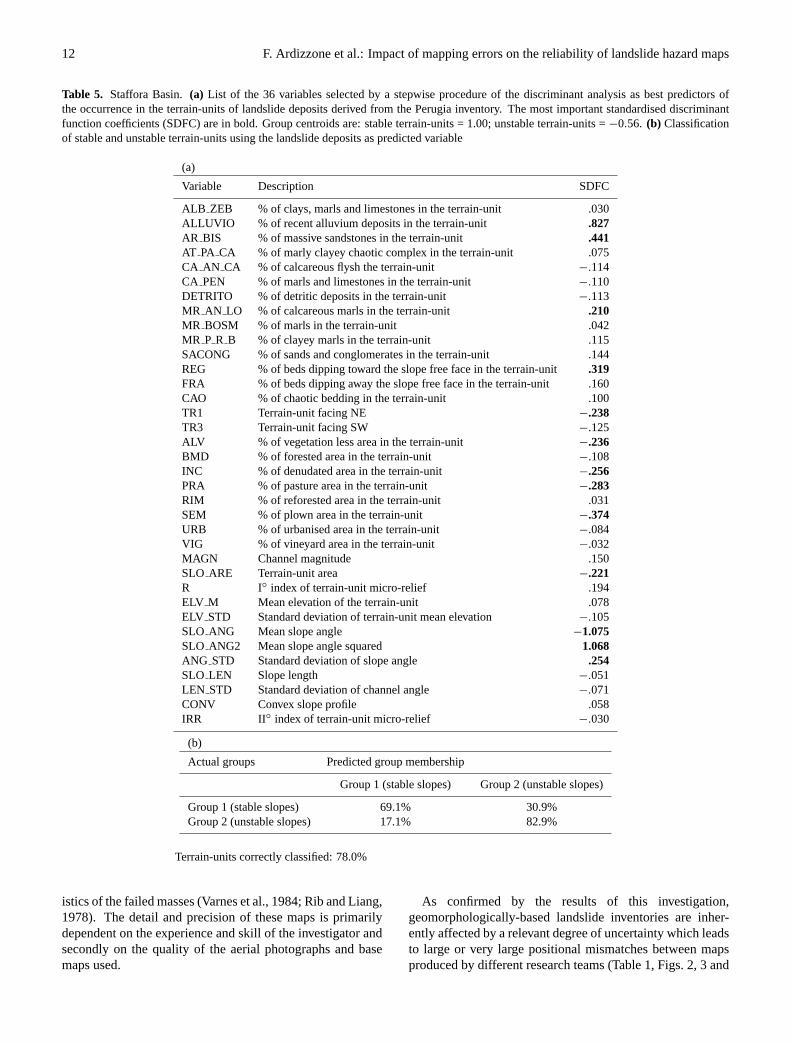
In the model predicting the Perugia landslides, 36 vari-ables were selected by a stepwise procedure (Table 5a).Among the lithological and structural variables, those withthe largest standardised discriminant function coefficientsare: the presence within the terrain unit of alluvional de-posits (ALLUVIO), massive sandstones (ARBIS), calcare-ous marls (MRAN LO) and bedding dipping toward theslope free face (REG). Of the land use/land cover vari-ables the most relevant are: the presence of tilled fields(SEM), denudated surfaces (INC), pastures (PRA) and vege-tation less areas (ALV). Among the morphometric variables,terrain-unit mean slope angle (SLOANG) and its square(SLO ANG2) have the largest coefficients. Terrain-unit area(SLO AR) and slope angle standard deviation (ANGSTD)have also large coefficients. Also in this case, the centroidsof the unstable and stable groups have negative (−0.56) andpositive (1.00) values, hence the sign of the coefficients hasto be interpreted as outlined above.
The results of this second model show that this mix of en-vironmental factors is capable of predicting, with a reliabil-
ity of the 78%, which terrain units are affected by or free oflandslide deposits (Table 5b).
It is worth noting that in both models nearly the same setof predictors were selected by the stepwise procedure andentered into the discriminant functions, and nearly the samepercentage of terrain-units was correctly classified.
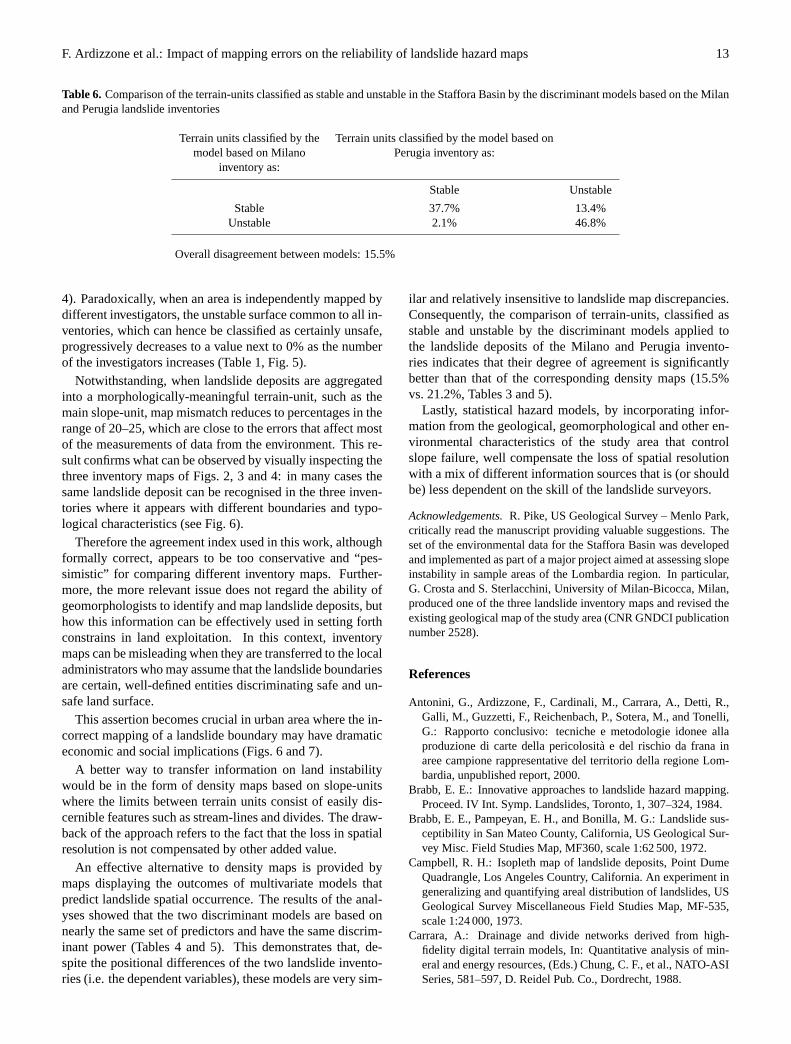
At this stage it was readily possible to compare the out-comes of the two hazard models by grouping the model prob-abilities of landslide occurrence into two classes, namely:terrain-units with a probability greater (unstable) or smaller(stable) than 0.5. The comparison matrix of Table 6 indi-cates that the overall model disagreement is equal to 15.5%:namely nearly one forth of the positional mismatch observedwhen the original inventory maps were confronted (Table 1).
Outcomes of the Milano and Perugia model comparisonwere also used to produce the map of Fig. 8 where terrainunits were grouped into 4 classes of which the first two in-dicate stable (37.7%) and unstable (46.8%) conditions pre-dicted by both models, and the last two identify the basinareas where the instability conditions forecast by of the twomodels are in conflict (summing up to 15%).
Lastly, Fig. 9 displays the Milano vs. Perugia hazard mod-els for the portion of the basin area of Fig. 6, where threesmall villages (A, B and C) are located. Here both modelsagree in classifying the entire slopes on which the villagesare built up as areas susceptible to slope failure.
4 Conclusions
Many studies world-wide have demonstrated that tradi-tional geomorphological investigations in the laboratory(aerial-photo interpretation) and in the field (geological-
F. Ardizzone et al.: Impact of mapping errors on the reliability of landslide hazard maps 11
Table 4. Staffora Basin.(a) List of the 40 variables selected by a stepwise procedure of the discriminant analysis as best predictors ofthe occurrence in the terrain-units of landslide deposits derived from the Milano inventory. The most important standardised discriminantfunction coefficients (SDFC) are in bold. Group centroids are: stable terrain-units = 0.67; unstable terrain-units =−0.75. (b) Classificationof stable and unstable terrain-units using landslide deposits as predicted variable
(a)
Variable Description SDFC
AR VA PA % of tectonic clayey melange in the terrain-unit .113ALB ZEB % of clays, marls and limestones in the terrain-unit .080ALLUVIO % of recent alluvium deposits in the terrain-unit .768AR BIS % of massive sandstones in the terrain-unit .314AR R M P % of sandstones and marls in the terrain-unit .047AT PA CA % of marly clayey chaotic complex in the terrain-unit .194CA PEN % of marls and limestones in the terrain-unit −.160DETRITO % of detritic deposits in the terrain-unit −.096MR AN LO % of calcareous marls in the terrain-unit .391MR B R C % of marls and sandstones in the terrain-unit .198MR BOSM % of marls in the terrain-unit .030MR P R B % of clayey marls in the terrain-unit .127SACONG % of sands and conglomerates in the terrain-unit .186INSIDE % of area fractured by faulting in the terrain-unit .030REG % of beds dipping toward the slope free face in the terrain-unit .122FRA % of beds dipping away the slope free face in the terrain-unit .100CAO % of chaotic bedding in the terrain-unit −.106TR3 Terrain-unit facing SW .158ALV % of vegetation less area in the terrain-unit −.280BD % of densely forested area in the terrain-unit .074INC % of denudated area in the terrain-unit −.269PRA % of pasture area in the terrain-unit −.300RIM % of reforested area in the terrain-unit −.031SEM % of tilled area in the terrain-unit −.557URB % of urbanised area in the terrain-unit −.101VIG % of vineyard area in the terrain-unit −.092MAGN Channel magnitude .167LINK LEN Channel length .102SLO ARE Terrain-unit area −.259R I◦ index of terrain-unit micro-relief .160ELV STD Standard deviation of terrain-unit mean elevation −.264SLO ANG Mean slope angle −.310SLO ANG2 Mean slope angle squared .480ANG STD Standard deviation of slope angle .177LINK ANG Mean channel angle .070LEN STD Standard deviation of channel angle −.073CONV Convex slope profile −.033COC COV Concave-convex slope profile .051RET Rectilinear slope profile .042IRR II◦ index of terrain-unit micro-relief .076
(b)
Actual groups Predicted group membership
Group 1 (stable slopes) Group 2 (unstable slopes)
Group 1 (stable slopes) 73.9% 26.1%Group 2 (unstable slopes) 19.5% 80.5%
Terrain-units correctly classified: 77.0%
geomorphological survey), are the best tool for identifyingand mapping landslide deposits (Dikau et al., 1996). The
maps obtained in this way provide valuable information onthe spatial distribution and the geomorphological character-
12 F. Ardizzone et al.: Impact of mapping errors on the reliability of landslide hazard maps
Table 5. Staffora Basin.(a) List of the 36 variables selected by a stepwise procedure of the discriminant analysis as best predictors ofthe occurrence in the terrain-units of landslide deposits derived from the Perugia inventory. The most important standardised discriminantfunction coefficients (SDFC) are in bold. Group centroids are: stable terrain-units = 1.00; unstable terrain-units =−0.56. (b) Classificationof stable and unstable terrain-units using the landslide deposits as predicted variable
(a)
Variable Description SDFC
ALB ZEB % of clays, marls and limestones in the terrain-unit .030ALLUVIO % of recent alluvium deposits in the terrain-unit .827AR BIS % of massive sandstones in the terrain-unit .441AT PA CA % of marly clayey chaotic complex in the terrain-unit .075CA AN CA % of calcareous flysh the terrain-unit −.114CA PEN % of marls and limestones in the terrain-unit −.110DETRITO % of detritic deposits in the terrain-unit −.113MR AN LO % of calcareous marls in the terrain-unit .210MR BOSM % of marls in the terrain-unit .042MR P R B % of clayey marls in the terrain-unit .115SACONG % of sands and conglomerates in the terrain-unit .144REG % of beds dipping toward the slope free face in the terrain-unit .319FRA % of beds dipping away the slope free face in the terrain-unit .160CAO % of chaotic bedding in the terrain-unit .100TR1 Terrain-unit facing NE −.238TR3 Terrain-unit facing SW −.125ALV % of vegetation less area in the terrain-unit −.236BMD % of forested area in the terrain-unit −.108INC % of denudated area in the terrain-unit −.256PRA % of pasture area in the terrain-unit −.283RIM % of reforested area in the terrain-unit .031SEM % of plown area in the terrain-unit −.374URB % of urbanised area in the terrain-unit −.084VIG % of vineyard area in the terrain-unit −.032MAGN Channel magnitude .150SLO ARE Terrain-unit area −.221R I◦ index of terrain-unit micro-relief .194ELV M Mean elevation of the terrain-unit .078ELV STD Standard deviation of terrain-unit mean elevation −.105SLO ANG Mean slope angle −1.075SLO ANG2 Mean slope angle squared 1.068ANG STD Standard deviation of slope angle .254SLO LEN Slope length −.051LEN STD Standard deviation of channel angle −.071CONV Convex slope profile .058IRR II◦ index of terrain-unit micro-relief −.030
(b)
Actual groups Predicted group membership
Group 1 (stable slopes) Group 2 (unstable slopes)
Group 1 (stable slopes) 69.1% 30.9%Group 2 (unstable slopes) 17.1% 82.9%
Terrain-units correctly classified: 78.0%
istics of the failed masses (Varnes et al., 1984; Rib and Liang,1978). The detail and precision of these maps is primarilydependent on the experience and skill of the investigator andsecondly on the quality of the aerial photographs and basemaps used.
As confirmed by the results of this investigation,geomorphologically-based landslide inventories are inher-ently affected by a relevant degree of uncertainty which leadsto large or very large positional mismatches between mapsproduced by different research teams (Table 1, Figs. 2, 3 and
F. Ardizzone et al.: Impact of mapping errors on the reliability of landslide hazard maps 13
Table 6. Comparison of the terrain-units classified as stable and unstable in the Staffora Basin by the discriminant models based on the Milanand Perugia landslide inventories
Terrain units classified by the Terrain units classified by the model based onmodel based on Milano Perugia inventory as:
inventory as:
Stable Unstable
Stable 37.7% 13.4%Unstable 2.1% 46.8%
Overall disagreement between models: 15.5%
4). Paradoxically, when an area is independently mapped bydifferent investigators, the unstable surface common to all in-ventories, which can hence be classified as certainly unsafe,progressively decreases to a value next to 0% as the numberof the investigators increases (Table 1, Fig. 5).
Notwithstanding, when landslide deposits are aggregatedinto a morphologically-meaningful terrain-unit, such as themain slope-unit, map mismatch reduces to percentages in therange of 20–25, which are close to the errors that affect mostof the measurements of data from the environment. This re-sult confirms what can be observed by visually inspecting thethree inventory maps of Figs. 2, 3 and 4: in many cases thesame landslide deposit can be recognised in the three inven-tories where it appears with different boundaries and typo-logical characteristics (see Fig. 6).
Therefore the agreement index used in this work, althoughformally correct, appears to be too conservative and “pes-simistic” for comparing different inventory maps. Further-more, the more relevant issue does not regard the ability ofgeomorphologists to identify and map landslide deposits, buthow this information can be effectively used in setting forthconstrains in land exploitation. In this context, inventorymaps can be misleading when they are transferred to the localadministrators who may assume that the landslide boundariesare certain, well-defined entities discriminating safe and un-safe land surface.
This assertion becomes crucial in urban area where the in-correct mapping of a landslide boundary may have dramaticeconomic and social implications (Figs. 6 and 7).
A better way to transfer information on land instabilitywould be in the form of density maps based on slope-unitswhere the limits between terrain units consist of easily dis-cernible features such as stream-lines and divides. The draw-back of the approach refers to the fact that the loss in spatialresolution is not compensated by other added value.
An effective alternative to density maps is provided bymaps displaying the outcomes of multivariate models thatpredict landslide spatial occurrence. The results of the anal-yses showed that the two discriminant models are based onnearly the same set of predictors and have the same discrim-inant power (Tables 4 and 5). This demonstrates that, de-spite the positional differences of the two landslide invento-ries (i.e. the dependent variables), these models are very sim-
ilar and relatively insensitive to landslide map discrepancies.Consequently, the comparison of terrain-units, classified asstable and unstable by the discriminant models applied tothe landslide deposits of the Milano and Perugia invento-ries indicates that their degree of agreement is significantlybetter than that of the corresponding density maps (15.5%vs. 21.2%, Tables 3 and 5).
Lastly, statistical hazard models, by incorporating infor-mation from the geological, geomorphological and other en-vironmental characteristics of the study area that controlslope failure, well compensate the loss of spatial resolutionwith a mix of different information sources that is (or shouldbe) less dependent on the skill of the landslide surveyors.
Acknowledgements.R. Pike, US Geological Survey – Menlo Park,critically read the manuscript providing valuable suggestions. Theset of the environmental data for the Staffora Basin was developedand implemented as part of a major project aimed at assessing slopeinstability in sample areas of the Lombardia region. In particular,G. Crosta and S. Sterlacchini, University of Milan-Bicocca, Milan,produced one of the three landslide inventory maps and revised theexisting geological map of the study area (CNR GNDCI publicationnumber 2528).
References
Antonini, G., Ardizzone, F., Cardinali, M., Carrara, A., Detti, R.,Galli, M., Guzzetti, F., Reichenbach, P., Sotera, M., and Tonelli,G.: Rapporto conclusivo: tecniche e metodologie idonee allaproduzione di carte della pericolosita e del rischio da frana inaree campione rappresentative del territorio della regione Lom-bardia, unpublished report, 2000.
Brabb, E. E.: Innovative approaches to landslide hazard mapping.Proceed. IV Int. Symp. Landslides, Toronto, 1, 307–324, 1984.
Brabb, E. E., Pampeyan, E. H., and Bonilla, M. G.: Landslide sus-ceptibility in San Mateo County, California, US Geological Sur-vey Misc. Field Studies Map, MF360, scale 1:62 500, 1972.
Campbell, R. H.: Isopleth map of landslide deposits, Point DumeQuadrangle, Los Angeles Country, California. An experiment ingeneralizing and quantifying areal distribution of landslides, USGeological Survey Miscellaneous Field Studies Map, MF-535,scale 1:24 000, 1973.
Carrara, A.: Drainage and divide networks derived from high-fidelity digital terrain models, In: Quantitative analysis of min-eral and energy resources, (Eds.) Chung, C. F., et al., NATO-ASISeries, 581–597, D. Reidel Pub. Co., Dordrecht, 1988.
14 F. Ardizzone et al.: Impact of mapping errors on the reliability of landslide hazard maps
Carrara, A., Cardinali, M., Detti, R., Guzzetti, F., Pasqui, V., andReichenbach, P.: GIS techniques and statistical models in evalu-ating landslide hazard, Earth Surface Processes and Landforms,16, 5, 427–445, 1991.
Carrara, A., Cardinali, M., and Guzzetti, F.: Uncertainty in assess-ing landslide hazard and risk, ITC Jour., 2, 172–183, 1992.
Carrara, A., Cardinali, M., Guzzetti, F., and Reichenbach, P.: GIStechnology in mapping landslide hazard, In: Geographical In-formation Systems in assessing Natural Hazards, (Eds) Carrara,A. and Guzzetti, F., Kluwer Pub., Dordrecht, The Netherlands,135–175, 1995.
Carrara, A., Guzzetti, F., Cardinali, M., and Reichenbach, P.: Useof GIS technology in the prediction and monitoring of landslidehazard, Natural Hazard, 20, 117–135, 1999.
Cruden, D. M. and Varnes, D. J.: Landslides types and processes,In: “Landslide: investigation and mitigation”, Transportation Re-search Board, Natural Academy of Science, 1994.
DeGraff, J. V.: Using isopleth maps of landslide deposits as a toolin timber scale planning, Bullettin American Association of En-gineering Geologists, 22, 445–453, 1985.
Dikau, R., Brunsden, D., Schrott, L., and Ibsen, M. L.: Landsliderecognition, identification, movements and causes, Chichester,UK, 251, 1996.
Guzzetti, F., Cardinali, M., Reichenbach, P., and Carrara, A.: Com-paring Landslide maps: a case study in the upper Tiber river
basin, Central Italy, Environmental Management, 25, 3, 247–263, 2000.
Guzzetti, F., Carrara, A., Cardinali, M., and Reichenbach, P.: Land-slide hazard evaluation: a review of current techniques and theirapplication in a multi-scale study, Central Italy, Geomorphology,31, 181–216, 1999.
Hansen, A.: Landslide hazard analysis, In: Slope Instability, (Eds.)Brunsden, D. and Prior, D. B., John Wiley and Sons, New York,523–602, 1984.
Hutchinson, J. N.: Keynote paper: landslide hazard assessment, In:Landslides, (Ed.) Bell, Balkema, Rotterdam, 1805–1841, 1995.
Rib, H. T. and Liang, T.: Recognition and identification, In: Land-slides analysis and control, (Eds.) Schuster, R. L., and Krizek,R. J., Washington Transportation research Board, Special Report176, National Academy of Sciences, Washington, 34–80, 1978.
Van Westen, C. J.: Application of Geographic Information Sys-tem to landslide hazard zonation ITC-Publication, 15, ITC, En-schede, 1993.
Varnes, D. J. and IAEG Commission on Landslides and OtherMass-Movements: Landslide hazard zonation: a review of prin-cipales and practice UNESCO Press, Paris, 1984.
Wright, R. H. and Nilsen, T. H.: Isopleth map of landslide de-posits, southern San Francisco Bay Region, California, US Geo-logical Survey Miscellaneous Field Studies Map, MF-550 (scale1:250 000), 1974.