Embed Size (px)
Citation preview

ORI GIN AL PA PER
Landslide hazard and risk assessment and theirapplication in risk management and landuse planningin eastern flank of Menoreh Mountains, YogyakartaProvince, Indonesia
Danang Sri Hadmoko • Franck Lavigne • Junun Sartohadi •
Pramono Hadi • Winaryo
Received: 12 May 2008 / Accepted: 20 December 2009 / Published online: 21 January 2010� Springer Science+Business Media B.V. 2010
Abstract The Menoreh Mountains in Yogyakarta are severely affected by landslides.
Due to the high population densities, mass movements are generally damaging and fatal.
More than other Javanese mountains, the Menoreh Mountains cumulate several factors
causing landslides. Therefore, it is necessary to evaluate the ways to map landslide risk in
order to improve the risk mitigation. The objectives of this paper are to provide landslide
hazard and risk assessment that will be useful for risk prevention and landuse planning in
the Menoreh Mountains. So far, risk management has been developed by the Research
Centre for Disasters Gadjah Mada University in collaboration with the Regional Devel-
opment Planner (BAPPEDA), which carries out fundamental and applied researches. The
results of the studies have been integrated in the risk prevention and landuse planning in
order to improve the integrated landslide mitigation programme.
Keywords Landslides � Hazard � Risk mapping � GIS � Risk management �Mitigation � Menoreh Mountains � Java
1 Introduction
Like in many countries in the world, landslides have become one of the major natural risks in
Indonesia. The death toll by landslides in Java is very high, due to the high frequency of
landslide events and the high level of people’s vulnerability. During the period of
1990–2005, a thousand of landslide disasters have been reported in Java. During this period,
D. S. Hadmoko � J. SartohadiResearch Center for Disasters, Gadjah Mada University, Yogyakarta, Indonesia
D. S. Hadmoko � F. LavigneUniversite Paris 1 Pantheon Sorbonne, Paris, France
D. S. Hadmoko (&) � J. Sartohadi � P. Hadi � WinaryoFaculty of Geography, Gadjah Mada University, Sekip-Bulaksumur, Yogyakarta 55281, Indonesiae-mail: [email protected]: http://www.hadmoko.staff.ugm.ac.id
123
Nat Hazards (2010) 54:623–642DOI 10.1007/s11069-009-9490-0

the death toll caused by landslides in Java exceeded 1,112 people and the number of people
injured reached 395 people. This vulnerability results mainly from the high density of
population and infrastructures located in the disaster prone areas. Landslide disasters also
become the major obstacle in development process because their economic losses are rel-
atively high (Guzzetti et al. 1999; Saha and Gupta 2002; Knapen et al. 2006) (Table 1).
Due to the high demand of public information related to spatial planning and envi-
ronmental protection, landslide hazard and risk assessment have become a fundamental
tool in risk management as an integral part of landuse planning in the disaster prone areas
(Gorsevski et al. 2006; Hadmoko 2007; Saldivar-Sali and Einstein 2007). Therefore,
evaluation of risks associated with landslides is an important challenge to develop proper
disaster management policies.
Varnes (1984) defined landslide hazard as the probability of occurrence of a potentially
damaging landslide within a specified period of time and within a given area. Hazard
assessments are commonly shown in maps, which display the spatial distribution or
zonation of hazard classes (Varnes 1984; Van Westen 1993). Landslide hazard zonation is
associated to the division of land in homogenous areas and their ranking according to
degrees of landslide hazard. It consists of two different aspects: assessing the terrain
susceptibility for a slope failure and determining the probability of a specific triggering
factor controlling landslides (Hadmoko 2007). Therefore, the hazard information should be
presented in a map in which the spatial information of degree of hazard is provided.
However, the temporal probability of landslide event is still difficult to be included in most
of hazard maps due to several factors: (1) absence of multi-temporal data of landslide
Table 1 Impacts of landslide disasters in Java during the period 1990–2005 to the houses, agricultural land,road and economic activities
No. Year Destruction
Housecompletelydamages
Housepartiallydamages
Agriculturearea (ha)
Road(m)
Estimatedeconomiclosses (euros)
1 2005 57 84 27 450 413,500
2 2004 68 179 169 155 650,500
3 2003 59 1354 93 235 1,816,900
4 2002 89 1119 129 607 1,772,100
5 2001 133 387 41 718 1,139,300
6 2000 182 626 1176 334 2,185,400
7 1999 120 459 89 307 1,575,900
8 1998 203 388 198 2362 1,592,200
9 1997 24 305 75 451 634,100
10 1996 131 632 58 858 1,508,800
11 1995 57 217 71 964 762,600
12 1994 125 191 266 1125,5 976,200
13 1993 88 153 221 136 736,600
14 1992 22 720 104,3 165,5 951,150
15 1991 32 264 229 345 603,700
16 1990 118 96 71 326 721 500
Total 1508 7174 3017,3 9539 18,040,450
Hadmoko (2006a, b)
624 Nat Hazards (2010) 54:623–642
123

events in the hazardous area; (2) heterogeneity of the subsurface conditions; scarcity of
input data; absence or insufficient length of historical records of the triggering events
(Terlien 1996; Van Westen et al. 2005). Consequently, most of the published hazard maps
have only presented the spatial information of landslide hazard and do not provide an
estimate of ‘‘when’’ landslides occur.
Risk is defined by Einstein (1997) as ‘‘Hazard * Worth of loss’’. Hence, risk is obtained
by combining the quantified hazard or probability of failure with a quantified expression of
the consequences. Quantification of consequences requires the identification of the impacts
in terms of associated losses. Possible consequences can be listed as damage to houses, to
utilities and to roads. The spatial distribution of landslide risk may be obtained by spatial
subdivision of the area under study and multiplication of spatial landslide probability,
affected zones, landuse or spatial distribution of population or property and vulnerability
(Dai et al. 2002). This type of calculation can easily be calculated through GIS tools
(Leone and Leroi 1996; Wang et al. 2005).
Various methods have been developed and applied to landslide hazard and risk
assessment in the last 20 years (Van Westen 1993; Terlien 1996), from the simplest
method to very complex methods, using a large number of landslide parameters (Wang
et al. 2005; Hadmoko 2007; Dai et al. 2002) classified landslide hazard and risk assessment
into two methods, i.e. qualitative and quantitative assessment. The choice of these methods
is largely depending on both the desired accuracy of the outcome and the nature of the
problem and should be compatible with the quality and quantity of available data. Gen-
erally, for a large area where the quality and quantity of available data are too limited for
quantitative analysis, a qualitative risk assessment may be more applicable; while for site-
specific slopes that are amenable to conventional limit equilibrium analysis, a detailed
quantitative risk assessment should be carried out.
Semi-quantitative assessments or heuristic method of landslide hazards have been
carried out by several scientists in Indonesia. For example, Dibyosaputro (1999), Mar-
diatno (2002) and Goenadi et al. (2003) had applied relative hazards map by using com-
bination between scoring and weighting methods in Kulon Progo Area. Layers of data were
superimposed in geographic information system (GIS) to create the landslide hazard map.
Scoring and weighting value were applied to all parameters used in the analysis based on
their relative contribution to landslide hazard. Based on the relative hazard information
value, final hazard map was presented.
The key aim of this paper is to present landslide hazard and risk assessment as basic
information for risk prevention and landuse planning in the eastern flank of Menoreh
Mountains in Central Java. A vector-based GIS was used to analyse several factors,
including slope, geology, soil and landuse that play a dominant role in landslide occur-
rence. The overlay operation in GIS is mostly used in this research in order to build hazard
and risk maps. Implementation of hazard and risk maps will be presented in landslide
prevision, prevention, protection countermeasures and landuse planning (Fig. 1).
2 Description of the study area
Situated at Kulonprogo District, the eastern flank of Menoreh Mountains is located 20 km
west of Yogyakarta City (Fig. 2). The study area, which consists of five districts i.e.
Samigaluh, Kalibawang, Girimulyo, Kokap and Nanggulan, covers approximately
343 km2. Menoreh Mountains are highly and densely populated (210,448 inhabitants and
655 inhab./km2 (Hadmoko 2006a).
Nat Hazards (2010) 54:623–642 625
123
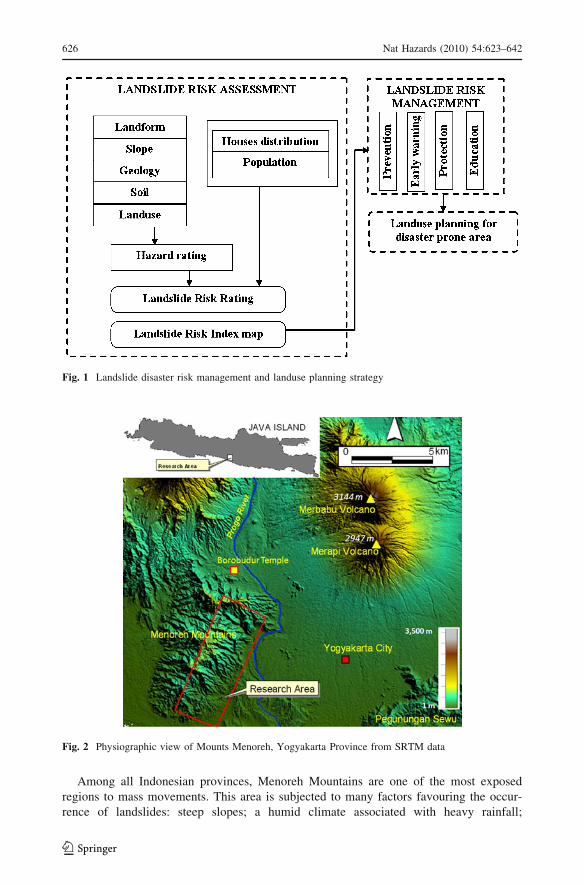
Among all Indonesian provinces, Menoreh Mountains are one of the most exposed
regions to mass movements. This area is subjected to many factors favouring the occur-
rence of landslides: steep slopes; a humid climate associated with heavy rainfall;
Fig. 1 Landslide disaster risk management and landuse planning strategy
Fig. 2 Physiographic view of Mounts Menoreh, Yogyakarta Province from SRTM data
626 Nat Hazards (2010) 54:623–642
123
earthquakes occurrence; human activity (mining, heavy development, agriculture). Dam-
age caused by landslides exceed hundreds of millions rupiahs (Table 1) that means tens of
thousands dollars. Moreover, local statistics and interviews carried out among local
communities living at risk underline an increasing of mass movement occurrence from the
late 1990s. For example, recurrent landslides in the Purworejo prefecture (west flank of the
Menoreh Mountains) made 56 victims since the catastrophic events of the 5th and 6th
November 2000. This example is representative of all mountainous areas in South Java.
Massive landslides affect deep slopes which has been stable for decades.
Menoreh’s climate is characterized by a humid tropical environment like others area in
Java. There are two pronounced seasons in this area: a rainy season from November to
April and a dry season from May to October. Maximum average annual rainfall calculated
in Samigaluh Station (?515 m asl) is 3107.1 mm (1973–2001), and minimum average
annual rainfall is reported in Nanggulan Station (?60 m asl) is 1563.1 mm (1973–2001).
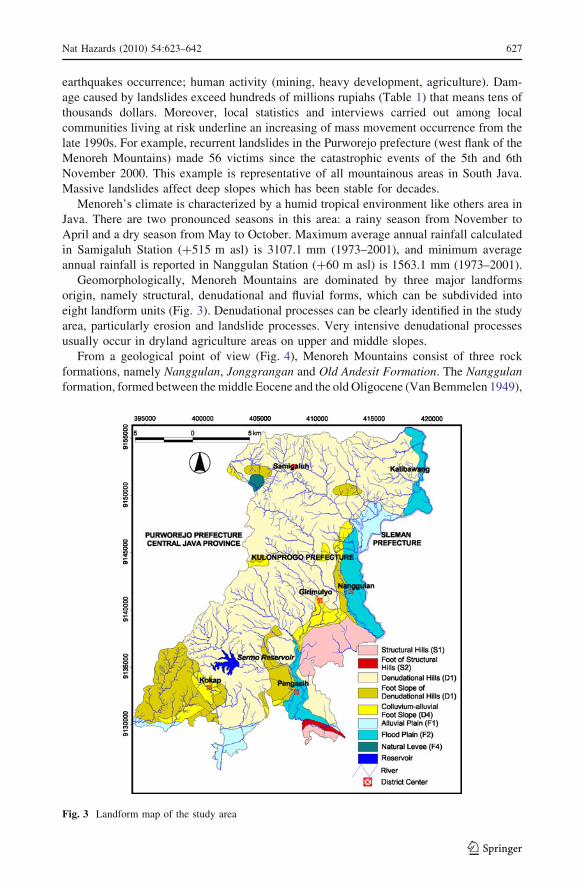
Geomorphologically, Menoreh Mountains are dominated by three major landforms
origin, namely structural, denudational and fluvial forms, which can be subdivided into
eight landform units (Fig. 3). Denudational processes can be clearly identified in the study
area, particularly erosion and landslide processes. Very intensive denudational processes
usually occur in dryland agriculture areas on upper and middle slopes.
From a geological point of view (Fig. 4), Menoreh Mountains consist of three rock
formations, namely Nanggulan, Jonggrangan and Old Andesit Formation. The Nanggulanformation, formed between the middle Eocene and the old Oligocene (Van Bemmelen 1949),
Fig. 3 Landform map of the study area
Nat Hazards (2010) 54:623–642 627
123
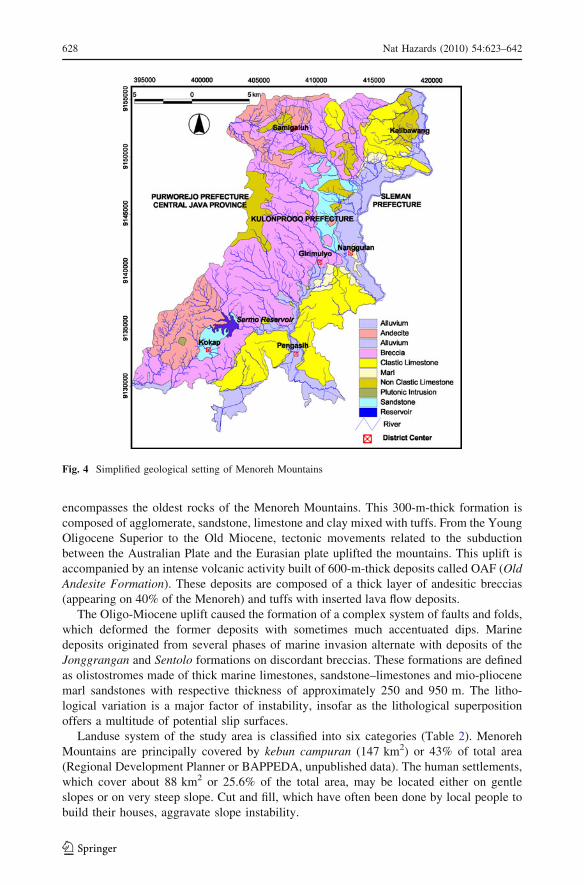
encompasses the oldest rocks of the Menoreh Mountains. This 300-m-thick formation is
composed of agglomerate, sandstone, limestone and clay mixed with tuffs. From the Young
Oligocene Superior to the Old Miocene, tectonic movements related to the subduction
between the Australian Plate and the Eurasian plate uplifted the mountains. This uplift is
accompanied by an intense volcanic activity built of 600-m-thick deposits called OAF (OldAndesite Formation). These deposits are composed of a thick layer of andesitic breccias
(appearing on 40% of the Menoreh) and tuffs with inserted lava flow deposits.
The Oligo-Miocene uplift caused the formation of a complex system of faults and folds,
which deformed the former deposits with sometimes much accentuated dips. Marine
deposits originated from several phases of marine invasion alternate with deposits of the
Jonggrangan and Sentolo formations on discordant breccias. These formations are defined
as olistostromes made of thick marine limestones, sandstone–limestones and mio-pliocene
marl sandstones with respective thickness of approximately 250 and 950 m. The litho-
logical variation is a major factor of instability, insofar as the lithological superposition
offers a multitude of potential slip surfaces.
Landuse system of the study area is classified into six categories (Table 2). Menoreh
Mountains are principally covered by kebun campuran (147 km2) or 43% of total area
(Regional Development Planner or BAPPEDA, unpublished data). The human settlements,
which cover about 88 km2 or 25.6% of the total area, may be located either on gentle
slopes or on very steep slope. Cut and fill, which have often been done by local people to
build their houses, aggravate slope instability.
Fig. 4 Simplified geological setting of Menoreh Mountains
628 Nat Hazards (2010) 54:623–642
123
Dry fields or tegalan system (44 km2 or 12.8% of the total area) is applied by local
people to cultivate non-arable land on steeper slopes when there is no irrigation available
in this area. Rice fields or sawah area (41 km2 or 12%) is generally found on gentle slope
where the irrigation system is available. Forest areas cover the smallest part of Menoreh
Mountains (10 km2 or 2.9% of total area) due to land conversion into settlements and
agriculture area.
3 Methods
3.1 Basic assumption
The fundamental principle of landslide hazard zonation in this research is ‘the past and thepresent are keys to the future (Varnes 1984; Carrara et al. 1991; Hutchinson 1995; Wang
et al. 2005). This principle which follows from uniformitarianism implies that slope fail-
ures in the future will be more likely to occur under the conditions which led to past and
present instability (Ercanoglul et al. 2004). Hence, the future landslides will occur under
conditions and factors equal or similar to those for comparable past landslides such as
slope, geology, soil, landuse.
It is further assumed that the causative factors for the mapped landslides remain almost
constant over time. Landslide occurrence, in space or time, can be inferred from heuristic
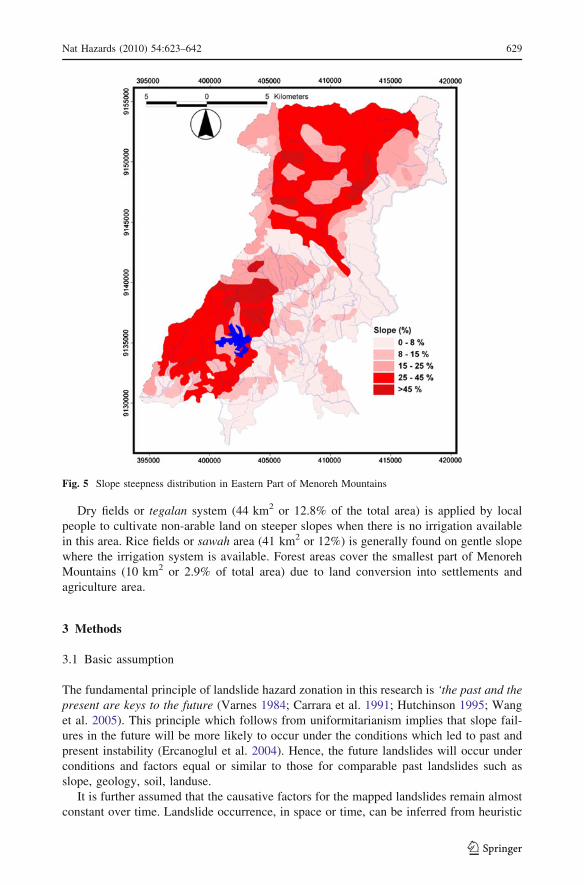
Fig. 5 Slope steepness distribution in Eastern Part of Menoreh Mountains
Nat Hazards (2010) 54:623–642 629
123
investigations, computed through the analysis of environmental information as a result of
combination of physical factors. Therefore, a territory can be zoned into hazard classes
ranked according to combination of certain factors (Guzzetti et al. 1999). In this research,
terrain susceptibility analysis to landslide has been conducted, which represents terrain
sensitivity to triggering factor such as rainfall and seismic acceleration.
3.2 Methods of obtaining the parameter maps
Five parameter maps were used in order to build landslide hazard maps, namely landform
map, slope map, geological map, soil map and landuse map. Detailed thematic data were
derived from existing topographical maps, aerial photographs and field surveys. These
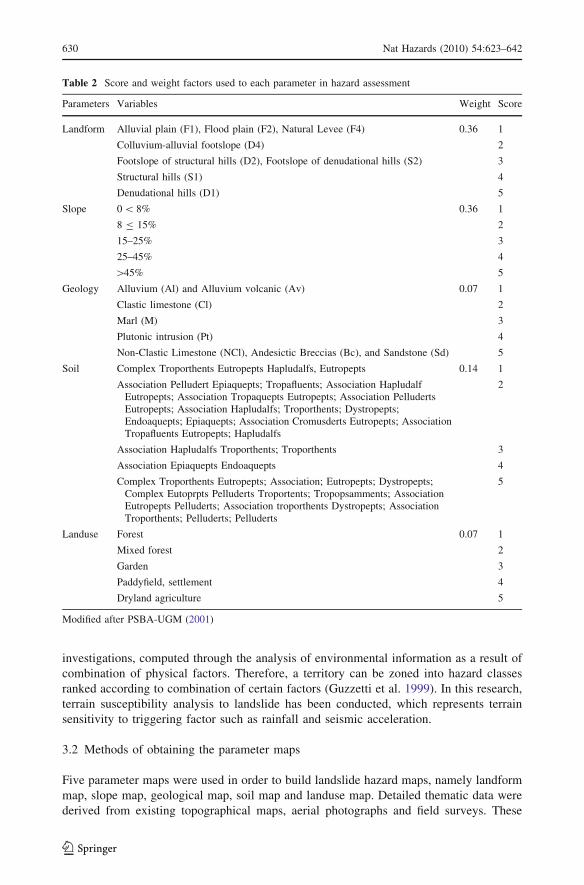
Table 2 Score and weight factors used to each parameter in hazard assessment
Parameters Variables Weight Score
Landform Alluvial plain (F1), Flood plain (F2), Natural Levee (F4) 0.36 1
Colluvium-alluvial footslope (D4) 2
Footslope of structural hills (D2), Footslope of denudational hills (S2) 3
Structural hills (S1) 4
Denudational hills (D1) 5
Slope 0 \ 8% 0.36 1
8 B 15% 2
15–25% 3
25–45% 4
[45% 5
Geology Alluvium (Al) and Alluvium volcanic (Av) 0.07 1
Clastic limestone (Cl) 2
Marl (M) 3
Plutonic intrusion (Pt) 4
Non-Clastic Limestone (NCl), Andesictic Breccias (Bc), and Sandstone (Sd) 5
Soil Complex Troporthents Eutropepts Hapludalfs, Eutropepts 0.14 1
Association Pelludert Epiaquepts; Tropafluents; Association HapludalfEutropepts; Association Tropaquepts Eutropepts; Association PelludertsEutropepts; Association Hapludalfs; Troporthents; Dystropepts;Endoaquepts; Epiaquepts; Association Cromusderts Eutropepts; AssociationTropafluents Eutropepts; Hapludalfs
2
Association Hapludalfs Troporthents; Troporthents 3
Association Epiaquepts Endoaquepts 4
Complex Troporthents Eutropepts; Association; Eutropepts; Dystropepts;Complex Eutoprpts Pelluderts Troportents; Tropopsamments; AssociationEutropepts Pelluderts; Association troporthents Dystropepts; AssociationTroporthents; Pelluderts; Pelluderts
5
Landuse Forest 0.07 1
Mixed forest 2
Garden 3
Paddyfield, settlement 4
Dryland agriculture 5
Modified after PSBA-UGM (2001)
630 Nat Hazards (2010) 54:623–642
123

maps were transferred into digital format in vector-based GIS by using ArcViewTM
software.
Landform map was produced based on stereo aerial photos interpretation. Landform
units are classified based on four parameters as main factors to classify landform unit i.e.
surface morphology, lithology, genesis, morphochronology and morphoarrangement. The
study area was identified into four major processes i.e. volcanic, structural, fluvial and
denudational processes. These four major processes were mapped and classify into eight
landforms unit (Fig. 3).
A triangular irregular network (TIN)-based digital elevation model (DEM) of a 1:25,000
topographical map was used to create the slope map. A TIN represents one or more
geographical layers, usually at least a surface layer, where space was partitioned into a set
of non-overlapping triangles. Attribute and geometry information was stored for the points,
lines and faces that comprise each triangle. By using the value of the each face, slope angle
can be obtained. Five slope categories were used in this analysis adopted from criteria for
landslide susceptibility assessment from Research Center for Disasters, Gadjah Mada
University (2001). These categories represent the different terrain morphology and clas-
sified according to gradients: Class I (0–8%): level to gently sloping; Class II ([8–15%):
gently sloping to undulating, Class III ([15–30%): undulating to moderately steep,
Class IV ([30–45%): moderately steep to steep, Class V ([45%): very steep (Table 2 and
Fig. 5).
Geological map (Fig. 4) was digitized from a 1:100,000 geological map (Raharjo et al.
1995). Eight geological units were mapped in Mountainous areas. These eight units of
geology were ranked into five categories of susceptibility based on the degree of weath-
ering, stability and the existence of faults. The 1:100,000 scale of geological map is used
although this scale is smaller than other parameters maps (1:25,000) due to the unavail-
ability of medium/large scale of geological map. Consequently, the smaller scale of
geological map caused the over-simplification of geological information e.g. lithology,
structure, weathering degree and rock stability. Therefore, extensive field works were
carried out in order to verify and to complete this information.
Soil map was obtained from a 1:25,000 scale map from the soil science department of
Gadjah Mada University. USDA classification was used to group the soil family. In
Menoreh Mountains, 25 soil families were identified and grouped into five categories
related to their contribution to landslide hazard based on the texture, drainage, soil
thickness and stability (Table 2).
Landuse map was used in order to rank the physical vulnerability to landslide hazard of
each landuse system. Landuse data were obtained from existing maps at 1:12,500 scales
and through the interpretation, colour aerial photographs in 1:20,000. In a 12,500 scale
map, five categories of landuse system were classified. Point data were digitized to obtain
the spatial distribution of houses. Based on the number of houses and of persons living in
each house, a risk index was created (Table 2).
3.3 Hazard assessment
Normally, a landslide hazard zonation consists of two major aspects e.g. spatial probability
of landslide occurrence which can be conducted by zoning different hazardous areas and
temporal probability which is related to the magnitude return period of the triggering event
and the occurrence of landslides (Varnes 1984). However, determining temporal proba-
bility is often not possible, due to the absence of historical landslide records that effectively
can be related with the historical records of the most important triggering events (rainfall
Nat Hazards (2010) 54:623–642 631
123
and earthquakes), scarcity of input data, or the absence or insufficient length of historical
records of the triggering events (Van Westen et al. 2003). These parameters are very site
specific and can only be modelled properly using deterministic models, which require large
amount of geotechnical data. This method is sometimes unsuitable for developing coun-
tries like Indonesia due to the high budget and time required.
Therefore, an alternative method to build landslide hazard map is needed in order to
solve these problems explained previously. The semi-quantitative system can be used to
bridge between qualitative and quantitative methods by evaluating the importance of
parameters in the generation of landslide hazard maps (Van Westen et al. 2003). This
method represents only the ‘spatial extension’ of landslide hazard but the temporal
probability cannot be included. The semi-quantitative method is also widely used in
developing countries like in Baguio Region, Philippines (Saldivar-Sali and Einstein 2007),
and San Antonio del Sur, Guantanamo, Cuba (Abella and Westen (2008). This method is
useful when quantitative parameters are limited whereas qualitative data are available. The
proposed method is based on relatively simple characteristics, which can be easily assessed
on the map and checked in the field or from available records. This makes it easily
applicable in developing countries like in Indonesia.
An indirect mapping approach was applied to establish the different landslide hazard
zones using classical overlay operations by using GIS after having established maps
representing major landslide influencing factors. We built mapping unit in order to assess
landslide hazard by using five parameters mentioned previously.
Before the overlay operation, maps of landform, slope, geology, soil and landuse were
firstly prepared. Each parameter map conditioning landslide occurrence is evaluated, by
giving score and weight, and repeated to all parameter maps separately. This method was
mainly based on the experts’ knowledge and experience (Watchal and Hudak 2000; PSBA-
UGM 2001; Abella and Westen 2008). Final hazard map can be obtained by calculation of
total score through combination between adding and multiplying operation in GIS by using
the following basic formula:
LHI ¼ 0:36LANDFþ 0:36SLOPþ 0:07GEOLþ 0:14SOILþ 0:07LUð Þ ð1Þ
where LHI is landslide hazard index, LANDF is landform unit, SLOP is slope map, GEOL
is geological map, SOIL is soil map, LU is landuse map, and the number are representing
weighting factors for each parameter map. The weighting factors were calculated based on
the relative contribution of each parameter to landslide hazards (Table 2). Weighting
process was carried out by comparing the relative contribution of each factor to landslide
hazard during the extensive field investigations. The weight values were decided by team
of experts using the checklist of factors and give them a ranking. Using trial and error
method, the weight-scoring values have been re-adjusted (Panday et al. 2008). The highest
weight value of parameter map is the most important factor to landslides (Watchal and
Hudak 2000; Abella and Westen 2008). Based on the assessment, weight value of land-
form, slope, geology, soil and landuse are 0.36; 0.36; 0.07; and 0.07, respectively, with the
total weight value is 1.00. Range values between 1 and 5 systems were used to classify the
score representing importance of each parameter to landslide. Based on the maximum and
minimum total scores of all parameters and the number of rank used, hazard levels can be
classified.
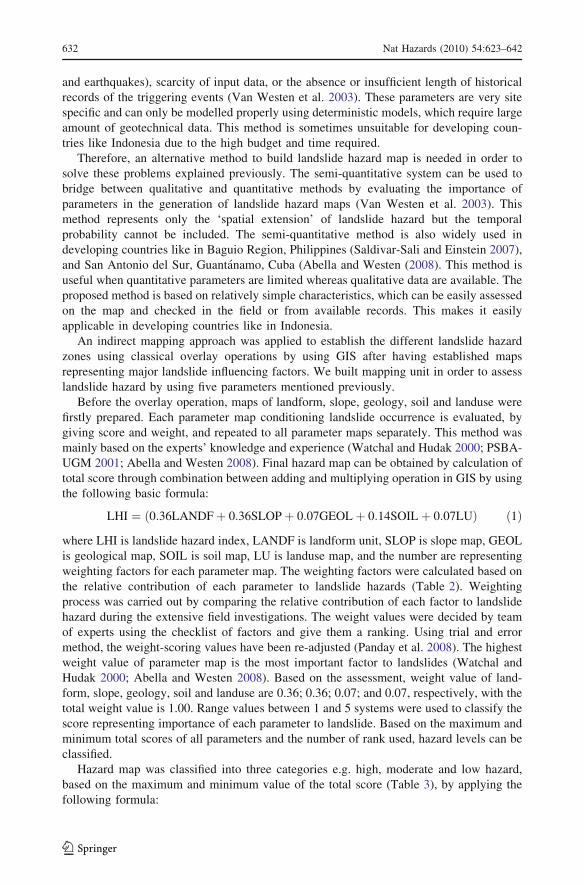
Hazard map was classified into three categories e.g. high, moderate and low hazard,
based on the maximum and minimum value of the total score (Table 3), by applying the
following formula:
632 Nat Hazards (2010) 54:623–642
123
Class interval ¼ Max value�min value
Number of class: ð2Þ
Hazard ratings range from 5 for the highest hazard zone to 1 for the lowest hazard zone.
Using this method, ranges are well represented by their average and values within each of
the ranges are fairly close together (Watchal and Hudak 2000).
3.4 Risk assessment
Landslide risks assessment in Menoreh Mountains had been carried out semi-quantitatively
by using risk index. Risk assessment was focused only on the number of populations
possibly threatened in each house or building mapped in the region (Table 4). In order to
calculate the density of building, we divided the number of houses by the surface of each
district (unit/km2). However, infrastructure and indirect loss induced by the disruption of
economic activities were not assessed. Legend of risk map consists of two fundamental
parameters: (1) landslide hazard index, which is displayed by hachured colour polygons
and (2) and risk index, which is presented by solid colour polygon (green, yellow and red).
4 Results
4.1 Landslide hazard map
Three hazard zones were obtained in this research (Fig. 6). Low hazard zones, which are
defined as stable and safe areas with no recognizable mass movement processes, are
usually located on flat—gentle slope (0–8%). This area is often associated with alluvial
plain, natural levee and colluvium-alluvial footslope and covered by alluvium and allu-
vium volcanic materials. The percentage of total area classified as low hazard zones is
75 km2 (22%).
The moderate hazard zones are usually associated with local evidence of shallow and
non-catastrophic landslides. Soil creep, inclined house, crack, tilted electrical pillars are the
common features identified in this zone. The damage is expected to be local and can be
prevented by relatively simple and inexpensive stabilization measures. These areas
encompass the lower and partially middle slopes of Menoreh Mountains, including
footslope of structural and denudational hills. About 180 km2 (54%) was classified as
Table 3 Hazard level classifica-tion criteria based on the totalscore
No. Interval value Hazard level
1 1–2,33 Low
2 2.34–3.67 Medium
3 3.68–5 High
Table 4 Criteria used to deter-mine the risk index
PSBA-UGM (2001)
No Persons threatened Risk index
1 No Low
2 1–10 Medium
3 [10 High
Nat Hazards (2010) 54:623–642 633
123

moderate hazard zone, which is characterized by moderate—steep slope (15–30%), and
soil thickness is 2–4 m. Geologically, this zone is usually occupied by fractured weathered
rocks whereas dips are parallel with slope inclination. Landslide occurrences are relatively
high, about 10–25 landslide events occur every year.
Within the high hazard zone, a lot of catastrophic landslides, usually deep-seated
landslides, ever occurred. These areas clearly show recognizable evidence of active
landslides or reactivation in parts of the old landslide units, with some sliding currently
taking place. The percentage of total area with very high landslide susceptibility is 81 km2
(24%). Slope steepness of these areas is more than 30%, soil thickness[4 m, dips parallel
with slopes, rocks occupied by fractures, more than 25 landslides events occurring every
year. Landslide occurrence is expected to cause victims, damage infrastructure, building
and agriculture area. Building construction should be avoided in these areas or at least not
until effective mitigation measures are installed.
4.2 Landslide risk map
We defined the potential consequences of landslides, through a combination of the land-
slide hazard and a typology of damage related to landslide risk i.e. potential loss of life and
loss of property. Risk information can be classified into three levels such as high, moderate
and low. We obtained seven combinations between the risk and hazard level (Fig. 7). For
the low hazard and low risk combination, we assumed that in the low hazard zone, there is
Fig. 6 Landslide hazard map of Menoreh Mountains
634 Nat Hazards (2010) 54:623–642
123

no possibility of landslide occurrence, so the risk level is considered as low although there
is more than one person living in these houses.
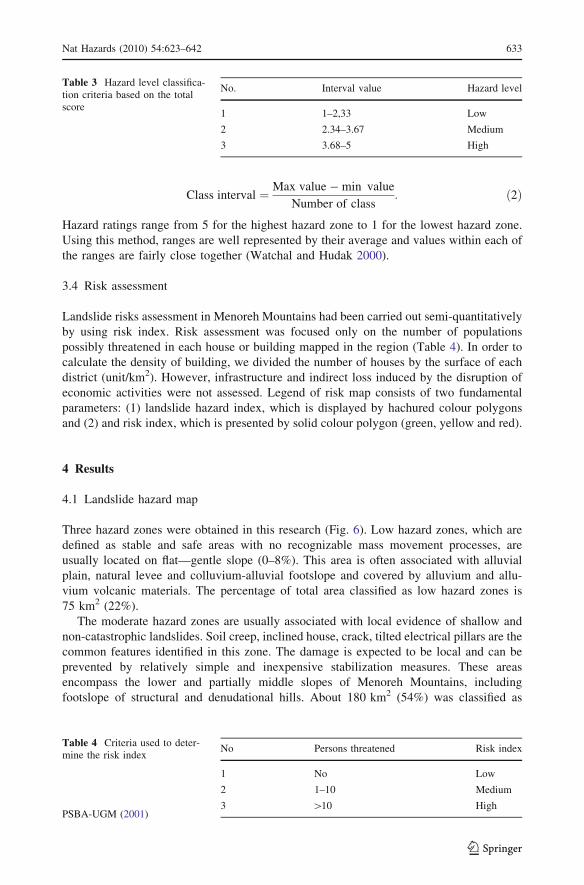
There are 21,254 houses including the building of public facilities such as schools,
offices and hospitals mapped in the whole study area (Fig. 8a). We found that Pengasih is
the most densely district followed by Kokap, Kalibawang, Girimulyo, Samigaluh and
Naggulan that the density reached 150, 64, 56, 47, 46 and 46 unit/km2, respectively.
Analysis of potential risk shows that the highest risk for buildings is in Girimulyo (408
units) and followed by Kokap (369 units), Samigaluh (363 units). We found only 12 units
of buildings in Pengasih and 32 units in Nanggulan, which were identified as high risk to
landslides (Fig. 8b). The calculations of total risky building in Menoreh show that 6% of
houses were identified as high risk, 55% were classified as medium risk and 39% were
classified as low risk. The majority of houses were classified to moderate risk because the
majority of houses and buildings are occupied by 1–10 people.
4.3 Implication of landslide hazard and risk map on landuse planning
The development of scientific products such as landslide hazard maps, risk maps and
reports are not effective in reducing the landslide impacts unless this information is con-
cretely applied by local (desa, kecamatan), regional (kabupaten, propinsi) and national
government organization. Public awareness and landuse planning have also been taken into
Fig. 7 Zoom of risk map in the northern part of research area with the legend showing the look up table ofhazard and risk index. Only hazard map and the number of persons living in each house were considered tocalculate risk map
Nat Hazards (2010) 54:623–642 635
123
account by government and became an important aspect in landuse planning and legally
documented as a law (undang-undang), national and regional policy (peraturan pemer-intah, peraturan daerah).
Planning measures at national, regional and local level are the one of the political and
economical ways to reduce landslide losses (Lateltin et al. 2005; Stanganell 2008). It can
be accomplished by applying the landuse planning in disaster prone area based on the
spatial landslide hazard and risk information. The first priority in selecting measures
implies appropriate landuse planning for local management plan purpose such as prohi-
bition, restriction and regulation for the developments in landslide-prone areas. Therefore,
the risk information will enable decision-makers, communities and individuals to make
informed decisions on where to live, to build infrastructures or business areas.
Fig. 8 a chart showing the building density and area in six districts of Menoreh Mountains and b number ofbuildings for each risk level in six districts of Menoreh Mountains
636 Nat Hazards (2010) 54:623–642
123
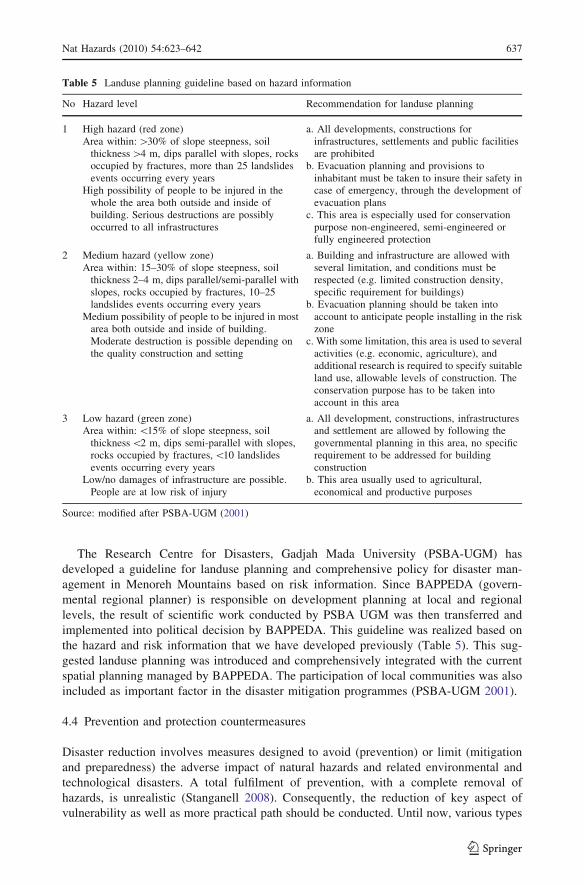
The Research Centre for Disasters, Gadjah Mada University (PSBA-UGM) has
developed a guideline for landuse planning and comprehensive policy for disaster man-
agement in Menoreh Mountains based on risk information. Since BAPPEDA (govern-
mental regional planner) is responsible on development planning at local and regional
levels, the result of scientific work conducted by PSBA UGM was then transferred and
implemented into political decision by BAPPEDA. This guideline was realized based on
the hazard and risk information that we have developed previously (Table 5). This sug-
gested landuse planning was introduced and comprehensively integrated with the current
spatial planning managed by BAPPEDA. The participation of local communities was also
included as important factor in the disaster mitigation programmes (PSBA-UGM 2001).
4.4 Prevention and protection countermeasures
Disaster reduction involves measures designed to avoid (prevention) or limit (mitigation
and preparedness) the adverse impact of natural hazards and related environmental and
technological disasters. A total fulfilment of prevention, with a complete removal of
hazards, is unrealistic (Stanganell 2008). Consequently, the reduction of key aspect of
vulnerability as well as more practical path should be conducted. Until now, various types
Table 5 Landuse planning guideline based on hazard information
No Hazard level Recommendation for landuse planning
1 High hazard (red zone)Area within: [30% of slope steepness, soil
thickness [4 m, dips parallel with slopes, rocksoccupied by fractures, more than 25 landslidesevents occurring every years
High possibility of people to be injured in thewhole the area both outside and inside ofbuilding. Serious destructions are possiblyoccurred to all infrastructures
a. All developments, constructions forinfrastructures, settlements and public facilitiesare prohibited
b. Evacuation planning and provisions toinhabitant must be taken to insure their safety incase of emergency, through the development ofevacuation plans
c. This area is especially used for conservationpurpose non-engineered, semi-engineered orfully engineered protection
2 Medium hazard (yellow zone)Area within: 15–30% of slope steepness, soil
thickness 2–4 m, dips parallel/semi-parallel withslopes, rocks occupied by fractures, 10–25landslides events occurring every years
Medium possibility of people to be injured in mostarea both outside and inside of building.Moderate destruction is possible depending onthe quality construction and setting
a. Building and infrastructure are allowed withseveral limitation, and conditions must berespected (e.g. limited construction density,specific requirement for buildings)
b. Evacuation planning should be taken intoaccount to anticipate people installing in the riskzone
c. With some limitation, this area is used to severalactivities (e.g. economic, agriculture), andadditional research is required to specify suitableland use, allowable levels of construction. Theconservation purpose has to be taken intoaccount in this area
3 Low hazard (green zone)Area within: \15% of slope steepness, soil
thickness \2 m, dips semi-parallel with slopes,rocks occupied by fractures, \10 landslidesevents occurring every years
Low/no damages of infrastructure are possible.People are at low risk of injury
a. All development, constructions, infrastructuresand settlement are allowed by following thegovernmental planning in this area, no specificrequirement to be addressed for buildingconstruction
b. This area usually used to agricultural,economical and productive purposes
Source: modified after PSBA-UGM (2001)
Nat Hazards (2010) 54:623–642 637
123
of practical aspects of risk mitigation in order to reduce the vulnerability have been carried
out. Prevention and protection of the risks were already set up by several local authorities,
non-governmental organisations and the universities in Menoreh Mountains by using
various methods (technical and social methods).
The prevention social approach proves to be fundamental in a developing country like
Indonesia. The purpose of social risk prevention is in order to provide information to the
people in evacuation and alert system purposes. Public awareness was realised by Direc-
torate of Volcanology and Geological Hazard Mitigation for the whole area in Java dif-
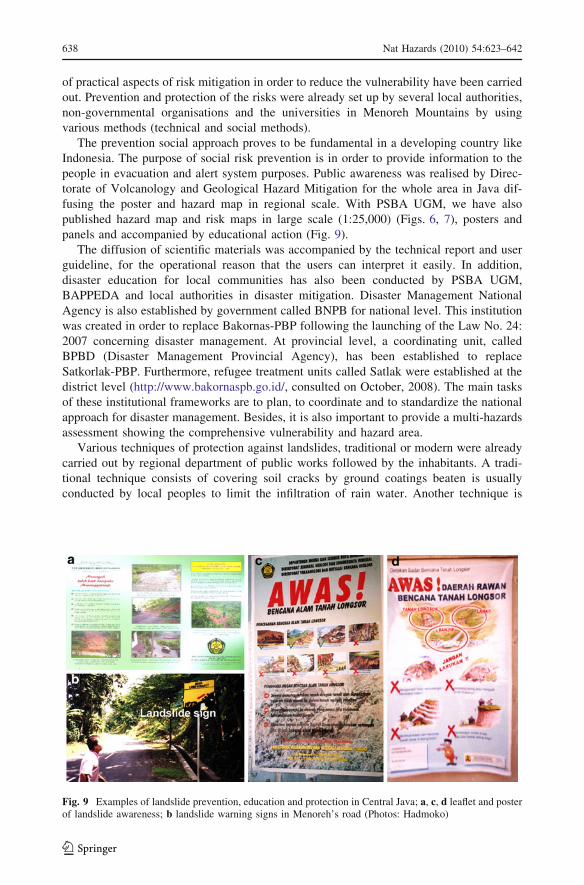
fusing the poster and hazard map in regional scale. With PSBA UGM, we have also
published hazard map and risk maps in large scale (1:25,000) (Figs. 6, 7), posters and
panels and accompanied by educational action (Fig. 9).
The diffusion of scientific materials was accompanied by the technical report and user
guideline, for the operational reason that the users can interpret it easily. In addition,
disaster education for local communities has also been conducted by PSBA UGM,
BAPPEDA and local authorities in disaster mitigation. Disaster Management National
Agency is also established by government called BNPB for national level. This institution
was created in order to replace Bakornas-PBP following the launching of the Law No. 24:
2007 concerning disaster management. At provincial level, a coordinating unit, called
BPBD (Disaster Management Provincial Agency), has been established to replace
Satkorlak-PBP. Furthermore, refugee treatment units called Satlak were established at the
district level (http://www.bakornaspb.go.id/, consulted on October, 2008). The main tasks
of these institutional frameworks are to plan, to coordinate and to standardize the national
approach for disaster management. Besides, it is also important to provide a multi-hazards
assessment showing the comprehensive vulnerability and hazard area.
Various techniques of protection against landslides, traditional or modern were already
carried out by regional department of public works followed by the inhabitants. A tradi-
tional technique consists of covering soil cracks by ground coatings beaten is usually
conducted by local peoples to limit the infiltration of rain water. Another technique is
Fig. 9 Examples of landslide prevention, education and protection in Central Java; a, c, d leaflet and posterof landslide awareness; b landslide warning signs in Menoreh’s road (Photos: Hadmoko)
638 Nat Hazards (2010) 54:623–642
123
improving the drainage pipes in bamboo which is introduced into the slope vulnerable to
landslides. The bioengineering technique became also alternative protection countermea-
sures which have been applied to the several slope conditions. This technique is relatively
cheaper and community-friendly which can be conducted by local peoples (Karnawati
et al. 2004). A modern technique is construction of retaining concrete walls or small gabion
(walls of unsealed blocks and retained by a net) intended to stabilize or consolidate the
slopes along principal roads.
5 Discussion
Qualitative, semi-quantitative and quantitative methods have been developed by scientists
to estimate hazard and risk level. Each technique has advantages and limitations that can be
adapted to the available data and the type of information that we need. In this research, we
used semi-quantitative method in order to quantify the qualitative parameters which are
directly influencing landslide processes.
Geomorphological maps, geological maps and soil maps have only qualitative infor-
mation about the physical features of terrain. Therefore, we have to quantify these
parameters in order to assess landslide hazards. For example, the lithological information
can be quantified by different weathering level, the existence of joints and cracks, and
bedding plane direction etc. Soil unit map can be quantified by using its parameters such as
soil depth, swelling and shrinkage parameters, permeability. The main assumptions of this
research are: (1) each factor previously mentioned has different contribution to landslide
process and (2) the future landslides will occur in the susceptible area based on the
geomorphological, geological, slope, soil and landuse condition (Guzzetti et al. 1999).
Semi-quantitative method is widely used in Indonesia to assess the hazard level for the
area that the several parameters are difficult to be obtained such as landslide occurrence,
rainfall, seismic acceleration, groundwater fluctuation Dibyosaputro (1999), Mardiatno
(2002) and Goenadi et al. (2003). By using this method, reliable maps over larger areas
with limited costs and time availability can be provided (Van Westen et al. 2005). The
current method was done during 4 months of intensive works with the budget less than
4,000 USD. Therefore, it is applicable for the developing country like Indonesia in order to
anticipate budget and time limitation. In addition, this method is relative simple compared
by the quantitative method such as deterministic model.
The Indonesian standard for landslide hazard and risk mapping is currently unavailable
at SNI (Indonesian National Standard) (http://www.idsn.or.id). However, several Indone-
sian governmental institutions have their own version to represent landslide hazard maps
(e.g. Ministry of Public Work, National Agency for Survey and Mapping (BAKOSURT-
ANAL), and Directorate of Volcanology and Geological Hazard Mitigation (DVGHM)).
BAPPEDA and PSBA UGM built their own standard through this work, in order to provide
comprehensive and simple landslide hazard and risk maps which can be used easily by
scientists and decision-makers (local and regional authorities) on risk prevention and
landuse planning. The maps are also supported by technical user guide which is clearly
understandable.
However, there are several limitations have to be taken into account for the very
detailed hazard information or for engineering purposes. Within this approach, expert
opinions are used to estimate landslide potential from data on preparatory variables. This
approach is based on the assumption that the relationships between landslide susceptibility
and the preparatory variables are known and are specified in the models (Dai et al. 2002).
Nat Hazards (2010) 54:623–642 639
123

Its reliability depends largely on how well and how much the investigator understands the
geomorphological processes acting upon the terrain (Guzzetti et al. 1999). This assumption
causes several uncertainties concerning the hazard and risk level. This information is
therefore resulted from subjective assessment of experts; consequently, a scientific vali-
dation is necessary to verify the result of hazard and risk.
The resultant landslide hazard values cannot be considered as absolute values because
the parameters used were the resultant of quantification of qualitative parameters. The term
of high, moderate and low hazard could not be compared by another product resulted by
another scientist in different area because these terms would be have different meaning. In
addition, we used only the relative static parameters in hazard assessment, and the trig-
gering factors such as rainfall and seismic acceleration were not considered in this
research; consequently, the temporal probability of landslides could not be assessed.
Since this work is intended to evaluate the qualitative information concerning potential
risk and due to the limitation of budget and time availability, the detailed information
concerning types and number of properties of each sub-district cannot be provided.
However, the information provided by this work would be valuable to the local govern-
ment in order to support on decision-making concerning landuse planning. In addition,
there is no research related to landslide risk assessment conducted in the study area;
therefore, this work became a pioneer and extendable for other areas in Indonesia. Detailed
information on the properties, infrastructures such as schools, offices, mosques, churches is
recommended to be included for the future research.
In order to improve the result of heuristic methods, Hadmoko and Lavigne (2007) have
been introducing a detailed spatio-temporal analysis for preparation of landslide hazard
maps in parts of Menoreh Mountains. This method has been carried out in order to assess
the temporal probability of landslides based on the historical data of landslides, the trig-
gering factors such as intensity, duration and antecedent rainfall and to improve the current
result of hazard and risk map. It is expected that the project would be extended to other
areas, which have high susceptibility to landslide. This work would be valuable to support
the government mitigation programme as well as it will be helpful to develop a landslide
hazard and risk assessment model for the area.
As pointed out in the previous section that the important efforts have been applied for
the assessment and management of landslide hazards such as risk prevention, public
awareness and protection by several institutions e.g. governmental, educational and non-
governmental organizations. Mitigation efforts i.e. hazard and risk mapping, scientific
researches, prevention and protection countermeasures have been applied. Landuse plan-
ning guideline based on landslide risk information has also been developed in district
levels is among the tools for landslide risk management.
However, many landslides are still occurring, triggering a considerable number of
destruction and victims. This phenomenon is probably caused by several constraints in
disaster mitigation programme. An integrated and multi-sectoral approach to risk man-
agement is currently still limited. Until now, many difficulties are still involved from
conceptual and practical aspects, including scientific barriers, administrative/bureaucratic
structures and the risk comprehensions to the society. This problem should be taken into
account as an important aspect to be considered as next action towards improved inte-
gration of landslide risk management and planning actions in landslide disaster prone area.
In addition, there is no sustainability of disaster education for local people. Hazard edu-
cation should be conducted regularly in order to build the better perception and under-
standing for local people regarding to landslide hazard and risk.
640 Nat Hazards (2010) 54:623–642
123
6 Conclusion
Landslide disasters became a serious problem in Java particularly in Menoreh Mountains
as a result of physical–natural factors (e.g. high of rainfall intensity, domination of
mountainous area, intensive weathering processes). In addition, high demand of land due to
the rapid increase of population might aggravate the vulnerability. This phenomenon has
encouraged scientists to build landslide hazard and risk map in order to assess the most
hazardous area to landslides. Such maps are useful to provide the information for landslide
disaster mitigation programme. These hazard and risk assessments are followed by the
diffusion of scientific materials in order to educate the local peoples and to build their
perception to landslide risk. Several efforts were also being conducted in disaster miti-
gation through formal and non-formal education. However, there are still many constrains
have to be solved in order to obtain the better result. Therefore, an efficient management on
landslide risk, the coordination between regions, departments concerned, universities,
research centres, non-governmental organisations and local peoples in landslide-prone
would be helpful in order to obtain the better risk management. This coordination and
communication would minimize the wasting budget, man power, time allocation and miss-
communication of decisions taken in future.
Acknowledgments The authors thankful to the governmental regional planner (BAPPEDA) of Kulon-progo district, Yogyakarta Special Province, who had supported this work, as well as the Laboratoire deGeographie Physique, UMR 8591 CNRS, France, and the French Embassy in Indonesia. We acknowledgeResearch Centre for Disasters, Gadjah Mada University (PSBA UGM), for all the service and help duringthe field work and data processing, as well as the Directorate Volcanology and Geological Hazard Miti-gation, who provided the landslide data in Java.
References
Abella EAC, Van Westen CJ (2008) Qualitative landslide susceptibility assessment by multicriteria anal-ysis: a case study from San Antonio del Sur, Guantanamo, Cuba. Geomorphology 94:453–466. doi:10.1016/j.geomorph.2006.10.038
Carrara A, Cardinali M, Detti R, Guzzetti F, Pasqui V, Reichenbach P (1991) GIS techniques and statisticalmodels in evaluating landslide hazard. Earth Surf Process Landf 16:427–445. doi:10.1002/esp.3290160505
Dai FC, Lee CF, Ngai YY (2002) Landslide risk assessment and management: an overview. Eng Geol64:65–87. doi:10.1016/S0013-7952(01)00093-X
Dibyosaputro S (1999) Landslide in Samigaluh Sub Distric, Kulonprogo Prefecture, Yogyakarta SpecialProvince. Scientific report. Gadjah Mada University (in Indonesian)
Einstein HH (1997) Landslide risk—systematic approaches to assessment and management. In: Cruden F(eds) Proceedings landslide risk assessment, Honolulu, Balkema
Ercanoglul M, Gokceoglu C, Van Asch TWJ (2004) Landslide susceptibility Zoning North of Yenice (NWTurkey) by multivariate statistical techniques. Nat Hazards 32:1–23
Goenadi S, Sartohadi J, Hardiyatmo HC, Hadmoko DS, Giyarsih SR (2003) Integrated land conservationin landslide hazardous area, Kulonprogo, Yogyakarta Special Province. Scientific report of HibahBersaing, Gadjah Mada University (in Indonesian)
Gorsevski PV, Gessler PE, Boll J, Elliot WJ, Foltz RB (2006) Spatially and temporally distributed modellingof landslide susceptibility. Geomorphology 80:178–198. doi:10.1016/j.geomorph.2006.02.011
Guzzetti F, Carrara A, Cardinali M, Reichenbach P (1999) Landslide hazard evaluation: a review of currenttechniques and their application in a multi-scale study, Central Italy. Geomorphology 31:181–216. doi:10.1016/S0169-555X(99)00078-1
Hadmoko DS (2006a) Les mouvements de terrain dans les Monts Menoreh: declenchement, dynamique,alea, modelisation spatio-temporelle et risques associes, M.Sc. Thesis, Universite Paris 1, PantheonSorbonne, France, pp 83 (unpublised)
Nat Hazards (2010) 54:623–642 641
123
Hadmoko DS (2006b) Wet season and related natural disasters: learning from several cases of landslides inJava. Paper presented on the seminar on disasters, research center for disasters, Gadjah Mada Uni-versity. Indonesia (Dec):29 (in Indonesian)
Hadmoko DS (2007) Toward GIS-based integrated landslide hazard assessment: a critical overview.Indonesian J Geogr 34:55–77
Hadmoko DS, Lavigne F (2007) Landslides in Menoreh Mountains, Central Java, Indonesia: dynamics,triggering, spatio-temporal analysis, and associated hazards. Paper presented on the internationalconference of international association of geomorphologists on environmental change in the tropic.Kota Kinabalu, Sabah, Malaysia 22–25 June
Hutchinson JN (1995) Keynote paper: landslide hazard assessment. In: Bell DH (ed) Landslides. Balkema,Rotterdam, pp 1805–1841
Karnawati D, Ibriam I, Anderson MG, Holcombe EA, Mummery GT, Renaud JP, Wang Y (2004) An initialapproach to identifying slope stability control in Southern Java and to providing community-basedlandslide warning information. In: Glade T, Anderson M, Crozier MJ (eds) Landslide hazard and risk.Wiley, London, pp 733–763
Knapen A, Kitutu MG, Poesen J, Breugelmans W, Decker J, Muwanga A (2006) Landslides in a denselypopulated county at the footslopes of Mount Elgon (Uganda): characteristics and causal factors.Geomorphology 73:149–165. doi:10.1016/j.geomorph.2005.07.004
Lateltin O, Haemmig C, Raetzo H, Bonnard C (2005) Landslide risk management in Switzerland. Land-slides 2:313–320. doi:10.1007/s10346-005-0018-8
Leone AJP, Leroi E (1996) Vulnerability assessment of elements exposed to mass-moving: working towarda better risk perception. In: Senneset K (ed) Landslides. Balkema, Rotterdam, pp 263–269
Mardiatno D (2002) Landslide risk in Girimulyo Sub District Kulonprogo Prefecture, Yogyakarta SpecialProvince. M.Sc. Thesis. Fac. of geography, Gadjah Mada University (in Indonesian)
Panday A, Dabral PP, Chowdary VM, Yadav NK (2008) Landslide hazard zonation using remote sensingand GIS: a case study of Dikrong river basin, Arunachal Pradesh. India Environ Geol 54:1517–1529.doi:10.1007/s00254-007-0933-1
Pusat Studi Bencana Universitas Gadjah Mada (PSBA-UGM) (2001) Penyusunan Sistem Informasi Pen-anggulangan Bencana Alam Tanah Longsor di Kabupaten Kulon Progo—laporan akhir (LandslideDisaster Information System for Kulon Progo Distric). Yogyakarta, BAPPEDA Kabupaten KulonProgo, p 67 (unpublised)
Raharjo W, Sukandarrumidi, Rosyidi, HMD (1995) Geological map of Yogyakarta. Faculty of Engineering,Gadjah Mada University
Research Center for Disasters, Gadjah Mada University (2001) Landslide disaster information system inKulonprogo Prefecture, Yogyakarta Province, Indonesia. Unpublished report, Research Center forDisasters, Gadjah Mada University, Yogyakarta, Indonesia. 120 p (in Indonesian version)
Saha AK, Gupta RP (2002) GIS-based landslide hazard zonation in the Bhagirathi (Ganga) Valley,Himalayas. Int J Remote Sens 23(2):357–369. doi:10.1080/01431160010014260\/jrn[
Saldivar-Sali A, Einstein HH (2007) A landslide risk rating system for Baguio, Philippines. Eng Geol 91(2–4):85–99
Stanganell M (2008) A new pattern of risk management: the Hyogo framework for action and Italianpractise. Socio-Econ Plan Sci 42(2):92–111
Terlien MTJ (1996) Modelling spatial and temporal variations in rainfall-triggered landslides. PhD thesis,ITC Publ. no. 32, p 254
Van Bemmelen RW (1949) The geology of Indonesia. Government Printing Office, The HagueVan Westen CJ (1993) Application of geographic information systems to landslide hazard zonation. PhD
thesis, Technical University Delft, pp 245 (unpublished)Van Westen CJ, Rengers N, Soeters R (2003) Use of geomorphological information in indirect landslide
susceptibility assessment. Nat Hazards 30:399–419Van Westen CJ, Van Asch TWJ, Soeters R (2005) Landslide hazard and risk zonation—why is it still so
difficult? Bull Eng Geol. doi: 10.1007/s10064-005-0023-0Varnes DJ (1984) Landslide hazard zonation: a review of principles and practice, Commission on landslides
of the IAEG, UNESCO, Natural Hazards No. 3, pp 61Wang H, Gangjun L, Weiya X, Gonghui W (2005) GIS-based landslide hazard assessment: an overview.
Prog Physical Geogr 29:548–567. doi:10.1191/0309133305pp462raWatchal DJ, Hudak PF (2000) Mapping landslide susceptibility in Travis County, Texas, USA. GeoJournal
51:245–253
642 Nat Hazards (2010) 54:623–642
123


![Degradasi Lingkungan [Studi Kasus: Perubahan Landuse terhadap keseimbangan (hidrologi) Neraca Air (Water Balance)]](https://img.dokumen.tips/doc/110x75/631ae1f9d43f4e176304a5ef/degradasi-lingkungan-studi-kasus-perubahan-landuse-terhadap-keseimbangan-hidrologi.jpg)


