Embed Size (px)
Citation preview
Scientific Note SAClRESAlMWRD/CRZISN/03 100
LANDUSE MAPPING OF THEWEST BENGAL
COASTAL REGULATION ZONE
J. B. Nanda, Ms. K. Mukhargee, Somenath Bhattacharya
Institute of Wetland Management and Ecological Design
Calcutta-700 091
H. B. Chauhan, Shailesh Nayak
Space Applications Centre (ISRO)
Ahmedabad - 380 053
Funded by Min. of Environment & Forest, Govt. of India
Space Applications Centre (ISRO)
Ahmedabad 380 053
July 2001
Space Applications Centre (ISRO)Ahmedabad 380 053
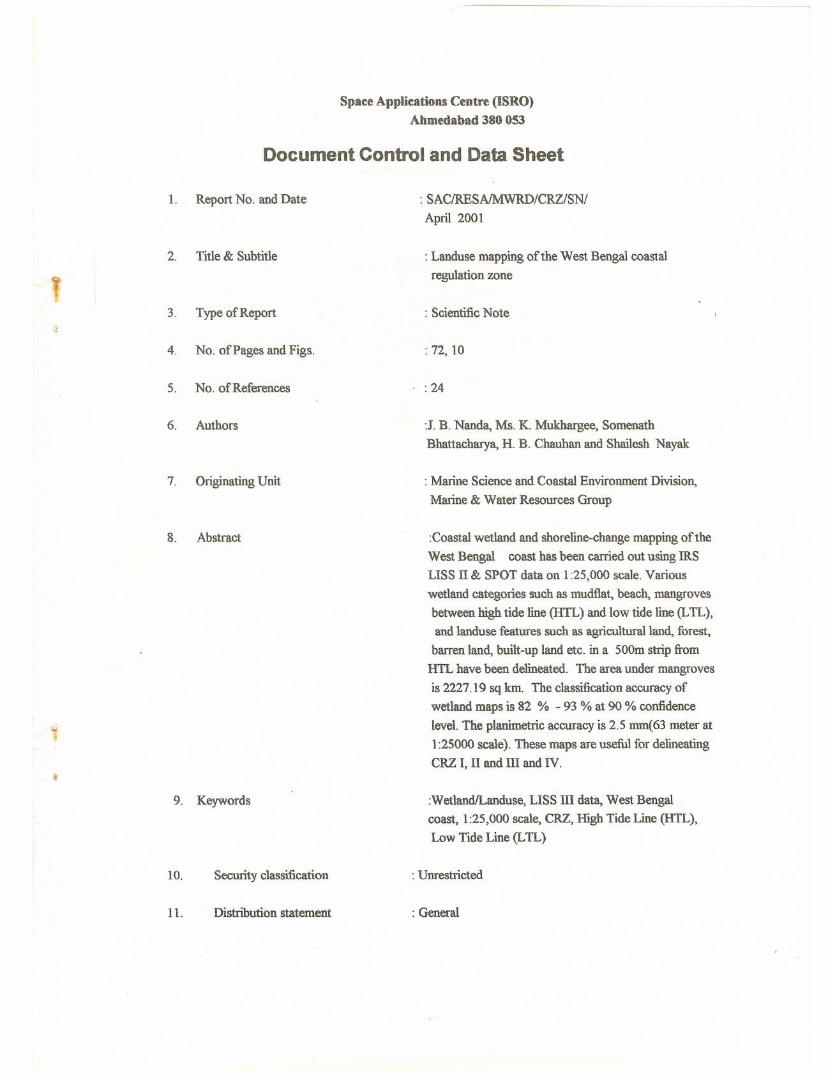
Document Control and Data Sheet
1. Report No. and Date
2.Title & Subtitle
'iI
3.Type of Report
~ 4.
No. of Pages and Figs.
S.
No. of References
6.
Authors
7. Originating Unit
8. Abstract
9. Keywords
: SACIRESAlMWRD/CRZISNI
April 2001
: Landuse mapping of the West Bengal coastal
regulation zone
: Scientific Note
: 72,10
: 24
:J. B. Nanda, Ms. K. Mukhargee, Somenath
Bhattacharya, H. B. Chauhan and Shailesh Nayak
: Marine Science and Coastal Environment Division,
Marine & Water Resources Group
:Coastal wetland and shoreline-change mapping of the
West Bengal coast has been carried out using IRS
LISS II & SPOT data on 1:25,000 scale. Various
wetland categories such as mudflat, beach, mangroves
between high tide line (HTL) and low tide line (LTL),
and landuse features such as agricu1tura1land, forest,
barren land, built-up land etc. in a SOOmstrip from
HTL have been delineated. The area under mangroves
is 2227.19 sq km. The classification accuracy of
wetland maps is 82 % - 93 % at 90 % confidence
level. The planimetric accuracy is 2.5 mm(63 meter at
1:25000 scale). These maps are useful for delineating
CRZ I, II and ill and IV.
:WetlandlLanduse, LISS ill data, West Bengal
coast, 1:25,000 scale, CRZ, High Tide Line (HTL),
Low Tide Line (LTL)
10.
11.
Security classification
Distribution statement
: Unrestricted
: General
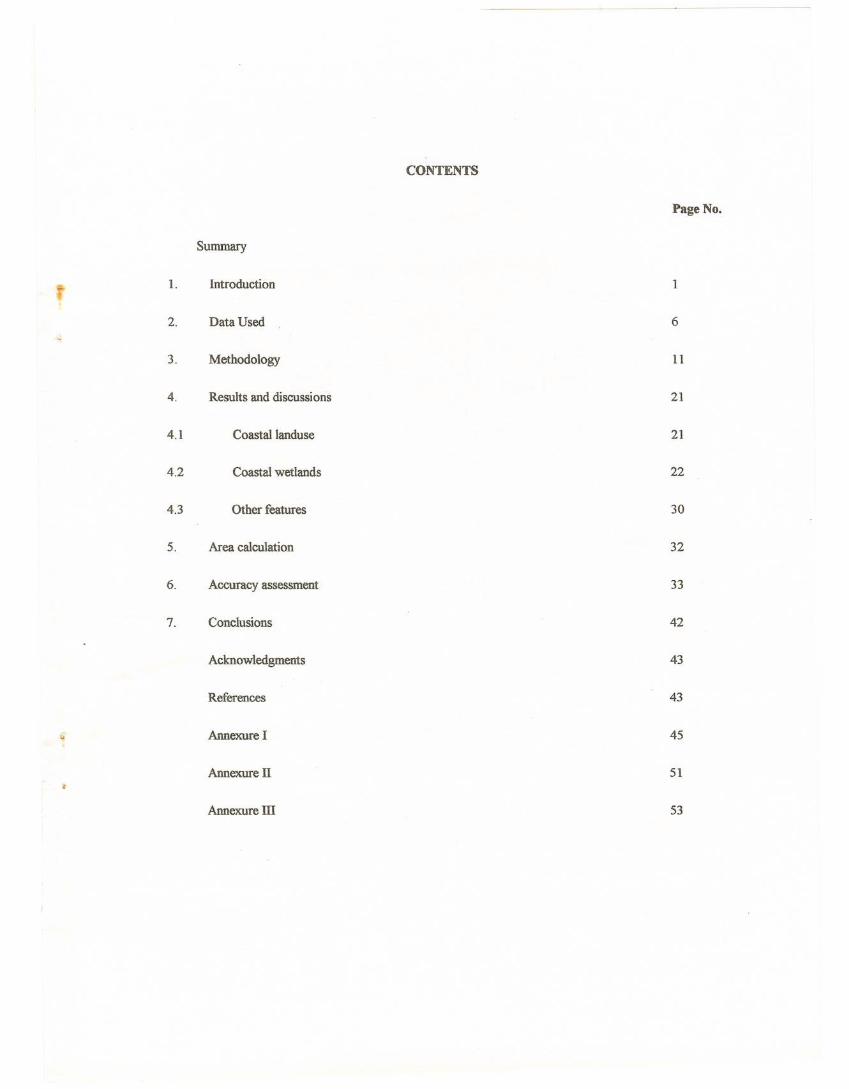
CONTENTS
Page No.Summary 1.
Introduction 1
2.
Data Used 6
3.
Methodology 11
4.
Results and discussions 21
4.1
Coastallanduse 21
4.2
Coastal wetlands 22
4.3
Other features 30
5.
Area calculation 32
6.
Accuracy assessment 33
7.
Conclusions 42
Acknowledgments
43
References
43
Annexure I
45
Annexure n
51
Annexure ill
53
- - - - -- - ----------
SUMMARY
Coastal zone in India assumes its importance because of high productivity of itsecosystems, concentration of population, exploitation of renewable and non-renewable naturalresources, discharge of waste effluent and municipal sewage, development of various industriesand spurt in recreational activities. Thus, there is a need to protect the coastal environment whileensuring continuing production and development.
Coastal stretches of bays, estuaries, backwaters, seas, creeks, etc. which are influenced bytidal action upto 500 m from High Tide Line (HTL) and the land between the Low Tide Line(LTL) and the HTL have been declared as Coastal Regulation Zone (CRZ) by the Govt. of India.
In order to regulate various activities in this zone, it is necessary to have knowledge about thepresent land use conditions in the zone 500 m from HTL and wetland condition between LTL andHTL. Satellite data has been used to assess present condition in CRZ (wetland conditionsbetween high and low waterlines and land use in the 500 m zone from high tide line) on 1:25,000scale for the Maharashtra coast. Mainly LISS II of IRS satellite and SPOT data (period 1988-90)used for mapping. The main emphasis was on built up area, tidal wetland and sand / rock miningareas. The topographical maps on 1:50,000 were enlarged to 1:25,000 scale and these enlargedmaps were used as base maps. Various wetland categories such as mangrove, coral reef, mudflats,beach and land use categories like agriculture area, forest, barren land, built up land, salt pans,aquaculture pond and reclaimed areas were mapped. The classification system is such that coastalzone can be divided in to CRZ I, II, III and IV categories.
The major part of the mangrove area is under Sundarban forest. It is the largest single blockof tidal helophytic mangroves of the world. It covers total 2227.19 sq. km. area. Mudflats arecovering 223.94 sq. km. area and mainly occurred in Sundarban sector. They occur as strips onboth the side of tidal river and creeks. Parts of these mudflats are being converted for aquaculturepond or shrimp culture. Sandy beaches are narrow and few in West Bengal. Submerged bars andchars consisting of sand, silt and clay are found all along the coast. Marsh vegetation occupies22.59 sq. km. and largely restricted to Sundarban area. Built-up land is covered by 1303.60 sq.km. and is about -18.89 % of the total CRZ area. Reclamation of mantgrove area is very prominentin Sundarban area. They are mainly converted for settlement and agriculture. About 356.09 sq.km. area of CRZ is used for aquaculture and it is mainly occurred in Sundarban sector. Theclassification accuracy of these CRZ maps is 82 % - 93 % at 90 % confidence level and
C planimetric accuracy is 2.5 rom (63 mat 1:25,000 scale). CRZ maps prepare under this projectthus provides information about conditions of wetlands and land use and serve as a base map fortaking necessary action for preparing Coastal Zone Management Plan (CZMP).
1. Introduction
The Coastal Zone environment, and unique geological-biological-ecological domain, isthe most dynamic of the entire known environment. It is also unique in terms of productivity.There are a large variety of coastal resources but they can be classified under the headings ofland, forests, coastal waters (including enclosed and semi enclosed seas, estuaries, inland waters),minerals and hydrocarbons, and living marine resources. These are regarded as renewable orsemi-renewable natural resources.
The Coastal Zone in most countries is under severe and increasing pressure from rapidurbanisation, pollution, tourism development, over exploitation of coastal resources (specially
'C biological resources) and continued development in hazard prone areas. Resources allocationconflicts are increasing. The coast provides important locational benefits for heavy industries,energy generating facilities, fuel and raw material processing etc. Coastal landforms have animportant role in protecting the coastline from erosion and flooding. A large portion of waveenergy arriving at the coast is absorbed by the salt marshes and mangrove swamps; if present.Besides, Spit and bar perform similar role in dissipating wave energy. Coastal wetlands are hometo a large variety of birds, plants and other biota and also serve the important role of filteringimpurities in the water coursing through them.
Despite its fragility, the coastal zone is amazingly resilient. The ecosystem as a whole is adynamic and regenerative forces, if "left alone", natural mechanism operate to maintain anequilibrium between all living and the natural environment (Beatly et at., 1994). There arelimits, however, to the extent of coastal ecosystem can withstand external assaults to itsintegrity. That is why, proper assessment of coastal resources as well as dynamics working in thisregion need to be studied in detail.
Background
The definition of the coastal zone depends upon the purpose at hand. From both themanagement' and scientific view points, the extent of coastal zone will vary according to thenature of the problem, the extent of the resource and the administrative boundaries as imposedby the Government with jurisdiction and responsibility for management in the coastal zone,a very dynamic as well as fragile system. This is a result of interactions with atmosphericprocesses, the operations of different ecosystems and coastal processes, and up-catchmentsactivities as well as the different degrees of development activities being carried out. Theinteraction between the coastal zone and the high seas is a further aspect of this dynamism,particularly. in relation to living marine resources and the impact of environmental degradationand pollution. The boundaries of coastal zone should extend as far inland as far seaward asnecessary to achieve the objectives of the management programs. Present sustainability of theseresources should be measured before policy formulation. Detail updatation of present land use/land cover pattern, both micro and macro level resource survey and landform-natural processesinteraction study is needed before policy formulation for sustainable development. Policy
1

development and implementation must take into account the dynamic nature of these systems andthe specific local and regional character of coastal resources and processes. Detail plan can beprepared only on a cas~by-case basis for specific regions.
General Geology and Geomorphology
The study area, i.e. Coastal Regulation Zone of West Bengal is the eastern and southernpart of Bengal Geosynclines (stable shelf in the west and deep basin in the east) bordered in thewest by the Indian shield, which is separated by a series of buried basin marginal encephalonfaults. Intensive Geophysical surveys and deep drilling data in this alluvial plain of West Bengalrevealed that the extensive subaquous basaltic lava (#Rajmahal Trap) is overlying PermoCarboniferous coal bearing Gondwana sediments of continental environment. Later geologicalhistory is the repetition of marine transgressions and regressions which were the major phenomenacontrolling the depositional environment during the evolution of this basin. The sedimentsoverlying the trap were deposited mainly in the continental environment. The drainage systemoriginated from Indian shield (Chhotanagpur plateau part) was the then geological agents ofsediment transportation and deposition. The first evidence of traIisgression in the basin is duringCretaceous but upper Cretaceous was a phase of regression. Other phases of transgressions areearly Paleocene (local), Eocene (extensive), late Oligocen~Miocene (extensive), and Pliocene(two phases - early and late Pliocene). Late Paleocene, late Eocene-early Oligocene, midMiocene, and upper most Miocene were the phases of regressions. Although the Quaternary wasin general in .regressive phase but oscillatory environment was also there at that time (Tiwary &Banerjee, 1985). The Eocene Hinge Zone, a zone of tectonic flexure and fault, passing CalcuttaRanaghat-Mymensingh 'separate the relatively stable shelf from the deeper basin of thegeosynclines. Post Eocene eastward tilting cause very thick pile of stratisraphic horizons in theeastern part. Raman and co-members (1986) from isochronal interval mapping of thestratigraphic horizons concluded that Krishnanagar-Ranaghat area was a depositional low andContai area was a high probably with an another depositional low in the present day offshoreduring Cretaceous and Paleocene times.
Niyogi (1970) has reported the presence ofBelda-Contai upland which was not occupied byany large river in the recent past. He concludes also that this upland evolved mainly from thedelta of Subarnarekha and Kasai. Palaeo Damodar river trend was the main source of sediment
supply during the Cretaceous-Eocene period.
During Creteous time, Ghatal area was under the influence of restricted lagoon environment,which was replaced, by open marine shelf environment during the Paleocene and Eocene (Ramanet aI., 1986).
A detailed study of landforms and soils by air photo interpretation and extensive fieldwork was carried out by Niyogi D. (1970 & 1975). According to him four belts ofland surfaces,Laterite upland, Older deltaic plain, Younger deltaic plain and Recent deltaic plain represent theexposed top portions of four series of sediment deposited in an off lap during the four high standsof sea level of Quaternary. These "morphostratigraphic" units are each characterised by a distinctsoil. Niyogi has given the status of formation to .these four upits. According to him, delta building
2
by existing set of rivers continued through the Quaternary there by pushing the shoreline steadilyeastward or southeastward. He also advocated that due to continuous uplift of the region in thewest, each younger formation was deposited further seaward than the preceding one therebyleaving a portion of the latter uncovered and at each junction, the older formation dips below theyounger, the regional dip being towards east or south-east. Also he suggested that in the presentarea, a steady but slow uplift continued all through the Quaternary; due to this phenomenon, beltsof land remained uncovered to the west during successive high stands. It is also apparent,according to Niyogi, that the cumulative effect of the uplift operating for quite a long timeprogressively steepened the surfaces of older landforms all of which were initially much flatter.Deltaic plain of modem delta of comparable lithology slopes at 0.07 m per kIn. while Gangadelta slopes 0.1 m per lan. towards south (Mallick, 1971).
Chakraborti (Chakraborti, 1991) contradicted this view of Niyogi and suggested aninterfingering relationship with the rows of dunes, beach ridges and clayey inter tidal flat of theadjoining coastal plain in the east. In the eastern side of Subamarekha delta, according to Niyogi(1970), six regular cycles of beach ridges alternating with a variable number of bars are visiblewhich are indicative of shifting of shoreline. But it is not clear whether these ridges are indicativeof punctuations in the regression of Holocene sea. According to Chakraborty, only one beachridge is present in the association of dune rows in the mesotidal Midnapore coastal plain. Thisridge has been termed as "Older beach ridge" from its morpho-arrangement by Chakraborty.According to him, the successive rows of dunes (viz. Ancient, older and Beach front dunes) withintervening clayey tidal flats and local sandy beach ridges are indicative of punctuations in theregression of the Holocene sea in this area. He also suggested that the "Ancient dune complex II
__-alL.along the Midn3pore-co3~t3t plain (3honLlD-1o_-15.km~ north of the pre~ent dJ'lY~hore tine)indicates the positioo of the ancietlt str-and line in-the-axea.. J:~ 1-4 dating g.f the-sediments. fromAncient fluvio-tidal flat (5760 +140 YBP) bordering the Ancient dune complex in the southconfirms that the higher strand line in the post glacial (Holocene) period is at present representedby the "Ancient dune complex" which is around 6000 YBP - the optimum Flandriantransgression. The C14 dating of sediments from ancient inter tidal flat (just south of Ancientdune complex) gives an age of 2920 + 160 YBP, which indicates the first punctuation in theregression of Holocene sea in the area under consideration.
Subsequently, Chakraborty (1995) further reported the presence of a morpho-structurallineament in the same alignment and as an extension of the continuous dune ridge (the Ancientdune complex) in the eastern part of the Hooghly river. He has identified this lineament on thebasis of study of the Landsat (both black & white and FCC/TM) and reported that the saidlineament passes in a northeasterly direction and separates the lower deltaic plain of theGanga-Brahmaputra in two sectors. According to Chakraborty, the area to the south of this lineare characterised by the presence of islands (draped with mangroves) separated by embroidery ofactive tidal creeks and islands. Chakraborty (from C14 dating of the sticky gray clay sample ofinterdistributary mangrove marsh unit of Namkhana area which gives an age of 3170 + 70 YBP)concluded that the lineament in the eastern part of Hooghly estuary is nothing but a mark ofancient strand line. During our present study, although such zones of separation of tidal creekshave been noticed, but specific identification of such a lineament in the imageries used has notmet any success. Chakraborty also concluded that the delta building activity in this portion of the
3
Indo-Gangetic plain was practically extinct in the recent past (about 200 years ago) and hasbecome the abandoned delta whereas the eastern Ganga - Brahmaputra delta (Bangladesh part) isthe active portion. This abandoned delta is also turning destructive and free from any depositionalactivity by littoral current.
Climate
Tropical humid climate with annual rainfall of about 1650-1800 mm in central andnorthern areas, and as much as 2790 rom on the outer coast is observed along this coast(Chaudhuri & Chaudhury, 1994). The mean maximum temperature is 29 C (December-January).Average humidity is about 80 % (Chaudhuri & Chaudhury, 1994). Southwest Monsoon enters inmid June and continues up to October. During winter months, when North -East Monsoon prevail(October to mid March), lowest precipitation is noticed.
Cyclonic hazards are frequent which cause destructive surges along the coast. On anaverage, three to four cyclonic storms form in the Bay of Bengal mostly during pre monsoon(April-June) and post monsoon (September - November). These spirally moving cyclones ortyphoons developing in Bay of Bengal striking Bangladesh, West Bengal, Orissa, Andhra pradeshand Tamilnadu coast with average wind velocity of 100-120 km/hour and sometimes cause heavydown pour in the order of 15-25 cm within the duration of passage over the belt. A study carriedout by Saha et al. (1984) indicates that over a period of about 100 years (From 1889 to 1970),frequency of cyclonic surge, as noted along the East Coast, is maximum at the coast of 24Parganaga district of West Bengal. Incidentally, mangrove forest is present all along the coast of24-Parganas district providing protection to the coast from severe surge waves.
The storms give rise to spectacular dune landforms on Balasore-Contai coast. Extremelyirregular and high waves are generated and severe beach erosion took place, particularly if thestorms happen to coincide with either new moon or full moon high tides. Immediately after suchcyclones the beach is left in a broken state having deep channels at an angle to the beach slope.Within few days these irregularities are smoothed out. Surges bring coarser sands from theoffshore and removed finer sands to the deep waters. Thus, ultimately the beach graduallygets lowered.
Again, ,destruction and migration of the dune complex especially in pre-monsoon periodbreached the beachfront dune complex at places. The re-mobile sands are spread over the lowlying paddy field and thus convert it into a barren ground. Damage of embankments, expositionof older sediments by cyclones has been noticed at Medinipur coast during 1997 period.
The estuarine zone experiences a relatively weak tide during winter months. Strong tidesprevail during February to May followed by a short period of relatively weaker tides andreturning to strong tides during pre-winter season.' During summers, strong tides govern thechannel regime and influence the upstream sediment movements.· But during monsoon rains, thechannel regime is determined by the interaction of headwater discharge and the tides, whichtogether influence the seaward drift of the sediments. Sedimentation during this period causecongestion of the channel in its mouth region. Salt concentration in this estuarine environment
4
fluctuate greatly and the density difference between saline water and fresh water at their interfacecreates current which plays a major part in the formation of estuarine landforms. Again, the floodtide is short in duration, lasting two to three hours, while the ebb flows for the remaining eight ornine hours of the twelve hour tidal cycle. One effect of this disparity is that flood tide velocitiesare much greater than ebb tide and each flow can take a different pathway through the maze ofminor channels within the estuary (Chaudhuri & Chaudhury, 1994).
Study Area
The 220 lan. long coastal stretch (between 87° 26'E to 89° 08'E) of West Bengal extendsfrom Subarnarekha estuary on west to Harinbhanga river in the east. The Coastal RegulationZone of West Bengal is the Lower Ganga Delta plain. This stretch of coastal Quaternariesexhibits varied geomorphologic signatures (sand dunes, beach ridges, flood plains, tidal shoalsetc.) evolved out of dynamic and varied interactions of river and marine agencies. Based on tidalamplitude, the West Bengal coast can be sub-divided into two different coastal environmentsnamely: -
i) The macro tidal (tidal range: > 4 m) Hooghly estuary, characterised by an embroideryof tidal creeks, encompassing the islands and offshore linear tidal shoals, aligned perpendicular tothe shore line and separated by swales.
ii) The meso tidal (tidal range: 2-4 m) Midnapore (Digha - Junput) coastal plain (a part ofBalasore - Contai coastal plain) to the west of the Hooghly estuary, with successive rows ofdunes with intervening clayey tidal flats.
The Hooghly estuary separates two unique coastal ecosystems, namely deltaic mangroveswamp coast of the eastern part and dune-inter-dune coast of the west, coinciding with twoabove-mentioned different tidal environments. Now, what will be the landward limit of coastalzone i.e. the width of this zone?
Theoretically, Coastal Regulation Zone (CRZ) extends landward, up to which the coastalprocesses are active. However, for all practical purposes, in the present study, CRZ has beendrawn along the both sides of the river, canals, creeks etc. as far inland as tidal symbol has beenmarked on Survey of India topographic sheets, although in few cases, tidal influence have notbeen found in such streams! canals! creeks etc. In-spite of the negative field observations, theseareas have been included since, (i) ground truth has been collected on a particular day rather thanthrough out the year; (ii) the CRZ has been drawn strictly following Survey of India maps wheretidal symbols have been demarcated; (iii) the experience of local people regarding the tideconditions have also been considered. Again, it has been observed from images that in certainareas, the choking of the river bed is very prominent and there is hardly any possibility of tide toplay. These areas have been excluded from CRZ.
Further, certain areas have been included under CRZ of West Bengal along certain canals,streams or creeks although in Survey of India topographic sheets, tidal symbols have not been
5
marked in those particular stretches. These areas were included specifically on the basis ofground truth and image signature.
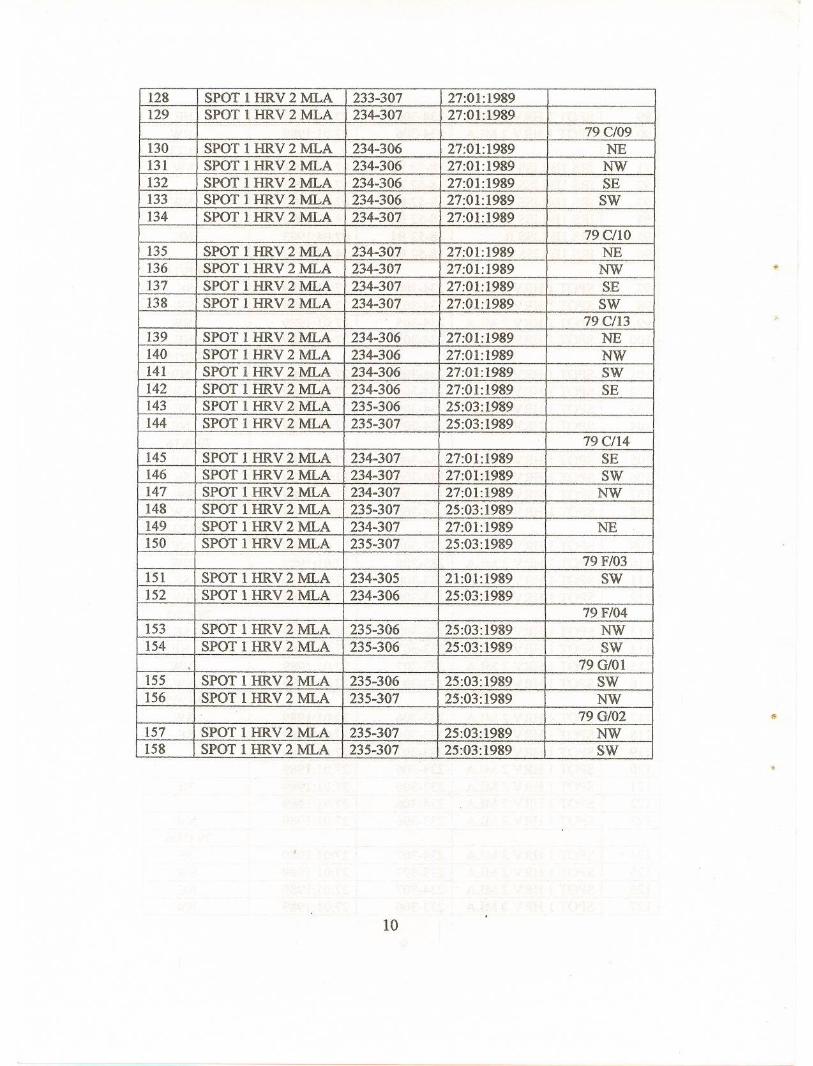
Total 158 (one hundred and fifty eight) maps on 1: 25,000 scale, each covering the area boundedby the parallels and meridians of 7'30" X 7'30" interval, had been prepared.
On the basis of landuse / landcover unit characteristics and nature of the tidal influence
the entire Coastal Regulation Zone of West Bengal may be subdivided into following sectors:
Deep- inland sector:
Central sector:
Sunderbans sector:
Medinipur coastal sector:
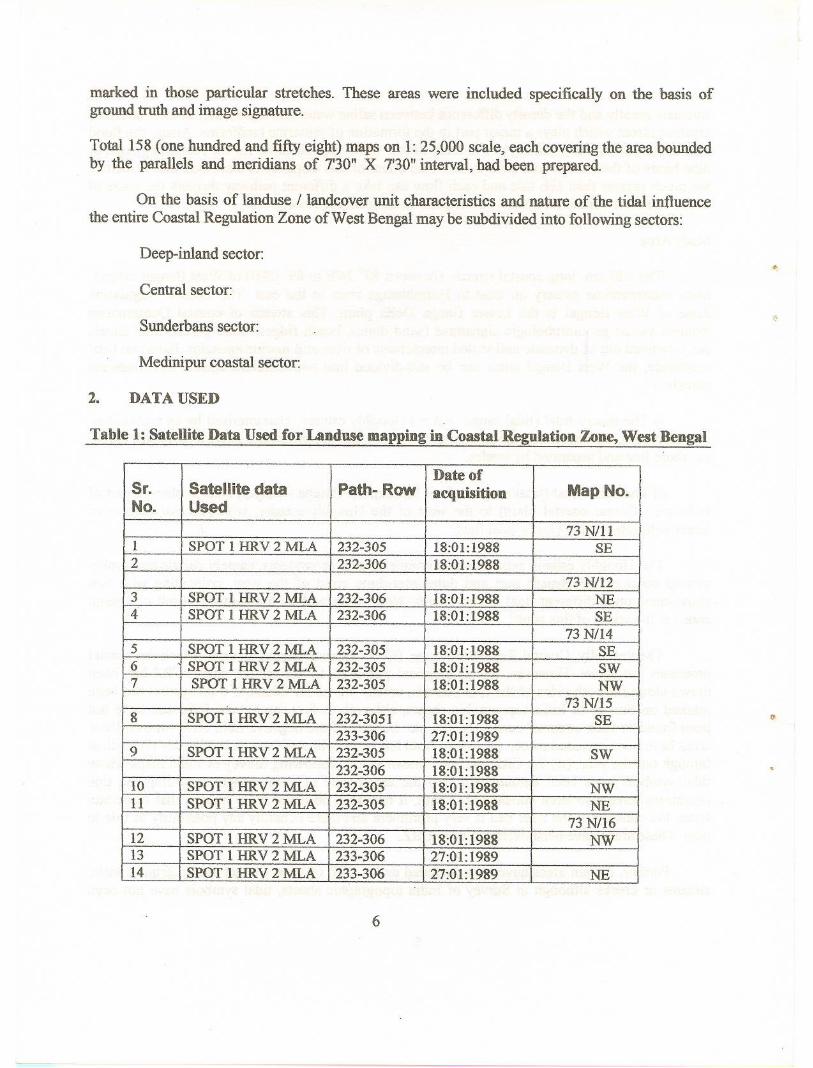
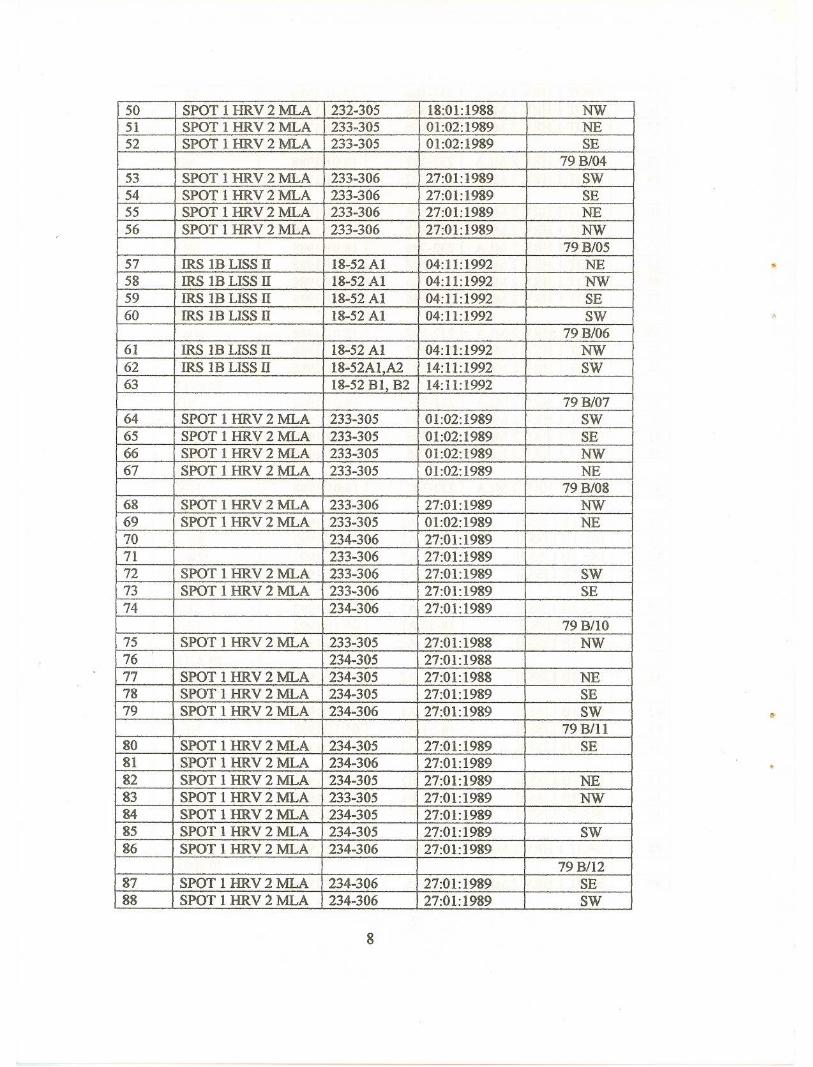
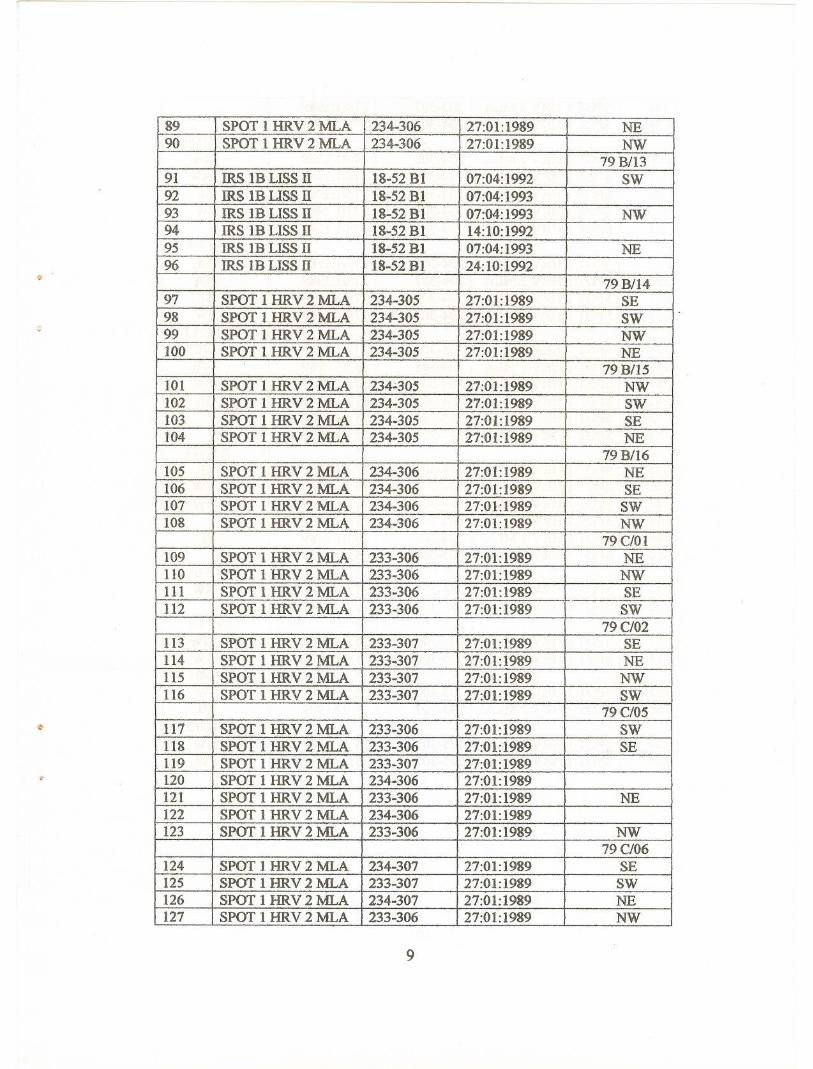
2. DATA USED
Table 1: Satellite Data Used for Landuse mapping in Coastal Regulation Zone, West Bengal
Date ofSr.Satellite dataPath- RowacquisitionMap No.
No.Used
73 N/ll1
SPOT 1 HRV 2 MLA232-305, 18:01:1988 SE2
232-30618:01:198873 N/123
SPOT 1 HRV 2 MLA232-30618:01:1988 NE4
SPOT 1 HRV 2 MLA232-30618:01:1988 SE73 N/145
SPOT 1 HRV 2 MLA232-30518:01:1988 SE6
SPOT 1 HRV 2 MLA232-30518:01:1988 SW7
SPOT 1 HRV 2 MLA232-30518:01:1988 NW73 NIlS8
SPOT 1 HRV 2 MLA232-305118:01:1988 SE233-306
27:01:19899
SPOT 1 HRV 2 MLA232-30518:01: 1988SW232-306
18:01: 198810
SPOT 1 HRV 2 MLA232-30518:01:1988NW11
SPOT 1 HRV 2 MLA232-30518:01:1988NE73 N/1612
SPOT 1 HRV 2 MLA232-30618:01:1988NW13
SPOT 1 HRV 2 MLA233-30627:01:198914
SPOT 1 HRV 2 MLA233-306I 27:01:1989 NEI
6

15 SPOT 1 HRV 2 MLA233-30627:01: 1989SE16
SPOT 1 HRV 2 MLA232-30618:01:1988SW17
SPOT 1 HRV 2 MLA233-30627:01:198973 010618
SPOT 1 HRV 2 MLA232-30710:01:1988 NE19
SPOT 1 HRV 2 MiA232-30718:01:1988 SE73 010920
SPOT 1 HRV 2 MLA232-30618:01:1988SW21
SPOT 1 HRV 2 MLA232-30718:01:198822
SPOT 1 HRV 2 MLA232-30618:01:1988SE23
SPOT 1 HRV 2 MLA232-30718:01:198824
SPOT 1 HRV 2 MLA232-30618:01:1988NE25
SPOT 1 HRV 2 MLA232-30618:01:1988NW73 0/1 026
SPOT 1 HRV 2 MLA232-30718:01:1988NW27
SPOT 1 HRV 2 MLA232-30718:01:1988NE28
SPOT 1 HRV 2 MLA232-30718:01:1988SW73 0/13129
I SPOT 1 HRV 2 MLA232-30618:01: 1988NE30
SPOT 1 HRV 2 MLA232-30618:01:1988NWI31
SPOT 1 HRV 2 MLA232-30618:01:1988 SE32
SPOT 1 HRV 2 MLA232-30618:01:1988SW73 0/1433
SPOT 1 HRV2 MLA232-30718:01:1988NW!---- ""- 79 N0734
IRS IB LISS II 18-51 A204:11:1992SW35
IRS IB LISS IT 18-51 A204: 11:1992SE36
IRS IB LISS II 18-51 A204:11:1992NW37
I IRS IB LISS II 18-51 A204:11:1992NEI79 Al0838
IRS IB LISS n 18-52 Al04:11:1992 SE39
IRS IB LISS II 18-52 Al04:11:1992 NE40
IRS IB LISS II 18-51 A207:11:1992 NW79 AlII41
IRS 1B LISS II 18-51 A204:11:1992 NW79 Al1242
IRS IB LISS II 18-52 Al04:11:1992 SW43
IRS IB LISS II 18-51 A204:11:1992 NE44
IRS IB LISS II 18-52 Al04:11:1992 NW79 Al1645
IRS IB LISS II 18-51 B207:04:1993NW46
IRS IB LISS n 18-52 Bl07:04:1993SE47
IRS IB LISS II 18-52 Bl07:04:1993SW19 B/0248
SPOT 1 HRV 2 MLA233-30501:02:1989SE79 B/0349
SPOT 1 HRV 2 MLA232-30518:01:1988SW
7
50 SPOT 1 HRV 2 MLA232~30518:01:1988NW51
SPOT 1 HRV 2 MLA233-30501:02:1989NE52
SPOT 1 HRV 2 MLA233~30501:02:1989SE79 B/0453
SPOT 1 HRV 2 MLA233-30627:01:1989SW54
SPOT 1 HRV 2 MLA233-30627:01:1989SE55
SPOT 1 HRV 2 MLA233~30627:01:1989NE56
SPOT 1 HRV 2 MLA233~30627:01:1989NW79 B/0557
IRS IB LISS n 18-52 Al04:11:1992 NE58
IRS IB LISS n 18-52 Al04:11: 1992NW59
IRS IB LISS n 18-52 Al04:11:1992 SE60
IRS 1B LISS n 18-52 Al04:11:1992 SW79 B/0661
IRS IB LISS n 18-52 Al04:11:1992 NW62
IRS 1B LISS IT18-52Al,A214:11:1992SW63
18-52 Bl, B214:11:199279 B/0764
SPOT 1 HRV 2 MLA233-30501:02:1989SW65
SPOT 1 HRV 2 MLA233-30501:02:1989SE66
SPOT I HRV 2 MLA233-30501:02:1989NW67
SPOT 1 HRV 2 MLA233-30501:02:1989NE79 BIOS68
SPOT 1 HRV 2 MLA233-30627:01:1989NW69
SPOT 1 HRV 2 MLA233-30501:02:1989NE70
234-30627:01:198971
233-30627:01:198972
SPOT 1 HRV 2 MLA233-30627:01:1989SW73
SPOT 1 HRV 2 MLA233-30627:01:1989SE74
234-30627:01:198979 B/I075
SPOT 1 HRV 2 MLA233-30527:01:1988NW76
234-30527:01:198877
SPOT 1 HRV 2 MLA234-30527:01:1988NE78
SPOT 1 HRV 2 MLA234-30527:01:1989SE79
SPOT 1 HRV 2 MLA234-30627:01:1989SW79 Bill80
SPOT 1 HRV 2 MLA234-30527:01:1989SE81
SPOT 1 HRV 2 MLA234-30627:01:198982
SPOT 1 HRV 2 MLA234-30527:01:1989NE83
SPOT 1 HRV2MLA233-30527:01:1989NW84
SPOT 1 HRV 2 MLA234-30527:01:198985
SPOT 1 HRV2MLA234-30527:01:1989SW86
SPOT 1 HRV 2 MLA234-30627:01:198979 B/1287
SPOT 1 HRV 2 MLA234-30627:01:1989SE88
SPOT 1 HRV 2 MLA234-30627:01:1989SW
8
-0
89 SPOT 1 HRV 2 :MLA234-30627:01:1989NE90
SPOT 1 HRV 2 MLA234-30627:01:1989NW79 BIB91
IRS IB LISS II 18-52 Bl07:04:1992SW92
IRS IB LISS II 18-52 Bl07:04:199393
IRS IB LISS II 18-52 Bl07:04:1993NW94
IRS IB LISS II 18-52 Bl14:10:199295
IRS IB LISS II 18-52 Bl07:04:1993NE96
IRS IB LISS II 18-52 Bl24: 10:199279 B/1497
SPOT 1 HRV 2 MLA234-30527:01:1989SE98
SPOT 1 HRV 2 MLA234-30527:01:1989SW99
SPOT 1 HRV 2 MLA234-30527:01:1989NW100
SPOT 1 HRV2 MLA234-30527:01:1989NE79 BI15101
SPOT 1 HRV 2 MLA234.:.30527:01:1989 NW102
SPOT 1 HRV 2 MLA234-30527:01:1989 SW103
SPOT 1 HRV 2 MLA234-30527:01:1989 SE104
SPOT 1 HRV 2 MLA234-30527:01:1989 NE79 B/16105
SPOT 1 HRV 2 MLA234-30627:01:1989 NE106
SPOT 1 HRV 2 MLA234-30627:01:1989 SE107
SPOT 1 HRV 2 MLA234-30627:01:1989SW108
SPOT 1 HRV2 MLA234-30627:01:1989NW79 C/O1109
SPOT 1 HRV 2 MLA233-30627:01:1989 NE110
SPOT 1 HRV 2 MLA233-30627:01:1989NW111
SPOT 1 HRV 2 MLA233-30627:01:1989 SE112
SPOT 1 HRV 2 MLA233-30627:01:1989SW79 C/02113
SPOT 1 HRV 2 MLA233-30727:01:1989 SE114
SPOT 1 HRV 2 MLA233-30727:01:1989 NE115
SPOT 1 HRV 2 MLA233-30727:01:1989NW116
SPOT 1 HRV 2 MLA233-30727:01:1989SW79 C/05117
SPOT 1 HRV 2 MLA233-30627:01:1989SW118
SPOT 1 HRV 2 MIA233-30627:01:1989SE119
SPOT 1 HRV 2 MLA233-30727:01:1989120
SPOT 1 HRV 2 MLA234-30627:01:1989121
SPOT 1 HRV 2 MLA233-30627:01:1989NE122
SPOT 1 HRV 2 MLA234-30627:01:1989123
SPOT 1 HRV 2 MLA233-30627:01:1989NW79 C/06124
SPOT 1 HRV 2 MLA234-30727:01:1989SE125
SPOT 1 HRV 2 MLA233-30727:01:1989SW126
SPOT 1 HRV 2 MLA234-30727:01:1989NE127
SPOT 1 HRV 2 MLA233-30627:01:1989NW
9
128 SPOT 1 HRV 2 MLA233-30727:01:1989129
SPOT 1 HRV 2 MLA234-30727:01:198979 C/09130
SPOT 1 HRV 2 MLA234-30627:01:1989 NE131
SPOT 1 HRV 2 MLA234-30627:01:1989NW132
SPOT 1 HRV 2 MLA234-30627:01:1989SE133
SPOT 1 HRV 2 MLA234-30627:01:1989SW134
SPOT 1 HRV2 MLA234-30727:01:198979 CIl 0135
SPOT 1 HRV 2 MLA234-30727:01:1989NE136
SPOT 1 HRV 2 MLA234-30727:01:1989NW137
SPOT 1 HRV 2 MLA234-30727:01:1989SE138
SPOT 1 HRV 2 MLA234-30727:01:1989SW79 C/13139
SPOT 1 HRV 2 MLA234-30627:01:1989NE140
SPOT 1 HRV 2 MLA234-30627:01:1989NW141
SPOT 1 HRV 2 MLA234-30627:01:1989SW142
SPOT 1 HRV 2 MLA234-30627:01:1989SE143
SPOT 1 HRV 2 MLA235-30625:03:1989144
SPOT 1 HRV 2 MLA235-30725:03:198979 C/14145
SPOT 1 HRV 2 MLA234-30727:01:1989SE146
SPOT 1 HRV 2 MLA234-30727:01:1989SW147
SPOT 1 HRV 2 MLA234-30727:01:1989NW148
SPOT 1 HRV 2 MLA235-30725:03:1989149
SPOT 1 HRV2 MLA234-30727:01:1989NE150
SPOT 1 HRV 2 MLA235-30725:03:198979 F/03151
SPOT 1 HRV 2 MLA234-30521:01:1989SW152
SPOT 1 HRV 2 MLA234-30625:03:198979 F/04153
SPOT 1 HRV 2 MLA235-30625:03:1989NW154
SPOT 1 HRV 2 MLA235-30625:03:1989SW79 G/O1155
SPOT 1 HRV 2 MLA235-30625:03:1989SW156
SPOT 1 HRV 2 MLA235-30725:03:1989NW79 G/02157
SPOT 1 HRV 2 MLA235-30725:03:1989NW158
SPOT 1 HRV 2 MLA235-30725:03:1989SW
10
s
a
~~ ---~--~-----------------------------------------------
3. METHODOLOGY
3.1 Classification System
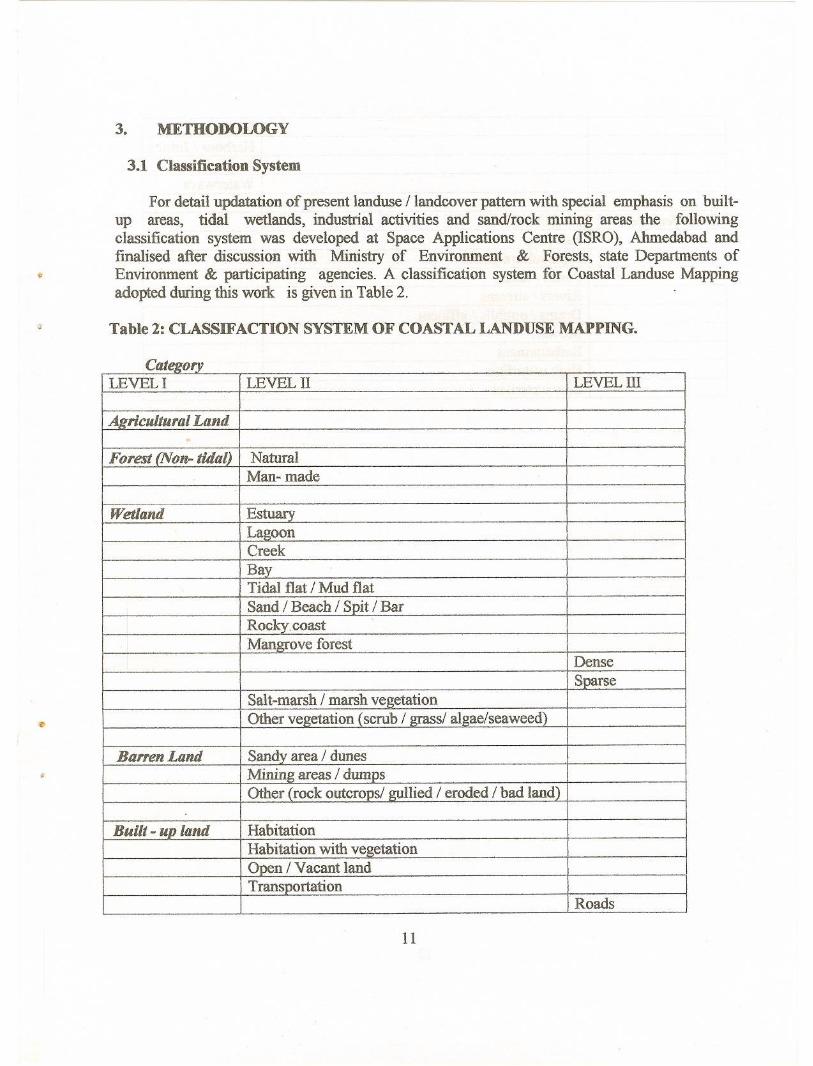
For detail upclatation of present landuse / landcover pattern with special emphasis on builtup areas, tidal wetlands, industrial activities and sand/rock mining areas the followingclassification system was developed at Space Applications Centre (ISRO), Ahmedabad andfinalised after discussion with Ministry of Environment & Forests, state Departments ofEnvironment & participating agencies. A classification system for Coastal Landuse Mappingadopted during this work is given in Table 2.
;; Table 2: CLASSIFACTION SYSTEM OF COASTAL LANDUSE MAPPING.
~~-....- - -,
LEVEL ILEVEL II LEVEL ill
Agricultural Land Forest (Non- tidal)
NaturalMan- made
Wetland
Estuary
LagoonCreekBavTidal flat / Mud flatSand / Beach / Spit / BarRocky. coastMangrove forest DenseSparseSalt-marsh / marsh vegetation Other vegetation (scrub / grass/ algae/seaweed)Barren Land
Sandy area / dunesMining areas / dumpsOther (rock outcrops/ gullied / eroded / bad land)
Built - up land
Habitation
Habitation with vegetationOpen / Vacant landTransportation Roads
11

RailwaysHarbour I JettiesAirportWaterways
Other features
Reclaimed areaSalt pansAquaculture pondsPonds I lakesRivers I streamsDrains / outfalls / affluentSeawallEmbankmentHigh waterlineLow waterline
12
~) G
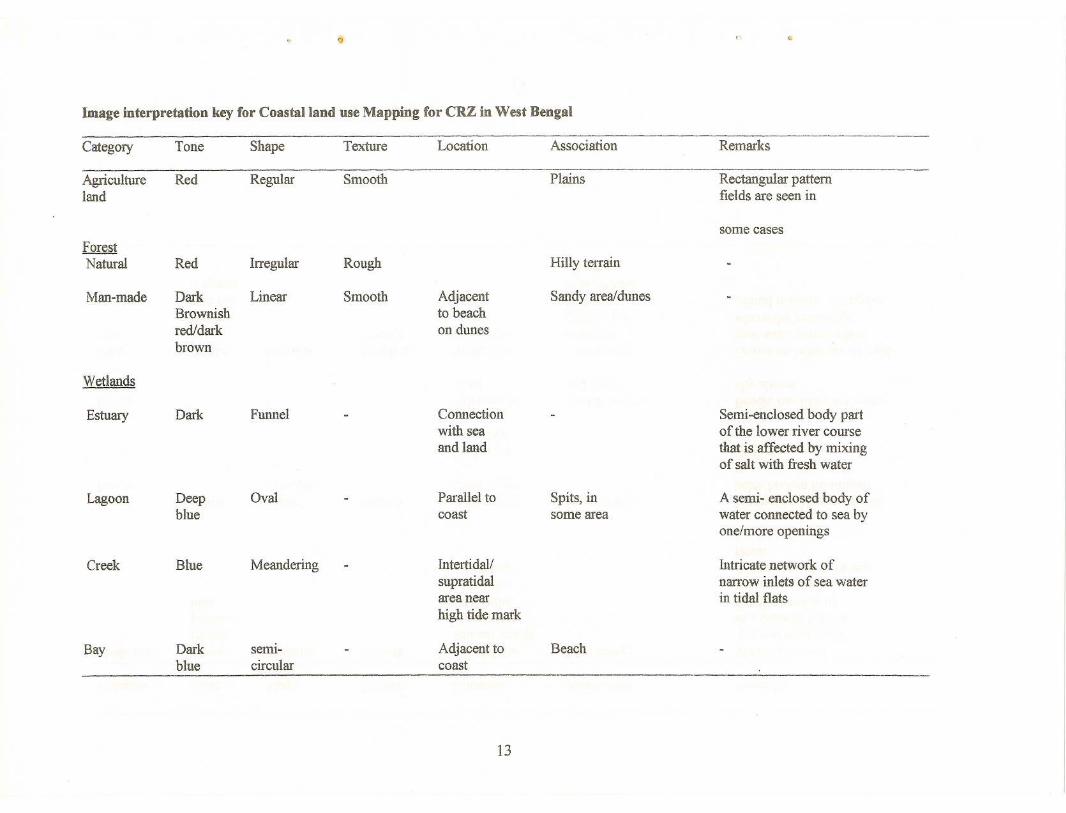
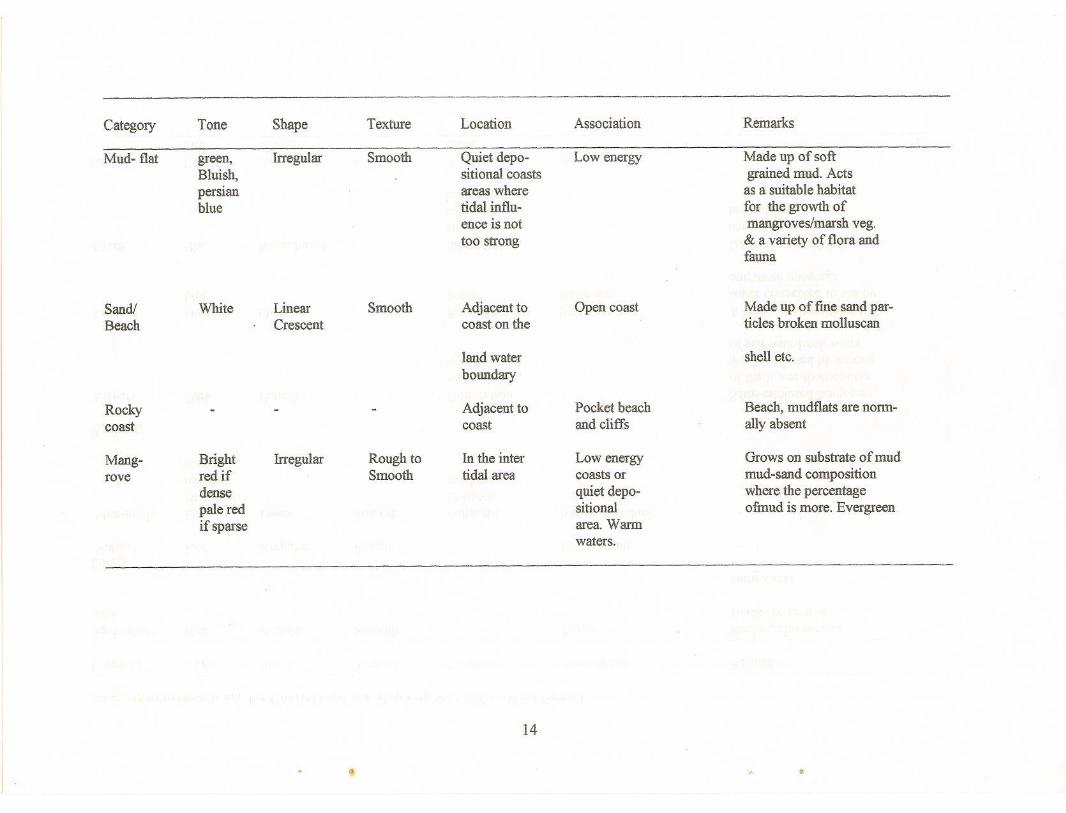
Image interpretation key for Coastal land use Mapping for CRZ in West Bengal
CategOI)'
ToneShapeTextureLocationAssociationRemarks
Agriculture
RedRegularSmooth PlainsRectangular patternland
fields are seen in
some cases
Forest NaturalRedIrregularRough Hilly terrain
Man-made
DarkLinearSmoothAdjacentSandy area/dunesBrownish
to beachred/dark
on dunesbrown
Wetlands Estuary
DarkFunnel-Connection- Semi-enclosed body part
with seaof the lower river course
and landthat is affected by mixing
of salt with fresh water
Lagoon
DeepOval-Parallel toSpits, in A semi- enclosed body of
bluecoastsome areawater connected to sea by
one/more openingsCreek
BlueMeandering-Intertidal/ Intricate network of
supratidal
narrow inlets of sea waterarea near
in tidal flats
high tide markBay
Darkseml--Adjacent toBeachblue
circular coast
13
Category ToneShapeTextureLocationAssociationRemarks
Mud- flat
green,IrregularSmoothQuiet depo-Low energyMade up of softBluish,
sitional coastsgrained mud. Acts
persIan
areas whereas a suitable habitat
bluetidal influ-for the growth of
ence is notmangroves/marsh veg.
too strong
& a variety of flora andfauna
Sandi
WhiteLinearSmoothAdjacent toOpen coastMade up of fme sand par-Beach
Crescentcoast on the ticles broken molluscan
land water
shell etc.
boundaryRocky
-- -Adjacent toPocket beachBeach, mudflats are norm-coast
coastand cliffs ally absent
Mang-
BrightIrregularRough toIn the interLow energyGrows on substrate of mud
rove
red if Smoothtidal areacoasts or mud-sand compositiondense
quiet depo-where the percentagepale red
sitionalofinud is more. Evergreen
if sparse
area. Wannwaters.
14
.1, 'J

" ~
Category ToneShapeTextureLocationAssociationRemarks
Salt
DarkIrregularSmoothIn the interLow energyUsually occur in temperatemarsh
brown tidal/supracoasts or countries. Certain tolerant
/marshif dense tidal areaquiet depo-species occur within mang
veg.
sparse sitional area.roves or after the mangr-
Cold waters.ove belt. Evergreen.
Other
Pink ifIrregularSmoothIn the interOn reefs, rocksDistinct on reef edgeveg.
dense tidal/supraand mudflatreef flats & rocky coasttidal area
Barren land Sand
Red!LinearSmoothBehind theDevelops inDetected easily when veg.Dune
white beach, onany env. mpresent on it, otherwiselandward
which loosethe signature of duneside sand
particles ofgets mixed up with beach.are exposed
Casurina spp may beto wind
present.action.
Mining
LightIrregularRoughBad landPonds Iron ore, stone quarriesareal
to dark
dumpsgreen
15
Category ToneShapeTextureLocationAssociationRemarks
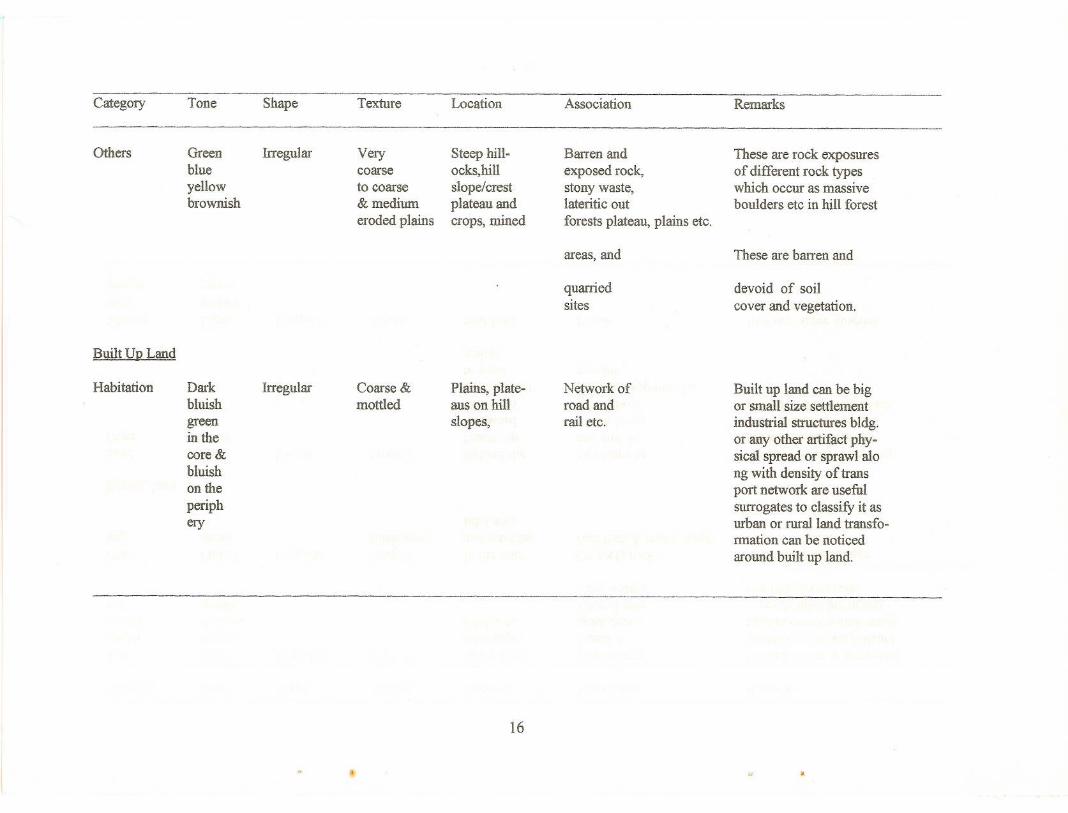
Others
GreenIrregularVerySteep hiU-Barren andThese are rock exposuresblue
coarseocks,hillexposed rock,of different rock typesyellow
to coarseslope/creststony waste,which occur as massivebrownish
& mediumplateau andlateritic outboulders etc in hill foresteroded plains
crops, minedforests plateau, plains etc.
areas, and
These are barren and
quarried
devoid of soilsites
cover and vegetation.
Built Un. LandHabitation
DarkIrregularCoarse &Plains, plate-Network ofBuilt up land can be bigbluish
mottledaus on hillroad and or small size settlementgreen
slopes,rail etc. industrial structures bldg.in the
or any other artifact phy-core &
sical spread or sprawl alobluish
ng with density of transon the
port network are usefulperiph
surrogates to classify it asery
urban or rural land transfo-rmation can be noticedaround built up land.
16
q,

~, (,')
Category ToneShapeTextureLocationAssociationRemarks
Habitation
DarkIrregularCoarse &Plains,Same as aboveUnder regulative order.
with veg.
bluish MolttedPlateau,green
Hill slopes
in the core &bluishon theperipheryandreddishspotsOpen vac
YellowishRectangularSmooth- Within built up area
ant landgreyish
Transportation
Roads
DarkStraight-- Interspersed withIt has a linear pattern.
grey
with bends pink tone
Railways
LightStraightMedium
Harbour
LightIrregular-On theSurrounded by blue
cyan
coasttone
Airport
LightLong strt.-Outskirts ofInterspersed by pink
bluestrips citytone
Waterways
DarkLinear
17

Category ToneShapeTextureLocationAssociationRemarks
Other features Reclaimed
DarkIrregularCoarse &-Bunds, embankmentsReclaimed for agriculture,area
bluish mottled- industrial, residential use
green· in thecore&bluishon theperipherySaltpan
DarkRectangular,SmoothNear high tideMudflat Dry salt pan appearsBlue!
square limit white. Shallow depreslight
sions in which waterblue!
collects & evaporateswhite
leaving salt deposit.
Aqua
DarkRectangularSmoothNear high tideMudflat,culture
blacksquare limitCreek
ponds
Ponds
LightRegular toSmooth toTanks and lakeAmidst culti-These are impounded!lakes
blue toirregularmottledin lowlandsvated lowlandswater bodies on lowdark
!plains, reser-lands,plains acrossblue
voirs, etcriver!streams
Rivers!
Blue!IrregularSmooth tonatural riversdrainage pattern onThese are water coursesstreams
Whitesmuousmedium!streams(pere-hill slopes, floodin the channels of diff.nnial & non
plains, uplands etcdimensions and lengths.perennial)
18
~i

~I) 0'
Category ToneShapeTextureLocationAssociationRemarks
Embank-
-Linear--Across the creeks,Construct to stopment
near HTLsalinity ingress,reclamation, etc.
High
-Linear HTL locatedHTL in supratidalTotal discontinuitywater
upto the highestarea between wetland and
linesea waterterrestrial system
influx on land during hightideLow
-linear-LWL to lowestLWL in sub tidalTotal discontinuitywater
level to whicharea between wetland and
linewater recedesmarine waters.
during low tide
19
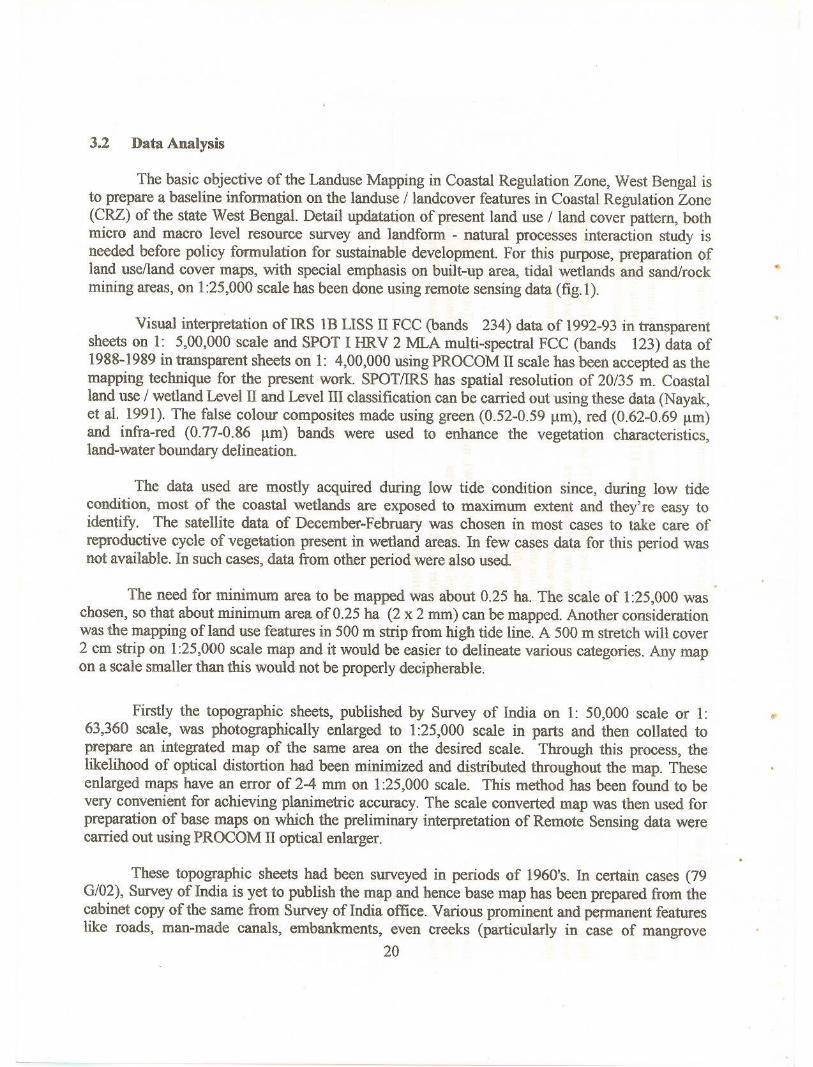
3.2 Data Analysis
The basic objective of the Landuse Mapping in Coastal Regulation Zone, West Bengal isto prepare a baseline infonnation on the landuse /landcover features in Coastal Regulation Zone(CRZ) of the state West Bengal. Detail updatation of present land use /land cover pattern, bothmicro and macro level resource survey and landfonn - natural processes interaction study isneeded before policy fonnulation for sustainable development. For this purpose, preparation ofland use/land cover maps, with special emphasis on built-up area, tidal wetlands and sand/rockmining areas, on 1:25,000 scale has been done using remote sensing data (fig. I).
Visual interpretation of IRS IB LISS II FCC (bands 234) data of 1992-93 in transparentsheets on 1: 5,00,000 scale and SPOT I HRV 2 MLA multi-spectral FCC (bands 123) data of1988-1989 in transparent sheets on 1: 4,00,000 using PROCOM II scale has been accepted as themapping technique for the present work. SPOTIIRS has spatial resolution of 20/35 m. Coastalland use / wetland Level II and Level III classification can be carried out using these data (Nayak,et al. 1991). The false colour composites made using green (0.52-0.59 /lm), red (0.62-0.69 /lm)and infra-red (0.77-0.86 /lm) bands were used to enhance the vegetation characteristics,land-water boundary delineation.
The data used are mostly acquired during low tide condition since, during low tidecondition, most of the coastal wetlands are exposed to maximum extent and they're easy toidentify. The satellite data of December ..February was chosen in most cases to take care ofreproductive cycle of vegetation present in wetland areas. In few cases data for this period wasnot available. In such cases, data from other period were also used.
The need for minimum area to be mapped was about 0.25 ha. The scale of 1:25,000 waschosen, so that about minimum area of 0.25 ha (2 x 2 mm) can be mapped. Another considerationwas the mapping of land use features in 500 m strip from high tide line. A 500 m stretch will cover2 cm strip on 1:25,000 scale map and it would be easier to delineate various categories. Any mapon a scale smaller than this would not be properly decipherable.
Firstly the topographic sheets, pubiished by Survey of India on 1: 50,000 scale or 1:63,360 scale, was photographically enlarged to 1:25,000 scale in parts and then collated toprepare an integrated map of the same area on the desired scale. Through this process, thelikelihood of optical distortion had been minimized and distributed throughout the map. Theseenlarged maps have an error of 2-4 mm on 1:25,000 scale. This method has been found to bevery convenient for achieving planimetric accuracy. The scale converted map was then used forpreparation of base maps on which the preliminary interpretation of Remote Sensing data werecarried out using PROCOM IToptical enlarger.
These topographic sheets had been surveyed in periods of 1960's. In certain cases (79G/02), Survey ,of India is yet to publish the map and hence base map has been prepared from thecabinet copy of the same from Survey of India office. Various prominent and permanent featureslike roads, man-made canals, embankments, even creeks (particularly in case of mangrove
20
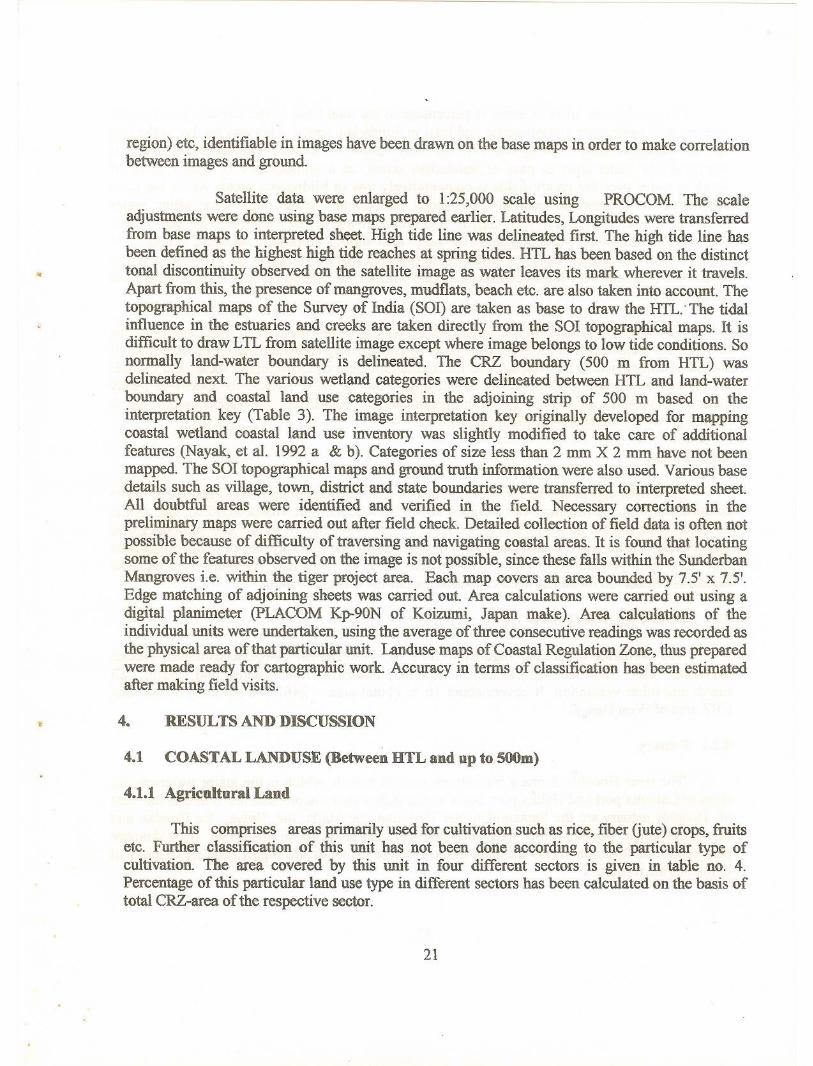
region) etc, identifiable in images have been drawn on the base maps in order to make correlationbetween images and grOlmd.
Satellite data were enlarged to 1:25,000 scale using PROCOM. The scaleadjustments were done using base maps prepared earlier. Latitudes, Longitudes were transferredfrom base maps to interpreted sheet. High tide line was delineated first. The high tide line hasbeen defined as the highest high tide reaches at spring tides. HTL bas been based on the distincttonal discontinuity observed on the satellite image as water leaves its mark wherever it travels.Apart from this, the presence of mangroves, mudflats, beach etc. are also taken into account. Thetopographical maps of the Survey of India (SOl) are taken as base to draw the HTL.·The tidalinfluence in the estuaries and creeks are taken directly from the SOl topographical maps. It isdifficult to draw LTL from satellite image except where image belongs to low tide conditions. Sonormally land-water boundary is delineated. The CRZ boundary (500 m from HTL) wasdelineated next. The various wetland categories were delineated between HTL and land-waterboundary and coastal land use categories in the adjoining strip of 500 m based on theinterpretation key (Table 3). The image interpretation key originally developed for mappingcoastal wetland coastal land use inventory was slightly modified to take care of additionalfeatures (Nayak, et al. 1992 a & b). Categories of size less than 2 mm X 2 mm have not beenmapped. The SOl topographical maps and ground truth information were also used. Various basedetails such as village, town, district and state boundaries were transferred to interpreted sheet.All doubtful areas were identified and verified in the field. Necessary corrections in thepreliminary maps were carried out after field check. Detailed collection of field data is often notpossible because of difficulty of traversing and navigating coastal areas. It is found that locatingsome of the features observed on the image is not possible, since these falls within the SunderbanMangroves i.e. within the.tiger project area. Each map covers an area bounded by 7.5' x 7.5'.Edge matching of adjoining sheets was carried out. Area calculations were carried out using adigital planimeter (pLACOM Kp-90N of Koizumi, Japan make). Area calculations of theindividual units were undertaken, using the average of three consecutive readings was recorded asthe physical area of that particular unit. Landuse maps of Coastal Regulation Zone, thus preparedwere made ready for cartographic work. Accuracy in terms of classification has been estimatedafter making field visits.
4. RESULTS AND DISCUSSION
4.1 COASTAL LANDUSE (Between HTL and up to soOm)
4.1.1 Agricultural Land
This comprises areas primarily used for cultivation such as rice, fiber (jute) crops, fruitsetc. Further classification of this unit bas not been done according to the particular type ofcultivation. The area covered by this unit in four different sectors is given in table no. 4.Percentage of this particular land use type in different sectors has been calculated on the basis oftotal CRZ-area of the respective sector.
21
The agricultural areas in terms of percentage of the total CRZ of the respective sectors aremaximum in Midnapore coastal sector and least in Sundarban sector. This may be due to the factthat in Midnapore sector, during and after the rainy season, the surface drainage of rain water iscomparatively better than in case of Sundarban sector, as a consequence of which depth ofstanding water over the paddy fields is comparatively low in Midnapore sector which has beenconsidered as a favorable condition for paddy cultivation. Besides this, least saline waterincursion, limited reclamation for industrial and urban growth is also responsible for that. Whilesaline water incursion, water logging over huge area duTing monsoon, extensive presence ofmangroves in Sundarban Reserve Forests in the southern part of the sector are the major reasonsbehind the comparatively least percentage of land within CRZ among the four sectors being usedfor agriculture.
The agricultural field, in Sundarban sector, is lying below the river or creek bed level dueto immature reclamation of the tidal flood plain by constructing embankments along the creeks. Itshould be mentioned in this respect that the agriculture field of Deep inland sector and Centralsector are mostly jute growing fields but in other two sectors it is used for extensive paddyculture. Vegetables are mainly grown in Sundarban and Central sectors whereas cashew nut ismainly grown on sandy area of Medinipore coast.
4.1.2 Forest
Both tidal and non-tidal forests are found in Coastal Regulation Zone. Tidal forest is thepredominant unit and this has been included under the Wetland unit. About 3.595 sq. km. area iscovered by the natural non-tidal and 12.42 sq. km. area is covered by man-made non-tidal forestrespectively. Casuarinas, Akashmoni, Sisoo, Babla etc. are the main species of planted non:..tidaltype. At places, plantations of mangroves are also fOU11dviz. Bogkhali, Agnimari Char etc. TheSundarban Reserved forest has been considered under the mangrove units.
4.2 COASTAL WETLAND
The wetlands of coastal regulation zone in West Bengal comprise estuaries, creeks,backwater, tidal flats/mud flats, sandlbeach/spitlbar, mangrove forest (dense and sparse), saltmarsh and other vegetation. It covers about 36 % (Total area = 2467.146 sq. km.) of the totalCRZ area of West Bengal.
4.2.1 Estuary
The river Hooghly forms a big estuary near its mouth, which is the major waterway forships of Calcutta port and Haldia port, boats and launch. Other major estuaries found to the eastof Hooghly estuary are the Saptamukhi, the Thakuran, the Matla, the Bidya, the Gosaba, andthe Harinbhanga. Besides these numerous smaller estuaries occur in this sector. In Midnaporepart, mouth of Rasulpur forms the only estuary. These estuaries are highly productive areas ofliving marine resources.
22
4.2.2 Creek
Dense embroidery network of creeks fed Sunderban area which are influenced by dailytides. The high erosive energy of storm surges is absorbed by the network of creek s. Thecreeks are gradually filled with sediments and getting choked from upper reach.
In ancient times, all the major rivers of Sunderbans used to receive remarkable quantityof fresh water from Bhagirathi - Hooghly-Padma river. But, be-headation of these channelscaused by greater rate of subsidence of the deeper geosynclinals eastern part as well as easterlytilting by neo-tectonic movement during the 12th century (Morgan & McIntire, 1959) made thischannel system as tidal drainage with very insignificant freshwater discharge during monsoonperiod. Again, reclamation of this immature flood plain by constructing embankments almost allalong the tidal channels lead to imbalanced growth where river beds stand higher than thereclaimed land which is being used for agriculture.
Constructions of embankments on both sides of the major rivers! creeks bring forth deadchannels by degrading smaller creeks on both sides. These degraded channels with time havebeen transformed into significant wetlands in Sunderbans and play an important role in thedrainage of the area. S. Chottopadhyay has divided the drainage regime of this area into threetypes as follows :
i) Dead channel- which have lost their connection with one of the main river system in eitherside. Some of these channels are completely choked up with no tide water except monsoon.Channels like Giapati in Namkhana-Kakdwip, Piyali, Bidyadhari, and Ghugudanga blinds creeksare examples.
ii) Decaying channel - channels that are considerably silted up but having regularly recordedtidal fluctuations. The upper part of Saptamukhi estuary, Hatiani-Doani channel etc. areexamples.
iii) Active channel - all the channels that do not fall in above two categories, havingpronounced tidal action.
These wetland system have a great ecological importance, especially in ground water,aquaculture and these are the only routes in this inaccessible area (fig. 1).
4.2.3 Tidal flatslMud flats
Mud flatslTidal flats is one of the most important category of the landuse / landcoverfeature in Coastal Regulation Zone (CRZ). In the western part of West Bengal coast i.e. inMedinipore coastal sector it is sandy but in Sundarban sector and in other two sectors it is muddyin nature. Three types of mud flats are found namely; Saline water mud flat, Brackish water mudflat and Fresh water mud flat. In two sea facing sectors the mud is very saline and major portionis inundated by daily tides while mud flats of central and deep-inland sector get inundation by
23
pushed back freshwater during spring tide and monsoon period only. Out of 223.947 sq. km.area (excluding Mangrove swamp area) about 81.27 % (181.994 sq.km.) is restricted inSundarban sector and Medinipore coastal sector constitute about 5.94 % (13.295 sq. km.). Therest lies in central sector (28.183 sq. km.) and deep-inland sector (0.475 sq.km). Mud flat ofcentral sector is restricted to the recent chars of Rupnarayan river, Kaliaghai river and Haldiriver. A vast stretch of mud flat (6.644 sq.km) lying in between Kaliaghai river andKapaleshwari N near Daspur(73 N/12 SE) become waterlogged for about six months duringmonsoon and post-monsoon period. This mud flat is converted to rice field during dry season bypumping out stored water ignoring the value of this wetland (fig 2).
Other important mud flats of this sector are found near Radhapur Island(79 B/04 NW, 73N/16 NE), Horkhali(79 B/04 NE), Nukulyan (73 N/l5 SE), Uttar Dhalhara (73 N/l5 SE),Amberia(73 N/l5 SE), Kolaghat, Bangalipara, Gabra (73 N/l5 NE), Iswardaha (73 N/16SE).
In Sundarban sector mud flats occur as elongated strip on both sides of the tidal river andcreeks, as patches within mangrove swamp and along the periphery of the islands. A remarkablepart of this highly productive unit is now under aquaculture bheries. The vast mud flat of Canningarea has been reclaimed for traditional practice of brackish water aquaculture (fig. 3). At places,mud flat area has been converted into vegetable garden. In certain areas linear patches of sandare seen lying within the mudflats. Mudflats are found near Phuldubi Gang-NarharipurRadhakrishnapur village (79 C/02 NW, 79 C/OI SW), southern part of Agnimarichar (79 C/OINW), eastern coast of Jambudwip (79 C/02 SE), Chemagari (79 C/02 NE), Banibishnupur (79B/04 SW) and Baneswar chak (79 B/04 SE), Lohachara and Suparbhanga island (79 C/OI SW,peripheral part of Dalhousi island, along Piyali river bed, Purba Gabtala (79 B/12 SW), Haripur(79 C/06 SW), Lothian island (79 C/06), Patharpratima Abad (79 C/05 SW), Mahabatnagar (79C/05 NE), Upendranagar(79 C/05 SE), Kishorimohanpur(79 C/09 SW) etc. Mud flat nearGoalpara (79 B/14 NE) along the Ichamati River is extensively used for Brick preparation (fig.4). In Medinipore part elongated stretches of tidal flat which is mainly sandy all along the coast.Mud is restricted to the Sankarpur, Junput and the mouth region ofPichaboni khal and Rasulpurriver (73 0/13). The major part of the tidal flat near Sankarpur harbor has been reclaimed forshrimp culture i:qcommercial scale. In Deep-inland sector the tidal flat/mud flat is almost absent.
4.2.4 SandlBeachlSpitIBar
Beaches in West Bengal coast are sandy or muddy. Sandy beaches are noticed in thewestern part of Hooghly estuary whereas vast extension of muddy beach is found in 24-Parganasparts i.e. to the east of Hooghly estuary especially to the east ofBogkhali. Well-developed beachis found near Digha, Dattapur, Shaympur, Dadanpatra, Baguranjalpai, Dariapur, Nij Kasba,Bamanchack, Beguakhali, Gangasagtar, Dublat, and Chemagari etc. In other parts beaches arenarrow and it is almost absent on Southeastern part of the coast. Exposition of older mudflat inBogkhali coast and Sankarpur coast is the clear indication of beach erosion (fig. 5).Formation of spit is found near Junput (73 0/13 NW) at the mouth of Pichaboni khaL Anotherminor hook shaped projection is found at the mouth of Sankarpur harbour. The beachfront dunecomplex of Medinipur coast has been included under this unit. Only 0.40 % of the total CRZ area
24

of Sunderban sector is covered by sand and these are mostly narrow linear ridges occurring on thenarrow muddy beach or at the peripheral part of the island viz. Jambudwip (79 C/02 SE), SagarIsland, Chuksardwip (79 C/02 SW), Bogkhali beach ridge (79 C/06 SW), Bulchery island (79C/06 SE, 79 C/l0 SW), Halliday island (79 C/l0 NE), near Jagdal Gang (79 C/06 SE), along theperiphery of the island near Harinbhanga river mouth (79 G/02 NW & SW).
Submerged bars and chars consisting of sand, silt and clay are found all along the coastand rivers namely -- the Hooghly, the Matla, the Thakuran, the Saptamukhi, the Gosaba,theRaimangal, the Harinbhanga etc. Few of these partly covered with marsh vegetation as well asmangrove swamp at places. These shoals are very mobile and changing their position and shapesespecially during SW monsoon.
4.2.5 Mangrove
Mangrove swamp is the major unit of vegetated wetland in CRZ of West Bengal. The totalarea covered by such wetlands is about 2149.496 sq. km. (31.20 % of the total CRZ area). Fromthe satellite image of 1992 dense mangrove area and sparse mangrove area has been calculated as2098.00 sq. km. and 129.19 sq. km. respectively. The major part of this mangrove area is nowunder Sundarban Biosphere Reserve. This mangrove colony is the largest single block of tidalhalophytic mangroves of the World. They are in the form of dense forest along east and southeast parts of the coast while small patches of mangrove are found in Sagar island (fig. 6),Gangadharpur, Nijkasba and man-made mangrove unit are also found in few pockets viz.Agnimarichar, Bogkhali (fig. 7), Sagar island. Recently mangrove steps in few newly formedisland viz. Balaribar Island. The Sundarban Bio-Sphere Reserve could be divided (according toForest Department, Govt ofW.B) in to following zones.
1) Core Zone - well conserved mangrove forests of existing Sundarban Tiger Reserve (1330 sq.km.)forests of "Sundarban National Park".
2) Manipulation Zone - comprises mangrove forest and covers an area of 2400 sq. Ian.
3) Restoration Zone - covers 230 sq. km. degraded forested area, saline blanks, and degradedmudflats within the non-forest area.
4) Development Zone - 5330 sq. km. includes non-forest areas suitable for agri-silvi-pisci culture,animal husbandry, apiculture, horticulture, aquaculture, mushroom culture etc.
Within the present Mangrove islands there are sporadic distribution of saucer-shaped areaswith bright white tone in FCC image, which are flooded by high tide and accumulates salts on thetopsoil. These natural saltpans have been shown as tidal flat on the maps.
Naskar & Guha Bakshi (1982) group the mangrove forest into 5(five) major zones as: i)sea face or beach forest; ii) formative island flora; iii) flora of reclaimed land and low-lying area;iv) flora of riverbanks; and v) swamp forest. The first category is dominated by xerophytes dueto dryness of the sandy soil. The flora of the formative islands consists mainly of Proteresia
25
coarctata, Suaeda maritima, S. nudiflora, Phragmites karka, Acanthus ilicifolius, and a few treespecies such as Avecennia, Sonneratia and Excoecaria species. The reclaimed areas aredominated by mesophytic flora whereas the last two zones are dominated by Halophyticmangrove species. More recently, Naskar & Guha Baksi (1987) established the followingsuccessional phases from swampy mangrove to dry evergreen forest.
Phase I : Swampy mangrove or intertidal mangrove zone - characterised by theherbaceous species Portersia sp. Leersia sp. etc. and the shrub species Acanthus sp., Phoenix sp.The trees are represented by Avicennia sp., Lumnitzera sp., Bruguiera sp. and Rhizophora sp..
Phase II: Tidal Mangrove (ridge forest) - is represented by the herbs like Aerva sp.,Salicornia sp., Sesuviun sp., Scirpus sp., Cyprus sp.; the shrubs Acanthus sp., Aegiceras sp.,Phoenix sp. etc. and the trees like Ceriops, Heritiera, Rhizophora, Sonneratia and Xylocarpus.
Phase ill: True Mangrove - Excoecaria sp., Lumnitzera sp. and Thespesia sp. are present inthis stage, although this stage signifies a decline of true mangrove species.
Phase IV: Non-littoral Zone - Barringtonia sp., Cerbera sp., Dalbergia sp., Dolicandromesp., Hibiscus sp., Pandanus sp. and Thespesia sp. are dominant in this stage and replace the truemangrove species.
Phase V: Xerophytic non-mangrove and dry evergreen forests - In this final phase the treesAccacia sp., Calotropis sp., Casurina sp. and Prosopis sp. are dominates.
Sanyal and Bal (1986) divided the mangrove tidal flats, on which mangrove occurs, into three region, namely - true estuarine tidal flats, middle estuarine flats and inner riverine tidalflats. The true estuarine is dominated by Avecennia marina on the coastal edge, followed byAegialites rotundifolia, Avecennia alba, Bruguiera cylindrica, B. parviflora, Lumnitzeraracemosa, and Sonneratia griffithii. These species can tolerate highly saline conditions andsubmergence. The middle estuarine zone is dominated by Bruguiera gymnorhiza, Ceriopsdecandra, C. tagal, Kandelia kandel, Rhizophora apiculata, R. mucronata, Sonneratia apelata,Xylocarpus granatum and X. mekongensis. The salinity level in this zone is lower than truemangrove but the influence of tidal current is higher. The inner estuarine riverine zone is lesssaline and there is remarkable fresh water discharge. The dominated species are Amooracucullata, B. sexangUla,Cynometra ramiflora, Excoecaria agallocha, Heritiera foems, Nypafruticans, and Sonneratia caseolaris.
Recent reclamation of mangrove swamp area is observed in few pockets especially forshrimp culture. Huge area (about 10.59 sq. km.) has been reclaimed by clearing mangroves, viz.near Dighirpar, Ramkrishnapur and Charkhali (79 B/12 SE). Reclamation in this area has beenfound to be continuing as confirmed by field visit. Remarkable mangrove area reclamation is alsoobserved in other parts, viz. Vijoynagar (79 B/16 NW), Moipit-Sridharpur and Chuprijhara (79C/09 NW), Mollakhali (79 B/16 NW), Bogkhali crocodile project (79 C/06 SW), nearSurendranagar, Harekrishnapur (79 C/05 SW), along the western side of Gobaria Gang nearKashiabai (79 C/05 NW), Kankramarichar (79 C/02 NE), Dakshin Kasinagar (79 C/05 SE), near
26
Keoratala (79 C/05 NE) etc. But, it should be mentioned in this respect that the elimination ofmangroves in few of these locations have taken place through natural processes, althoughaccentuated by human activity.
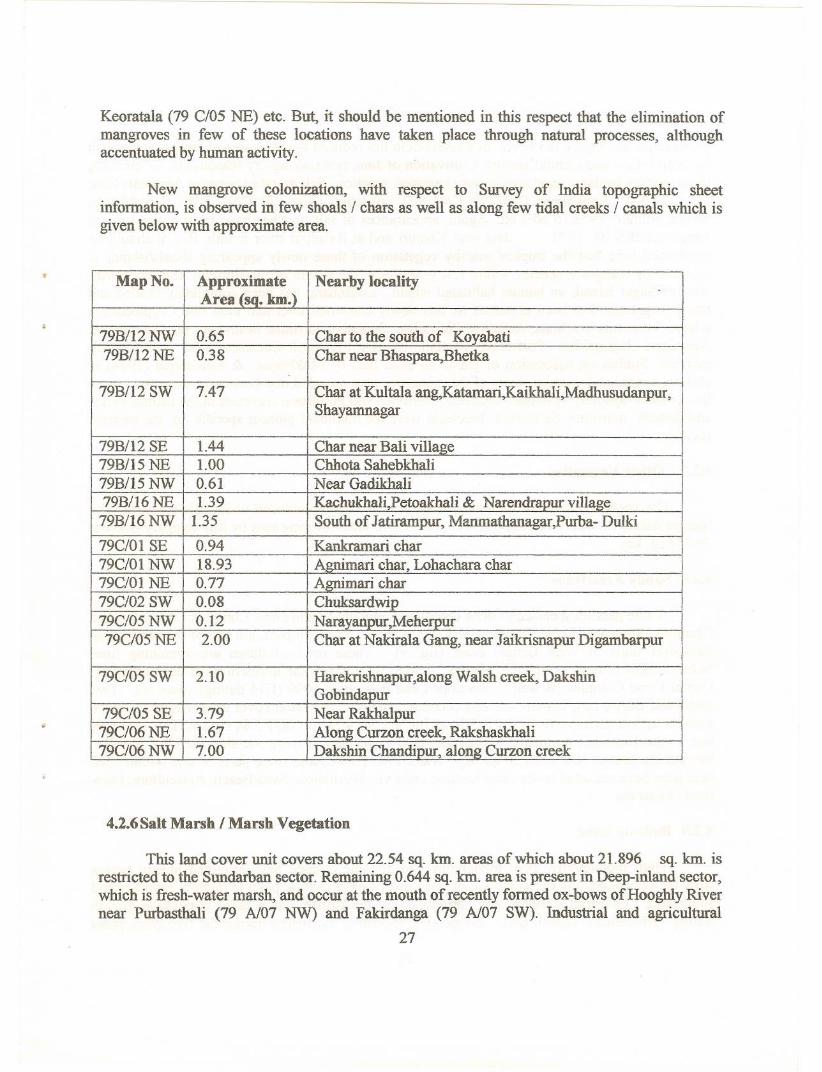
New mangrove colonization, with respect to Survey of India topographic sheetinformation, is observed in few shoals / chars as well as along few tidal creeks / canals which isgiven below with approximate area.
Map No.ApproximateNearby localityArea (sq. km.)
79B/12 NW
0.65Char to the south of Koyabati79B/12 NE
0.38Char near Bhaspara,Bhetka
79B/12 SW
7.47Char at Kultala ang,Katamari,Kaikhali,Madhusudanpur,Shayamnagar
79B/12 SE
1.44Char near Bali village79B/15 NE
1.00Chhota Sahebkhali79B/15 NW
0.61Near Gadikhali79B/16 NE
1.39Kachukhali,Petoakhali & Narendrapur village79B/16 NW
1.35 South of Jatirampur, Manmathanagar,Purba- DuIki
79C/0 1 SE
0.94Kankramari char79C/Ol NW
18.93AJ-mimarichar, Lohachara char79C/0 1 NE
0.77Agnimari char79C/02 SW
0.08Chuksardwip79C/05 NW
0.12Narayanpur,Meherpur79C/05 NE
2.00Char at Nakirala Gang, near Jaikrisnapur Digambarpur
79C/05 SW
2.10Harekrishnapur,along Walsh creek, DakshinGobindapur79C/05 SE
3.79Near Rakhalpur79C/06 NE
1.67Along Curzon creek, Rakshaskhali79C/06 NW
7.00Dakshin Chandipur, alon~ Curzon creek
4.2.6 Salt Marsh I Marsh Vegetation
This land cover unit covers about 22.54 sq. km. areas of which about 21.896 sq. km. isrestricted to the Sundarban sector. Remaining 0.644 sq. kIn. area is present in Deep-inland sector,which is fresh-water marsh, and occur at the mouth of recently formed ox-bows ofHooghly Rivernear Purbasthali (79 Al07 NW) and Fakirdanga (79 Al07 SW). Industrial and agricultural
27
pressure on this highly fertile recent alluvial field has reduced the total area of fresh-water marshin Deep-Inland and Central sectors. Cultivation of Jute, rice (during dIy season) etc. by cleaningthese marshy wetland vegetation is very common practice. Salt marshes occur in Agffimari Char(79 C/O1 NW), Kankramari Char (79 C/O1 SE), Lohachara Char (79 C/O1 NW), SuparbhangaIsland, Amtali (79 B/16 NE) etc. Again, appearances of salt marshes have been noticed in theimages of IRS IB 1992 data near Khejuri and at Rasulpur river mouth. But, it should bementioned here that the tropical marshy vegetation of these newly appearing shoals/islands isreplaced by mangrove species within few years. Near the mouth of the Hooghly and the northwest of Sagar Island, an human habitated island , Lohachara, has been completely eroded andmarsh vegetation has been appeared on this newly converted intertidal mud flat. Cryptocornyeciliata, Salicornia brachiata, Acanthus ilicifolius, Swaeda maritima, Sesuvium portulacustrum,Aeluropus lagopoides, Porteresia coarctata etc. are the marsh specieses found in these saltmarshes. Studies on succession of plants on mud flats by MukheIjee & MukheIjee (1978) ineastern, central and western sector of the mangrove area revealed that Porteresia coarctta wasthe pioneer species; whereas Acanthus ilicifolius and Porteresia coarctata in the central sectorand Suaeda maritima, Salicornia brachiata were the dominant pioneer species in the westernsector.
4.2.7 Other Vegetation
The vegetated areas of Unidentified species have been included under this category. Thespecies· nature is widely varying place to place. The total covering area by this category is about39.254 sq. kIn.
4.2.8 Sandy Area/Dune
Three parallel spectacular dune complexes, namely Contai Dune Complex / Ancient DuneComplex, Ramnagar Dune Complex, and Beach front Dune Complex, are one of the two uniquelandcover units of West Bengal coast (fig. 9). These rows of dunes are stretching fromSubamarekha estuary to Hooghly estuary. Among these three, the northern most dune complex,Contai Dune.Complex, is well developed and it is about 6000 (C14 dating) years old. Twoimportant cash crops, cashew nut and coconut, grown on this sand cover area. Although, morethan 90 sq. kIn. area is covered by the dunes but in CRZ area it is only 5.84 sq. km. This is simplydue to the facts that the major part of this land cover unit is lying out side the CRZ area i.e.beyond the line of 500 meter from High Water Line (HWL) and some parts of this within CRZarea have been included under other landuse units viz. Habitation, Sand/Beach, Agriculture, Manmade forest etc.
4.2.9 Built-up Land
High productivity, even topography and equable climate have attracted human beingsfrom the very beginning of the growth of this Lower Ganga Deltaic plain to migrate eastward andsouthward. Industrial development, introduced by the British, cause rapid population growthduring 19th century. Again, post independent industrial expansion during the five years plans
28
Area f!iven in Sa. KJ
and migration of people from neighboring Bangladesh bring forth rapid expansion of habitatedarea reclaiming immature flood plains ofHooghly-Matla-Harinbhanga drainage basin.
In Coastal Regulation Zone (CRZ) of West Bengal the unit of built-up land covers about1301.603 sq. km. area and it is about 18.89 % of the total CRZ area. The distribution of differentsubunits in different sectors is given below.
From the mapping work it is clear that maximum habitated area is located in Sundarban sector(545.191 sq.km.) but in terms of percentage of the respective area it is only 11.26 % whereas inDeep-inland sector and Central sector it is 40.88 % and 41.43 % respectively. Growth of industry(Hooghly industrial belt), trade and Commercial centers centering Calcutta are the main cause ofthis uneven distribution. In this Central sector the habitated zone on both eastern and western
natural levee of the river Hooghly, from Gardenreach to Tribeni, is characterised by very densepopulation with very insignificant presence of vegetation. On the other hand, sparse linearsettlement is found to be grown on both sides of tide-fed river/creeks and roads. The waterwaysof these tidal creeks are the major transport system in this highly inaccessible area. Somevegetable growing fields, especially in Sundarban sector have been included under the unit ofHabitation with vegetation since demarcation of such small vegetable garden's boundaries is verydifficult.
4.3 OTHER FEATURES
4.3.1 Reclaimed Area
Reclamation of mangrove areas is very prominent in Sundarban sector. Systematic leaseswere granted to settlers to settle in the area, from 1831 to 1833, to the south of Dampier-Hodgesline. This colonisation policy encouraged the reclamation of the then mangrove area from Haroa,Minakhan in the northeast of Sagar, Kakdwip and Patharpratima on the south-west (pargiter,1934). The low-lying immature flood plain of cleared mangrove had been protected from tidalingress by construction of embankments. This reclamation gave rise to a number ofenvironmental problems.
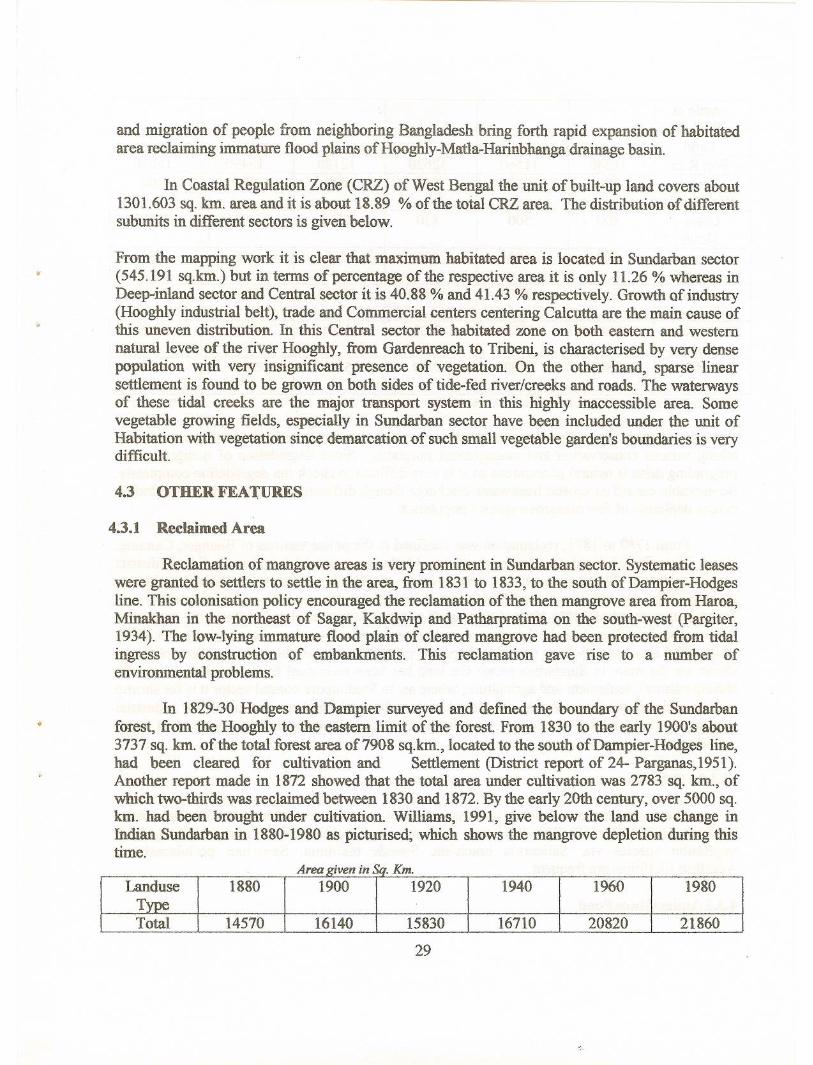
In 1829-30 Hodges and Dampier surveyed and defined the boundary of the Sundarbanforest, from the Hooghly to the eastern limit of the forest. From 1830 to the early 1900's about3737 sq. km. of the total forest area of 7908 sq.km., located to the south of Dampier-Hodges line,had been cleared for cultivation and Settlement (District report of 24- Parganas, 1951).Another report made in 1872 showed that the total area under cultivation was 2783 sq. km., ofwhich two-thirds was reclaimed between 1830 and 1872. By the early 20th century, over 5000 sq.km. had been brought under cultivation. Williams, 1991, give below the land use change inIndian Sundarban in 1880-1980 as picturised; which shows the mangrove depletion during thistime.
.-.
Landuse 188019001920194019601980
Type Total145701614015830167102082021860
29

arable &SettledLandWet Rice
112401156012620121201549016040
Forest
680630640600440400
Woodlands Grass-800500820150014301790
shrub Barren500500500500500500
Land Total1516013960139401241085307180
Wetland Mangrove
614955745402530142313909
Tidal Surface574057405740574057405740
Water
Source: Mangrove of the Sunderbans, vol. one: India
But, present study shows that the rate of mangrove depletion has been hacked up to a level aftertaking various conservation and management programs. Since degradation of mangrove in aprograding delta is natural phenomena so it is very difficult to check the degradation completely.Remarkable cut-off of upland freshwater discharge though different river channels of Sundarbancauses depletion of few mangrove species population.
From 1780 to 1873, reclamation was confined to the police stations of Bhangor, Canning,Haroa, Hasnabad, fJ...ingalganj,Joynagar, Kulpi, Mathurapur and Mohankhan & Sagar (districtcensus report of 24-parganas, 1951). Reclamation of Gosaba, Kakdwip, Kultali, Namkhana,Patharpratima, Basanti, Sagar and Sandeshkhali polici stations, as well as Canning areas wasfound in the period of 1873- 1939. A few small pockets were also cleared after 1951 to resettlethe refugees from Bangladesh. However, in our present work very recent reclamation (after 196869) in CRZ area has only been considered and the present landuse of the reclaimed area has beenshown on the map. In Sundarban sector the land has been reclaimed for aquaculture (speciallyshrimp culture), settlement and agriculture~ where as, in Medinipore coastal sector it is for shrimpculture and salt panning. Again, in central sector, the land has been reclaimed for industrialdevelopment and related agriculture, and freshwater aquaculture is mainly practiced in deepinland sector.
4.3.2 Salt Pan
These are reclaimed inter tidal marsh land has been marked near Dadanpatra ofMedinipore coast (fig. 10). This salt pan is now used also for aquaculture. Presence of salt marshvegetation species viz. Salicornia brachiata, Suaeda maritima, Sesuvium portulacastrum,Acanthus ilicifolius are frequent.
4.3.3 Aquaculture Pond30
The fishery industry, which plays a significant role in socio-economic environment aswell as in physical environment, of the CRZ of West Bengal are of diverse type, comprisingsaline water coastal fisheries, brackish water fisheries and fresh water aquaculture. Large-scaleconversion of mangrove forest, salt marshes, agricultural field, mudflats, and fresh water lakes /beels have caused serious and irrevocable damage. Surveys conducted in the Sundarban indicatea total annual catch offish of 25,000 metric tons and on an average 4,000 individuals are engaged
in daily fishing (1.5 kg fish/day/fisherman). Besides this, about 40,000 shrimp seep collectorsannually harvest about 540 million seed of Paneous monodon destroying 10.26 billion seeds ofother fish and shrimp in this process. Similarly, reclamation of freshwater beels, specially incentral and Deep-inland sector, for culture of selective species severely destroying thediversity of aquatic species as well as the whole. Another problem is that the soil becomeextremely acidic due to exposition of pyrite, present in the soil of mangrove area, to air and, thus,release sulphuric acid which reduce the fertility of soil greatly (fig. 11).
About 356.09 sq. km.(5.17 %) area of CRZ is used for aquaculture of which 352.49sq.km area is of saline and brackish water. Sunderban sector constitute 347.461 sq. km. area ofsaline water and brackish water aquaculture whereas the freshwater fisheries are restricted mainlyto the beels/lakes in central and deep-inland sectors.
5. Area calculation
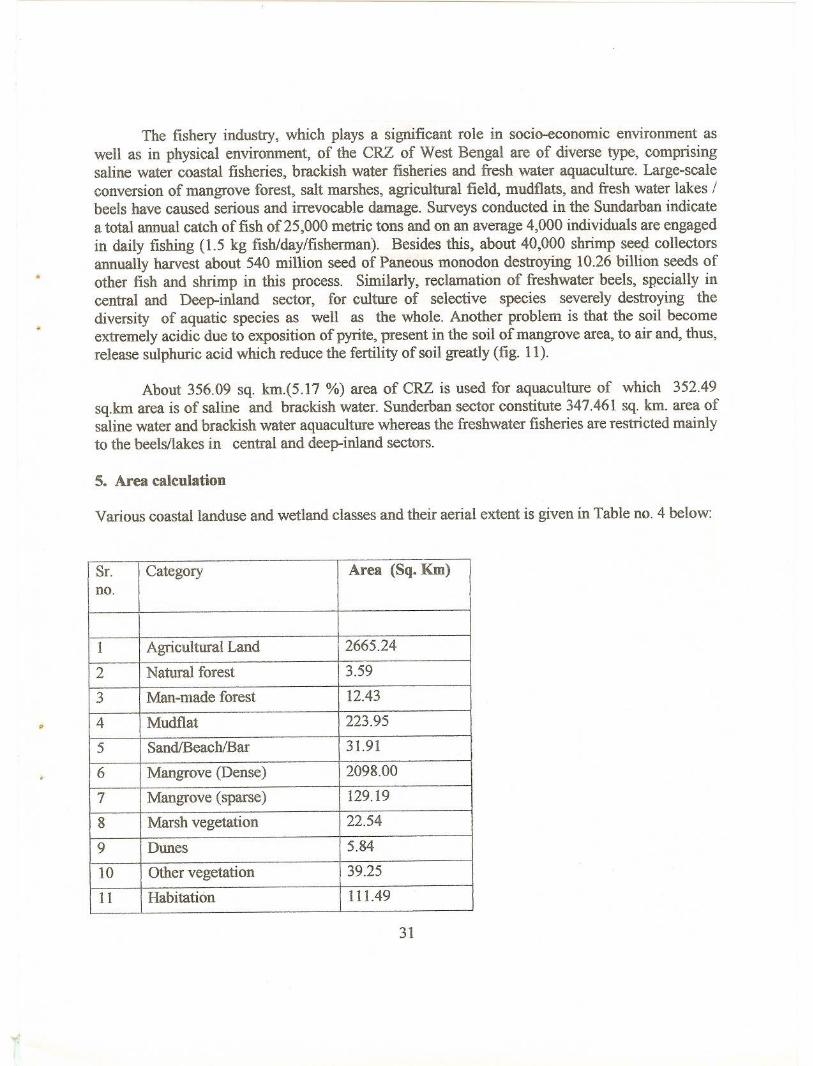
Various coastallanduse and wetland classes and their aerial extent is given in Table no. 4 below:
I Sf
CategoryArea (Sq. KIn) Ino.
1
Agricultural Land 2665.24
2
Natural forest 3.59
3
Man-made forest 12.43
4
Mudflat 223.95
5
SandlBeach/Bar 31.91
6
Mangrove (Dense) 2098.00
7
Mangrove (sparse) 129.19
8
Marsh vegetation 22.54
9
Dunes 5.84
10
Other vegetation 39.25
11
Habitation 111.49
31
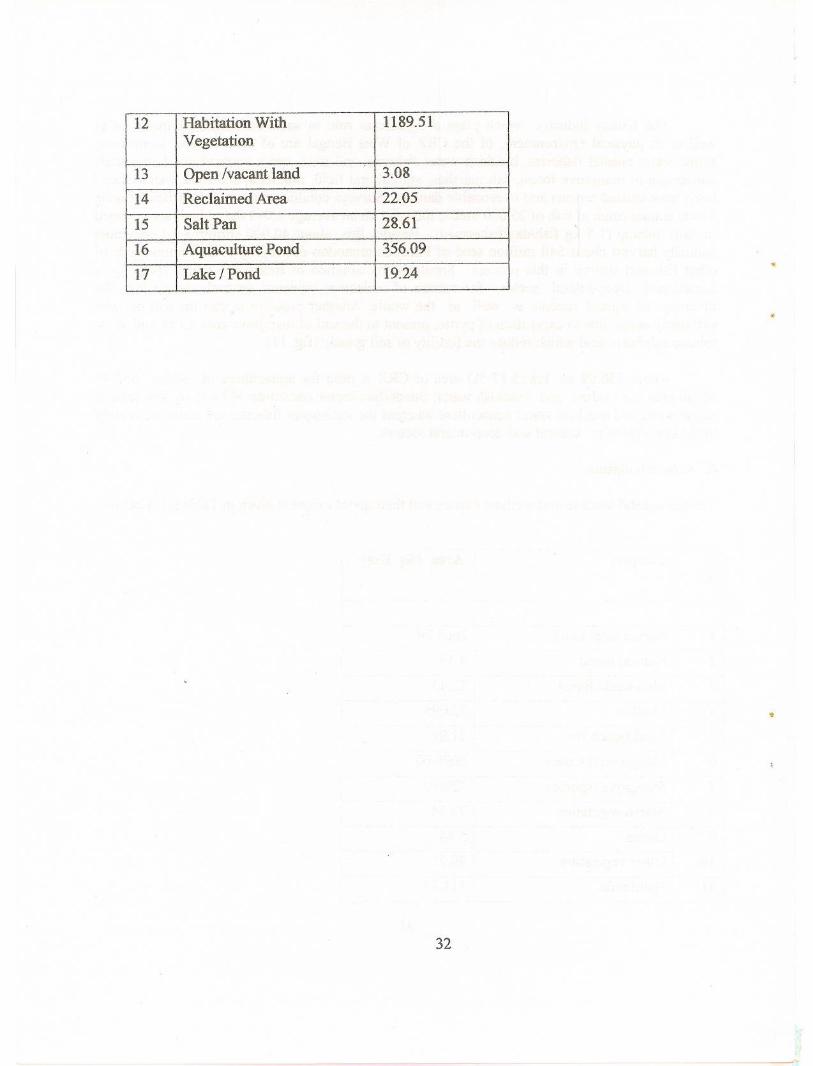
12 Habitation With 1189.51
Vegetation13
Open /vacant land 3.08
14
Reclaimed Area 22.05
15
Salt Pan 28.61
16
Aquaculture Pond 356.09
17
Lake / Pond 19.24
32
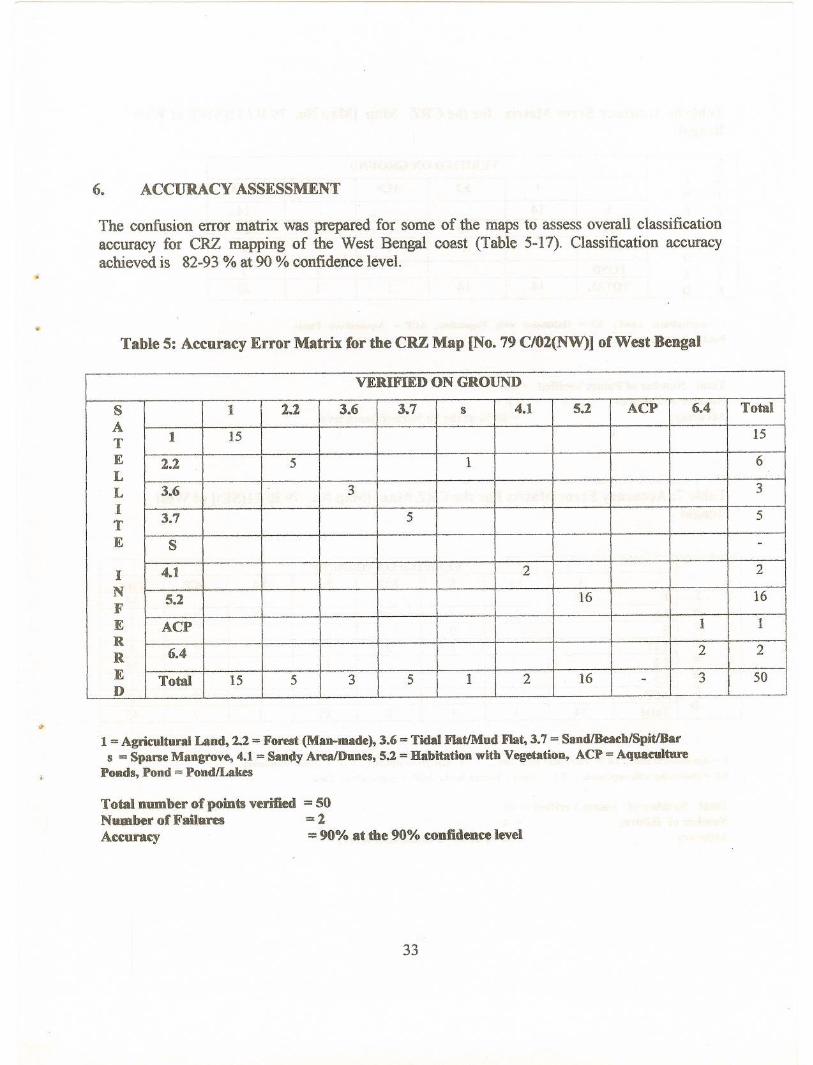
6. ACCURACY ASSESSMENT
The confusion error matrix was prepared for some of the maps to assess overall classificationaccuracy for CRZ mapping of the West Bengal coast (Table 5-17). Classification accuracyachieved is 82-93 % at 90 % confidence level.
Table 5: Accuracy Error Matrix for the CRZ Map [No. 79 C/02(NW)] of West Bengal
VERIFIED ON GROUND
S
12.23.63.7s4.15.2ACP6.4Total
A15T
115
E2.2 5 1 6
L L3.6 3 3
I 3.75 5
TE
S-
I4.1 22
N5.2
1616F E
ACP 11R R
6.4 22
E
Total155351216-350D
1"" Agricultural Land, 2.2:= Forest (Man-made), 3.6 = Tidal FlatlMud Flat, 3.7 = SandlBeacb/SpitIBars = Sparse Mangrove, 4.1 = Sandy AreafDunes, 5.2 = Habitation witb Vegetation, ACP =Aquaculture
Ponds, Pond = PondlLakes .
Total number of points verified = 50Number of Failures = 2Accuracy = 90% at the 90% confidence level
33

Table 6: Accuracy Error Matrix for the CRZ Map [Map No. 79 B / l1(SW)] of WestBengal
S VERIFIED ON GROUNDA
I 15.2ACPPONDTOTALT
NE
F 114 14L
E 5.2 13 13L
R ACP 11 2IR
TE POND 11
E
D TOTAL14141130
1 = Agricultural Land, 5.2 = Habitation with Vegetation, ACP = Aquaculture PondsPond = Pond I Lakes
Total Number of Points Verified = 30Number of Failures = 1
Accuracy = 88 % at tbe 90 % confidence level
Table 7: Accuracy Error Matrix For the CRZ Map [Map No. 79 B/ l1(SE)] of WestBengal
S VERIFIED ON GROUNDA
13.6S3.125.25.3ACPTota!T
I1 14 14E
N3.6 3 14L
FS 0L
E3.12 12 14I
R5.2 1414T
R5.3 11E
EACP 178D Total 14312151945
1 = Agricultural land • 3.6 = Tidal flat I Mud flat. s = Mangrove (sparse). 3.12 = Other vegetation
5.2 = Habitation with vegetation, 5.3 = Open I Vacant land. ACP = Aquaculture Pond
Total Number of points Verified = 45Number of failures = 4
Accuracy = 83 % at 90 % confidence level
34
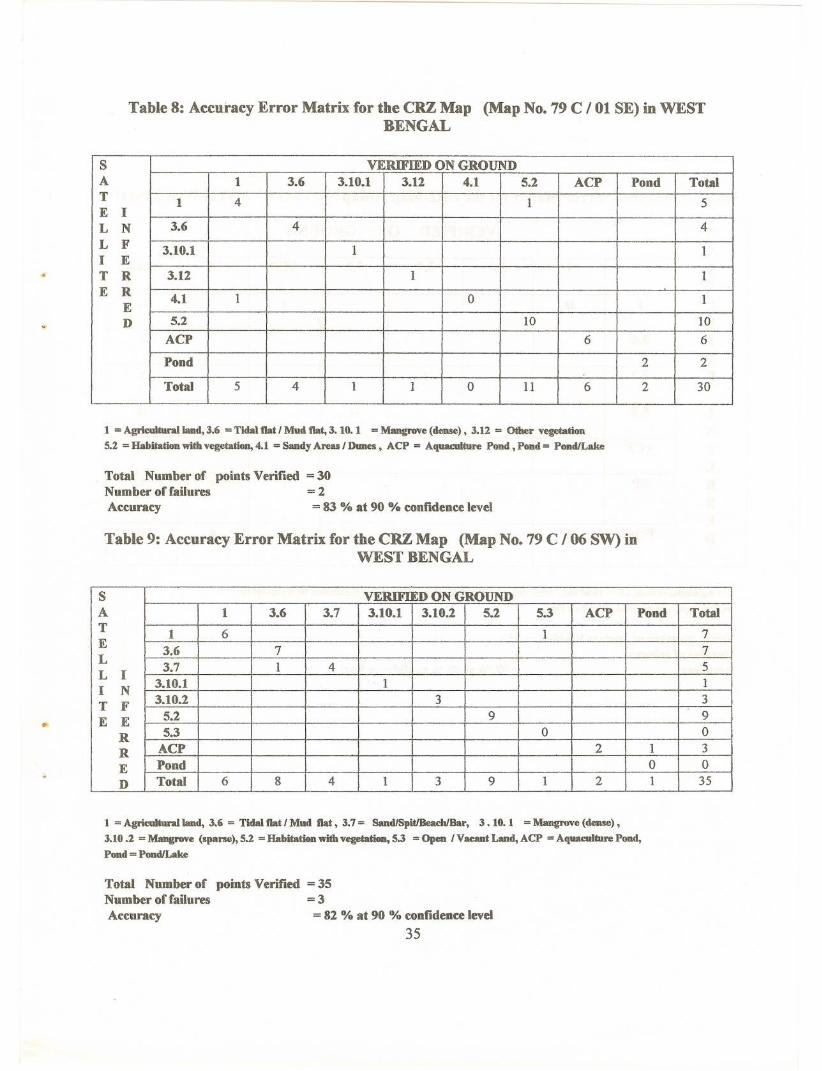
Table 8: Accuracy Error Matrix for the CRZ Map (Map No. 79 C / 01 SE) in WESTBENGAL
S VERIFIED ON GROUNDA
13.63.10.13.124.15.2ACPPondTotalT
14 15E
IL
N 3.6 4 4
LF 3.10.1 1 1I E
TR 3.12 1 1
ER
4.11 01E D
5.2 10]0
ACP66
Pond
22
Total
541I0II6230
1 = Agrieulturalland, 3.6 = Tidal flat I Mud flat, 3. 10. 1 = Mangrove (dense), 3.12 => Other vegetation
5.2 = Habitation with vegetation, 4.1 = Sandy Areas I Dunes, ACP => Aquaculture Pond, Pond = PondILake
Total Number of points Verified = 30Number of failures = 2Accuracy = 83 % at 90 % confidence level
Table 9: Accuracy Error Matrix for the CRZ Map (Map No. 79 C / 06 SW) inWEST BENGAL
S VERIFIED ON GROUNDA
13.63.73.10.13.10.25.25.3ACPPondTotalT
16 I7
E 3.67 7L 3.714 5L I
3.10.11 II N
TF 3.10.2 33
E
E 5.2 99
R
5.3 00
R
ACP 213
E
Pond 00
D
Total68413912I35
1 = Agricultural land, 3.6 = Tidal flat I Mud flat, 3.7= SandiSpitlBeachlBar, 3. 10. 1 = Mangrove (dense) ,
3.10.2 = Mangrove (sparse),5.2 = Habitation with vegetation. 5.3 = Open I Vacant Land, ACP =< Aquaculture Pond,Pond =PondlLake
Total Number of points Verified = 35Number offailures = 3Accuracy = 82 % at 90 % confidence level
35
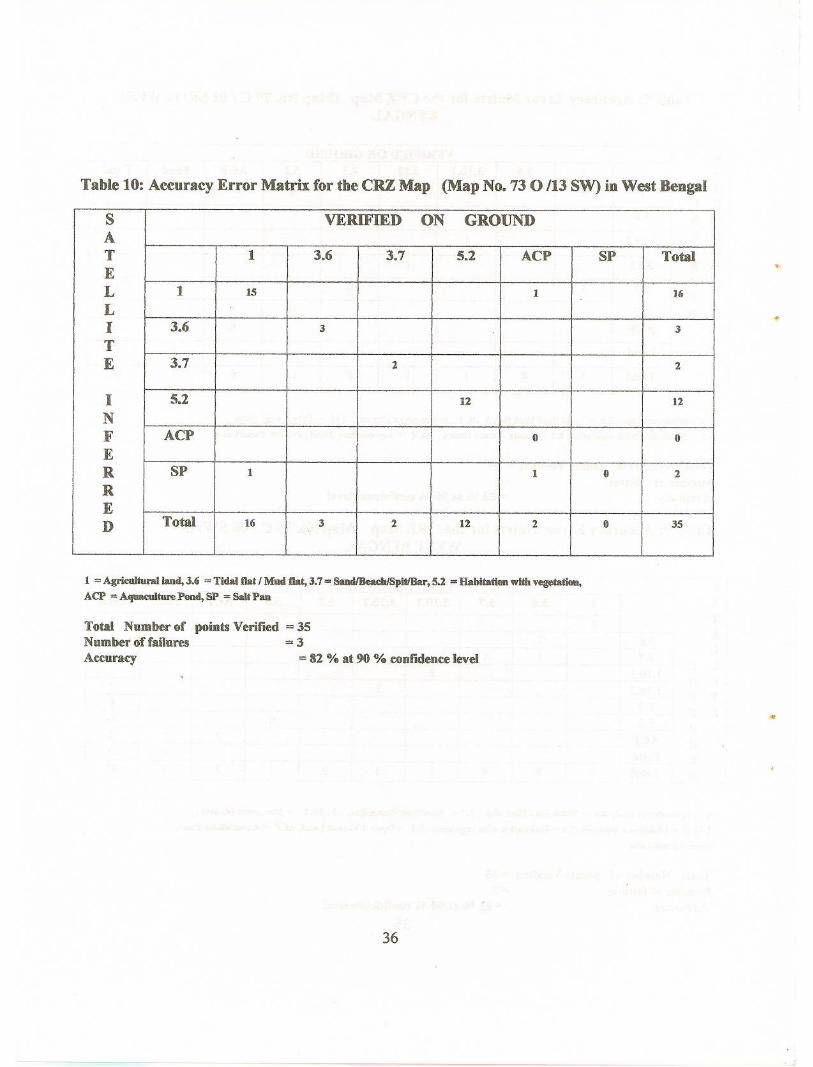
Table 10: Accuracy Error Matrix for the CRZ Map (Map No. 730/13 SW) in West Bengal
S VERIFIEDONGROUNDA T
13.63.75.2ACPSPTotalE L
115 116
L I3.6 3 3
T E3.7 2 2
I
5.2 1212
N FACP 00
E RSP1 102
R EDTotal1632122035
1 = Agricultural land, 3.6 = Tidal flat I Mud flat, 3.7= Sand!BeadtlSpitlBar, 5.2 = Habitation with vegetation,
AcP = Aquaculture Pond, SP = Salt Pan
Total Number of points Verified = 35Number of failures = 3Accuracy = 82 % at 90 % confidence level
36
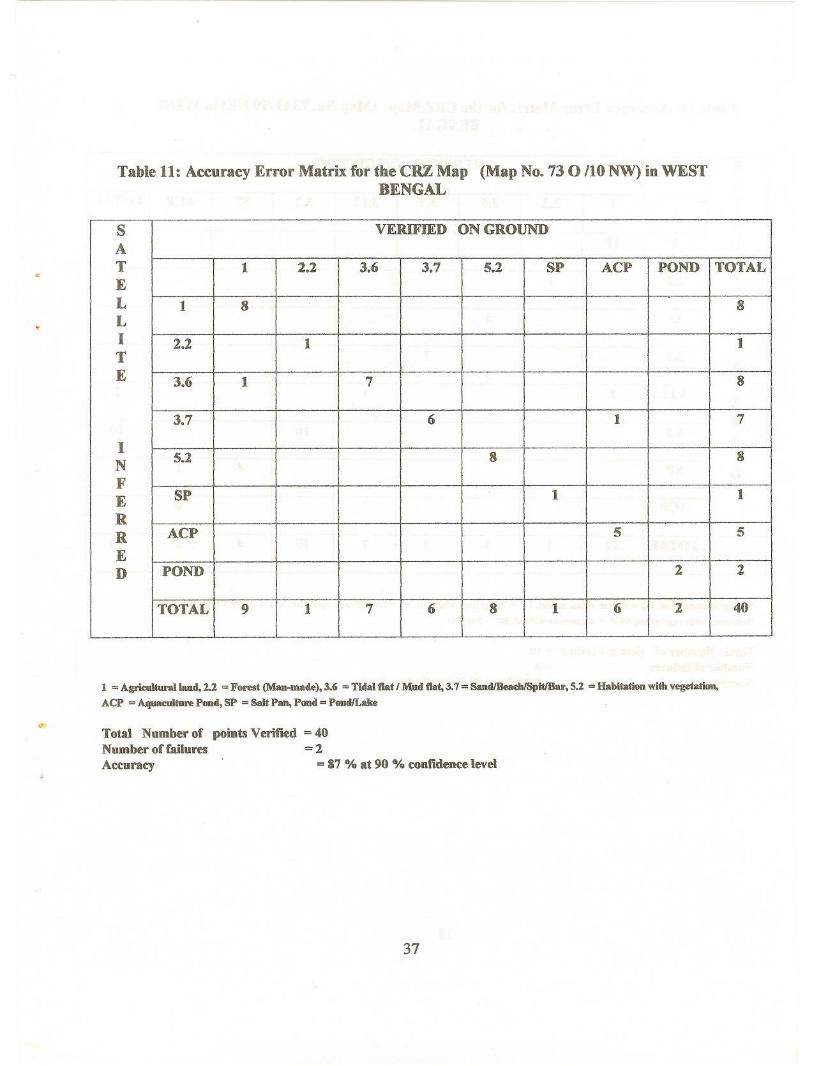
Table 11: Accuracy Error Matrix for the CRZ Map (Map No. 73 0 /10 NW) in WESTBENGAL
S VERIFmD ON GROUNDA T
12.23.63.75.2SPACPPONDTOTALE L
18 8L I 2.2
1 tT E
3.6t 7 8
3.7
617
I8N
5.2 8
F E
SP 11
R R
ACP 55
E DPOND 22
TOTAL
9tI
7 6816240
1 = Agrieulturalland, 2.2 = Forest (Man-made), 3.6 = Tidal flat I Mud Oat, 3.7 = SandlBeaehlSpitlBar, 5.2 = Habitation with vegetation,
ACP = Aquaculture Pond, SP = Salt Pan, Pond = PondILake
Total Number of points Verified = 40Number of failures = 2Accuracy = 87 % at 90 % confidence level
37

Table 12: Accuracy Error Matrix for the CRZ Map (Map No. 73 0/10 NE) in WESTBENGAL
S VERIFIED ON GROUNDA T
12.23.63.73.125.2SPACPTOTALE L
111 11L I 2.2 1 1T E
3.6 3 3
I3.7
7 7N F 3.12E1 12
R R
5.2 1010
E DSP 426
ACP
00
TOTAL
121371104240
1 =Agricultural land, 2.2 = Forest (Man-made), 3.6 = Tidal flat I Mud flat, 3.7 = SandJBeaclJ/SpitlBar, 3.12 = Other Vegetation, 5.2 =Habitation with vegetation, ACP = Aquaeulture Pond, SP = Salt Pan
Total Number of points Verified = 40Number offailures = 3Accuracy = 84 % at 90 % confidence level
38
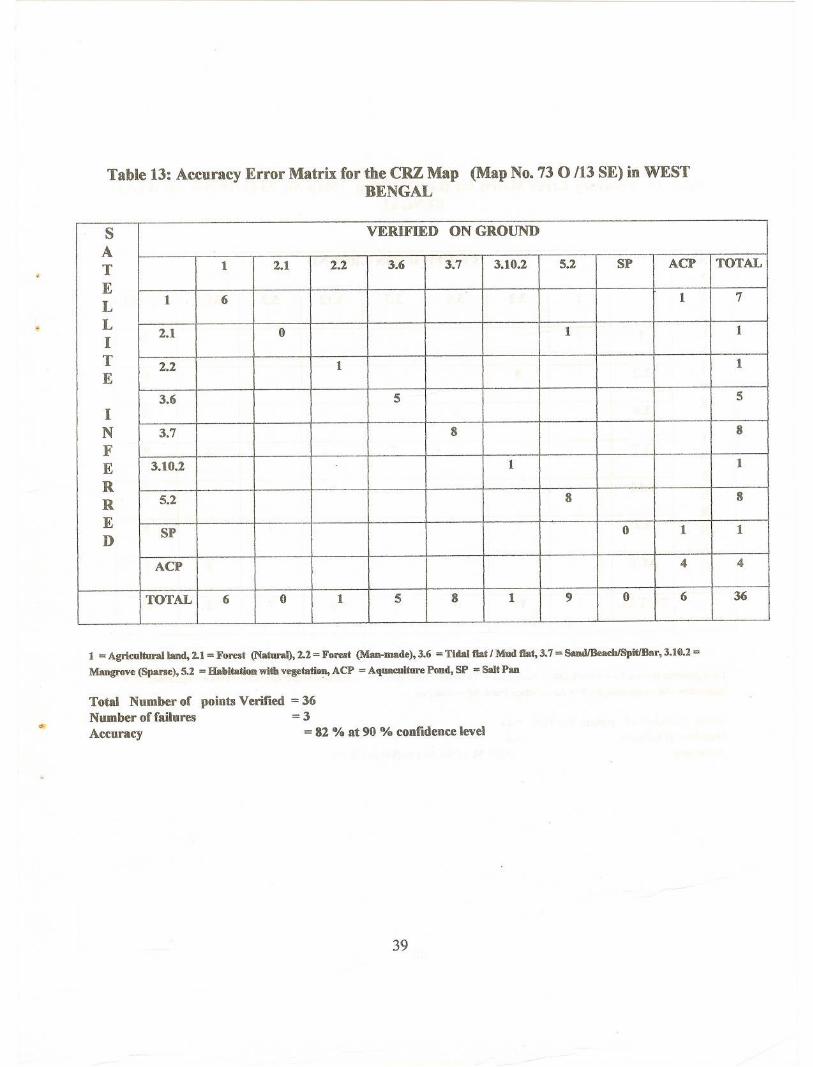
Table 13: Accuracy Error Matrix for the CRZ Map (Map No. 73 0/13 SE) in WESTBENGAL
S VERIFIED ON GROUND
A T
12.12.23.63.73.10.25.2SPACPTOTAL
E L16 17
L2.1
0 11I T2.2
1 1E 3.6
I5 5
I N3.7 88
F E3.10.2 11
R R5.2 88
E D
SF 011
ACP
44
TOTAL
60158190636
1 >= Agrkulturalland, 2.1= Forest (Natural), 2.2 = Forest (Man-made),3.6 = Tidal flat I Mud flat, 3.7 =SandlBeacblSpitfBar, 3.10.2 =
Mangrove (Sparse), 5.2 = Habitation with vegetation, ACP = Aquaculture Pond, SP = Salt Pan
Total Number of points Verified = 36Number offailures = 3Accuracy = 82 % at 90 % confidence level
39
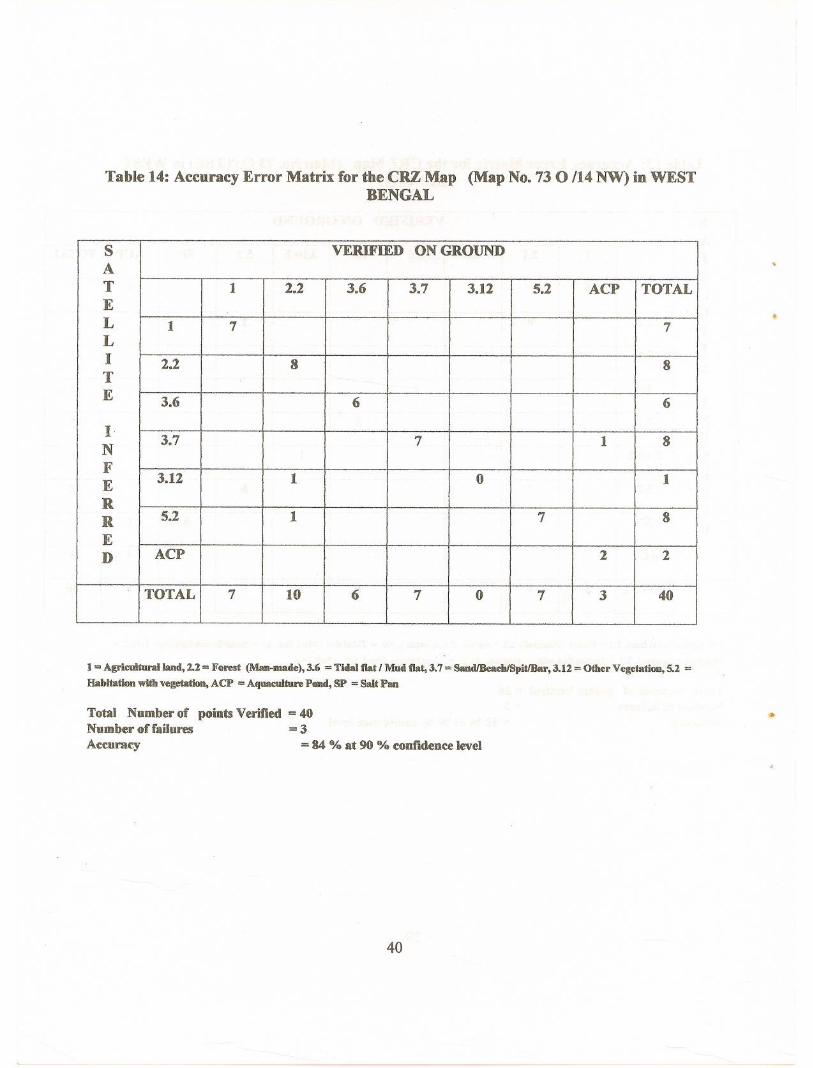
Table 14: Accuracy Error Matrix for the CRZ Map (Map No. 73 0/14 NW) in WESTBENGAL
S VERIFIED ON GROUNDA T
12.23.63.73.125.2ACPTOTALE
.L 17 7L I 2.2 8 8T E
3.66 6
I3.7
718N F 3.12
1E10
R R
5.2 1 78
E DACP 22
TOTAL
7106707340
1 = Agricultural land, 2.2 = Forest (Man-made),3.6 = Tidal flat f Mud flat, 3.7 = SandlBeacblSpitfBar, 3.12 = Other Vegetation, 5.2 =
Habitation with vegetation, ACP = Aquaculture Pond, SP = Salt Pan
Total Number of points Verified = 40Number offailures = 3A~curacy = 84 % at 90 % confidence level
40
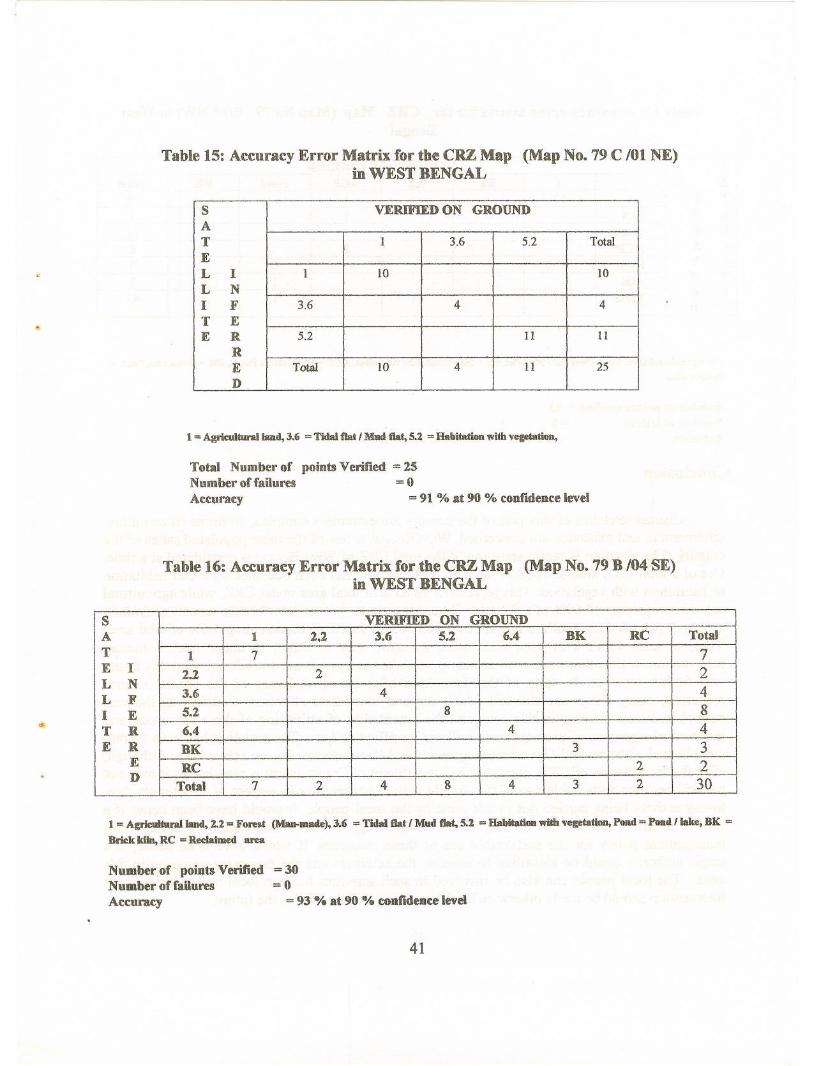
Table 15: Accuracy Error Matrix for the CRZ Map (Map No. 79 C 101 NE)in WEST BENGAL
S VERIFIED ON GROUNDA T
13.65.2Total
E LI 110 10
LN
IF 3.6 44
TE
ER 5.2 II11
R ETotal 1041125
D
1 = Agmulturalland, 3.6 '" Tidal flat I Mud fiat, 5.2 '" Habitation with vegetation,
Total Number of points Verified =::: 25Nnmber offailures = 0
Accuracy = 91 % at 90 % confidence level
Table 16: Accuracy Error Matrix for the CRZ Map (Map No. 79 B 104 SE)in WEST BENGAL
is VERIFIED ON GROUNDA
12.23.65.26.4BKRCTotal
T17 7
EI
2.22
I2L
N4L F 3.6 4
IE 5.2 88
T
R 6.4 44E
R BK 33E
RC 22D Total
724843230
1 = Agricultural land, 2.2 = Forest (Man-made),3.6 = Tidal fiat I Mud flat. 5.2 = Habitation with v.tation, Pond = Pond' lake, BK =
Brick kiln, RC = Reclaimed area
Numberof points Verified =::: 30Number offaOures = 0
Accuracy = 93 % at 90 % confidence level
41
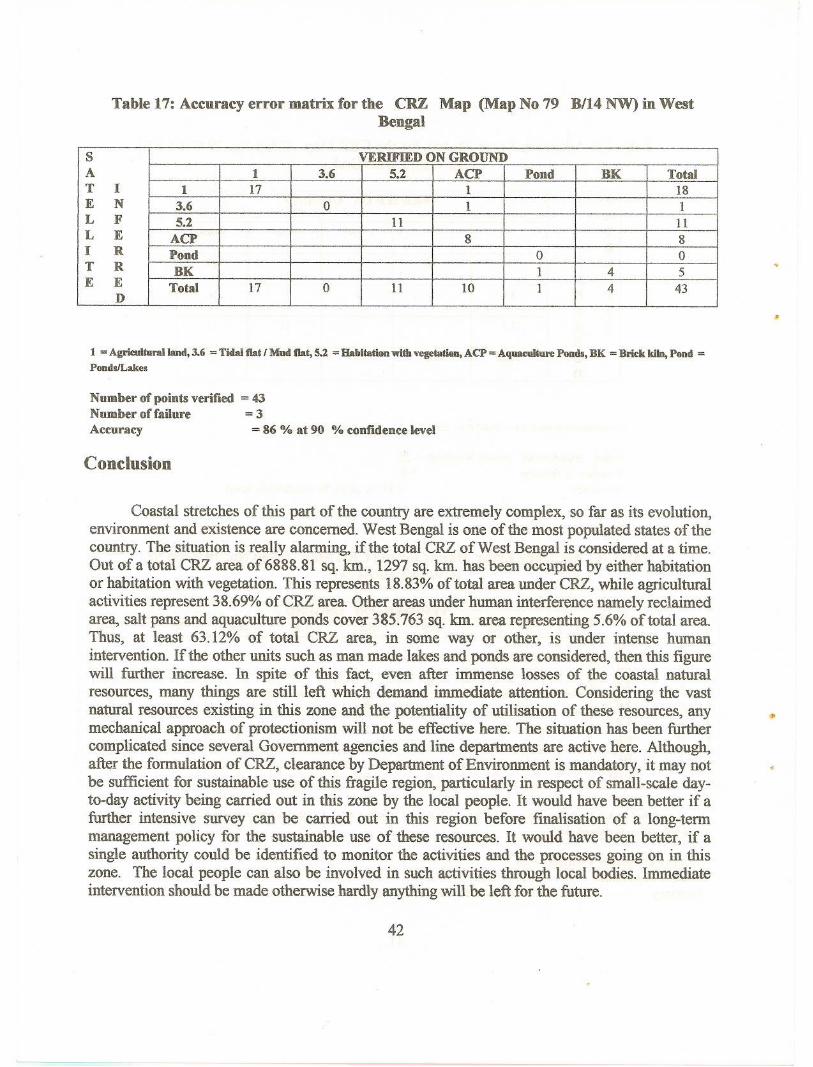
Table 17: Accuracy error matrix for the CRZ Map (Map No 79 B/14 NW) in WestBengal
S VERIFIED ON GROUNDA
13.65.2ACPPondBKTotalT
I 117 118E
N 3.6 01 1L
F 5.2 11 11L
E ACP 88I R Pond 00T
R BK 145E
E Total17011101443D
1 = Agricultural land, 3.6 = Tidal flat I Mud flat, 5.2 = Habitation with vegetation, ACP = Aquaculture Ponds, BK = Brick kiln, Pond =PondslLakes
Nnmber of points verified = 43Nnmber offailure = 3
Accuracy = 86 % at 90 % confidence level
Conclusion
Coastal stretches of this part of the country are extremely complex, so far as its evolution,environment and existence are concerned. West Bengal is one of the most populated states of thecountry. The situation is really alarming, if the total CRZ of West Bengal is considered at a time.Out of a total CRZ area of 6888.81 sq. km., 1297 sq. km. has been occupied by either habitationor habitation with vegetation. This represents 18.83% of total area under CRZ, while agriculturalactivities represent 38.69% of CRZ area. Other areas under human interference namely reclaimedarea, salt pans and aquaculture ponds cover 385.763 sq. kIn. area representing 5.6% of total area.Thus, at least 63.12% of total CRZ area, in some way or other, is under intense humanintervention. If the other units such as man made lakes and ponds are considered, then this figurewill further increase. In spite of this fact, even after immense losses of the coastal naturalresources, many things are still left which demand immediate attention. Considering the vastnatural resources existing in this zone and the potentiality of utilisation of these resources, anymechanical approach of protectionism will not be effective here. The situation has been furthercomplicated since several Government agencies and line departments are active here. Although,after the formulation of CRZ, clearance by Department of Environment is mandatory, it may notbe sufficient for sustainable use of this fragile region, particularly in respect of small-scale dayto-day activity being carried out in this zone by the local people. It would have been better if afurther intensive survey can be carried out in this region before finalisation of a long-termmanagement policy for the sustainable use of these resources. It would have been better, if asingle authority could be identified to monitor the activities and the processes going on in thiszone. The local people can also be involved in such activities through local bodies. Immediateintervention should be made otherwise hardly anything will be left for the future.
42
,
ACKNOWLEDGEMENTS
We are grateful to Dr. R R Navalgund, Deputy Director, Remote Sensing ApplicationsArea (RESA), and SAC for their constant encouragement and guidance. We are indebted to Dr. T.Bandyopadhyay, Director, Institute of Wetland Management and Ecological Design for his keen
in~erest, constant guidance and useful suggestions during the study.
REFERENCES
Anonymous: Coastal Zone Management - Integrated Policies, Organisation for economicco-operation and Development.
Beatley, Brower, & Schwab: An introduction to Coastal Zone Management; Island Press.
Chakrabarti P(1995) : Evolutionary history of the coastal Quaternaries of the Bengal plain, India.ProC. Indian natn. Sci. Acad., 61, A, No.5, pp.343-354.
Chakrabarti P : Process Response System Analysis in the Macrotidal estuarine and MesotidalCoastal plain of Eastern India. Memo.Geol. Soc.India. No. 22, pp 165-181.
Chakraborty P(1991) : Subamarekha delta - A Geomorphic Appraisal; Memo.Geol. Soc. ofIndia,No.22, pp. 25-30.
Chattopadhyay S: Landscape System in Littoral Tract of Deltaic West Bengal- a case study.
Chaudhuri AB & Chaudhury A, Mangroves of Sunderbans, mCN Publications, vol-I: India;1994.
Coastal Environment, Scientific Note, RSAM/SAC/COM/SN/11/92 Space Applications Centre(ISRO), Ahmedabad, 1992.
Coastal Planning and Management: A Review; Dept. of Env. London: HMSO
Coastal Zone Management Plan for West Bengal(March,1996), Department of Environment,Govt. of West Bengal; India
Morgan J P & McIntire (1959): Quaternary Geology of Bengal Basin, east Pakistan and India.Bull. Geol. Soc. of India, Vol 70, pp 319-342,
Mallick{ 1971): Personal corrununication.
Naskar K. R: Floristic studies of the district 24 Parganas in West Bengal (India) with SpecialReference to the Mangrove Vegetations of the Sunderbans. Ph.DThesis, University ofCalcutta, (Published).
43
Naskar & Guha Bakshi (1982) : Sunderbans - the World Famous Mangrove Forest of the District24-Parganas in West Bengal, Jour. Econ. Tax. Botani, 3:883-918.
Nayak S & Shaikh M.G. (1994) : Coastal Landuse Mapping of the West Bengal Coast forBrakish Water Aquaculture Site Selection. Sc. Note, RSAM/SAC/CMASS/SN/03/94,Space Applications Centre (ISRO), Ahmedabad, 1994.
Nayak S, Pandey A & Shaikh M. G., (1991): Manual for mapping of coastal wetlands/landformsand shoreline Changes using satellite data. Technical note, SAC, ISRO, Ahmedabad.IRS-UP/SAC/MCE/TN/32/91.
Nayak S; Pandey A, & Shaikh M. G., 1991 a A Coastal Zone Classification System - a RemoteSensing Approach. In the Proc. of the National Seminar on Quaternary Landscape ofIndian Subcontinent. Dept of Geology, M.S. University of Baroda, pp. 73-78.
Niyogi D & Mallik S (1973) : Quaternary Laterite of West Bengal: Its geomorphology,Stratigraphy and Genesis. Geol., Min.& Met. Soc. of India, 1973.
Niyogi D (1975) : Quaternary Geology of the Coastal Plain in West Bengal and Orissa, Ind. Jour.of Earth Sc. vol 2, pp 51-61 ,
Niyogi D (1970): Geological Background of Beach Erosion at Digha, West Bengal. Bull. of theGeol. Min. & Met. Soc. oflndia. vol. 43,
Raman, Neogi, Sukhdarshan Kumar and Parakh (1986) : New approach towards the explorationof Pre Eocene sediments in Bengal basin. Bull.of O.N.G.C , vol. 23, No.1.
Roybarman A. Geology and Hydrocarbon Prospects of West Bengal;Petroleutn Asia Jour., vol. vi, No.4, pp 51-56.
Sengupta S : Geological and geophysical studies in Western part of Bengal Basin, India. Vol.50,No.5, PP 1001-1017, Bull.of the American Assoc. of Petroleum Geol.
Tiwari S & Banerjee S.K (1985) : Seismic stratigraphy of onshore West Bengal basin; Bull. OfO.N.G.C , vol 22,
Valdiya K. S. (1987) : Environmental Geology, Indian Context; Tata McGraw-Hill PublishingCompo Ltd., 1987.
44
Annexure I
Coastal Regulation Zone of India
The Coastal Regulation Zone (CRZ) notification of 19th February 1991 is the directoutcome of Environmental Protection Act, 1986. Notification under section 3(1) and 3(2)(v) ofEnvironmental Protection Act, 1986 rule 5(3)(d) of the Environment (Protection) Rilles, 1986states the specific portion of coastal stretches as Coastal Regulation Zone and also mentionedabout the Regulating Activities in the Coastal Regulation Zone. According to the notification,the coastal stretches of seas, bays, estuaries, creeks, rivers and back waters which are influencedby the tidal action (in the landward side) up to 500 m from the High Tidal Line (HTL) and theland between the HTL and LTL (Low Tide Line) as Coastal Regulation Zone and imposes,with effect from the date of this notification, the restrictions on the setting up and expansion ofindustries, operation or processes etc. in the said Coastal Regulation Zone (CRZ). For the purposeof this notification, the High Tide Line (HTL) will be defmed as the line up to which the highestof high tide reaches at spring tide. It has also been mentioned that the proposed regu1ations willapply in the case of rivers, creeks and backwaters, may be modified on a case by case basis forreasons to be recorded while preparing the Coastal Zone Management Plan (CZMP) and,however, this distance shall not be less than 100 meters or the width of the creek, river, orbackwater whichever is less. In exercise of the powers conferred by clause (a) of sub rule (3) ofrule 5 of Environment Protection Rule, 1986, the Union Government hereby makes the followingamendments in the notification of the 001 in the Ministry of Environment & Forest No. S.O. 114(E) of 19th Feb. 1991, as has been made by S.O. 595 (E) dated 18.08.94 as below.
(a) In paragraph 1, for the portion beginning with the words "For purpose of thisnotification, the High Tide Line" and ending with the words "width of the creek, river andbackwaters which ever is less", the following shall be substituted, namely: -
"For the purpose of this notification, the High Tide Line means the line on the landup to which the highest water line reaches during the spring tide and shall be demarcateduniformly in all parts of the country by the demarcating authority so authorised by the CentralGovernment in consultation with the Surveyor General of India".
NOTE
The distance from the high tide line (HTL) shall apply to both sides in the case of rivers,creeks and back waters and may be modified on a case by case basis for reasons to be recordedwhile preparing the coastal zone management plans (CZMP). However this distance shall not beless than 50 meters or the width of the creek, river or backwater whichever is less.
The distance up to which development along rivers, creeks and back waters is to beregu1ated shall be governed by the distance up to which the tidal effect of sea is experienced inrivers, creeks or back waters, as the case may be, and should be clearly identified in theCoastal Zone Management Plans".
45
Mapping of HTL is to be done uniformly over all the coastal states so as to avoid conflictsin management treatment under the same regulation in different areas. Surveyor General of Indiahas been vested with the responsibility of demarcating HfL by MOEF (vide their letter dated23.02.1995) and the work is in progressing.
In order to regulate developmental activities, the CRZ has been classified into fourcategories; namely:
Category I (CRZ- I)
i) Areas that are ecologically sensitive and important such as national parks/marineparks, sanctuaries, reserve forests, wildlife habitats, mangroves, corals/or coral reefs, areasclose to breeding and spawning grounds of fish and other marine life, areas of outstandingnatural beauty / historical/heritage areas, areas rich in genetic diversity, areas likely tobe inundated due to rise in sea level consequent upon global warming and such other areas asmay be declared by the Central Government or the concerned authorities at the state or UnionTerritory level from time to time.
ii) Area between low tide line and high tide line.
Category n: (CRZ-ll)
The areas that have already been developed upto or close to the shoreline. For thispurpose, "developed area" is referred to as that area within the municipal limits or in otherlegally designated urban areas which is already substantially built up and other infrastructurefacilities, such as water supply and sewerage mains.
Category ill: (CRZ-Ill)
Areas that are relatively undisturbed and those, which do not belong to either category I orII. These will include coastal zone in the rural areas (developed and undeveloped) and also areaswithin Municipal limits or in other legally designated urban areas, which are not substantiallybuilt up.
Category IV: (CRZ-IV)
Coastal stretches in the Andaman & Niccobar, Lakshadweep and small islands, exceptthose designated as CRZ-I, CRZ-II, CRZ-ill.
The different regulatory activities as mentioned in the Notification are stated below: -
46
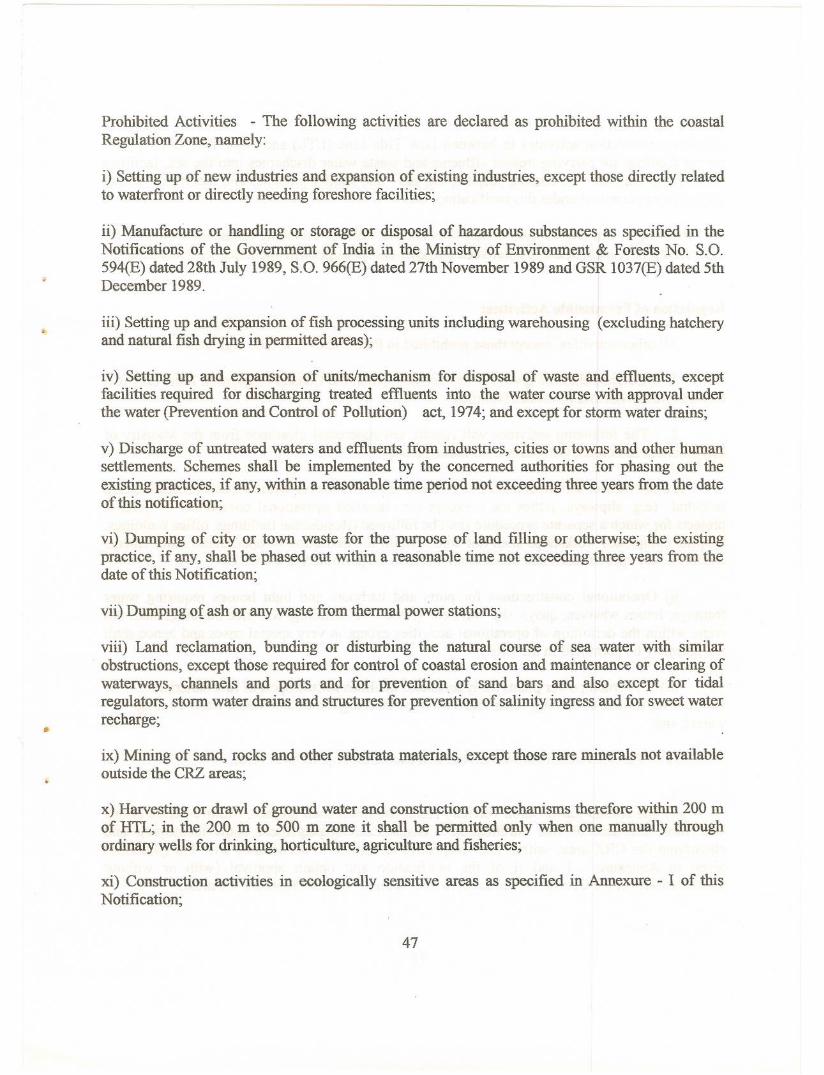
Prohibited Activities - The following activities are declared as prohibited within the coastalRegulation Zone, namely:
i) Setting up of new industries and expansion of existing industries, except those directly relatedto waterfront or directly needing foreshore facilities;
ii) ManufactUre or handling or storage or disposal of hazardous substances as specified in theNotifications of the Government of India in the Ministry of Environment & Forests No. S.O.594(E) dated 28th July 1989, S.O. 966(E) dated 27th November 1989 and GSR 1037(E) dated 5thDecember 1989.
iii) Setting up and expansion offish processing units including warehousing (excluding hatcheryand natural fish drying in permitted areas);
iv) Setting up and expansion of units/mechanism for disposal of waste and effluents, exceptfacilities required for discharging treated effluents into the water course with approval underthe water (Prevention and Control of Pollution) act, 1974; and except for storm water drains;
v) Discharge of untreated waters and effluents from industries, cities or towns and other humansettlements. Schemes shall be implemented by the concerned authorities for phasing out theexisting practices, if any, within a reasonable time period not exceeding three years from the dateof this notification; .
vi) Dumping of city or town waste for the purpose of land filling or otherwise; the existingpractice, if any, shall be phased out within a reasonable time not exceeding three years from thedate of this Notification;
vii) Dumping of ash or any waste from thermal power stations;
viii) Land reclamation, booding or disturbing the natural course of sea water with similar. obstructions, except those required for control of coastal erosion and maintenance or clearing of
waterways, channels and ports and for prevention of sand bars and also except for tidalregulators, storm water drains and structures for prevention of salinity ingress and for sweet waterrecharge;
ix) Mining of sand, rocks and other substrata materials, except those rare minerals not availableoutside the CRZ areas;
x) Harvesting or drawl of ground water and construction of mechanisms therefore within 200 mof HTL; in the 200 m to 500 m zone it shall be permitted only when one manually throughordinary wells for drinking, horticulture, agriculture and fisheries;
xi) Construction activities in ecologically sensitive areas as specified in Annexure - I of thisNotification;
47
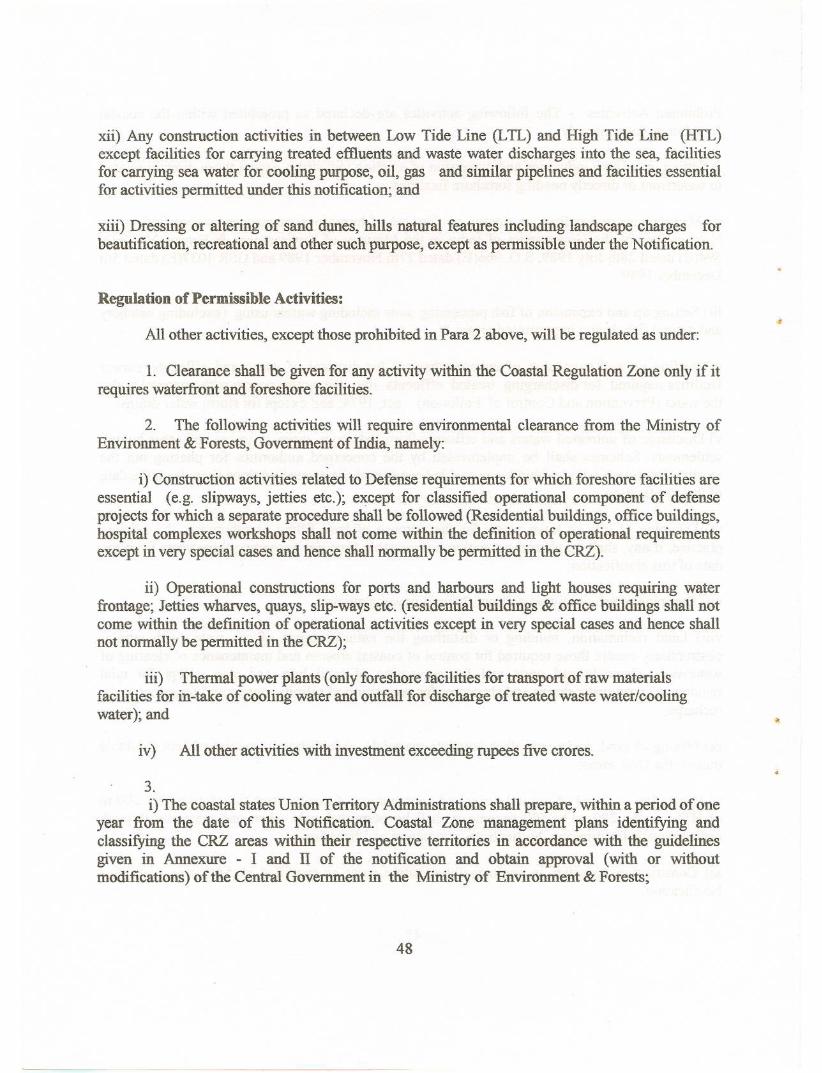
xii) Any construction activities in between Low Tide Line (LTL) and High Tide Line (HTL)except facilities for carrying treated effluents and waste water discharges into the sea, facilitiesfor·carrying sea water for cooling purpose, oil, gas and similar pipelines and facilities essentialfor activities permitted under this notification; and
xiii) Dressing or altering of sand dunes, hills natural features including landscape charges forbeautification, recreational and other such purpose, except as permissible under the Notification.
Regulation of Permissible Activities:
All other activities, except those prohibited in Para 2 above, will be regulated as under:
1. Clearance shaH be given for any activity within the Coastal Regulation Zone only if itrequires waterfront and foreshore facilities.
2. The following activities will require environmental clearance from the Ministry ofEnvironment & Forests, Government of India, namely:
i) Construction activities related to Defense requirements for which foreshore facilities areessential (e.g. slipways, jetties etc.); except for classified operational component of defenseprojects for which a separate procedure shall be foHowed (Residential buildings, office buildings,hospital complexes workshops shall not come within the definition of operational requirementsexcept in very special cases and hence shall normally be permitted in the CRZ).
ii) Operational constructions for ports and harbours and light houses requiring waterfrontage; Jetties wharves, quays, slip-ways etc. (residential buildings & office buildings shall notcome within the definition of operational activities except in very special cases and hence shallnot normally be permitted in the CRZ);
iii) Thermal power plants (only foreshore facilities for transport of raw materialsfacilities for in-take of cooling water and outfall for discharge of treated waste water/coolingwater); and
iv) All other activities with investment exceeding rupees five crores.
3.
i) The coastal states Union Territory Administrations shall prepare, within a period of oneyear from the date of this Notification. Coastal Zone management plans identifying andclassifying the CRZ areas within their respective territories in accordance with the guidelinesgiven in Annexure - I and II of the notification and obtain approval (with or withoutmodifications) of the Central Government in the Ministry of Environment & Forests;
48
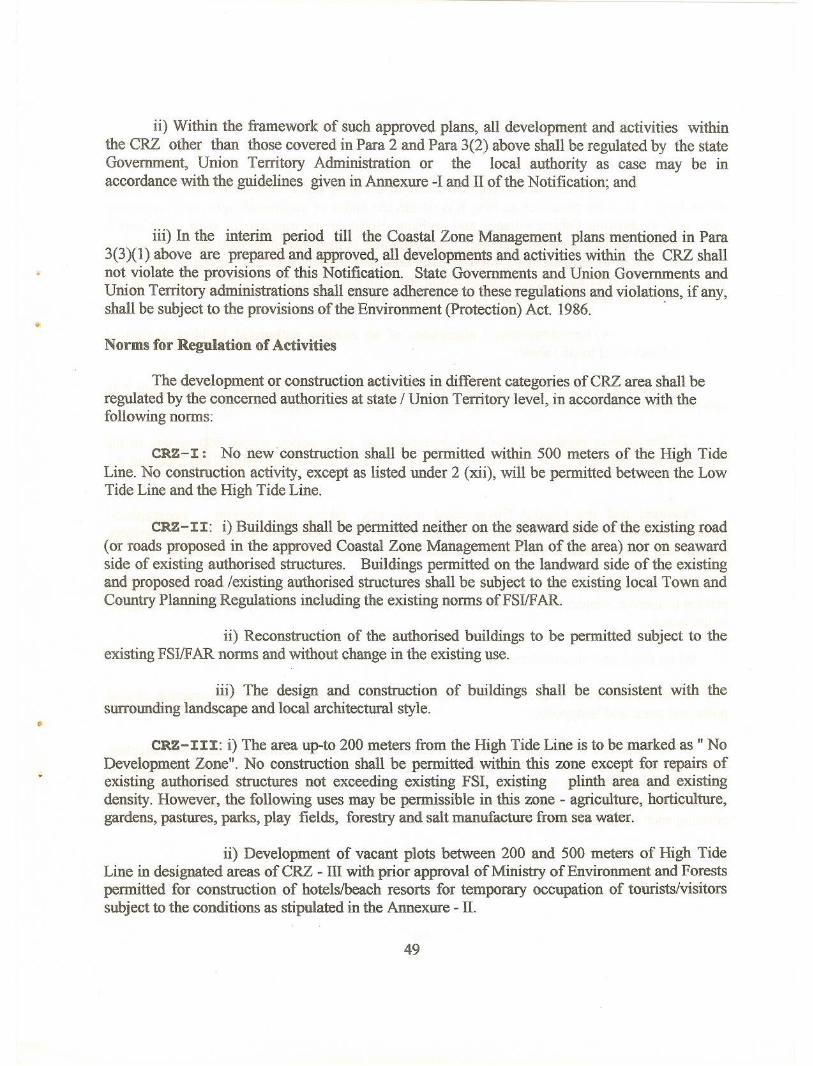
ii) Within the framework of such approved plans, all development and activities withinthe CRZ other than those covered in Para 2 and Para 3(2) above shall be regulated by the stateGovernment, Union Territory Administration or the local authority as case may be inaccordance with the guidelines given in Annexure -1 and II of the Notification; and
iii) In the interim period till the Coastal Zone Management plans mentioned in Para3(3)(1) above are prepared and approved, all developments and activities within the CRZ shallnot violate the provisions of this Notification. State Governments and Union Governments andUnion Territory administrations shall ensure adherence to these regulations and violations, if any,shall be subject to the provisions of the Environment (Protection) Act. 1986..
Norms for Regulation of Activities
The development or construction activities in different categories of CRZ area shall beregulated by the concerned authorities at state / Union Territory level, in accordance with thefollowing norms:
CRZ-I: No new construction shall be permitted within 500 meters of the High TideLine. No construction activity, except as listed under 2 (xii), will be permitted between the LowTide Line and the High Tide Line.
CRZ-II: i) Buildings shall be permitted neither on the seaward side of the existing road(or roads proposed in the approved Coastal Zone Management Plan of the area) nor on seawardside of existing authorised structures. Buildings permitted on the landward side of the existingand proposed road /existing authorised structures shall be subject to the existing local Town andCountry Planning Regulations including the existing norms of FSI/FAR.
ii) Reconstruction of the authorised buildings to be permitted subject to theexisting FSI/FAR norms and without change in the existing use.
iii) The design and construction of buildings shall be consistent with thesurrounding landscape and local architectural style.
CRZ-III: i) The area up-to 200 meters from the High Tide Line is to be marked as " NoDevelopment Zone". No construction shall be permitted within this zone except for repairs ofexisting authorised structures not exceeding existing FSI, existing plinth area and existingdensity. However, the following uses may be permissible in this zone - agriculture, horticulture,gardens, pastures, parks, play fields, forestry and salt manufacture from sea water.
ii) Development of vacant plots between 200 and 500 meters of High TideLine in designated areas ofCRZ - III with prior approval of Ministry of Environment and Forestspermitted for construction of hotelslbeach resorts for temporary occupation of tourists/visitorssubject to the conditions as stipulated in the Annexure - II.
49

iii) Construction/reconstruction of dwelling units between 200 and 500 metersof the High Tide Line permitted so long it is within the ambit of traditional rights and customaryuses such as existing fishing villages and gothans. Buildings permission for such constructionwill be subject to the conditions that the total number of dwelling units shall not be more thantwice the number of existing units; total covered area on all floors shall not exceed 33 percent ofthe plot size; the over all height of construction shall not exceed 9 (nine) meters and constructionshall not be more than 2 (two) floors (ground floor + one floor).
v) Reconstruction / alterations of an existing authorised building permittedsubject to (i) to (iii) above.
According to the amendment made on 18th Aug., 1994 in Annexure-II, in paragraph 7, insub-paragraph (1), for item (i), the following items shall be substituted, namely:-
i) The project proponent shall not undertake any construction within 200 meters in thelandward side from the High Tide Line and within the area between the High Tide Line and theLow Tide Line:
Provided that the Central Government may, after taking into account geographicalfeatures and overall Coastal Zone Management Plans, and for reasons to be recorded in \\TIting,permit any construction subject to such conditions and restrictions as it may deem fit;
ia) live fencing and barbed wire fencing with vegetative cover may be allowed aroundprivate properties subject to the condition that such fencing shall in no way hamper public accessto the beach;
ib) no flattening of sand dunes shall be carried out;
ic) no permanent structures for sports facilities shall be permitted except construction of goalposts, net posts and lampposts;
id) construction of basement may be allowed subject to the condition that no objectioncertificate is obtained from the State Ground Water Authority to the effect that such constructionwill not adversely affect free flow of ground water in that area. The State Ground WaterAuthority shall take into consideration the guidelines issued by the Central Government beforegranting such no objection certificate.
50
ANNEXURE II
Survey of India toposheets used for Landuse mapping in Coastal Regulation Zone
Map No. SOl ToposheetYear ofYear ofScale of SOlUsed
SUlveyPublicationToposheet73 N/ll
73 Nlll1969-7019721: 50,000SE 73 N/12
73 N/121969-7019761: 50,009NE, SE 73 N/14
73 N/141969- 7019711: 50,000SE, SW, NW 73 NilS
73 NilS1969-70i9731: 50,000SE, SW. NW. NE 73 N/16
73 N/161969-7019761: 50,000NW, NE, SE, SW 73 0/06
73 01061969- 7019761: 50,000NE, SE 73 0/09
73 01091969-7019731: 50,000SW, SE, NE, NW 73 0110
73 0/1 01968-6919721: 50,000NW, NE. SW 73 0/13
73 0/131968-6919711: 50,000NE, NW, SE, SW 730/14
73 0/141968-6919711: 50,000NW 79 Al07
79 Al071968-6919731: 50,000NE, NW. SE, SW 79 AlO8
79 Al081968-691972I: 50,000NE NW.SE 79 A/ll
79 AlII--1: 63,360
NW 79 A/1279 Al12--1: 63,360
SW, NE, NW 79 A/1679 Al161962-63,19671: 50,000
NW, SE, SW
1966-6779 B/02
79 B/021958-5919661: 50,000SE 79 B/03
79 B/031958-5919621: 50,000SW, SE, NE, NW 79B/04
79 B/041967-6819771: 50,000SE, SW, NE, NW 79 BIOS
79 B/051958-5919611: 50,000NE, NW, SE, SW 79 B/06
79 B/061958-5919731: 50,000
NW, SW 79 B/0779 B/071959-6019651: 50,000
SW, SE, NE, NW 79 B/08
79 B/081968-6919721: 50,000
51

NE, NW, SE, SW79 B/tO
79 BII01959-6019731: 50,000NE, NW. SEe SW 79 BIll
79 Bill1959-6019731: 50,000SE, SW, NW, NE 79 B/t2
79 B/121968-6919721: 50,000SEe SW, NE. NW 79 B/t3
79 B/13-19651: 63,360
SW, NW, NE.
79 B/1479 B/141919-2019571:63,360
SE, SW, NE. NW 79 BIIS79 BIl51959-6019731: 50,000
SE, SW, NW, NE.
79 B/1679 BIl6 '1968-6919721: 50,000
NE, NW. SEe SW 79 C/OI79 C/O11967-6819711: 50,000
SE, SW, NW, NE 79 C/0279 C/021968-6919731: 50,000
SE, SW, NW. NE 79C/0579 C/051968-6919721: 50,000
SE, SW, NW, NE 79 C/0679 C/061968-6919721: 50,000
SEe SW, NE. NW 79 C/0979 C/091968-6919721: 50,000
SE, SW, NE, NW 79 ClIO79 ClIO196819721: 50,000
SE, SW, NW, NE 79 C/1379 C/13196819731: 50,000
SE, SW, NE, NW 79 C/l479 C/14196819731: 50,000
SEe SW, NW, NE 79 F/0379 F1031980-8119851: 50,000
SW 79 F/0479 F/041968-6919741: ~O,OOO
NW. SW 79 G/OI
.,79 GIO1 196819731: 50,000
NW, SW 79 G/0279 G/02--1: 50,000
NW.SW
52
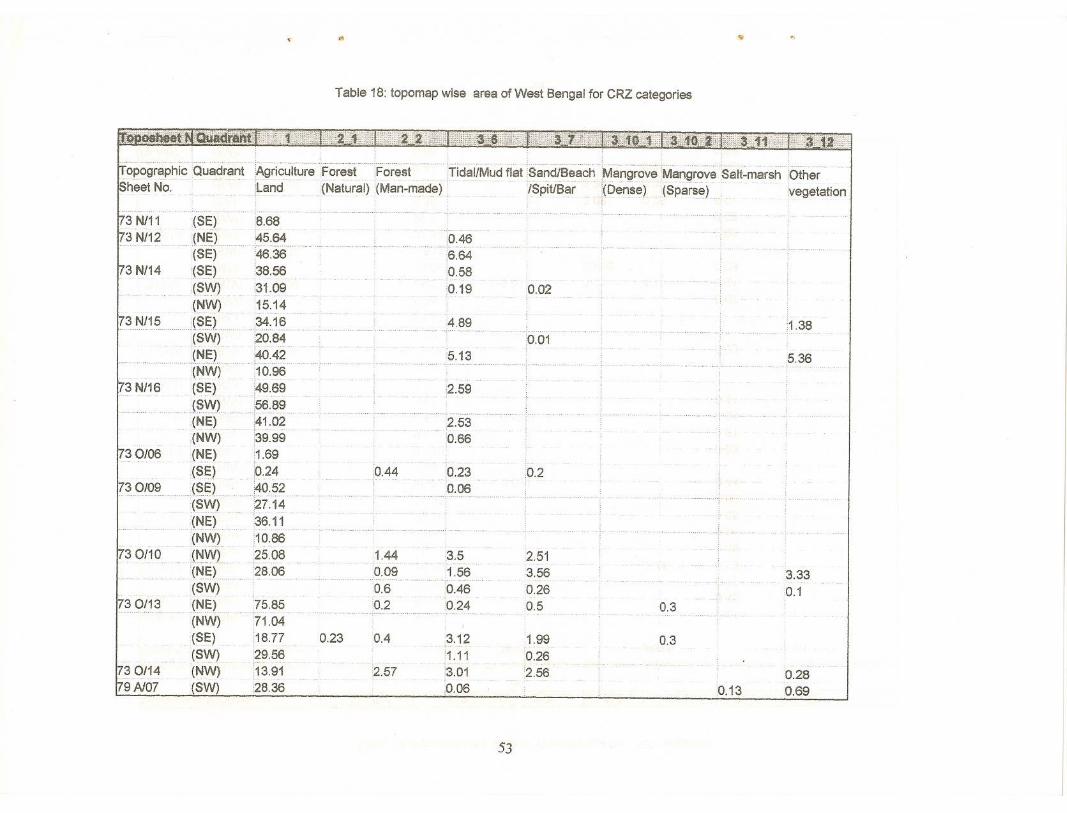
" .~
Table 18: topomap wise area of West Bengal for CRZ categories
5.13
4.89
0.230.06
0.466.640.58
0.19
0.44
;;3gT'tbdtJ:
1.443.50.09
1.560.6
0.460.2
0.24
0.23
0.43.121.99 0.3'1.11
0.262.57
3.012.56 0.28,0.06
0.130.69
;Agriculture'F~re~£ .Forest ;Tidal/Mud flat 'Sand/Seach ,Man~~<?vePJI£mwc)VeSalt-marshOther:Land(Natural)(Man-made) , jSpitJBar(Dens~) (Sparse) vegetation
;Quadr,4inti'
..' , -- , , .
(~~)8.68Jr-,J~L ... ~~:E)~H
(SE) '46.36
(SE) ". i38.!;E3
(SW) 31.09
(f'.I\fII) 15. 14
73 N115 ",(~~>',3<!:1E)(SW) ,20.84
'dd(f'.I~), , .'r40.42
J",\I\j) ,10.96
:73N116 (SE):49.69d .J~\t\I) d"'d~E):~~U
(NE) .41.02(NW) 39.99
(",E) 1.69(S~) , 0.24
J~~)d ,,' ,~.52(~W) ,27.14(f'.I~)d ",~~.11(N\fII) :10.86(f'.I\fIIL 25.08
"(,,,~L 28.06(SW)
'", (fII~L 75.85(NW) 71.04(SE) :18.77
(SW)?9.56:730114 (NW) :13.91'79Al07 !SW) 28.36
53
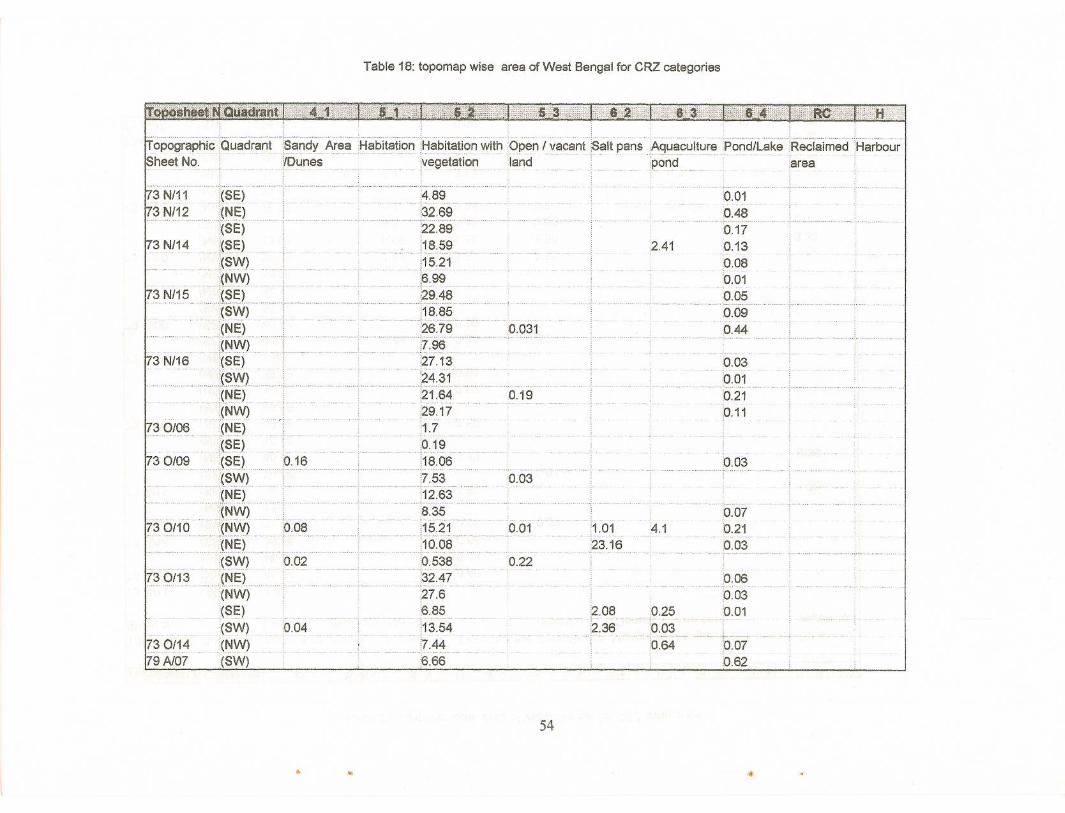
Table 18: topomap wise area of West Bengal for CRZ categories
0.070.210.03
0.48
0.17
0.130.080.01
.0.070.62
0.06
····.0.030.01
2.41
2.080.25- .
2.36 0.030.64
.4:89 ....:32.6922.8918.59
. '15~21'6.9929.48
.. ~.'. - •........... - .'18.85
26.79 0.031. ." .".- .......•... - •..~_.._-_ .._., .7.9627.13
~~:~~ ...21.64 0.19.29.171.7
0.19'18.06
7.5312.63
8.3515.21
,10.08
0.538 0.22'32.47
27.66.85
'13.54
7.446.66
···i~~':1dyp.r.e.~ 8~bit~tion ·8~~it~ti()':1with (:>pen/ vacant. ,Salt pans .AguaculturetDunes . ;vegetation 'Iand . pond
(~E:).( f-JE: L(SE)
(Se)(S\iV)
........ (f-J\iV)
.. X~E:L
(SW).... (f-JI:) ....
•(f>4\!V)
. (SI:). . {~.\iVL ..
..(~E)
. (N\iV)
(NE)
(~e)(~E:LO.16
(S'.N) .
"<~E:) .
(f-J\;v)
173 0/10 (r;J\;V).,0.08.(~E:)..' .
(SW) '0.02
173 0/13 ..... (N~).(NW)(S(:) ...(SW) '0.04
i73 0/14 (NW)!igAt07 (SW)
54
~ " ,d

~ N ••
Table 18: topomap wise area of West Bengal for CRZ categories
13.5879.27
••••.• , •• u •••.•••••••••
:76.0660.28
.46.5922.14
0.34 70.2939.8178.16
;18.92
;79.4481.21
0.6566.2369.93
3.39
1.30
·58.81
34.6948.7419.28
53.14
.69.862.1
109.6
98.7
34.0
46.89• .0 •
30.48
36.52
iCanals -Brick KlinTOTAL- ""u'
73 0/1479 Al07
(S~)...., .(f-J~)
(SE)
{~I:L(~Vj)
.,(NYV)
(~I:)(SV,,)
(f-JI:)
.. (,.,\iV)
(SEt,...,(~\N)
(,.,E)
(NW)(NE)
(Sf:).. (~,I:L
(S\iV)
..p(~I:L..(NW)
173 0/10 (f-J\fIJ)
.(~I:L(SW)
(,.,q ,.(NW) 0.01(SE)
. (~\N)(NW)(SW)
i73 N/16
55
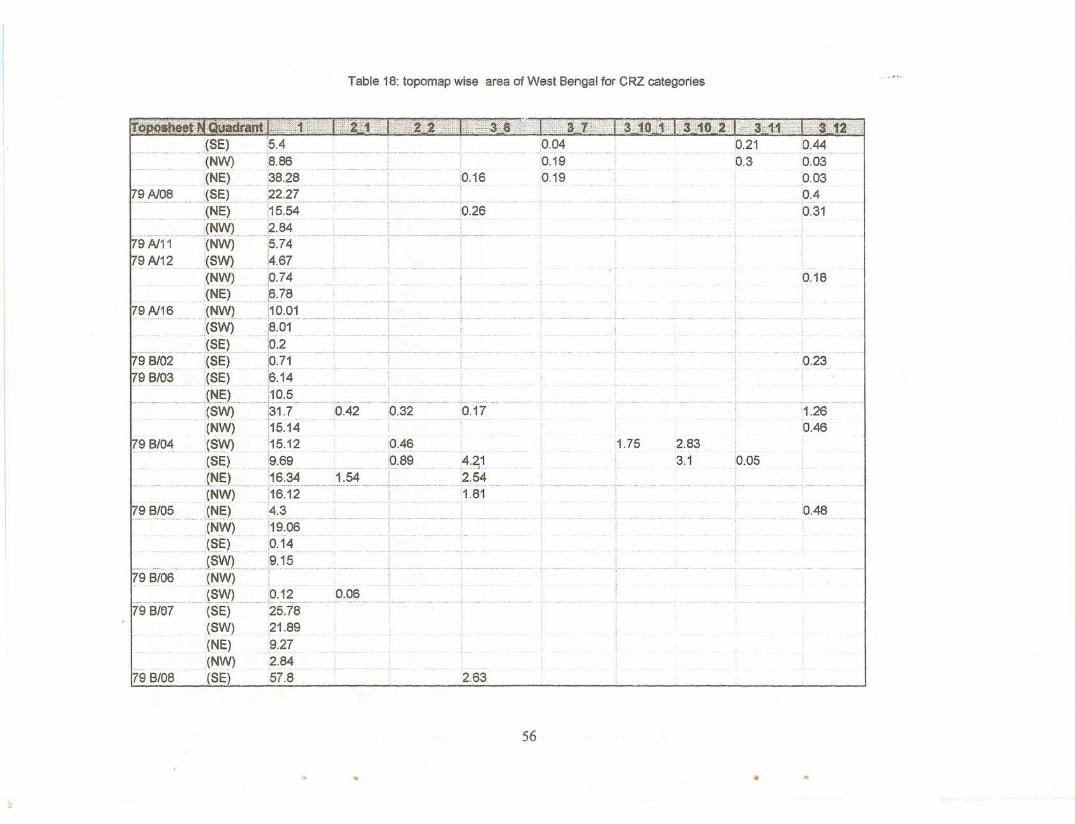
Table 18: topomap wise area of West Bengal for CRZ categories
0.18
.. - _, .
1.260.46
0.23
0.48
.q:2~ 0.440.3 0.03
0.03
p.~.....0.31
2.83
3.10.05
0.04
0.190.19
__ no ••
2.63
0.17
,4:~12.54,;1.81
i!0.16
.... 'I'
0.32
;0.46'0:89
......... .,. ' , .0.26
0.06:9:1?,25.7821.899.27.....2.8457.8
...
79 B/08
~Mi6i~~:Quidranti1....J~.~t p.~
(NW) :8.86
.(~¢) (3?28(SE) ;22.27
.......... ·.·:~~~):...•••.·.:.';~8~4··.9 A111(NW) :5.74
9 A112 ..(SW)l4.67(N~) lO. 74(~r=) i?]8
.. 'J~Y.Y) !1p.Q1 .
,(S'!J) ..:8.01
.................... _(~.~) :9.29 B/02(5(:) [0]19 B/03 (~(:) '6.14
{~E:L !~g:s. _. (~\i\f)l~1. 7,0.42(NW) ;15.14(§'{'J):15.12.
(§.E:L '9.69...... Jr-JE:) JE3:?4 .
. (toJlN) j1.6.12(~E:t..._.~.~..
..(~\i\f) :1~:06J8.E:) .. 0..~4
..{~YYL .9.15
(~IN)..(~VIJ)
(SE)
(SW)
(NE)
(NW)(SE)
1t'9 B/06
179 B/07
1t'9 B/05
56
. '.
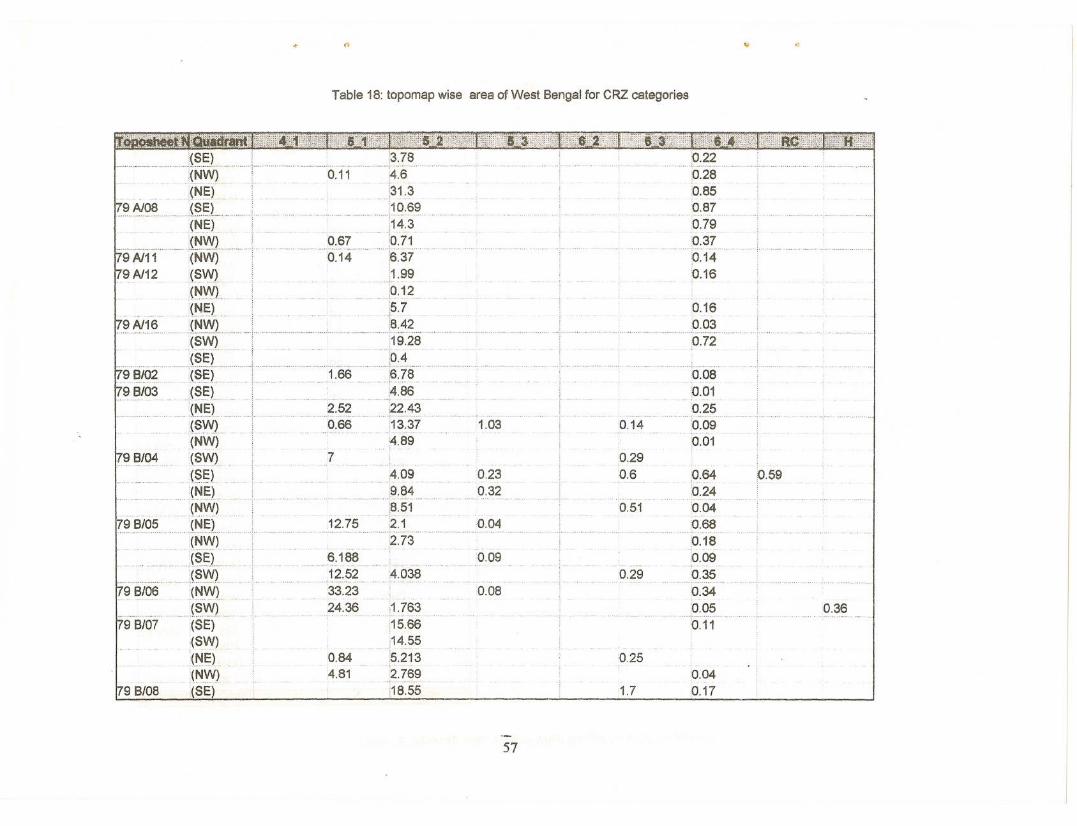
... '"
Table 18: topomap wise area of West Bengal for CRZ categories
0.36
.0.59
..........P.:?2p.280.85'0.87
0.790.37
"0:140.16
0.16
0.03•· •• d ••••••••••••••••
0.72
0.040.17
0.08
0.010.250.09
,0.01
0.640.240.040.68
0.180.09
0.35.... - _ .
0.34
.........p.q~..0.11
1.7
0.14
0.290.6
0.25
0.29
0.51
0.09
0.08
0.23
0.32
0.04
1.03
:1.763.......... - .
:15.66.14.55~5.2132.769
i18.55
,4.09
...... ~:~4,~.512.12.73
0.84:4.81
6.188.12.52 4.038.' ~ _ - , ..- , -.-..33.23
24.36
9 B/04
9 B/02
9 8/03
179 B/05
"'Tar.(SE) ! :3.78
........-.- .. - ':(~~)"'-r o:1'1"F:s"..... (~.~L .. ;31.3
179AJ08(SE) .. ; ;10.69
'(~.$)".'····.T ..~•...... nh ••••• ·······~·.··.;14:3...... I~\tY.t : h •• g.:~! .io.:?~ .
9 AJ11 (NW): 0.14 :6.37! )
9AJ12 (§Y'/J :.';:1.99(":I\tY.) ,0.12
(~~).... }:79 AJ16 .J~\tY.L !.....•••.••.......•.... ~:~?
J~'/IJ) . : ..;19.28
......1~§1 : __ _.:o.:~ .(~~L! 1.66 })]8.(~.§).•.............. ;4.86(f'J~) .._ L ?52 22.43(~\iV) :.0.:66 .. 3:37(NW) , '4.89'. ".-." .. ~. -.
(~\iV) 7(§§)
....Jf'J~t..... ( ":I\iV)
Jf':J.!:.L 1.2..!?.
(~'/IJ)
.)~~.L....... ,(§'!Y). '" ..
(NW)
.... . J§Y'!L ...(SE)
(f?\fI!)(N~)( tIj'{v')
(SE)
57
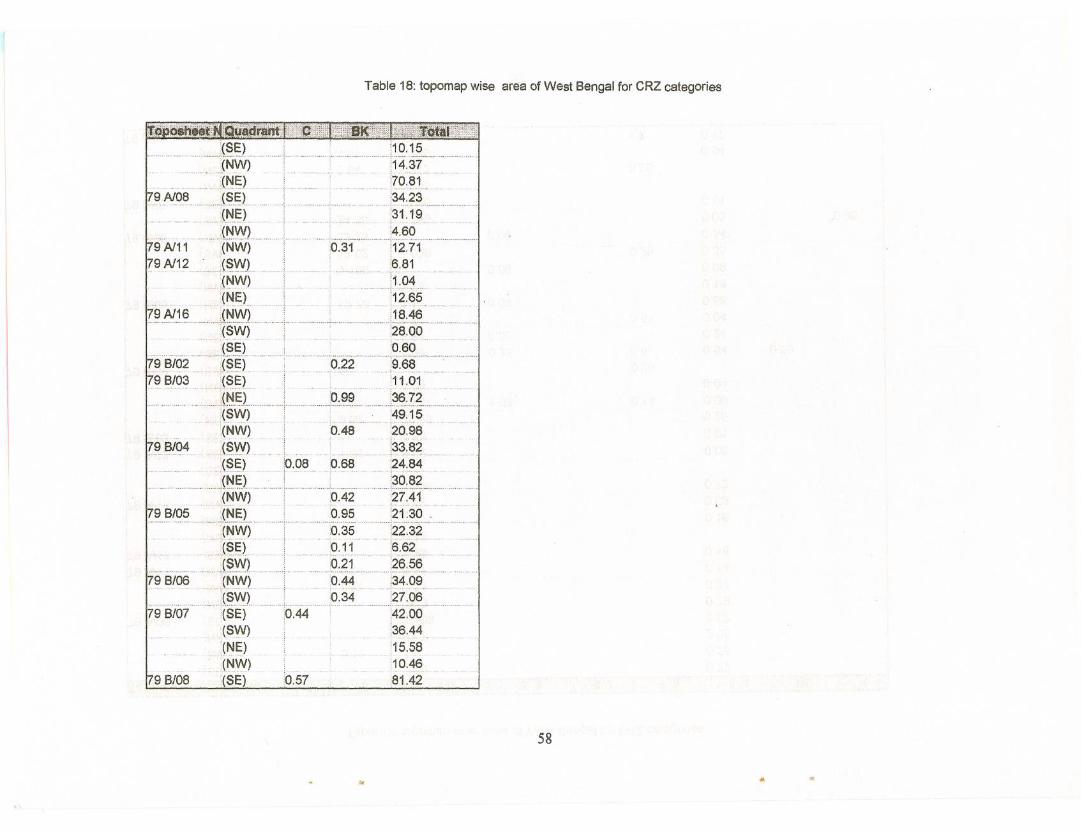
Table 18: topomap wise area of West Bengal for CRZ categories
.79 B/04
:79 B/08
!topO$h.et'·B;Qijlidr;l~;IT~\i}i;~I@j;~sK!IT@m;~oUtU;bi~!:"·~I:.......I~~J L ' i.......•......... ~1.P..!?..__ .
(NW); i14.~! .J~E:) , :~0.81
9 Al08 J~.E:L i : ~4.?~ .. (!'J~) ~ '31.19
...... "~.YY.t i ~:~q .79 Al11 '(NW) iO.31 '12.71
79 Al12 ...J~YYL j d ••••• _~:?1...J~YY). ! J1:9~
... .(~E:>. i. ;1.~:~~_....§~~§ .:JNW) L ; J!..~:~ .
(~Y") ·~~:o.O(SE) i '0.60
98/02 ($.§j ,· ·0.22" ,9:68··79 B/03 :(SE)! 111.01
",N$) L 9.:99 ?~J?(SW)' :49.15
,' .• "•.... , ; ....• 1. .•.•••.•.•.. _.
(NW) :0.48 20.98
(~VJ..) ! ••.• :33.82..(~E:) 10.08 0.68 .24:~~
...............J~E:) i -i .....•........... :~Q:~~...(~\,I\I) . 9.42 ~?:.~1 ..
9 B/05 J~~L L 9.:.~5 " :?!:.~9..; .
:.~~~); ·:~:i1~·'~.~~~.'1~.~L .•....... g ..?! ?~:?t3
179B/06(~yvL ~ g.44·~~.09.............:(f~.vy) L 0.34 ~.!.:9.t3 .
i79 B/07 (SE) 0.44 :42.00(SW) 36.44
.(~~) ....;15.58(~\,I\I) .' ... :10.46(SE) 0.57 81.42
58
.•
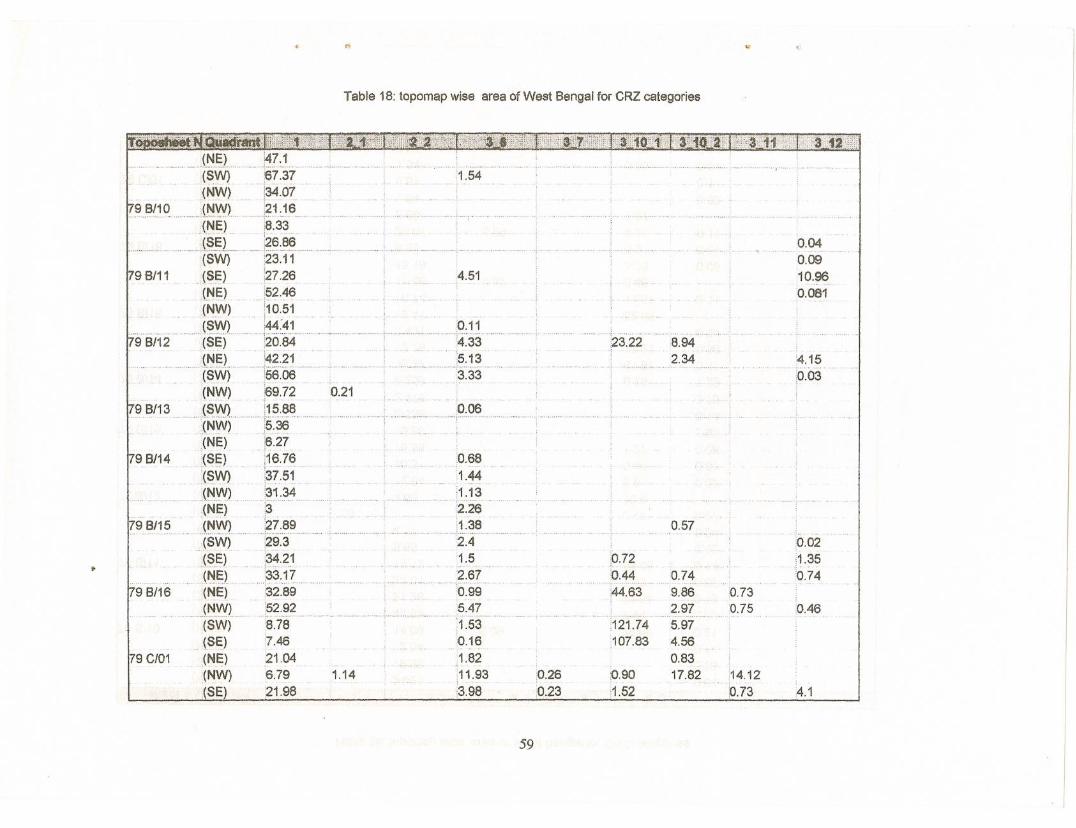
c>
Table 18: topomap wise area of West Bengal for CRZ categories
0.46
0.040.09
10.960.081
4.1
'4.15
:0.03
0.02
1.350.74
0.73
0.75
:14.12
:0.73
8.94
2.34
0.57
0.749.86
2.975.974.560.8317.82:0.90
:1.52
. H121·.74
107.83
.0.720.44..............................
44.63
0.26
0.23
4.51
.0.06
:1.54
'0.68
1.44
;1,~1_~:2.26
H ••• )1.:~8.2.41.5
2.67'0.995.47
'1.53 .0.161.82
11.93
'3.98
}):11'4.33
"""):!~'H3.33
1.14
0.21
QU~I_...J~~L..HHj~?:'!'H.
(~\fIJ) .. f3T:3! ,.(NY\') l~~07_
9 B/1.9. H._(~'{\I) 'H" c.2.1J.6 H.
(/'.IE) .. :8.33,.., ... _,... j~.~L'HH H':?§~~§'''H
(SW) '23.11
(~~) '27.26,(~£:)52.46(~~) i1,O.51
(SW) 44:41
'JSE) ..., H'. H:?C):S4'
H'H'H' '(f'.J~L 'H.}~?:,?1.HH
.. (~W) j5§.96(NW) p9.72
H.. (~v.yt h?·,~s..H' , .. H" . ' '' __ .. ''
,.(N\N).;s.:3§(NE) . '6.27
(~~) :16.76
(SW) '37.51_HJ""Y'{)H .. ~1.34
(NE) :3
,.Jf'.JYVL ..... H~!:~~H'H
,(SW) 2~}J~E) . :~ ..2..1
(~£:LH~?J7(NE) 32.89
..... H.(r-JYY)'H.'" H:??:'~.2.(SW) 8,78
.. (SE) f46Jf\I,l:) .~1.04(NW) ,6.79(SE) 21.98
i79 6/11
p
59
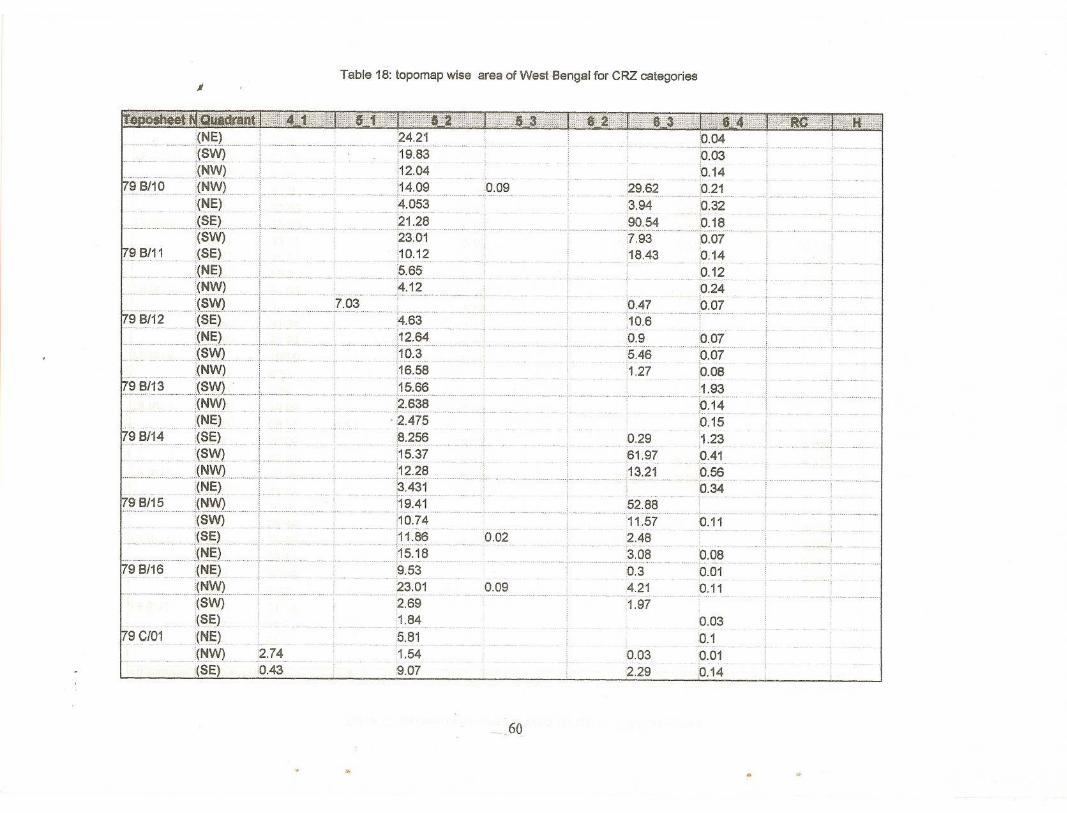
,; Table 18: topomap wise area of West Bengal for CRZ categories
0.11
0.030.1.0.01
,0.14
..... P:~?..;0.07.0.08
1.93
p.14.0.15
'1.23
.0.41
0.56.0.34
•.•. ' •• _vn··.'·····
0.08.0.01
.0.11
J):g~..p.03.0.14
......._JJ.:~1 ...0.32
0.18····..:0:07..
;<).140.12
;.0.24
"0.07
0.03
2.29
0.29
.61.9713.21
.0.4710.6
0.95.46
1.27
52.88
. '''11:57 .2.48
3.08.0.3
4.21
1.97
....29.62,3.9490.54
· ..••. ·.-· ••• · ••,.••• ·.0 .•..•.
7.93
18.43
0.09
0.09
0.02
"" .0·.· ..., .•...,..••..." .•
:4.63
•••••• , •••• 0 .,1 ..2'154;10.316.58
.0 •••• ' •• , •• 1,15:6.?
2.638
. 2.4758.256
15.3712.28
"""'3.431".. ;.....
,19.41 ...:10.7411.86
:15.18 o'
9.5323.01
2.691.84
5.81
, ...;1.549.07
24.2119.83
;12.04:14.09
A.053
21.28''' ..• ·.M.•.••••.•. h'"u .. _
23.0110.12
5.654.12......... - .. ,.•..., , ,." ".._"""'''''''' , " ....•..•....•... , ..
7.03
......
'2:.!40.43
,60
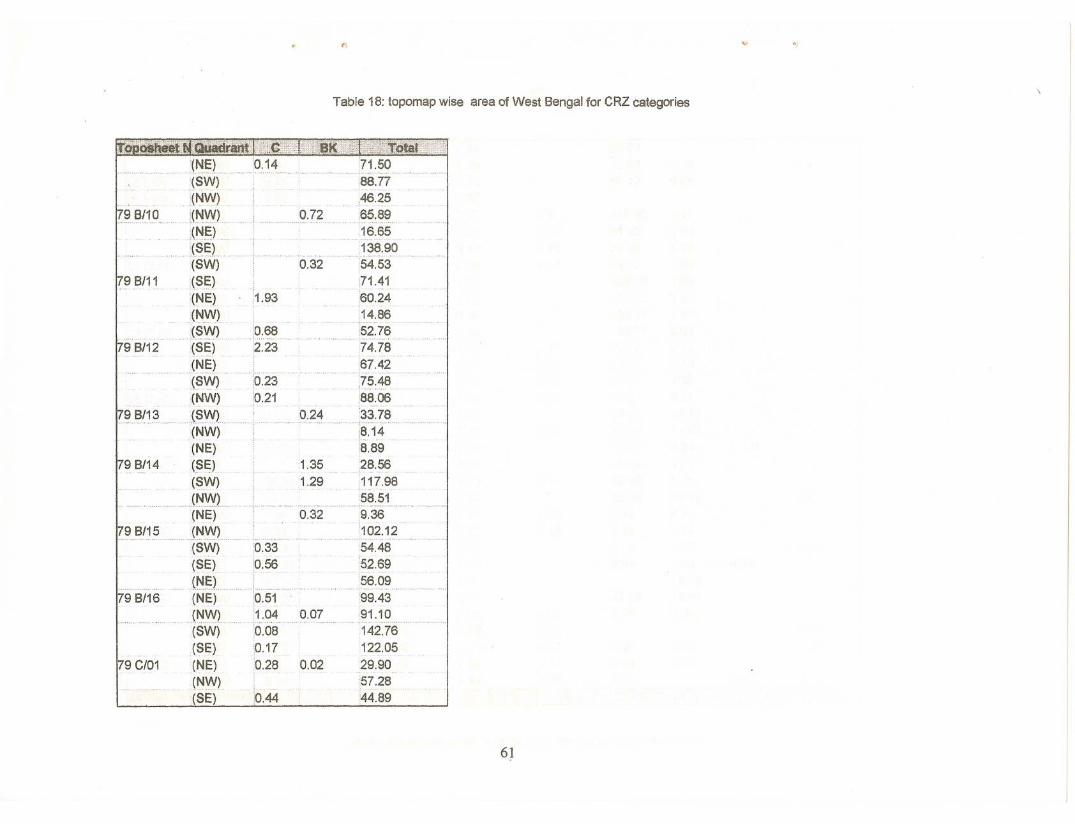
rc-)
Table 18: topomap wise area of West Bengal for CRZ categories
0.02
0.07
0.72
0.32
0.24
0.32
.[hg:18K;"'1;~1:f;f~F:-"t0t8f~.':Y.:;.50
88.77
,46.2565.8916.65
138.9054.53
]1.4160.24
14.86
52.76..... - ~ .
74.78
67.42............ - ... - .......•...........
7!5,4888.06
33.78
.~.14'8.89
28.56
117.9858.519.36102.12.' - _ ..
54.48
'52.69
56.0999.4391.10142.76
122.05
29.9057.28'44.89
1.35
1.29
'0.44
1.93
CO-'ibit1ftt;~:QUaar.anfJ
Jr-l§) 0.14(SW)
:(N~)..... jf\J~L ... < .
,(~~) .
(~~L.(SW)
(S~)([\IE)
.([\IW)
'd.J~Y.\') .:o.:6.~(SE) 2.23(~~)d' _d,d'd(SW) :0.23
,I[\IW) 0.21.........(~".\'L.d
I~W)(NE)
(~E) .(~yv)
• d" J~'!YL(N~)
.............. j~YV) ....(SW) 0.33(SE) .O.?6(NE) :
(N'~)'" ·'b.s(JI'-J.Y.V) .... :1.q.~(SW) 0.08
(SE) 0.17([\IE).0.28(NW)(SE)
179 8/16
179 C/01
61
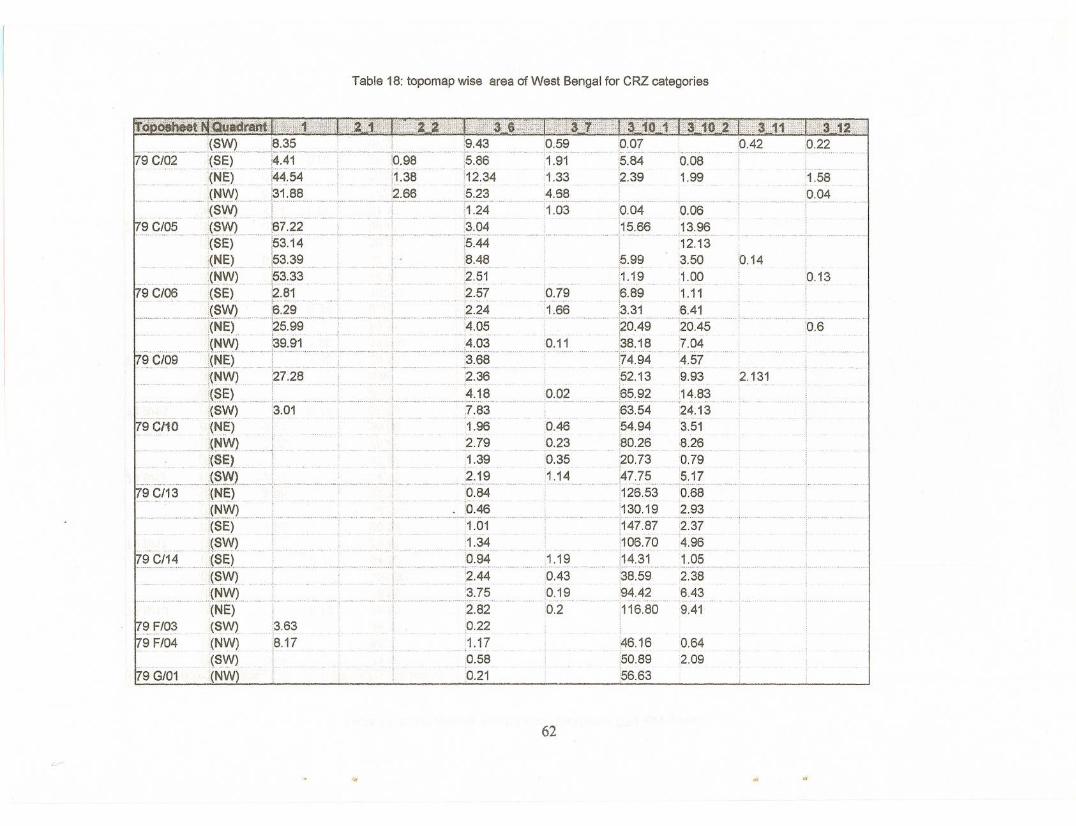
Table 18: topomap wise area of West Bengal for CRZ categories
0.13
)'::::3212(';'.0.22
1.58
O.OL1P
'2.131
0.14
46.16 0.64
,50:89 2.0956.63
I•'·3.1·..0'-'·;·1..=r S..·'·c-.....--1..·0..=2·'..sq...... '- . "," ' -- ,.. ,.-.
,- ...•• ' • .'~ ",.,. •..•.•... ;' •.•• "'>••••••. -- . .oj •. _'.>': ._' .... " •...•••.. ".' ... ,- ,.,. - " , ." , ' .
, ..••••••••. __ •. _ •.••.•. ,,_ ••.• 'C' ••
. pg.9T '.... P .. '-P .0.42,5.84 0.08'2.39 '1.99
0.11
0,46
g.2~.0.35
1.14
:o:!~'1.66
,9·~9.
1.911.33
.~.?~ ..1.03
( •..••.••••. d •••••• _
.0.04 0.06
;15.66 .13.96' , ······12.13
,5.99 3.501.19 1.00;, .. - ... ',-_.
~.89 '1.11~.31'., .... 6:~1 .....20.49 20.4538.18 7.04
:74.94 "'4.5752.13 9.9365.9214.83
."i63~54 '·24'.1354.94 3.5180.26 8.2620.73 0.79
. AT:??,?:!?:12.6.5~ 0.68:130.1.~ 2.93.147.872:3..7:106.70 A.96
.n.4:~1 1:9.5
38.59 2.3~.94,42 6,43
,116.80 9.41
... 1.190.430.190.2
3'.0'1·""- ..
i~·63.;8.17
.. > •.•
..'- .•............. !~:~3.:0.98 ~5.86
• " .. "'''.'.' _ •.••••.•.•••• , '•••••.•••.;,._•••, ••m. ,_•••••. _ ~
.i1:38 .112.34'2.665.23
...... - [1:24'67.22 '3.04.--: -'" - r n_;..n n .,53.14 . ;5.44.1??39 L' ;?:48..i?~:33 ;2.51:2.81 12.57i""" .. ; ."
:6.29 1 2.24........! __ ~._..,.." , _ _ _.~_nh •••••
:25.99 ;4.05:39.91 4.03
. .t ........•.••..• ' •.•..• ,,' •.......• ,•...•••..•••••...
. ~~-' ..' -- -,
2.36
~.1 8. n'P·g?
,7.83.1.962.791.39'2.190.84
'.. , 10.46
;1.01
.1.1 :~1..'0.94
- """~-'-+"" .•-•.•..•
2.44
..~J52.82
,0.221.170.58.0.21
62
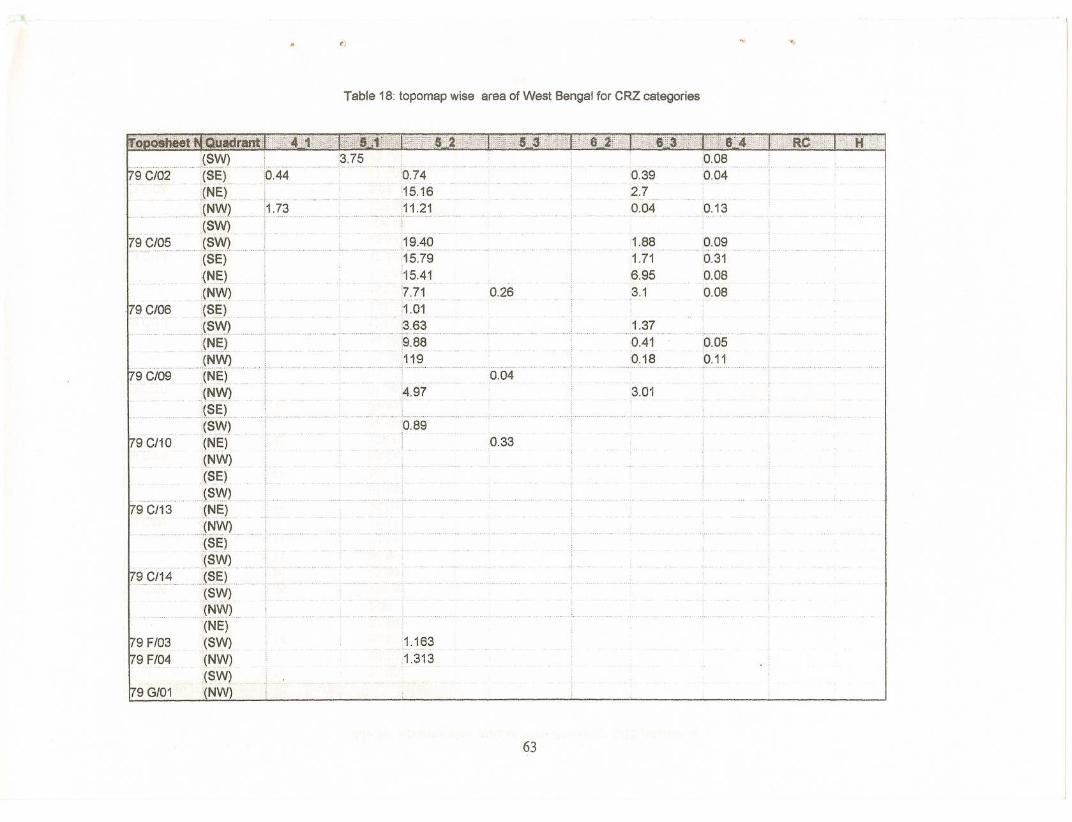
() "
Table 18: topomap wise area of West Bengal for CRZ categories
0.050.11
h.p·090.31
0.08
0.08
.h' hP,980.04
0.13..................
3.01
0.39
2.7
0.04
1.370.41
0.18
'1.881.71
6.953.1
0.04
0.33
0.26
0,89
1.163
1.313
4,97
-"_.
0.74
15.16
'11.21
h!1.9:~9 ....15.79
;15.41'7.71
,1.01
3.639.88
19
~g:~!'S21:i:flP:;i3,75 .'"
.i
:Qiiadrarit;
...J~'!Y) h •••• h
h'(S~)... '0.44
(NE)(f\J~L ..nj1.?'~'hh
.(SW)
h.. (~,{\,thh .
(SE)
{NE.)(~~) ."
.(SE.)
.J~YY.)h" h"
;(~~)(~yy)(NEt ...(~\IY)
'hI5.E.L .
(5."Y)
(NE.)(N.W)
(SE)
.. h.O(5."Y)hh
JNE)
J J:'I\t\I)
.(~E:).. ( ~IJ\{)
..h.O<5.E.L
(SW)
.... hh"'~\t\IL
(NE)
(SW)(NW)
(SW)(NW)
i79 C/05
179 F/039 F/04
63
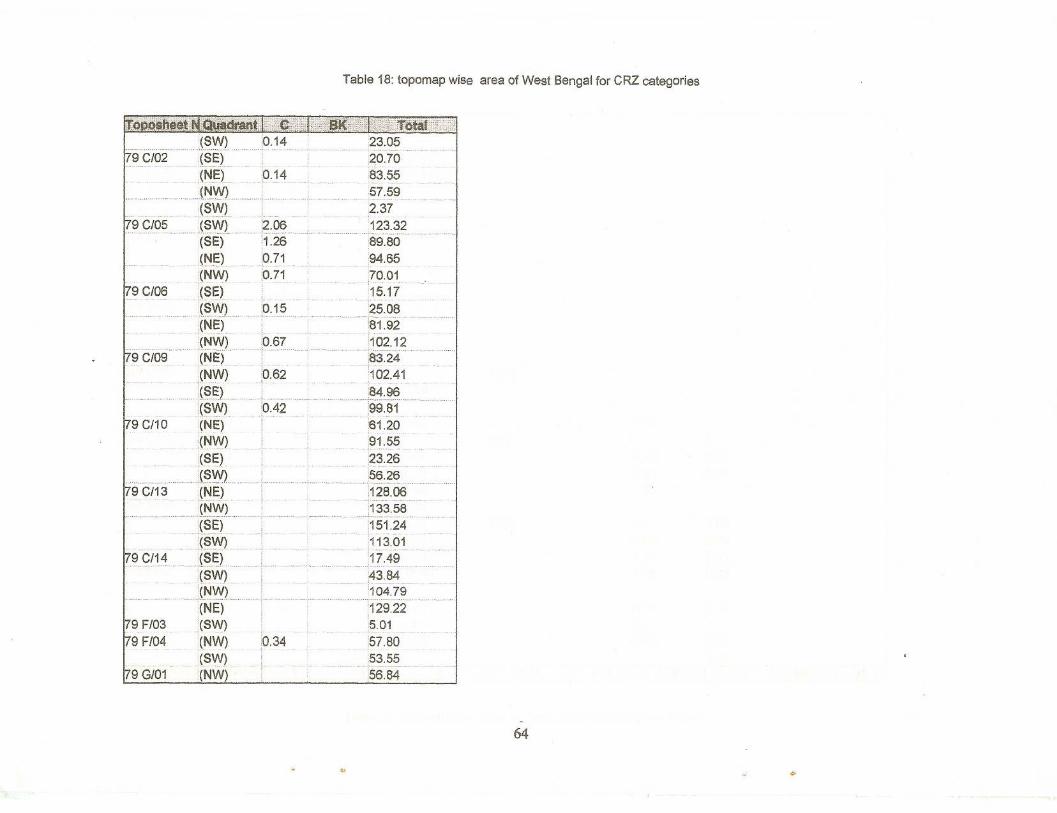
Table 18: topomap wise area of West Bengal for CRZ categories
2~.0520.7083.5557.59
2.37
123.32
89.8094.65
.. 70.0115.17
25.08
....... ··'81:92·· ..'102.1283.24
102.41
84.96
.99.8161.2091.55
23.26
56.26
128.06133.58
:151.24'113.01
:17.49
fl3.84:104.79129.22
,5.0157.8053.55'56.84
[Iuadrant::
{~.\:YL.. .0.14(?~) .(Nt:) 0.14
..Jf':I\lYL ...
... (?\(II)(~'I.'!).... :?9.?(SE) 1.26(1'.It:) .. p.71(~'N) ;0.71
179Cf06(S~) .
(~'I.'!) ... .0.15
(N!=.)
(1\1,,:\,)0.679 Cf09(~f:)
.<tII\oV) .0.62.. (~~L .
(?\oV) '0.429 Cf10 (NE)
(NVV)
(~~)...... {§\IY}
79 Cf13 (tilE) .... (I\IY'J)
(S§)
(~.'N)
... (~f:L(~'I.'!)..
..... Jf':I\lYL
(NE)
. (S'v'/) ..
(tIIVV) '0.34(SW)(NW)
64
" ,-

()
Table 18: topomap wise area of West Bengal for CRZ categories
'fI,
. 'oDosheet N Quadralill 1 J~-2~1 r~2--?_-=r-··-£.6 -=r-=--il~=2.-'ThJ! 3:;i"O)T~L:tCI-i_1i~l(SW) 0.15 0.08 28.58 0.05
'79 G/02 (NW) 3.22 1.48 8741 1 69
_______ (§'!iL . ... ._._. .__ O. q~_. ._.__L?7 T:..-._._...9J.~ ._~~~! . . )
65
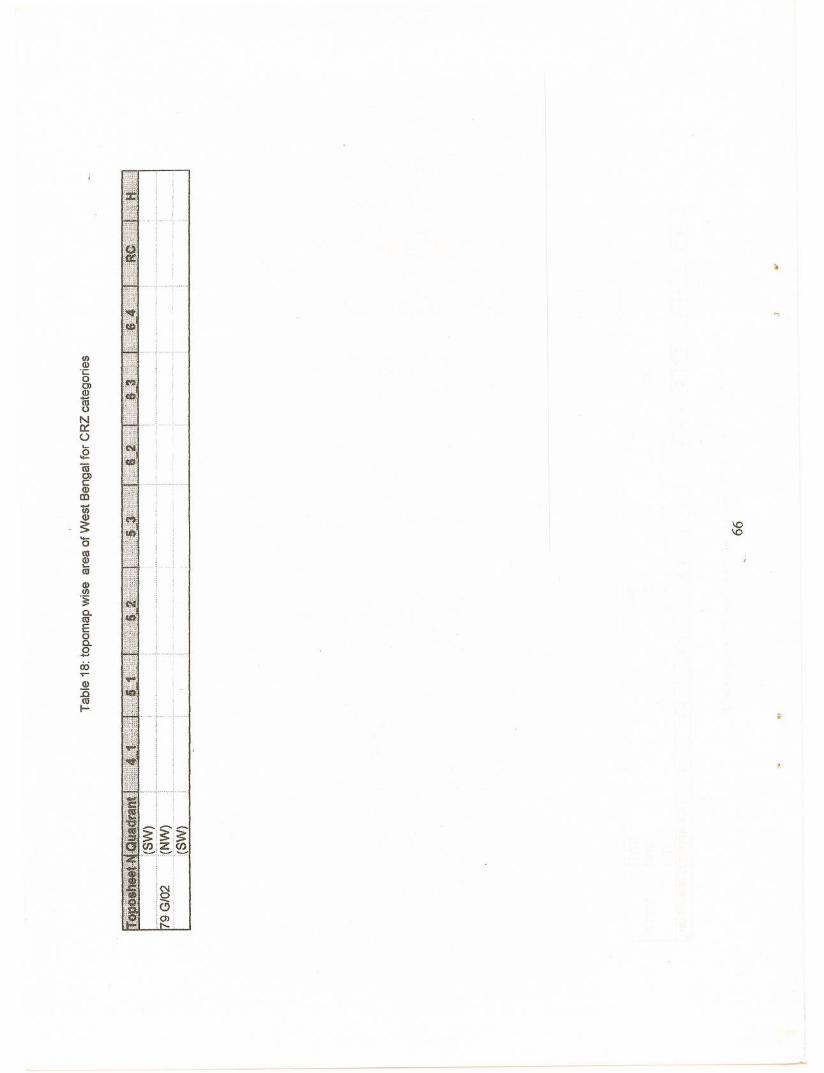
UJQ)";::0OJQ)1ii0N0::<.)'-.groOJcQ)CD.•..•UJ
~ 17r~ I\0
"-
'1&\0
0 roQ)•....roQ)
UJ"~a.roE0a..9O::i
..-Q)::aroI-
..
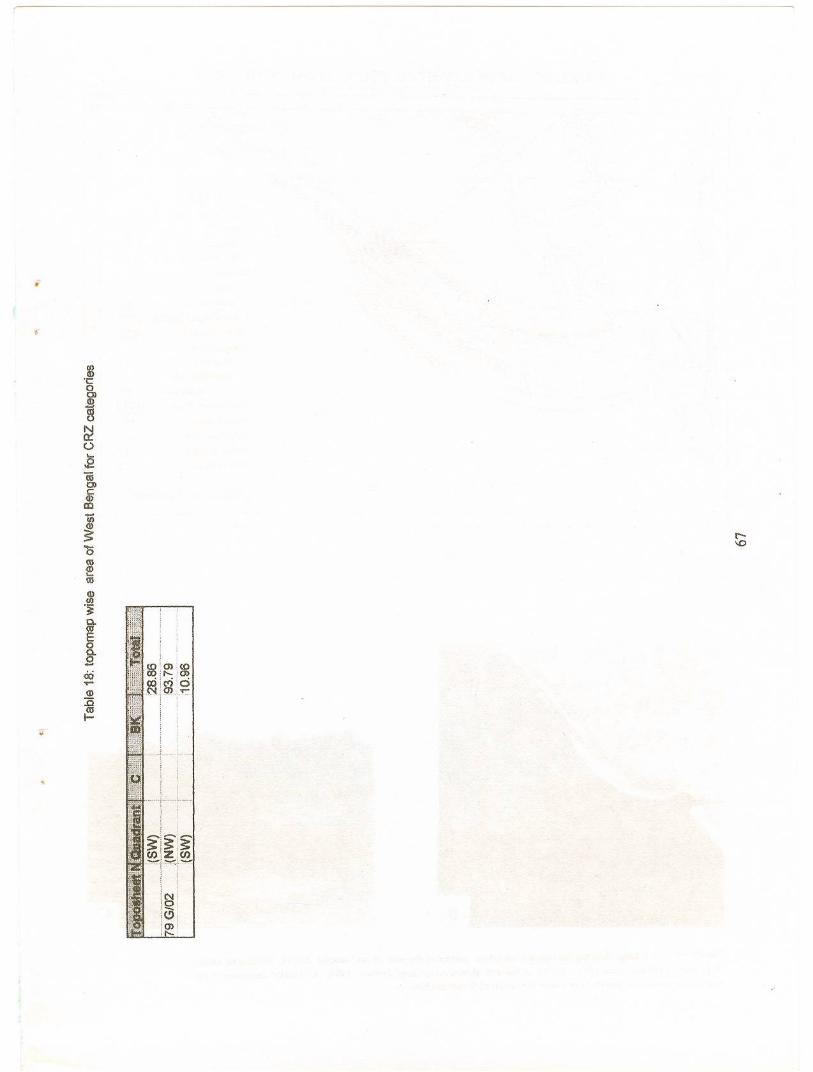
en(I)';::0Q)(I)
~Na:::(.)....g"iiQ)~OJ(j)~
t-- 0\.D
<U
(!)...<U
(I)<IJ'~c..<UE0g.-
I~:cn,<oQ;i
.•..;.; . t-- ,(])- '~jW ~J~Jg(!) :a<UI-~
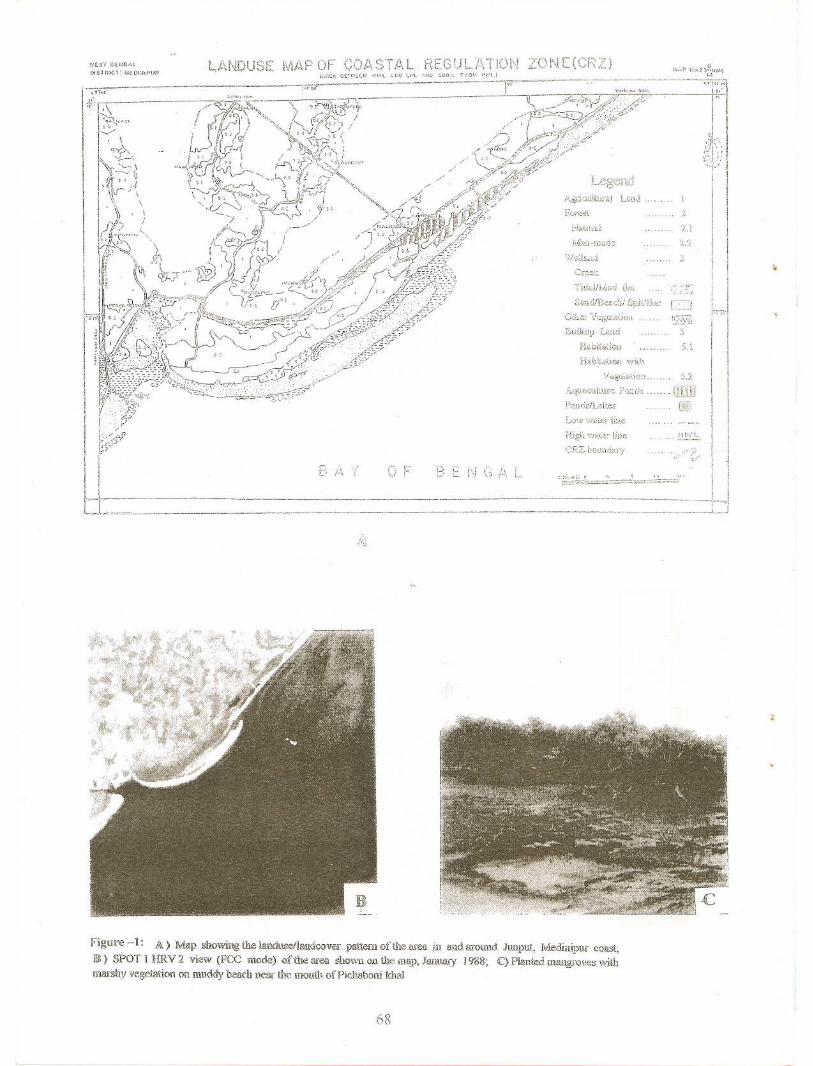
figure -1: A) Map showing the !alldn..~!1andcov;;;r pat~m of the ate;!. in an.a arollilG. JU\l.pU.t, lIfledill.i.pur coast;jlli)i SPOT 1 HRV 2 view (FCC mode) ofthe area shown on t!l" \111']), Jalllwx}' J 988; q Planted manJgroves wi,limarshy vegetation on muddy b~a(:h nell, the mouth ofPichaboni khal
68
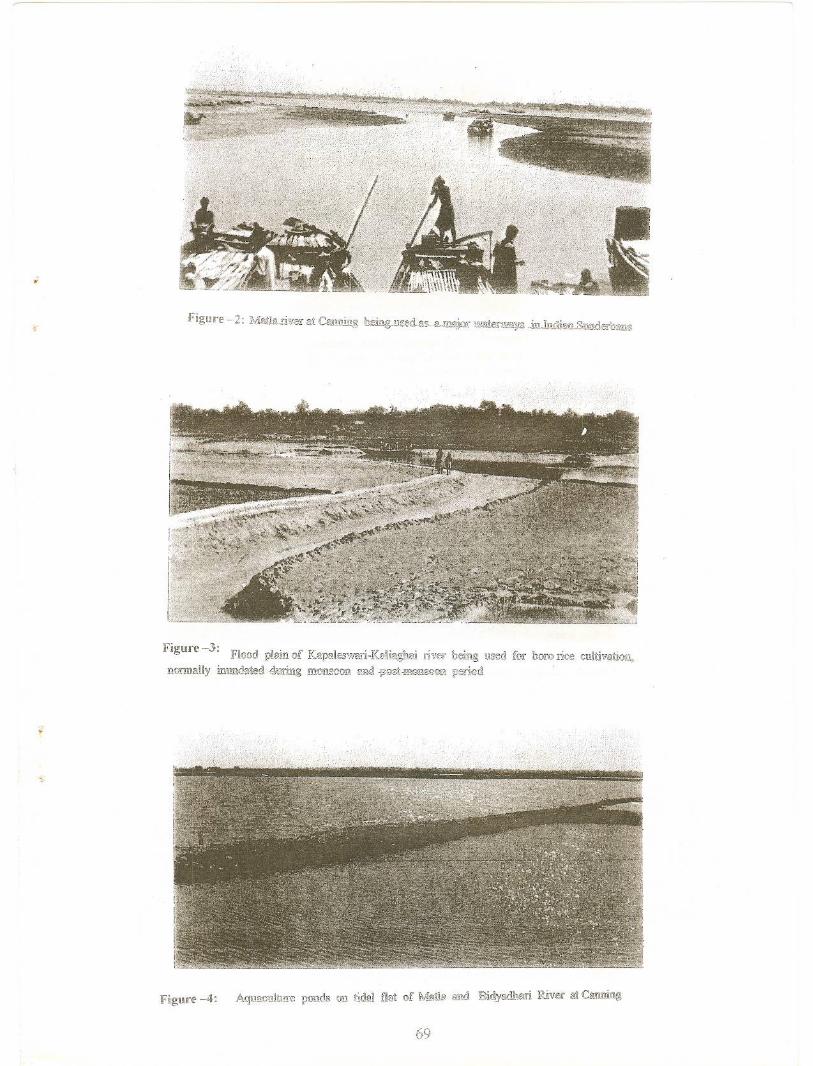
Fagur~~-3: FhJca plain of I(~1p9Jf;s'<~:vzfi1-I(01i2g118.i riviGE' heing u;}·::;G. foX' hOlo l'-ic~ GuJtivatioH.)
normally mund@t'6d· -gv-TI.ng r(~o:n3{'JGn ,~}1d{20sk-ill0ns.',q-,92
figure- -4:
69

Figure -5; I\llua flat uood for Brick i.nilt!.Sl:riea!
fields wiiliiD. tit? CRZ flB91' ihi&: c1.mfhl\"fu::e vI'
D!m.1C(Jar river with Hooghly
70
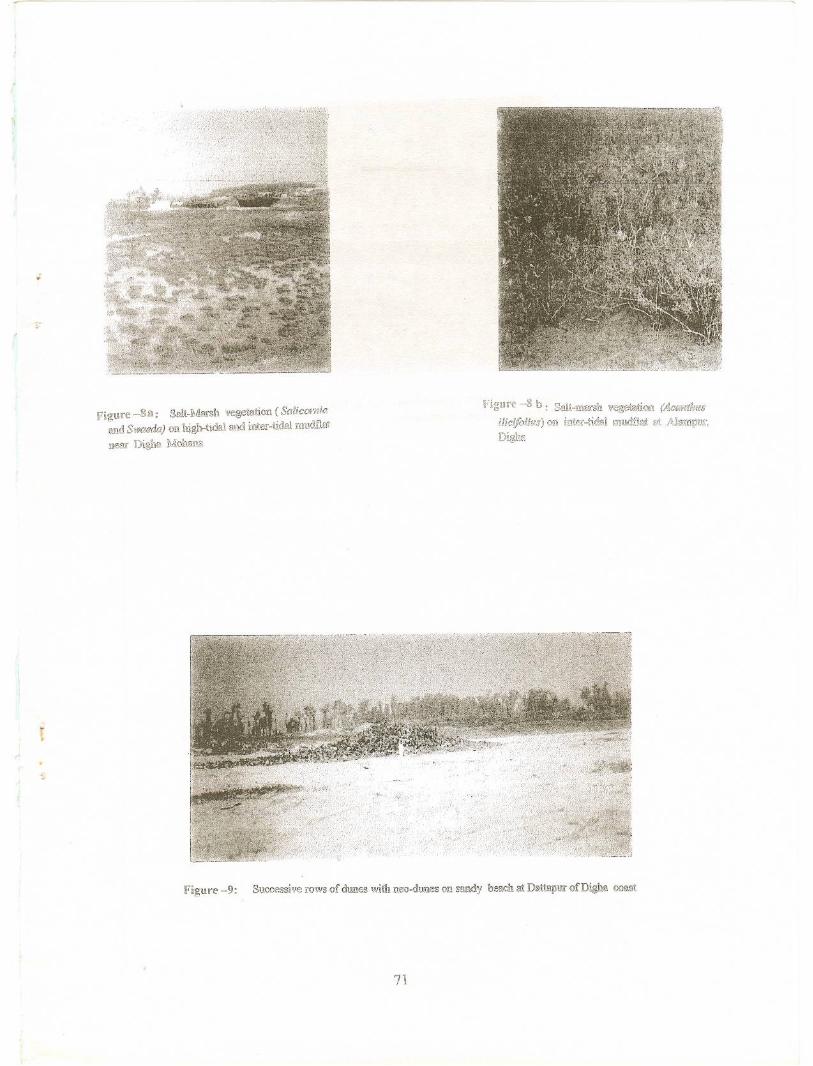
f~gnre -8 a: S2Jt-Ivlarsh vegeiation ( SaliC!W;1!O;
~11dS\vaerfa) on h.igh ...tidgl a~1dintrBr-tkl11i. f.0.ud11a1"
{l;::&'f r)igh~l Ivloh8n~~
Fig-;'~k"e -8 b: S.aH~T!::lar~h ve:!'!;f:w.,tk,c.'. (.4C0i·~;z?faf§
m"t,i,ryii,.'.:;: <}on i:nte:g"~~id:2J.~nIlh~1:~f.;;t
figure -9:
71
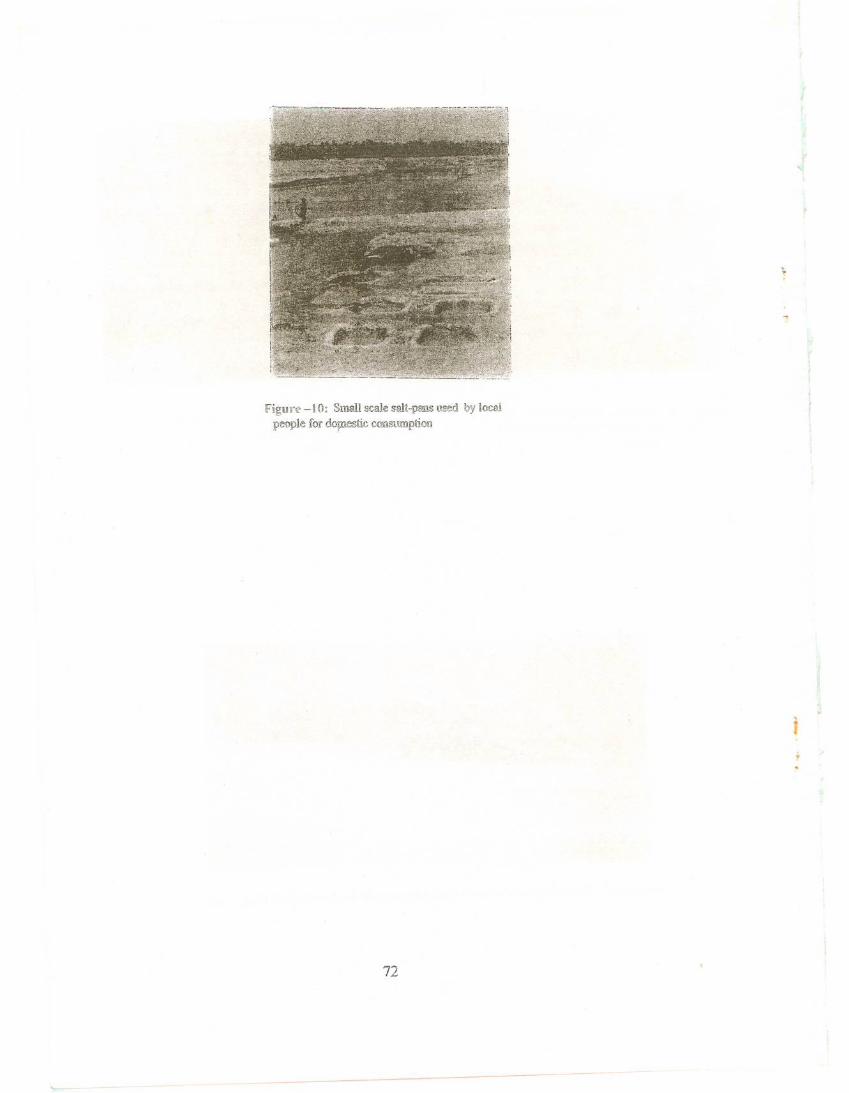
r.<'igure -10: Small scale ~wlt-pans w,~d by Io!::!)].
people for do;;nestie cffi'1sump\ion
72
;t
--------------------------------------~
Printed at
Library and Documentation DivisionSpace Applications Centre, ISRO
Ahmedabad-380 015, INDIA

")
,.,
I)A


