Embed Size (px)
Citation preview
Regional coseismic landslide hazard assessmentwithout historical landslide inventories:A new approachTheodosios Kritikos1, Tom R. Robinson1, and Tim R. H. Davies1
1Department of Geological Sciences, University of Canterbury, Christchurch, New Zealand
Abstract Currently, regional coseismic landslide hazard analyses require comprehensive historical landslideinventories as well as detailed geotechnical data. Consequently, such analyses have not been possible wherethese data are not available. A new approach is proposed herein to assess coseismic landslide hazard at regionalscale for specific earthquake scenarios in areas without historical landslide inventories. The proposed modelemploys fuzzy logic and geographic information systems to establish relationships between causative factorsand coseismic slope failures in regions with well-documented and substantially complete coseismic landslideinventories. These relationships are then utilized to estimate the relative probability of landslide occurrencein regions with neither historical landslide inventories nor detailed geotechnical data. Statistical analysesof inventories from the 1994 Northridge and 2008 Wenchuan earthquakes reveal that shaking intensity,topography, and distance from active faults and streams are the main controls on the spatial distribution ofcoseismic landslides. Average fuzzy memberships for each factor are developed and aggregated to model therelative coseismic landslide hazard for both earthquakes. The predictive capabilities of the models are assessedand show good-to-excellent model performance for both events. These memberships are then applied to the1999 Chi-Chi earthquake, using only a digital elevation model, active fault map, and isoseismal data, replicatingprediction of a future event in a region lacking historic inventories and/or geotechnical data. This similarlyresults in excellent model performance, demonstrating the model’s predictive potential and confirming it canbe meaningfully applied in regions where previous methods could not. For such regions, this method mayenable a greater ability to analyze coseismic landslide hazard from specific earthquake scenarios, allowing formitigation measures and emergency response plans to be better informed of earthquake-related hazards.
1. Introduction
Large earthquakes in mountainous environments result in a wide range of secondary hazards which cansignificantly increase the event impacts. Among themost notable of these effects are the various types of slopefailure that can result in long-term (multidecadal) geomorphic and socioeconomic impacts [Hewitt et al., 2008;Robinson and Davies, 2013]. Coseismic landslide hazard, defined herein as the relative probability of landslideoccurrence at a specific location in a specific event, is a function of intrinsic slope characteristics (slope angle,material strength, lithology, etc.), which dictate the susceptibility to failure and do not change appreciably withtime, and of strong ground motion from earthquakes, which acts as the triggering factor [e.g., Meunier et al.,2007]. In recent earthquakes, such as the 1999 Chi-Chi and 2008 Wenchuan events, tens of thousands oflandslides occurred affecting areas of several thousands of square kilometers [Dadson et al., 2004; Dai et al.,2010; Gorum et al., 2011]. Understanding and modeling the factors influencing coseismic slope failures isnecessary to develop effective hazard and risk assessment methods to underpin mitigation plans.
Since the first models of the effects of seismic shaking on slope stability in the 1950s [Terzhagi, 1950], variousmethods have been proposed to assess the stability (or performance) of slopes during earthquakes. Commonlyapplied methods are pseudostatic analysis [Stewart et al., 2003; Bray and Travasarou, 2009], stress-deformationanalysis (finite element model) [Clough and Chopra, 1966], and permanent-displacement analysis (Newmarkdisplacement model) [Newmark, 1965; Jibson et al., 2000]. These are primarily applicable to specific slopesalthough the Newmark displacement model has been adapted for more regional studies [Jibson, 2007; Saygiliand Rathje, 2008; Rathje and Antonakos, 2011; Rathje and Saygili, 2009]. Statistical methods using geographicinformation systems (GIS) have also been successfully utilized for regional landslide hazard assessments [VanWesten et al., 1997; Aleotti and Chowdhury, 1999; Guzzetti et al., 1999; Huabin et al., 2005; Crozier and Glade, 2005].
KRITIKOS ET AL. ©2015. American Geophysical Union. All Rights Reserved. 1
PUBLICATIONSJournal of Geophysical Research: Earth Surface
RESEARCH ARTICLE10.1002/2014JF003224
Key Points:• MMI, tectonics, and topographycontrol coseismic landslide occurrence
• The modeling approach incorporatesfuzzy set theory in GIS
• The model requires no site-specificdata inputs to perform the assessment
Correspondence to:T. Kritikos,[email protected]
Citation:Kritikos, T., T. R. Robinson, and T. R. H.Davies (2015), Regional coseismiclandslide hazard assessment withouthistorical landslide inventories: A newapproach, J. Geophys. Res. Earth Surf.,120, doi:10.1002/2014JF003224.
Received 28 MAY 2014Accepted 24 FEB 2015Accepted article online 26 FEB 2015
These are useful at regional scales because they are objective, reproducible, easy-to-update, and can have fewerdata requirements than physical modeling approaches [Naranjo et al., 1994; Soeters and Van Westen, 1996; VanWesten et al., 2006; He and Beighley, 2008]. Statistical methods are based on relationships between knownhistorical landslide locations and various causative factors [Remondo et al., 2003a], assuming that future slopefailures are likely to occur under similar conditions [Varnes and IAEG Commission on Landslides and otherMass-Movements, 1984; Carrara et al., 1991, 1995; Guzzetti et al., 1999; Dai and Lee, 2002]. This enables thosefactors that are common to all studied slope failures to be identified and utilized for regional analysis.
Several statistical methods exist for modeling regional-scale coseismic landslide hazard [e.g., Lee et al., 2008;Miles and Keefer, 2000, 2007, 2009a, 2009b; Jibson et al., 2000]. These can be highly successful for the areas inwhich they are trained, but very few have been applied beyond their training area. Typically, these methodsincorporate predisposing factors such as slope angle and height, vegetation cover, soil depth, moisture content,terrain roughness, soil or rock strength index, horizontal distance to streams or roads, etc., with modifiedMercalli (MM) shaking intensity or peak ground acceleration (PGA) as the triggering factor [Miles and Keefer,2007, 2009a; Lee et al., 2008; Jibson et al., 2000]. As a result, these methods require (i) a comprehensive andaccurate landslide inventory, (ii) multiple strong motion recordings or detailed isoseismals, (iii) accurategeologic maps, (iv) extensive geotechnical data, and (v) accurate digital elevation models (DEMs) [Harp et al.,2011; Jibson et al., 2000]. However, in many regions neither comprehensive landslide inventories nor extensivegeotechnical data are available. As a result, very few methods exist [e.g., Del Gaudio et al., 2003; Del Gaudio andWasowski, 2004] for regional-scale assessment of coseismic landslide hazard for such areas, and this is a topresearch priority [Wasowski et al., 2011].
Herein we describe a new approach to coseismic landslide hazard analysis for specific earthquake scenarios,in regions without historical landslide inventories or detailed geotechnical data. This is based on the conceptof fuzzy logic in GIS, applied in previous studies [Miles and Keefer, 2007, 2009a; Lee et al., 2008]. The factorscontrolling landslide occurrence are deduced from statistical analysis of landslide inventories from the 1994Northridge and 2008 Wenchuan earthquakes and are applied to the 1999 Chi-Chi earthquake to test themodel’s predictive performance beyond its training region. We first describe the concept of fuzzy logic and itsapplication to landslide hazard modeling, before outlining the data used to derive and test the model. Wethen present an analysis of the factors influencing landslide occurrence in Northridge andWenchuan and usethese to model landslide hazard in each event. Finally, we provide a sensitivity analysis of the results beforeapplying the memberships to Chi-Chi to test the model’s success beyond the training environments.
2. Method2.1. Fuzzy Set Theory
Landslide hazard analysis requires generalizations and simplifications of complex physical processes. Fuzzylogic is a method of modeling highly complex systems that deals with uncertainties related to insufficientknowledge, data limitations, and ambiguous or imprecise input information [Zadeh, 1965]. Fuzzy logic derivesfrom fuzzy set theory which is an extension of classical set theory [Ross, 1995]. In classical set theory, anelement has a clearly defined relationship with a set, whichmeans that the element either belongs (1) or doesnot belong (0) to the set; therefore, its membership degree value can be either 0 or 1.
χA xð Þ ¼ 1; x ∈ A
0; x ∉ A
�(1)
where χA(x) is the characteristic function of element x representing the membership of x in the set A. Fuzzylogic is based on the concept of partial membership, where elements have varying degrees of membershipbetween 0 and 1:
μA xð Þ ∈ ℝ 0 ≤ x ≤1j jf g (2)
where μA(x) is the membership function—the degree of membership of the element in the fuzzy set. A valueof 1 indicates full membership, 0 indicates no membership, and all real values between 0 and 1 are possible.
Membership functions can be either user defined (based on subjective judgment to determine the relativeimportance of the predictive variables), data driven, or a combination. These can be derived by variousfunctions, such as J-shaped, S-shaped, triangular, trapezoidal, or linear, that represent different relationships
Journal of Geophysical Research: Earth Surface 10.1002/2014JF003224
KRITIKOS ET AL. ©2015. American Geophysical Union. All Rights Reserved. 2
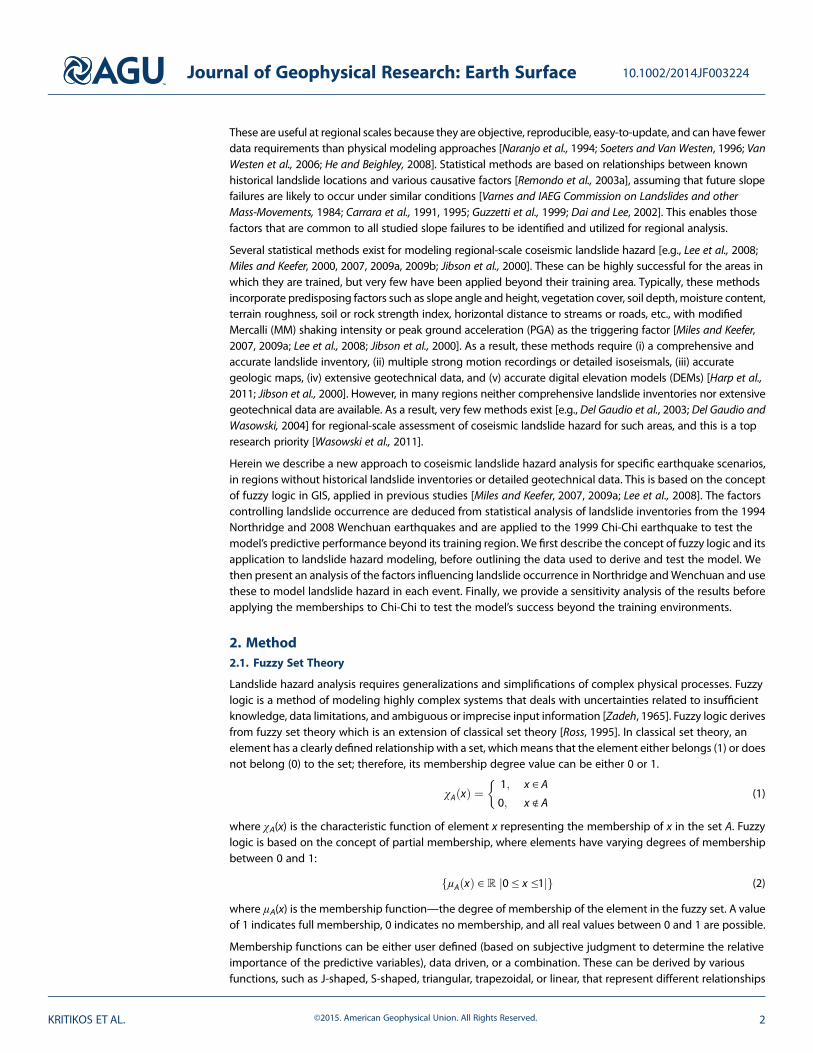
between factors and the phenomena being studied [Bonham-Carter, 1994; Wang et al., 2009]. This studyutilizes semi data-driven memberships from a series of functions available in Environmental SystemsResearch Institute’s ArcGIS. In order to minimize issues associated with subjectivity, the shapes of themembership curves are fitted to landslide densities from the inventory data using the coefficient ofdetermination (R2). However, some curves are subsequently manually altered to account for known errorsand inconsistencies within the data.
The density of landslides is calculated from the frequency ratio, i.e., the relative frequency of landslides withina factor compared with the relative frequency of landslides in the entire study area [e.g., Lee and Pradhan,2007; Lee and Sambath, 2006; Yilmaz, 2009]:
Frequency ratio ¼ N Lið Þ=N Cið ÞN Lð Þ=N Að Þ
(3)
where N(Li) is the number of landslide pixels in the factor i, N(Ci) is the total number of pixels in the factor i, N(L)
is total number of landslide pixels in the study area, and N(A) is the total number of pixels of the study area.
2.2. Fuzzy Overlay
GIS-based landslide hazard analyses require the combination of various factors in the form of spatial layers todevelop the final hazard map. When all relevant factors have been transformed into fuzzy membership datasets, these are aggregated together to produce a final fuzzy set describing the landslide hazard (Figure 1)[Dubois and Prade, 1985; Zimmermann, 1991]. This stage requires the user to decide how the factors arecombined in order to produce a meaningful output. Different operators are available such as fuzzy AND, fuzzyOR, fuzzy Product, fuzzy Sum, and fuzzy Gamma [Bonham-Carter, 1994]. The fuzzy AND and fuzzy OR operatorsare used to identify the lowest and highest membership values, respectively, for each pixel within all themembership data sets. They are therefore useful for identifying either the most or least influencing factorfor any given pixel but not the effect of multiple combined factors. The fuzzy Sum and fuzzy Productoperators assume that by combining factors, the resulting hazard/pixel value is either larger or smaller,respectively, than each of the individual membership sets. These operators are rarely used as they do notsufficiently represent the effect of multiple combined influencing factors [Environmental Systems ResearchInstitute, 2011].
Figure 1. Illustrative workflow of the fuzzy logic method for coseismic landslide hazard assessments.
Journal of Geophysical Research: Earth Surface 10.1002/2014JF003224
KRITIKOS ET AL. ©2015. American Geophysical Union. All Rights Reserved. 3

The fuzzy Gamma operator is a compromise and effectively establishes the combined effect of multiplememberships on the final hazard such that
μ xð Þ ¼ ∏n
i¼1
μi
!1�γ
� 1�∏n
i¼1
1� μið Þ !γ
(4)
where μ(x) is the combined membership value (or hazard), μi is the fuzzy membership function for factori, where i= 1, 2, …, n is the number of memberships to be combined, and γ is a user-defined parameterbetween 0 and 1. The γ value establishes the effect of large μi values (i.e., those favoring the occurrence oflandslides) compared to small μi values (i.e., those discouraging the occurrence of landslides). A large γassigns greater influence to favorable μi values in the final output, while a small γ assigns greater influence tounfavorable μi values. The optimum γ for hazard assessments must achieve high hazard for known landslidelocations across an area not significantly larger than the total landslide affected area.
3. Data
In this study coseismic landslide inventories from three historic earthquakes are used: 1994 Northridge (California),2008 Wenchuan (China), and 1999 Chi-Chi (Taiwan). Below is a brief summary of these earthquakes, theirtectonic environments, and the landslide inventories available.
3.1. 1994 Mw6.7 Northridge Earthquake
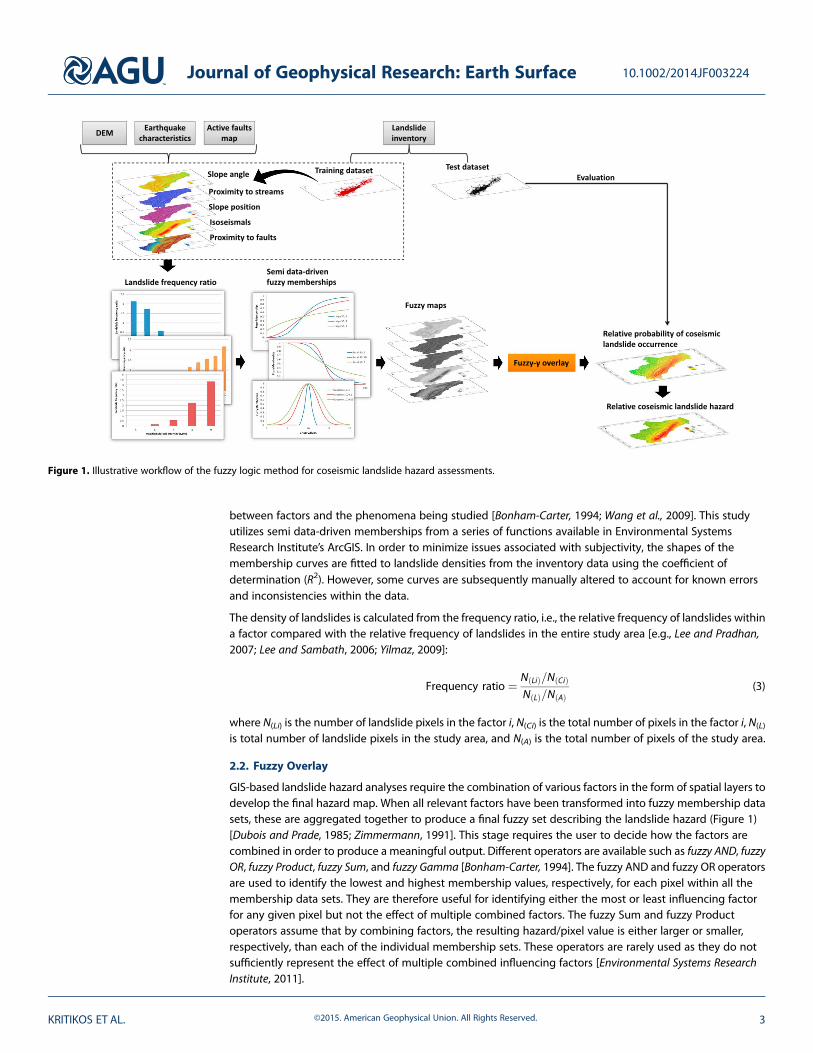
The Northridge earthquake occurred 30 kmnorth of the Los Angeles basin beneath the city of Northridge in theSan Fernando Valley, Southern California (Figure 2), at a focal depth of 18 km on a blind thrust fault [Wald andHeaton, 1994]. Slip occurred along a 14 km long section of the fault and reached a maximum of ~4m withaverage slip measuring ~1.2m. The region has a large number of mapped active faults and is within 100 km ofthe plate boundary San Andreas fault (Figure 2). Consequently, the region has high seismicity with 15>M4.8earthquakes occurring in the greater Los Angeles area between 1920 and 1994 [Hauksson et al., 1995]. In theNorthridge earthquake, high shaking intensities occurred in the surrounding Santa Susana, Santa Monica,and San Gabriel Mountains (Figure 2), and >11,000 landslides were triggered across a total area ~10,000 km2,up to 70 km from the epicenter [Harp and Jibson, 1996]. A distinct 1000 km2 zone northwest of the epicenterrepresents the region of most concentrated landsliding (Figure 2). An inventory containing 11,111 landslideswas compiled immediately after the event using field studies and aerial reconnaissance [Harp and Jibson, 1996].On sunlit slopes, landslides as small as 1–2m across were easily identifiable; however, on shadowed slopes onlylandslides 5–10m across or larger could be identified. Field observations suggested that landslides occurreddominantly on south facing slopes, which are sunlit in the aerial photography; thus it is thought >80% oflandslides>5m across have been mapped [Harp and Jibson, 1996]. Landslides were mapped as polygons andmanually digitized via GIS on 1:24,000 scale base maps. Mapping errors were estimated to be no more than30m [Harp and Jibson, 1996]. Herein, the polygon data are converted to top point (i.e., a point at the highestelevation of the polygon) to conform with data from the other inventories (Table 1).
3.2. 2008 Mw7.9 Wenchuan Earthquake
The Wenchuan earthquake occurred in the Longmen Shan Mountains of Sichuan Province, eastern China(Figure 2). The causative Yingxiu-Beichuan fault is one of three major faults in the Longmen Shan fault zonewhich accommodate both dip-slip and dextral strike-slip motion [Densmore et al., 2007]. As a result, theearthquake involved oblique thrust motion along a >320 km northwest dipping fault [Xu et al., 2009].Rupture originated at a focal depth of 14–19 km and propagated toward the northeast, with surface rupturealong the entire rupture length and maximum vertical and dextral displacements of 6.2m and 4.5m,respectively [Liu-Zeng et al., 2009; Gorum et al., 2011]. Prior to 2008, only 66 major earthquakes were knownto have occurred in the region since 638 A.D., the largest of which was Ms7.2 in 1976 [Li et al., 2009].
The Longmen Shan Mountains are characterized by extreme relief with elevations up to 7500m above sealevel. The earthquake caused very strong ground shaking along the full length of the fault rupture and withinthe ranges (Figure 2). As a result >60,000 landslides were triggered across a total area of 35,000 km2 withthe most concentrated zone covering ~8000 km2 [Gorum et al., 2011]. More than 200 landslide dams werereported [Cui et al., 2009], although more recent work suggests there may have been>800 [Fan et al., 2012].Following the earthquake, numerous studies of the consequential landsliding were undertaken, and various
Journal of Geophysical Research: Earth Surface 10.1002/2014JF003224
KRITIKOS ET AL. ©2015. American Geophysical Union. All Rights Reserved. 4
coseismic landslide inventories have been compiled [e.g., Parker et al., 2011; Gorum et al., 2011; Li et al., 2014].For the present study the inventory of Gorum et al. [2011] is used, which includes 60,109 landslides (Figure 2),identified from high-resolution (<15m) satellite images and air photos. The images cover the entire affectedregion with 0.5% of the study region affected by cloud cover. Landslides were mapped as top points witha minimum resolvable source area of 600m2 [Gorum et al., 2011]. It is not known what percentage of thetotal landslides is missing from this inventory; however, other inventories suggest similar numbers (~56,000:Parker et al. [2011] and ~57,000: Li et al. [2014]). Location accuracy for landslide points is thought to be similarto the pixel size of the satellite images used (i.e., ~15m).
Figure 2. Maps showing the topography and mapped active faults, shaking intensity (from USGS, 2014), and mapped coseismic landslides for the (a) Northridge,(b) Wenchuan, and (c) Chi-Chi earthquakes. Landslide inventories are from http://pubs.usgs.gov/of/1995/ofr-95-0213/downloads/ (Northridge), Gorum et al. [2011](Wenchuan), and Professor Hongey Chen of the National Taiwan University (Chi-Chi).
Journal of Geophysical Research: Earth Surface 10.1002/2014JF003224
KRITIKOS ET AL. ©2015. American Geophysical Union. All Rights Reserved. 5
3.3. 1999 Mw7.7 Chi-Chi Earthquake
The Chi-Chi earthquake was centered 7.5 km beneath the town of Chi-Chi, central Taiwan. The earthquakehad a complex source, rupturing over 100 km along the Chelungpu fault in a series of jumping dislocations[Shin and Teng, 2001]. The rupture surface was nonplanar following the surface expression of the fault withnumerous changes in strike (Figure 2). Thrust motion predominated with maximum surface displacements of~8m; however, the complex fault trace resulted in multiple styles of motion including oblique slip [Chi et al.,2001; Shin and Teng, 2001]. The region has an extremely high seismicity rate with at least 17 damagingearthquakes occurring during the twentieth century [Yu et al., 1997].
The Chelungpu fault marks the boundary between the Central Mountains of Taiwan and the coastal plains(Figure 2). The 1999 earthquake generated strong shaking affecting a large region within the Central Mountainsresulting in>20,000 landslides (Figure 2), the majority occurring across a 3000 km2 region [Dadson et al., 2004].Most of the landslides were shallow debris slides [Lin et al., 2004] although two large-volume rock avalanchesresulted in 78 fatalities [Chigira et al., 2003]. Herein the landslide inventory presented in Dadson et al. [2004]is used, which contains 21,969 landslide polygons (converted to top points) identified from 20m resolutionsatellite images. Landslides >3600m2 are resolved, and other inventories contain similar numbers (~20,000:Wang et al. [2002]) suggesting that the majority of the total landslides is included. Location errors for mappedlandslide polygons are similar to the pixel size of the satellite imagery (~20m).
4. Inventory Analysis and Model Design
Previous coseismic landslide hazard models [e.g., Miles and Keefer, 2007, 2009a; Jibson et al., 2000] have usedhistorical inventories from a study area assuming the factors identified will have a similar influence in thisarea during the next event. However, accurate and complete inventories only exist for very few locations[Xu, 2014], so this approach is impossible for regions without historical inventories. Nevertheless, many of thesame factors have been identified in previous studies (e.g., slope angle, distance from streams, shakingintensity) despite being from different study areas [e.g., Miles and Keefer, 2007, 2009a; Gorum et al., 2011; Leeet al., 2008]. The present approach shows that the effect of various factors on landslide occurrence is similar indifferent regions, allowing meaningful hazard analysis in regions without historical inventories. To achievethis, we identify a series of factors that play similar roles in influencing slope stability in the Northridge andWenchuan landslide inventories. These factors are integrated using GIS-based fuzzy logic to derive averagemembership curves that can be applied beyond the training region. To ensure each of the derived factorsis necessary for modeling, we then undertake a sensitivity analysis to evaluate the effect of each individualfactor on predicting coseismic landslide hazard. Finally, the model is applied to the Chi-Chi earthquake(for which no statistical analysis is undertaken) in order to confirm its applicability beyond the Northridge andWenchuan environments.
4.1. Training Stage
Initially, the Northridge and Wenchuan landslide inventories are randomly split into two datasets (trainingand test datasets), each containing half of the recorded landslides. Landslides for each set are selected usingHawth’s Analysis Tools for ArcMap v.9.3 [Beyer, 2004] to avoid spatial clustering and ensure that both setscontain landslides from across the entire study area. The training data set is utilized to derive the frequencyratio of landslides within the various factors examined. This allows a direct comparison of each factor acrossboth inventories. The test data set is used in the model evaluation to test the success of converting these
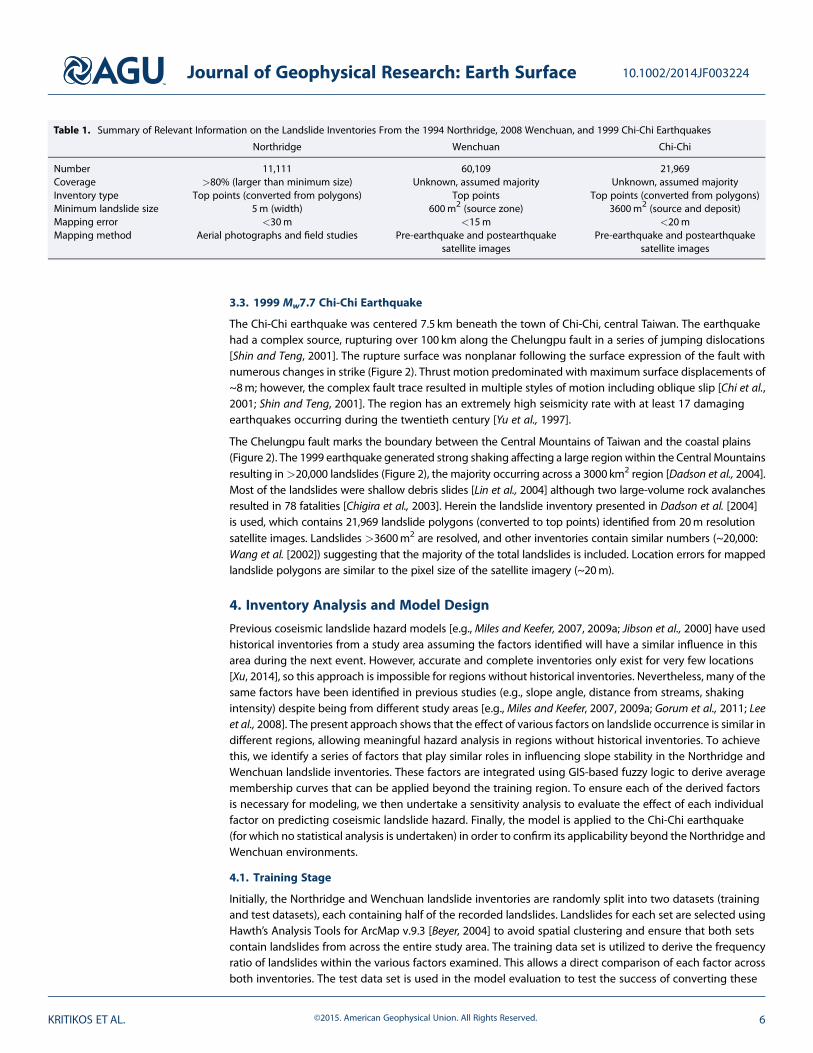
Table 1. Summary of Relevant Information on the Landslide Inventories From the 1994 Northridge, 2008 Wenchuan, and 1999 Chi-Chi Earthquakes
Northridge Wenchuan Chi-Chi
Number 11,111 60,109 21,969Coverage >80% (larger than minimum size) Unknown, assumed majority Unknown, assumed majorityInventory type Top points (converted from polygons) Top points Top points (converted from polygons)Minimum landslide size 5m (width) 600m2 (source zone) 3600m2 (source and deposit)Mapping error <30m <15m <20mMapping method Aerial photographs and field studies Pre-earthquake and postearthquake
satellite imagesPre-earthquake and postearthquake
satellite images
Journal of Geophysical Research: Earth Surface 10.1002/2014JF003224
KRITIKOS ET AL. ©2015. American Geophysical Union. All Rights Reserved. 6
frequency ratios into fuzzy memberships (see below). This splitting ensures that the model is tested againstits predictive ability, rather than its goodness of fit with the statistically analyzed training data.
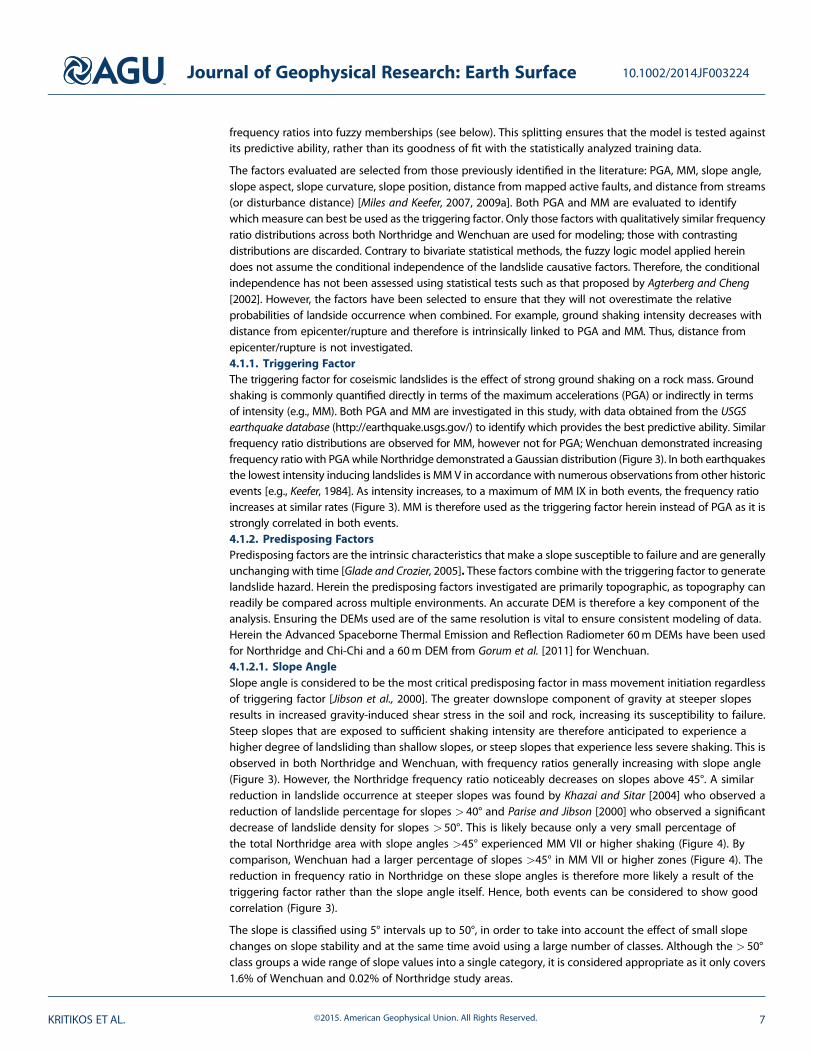
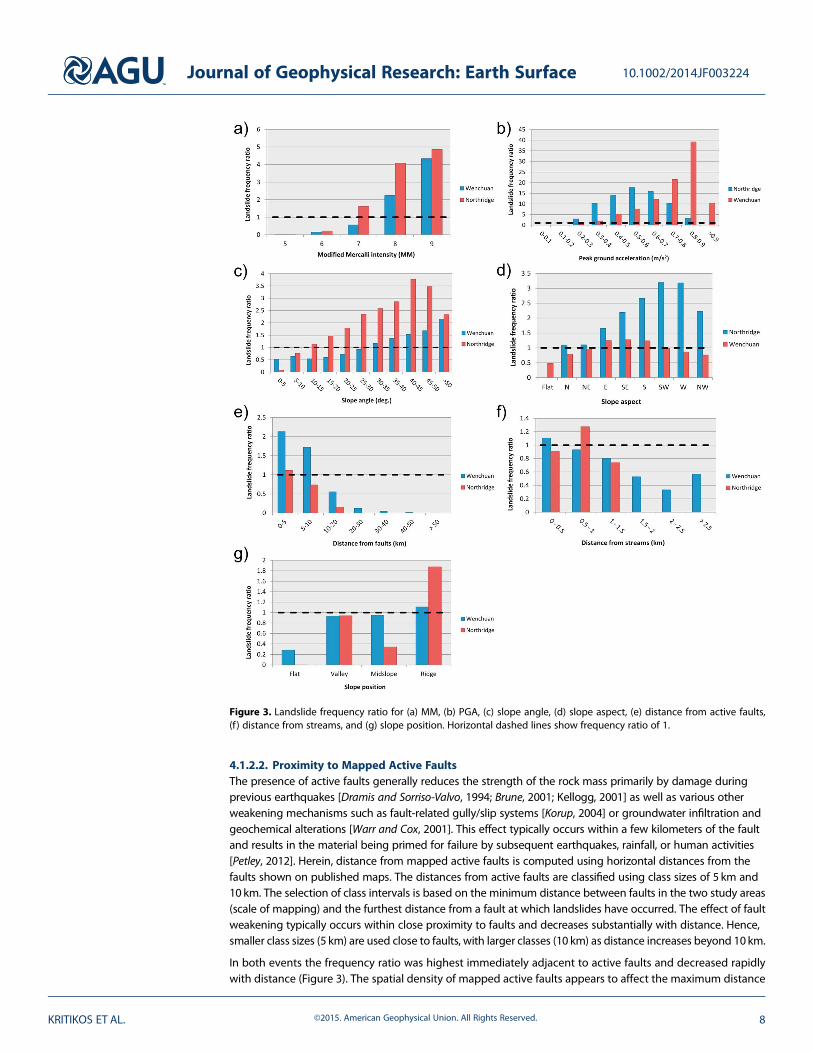
The factors evaluated are selected from those previously identified in the literature: PGA, MM, slope angle,slope aspect, slope curvature, slope position, distance from mapped active faults, and distance from streams(or disturbance distance) [Miles and Keefer, 2007, 2009a]. Both PGA and MM are evaluated to identifywhich measure can best be used as the triggering factor. Only those factors with qualitatively similar frequencyratio distributions across both Northridge and Wenchuan are used for modeling; those with contrastingdistributions are discarded. Contrary to bivariate statistical methods, the fuzzy logic model applied hereindoes not assume the conditional independence of the landslide causative factors. Therefore, the conditionalindependence has not been assessed using statistical tests such as that proposed by Agterberg and Cheng[2002]. However, the factors have been selected to ensure that they will not overestimate the relativeprobabilities of landside occurrence when combined. For example, ground shaking intensity decreases withdistance from epicenter/rupture and therefore is intrinsically linked to PGA and MM. Thus, distance fromepicenter/rupture is not investigated.4.1.1. Triggering FactorThe triggering factor for coseismic landslides is the effect of strong ground shaking on a rock mass. Groundshaking is commonly quantified directly in terms of the maximum accelerations (PGA) or indirectly in termsof intensity (e.g., MM). Both PGA and MM are investigated in this study, with data obtained from the USGSearthquake database (http://earthquake.usgs.gov/) to identify which provides the best predictive ability. Similarfrequency ratio distributions are observed for MM, however not for PGA; Wenchuan demonstrated increasingfrequency ratio with PGAwhile Northridge demonstrated a Gaussian distribution (Figure 3). In both earthquakesthe lowest intensity inducing landslides is MM V in accordance with numerous observations from other historicevents [e.g., Keefer, 1984]. As intensity increases, to a maximum of MM IX in both events, the frequency ratioincreases at similar rates (Figure 3). MM is therefore used as the triggering factor herein instead of PGA as it isstrongly correlated in both events.4.1.2. Predisposing FactorsPredisposing factors are the intrinsic characteristics that make a slope susceptible to failure and are generallyunchanging with time [Glade and Crozier, 2005]. These factors combine with the triggering factor to generatelandslide hazard. Herein the predisposing factors investigated are primarily topographic, as topography canreadily be compared across multiple environments. An accurate DEM is therefore a key component of theanalysis. Ensuring the DEMs used are of the same resolution is vital to ensure consistent modeling of data.Herein the Advanced Spaceborne Thermal Emission and Reflection Radiometer 60m DEMs have been usedfor Northridge and Chi-Chi and a 60m DEM from Gorum et al. [2011] for Wenchuan.4.1.2.1. Slope AngleSlope angle is considered to be the most critical predisposing factor in mass movement initiation regardlessof triggering factor [Jibson et al., 2000]. The greater downslope component of gravity at steeper slopesresults in increased gravity-induced shear stress in the soil and rock, increasing its susceptibility to failure.Steep slopes that are exposed to sufficient shaking intensity are therefore anticipated to experience ahigher degree of landsliding than shallow slopes, or steep slopes that experience less severe shaking. This isobserved in both Northridge and Wenchuan, with frequency ratios generally increasing with slope angle(Figure 3). However, the Northridge frequency ratio noticeably decreases on slopes above 45°. A similarreduction in landslide occurrence at steeper slopes was found by Khazai and Sitar [2004] who observed areduction of landslide percentage for slopes > 40° and Parise and Jibson [2000] who observed a significantdecrease of landslide density for slopes > 50°. This is likely because only a very small percentage ofthe total Northridge area with slope angles >45° experienced MM VII or higher shaking (Figure 4). Bycomparison, Wenchuan had a larger percentage of slopes >45° in MM VII or higher zones (Figure 4). Thereduction in frequency ratio in Northridge on these slope angles is therefore more likely a result of thetriggering factor rather than the slope angle itself. Hence, both events can be considered to show goodcorrelation (Figure 3).
The slope is classified using 5° intervals up to 50°, in order to take into account the effect of small slopechanges on slope stability and at the same time avoid using a large number of classes. Although the > 50°class groups a wide range of slope values into a single category, it is considered appropriate as it only covers1.6% of Wenchuan and 0.02% of Northridge study areas.
Journal of Geophysical Research: Earth Surface 10.1002/2014JF003224
KRITIKOS ET AL. ©2015. American Geophysical Union. All Rights Reserved. 7
4.1.2.2. Proximity to Mapped Active FaultsThe presence of active faults generally reduces the strength of the rock mass primarily by damage duringprevious earthquakes [Dramis and Sorriso-Valvo, 1994; Brune, 2001; Kellogg, 2001] as well as various otherweakening mechanisms such as fault-related gully/slip systems [Korup, 2004] or groundwater infiltration andgeochemical alterations [Warr and Cox, 2001]. This effect typically occurs within a few kilometers of the faultand results in the material being primed for failure by subsequent earthquakes, rainfall, or human activities[Petley, 2012]. Herein, distance from mapped active faults is computed using horizontal distances from thefaults shown on published maps. The distances from active faults are classified using class sizes of 5 km and10 km. The selection of class intervals is based on the minimum distance between faults in the two study areas(scale of mapping) and the furthest distance from a fault at which landslides have occurred. The effect of faultweakening typically occurs within close proximity to faults and decreases substantially with distance. Hence,smaller class sizes (5 km) are used close to faults, with larger classes (10 km) as distance increases beyond 10km.
In both events the frequency ratio was highest immediately adjacent to active faults and decreased rapidlywith distance (Figure 3). The spatial density of mapped active faults appears to affect the maximum distance
Figure 3. Landslide frequency ratio for (a) MM, (b) PGA, (c) slope angle, (d) slope aspect, (e) distance from active faults,(f ) distance from streams, and (g) slope position. Horizontal dashed lines show frequency ratio of 1.
Journal of Geophysical Research: Earth Surface 10.1002/2014JF003224
KRITIKOS ET AL. ©2015. American Geophysical Union. All Rights Reserved. 8
at which landslides occur. Both events show similar frequency ratio distributions, with the influence of mappedactive faults becoming negligible beyond ~10 km (Figure 3).4.1.2.3. Proximity to StreamsThe role of river incision on hillslope processes and landscape evolution has been discussed in numerousstudies [Snyder et al., 2000; Whipple, 2004 Korup, 2004; Larsen and Montgomery, 2012]. Fluvial undercutting,causing high shear stresses due to removal of lateral support, has been identified as a key triggeringmechanism of aseismic slope instability [Korup, 2004]. Therefore, proximity to drainage network has beenused in many landslide studies as a conditioning factor. By including distance to streams, localized processessuch as terrain modified by gully erosion [Dai and Lee, 2002; Dai et al., 2001], stream flow undercutting[Donati and Turrini, 2002; Saha et al., 2002 Van Westen et al., 2003], and headward stream channel erosion[He and Beighley, 2008] can be accounted for.
Herein, streams are derived using a flow accumulation tool within the GIS, with a stream assumed to formwhenthe contributing catchment area exceeds 1 km2. Distance from streams is then computed as the horizontaldistance from the center of the resulting stream channel. Distance from streams is classified using equal-sizedclasses of 0.5 km, based on the drainage network densities in Northridge and Wenchuan and the spatialresolution of the DEMs.
Both events show generally decreasing frequency ratio with increasing distance (Figure 3), with areas within1.5 km of a stream producing the largest proportion of landslides. The small differences in landslide frequencyratio betweenWenchuan and Northridge are perhaps associated with the different uplift rates and consequentfluvial erosion rates. Additionally, in Wenchuan there are significantly more powerful stream channels comparedto Northridge that may affect the landscape at greater distances. Nevertheless, distance from streams playsan important role in both events with the highest landslide densities being observed within 1 km andsubstantially decreasing at >1.5 km.4.1.2.4. Slope PositionOne of the key factors favoring coseismic landsliding is the amplification of seismic ground motion bytopography, known as topographic amplification [Meunier et al., 2008]. This is a localized increase in thegroundmotion amplitude generated by the propagation of seismic waves on the Earth’s surface and throughthe crust. This has received increased attention over the last few decades [Davis and West, 1973; Spudich et al.,1996; Athanasopoulos et al., 1999; LeBrun et al., 1999; Havenith et al., 2003;Wald and Allen, 2007;Meunier et al.,2008; Buech et al., 2010] showing that different parts of hillslopes (e.g., ridge, midslope, and base) responddifferently to seismic shaking. Despite the progress in understanding the phenomenon at the local scale,limited studies have attempted to model topographic amplification at the regional scale [Lee et al., 2008,2009a, 2009b].
Figure 4. Distribution of slope angles >40° with respect to MM in the Northridge and Wenchuan earthquakes.
Journal of Geophysical Research: Earth Surface 10.1002/2014JF003224
KRITIKOS ET AL. ©2015. American Geophysical Union. All Rights Reserved. 9
To classify the landscape according to relative slope position, we use the Topographic Position Index(TPI) [Weiss, 2001]. This compares the elevation of each cell in a DEM to the mean elevation of a specifiedneighborhood around that cell. The output is a continuous raster where positive TPI values represent locationsthat are higher than the average of their surroundings (e.g., ridges) and negative values represent lowerlocations (e.g., valleys). TPI values near zero are areas of uniform slope angle. This can then be classified intovarious discrete slope position classes [Jenness et al., 2013]. Herein, we classify the landscape into four slopeposition classes (valleys, midslopes, ridges, and flat plains) following the example given in Jenness et al. [2013].
The highest landslide frequency ratios are observed at ridges in both environments (Figure 3). This agreeswith Buech et al. [2010] who showed that ground shaking was amplified most along ridgelines thusincreasing the probability of slope failure. Frequency ratio generally decreases as slope class changes tomidslopes, valleys, and flat plains (Figure 3). In Wenchuan the density of landslides at midslopes is similarto that in valleys, probably because Gorum et al. [2011] mapped lateral spreads which occurred at riverbanks within valleys, increasing the frequency ratio for this class. Lateral spreads were not mapped in theNorthridge inventory [Harp and Jibson, 1996]. Nevertheless, midslopes show amarked reduction in frequencyratio at Northridge. This is likely a result of a small number of pixels being classified as midslopes becauseelevation in the region is limited to ~2700m resulting in relatively short slopes with continuous slope anglewhen using a 60m DEM. In Wenchuan, the maximum elevation is ~6000m resulting in significantly longerslopes and thus more pixels classified as midslopes.4.1.2.5. Other FactorsSlope aspect influenced the location of landslides in both Northridge and Wenchuan but did not correlateacross the events (Figure 3). Landslides in Northridge favored south facing to west facing slopes [Harp andJibson, 1996], while inWenchuan they favored south facing to east facing slopes (Figure 3). This is likely an effectof slope orientation in relation to seismic wave propagation, a factor which may yield useful results but isbeyond the scope of this study. Slope curvature appeared to play no significant role in landslide formation; bothconvex and concave slopes had similar effects and were only slightly more influential than flat slopes (Figure 3).
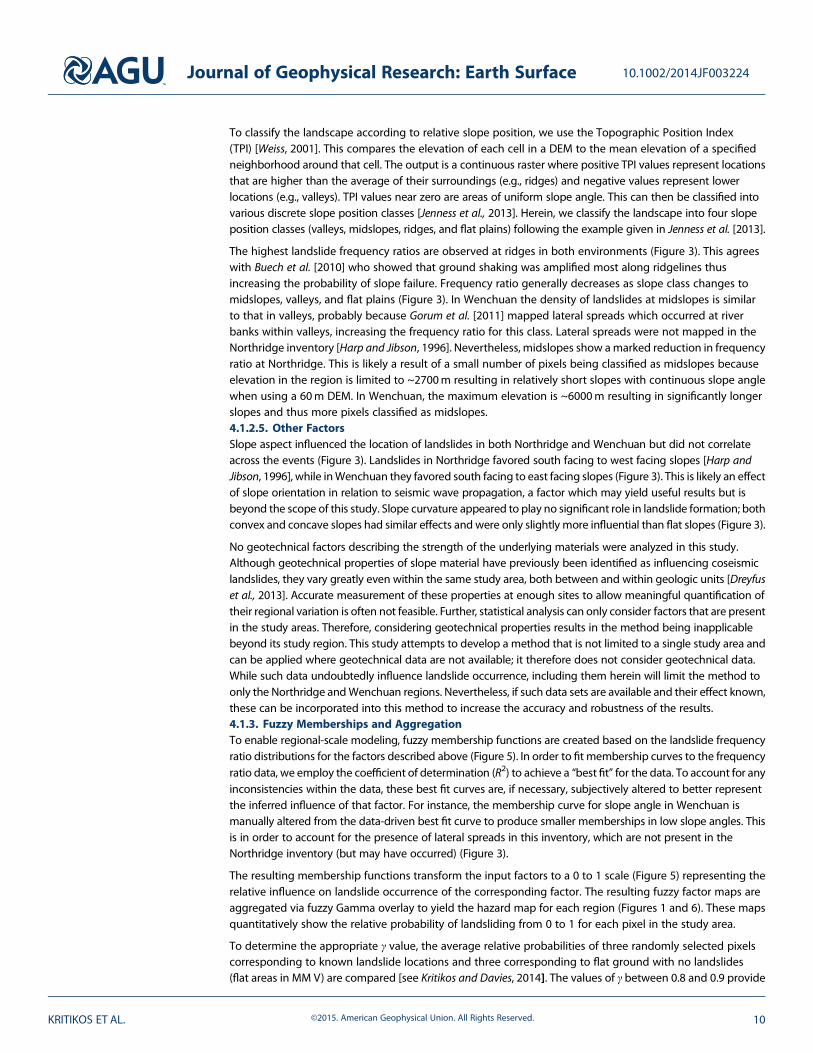
No geotechnical factors describing the strength of the underlying materials were analyzed in this study.Although geotechnical properties of slope material have previously been identified as influencing coseismiclandslides, they vary greatly even within the same study area, both between and within geologic units [Dreyfuset al., 2013]. Accurate measurement of these properties at enough sites to allow meaningful quantification oftheir regional variation is often not feasible. Further, statistical analysis can only consider factors that are presentin the study areas. Therefore, considering geotechnical properties results in the method being inapplicablebeyond its study region. This study attempts to develop a method that is not limited to a single study area andcan be applied where geotechnical data are not available; it therefore does not consider geotechnical data.While such data undoubtedly influence landslide occurrence, including them herein will limit the method toonly the Northridge andWenchuan regions. Nevertheless, if such data sets are available and their effect known,these can be incorporated into this method to increase the accuracy and robustness of the results.4.1.3. Fuzzy Memberships and AggregationTo enable regional-scale modeling, fuzzy membership functions are created based on the landslide frequencyratio distributions for the factors described above (Figure 5). In order to fit membership curves to the frequencyratio data, we employ the coefficient of determination (R2) to achieve a “best fit” for the data. To account for anyinconsistencies within the data, these best fit curves are, if necessary, subjectively altered to better representthe inferred influence of that factor. For instance, the membership curve for slope angle in Wenchuan ismanually altered from the data-driven best fit curve to produce smaller memberships in low slope angles. Thisis in order to account for the presence of lateral spreads in this inventory, which are not present in theNorthridge inventory (but may have occurred) (Figure 3).
The resulting membership functions transform the input factors to a 0 to 1 scale (Figure 5) representing therelative influence on landslide occurrence of the corresponding factor. The resulting fuzzy factor maps areaggregated via fuzzy Gamma overlay to yield the hazard map for each region (Figures 1 and 6). These mapsquantitatively show the relative probability of landsliding from 0 to 1 for each pixel in the study area.
To determine the appropriate γ value, the average relative probabilities of three randomly selected pixelscorresponding to known landslide locations and three corresponding to flat ground with no landslides(flat areas in MM V) are compared [see Kritikos and Davies, 2014]. The values of γ between 0.8 and 0.9 provide
Journal of Geophysical Research: Earth Surface 10.1002/2014JF003224
KRITIKOS ET AL. ©2015. American Geophysical Union. All Rights Reserved. 10
the best compromise between achieving high susceptibility values at known landslide locations and lowvalues at locations known not to have sustained landsliding (Figure 7). Herein we use a value of 0.9 as thisachieves comparatively marginally higher hazard values for the same landslide pixel, and when undertakingscenario analysis it is preferential to overestimate hazard than underestimate. The Wenchuan model was alsoundertaken using γ= 0.8 with only negligible difference in success rate (see below).
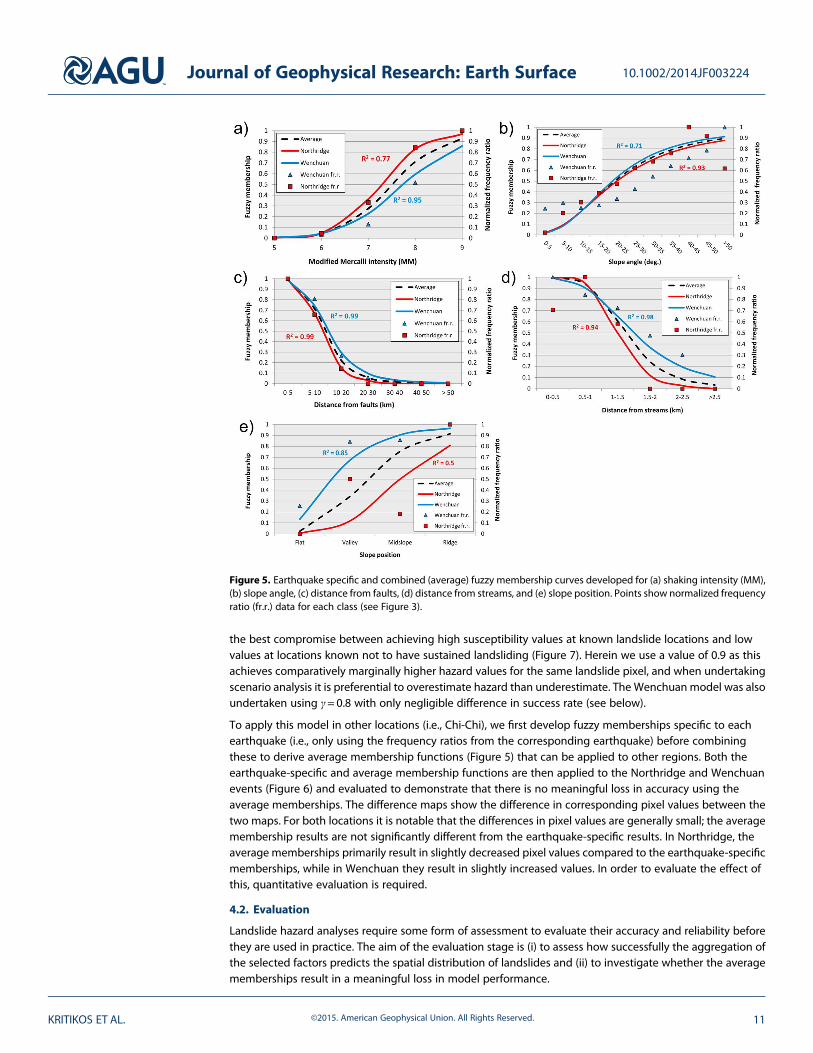
To apply this model in other locations (i.e., Chi-Chi), we first develop fuzzy memberships specific to eachearthquake (i.e., only using the frequency ratios from the corresponding earthquake) before combiningthese to derive average membership functions (Figure 5) that can be applied to other regions. Both theearthquake-specific and average membership functions are then applied to the Northridge and Wenchuanevents (Figure 6) and evaluated to demonstrate that there is no meaningful loss in accuracy using theaverage memberships. The difference maps show the difference in corresponding pixel values between thetwo maps. For both locations it is notable that the differences in pixel values are generally small; the averagemembership results are not significantly different from the earthquake-specific results. In Northridge, theaverage memberships primarily result in slightly decreased pixel values compared to the earthquake-specificmemberships, while in Wenchuan they result in slightly increased values. In order to evaluate the effect ofthis, quantitative evaluation is required.
4.2. Evaluation
Landslide hazard analyses require some form of assessment to evaluate their accuracy and reliability beforethey are used in practice. The aim of the evaluation stage is (i) to assess how successfully the aggregation ofthe selected factors predicts the spatial distribution of landslides and (ii) to investigate whether the averagememberships result in a meaningful loss in model performance.
Figure 5. Earthquake specific and combined (average) fuzzy membership curves developed for (a) shaking intensity (MM),(b) slope angle, (c) distance from faults, (d) distance from streams, and (e) slope position. Points show normalized frequencyratio (fr.r.) data for each class (see Figure 3).
Journal of Geophysical Research: Earth Surface 10.1002/2014JF003224
KRITIKOS ET AL. ©2015. American Geophysical Union. All Rights Reserved. 11
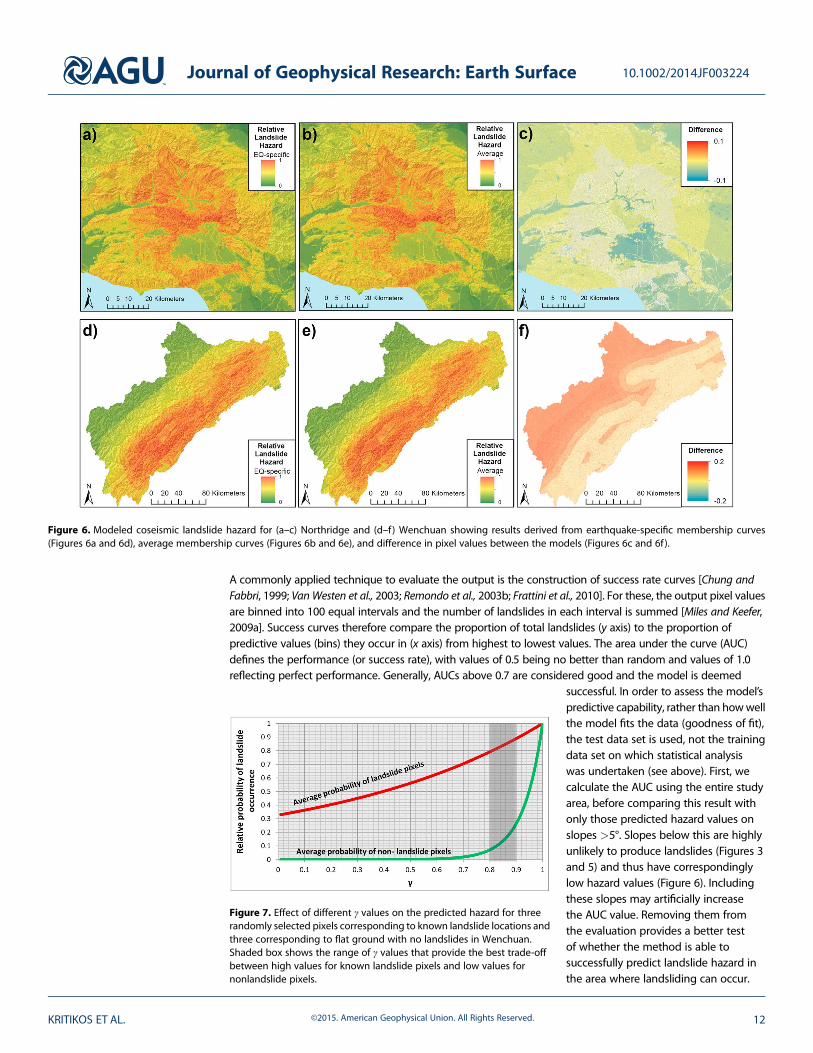
A commonly applied technique to evaluate the output is the construction of success rate curves [Chung andFabbri, 1999; VanWesten et al., 2003; Remondo et al., 2003b; Frattini et al., 2010]. For these, the output pixel valuesare binned into 100 equal intervals and the number of landslides in each interval is summed [Miles and Keefer,2009a]. Success curves therefore compare the proportion of total landslides (y axis) to the proportion ofpredictive values (bins) they occur in (x axis) from highest to lowest values. The area under the curve (AUC)defines the performance (or success rate), with values of 0.5 being no better than random and values of 1.0reflecting perfect performance. Generally, AUCs above 0.7 are considered good and the model is deemed
successful. In order to assess the model’spredictive capability, rather than howwellthe model fits the data (goodness of fit),the test data set is used, not the trainingdata set on which statistical analysiswas undertaken (see above). First, wecalculate the AUC using the entire studyarea, before comparing this result withonly those predicted hazard values onslopes >5°. Slopes below this are highlyunlikely to produce landslides (Figures 3and 5) and thus have correspondinglylow hazard values (Figure 6). Includingthese slopes may artificially increasethe AUC value. Removing them fromthe evaluation provides a better testof whether the method is able tosuccessfully predict landslide hazard inthe area where landsliding can occur.
Figure 7. Effect of different γ values on the predicted hazard for threerandomly selected pixels corresponding to known landslide locations andthree corresponding to flat ground with no landslides in Wenchuan.Shaded box shows the range of γ values that provide the best trade-offbetween high values for known landslide pixels and low values fornonlandslide pixels.
Figure 6. Modeled coseismic landslide hazard for (a–c) Northridge and (d–f ) Wenchuan showing results derived from earthquake-specific membership curves(Figures 6a and 6d), average membership curves (Figures 6b and 6e), and difference in pixel values between the models (Figures 6c and 6f).
Journal of Geophysical Research: Earth Surface 10.1002/2014JF003224
KRITIKOS ET AL. ©2015. American Geophysical Union. All Rights Reserved. 12
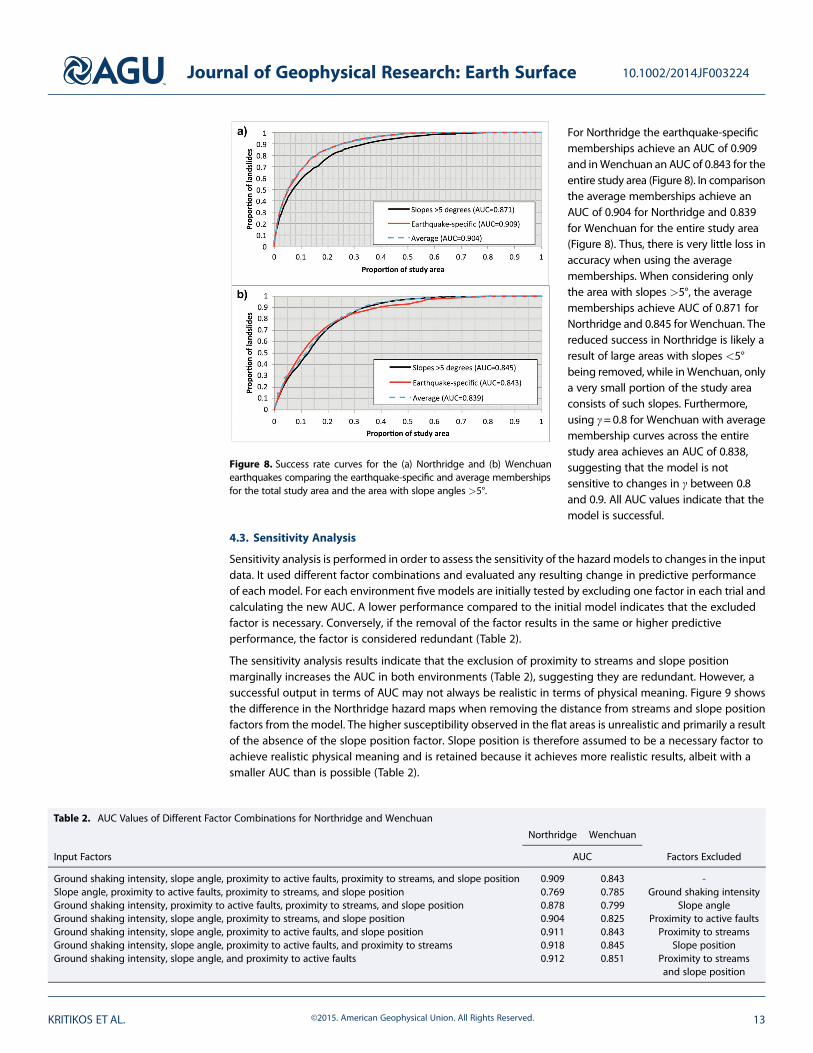
For Northridge the earthquake-specificmemberships achieve an AUC of 0.909and inWenchuan an AUC of 0.843 for theentire study area (Figure 8). In comparisonthe average memberships achieve anAUC of 0.904 for Northridge and 0.839for Wenchuan for the entire study area(Figure 8). Thus, there is very little loss inaccuracy when using the averagememberships. When considering onlythe area with slopes >5°, the averagememberships achieve AUC of 0.871 forNorthridge and 0.845 for Wenchuan. Thereduced success in Northridge is likely aresult of large areas with slopes <5°being removed, while inWenchuan, onlya very small portion of the study areaconsists of such slopes. Furthermore,using γ=0.8 for Wenchuan with averagemembership curves across the entirestudy area achieves an AUC of 0.838,suggesting that the model is notsensitive to changes in γ between 0.8and 0.9. All AUC values indicate that themodel is successful.
4.3. Sensitivity Analysis
Sensitivity analysis is performed in order to assess the sensitivity of the hazardmodels to changes in the inputdata. It used different factor combinations and evaluated any resulting change in predictive performanceof each model. For each environment five models are initially tested by excluding one factor in each trial andcalculating the new AUC. A lower performance compared to the initial model indicates that the excludedfactor is necessary. Conversely, if the removal of the factor results in the same or higher predictiveperformance, the factor is considered redundant (Table 2).
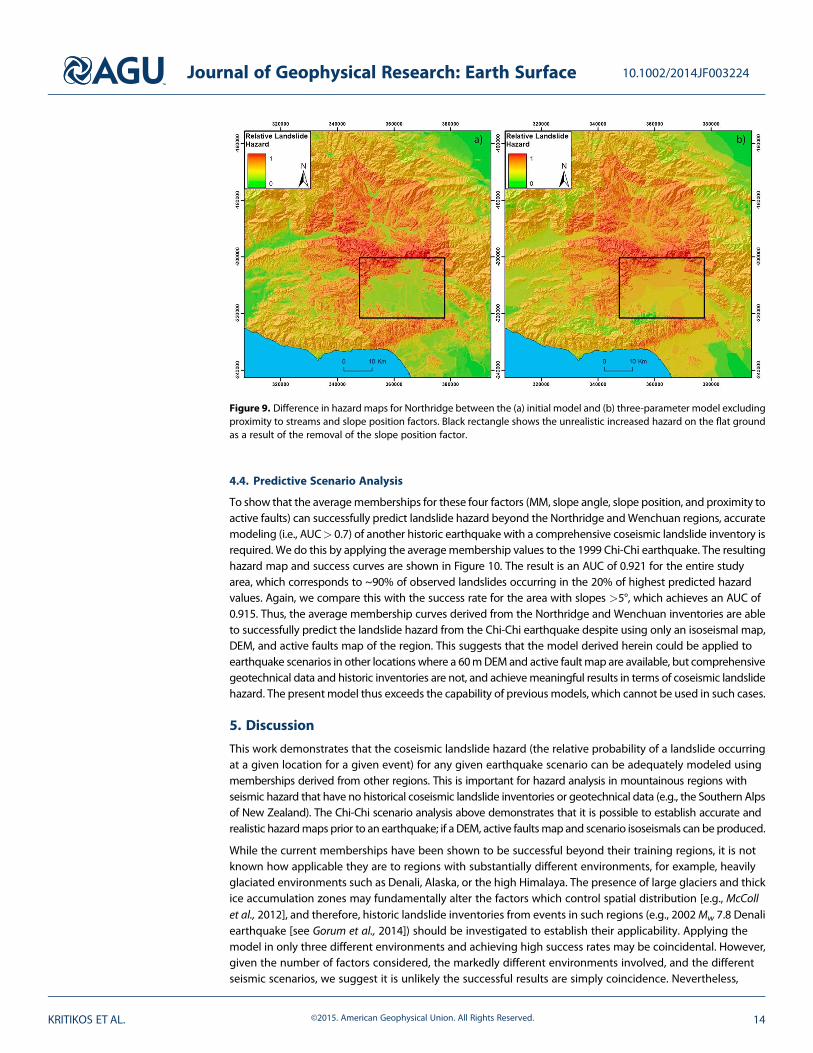
The sensitivity analysis results indicate that the exclusion of proximity to streams and slope positionmarginally increases the AUC in both environments (Table 2), suggesting they are redundant. However, asuccessful output in terms of AUC may not always be realistic in terms of physical meaning. Figure 9 showsthe difference in the Northridge hazard maps when removing the distance from streams and slope positionfactors from the model. The higher susceptibility observed in the flat areas is unrealistic and primarily a resultof the absence of the slope position factor. Slope position is therefore assumed to be a necessary factor toachieve realistic physical meaning and is retained because it achieves more realistic results, albeit with asmaller AUC than is possible (Table 2).
Table 2. AUC Values of Different Factor Combinations for Northridge and Wenchuan
Input Factors
Northridge Wenchuan
Factors ExcludedAUC
Ground shaking intensity, slope angle, proximity to active faults, proximity to streams, and slope position 0.909 0.843 -Slope angle, proximity to active faults, proximity to streams, and slope position 0.769 0.785 Ground shaking intensityGround shaking intensity, proximity to active faults, proximity to streams, and slope position 0.878 0.799 Slope angleGround shaking intensity, slope angle, proximity to streams, and slope position 0.904 0.825 Proximity to active faultsGround shaking intensity, slope angle, proximity to active faults, and slope position 0.911 0.843 Proximity to streamsGround shaking intensity, slope angle, proximity to active faults, and proximity to streams 0.918 0.845 Slope positionGround shaking intensity, slope angle, and proximity to active faults 0.912 0.851 Proximity to streams
and slope position
Figure 8. Success rate curves for the (a) Northridge and (b) Wenchuanearthquakes comparing the earthquake-specific and average membershipsfor the total study area and the area with slope angles >5°.
Journal of Geophysical Research: Earth Surface 10.1002/2014JF003224
KRITIKOS ET AL. ©2015. American Geophysical Union. All Rights Reserved. 13
4.4. Predictive Scenario Analysis
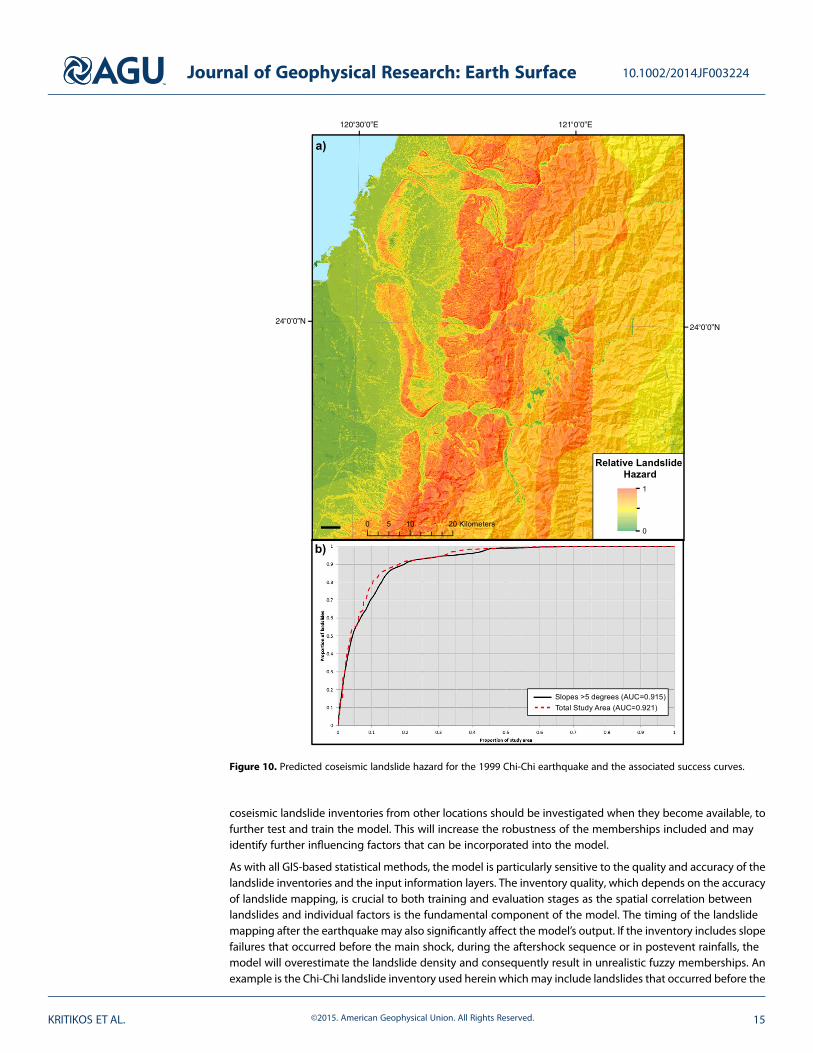
To show that the averagememberships for these four factors (MM, slope angle, slope position, and proximity toactive faults) can successfully predict landslide hazard beyond the Northridge andWenchuan regions, accuratemodeling (i.e., AUC> 0.7) of another historic earthquake with a comprehensive coseismic landslide inventory isrequired. We do this by applying the averagemembership values to the 1999 Chi-Chi earthquake. The resultinghazard map and success curves are shown in Figure 10. The result is an AUC of 0.921 for the entire studyarea, which corresponds to ~90% of observed landslides occurring in the 20% of highest predicted hazardvalues. Again, we compare this with the success rate for the area with slopes >5°, which achieves an AUC of0.915. Thus, the average membership curves derived from the Northridge and Wenchuan inventories are ableto successfully predict the landslide hazard from the Chi-Chi earthquake despite using only an isoseismal map,DEM, and active faults map of the region. This suggests that the model derived herein could be applied toearthquake scenarios in other locations where a 60mDEMand active faultmap are available, but comprehensivegeotechnical data and historic inventories are not, and achievemeaningful results in terms of coseismic landslidehazard. The present model thus exceeds the capability of previous models, which cannot be used in such cases.
5. Discussion
This work demonstrates that the coseismic landslide hazard (the relative probability of a landslide occurringat a given location for a given event) for any given earthquake scenario can be adequately modeled usingmemberships derived from other regions. This is important for hazard analysis in mountainous regions withseismic hazard that have no historical coseismic landslide inventories or geotechnical data (e.g., the Southern Alpsof New Zealand). The Chi-Chi scenario analysis above demonstrates that it is possible to establish accurate andrealistic hazardmaps prior to an earthquake; if a DEM, active faultsmap and scenario isoseismals can be produced.
While the current memberships have been shown to be successful beyond their training regions, it is notknown how applicable they are to regions with substantially different environments, for example, heavilyglaciated environments such as Denali, Alaska, or the high Himalaya. The presence of large glaciers and thickice accumulation zones may fundamentally alter the factors which control spatial distribution [e.g., McCollet al., 2012], and therefore, historic landslide inventories from events in such regions (e.g., 2002Mw 7.8 Denaliearthquake [see Gorum et al., 2014]) should be investigated to establish their applicability. Applying themodel in only three different environments and achieving high success rates may be coincidental. However,given the number of factors considered, the markedly different environments involved, and the differentseismic scenarios, we suggest it is unlikely the successful results are simply coincidence. Nevertheless,
Figure 9. Difference in hazard maps for Northridge between the (a) initial model and (b) three-parameter model excludingproximity to streams and slope position factors. Black rectangle shows the unrealistic increased hazard on the flat groundas a result of the removal of the slope position factor.
Journal of Geophysical Research: Earth Surface 10.1002/2014JF003224
KRITIKOS ET AL. ©2015. American Geophysical Union. All Rights Reserved. 14
coseismic landslide inventories from other locations should be investigated when they become available, tofurther test and train the model. This will increase the robustness of the memberships included and mayidentify further influencing factors that can be incorporated into the model.
As with all GIS-based statistical methods, the model is particularly sensitive to the quality and accuracy of thelandslide inventories and the input information layers. The inventory quality, which depends on the accuracyof landslide mapping, is crucial to both training and evaluation stages as the spatial correlation betweenlandslides and individual factors is the fundamental component of the model. The timing of the landslidemapping after the earthquake may also significantly affect the model’s output. If the inventory includes slopefailures that occurred before the main shock, during the aftershock sequence or in postevent rainfalls, themodel will overestimate the landslide density and consequently result in unrealistic fuzzy memberships. Anexample is the Chi-Chi landslide inventory used herein whichmay include landslides that occurred before the
Figure 10. Predicted coseismic landslide hazard for the 1999 Chi-Chi earthquake and the associated success curves.
Journal of Geophysical Research: Earth Surface 10.1002/2014JF003224
KRITIKOS ET AL. ©2015. American Geophysical Union. All Rights Reserved. 15
earthquake according to recent studies [Lee, 2013, 2014] that demonstrate the earthquake likely generated~13,000 landslides. The issue of input data quality is further complicated when information from differentenvironments is combined. The resolutions of the various data layers must be the same and shouldmatch thescale of the assessment (e.g., regional-scale input data will only provide a useful output for a regional-scalestudy); otherwise, the model’s predictive capability will be significantly decreased.
Another limitation results from the use of oversimplified input data by only considering information that isrelatively easily mapped or derived from a DEM. For instance, the influence of topographic amplification ismodeled based on the TPI [Weiss, 2001] to classify the landscape according to relative slope positions. Thisis a simplification of a very complex phenomenon at regional scale. It does not take into account otherparameters such as the orientation of topographic irregularities with respect to the ground motion, resonantfrequencies, or sharp contrasts of mechanical properties with depth or between geological formations.Additionally, the TPI is an inherently scale-dependent parameter; at a 50m scale a point might be considereda flat plain whereas at a scale of several kilometres this same point might be at the bottom of a steep valley[Jenness et al., 2013]. Therefore, the slope positions identified by this technique depend entirely on the scaleof the analysis and the resolution of the DEM. This may be the reason why removing slope position factorresults in slightly increased AUC values as it is too simplified at the regional scale.
Reclassifying continuous data of landslide causative factors (e.g., slope angle) into discrete classes is necessary inorder to calculate the distribution of landslide density for each factor. This process introduces a degree ofsubjectivity and a source of uncertainty in the modeling approach. Since the shapes of the fuzzy membershipcurves are related to the distributions of landslide densities, the size and number of classes within a factorcan directly affect the result. To minimize the effect of this source of uncertainty the size and number of classesare selected based on the mapping scale of each factor (e.g., mapping scale of active faults map), the DEMresolution and the spatial distribution of landslides within the factor (e.g., closest and farthest distances from afault or streamwhere landslides are observed). However, themost important step tominimize the uncertaintiesof class boundaries is the application of semi data-driven fuzzy memberships. The shapes of the membershipcurves are fitted to landslide densities from the inventory data using the coefficient of determination (R2).This allowed us to alter the shape of a curve to account for any known errors or inconsistencies within the dataand maintain a high R2 at the same time. By doing this, the landslide density distributions with discrete classboundaries are transformed into continuous fuzzy membership curves with a similar shape and no discreteboundaries. However, this process also involves a degree of subjectivity that can directly affect the final output.
These considerations suggest that the predictive ability of the present model must be taken as anorder-of-magnitude estimate only. Nevertheless, in regions with no historic or geotechnical data, suchestimates are useful for preliminary hazard assessment and mitigation planning.
6. Conclusions
This study (i) identifies factors common to multiple regions that appear to influence coseismic landslideoccurrence to the same extent, (ii) models the influence of these factors using fuzzy logic in GIS, and (iii)demonstrates that these factors can be used to successfully assess landslide hazard beyond the study areas.In particular
1. Landslide inventories from the 1994 Northridge and 2008 Wenchuan earthquakes reveal four factorsdemonstrating strong correlation across both events: shaking intensity (MM), slope angle, distance fromactive faults, and slope position.
2. Based on the frequency ratio of observed landslides within these factors, semi data-driven averagemembership curves are developed to successfully model the coseismic landslide hazard for both events.
3. These memberships are successfully applied to the 1999 Mw7.7 Chi-Chi earthquake. The results show that90% of the landslides in the Chi-Chi event occurred in the highest 20% of modeled hazard values, showingthat the method can be applied with meaningful accuracy beyond the Northridge and Wenchuan regions.
Analysis of other available coseismic landslide inventories can increase the robustness of themembership curvesand identify other factors that may potentially influence landsliding similarly across multiple environments.The present method, and the memberships derived, allows preliminary hazard analyses in regions with thepotential for coseismic landsliding, for which quantitative analysis has not previously been possible.
Journal of Geophysical Research: Earth Surface 10.1002/2014JF003224
KRITIKOS ET AL. ©2015. American Geophysical Union. All Rights Reserved. 16
ReferencesAgterberg, F. P., and Q. Cheng (2002), Conditional independence test for weights of evidence modelling, Nat. Resour. Res., 11, 249–255.Aleotti, P., and R. Chowdhury (1999), Landslide hazard assessment: Summary review and new perspectives, Bull. Eng. Geol. Environ., 58, 21–44.Athanasopoulos, G. A., P. C. Pelekis, and E. A. Leonidou (1999), Effects of surface topography on seismic ground response in the Egion
(Greece) 15 June 1995 earthquake, Soil Dyn. Earthquake Eng., 18(2), 135–149.Beyer, H. L. (2004), Hawth’s analysis tools for ArcGIS. [Available at http://www.spatialecology.com/htools.]Bonham-Carter, G. F. (1994), Geographic Information Systems for Geoscientists, Pergamon, Ottawa.Bray, J. D., and T. Travasarou (2009), Pseudostatic coefficient for use in simplified seismic slope stability evaluation, J. Geotech. Geoenviron.
Eng., 135, 1336–1340.Brune, J. N. (2001), Shattered rock and precarious rock evidence for strong asymmetry in groundmotions during thrust faulting, Bull. Seismol.
Soc. Am., 91, 441–447.Buech, F., T. R. Davies, and J. R. Pattinga (2010), The little red hill seismic experimental study: Topographic effects on ground motion at a
bedrock-dominated mountain edifice, Bull. Seismol. Soc. Am., 100(5A), 2219–2229, doi:10.1785/0120090345.Carrara, A., M. Cardinali, R. Detti, F. Guzzetti, V. Pasqui, and P. Reichenbach (1991), GIS techniques and statistical models in evaluating
landslide hazard, Earth Surf. Processes Landform, 16, 427–445.Carrara, A., M. Cardinali, F. Guzzetti, and P. Reichenbach (1995), GIS technology inmapping landslide hazard, inGeographical Information Systems
in Assessing Natural Hazards, edited by A. Carrara and F. Guzzetti, pp. 135–175, Kluwer Acad., Dordrecht, Netherlands.Chi, W.-C., D. Dreger, and A. Kaverina (2001), Finite-source modeling of the 1999 Taiwan (Chi-Chi) Earthquake derived from a dense
strong-motion network, Bull. Seismol. Soc. Am., 91, 1144–1157.Chigira, M., W. Wang, T. Furuya, and T. Kamai (2003), Geological causes and geomorphological precursors of the Tsaoling landslide triggered
by the 1999 Chi-Chi earthquake, Taiwan, Eng. Geol., 68(3), 259–273.Chung, C. F., and A. G. Fabbri (1999), Probabilistic prediction models for landslide hazard mapping, Photogramm. Eng. Remote Sens., 65(12),
1389–1399.Clough, R. W., and A. K. Chopra (1966), Earthquake stress analysis in earth dams, ASCE J. Eng. Mech. Div., 92, 197–211.Crozier, M. J., and T. Glade (2005), Landslide hazard and risk: Issues, concepts and approach, in Landslide Risk Assessment, edited by T. Glade,
M. G. Anderson, and M. J. Crozier, pp. 1–40, John Wiley, Chichester, U. K.Cui, P., Y. Zhu, Y. Han, X. Chen, and J. Zhuang (2009), The 12MayWenchuan earthquake-induced landslide lakes: Distribution and preliminary
risk evaluation, Landslides, 6(3), 209–223.Dadson, S., et al. (2004), Earthquake-triggered increase in sediment delivery from an active mountain belt, Geology, 32(8), 733–736.Dai, F. C., and C. F. Lee (2002), Landslide characteristics and, slope instability modeling using GIS, Lantau Island, Hong Kong, Geomorphology,
42(3–4), 213–228.Dai, F. C., C. F. Lee, J. Li, and Z. W. Xu (2001), Assessment of landslide susceptibility on the natural terrain of Lantau Island, Hong Kong, Environ.
Geol., 40(3), 381–391.Dai, F. C., C. Xu, X. Yao, L. Xu, X. B. Tu, and Q. M. Gong (2010), Spatial distribution of landslides triggered by the 2008 Ms 8.0 Wenchuan
earthquake, China, J. Asian. Earth Sci., 40, 883–895.Davis, L. L., and L. R. West (1973), Observed effects of topography on ground motion, Bull. Seismol. Soc. Am., 63, 283–298.Del Gaudio, V., and J. Wasowski (2004), Time probabilistic evaluation of seismically-induced landslide hazard in Irpinia (Southern Italy), Soil
Dyn. Earthquake Eng., 24, 915–928.Del Gaudio, V., P. Pierri, and J. Wasowski (2003), An approach to time-probabilistic evaluation of seismically induced landslide hazard, Bull.
Seismol. Soc. Am., 93, 557–569.Densmore, A., M. A. Ellis, Y. Li, R. Zhou, G. Hancock, and N. Richardson (2007), Active tectonics of the Beichuan and Pengguan faults at the
eastern margin of the Tibetan Plateau, Tectonics, 26, TC4005, doi:10.1029/2006TC001987.Donati, L., and M. C. Turrini (2002), An objective method to rank, the importance of the factors predisposing to landslides with the GIS
methodology: Application to an area of the Apennines, (Valnerina; Perugia, Italy), Eng. Geol., 63(3–4), 277–289.Dramis, F., and M. Sorriso-Valvo (1994), Deep-seated gravitational slope deformation, related landslides and tectonics, Eng. Geol., 38, 231–243.Dreyfus, D., E. M. Rathje, and R. W. Jibson (2013), The influence of different simplified sliding-block models and input parameters on regional
predictions of seismic landslides triggered by the Northridge earthquake, Eng. Geol., 163, 41–54.Dubois, D., and H. Prade (1985), A review of fuzzy set aggregation connectives, Inf. Sci., 36, 85–121.Environmental Systems Research Institute (2011), ArcGIS desktop help 10—How fuzzy overlay works. [Available at http://help.arcgis.com/
en/arcgisdesktop/10.0/help/index.html#/How_Fuzzy_Overlay_works/009z000000s0000000/, Accessed on 9/30/2011.]Fan, X., C. J. van Westen, O. Korup, T. Gorum, Q. Xu, F. Dai, and G. Wang (2012), Transient water and sediment storage of the decaying
landslide dams induced by the 2008 Wenchuan earthquake, China, Geomorphology, 171, 58–68.Frattini, P., G. Crosta, and A. Carrara (2010), Techniques for evaluating the performance of landslide susceptibility models, Eng. Geol.,
111(1–4), 62–72.Glade, T., and M. J. Crozier (2005), The nature of landslide hazard and impact, in Landslide Hazard and Risk, edited by T. Glade, M. Anderson,
and M. Crozier, pp. 43–74, Wiley, Chichester, U. K.Gorum, T., X. Fan, C. van Westen, R. Huang, Q. Xu, C. Tang, and G. Wang (2011), Distribution pattern of earthquake-induced landslides
triggered by the 12 May 2008 Wenchuan earthquake, Geomorphology, 133(3), 152–167.Gorum, T., O. Korup, C. J. van Westen, M. van der Meijde, C. Xu, and F. D. van der Meer (2014), Why so few? Landslides triggered by the 2002
Denali earthquake, Alaska, Quat. Sci. Rev., 95, 80–94.Guzzetti, F., A. Carrarra, M. Cardinali, and P. Reichenbach (1999), Landslide hazard evaluation: A review of current techniques and their
application in a multiscale study, Central Italy, Geomorphology, 31, 181–216.Harp, E., and R. Jibson (1996), Landslides triggered by the 1994 Northridge, California, earthquake, Bull. Seismol. Soc. Am., 86(1B), S319–S332.Harp, E. L., D. K. Keefer, H. P. Sato, and H. Yagi (2011), Landslide inventories-the essential part of seismic landslide hazard analyses, Eng. Geol.,
122, 9–21.Hauksson, E., L. Jones, and K. Hutton (1995), The 1994 Northridge earthquake sequence in California: Seismological and tectonic aspects,
J. Geophys. Res., 100(B7), 12,335–12,355, doi:10.1029/95JB00865.Havenith, H.-B., M. Vanini, D. Jongmans, and E. Faccioli (2003), Initiation of earthquake-induced slope failure: Influence of topographical and
other site specific amplification effects, J. Seismol., 7, 397–412.He, Y. P., and R. E. Beighley (2008), GIS-based regional landslide susceptibility mapping: A case study in southern California, Earth Surf.
Processes Landforms, 33(3), 380–393.
Journal of Geophysical Research: Earth Surface 10.1002/2014JF003224
KRITIKOS ET AL. ©2015. American Geophysical Union. All Rights Reserved. 17
AcknowledgmentsThe landslide inventory for Wenchuanearthquake was kindly provided to us byTolga Gorum of ITC, University of Twente,Netherlands. The landslide inventoryfor Chi-Chi earthquake was providedby Hongey Chen of National TaiwanUniversity, Taiwan. Northridge landslidedata set is publically available from theU.S. Geological Survey at: http://earth-quake.usgs.gov/earthquakes/shakemap/sc/shake/Northridge/#download. Wealso wish to thank Alex Densmore andthe three anonymous reviewers for theirconstructive review and insightfulcomments that helped us improve thismanuscript.
Hewitt, K., J. J. Clague, and J. F. Orwin (2008), Legacies of catastrophic rock slope failures in mountain landscapes, Earth Sci. Rev., 87(1), 1–38.Huabin, W., L. Gangjun, X. Weiya, and W. Gonghui (2005), GIS based landslide hazard assessment: An overview, Prog. Phys. Geogr., 29(4),
548–567.Jenness, J., B. Brost, and P. Beier (2013), Manual: Land facet corridor designer, p. 110.Jibson, R. W. (2007), Regression models for estimating coseismic landslide displacement, Eng. Geol., 91, 209–218.Jibson, R. W., E. L. Harp, and J. A. Michael (2000), A method for producing digital probabilistic seismic landslide hazard maps, Eng. Geol., 58,
271–289.Keefer, D. K. (1984), Landslides caused by earthquakes, Bull. Geol. Soc. Am., 95, 406–421.Kellogg, K. S. (2001), Tectonic controls on a large landslide complex: Williams Fork Mountains near Dillon, Colorado, Geomorphology, 41,
355–368.Khazai, B., and N. Sitar (2004), Evaluation of factors controlling earthquake-induced landslides caused by Chi-Chi earthquake and comparison
with the Northridge and Loma Prieta events, Eng. Geol., 71, 79–95.Korup, O. (2004), Geomorphic implications of fault zone weakening: Slope instability along the Alpine Fault, South Westland to Fiordland,
N. Z. J. Geol. Geophys., 47, 257–267.Kritikos, T., and T. Davies (2014), Assessment of rainfall-generated shallow landslide/debris-flow susceptibility and runout using a GIS-based
approach: Application to western Southern Alps of New Zealand, Landslides, doi:10.1007/s10346-014-0533-6.Larsen, I. J., and D. R. Montgomery (2012), Landslide erosion coupled to tectonics and river incision, Nat. Geosci., 5, 468–473.LeBrun, B., D. Hatzfeld, P. Y. Bard, and M. Bouchon (1999), Experimental study of the ground motion on a large scale topographic hill in
Kitherion (Greece), J. Seismol., 3, 1–15.Lee, C. T. (2013), Re-evaluation of factors controlling landslides triggered by the 1999 Chi-Chi earthquake, in Earthquake-Induced Landslides,
edited by K. Ugai, H. Yagi, and A. Wakai, pp. 213–224, Springer, Berlin.Lee, C. T. (2014), Statistical seismic landslide hazard analysis: An example from Taiwan, Eng. Geol., 182, Part B, 201–212.Lee, C. T., C. C. Huang, J. F. Lee, K. L. Pan, M. L. Lin, and J. J. Dong (2008), Statistical approach to earthquake-induced landslide susceptibility,
Eng. Geol., 100, 43–58.Lee, S., and B. Pradhan (2007), Landslide hazard mapping at Selangor, Malaysia using frequency ratio and logistic regression models,
Landslides, 4(1), 33–41.Lee, S., and T. Sambath (2006), Landslide susceptibility mapping in the Damrei Romel area, Cambodia using frequency ratio and logistic
regression models, Environ. Geol., 50(6), 847–855.Lee, S. J., Y. C. Chan, D. Komatitsch, B.-S. Huang, and J. Tromp (2009a), Effects of realistic surface topography on seismic groundmotion in the
Yangminshan region (Taiwan) based upon the Spectral-Element Method and LiDAR DTM, Bull. Seismol. Soc. Am., 99(2A), 681–693.Lee, S. J., D. Komatitsch, B.-S. Huang, and J. Tromp (2009b), Effects of topography on seismic-wave propagation: An example from northern
Taiwan, Bull. Seismol. Soc. Am., 99(1), 314–325, doi:10.1785/0120080020.Li, G., A. J. West, A. L. Densmore, Z. Jin, R. N. Parker, and R. G. Hilton (2014), Seismic mountain building: Landslides associated with the 2008
Wenchuan earthquake in the context of a generalized model for earthquake volume balance, Geochem. Geophys. Geosyst., 15, 833–844,doi:10.1002/2013GC005067.
Li, Y., et al. (2009), Geological background of Longmen Shan seismic belt and surface ruptures in Wenchuan earthquake, J. Eng. Geol., 17(1),3–18.
Lin, C., C. Shieh, B. Yuan, Y. Shieh, S. Liu, and S. Lee (2004), Impact of Chi-Chi earthquake on the occurrence of landslides and debris flows:Example from the Chenyulan River watershed, Nantou, Taiwan, Eng. Geol., 71(1), 49–61.
Liu-Zeng, J., et al. (2009), Coseismic ruptures of the 12 May 2008, Ms 8.0 Wenchuan earthquake, Sichuan: East–west crustal shortening onoblique, parallel thrusts along the eastern edge of Tibet, Earth Planet. Sci. Lett., 286, 355–370.
McColl, S. T., T. R. H. Davies, and M. J. McSaveney (2012), The effect of glaciation on the intensity of seismic ground motion, Earth Surf.Processes Landforms, 37, 1290–1301.
Meunier, P., N. Hovius, and A. J. Haines (2007), Regional patterns of earthquake-triggered landslides and their relation to ground motion,Geophys. Res. Lett., 34, L20408, doi:10.1029/2007GL031337.
Meunier, P., N. Hovius, and A. J. Haines (2008), Topographic site effects and the location of earthquake induced landslides, Eng. Geol., 275,221–232.
Miles, S. B., and D. K. Keefer (2000), Evaluation of seismic slope-performance models using a regional case study, Environ. Eng. Geosci., 6, 25–39.Miles, S. B., and D. K. Keefer (2007), Comprehensive areal model of earthquake-induced landslides: Technical specification and user
guide, U.S. Geol. Surv. Open-File Rep., 2007–1072, 69 pp.Miles, S. B., and D. K. Keefer (2009a), Evaluation of CAMEL—Comprehensive areal model of earthquake-induced landslides, Eng. Geol., 104,
1–15.Miles, S. B., and D. K. Keefer (2009b), Toward a comprehensive areal model of earthquakeinduced landslides, Am. Soc. Civ. Eng. Nat. Hazards
Rev., 10, 19–28.Naranjo, J. L., C. J. VanWesten, and R. Soeters (1994), Evaluating the use of training areas in bivariate statistical landslide hazard analysis:
A case study in Colombia, ITC J., 1994–3, 292–300.Newmark, N. M. (1965), Effects of earthquakes on dams and embankments, Geotechnique, 15, 139–159.Parise, M., and R. W. Jibson (2000), A seismic landslide susceptibility rating of geologic units based on analysis of characteristics of landslides
triggered by the January 17, 1994, Northridge, California, earthquake, Eng. Geol., 58, 251–270.Parker, R., A. Densmore, N. Rosser, M. De Michele, Y. Li, R. Huang, S. Whadcoat, and D. Petley (2011), Mass wasting triggered by the 2008
Wenchuan earthquake is greater than orogenic growth, Nat. Geosci., 4(7), 449–452.Petley, D. (2012), Global patterns of loss of life from landslides, Geology, 40(10), 927–930.Rathje, E. M., and G. Antonakos (2011), A unified model for predicting earthquake-induced sliding displacements of rigid and flexible slopes,
Eng. Geol., 122, 51–60, doi:10.1016/j.enggeo.2010.12.004.Rathje, E. M., and G. Saygili (2009), Probabilistic assessment of earthquake-induced sliding displacements of natural slopes, Bull. N. Z. Soc.
Earthquake Eng., 42, 18–27.Remondo, J., A. González-Díez, J. R. Diaz De Terán, and A. Cendrero (2003a), Landslide susceptibility models utilising spatial data analysis
techniques. A case study from the lower Deba Valley, Guipúzcoa (Spain), Nat. Hazards, 30(3), 267–279.Remondo, J., A. Gonzalez, J. R. Diaz De Terán, A. Cendrero, A. Fabbri, and C.-J. F. Chung (2003b), Validation of landslide susceptibility maps;
Examples and applications from a case study in northern Spain, Nat. Hazards, 30(3), 437–449.Robinson, T. R., and T. R. H. Davies (2013), Review article: Potential geomorphic consequences of a future great (Mw = 8.0+), Alpine Fault
earthquake, South Island, New Zealand, Nat. Hazards Earth Syst.Sci., 13(9), 2279–2299.
Journal of Geophysical Research: Earth Surface 10.1002/2014JF003224
KRITIKOS ET AL. ©2015. American Geophysical Union. All Rights Reserved. 18
Ross, T. (1995), Fuzzy Logic With Engineering Applications, McGraw-Hill, New York.Saha, A. K., R. P. Gupta, and M. K. Arora (2002), GIS-based landslide hazard zonation in the Bhagirathi (Ganga) Valley, Himalayas, Int. J. Remote
Sens., 23(2), 357–369.Saygili, G., and E. M. Rathje (2008), Empirical predictive models for earthquake-induced sliding displacements of slopes, J. Geotech.
Geoenviron. Eng., ASCE, 134(6), 790–803.Shin, T., and T. Teng (2001), An overview of the 1999 Chi-Chi, Taiwan, earthquake, Bull. Seismol. Soc. Am., 91(5), 895–913.Snyder, N. P., K. X. Whipple, G. E. Tucker, and D. J. Merritts (2000), Landscape response to tectonic forcing: Digital elevation model analysis of
stream profiles in the Mendocino triple junction region, northern California, Geol. Soc. Am. Bull., 112, 1250–1263.Soeters, R., and C. J. Van Westen (1996), Slope stability: Recognition, analysis and zonation, in Landslides: Investigation and Mitigation,
Transportation Research Board, National Research Council Special Report 247, edited by A. K. Turner and R. L. Shuster, pp. 129–177.Spudich, P., M. Hellweg, and W. H. K. Lee (1996), Directional topographic site response at Tarzana observed in aftershocks of the 1994
Northridge, California, earthquake: Implications for mainshock motions, Bull. Seismol. Soc. Am., 86, 193–208.Stewart, J. P., T. F. Blake, and R. A. Hollingsworth (2003), A screen analysis procedure for seismic slope stability, Earthquake Spectra, 19,
697–712.Terzhagi, K. (1950), Mechanism of landslides, in Application of Geology to Engineering Practice (Berkey Volume), edited by S. Paige, pp. 83–123,
Geol. Soc. of Am., New York.Van Westen, C. J., N. Rengers, M. T. J. Terlien, and R. Soeters (1997), Prediction of the occurrence of slope instability phenomena through
GIS-based hazard zonation, Geol. Rundsch., 86, 404–414.Van Westen, C. J., N. Rengers, and R. Soeters (2003), Use of geomorphological information in indirect landslide susceptibility assessment,
Nat. Hazards, 30(3), 399–419.VanWesten, C. J., T. W. J. Van Asch, and R. Soeters (2006), Landslide hazard and risk zonation: Why is it still so difficult?, Bull. Eng. Geol. Environ.,
65, 167–184.Varnes, D. J., and IAEG Commission on Landslides and other Mass–Movements (1984), Landslide Hazard Zonation: A Review of Principles and
Practice, p. 63, UNESCO Press, Paris.Wald, D., and T. Heaton (1994), A dislocation model of the 1994 Northridge, California, earthquake determined from strong ground motions,
U.S. Geol. Surv. Open File Rep., 94–278.Wald, D. J., and T. I. Allen (2007), Topographic slope as a proxy for seismic site conditions and amplification, Bull. Seismol. Soc. Am., 97(5),
1379–1395, doi:10.1785/0120060267.Wang, F., Q. Cheng, L. Highland, M. Miyajima, H. Wang, and C. Yan (2009), Preliminary investigation of some large landslides triggered by the
2008 Wenchuan earthquake, Sichuan Province, China, Landslides, 6(1), 47–54.Wang, W. N., H. Nakamura, and S. Tsuchiya (2002), Distributions of landslides triggered by the Chi-Chi Earthquake in central Taiwan on
September 21, 1999, Landslides, 38, 1826.Warr, L. N., and S. Cox (2001), Clay mineral transformations and weakening mechanisms along the Alpine Fault, New Zealand, in The Nature
and Tectonic Significance of Fault Zone Weakening, Geol. Soc. London Spec. Publ., vol. 186, edited by R. E. Holdsworth et al., pp. 85–101.Wasowski, J., D. K. Keefer, and C.-T. Lee (2011), Toward the next generation of research on earthquake-induced landslides: Current issues and
future challenges, Eng. Geol., 122, 1–8, doi:10.1016/j.enggeo.2011.06.001.Weiss, A. D. (2001), Topographic position and landforms analysis. Poster presentation, ESRI User Conference, San Diego, Calif.Whipple, K. X. (2004), Bedrock rivers and the geomorphology of active orogens, Annu. Rev. Earth Planet. Sci., 32, 85–151.Xu, C. (2014), Preparation of earthquake-triggered landslide inventory maps using remote sensing and GIS technologies: Principles and case
studies, Geosci. Frontiers, doi:10.1016/j.gsf.2014.03.004.Xu, X., X. Wen, G. Yu, G. Chen, Y. Klinger, J. Hubbard, and J. Shaw (2009), Coseismic reverse-and oblique-slip surface faulting generated by the
2008 Mw 7.9, Wenchuan earthquake, China, Geology, 37(6), 515–518.Yilmaz, I. (2009), Landslide susceptibility mapping using frequency ratio, logistic regression, artificial neural networks and their comparison:
A case study from Kat landslides (Tokat—Turkey), Comput. Geosci., 35(6), 1125–1138.Yu, S., H. Chen, and L. Kuo (1997), Velocity field of GPS stations in the Taiwan area, Tectonophysics, 274(1), 41–59.Zadeh, L. A. (1965), Fuzzy sets, Inf. Control, 8, 338–353.Zimmermann, H. J. (1991), Fuzzy Set Theory and Its Applications, p. 399, Kluwer Acad., Boston.
Journal of Geophysical Research: Earth Surface 10.1002/2014JF003224
KRITIKOS ET AL. ©2015. American Geophysical Union. All Rights Reserved. 19