Embed Size (px)
Citation preview
ORIGINAL PAPER
Study of regional monsoonal effects on landslide hazardzonation in Cameron Highlands, Malaysia
Abd Nasir Matori & Abdul Basith &
Indra Sati Hamonangan Harahap
Received: 18 August 2010 /Accepted: 21 February 2011# Saudi Society for Geosciences 2011
Abstract In general, landslides in Malaysia mostly oc-curred during northeast and southwest periods, two mon-soonal systems that bring heavy rain. As the consequence,most landslide occurrences were induced by rainfall. Thispaper reports the effect of monsoonal-related geospatialdata in landslide hazard modeling in Cameron Highlands,Malaysia, using Geographic Information System (GIS).Land surface temperature (LST) data was selected as themonsoonal rainfall footprints on the land surface. Four LSTmaps were derived from Landsat 7 thermal band acquired atpeaks of dry and rainy seasons in 2001. The landslidefactors chosen from topography map were slope, slopeaspect, curvature, elevation, land use, proximity to road,and river/lake; while from geology map were lithology andproximity to lineament. Landslide characteristics wereextracted by crossing between the landslide sites ofCameron Highlands and landslide factors. Using which,the weighting system was derived. Each landslide factorswere divided into five subcategories. The highest weightvalues were assigned to those having the highest number oflandslide occurrences. Weighted overlay was used as GISoperator to generate landslide hazard maps. GIS analysiswas performed in two modes: (1) static mode, using allfactors except LST data; (2) dynamic mode, using allfactors including multi-temporal LST data. The effect ofaddition of LST maps was evaluated. The final landslidehazard maps were divided into five categories: very high
risk, high risk, moderate, low risk, and very low risk. Fromverification process using landslide map, the landslidemodel can predict back about 13–16% very high risk sitesand 70–93% of very high risk and high risk combinedtogether. It was observed however that inclusion of LSTmaps does not necessarily increase the accuracy of thelandslide model to predict landslide sites.
Keywords Monsoonal effect . Land surface temperatures .
Landslide . GIS . Remote sensing . Cameron highlands .
Malaysia
Introduction
Landslide has been the second natural disaster threat forMalaysia after flood. Besides damaging the infrastructures,landslides cause loss of lives, damage the environment, andinterrupt the economic activity. Some examples of majordamaging landslides took place at Pos Dipang, Bukit AntarBangsa, and Cameron Highlands. At Pos Dipang, debrisflow caused loss of 44 lives. At Bukit Antar Bangsa,landslide damaged the settlements and took casualties.Besides causing loss of lives, landslides in CameronHighlands also damaged the highway and disturbedeconomic activity by delaying the delivery of agricultureproducts. From 1973–2007, the total economic loss due tolandslides was estimated about US $1 billion. Most oflandslide events in this country occurred during rainyseasons or after prolonged heavy rainfall. This can beunderstood since this country, due to its geographicalposition, experiences two maritime monsoons namelynortheast and southwest monsoons. The first monsoon thatfalls between November and January brings heavier rainfallpouring Malaysia than the second one that falls between
A. N. Matori (*) :A. Basith : I. S. H. HarahapDepartment of Civil Engineering,Universiti Teknologi PETRONAS,Bandar Seri Iskandar,Tronoh 31750, Malaysiae-mail: [email protected]
A. Basithe-mail: [email protected]
Arab J GeosciDOI 10.1007/s12517-011-0309-4
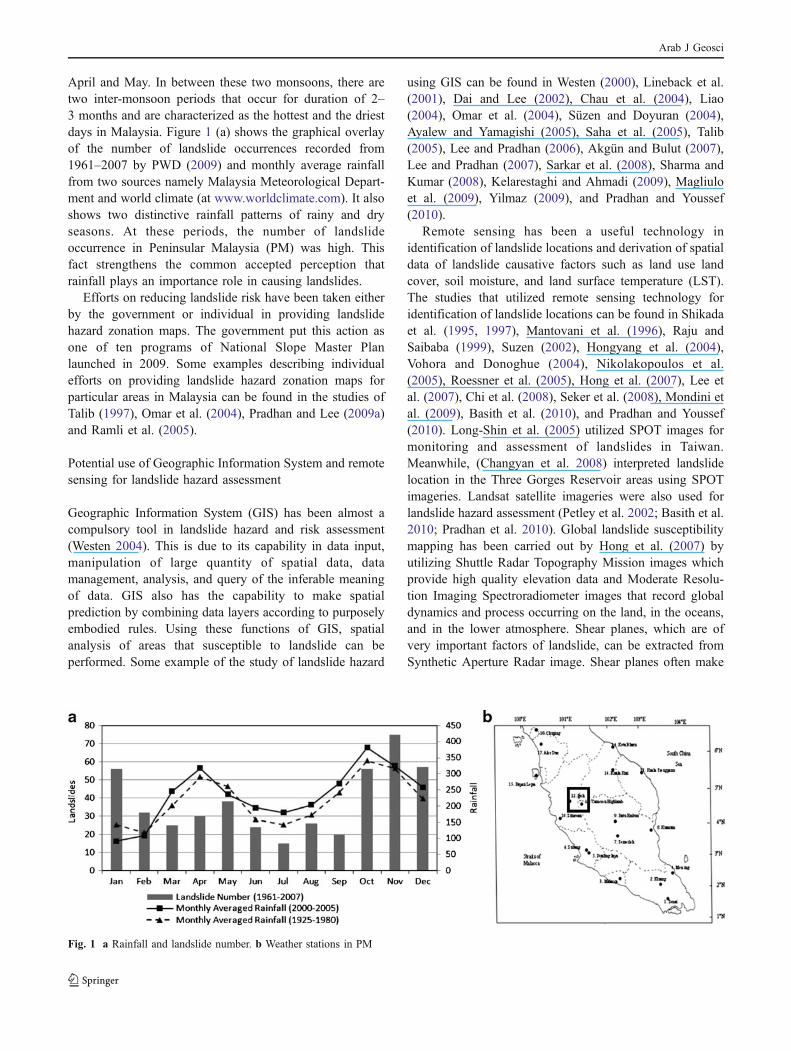
April and May. In between these two monsoons, there aretwo inter-monsoon periods that occur for duration of 2–3 months and are characterized as the hottest and the driestdays in Malaysia. Figure 1 (a) shows the graphical overlayof the number of landslide occurrences recorded from1961–2007 by PWD (2009) and monthly average rainfallfrom two sources namely Malaysia Meteorological Depart-ment and world climate (at www.worldclimate.com). It alsoshows two distinctive rainfall patterns of rainy and dryseasons. At these periods, the number of landslideoccurrence in Peninsular Malaysia (PM) was high. Thisfact strengthens the common accepted perception thatrainfall plays an importance role in causing landslides.
Efforts on reducing landslide risk have been taken eitherby the government or individual in providing landslidehazard zonation maps. The government put this action asone of ten programs of National Slope Master Planlaunched in 2009. Some examples describing individualefforts on providing landslide hazard zonation maps forparticular areas in Malaysia can be found in the studies ofTalib (1997), Omar et al. (2004), Pradhan and Lee (2009a)and Ramli et al. (2005).
Potential use of Geographic Information System and remotesensing for landslide hazard assessment
Geographic Information System (GIS) has been almost acompulsory tool in landslide hazard and risk assessment(Westen 2004). This is due to its capability in data input,manipulation of large quantity of spatial data, datamanagement, analysis, and query of the inferable meaningof data. GIS also has the capability to make spatialprediction by combining data layers according to purposelyembodied rules. Using these functions of GIS, spatialanalysis of areas that susceptible to landslide can beperformed. Some example of the study of landslide hazard
using GIS can be found in Westen (2000), Lineback et al.(2001), Dai and Lee (2002), Chau et al. (2004), Liao(2004), Omar et al. (2004), Süzen and Doyuran (2004),Ayalew and Yamagishi (2005), Saha et al. (2005), Talib(2005), Lee and Pradhan (2006), Akgün and Bulut (2007),Lee and Pradhan (2007), Sarkar et al. (2008), Sharma andKumar (2008), Kelarestaghi and Ahmadi (2009), Magliuloet al. (2009), Yilmaz (2009), and Pradhan and Youssef(2010).
Remote sensing has been a useful technology inidentification of landslide locations and derivation of spatialdata of landslide causative factors such as land use landcover, soil moisture, and land surface temperature (LST).The studies that utilized remote sensing technology foridentification of landslide locations can be found in Shikadaet al. (1995, 1997), Mantovani et al. (1996), Raju andSaibaba (1999), Suzen (2002), Hongyang et al. (2004),Vohora and Donoghue (2004), Nikolakopoulos et al.(2005), Roessner et al. (2005), Hong et al. (2007), Lee etal. (2007), Chi et al. (2008), Seker et al. (2008), Mondini etal. (2009), Basith et al. (2010), and Pradhan and Youssef(2010). Long-Shin et al. (2005) utilized SPOT images formonitoring and assessment of landslides in Taiwan.Meanwhile, (Changyan et al. 2008) interpreted landslidelocation in the Three Gorges Reservoir areas using SPOTimageries. Landsat satellite imageries were also used forlandslide hazard assessment (Petley et al. 2002; Basith et al.2010; Pradhan et al. 2010). Global landslide susceptibilitymapping has been carried out by Hong et al. (2007) byutilizing Shuttle Radar Topography Mission images whichprovide high quality elevation data and Moderate Resolu-tion Imaging Spectroradiometer images that record globaldynamics and process occurring on the land, in the oceans,and in the lower atmosphere. Shear planes, which are ofvery important factors of landslide, can be extracted fromSynthetic Aperture Radar image. Shear planes often make
Fig. 1 a Rainfall and landslide number. b Weather stations in PM
Arab J Geosci
rocks lose bulk property, display unbalance feature, andexpedite the development of landslide (Huosheng and Hui1999). From thermal band of Landsat image, LST can beextracted (Markham and Barker 1986; Suga et al. 2000; Qinet al. 2001; Huang et al. 2002; Li et al. 2004; Lau et al.2006; Xing et al. 2006).
Landslide hazard assessment approachesand multi-temporal factors issue
In landslide hazard assessment, there is no single methodproven to be the superior one in every area and for all typesof landslides in the study area. Selection of methodsappears less important than the availability, quality, resolu-tion, and abundance of input data as suggested by Guzzetti(2002). Westen et al. (2006) recommended to begin withcreating a landslide inventory map before constructing anylandslide hazard zonation map. Constructing such a maprequires two different aspects, namely (1) assessment ofsusceptibility of terrain for slope failure and (2) determina-tion of the probability that a triggering factor occurs. Theimportant steps to construct landslide hazard zonation mapare (Westen 2000; Westen et al. 2006):
& Landslide distribution mapping (inventory), differenti-ating according type, activity, dimension etc.
& Mapping the most relevant terrain parameters related tothe occurrence of landslides
& Assignment of weights to the individual causative factors
There are three approaches for constructing landslidehazard zonation map using GIS. Each approach is suitablefor a particular scale or coverage as follows:
& Heuristic (qualitative). This approach is particularly suitedfor small-scale regional surveys (1:100,000 to 1:250,000).
& Statistical (quantitative) approach for medium-scalesurveys (1:25,000 to 1:50,000)
& Deterministic (quantitative) approach for detailed scalesurveys (1:2,000–1:10,000)
Heuristic approach applies direct relationship betweenthe occurrence of slope failure and the causative terrainparameters. An a priori knowledge on the cause of landslideis essential in the decision making, and therefore, it reliesheavily on the professional experience of the expert. Thedrawback of this method is the subjectivity in the decisionmaking. GIS is very suitable for statistical approach whichis considered as indirect landslide susceptibility mapping.All possible causative terrain parameters are entered in GISand crossed for their analysis with a landslide inventorymap. The quantification of landslide risk is often a difficulttask for a large area. In practice, simplified qualitativeprocedures are often used. The disadvantage of this methodis the collection of data over a large area regarding
landslide distribution and factor maps that is considerablyexpensive. Deterministic approach results in safety factorthat can be used directly by the engineers. The implemen-tation of this approach will be successful if the failure andtriggering mechanism of different landslide type arecorrectly identified. This approach requires a large amountof input data derived from laboratory tests and fieldmeasurements that are laborious and costly (Westen 2000).
In constructing landslide hazard zonation map, research-ers mostly incorporate landslide causative factors that canbe called as “static factors,” such as slope, slope aspect,soil, lithology, and land use, the factors which are assumedto be constant over the period of study. Examples of suchinvestigations can be found in Anbalagan (1992) and Sahaet al. (2005) for landslide cases in India; Peloquin andGwyn (2000) for the case in Bolivia; Ayalew andYamagishi (2005) for the cases in Japan; Hervas et al.(2003) for the cases in Italy; and Lee and Pradhan (2006,2007), Talib (1997), Omar et al. (2004), and Pradhan andLee (2009b) for the cases in Malaysia. In response toregional monsoonal effect on causative factors, it isimportant to include multi-temporal causative factors(“dynamic factors”) such as multi-temporal rainfall maps,pore pressure maps, ground water table level maps, etc. thatare affected by monsoonal systems in the landslide hazardzonation. The possible expansion or contraction of thehazard zones can be identified.
Attempts to introduce the time component into landslidehazard models were implemented by researchers such asAgostoni et al. (2000), Guzzetti (2002), and Guzzetti et al.(2002) which was intended to improve the accuracy of thelandslide hazard models. Asch and Steijn (1991) and Beekand Asch (2004) added that the actual landslide hazard isintimately related to the temporal frequency of triggeringevents. The temporal component is important for assessingthe landslide hazard under environmental changes. Mean-while, Asch et al. (1999) emphasized the importance ofinvolving the temporal activity/variation of causative factorfor investigation of rainfall-induced landslide.
The number of publications on landslide hazardzonation incorporating multi-temporal causative factorsis quite few. This may be due to the unavailability ofsuch data especially for larger areas such as medium andregional scope due to the heterogeneity of the subsurfaceconditions as reported by Terlien (1996). Providing datafor such area would be laborious and costly. In general,researchers implemented these factors only for a local and/or laboratory scope.
For larger areas, rainfall data was frequently added as thecausative factor such as the landslide hazard assessmentcarried out by Chau et al. (2004), Lee and Pradhan (2007),and Pradhan and Youssef (2010). Wieczorek et al. (2001)used National Weather Service WSR-88D Doppler radar to
Arab J Geosci
provide rainfall data with 1 km resolution for analysis ofuse of landslide hazard. The estimated rainfall data usingthis system either overestimated or underestimated theground truth rainfall data. On the other hand, obtaininghigh spatial resolution of ground truth rainfall data for largeareas, e.g., medium scale (1:25,000 to 1:50,000) would bedifficult in term of the availability of the data as notified bySharma and Shakya (2008). This is the case of weatherstations availability in PM as shown in Fig. 1 (b).
To overcome the lack of required data as the represen-tation of monsoonal effect, i.e., monsoonal rainfall onterrain, environment factors such as LST, vegetation index,and soil moisture are used to assess landslide hazard. Someexamples of investigations of landslide hazard using thesefactors can be found in Shikada et al. (1995), Lau (2004),Lau et al. (2006), Seker et al. (2008), and Lineback et al.(2001). The number of studies on the relation betweenlandslide and LST were limited as reported by Lau et al.(2006). The author highlighted the drawbacks of thisinvestigation if this approach was applied to heteroge-neous regions and hilly terrain and suggested not to useLST alone for prediction of landslide hazard zones.Another factor that responds directly to rainfall is groundwater table. Alkhaier et al. (2009) found that shallowground water affect skin temperature of land surfacedirectly by its distinctive thermal properties in the soilprofile. Furuya et al. (2006) investigated the relationbetween LST, ground water veins, and slope failures.The author found that the actual slope failures occurredaround the shallow ground water veins with the temper-atures were slightly lower than those of the surroundings.Zones with veins of ground water rising from the deep soillayers had LST lower than the average temperature in thestudy area, Shikoku Island, southern Japan.
For medium scale, it is difficult to provide high spatialLST covering that scale using conventional methods. As an
alternative option, Landsat 7 Enhanced Thematic MapperPlus (ETM+) satellite mission offers the opportunity toderive LST maps from thermal infrared band (band 6).Some examples of the relevant investigations can be foundin Markham and Barker (1986), Suga et al. (2000), Qin etal. (2001), Li et al. (2004), Yang and Wang (2002), Alsultanet al. (2005), and Xing et al. (2006).
Previous works of landslide hazard studies in CameronHighlands
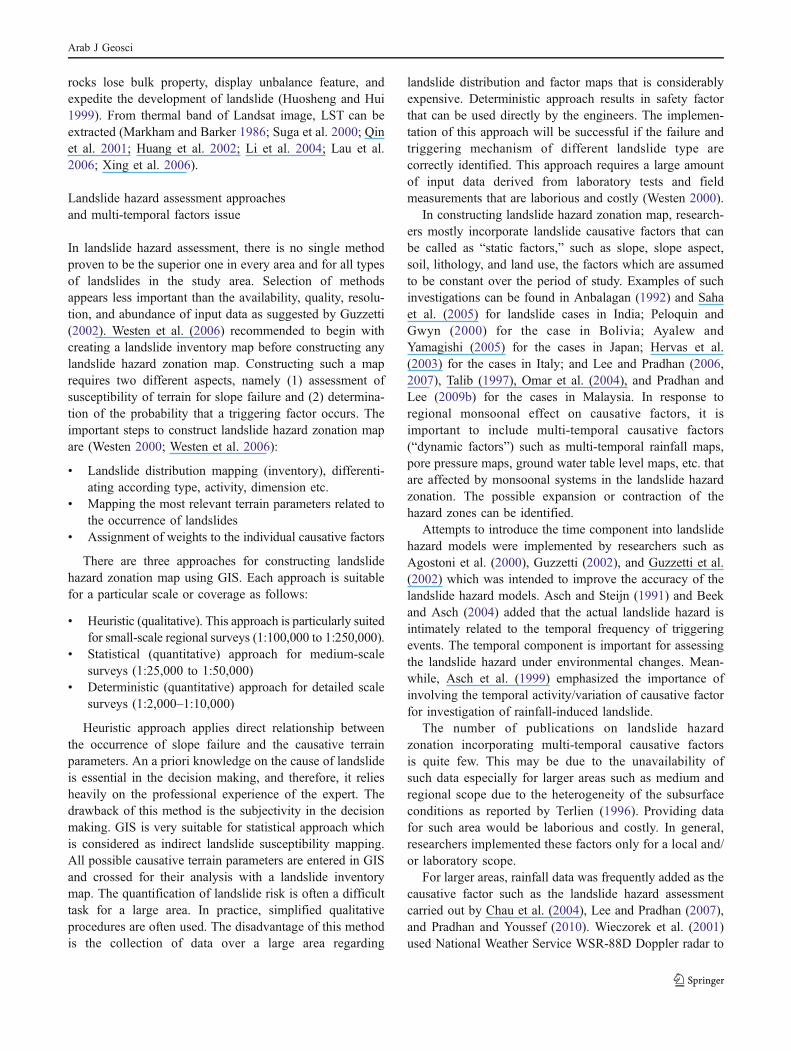
Field investigation showed that landslides in CameronHighlands occurred along the road where surroundingslopes are cut or modified. Only a few landslides occur ata distance from the road, but it still took place on modifiedslope. As an active landslide site, Cameron Highlands isone of interesting areas to study in Malaysia (Fig. 2). Thearea is bounded by the coordinates: 101° 13′ 50″ to 101°30′ 20″ for longitudes and 4° 20′ to 4° 36′ 30″ forlatitudes. Cameron Highlands is located on the mainrange of Peninsular Malaysia. It lies between 1,070 and1,830 m above mean sea level. The total land area is71,218 ha. The area is bordered by Kelantan on thenorth, by Perak on the west, and the Pahang’s District ofRaub on the south and east.
The temperatures are mild, with an average daytimereading of 24°C and an average nighttime reading of 14°C.The average annual rainfall is 2,660 mm with peaks in themonths of May and October. The climate is thus veryconducive to a wide range of subtropical crops. However,the land is steeply sloping with 66% of the slopes havinggradients of more than 20°. About 86% (60,000 ha) of thearea is forested, 8% (5,500 ha) under agriculture, 4%(2,750 ha) occupied by settlements, and the remainder usedfor recreation and other activities. Most of the presentagricultural activities lead to serious soil erosion, producing
Fig. 2 The study area, CameronHighlands
Arab J Geosci
large amounts of sediments. Besides landslide is anotherpotential natural disaster that threatens this economicallypotential area.
Landslide hazard zonation map of this area in particulararound the road stretching from Pos Slim to CameronHighlands has been produced by Omar et al. (2004). Theauthor used a 30-m resolution of Landsat TM5 satelliteimage to derive land use land cover map; Digital ElevationModel (DEM) extracted from 1:50,000 topographic maps toderive slope risk map, aspect risk map, and height risk map.The final landslide hazard map was constructed byoverlaying all contributing factors. There was not validationof the resulted landslide hazard map. In fact, it is importantto validate GIS-based landslide hazard zonation model sothat the accuracy of the model in predicting possiblelandslide areas can be measured. Another important notewas that weighting system for all causative factors wasadopted from other author’s work and out of the study area.Since landslide events are usually typical for a particulararea, there is a need to have a local weighting system.Ramli et al. (2005) has conducted landslide hazardinvestigation in Tanah Rata, part of Cameron Highlandsdistrict, using a weighting system adopted from (Anbalagan1992). A little modification was made to adapt with localnatural behavior. Barren land, open land, cut/modified slopewere not incorporated in GIS analysis. Meanwhile, Talib(1997) applied information value method to study slopeinstability and hazard zonation in Cameron Highlands. Theresult showed that very high risk areas mostly located onsloping areas near the roads and an urban area in TanahRata. There was no report regarding the validation of thehazard maps. The latest investigation was carried out byPradhan and Lee (2009b) who applied neural network in
predicting landslide susceptibility areas. The author in-volved average rainfall data from 1981 to 2007. Afterpassing the validation process using landslide inventorymap, the landslide susceptibility model showed 83%accuracy. All mentioned literatures did not incorporatetemporal variation of causative factors such as LST,vegetation index, and soil moisture as the response toregional monsoon system.
Having reviewed relevant literatures mentioned above,there is an opportunity and a necessity to carry out theinvestigation of landslide hazard in Cameron Highlandsthat accommodates multi-temporal variation of causativefactors as response to the regional monsoon system. Theavailability of multi-temporal LST enables construction ofmulti-temporal landslide hazard maps.
Hence, the objectives of this research are:
1. To construct GIS-based landslide hazard zonation mapswith and without considering multi-temporal LST mapsas the manifestation of the regional monsoonal effects
2. To evaluate the significant contribution of these factorsto the accuracy of the landslide hazard maps
Data and methodology
Data
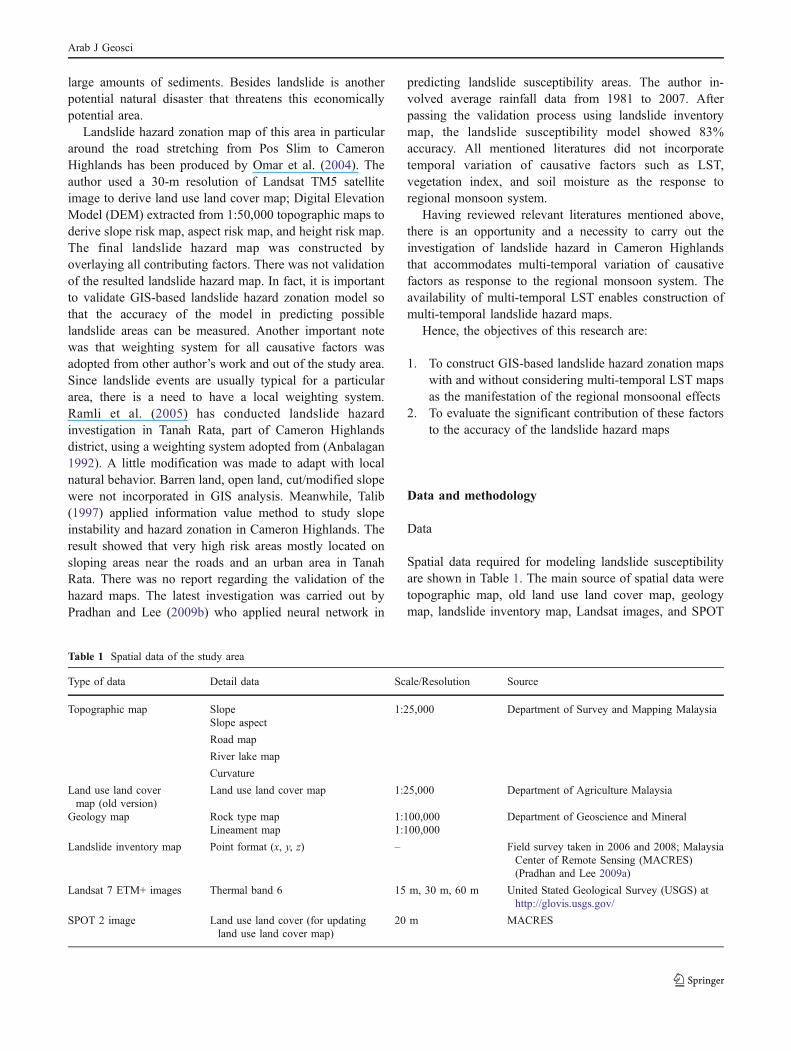
Spatial data required for modeling landslide susceptibilityare shown in Table 1. The main source of spatial data weretopographic map, old land use land cover map, geologymap, landslide inventory map, Landsat images, and SPOT
Table 1 Spatial data of the study area
Type of data Detail data Scale/Resolution Source
Topographic map Slope 1:25,000 Department of Survey and Mapping MalaysiaSlope aspect
Road map
River lake map
Curvature
Land use land covermap (old version)
Land use land cover map 1:25,000 Department of Agriculture Malaysia
Geology map Rock type map 1:100,000 Department of Geoscience and MineralLineament map 1:100,000
Landslide inventory map Point format (x, y, z) – Field survey taken in 2006 and 2008; MalaysiaCenter of Remote Sensing (MACRES)(Pradhan and Lee 2009a)
Landsat 7 ETM+ images Thermal band 6 15 m, 30 m, 60 m United Stated Geological Survey (USGS) athttp://glovis.usgs.gov/
SPOT 2 image Land use land cover (for updatingland use land cover map)
20 m MACRES
Arab J Geosci
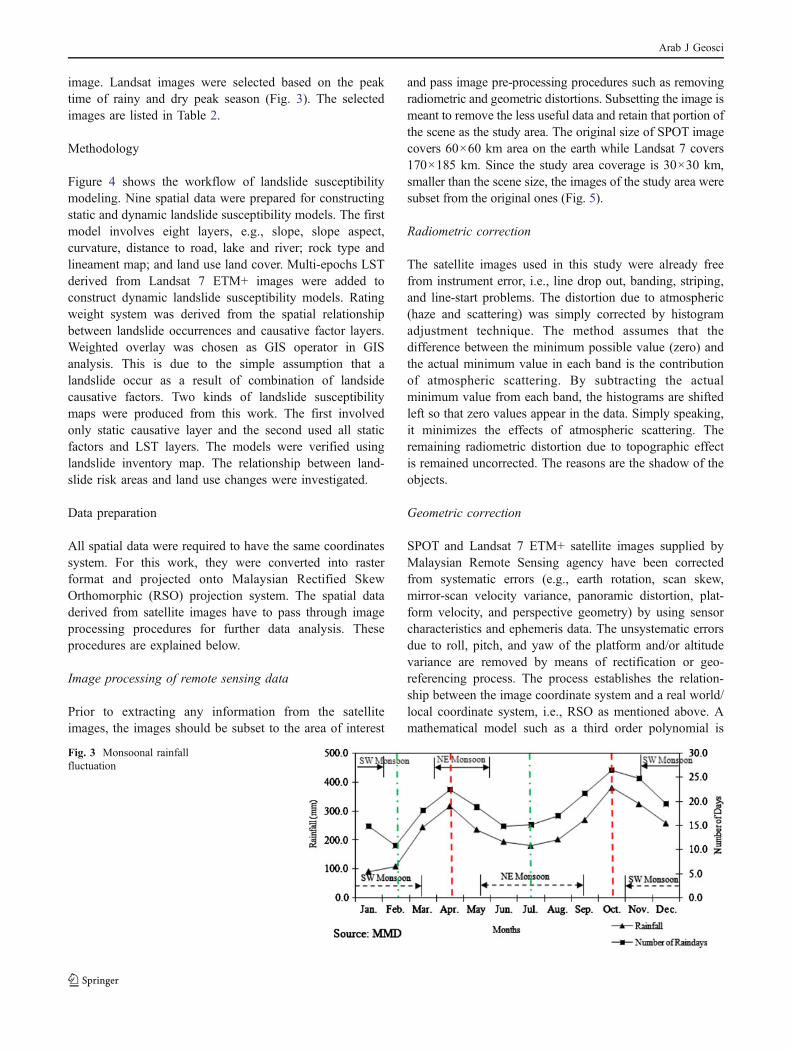
image. Landsat images were selected based on the peaktime of rainy and dry peak season (Fig. 3). The selectedimages are listed in Table 2.
Methodology
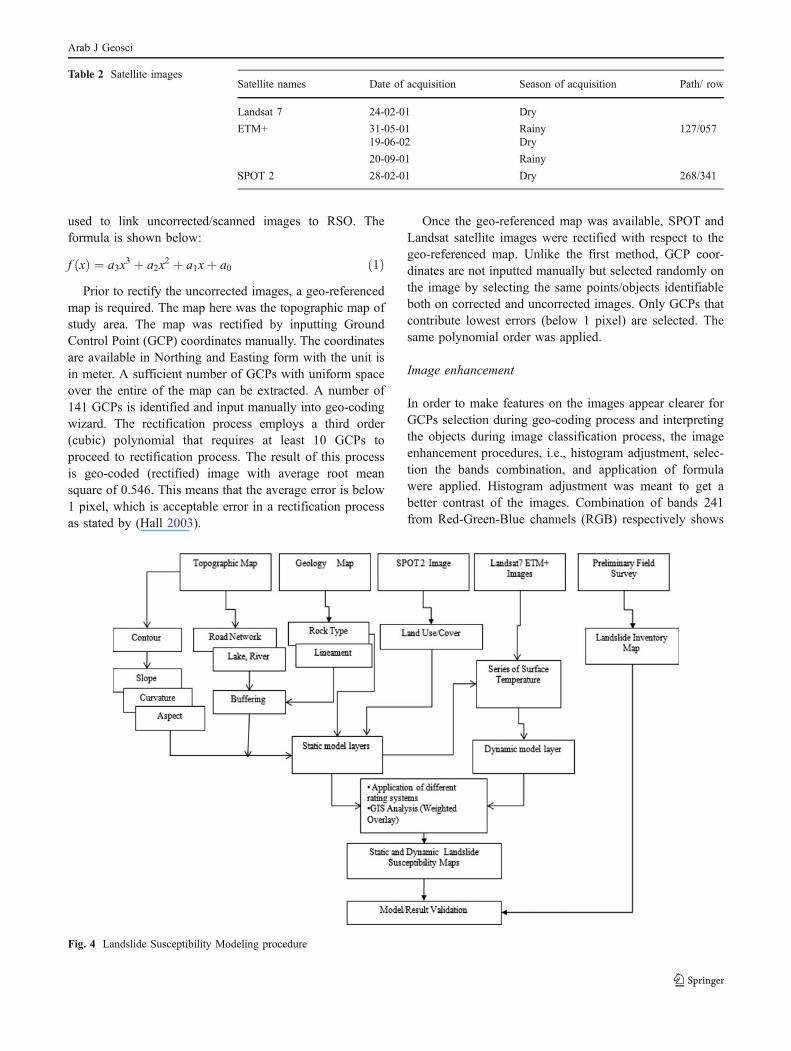
Figure 4 shows the workflow of landslide susceptibilitymodeling. Nine spatial data were prepared for constructingstatic and dynamic landslide susceptibility models. The firstmodel involves eight layers, e.g., slope, slope aspect,curvature, distance to road, lake and river; rock type andlineament map; and land use land cover. Multi-epochs LSTderived from Landsat 7 ETM+ images were added toconstruct dynamic landslide susceptibility models. Ratingweight system was derived from the spatial relationshipbetween landslide occurrences and causative factor layers.Weighted overlay was chosen as GIS operator in GISanalysis. This is due to the simple assumption that alandslide occur as a result of combination of landsidecausative factors. Two kinds of landslide susceptibilitymaps were produced from this work. The first involvedonly static causative layer and the second used all staticfactors and LST layers. The models were verified usinglandslide inventory map. The relationship between land-slide risk areas and land use changes were investigated.
Data preparation
All spatial data were required to have the same coordinatessystem. For this work, they were converted into rasterformat and projected onto Malaysian Rectified SkewOrthomorphic (RSO) projection system. The spatial dataderived from satellite images have to pass through imageprocessing procedures for further data analysis. Theseprocedures are explained below.
Image processing of remote sensing data
Prior to extracting any information from the satelliteimages, the images should be subset to the area of interest
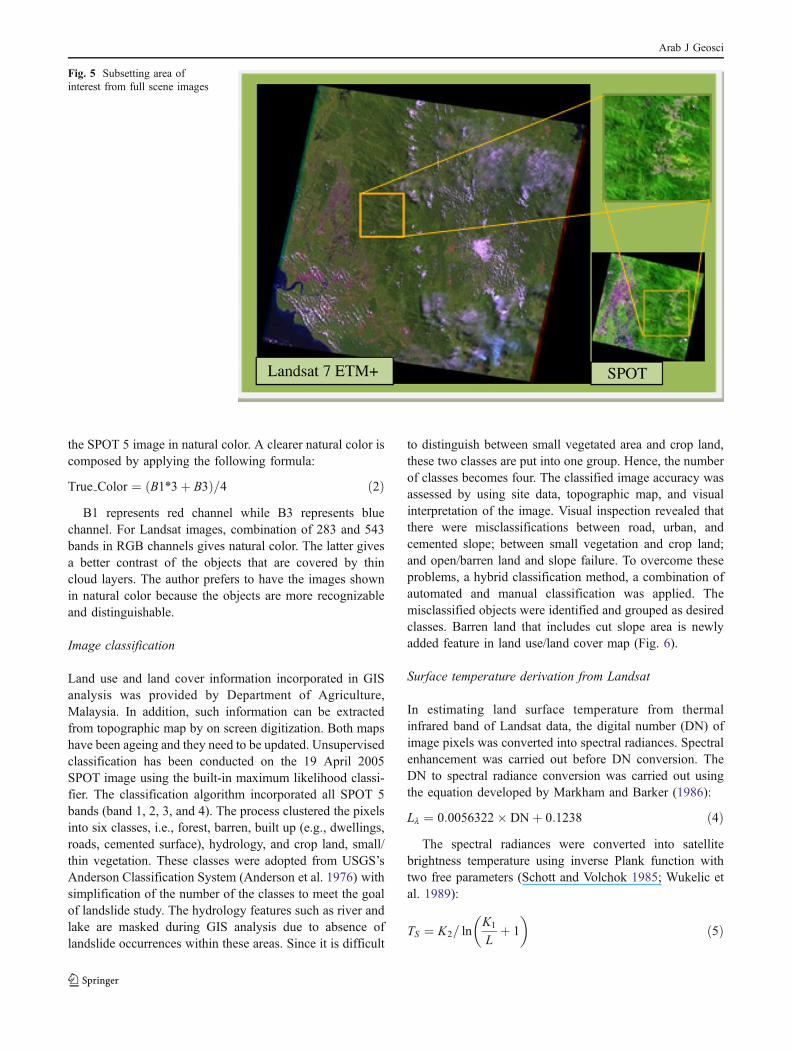
and pass image pre-processing procedures such as removingradiometric and geometric distortions. Subsetting the image ismeant to remove the less useful data and retain that portion ofthe scene as the study area. The original size of SPOT imagecovers 60×60 km area on the earth while Landsat 7 covers170×185 km. Since the study area coverage is 30×30 km,smaller than the scene size, the images of the study area weresubset from the original ones (Fig. 5).
Radiometric correction
The satellite images used in this study were already freefrom instrument error, i.e., line drop out, banding, striping,and line-start problems. The distortion due to atmospheric(haze and scattering) was simply corrected by histogramadjustment technique. The method assumes that thedifference between the minimum possible value (zero) andthe actual minimum value in each band is the contributionof atmospheric scattering. By subtracting the actualminimum value from each band, the histograms are shiftedleft so that zero values appear in the data. Simply speaking,it minimizes the effects of atmospheric scattering. Theremaining radiometric distortion due to topographic effectis remained uncorrected. The reasons are the shadow of theobjects.
Geometric correction
SPOT and Landsat 7 ETM+ satellite images supplied byMalaysian Remote Sensing agency have been correctedfrom systematic errors (e.g., earth rotation, scan skew,mirror-scan velocity variance, panoramic distortion, plat-form velocity, and perspective geometry) by using sensorcharacteristics and ephemeris data. The unsystematic errorsdue to roll, pitch, and yaw of the platform and/or altitudevariance are removed by means of rectification or geo-referencing process. The process establishes the relation-ship between the image coordinate system and a real world/local coordinate system, i.e., RSO as mentioned above. Amathematical model such as a third order polynomial is
Fig. 3 Monsoonal rainfallfluctuation
Arab J Geosci
used to link uncorrected/scanned images to RSO. Theformula is shown below:
f ðxÞ ¼ a3x3 þ a2x
2 þ a1xþ a0 ð1ÞPrior to rectify the uncorrected images, a geo-referenced
map is required. The map here was the topographic map ofstudy area. The map was rectified by inputting GroundControl Point (GCP) coordinates manually. The coordinatesare available in Northing and Easting form with the unit isin meter. A sufficient number of GCPs with uniform spaceover the entire of the map can be extracted. A number of141 GCPs is identified and input manually into geo-codingwizard. The rectification process employs a third order(cubic) polynomial that requires at least 10 GCPs toproceed to rectification process. The result of this processis geo-coded (rectified) image with average root meansquare of 0.546. This means that the average error is below1 pixel, which is acceptable error in a rectification processas stated by (Hall 2003).
Once the geo-referenced map was available, SPOT andLandsat satellite images were rectified with respect to thegeo-referenced map. Unlike the first method, GCP coor-dinates are not inputted manually but selected randomly onthe image by selecting the same points/objects identifiableboth on corrected and uncorrected images. Only GCPs thatcontribute lowest errors (below 1 pixel) are selected. Thesame polynomial order was applied.
Image enhancement
In order to make features on the images appear clearer forGCPs selection during geo-coding process and interpretingthe objects during image classification process, the imageenhancement procedures, i.e., histogram adjustment, selec-tion the bands combination, and application of formulawere applied. Histogram adjustment was meant to get abetter contrast of the images. Combination of bands 241from Red-Green-Blue channels (RGB) respectively shows
Fig. 4 Landslide Susceptibility Modeling procedure
Satellite names Date of acquisition Season of acquisition Path/ row
Landsat 7 24-02-01 Dry
ETM+ 31-05-01 Rainy 127/05719-06-02 Dry
20-09-01 Rainy
SPOT 2 28-02-01 Dry 268/341
Table 2 Satellite images
Arab J Geosci
the SPOT 5 image in natural color. A clearer natural color iscomposed by applying the following formula:
True Color ¼ B1»3þ B3ð Þ=4 ð2ÞB1 represents red channel while B3 represents blue
channel. For Landsat images, combination of 283 and 543bands in RGB channels gives natural color. The latter givesa better contrast of the objects that are covered by thincloud layers. The author prefers to have the images shownin natural color because the objects are more recognizableand distinguishable.
Image classification
Land use and land cover information incorporated in GISanalysis was provided by Department of Agriculture,Malaysia. In addition, such information can be extractedfrom topographic map by on screen digitization. Both mapshave been ageing and they need to be updated. Unsupervisedclassification has been conducted on the 19 April 2005SPOT image using the built-in maximum likelihood classi-fier. The classification algorithm incorporated all SPOT 5bands (band 1, 2, 3, and 4). The process clustered the pixelsinto six classes, i.e., forest, barren, built up (e.g., dwellings,roads, cemented surface), hydrology, and crop land, small/thin vegetation. These classes were adopted from USGS’sAnderson Classification System (Anderson et al. 1976) withsimplification of the number of the classes to meet the goalof landslide study. The hydrology features such as river andlake are masked during GIS analysis due to absence oflandslide occurrences within these areas. Since it is difficult
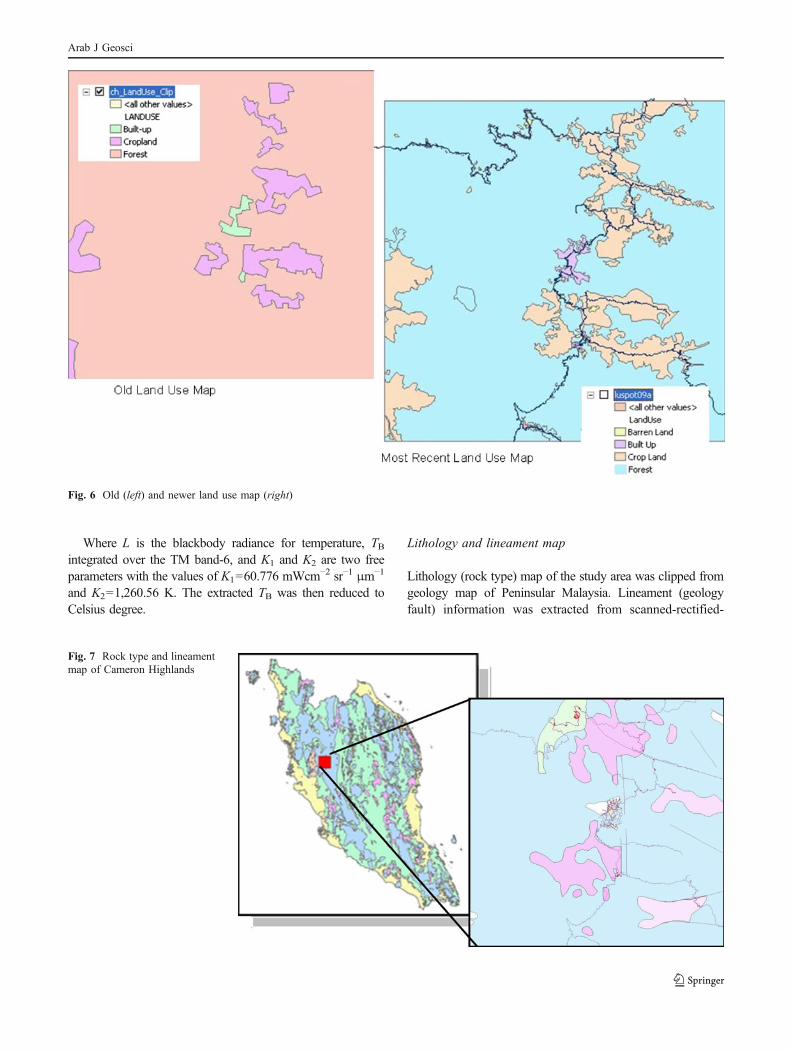
to distinguish between small vegetated area and crop land,these two classes are put into one group. Hence, the numberof classes becomes four. The classified image accuracy wasassessed by using site data, topographic map, and visualinterpretation of the image. Visual inspection revealed thatthere were misclassifications between road, urban, andcemented slope; between small vegetation and crop land;and open/barren land and slope failure. To overcome theseproblems, a hybrid classification method, a combination ofautomated and manual classification was applied. Themisclassified objects were identified and grouped as desiredclasses. Barren land that includes cut slope area is newlyadded feature in land use/land cover map (Fig. 6).
Surface temperature derivation from Landsat
In estimating land surface temperature from thermalinfrared band of Landsat data, the digital number (DN) ofimage pixels was converted into spectral radiances. Spectralenhancement was carried out before DN conversion. TheDN to spectral radiance conversion was carried out usingthe equation developed by Markham and Barker (1986):
Ll ¼ 0:0056322� DNþ 0:1238 ð4ÞThe spectral radiances were converted into satellite
brightness temperature using inverse Plank function withtwo free parameters (Schott and Volchok 1985; Wukelic etal. 1989):
TS ¼ K2= lnK1
Lþ 1
� �ð5Þ
Fig. 5 Subsetting area ofinterest from full scene images
Arab J Geosci
Where L is the blackbody radiance for temperature, TBintegrated over the TM band-6, and K1 and K2 are two freeparameters with the values of K1=60.776 mWcm−2 sr−1 μm−1
and K2=1,260.56 K. The extracted TB was then reduced toCelsius degree.
Lithology and lineament map
Lithology (rock type) map of the study area was clipped fromgeology map of Peninsular Malaysia. Lineament (geologyfault) information was extracted from scanned-rectified-
Fig. 7 Rock type and lineamentmap of Cameron Highlands
Fig. 6 Old (left) and newer land use map (right)
Arab J Geosci
geology map (Fig. 7). More detailed rock type and lineamentinformation of Tanah Rata area was obtained from work doneby Ramli et al. (2005) and was added into the database. Theavailable rock type map shows only three types of rock, i.e.,granite, alluvium, and other (undifferentiated). There is nodetail information regarding undifferentiated rock type fromthe geological base map except the one reported by Lee et al.(2006) that undifferentiated is acid intrusive rock type. Thisrock is laid in between two rock types mentioned above interms of weight value. In addition, amore detailed geologymapof Pos Selim area resulted from geology survey conducted byAbu Bakar et al. (Bakar and Madun 2004) shows coverage ofschist formation underlying most of slope failure area.
Topographic map and its spatial data derivation
Topographic map contains several layers required for thisstudy, e.g., contour, land use, road network, river, lake,stream, etc. They are already projected onto RSO system.Each feature was stored as a single layer. Using GISenvironment, contour data was processed to derive a DEMfrom which slope map and other spatial data such as slopeaspect and earth curvature can be derived. Earth curvatureis second derivative of surface. It shows whether the surfaceis convex or concave. Convex surfaces, like ridges, aregenerally exposed and drain to other areas while concavesurfaces, like channels, are generally more sheltered and
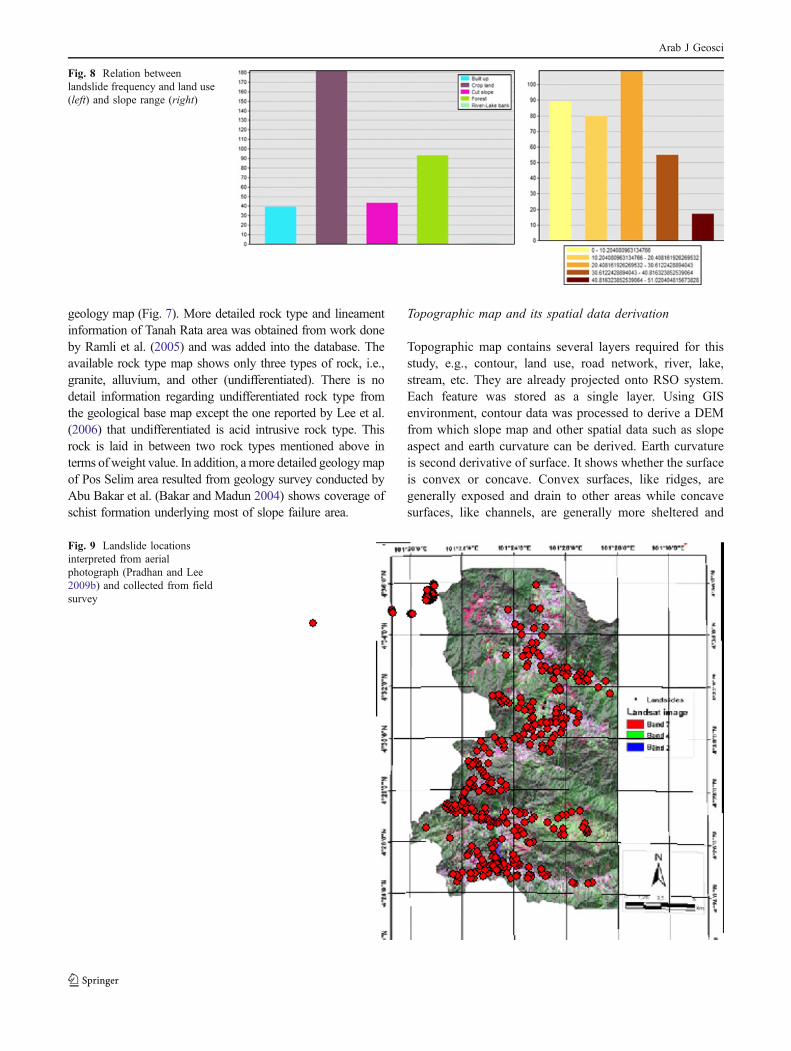
Fig. 8 Relation betweenlandslide frequency and land use(left) and slope range (right)
Fig. 9 Landslide locationsinterpreted from aerialphotograph (Pradhan and Lee2009b) and collected from fieldsurvey
Arab J Geosci
Landslide factors Classes Number of landslide Weightage1 2 3 4
Land use Crop land 182 5
Forest 93 4
Built up 39 2
Cut slope 43 3
River/lake bank 1 1
Geology Granite 231 5
Others/undifferentiated 82 4
Alluvium 1 2
Schist 44 3
Elevation <805 m 4 1
805–1,070 m 16 2
1,070–1,335 m 181 5
1,335–1,600 m 131 4
>1,600 m 26 3
Slope <10.2 90 4
10.2–20.4 82 3
20.4–30.6 111 5
30.6–40.8 57 2
>40.8 18 1
Slope aspect Flat (−1) 0 1
North (0–22.5) 17 2
Northeast (22.5–67.5) 56 5
East (67.5–112.5) 39 3
Southeast (112.5–157.5) 44 3
South (157.5–202.5) 43 3
Southwest (202.5–247.5) 51 4
West (247.5–292.5) 37 3
Northwest (292.5–337.5) 53 5
North (337.5–360) 18 2
Curvature <−8.4 19 2
−8.4–−2.1 76 4
−2.1–4.2 208 5
4.2–10.5 46 3
>10.5 9 1
Distance to road <500 278 5
500–1,000 44 4
1,000–1,500 22 3
1,500–2,000 11 2
>2,000 3 1
Distance to lineament <1,000 143 5
1,000–2,000 111 4
2,000–3,000 69 3
3,000–4,000 28 2
>4,000 7 1
Distance to river lake <1,000 123 5
1,000–2,000 55 4
2,000–3,000 48 3
3,000–4,000 60 2
>4,000 72 1
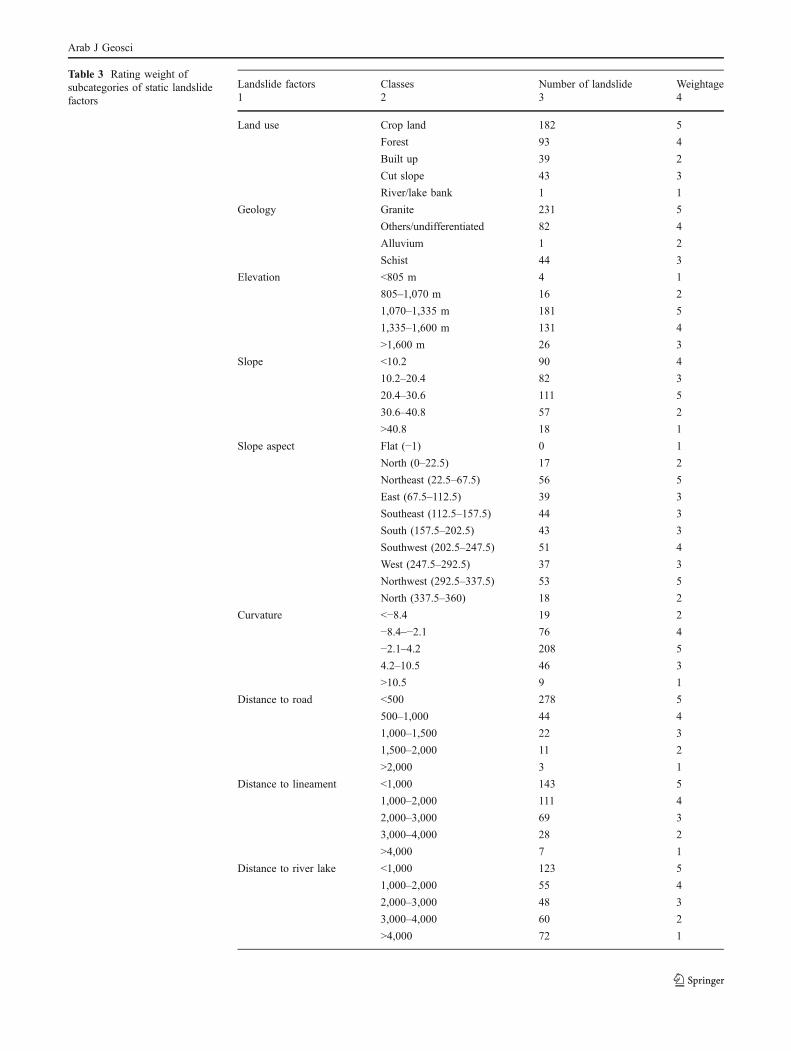
Table 3 Rating weight ofsubcategories of static landslidefactors
Arab J Geosci
accept drainage from other areas. Euclidean distances werecomputed for road, lakes, and rivers.
Rating weight derivation
Each subcategory of causative factors was assigned aweighting value based on landslide frequency at a particularsubcategory or subclass. In order to obtain weighting valuesfor all subcategories of causative factors, crossing betweenlandslide map of Cameron Highlands and causative factorswas carried out. Crossing means extracting attribute ofcausative factors at landslide sites. Each causative factorwas reclassified into five classes/subcategories in order tosimplify GIS process. In accordance to the reclassificationof causative factors, weight values were set from 1 to 5representing from low to high risk areas.
Figure 8 shows the relation between land use type, sloperanges, and landslide occurrences. A large number oflandslide events occurred at crop land areas. Meanwhilemore frequent landslide occurrences took place at sloperange 20.4° to 30.6°. For these cases, maximum weightvalues were given to these subcategories.
Landslide susceptibility modeling
Among the three approaches mentioned previously,statistical approach is very suitable to apply for this
area. However, application of this approach requires thelandslide sites data to be well distributed over the area ofstudy and have multi-temporal records. Moreover, de-tailed landslide inventory map is required as the basis offrequency and intensity analysis of landslide. Bothrequirements are not satisfied for the case of CameronHighlands. A non-detailed landslide inventory map wasconstructed based on field investigation and interpreta-tion of SPOT image. This map is useful in providingconsideration for assigning weight values. Due to thesimple landslide inventory map available, a simplifiedquantitative (statistical) approach is the most possibleapproach that can be implemented.
There were two approaches employed for modelinglandslide susceptibility, namely “static” and “dynamic”modeling approaches. In static modeling, all non-time-dependent landslide causative factors were taken intoaccount in GIS analysis. Time-dependent causative factor,i.e., LST was assumed to be constant along the period ofstudy. Meanwhile, in dynamic modeling, multi-temporal ofcausative factor was involved in the model as well as thestatic causative factors.
Static approach involved land use, geology, elevation,slope, slope aspect, curvature, distance to road, distanceto lineament, and distance to river and lake. Thesubcategories of each landslide causative factor wereassigned with weight values. For GIS analysis, weightedoverlay was selected as GIS operator. Dynamic modelincludes all static parameters and series of LST asadditional factors. The same procedures as static model-ing are applied to dynamic modeling except addition of aseries of surface temperatures derived from Landsatimages. LST was the only feature that contributesdifferent distribution of susceptible areas on the map.
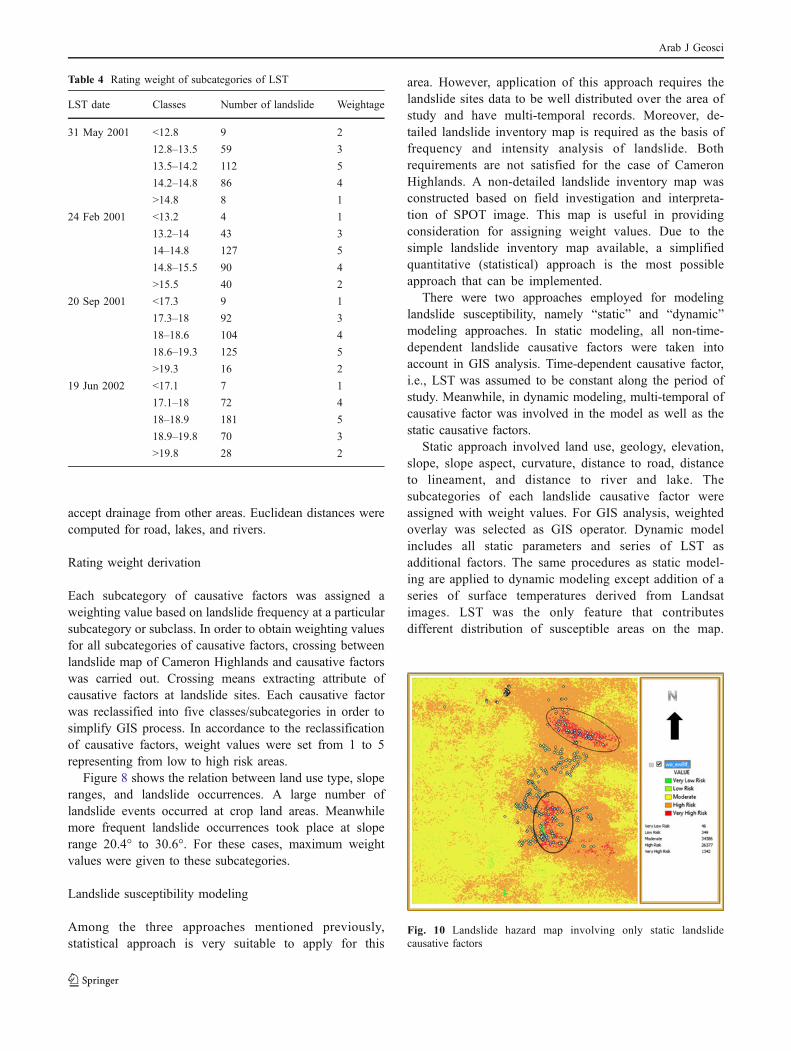
Table 4 Rating weight of subcategories of LST
LST date Classes Number of landslide Weightage
31 May 2001 <12.8 9 2
12.8–13.5 59 3
13.5–14.2 112 5
14.2–14.8 86 4
>14.8 8 1
24 Feb 2001 <13.2 4 1
13.2–14 43 3
14–14.8 127 5
14.8–15.5 90 4
>15.5 40 2
20 Sep 2001 <17.3 9 1
17.3–18 92 3
18–18.6 104 4
18.6–19.3 125 5
>19.3 16 2
19 Jun 2002 <17.1 7 1
17.1–18 72 4
18–18.9 181 5
18.9–19.8 70 3
>19.8 28 2
Fig. 10 Landslide hazard map involving only static landslidecausative factors
Arab J Geosci
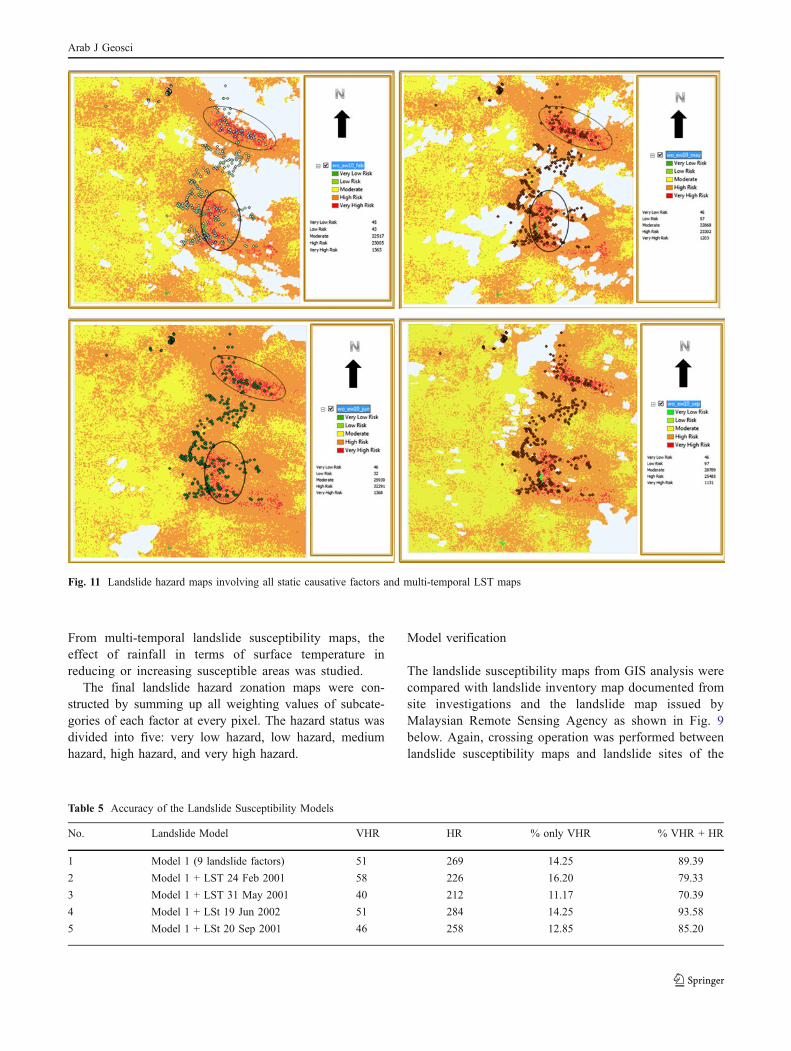
From multi-temporal landslide susceptibility maps, theeffect of rainfall in terms of surface temperature inreducing or increasing susceptible areas was studied.
The final landslide hazard zonation maps were con-structed by summing up all weighting values of subcate-gories of each factor at every pixel. The hazard status wasdivided into five: very low hazard, low hazard, mediumhazard, high hazard, and very high hazard.
Model verification
The landslide susceptibility maps from GIS analysis werecompared with landslide inventory map documented fromsite investigations and the landslide map issued byMalaysian Remote Sensing Agency as shown in Fig. 9below. Again, crossing operation was performed betweenlandslide susceptibility maps and landslide sites of the
Fig. 11 Landslide hazard maps involving all static causative factors and multi-temporal LST maps
Table 5 Accuracy of the Landslide Susceptibility Models
No. Landslide Model VHR HR % only VHR % VHR + HR
1 Model 1 (9 landslide factors) 51 269 14.25 89.39
2 Model 1 + LST 24 Feb 2001 58 226 16.20 79.33
3 Model 1 + LST 31 May 2001 40 212 11.17 70.39
4 Model 1 + LSt 19 Jun 2002 51 284 14.25 93.58
5 Model 1 + LSt 20 Sep 2001 46 258 12.85 85.20
Arab J Geosci
study area. The attributes extracted from the maps wereevaluated. The author made an assumption that thelandslide points were assumed to have very high riskstatus or at least high risk status. The accuracy of themodel was indicated by the resulted number of pointshaving both statuses.
Result and discussions
Rating weight values
Table 3 shows the weightage of all subcategories as theresult of crossing between landslide map and subcategoriesof static causative factors while Table 4 shows theweightage of LST. Those having 5 weight values meanthat at these subcategories landslide more frequently occurs.On the contrary, for those having 1 weight value means lesslandslide occurs at these subcategories. This weightageinformation was used as input in GIS analysis.
Column 3 on the Table 3 was the number of pixelscontaining landslide sites. This number of landslideoccurrences came from the result of crossing betweenlandslide inventory map of the study area and the final.
Landslide susceptibility maps
Figures 10 and 11 show static and dynamic LandslideSusceptibility Maps, respectively. All models can predictback the landslide sites about 13–16% of very high riskpoints that were assumed as landslide points. When very highrisk points are taken into account, all landslide susceptibilitymodels show a good accuracy in back prediction of landslideareas from 70% to 93% (Table 5). Meanwhile, from theinclusion of multi-temporal LST in landslide susceptibilitymodel, it can be concluded that addition of LST does notnecessarily improve the model in predicting landslide areas.However, from the landslide susceptibility maps, it can beseen that the distribution of very high risk areas are clusteredor close to landslide locations.
Conclusion
From this research, it can be concluded that the landslidecharacteristics derived from crossing between landslidesites of the study area and landslide factors producedsufficient results in predicting landslide risk areas. The veryhigh risk areas produced by all models are clustered aroundthe landslide sites. The influence of addition of multi-temporal LST maps as representation of the monsoonaleffect in the final landslide hazard models did not improvethe landslide models.
Acknowledgments This work is supported by Universiti TeknologiPETRONAS fund under Graduate Assistantship scheme.
References
Agostoni S, Cardinali M, Carrara A, Crosta G, Fossati D, Frantini P,Guzzetti F, Laffi R, Reichenbach P (2000) Assessment oflandslide hazard of the Staffora Basin (Northern Italy) byintegrating geomorphological and historical data within amultivariate model. XXV EGS General Assembly, Nice, France
Akgün A, Bulut F (2007) GIS-based landslide susceptibility for Arsin-Yomra (Trabzon, North Turkey) region. Environ Geol 51(8):1377–1387
Alkhaier F, Schotting RJ, Su Z (2009) A qualitative description ofshallow groundwater effect on surface temperature of bare soil.Hydrol Earth Syst Sci 13(9):1749–1756
Alsultan S, Lim H-S, MatJafri MZ, Abdullah K (2005) An algorithmfor land surface temperature analysis of remote sensing imagecoverage over Alqassim, Saudi Arabia, FIG Working Week,Cairo, Egypt
Anbalagan R (1992) Landslide hazard evaluation and zonationmapping in mountainous terrain. Eng Geol 32:269–277
Anderson JR, Hardy EE, Roach JT, Witmer RE (1976) A land use andland cover classification system for use with remote sensor Data.Geological Survey Professional Paper 964. U.S. Geol SurveyCirc 671, 16 p., refs
Asch TWJV, Steijn HV (1991) Temporal patterns of mass movementsin the French Alps. Catena 18:515–527
Asch TWJV, Buma J, Beek LPHV (1999) A view of somehydrological triggering system in landslides. Geomorphology30:25–32
Ayalew L, Yamagishi H (2005) The application of GIS-based logisticregression for landslide susceptibility mapping in the Kakuda-Yahiko Mountains, Central Japan. Geomorphology 65:15–31
Bakar SA, Madun A (2004) Geological mapping and stereo-netanalysis to evaluate cut slope stability at Pos Slim LojingHighway. 6th Malaysian Road Conference. 16–18 Augustus,Sunway Pyramid Convention Centre, Kuala Lumpur
Basith A, Matori AN, Harahap ISH (2010) Past landslide at Post Slim:evaluation of its causative factors using geospatial and remotesensing data. International Conference on Sustainable Buildingand Infrastructure (ICSBI2010), Kuala Lumpur, Malaysia
Beek LPHV, Asch TWJV (2004) Regional assessment of the effects ofland-use change on landslide hazard by means of physicallybased modelling. Nat Hazards 31:289–304
Changyan C, Zhengjun L, Jixian Z (2008) Interpretation of landslidefrom SPOT-5 imageries in the Three Gorges Reservoir Area.International Workshop on Earth Observation and RemoteSensing Applications (EORSA), pp 1–5
Chau KT, Sze YL, Fung MK, Wong WY, Fong EL, Chan LCP (2004)Landslide hazard analysis for Hong Kong using landslideinventory and GIS. Comput Geosci 30(4):429–443
Chi C, Liu Z, Zhang J (2008) Interpretation of Landslide from SPOT-5Imageries in the Three Gorges Reservoir Area, 2008 InternationalWorkshop on Earth Observation and Remote Sensing Applica-tions, Beijing, China
Dai FC, Lee CF (2002) Landslide characteristics and slope instabilitymodeling using GIS, Lantau Island, Hong Kong. Geomorphol-ogy 42(3-4):213–228
Furuya G, Suemine A, Sassa K, Komatsubara T, Watanabe N,Marui H (2006) Relationship between groundwater flowestimated by soil temperature and slope failures caused byheavy rainfall, Shikoku Island, southwestern Japan. Eng Geol85(3–4):332–346
Arab J Geosci
Guzzetti F (2002) Landslide hazard assessment and risk evaluation:limit and prospectives. In: Jansà A, Romero R (eds) Proceedings4th Plinius Conference on Mediterranean Storms. Universitat deIlles Baleares, Mallorca, Spain
Guzzetti F, Crosta G, Detti R, Agliardi F (2002) STONE: a computerprogram for the three-dimensional simulation of rock-falls.Comput Geosci 28(9):1079–1093
Hall A (2003) Change Detection ER Mapper 6.4 Application GuideHervas J, Barredo JI, Rosin PL, Pasuto A, Mantovani F, Silvano S
(2003) Monitoring landslide from optical remotely sensedimagery: the case history of Tessina landslide, Italy. Geomor-phology 54:63–75
Hong Y, Alder R, Huffman G (2007) Use of satellite remote sensingdata in the mapping of global landslide susceptibility. NaturalHazards 43:245–256
Hongyang C, Renshu Y, Xinjian S, Weiying G (2004) An applicationresearch of the landslide interpretation based on the technology ofremote sensing three-dimension visualization. IEEE. 2284–2285
Huang C, Wylie B, Yang L, Homer C, Zylstra G (2002) Derivation ofa tasselled cap transformation based on Landsat 7 at-satellitereflectance. International Journal of Remote Sensing, Taylor &Francis 23(8):1741–1748
Huosheng S, Hui L (1999) Radar image for the study of landslidestructures in Hongkong. AARS-ACRS Proceeding
Kelarestaghi A, Ahmadi H (2009) Landslide susceptibility analysis witha bivariate approach and GIS in Northern Iran. AJG 2(1):95–101
Lau WY (2004) Landslide Recognition and Prediction using Space-borne Multispectral Data. Thesis (Master). University of NewSouth Wales
Lau WY, Jia X, Ge L (2006) Landslide prediction using vegetationindex, surface temperature and surface moisture content derivedfrom Landsat data, 13th Australasian Remote Sensing &Photogrammetry Conference. Canberra, Australia
Lee S, Pradhan B (2006) Landslide hazard assessment at CameronHighland Malaysia using frequency ratio and logistic regressionmodels. Geophysical Research Abstract, European GeosciencesUnion. 8 (03261)
Lee S, Pradhan B (2007) Landslide hazard mapping at Selangor,Malaysia, using frequency ratio and logistic regression models.Landslides 4:33–41
Lee S, Oh H, Park N-W, Lee S (2007) Extraction of landslide-relatedfactors from ASTER imagery and its application to landslidesusceptibility mapping using GIS. IEEE International Geoscienceand Remote Sensing Symposium, Barcelona, Spain
Li F, Jackson T, Kustas W, Schmugge T, French A-U, Cosh M,Bindlish R-S (2004) Deriving land surface temperature fromLandsat 5 and 7 during SMEX02 SMACEX. Remote SensEnviron 92(2):521–534
Liao Q (2004) GIS-Based Landslide Hazard Zonation Mapping usingStatistical Approaches. Thesis (PhD Thesis). University ofArkansas
Lineback GM, Marcus WA, Aspinall R, Custer SG (2001) Assessinglandslide potential using GIS, soil wetness modeling andtopographic attributes, Payette River, Idaho. Geomorphology 37(1-2):149–165
Long-Shin L, Kun-Shan C, Chin-Lun W, Chen AJ, Boerner WM(2005) Landslide monitoring and assessment in Taiwan usingSPOT series satellites, Geoscience and Remote Sensing Sympo-sium, 2005. IGARSS ‘05. Proceedings. 2005 IEEE International,Seoul, South Korea, IEEEXplore, 2, 1397–1400
Magliulo P, Lisio AD, Russo F (2009) Comparison of GIS-basedmethodologies for the landslide susceptibility assessment. Geo-informatica 13:253–265
Mantovani F, Soeters R, Van Westen CJ (1996) Remote sensingtechniques for landslide studies and hazard zonation in Europe.Geomorphology 15(3-4):213–225
Markham BL, Barker JL (1986) Landsat MSS and TM post-calibration dynamic rangers, exoatmospheric reflectance andat-satellite temperatures. EOSAT Landsat Technical Notes.Aug (3–8)
Mondini A, Carlà R, Reichenbach P, Cardinali M, Guzzetti F (2009)Use of a remote sensing approach to detect landslide thermalbehaviour. Geophysical Research 11:7790–7798
Nikolakopoulos KG, Vaiopoulos DA, Skianis GA, Sarantinos P,Tsitsikas A (2005) Combined Use of Remote Sensing, GIS andGPS Data for Landslide Mapping. IEEE. 5196–5199
Omar SNS, Jeber FkM, Mansor S (2004) GIS/RS for landslideszonation in Pos Slim-Cameron Highlands district, PeninsulaMalaysia. Disaster Prev Manag 13(1):24–32
Peloquin S, Gwyn QHJ (2000) Using Remote Sensing, GIS andArtificial Intelligence to Evaluate Landslide Susceptibility Levels:Application in the Bolivian Andes. 4th International Conference onIntegrating GIS and Environmental Modelling
Petley DN, Crick WDO, Hart AB (2002) The Use of Satellite Imageryin Landslide Studies in High Mountain Areas. AARS-ACRS.www.gisdevelopment.net
Pradhan B, Lee S (2009a) Delineation of landslide hazard areas ofPenang Island, Malaysia, by using frequency ratio, logisticregression, and artificial neural network. Environmental EarthScience 60(5):1037–1054
Pradhan B, Lee S (2009b) Regional landslide susceptibility analysisusing back-propagation neural network model at Cameron High-lands, Malaysia. Landslides 7:13–30
Pradhan B, Youssef A (2010) Manifestation of remote sensing dataand GIS on landslide hazard analysis using spatial-basedstatistical models. AJG 3(3):319–326
Pradhan B, Sezer EA, Gokceoglu C, Buchroithner MF (2010)Landslide susceptibility mapping by neuro-fuzzy approach in alandslide-prone area (Cameron Highlands, Malaysia). Geoscienceand Remote Sensing, IEEE Transactions on 48(12):4164–4177
PWD (2009) National Slope Master Plan, Public_Works_Department,Kuala Lumpur
Qin Z, Karnieli A, Berliner P (2001) A mono-window algorithm forretrieving land surface temperature from Landsat TM data and itsapplication to Israel–Egypt border region. Int J Remote Sens 22(18):3719–3746
Raju PP, Saibaba J (1999) Landslide hazard zonation mapping usingremote sensing and geographic information system techniques—a case study of Pithoragarh Area, U.P. IEEE. 577–579
Ramli MF, Sulaiman WNA, Yusoff MK, Low YY, Manap MA (2005)Open source geographical resources analysis support system(GRASS) for landslide hazard assessment. Disaster Prev Manage-ment 14(2):522–532
Roessner S, Wetzel H-U, Kaufmann H, Sarnagoev A (2005) Potential ofsatellite remote sensing and GIS for landslide hazard assessment inSouthern Kyrgystan (Central Asia). Nat Hazards 35:395–416
Saha AK, Gupta RP, Sarkar I, Arora MK, Csaplovics E (2005) Anapproach for GIS-based statistical landslide susceptibility zona-tion—with a case study in the Himalayas. Landslides 2:61–69
Sarkar S, Kanungo DP, Patra AK, Kumar P (2008) GIS basedspatial data analysis for landslide susceptibility mapping. JMS5:52–62
Schott JR, Volchok WJ (1985) Thematic Mapper thermal infraredcalibration. Photogrammetric Engineering and Remote Sensing51(9):1351–1357
Seker DZ, Altan MO, Duran Z, Shrestha MB, Yuasa A, Kawamura K(2008) Producing landslide risk map of Sebinkarahisar by meansof remote sensing and GIS techniques, XXIst ISPRS Congress,Beijing, CHINA
Sharma M, Kumar R (2008) GIS-based landslide hazard zonation: acase study from the Parwanoo area, Lesser and Outer Himalaya,H.P., India. Bull Eng Geol Environ 67(1):129–137
Arab J Geosci
Sharma R, Shakya N (2008) Rain induced shallow landslide hazardassessment for ungauged catchments. Hydrogeol J 16(5):871–877
Shikada M, Muramatu N, Kusaka T, Goto S (1995) Extraction oflandslide areas using satellite remote sensing and GIS technol-ogy, IEEE Geoscience and Remote Sensing Symposium 1995(IGARSS ‘95). ‘Quantitative Remote Sensing for Science andApplications’, Florence, Italy
Shikada M, Suzuki Y, Kusaka T, Goto S, Kawata Y (1997) Anapplication of GIS information and remotely sensed data forextraction of landslide, IEEE Geoscience and Remote Sensing1997 (IGARSS ‘97). Remote Sensing - A Scientific Vision forSustainable Development, Singapore 1:210–212
Suga Y, Yoshimura M, Takeuchi S, Oguro Y (2000) Verification OfSurface Temperature From Landsat 7/Etm+ Data, Asian Confer-ence of Remote Sensing
Suzen ML (2002) Data driven landslide hazard assessment usinggeographical informations systems and remote sensing. Thesis(Doctor of Philosophy). Middle East University
Süzen M, Doyuran V (2004) A comparison of the GIS based landslidesusceptibility assessment methods: multivariate versus bivariate.Environ Geol 45(5):665–679
Talib, JA (1997) Slope instability and hazard zonation mapping usingremote sensing and GIS techniques in the area of CameronHighlands, Malaysia. Proc. of Asian Conference on RemoteSensing (ACRS). Malaysia GIS Development
Talib JA (2005) An integrated approach of remote sensing and gistechniques for landslide hazard zone mapping; Malaysia case
studies, 25th Symposium of EARSel: Global Developments inEnvironmental Earth Observation from Space. Porto, Portugal
Terlien MTJ (1996) modeling spatial and temporal variations inrainfall-triggered landslides. Thesis (PhD). ITC
Vohora VK, Donoghue SL (2004) application of remote sensing data tolandslide mapping in Hongkong. ISPRS Congress 2004, Istanbul
Westen CJV (2000) The modelling of landslide hazards using GIS.Surveys in Geophysics 21:241–255
Westen CJV (2004) Geoinformation Tools for Landslide RiskAssessment. An Overview of Recent Development. www.itc.nl/library/Papers_2004/n_p_conf/vanwesten.pdf
Westen CJV, van Asch TWJV, Soeters R (2006) Landslide hazard and riskzonation—why is it so difficult? Bull Eng Geol Environ 65:167–184
Wieczorek GF, McWreath HC, Davenport C (2001) Remote rainfallsensing for landslide hazard analysis, U.S. G. Survey, Reston, USA
Wukelic GE, Gibbons DE, Martucci LM, Foote HP (1989) Radio-metric calibration of Landsat Thematic Mapper thermal band.Remote Sens Environ 28:339–347
Xing Q, Chen C-Q, Shi P (2006) Method of integrating Landsat-5 andLandsat-7 data to retrieve sea surface temperature in coastalwaters on the basis of local empirical algorithm. Ocean Sci J 41(2):97–104
Yang J, Wang YQ (2002) Estimation of land surface temperature usingLandsat-7 ETM+ thermal infrared and weather station data
Yilmaz I (2009) Landslide susceptibility mapping using frequencyratio, logistic regression, artificial neural networks and theircomparison: a case study from Kat landslides (Tokat–Turkey).Comput Geosci 35(6):1125–1138
Arab J Geosci


