Embed Size (px)
Citation preview
3RD INTERNATIONAL CONFERENCE ON MANAGING RIVERS IN THE 21ST CENTURY:
6 - 9 DECEMBER 2011, PULAU PINANG, MALAYSIA
1
SOIL EROSIO� MODELI�G USI�G RUSLE A�D GIS AT CAMERO�
HIGHLA�DS, MALAYSIA
Jansen Luis1, Soo Huey Teh
2, Lariyah Mohd Sidek
3,
Mohamed Nor Bin Mohamed Desa4, Pierre Y. Julien
5
Abstract: Upland erosion and reservoir sedimentation at Cameron Highlands are among the most important
sedimentation problems in Malaysia. Uncontrolled deforestation and indiscriminate land clearing for agricultural,
housing development and road construction resulted in widespread soil erosion over the land surface of Cameron
Highlands leading to sedimentation of the rivers and of the Ringlet Reservoir. The increasing rate of sedimentation
in the reservoir is adversely impacting the hydropower production scheme. The objective of this article is to present
the results of a GIS-based analysis of the mean annual soil loss rate using the RUSLE model for the Upper
Catchment of Cameron Highlands for the years 1997 and 2006. Data such as rainfall pattern, soil type, topography,
cover management and support practice were integrated for soil erosion modeling using RUSLE and ArcGIS. The
sub-catchments of Telom, Kial and Kodol, Upper Bertam, Middle Bertam, Lower Bertam, Habu, Ringlet and
Reservoir catchments were studied. Sediments were detached and transported from the upper catchment and were
eventually deposited in the Ringlet Reservoir. The soil loss of Cameron Highlands catchment was computed to be
282,465.5 m3/ year in 1997 and 334,853.5 m3/ year in 2006. The sediment yield for the Ringlet Reservoir was
therefore computed to be 1564 m3/km2/yr or 15.64 tons/km2/yr for 1997 and 1854 m3/km2/yr or 18.54 tons/km2/yr
in 2006 or an increase of 18.5% since 1997. Hence, the storage capacity of the reservoir is decreasing faster than
anticipated because of the increasing sediment yield with time. Consequently, the reservoir life expectancy has also
decreased considerable as compared to the design life expectancy.
Key words sedimentation, reservoir, catchment, source erosion
1. I�TRODUCTIO�
Cameron Highlands Hydroelectric Scheme was planned
and constructed from 1959 to 1964. The main feature of
the scheme was the Ringlet Falls/Sultan Abu Bakar Dam
which stands at 40m comprising of concrete buttress fitted
with four (4) gated spillways. The reservoir elevation at
full supply level is 1070.7m and has a surface area of 60
hectares. The reservoir receives waters from the rivers
namely Sg. Habu, Sg. Bertam, Sg. Ringlet and other minor
tributaries. Ringlet Reservoir was designed for a gross
storage of 6.3 million m3, of which 4.7 million m3 is the
active/live storage and 2.0 million m3 is the inactive/dead
storage. The dead storage was designed for a useful lifespan of
approximately 80 years which translates to a design sediment
inflow of 20,000m3/year.
From the bathymetric survey data the sediment rate of
40,000m3/year was recorded immediately after construction.
The data showed an increase of almost 100% from the
designed storage requirement, which means that the dead
storage would be filled up after 40 years of operation and not
as what was designed for. This increase is directly related to
the increase in the upstream activities such as deforestation,
un-controlled farming, residential and rapid developments
surrounding the catchments.
Main Author:
1Jansen, L., Engineering Services, Generation Asset Development, T�B
Corresponding Author: 2Soo Huey Teh, Renewable Energy System, University of Iceland.
Main Supervisor: 3Assoc. Prof. Dr. Ir. Lariyah Mohd Sidek, Department of Civil Engineering,
U�ITE� ([email protected])
Co – Supervisor [1]: 4Prof. Dr. Ir. Hj Mohamed �or bin Mohamed Desa, Department of Civil
Engineering, U�ITE� (Mohamed�[email protected])
Co – Supervisor [2]: 5Prof Pierre Y. Julien, Department of Civil Engineering, Colorado State
University, Fort Collins ([email protected])
3RD INTERNATIONAL CONFERENCE ON MANAGING RIVERS IN THE 21ST CENTURY:
6 - 9 DECEMBER 2011, PULAU PINANG, MALAYSIA
2
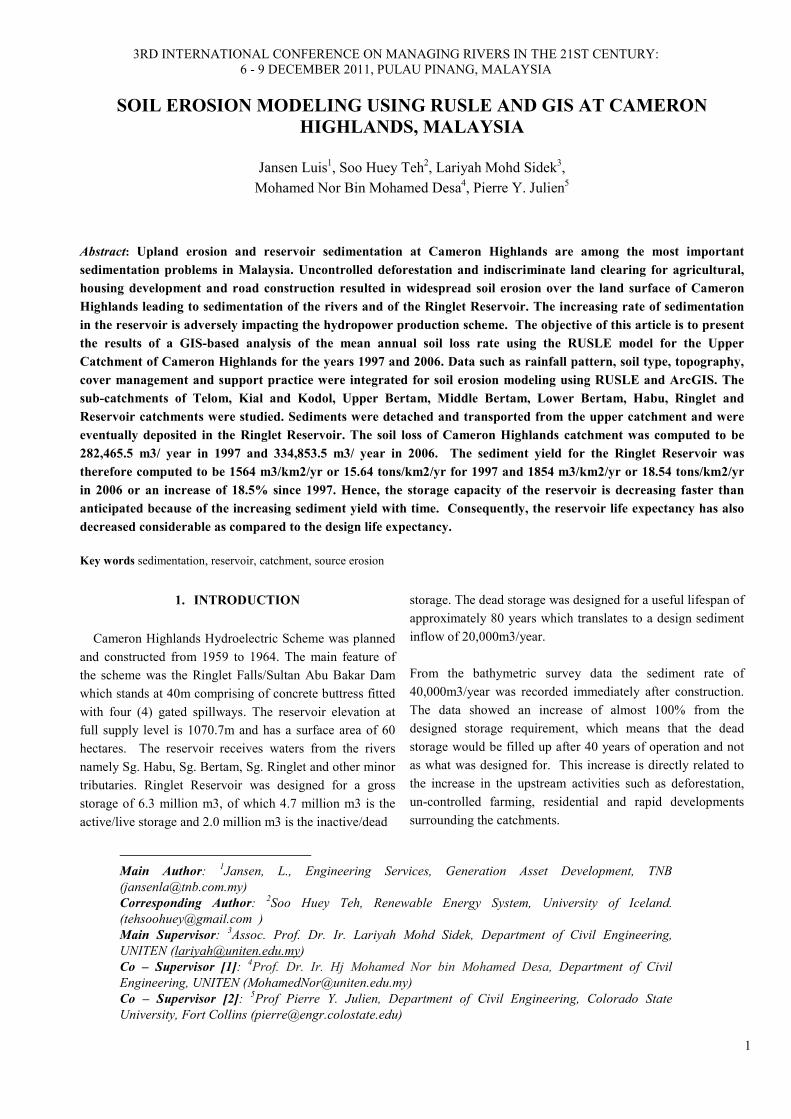
2. CATCHME�T CHARACTERISTICS
Cameron Highland catchment area is mountainous terrain
having various mountain peaks ranging from 1524m to
2032m. The highest peak within the catchment is Gunung
Brinchang standing at 2032m (6666 ft). Under the
Cameron Highlands Hydroelectric Scheme- Stage I
Construction, the scheme was designed as a high head
scheme which involves the combined flow from two major
Figure 1. Cameron Highlands sub-catchment
rivers, Sungei Telom and Sungei Bertam being conveyed
by pressure tunnel to an underground power station. The
gross head estimated between S. Bertam and S. Batang
Padang was 568m.The total catchment area of Cameron
Highlands Scheme is 183 square km comprising of 111
square km of Telom Catchment and 72 square km of
Bertam Catchment. The respective areas of the individual
catchments area are shown in Table 1.0.
3. FACTORS AFFECTI�G RESERVOIR
SEDIME�TATIO�
Eroded sediments from the catchment is most likely
contributes to the increase in sedimentation rate in
reservoir. The major factor that relates to the increase in
sediment inflow is the climatic characteristic such as the
rainfall intensity. However other factors such as the
catchment characteristic which includes soil, geology of
the area, vegetation cover, land use pattern and slopes also
plays an important part in the estimation of the soil erosion
rates. Such estimates on the source erosion are well
estimated using the Universal Soil Loss Equation (USLE)
combined with the more recent revision model named
Revised Universal Soil Loss Equation (RUSLE).
4. SOURCE EROSIO�
The well-known and widely used model used to calculate
the soil erosion losses from the catchment is the
USLE Equation was developed at National Runoff and Soil
Loss Data Center, USA. The USLE equation combines
various parameters as described in Equation 1:
A = R x K x L x S x C x P ------------- (1)
Where:
A – Soil Loss in kg/m2
R – The rainfall erosivity factor
K – The soil erodibility factor
L – Slope length factor
S – Slope gradient factor
C – Cover factor
P – Erosion control factor
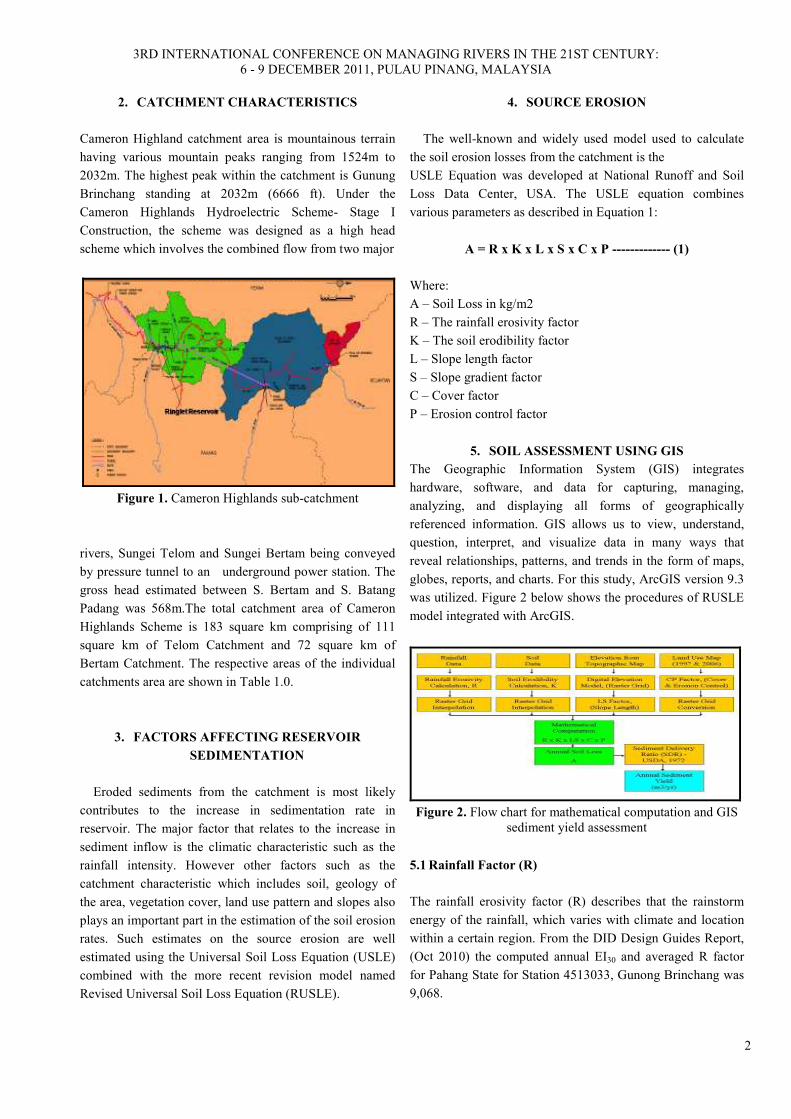
5. SOIL ASSESSME�T USI�G GIS
The Geographic Information System (GIS) integrates
hardware, software, and data for capturing, managing,
analyzing, and displaying all forms of geographically
referenced information. GIS allows us to view, understand,
question, interpret, and visualize data in many ways that
reveal relationships, patterns, and trends in the form of maps,
globes, reports, and charts. For this study, ArcGIS version 9.3
was utilized. Figure 2 below shows the procedures of RUSLE
model integrated with ArcGIS.
Figure 2. Flow chart for mathematical computation and GIS
sediment yield assessment
5.1 Rainfall Factor (R)
The rainfall erosivity factor (R) describes that the rainstorm
energy of the rainfall, which varies with climate and location
within a certain region. From the DID Design Guides Report,
(Oct 2010) the computed annual EI30 and averaged R factor
for Pahang State for Station 4513033, Gunong Brinchang was
9,068.
3RD INTERNATIONAL CONFERENCE ON MANAGING RIVERS IN THE 21ST CENTURY:
6 - 9 DECEMBER 2011, PULAU PINANG, MALAYSIA
3
Table 1. Main features of Cameron Highlands hydroelectric scheme
Upper Catchment, Pahang
• Sg Telom (76.7km2) receiving water from Sg Plau’ur
(9.7km 2) in Kelantan via a 480m long diversion
tunnel.
• Sg Kodol (1.3km2) diverting water into Sg. Telom at
Telom Tunnel entrance.
• Sg. Kial (22.7km2) diverting water into Sg. Telom via
a 423m long tunnel.
• Kampung Raja (0.8MW)
• Kuala Terla (0.5MW)
Lower Catchment, Pahang
• Sg. Bertam (72.6km2) receiving water from upper
catchment via a 10.25km Telom Tunnel.
• Ringlet Reservoir impounded by Sultan Abu Bakar Dam.
• Robinson Falls (0.9MW)
• Habu (5.5MW)
• Sultan Yussof or JOR (100MW)
This value seems to be very high. The value could have
been originated from technical error during data collection.
Furthermore there are only 31 automatic rainfall gauge
stations installed in the State of Pahang and only one
automatic rainfall gauge station in Cameron Highlands
situated on Mount Brinchang (Ministry of Natural
Resources and Environment Malaysia, 2010) which
provides continuous 10-minute interval rainfall records to
calculate the maximum 30 minute rainfall intensity (EI30).
Therefore, data from one automatic rainfall gauge station
does not provide enough spatial coverage of pluviographic
data to obtain an accurate R factor.
Therefore further research in the R factor revealed similar
and simplified equations used for other catchments
throughout the Asia region.
Bols, (1978) equation for calculation of the R value based
on empirical study in Indonesia is as below:
-------------------(2)
Another study was by Hartcher (2005) which
investigates the hill slope erosion at Mae Chaem, Thailand
was also researched. The rainfall erosivity factor was
determined using the following equation:
R = 38.5 + 0.35P
-------------------(3)
Therefore for Cameron Highland’s catchment the annual
average value was based on the existing monthly rainfall
grids. Several equations were compared and the following is
the results are shown in Table 2. Both Harper (2005) and Bols
(1978) provided an average R factor of 972.597 which was
used in the RUSLE mathematical and GIS model
computation.
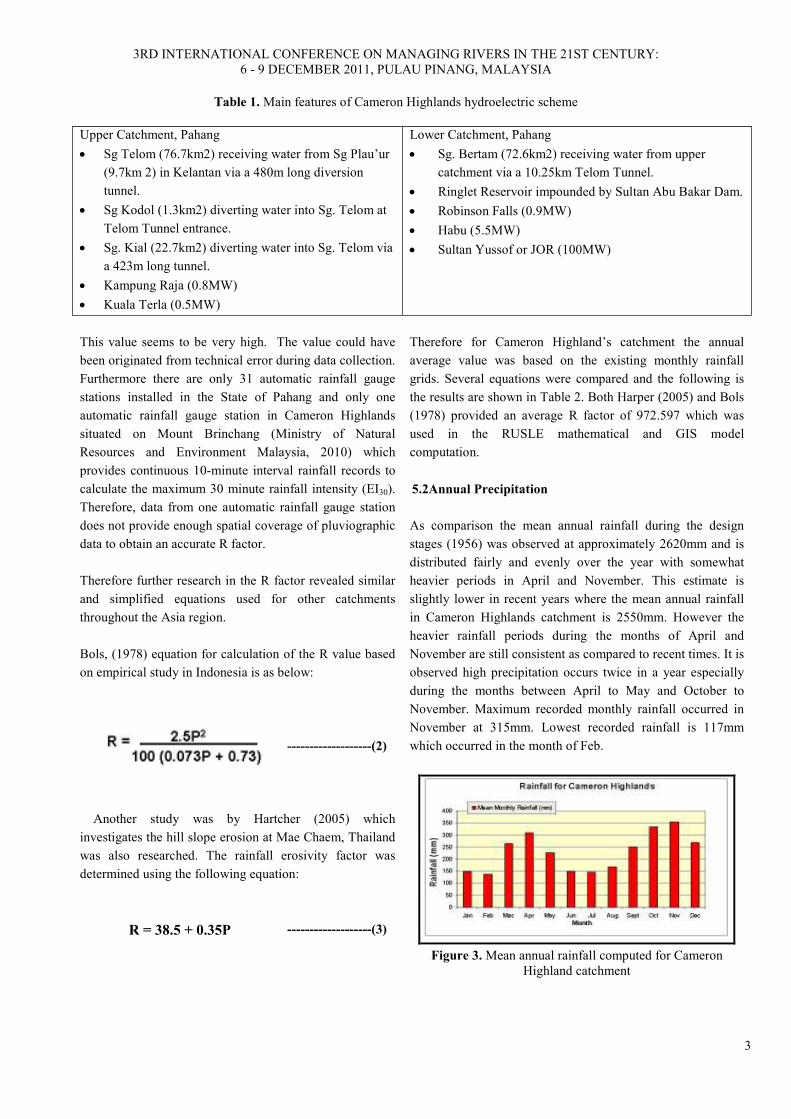
5.2Annual Precipitation
As comparison the mean annual rainfall during the design
stages (1956) was observed at approximately 2620mm and is
distributed fairly and evenly over the year with somewhat
heavier periods in April and November. This estimate is
slightly lower in recent years where the mean annual rainfall
in Cameron Highlands catchment is 2550mm. However the
heavier rainfall periods during the months of April and
November are still consistent as compared to recent times. It is
observed high precipitation occurs twice in a year especially
during the months between April to May and October to
November. Maximum recorded monthly rainfall occurred in
November at 315mm. Lowest recorded rainfall is 117mm
which occurred in the month of Feb.
Figure 3. Mean annual rainfall computed for Cameron
Highland catchment
3RD INTERNATIONAL CONFERENCE ON MANAGING RIVERS IN THE 21ST CENTURY:
6 - 9 DECEMBER 2011, PULAU PINANG, MALAYSIA
4
Table 2. Computed Rainfall Erosivity Factor, R
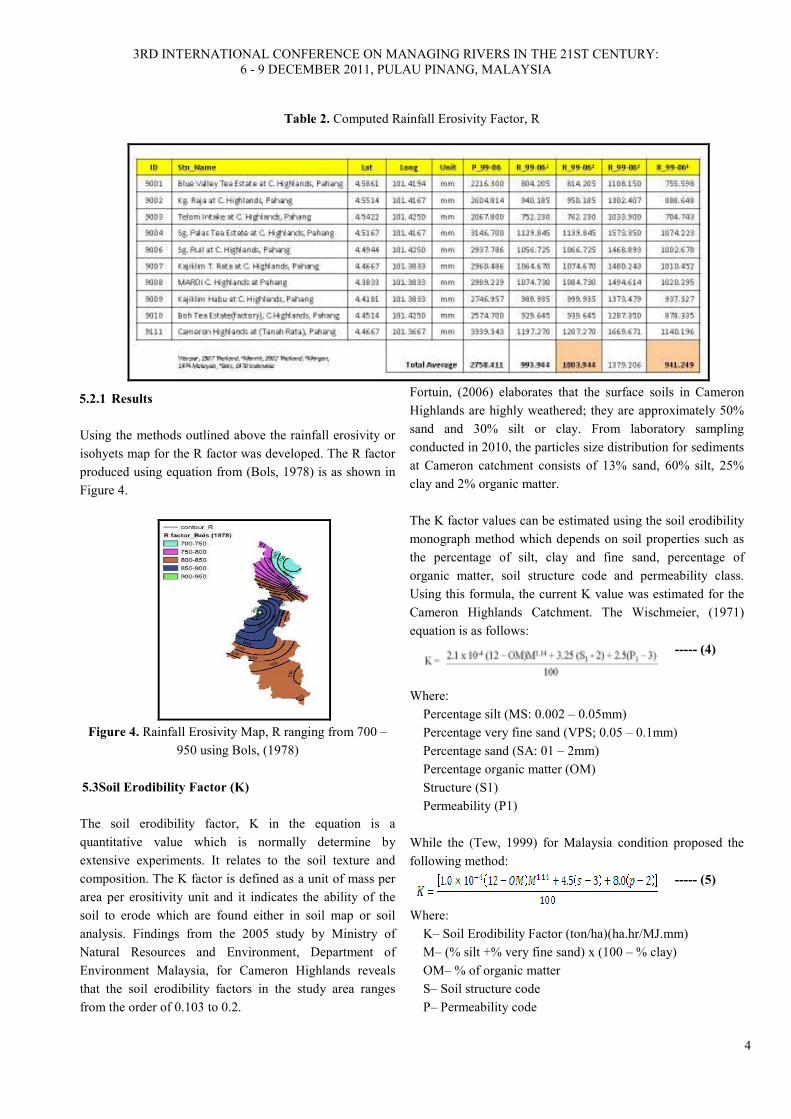
5.2.1 Results
Using the methods outlined above the rainfall erosivity or
isohyets map for the R factor was developed. The R factor
produced using equation from (Bols, 1978) is as shown in
Figure 4.
Figure 4. Rainfall Erosivity Map, R ranging from 700 –
950 using Bols, (1978)
5.3Soil Erodibility Factor (K)
The soil erodibility factor, K in the equation is a
quantitative value which is normally determine by
extensive experiments. It relates to the soil texture and
composition. The K factor is defined as a unit of mass per
area per erositivity unit and it indicates the ability of the
soil to erode which are found either in soil map or soil
analysis. Findings from the 2005 study by Ministry of
Natural Resources and Environment, Department of
Environment Malaysia, for Cameron Highlands reveals
that the soil erodibility factors in the study area ranges
from the order of 0.103 to 0.2.
Fortuin, (2006) elaborates that the surface soils in Cameron
Highlands are highly weathered; they are approximately 50%
sand and 30% silt or clay. From laboratory sampling
conducted in 2010, the particles size distribution for sediments
at Cameron catchment consists of 13% sand, 60% silt, 25%
clay and 2% organic matter.
The K factor values can be estimated using the soil erodibility
monograph method which depends on soil properties such as
the percentage of silt, clay and fine sand, percentage of
organic matter, soil structure code and permeability class.
Using this formula, the current K value was estimated for the
Cameron Highlands Catchment. The Wischmeier, (1971)
equation is as follows:
----- (4)
Where:
Percentage silt (MS: 0.002 – 0.05mm)
Percentage very fine sand (VPS; 0.05 – 0.1mm)
Percentage sand (SA: 01 – 2mm)
Percentage organic matter (OM)
Structure (S1)
Permeability (P1)
While the (Tew, 1999) for Malaysia condition proposed the
following method:
----- (5)
Where:
K– Soil Erodibility Factor (ton/ha)(ha.hr/MJ.mm)
M– (% silt +% very fine sand) x (100 – % clay)
OM– % of organic matter
S– Soil structure code
P– Permeability code
3RD INTERNATIONAL CONFERENCE ON MANAGING RIVERS IN THE 21ST CENTURY:
6 - 9 DECEMBER 2011, PULAU PINANG, MALAYSIA
5
5.3.1 Results
Using the (Wischmeier, 1971) formula, the K value for
Cameron Highlands was determined to be 0.052 while
(Tew, 1999) provided 0.033. Meanwhile, the soil
erodibility map for K factor developed using the GIS
method obtained a higher value of 0.0659. However all K
Factor for Peninsular Malaysia (DOA, 2008) shown in the
soil erodibility map shows a very low maximum value of
0.006. The DID Design Guide cites that the K values that
were used under a study in China was generally lower
compared to those in the USLE database for the
conterminous United States and that the K value
estimation method developed using the datasets from the
United States cannot be directly applied to soils in China.
Similarly in Malaysia, the Weishmeier method has also
been found to be significantly over estimated. However the
nomograph and equation developed by Tew (1999) are
based on limited data restricted to highland areas in
Malaysia. Therefore no exact value could be derived and
further study is therefore required on this field.
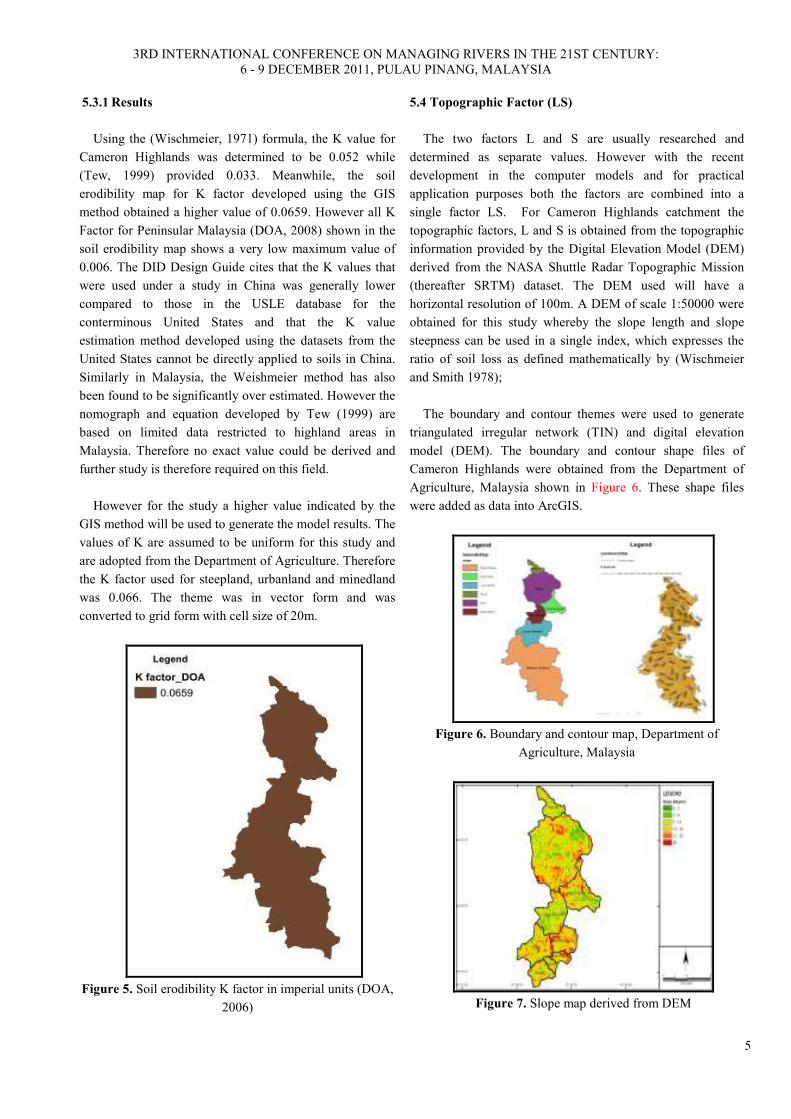
However for the study a higher value indicated by the
GIS method will be used to generate the model results. The
values of K are assumed to be uniform for this study and
are adopted from the Department of Agriculture. Therefore
the K factor used for steepland, urbanland and minedland
was 0.066. The theme was in vector form and was
converted to grid form with cell size of 20m.
Figure 5. Soil erodibility K factor in imperial units (DOA,
2006)
5.4 Topographic Factor (LS)
The two factors L and S are usually researched and
determined as separate values. However with the recent
development in the computer models and for practical
application purposes both the factors are combined into a
single factor LS. For Cameron Highlands catchment the
topographic factors, L and S is obtained from the topographic
information provided by the Digital Elevation Model (DEM)
derived from the NASA Shuttle Radar Topographic Mission
(thereafter SRTM) dataset. The DEM used will have a
horizontal resolution of 100m. A DEM of scale 1:50000 were
obtained for this study whereby the slope length and slope
steepness can be used in a single index, which expresses the
ratio of soil loss as defined mathematically by (Wischmeier
and Smith 1978);
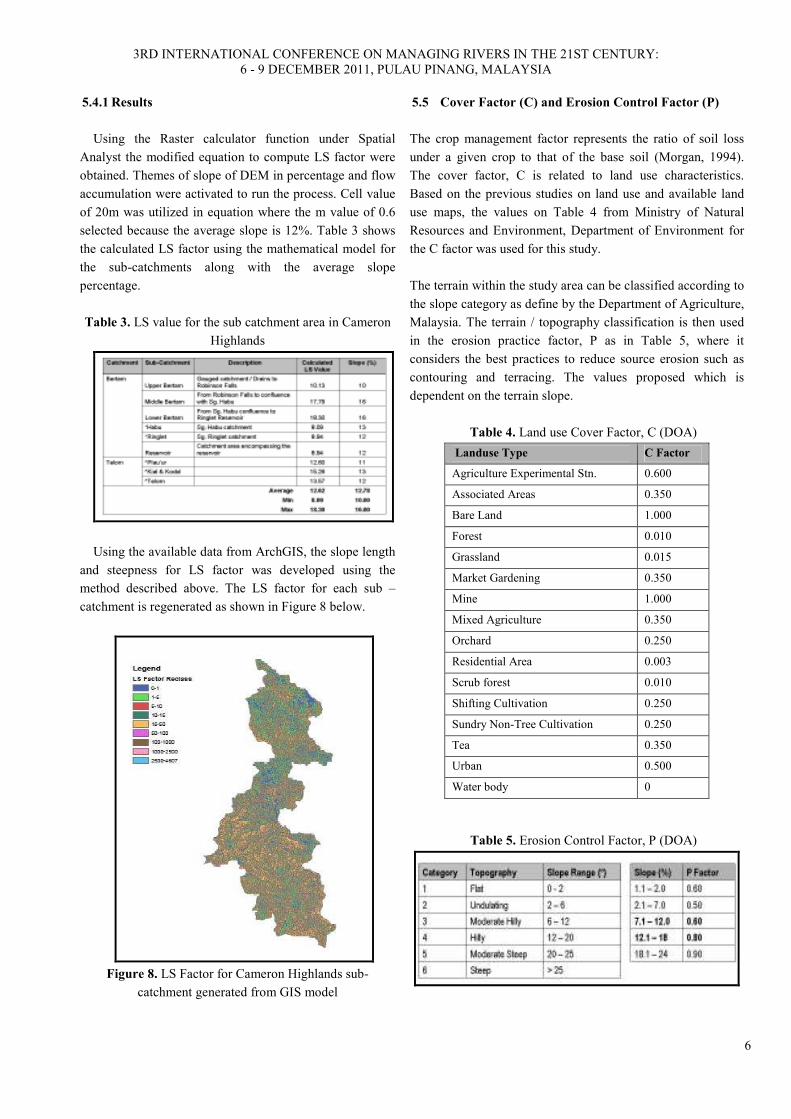
The boundary and contour themes were used to generate
triangulated irregular network (TIN) and digital elevation
model (DEM). The boundary and contour shape files of
Cameron Highlands were obtained from the Department of
Agriculture, Malaysia shown in Figure 6. These shape files
were added as data into ArcGIS.
Figure 6. Boundary and contour map, Department of
Agriculture, Malaysia
Figure 7. Slope map derived from DEM
3RD INTERNATIONAL CONFERENCE ON MANAGING RIVERS IN THE 21ST CENTURY:
6 - 9 DECEMBER 2011, PULAU PINANG, MALAYSIA
6
5.4.1 Results
Using the Raster calculator function under Spatial
Analyst the modified equation to compute LS factor were
obtained. Themes of slope of DEM in percentage and flow
accumulation were activated to run the process. Cell value
of 20m was utilized in equation where the m value of 0.6
selected because the average slope is 12%. Table 3 shows
the calculated LS factor using the mathematical model for
the sub-catchments along with the average slope
percentage.
Table 3. LS value for the sub catchment area in Cameron
Highlands
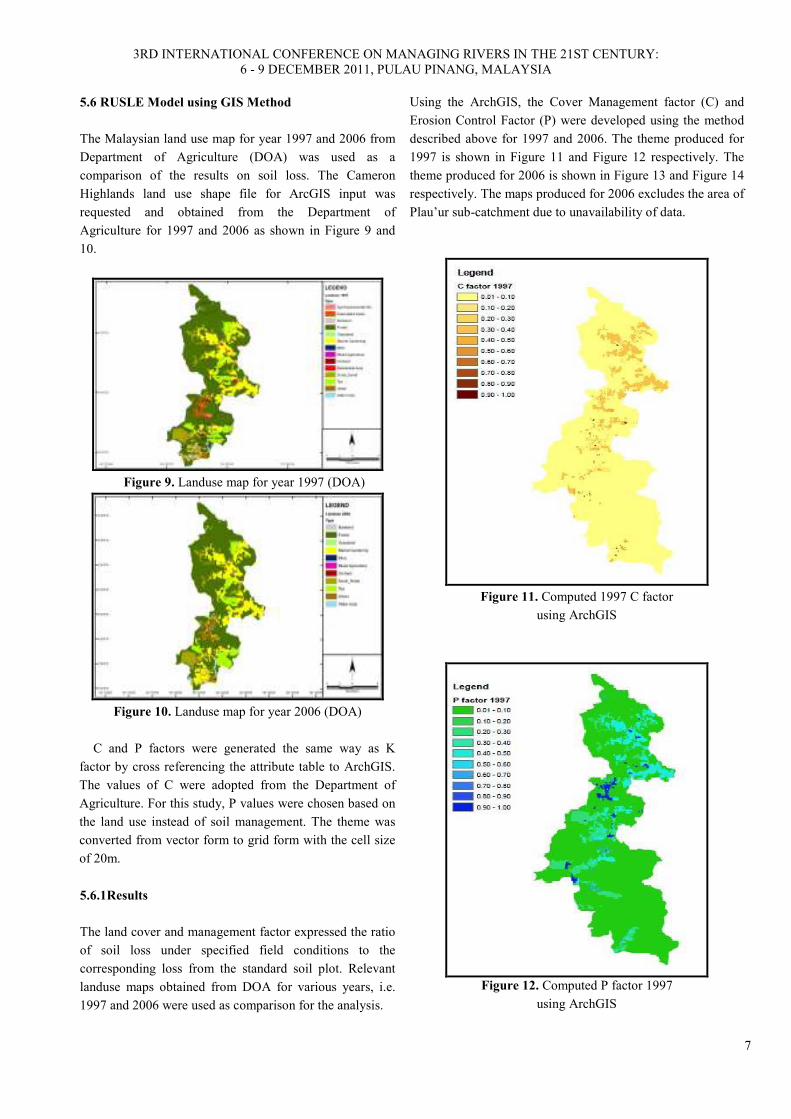
Using the available data from ArchGIS, the slope length
and steepness for LS factor was developed using the
method described above. The LS factor for each sub –
catchment is regenerated as shown in Figure 8 below.
Figure 8. LS Factor for Cameron Highlands sub-
catchment generated from GIS model
5.5 Cover Factor (C) and Erosion Control Factor (P)
The crop management factor represents the ratio of soil loss
under a given crop to that of the base soil (Morgan, 1994).
The cover factor, C is related to land use characteristics.
Based on the previous studies on land use and available land
use maps, the values on Table 4 from Ministry of Natural
Resources and Environment, Department of Environment for
the C factor was used for this study.
The terrain within the study area can be classified according to
the slope category as define by the Department of Agriculture,
Malaysia. The terrain / topography classification is then used
in the erosion practice factor, P as in Table 5, where it
considers the best practices to reduce source erosion such as
contouring and terracing. The values proposed which is
dependent on the terrain slope.
Table 4. Land use Cover Factor, C (DOA)
Landuse Type C Factor
Agriculture Experimental Stn. 0.600
Associated Areas 0.350
Bare Land 1.000
Forest 0.010
Grassland 0.015
Market Gardening 0.350
Mine 1.000
Mixed Agriculture 0.350
Orchard 0.250
Residential Area 0.003
Scrub forest 0.010
Shifting Cultivation 0.250
Sundry Non-Tree Cultivation 0.250
Tea 0.350
Urban 0.500
Water body 0
Table 5. Erosion Control Factor, P (DOA)
3RD INTERNATIONAL CONFERENCE ON MANAGING RIVERS IN THE 21ST CENTURY:
6 - 9 DECEMBER 2011, PULAU PINANG, MALAYSIA
7
5.6 RUSLE Model using GIS Method
The Malaysian land use map for year 1997 and 2006 from
Department of Agriculture (DOA) was used as a
comparison of the results on soil loss. The Cameron
Highlands land use shape file for ArcGIS input was
requested and obtained from the Department of
Agriculture for 1997 and 2006 as shown in Figure 9 and
10.
Figure 9. Landuse map for year 1997 (DOA)
Figure 10. Landuse map for year 2006 (DOA)
C and P factors were generated the same way as K
factor by cross referencing the attribute table to ArchGIS.
The values of C were adopted from the Department of
Agriculture. For this study, P values were chosen based on
the land use instead of soil management. The theme was
converted from vector form to grid form with the cell size
of 20m.
5.6.1 Results
The land cover and management factor expressed the ratio
of soil loss under specified field conditions to the
corresponding loss from the standard soil plot. Relevant
landuse maps obtained from DOA for various years, i.e.
1997 and 2006 were used as comparison for the analysis.
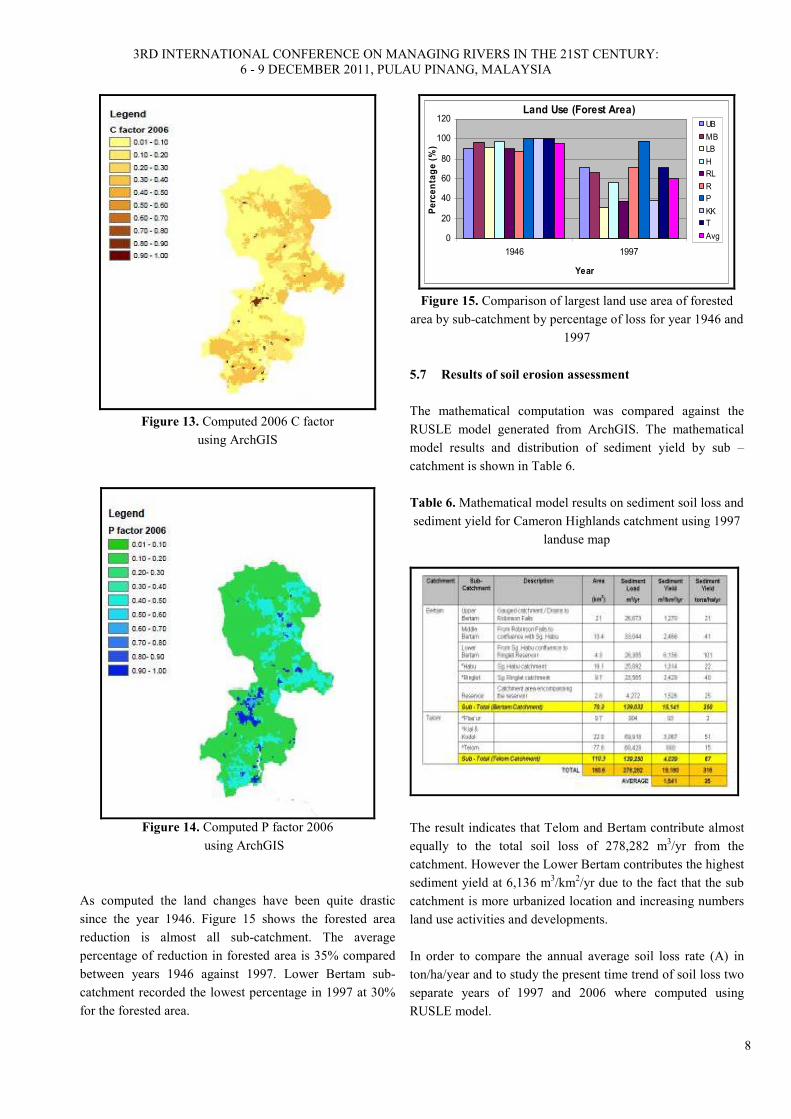
Using the ArchGIS, the Cover Management factor (C) and
Erosion Control Factor (P) were developed using the method
described above for 1997 and 2006. The theme produced for
1997 is shown in Figure 11 and Figure 12 respectively. The
theme produced for 2006 is shown in Figure 13 and Figure 14
respectively. The maps produced for 2006 excludes the area of
Plau’ur sub-catchment due to unavailability of data.
Figure 11. Computed 1997 C factor
using ArchGIS
Figure 12. Computed P factor 1997
using ArchGIS
3RD INTERNATIONAL CONFERENCE ON MANAGING RIVERS IN THE 21ST CENTURY:
6 - 9 DECEMBER 2011, PULAU PINANG, MALAYSIA
8
Figure 13. Computed 2006 C factor
using ArchGIS
Figure 14. Computed P factor 2006
using ArchGIS
As computed the land changes have been quite drastic
since the year 1946. Figure 15 shows the forested area
reduction is almost all sub-catchment. The average
percentage of reduction in forested area is 35% compared
between years 1946 against 1997. Lower Bertam sub-
catchment recorded the lowest percentage in 1997 at 30%
for the forested area.
Land Use (Forest Area)
0
20
40
60
80
100
120
1946 1997
Year
Percentage (%)
UB
MB
LB
H
RL
R
P
KK
T
Avg
Figure 15. Comparison of largest land use area of forested
area by sub-catchment by percentage of loss for year 1946 and
1997
5.7 Results of soil erosion assessment
The mathematical computation was compared against the
RUSLE model generated from ArchGIS. The mathematical
model results and distribution of sediment yield by sub –
catchment is shown in Table 6.
Table 6. Mathematical model results on sediment soil loss and
sediment yield for Cameron Highlands catchment using 1997
landuse map
The result indicates that Telom and Bertam contribute almost
equally to the total soil loss of 278,282 m3/yr from the
catchment. However the Lower Bertam contributes the highest
sediment yield at 6,136 m3/km
2/yr due to the fact that the sub
catchment is more urbanized location and increasing numbers
land use activities and developments.
In order to compare the annual average soil loss rate (A) in
ton/ha/year and to study the present time trend of soil loss two
separate years of 1997 and 2006 where computed using
RUSLE model.
3RD INTERNATIONAL CONFERENCE ON MANAGING RIVERS IN THE 21ST CENTURY:
6 - 9 DECEMBER 2011, PULAU PINANG, MALAYSIA
9
To predict the annual average soil loss rate in the upper
catchment of Cameron Highlands, the R, K, LS, C and P
factors were multiplied using the raster calculator function
tool of ArcGIS and the respective annual soil loss maps for
the catchment of Cameron Highlands were produced for
the year 1997 and 2006. However the Plau’ur sub-
catchment was excluded from the computation because of
insufficient land use data and the area is still relatively
undeveloped.
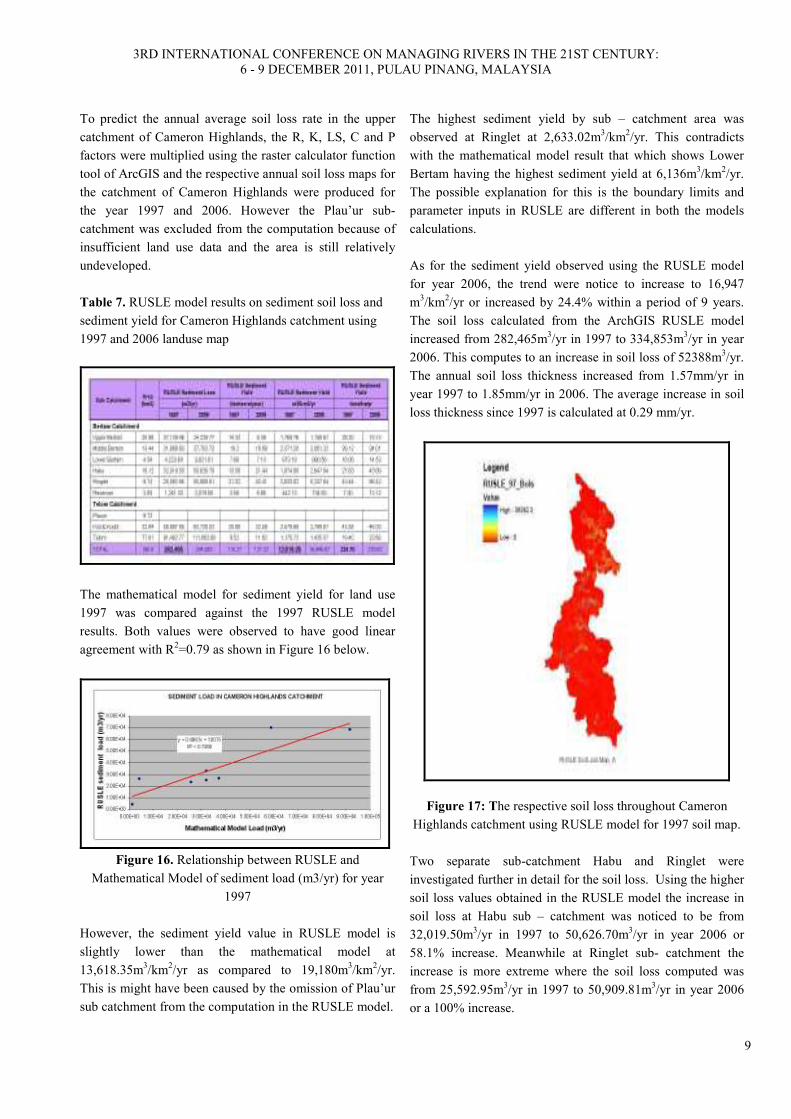
Table 7. RUSLE model results on sediment soil loss and
sediment yield for Cameron Highlands catchment using
1997 and 2006 landuse map
The mathematical model for sediment yield for land use
1997 was compared against the 1997 RUSLE model
results. Both values were observed to have good linear
agreement with R2=0.79 as shown in Figure 16 below.
Figure 16. Relationship between RUSLE and
Mathematical Model of sediment load (m3/yr) for year
1997
However, the sediment yield value in RUSLE model is
slightly lower than the mathematical model at
13,618.35m3/km
2/yr as compared to 19,180m
3/km
2/yr.
This is might have been caused by the omission of Plau’ur
sub catchment from the computation in the RUSLE model.
The highest sediment yield by sub – catchment area was
observed at Ringlet at 2,633.02m3/km
2/yr. This contradicts
with the mathematical model result that which shows Lower
Bertam having the highest sediment yield at 6,136m3/km
2/yr.
The possible explanation for this is the boundary limits and
parameter inputs in RUSLE are different in both the models
calculations.
As for the sediment yield observed using the RUSLE model
for year 2006, the trend were notice to increase to 16,947
m3/km
2/yr or increased by 24.4% within a period of 9 years.
The soil loss calculated from the ArchGIS RUSLE model
increased from 282,465m3/yr in 1997 to 334,853m
3/yr in year
2006. This computes to an increase in soil loss of 52388m3/yr.
The annual soil loss thickness increased from 1.57mm/yr in
year 1997 to 1.85mm/yr in 2006. The average increase in soil
loss thickness since 1997 is calculated at 0.29 mm/yr.
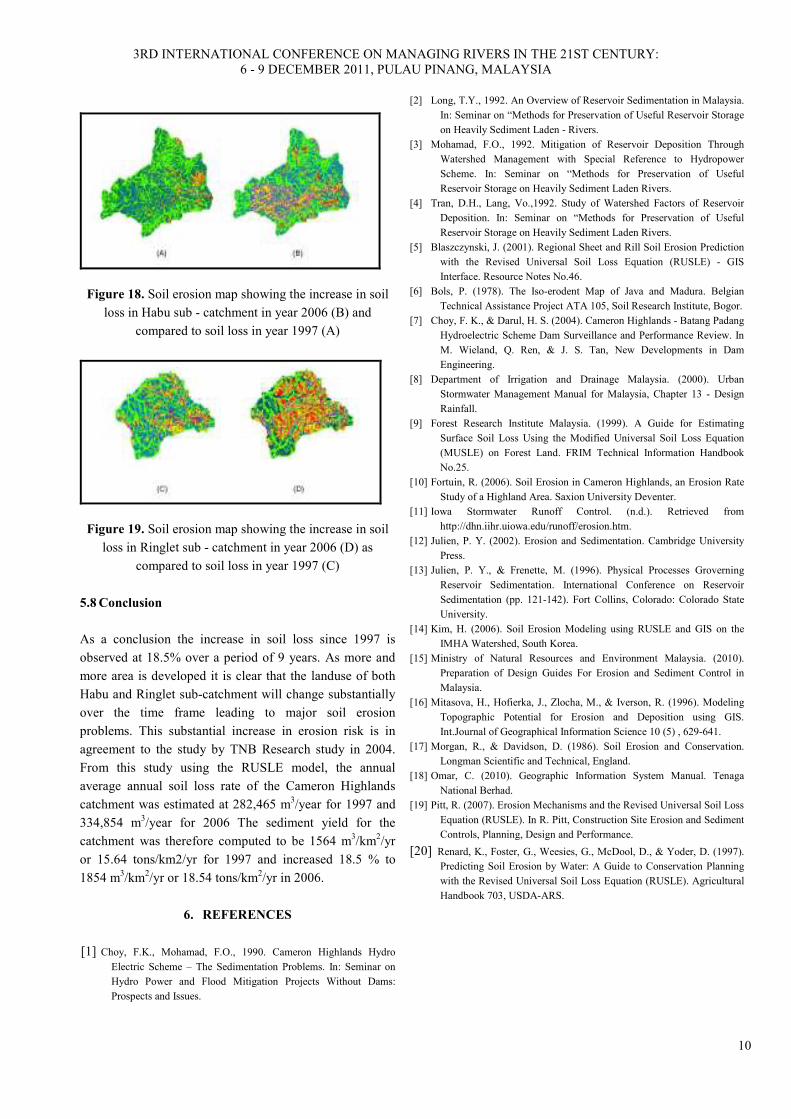
Figure 17: The respective soil loss throughout Cameron
Highlands catchment using RUSLE model for 1997 soil map.
Two separate sub-catchment Habu and Ringlet were
investigated further in detail for the soil loss. Using the higher
soil loss values obtained in the RUSLE model the increase in
soil loss at Habu sub – catchment was noticed to be from
32,019.50m3/yr in 1997 to 50,626.70m
3/yr in year 2006 or
58.1% increase. Meanwhile at Ringlet sub- catchment the
increase is more extreme where the soil loss computed was
from 25,592.95m3/yr in 1997 to 50,909.81m
3/yr in year 2006
or a 100% increase.
3RD INTERNATIONAL CONFERENCE ON MANAGING RIVERS IN THE 21ST CENTURY:
6 - 9 DECEMBER 2011, PULAU PINANG, MALAYSIA
10
Figure 18. Soil erosion map showing the increase in soil
loss in Habu sub - catchment in year 2006 (B) and
compared to soil loss in year 1997 (A)
Figure 19. Soil erosion map showing the increase in soil
loss in Ringlet sub - catchment in year 2006 (D) as
compared to soil loss in year 1997 (C)
5.8 Conclusion
As a conclusion the increase in soil loss since 1997 is
observed at 18.5% over a period of 9 years. As more and
more area is developed it is clear that the landuse of both
Habu and Ringlet sub-catchment will change substantially
over the time frame leading to major soil erosion
problems. This substantial increase in erosion risk is in
agreement to the study by TNB Research study in 2004.
From this study using the RUSLE model, the annual
average annual soil loss rate of the Cameron Highlands
catchment was estimated at 282,465 m3/year for 1997 and
334,854 m3/year for 2006 The sediment yield for the
catchment was therefore computed to be 1564 m3/km
2/yr
or 15.64 tons/km2/yr for 1997 and increased 18.5 % to
1854 m3/km
2/yr or 18.54 tons/km
2/yr in 2006.
6. REFERE�CES
[1] Choy, F.K., Mohamad, F.O., 1990. Cameron Highlands Hydro
Electric Scheme – The Sedimentation Problems. In: Seminar on
Hydro Power and Flood Mitigation Projects Without Dams:
Prospects and Issues.
[2] Long, T.Y., 1992. An Overview of Reservoir Sedimentation in Malaysia.
In: Seminar on “Methods for Preservation of Useful Reservoir Storage
on Heavily Sediment Laden - Rivers.
[3] Mohamad, F.O., 1992. Mitigation of Reservoir Deposition Through
Watershed Management with Special Reference to Hydropower
Scheme. In: Seminar on “Methods for Preservation of Useful
Reservoir Storage on Heavily Sediment Laden Rivers.
[4] Tran, D.H., Lang, Vo.,1992. Study of Watershed Factors of Reservoir
Deposition. In: Seminar on “Methods for Preservation of Useful
Reservoir Storage on Heavily Sediment Laden Rivers.
[5] Blaszczynski, J. (2001). Regional Sheet and Rill Soil Erosion Prediction
with the Revised Universal Soil Loss Equation (RUSLE) - GIS
Interface. Resource Notes No.46.
[6] Bols, P. (1978). The Iso-erodent Map of Java and Madura. Belgian
Technical Assistance Project ATA 105, Soil Research Institute, Bogor.
[7] Choy, F. K., & Darul, H. S. (2004). Cameron Highlands - Batang Padang
Hydroelectric Scheme Dam Surveillance and Performance Review. In
M. Wieland, Q. Ren, & J. S. Tan, New Developments in Dam
Engineering.
[8] Department of Irrigation and Drainage Malaysia. (2000). Urban
Stormwater Management Manual for Malaysia, Chapter 13 - Design
Rainfall.
[9] Forest Research Institute Malaysia. (1999). A Guide for Estimating
Surface Soil Loss Using the Modified Universal Soil Loss Equation
(MUSLE) on Forest Land. FRIM Technical Information Handbook
No.25.
[10] Fortuin, R. (2006). Soil Erosion in Cameron Highlands, an Erosion Rate
Study of a Highland Area. Saxion University Deventer.
[11] Iowa Stormwater Runoff Control. (n.d.). Retrieved from
http://dhn.iihr.uiowa.edu/runoff/erosion.htm.
[12] Julien, P. Y. (2002). Erosion and Sedimentation. Cambridge University
Press.
[13] Julien, P. Y., & Frenette, M. (1996). Physical Processes Groverning
Reservoir Sedimentation. International Conference on Reservoir
Sedimentation (pp. 121-142). Fort Collins, Colorado: Colorado State
University.
[14] Kim, H. (2006). Soil Erosion Modeling using RUSLE and GIS on the
IMHA Watershed, South Korea.
[15] Ministry of Natural Resources and Environment Malaysia. (2010).
Preparation of Design Guides For Erosion and Sediment Control in
Malaysia.
[16] Mitasova, H., Hofierka, J., Zlocha, M., & Iverson, R. (1996). Modeling
Topographic Potential for Erosion and Deposition using GIS.
Int.Journal of Geographical Information Science 10 (5) , 629-641.
[17] Morgan, R., & Davidson, D. (1986). Soil Erosion and Conservation.
Longman Scientific and Technical, England.
[18] Omar, C. (2010). Geographic Information System Manual. Tenaga
National Berhad.
[19] Pitt, R. (2007). Erosion Mechanisms and the Revised Universal Soil Loss
Equation (RUSLE). In R. Pitt, Construction Site Erosion and Sediment
Controls, Planning, Design and Performance.
[20] Renard, K., Foster, G., Weesies, G., McDool, D., & Yoder, D. (1997).
Predicting Soil Erosion by Water: A Guide to Conservation Planning
with the Revised Universal Soil Loss Equation (RUSLE). Agricultural
Handbook 703, USDA-ARS.


