Embed Size (px)
Citation preview

Copyright 2011 by the RESEARCH IN THE SCHOOLS
Mid-South Educational Research Association 2011, Vol. 18, No. 1, i-xxxv
Spring 2011 i RESEARCH IN THE SCHOOLS
Editorial: Citation Errors Revisited: The Case for Educational Researcher
Anthony J. Onwuegbuzie and Julie P. Combs
Sam Houston State University
Rebecca K. Frels
Lamar University
John R. Slate
Sam Houston State University
In a previous editorial, Onwuegbuzie, Frels, and
Slate (2010) examined the characteristics and
prevalence of citation errors, which occurs when
authors fail “to make certain that each source
referenced appears in both places [text and reference
list] and that the text citation and reference list entry
are identical in spelling of author names and year”
(American Psychological Association [APA], 2010,
p. 174). By conducting a mixed analysis (i.e.,
involving the combining of quantitative analyses and
qualitative analyses) of 150 manuscripts submitted to
Research in the Schools (RITS) over a 7-year period,
Onwuegbuzie, Frels, et al. (2010) were able to
deconstruct the citation error into the following five
types: (a) a work that is cited in text but does not
appear in the reference list, (b) a work that appears in
the text that is not consistent with the corresponding
work that is presented in the reference list, (c) a work
that is cited in the reference list but that does not
appear in the text, (d) a work that appears in the text
that is incomplete or inaccurate, and (e) a work that
appears in the reference list that is incomplete or
inaccurate. More than 90% (i.e., 91.8%) of authors,
representing authors from every region of the United
States, committed one or more of these five types of
citation errors, rendering the citation error as the most
prevalent citation error among RITS authors—being
1.6 times more prevalent than is the next most
common APA error identified by Onwuegbuzie and
Combs (2009)—namely, relating to the incorrect use
of numbers (57.3%). Further, these RITS authors, on
average, committed more than six citation errors per
manuscript (M = 6.26, SD = 7.09). Even more
notably, manuscripts that were accepted for
publication (M = 3.62, SD = 3.56) contained
statistically significantly and practically significantly
(Cohen’s [1988] d = 0.45) less citation errors than did
manuscripts that were not accepted for publication
In a previous editorial, Onwuegbuzie, Frels, and Slate (2010) presented the results of a mixed analysis of 150
manuscripts submitted to Research in the Schools over a 7-year period, which revealed that citation errors were
committed by 91.8% of the authors. These authors concluded that citation errors not only represented the most
pervasive APA error, but citation errors also predicted whether a manuscript was accepted for publication.
However, these authors questioned whether the same citation error rates would be observed among manuscripts
submitted to Tier I journals. Consequently, in the present editorial, we replicate and extend their work by using
mixed analysis techniques to examine the citation error rate of 88 manuscripts submitted to the highest ranked
educational journal, Educational Researcher, over a 3-year period. Disturbingly, 88.6% of the manuscripts
contained one or more citation errors. Further, the mean number of citation errors per manuscript was 7.83 (SD
= 8.59), with the number of citation errors being as high as 42. Findings also revealed that for every 4
references included, on average, 1of them represented a citation error. A multiple regression analysis revealed
that every additional author of a manuscript was associated with an increase of 3.30 citation errors, on average.
Further, every additional 9 references tended to be associated with an increase of 1.00 citation error.
Consequently, we provide a checklist for reducing citation errors, as well as a practice exercise. We hope that
the tools and strategies we provide will help authors to prevent citation errors in the future.
Correspondence should be addressed to Anthony J.
Onwuegbuzie, Department of Educational
Leadership and Counseling, Box 2119, Sam
Houston State University, Huntsville, Texas 77341
E-Mail: [email protected]

ANTHONY J. ONWUEGBUZIE, JULIE P. COMBS, REBECCA K. FRELS, AND JOHN R. SLATE
Spring 2011 ii RESEARCH IN THE SCHOOLS
(i.e., revise and resubmit, or reject) (M = 6.78, SD =
7.34).
Based on these and other findings,
Onwuegbuzie, Frels, et al. (2010) concluded that
citation errors represent a widespread problem that is
committed by an unacceptably high proportion of
RITS authors and that is an important predictor of the
quality of a manuscript. As posed by Onwuegbuzie,
Frels, et al. (2010), the question to be asked at this
stage is: Does the high citation error rate associated
with RITS authors represent an outlier? That is, is
this high citation error rate more reflective of the
amount of influence that RITS has on the educational
community than it is reflective of a rampant problem
among authors of empirical articles representing the
field of education in general? Interestingly, with an
editorial board of national and international scholars,
with authors submitting manuscripts to RITS who are
affiliated with institutions that represent more than
one half of the states in the United States (Frels,
Onwuegbuzie, & Slate, 2009), and with authors who
have published articles in RITS being “affiliated with
various school districts, the private sector, branches
of the U.S. Government, and public and private
universities in the United States, France, China,
Guam, Israel, and Turkey” (Frels, Onwuegbuzie, &
Slate, 2010, p. xiv), it is difficult to argue that RITS
does not have national visibility. Moreover, the
national visibility of RITS is increasing at a fast rate.
For example, utilizing Harzing’s (2009) Publish or
Perish software and Google Scholar, Frels et al.
(2009) reported that RITS articles were cited 838
times, yielding 55.87 citations per year. In less than
2 years, the number of times that RITS articles have
been cited has more than doubled (n = 1,998),
yielding 83.25 citations per year. Further, the h-
index, which provides an index of sustained impact
(Hirsch, 2005), in this same short time span,
incredibly has increased from 15 to 24.
Table 1 presents impact indices for all journals
associated with regional or state associations that are
affiliated with the American Educational Research
Association (AERA). It can be seen from this table
that RITS has, by far, better impact indices than do
any of the six other journals that are associated with a
state or regional educational research association.
Table 1
Impact Indices for All Journals Associated with Regional/State Associations Affiliated with the American
Educational Research Association
Educational Association Name of Journal Number
of Articles
Published
Total
Number of
Citations
Mean Number
of Citations
per Year
h-index
Mid-South Educational
Research Association
Research in the Schools 219 1,998 83.25 24
Eastern Educational Research
Association
Journal of Research in
Education
208 514 4.67 10
Mid-Western Educational
Research Association
Mid-Western
Educational Researcher
144 245 8.45 8
Northern Rocky Mountain
Educational Research
Association
The Researcher 91 246 2.83 7
Florida Educational Research
Association
Florida Journal of
Educational Research
197 446 9.10 11
Hawaii Educational Research
Association
Pacific Educational
Research Journal
15 59 2.36 4
Louisiana Educational
Research Association
Contemporary Issues in
Educational Research
238 120 40.00 4
American Educational
Research Association
Educational Researcher 3,670 139,377 2,965.47 177

EDITORIAL: CITATION ERRORS REVISITED: THE CASE FOR EDUCATIONAL RESEARCHER
Spring 2011 iii RESEARCH IN THE SCHOOLS
Despite this evidence of increasing impact, RITS,
as yet, has not reached the highest echelons of
journals. Thus, although some of the authors who
publish articles in RITS are among the most prolific,
it is likely that most of the prolific authors will
submit manuscripts to journals with the highest
impact factors. And, assuming that prolific authors
tend to commit less citation errors, it is reasonable to
hypothesize that journals with the highest impact
factors would have manuscripts submitted to their
journals that have significantly lower citation error
rates. To this end, in this editorial, we replicate and
extend the work of Onwuegbuzie, Frels, et al. (2010)
by examining the citation error rate of manuscripts
submitted to a Tier I educational journal.
Sources of Evidence
We conducted a mixed research study in which
we examined 88 manuscripts submitted to
Educational Researcher over a period of 3.5 years.
The journal Educational Researcher was selected
because, with an impact factor of 3.774, it has the
highest ranking among 177 journals representing
education and education research. The lead two
authors of this editorial were part of the editor team
(i.e., editor and associate editor) of Educational
Researcher (2006-2010) that secured this extremely
high impact factor. As such, they had access to every
manuscript submitted to Educational Researcher
during this period. The 88 manuscripts selected for
study represented those manuscripts that were
submitted for the first time to the Research News and
Comment section of Educational Researcher—one of
two sections at that time (with the other section being
called Features that was co-edited by Patricia B.
Elmore and Gregory Camilli). Further, these 88
manuscripts represented those manuscripts that had
not been subjected to a desk reject during the internal
review process (i.e., before the manuscript is sent out
for external review, the manuscript was deemed
inappropriate for Educational Researcher because it
had a focus or content that was outside the scope of
the journal [e.g., the topic did not pertain to an
educational issue]; did not follow adequately the
stipulated format for manuscripts [e.g., the
manuscript resembled more of a traditional empirical
report rather than an essay]; or the manuscript was
written in a style that was far removed from APA
[e.g., the manuscript followed Chicago Manual of
style; Chicago Manual, 2003]). That is, each of the
88 manuscripts had met the criteria for being sent out
for external review. These 88 manuscripts
represented 52.07% of all manuscripts submitted to
the Research News and Comment section of
Educational Researcher over this period, which made
our findings generalizable to the population of
manuscripts submitted to Educational Researcher—
at least over this period of time.
The two editors of the Research News and
Comment section of Educational Researcher
meticulously documented every citation error
committed by these 88 sets of authors over the 3.5-
year period. Alongside collecting citation error
information, theses editors collected an array of
information associated with each of these
manuscripts, including the following: the length of
the manuscript (i.e., number of pages, number of
words), the length of the reference list (i.e., total
number of references), topic of the manuscript, and
the number of authors per manuscript. In addition,
the editors documented every APA error that
appeared in these 88 manuscripts. Therefore, the data
set developed by these editors is as extensive as that
developed by Onwuegbuzie, Frels, et al. (2010).
Further, as was the case for Onwuegbuzie, Frels, et
al.’s (2010) data set, the Educational Researcher data
set is unique because only journal editors have the
opportunity to collect these data.
Methodology
Using the philosophical lens of dialectic
pluralism (i.e., representing a belief in combining
multiple epistemological perspectives within the
same study; Johnson, 2011), we utilized mixed
analysis techniques—specifically, a sequential
mixed analysis (Onwuegbuzie & Combs, 2010)—to
investigate the characteristics and prevalence of
citation errors in the 88 manuscripts submitted to
Educational Researcher. Specifically, we used a
four-stage sequential mixed analysis procedure.
Each of these stages is described below.
Stage 1 Analysis
The first stage involved a classical content
analysis (Berelson, 1952; see also Leech &
Onwuegbuzie, 2007, 2008, 2011) of the 88
manuscripts to determine the frequency of each of
the five citation error themes (i.e., Not in Reference
List, Not Consistent with Reference List, Not in
Text, Incomplete or Incorrect Citation, and
Incomplete or Incorrect Reference) identified by
Onwuegbuzie, Frels, et al. (2010), which led to an a
priori analysis (Constas, 1992). From this analysis,
the total number of citation errors also was
computed. In addition, a citation error rate was
computed for each manuscript by dividing the
number of citation errors by the corresponding
number of references appearing in the reference list.

ANTHONY J. ONWUEGBUZIE, JULIE P. COMBS, REBECCA K. FRELS, AND JOHN R. SLATE
Spring 2011 iv RESEARCH IN THE SCHOOLS
Stage 2 Analysis
The second stage involved creating an “inter-
respondent matrix” (Onwuegbuzie, 2003, p. 396) of
the five citation error themes that were extracted in
the first stage such that, for each manuscript, a “1”
was assigned for an error theme if the manuscript
contained one or more citation error themes of this
type and a “0” was assigned if the manuscript did
not contain any citation error themes of this type
(Onwuegbuzie, 2003; Onwuegbuzie & Teddlie,
2003)—yielding a manuscript x citation error theme
matrix that comprised a combination of 0s and 1s
(Onwuegbuzie, 2003, p. 396). The creation of this
inter-respondent matrix represented quantitizing the
citation error themes (i.e., converting qualitative
data into quantitative data that can be analyzed
statistically; Miles & Huberman, 1994;
Sandelowski, Voils, & Knafl, 2009; Tashakkori &
Teddlie, 1998).
The inter-respondent matrix was used to conduct
a principal component analysis to determine the
underlying structure of the citation error themes.
This inter-respondent matrix was transformed to a
matrix of bivariate associations that represented
tetrachoric correlation coefficients because the
citation error themes had been quantitized to
dichotomous data (i.e., “0” vs. “1”). Indeed,
tetrachoric correlation coefficients are justified to
use when examining the relationship between two
(artificial) dichotomous variables (cf. Onwuegbuzie
et al., 2007). Thus, the matrix of tetrachoric
correlation coefficients served as the basis of the
principal component analysis. Specifically, an
orthogonal (i.e., varimax) rotation was employed,
combining use of the eigenvalue-greater-than-one
rule (i.e., K1; Kaiser, 1958), the scree test (i.e., a
plot of eigenvalues against the factors in descending
order; Cattell, 1966; Kieffer, 1999; Zwick &
Velicer, 1986), and a parallel analysis (involving
extracting eigenvalues from random data sets that
parallel the actual data set with respect to the
sample size and number of variables; Thompson,
2004; Zwick & Velicer, 1982, 1986) to determine an
appropriate number of factors to retain. These
factors represented meta-themes (Onwuegbuzie,
2003), whereby each meta-theme contained at least
one citation error theme. The proportion of variance
explained by each factor after rotation, also known
as the trace, yielded an effect size index for each
meta-theme (Onwuegbuzie, 2003). By establishing
the hierarchical relationship among the citation error
themes, the verification component of categorization
was empirical, rational, and technical (Constas,
1992).
Stage 3 Analysis
The third stage involved conducting a latent class
analysis to determine the smallest number of
clusters (i.e., latent classes) that accounts for all the
associations among the citation error themes. The
assumption behind this latent class analysis was that
a certain number of unique citation error themes
existed, and that manuscripts could be classified into
a small number of distinct clusters known as latent
classes based on their profiles of citation errors,
such that each manuscript belonged to only one
cluster. This latent class analysis represented the
qualitizing of the data (i.e., converting numeric data
into [qualitative] narrative profiles; Tashakkori &
Teddlie, 1998).
Stage 4 Analysis
The fourth and final stage involved using the
inter-respondent matrix pertaining to the citation
error codes to determine which of the selected
manuscript variables (i.e., number of authors,
number of pages, number of words) predicted the
number of citation errors. In addition, the inter-
respondent matrix was used to conduct a canonical
correlation analysis to examine the multivariate
relationship between the five citation error themes
and the selected manuscript variables.
Findings
Stage 1 Findings
The classical content analysis revealed a total of
681 citation errors across the 88 manuscripts,
yielding nearly eight citation errors per manuscript,
on average (M = 7.83, SD = 8.59), with the number of
citation errors ranging from 0 to 42. Surprisingly,
this mean number of citation errors is higher than that
reported for RITS by Onwuegbuzie, Frels, et al.
(2010) (M = 6.26, SD = 7.09, n = 150), although this
difference was not statistically significant (Mann-
Whitney’s U = 5830.00, p = .29, Cohen’s [1988] d =
0.20) 1
. The number of references in the 88
manuscripts ranged from 0 to 166 (M = 37.16, SD =
31.36), yielding citation error rates (i.e., number of
citation errors / total number of references) that
ranged from 0 to 425.00% (i.e., more than four times
as many citation errors as references cited), with a
mean citation error rate of 27.39% (SD = 58.80%).
This mean citation error rate indicated that for every
four references included, on average, one of them
represented some type of citation error.
Disturbingly, only 11.4% of the manuscripts did
not contain any citation errors, implying that 88.6%
of the manuscripts contained one or more citation
errors. Further, more than one in four manuscripts
(27.6%) contained at least 10 citation errors, 16.1%
contained at least 15 citation errors, 10.3% contained

EDITORIAL: CITATION ERRORS REVISITED: THE CASE FOR EDUCATIONAL RESEARCHER
Spring 2011 v RESEARCH IN THE SCHOOLS
20 or more citation errors, and 3.4% contained 30 or
more citation errors. The proportion of manuscripts
that contained one or more citation errors is only
slightly smaller than is the 91.8% reported by
Onwuegbuzie, Frels, et al. (2010) and, thus, this
difference was not statistically significant (Χ2[1] =
0.75, p = .39).
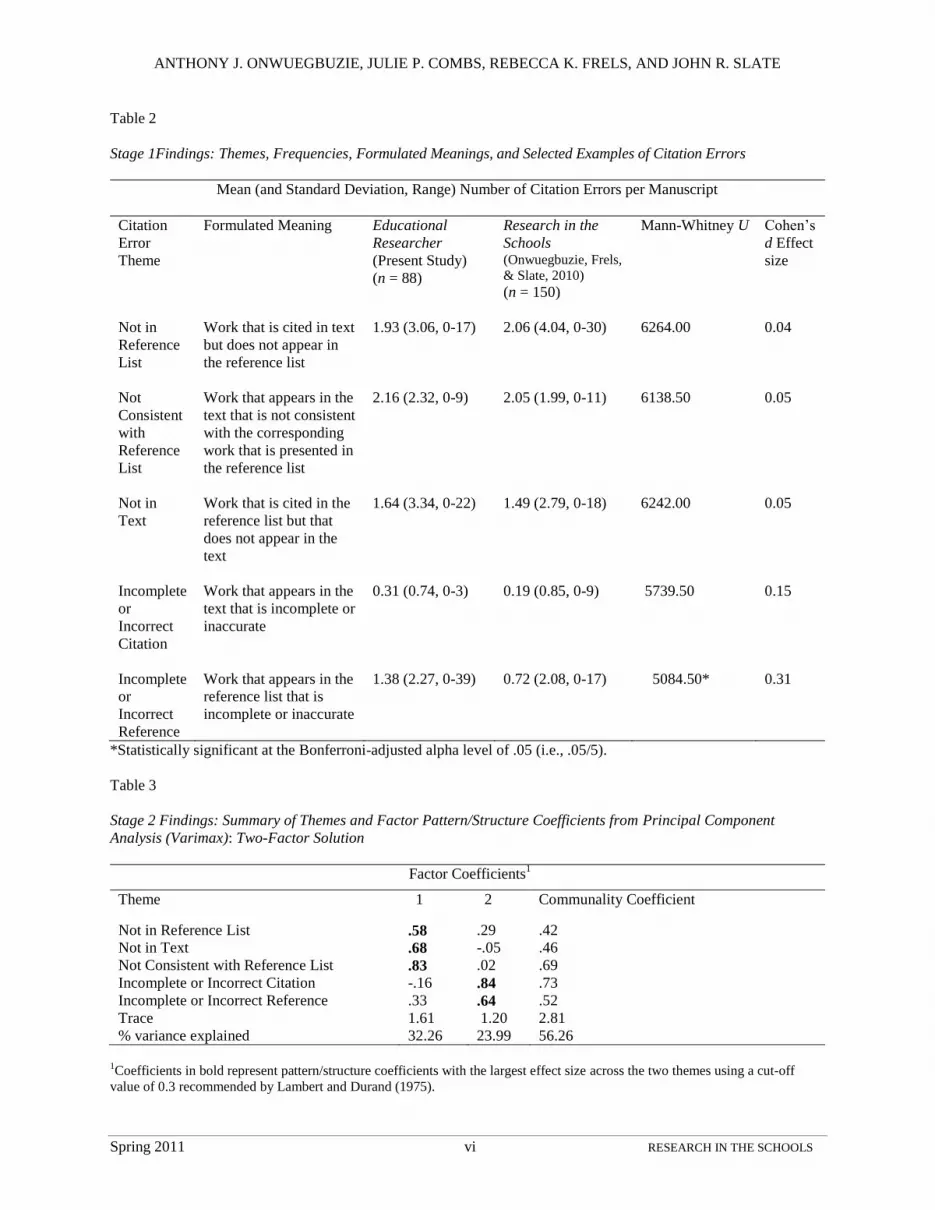
Table 2 presents the mean, standard deviation,
and range regarding the number of citation errors
pertaining to each of the five citation error themes for
both the Educational Researcher manuscripts and
Onwuegbuzie et al.’s (2010) RITS manuscripts, as
well as the t values and effect sizes comparing both
sets of mean citation errors. It can be seen that
whereas for the RITS manuscripts, authors
committing citation errors associated with in-text
citations not being presented in the reference list (i.e.,
Not in Reference List) and citation errors associated
with citations in the text and the reference list not
being consistent (i.e., Not Consistent with Reference
List) were almost equally the most prevalent; for the
Educational Researcher manuscripts, the citation
errors associated with citations in the text and the
reference list not being consistent was by far the most
prevalent. Interestingly, after using the Bonferroni
adjustment to control for the inflation of Type I error
(e.g., Chandler, 1995; Ho, 2006; Manly, 2004; Vogt,
2005), four of the 10 pairwise comparisons (i.e.,
nonparametric dependent samples t test) were
statistically significant (i.e., p < .005). Specifically,
Incomplete or Incorrect Citation errors were
statistically significantly less prevalent than were all
other error themes, namely, Incomplete or Incorrect
Reference errors (d = 0.63), Not in Text errors (d =
0.55), Not in Reference List errors (d = 0.73), and
Not Consistent with Reference List errors (d =
1.07)—representing moderate to large effect sizes.
Comparing the Educational Researcher and RITS
manuscripts revealed that the Educational
Researcher manuscripts, on average, contained more
citation errors pertaining to the following four error
themes: Incomplete or Incorrect Citation errors were
statistically significantly less prevalent than were all
other error themes, namely, Not Consistent with
Reference List errors, Not in Text errors, Incomplete
or Incorrect Reference errors, and Not in Text errors.
The RITS manuscripts, on average, only had a greater
number of Not in Reference List citation errors.
However, only the Incomplete or Incorrect Citation
errors yielded a statistically significant difference
with a small-to-moderate effect size (d = 0.31).
A series (i.e., n = 10) of nonparametric (i.e.,
Spearman) correlations, after applying the Bonferroni
adjustment to control for the inflation of Type I error,
revealed two statistically significant findings.
Specifically, authors who committed Not Consistent
with Reference List errors were statistically
significantly more likely also to commit Not in
Reference List errors (rs[86] = .50, p < .001) and Not
in Text errors (rs[86] = .48, p < .001). Using Cohen’s
(1988) criteria, both of these relationships were large.
Stage 2 Findings
As did Onwuegbuzie, Frels, et al. (2010), a
principal component analysis was used to determine
the number of factors underlying the five citation
error themes. The Kaiser-Meyer-Olkin (KMO)
measure of sampling adequacy was greater than .5
(i.e., KMO = .59) and Bartlett’s test of sphericity
was statistically significant (Χ2[10] = 30.37, p <
.001), which justified the principal component
analysis. The eigenvalue-greater-than-one rule (i.e.,
K1; Kaiser, 1958) indicated that two factors (i.e.,
meta-themes) be retained, as did the scree test. In
addition, a parallel analysis was conducted as a
validity check to the K1 and scree test (Zwick &
Velicer, 1982, 1986). For the current data of 88
manuscripts and five variables (i.e., citation error
themes), a series of (i.e., n = 1,000) random data
matrices of size 88 x 5 was generated, and
eigenvalues were computed for the correlation
matrices for the original data and for each of the
1,000 random data sets. The eigenvalues derived
from the actual data then were compared to the
eigenvalues derived from the random data, in order
to identify the number of components that account
for more variance than do the components derived
from random data. This parallel analysis also
suggested retaining two factors.
This two-factor solution is presented in Table 3.
Using a cutoff correlation of 0.3, recommended by
Lambert and Durand (1975) as an acceptable lower
bound for pattern/structure coefficients, Table 3
reveals that the following citation error themes had
pattern/structure coefficients with large effect sizes
on the first factor: Not in Reference List, Not
Consistent with Reference List, and Not in Text; and
the following citation error themes had
pattern/structure coefficients with large effect sizes
on the second factor: Incomplete or Incorrect
Citation and Incomplete or Incorrect Reference. As
was the case for Onwuegbuzie et al.’s (2010) study,
the first meta-theme (i.e., Factor 1) was labeled
Missing or Inconsistent Citations/References, and
the second meta-theme (i.e., Factor 2) was termed
Erroneous Citations/References.
ANTHONY J. ONWUEGBUZIE, JULIE P. COMBS, REBECCA K. FRELS, AND JOHN R. SLATE
Spring 2011 vi RESEARCH IN THE SCHOOLS
Table 2
Stage 1Findings: Themes, Frequencies, Formulated Meanings, and Selected Examples of Citation Errors
Mean (and Standard Deviation, Range) Number of Citation Errors per Manuscript
Citation
Error
Theme
Formulated Meaning Educational
Researcher
(Present Study)
(n = 88)
Research in the
Schools (Onwuegbuzie, Frels,
& Slate, 2010)
(n = 150)
Mann-Whitney U Cohen’s
d Effect
size
Not in
Reference
List
Work that is cited in text
but does not appear in
the reference list
1.93 (3.06, 0-17) 2.06 (4.04, 0-30) 6264.00 0.04
Not
Consistent
with
Reference
List
Work that appears in the
text that is not consistent
with the corresponding
work that is presented in
the reference list
2.16 (2.32, 0-9) 2.05 (1.99, 0-11) 6138.50
0.05
Not in
Text
Work that is cited in the
reference list but that
does not appear in the
text
1.64 (3.34, 0-22) 1.49 (2.79, 0-18) 6242.00 0.05
Incomplete
or
Incorrect
Citation
Work that appears in the
text that is incomplete or
inaccurate
0.31 (0.74, 0-3) 0.19 (0.85, 0-9) 5739.50 0.15
Incomplete
or
Incorrect
Reference
Work that appears in the
reference list that is
incomplete or inaccurate
1.38 (2.27, 0-39) 0.72 (2.08, 0-17) 5084.50* 0.31
*Statistically significant at the Bonferroni-adjusted alpha level of .05 (i.e., .05/5).
Table 3
Stage 2 Findings: Summary of Themes and Factor Pattern/Structure Coefficients from Principal Component
Analysis (Varimax): Two-Factor Solution
Factor Coefficients1
Theme 1 2 Communality Coefficient
Not in Reference List
Not in Text
Not Consistent with Reference List
Incomplete or Incorrect Citation
Incomplete or Incorrect Reference
.58
.68
.83
-.16
.33
.29
-.05
.02
.84
.64
.42
.46
.69
.73
.52
Trace
% variance explained
1.61
32.26
1.20
23.99
2.81
56.26
1Coefficients in bold represent pattern/structure coefficients with the largest effect size across the two themes using a cut-off
value of 0.3 recommended by Lambert and Durand (1975).

EDITORIAL: CITATION ERRORS REVISITED: THE CASE FOR EDUCATIONAL RESEARCHER
Spring 2011 vii RESEARCH IN THE SCHOOLS
The trace (i.e., the proportion of variance explained,
or eigenvalue, after rotation; Hetzel, 1996) revealed
that the Missing or Inconsistent Citations/References
meta-theme (i.e., Factor 1) explained 32.26% of the
total variance, and the Erroneous
Citations/References meta-theme (i.e., Factor 2)
accounted for 23.99% of the variance. These two
meta-themes combined explained 56.26% of the total
variance, yielding a large effect size (Henson,
Capraro, & Capraro, 2004; Henson & Roberts, 2006).
The corresponding total variance explained that was
reported by Onwuegbuzie, Frels, et al. (2010) was
similar, at 51.99%.
The manifest effect size (i.e., actual error rate per
meta-theme) associated with the two meta-themes
was as follows: Missing or Inconsistent
Citations/References (83.7%) and Erroneous
Citations/References (51.2%). Figure 1 displays the
thematic structure (i.e., relationships among the
citation error themes and the citation error meta-
themes), including the manifest effect sizes and latent
effect sizes. This figure represents what
Onwuegbuzie and Dickinson (2008) referred to as a
crossover visual representation, which involves
integrating both quantitative and qualitative findings
within the same display.
Stage 3 Findings
The latent class analysis on the five
(dichotomized) citation error themes indicated that
the optimal number of clusters was two (L2 = 20.97,
df = 20, p = .40, Bootstrap p = .50). Figure 2 displays
these two distinct groups of manuscripts. This figure
shows that Cluster 1 (comprising 69.0% of
manuscripts) is relatively high with respect to four of
the citation error themes (i.e., Not in Reference List
errors, Not Consistent with Reference List errors, Not
in Text errors). In contrast, Cluster 2 (comprising
31.0% of manuscripts) is relatively low on all five
citation error themes. As can be seen from Figure 2,
Not in Reference List errors (Wald = 6.57, p = .001,
R2 = 16.77%), Not Consistent with Reference List
errors (Wald = 5.81, p = .016, R2 = 61.49%), and Not
in Text errors (Wald = 7.37, p = .007, R2 = 16.35%)
statistically significantly discriminated the two
clusters, whereas Incomplete or Incorrect Citation
errors (Wald = 0.03, p = .87, R2 = 0.05%) and
Incomplete or Incorrect Reference errors (Wald =
2.61, p = .11, R2 = 8.19%) did not. Examining the R
2
values indicates that Not Consistent with Reference
List errors had the most variance explained by the
two-cluster model.
Figure 1. Stage 2 Findings: Thematic structure pertaining to citation errors, with effect sizes pertaining to
Onwuegbuzie et al.’s (2010) study in parentheses.
Missing or Inconsistent Citations/References
Latent Effect Size = 32.26% (29.69%)
Manifest Effect Size = 83.7% (89.7%)
Not in
Reference List
Not in
Text
Not Consistent
with Reference List
Erroneous Citations/References
Latent Effect Size = 23.99% (22.31%)
Manifest Effect Size = 51.2% (32.2%)
Incomplete or Inconsistent
Citations
Incomplete or Inconsistent References

ANTHONY J. ONWUEGBUZIE, JULIE P. COMBS, REBECCA K. FRELS, AND JOHN R. SLATE
Spring 2011 viii RESEARCH IN THE SCHOOLS
Figure 2. Stage 3 Findings: Profiles of the manuscripts with respect to the citation error themes.
Stage 4 Findings
Correlation analysis. A series (i.e., n = 4) of
nonparametric (i.e., Spearman) correlations, after
applying the Bonferroni adjustment to control for the
inflation of Type I error, revealed that the number of
citation errors was statistically significantly related to
the number of references in the reference list (rs[86]
= .55, p < .001), the number of manuscript pages
(rs[86] = .38, p < .001), the number of manuscript
words (rs[86] = .49, p < .001), and the number of
authors (rs[86] = .43, p < .001). Using Cohen’s
(1988) criteria, all of these relationships were in the
moderate-to-large or large range. Although the first
three relationships were not surprising, the fourth
relationship was extremely surprising because it
indicates that as the number of authors of a
manuscript increases, so do the number of citation
errors. This finding, which is extremely disturbing, is
consistent with Onwuegbuzie, Frels, et al. (2010),
who documented a relationship between these two
variables.
Multiple regression analysis. An all possible
subsets (APS) multiple linear regression
(Onwuegbuzie & Daniel, 2003; Thompson 1995) was
used to identify an optimal combination of
independent variables (i.e., number of references in
the reference list, number of manuscript pages,
number of manuscript words, number of authors) that
predicted the number of citation errors2. Using this
analytical technique, all possible models involving
some or all of the independent variables were
examined. This method of analysis, which has been
advocated by many statisticians (e.g., Onwuegbuzie
& Daniel, 2003; Thompson 1995), involves
conducting separate regression analyses for the one
possible set of four independent variables, all four
possible trios of independent variables, all six
possible pairs of independent variables, and all four
No
tinR
efe
ren
ceL
ist
0-1
Me
an
No
tCo
nsi
ste
ntw
ithR
efe
ren
ceL
ist
0-1
Me
an
No
tinT
ext
0-1
Me
an
Inco
rre
ctC
itatio
n
0-1
Me
an
Inco
rre
ctR
efe
ren
ce
0-1
Me
an
1 .0
0.8
0.6
0.4
0.2
0.0
Clus ter1
Clus ter2

EDITORIAL: CITATION ERRORS REVISITED: THE CASE FOR EDUCATIONAL RESEARCHER
Spring 2011 ix RESEARCH IN THE SCHOOLS
independent variables singly—yielding the fitting of
15 multiple regression models. These 15 models then
were compared to identify the best subset of
independent variables according to the criteria of (a)
the maximum proportion of variance explained (R2)
and (b) Mallow’s Cp (Myers, 1986; Sen & Srivastava,
1990). The APS multiple regression analysis
revealed that a model containing two variables
provided the best fit to these data. In fact, the four-
variable model only increased the proportion of
variance explained by 3.2%. In addition, Mallow’s Cp
was closer in value to the number of regressor
variables (Myers, 1986; Sen & Srivastava, 1990) with
the two-variable solution, than with any other
variable solution.
The selected model indicated that the following
two variables contributed statistically significantly
(F[2, 86] = 14.31, p < .001) to the prediction of the
number of citation errors: the number of authors and
the number of references in the reference list. These
two variables combined to explain 31.6% of the
variation in the number of citation errors (Adjusted
R2 = 29.4%). Using Cohen’s (1988) criteria for
assessing the predictive power of a set of independent
variables in a multiple regression model, the
proportion of variance explained indicates a large
effect size, because it exceeded 26%.
With respect to the assumptions for the selected
two-variable multiple linear regression model, the
Durbin-Watson coefficient of 2.08 was sufficiently
close to 2 to suggest that for any two observations,
the residual terms were uncorrelated (i.e., lack of
autocorrelation), which was a desirable outcome. In
addition, an examination of the standardized residuals
pertaining to each of the participants revealed that
only one manuscript (i.e., manuscript #52) had a
standardized residual that exceeded 2.00 (i.e., 4.44).
This manuscript, which was written by two authors
and contained 44 references, yielded 41 citation
errors—the second highest number of citation
errors—likely explaining why the number of citation
errors was difficult for the model to predict.
Nevertheless, because this number represented only
1.14% (i.e., 1/88) of the total sample of manuscripts,
the number of manuscripts with large standardized
residuals was less than the 5% that might have been
expected by chance, which suggested little cause for
concern.
An examination of the tolerance statistics, the
variance inflation factors, and the condition indices
of the selected regression model indicated strongly
that no multicollinearity was present. In particular,
both variance inflation factors (VIFs), which
represent the extent that the variance of an individual
regression coefficient has been inflated by the
presence of collinearity, were much less than 10,
suggesting little evidence of multicollinearity (Myers,
1986). In fact, both variance inflation factors were
very close to 1.00 (i.e., both VIFs = 1.03), which
indicated no relationship between the two
independent variables. Condition indices, which
represent the ratio of the largest to the smallest
eigenvalues, also provided information about the
strength of linear dependency between the
independent variables. Both condition indices (3.15
for the number of authors and 4.65 for the number of
references) were much less than 1,000 (Myers, 1986),
again suggesting that no multicollinearity was
present. Further, both tolerance statistics were
greater than .2 (.97), which also suggested a lack of
multicollinearity (Field, 2009).
The following additional influence diagnostics
were examined: (a) the overall influence of a case on
the model (i.e., Cook’s distance); (b) the influence of
the observed value of the dependent variable over the
predicted values (i.e., Leverage); (c) the number of
estimated standard errors (for each regression
coefficient) that the coefficient changes if the ith
observation was set aside (i.e., DFBeta, Standardized
DFBeta); (d) the number of estimated standard errors
that the predicted value changes if the ith point is
removed from the data set (i.e., DFFit, Standardized
DFFit); and (e) the influence of the observed value
over the variance of the regression parameters (i.e.,
covariance ratio). Using criteria recommended in the
literature (e.g., Field, 2009; Myers, 1986), the 52nd
manuscript (of the set of 88 manuscripts), which had
the only absolute standardized residual that exceeded
2, generated the following influence statistics: (a)
Cook’s distance = .012 < 1, suggesting that it did not
have undue influence on the model; (b) Leverage =
.0025 < (2[p + 1])/n)3 = .068, which suggested that it
did not have a large influence over the regression
coefficients; (c) Standardized DFBeta for the number
of authors = 0.24 and Standardized DFBeta for the
number of references = 0.075, both of which are < |-
2|, which suggested that this manuscript did not have
undue influence on the model parameters; and (d)
Standardized DFFit = 0.71 < |-2|, which suggested
that this manuscript did not have an undue influence
on the predicted value. Only the covariance ratio
value (i.e., 0.34) suggested a cause for concern
because it was less than 1 – (3[p + 1]/n) = 0.90,
thereby suggesting that deleting the 52nd manuscript
from the analysis might have improved the precision
of the model. However, because the other indices did
not exceed the cutpoint, this manuscript was retained.
The partial and semi-partial correlation
coefficients indicated that the number of authors
(19.0% unique variance explained) was a better
predictor of the number of citation errors than was
the number of references (12.6% unique variance
explained). An examination of the structure
coefficients, using a cutoff correlation of 0.3

ANTHONY J. ONWUEGBUZIE, JULIE P. COMBS, REBECCA K. FRELS, AND JOHN R. SLATE
Spring 2011 x RESEARCH IN THE SCHOOLS
recommended by Lambert and Durand (1975) as an
acceptable minimum coefficient, suggested that both
independent variables made important contributions
to the model. Thus, in summary, the selected final
regression model suggested that the manuscripts with
the most citation errors tended to have the highest
number of authors and the highest number of
references. The regression equation was as follows:
Number of Citation Errors = -1.38 + 3.30 *
Number of Authors + 0.11 * Number of References
This equation indicated that among manuscripts
submitted to Educational Researcher, every
additional author of a manuscript was associated with
an increase of 3.30 citation errors, on average.
Further, every additional nine references tended to be
associated with an increase of 1.00 citation error.
Canonical correlation analysis. A canonical
correlation analysis was conducted to examine the
multivariate relationship between the citation error
themes and selected demographic variables (i.e.,
number of references in the reference list, number of
manuscript pages, number of manuscript words,
number of authors). Because five citation error
themes were correlated with four manuscript
variables, four canonical functions were generated.
The canonical correlation analysis revealed that
the four canonical correlations combined were
statistically significant (p < .01; Rc1 = .57; Wilk’s
Lambda = .52). However, when the first canonical
root was excluded, the remaining three roots were not
statistically significant (p = .23; Rc2 = .41; Wilk’s
Lambda = .77). Similarly, when the first two
canonical roots were excluded, the remaining two
roots were not statistically significant (p = .60; Rc3 =
.22; Wilk’s Lambda = .93), and when the first three
canonical roots were excluded, the remaining root
was not statistically significant (p = .45; Rc4 = .16;
Wilk’s Lambda = .97). Together, these results
suggested that the first canonical function was
statistically significant and practically significant
(Canonical Rc12 = .33) (Cohen, 1988), but the
remaining roots were not statistically significant.
Thus, only the first canonical function was
interpreted.
Data (i.e., standardized function coefficients and
structure coefficients) pertaining to the first canonical
root are presented in Table 4. Again, using a cutoff
correlation of 0.3 (Lambert & Durand, 1975), the
standardized canonical function coefficients revealed
that the following two citation error themes made
important contributions: Not in Reference List and
Not in Text, with Not in Text making the largest
contribution. With respect to the manuscript variable
set, number of authors, number of manuscript pages,
and number of manuscript words made noteworthy
contributions, with number of manuscript words
making the most noteworthy contribution. The
structure coefficients revealed that three citation error
variables made noteworthy contributions: Not in
Reference List, Not Consistent with Reference List,
and Not in Text. Again, Not in Text made the largest
contribution. The square of the structure coefficient
indicated that Not in Text explained 60.8% of the
variance. With regard to the manuscript variable
cluster, all four variables made noteworthy
contributions, with the number of manuscript words
making the greatest contribution for the second time,
explaining 67.2% of the variance. Comparing the
standardized and structure coefficients suggested
multicollinearity with Not Consistent With Reference
List because the structured coefficient associated
with this variable was large, whereas the
corresponding standardized coefficient was relatively
small (Onwuegbuzie & Daniel, 2003).
Multicollinearity also was suggested with number of
references for the same reason. Thus, the
multivariate relationship between citation error
themes and the manuscript variables was mainly
characterized by the relationship between citation
errors associated with Not in Reference List and Not
in Text on the one side, and number of authors,
number of manuscript pages, and number of
manuscript words on the other side. Interestingly, in
Onwuegbuzie, Frels, et al.’s (2010) study, the number
of authors and the length of manuscript similarly
were related to the five citation error themes.
Unfortunately, because the Educational
Researcher editors accepted only one of these 88
manuscripts the first time, it was not possible to
examine any relationships between the number of
citation errors and the decision made by the editors
regarding the manuscript’s suitability for
publication. However, the fact that every manuscript
with a high number of citation errors was rejected
for publication is unlikely to be a coincidence.
Discussion of Findings
Our current editorial provides even more
compelling evidence that the citation error represents,
by far, the most prevalent APA error. Moreover, the
present findings indicate that not only do citation
errors permeate manuscripts that are submitted to
RITS (91.8% prevalence rate) but they similarly
pervade manuscripts that are submitted to the
foremost journal in education, namely, Educational
Researcher (88.6% prevalence rate). From our
experience as editors of Educational Researcher, we
can verify that a high proportion of authors who
submit manuscripts to Educational Researcher are
among the most prolific of authors. Thus, it can be
concluded that citation errors are not only committed

EDITORIAL: CITATION ERRORS REVISITED: THE CASE FOR EDUCATIONAL RESEARCHER
Spring 2011 xi RESEARCH IN THE SCHOOLS
by beginning authors, but also they are being
committed by prolific authors. Indeed, the
characteristics of citation errors for both the
Educational Researcher manuscripts and RITS
manuscripts were very similar, including the
distributions of the five citation error themes, the
thematic structure pertaining to the citation errors, the
profiles of the manuscripts with respect to the citation
error themes, and the relationship of the number of
authors and the length of the manuscript to the
citation error themes.
In our previous editorial on citation errors, we
surmised that the 91.8% citation error rate for RITS
authors likely represents a lower bound when one
takes into account that these manuscripts were
submitted before the writers of sixth edition of APA
stipulated that authors include digital object
identifiers (DOIs) whenever they are available (cf.
section 6.31). According to the writers of the sixth
edition of [APA] Publication Manual, DOI numbers
represent unique numbers assigned by the publisher
for electronic referencing of published journal
articles and other documents. In a reference list,
authors should place the DOI at the end of the
reference. Thus, under the sixth edition of APA,
failure to include available DOI numbers represents a
citation error—specifically, an incomplete reference.
(pp. xiii-xiv)
For this same reason, the citation error rate of
88.6% for Educational Researcher authors also likely
represents a lower bound. And when we take into
account the fact that the 88 manuscripts submitted to
the Research News and Comment section of
Educational Researcher over this 3-year period
represented those manuscripts that were sent out for
external review and that none of the 47.93% of
manuscripts that were desk rejected were included in
this sample of manuscripts, it is reasonable to
conclude that this 88.6% citation error rate is even
more of a lower bound.
It might be argued that the high citation error rate
for Educational Researcher manuscripts stems, in
part, from the fact that these manuscripts tend to be
longer than that allowed for the majority of
educational journals, and as we reported earlier, the
number of manuscript pages was positively related to
the number of citation errors (cf. Table 4). Yet, the
number of pages of manuscripts submitted to
Educational Researcher (M = 25.64, SD = 11.36;
Range = 6 to 54) actually was statistically
significantly smaller (t[236] = -1.74, p = .04; d =
0.23) than was the number of pages of manuscripts
submitted to RITS (M = 27.96, SD = 9.04; Range = 9
to 48; cf. Frels et al., 2009). Thus, the length of the
Educational Researcher manuscripts does not
account for the high citation error rates. Similarly, it
might be argued that the number of authors of
Educational Researcher manuscripts would be higher
than normal due to the fact that Educational
Researcher has a lower acceptance rate (lower than
5% during this time period) than does virtually any
other journal representing the field of education, and
as we documented earlier, the number of authors was
positively related to the number of citation errors (cf.
Table 4). Yet again, this argument can be refuted
because the number of authors per Educational
Researcher manuscript (M = 1.64, SD = 0.92; Range
= 1 to 5) actually was statistically significantly
(t[236] = -3.18, p < .001; d = 0.43) smaller than was
the number of authors per RITS manuscript (M =
2.13, SD = 1.26; Range = 1 to 9).
Conclusions
That the mean citation error rate appears to range
from approximately 5.9 (Onwuegbuzie, Waytowich,
& Jiao, 2006) to approximately 7.8 (the present
study), alongside the present findings that both the
number of authors and number of references are
positively related to the number of citation errors, and
previous findings that manuscripts that contain
several citation errors are significantly more likely to
be rejected (Onwuegbuzie et al., 2006, 2010),
demonstrate the importance of developing strategies
for drastically reducing these trends, and producing
what Jiao, Onwuegbuzie, and Waytowich (2008)
referred to as a “culture of error free citations” (p.
954). Onwuegbuzie, Frels, et al. (2010) provided a
number of recommendations for creating this culture
for (a) authors; (b) college-level instructors, mentors,
advisors, and thesis/dissertation committee members
and chairs or supervisors; (c) copyeditors typesetters,
production editors, publishers; and (d) writers of
future editions of the Publication Manual. We refer
readers to these recommendations. However, we will
conclude our editorial by focusing on attempting to
help authors avoid making citation errors.
Recommendations for authors provided by
Onwuegbuzie, Frels, et al. (2010) include printing out
the whole document and comparing every in-text
citation (i.e., line-by-line) with the corresponding
entry in the reference list; proof-reading the reference
lists several times for incomplete or inaccurate
references; conducting a secondary electronic check
for citation errors using the search function of word
processing software programs and the spell check
function; using a reference management software
package (e.g., EndNote, RefMan, and ProCite); and
ensuring that all authors representing articles that
involve multiple authors to check the manuscript
meticulously for citation errors.
Another useful recommendation is to use Table 2
as a starting point by focusing on these most common
types of errors, namely, works that are cited in text

ANTHONY J. ONWUEGBUZIE, JULIE P. COMBS, REBECCA K. FRELS, AND JOHN R. SLATE
Spring 2011 xii RESEARCH IN THE SCHOOLS
but that do not appear in the reference list, works that
appear in the text that are not consistent with the
corresponding works that are presented in the
reference list, works that are cited in the reference list
but that do not appear in the text. In Appendix A, we
provide a checklist for reducing citation errors. In
Appendix B, we provide an excerpt that has been
modified from Waytowich, Onwuegbuzie, and
Elbedour’s (2011) article in such a way that it
contains numerous citation errors. These citation
errors represent all five types of citation errors
presented in Table 2. Appendix C provides a
corrected version of the excerpt that incorporates
comments for addressing the various citation errors.
In closing, we reiterate the sentiments of
Onwuegbuzie, Frels, et al. (2010) that the authors of
APA “should make clear how serious citation errors
are, as well as their ethical implications” (p. xx). In
the sixth edition of the Publication Manual (APA,
2010), Chapter 6 is dedicated to crediting sources,
whereby it is stated that “a critical part of the writing
process is helping readers place your contribution in
context by citing the researchers who influenced you”
(p. 169). Further, the authors of the Publication
Manual (APA, 2010) dedicated a separate chapter to
illustrate reference examples. In Chapter 1, authors
open the section “Ethical and Legal Standards in
Publishing” (p. 11) by citing the APA Ethics Code
(APA, 2002), in that researchers and writers should
“protect intellectual property rights” (p. 11). Finally,
Section 8.07 of Chapter 8 (APA, 2010) presents a
checklist for manuscript submission, which includes
a section on references whereby authors are to check
some of the following:
[a] are references cited both in text and in the
reference list (6.11-6.21)? [b] do the text
citations and reference list entries agree both
in spelling and in date (6.11-6.21)? [c] are
journal titles in the reference list spelled out
fully (6.29)? [d] are the references (both in the
parenthetical text citations and in the reference
list) ordered alphabetically by the authors’
surnames (6.16, 6.25)? [e] are inclusive page
numbers for all articles or chapters in books
provided in the reference list (7.01, 7.02)? (p.
242)
In addition, in the Code of Ethics (AERA, 2011),
the authors stipulate that “educational researchers
adhere to the highest possible standards,” and in their
publications, “[they] explicitly identify, credit, and
reference the author(s) when they take data or
material verbatim from another person’s work” (p.
147). In fact, when considering the meticulous care
with which scholars perform research (e.g., providing
documentation, transparency, meticulous data
analysis), it is quite surprising that in one of the most
prestigious journals in educational research, namely
Educational Researcher, citation errors were so high,
especially when crediting sources appropriately are
put forth in research ethical codes of prominent
organizations:
see APA:
http://www.apa.org/research/responsible/publication/i
ndex.aspx; the American Counseling Association:
http://www.counseling.org/resources/codeofethics/TP
/home/ct2.aspx;
see AERA:
http://www.aera.net/Portals/38/docs/About_AERA/C
odeOfEthics(1).pdf
As such, it is our hope that the findings of this
editorial bring to the fore the professional and ethical
obligation to become more detailed-oriented in the
presentation of their works with respect to
parenthetical references and reference lists. We hope
that at least one of the tools and strategies presented
in this editorial or the previous editorial helps
students, researchers, and experienced scholars to
prevent citation errors through the use of consistent
and accurate reporting of sources.
References
American Educational Research Association. (2011).
Code of ethics. Retrieved from
http://www.aera.net/Portals/38/docs/About_
AERA/CodeOfEthics(1).pdf
American Psychological Association. (2002). Ethical
principles of psychologists and code of
conduct. American Psychologist, 57, 1060-
1073., doi:10.1037/0003066X.57.12.1060
American Psychological Association. (2010).
Publication manual of the American
Psychological Association (6th ed.).
Washington, DC: Author.
Berelson, B. (1952). Content analysis in
communicative research. New York, NY:
Free Press.
Cattell, R. B. (1966). The scree test for the number of
factors. Multivariate Behavioral Research,
1, 245-276.
doi:10.1207/s15327906mbr01 02_10
Chandler, C. R. (1995). Practical considerations in
the use of simultaneous inference for
multiple tests. Animal Behaviour, 49, 524-
527. doi:10.1006/anbe.1995.0069
Chicago Manual of Style (15th ed.). (2003). Chicago,
IL: The University of Chicago Press.
Cohen, J. (1988). Statistical power analysis for the
behavioral sciences (2nd ed.). Hillsdale, NJ:
Lawrence Erlbaum.
EDITORIAL: CITATION ERRORS REVISITED: THE CASE FOR EDUCATIONAL RESEARCHER
Spring 2011 xiii RESEARCH IN THE SCHOOLS
Constas, M. A. (1992). Qualitative data analysis as a
public event: The documentation of category
development procedures. American
Educational Research Journal, 29, 253-266.
doi:10.1177/0013164405282485
Field, A. (2009). Discovering statistics using SPSS
(3rd ed.). London, England: Sage.
Frels, R. K., Onwuegbuzie, A. J., & Slate, J. R.
(2009). Editorial: A historical and
demographic account of 15 years of
Research in the Schools. Research in the
Schools, 16(2), i-viii.
Frels, R. K., Onwuegbuzie, A. J., & Slate, J. R.
(2010). Editorial: Research in the Schools:
The flagship journal of the Mid-South
Educational Research Association. Research
in the Schools, 17(1), i-vii.
http://www.msera.org/download/RITS_17_1
_Flagship.pdf
Harzing, A. W. K. (2009, January). Publish or perish.
Retrieved from www.harzing.com/pop.htm
Henson, R. K., Capraro, R. M., & Capraro, M. M.
(2004). Reporting practice and use of
exploratory factor analysis in educational
research journals: Errors and explanation.
Research in the Schools, 11(2), 61-72.
Henson, R. K., & Roberts, J. K. (2006). Use of
exploratory factor analysis in published
research. Educational and Psychological
Measurement, 66, 393-416.
doi:10.1177/0013164405282485
Hetzel, R. D. (1996). A primer on factor analysis
with comments on patterns of practice and
reporting. In B. Thompson (Ed.), Advances
in social science methodology (Vol. 4, pp.
175-206). Greenwich, CT: JAI Press.
Hirsch, J. E. (2005). An index to quantify an
individual’s scientific research output.
Proceedings of the National Academy of
Sciences, 102(46), 16569-16572.
doi:10.1073/pnas.0507655102
Ho, R. (2006). Handbook of univariate and
multivariate data analysis and interpretation
with SPSS. London, England: Chapman &
Hall.
Jiao, Q. G., Onwuegbuzie, A. J., & Waytowich, V. L.
(2008). The relationship between citation
errors and library anxiety: An empirical
study of doctoral students in education.
Information Processing & Management, 44,
948-956. doi:10.1016/j.ipm.2007.05.007
Johnson, R. B. (2011, May). Dialectical pluralism: A
metaparadigm to help us hear and ''combine"
our valued differences. In S. J. Hesse-Biber
(Chair), Addressing the Credibility of
Evidence in Mixed Methods Research:
Questions, Issues and Research Strategies.
Plenary conducted at the meeting of Seventh
International Congress of Qualitative
Inquiry, University of Illinois at Urbana-
Champaign.
Kaiser, H. F. (1958). The varimax criterion for
analytic rotation in factor analysis.
Psychometrika, 23, 187-200. doi:10.1007/
BF02289233
Kieffer, K. M. (1999). An introductory primer on the
appropriate use of exploratory and
confirmatory factor analysis. Research in the
Schools, 6(2), 75-92.
Lambert, Z. V., & Durand, R. M. (1975). Some
precautions in using canonical analysis.
Journal of Market Research, 12, 468-475.
doi:10.2307/3151100
Leech, N. L., & Onwuegbuzie, A. J. (2007). An array
of qualitative analysis tools: A call for data
analysis triangulation. School Psychology
Quarterly, 22, 557-584. doi:10.1037/1045-
3830.22.4.557
Leech, N. L., & Onwuegbuzie, A. J. (2008).
Qualitative data analysis: A compendium of
techniques for school psychology research
and beyond. School Psychology Quarterly,
23, 587-604.
doi:10.1037/1045-3830.23.4.587
Leech, N. L., & Onwuegbuzie, A. J. (2011). Beyond
constant comparison qualitative data
analysis: Using NVivo. School Psychology
Quarterly, 26, 70-84. doi:10.1037/a0022711
Manly, B. F. J. (2004). Multivariate statistical
methods: A primer (3rd ed.). London,
England: Chapman & Hall.
Miles, M. B., & Huberman, A. M. (1994).
Qualitative data analysis: An expanded
sourcebook (2nd ed.). Thousand Oaks, CA:
Sage.
Myers, R. H. (1986). Classical and modern
regression with applications. Boston, MA:
Duxbury Press.
Onwuegbuzie, A. J. (2003). Effect sizes in qualitative
research: A prolegomenon. Quality &
Quantity: International Journal of
Methodology, 37, 393-409.
doi:10.1023/A:1027379223537
Onwuegbuzie, A. J., & Combs, J. P. (2009). Writing
with discipline: A call for avoiding APA
style guide errors in manuscript preparation.
School Leadership Review, 4(1), 116-149.

ANTHONY J. ONWUEGBUZIE, JULIE P. COMBS, REBECCA K. FRELS, AND JOHN R. SLATE
Spring 2011 xiv RESEARCH IN THE SCHOOLS
Onwuegbuzie, A. J., & Combs, J. P. (2010).
Emergent data analysis techniques in mixed
methods research: A synthesis. In A.
Tashakkori & C. Teddlie (Eds.), Handbook
of mixed methods in social and behavioral
research (2nd ed., pp. 397-430). Thousand
Oaks, CA: Sage.
Onwuegbuzie, A. J., Combs, J. P., Slate, J. R., &
Frels, R. K. (2010). Editorial: Evidence-
based guidelines for avoiding the most
common APA errors in journal article
submissions. Research in the Schools.
Retrieved from
http://msera.org/download/RITS_16_2_AP
AErrors6th.pdf
Onwuegbuzie, A. J., & Daniel, L. G. (2003, February
12). Typology of analytical and
interpretational errors in quantitative and
qualitative educational research. Current
Issues in Education, 6(2). Retrieved from
http://cie.ed.asu.edu/volume6/number2/
Onwuegbuzie, A. J., & Dickinson, W. B. (2008).
Mixed methods analysis and information
visualization: Graphical display for effective
communication of research results. The
Qualitative Report, 13, 204-225. Retrieved
from http://www.nova.edu/ssss/QR/QR13-
2/onwuegbuzie.pdf
Onwuegbuzie, A. J., Frels, R. K., & Slate, J. R.
(2010). Editorial: Evidence-based guidelines
for avoiding the most prevalent and serious
APA error in journal article submissions—
The citation error. Research in the Schools,
17(2), i-xxiv.
Onwuegbuzie, A. J., & Teddlie, C. (2003). A
framework for analyzing data in mixed
methods research. In A. Tashakkori & C.
Teddlie (Eds.), Handbook of mixed methods
in social and behavioral research (pp. 351-
383). Thousand Oaks, CA: Sage.
Onwuegbuzie, A. J., Waytowich, V. L., & Jiao, Q. G.
(2006, December). Bibliographic errors in
articles submitted to scholarly journals: The
case for Research in the Schools. Academic
Exchange Extra. Retrieved from
http://www.unco.edu/AE-
Extra/2006/12/Jiao.html
Onwuegbuzie, A. J., Witcher, A. E., Collins, K. M.,
Filer, J. D., Wiedmaier, C. D., & Moore, C.
W. (2007). Students’ perceptions of
characteristics of effective college teachers:
A validity study of a teaching evaluation
form using a mixed-methods analysis.
American Educational Research Journal,
44, 113-160.
doi 10.3102/0002831206298169
Sandelowski, M., Voils, C. I., & Knafl, G. (2009). On
quantitizing. Journal of Mixed Methods
Research, 3, 208-222. doi:10.1177/
1558689809334210
Sen, A. K., & Srivastava, M. (1990). Regression
analysis: Theory, methods, and applications.
New York, NY: Springer-Verlag.
Tashakkori, A., & Teddlie, C. (1998). Mixed
methodology: Combining qualitative and
quantitative approaches. Applied Social
Research Methods Series (Vol. 46).
Thousand Oaks, CA: Sage.
Thompson, B. (1995). Stepwise regression and
stepwise discriminant analysis need not
apply here: A guidelines editorial.
Educational and Psychological
Measurement, 55, 525-534.
doi:10.1177/0013164495055004001
Thompson B. (2004). Exploratory and confirmatory
factor analysis: understanding concepts and
applications. Washington, DC: American
Psychological Association.
Vogt, W. P. (2005). Dictionary of statistics and
methodology: A nontechnical guide for the
social sciences (3rd ed.). Thousand Oaks,
CA: Sage.
Waytowich, V. L., Onwuegbuzie, A. J., & Elbedour,
S. (2011). Violence and attribution error in
adolescent male and female delinquents.
International Journal of Education, 3(1),
E6, 1-19. Retrieved from
http://www.macrothink.org/journal/index.ph
p/ije/article/viewFile/594/452
Zwick, W. R., & Velicer, W. F. (1982). Factors
influencing four rules for determining the
number of components to retain.
Multivariate Behavioral Research, 17, 253-
269. doi:10.1207/s15327906mbr1702_5
Zwick, W. R., & Velicer, W. F. (1986). Comparison
of five rules for determining thenumber of
components to retain. Psychological
Bulletin, 99, 432-442. doi:10.1037//0033-
2909.99.3.432

EDITORIAL: CITATION ERRORS REVISITED: THE CASE FOR EDUCATIONAL RESEARCHER
Spring 2011 xv RESEARCH IN THE SCHOOLS
Appendix A
Checklist for Reducing Citation Errors
The following checklist can be a useful tool for authors concerned about reducing citation errors in their work.
To edit for citation errors, the author will need a copy of the paper, a pencil, and the Sixth Edition Publication
Manual of the American Psychological Association (2010) which will be referred to as the APA Manual. The steps
in the process are as follows:
1. Print out paper.
2. Verify the match of each citation used.
3. Verify each direct quotation used.
4. Remove unused references from the list.
5. Locate missing references.
6. Resolve inconsistencies.
7. Edit for use of et al.
8. Check alphabetical order of references.
9. Edit references for format, punctuation, and capitalization.
Step 1 is to print out a paper copy of the draft, including the reference list. Even though authors conduct most
of the editing of drafts via a computer screen, having a printed copy of the paper often helps to locate errors that are
not seen easily in the earlier stages of editing using a computer. Separate the paper from the references and proceed
to Step 2. In the second step, the author will scan the manuscript, line-by-line, and locate every citation used in the
text. Then, the author will mark the citation with a pencil in the text and in the reference list. During this cross-
checking process, careful attention should be given to the spelling of the authors’ names and the dates each time
they are used. For any citations that do not match, the author should make a note and continue with the process. At
the end of this step, the paper will be marked up, and each entry in the reference list should be marked at least once.
Step 2 is likely the most tedious step in the process; however, conducting this step for every citation is critical to
locating errors. The third step involves a verification of direct quotations. Step 3 can be performed at the same time
as Step 2. For every direct quotation used, “always provide the author, year, and specific page citation or paragraph
number or nonpaginated material” (APA, 2010, p. 170).
In addition, if the direct quotation is “40 or more words. display it in a freestanding block of text and omit the
quotation marks” (APA, 2010, p. 171). Additional information is provided in the APA Manual regarding omissions
or insertions of material in direct quotes. At the conclusion of the first three steps, the author can proceed to revising
the references. For Step 4, the list of references will be reviewed. Any reference that was not marked in Step 2
should be removed from the paper because the reference list should contain only those works cited in the paper.
Similarly, in Step 5, the author will locate references that were cited in the paper but were not included in the
reference list. Finally, in Step 6, the author will correct spelling errors of authors’ names and resolve inconsistencies
in the dates cited.
One of the citation rules in APA addresses the appropriate use of et al. (see Table 6.1, APA, 2010, p. 177). We
suggest addressing this convention near the conclusion of the editing process because revisions of the paper can
change the order of citations used in the paper. For citations whereby three, four, or five individuals authored the
work, the first citation in the text would include all authors; subsequent citations would have the convention et al. If
the author in Step 2 marked every reference each time it was used in the paper, he or she will be able to identify the
references where et al. would be appropriate (i.e., in the references, search for group authors with multiple
checkmarks). Next, using a “find” command on the computer, each citation can be located in the paper and can be
corrected. For works that have six or more authors, the convention et al. is used each time (see APA Manual, 2010,
p. 177). Finally, it is recommended that authors carefully check the punctuation of the et al. convention as errors
appear to be prevalent with its usage. In a recent study, 44.5% of authors (n = 110) who submitted a manuscript to
Research in the Schools misused the et al. convention at least once in their manuscripts (Onwuegbuzie, Combs,
Slate, & Frels, 2010).
In Step 8, the author will attend to the alphabetical order of the reference list. Rules for alphabetizing can be
found in the APA Manual in Section 6.25. Finally, in Step 9, each reference will be carefully read and checked for
errors in punctuation and capitalization. In addition, the author can verify that journals and book titles are italicized.
New to the APA Manual specific to the sixth edition is the provision of doi numbers; websites such as
www.crossref.org can be used to verify doi numbers. During Step 9, the use of the APA Manual is essential, as
experienced authors and editors refer to the APA Manual frequently and when in doubt. When authors edit citations
and reference lists using this checklist, citation errors can be minimized and hopefully eliminated.
ANTHONY J. ONWUEGBUZIE, JULIE P. COMBS, REBECCA K. FRELS, AND JOHN R. SLATE
Spring 2011 xvi RESEARCH IN THE SCHOOLS
References
American Psychological Association. (2010). Publication manual of the American Psychological Association (6th
ed.). Washington, DC: Author.
Onwuegbuzie, A. J., Combs, J. P., Slate, J. R., & Frels, R. K. (2010). Editorial: Evidence-based guidelines for
avoiding the most common APA errors in journal article submissions. Research in the Schools. Retrieved
from http://msera.org/download/RITS_16_2_APAErrors6th.pdf

EDITORIAL: CITATION ERRORS REVISITED: THE CASE FOR EDUCATIONAL RESEARCHER
Spring 2011 xvii RESEARCH IN THE SCHOOLS
Appendix B
A Modified Excerpt from Waytowich, Onwuegbuzie, and Elbedour (2011)
with Numerous Citation Errors Inserted
Adapted from “Violence and attribution error in adolescent male and female delinquents.” by V. L. Waytowich, A.
J. Onwuegbuzie and S. Elbedour, 2011, International Journal of Education, 3(1), E6, pp. 1-19. Copyright 2011 by
V. L. Waytowich, A. J. Onwuegbuzie and S. Elbedour.
Violence and Attribution Error in Adolescent Male and Female Delinquents
In the field of social psychology, considerable interest has centered on the mediating role of the causal
attributions and assumptions made by the victims and perpetrators of violence (Fondacaro & Heller, 1990; Shaver &
Drown, 1986; Trachtenberg & Viken, 1994). However, few of these studies have focused on delinquent female
adolescents; in fact, relatively little is known about female delinquents. Indeed, in general, we know very little about
the psychology and cognitive/attributional processes of young women in regard to violence (Chesney-Lind &
Sheldon, 1992), perhaps because the prevalence of this group in the criminal population has only recently been
considered as serious problem.
Attribution Theory
Attribution theory is concerned with the cognitive processes that individuals use to justify the events that occur
in their social and physical environments (Kelley, 1973). As described by Heider (1958), Jones and Harris (1967),
Kelley (1973), and Weiner (1985), individuals operate in the social environment through action, and the process of
assigning causes to their actions and experiences is called causal attribution. People set goals, make decisions, and
plan activities based on their sociopsychological analysis and appraisal of their past actions, in a dynamic interplay
both internally and in relationship with other individuals (Janoff-Bulman, 1979; Janoff-Bulman & Freize, 1983;
Silver, Wortman, & Klos, 1982). These causal attributions determine how a person will interpret a given event, by
identifying the location of its cause (i.e., internal or external to the individual), the stability of the cause over time
(i.e., transient or lasting; Kelley, 1973), and the responsibility for the event (i.e., whether or not the cause is seen as
under the individual’s control; Abramson, Seligman, & Teasdale, 1978; Wortman & Dintzer, 1978). The resulting
appraisal is incorporated into the individual’s motivational dynamics. An appraisal of something as a good for action
becomes a move to action, or motivation (Arnold, 1962). In this way, an individual’s subjective assessments may
strengthen or weaken the person’s motivation to achieve a particular objective.
It is by making attributions that people justify their own behaviors and make sense of them. When recognized,
these attributions also can predict future behaviors (Heider, 1958; Jones & Harris, 1967; Kelley, 1973; Weiner,
1985). According to Bulman and Wortman (1977), Fincham, Beach, and Baucom (1987), Grills and Ollendick
(2002), Janoff-Bulman (1979), and other researchers, people are more likely to experience distress that contributes
to depression when they attribute their behavioral outcome to personality traits or dispositional characteristics
(characterological attributions). Greater mental health benefits are found in people who attribute their problems to
some aspect of their own behaviors or to situational factors. An individual’s framework of attribution can be a
window through which we can view the person’s emotional vulnerability self-image, and his/her approach to solving
social and interpersonal problems (Jones & Nisbett, 1972; Lazarus & Launier, 1978),
The self-questioning involved in the attribution process is also accompanied by inhibitory responses that
function quite apart from these appraisals and assumptions. It is the brain’s inhibitory response capability that allows
people to tolerate, cope with, and master their impulses. As a result, these causal attributions are not necessarily
rational or objective; they are influenced by the individual’s cognitive and sociocultural biases, which include the
following: (a) cognitive heuristics, which represent problem-solving strategies that reduce the complexity of making
probabilistic judgments (Kahneman, Slovic, & Tversky, 1982; Nisbett & Ross, 1980), and which, as noted by
Tversky and Kahneman (1974, p. 1124), "are quite useful, but sometimes they lead to severe and systematic errors";
(b) the just world theory, which represents the underlying belief that life is fundamentally “fair” and might influence
individuals to view victims as being responsible for their own circumstances (Lerner, 1970, p. 190); (c) the
fundamental attribution error, wherein personal or dispositional factors are overemphasized and situational and
environmental factors are underemphasized (Tetlock, 1985); (d) defensive attribution bias, wherein a person’s
tendency to blame another person increases as the observer’s perceived similarity to the other person’s
circumstances decreases (cf. Burger, 1981); and (3) stereotyping, which occurs as a direct result of the out-group
homogeneity, wherein people tend to assign the cause of undesirable behavior by an out-group member to a personal
deficiency that they attribute to all members of that group (cf. Fiske, 2000).

ANTHONY J. ONWUEGBUZIE, JULIE P. COMBS, REBECCA K. FRELS, AND JOHN R. SLATE
Spring 2011 xviii RESEARCH IN THE SCHOOLS
Taken together, these cognitive and motivational biases provide the support framework for the individual’s
patterns of moral and social behavior. Although research on attribution theory in the context of violence and
victimization has gained prominence recently, little attention has been paid to the role that attribution plays in
placing adolescents at risk for perpetrating acts of violence—especially the role played by violence attribution error.
Because of gendered socialization processes, the differing social status of men and women, and the fact that
victim blaming is more common in certain cultures, female juvenile delinquents may show different violence
attribution errors than do male juvenile delinquents. Research on this topic is becoming increasingly urgent because
the rates of female crime have risen dramatically in recent years. Chesney-Lind (2001) cites federal statistics that the
rate of female violent crime has increased more than 100% since 1981; between 1989 and 1998 the arrest rate for
female adolescents increased 50.3% (compared to 16.5% for males), and during the same period there was a 64.3%
increase in arrests of females for serious violent offenses. According to a report by the U.S. Department of Justice,
in 1999, there were 2.1 million female violent offenders, representing 14% of all violent offenders (U.S. Department
of Justice, 1999).
There are limited data on attribution errors among female delinquents; however, several studies exist in the area
of attribution errors among delinquents. For example, Daley and Onwuegbuzie (1995) documented that 80% of male
juvenile delinquents make inaccurate causal attributions when explaining the violent actions of others. In a later
study, Daley and Onwuegbuzie (2004) coined the term “violence attribution error” (p. 551). A specific form of
attribution error, this refers to “errors that occur when an offender does not blame the perpetrator of a violent act
(e.g., rape) but instead blames either the victim or the circumstance" (p. 551).
In the only study, to date, investigation the violence attribution errors of females, Daley and Onwuegbuzie
(1999) compared male (n = 73) and female (n = 80) high schools students with respect to violence attribution errors.
These researchers found that females tended to make significantly fewer violence attribution errors (i.e., “errors that
occur when an offender does not blame the perpetrator of a violent act (e.g., rape) but instead blames either the
victim or the circumstance”; Daley & Onwuegbuzie, 2004, p. 551) than did their male counterparts. The effect size
(d = 0.63) associated with this difference was moderate-to-large. More recently, using a mixed method analysis
(Johnson & Onwuegbuzie, 2004), Daley and Onwuegbuzie (2004) reported that the male juvenile offenders, who
were incarcerated at a correctional facility in a large southeastern U.S. state, committed violence attribution errors
approximately 53% of the time. Although Daley and Onwuebuzie (2002/2003, 2004) provided evidence that
violence attribution errors play an important role in predicting at-risk behaviors, their studies only involved male
delinquents. Yet, it is likely that violence attribution errors also place females at-risk for delinquency. However, this
possible link has yet to be investigated. This was a subject of the current investigation.
In addition to gender, examining race as a static criminogenic factor (i.e., a factor identified by research as a
predictor of crime or criminality) also is poignant due to the over-representation of minority youth currently
involved in the juvenile justice system (Florida Department of Juvenile Justice, 2006). Minority youth
disproportionately experience a greater degree of violent victimization and perpetration, with homicides accounting
for the leading cause of death among African-American males and females between the ages of 15 and 24 years
(Commission for the Prevention of Youth Violence, 2000). In 1997, minorities represented 24% of the juvenile
population, yet were 67% of the juveniles incarcerated in detention facilities (Commission for Prevention of Youth
Violence, 2000). Furthermore, in 2003, African-American youth were more at risk than were White youth, and three
times as likely as were youth of other races to be victims of serious violent crime (Federal Interagency Forum on
Child and Family Statistics [FIFCFS], 2005). Findings from other studies indicate that gender and race differ across
groups in their rates of violence, and that gender and race groups are differentially exposed to protective and risk
factors that contribute or ameliorate the risk of violence exposure (Herrenkohl, Hill, Chung, & Catalano, 2004).
With these variables in mind, a second central purpose was to identify predictors (i.e., peer victimization, self-
esteem, and demographic variables) of violence attribution errors. Although numerous studies have been conducted
on key indicators of risk that identify a youth to be on a potential path to delinquency such as poverty, poor self-
concept, association with delinquent peers, drug use, physical and sexual abuse, poor parenting, truancy, and poor
educational performance (Archwamety & Katsyannis, 2000; Ball & Connolly, 2000; Carr & Vandiver, 2001;
Chesney-Lind & Sheldon, 1998; Goff & Goddard, 1999; Matza, 1964; Stoiber, 1998; Tanner, Davies, & O’Grady,
1999; Waytowich & Onweugbuzie, 2007; Welsh, Stokes, & Greene, 2000), scant research has been paid attention to
predictors of violence attribution errors. Because violence attribution errors have been found to predict acts of
violence (Daley & Onwuegbuzie, 2002/2003), it is expected that identifying antecedents of violence attribution
errors likely would increase our understanding of why adolescents engage in delinquent behaviors in general and
acts of violence in particular. The present study was unique for at least two reasons. First, the current investigation
was the first to investigate violence attribution errors committed by female juvenile delinquents. In addition, it

EDITORIAL: CITATION ERRORS REVISITED: THE CASE FOR EDUCATIONAL RESEARCHER
Spring 2011 xix RESEARCH IN THE SCHOOLS
represented the only study in which male and female juvenile delinquents have been compared with respect to these
attribution errors.
The relevance of researching female delinquency is especially pertinent to the state of Florida. Inasmuch as the
representation of females in Florida’s Juvenile Justice system is growing, the 2001-2002 statistics were somewhat
more encouraging, with females accounting for less than 30% of all juvenile delinquency referrals. However,
between 1998-1999 and 2002-2003 female residential placements increased 25.2%, resulting in a greater number of
girls placed in commitment programs for violent offenders (Florida Department of Juvenile Justice, 2008).

ANTHONY J. ONWUEGBUZIE, JULIE P. COMBS, REBECCA K. FRELS, AND JOHN R. SLATE
Spring 2011 xx RESEARCH IN THE SCHOOLS
References
Abramson, L. Y., Seligman M. E. P., & Teasdale J. D. (1978). Learned helplessness in
humans: Critique and reformulation, Journal of Abnormal Psychology, 87, 49-74.
Archwamety, T., & Katsiyannis, A. (2000). Academic remediation, parole violations, and recidivism rates among
delinquent youths. Remedial and Special Education, 21, 161-170. doi:10.1177/074193250002100306
Arnold, M. (1962). Story sequence analysis. New York, NY: Holt, Rinehart & Winston.
Ball, C., & Connolly, J. (2000). Educationally disaffected young offenders. British Journal of Criminology, 40, 594-
616. doi:10.1093/bjc/40.4.594
Bulman, R., & Wortman, C. B. (1977). Attributions of blame and coping in the "real world": Severe accident
victims react to their lot. Journal of Personality and Social Psychology, 35, 351-363. doi:10.1037//0022-
3514.35.5.351
Burger, J. M. (1981). Motivational biases in the attribution of responsibility for an accident: A meta-analysis of the
defensive-attribution hypothesis. Psychological Bulletin, 90, 496-512. doi:10.1037//0033-2909.90.3.496
Carr, M., & Vandiver, T. (2001). Risk and protective factors among youth offenders. Adolescence, 36, 409-426.
Chesney-Lind, M. (2001). What about the girls? Delinquency programming as if gender mattered. Corrections
Today, 63(1), 38-45.
Chesney-Lind, M., & Sheldon, R. (1992). Girls, delinquency and juvenile justice. Belmont, CA: Brooks/Cole.
Commission for the Prevention of Youth Violence. (2000). Youth and violence—Medicine, nursing and public
health: Connecting the dots to prevent violence. Retrieved from http://www.ama-
assn.org/ama/upload/mm/386/fullreport.pdf
Daley, C. E., & Onwuegbuzie, A. J. (1995). Attitudes and attributions of male juvenile offenders. Paper presented at
the annual meeting of the American Educational Research Association, San Francisco, CA.
Daley, C. E., & Onwuegbuzie, A. J. (1999, April). Boys will be boys? A comparison of attributions for violence
between male and female high school students. Paper presented at the annual meeting of the American
Educational Research Association, Montreal, Canada.
Daley, C. E., & Onwuegbuzie, A. J. (2002/2003). Relationship between violence attributional errors and at-risk
behaviors among male juvenile delinquents. Louisiana Education Research Journal, 28(2), 3-14.
Daley, C. E., & Onwuegbuzie, A. J. (2004). Attributions toward violence of male juvenile delinquents: A concurrent
mixed methods analysis. Journal of Social Psychology, 144, 549-570. doi:10.3200/SOCP.144.6.549-570
Federal Interagency Forum on Child and Family Statistics. (2005). America’s Children: Key National Indicators of
well-being. Retrieved from http://www.childstats.gov/americaschildren/index.asp
Fincham, F., Beach, S., & Baucom, D. (1987). Attribution processes in distressed and nondistressed couples: 4. Self-
partner attribution differences. Journal of Personality and Social Psychology, 52, 739-748.
doi:10.1037//0022-3514.52.4.739
Fiske, S. T. (2000). Stereotyping, prejudice, and discrimination at the seam between the centuries: Evolution,
culture, mind, and brain. European Journal of Social Psychology, 30, 299-322. doi:10.1002/(SICI)1099-
0992(200005/06)30:3<299::AID-EJSP2>3.0.CO;2-F
Florida Department of Juvenile Justice. (2006). Key juvenile crime trends and conditions. Retrieved from
http://www.djj.state.fl.us/Research/Trends.html
Fondacaro, M., & Heller, K. (1990). Attributional style in aggressive adolescent boys.
Journal of Abnormal Child Psychology, 18, 75-89. doi:10.1007/BF00919457
Goff, B., & Goddard, H. (1999). Terminal core values associated with adolescent problem behaviors. Adolescence,
34, 47-60.
Grills, A. E., & Ollendick, T. H. (2002). Peer victimization, global self-worth, and anxiety in middle school
children. Journal of Clinical Child and Adolescent Psychology, 31, 59-68.
doi:10.1207/153744202753441675
Heider, F. (1958). The psychology of interpersonal relations. New York, NY: Wiley.
Herrenkohl, T., Hill, K., Chung, I., & Catalano, R. F. (2004). Review of research on predictors of youth violence
and school-based and community-based prevention approaches. In P. Allen-Meares & M. W. Fraser (Eds.),
Intervention with children and adolescents: An interdisciplinary perspective. Boston, MA: Allyn & Bacon.
Janoff-Bulman, R. (1979). Characterlogical versus behavioral self-blame: Inquires into depression and rape. Journal
of Personality and Sociology Psychology, 37, 1798–1809. doi:10.1037//0022-3514.37.10.1798
Janoff-Bulman, R., & Frieze, I. H. (1983). A theoretical perspective for understanding reactions to victimization.
Journal of Social Issues, 39(2), 1-17. doi:10.1111/j.1540-4560.1983.tb00138.x
Johnson, R. B., & Onwuegbuzie, A. J. (2004). Mixed methods research: A research paradigm whose time has come.
Educational Researcher, 33, 14-26. doi:10.3102/0013189X033007014

EDITORIAL: CITATION ERRORS REVISITED: THE CASE FOR EDUCATIONAL RESEARCHER
Spring 2011 xxi RESEARCH IN THE SCHOOLS
Jones, E. E., & Harris, V. A. (1967). The attribution of attitudes. Journal of Experimental Social Psychology, 3, 1-
24. doi:10.1016/0022-1031(67)90034-0
Jones, E. E., & Nisbett, E. (1972). The actor and the observer. Divergent perceptions of the causes of behavior. In E.
E. Jones, D. Kanouse, H. H. Kelley, R. E. Nisbett, S. Valins, & B. Weiner (Eds.), Attributions: Perceiving
the causes of behavior (pp. 79-94). Morristown, NJ: General Learning Press.
Kahneman, D., Paul Slovic, P., & Tversky, A. (Eds.) (1982). Judgement under uncertainty: Heuristics and biases.
New York, NY: Cambridge.
Kelley, H. (1973). The processes of causal attribution. American Psychologist, 28,107-128. doi:10.1037/h0034225
Lazarus, R. S., & Launier, R. (1978) Stress-related transactions between person and environment. In L. A. Pervin &
M. Lewis (Eds.), Perspectives in interactional psychology (pp. 287-327). New York, NY: Plenum.
Lerner, M. J. (1970). The desire for justice and reactions to victims. In J. Macaulay & L.
Berkowitz (Ed.), Altruism and helping behavior (pp. 205-229). NewYork, NY:
Academic Press.
Lerner, M. J. (1980). The belief in a just world: A fundamental delusion. New York, NY:
Plenum.
Matza, D. (1964). Delinquency and drift. New York, NY: Wiley.
Nisbett, R. E., & Ross, L. (1980). Human inference: Strategies and shortcomings of social judgment. Englewood
Cliffs, NJ: Prentice-Hall.
Shaver, K.G., & Drown, D. (1986). On causality, responsibility, and self-blame: A theoretical note. Journal of
Personality and Social Psychology, 50, 697–702.
doi:10.1037//0022-3514.50.4.697
Silver, R., Wortman, C. & Klos, D. (1982). Cognitions, affect and behavior following uncontrollable outcomes: A
response to current human helplessness research. Journal of Personality, 50, 480-514. doi:10.1111/j.1467-
6494.1982.tb00230.x
Stoiber, K. (1998). Risk and resilience factors linked to problem behavior among urban,
culturally diverse adolescents. The School Psychology Review, 27, 380-397.
Tanner, J., Davies, S., & O’Grady, B. (1999). Whatever happened to yesterday’s rebels? Longitudinal effects of
youth delinquency on education and employment. Social Problems, 46, 250-274.
doi:10.1525/sp.1999.46.2.03x0188f
Tetlock, P. E. (1985). Accountability: A social check on the fundamental attribution error. Social Psychology
Quarterly, 48, 227-236. doi:10.2307/3033683
Trachtenberg, S., & Viken, R. J. (1994). Aggressive boys in the classroom: Biased attributions or shared
perceptions? Child Development, 65, 829-835. doi:10.2307/1131421
Tversky, A., & Kahneman, D. (1974). Judgment and uncertainty: Heuristics and biases. Science, 185, 1124-1131.
doi:10.1126/science.185.4157.1124
U.S. Department of Justice, Office of Justice Programs. (1999). Women offenders. Bureau of Justice Statistics
Special Report. Retrieved from http://www.utmb.edu/imh/CorrectionalHealth/WomenOffenders.pdf
Waytowich, V. L., & Onwuegbuzie, A. J. (2007). Violence. In K. M. Borman, S. E. Cahill, & B.
A. Cotner (Eds.), The Praeger handbook of American high schools (pp. 429-434). Westport, CT: Praeger.
Weiner, B. (1985). “Spontaneous” casual thinking. Psychological Bulletin, 97, 74-84.
doi:10.1037//0033-2909.97.1.74
Welsh, W., Stokes, R., & Greene, J. (2000). A macro-level of school disorder. Journal of Research in Crime and
Delinquency, 37, 243-283. doi:10.1177/0022427800037003001
Wortman, C. B., & Dintzer, L. (1978). Is an attributional analysis of the learned helplessness phenomenon viable? A
critique of the Abramson, Seligman, Teasdale reformulation. Journal of Abnormal Psychology, 87, 75-90.
doi:10.1037/0021-843X.87.1.75

ANTHONY J. ONWUEGBUZIE, JULIE P. COMBS, REBECCA K. FRELS, AND JOHN R. SLATE
Spring 2011 xxii RESEARCH IN THE SCHOOLS
Appendix C
A Modified Excerpt from Waytowich, Onwuegbuzie, and Elbedour (2011) with Numerous
Citation Errors Corrected with Comments
Adapted from “Violence and attribution error in adolescent male and female delinquents.” by V. L. Waytowich, A.
J. Onwuegbuzie and S. Elbedour, 2011, International Journal of Education, 3(1), E6, pp. 1-19. Copyright 2011 by
V. L. Waytowich, A. J. Onwuegbuzie and S. Elbedour.

EDITORIAL: CITATION ERRORS REVISITED: THE CASE FOR EDUCATIONAL RESEARCHER
Spring 2011 xxiii RESEARCH IN THE SCHOOLS

ANTHONY J. ONWUEGBUZIE, JULIE P. COMBS, REBECCA K. FRELS, AND JOHN R. SLATE
Spring 2011 xxiv RESEARCH IN THE SCHOOLS

EDITORIAL: CITATION ERRORS REVISITED: THE CASE FOR EDUCATIONAL RESEARCHER
Spring 2011 xxv RESEARCH IN THE SCHOOLS

ANTHONY J. ONWUEGBUZIE, JULIE P. COMBS, REBECCA K. FRELS, AND JOHN R. SLATE
Spring 2011 xxvi RESEARCH IN THE SCHOOLS

EDITORIAL: CITATION ERRORS REVISITED: THE CASE FOR EDUCATIONAL RESEARCHER
Spring 2011 xxvii RESEARCH IN THE SCHOOLS

ANTHONY J. ONWUEGBUZIE, JULIE P. COMBS, REBECCA K. FRELS, AND JOHN R. SLATE
Spring 2011 xxviii RESEARCH IN THE SCHOOLS
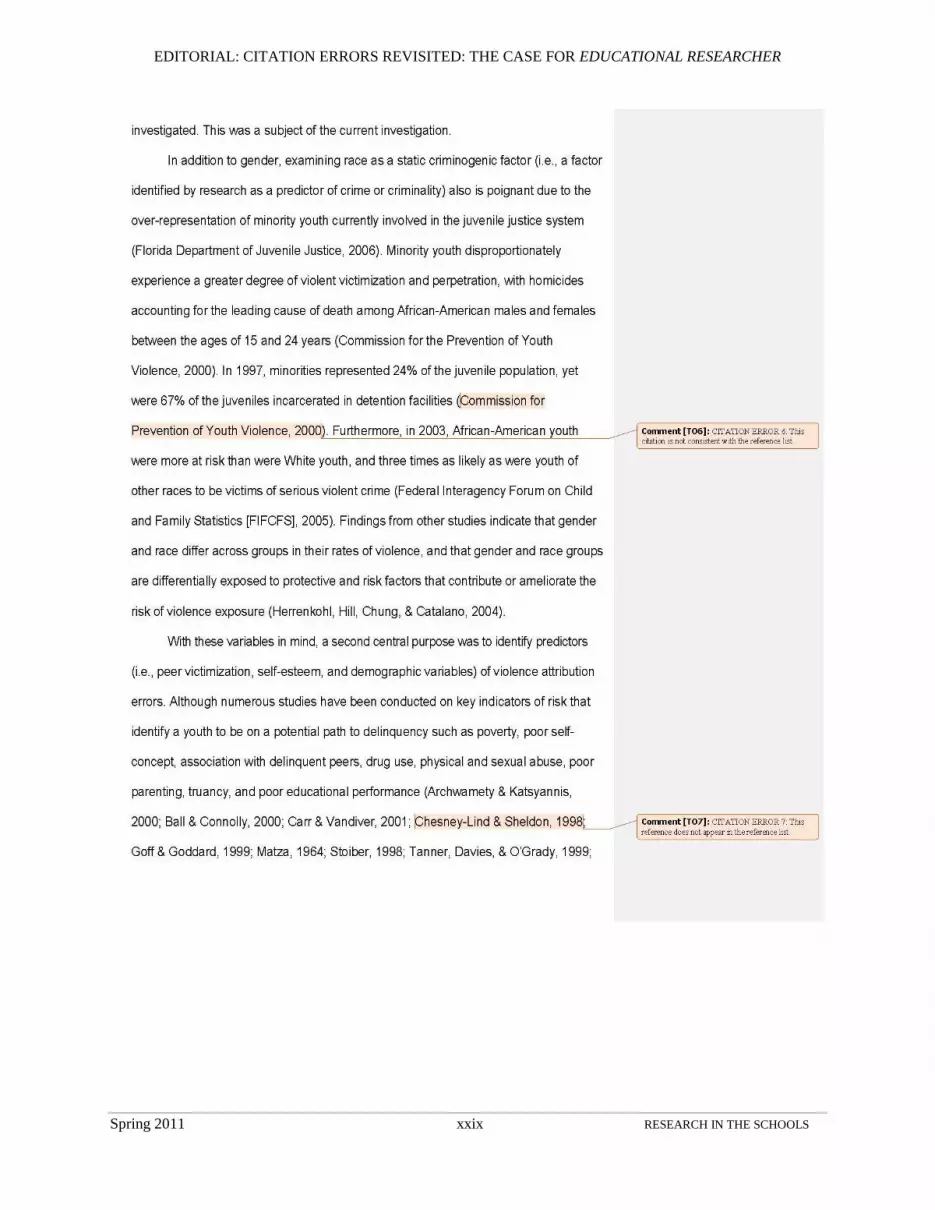
EDITORIAL: CITATION ERRORS REVISITED: THE CASE FOR EDUCATIONAL RESEARCHER
Spring 2011 xxix RESEARCH IN THE SCHOOLS

ANTHONY J. ONWUEGBUZIE, JULIE P. COMBS, REBECCA K. FRELS, AND JOHN R. SLATE
Spring 2011 xxx RESEARCH IN THE SCHOOLS

EDITORIAL: CITATION ERRORS REVISITED: THE CASE FOR EDUCATIONAL RESEARCHER
Spring 2011 xxxi RESEARCH IN THE SCHOOLS

ANTHONY J. ONWUEGBUZIE, JULIE P. COMBS, REBECCA K. FRELS, AND JOHN R. SLATE
Spring 2011 xxxii RESEARCH IN THE SCHOOLS

EDITORIAL: CITATION ERRORS REVISITED: THE CASE FOR EDUCATIONAL RESEARCHER
Spring 2011 xxxiii RESEARCH IN THE SCHOOLS

ANTHONY J. ONWUEGBUZIE, JULIE P. COMBS, REBECCA K. FRELS, AND JOHN R. SLATE
Spring 2011 xxxiv RESEARCH IN THE SCHOOLS

EDITORIAL: CITATION ERRORS REVISITED: THE CASE FOR EDUCATIONAL RESEARCHER
Spring 2011 xxxv RESEARCH IN THE SCHOOLS


![[In Process Citation]](https://img.dokumen.tips/doc/110x75/633592b6379741109e00b139/in-process-citation.jpg)


