Embed Size (px)
Citation preview
International Journal of Emerging Technology and Advanced Engineering
Website: www.ijetae.com (ISSN 2250-2459, ISO 9001:2008 Certified Journal, Volume 4, Issue 1, January 2014)
431
GIS Based Post Earthquake Landslide Hazard Zonation
Mapping of Lachung Basin, Sikkim R Anbalagan
1, Rohan Kumar
2, Sujata Parida
3, K Lakshmanan
4
1Professor,
2,3,4Research Scholar, Department of Earth Sciences, Indian Institute of Technology Roorkee, Roorkee-247667
(Uttarakhand), India
Abstract— Lachung basin is part of Sikkim Himalaya,
which was struck by a major earthquake on 18th September
2011. Earthquake resulted in many landslide incidents, which
caused great panic in the area. A landslide hazard zonation
map is prepared to assist mitigation planners in wake of
landslide trigger. In the present study pre and post
earthquake remote sensing data has been used to prepare
landslide inventory. Remote sensing data is further used to
delineate drainage pattern, photo lineaments, structural
features, lithologial features, and land/use land/cover type of
the area by applying digital image processing techniques.
Geological features are analyzed using criteria such as colour,
tones, topography and stream drainage pattern from the
imageries. Digital elevation model data is used to generate
primary topographic attributes namely, slope, aspect, and
relative relief. For landslide hazard zonation (LHZ) different
thematic maps such as land-cover map, slope map, relative
relief map, structural map, lithology map, lineament buffer
map, drainage buffer map, soil map, are assigned relative
weight on ordinal scale to obtain landslide hazard index
(LHI). Threshold values are selected according to breaks in
LHI frequency and a LHZ map is prepared which contains
very low hazard, low hazard, moderate hazard, high hazard
and very high hazard zones. Study suggests that landslides in
present area are influenced by the proximity to drainage,
lineament and topographic attributes.
Keywords— DEM, Earthquake, Landslide, Remote
Sensing, LHZ.
I. INTRODUCTION
Landslide is the result of a wide variety of geo-
environmental processes which include geological,
meteorological and human factors. The main factors which
influence land slide are discussed by Varnes and
Hutchinson [1], [2]. Generally the most important inherent
factors are bedrock geology (lithology, structure, degree of
weathering), geomorphology (slope gradient, aspect, and
relative relief), soil (depth, structure, permeability, and
porosity), land use and land cover (LULC) and hydrologic
conditions.
Landslides are triggered by many extrinsic causative
factors such as rainfall, earthquake, blasting and drilling,
cloudburst and flashfloods. Himalayan region has highly
undulating terrain which is a witness of ongoing orogeny
process. The region comes under major seismic zone.
These combined geo-environmental factors cause
numerous occasions of landslides and subsequently major
loss of life and property. The Himalayan landslides are
sometimes highly inaccessible and this gives planners a
major setback. But geospatial technique provides capability
of reaching every part of the inaccessible area, identifying
all types of landslides and determining landslide prone
zone on the basis of major causative factors. Remote
sensing and GIS based landslide hazard zonation is
suggested by several authors, such as Mantovani et al.,
Nagarajan et al., Gupta et al., Saha et al., Van Westen et al.
[3], [4], [5], [6], [7]. Landslide hazard zonation techniques
have been applied in Himalayan region by several authors
such as causative factor based hazard assessment done by
Anbalagan [8], Landslide hazard zonation based on
geological attributes by Pachauri and Pant [9], GIS based
landslide hazard zonation by Gupta et al. [5] and Saha et al.
[6]. In the present study spectral character of satellite
multispectral data are used to determine geology, structure,
photo lineament and drainage which are the major
parameters for Landslide Hazard Zonation. Digital
elevation model (DEM) of the area is used for terrain
parameter extraction. High resolution remote sensing data
is used for large scale landslide hazard zonation map.
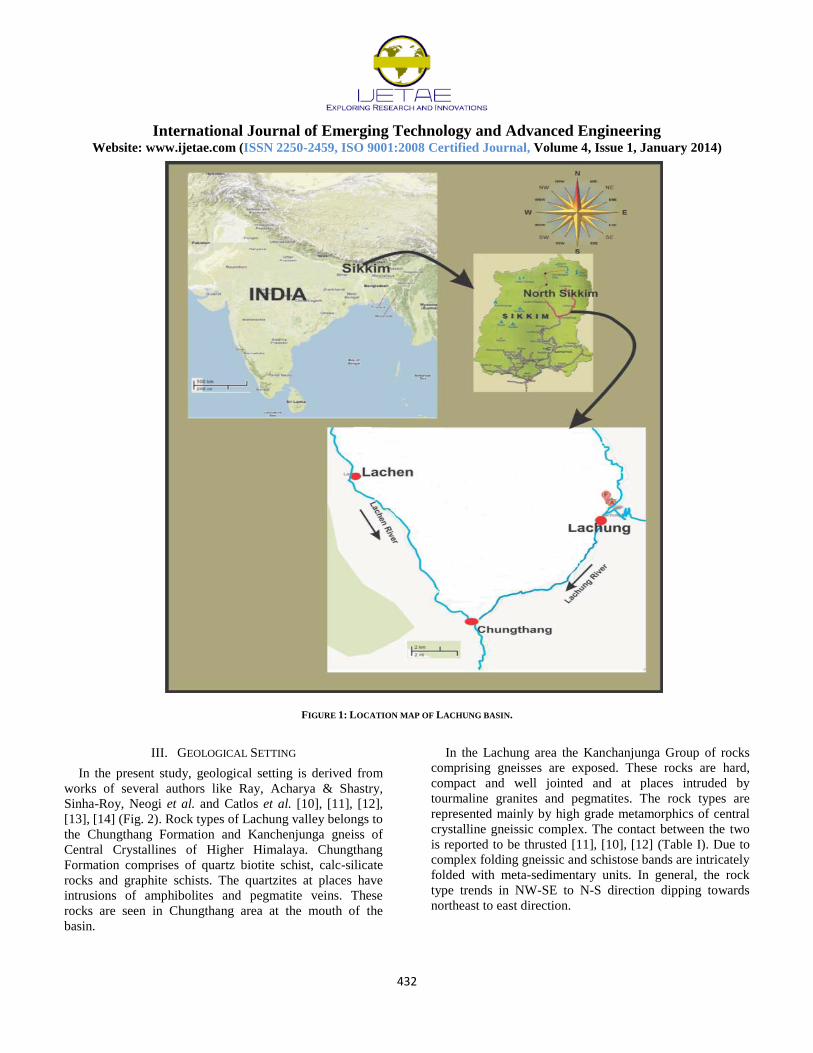
II. STUDY AREA
The Lachung basin is located in the upper north-eastern
reaches of Teesta river in Sikkim state of India. It has
central longitude/latitude value of 88.65°E and 27.61°N.
The basin has temperate climate in the lower reaches of the
valley, where as high mountainous region in the north is
characterized by low temperature tundra type of climate.
The basin receives an average monthly rainfall of 52mm
and also snowfall in the month of December, January and
occasionally in the month of March (Fig. 1).
International Journal of Emerging Technology and Advanced Engineering
Website: www.ijetae.com (ISSN 2250-2459, ISO 9001:2008 Certified Journal, Volume 4, Issue 1, January 2014)
432
FIGURE 1: LOCATION MAP OF LACHUNG BASIN.
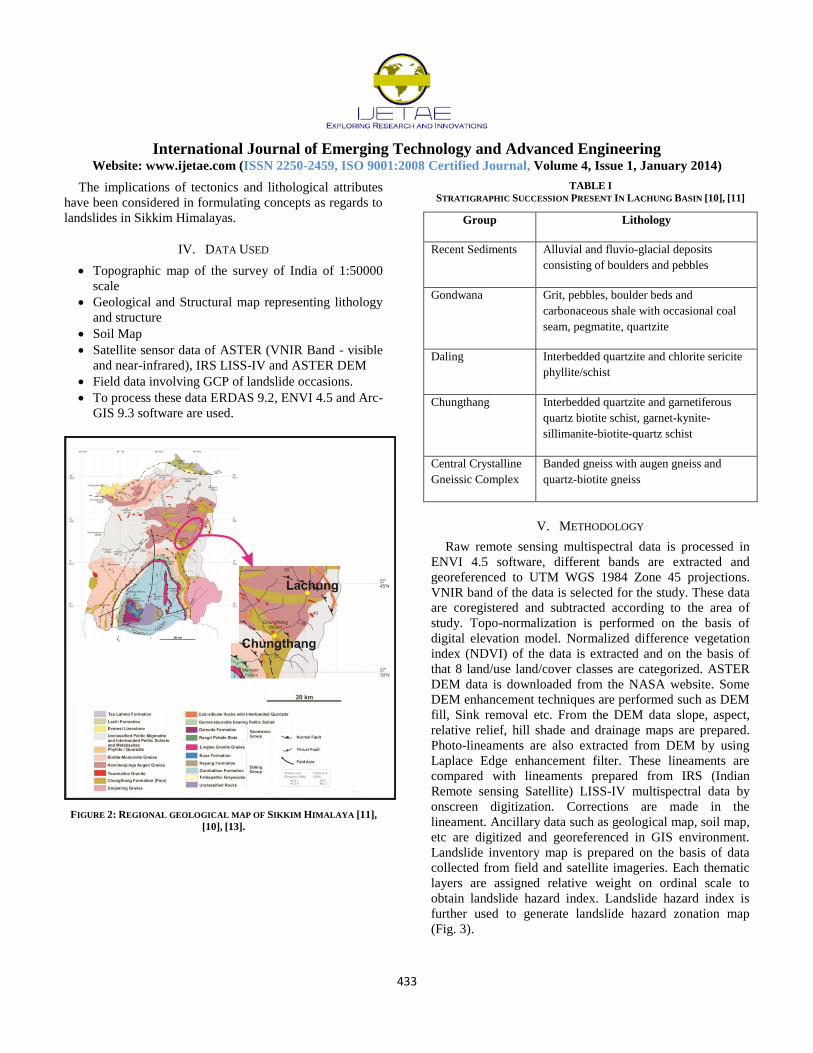
III. GEOLOGICAL SETTING
In the present study, geological setting is derived from
works of several authors like Ray, Acharya & Shastry,
Sinha-Roy, Neogi et al. and Catlos et al. [10], [11], [12],
[13], [14] (Fig. 2). Rock types of Lachung valley belongs to
the Chungthang Formation and Kanchenjunga gneiss of
Central Crystallines of Higher Himalaya. Chungthang
Formation comprises of quartz biotite schist, calc-silicate
rocks and graphite schists. The quartzites at places have
intrusions of amphibolites and pegmatite veins. These
rocks are seen in Chungthang area at the mouth of the
basin.
In the Lachung area the Kanchanjunga Group of rocks
comprising gneisses are exposed. These rocks are hard,
compact and well jointed and at places intruded by
tourmaline granites and pegmatites. The rock types are
represented mainly by high grade metamorphics of central
crystalline gneissic complex. The contact between the two
is reported to be thrusted [11], [10], [12] (Table I). Due to
complex folding gneissic and schistose bands are intricately
folded with meta-sedimentary units. In general, the rock
type trends in NW-SE to N-S direction dipping towards
northeast to east direction.
International Journal of Emerging Technology and Advanced Engineering
Website: www.ijetae.com (ISSN 2250-2459, ISO 9001:2008 Certified Journal, Volume 4, Issue 1, January 2014)
433
The implications of tectonics and lithological attributes
have been considered in formulating concepts as regards to
landslides in Sikkim Himalayas.
IV. DATA USED
Topographic map of the survey of India of 1:50000
scale
Geological and Structural map representing lithology
and structure
Soil Map
Satellite sensor data of ASTER (VNIR Band - visible
and near-infrared), IRS LISS-IV and ASTER DEM
Field data involving GCP of landslide occasions.
To process these data ERDAS 9.2, ENVI 4.5 and Arc-
GIS 9.3 software are used.
FIGURE 2: REGIONAL GEOLOGICAL MAP OF SIKKIM HIMALAYA [11],
[10], [13].
TABLE I
STRATIGRAPHIC SUCCESSION PRESENT IN LACHUNG BASIN [10], [11]
Group Lithology
Recent Sediments Alluvial and fluvio-glacial deposits
consisting of boulders and pebbles
Gondwana Grit, pebbles, boulder beds and
carbonaceous shale with occasional coal
seam, pegmatite, quartzite
Daling Interbedded quartzite and chlorite sericite
phyllite/schist
Chungthang Interbedded quartzite and garnetiferous
quartz biotite schist, garnet-kynite-
sillimanite-biotite-quartz schist
Central Crystalline
Gneissic Complex
Banded gneiss with augen gneiss and
quartz-biotite gneiss
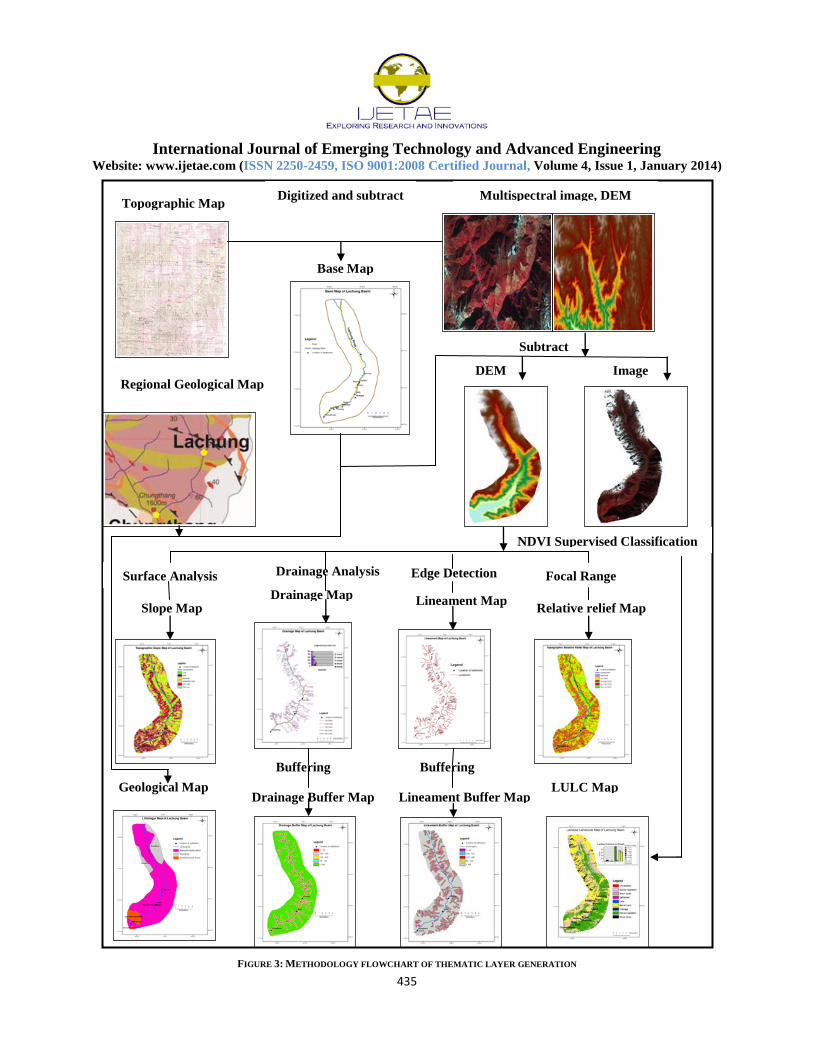
V. METHODOLOGY
Raw remote sensing multispectral data is processed in
ENVI 4.5 software, different bands are extracted and
georeferenced to UTM WGS 1984 Zone 45 projections.
VNIR band of the data is selected for the study. These data
are coregistered and subtracted according to the area of
study. Topo-normalization is performed on the basis of
digital elevation model. Normalized difference vegetation
index (NDVI) of the data is extracted and on the basis of
that 8 land/use land/cover classes are categorized. ASTER
DEM data is downloaded from the NASA website. Some
DEM enhancement techniques are performed such as DEM
fill, Sink removal etc. From the DEM data slope, aspect,
relative relief, hill shade and drainage maps are prepared.
Photo-lineaments are also extracted from DEM by using
Laplace Edge enhancement filter. These lineaments are
compared with lineaments prepared from IRS (Indian
Remote sensing Satellite) LISS-IV multispectral data by
onscreen digitization. Corrections are made in the
lineament. Ancillary data such as geological map, soil map,
etc are digitized and georeferenced in GIS environment.
Landslide inventory map is prepared on the basis of data
collected from field and satellite imageries. Each thematic
layers are assigned relative weight on ordinal scale to
obtain landslide hazard index. Landslide hazard index is
further used to generate landslide hazard zonation map
(Fig. 3).
International Journal of Emerging Technology and Advanced Engineering
Website: www.ijetae.com (ISSN 2250-2459, ISO 9001:2008 Certified Journal, Volume 4, Issue 1, January 2014)
434
VI. DATA LAYERS
Following data layers are prepared for Landslide Hazard
Zonation
a) Land use/Land cover map
b) Slope map
c) Relative relief map
d) Drainage buffer map
e) Lineament buffer map
f) Soil map
g) Lithological Map
VII. DRAINAGE PATTERN
The river bed gradient from inception of the river to the
upstream of Lachung where the river takes a turn towards
south to south westerly direction is of very high order. The
fall in elevation being 2100m over a distance of 21km, the
gradient is 100m/km. On the other hand the river bed
gradient further downstream of Lachung is less as
compared to the upper portion. The fall in elevation up to
Chungthang is 1016m over a distance of 17km with a
gradient of 60m/km. Further downstream of Chungthang
the river bed gradient is conspicuously low falling around
30m/km or less. The general pattern of drainage is a
complicated aspect as the dominant pattern is not very
clear. In the higher reaches close to the ridge the first order
streams cluster to form second and third order ones
indicating a dendritic or tree type drainage pattern. Further
down the streams in the middle reach, where the slopes are
moderate to steep form third or fourth order drains, though
the fifth order is very rare. It is common to notice that the
streams joining the river on the right bank and in parts of
left bank takes deflection towards downstream before
joining the main river. These drainage networks have
compelling relation with the landslides. During the field,
study majority of landslides are found nearer to the
drainage area.
To make the proper assessment of landslides drainage
buffer map with buffer distance 50m, 100m, 150m, 200m
are prepared.
VIII. TOPOGRAPHIC ATTRIBUTES
From the DEM data it has been observed that the upper
portion of the Lachung basin is aligned in NW-SE
direction, while the lower portion is aligned in NE-SW
direction. The basin shows large variations in slope angles.
The areas just adjoining river bed are generally very gentle
(<10˚). The debris cones present in the vicinity of the river
bed have gentle slope angles (<20˚) which is also seen in
upper levels in certain patches. Similarly on the southeast
side and downstream of Lachung, gentle slopes can be seen
on high levels on left bank. These gentle slopes are often
intercalated with slopes of moderate angles (20˚-40˚). The
fairly steep (30˚-40˚) to steep slopes (40˚-50˚) are seen
profusely in the middle portions on both sides of the valley.
Particularly these slopes are conspicuously seen on the
right bank side. The very steep (50˚-60˚) to extremely steep
slopes (>60˚) are seen close to the top of the ridge. The
basin shows well distributed pattern of varying categories
of slope aspects. The left bank predominantly shows west
and south-westerly slopes in the upper portion of the basin
with less south and south easterly slopes. On the other hand
in the lower reaches, north and north-easterly slopes are
dominantly present with east west and south-westerly
slopes. On the right bank easterly and north-easterly slopes
are present in large numbers with less northerly slopes in
the upper portion of the basin, while in the lower reaches,
south and easterly slopes are dominantly present. In
general, the trends of slope aspects are perpendicular to the
flow direction of the river in different locations. Relative
relief is found to be varying between 0 to 320 meters.
Relative relief map is generated from the DEM data by
applying 3x3 grid matrix filter.
International Journal of Emerging Technology and Advanced Engineering
Website: www.ijetae.com (ISSN 2250-2459, ISO 9001:2008 Certified Journal, Volume 4, Issue 1, January 2014)
435
FIGURE 3: METHODOLOGY FLOWCHART OF THEMATIC LAYER GENERATION
Topographic Map Digitized and subtract Multispectral image, DEM
Regional Geological Map
Base Map
Subtract
DEM Image
Geological Map Drainage Buffer Map Lineament Buffer Map
LULC Map
Slope Map Drainage Map Lineament Map
Relative relief Map
Buffering Buffering
Surface Analysis Drainage Analysis Edge Detection Focal Range
NDVI Supervised Classification
International Journal of Emerging Technology and Advanced Engineering
Website: www.ijetae.com (ISSN 2250-2459, ISO 9001:2008 Certified Journal, Volume 4, Issue 1, January 2014)
436
IX. LINEAMENT PATTERN
The overall lineament pattern of Lachung basin shows a
nearly similar trend as that of drainage pattern. A cluster of
lineaments close to the ridge line coincides with the barren
rock exposures. In the middle reaches a series of nearly
parallel lineaments are seen. They are nearly perpendicular
to the river flow direction locally. The structure controls in
the stream flow direction is clearly substantiated by the
lineament map. Distance from these structural features
have relative influence on the landslide [5], accordingly
buffer map is prepared for landslide hazard zonation.
X. LAND USE LAND COVER
Image classification resulted into 8 land/use land/cover
classes such as dense vegetation, sparse vegetation, lake,
drainage, settlement, cloud-cover, fallow/barren land, and
snow cover. It is found that basin in general has a good
vegetation cover with thick vegetation covering an area of
about 98 sq km. It is mainly concentrated on the left bank
of the Lachung river in the lower reaches between
Chungthang and Lachung. On the right bank the thick
vegetation is seen adjoining to the river upto Lachung with
patches of sparse vegetation and barren land. A part of
middle and top slopes close to the ridge are generally
barren in nature due to snow cover. On the left bank the top
slopes close to the ridge are barren in the upper reaches of
the basin. Sparse vegetation is seen as patches and well
distributed within the basin.
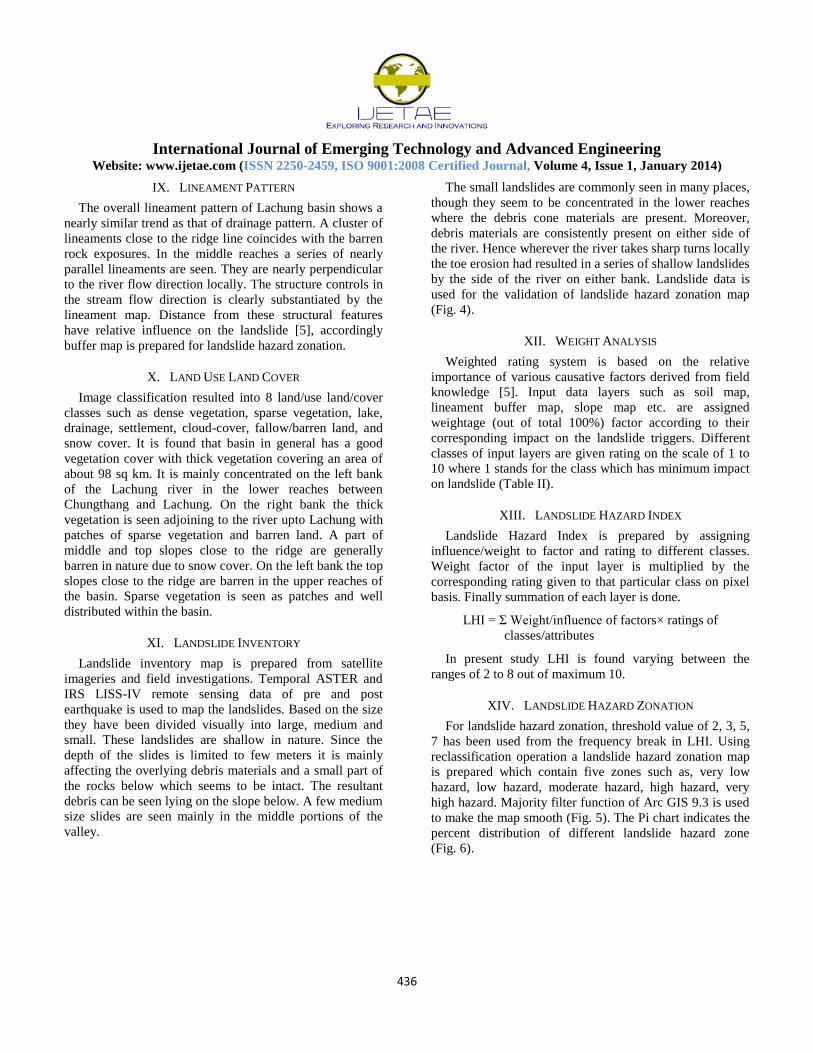
XI. LANDSLIDE INVENTORY
Landslide inventory map is prepared from satellite
imageries and field investigations. Temporal ASTER and
IRS LISS-IV remote sensing data of pre and post
earthquake is used to map the landslides. Based on the size
they have been divided visually into large, medium and
small. These landslides are shallow in nature. Since the
depth of the slides is limited to few meters it is mainly
affecting the overlying debris materials and a small part of
the rocks below which seems to be intact. The resultant
debris can be seen lying on the slope below. A few medium
size slides are seen mainly in the middle portions of the
valley.
The small landslides are commonly seen in many places,
though they seem to be concentrated in the lower reaches
where the debris cone materials are present. Moreover,
debris materials are consistently present on either side of
the river. Hence wherever the river takes sharp turns locally
the toe erosion had resulted in a series of shallow landslides
by the side of the river on either bank. Landslide data is
used for the validation of landslide hazard zonation map
(Fig. 4).
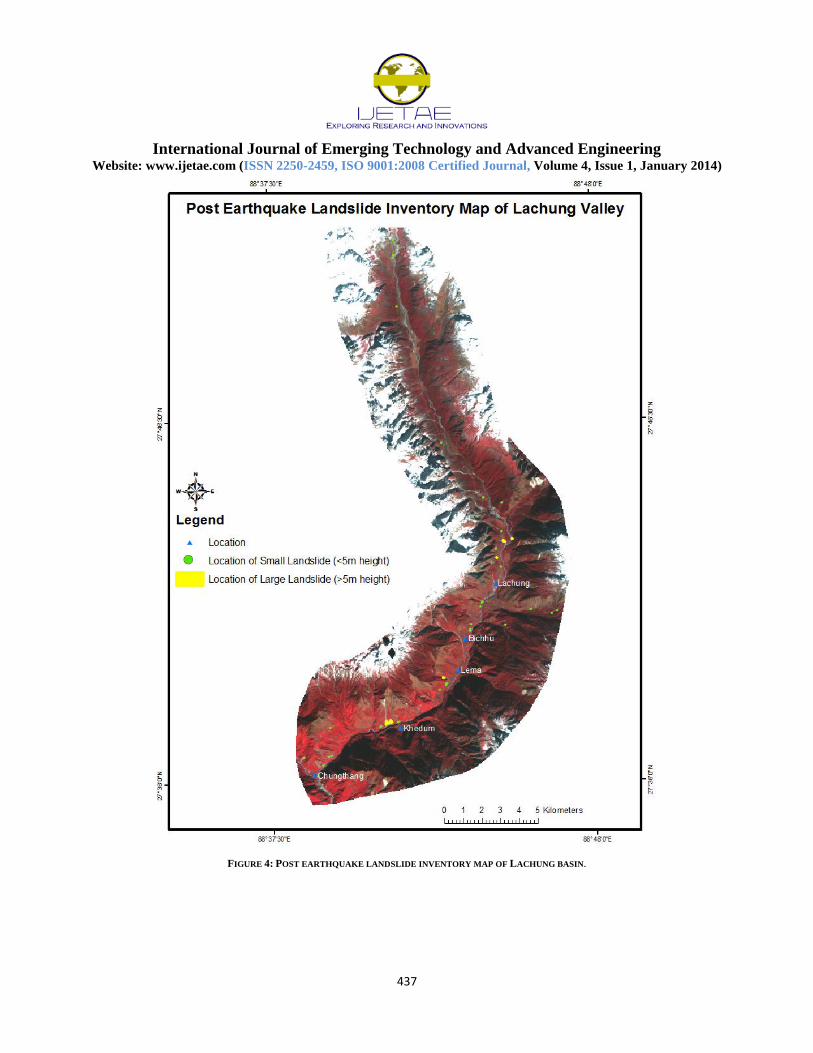
XII. WEIGHT ANALYSIS
Weighted rating system is based on the relative
importance of various causative factors derived from field
knowledge [5]. Input data layers such as soil map,
lineament buffer map, slope map etc. are assigned
weightage (out of total 100%) factor according to their
corresponding impact on the landslide triggers. Different
classes of input layers are given rating on the scale of 1 to
10 where 1 stands for the class which has minimum impact
on landslide (Table II).
XIII. LANDSLIDE HAZARD INDEX
Landslide Hazard Index is prepared by assigning
influence/weight to factor and rating to different classes.
Weight factor of the input layer is multiplied by the
corresponding rating given to that particular class on pixel
basis. Finally summation of each layer is done.
LHI = Σ Weight/influence of factors× ratings of
classes/attributes
In present study LHI is found varying between the
ranges of 2 to 8 out of maximum 10.
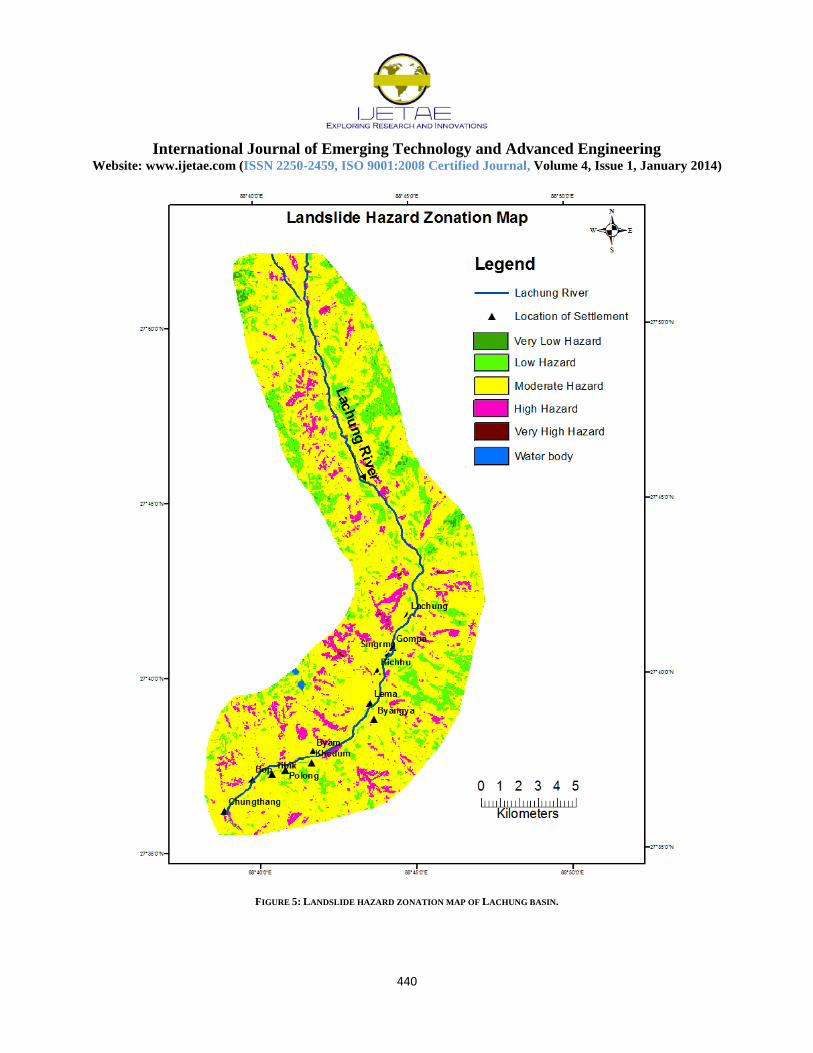
XIV. LANDSLIDE HAZARD ZONATION
For landslide hazard zonation, threshold value of 2, 3, 5,
7 has been used from the frequency break in LHI. Using
reclassification operation a landslide hazard zonation map
is prepared which contain five zones such as, very low
hazard, low hazard, moderate hazard, high hazard, very
high hazard. Majority filter function of Arc GIS 9.3 is used
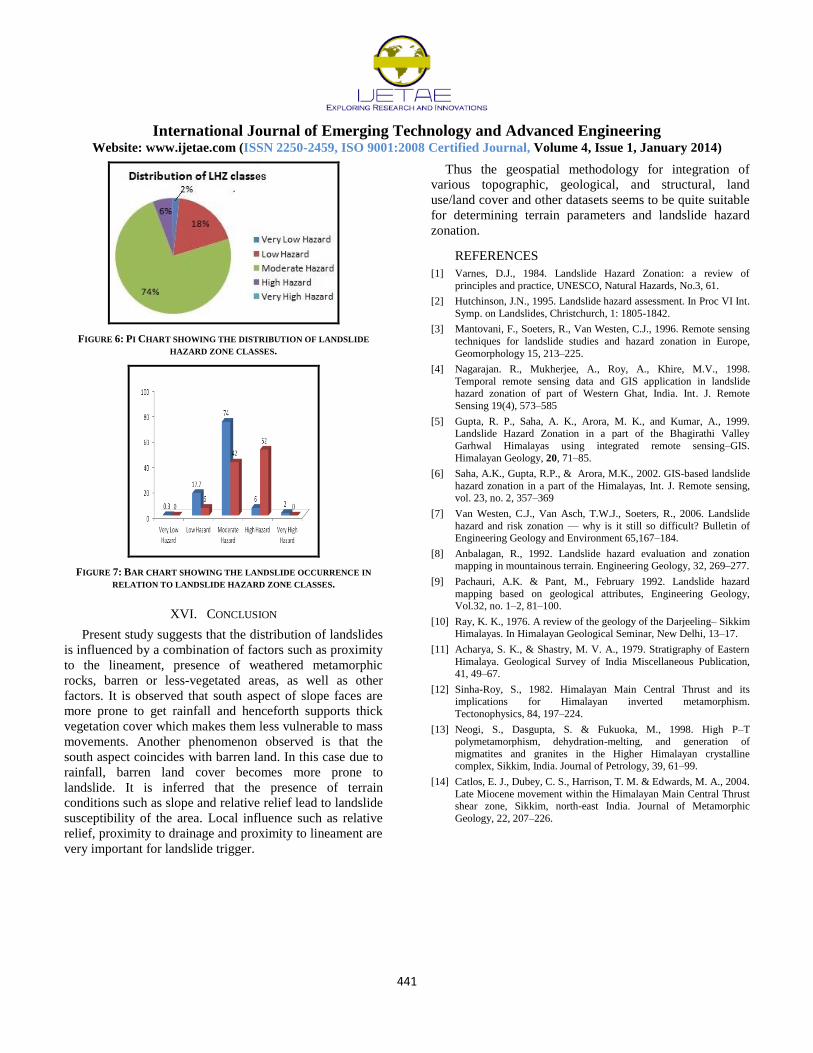
to make the map smooth (Fig. 5). The Pi chart indicates the
percent distribution of different landslide hazard zone
(Fig. 6).
International Journal of Emerging Technology and Advanced Engineering
Website: www.ijetae.com (ISSN 2250-2459, ISO 9001:2008 Certified Journal, Volume 4, Issue 1, January 2014)
437
FIGURE 4: POST EARTHQUAKE LANDSLIDE INVENTORY MAP OF LACHUNG BASIN.
International Journal of Emerging Technology and Advanced Engineering
Website: www.ijetae.com (ISSN 2250-2459, ISO 9001:2008 Certified Journal, Volume 4, Issue 1, January 2014)
438
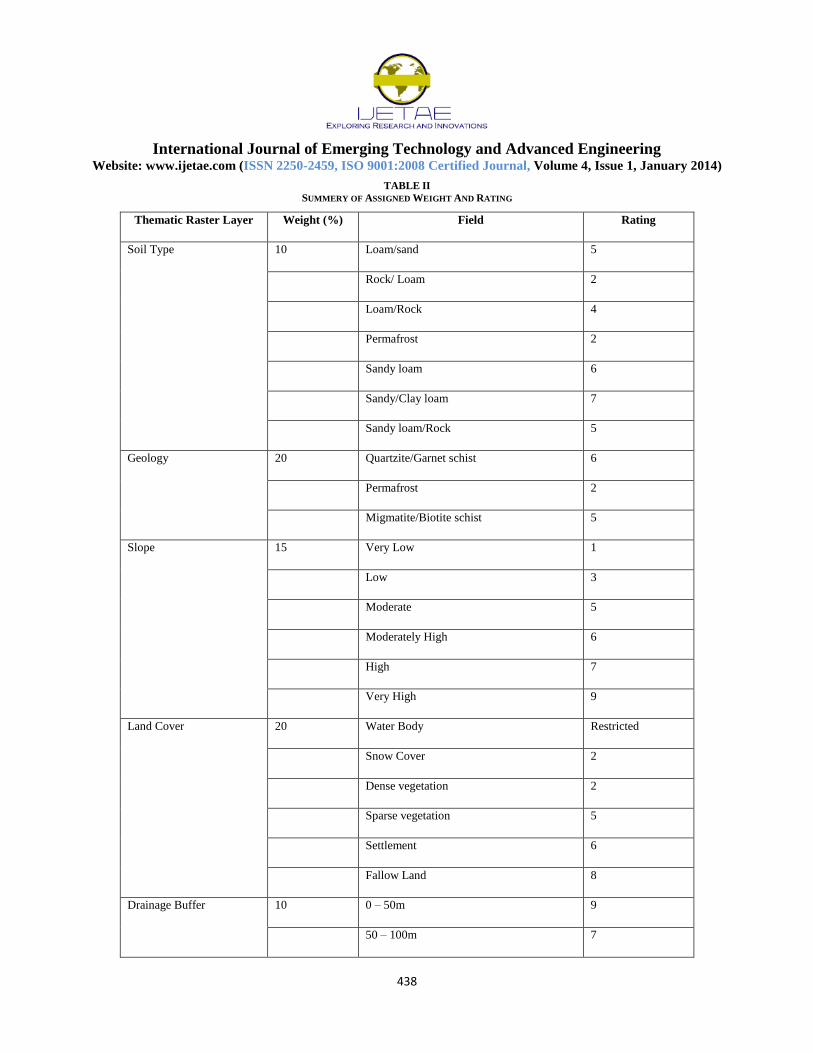
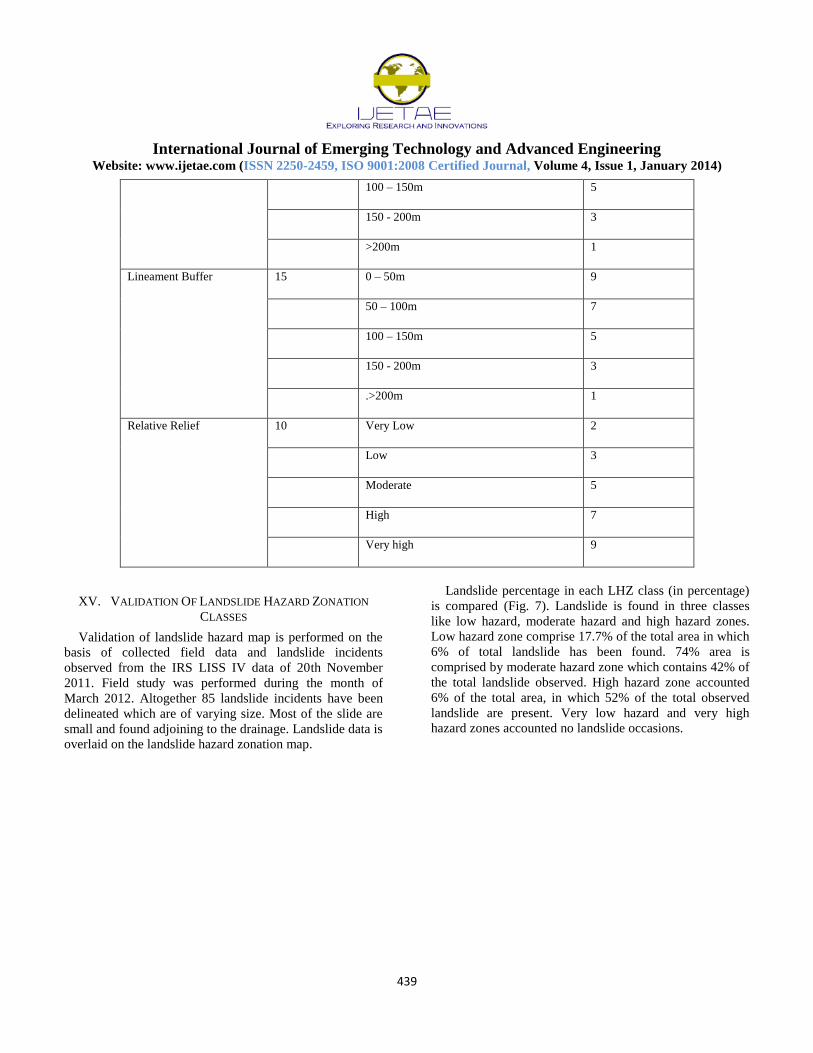
TABLE II
SUMMERY OF ASSIGNED WEIGHT AND RATING
Thematic Raster Layer Weight (%) Field Rating
Soil Type 10 Loam/sand 5
Rock/ Loam 2
Loam/Rock 4
Permafrost 2
Sandy loam 6
Sandy/Clay loam 7
Sandy loam/Rock 5
Geology 20 Quartzite/Garnet schist 6
Permafrost 2
Migmatite/Biotite schist 5
Slope 15 Very Low 1
Low 3
Moderate 5
Moderately High 6
High 7
Very High 9
Land Cover 20 Water Body Restricted
Snow Cover 2
Dense vegetation 2
Sparse vegetation 5
Settlement 6
Fallow Land 8
Drainage Buffer 10 0 – 50m 9
50 – 100m 7
International Journal of Emerging Technology and Advanced Engineering
Website: www.ijetae.com (ISSN 2250-2459, ISO 9001:2008 Certified Journal, Volume 4, Issue 1, January 2014)
439
100 – 150m 5
150 - 200m 3
>200m 1
Lineament Buffer 15 0 – 50m 9
50 – 100m 7
100 – 150m 5
150 - 200m 3
.>200m 1
Relative Relief 10 Very Low 2
Low 3
Moderate 5
High 7
Very high 9
XV. VALIDATION OF LANDSLIDE HAZARD ZONATION
CLASSES
Validation of landslide hazard map is performed on the
basis of collected field data and landslide incidents
observed from the IRS LISS IV data of 20th November
2011. Field study was performed during the month of
March 2012. Altogether 85 landslide incidents have been
delineated which are of varying size. Most of the slide are
small and found adjoining to the drainage. Landslide data is
overlaid on the landslide hazard zonation map.
Landslide percentage in each LHZ class (in percentage)
is compared (Fig. 7). Landslide is found in three classes
like low hazard, moderate hazard and high hazard zones.
Low hazard zone comprise 17.7% of the total area in which
6% of total landslide has been found. 74% area is
comprised by moderate hazard zone which contains 42% of
the total landslide observed. High hazard zone accounted
6% of the total area, in which 52% of the total observed
landslide are present. Very low hazard and very high
hazard zones accounted no landslide occasions.
International Journal of Emerging Technology and Advanced Engineering
Website: www.ijetae.com (ISSN 2250-2459, ISO 9001:2008 Certified Journal, Volume 4, Issue 1, January 2014)
440
FIGURE 5: LANDSLIDE HAZARD ZONATION MAP OF LACHUNG BASIN.
International Journal of Emerging Technology and Advanced Engineering
Website: www.ijetae.com (ISSN 2250-2459, ISO 9001:2008 Certified Journal, Volume 4, Issue 1, January 2014)
441
FIGURE 6: PI CHART SHOWING THE DISTRIBUTION OF LANDSLIDE
HAZARD ZONE CLASSES.
FIGURE 7: BAR CHART SHOWING THE LANDSLIDE OCCURRENCE IN
RELATION TO LANDSLIDE HAZARD ZONE CLASSES.
XVI. CONCLUSION
Present study suggests that the distribution of landslides
is influenced by a combination of factors such as proximity
to the lineament, presence of weathered metamorphic
rocks, barren or less-vegetated areas, as well as other
factors. It is observed that south aspect of slope faces are
more prone to get rainfall and henceforth supports thick
vegetation cover which makes them less vulnerable to mass
movements. Another phenomenon observed is that the
south aspect coincides with barren land. In this case due to
rainfall, barren land cover becomes more prone to
landslide. It is inferred that the presence of terrain
conditions such as slope and relative relief lead to landslide
susceptibility of the area. Local influence such as relative
relief, proximity to drainage and proximity to lineament are
very important for landslide trigger.
Thus the geospatial methodology for integration of
various topographic, geological, and structural, land
use/land cover and other datasets seems to be quite suitable
for determining terrain parameters and landslide hazard
zonation.
REFERENCES
[1] Varnes, D.J., 1984. Landslide Hazard Zonation: a review of
principles and practice, UNESCO, Natural Hazards, No.3, 61.
[2] Hutchinson, J.N., 1995. Landslide hazard assessment. In Proc VI Int.
Symp. on Landslides, Christchurch, 1: 1805-1842.
[3] Mantovani, F., Soeters, R., Van Westen, C.J., 1996. Remote sensing
techniques for landslide studies and hazard zonation in Europe,
Geomorphology 15, 213–225.
[4] Nagarajan. R., Mukherjee, A., Roy, A., Khire, M.V., 1998.
Temporal remote sensing data and GIS application in landslide hazard zonation of part of Western Ghat, India. Int. J. Remote
Sensing 19(4), 573–585
[5] Gupta, R. P., Saha, A. K., Arora, M. K., and Kumar, A., 1999. Landslide Hazard Zonation in a part of the Bhagirathi Valley
Garhwal Himalayas using integrated remote sensing–GIS.
Himalayan Geology, 20, 71–85.
[6] Saha, A.K., Gupta, R.P., & Arora, M.K., 2002. GIS-based landslide
hazard zonation in a part of the Himalayas, Int. J. Remote sensing, vol. 23, no. 2, 357–369
[7] Van Westen, C.J., Van Asch, T.W.J., Soeters, R., 2006. Landslide
hazard and risk zonation — why is it still so difficult? Bulletin of Engineering Geology and Environment 65,167–184.
[8] Anbalagan, R., 1992. Landslide hazard evaluation and zonation
mapping in mountainous terrain. Engineering Geology, 32, 269–277.
[9] Pachauri, A.K. & Pant, M., February 1992. Landslide hazard
mapping based on geological attributes, Engineering Geology, Vol.32, no. 1–2, 81–100.
[10] Ray, K. K., 1976. A review of the geology of the Darjeeling– Sikkim Himalayas. In Himalayan Geological Seminar, New Delhi, 13–17.
[11] Acharya, S. K., & Shastry, M. V. A., 1979. Stratigraphy of Eastern
Himalaya. Geological Survey of India Miscellaneous Publication, 41, 49–67.
[12] Sinha-Roy, S., 1982. Himalayan Main Central Thrust and its implications for Himalayan inverted metamorphism.
Tectonophysics, 84, 197–224.
[13] Neogi, S., Dasgupta, S. & Fukuoka, M., 1998. High P–T polymetamorphism, dehydration-melting, and generation of
migmatites and granites in the Higher Himalayan crystalline complex, Sikkim, India. Journal of Petrology, 39, 61–99.
[14] Catlos, E. J., Dubey, C. S., Harrison, T. M. & Edwards, M. A., 2004.
Late Miocene movement within the Himalayan Main Central Thrust shear zone, Sikkim, north-east India. Journal of Metamorphic
Geology, 22, 207–226.