Embed Size (px)
Citation preview
Computers amp Geosciences 28 (2002) 735ndash749
Probabilistic modeling of uncertainties in earthquake-inducedlandslide hazard assessment$
Alberto Reficea Domenico Capolongob
aDipartimento Interateneo di Fisica INFM Via Amendola 173 70126 Bari ItalybDipartimento di Geologia e Geofisica Via F Orabona 4 70125 Bari Italy
Received 12 October 2000 received in revised form 1 November 2001 accepted 8 November 2001
Abstract
Probabilistic analysis is gaining more attention in the field of landslide hazard assessment due to the possibility of
taking into account estimation uncertainties and spatial variability of geological geotechnical geomorphological and
seismological parameters In this paper an implementation of a simple approach to derive probabilistic earthquake
triggered landslide hazard maps is described The method is based on the simplified Newmark slope stability model
applied on a pixel-by-pixel basis which fully integrates into current GIS computational environments Uncertainties
and fluctuations in input parameters are considered by treating these quantities as statistical distributions Various
probability density functions can be simulated through Monte Carlo techniques on a pixel-by-pixel basis and the
simulated samples are retained through all the computing steps This allows the resulting quantities to be cast into
probabilistic hazard maps without restrictions about the symmetry or the mathematical complexity of the underlying
distributions First results on a test landslide site in Southern Italy show good performances for realistic landslide
hazard zonation The simplicity of the adopted framework allows the current approach to be easily expanded and
improved the current approach r 2002 Elsevier Science Ltd All rights reserved
Keywords Probabilistic methods Newmark model Earthquake-triggered landslides Monte Carlo simulation Asymmetric pdf
1 Introduction and motivation
In the international Decade for Natural Disaster
Reduction (1990ndash2000) a major of research effort was
initiated to develop new methodologies for landslide
hazard assessment In this context the term hazard
describes the magnitude and probability of occurrence
of landslides within a specified period of time and in a
certain area
Earthquakes are an important triggering cause for
landslides Damage from earthquake-induced landslides
and other ground failures sometimes exceeds the
damage directly related to ground shaking and fault
rupture Effects such as these have encouraged the
development of reliable techniques for anticipating slope
failures Methodologies range from modeling and
understanding of the causes of landslides to monitoring
of some probable triggering factors such as premoni-
tory small displacements to improvements in risk
management mainly through hazard zonation and
forecasting The emerging capabilities of Geographic
Information Systems the rapid increase in computa-
tional power and decrease in computer costs the
increasingly widespread use of such techniques by the
geological community at large all constitute a strong
impulse to research on these fields (Burrough 1986)
Among slope stability models Newmarkrsquos model
(Newmark 1965) is often used to derive indications
about slope instabilities due to earthquakes mostly by
virtue of its simplicity (Wilson and Keefer 1985 Jibson
$Code available on server at httpwwwiamgorg
CGEditorindexhtm
Corresponding author Tel +39+80-544-3166 fax
+39+80-544-3165
E-mail address albertoreficebainfnit (A Refice)
0098-300402$ - see front matter r 2002 Elsevier Science Ltd All rights reserved
PII S 0 0 9 8 - 3 0 0 4 ( 0 1 ) 0 0 1 0 4 - 2
1993) However to deal with some of the weaknesses
associated with the original deterministic model
probabilistic seismic slope stability techniques are being
used These are usually capable of quantifying and then
mapping a measure related to the likelihood of slope
failure of any particular terrain location Specifically by
incorporating the variability of some of the parameters
entering the model these methods give a measure of the
probabilities for shallow slope failure during future
earthquakes The general approach consists in treating
some parameters as random variables rather than fixed
values The details of how these variables are then used
to obtain the final predictive quantities differ with each
particular application or author For example in
Mankelow and Murphy (1998) it is shown that
modeling uncertainties as probability distribution func-
tions improves the forecasting capabilities of Newmarkrsquos
model The authors propagate the uncertainty through
the model equations determining the statistical para-
meters of the final probability distribution for the
Newmark displacement All distributions are modeled
as Gaussian and thus characterized by their mean and
standard deviation
Other examples of probabilistic techniques used in
landslide hazard zonation are in van Asch and Mulder
(1991) Luzi et al (1998) Chung and Fabbri (1998) and
Massari and Atkinson (1998)
Although the Gaussian hypothesis is simple to deal
with and allows a complete description of all the
statistical variability to be obtained through a relatively
small computational effort (Luzi et al 1998 Mankelow
et al 1998) it is sometimes considered too simple for
real applications However the same methodology used
for Gaussian distributions can be adapted to a number
of other statistical probability density functions (pdfs)
Nevertheless the most efficient approach to deal in a
general way with non-Gaussian distributions is Monte
Carlo simulation Due to intensive computational needs
effective applications of Monte Carlo simulation tech-
niques for risk analysis studies have only recently begun
to be used extensively (Vose 1996)
In this paper a software implementation of a
methodology is described which calculates statistical
probabilities of Newmark displacements for a given
earth surface region on a pixel-by-pixel basis The
software accepts in input geological geotechnical
geomorphological and seismological parameters in
the form of raster matrices and tables of numerical
values containing statistical parameters for the assumed
distributions of some of the input quantities These
parameters are used to perform a series of Monte
Carlo simulations in which random samples are
generated and then combined through Newmarkrsquos
model equations to obtain probabilistic distributions
of the final Newmark displacement These can then be
cast into maps displaying for example the probability
that the predicted displacement exceeds a given thresh-
old value for each map pixel
Maps of this kind are particularly important in
regions characterized by several seismic events per year
and low return periods for large magnitude events such
as the Irpinian region (Southern Italy) The active
tectonics of this area and its complex geological history
result among other things in the presence of steep and
unstable slopes that undergo active degradation Thus
extensive landsliding has occurred during earthquakes in
the past In this paper an application of probabilistic
techniques to this particular region is presented A
probabilistic earthquake-induced landslide hazard map
is built and compared with the results provided by other
methodologies
The paper is organized as follows In Section 2 some
general background regarding probabilistic applications
of Newmarkrsquos model for seismically induced landslide
hazard assessment is reviewed in Section 3 the details of
the program implementation are given then in Section
4 the Sele Valley test site is described and in Section 5
results of the described approach over this test landslide
area are presented and compared with other methods
Finally in Section 6 some conclusions are drawn
2 Landslide risk assessment through probabilistic
methods
21 Newmarkrsquos model for landslide risk assessment
Due to the problems associated with assigning
particular dynamic factors of safety and since it is
increasingly being found to be a more realistic method
of analysis the dynamic displacement model developed
by Newmark (1965) is being used instead of more
traditional pseudo-static seismic slope stability models
in many studies on earthquake-triggered landslides
(Wieczorek 1984 Jibson 1993 Mankelow and Mur-
phy 1998)
Newmarkrsquos analysis (Newmark 1965 Jibson 1993)
models the part of the slope which is under stress as a
uniform block sliding over an infinite inclined surface
With this approach the static factor of safety is
computed as (Jibson 1993)
FSstat frac14c0 thorn frac12ethg mgwTHORNz cos2 atan f0
gz sin a cos a eth1THORN
where c0 is the effective cohesion f0 the effective friction
angle g the material unit weight gw the unit weight of
water m represents the fractional depth of the water
table with respect to the total slide depth z stands for
the slope-normal thickness of the failure slab and a is
the slope angle
Newmarkrsquos analysis then calculates the displacement
of a slope as it is subjected to an earthquake Slope
A Refice D Capolongo Computers amp Geosciences 28 (2002) 735ndash749736
failure will occur and movements will be initiated when
the critical acceleration of the slope ac is exceeded The
quantity ac represents the acceleration required to
overcome the frictional resistance of the slope material
and thus initiate sliding it can be calculated as follows
ac frac14 ethFSstat 1THORN g sin a0 eth2THORN
where g is the Earthrsquos gravity acceleration and a0 is the
thrust angle of the landslide block For shallow land-
slides one can assume a0 frac14 aTo determine the Newmark displacement Dn after
Jibson et al (1997) an empirical logarithmic regression
equation can be used relating Dn the critical accelera-
tion ac and the Arias Intensity IA (a measure of the
earthquake energy)
log Dn frac14 07605 log IA 09965 log ac 0773 eth3THORN
where Dn is expressed in m IA in m s1 and ac in g units
This empirical relation has been derived from an
extensive dataset of seismic records collected in different
regions Although approximate it constitutes a useful
relation which allows information about the Newmark
displacement to be derived from seismic and geotechni-
cal records
The Arias intensity is often modeled through another
empirical logarithmic relation as a function of the
earthquake magnitude M and the site distance from
the seismogenic fault R derived in Wilson and Keefer
(1985)
log IA frac14 M 2 log R 41 eth4THORN
where IA is expressed in m s1 M is the earthquake
magnitude in the Richter scale and R is in m
The two preceding equations have been used in the
present work as a reasonable and simple computational
tool for deriving information about the Newmark
displacement given a certain geotechnical situation and
supposing a certain seismic shaking strength as is
common practice (see Mankelow and Murphy 1998)
No attempt has been made to test the validity of the
preceding relations for the geological conditions of
southern Italy This goes beyond the scope of the present
work and constitutes an interesting subject for future
research
22 Probabilistic framework
Newmarkrsquos model requires the knowledge of several
parameters some of which have to be estimated from
geotechnical field work (eg cohesion and friction
angles) others are obtained from seismic records (Arias
intensity) and some can be derived nowadays spatial
topographic data through GIS programs (slope maps)
In the situation of geotechnical data properties of soil
types are derived from laboratory tests and their spatial
variability is extrapolated on the basis of geological
maps Often such properties are difficult to determine
accurately moreover lithological distinctions are often
not reported on geological maps so that one may be led
to assume a homogenous distribution of parameters for
different lithologies of the same geological unit Finally
a poor positional accuracy is often related with the scale
of the geological map used to derive the spatial
distribution of the parameters
For these reasons the model parameters should be
thought of more as probabilistically distributed rather
than having single deterministic values (see Miles et al
2000)
The statistical uncertainties in many real-world data
can be modeled by a large variety of pdfs Although the
most used are the simple uniform or the Gaussian many
natural quantities cannot be assumed to follow these
distributions This is especially true for quantities which
have to be estimated through repeated field work often
performed in heterogeneous conditions or judged by
expertsrsquo opinions In these cases it is often preferred to
use more general distributions to model their uncer-
tainty For example the b distribution is often chosen
for its simplicity either in its original form or modified
such as in the so-called bPERT which is a mathematical
variant defined by the three parameters of minimum
most likely and maximum value (see Vose 1996 for
further details on the bPERT and its use)
3 Implementation
In this section the details of our technique are
presented The software developed consists of a series
of Matlabs functions performing specific tasks This
allows to have a very flexible framework which can be
adapted to many situations and geographic areas by
simply changing eg the statistical distributions or the
Monte Carlo simulation techniques used A scheme of
the method is illustrated in Fig 1
31 Input files
Input to the software is constituted by a set of raster
maps and tables whose file names are defined in a
parameter file Some of the maps represent information
whose accuracy is already at the pixel level such as the
slope map or the Arias intensity map Other quantities
are defined over homogeneous spatial regions or units
and are thus specified by a raster map of the unit indices
and a table in which a series of parameters is attached to
each unit index For example a lithological index map
can have a series of geotechnical parameters linked to
each lithological unit
For obvious reasons statistical variability is typically
connected to this second type of input data although in
principle any variable could be considered as a set of
A Refice D Capolongo Computers amp Geosciences 28 (2002) 735ndash749 737
probability distributions since the program can treat
each map pixel independently
Different index maps could be used for different
parameters (eg one for the cohesion another for the
friction angle etc) In these cases a simple merging of
the various index maps and consequent splitting of
homogeneous regions would yield a new index map in
which each unit would have different overall character-
istics
32 Monte Carlo simulations
Simulations are performed by Monte Carlo sampling
For each particular set of values statistically rando-
mized samples can be generated as drawn from common
distributions such as the Gaussian the simple triangu-
lar or the mentioned bPERT pdf
Each statistical sample is generated by the stratified
sampling methodology known as Latin Hypercube
Sampling (LHS) which is based on the subdivision of
the data interval into a certain number of sub-intervals
of equal probability (Vose 1996) LHS sampling allows
realistic looking distributions to be obtained from a
relatively limited number of samples Thus fewer
samples can be used without significant loss of accuracy
leading to an overall gain in computational efficiency
Moreover importance of sampling techniques such as
LHS allows low-probability tails in the simulated
distributions better to be reproduced
33 On the use of asymmetric pdfs
Fig 2 shows an example of Monte Carlo analysis
performed for one particular location of the landslide test
site in Southern Italy Histograms of the three random
samples of values simulating the cohesion c0 friction
angle f0 and water table fractional depth m with bPERT
distributions are shown on the left part of the figure The
random samples consisting of 100000 numbers each
were then combined using Eqs (1)ndash(3) with the mor-
phological (slope angle) and seismic (Arias intensity)
quantities related to the specific site to obtain the Dn
sample values whose histogram is shown on the graph on
the right of the figure This graph also shows two
continuous curves representing the theoretical distribu-
tions obtained through the application of lsquolsquostandardrsquorsquo
statistical methods which are usually applied to Gaussian
distributions Curve (a) shows the theoretical bPERT
distribution obtained by propagating the minimum most
likely and maximum values of each of the three input
parameters through the Newmark model equations
Curve (b) shows the bPERT distribution derived by
Fig 1 Schematic representation of computational methodology described in text In parameters table for simplicity number of
parameters Pk for fixed geotechnical parameter k k frac14 1yM is represented as fixed for all N lithological indices although in principle
different pdfs involving different numbers of parameters could be used for each lithology index Output dataset is shown as consisting
of whole histogram samples for output data (eg Newmark displacement) although in most examples only single value per pixelmdash
typically pdf integral above fixed thresholdmdashneeds to be represented on output map
A Refice D Capolongo Computers amp Geosciences 28 (2002) 735ndash749738
estimating the minimum most likely and maximum
parameters from the obtained experimental distribution
through standard non-linear least-squares estimation
techniques such as a LevenbergndashMarquardt algorithm
(Press et al 1992) It can be noted that both curves show
a poor agreement with the sampled distribution obtained
by performing the calculations over each of the random
samples as expected This example shows how conven-
tional methodologies usually accepted for simulations
performed with Gaussian assumptions are not suitable
when more general types of statistical distributions are
used In these situations retaining the whole random
Fig 2 Example of Monte Carlo simulations Histograms of randomly generated samples for effective cohesion c0 friction angle f0 and
water table fractional depth m are shown on left for given location of landslide test site Resulting histogram of calculated Dn sample is
shown on right Continuous curves represent analytical distribution obtained by propagating minimum most likely and maximum
values for three input parameters through equation described in section 2 (a) and best fitting bPERT distribution obtained through
standard least-squares estimation (b) respectively
A Refice D Capolongo Computers amp Geosciences 28 (2002) 735ndash749 739
samples throughout the calculations is required in order
to avoid errors and approximations
34 Map construction
In the proposed methodology the random samples
generated for each lithological unit are retained
throughout all the map construction operations This
avoids unnecessary assumptions about their behavior
when they are used to derive features such as the critical
acceleration or the Newmark displacement Each
statistical random sample is thus combined on a pixel-
by-pixel basis with the remaining quantities such as the
slope angle and the Arias Intensity values
The whole random samples representing the various
model intermediate and final parameters such as the
factor of safety critical acceleration and the Newmark
displacement are thus retained for each pixel This as
demonstrated in the previous section is the correct way
to deal with general pdfs (non-Gaussian)
The entire three-dimensional datasets representing the
histograms of each map pixel can be stored However to
avoid excessive disk usage and since hazard assessment
results are traditionally conveyed in the form of two-
dimensional maps in most situations it is sufficient to
store only a small number of parameters for each pixel
of a given output quantity For example the most useful
output for the Newmark displacement distribution is the
probability that Dn exceeds a certain given threshold
value Such a quantity indicates the degree of landslide
hazard associated with each map site given a certain
earthquake intensity specified by the Arias Intensity
value
To derive such a probability map a certain threshold
value is determined for the Newmark displacement
then the experimental Dn distributions associated with
each pixel are numerically integrated above the thresh-
old The result gives an estimated probability of Dn
exceeding the threshold value
4 Description of a case study the Sele Valley
In this section some background information is given
about the region of the Sele Valley in southern Italy
characterized by several landslide sites and on which the
technique described in this work has been applied as a
case study
A location map of the area is shown in Fig 3 The
valley has undergone strong seismic shaking during the
past The 1980 Irpinian earthquake for example has
triggered many landslides and rockfalls on the valley
flanks The Sele Valley is the object of intensive studies
mainly due to the peculiar character of its landslide
distribution (Wasowski et al 2000)
41 Outline of the geology and geomorphology of the
upper valley of the Sele river
The outcropping lithologies can be broadly divided
into four main groups schematically shown in Fig 4
Carbonate units Limestones dolomitic limestones
and dolomites (Trias-Cretaceous) form the Picentini
mountains and the Mt OgnamdashMt Marzano ridge In
the present work carbonate terrains have been sepa-
rated from the dolomites only where their physical
characteristics and their geotechnical behaviour were
particularly different
Irpinian units Terrigenous Miocene sediments known
as Castelvetere flysch They consist mainly of sandstone
and conglomerate embedded in clayey-marly strata
which have become mixed with limestone blocks that
range in size from a few to several thousands m3 These
lithological units are referred to in the text also as flysch
or flysch formations
Sicilide units Extensive overburden of variegated
clays shales marls cherts and sandstone (Upper
Cretaceous-Paleocene) This formation is marked
mainly by clay-rich lithofacies and is characterized by
high heterogeneity and anisotropy It shows macro-
Fig 3 Location map of Italian southern Apennines area used
as test site Sele Valley is indicated by small rectangle
A Refice D Capolongo Computers amp Geosciences 28 (2002) 735ndash749740
scopic slope deformation and mass movement in
general
Quaternary superficial deposits They consist of
colluvial and alluvial fan sediments The fan sediments
are carbonates eroded from the mountain basins and
from Quaternary gelifraction of the clastic deposits at
the mountain front In the text and the figures they are
also referred to as alluvium and colluvium
Various tectonic phases created the present-day
structure of the study area (Scandone 1973) The
Apennine tectonics that had already begun in the
Middle-Upper Miocene and continued throughout the
Plio-Pleistocene determined large-scale dislocation and
associated intensive deformations By contrast the
Pleistocene was characterized by extensional tectonics
that have mainly influenced the present-day morphology
(Ortolani 1975) The Quaternary tectonics have been
characterized by a general and significant uplift
Recently the role of strike-slip tectonics has been
emphasized (with different opinions and conclusions)
as being responsible for the recent deformation and
evolution of the southern Apennines (Cinque et al
1992)
The morphology of the study area is strongly
dependent on its structural and neotectonic
evolution Two different landscapes can be recognized
one typical of the carbonate domains the other
of the flysch formations and colluvium and alluvium
Fig 4 Lithological units used in simulation
A Refice D Capolongo Computers amp Geosciences 28 (2002) 735ndash749 741
terrain Carbonate rocks border the eastern and
western margin of the Sele valley and are delimited by
bounding faults
A slope map of the test area is shown in Fig 5 The
outcrops are characterized by steep and sometimes
subvertical slopes The flysch formations and collu-
viumalluvium terrain show low-medium angle slopes
(10ndash12 deg on average)
The hydrographic network testifies a strong structural
control only in part guided by tectonic discontinuities
and shows a dendritic pattern with a tendency to be
rectangular Mass movement is the principal geo-
morphic process active in this area
The hydrogeological setting has also undergone
extensive investigations (Cotecchia et al 1986) The
high permeability of the carbonate rocks due to
fracturing and karst phenomena allows a large accu-
mulation of water This water is confined by the flysch
acting as an impervious lsquolsquobeltrsquorsquo around the carbonate
massif A large number of springs are located at the
scarp toe of the carbonate massives In particular
springs are located at the contact between the carbonate
aquifer and the flysch formations (termed Irpinian units
in the description of Section 41)
42 Historic seismicity and 1980 earthquake main
parameters
This part of the Southern Apennines was hit by at
least 48 earthquakes of intensities up to IX in the
MercallindashCancanindashSieberg (MCS) scale between 63 AD
and 1980 In this study area earthquakes with intensity
of X MCS occurred in 1571 (Vallo di Diano) 1694
(Basilicata Settentrionale) 1702 (Benevento) 1732
Fig 5 Slope map of test area Legend units are degrees
A Refice D Capolongo Computers amp Geosciences 28 (2002) 735ndash749742
(Irpinia) 1851 (Vulture) 1930 (Irpinia) and 1980
(CampaniandashLucania) Unfortunately information on
the triggered landslides are available only for the most
recent event The main parameters for this earthquake
are shown in Table 1 In Pantosti and Valensise (1990) it
is suggested that the 1980 earthquake must be con-
sidered as the early stage of a new tectonic regime They
show how the trend of the 1980 surface fault does not
follow any previously mapped structure and occurs at an
average elevation of 1200 m much closer to the top of
the range (1400 m) than to the Upper Sele valley floor
(300 m) The computed seismic moment is
18 1023 Nm1
Fig 6 shows the map of the Arias Intensity (IA) for
the test area as computed through Eq (4)
In Agnesi et al (1980) data pertaining to 50 landslides
that occurred after the 1980 earthquake were gathered
The area consisted of carbonate rock outcrops that were
only marginally influenced by mass movements Rock-
falls and topples were confined to the steep slopes around
the carbonate relief and to some karst cavities whose
roofs collapsed forming dolines Numerous landslides
occurred in the flysch formations Several of these were
reactivations of ancient or dormant landslides mainly of
Table 1
Source Parameters of 23 November 1980 earthquake
Location 401450Nndash161180E
Depth of focus 18 103 m
Magnitude of main shock (Richter scale) 69
Intensity at epicentre (MCS scale) X
Maximum acceleration of the EndashW
component (recorded at Sturno)
033 g
Origin time 1834
Duration gt70 s
Fig 6 Map of Arias intensity (IA) of test area calculated from 1980 Irpinian earthquake seismic data Units are in m s1
A Refice D Capolongo Computers amp Geosciences 28 (2002) 735ndash749 743
slide-flow type The morphology and the type of post-
earthquake landslides do not significantly differ from the
pre-earthquake existing landslides
Earthquake-triggered landslides are markedly predo-
minant on the western valley side both in flysch and in
carbonate rocks Such a peculiar spatial distribution is
being intensely studied since it is difficult to explain with
the simple hypothesis of similar terrain characteristics of
both valley sides which could be assumed by the
available ground data
43 Brief outline of the geotechnical features
In Cotecchia et al (1992) a study on the geotechnical
behavior of flysch units in the Sele valley is reported
The flysch formation of lsquolsquoArgille varicolorirsquorsquo part of
Sicilide Units must be considered a lsquolsquostructurally
complexrsquorsquo formation from both a geological and a
geotechnical point of view This is due to its marked
heterogeneity anisotropic nature the presence of
irregular lithological alterations together with the
widespread variously oriented discontinuities and the
structural attitude conditioned on both small and large
scale by intense tectonic and deformation history (Esu
1977) The results of the ongoing mineralogical and
geochemical studies reveal a predominance of smectite
and illite as the clay component Small and large scale
geotechnical behavior seems to be different In situ
residual strength values have been obtained by back
analysis of major and minor mass movements part of
which were reactivated after the 1980 earthquake
(Cotecchia et al 1992) Residual frictional angles
between 12 and 15 deg were calculated (Bellino and
Maugeri 1985 Cotecchia et al 1986)
5 Simulation results
In this section the results of the simulations
performed over the study region are shown To
investigate the potential of the method two kinds of
simulations were performed First a series of values was
established for the minimum most likely and maximum
parameters which characterize bPERT distributions for
the three geotechnical quantities of cohesion friction
angle and water table depth
The other parameters were assumed as fixed in these
simplified experiments although they can also be easily
modeled probabilistically in the framework of the
proposed method This choice was made to keep the
conditions simple Moreover the simulations were
performed with a focus on the variability of geotechnical
parameters more than that of other quantities
All the numbers were chosen after a critical review of
the related literature nevertheless they are often the
result of abstraction and conjecture due to the
insufficient detail with which such parameters are
described for our particular lithologic types They
should be considered here mainly as representative
values
For comparison another series of simulations was
performed by adopting Gaussian distributions for the
Table 2
Statistical parameters used for simulations with bPERT pdfs
Type c0 (kPa) f0 (deg) m g (kNm3)
Min ml Max Min ml Max Min ml Max
Carbonate units 100 200 600 20 42 55 05 08 1 26
Irpinian units 0 3 5 5 40 50 05 08 1 21
Sicilide units 5 39 44 10 16 23 05 08 1 20
Alluvium and colluvium 0 3 10 15 35 40 05 08 1 15
z frac14 75m gw frac14 9807kN m3
Table 3
Statistical parameters used for simulations with Gaussian pdfs
Type c0 (kPa) f0 (degrees) m g (kNm3)
mean SD mean SD mean SD
Carbonate units 3500 833 375 58 075 008 26
Irpinian units 25 83 275 75 075 008 21
Sicilide units 245 65 165 22 075 008 20
Alluvium and colluvium 50 16 275 42 075 008 15
z frac14 75m gw frac14 9807kN m3
A Refice D Capolongo Computers amp Geosciences 28 (2002) 735ndash749744
mentioned parameters with means and standard
deviations derived so as to best approximate the
bPERT pdfs with the obvious limitation of symmetry
around the mean The results of this last type of
simulation are in fact the same as could be obtained by
the pseudo-deterministic methodology described earlier
consisting of propagating the means and standard
deviations through the model equations to have a final
value for the Dn statistical parameters
Table 2 reports the various parameters used for the
simulation with bPERT distribution functions whereas
Table 3 shows the corresponding parameters used in the
simulations with Gaussian pdfs
A slope map was derived from digital elevation data
of the area (see Fig 5) whereas the Arias intensity IA
was modeled from seismological records (see Fig 6)
Fig 7 shows the main landslide and rockfalls triggered
by the 1980 earthquake (see Section 43)
The slope and the landslide maps are shown as draped
on a hill-shaded 3D view of the DEM used in the
simulations as well as the resulting landslide probability
hazard maps described in the following
Figs 8 and 9 show the Dn probability maps obtained
from Gaussian and bPERT simulated samples respec-
tively As can be noted both maps exhibit consistent
levels of estimated hazard on the eastern side of the
valley and a considerably lesser one on the western side
This is in contrast with the actual situation in which the
western flank of the valley is more subjected to landslide
activity as can be inferred from the higher density of
landslide areas shown by the map in Fig 7 This
behavior is probably due to the simple modelization of
the lithology and geotechnical features of the area
Nevertheless it can be seen that less grey areas are
generated on the eastern flank of the valley by using
bPERT pdfs than by using the Gaussian hypothesis for
Fig 7 Location of landslides and rockfalls triggered by 1980 earthquake on Sele Valley test site shown as light gray and white areas
respectively Seismogenetic fault of 1980 Irpinian earthquake (dashed line) is also shown
A Refice D Capolongo Computers amp Geosciences 28 (2002) 735ndash749 745
the pdfs A better agreement is therefore obtained
between the reality and the model by allowing the
statistical distribution to model uncertainties in a non-
symmetrical and thus more realistic way
Both the probabilistic approaches lead to a better
agreement with reality than a completely deterministic
model see the results shown in Fig 10 for comparison
(details can be found in Capolongo 1999)
6 Conclusions
We have presented an approach to compute prob-
abilistic hazard maps for seismically induced landslides
Based on Newmarkrsquos displacement method the proce-
dure allows some of the uncertainties usually associated
with the geological geomorphological or seismological
data involved in the model under the form of statistical
distributions to be considered
The procedure calculates and stores histogram
information about the derived quantities such
as the Newmark displacement Dn on a pixel-by pixel
basis This approach allows a considerable degree of
flexibility in modeling real-world estimates of quantities
usually difficult to model as Gaussian-distributed
Probability threshold maps can then be derived for
indicative parameters such as the Newmark displace-
ment as a representation of the spatial distribution of
the seismic-landslide hazard throughout the area under
study
Fig 8 Dn probability map obtained with methodology described in text using Gaussian pdfs for statistical modeling Filled areas
from white to black indicate increasing probability of Dn exceeding threshold value of 01m
A Refice D Capolongo Computers amp Geosciences 28 (2002) 735ndash749746
The application of the methodology to a landslide
area in southern Italy has shown consistent improve-
ments in the capabilities to predict potentially hazardous
zones compared to other methods although many
problems are yet to be solved due to the geologic
complexity of the site Nevertheless the results are
encouraging further studies and improvements of the
presented approach
The methodology implemented as a Matlabs suite of
functions is built in a modular fashion and can be
easily expanded and enriched with more complex
features For example other models can be used rather
than Newmarkrsquos different sampling distributions can be
used to simulate different kinds of behavior or the
model can be adapted to different geographic zones
Moreover different sampling criteria could be intro-
duced or further statistical Monte Carlo tools could be
added to control other features of the simulated
quantities such as correlation between different vari-
ables or spatial autocorrelation for certain parameters
including fractal characteristics The modularity and
compactness of the approach allows an almost seamless
integration into existing GIS environments
Acknowledgements
The authors would like to thank Dr Joseph
Mankelow and Dr David Giles for the useful discus-
sions and Dr Janusz Wasowski and Dr Vincenzo Del
Gaudio of the CERIST-CNR of Bari for their kind
permission to use some of their data and for their
support They also thank the two anonymous reviewers
for the insightful comments and useful suggestions
Fig 9 Same as Fig 8 but obtained by using bPERT pdfs for statistical modeling
A Refice D Capolongo Computers amp Geosciences 28 (2002) 735ndash749 747
References
Agnesi V Carrara A Macaluso T Monteleone S
Pipitone G Sorriso-Valvo M 1980 Osservazioni pre-
liminari sui fenomeni di instabilita dei versanti indotti dal
sisma del 1980 (alta valle del sele) (preliminary observations
about versant instability phenomena induced by the 1980
earthquake (alta valle del sele)) Geologia Applicata e
Idrogeologia 17 79ndash93
Bellino S Maugeri M 1985 Confronto fra i valori di
resistenza residua ottenuti con diverse apparecchiature
anulari di taglio (comparison between residual resistance
values obtained with different annular cutting devices)
Rivista Italiana di Geotecnica 2 101ndash111
Burrough P 1986 Principles of Geographic Information
Systems for Land Resources Assessment Clarendon Press
Oxford UK 195p
Capolongo D 1999 GIS techniques for estimating earth-
quake-triggered landslide hazards PhD Dissertation
Dipartimento di Geologia e Geofisica Universita degli
studi di Bari 98p
Chung CF Fabbri AG 1998 Three Bayesian prediction
models for landslide hazard In Proceedings of The Annual
Conference of the International Association for Mathema-
tical Geology (IAMG 98) Vol I Ischia Island Naples
Italy pp 204ndash211
Cinque A Patacca E Scandone P Tozzi M 1992
Quaternary kinematic evolution of the South
Apennines relationship between surface geological features
and deep lithospheric structures Annali di Geofisica 36
249ndash260
Cotecchia V Del Prete M Tafuni N 1986 Effects of
earthquake of 23rd November 1980 on pre-existing land-
slides in the Senerchia area (southern Italy) In Proceedings
Fig 10 Dn map generated by deterministic method Fixed values were used for c0 f0 and m parameters to derive deterministic
Newmark displacement values On areas highlighted in black Dn value exceeds 01 m
A Refice D Capolongo Computers amp Geosciences 28 (2002) 735ndash749748
of International Symposium on Engineering Geological
Problems in Seismic Areas Vol 4 Bari Italy pp 1ndash46
Cotecchia V Salvemini A Simeone V Tafuni N 1992
Comportamento geotecnico delle unita sicilide ed irpine
affioranti nelle alte valli dei fiume sele e ofanto ad elevato
rischio sismotettonico (geotechnical behaviour of sicilide
and Irpine units outcropping in the high valleys of the sele
and Ofanto rivers of high seismotectonic risk) Geologia
Applicata e Idrogeologia XXVII 1ndash47
Esu F 1977 Behaviour of slopes in structurally complex
formations In Proceedings of International Symposium on
the Geotechnics of Structurally Complex Formations Vol
2 Capri Italy pp 292ndash304
Jibson RW 1993 Predicting earthquake-induced landslide
displacements using Newmarkrsquos sliding block analysis
Transportation Research Record 1411 9ndash17
Jibson RW Harp EL Michael JA 1997 A method for
producing digital probabilistic seismic landslide hazard
maps an example from the Los Angeles California area
Open-file Report 98-113 US Geological Survey available
online at httpgeohazardscrusgsgovpubsofr98-113
ofr98-113html
Luzi L Pergalani F Terlien MTJ 1998 A probabilistic
approach to assess uncertainty of landslide vulnerability to
earthquakes using GIS techniques In Proceedings of the
Annual Conference of the International Association for
Mathematical Geology (IAMG 98) Vol I Ischia Island
Naples Italy pp 235ndash240
Mankelow JM Giles D Murphy W 1998 Probability
density function modeling for earthquake triggered land-
slide hazard assessments In Proceedings of the Annual
Conference of the International Association for Mathema-
tical Geology (IAMG 98) Vol I Ischia Island Naples
Italy pp 241ndash246
Mankelow JM Murphy W 1998 Using GIS in the
probabilistic assessment of earthquake triggered landslides
hazards Journal of Earthquake Engineering 2 (4) 593ndash623
Massari R Atkinson PM 1998 Using the GIbbs sampler in
mapping susceptibility to landsliding In Proceedings of the
Annual Conference of the International Association for
Mathematical Geology (IAMG 98) Vol I Ischia Island
Naples Italy pp 247ndash252
Miles SB Keefer DK Nyerges TL 2000 A case study in
GIS-based environmental model validation using earth-
quake-induced landslide hazard In Proceedings of Fourth
International Symposium on Spatial Accuracy Assessment
in Natural Resources and Environmental Sciences Am-
sterdam pp 104ndash114
Newmark NM 1965 Effects of earthquakes on dams and
embankments Fifth Rankine Lecture pp 139ndash160
Ortolani F 1975 Assetto strutturale dei monti picentini della
valle del sele e del gruppo di monte marzanomdashmonte ogna
(appennino meridionale)(structural setup of monti picentini
sele valley and the mt marzanomdashmt ogna group (southern
Appennines)) Bollettino della societa Geologica Italiana 94
209ndash230
Pantosti D Valensise G 1990 Faulting mechanism and
complexity of the 23 november 1980 CampaniamdashLucania
earthquake inferred from surface observations Journal of
Geophysical Research 95 15319ndash15341
Press WH Flannery BP Teukolsky SA Vetterling WT
1992 Numerical Recipes The Art of Scientific Computing
2nd Edn Cambridge University Press Cambridge UK
994p
Scandone P 1973 Studi di geologia lucana Nota illustrativa
della carta dei terreni della serie calcareo-silico
marnosa Bollettino Societa Nat Napoli 81 225ndash300
(in Italian)
Van Asch TWJ Mulder HFHM 1991 Statistical
geotechnical and hydrological approaches in landslide
hazard assessment of mass movements In UNESCO-ITC
Project on Mountain Hazard Mapping in Andean Environ-
ment using Geographical Information Systems Expert
Workshop Bogota Colombia p 31
Vose D 1996 Quantitative Risk Analysis A Guide to Monte
Carlo Simulation Modeling Wiley Chichester England
328p
Wasowski J Del Gaudio V Pierri P 2000 Landslide
triggering by the 1980 Irpinian earthquake re-visited the
case of the Sele valley In Geophysical Research Abstracts
Vol 2 European Geophysical Society available on CD-
ROM
Wieczorek GF 1984 Preparing a detailed landslide-inventory
map for hazard evaluation and reduction Bulletin of the
Association of Engineering Geologists 3 337ndash342
Wilson RC Keefer DK 1985 Predicting the areal limits of
earthquakes induced landslides In Ziony J (Ed) Evalu-
ating Earthquake Hazards in the Los Angeles Metropolitan
Area US Geological Survey Professional Paper 1360 pp
317ndash345
A Refice D Capolongo Computers amp Geosciences 28 (2002) 735ndash749 749
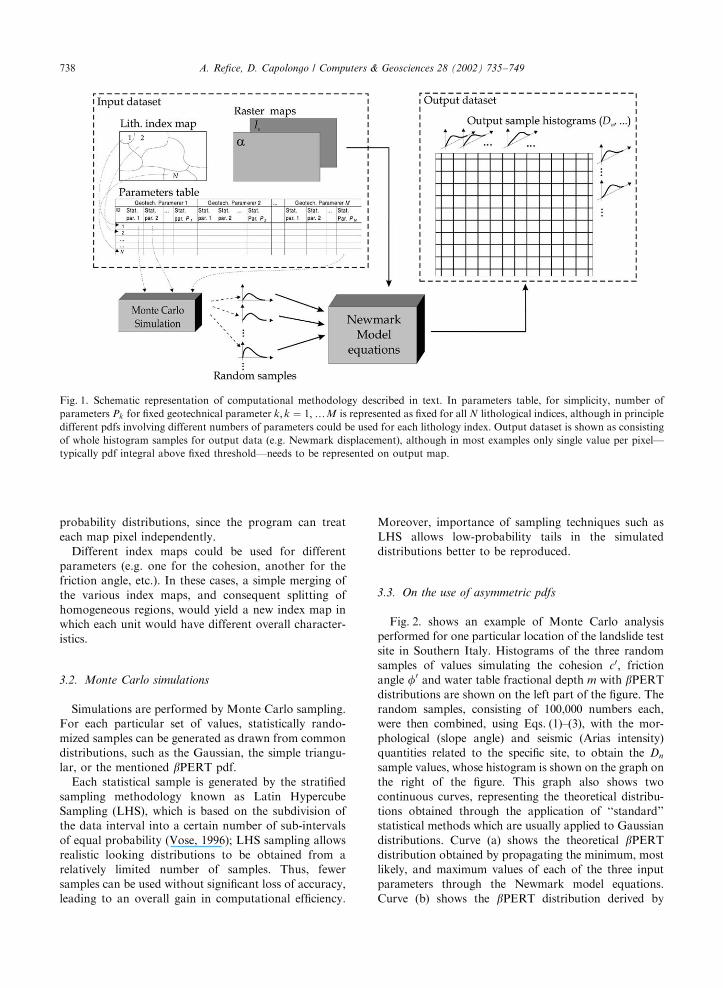
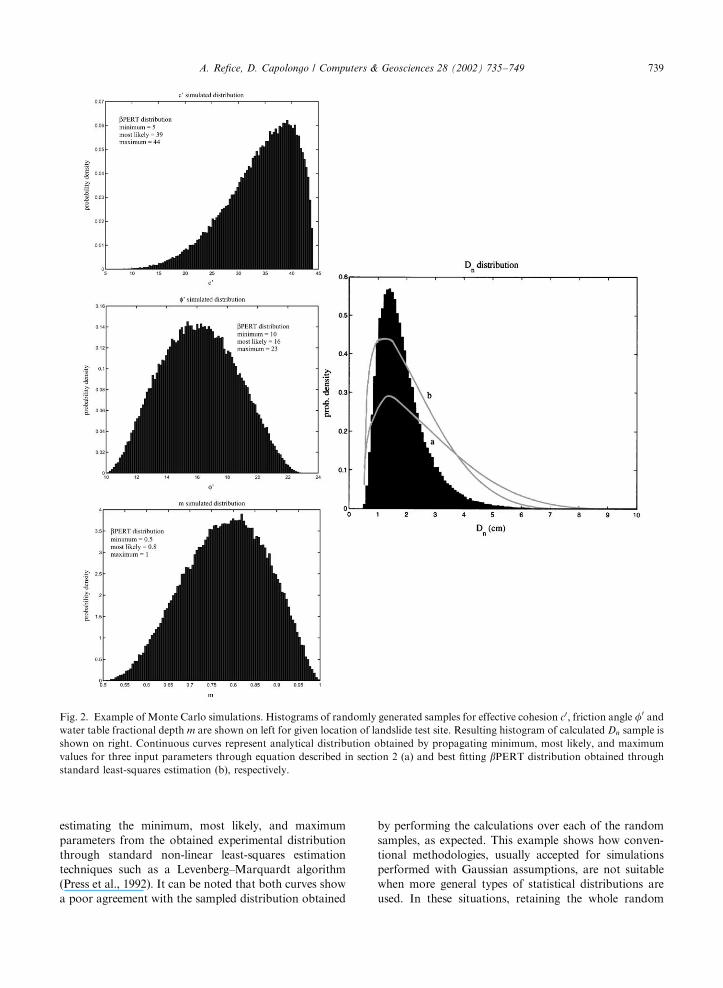
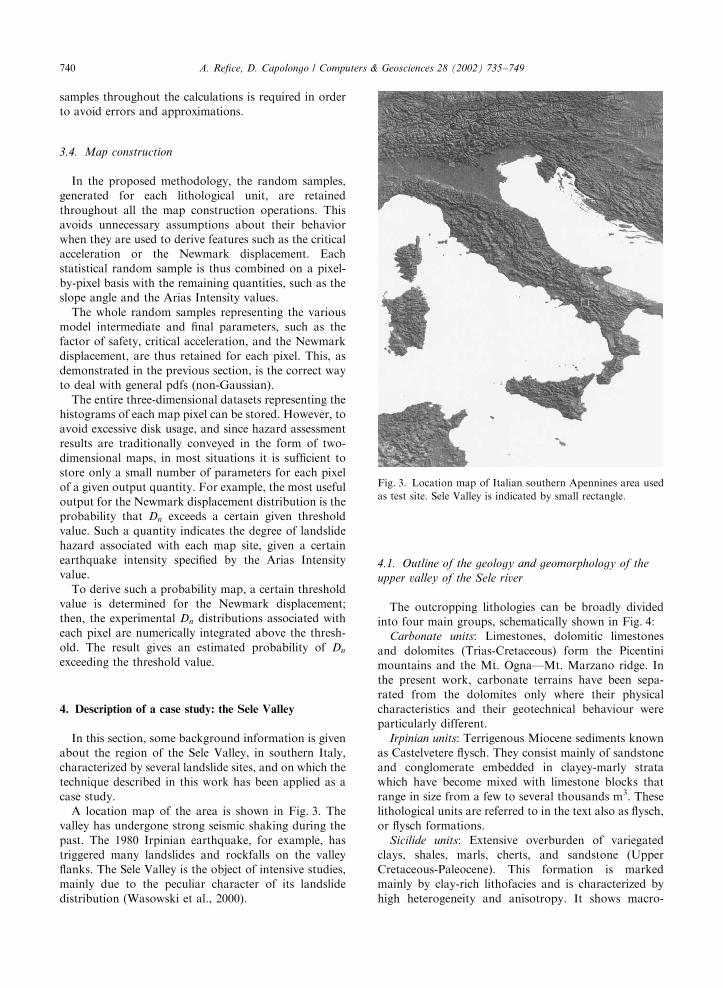
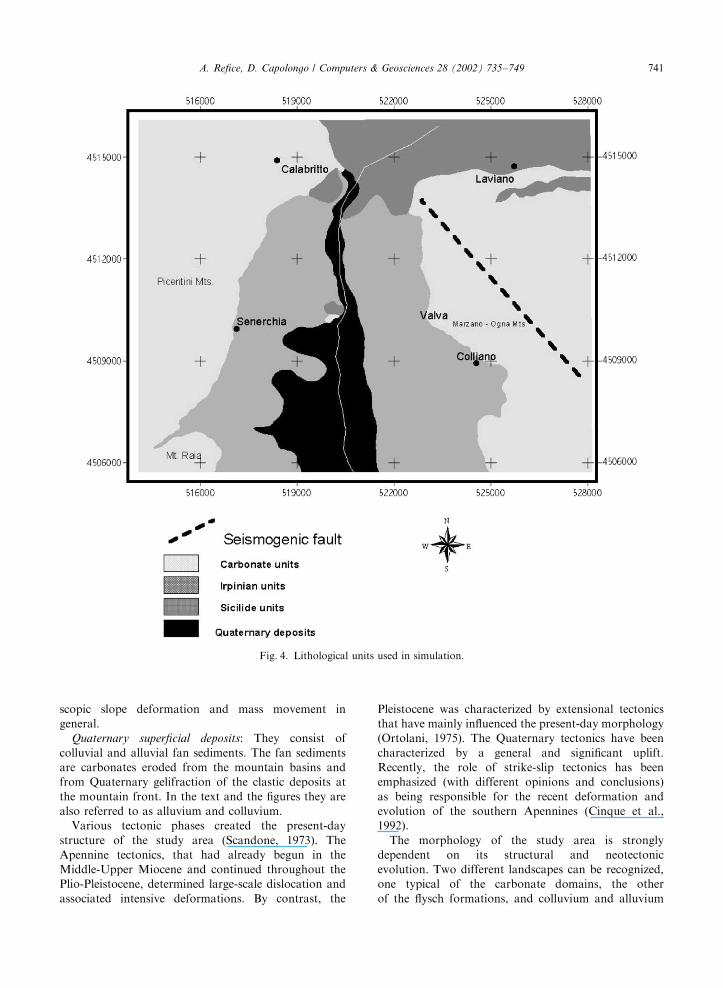
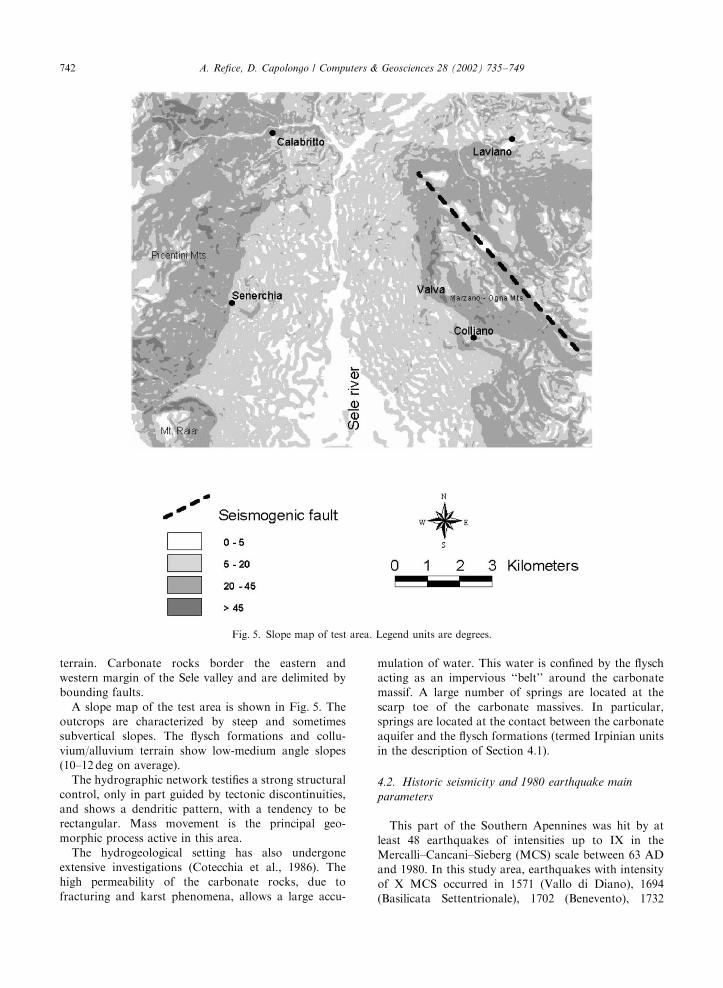
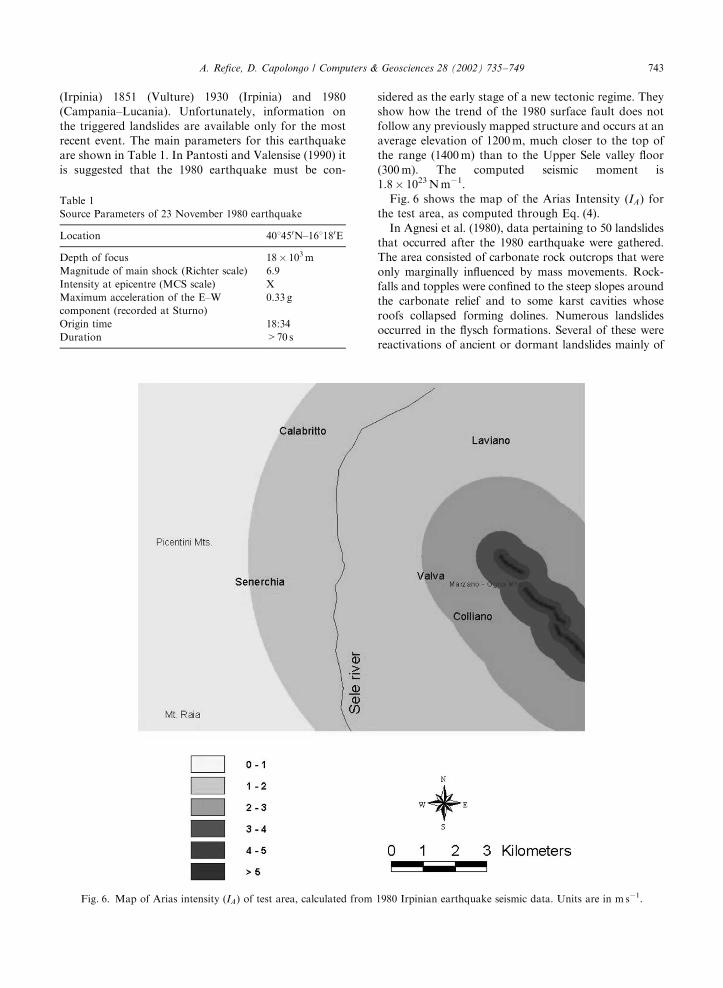
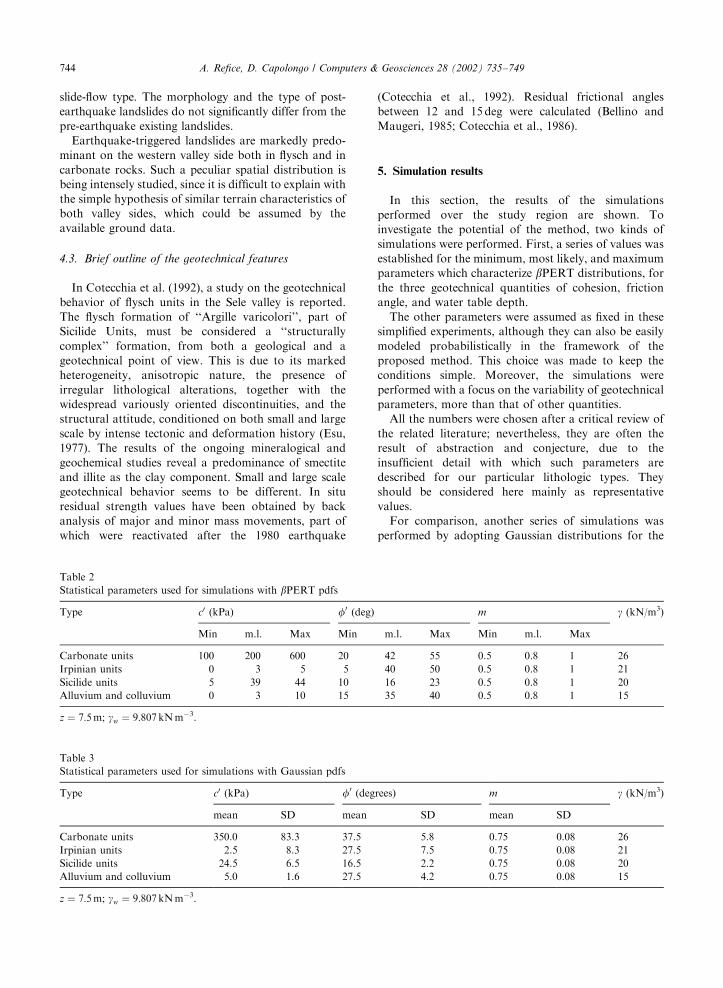
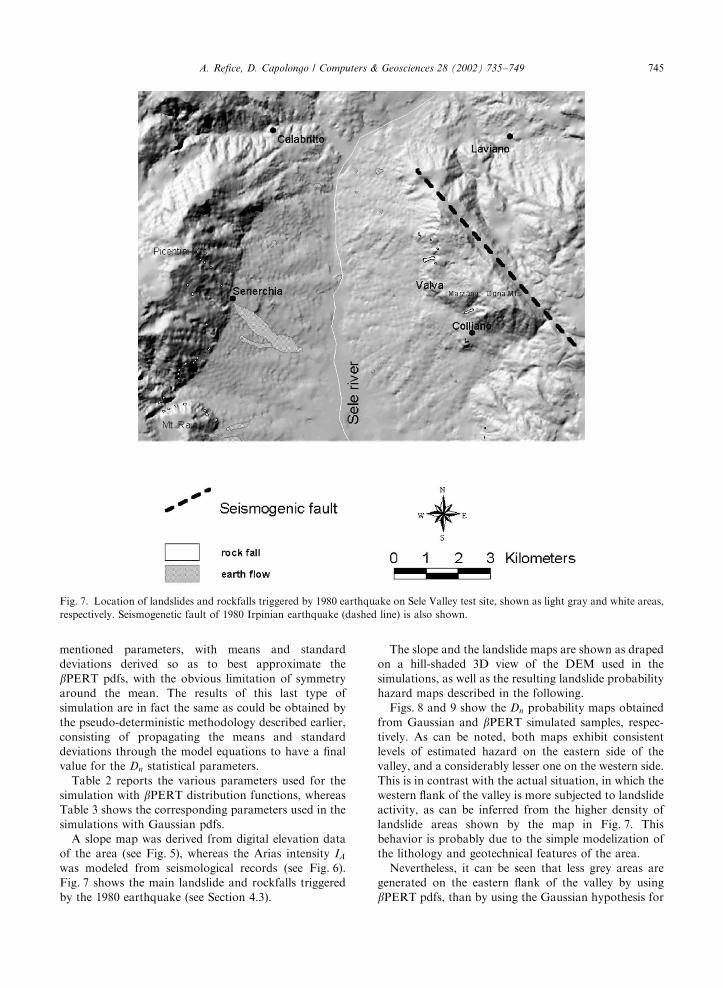
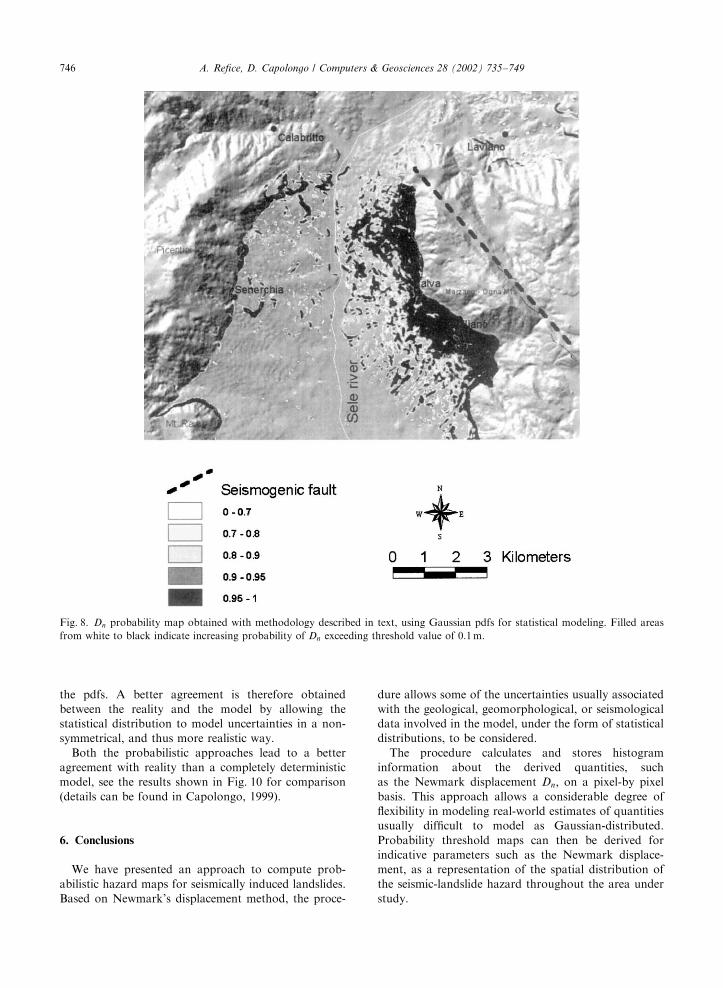
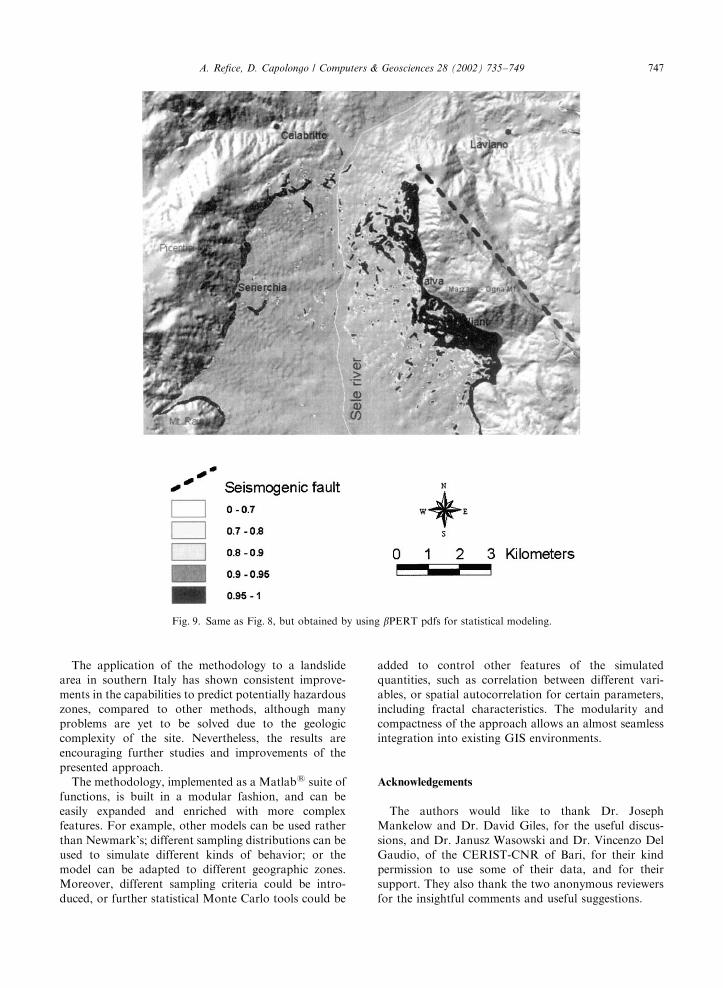
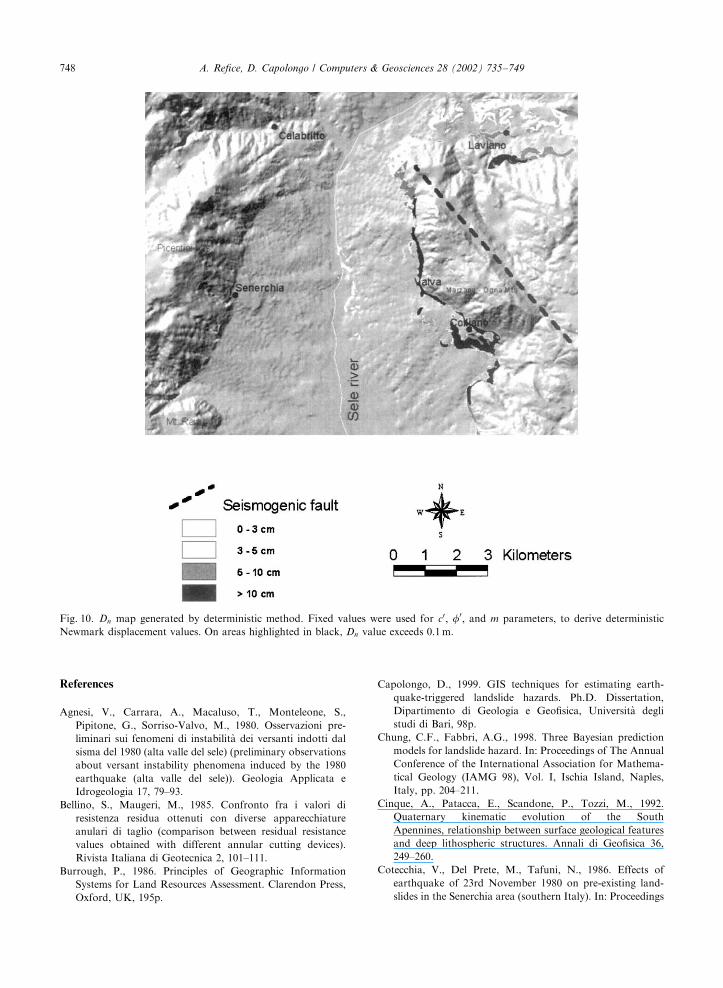