Embed Size (px)
Citation preview
Prefatory Note The attached document represents the most complete and accurate version available based on original copies culled from the files of the FOMC Secretariat at the Board of Governors of the Federal Reserve System. This electronic document was created through a comprehensive digitization process which included identifying the best-preserved paper copies, scanning those copies,1
and then making the scanned versions text-searchable.2
Though a stringent quality assurance process was employed, some imperfections may remain. Please note that some material may have been redacted from this document if that material was received on a confidential basis. Redacted material is indicated by occasional gaps in the text or by gray boxes around non-text content. All redacted passages are exempt from disclosure under applicable provisions of the Freedom of Information Act. 1 In some cases, original copies needed to be photocopied before being scanned into electronic format. All scanned images were deskewed (to remove the effects of printer- and scanner-introduced tilting) and lightly cleaned (to remove dark spots caused by staple holes, hole punches, and other blemishes caused after initial printing). 2 A two-step process was used. An advanced optical character recognition computer program (OCR) first created electronic text from the document image. Where the OCR results were inconclusive, staff checked and corrected the text as necessary. Please note that the numbers and text in charts and tables were not reliably recognized by the OCR process and were not checked or corrected by staff.
Content last modified 6/05/2009.

CONFIDENTIAL (FR)
CURRENT ECONOMIC AND FINANCIAL CONDITIONS
By the StaffBoard of Governors
of the Federal Reserve SystemAugust 12, 1970

TABLE OF CONTENTS
Page No.Section
SUMMARY AND OUTLOOK I
Nonfinancial . . . . . . . . . . . .... .... . . . . . - 1Outlook. . . . . . . . . . . . . . . . . .. . . . . . . - 2
Financial. . . . . . . . . . . ... . . . . . . . . . . . - 4
Banking outlook. . . . . . . . . . . . . . . . . . . . - 5
Security markets outlook . . . . . . . . . . . . . . . - 6
Mortgage markets . . . . . . . . . . . . . . . . . . . - 7
Balance of payments . . . . . . . . . . . .. .. . - 7
THE ECONOMIC PICTURE IN DETAIL:
Domestic Nonfinancial Scene II
Gross national product . ........... . . . . 1
Industrial production. . . . . . . . . . . . . .... - 6
Retail sales . . . . . . . . . . . . . . . .... . 8
Unit auto sales and stocks . . . . . . . . . . . . . . - 9
Consumer credit. . . . . . . . . . .... . . . . . .. . - 10Consumer buying expectations . . . . . . .... . ... - 11Manufacturers' orders. . . . . . . . . . . . . ... . - 12
Inventories. . . . . . . . . ..... . ......... . - 14
Cyclical indicators. . . . . . . . . . . . . . . . .. . - 16
Construction and real estate . . . . . . . . . . . - 17
Labor market . . . . . . . . . . . . . . . . . . . . . - 19
Payroll employment . . . . . . . . . .. . . . . . .. - 20
Earnings . . . . . . . . . . . . . . . . . . . .. . - 21
Productivity . . . . . . . . . . . . . . .. . . . - 22
Industrial relations . . . . . . . . .... . . . . . . . - 23
Unemployment insurance legislation . . . . . . ... - 25
Wholesale prices . . . . . . . . . ... . . . . .... - 26
Consumer prices. . .. ......... . . . . " 29Price indexes for the GNP . . . . . . . . . . . . . . - 32Farm production prospects . . . . . . . . . . . ... - 36
Domestic Financial Situation III
Monetary aggregates. . ..... . . . . . . . . . . . . - 1
Bank credit. . ......... . . . .. . . . - 3
Other short-term credit markets. . .......... - 5
Nonbank depositary intermediaries. . . . . . . . . ... - 8
Life insurance companies . . . . . . .... . . .. . . - 10
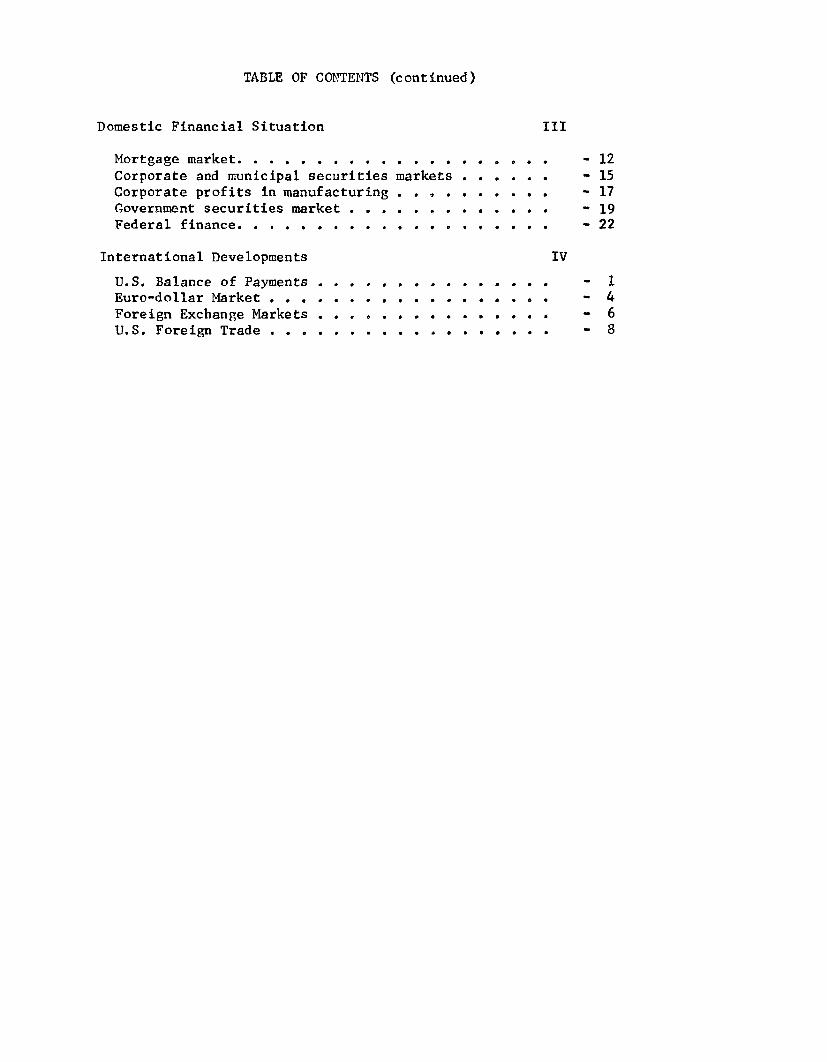
TABLE OF CONTENTS (continued)
Domestic Financial Situation
Mortgage market . . . . . . . . . . . . .Corporate and municipal securities marketsCorporate profits in manufacturing . . . .Government securities market . . . . . . .Federal finance . . . . . . . . . . . . .
International Developments
U.S. Balance of Payments . . . ..Euro-dollar Market . . . . . . . . . .Foreign Exchange Markets . . . . . . . . .U.S. Foreign Trade . . . . . . . . . .
* * . . .
- 12- 15- 17
- 19- 22
- 1- 4- 6- 8
c
I - 1
SUMMARY AND OUTLOOK
Nonfinancial
The data now available for July on balance are consistent
with the staff projection of a modest rise in real GNP in the third
quarter.
Industrial production increased slightly in July, following
a very small June decline, and was about 3 per cent below the peak
level of a year earlier. Output of consumer goods was up slightly
and production of both durable and nondurable materials advanced,
but both business and defense equipment declined further. Retail
sales increased almost 1 per cent in July following a relatively
strong expansion for the second quarter as a whole. Unit sales of
domestic autos, at an annual rate of 8.5 million units, were about
the same as in June and 15 per cent above the average rate of the
first five months of the year. New orders for durable goods leveled
off in the second quarter following an extended period of decline;
however, orders for producers' capital goods declined further. In
recent months, inventories have been brought somewhat more closely
into line with sales, but at midyear stock-sales ratios were still
relatively high.
The labor market continued to ease in July. Nonfarm payroll
employment dropped for the fourth successive month, with declines re-
ported in most industries, and the unemployment rate moved back up to
I - 2
5 per cent from 4.7 per cent in June. However, the work week in
manufacturing increased slightly. Reductions of labor input in the
spring were associated with a resumption of productivity increase
for the private nonfarm economy as a whole, and the rise of unit
labor costs slowed markedly. Increases in hourly compensation have
averaged somewhat less in recent months than a year earlier. But
new contracts have provided very large increases in wages and benefits,
paced by the trucking and construction agreements.
Although seasonally adjusted wholesale prices of farm pro-
ducts and foods increased sharply from mid-June to mid-July, following
three months of decline, there have been indications of selective eas-
ing of upward price pressures. Since mid-July, a number of farm pro-
duct prices have declined, in some cases substantially. Moreover,
prospective supplies of crops and livestock are large for the second
half of this year. Wholesale prices of industrial commodities, season-
ally adjusted, increased somewhat more slowly in July than in the first
half of the year. Further weakness in prices of nonferrous metals re-
sulted in the first decline in the metals and metal products group
since November 1968. At the consumer level, some slowing of the rate
of overall price increase occurred in the second quarter, mostly
attributable to a relatively small increase in food prices and a level-
ing off of mortgage interest rates. On average, retail prices of
other commodities and services continued to rise rapidly.
Outlook. Economic activity is expected to expand only
moderately in the last half of this year, at about the same rate as
I - 3
previously projected. Consumer outlays and residential construction
now seem likely to be stronger than expected earlier, but business
fixed investment probably will be weaker. The recent strength in
consumer spending, including purchases of autos, has led us to raise
the projections in this area, and the saving rate is projected to
decline perceptibly from the very high second quarter level. Sim-
ilarly, the jump in housing starts in June and a very large inflow
of funds into depositary institutions suggest that there may be a
faster turnaround than we had allowed for in residential activity.
On the other hand, prospects for business fixed investment
have become more bearish. The latest GNP figures for the first half
show a leveling-off in business fixed investment in current dollars
and an appreciable decline in real terms. Second half declines are
now strongly suggested by recent reductions in contract awards for
private non-residential construction, and the continued weakness in
new orders for capital equipment.
Real growth in GNP seems likely to be somewhat more rapid
in the first half of 1971 than previously projected, at about a 3 to
3-1/2 per cent annual rate. To a large extent, the upward revision
reflects the stimulus of a less restrictive Federal Budget--including
an assumed Federal pay raise next January 1--and the lagged effects
of somewhat faster monetary expansion in the remainder of this year
than occurred in the first half, when money supply rose at a 4 per
cent annual rate. The projected rate of growth in real GNP, however,
I - 4
would probably still not be sufficient to absorb the increase in
supplies of available resources, and the unemployment rate would
likely rise above 5.5 per cent in the second quarter of 1971. In
these circumstances, the rise in the GNP price deflator is still ex-
pected to ease to around a 3 per cent annual rate in the second quar-
ter.
No allowance has been made in our projection for the very
real possibility of an extended auto strike this fall. Such a strike,
through its impact on output and incomes--and inventories and consump-
tion--could depress the fourth quarter GNP increase appreciably, depend-
ing on which firm is struck and for how long. As output rebounds after
a strike settlement, increases in the rate of inventory accumulation
and in consumption would probably make up most or all of the fourth
quarter shortfall.
Financial
The considerable decline in bond yields that began in
late June appears to have stalled, and in some instances to have
been reversed, by early August. The earlier rally in bond markets
was triggered by a change in expectations about the future course
of interest rates, reflecting prospects for only limited growth
in economic activity, a reduced rate of inflation, a moderation of
credit demands over the longer-run, and a more expansive monetary
policy. More recently, with demands in long-term markets continuing
I - 5
very heavy, investors seem to be waiting for confirmation of these
expectations. Similarly, cautious investor attitudes have affected
short- and intermediate-term debt markets. The Treasury's mid-August
refunding was relatively successful,but prices of the new issues
have faded somewhat in recent days. In equity markets, prices have
changed little on balance since mid-July in light trading.
Demands for bank credit by firms forced out of the commercial
paper market seem to have abated, although some firms continue to use
bank financing to meet maturing obligations as investors continue to
be extremely quality-conscious. Partly as a consequence of reduced
bank loan demands, banks have become less aggressive in bidding for
30-to-89 day CD's. They had increased their CD outstandings by nearly
$5 billion from late June to the end of July, nearly all of which
was in these shorter maturities.
Banking outlook. Over-all bank loan demand in the months
immediately ahead is likely to be relatively moderate, barring any
further disturbances to financial confidence. Loan demands of firms
having difficulty selling commercial paper are likely to be modest,
being limited possibly to a few lesser-rated names. Demands for loans
other than those related to commercial paper and to security financing
have been sluggish for the past two months. And with capital outlays
being stretched out and cut back, with little increase indicated in
inventory financing requirements, and with substantial capital market
borrowing, business loan demands are not likely to pick up.
I -6
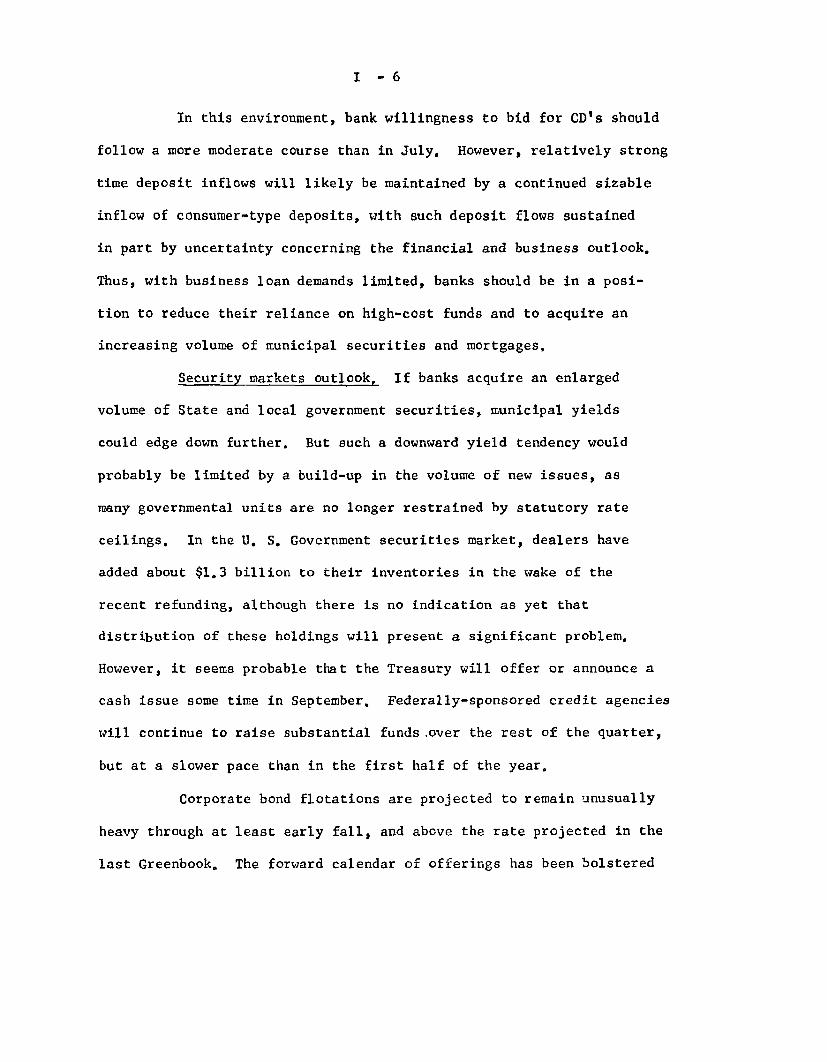
In this environment, bank willingness to bid for CD's should
follow a more moderate course than in July. However, relatively strong
time deposit inflows will likely be maintained by a continued sizable
inflow of consumer-type deposits, with such deposit flows sustained
in part by uncertainty concerning the financial and business outlook.
Thus, with business loan demands limited, banks should be in a posi-
tion to reduce their reliance on high-cost funds and to acquire an
increasing volume of municipal securities and mortgages.
Security markets outlook. If banks acquire an enlarged
volume of State and local government securities, municipal yields
could edge down further. But such a downward yield tendency would
probably be limited by a build-up in the volume of new issues, as
many governmental units are no longer restrained by statutory rate
ceilings. In the U. S. Government securities market, dealers have
added about $1.3 billion to their inventories in the wake of the
recent refunding, although there is no indication as yet that
distribution of these holdings will present a significant problem.
However, it seems probable that the Treasury will offer or announce a
cash issue some time in September. Federally-sponsored credit agencies
will continue to raise substantial funds over the rest of the quarter,
but at a slower pace than in the first half of the year.
Corporate bond flotations are projected to remain unusually
heavy through at least early fall, and above the rate projected in the
last Greenbook. The forward calendar of offerings has been bolstered
I - 7
by several large industrial issues, which, together with a large amount
of public utility offerings, may bring the dollar volume of total
publicly offered bond issues in the third quarter above that in the
preceding quarter exclusive of the exceptionally large AT&T financing.
While such a volume of financing may generate some backing and filling
of yields, we nevertheless anticipate a general drifting down in yields
over time as signs of a lessening in inflation develop.
Mortgage markets. Net mortgage lending by thrift insti-
tutions is likely to increase further in the third quarter, and mort-
gage terms may ease somewhat. Although net savings inflows are not
likely to be maintained at the unusually rapid July pace, consumer
desires for depositary claims could remain strong in view of financial
and economic uncertainties. With liquidity rebuilt, and favorable
fund flows, S&L's and mutual savings banks are expected to accelerate
their new mortgage commitment volume.
Balance of Payments
Presently available information throws little new light
on second-quarter balance of payments developments. The trade
balance showed a marked further improvement in June. For the second
quarter as a whole, substantial capital outflows, including unrecorded
flows of funds, were evidently a major factor in the very large over-
all deficit, measured either on the official settlements basis or on
the liquidity basis before special transactions. These outflows, which
I-8
presumably included movements into the Canadian dollar and the German
mark, and perhaps into Euro-dollar deposits, seem to have slackened
or even turned around since midyear--to judge by weekly over-all in-
dicators which have been suggesting a marked shrinkage in the liquid-
ity deficit in July, after allowance for adverse seasonality.
Since the relaxation of Regulation Q on June 24, outstand-
ing liabilities of U. S. banks to their foreign branches have been
sharply reduced. For most leading banks, these liabilities since the
end of July have been close to May 1969 levels (the historical base
levels). The repayment of these liabilities was a factor in the very
large official settlements deficit experienced in July. The 3-month
Euro-dollar rate has been in the 8 - to - 8/1/2 per cent range since
the latter part of July, in contrast to rates over 9 per cent during
June. Since the lowering of the German central bank's lending rates
on July 16, there has been some decline in German money market rates,
too. This easing of German rates may be partly seasonal, and it does
not rule out the possibility of renewed upward pressures on Euro-
dollar rates from the European side, which would encourage further
Euro-dollar repayments by U. S. banks to their branches despite the
impairment of reserve-free bases that would be entailed. Even without
any new rise in Euro-dollar rates such repayments may continue if U. S.
rates decline, and especially if U. S. banks become persuaded that
they do not risk renewed pressures on their liquidity positions.
Augu 11, 1970
I -- T - 1
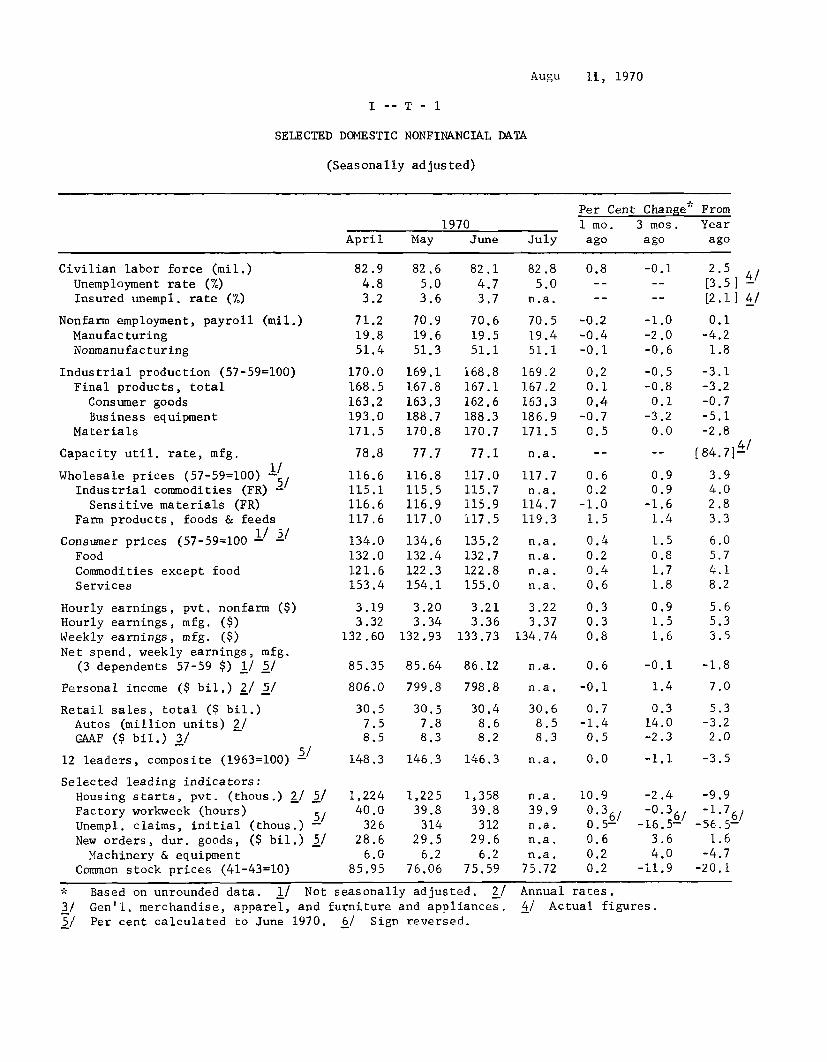
SELECTED DOMESTIC NONFINANCIAL DATA
(Seasonally adjusted)
Per Cent Change* From
1970 1 mo. 3 mos. Year
April May June July ago ago ago
Civilian labor force (mil.)Unemployment rate (%)Insured unempl. rate (%)
Nonfarm employment, payroll (mil.)ManufacturingNonmanufacturing
Industrial production (57-59=100)Final products, total
Consumer goodsBusiness equipment
Materials
Capacity util. rate, mfg.
Wholesale prices (57-59=100) 5Industrial commodities (FR)
Sensitive materials (FR)Farm products, foods & feeds
Consumer prices (57-59=100 -1 -5
FoodCommodities except foodServices
Hourly earnings, pvt. nonfarm ($)Hourly earnings, mfg. ($)Weekly earnings, mfg. ($)Net spend, weekly earnings, mfg.
(3 dependents 57-59 $) 1/ 5/
Personal income ($ bil.) 2/ 5/
Retail sales, total ($ bil.)Autos (million units) 2/GAAF ($ bil.) 3/
12 leaders, composite (1963=100) -
Selected leading indicators:
Housing starts, pvt. (thous.) 2/ 5/Factory workweek (hours) 5/Unempl. claims, initial (thous.)New orders, dur. goods, ($ bil.) 5/Machinery & equipment
Common stock prices (41-43=10)
82.9
4.83.2
71.2
19.8
51.4
170.0168.5
163.2
193.0
171.5
78.8
116.6
115.1
116.6
117.6
134.0
132.0
121.6153.4
3.193.32
132.60
85.35
806.0
30.5
7.58.5
148.3
1,22440.0
326
28.6
6.085.95
82.6
5.0
3.6
70.9
19.651.3
169.1167.8
163.3
188.7170.8
77.7
116.8115.5116.9
117.0
134.6132.4
122.3
154.1
3.203.34
132.93
85.64
799.8
30.5
7.88.3
146.3
1,22539.8
314
29.5
6.276.06
82.1
4.73.7
70.6
19.551.1
168.8167.1
162.6188.3170.7
77.1
117.0115.7115.9117.5
135.2
132.7122.8155.0
3.213.36
133.73
86.12
798.8
30.48.68.2
146.3
1,35839.8
31229.6
6.275.59
82.85.0
n.a.
70.5
19.451.1
169.2167.2
163.3186.9171.5
n.a.
117.7n.a.
114.7
119.3
n.a.n.a.n.a.n.a.
3.223.37
134.74
0.8
-0.2
-0.4
-0.1
0.20.1
0.4
-0.70.5
0.60.2
-1.0
1.5
0.4
0.2
0.4
0.6
-0.1 2.5-[3.5] --- [2.1] 4/
-1.0
-2.0-0.6
-0.5-0.8
0.1
-3.2
0.0
0.9
0.9
-1.6
1.4
1.5
0.81.71.8
0.9 5.61.5 5.3
1.6 3.5
n.a. 0.6
n.a. -0.1
30.6 0.78.5 -1.48.3 0.5
n.a. 0.0
n.a.39.9n.a.n.a.n.a.
75.72
10.90.30.5-0.60.20.2
-0.1
1.4
0.314.0-2.3
-1.1
-2.4-0.36 /
-16.5-3.64.0
-11.9
* Based on unrounded data. 1/ Not seasonally adjusted. 2/
3/ Gen'l. merchandise, apparel, and furniture and appliances.
5/ Per cent calculated to June 1970. 6/ Sign reversed.
Annual rates.4/ Actual figures.
0.1-4.2
1.8
-3.1-3.2-0.7-5.1-2.8
[84.7]-
3.94.02.83.3
6.05.74.18.2
-1.8
7.0
5.3-3.22.0
-3.5
-9.9-1.76/
-56.5-1.6
-4.7-20.1
I -- T - 2
SELECTED DOMESTIC FINANCIAL DATA
Averages1969
QIII QIVInterest rates, per cent
Federal funds3-mo. Treasury bills3-mo. Federal agencies3-mo. Euro-dollars3-mo. finance co. paper4-6 mo. commercial paper
Bond buyer municipalsAaa corporate-new issues20-year Treasury bondsFHA mortgages, 30-year
8.987.027.63
10.897.748.49
6.007.756.348.38
8.947.367.92
10.487.898.63
6.408.326.718.53
1970
_I QII
8.567.217.729.267.948.55
6.358.456.789.25
7.886.677.098.877.418.16
6.818.947.149.12
1970Week ended
July July 29
7.216.456.688.767.648.29
6.538.636.92n.a.
6.896.346.818.347.808.30
6.408.606.86
1969QIII OIV
Change in monetaryaggregates (SAAR, per cent)
Total reservesNonborrowed reservesCredit proxyCredit proxy + nondep. fundsMoney supplyTime and savings depositsDeposits at S&L's and MSB'sBank credit, end-of-month
Treasury securitiesOther securitiesTotal loans
Business
Change in millions of dollars
Commercial paper (SA)Bank related (NSA)
- 9.3- 4.8- 9.4-4.3
-13.32.1
- 0.8-11.4- 7.2
3.17.0
1.4- 0.1
0.1
2.01.2
1.44.8
-20.54.5
10.07.7
1969
QIII QIV
3,3291,350
3,1511,614
New security issues (NSA, $ mil.)
Total corp. issues
Public offerings
State and local governmentbond offerings
Fed. sponsored agency debt
(change)
Fed. gov't. debt (change)
1968 1969Year HI QII HI
21,965 13,572 7,354 17,944e15,314 10,359 5,679 15,358e
1970QII July
9,967e 2,900e8,634e 1,800e
16,574 11,881 3,648 7,816 3,711 1,300e
3,354 3,605 2,411 4,947 1,23315,300 -12,280 -12,437 -4,415 -6,396
455e5,900e
n.a. - Not available. e - Estimated. p - Preliminary.SAAR - Seasonally adjusted annual rate. NSA - Not seasonally adjusted.
1/ Figure is for S&L's only, data for MSB's not available.
1970SII
2.64.16.06.54.2
13.87.04.2
30.29.9
- 2.01.5
1970QII
2,1041,035
- 2.9- 0.4
0.60.53.80.4
1.9- 0.4-12.3
9.5- 0.7- 4.5
QI
3,1852,224
July
4.1-18.122.318.14.135.214.316.631.1
8.016.1
4.6
July
n.a.245
--
--
I -- T - 3U.S. Balance of Payments
In millions of dollars; seasonally adjusted
1969 1 9 7 0PYear T TT Apr.* May*" une
Coods and services, net 1/ 1,950 885Trade balance 2/ 638 518 848 181 237 430Exports 2/ 36,473 10,241 10,706 3,394 3,592 3,720Imports 2/ -35,835 -9,723 -9,858 -3,213 -3,355 -3,290
Service balance 1,312 367
Remittances and pensions -1,191 -330Govt. grant & capital, net -3,828 -837
U.S. private capital -5,374 -1.543Direct investment -3,070 -1,304Foreign securities -1,494 -159 19 -66 61 41Banking claims -541 170 -486 -117 -276 -151Other -269 -250
Foreign capital 12,554 1,710Official foreign, liquid -525 3,028 450 -343 368 503Official reserve holders, nonliquid -996 -422 506 67 131 283Other official foreign, nonliquid 259 -66Foreign commercial banks, liquid 9,434 -1,717 13 935 -351 -656New direct investment issues 3/ 1,029 155 306U.S. corporate stocks 1,565 -85 -126 8 -198 64Other 1,788 817
U.S. monetary reserves (inc.-) -1,187 481 1,022 431 754 -163Gold stock -967 -44 14 1 2 11Special drawing rights -- -53 -37 -6 1 -32IMF gold tranche -1,034 -253 227 67 150 10Convertible currencies 814 831 818 369 601 -152
Errors and omissions -2,924 -366
BALANCES (deficit -) 4/Official settlements, S.A. -3,087 -1,978
S" , N.S.A. 2,708 -2,825 -2,063 -155 -1,253 -623Liquidity, S.A. -1,767 -1,504
S , N.S.A. -7,221 -1,677 -1,497 -1,008 -707 218Adjusted over-all, S.A. -1,370 -1,991
" , N.S.A. -6,726 -1,288 -1,991 -1,090 -902 33Financed by: 5/
Liab. to comm. banks 9,434 -1,537 -72 935 -351 -656Official settlements -2,708 2,825 2,063 155 1,253 623
* Only exports and imports are seasonally adjusted.1/ Equals "net exports" in the GNP, except for latest revisions.2/ Balance of payments basis which differs a little from Census basis.
3/ New issues sold abroad by U.S. direct investors.4/ Excludes initial allocation of SDRs on January 1, 1970; total $867 million, quarterly
S.A., $217 million.5/ Minus sign indicates decrease in net liabilities. Data not seasonally adjusted.
II - 1
THE ECONOMIC PICTURE IN DETAIL
Domestic Nonfinancial Scene
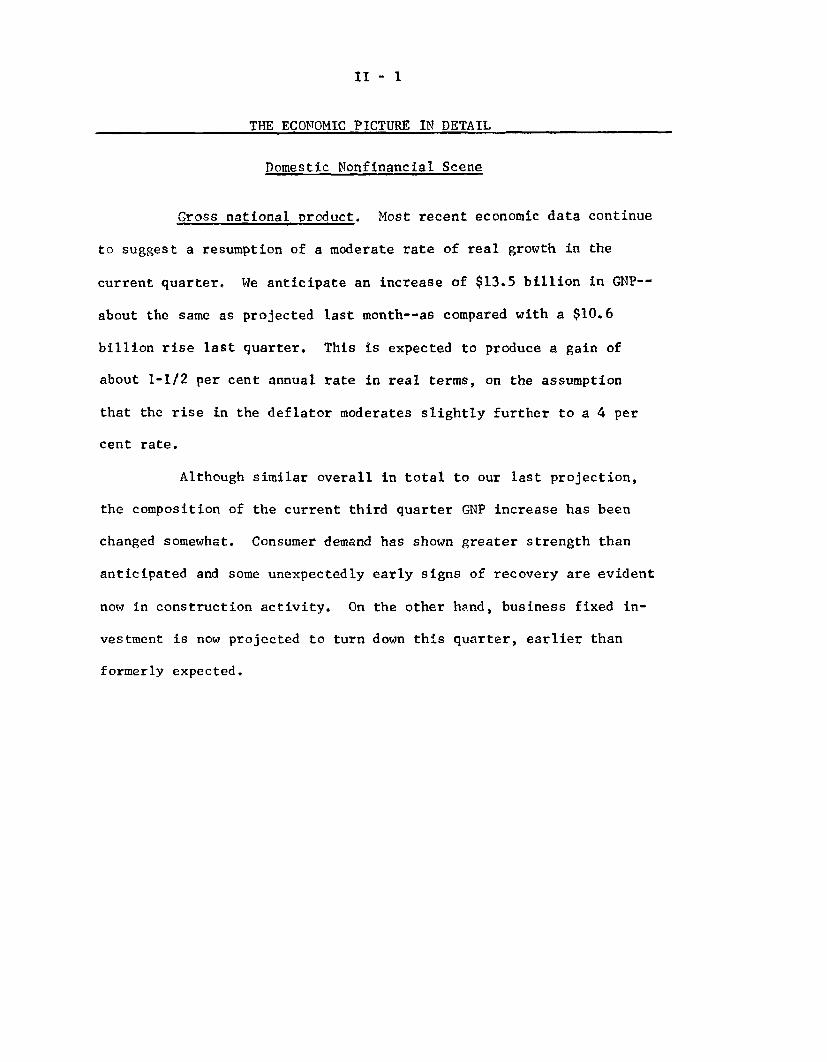
Gross national product. Most recent economic data continue
to suggest a resumption of a moderate rate of real growth in the
current quarter. We anticipate an increase of $13.5 billion in GNP--
about the same as projected last month--as compared with a $10.6
billion rise last quarter. This is expected to produce a gain of
about 1-1/2 per cent annual rate in real terms, on the assumption
that the rise in the deflator moderates slightly further to a 4 per
cent rate.
Although similar overall in total to our last projection,
the composition of the current third quarter GNP increase has been
changed somewhat. Consumer demand has shown greater strength than
anticipated and some unexpectedly early signs of recovery are evident
now in construction activity. On the other hand, business fixed in-
vestment is now projected to turn down this quarter, earlier than
formerly expected.
II - 2
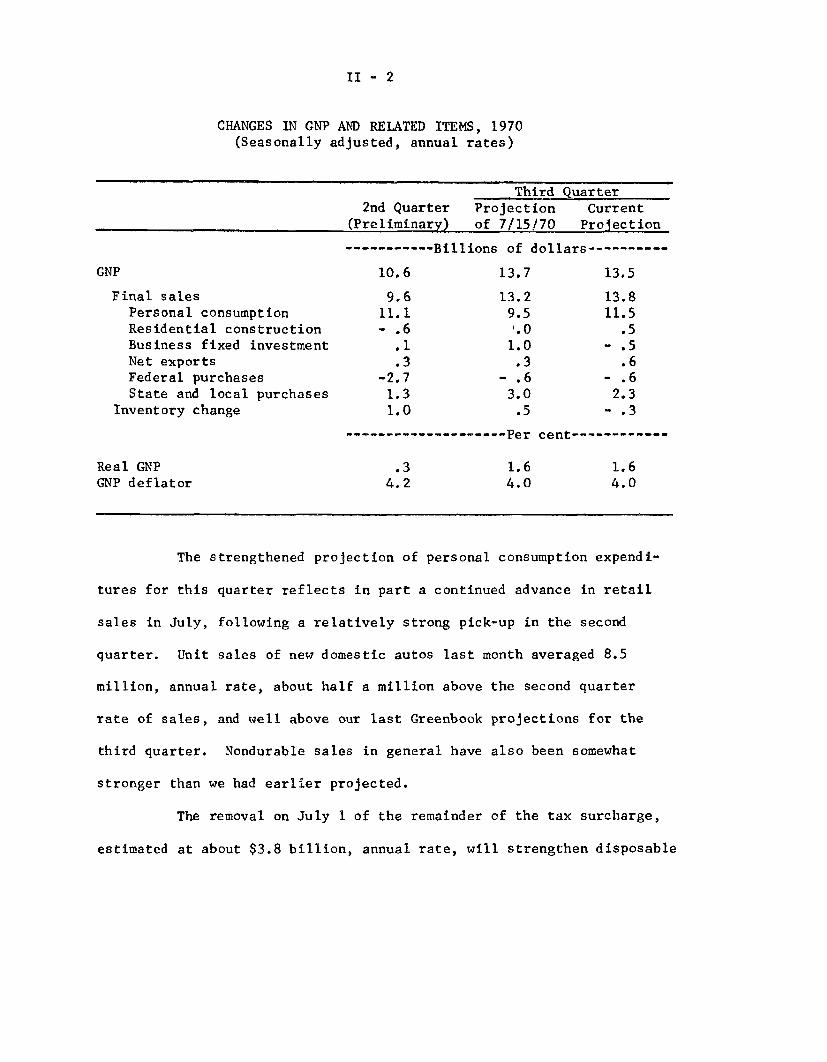
CHANGES IN GNP AND RELATED ITEMS, 1970(Seasonally adjusted, annual rates)
GNP
Final salesPersonal consumptionResidential constructionBusiness fixed investmentNet exportsFederal purchasesState and local purchases
Inventory change
Real GNPGNP deflator
Third Quarter2nd Quarter Projection Current
(Preliminary) of 7/15/70 Projection
----------- Billions of dollars----------
10.6 13.7 13.5
9.6 13.2 13.811.1 9.5 11.5- .6 '.0 .5
.1 1.0 - .5
.3 .3 .6-2.7 - .6 - .61.3 3.0 2.31.0 .5 - .3
-------------------- Per cent-----------
.3 1.6 1.64.2 4.0 4.0
The strengthened projection of personal consumption expendi-
tures for this quarter reflects in part a continued advance in retail
sales in July, following a relatively strong pick-up in the second
quarter. Unit sales of new domestic autos last month averaged 8.5
million, annual rate, about half a million above the second quarter
rate of sales, and well above our last Greenbook projections for the
third quarter. Nondurable sales in general have also been somewhat
stronger than we had earlier projected.
The removal on July 1 of the remainder of the tax surcharge,
estimated at about $3.8 billion, annual rate, will strengthen disposable
_ ___ __
II - 3
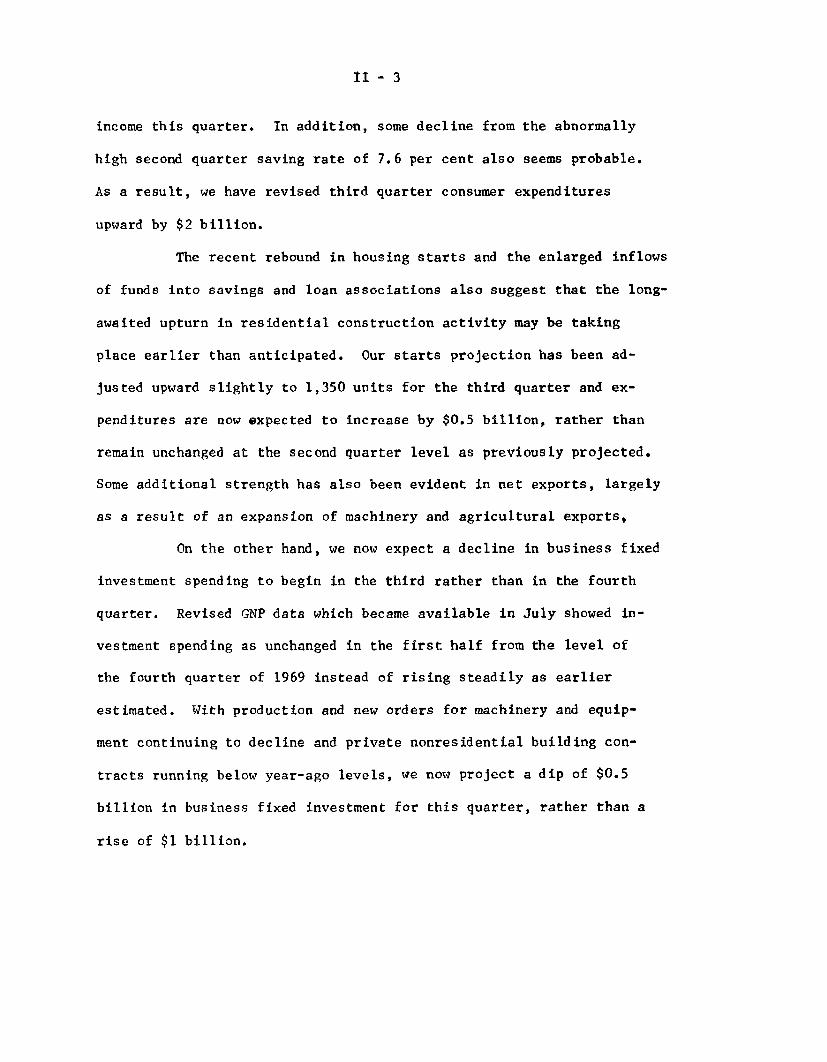
income this quarter. In addition, some decline from the abnormally
high second quarter saving rate of 7.6 per cent also seems probable.
As a result, we have revised third quarter consumer expenditures
upward by $2 billion.
The recent rebound in housing starts and the enlarged inflows
of funds into savings and loan associations also suggest that the long-
awaited upturn in residential construction activity may be taking
place earlier than anticipated. Our starts projection has been ad-
justed upward slightly to 1,350 units for the third quarter and ex-
penditures are now expected to increase by $0.5 billion, rather than
remain unchanged at the second quarter level as previously projected.
Some additional strength has also been evident in net exports, largely
as a result of an expansion of machinery and agricultural exports,
On the other hand, we now expect a decline in business fixed
investment spending to begin in the third rather than in the fourth
quarter. Revised GNP data which became available in July showed in-
vestment spending as unchanged in the first half from the level of
the fourth quarter of 1969 instead of rising steadily as earlier
estimated. With production and new orders for machinery and equip-
ment continuing to decline and private nonresidential building con-
tracts running below year-ago levels, we now project a dip of $0.5
billion in business fixed investment for this quarter, rather than a
rise of $1 billion.
II - 4
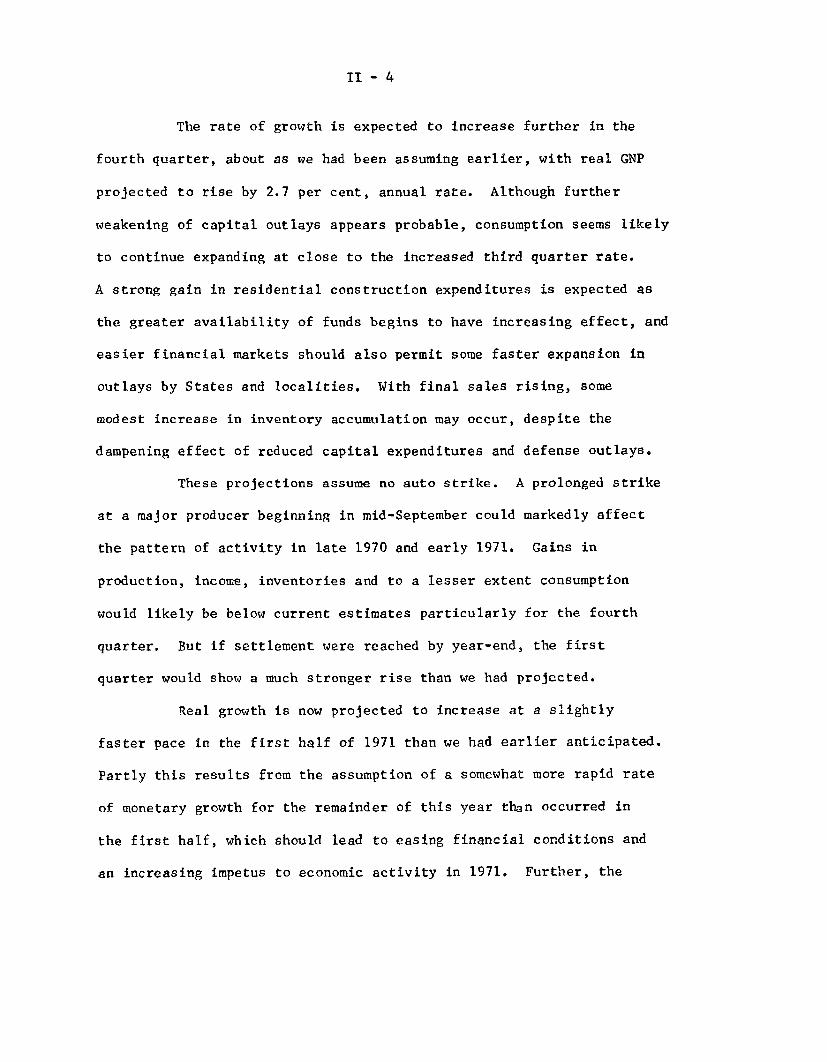
The rate of growth is expected to increase further in the
fourth quarter, about as we had been assuming earlier, with real GNP
projected to rise by 2.7 per cent, annual rate. Although further
weakening of capital outlays appears probable, consumption seems likely
to continue expanding at close to the increased third quarter rate.
A strong gain in residential construction expenditures is expected as
the greater availability of funds begins to have increasing effect, and
easier financial markets should also permit some faster expansion in
outlays by States and localities. With final sales rising, some
modest increase in inventory accumulation may occur, despite the
dampening effect of reduced capital expenditures and defense outlays.
These projections assume no auto strike. A prolonged strike
at a major producer beginning in mid-September could markedly affect
the pattern of activity in late 1970 and early 1971. Gains in
production, income, inventories and to a lesser extent consumption
would likely be below current estimates particularly for the fourth
quarter. But if settlement were reached by year-end, the first
quarter would show a much stronger rise than we had projected.
Real growth is now projected to increase at a slightly
faster pace in the first half of 1971 than we had earlier anticipated.
Partly this results from the assumption of a somewhat more rapid rate
of monetary growth for the remainder of this year than occurred in
the first half, which should lead to easing financial conditions and
an increasing impetus to economic activity in 1971. Further, the

II - 5
Federal deficit (NIA basis) is expected to be larger and hence more
stimulative during the first half of next year than we had formerly
thought, mainly because of increased expenditures. We have newly
incorporated in our current projections a 6 per cent Federal pay
raise in January in line with the Administration's recent proposal
with respect to comparability of Federal and industry pay. This pay
raise would add some $2.6 billion to disposable income, and should
help to support continued relatively strong gains in consumption.
The somewhat easier credit market conditions associated with more
rapid money supply growth should encourage additional outlays for
residential construction and expenditures by States and localities,
and may also contribute to the moderate rise in inventory investment
that is projected. Declines in business fixed investment and defense
spending will limit expansion of activity, but with other major
expansionary forces at work, we now expect first and second quarter
GNP gains of $18.2 billion and $16.0 billion, respectively as
compared with the earlier $15.6 and $14.9 billion increases.
Our basic price assumptions are little changed, with the
increase in the GNP implicit price deflator projected to moderate to
a 3 per cent rate by mid-1971. In real terms, the economy is pro-
jected to be growing at an annual rate of 3 to 3-1/2 per cent in
early 1971, still significantly below its long-term potential.
With the economy now operating well below its potential, and
productivity expected to recover further, we still expect substantial
II - 6
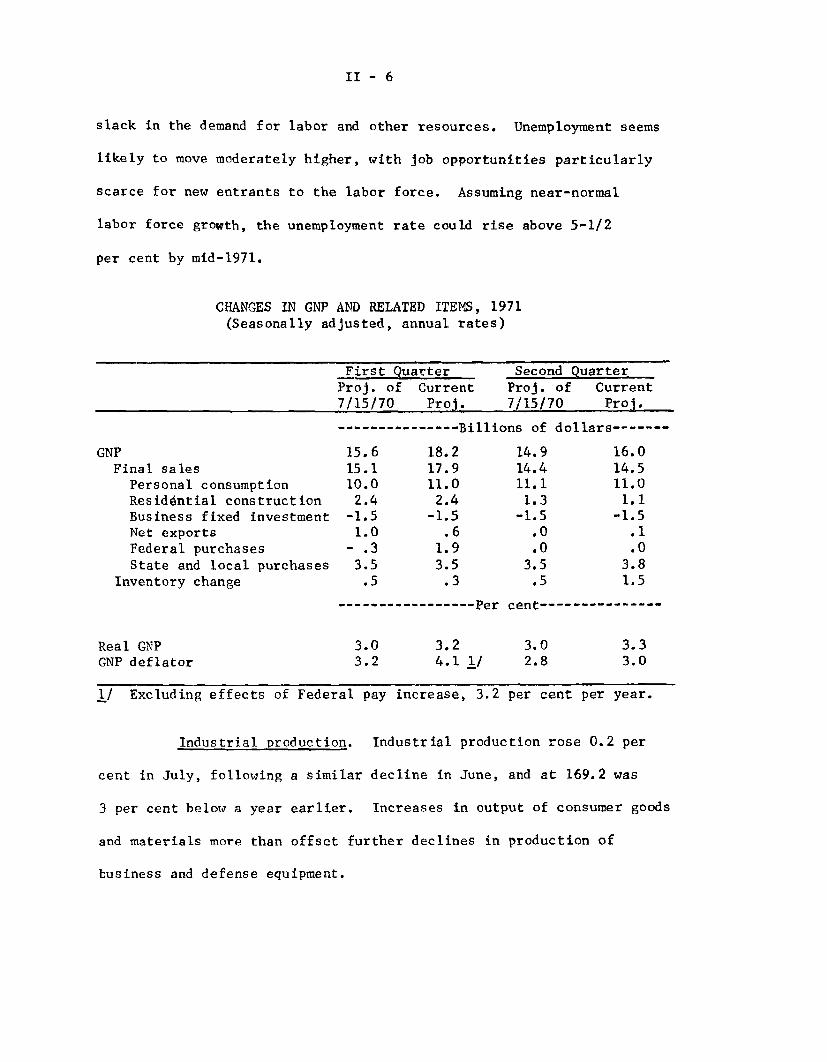
slack in the demand for labor and other resources. Unemployment seems
likely to move moderately higher, with job opportunities particularly
scarce for new entrants to the labor force. Assuming near-normal
labor force growth, the unemployment rate could rise above 5-1/2
per cent by mid-1971.
CHANGES IN GNP AND RELATED ITEMS, 1971(Seasonally adjusted, annual rates)
GNPFinal sales
Personal consumptionResidential constructionBusiness fixed investmentNet exportsFederal purchasesState and local purchases
Inventory change
First QuarterProj. of Current7/15/70 Proj.
-------------- Billio
15.6 18.215.1 17.910.0 11.02.4 2.4
-1.5 -1.51.0 .6
- .3 1.93.5 3.5
.5 .3
----------------- Per
Second QuarterProj. of Current7/15/70 Proj.
ins of dollars------
14.9 16.014.4 14.511.1 11.01.3 1.1
-1.5 -1.5.0 .1.0 .0
3.5 3.8.5 1.5
cent--------------
Real GNP 3.0 3.2 3.0 3.3GNP deflator 3.2 4.1 1/ 2.8 3.0
1/ Excluding effects of Federal pay increase, 3.2 per cent per year.
Industrial production. Industrial production rose 0.2 per
cent in July, following a similar decline in June, and at 169.2 was
3 per cent below a year earlier. Increases in output of consumer goods
and materials more than offset further declines in production of
business and defense equipment.
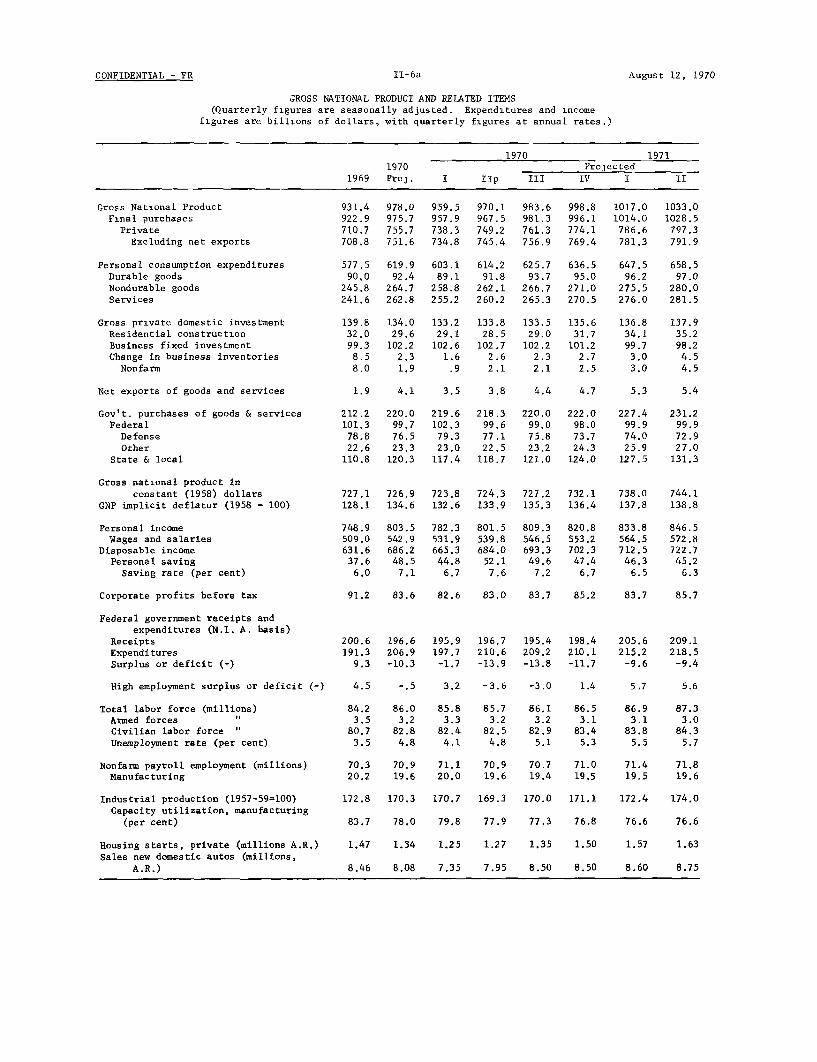
CONFIDENTIAL - FR
GROSS NATIONAL PRODUCT AND RELATED ITEMS
(Quarterly figures are seasonally adjusted. Expenditures and income
figures are billions of dollars, with quarterly figures at annual rates.)
1970 1971
1970 Projected
1969 Pro3. I IIp III IV I II
Gross National ProductFinal purchasesPrivateExcluding net exports
Personal consumption expendituresDurable goodsNondurable goodsServices
Gross private domestic investmentResidential constructionBusiness fixed investmentChange in business inventories
Nonfarm
Net exports of goods and services
Gov't. purchases of goods & servicesFederalDefenseOther
State & local
Gross national product inconstant (1958) dollars
GNP implicit deflator (1958 = 100)
Personal incomeWages and salaries
Disposable incomePersonal savingSaving rate (per cent)
Corporate profits before tax
Federal government receipts andexpenditures (N.I. A. basis)
ReceiptsExpendituresSurplus or deficit (-)
High employment surplus or deficit (-)
Total labor force (millions)Armed forcesCivilian labor forceUnemployment rate (per cent)
Nonfarm payroll employment (millions)Manufacturing
Industrial production (1957-59=100)Capacity utilization, manufacturing
(per cent)
Housing starts, private (millions A.R.)
Sales new domestic autos (millions,A.R.)
931.4922.9710.7708.8
577.590.0
245.8241.6
139.832.099.38.58.0
978.0975.7755.7751.6
619.992.4
264.7262.8
134.029.6
102.22.31.9
959.5957.9738.3734.8
603.189.1
258.8255.2
133.229.1
102.61.6
.9
970.1967.5749.2745.4
614.291.8
262.1260.2
133.828.5
102.72.62.1
983.6981.3761.3756.9
625.793.7
266.7265.3
133.529.0
102.22.32.1
998.8996.1774.1769.4
636.595.0
271.0270.5
135.631.7
101.22.72.5
1017.01014.0
786.6781.3
647.596.2
275.5276.0
136.834.199.73.03.0
1033.01028.5
797.3791.9
658.597.0
280.0281.5
137.935.298.24.54.5
1.9 4.1 3.5 3.8 4.4 4.7 5.3 5.4
212.2101.3
78.822.6
110.8
220.099.776.523.3
120.3
219.6102.3
79.323.0
117.4
218.399.677.122.5
118.7
220.099.075.823.2
121.0
222.098.073.724.3
124.0
227.499.974.025.9
127.5
231.299.972.927.0
131.3
727.1 726.9 723.8 724.3 727.2 732.1 738.0 744.1128.1 134.6 132.6 133.9 135.3 136.4 137.8 138.8
748.9509.0631.6
37.66.0
803.5542.9686.2
48.57.1
782.3531.9665.3
44.86.7
801.5
539.8684.0
52.1
7.6
809.3546.5693.3
49.67.2
820.8553.2702.3
47.46.7
833.8564.5712.5
46.36.5
846.5572.8722.7
45.26.3
91.2 83.6 82.6 83.0 83.7 85.2 83.7 85.7
200.6191.3
9.3
196.6206.9-10.3
195.9197.7
-1.7
196.7210.6-13.9
195.4209.2-13.8
198.4210.1-11.7
205.6215.2
-9.6
209.1218.5
-9.4
4.5 -. 5 3.2 -3.6 -3.0 1.4 5.7 5.6
84.2 86.0 85.8 85.7 86.1 86.5 86.9 87.33.5 3.2 3.3 3.2 3.2 3.1 3.1 3.080.7 82.8 82.4 82.5 82.9 83.4 83.8 84.33.5 4.8 4.1 4.8 5.1 5.3 5.5 5.7
70.3 70.9 71.1 70.9 70.7 71.0 71.4 71.820.2 19.6 20.0 19.6 19.4 19.5 19.5 19.6
172.8
83.7
170.3
78.0
1.47 1.34
8.46 8.08
170.7
79.8
1.25
7.35
169.3
77.9
1.27
7.95
170.0
77.3
1.35
8.50
171.1
76.8
1.50
8.50
172.4
76.6
174.0
76.6
1.57 1.63
8.60 8.75
II-6a August 12, 1970
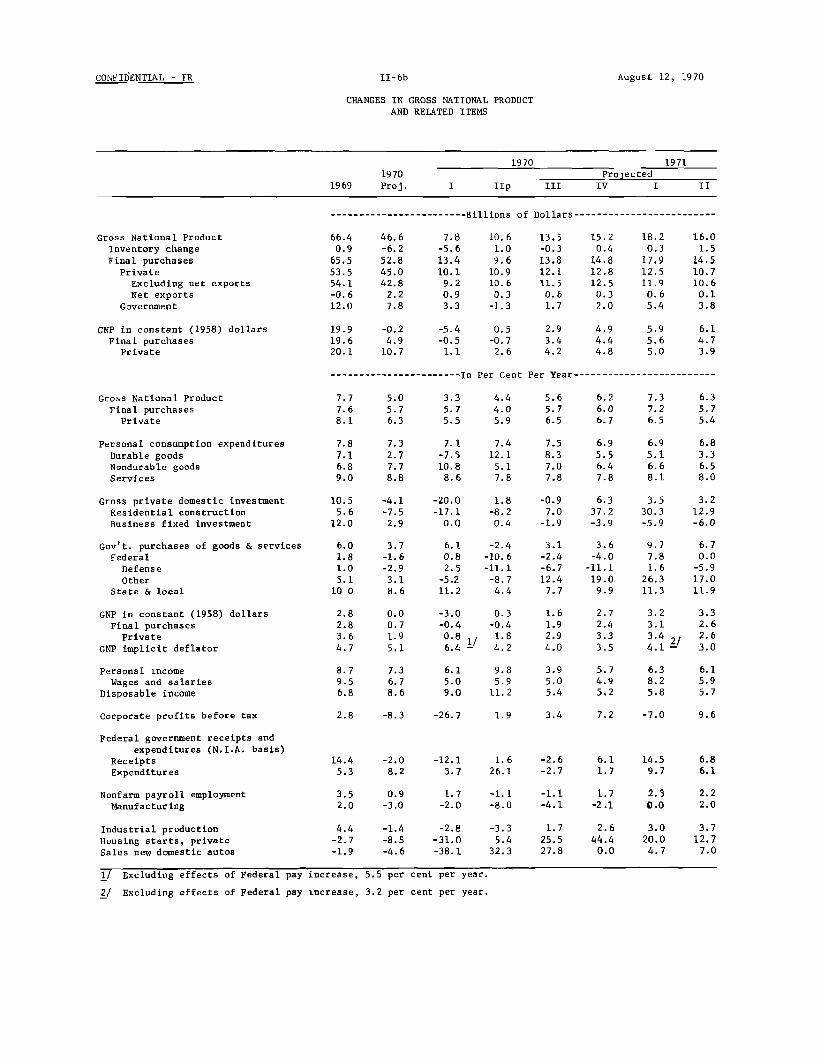
CONFIDENTIAL - FR
CHANGES IN GROSS NATIONAL PRODUCT
AND RELATED ITEMS
1970 19711970 Prolected
1969 Proj. I IIp III IV I II
------------------------ Billions of Dollars-------------------------
Gross National Product
Inventory change
Final purchases
Private
Excluding net exports
Net exports
Government
GNP in constant (1958) dollars
Final purchases
Private
7.8-5.613.410.1
9.20.93.3
10.61.09.6
10.910.6
0.3-1.3
19.9 -0.2 -5.4 0.5 2.919.6 4.9 -0.5 -0.7 3.420.1 10.7 1.1 2.6 4.2
----------------------- In Per Cent Per Year-------------------------
Gross National Product
Final purchases
Private
3.3 4.45.7 4.05.5 5.9
Personal consumption expendituresDurable goodsNondurable goodsServices
Gross private domestic investmentResidential constructionBusiness fixed investment
Gov't. purchases of goods & servicesFederal
DefenseOther
State & local
GNP in constant (1958) dollarsFinal purchasesPrivate
GNP implicit deflator
Personal incomeWages and salaries
Disposable income
Corporate profits before tax
Federal government receipts andexpenditures (N.I.A. basis)
ReceiptsExpenditures
Nonfarm payroll employmentManufacturing
Industrial productionHousing starts, privateSales new domestic autos
7.8 7.3 7.17.1 2.7 -7.56.8 7.7 10.89.0 8.8 8.6
10.5 -4.1 -20.05.6 -7.5 -17.1
12.0 2.9 0.0
3.7-1.6-2.9
3.18.6
-3.0
-0.4
0.8 /6.4 -
6.15.09.0
7.4 7.512.1 8.35.1 7.07.8 7.8
1.8 -0.9 6.3 3.5 3.2-8.2 7.0 37.2 30.3 12.90.4 -1.9 -3.9 -5.9 -6.0
-2.4-10. 6-11.1
-8.74.4
0.3 1.6-0.4 1.91.8 2.94.2 4.0
3.6-4.0
-11.119.0
9.9
9.77.81.6
26.311.3
6.70.0
-5.917.011.9
3.23.13.4 24.1
9.8 3.9 5.7 6.35.9 5.0 4.9 8.2
11.2 5.4 5.2 5.8
2.8 -8.3 -26.7 1.9 3.4 7.2 -7.0 9.6
14.4 -2.0 -12.1 1.6 -2.6 6.1 14.5 6.8
5.3 8.2 3.7 26.1 -2.7 1.7 9.7 6.1
3.5 0.92.0 -3.0
4.4 -1.4 -2.8-2.7 -8.5 -31.0-1.9 -4.6 -38.1
1.7 -1.1 -1.1 1.7 2.3 2.2-2.0 -8.0 -4.1 -2.1 0.0 2.0
-3.3 1.7 2.6 3.0 3.75.4 25.5 44.4 20.0 12.732.3 27.8 0.0 4.7 7.0
1/ Excluding effects of Federal pay increase, 5.5 per
2/ Excluding effects of Federal pay increase, 3.2 per
cent per year.
cent per year.
18.20.3
17.912.511.90.65.4
16.01.5
14.510.710.60.13.8
II-6b August 12, 1970
II - 7
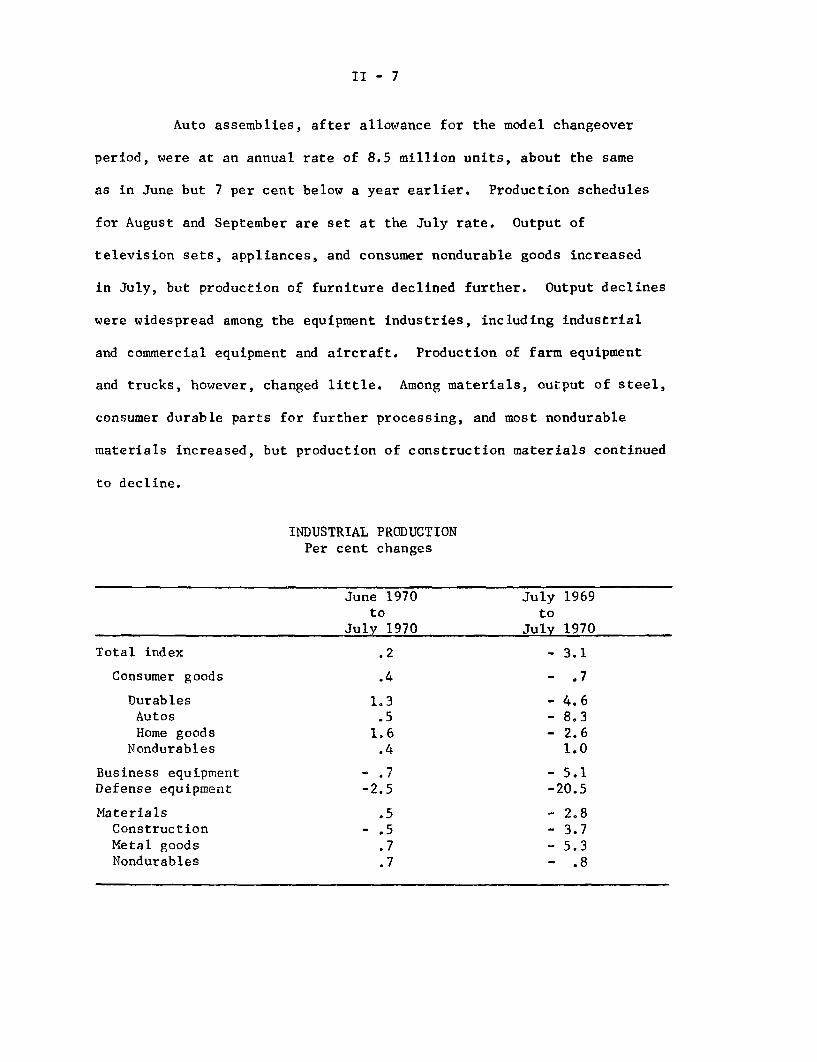
Auto assemblies, after allowance for the model changeover
period, were at an annual rate of 8.5 million units, about the same
as in June but 7 per cent below a year earlier. Production schedules
for August and September are set at the July rate. Output of
television sets, appliances, and consumer nondurable goods increased
in July, but production of furniture declined further. Output declines
were widespread among the equipment industries, including industrial
and commercial equipment and aircraft. Production of farm equipment
and trucks, however, changed little. Among materials, output of steel,
consumer durable parts for further processing, and most nondurable
materials increased, but production of construction materials continued
to decline.
INDUSTRIAL PRODUCTIONPer cent changes
June 1970 July 1969to to
July 1970 July 1970
Total index .2 - 3.1
Consumer goods .4 - .7
Durables 1.3 - 4.6Autos .5 - 8.3Home goods 1.6 - 2.6
Nondurables .4 1.0
Business equipment - .7 - 5.1Defense equipment -2.5 -20.5
Materials .5 - 2.8Construction - .5 - 3.7Metal goods .7 - 5.3Nondurables .7 - .8
II - 8
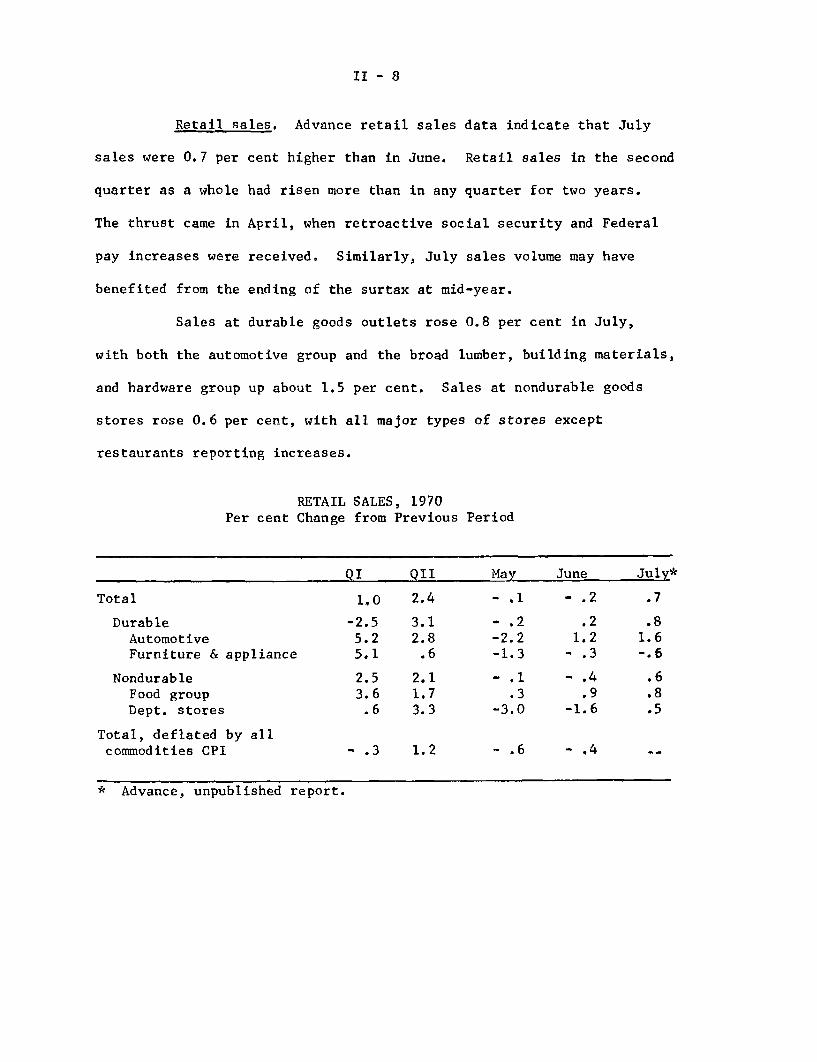
Retail sales. Advance retail sales data indicate that July
sales were 0.7 per cent higher than in June. Retail sales in the second
quarter as a whole had risen more than in any quarter for two years.
The thrust came in April, when retroactive social security and Federal
pay increases were received. Similarly, July sales volume may have
benefited from the ending of the surtax at mid-year.
Sales at durable goods outlets rose 0.8 per cent in July,
with both the automotive group and the broad lumber, building materials,
and hardware group up about 1.5 per cent. Sales at nondurable goods
stores rose 0.6 per cent, with all major types of stores except
restaurants reporting increases.
RETAIL SALES, 1970Per cent Change from Previous Period
QI QII May June July*
Total 1.0 2.4 - .1 - .2 .7
Durable -2.5 3.1 - .2 .2 .8Automotive 5.2 2.8 -2.2 1.2 1.6Furniture & appliance 5.1 .6 -1.3 - .3 -.6
Nondurable 2.5 2.1 - .1 - .4 .6Food group 3.6 1.7 .3 .9 .8Dept. stores .6 3.3 -3.0 -1.6 .5
Total, deflated by allcommodities CPI - .3 1.2 - .6 - .4
* Advance, unpublished report.
II - 9
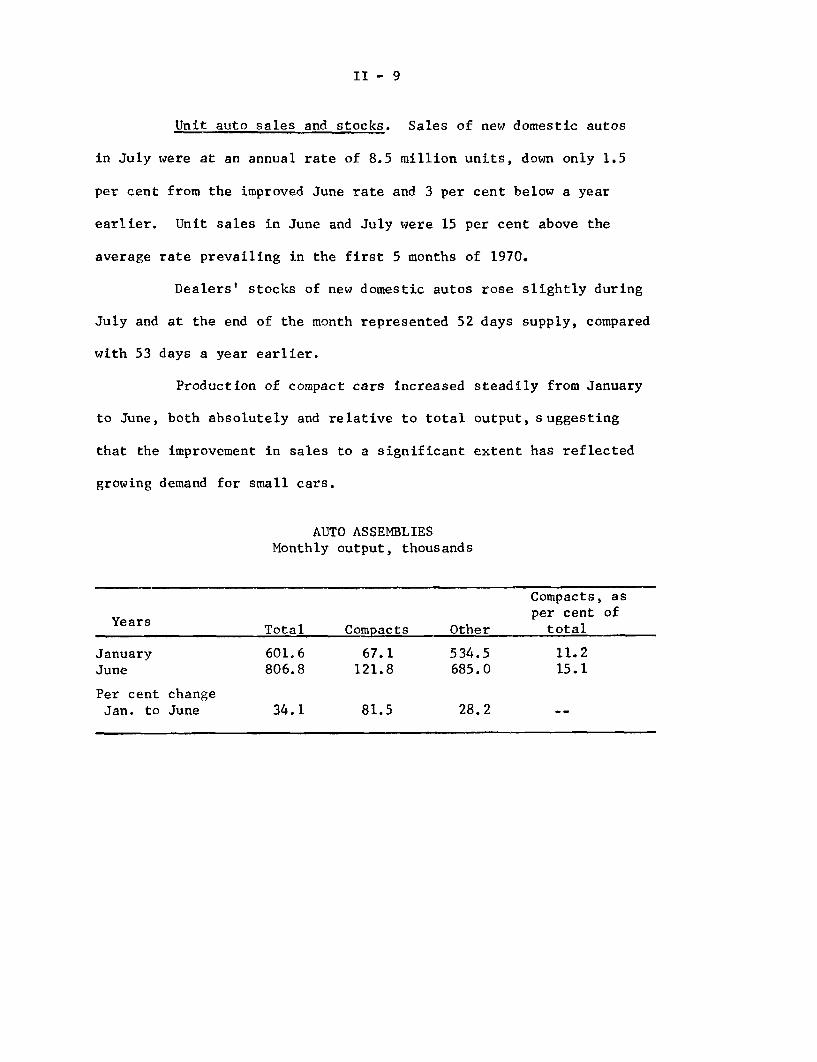
Unit auto sales and stocks. Sales of new domestic autos
in July were at an annual rate of 8.5 million units, down only 1.5
per cent from the improved June rate and 3 per cent below a year
earlier. Unit sales in June and July were 15 per cent above the
average rate prevailing in the first 5 months of 1970.
Dealers' stocks of new domestic autos rose slightly during
July and at the end of the month represented 52 days supply, compared
with 53 days a year earlier.
Production of compact cars increased steadily from January
to June, both absolutely and relative to total output, suggesting
that the improvement in sales to a significant extent has reflected
growing demand for small cars.
AUTO ASSEMBLIESMonthly output, thousands
Compacts, asYears per cent of
Total Compacts Other total
January 601.6 67.1 534.5 11.2June 806.8 121.8 685.0 15.1
Per cent changeJan. to June 34.1 81.5 28.2 --
II - 10
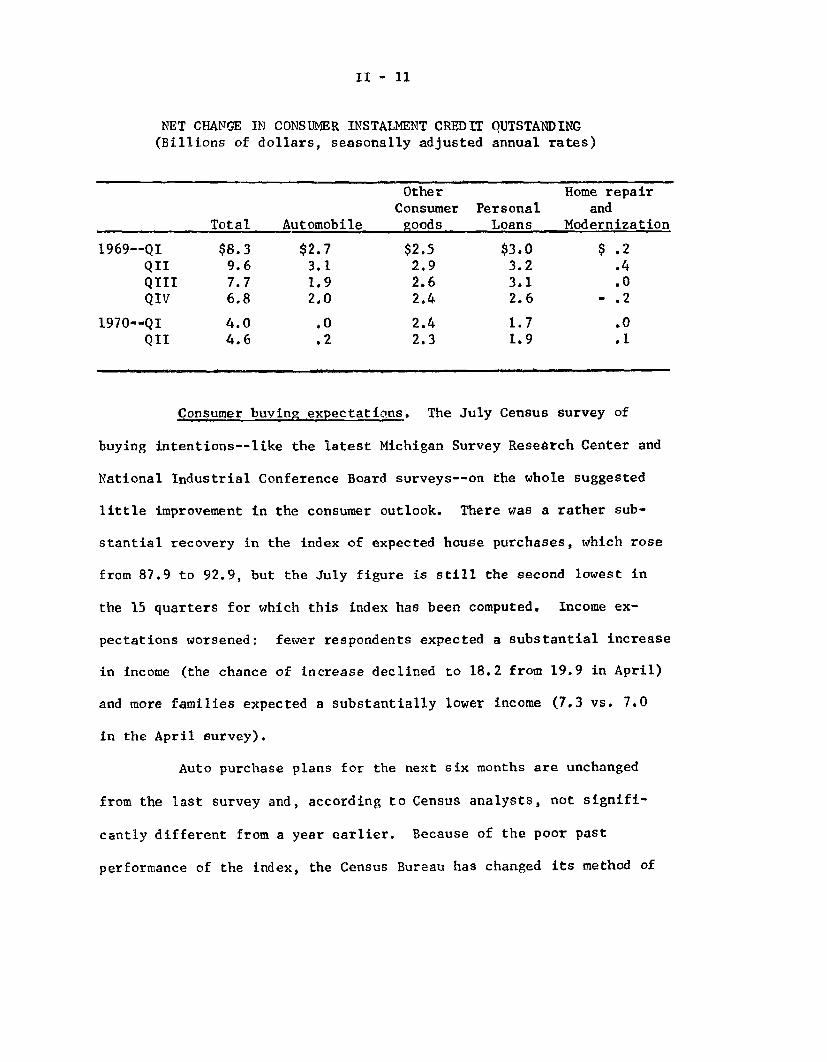
Consumer credit. Consumer instalment credit outstanding rose
at a seasonally adjusted annual rate of $5.3 billion in June. This
was the largest monthly advance since last November and lifted the
average rate of increase for the second quarter as a whole to $4.6
billion, up somewhat from the $4.0 billion rate in the first quarter.
Despite the most recent gain, the rise in instalment credit during the
first half of 1970 was less than one-half the $9.0 billion rate in
the first half of last year, and was also well below the $7.2 billion
rate in the latter half of 1969.
Extensions and repayments of instalment credit both declined
substantially in June after posting very large increases in May. The
reductions were centered in personal loans and nonautomotive consumer
goods--the same categories that had moved up sharply in May. For the
second quarter as a whole, total extensions of instalment credit,
which had declined for three straight quarters, rose to a level slightly
above the year-earlier peak; over-the-year increases in personal loans
and nonautomotive consumer goods more than offset reductions in the
automobile and repair and modernization groups.
II - 11
NET CHANGE IN CONSUMER INSTALMENT CREDIT OUTSTANDING(Billions of dollars, seasonally adjusted annual rates)
Other Home repairConsumer Personal and
Total Automobile goods Loans Modernization
1969--QI $8.3 $2.7 $2.5 $3.0 $ .2QII 9.6 3.1 2.9 3.2 .4QIII 7.7 1.9 2.6 3.1 .0QIV 6.8 2,0 2.4 2.6 - .2
1970--QI 4.0 .0 2.4 1.7 .0QII 4.6 .2 2.3 1.9 .1
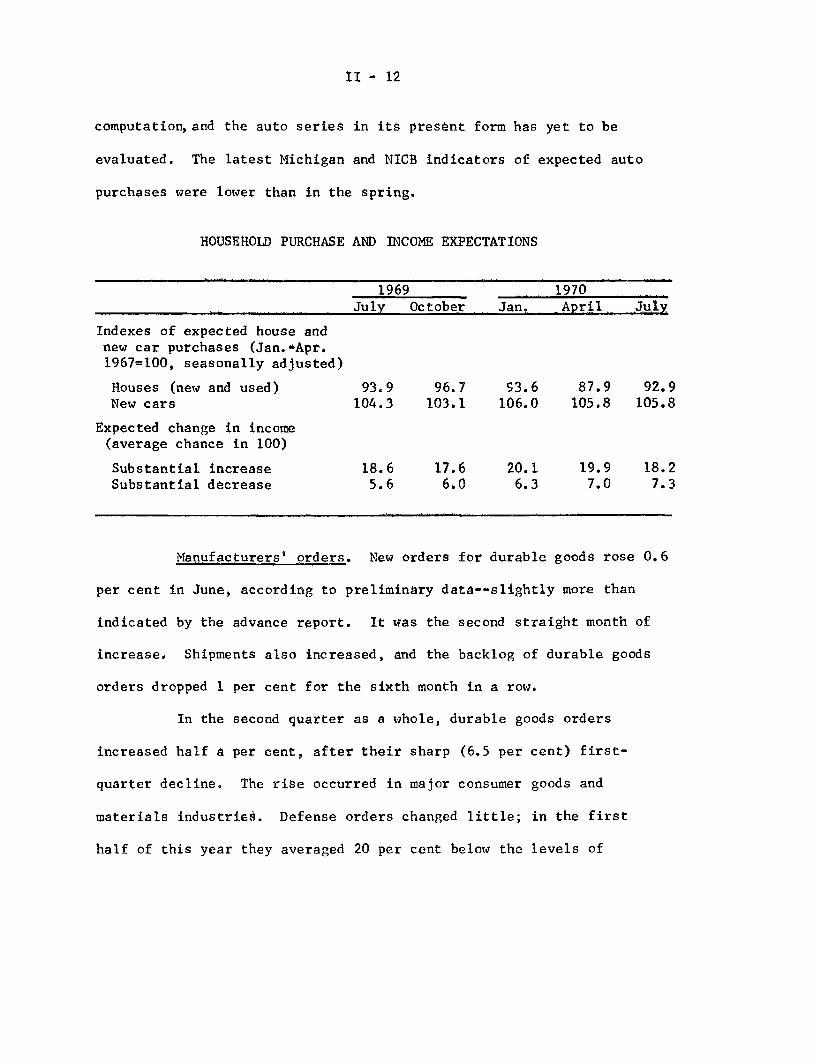
Consumer buying expectations. The July Census survey of
buying intentions--like the latest Michigan Survey Research Center and
National Industrial Conference Board surveys--on the whole suggested
little improvement in the consumer outlook. There was a rather sub-
stantial recovery in the index of expected house purchases, which rose
from 87.9 to 92.9, but the July figure is still the second lowest in
the 15 quarters for which this index has been computed. Income ex-
pectations worsened: fewer respondents expected a substantial increase
in income (the chance of increase declined to 18.2 from 19.9 in April)
and more families expected a substantially lower income (7.3 vs. 7.0
in the April survey).
Auto purchase plans for the next six months are unchanged
from the last survey and, according to Census analysts, not signifi-
cantly different from a year earlier. Because of the poor past
performance of the index, the Census Bureau has changed its method of
II - 12
computation, and the auto series in its present form has yet to be
evaluated. The latest Michigan and NICB indicators of expected auto
purchases were lower than in the spring.
HOUSEHOLD PURCHASE AND INCOME EXPECTATIONS
1969 1970
July October Jan. April July
Indexes of expected house andnew car purchases (Jan."Apr.1967=100, seasonally adjusted)
Houses (new and used) 93.9 96.7 53.6 87.9 92.9New cars 104.3 103.1 106.0 105.8 105.8
Expected change in income(average chance in 100)
Substantial increase 18.6 17.6 20.1 19.9 18.2Substantial decrease 5.6 6.0 6.3 7.0 7.3
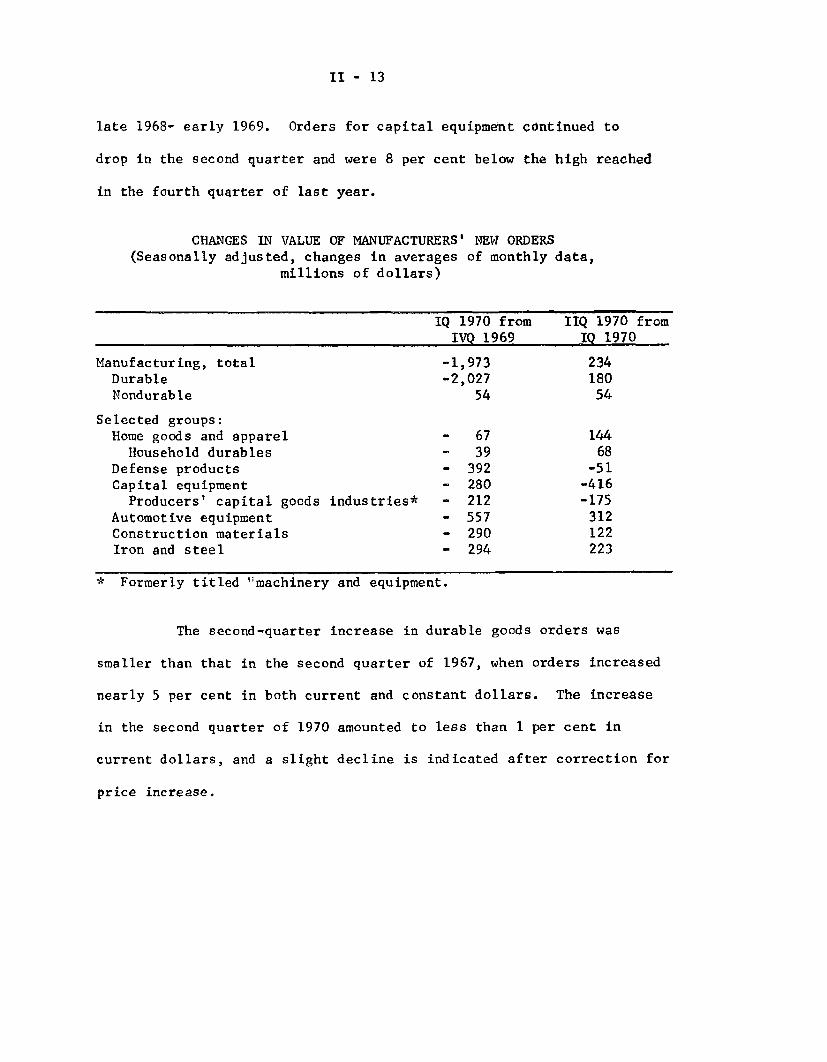
Manufacturers' orders. New orders for durable goods rose 0.6
per cent in June, according to preliminary data--slightly more than
indicated by the advance report. It was the second straight month of
increase. Shipments also increased, and the backlog of durable goods
orders dropped 1 per cent for the sixth month in a row.
In the second quarter as a whole, durable goods orders
increased half a per cent, after their sharp (6.5 per cent) first-
quarter decline. The rise occurred in major consumer goods and
materials industries. Defense orders changed little; in the first
half of this year they averaged 20 per cent below the levels of
II - 13
late 1968- early 1969. Orders for capital equipment continued to
drop in the second quarter and were 8 per cent below the high reached
in the fourth quarter of last year.
CHANGES IN VALUE OF MANUFACTURERS' NEW ORDERS(Seasonally adjusted, changes in averages of monthly data,
millions of dollars)
IQ
Manufacturing, totalDurableNondurable
Selected groups:Home goods and apparel
Household durablesDefense productsCapital equipment
Producers' capital goods industries* -Automotive equipmentConstruction materialsIron and steel
* Formerly titled "machinery and equipment.
1970 fromIVQ 1969
1,9732,027
54
6739
392280212557290294
IIQ 1970 fromIq 1970
23418054
14468-51
-416-175312122223
The second-quarter increase in durable goods orders was
smaller than that in the second quarter of 1967, when orders increased
nearly 5 per cent in both current and constant dollars. The increase
in the second quarter of 1970 amounted to less than 1 per cent in
current dollars, and a slight decline is indicated after correction for
price increase.
- ---- --
-
II - 14
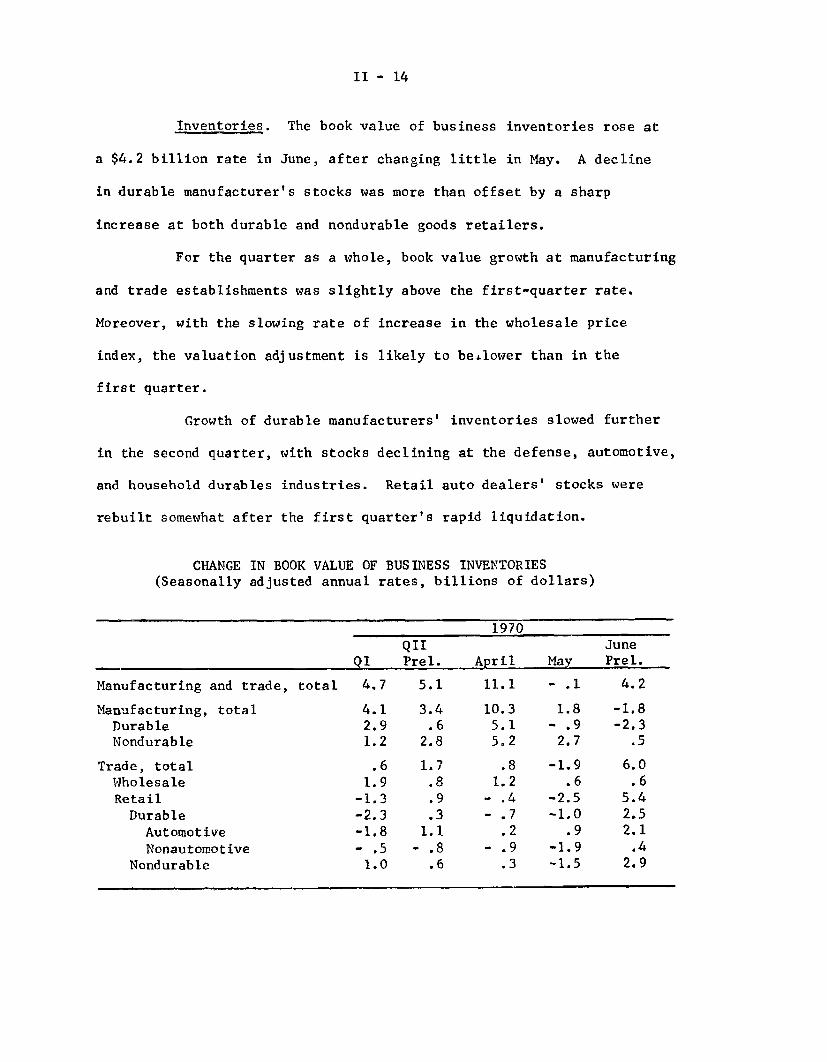
Inventories. The book value of business inventories rose at
a $4.2 billion rate in June, after changing little in May. A decline
in durable manufacturer's stocks was more than offset by a sharp
increase at both durable and nondurable goods retailers.
For the quarter as a whole, book value growth at manufacturing
and trade establishments was slightly above the first-quarter rate.
Moreover, with the slowing rate of increase in the wholesale price
index, the valuation adjustment is likely to be lower than in the
first quarter.
Growth of durable manufacturers' inventories slowed further
in the second quarter, with stocks declining at the defense, automotive,
and household durables industries. Retail auto dealers' stocks were
rebuilt somewhat after the first quarter's rapid liquidation.
CHANGE IN BOOK VALUE OF BUSINESS INVENTORIES(Seasonally adjusted annual rates, billions of dollars)
1970QII June
QI Prel. April May Prel.
Manufacturing and trade, total 4.7 5.1 11.1 - .1 4.2
Manufacturing, total 4.1 3.4 10.3 1.8 -1.8Durable 2.9 .6 5.1 - .9 -2.3Nondurable 1.2 2.8 5.2 2.7 .5
Trade, total .6 1.7 .8 -1.9 6.0Wholesale 1.9 .8 1.2 .6 .6Retail -1.3 .9 - .4 -2.5 5.4Durable -2.3 .3 - .7 -1.0 2.5
Automotive -1.8 1.1 .2 .9 2.1Nonautomotive - .5 - .8 - .9 -1.9 .4
Nondurable 1.0 .6 .3 -1.5 2.9

II - 15
The over-all inventory-sales ratio was cut in June, as
declines continued at durable and nondurable manufacturing and
wholesale trade. Inventories rose relative to sales throughout the
major retail groups, however. The recent slowdown of investment
inventory has brought stocks into better alignment with sales, and
recent ratios for the cyclically significant durable manufacturing and
total trade groups are comparable to those of mid-1967 and other periods
when the economy was on the verge of renewed expansion. The ratio of
durable manufacturers' inventories to unfilled orders rose further,
however, and is at the highest point since its historical peak in
November 1962.
INVENTORY RATIOS
19701967 June
May June May (prel.)
Inventories to sales:Manufacturing and trade, total 1.59 1.57 1.58 1.57
Manufacturing, total 1.79 1.78 1.76 1.74Durable 2.11 2.08 2.13 2.11Nondurable 1.41 1.41 1.32 1.30
Trade, total 1.37 1.35 1.37 1.38Wholesale 1.22 1.20 1.21 1.20Retail 1.47 1.44 1.48 1.50Durable 2.02 1.95 2.13 2.15
Automotive 1.51 1.43 1.78 1.79Nonautomotive 2.74 2.70 2.63 2.66
Nondurable 1.21 1.20 1.20 1.22
Inventories to unfilled orders,durable manufacturing .681 .673 .789 .795
II - 16
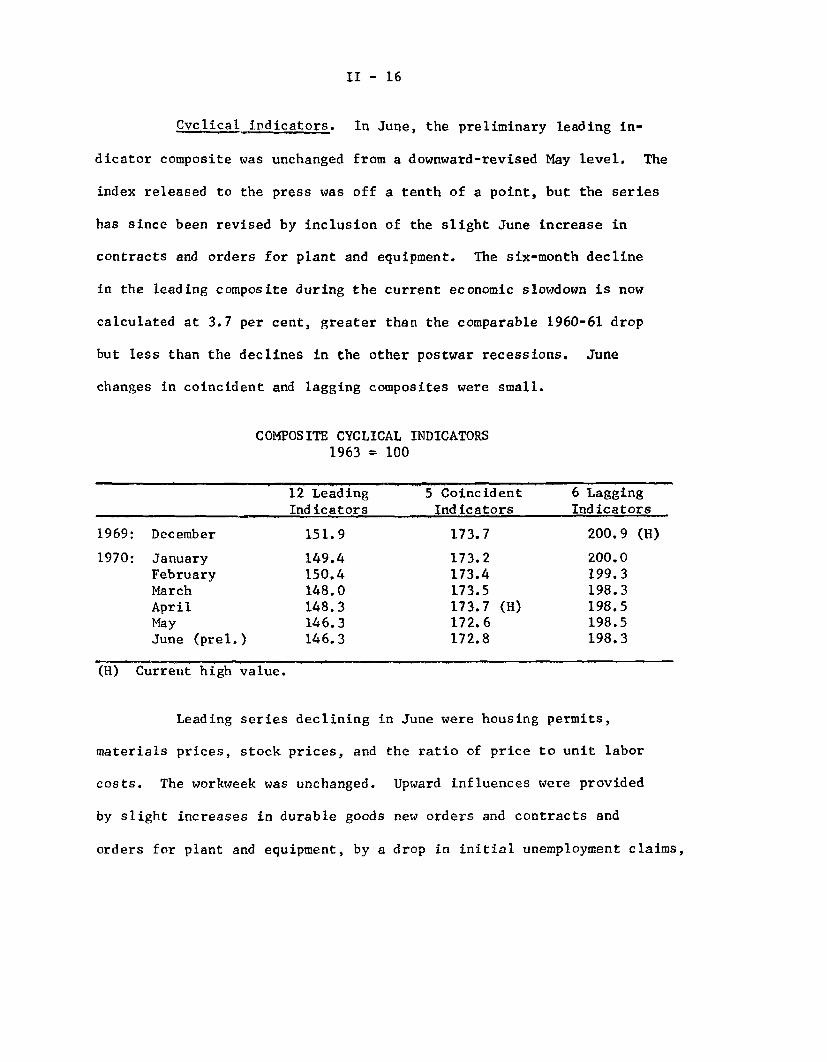
Cyclical indicators. In June, the preliminary leading in-
dicator composite was unchanged from a downward-revised May level. The
index released to the press was off a tenth of a point, but the series
has since been revised by inclusion of the slight June increase in
contracts and orders for plant and equipment. The six-month decline
in the leading composite during the current economic slowdown is now
calculated at 3.7 per cent, greater than the comparable 1960-61 drop
but less than the declines in the other postwar recessions. June
changes in coincident and lagging composites were small.
COMPOSITE CYCLICAL INDICATORS1963 = 100
12 Leading 5 Coincident 6 LaggingIndicators Indicators Indicators
1969: December 151.9 173.7 200.9 (H)
1970: January 149.4 173.2 200.0February 150.4 173.4 199.3March 148.0 173.5 198.3April 148.3 173.7 (H) 198.5May 146.3 172.6 198.5June (prel.) 146.3 172.8 198.3
(H) Current high value.
Leading series declining in June were housing permits,
materials prices, stock prices, and the ratio of price to unit labor
costs. The workweek was unchanged. Upward influences were provided
by slight increases in durable goods new orders and contracts and
orders for plant and equipment, by a drop in initial unemployment claims,
II - 17
and by the trend adjustment which contributes an increase of .35 per
cent each month. The principal reason for May's downward revision
appears to have been the sharp drop in the preliminary inventory data.
Preliminary data for July indicate an increase in common
stock prices and the manufacturing workweek and a decline in initial
unemployment claims, but a further decline in industrial materials
prices.
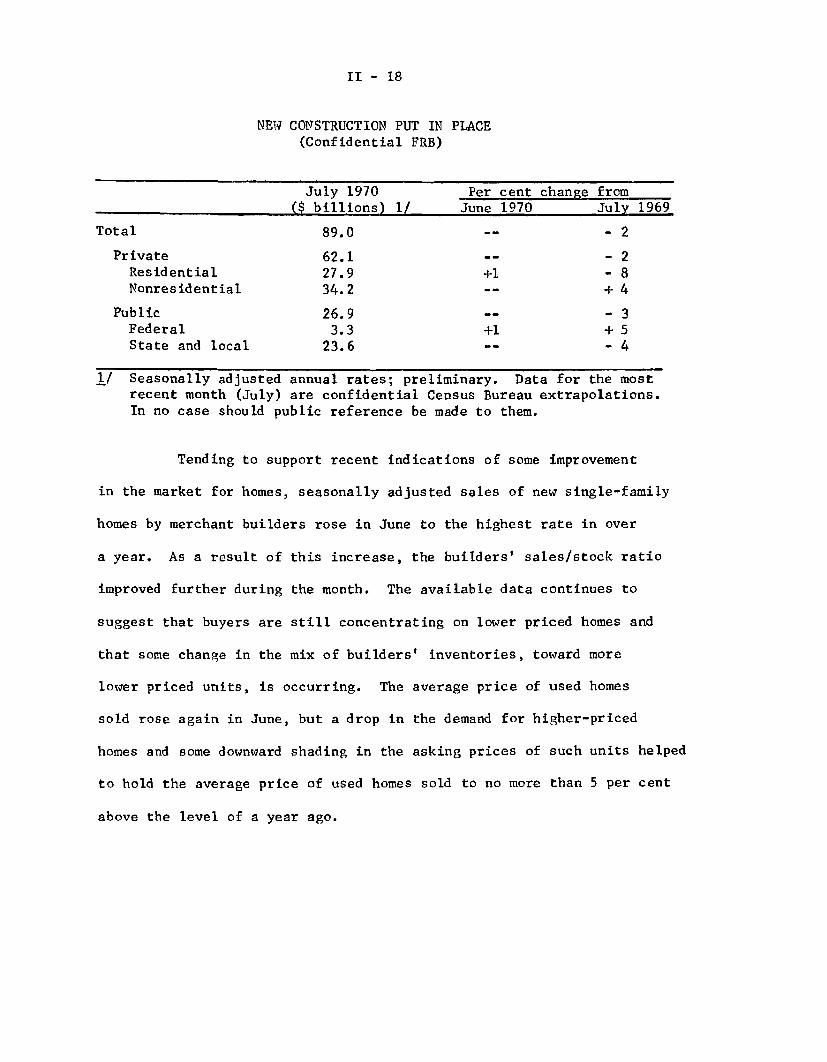
Construction and real estate. Total outlays for new construc-
tion put in place remained virtually unchanged in July, according to
preliminary Census estimates. At a seasonally adjusted annual rate of
$89.0 billion, the July figure was 2 per cent below a year earlier;
in constant dollars, however, the year-over-year decline amounted to
more than 7 per cent. Private residential construction expenditures,
reflecting the higher level of June starts, apparently halted the
downward trend of the past three months. In the public sector, State
and local outlays continued near the reduced April rate.
II - 18
NEW CONSTRUCTION PUT IN PLACE(Confidential FRB)
July 1970 Per cent change from
($ billions) 1/ June 1970 July 1969
Total 89.0 -- - 2
Private 62.1 - - 2Residential 27.9 +1 - 8Nonresidential 34.2 -- + 4
Public 26.9 -- - 3Federal 3.3 +1 + 5State and local 23.6 -- - 4
1/ Seasonally adjusted annual rates; preliminary. Data for the mostrecent month (July) are confidential Census Bureau extrapolations.In no case should public reference be made to them.
Tending to support recent indications of some improvement
in the market for homes, seasonally adjusted sales of new single-family
homes by merchant builders rose in June to the highest rate in over
a year. As a result of this increase, the builders' sales/stock ratio
improved further during the month. The available data continues to
suggest that buyers are still concentrating on lower priced homes and
that some change in the mix of builders' inventories, toward more
lower priced units, is occurring. The average price of used homes
sold rose again in June, but a drop in the demand for higher-priced
homes and some downward shading in the asking prices of such units helped
to hold the average price of used homes sold to no more than 5 per cent
above the level of a year ago.
II - 19
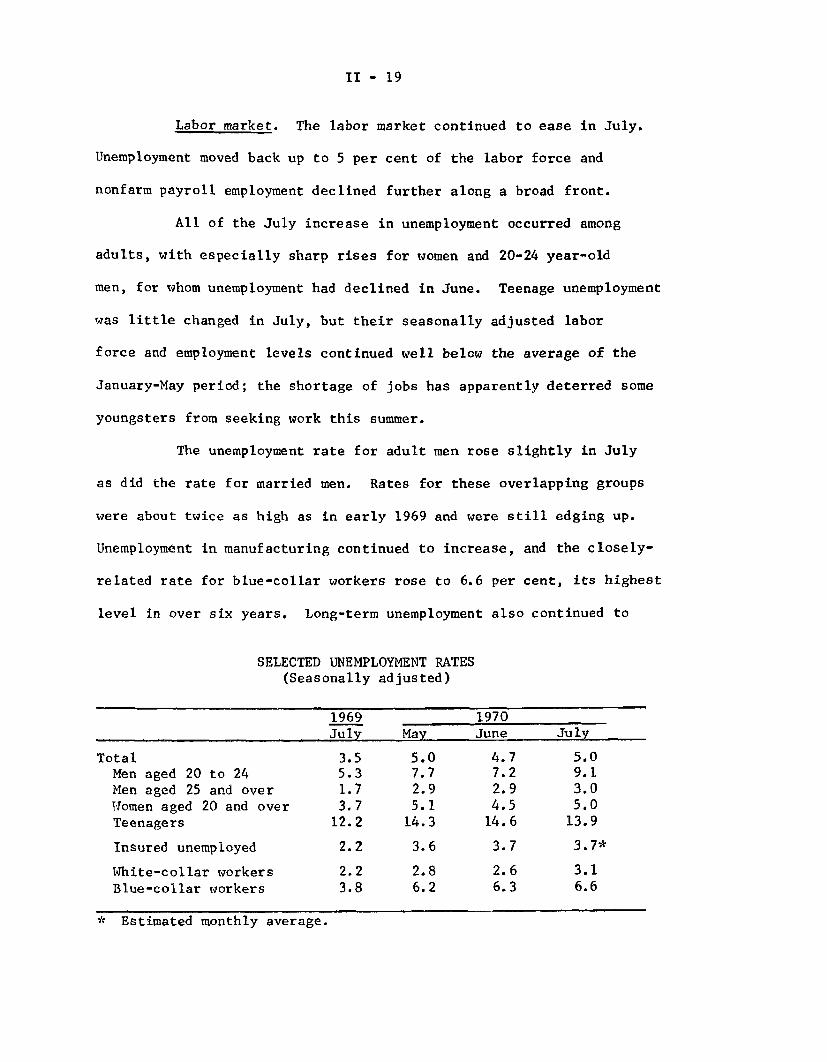
Labor market. The labor market continued to ease in July.
Unemployment moved back up to 5 per cent of the labor force and
nonfarm payroll employment declined further along a broad front.
All of the July increase in unemployment occurred among
adults, with especially sharp rises for women and 20-24 year-old
men, for whom unemployment had declined in June. Teenage unemployment
was little changed in July, but their seasonally adjusted labor
force and employment levels continued well below the average of the
January-May period; the shortage of jobs has apparently deterred some
youngsters from seeking work this summer.
The unemployment rate for adult men rose slightly in July
as did the rate for married men. Rates for these overlapping groups
were about twice as high as in early 1969 and were still edging up.
Unemployment in manufacturing continued to increase, and the closely-
related rate for blue-collar workers rose to 6.6 per cent, its highest
level in over six years. Long-term unemployment also continued to
SELECTED UNEMPLOYMENT RATES(Seasonally adjusted)
1969 1970July May June July
Total 3.5 5.0 4.7 5.0Men aged 20 to 24 5.3 7.7 7.2 9.1Men aged 25 and over 1.7 2.9 2.9 3.0Women aged 20 and over 3.7 5.1 4.5 5.0Teenagers 12.2 14.3 14.6 13.9
Insured unemployed 2.2 3.6 3.7 3.7*
White-collar workers 2.2 2.8 2.6 3.1Blue-collar workers 3.8 6.2 6.3 6.6
* Estimated monthly average.
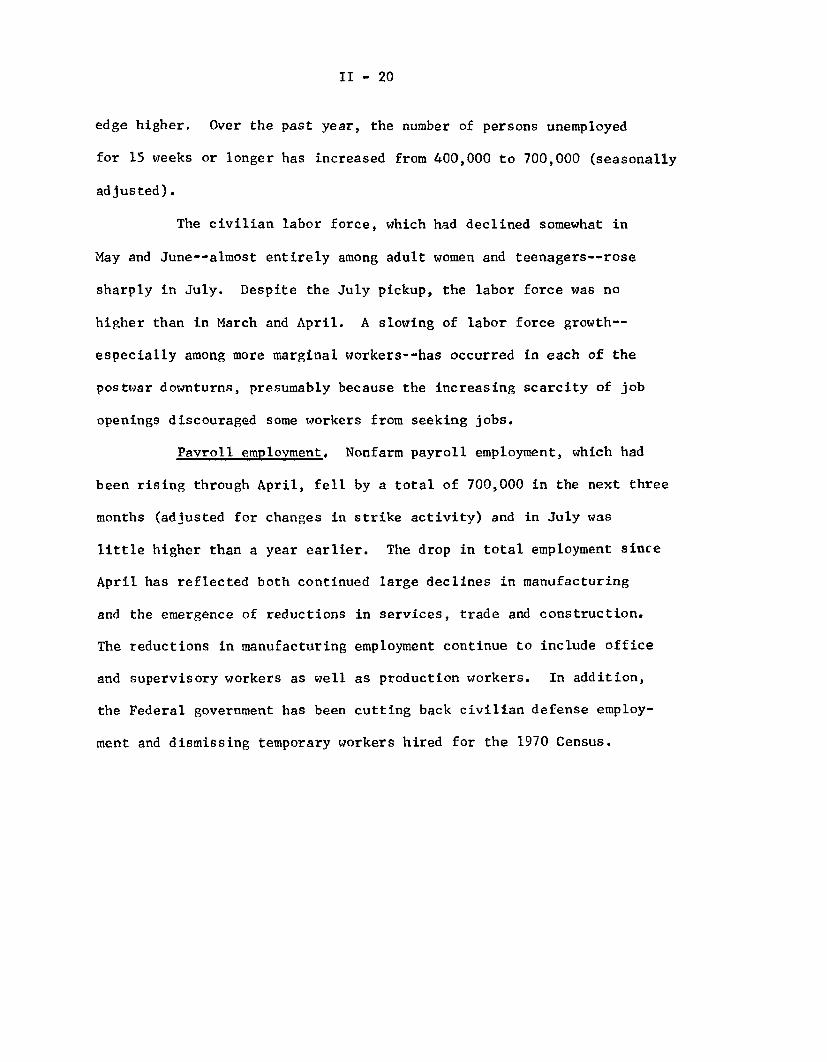
II - 20
edge higher. Over the past year, the number of persons unemployed
for 15 weeks or longer has increased from 400,000 to 700,000 (seasonally
adjusted).
The civilian labor force, which had declined somewhat in
May and June--almost entirely among adult women and teenagers--rose
sharply in July. Despite the July pickup, the labor force was no
higher than in March and April. A slowing of labor force growth--
especially among more marginal workers--has occurred in each of the
postwar downturns, presumably because the increasing scarcity of job
openings discouraged some workers from seeking jobs.
Payroll employment. Nonfarm payroll employment, which had
been rising through April, fell by a total of 700,000 in the next three
months (adjusted for changes in strike activity) and in July was
little higher than a year earlier. The drop in total employment since
April has reflected both continued large declines in manufacturing
and the emergence of reductions in services, trade and construction.
The reductions in manufacturing employment continue to include office
and supervisory workers as well as production workers. In addition,
the Federal government has been cutting back civilian defense employ-
ment and dismissing temporary workers hired for the 1970 Census.

II - 21
NONFARM PAYROLL EMPLOYMENT, 1970*(Seasonally adjusted, in thousands)
Total Manufacturing Nonmanufactufing
Change from prior month:January 150 -64 214February 33 -209 242March 113 7 106April 21 -146 167May -214 -175 -39June -306 -108 -198July -194 -103 -91
* Adjusted to exclude effects of major strikes.
The downtrend in manufacturing employment, which began last
fall and intensified in the early months of 1970, may be easing
somewhat. The average workweek--a fairly reliable leading indicator--
has held at a little less than 40 hours for the past three months.
And although employment declines were evident in June and July in most
of the 21 manufacturing industries, the over-all declines were some-
what smaller than in April and May.
Earnings. Since January, hourly earnings of nonsupervisory
workers in the private nonfarm sector have increased 2.9 per cent,
compared with a 3.4 per cent advance in the corresponding period of
1969. Hourly earnings in July were 17 cents, or 5.6 per cent, higher
than a year earlier. So far this year, weekly earnings have advanced
4.3 per cent, as compared with a 5.0 per cent gain last year. The
moderation of the rate of growth of both hourly and weekly earnings

II - 22
largely reflects the sharp reductions of overtime work at premium
pay and the heavy layoffs of high-wage workers in the durable goods
manufacturing industries (both factors tend to depress the average
earnings figures).
Productivity. Output per manhour increased at an annual
rate of 3.3 per cent in the private nonfarm economy in the second quarter.
The increase resulted from a sharp drop in employment and working
hours while real output leveled off. Both output and productivity had
declined in the first quarter. As a result of the rise in productivity
and the smaller gains in earnings, noted above, the increase in unit
labor costs slowed sharply in the second quarter.
PRODUCTIVITY AND UNIT LABOR COSTS, PRIVATE NONFARM ECONOMY(Seasonally adjusted)
Compensation Output per Unit laborper manhour manhour costs
Change from previous quarter,annual rate:
1969: I 5.5 -1.5 7.1II 5.8 -0.4 6.3
III 7.3 .6 6.6IV 7.7 .3 7.3
1970: I 6.6 -2.9 9.8II 5.6 3.3 2.2
II - 23
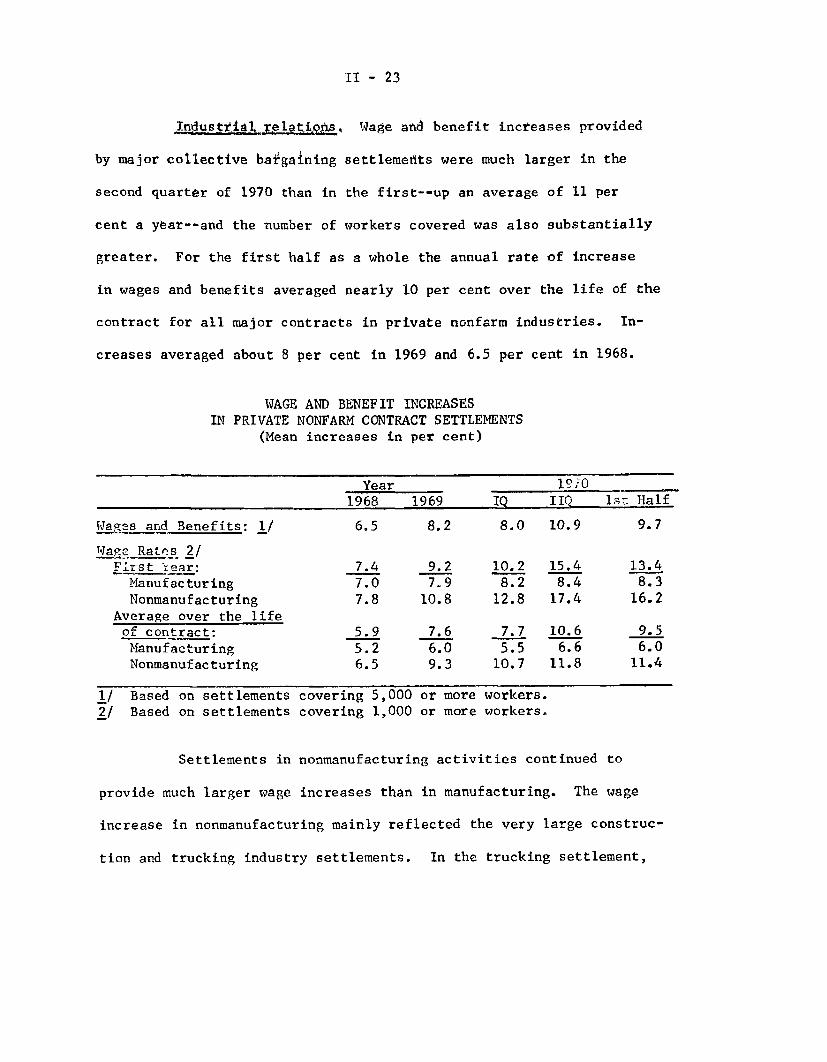
Industrial relations. Wage and benefit increases provided
by major collective bargaining settlements were much larger in the
second quarter of 1970 than in the first--up an average of 11 per
cent a year--and the number of workers covered was also substantially
greater. For the first half as a whole the annual rate of increase
in wages and benefits averaged nearly 10 per cent over the life of the
contract for all major contracts in private nonfarm industries. In-
creases averaged about 8 per cent in 1969 and 6.5 per cent in 1968.
WAGE AND BENEFIT INCREASESIN PRIVATE NONFARM CONTRACT SETTLEMENTS
(Mean increases in per cent)
Year 19i0
1968 1969 IQ IIQ lsr Half
WaRes and Benefits: 1/ 6.5 8.2 8.0 10.9 9.7
Tafe Rates 2/First fear: 7.4 9.2 10.2 15.4 13.4
Manufacturing 7.0 7.9 8.2 8.4 8.3Nonmanufacturing 7.8 10.8 12.8 17.4 16.2
Average over the lifeof contract: 5.9 7.6 7.7 10.6 9.5
Manufacturing 5.2 6.0 5.5 6.6 6.0Nonmanufacturing 6.5 9.3 10.7 11.8 11.4
1/ Based on settlements covering 5,000 or more workers.2/ Based on settlements covering 1,000 or more workers.
Settlements in nonmanufacturing activities continued to
provide much larger wage increases than in manufacturing. The wage
increase in nonmanufacturing mainly reflected the very large construc-
tion and trucking industry settlements. In the trucking settlement,
II - 24
wage and benefit increases together averaged about 13 per cent
annually; first-year wage increases alone totaled 85 cents, or 22-1/2
per cent. Construction workers covered by new contracts during the
second quarter received wage increases averaging about 18 per cent in
the first year.
With most of the 1970 collective bargaining schedule in
manufacturing lying ahead, pressure on wages may intensify in this
important sector. Only one-fourth of the 2.7 million workers covered
by major contracts to be reopened this year negotiated new agreements
during the first six months. Of the remaining 2 million workers, more
than 700,000 are employees of General Motors, Ford and Chrysler where
contracts expire September 14. The auto industry settlement will
probably set the wage pattern for the auto supplier plants and in the
farm and construction equipment industries.
II - 25
Unemployment insurance legislation. The President on
August 10 approved legislation which extends coverage of the State
unemployment insurance programs and automatically triggers an
extension of the number of weeks of benefits during periods of
high unemployment nationally or at the State level. The Act will
be effective at the national level January 1, 1972. The Federal
government will pay one half the cost of the extended benefit
program.
About 4.7 million workers will be newly covered, mainly
employees of small firms, private nonprofit organizations, State
hospitals and institutions of higher education. Extension of
benefits will be automatically triggered for all States when the
seasonally adjusted national rate of insured unemployment reaches
4.5 per cent for three consecutive months. (This rate was 3.7 per
cent in June, the latest figure available.) Provision is also
made for extension of benefits in individual States with high unemploy-
ment when the overall rate is not high enough to trigger a national
extension. For individual States, the automatic trigger occurs
when the State's unemployment rate for 13 consecutive weeks is 120
per cent or more of the rate for the corresponding period in each
of the two preceding years and is 4 per cent cr more.
Generally, workers covered by unemployment compensation
will receive 13 additional weeks of benefits if unemployment goes
above the prescribed rate. In several States rates are now high
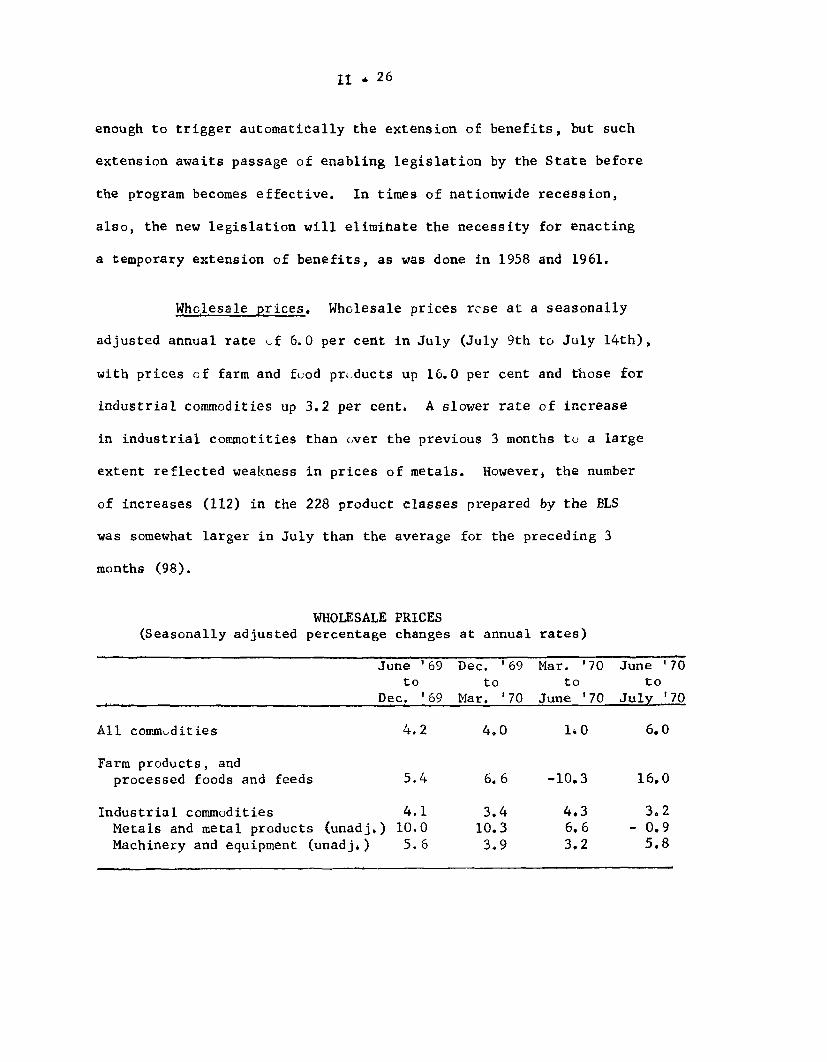
11 - 26
enough to trigger automatically the extension of benefits, but such
extension awaits passage of enabling legislation by the State before
the program becomes effective. In times of nationwide recession,
also, the new legislation will eliminate the necessity for enacting
a temporary extension of benefits, as was done in 1958 and 1961.
Wholesale prices. Wholesale prices rose at a seasonally
adjusted annual rate of 6.0 per cent in July (July 9th to July 14th),
with prices of farm and food products up 16.0 per cent and those for
industrial commodities up 3.2 per cent. A slower rate of increase
in industrial commotities than over the previous 3 months to a large
extent reflected weakness in prices of metals. However, the number
of increases (112) in the 228 product classes prepared by the BLS
was somewhat larger in July than the average for the preceding 3
months (98).
WHOLESALE PRICES(Seasonally adjusted percentage changes
June '69to
Dec. '69
at annual
Dec. '69to
Mar. '70
All commodities 4.2 4.0 '10 6.0
Farm products, andprocessed foods and feeds 5.4 6.6 -10.3 16.0
Industrial commodities 4.1 3.4 4.3 3.2Metals and metal products (unadj,) 10.0 10.3 6.6 - 0.9Machinery and equipment (unadj,) 5.6 3.9 3.2 5.8
rates)
Mar. '70to
June '70
June '70to
July '70
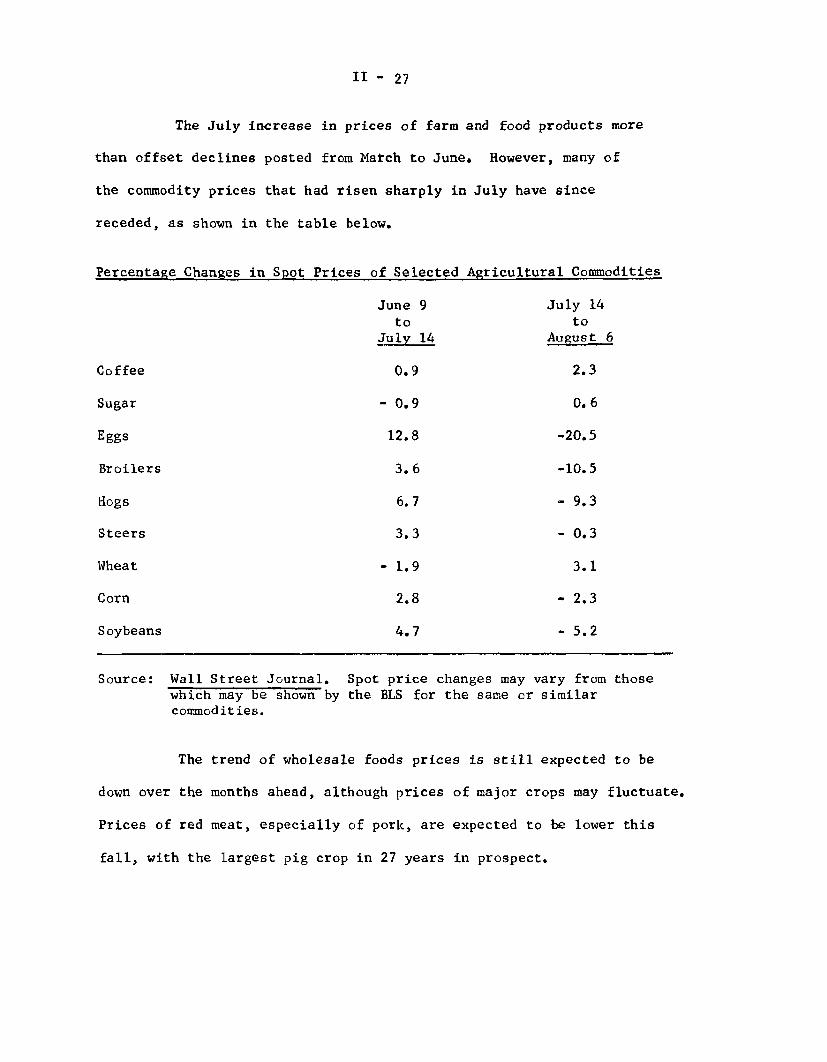
II - 27
The July increase in prices of farm and food products more
than offset declines posted from March to June. However, many of
the commodity prices that had risen sharply in July have since
receded, as shown in the table below.
Percentage Changes in Spot Prices
Coffee
Sugar
Eggs
Broilers
Hogs
Steers
Wheat
Corn
Soybeans
of Selected Agricultural Commodities
June 9 July 14to to
July 14 August 6
0.9 2.3
- 0.9 0.6
12.8 -20.5
3.6 -10.5
6.7 - 9.3
3.3 - 0.3
- 1.9 3.1
2.8 - 2.3
4.7 - 5.2
Source: Wall Street Journal. Spot price changes may vary from those
which may be shown by the BLS for the same or similarcommodities.
The trend of wholesale foods prices is still expected to be
down over the months ahead, although prices of major crops may fluctuate.
Prices of red meat, especially of pork, are expected to be lower this
fall, with the largest pig crop in 27 years in prospect.

II - 23
Among industrial commodities, an increase of 0.5 per cent in
prices of machinery and equipment from June to July was larger than
in any month since last January. Prices of fuels and chemicals also
moved up, and increases were posted for tires and paper products.
Coal prices are still rising, and prices for natural gas are under
growing pressure, with additions to supply failing to keep up with
rapidly growing demand. Further advances in prices of residual fuels
(up more than 5 per cent in July) are likely as demand increases
while supply and distribution problems persist.
On the other hand, the metals and metal products group
declined for the first time in over a year and one-half, as nonferrous
metals prices fell for the second successive month--reflecting cuts
for lead and copper mill products. Since mid-July, further cuts
have been made in the prices of brass mill products as a result of a
drop in price for dealer copper and in reaction to increased
competition from imports. Dealer copper and copper scrap were recently
selling for less than producer copper--for the first time in seven
years. The price of lead was reduced recently by another 1/2 cent
a pound, following by about a month a cut in July. Steel scrap
receded somewhat from recent high levels, probably reflecting lower
operating rates in the steel industry. Lumber and wood products
prices declined further in July as did prices of hides and skins
and crude natural rubber.

II - 29
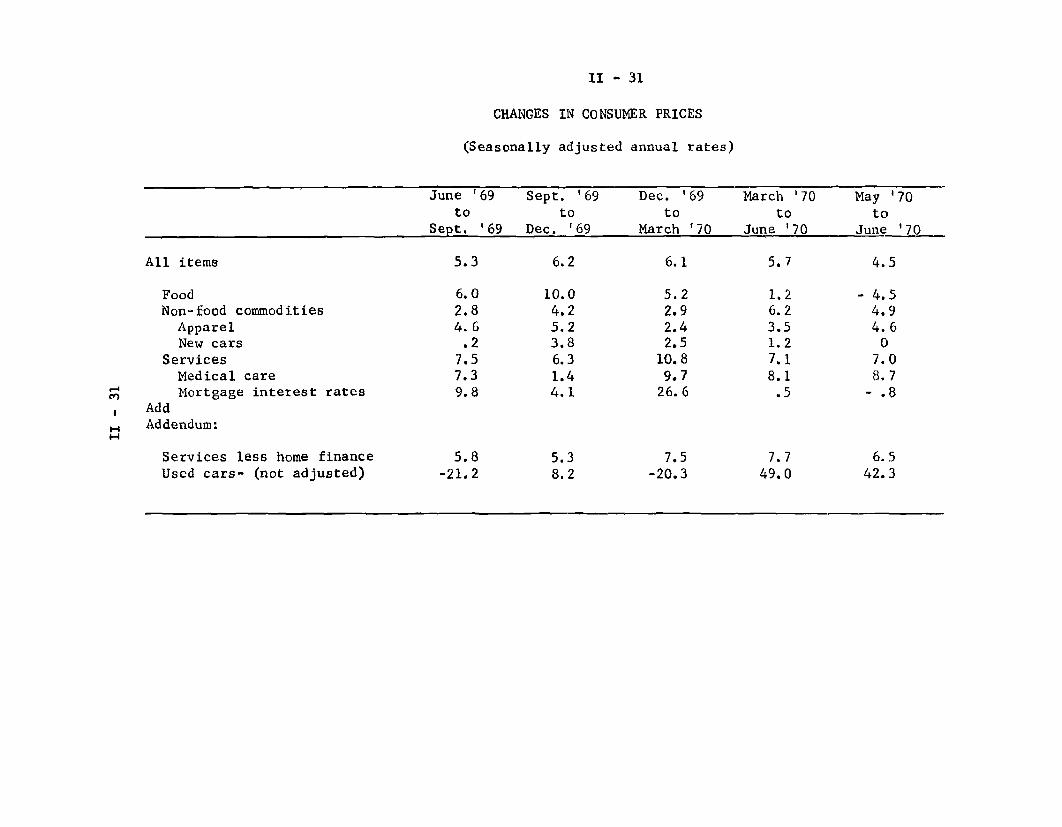
Consumer prices. The slower rise in the CPI over the second
quarter was mainly attributable to a much more moderate rise in food
prices than earlier and to a leveling off in mortgage interest rates,
which had risen very sharply in the first quarter. Indeed, both seasonally
adjusted food prices and mortgage interest rates declined in June. However,
there was little change through midyear in the basic trend of retail
prices of non-food commodities or of service costs. The 7 per cent
rate of increase in service prices in the second quarter was close
to the average for last year--when interest costs were rising
rapidly.
Despite the fact that a seasonal (or perhaps more than
seasonal) increase in food prices will probably show up in the July
CPI a tendency toward stability in prices of foods for home use is
likely in the second half of the year, reflecting rising supplies
of such important foods as pork, poultry, eggs, and potatoes. Such
a leveling off would tend to moderate the advance in consumer prices,
even if services and non-food commodities should continue to rise
at recent rates.
The acceleration in non-food commodity prices last quarter
(and in June) mainly reflects large jumps in used car prices. New
car prices have been fairly stable; apparel price increases speeded
up since last quarter from the first quarter pace, when price
increases were exceptionally small owing to January sales.
II - 30
Used car prices may decline soon, if last year's experience
is any guide. Last year, after a spectacular rise between January
and April, such prices started down and lost most of the previous
gain by early this year. (This series is too short for seasonal
adjustment.) On the other hand, the fall rise in new car prices
will probably be larger this year than last. The nominal rise,
judging from the Ford announcement, will not only be larger, but in
addition, the service warranty is being withdrawn adding to the price
increase after allowance for quality change.
II - 31
CHANGES IN CONSUMER PRICES
(Seasonally adjusted annual rates)
June '69 Sept. '69 Dec. '69 March '70 May '70to to to to to
Sept. '69 Dec. '69 March '70 June '70 June '70
All items 5.3 6.2 6.1 5.7 4.5
Food 6.0 10.0 5.2 1.2 - 4.5Non-food commodities 2.8 4.2 2.9 6.2 4.9
Apparel 4.6 5.2 2.4 3.5 4.6New cars .2 3.8 2.5 1.2 0
Services 7.5 6.3 10.8 7.1 7.0Medical care 7.3 1.4 9.7 8.1 8.7Mortgage interest rates 9.8 4.1 26.6 .5 - .8
AddAddendum:
Services less home finance 5.8 5.3 7.5 7.7 6.5Used cars- (not adjusted) -21.2 8.2 -20.3 49.0 42.3
II - 32
Price indexes for the GNP. The GNP implicit price
deflator rose at an annual rate of 4.9 per cent in the fourth
quarter of 1969 and at a rate of 6.4 per cent in the first quarter
of 1970. But the increase in the second quarter was down to 4.2
per cent, a rate considerably below the average for 1969. While
the retroactive Federal government pay increase accounts in large
part for the step up in the first quarter, the deflator for the private
economy (which excludes government salaries) also shows a pattern
similar to the overall deflator--from a rise of 5.3 per cent
in the first quarter and 4.1 per cent in the second. This pattern
of change in the implicit deflator in the past two quarters reflects
in the main shifts in the composition of the GNP rather than a
changing rate of price increase.
The implicit deflator was not designed to measure price
changes but is rather a byproduct of the transaction of current
dollar GNP to constant dollar GNP. The implicit weights are,
in concept, current period quantities valued at base year (1958)
prices; the weights thus change--to a varying degree--from
quarter to quarter. Shifts in weights towards components that have
increased more rapidly in price since 1958 result in a higher index
than would fixed weights and vice versa. Thus, changes in the defla-
tor are to a varying extent independent of current price movements.
For example, autos have increased relatively little in price since
1958, and are consequently deflated by an index of only 107,
II - 33
compared with an index of 134 for the GNP as a whole and indexes
as high as 139 for consumer services and 148 for non-residential
construction. When consumer demand for autos declines as a propor-
tion of GNP, as it did in the first quarter, the rate of increase
in the overall GNP deflator is raised on this account. The
increase in the implicit GNP deflator in the first quarter would
have been 6.0 per cent instead of 6.4 per cent if auto purchases
had been the same percentage of GNP as in the fourth quarter.
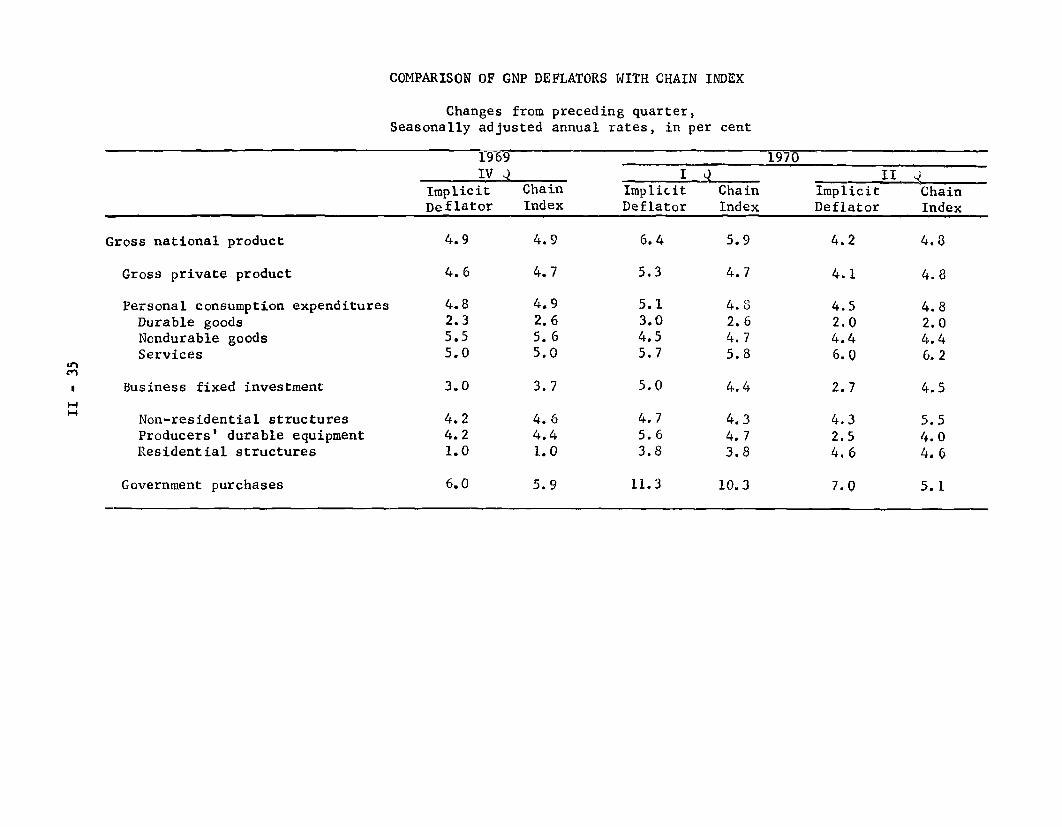
The OBE has supplied us with confidential estimates of
1/price change for the GNP based on chain weights.- These are
useful for comparing prices in two adjacent quarters since they
measure the quarterly change in prices assuming that the composi-
tion of expenditures in the second quarter is unchanged from the
2/actual composition in the first.-
1/ For a detailed account of the GNP implicit deflator and comparisonswith fixed weight and chain indexes in 1965-1968, see "AlternativeMeasures of Price Change for GNP" by Allen H. Yound and ClaudiaMarkins, Survey of Current Business, March, 1969.
It should be noted that this article commented as follows: "Theimplicit deflator for the GNP has increased at the same rateas fixed weighted prices indexes over the past 3 years [IV-1965 toIV-1968]. Within this span, however, the alternative pricemeasures have on occasion moved differently from the delator."
2/ A chain-weighted price index differs from a fixed base-year-weighted index such as the CPI and WPI. For a change betweentwo adjacent quarters, the two indexes would be equivalent ifthe composition of expenditures in the first of the two quarterswere the same as in the base year of the fixed weighted index.

II - 34
As may be seen in the table, the rates of increase of the
chain-weighted price index for the gross private product show a
fairly steady price increase over the last three quarters, at an
annual rate of 4.7 - 4.8 per cent.
COMPARISON OF GNP DEFLATORS WITH CHAIN INDEX
Changes from preceding quarter,Seasonally adjusted annual rates, in per cent
1969 1970IV __I _ II _
Implicit Chain Implicit Chain Implicit ChainDeflator Index Deflator Index Deflator Index
Gross national product 4.9 4.9 6.4 5.9 4.2 4.8
Gross private product 4.6 4.7 5.3 4.7 4.1 4.8
Personal consumption expenditures 4.8 4.9 5.1 4.8 4.5 4.8Durable goods 2.3 2.6 3.0 2.6 2.0 2.0Nondurable goods 5.5 5.6 4.5 4.7 4.4 4.4Services 5.0 5.0 5.7 5.8 6.0 6.2
Business fixed investment 3.0 3.7 5.0 4.4 2.7 4.5
Non-residential structures 4.2 4.6 4.7 4.3 4.3 5.5Producers' durable equipment 4.2 4.4 5.6 4.7 2.5 4.0Residential structures 1.0 1.0 3.8 3.8 4.6 4.6
Government purchases 6.0 5.9 11.3 10.3 7.0 5.1
-L
II - 36
Farm production prospects. The crop report released at
3:00 p.m. on August 11 can be expected to spark a mildly bullish
reaction in future markets even though the small declines in
prospects for feed grains and soybeans were not entirely unexpected.
Based on August 1 conditions, the corn crop is forecast at 4.7
billion bushels, 3 per cent above last year's record but 3 per
cent below the July 1 forecast. Output of the four feed grains is
expected to be about the same as last year and possibly a little
less than anticipated utilization if exports equal those of last
year. A soybean crop of 1.1 billion bushels, nearly the same as
last year, is forecast.
The index of total crop output is forecast at 121 (1957-59
= 100), the same as last year's record and yields are down a little,
as shown in the table. Aside from the close balance in supply and
demand prospects for feed grains and soybeans, August 1 prospects
are relatively favorable. Smaller food grains and processing
vegetable crops reflect planned adjustments to prospective needs.
In the south, a 10 per cent larger cotton crop is in prospect
and a record peanut crop. Tobacco is expected to equal last year's
output.
Prospects are mixed for the fresh market crops which have
a direct impact on retail prices. Summer vegetable and melon crops
are larger than last year. Marketings from the short early summer
potato crop will soon be supplemented by the more ample late summer

II - 37
crop. Output of sweet potatoes is smaller than last year and so
is output of nearly all of the deciduous fruits. Plentiful citrus
fruits are in prospect for the 1970/71 season starting in September.
Total output of farm products in 1970 is expected to
top last year's record by a narrow margin if the August 1 crop
forecast is realized. But much of the critical growing season lies
ahead and substantial changes between the August 1 forecast and the
final harvest may occur. Record livestock output seems to be assured.
Liveweight production of meat animals is estimated to be 5 per cent
larger than last year but it should be pointed out that marketings
for slaughter (another concept) will be up a little less than 2
per cent. More turkeys and broilers are being raised this year
than last and egg production will average above last year if
anticipated increases in the latter part of the year occur. Milk
production is likely to remain the same as in 1968 and 1969.
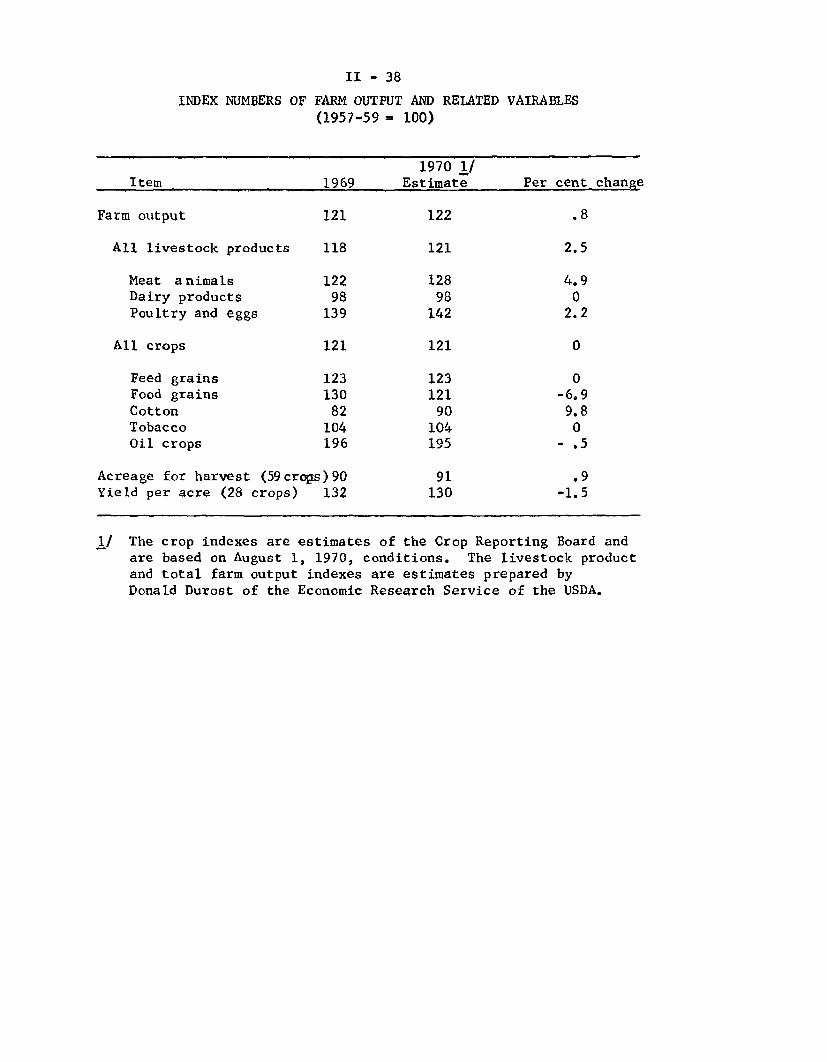
INDEX NUMBERS OF
II - 38
FARM OUTPUT AND RELATED VAIRABLES(1957-59 = 100)
1970 1/Item 1969 Estimate Per cent change
Farm output 121 122 .8
All livestock products 118 121 2.5
Meat animals 122 128 4.9Dairy products 98 98 0Poultry and eggs 139 142 2.2
All crops 121 121 0
Feed grains 123 123 0Food grains 130 121 -6.9Cotton 82 90 9.8Tobacco 104 104 0Oil crops 196 195 - .5
Acreage for harvest (59crops)90 91 .9Yield per acre (28 crops) 132 130 -1.5
1/ The crop indexes are estimates of the Crop Reporting Board andare based on August 1, 1970, conditions. The livestock productand total farm output indexes are estimates prepared byDonald Durost of the Economic Research Service of the USDA.

II-C 1 8/11/70
ECONOMIC DEVELOPMENTS - UNITED STATESSEASONALLY ADJUSTED, RATIO SCALE
GNP INCREASE BIL$ EMPLOYMENT ESTAB BASIS MILLIONSOFPERSONSANNUAL RATEARITHMETIC SCALE CURRENT $
on 10o - 20 - 70
NONAGRICULTURALJULY 70 5 - 65
I 21MANUFACTURINGJULY 194
PER CENTANNUAL RATE 19ARITHMEIC SCALE 19 8 I
Su 0 3 HOURS
WORKWEEK-MFG. - 42+ JULY 39 9
S - - 40
1968 1970 1968 1970
INDUSTRIAL PRODUCTION- I 1957-59=100 UNEMPLOYMENT RATES PERCENTARITHMETIC SCALE
-200
TOTAL 4
TOTAL JULY 5JULY 1692
5INSUREDCONSUMER GOODS 150INSUREDJULY 1633 JUNE
2
1I Ii i II 1 (1LL L I f Il I I I I--
1968 1970
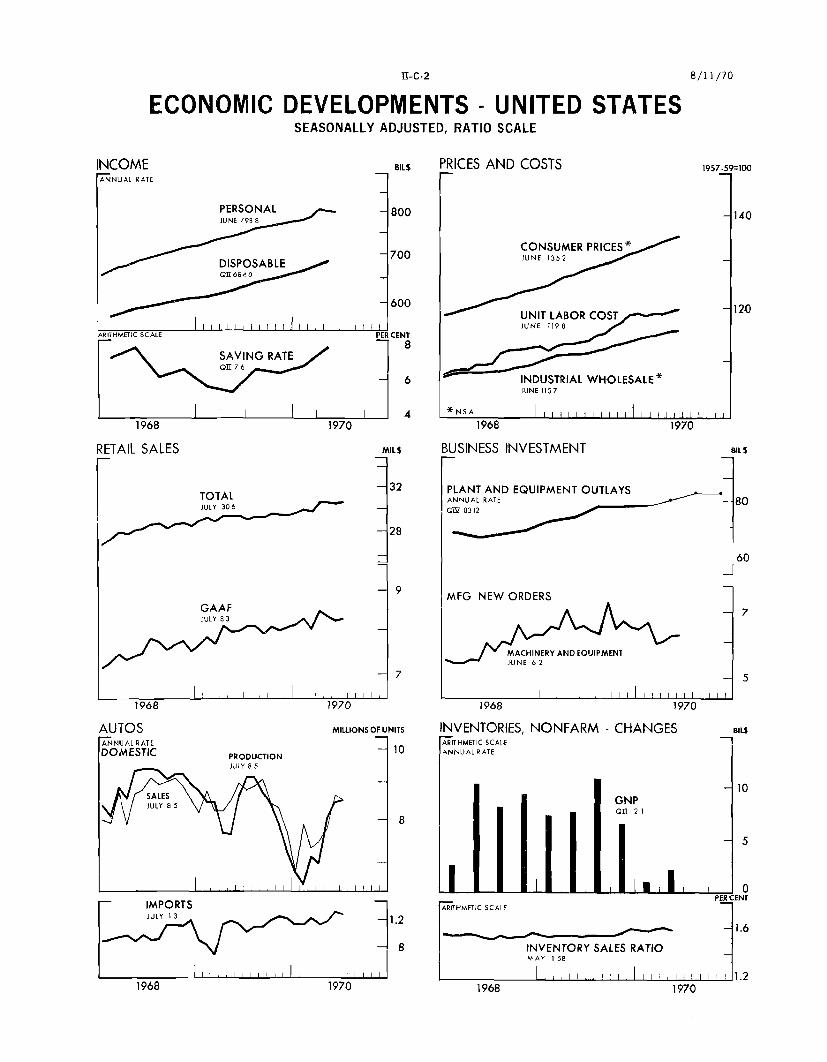
ECONOMIC DEVELOPMENTS - UNITED STATESSEASONALLY ADJUSTED, RATIO SCALE
INCOMEANNUAL RATE
PERSONALJUNE 798 8
SDISPOSABLE^^ O1T 6 8<1 dO
I I I I I 1 II I IARITHMETIC SCALE PEI
SAVING RATE
1968 1970
RETAIL SALES MILS
-32TOTALJULY 306
GAAFJULY 83
1968 1970
BILS PRICES AND COSTS 1957-59=100
INDUSTRIAL WHOLESALE*JUNE 1157
*NSA SI I I I I I 1 I I I i I I II I I I I
1968 1970
BUSINESS INVESTMENT BILS
PLANT AND EQUIPMENT OUTLAYSANNUAL RATE80
60
8312
60
MFG NEW ORDERS
MACHINERY AND EOUIPMENTJUi NE 62
1 I 1 1 1 III I I I
AUTOSANNUAL RATE
IDOMESTIC PRODUCTIONJULY 8 5
IMPORTSJULY 1 3
...... i l I II
MILLIONS OF UNITS
- 10
-1.2
- 8
I i
INVENTORIES, NONFARM - CHANGESARITHMETIC SCALEANNUAL RATE
GNPOn1 21
I, I .PER
RITHMETIC SCALE
INVENTORY SALES RATIOMAY 1 58
1 , . , i I l 1 1 1 1 1I I I I l
1970 1968
I I I I I I
11-C-2 8/11/70
I I I ' I
, , , 1 1 , ,r i i I
1970

III - 1
THE ECONOMIC PICTURE IN DETAIL
Domestic Financial Situation
Monetary aggregates. The money supply increased at a 4.1 per
cent annual rate in July, close to the average rate of increase during
the second quarter of the year. Money balances ballooned in the first
two weeks of the month (presumably in part reflecting a buildup in
response to the abrupt shift of investors away from the commercial
paper market) receded sharply during the middle of the month, then
advanced again toward month-end.
MONETARY AGGREGATES(Seasonally adjusted percentage changes, at annual rates
1970QI QIIp June July
Money stock 3.8 4.2 -1.8 4.1
Commercial bank time andsavings deposits .4 13.8 8.4 35.2
Member bank deposits .6 6.0 5.8 22.3
Member bank deposits plusnondeposit sources 2/ .5 6.5 7.0 18.1
1/ Based on monthly average of daily figures for deposits and monthlyaverage of weekly figures for nondeposit funds. Quarterly changesare calculated from the average amounts outstanding in the last monthof each quarter.
2/ Includes all deposits subject to reserve requirements plus thefollowing nondeposit sources: commercial paper issued by a holdingcompany or bank affiliate; loans or participation in pools of loanssold under repurchase agreement to other than banks and other thanbanks' own affiliates or subsidiaries; Euro-dollars borrowed directlythrough brokers or dealers; liabilities to banks' own branches inU.S. territories and possessions; and liabilities to banks' ownforeign branches.
p--preliminary
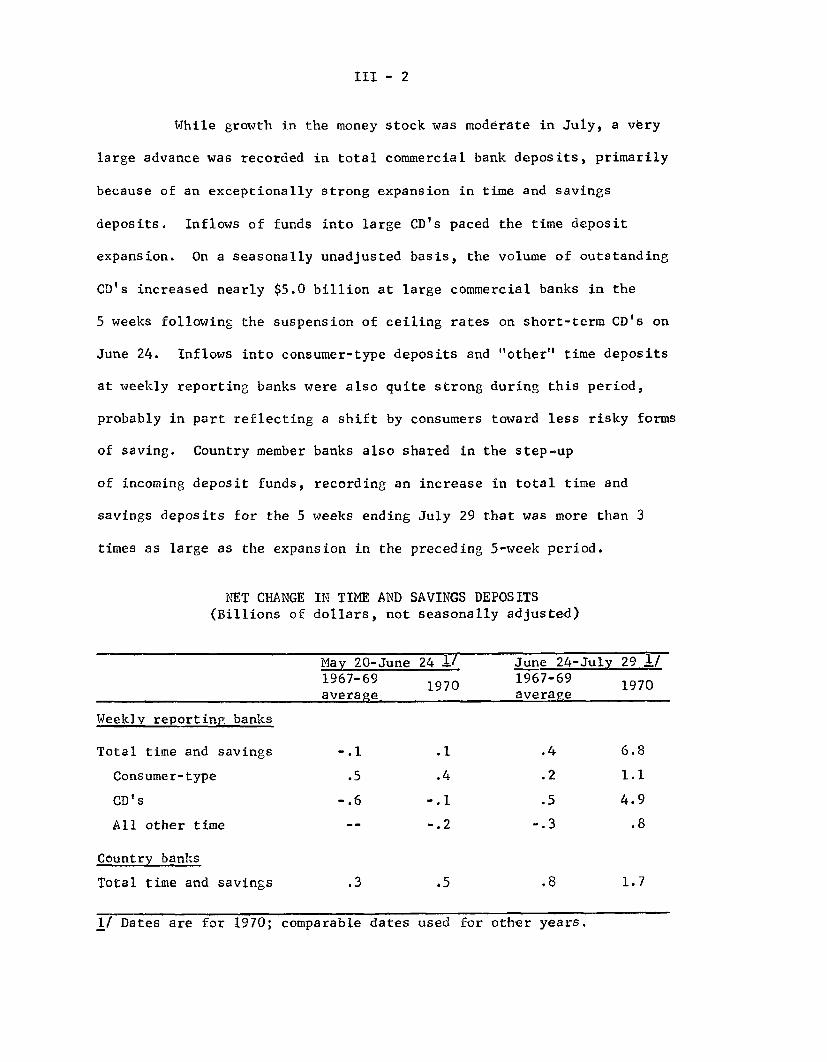
III - 2
While growth in the money stock was moderate in July, a very
large advance was recorded in total commercial bank deposits, primarily
because of an exceptionally strong expansion in time and savings
deposits. Inflows of funds into large CD's paced the time deposit
expansion. On a seasonally unadjusted basis, the volume of outstanding
CD's increased nearly $5.0 billion at large commercial banks in the
5 weeks following the suspension of ceiling rates on short-term CD's on
June 24. Inflows into consumer-type deposits and "other" time deposits
at weekly reporting banks were also quite strong during this period,
probably in part reflecting a shift by consumers toward less risky forms
of saving. Country member banks also shared in the step-up
of incoming deposit funds, recording an increase in total time and
savings deposits for the 5 weeks ending July 29 that was more than 3
times as large as the expansion in the preceding 5-week period.
NET CHANGE IN TIME AND SAVINGS DEPOSITS(Billions of dollars, not seasonally adjusted)
May 20-June 24 17 June 24-July 29 1/1967-69 170 1967-69 1970average average
Weekly reporting banks
Total time and savings -.1 .1 .4 6.8
Consumer-type .5 .4 .2 1.1
CD's -. 6 -. 1 .5 4.9
All other time -- -. 2 -. 3 .8
Country banks
Total time and savings .3 .5 .8 1.7
1/ Dates are for 1970; comparable dates used for other years.

III - 3
Commercial banks used part of their incoming deposit funds to
reduce other liabilities in July and the credit proxy adjusted for non-
deposit sources increased at a somewhat slower pace than total member
bank deposits. The main decline was in bank borrowing from foreign
branches, but borrowing from other sources outside the U.S. was also
reduced and loan RP's continued to edge downward. Outstanding commer-
cial paper issued by holding companies and affiliates declined during
the early part of the month, extending a downtrend prevailing since
early June, but this trend was reversed as the month progressed, and on
balance bank-related commercial paper indebtedness showed a fairly
strong increase for the month.
Bank credit. Commercial bank credit adjusted for loan sales
to affiliates and subsidiaries rose sharply in July after having
remained essentially unchanged in June. Substantial acquisitions of
U.S. Treasury securities, an unusually large rise in loans to finance
companies, and an increase in loans to security dealers were primarily
responsible for the step-up in bank credit growth. In contrast to
these developments, acquisitions of other security holdings remained
moderate, as in other recent months, and comparatively small gains were
recorded in business, real estate and consumer loans.
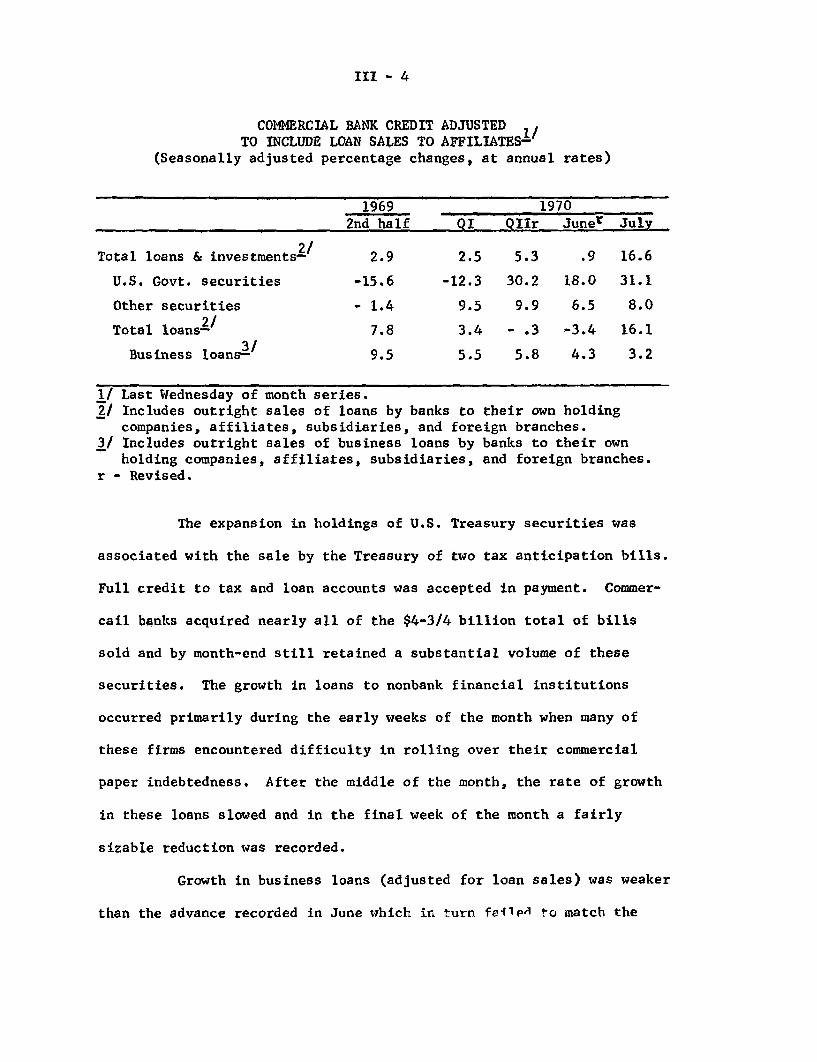
III - 4
COMMERCIAL BANK CREDIT ADJUSTED ./TO INCLUDE LOAN SALES TO AFFILIATES-
(Seasonally adjusted percentage changes, at annual rates)
1969 19702nd half QI QIIr Juner July
2/Total loans & investments- 2.9 2.5 5.3 .9 16.6
U.S. Govt. securities -15.6 -12.3 30.2 18.0 31.1
Other securities - 1.4 9.5 9.9 6.5 8.0
Total loans2/ 7.8 3.4 - .3 -3.4 16.1
3'Business loans- 9.5 5.5 5.8 4.3 3.2
1/ Last Wednesday of month series.2/ Includes outright sales of loans by banks to their own holding
companies, affiliates, subsidiaries, and foreign branches.3/ Includes outright sales of business loans by banks to their own
holding companies, affiliates, subsidiaries, and foreign branches.r - Revised.
The expansion in holdings of U.S. Treasury securities was
associated with the sale by the Treasury of two tax anticipation bills.
Full credit to tax and loan accounts was accepted in payment. Commer-
call banks acquired nearly all of the $4-3/4 billion total of bills
sold and by month-end still retained a substantial volume of these
securities. The growth in loans to nonbank financial institutions
occurred primarily during the early weeks of the month when many of
these firms encountered difficulty in rolling over their commercial
paper indebtedness. After the middle of the month, the rate of growth
in these loans slowed and in the final week of the month a fairly
sizable reduction was recorded.
Growth in business loans (adjusted for loan sales) was weaker
than the advance recorded in June which in turn failed to match the
III - 5
average rate of growth recorded for the second quarter as a whole. The
continued weakness displayed by July loan data appears particularly
significant in view of the fillup to business loan demand provided by
refinancings of commercial paper, some of which appears to have
involved nonfinancial firms. An easing in business loan demand, how-
ever, is hardly surprising in view of the slowdown in economic activity.
Rates of change in business loans have lagged behind changes in general
economic activity in other post-war periods of economic slack, although
the exact timing has not been predictable. Moreover, the recent slowing
seems consistent with the modest rate of inventory investment, heavy
corporate borrowing in the bond market, and growing indication of a cut-
back in business spending on fixed investment.
Other short-term credit markets. Outstanding commercial
paper continued to decline during July. While we do not have data for
the last two days of the month, a preliminary estimate suggests a
seasonally adjusted decline of $1.4 billion in outstandings in July, as
compared with a drop of $993 million in June. Seasonally unadjusted
data, however, show an overall July decrease of about $200 million in
outstandings as compared with a fall of $1.9 billion in June.
Dealers report that the market is still wary of anything other
than top-rated paper. Large finance companies generally have had no
difficulty in rolling over their maturing paper and in some cases they
have picked up sizable amounts of new money. But in the dealer-placed
market those firms with lower-grade paper outstanding are being encouraged

III - 6
to line up alternative sources of financing. Dealers have in some
cases bought back paper, and dealer holdings may decline for a few more
weeks as such paper matures.
Rates on commercial paper, finance paper and bankers' accept-
ances maturing in 30 days or less fell 25 basis points from July 22 to
August 5, after rising in the first part of July. Some reduction in
rates has also been visible in daily quotations on other maturities of
commercial paper and finance paper. This softening has occurred in con-
junction with the downward movement in rates on 60-89 day certificates
of deposit. The spread between commercial and finance paper, on the
one hand, and Treasury bills on the other had become particularly wide
around midyear, but has narrowed again recently as bill rates have
moved up partly under the weight of heavy dealer positions arising from
the Treasury tax bill financings in July.
COMMERCIAL AND FINANCE COMPANY PAPER(End-of-month data, in millions of dollars)
1/May June July-
Amounts outstandingTotal commercial and
finance paper 2/ 39,503 38,510p 37,102e
Bank related 3/ 7,465 7,468 7,713pNonbank related 4/
Placed through dealers 12,969 12,486p 11,658ePlaced directly 19,069 18,556p 17,731e
Total commercial and Net changefinance paper 2/ 1,227 -9 93p -1,408e
Bank related 3/ 923 3 245pNonbank related 4/
Placed through dealers 808 -483p -828ePlaced directly -504 -513p -825e
e/ Estimated. 2/ Preliminary.1/ Weekly data. The end-of-month data, for other than bank related, will
differ somewhat from the July 29 data because of the 2 day differencein dating.
2/ Combines seasonally adjusted nonbank-related paper and seasonallyunadjusted bank-related paper.
3/ Seasonally unadjusted. 4/ Seasonally adjusted.
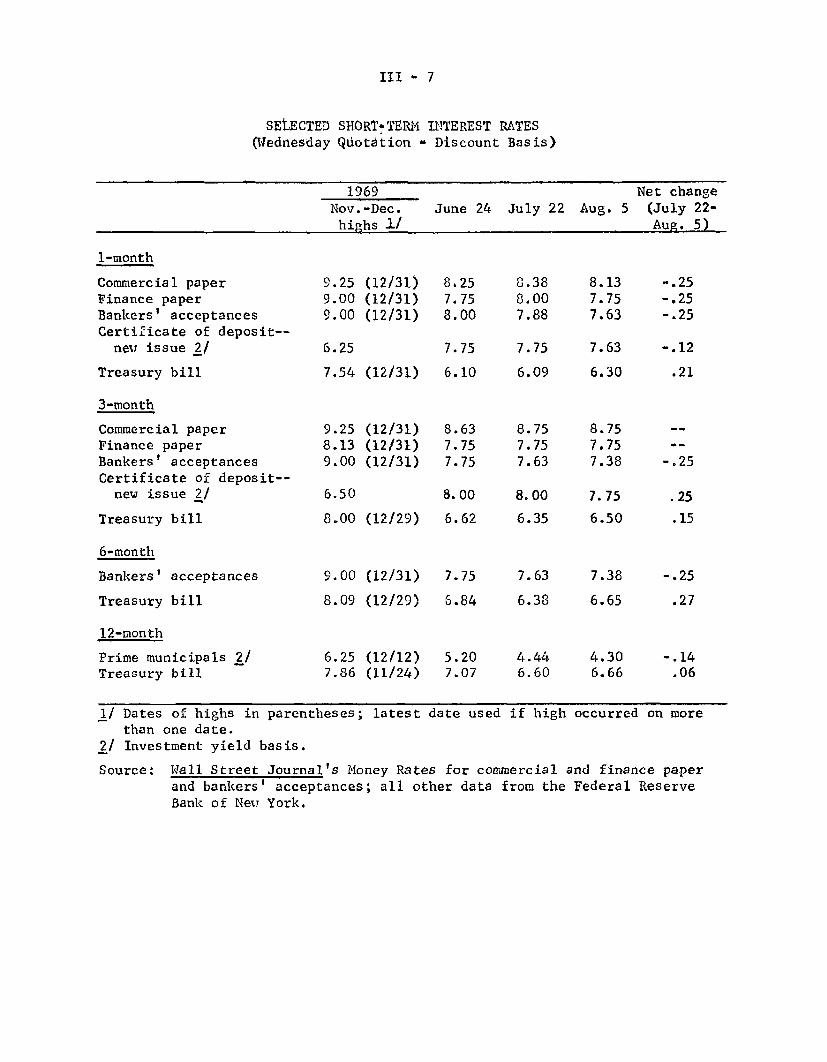
III - 7
SELECTED SHORT-TERM INTEREST RATES(Wednesday Quotation - Discount Basis)
1969 Net changeNov.-Dec. June 24 July 22 Aug. 5 (July 22-
highs 1/ Aug. 5)
1-month
Commercial paper 9.25 (12/31) 8.25 8.38 8.13 -.25Finance paper 9.00 (12/31) 7.75 8.00 7.75 -.25Bankers' acceptances 9.00 (12/31) 8.00 7.88 7.63 -.25Certificate of deposit--
new issue 2/ 6.25 7.75 7.75 7.63 -.12
Treasury bill 7.54 (12/31) 6.10 6.09 6.30 .21
3-month
Commercial paper 9.25 (12/31) 8.63 8.75 8.75Finance paper 8.13 (12/31) 7.75 7.75 7.75Bankers' acceptances 9.00 (12/31) 7.75 7.63 7.38 -.25Certificate of deposit--
new issue 2/ 6.50 8.00 8.00 7.75 .25
Treasury bill 8.00 (12/29) 6.62 6.35 6.50 .15
6-month
Bankers' acceptances 9.00 (12/31) 7.75 7.63 7.38 -.25
Treasury bill 8.09 (12/29) 6.84 6.38 6.65 .27
12-month
Prime municipals 2/ 6.25 (12/12) 5.20 4.44 4.30 -.14Treasury bill 7.86 (11/24) 7.07 6.60 6.66 .06
1/ Dates of highs in parentheses; latest date used if high occurred on morethan one date.
2/ Investment yield basis.
Source: Wall Street Journal's Money Rates for commercial and finance paperand bankers' acceptances; all other data from the Federal ReserveBank of New York.
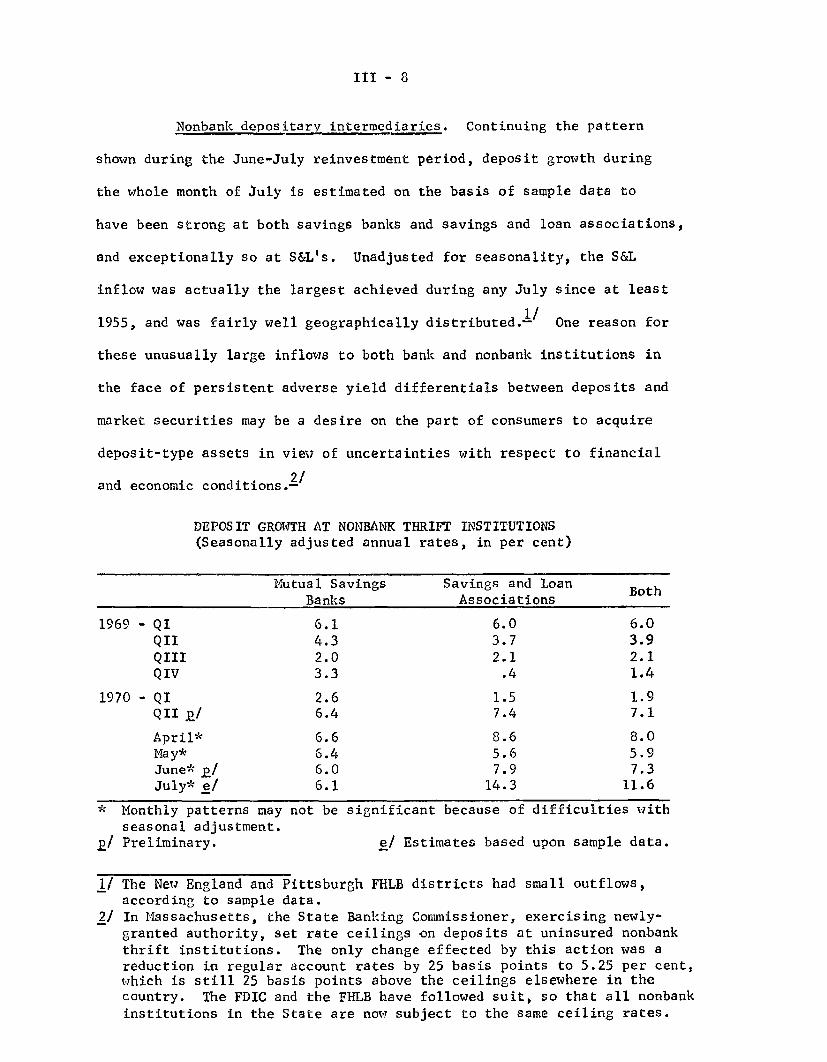
III - 8
Nonbank depositary intermediaries. Continuing the pattern
shown during the June-July reinvestment period, deposit growth during
the whole month of July is estimated on the basis of sample data to
have been strong at both savings banks and savings and loan associations,
and exceptionally so at S&L's. Unadjusted for seasonality, the S&L
inflow was actually the largest achieved during any July since at least
1955, and was fairly well geographically distributed. / One reason for
these unusually large inflows to both bank and nonbank institutions in
the face of persistent adverse yield differentials between deposits and
market securities may be a desire on the part of consumers to acquire
deposit-type assets in view of uncertainties with respect to financial
2/and economic conditions.2
DEPOSIT GROWTH AT NONBANK THRIFT INSTITUTIONS(Seasonally adjusted annual rates, in per cent)
Mutual SavingsBanks
1969 - QI 6.1QII 4.3QIII 2.0QIV 3.3
1970 - QI 2.6QII P/ 6.4
April* 6.6May* 6.4June* J/ 6.0July* e/ 6.1
* Monthly patterns may not be signiseasonal adjustment.
P/ Preliminary. e
Savings and Loan BothBoth
Associations
6.0 6.03.7 3.92.1 2.1
.4 1.4
1.5 1.97.4 7.1
8.6 8.05.6 5.97.9 7.3
14.3 11.6
ficant because of difficulties with
/ Estimates based upon sample data.
1/ The New England and Pittsburgh FHLB districts had small outflows,according to sample data.
2/ In Massachusetts, the State Banking Commissioner, exercising newly-granted authority, set rate ceilings on deposits at uninsured nonbankthrift institutions. The only change effected by this action was areduction in regular account rates by 25 basis points to 5.25 per cent,which is still 25 basis points above the ceilings elsewhere in thecountry. The FDIC and the FHLB have followed suit, so that all nonbank
institutions in the State are now subject to the same ceiling rates.

III - 9
The general improvement in savings and loan associations'
deposit growth that has been maintained since February has afforded them
the opportunity to rebuild liquidity. In sharp contrast to the previous
two years, their total liquid assets increased during the first half of
this year by $1.5 billion--nearly all of which represented Agency issues.
Correspondingly, S&L borrowing activity has been very modest--and con-
tinued so during July--although repayments have been minimized by the
FHLBB's subsidization of rates on advances guaranteed to remain outstand-
ing for at least one year. New mortgage commitments were made at an
advanced pace during May and June, but the net increase in mortgages has
not yet reflected all of this buildup.
INSURED SAVINGS AND LOAN ASSOCIATIONSSources and Uses of Funds
(Billions of dollars, not seasonally adjusted)
First Quarter Second Quarter1968 1969 1970 1968 1969 1970
Sources
Deposit accounts net 1/ 1.6 1.8 .4 2.0 1.4 2.7Borrowed funds net -.2 -.1 .3 .7 1.1 .5
Subtotal 1.4 1.7 .7 2.7 2.5 3.2Gross mortgage repayments 3.4 3.4 3.0 3.7 3.8 3.4Other sources net 2/ .8 1.0 .4 -. 2 .1 .1
Total 5.6 6.1 4.1 6.2 6.4 6.7
Uses
Cash and Governments net .2 .2 -.2 -- -.7 .3Other liquid assets net 3/ .3 .4 .7 -.1 -- .7Gross mortgage acquisitions 5.1 5.5 3.6 6.3 7.1 5.7
Total 5.6 6.1 4.1 6.2 6.4 6.7
Memo: Net increase inmortgages 1.7 2.1 .6 2.6 3.3 2.3
1/ Includes interest credited.2/ Includes the net changes in loans in process, reserves and surplus, and
accrual of dividends. Netted out from that total are the net changesin other uses of funds.
3/ Reflects primarily Federal Agency issues, but also includes time CD'sand State and local government securities.
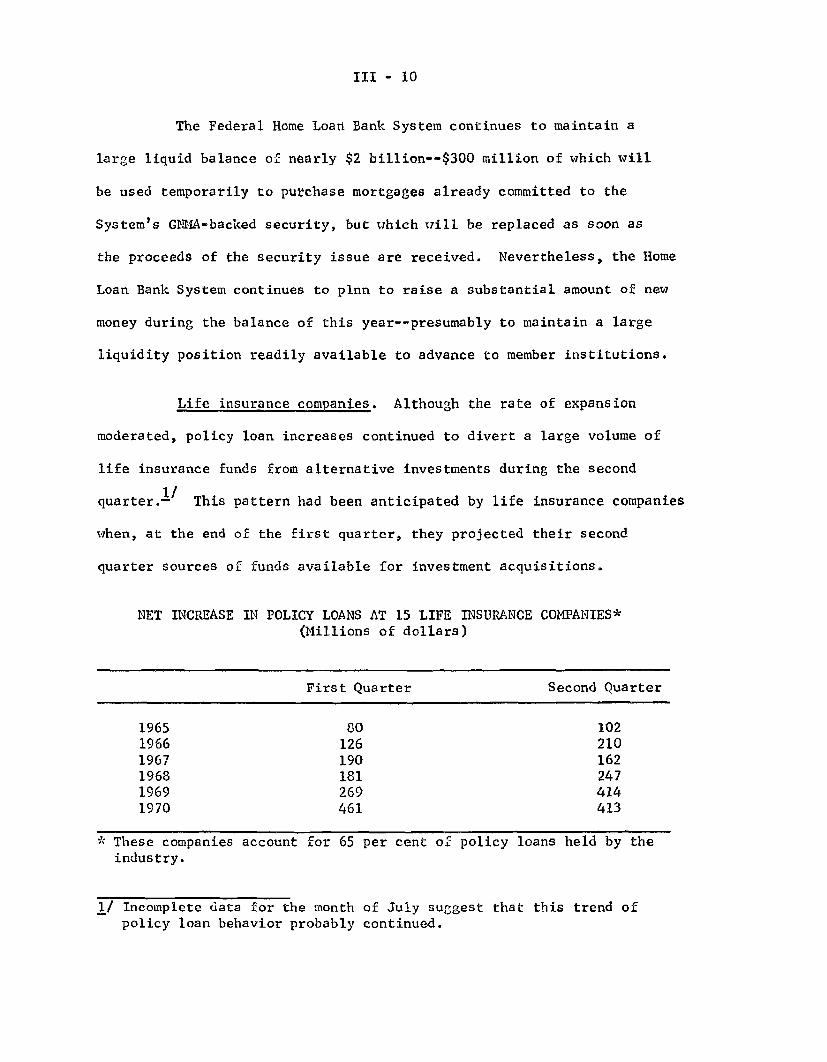
III - 10
The Federal Home Loan Bank System continues to maintain a
large liquid balance of nearly $2 billion--$300 million of which will
be used temporarily to purchase mortgages already committed to the
System's GNMA-backed security, but which will be replaced as soon as
the proceeds of the security issue are received. Nevertheless, the Home
Loan Bank System continues to plnn to raise a substantial amount of new
money during the balance of this year--presumably to maintain a large
liquidity position readily available to advance to member institutions.
Life insurance companies. Although the rate of expansion
moderated, policy loan increases continued to divert a large volume of
life insurance funds from alternative investments during the second
1/quarter.- This pattern had been anticipated by life insurance companies
when, at the end of the first quarter, they projected their second
quarter sources of funds available for investment acquisitions.
NET INCREASE IN POLICY LOANS AT 15 LIFE INSURANCE COMPANIES*(Millions of dollars)
First Quarter Second Quarter
1965 80 1021966 126 2101967 190 1621968 181 2471969 269 4141970 461 413
* These companies account for 65 per cent of policy loans held by theindustry.
1/ Incomplete data for the month of July suggest that this trend ofpolicy loan behavior probably continued.
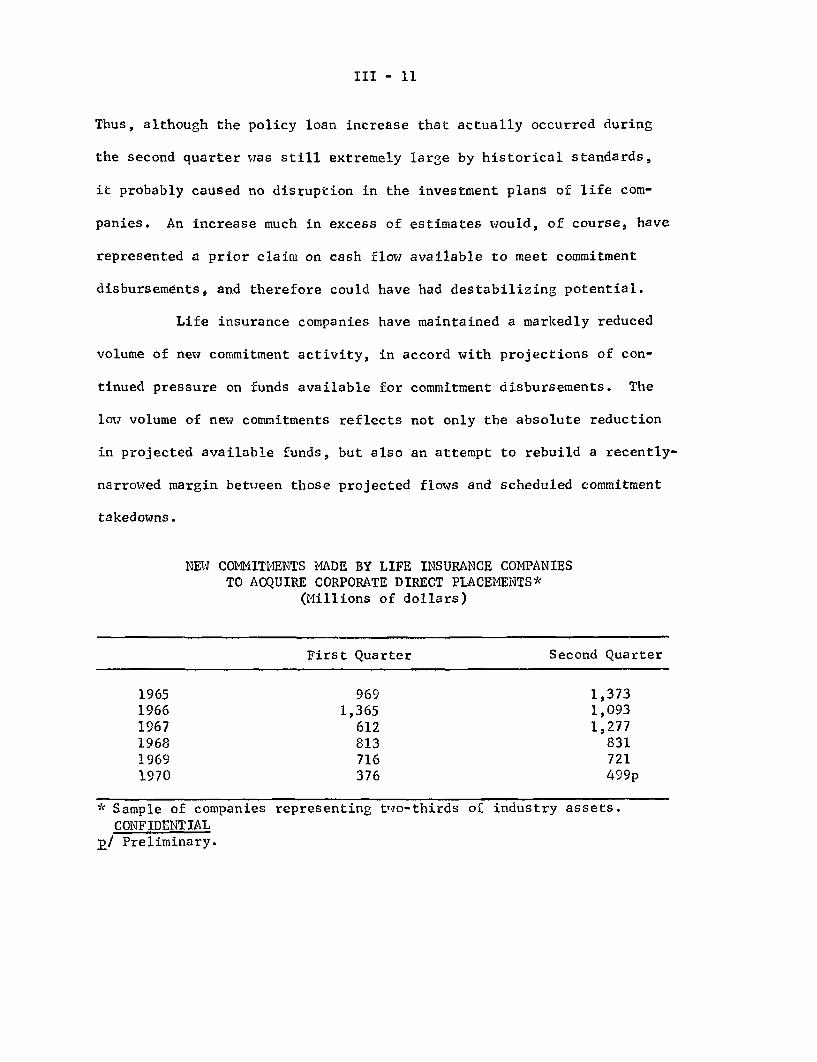
III - 11
Thus, although the policy loan increase that actually occurred during
the second quarter was still extremely large by historical standards,
it probably caused no disruption in the investment plans of life com-
panies. An increase much in excess of estimates would, of course, have
represented a prior claim on cash flow available to meet commitment
disbursements, and therefore could have had destabilizing potential.
Life insurance companies have maintained a markedly reduced
volume of new commitment activity, in accord with projections of con-
tinued pressure on funds available for commitment disbursements. The
low volume of new commitments reflects not only the absolute reduction
in projected available funds, but also an attempt to rebuild a recently-
narrowed margin between those projected flows and scheduled commitment
takedowns.
NEW COMMITMENTS MADE BY LIFE INSURANCE COMPANIESTO ACQUIRE CORPORATE DIRECT PLACEMENTS*
(Millions of dollars)
First Quarter Second Quarter
1965 969 1,3731966 1,365 1,0931967 612 1,2771968 813 8311969 716 7211970 376 4 9 9p
* Sample of companies representing two-thirds of industry assets.
CONFIDENTIALp/ Preliminary.
III - 12
Mortgage market. With net savings flows exceptionally strong
last month, the availability of mortgage funds probably increased
further, although July data on nonbank thrift institution lending com-
mitments are not yet available.
During the second quarter, there was a modest upturn in net
mortgage debt formation to a seasonally adjusted annual rate of around
$23 billion--the first increase in 5 quarters. While net expansion in
outstanding residential mortgage debt was still unusually low and failed
to recoup fully the first-quarter decline, it apparently accounted for
all of the rise in the second-quarter total. Savings and loan associa-
tions, bolstered by improved deposit flows, accounted for most of the
seasonally adjusted increase in net residential mortgage lending, in
contrast to the quite depressed first-quarter performance for this
important lender group. With new mortgage commitments rising sharply at
S&L's, by the end of June the backlog of their outstanding commitments
available for takedown in the future reached the highest level in 8
months. Although FNMA's net addition to its mortgage portfolio remained
quite large in the second quarter, it was below earlier peaks. Mean-
while, net expansion in the mortgage portfolios of other major lender
groups, including commercial banks, generally continued limited.

III - 13
NET MORTGAGE DEBT FORMATION(Billions of dollars, seasonally adjusted annual rates)
1969 1970QI QII QIII QIV QI QIIp
Total 30.4 28.5 27.0 25.6 20.7 22.8
Type of Property
Residential 22.1 21.2 20.0 18.6 14.2 16.7
Nonresidential 8.3 7.3 7.1 7.1 6.5 6.1
Type of Holder
Savings and loan asso. 10.6 11.1 8.9 7.0 4.4 7.5
Mutual savings banks 3.1 2.9 1.9 2.2 1.5 2.3
Commercial banks 7.8 6.2 3.4 3.3 2.7 2.2
Life insurance companies 1.8 2.2 2.2 1.8 2.3 2.3
FNMA-GNMA 2.1 2.8 5.5 7.1 6.3 5.5
Other 5.0 3.3 5.1 4.2 3.5 3.0
p/- Preliminary
MORTGAGE COMMITMENTS OUTSTANDING AT SELECTED THRIFT INSTITUTIONS(Billions of dollars, seasonally adjusted)
d o Savings and loan Mutual savings banks TEnd f associations/ (New York State)Total
quarter 1968 1969 1970 1968 1969 1970 1968 1969 1970
QI 6.1 7.0 5,2 2.5 3.3 2.5 8.6 10.3 7.6
QII 5.9 7.0 6.1 2.6 3.2 2.1 8.5 10.2 8.2
QIII 6.2 6.4 2.9 2.8 9.2 9.2
QIV 6.6 5.8 3.1 2.6 9.7 8.4
I/ Data include loans in process.
As an indication of some further improvement in underlying
mortgage supply conditions, yields on 6-month forward commitments in
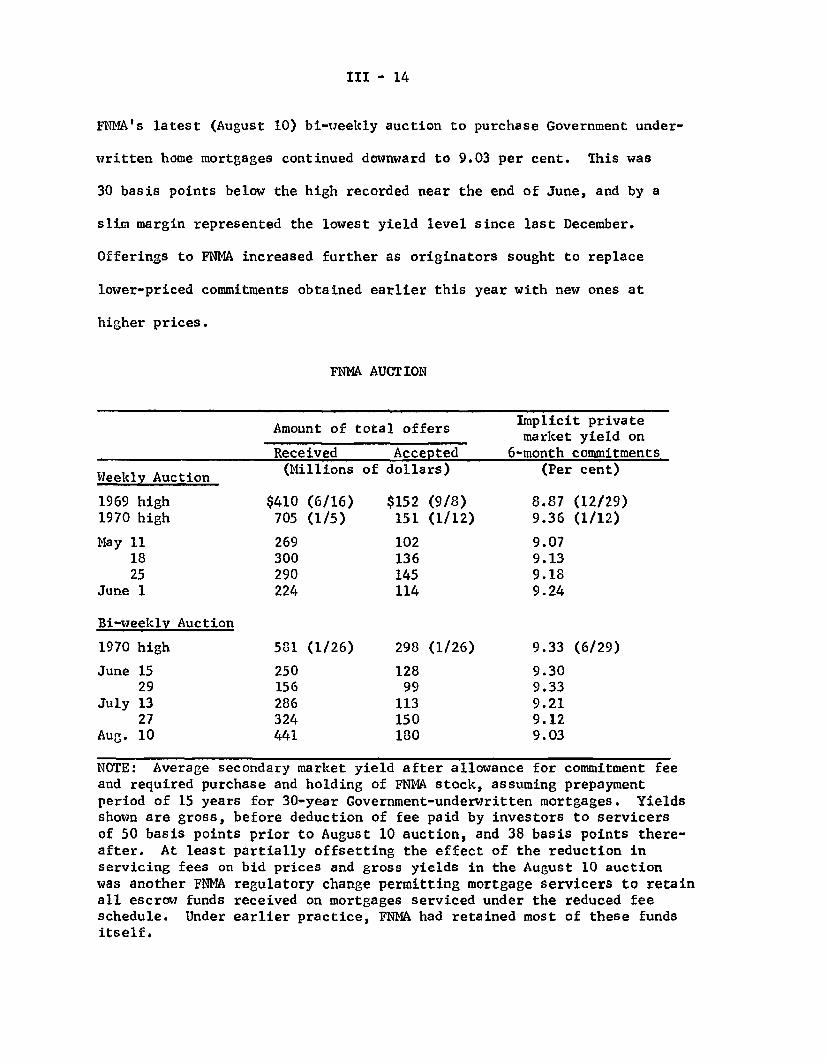
III - 14
FNMA's latest (August 10) bi-weekly auction to purchase Government under-
written home mortgages continued downward to 9.03 per cent. This was
30 basis points below the high recorded near the end of June, and by a
slim margin represented the lowest yield level since last December.
Offerings to FNMA increased further as originators sought to replace
lower-priced commitments obtained earlier this year with new ones at
higher prices.
FNMA AUCTION
Amount of total offers
Weekly Auction
1969 high1970 high
May 111825
June 1
Bi-weekly Auction
1970 high
June 1529
July 1327
Aug. 10
Received(Millions
$410 (6/16)705 (1/5)
269300290224
581 (1/26)
250156286324441
Acceptedof dollars)
$152 (9/8)151 (1/12)
102136145114
298 (1/26)
12899
113150180
Implicit privatemarket yield on
6-month commitments(Per cent)
8.87 (12/29)9.36 (1/12)
9.079.139.189.24
9.33 (6/29)
9.309.339.219.129.03
NOTE: Average secondary market yield after allowance for commitment feeand required purchase and holding of FNMA stock, assuming prepaymentperiod of 15 years for 30-year Government-underwritten mortgages. Yieldsshown are gross, before deduction of fee paid by investors to servicersof 50 basis points prior to August 10 auction, and 38 basis points there-after. At least partially offsetting the effect of the reduction inservicing fees on bid prices and gross yields in the August 10 auctionwas another FNMA regulatory change permitting mortgage servicers to retainall escrow funds received on mortgages serviced under the reduced feeschedule. Under earlier practice, FNMA had retained most of these fundsitself.
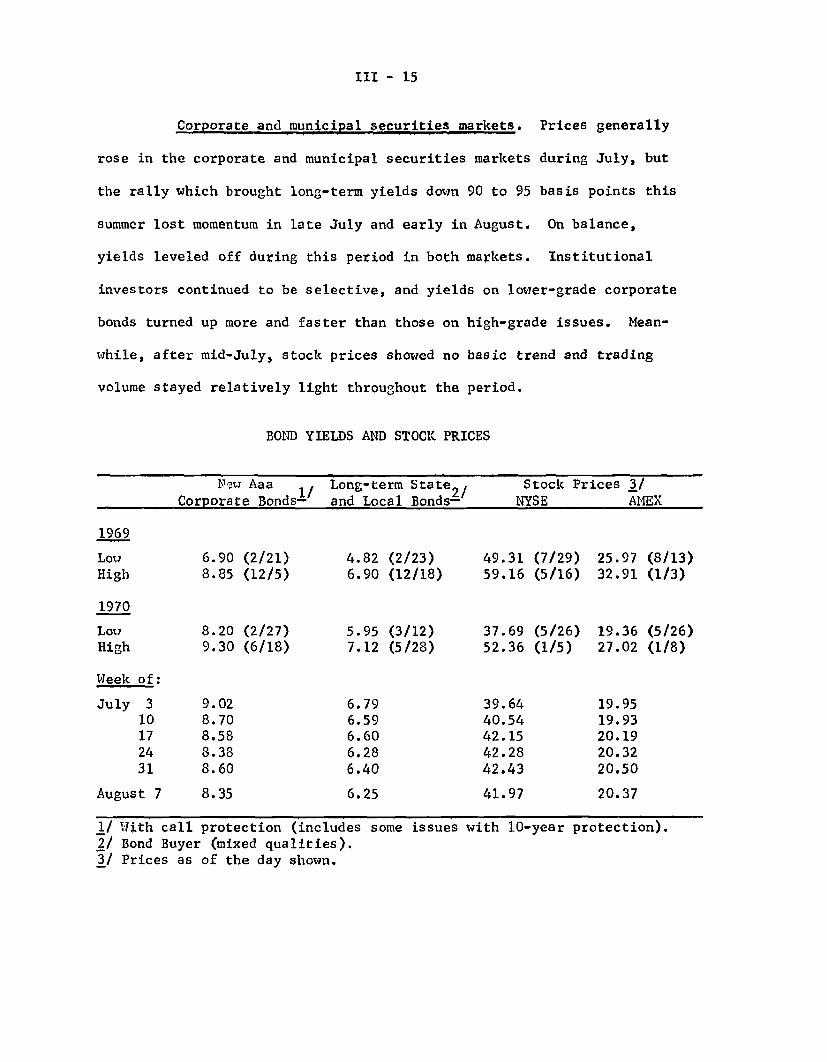
III - 15
Corporate and municipal securities markets. Prices generally
rose in the corporate and municipal securities markets during July, but
the rally which brought long-term yields down 90 to 95 basis points this
summer lost momentum in late July and early in August. On balance,
yields leveled off during this period in both markets. Institutional
investors continued to be selective, and yields on lower-grade corporate
bonds turned up more and faster than those on high-grade issues. Mean-
while, after mid-July, stock prices showed no basic trend and trading
volume stayed relatively light throughout the period.
BOND YIELDS AND STOCK PRICES
New Aaa Long-term State/ Stock Prices 3/Corporate Bonds- and Local Bonds- NYSE AMEX
1969
Low 6.90 (2/21) 4.82 (2/23) 49.31 (7/29) 25.97 (8/13)High 8.85 (12/5) 6.90 (12/18) 59.16 (5/16) 32.91 (1/3)
1970
Low 8.20 (2/27) 5.95 (3/12) 37.69 (5/26) 19.36 (5/26)High 9.30 (6/18) 7.12 (5/28) 52.36 (1/5) 27.02 (1/8)
Week of:
July 3 9.02 6.79 39.64 19.9510 8.70 6.59 40.54 19.9317 8.58 6.60 42.15 20.1924 8.38 6.28 42.28 20.3231 8.60 6.40 42.43 20.50
August 7 8.35 6.25 41.97 20.37
1/ With call protection (includes some issues with 10-year protection).2/ Bond Buyer (mixed qualities).3/ Prices as of the day shown.
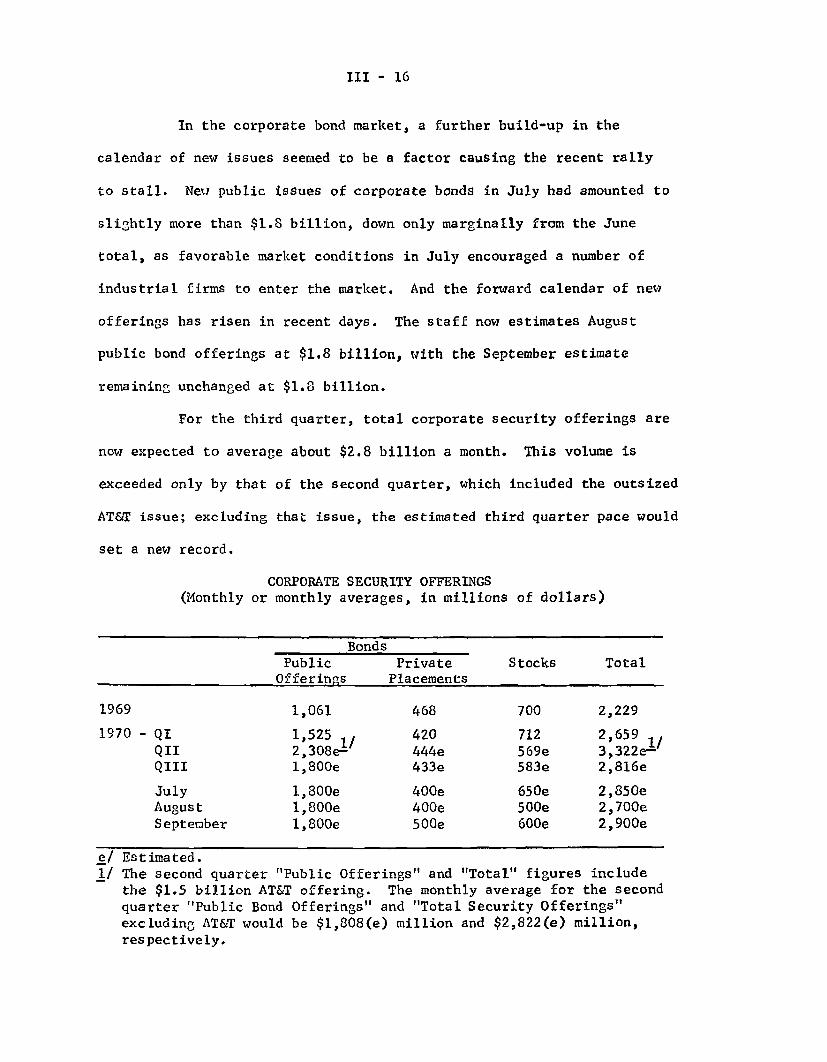
III - 16
In the corporate bond market, a further build-up in the
calendar of new issues seemed to be a factor causing the recent rally
to stall. New public issues of corporate bonds in July had amounted to
slightly more than $1.8 billion, down only marginally from the June
total, as favorable market conditions in July encouraged a number of
industrial firms to enter the market. And the forward calendar of new
offerings has risen in recent days. The staff now estimates August
public bond offerings at $1.8 billion, with the September estimate
remaining unchanged at $1.8 billion.
For the third quarter, total corporate security offerings are
now expected to average about $2.8 billion a month. This volume is
exceeded only by that of the second quarter, which included the outsized
AT&T issue; excluding that issue, the estimated third quarter pace would
set a new record.
CORPORATE SECURITY OFFERINGS(Monthly or monthly averages, in millions of dollars)
BondsPublic Private Stocks Total
Offerings Placements
1969 1,061 468 700 2,229
1970 - QI 1,525 420 712 2,659 ..QII 2,308e- 444e 569e 3,322e--QIII l,800e 433e 583e 2,816e
July 1,800e 400e 650e 2,850eAugust 1,800e 400e 500e 2,700eSeptember l,800e 500e 600e 2,900e
e/ Estimated.1/ The second quarter "Public Offerings" and "Total" figures include
the $1.5 billion AT&T offering. The monthly average for the secondquarter "Public Bond Offerings" and "Total Security Offerings"excluding AT&T would be $1,808(e) million and $2,822(e) million,
respectively.
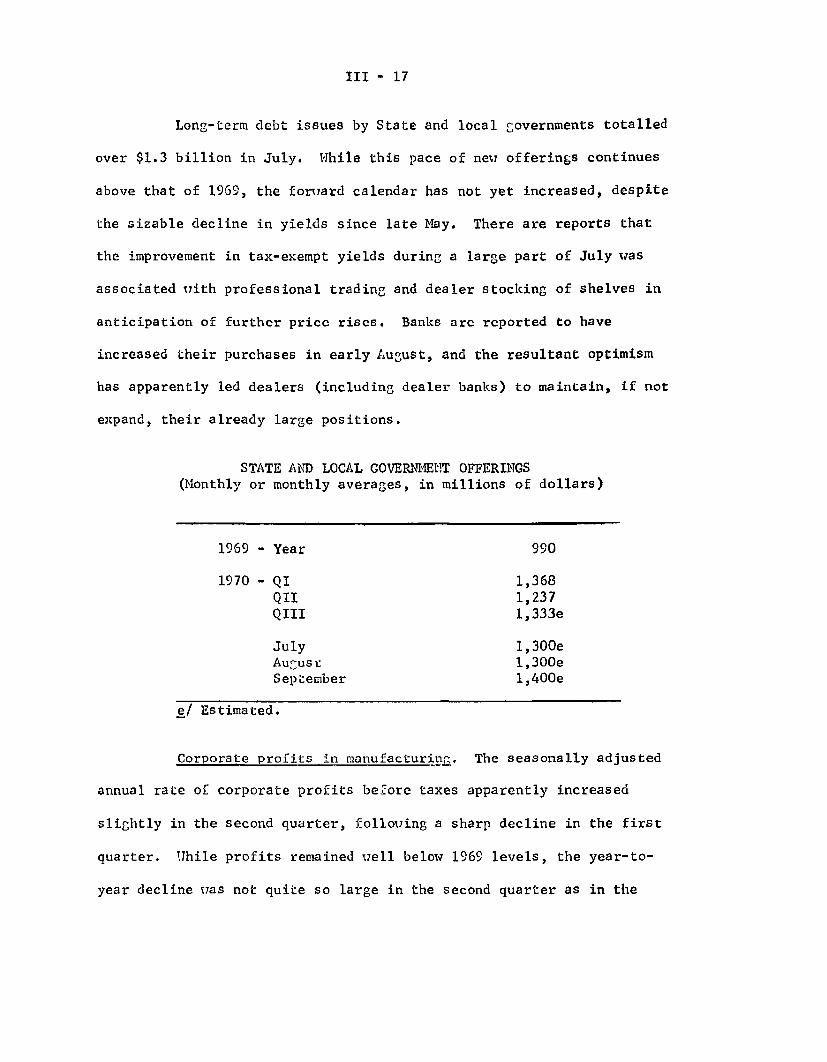
III - 17
Long-term debt issues by State and local governments totalled
over $1.3 billion in July. While this pace of new offerings continues
above that of 1969, the forward calendar has not yet increased, despite
the sizable decline in yields since late May. There are reports that
the improvement in tax-exempt yields during a large part of July was
associated with professional trading and dealer stocking of shelves in
anticipation of further price rises. Banks are reported to have
increased their purchases in early August, and the resultant optimism
has apparently led dealers (including dealer banks) to maintain, if not
expand, their already large positions.
STATE AND LOCAL GOVERNMENT OFFERINGS(Monthly or monthly averages, in millions of dollars)
1969 - Year 990
1970 - QI 1,368QII 1,237QIII 1,333e
July 1,300eAugust 1,300eSeptember 1,400e
e/ Estimated.
Corporate profits in manufacturing. The seasonally adjusted
annual rate of corporate profits before taxes apparently increased
slightly in the second quarter, following a sharp decline in the first
quarter. While profits remained well below 1969 levels, the year-to-
year decline was not quite so large in the second quarter as in the
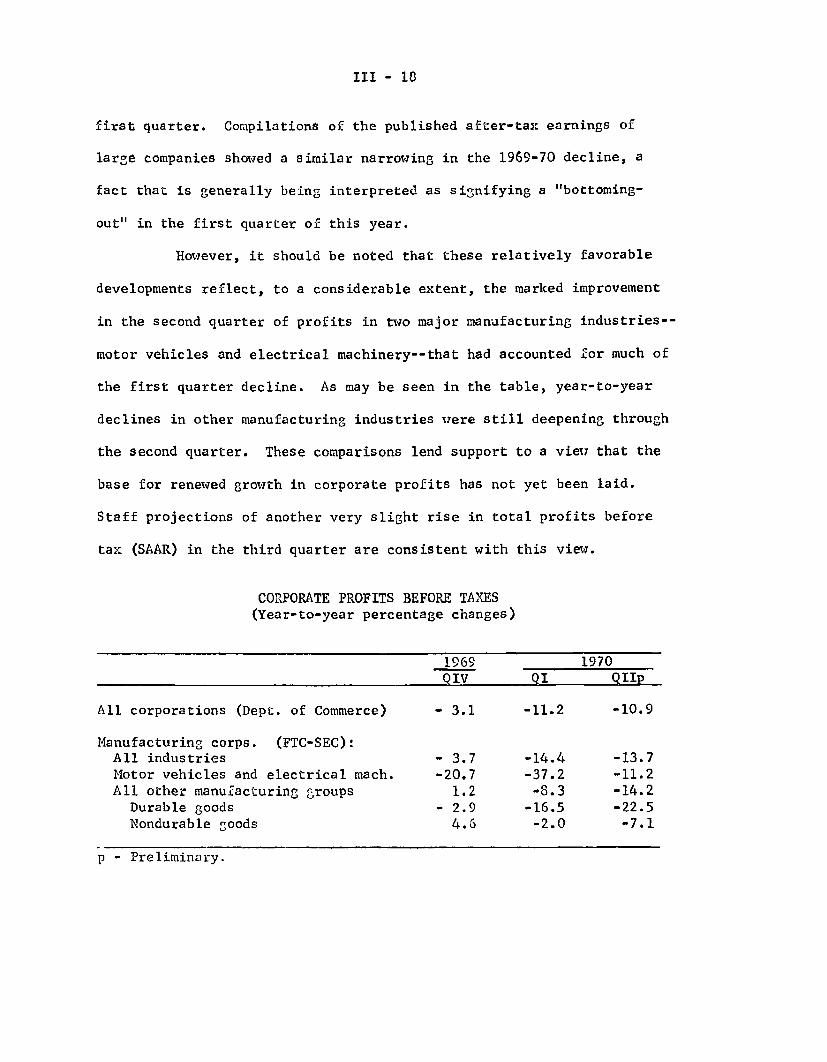
III - 18
first quarter. Compilations of the published after-tax earnings of
large companies showed a similar narrowing in the 1969-70 decline, a
fact that is generally being interpreted as signifying a "bottoming-
out" in the first quarter of this year.
However, it should be noted that these relatively favorable
developments reflect, to a considerable extent, the marked improvement
in the second quarter of profits in two major manufacturing industries--
motor vehicles and electrical machinery--that had accounted for much of
the first quarter decline. As may be seen in the table, year-to-year
declines in other manufacturing industries were still deepening through
the second quarter. These comparisons lend support to a view that the
base for renewed growth in corporate profits has not yet been laid.
Staff projections of another very slight rise in total profits before
tax (SAAR) in the third quarter are consistent with this view.
CORPORATE PROFITS BEFORE TAXES(Year-to-year percentage changes)
1969OIV
1970QI QIIp
All corporations (Dept. of Commerce) - 3.1 -11.2 -10.9
Manufacturing corps. (FTC-SEC):All industries - 3.7 -14.4 -13.7Motor vehicles and electrical mach. -20.7 -37.2 -11.2All other manufacturing groups 1.2 -8.3 -14.2
Durable goods - 2.9 -16.5 -22.5Nondurable goods 4.6 -2.0 -7.1
p - Preliminary.
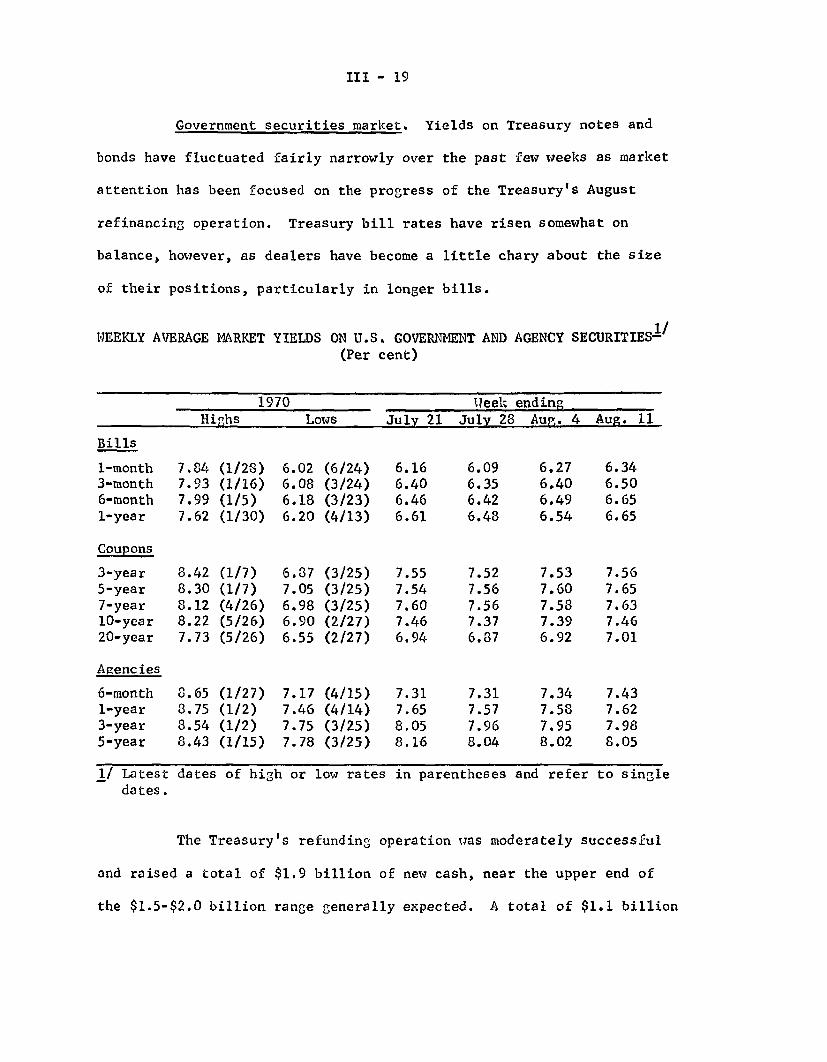
III - 19
Government securities market. Yields on Treasury notes and
bonds have fluctuated fairly narrowly over the past few weeks as market
attention has been focused on the progress of the Treasury's August
refinancing operation. Treasury bill rates have risen somewhat on
balance, however, as dealers have become a little chary about the size
of their positions, particularly in longer bills.
1/WEEKLY AVERAGE MARKET YIELDS ON U.S. GOVERNMENT AND AGENCY SECURITIES-(Per cent)
1970 Ueek endingHighs Lows July 21 July 28 Aup. 4 Aug. 11
Bills
1-month 7.84 (1/28) 6.02 (6/24) 6.16 6.09 6.27 6.343-month 7.93 (1/16) 6.08 (3/24) 6.40 6.35 6.40 6.506-month 7.99 (1/5) 6.18 (3/23) 6.46 6.42 6.49 6.651-year 7.62 (1/30) 6.20 (4/13) 6.61 6.48 6.54 6.65
Coupons
3-year 8.42 (1/7) 6.87 (3/25) 7.55 7.52 7.53 7.565-year 8.30 (1/7) 7.05 (3/25) 7.54 7.56 7.60 7.657-year 8.12 (4/26) 6.98 (3/25) 7.60 7.56 7.58 7.6310-year 8.22 (5/26) 6.90 (2/27) 7.46 7.37 7.39 7.4620-year 7.73 (5/26) 6.55 (2/27) 6.94 6.87 6.92 7.01
Agencies
6-month 8.65 (1/27) 7.17 (4/15) 7.31 7.31 7.34 7.431-year 8.75 (1/2) 7.46 (4/14) 7.65 7.57 7.58 7.623-year 8.54 (1/2) 7.75 (3/25) 8.05 7.96 7.95 7.985-year 8.43 (1/15) 7.78 (3/25) 8.16 8.04 8.02 8.05
1/ Latest dates of high or low rates in parentheses and refer to singledates.
The Treasury's refunding operation was moderately successful
and raised a total of $1.9 billion of new cash, near the upper end of
the $1.5-$2.0 billion range generally expected. A total of $1.1 billion
III - 20
of the $5.6 billion publicly held maturing issues (just under 20 per
cent) was not exchanged into the two longer 7-3/4 per cent issues.
Cash subscriptions to the 7-1/2 per cent, 18-month note were very large,
however; and the issue was over-allotted by nearly 10 per cent, increas-
ing its size to $3.0 billion. An allotment ratio of 9-1/2 per cent was
set for subscriptions in excess of $200,000; a total of $1.2 billion of
subscriptions for less than $200,000 was awarded in full.
Dealers' positions in Treasury securities have been swollen
in recent weeks by the various Treasury financing operations, including
the two tax anticipation bill auctions in early and mid-July which in
the first instance were taken up by banks. Dealer bill positions reached
a peak of just under $4.0 billion on July 28. Some reduction in these
positions has been effected most recently, but market reports indicate
that bill demand has not been up to the expectations of a number of
participants. Thus, despite a 50 basis point decline in financing costs
over the past two or three weeks, there has been some tendency for
dealers to cut prices and for bill rates to drift generally higher.
Most recently, dealer positions have been swollen by $1.25 billion of
awards of new notes in the mid-August refunding, including about $550
million of the 7-year, $450 million of the 3-1/2-year, and $250 million
of the 18-month issue.
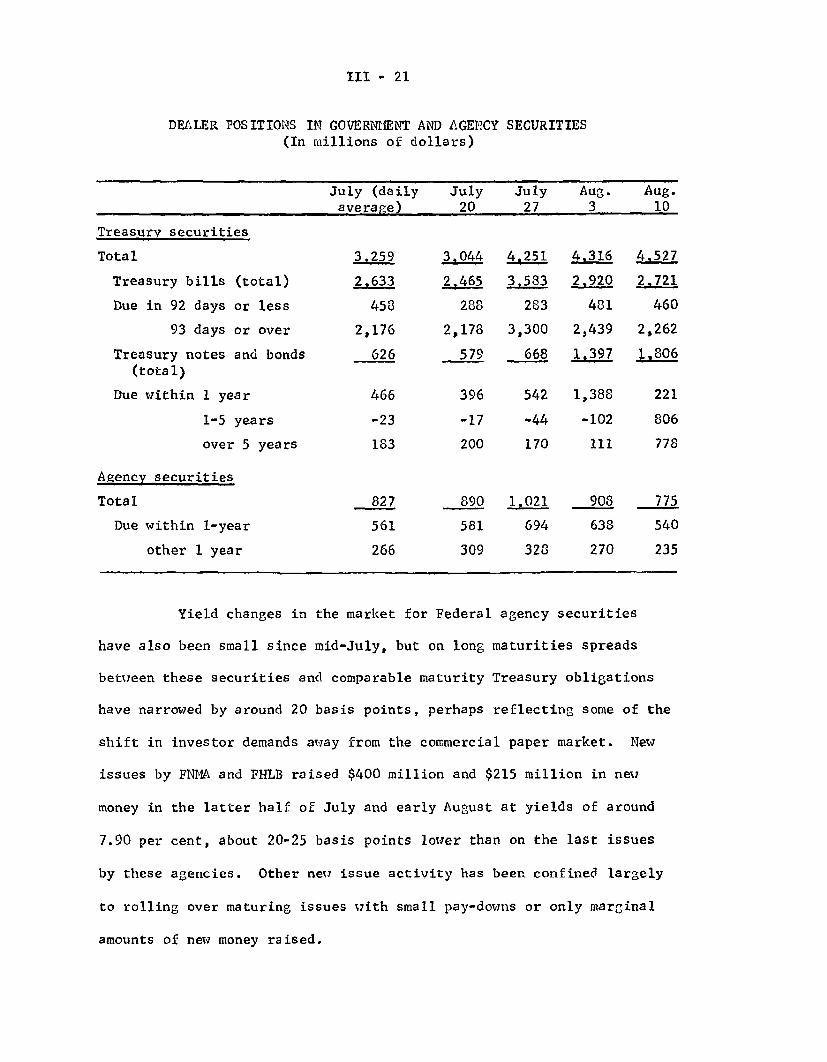
III - 21
DEALER POSITIONS IN GOVERNMENT AND AGENCY SECURITIES(In millions of dollars)
July (daily July July Aug. Aug.average) 20 27 3 10
Treasury securities
Total 3,259 3044 251 4316 4527
Treasury bills (total) 2.63 2465 83 2920 2721
Due in 92 days or less 458 288 283 481 460
93 days or over 2,176 2,178 3,300 2,439 2,262
Treasury notes and bonds 626 579 668 1,397 1.806(total)
Due within 1 year 466 396 542 1,388 221
1-5 years -23 -17 -44 -102 806
over 5 years 183 200 170 111 778
Agency securities
Total 827 890 1 021 908 775
Due within 1-year 561 581 694 638 540
other 1 year 266 309 328 270 235
Yield changes in the market for Federal agency securities
have also been small since mid-July, but on long maturities spreads
between these securities and comparable maturity Treasury obligations
have narrowed by around 20 basis points, perhaps reflecting some of the
shift in investor demands away from the commercial paper market. New
issues by FNMA and FHLB raised $400 million and $215 million in new
money in the latter half of July and early August at yields of around
7.90 per cent, about 20-25 basis points lower than on the last issues
by these agencies. Other new issue activity has been confined largely
to rolling over maturing issues with small pay-downs or only marginal
amounts of new money raised.
III - 22
Federal finance. At the present time the Board Staff is
projecting a fiscal 1971 federal deficit of $11.7 billion, on a unified
budget basis, about $10.4 billion more than the deficit forecast by the
Administration in the May 19 budget review. The staff's estimate of
receipts is nearly $5.0 billion lower than the Administration's revised
estimate, largely because of lower income assumptions; the remaining
difference between the Staff and Budget Bureau projections reflects the
higher level of expenditures in the Staff estimates.
The Staff estimate of fiscal 1971 receipts remains at $199.4
billion, as in the last Greenbook, though an apparent shortfall in
recent corporate tax receipts suggests that a downward revision in the
forecast may eventually be necessary. The Staff's estimate of budget
outlays for the current fiscal year has been increased by $1.8 billion
since the last Greenbook as a result of (1) the expected Congressional
overriding of the President's veto of the education appropriation bill
which includes $.5 billion above the budget request, and (2) the
Administration's recent proposals, relating to comparability in Federal
pay, which implicitly include a pay hike in January 1971 that would add
$1.3 billion to fiscal 1971 outlays. Considerable uncertainty exists
with respect to the forecast of outlays, however, since Congress has yet
to act on most of the regular appropriations bills for the current
fiscal year.
In regard to the fiscal year just completed, final figures
indicate that the budget deficit was $3.0 billion, about as projected
by the Staff, though our estimates of both receipts and outlays for June
were approximately $.6 billion too high.
III - 23
Turning to the national income accounts concepts, the Staff
projects a $10.3 billion federal deficit in calendar 1970 and an $11.1
billion deficit in fiscal year 1971. The increase in the size of the
Federal sector deficit at annual rates is expected to have topped out in
the second quarter of calendar 1970; thereafter the deficit is expected
to remain at high, though somewhat lower, levels through the second
quarter of 1971.
Despite the discretionary increases in spending included in
the staff estimate for the current fiscal year, the forecast of the high
employment budget indicates that fiscal policy will still be turning
somewhat more restrictive as the fiscal year progresses. The high
employment budget is expected to move from a $.8 billion deficit in the
July-December period of 1970 to a $5.7 billion surplus in the first half
of calendar 1971. This shift reflects mainly the anticipated speed-up
in estate and gift taxes ($1.5 billion), the scheduled hike in social
security taxes in January ($5.8 billion) and the fact that federal out-
lays still are not projected to be rising quite as fast as revenues if
the economy were growing at its full potential.
The Staff estimates that the end-of-August cash balance at
the Treasury will be about $6.3 billion. The Treasury raised $1.9
billion of net new money in the recent refinancing and cash borrowing
operation. There may be additional cash borrowing in early September
though it is not yet clear whether it will be early or late in the month.
As indicated in earlier Greenbooks, Treasury net cash borrowing in the
second half of 1970 is expected to be somewhat larger than in recent
years.

III - 24
PROJECTION OF TREASURY CASH OUTLOOK(In billions of dollars)
July Aug. Sept. Oct.
Total net borrowing:
Weekly and monthly billsTax billsCoupon issuesAs yet unspecified new
borrowingOther (agency, debt repayment, etc.)
Plus: Other net financial sources-
Plus: Budget surplus or deficit (-)
Equals: Change in cash balance
Memoranda: Level of cash balance,end of period
Derivation of budgetsurplus or deficit:
Budget receiptsBudget outlays
Maturing coupon issuesheld by public
5.9
.54.8
2.1
.3
3.03.0
.6 -1.2
-. 3 -. 2
-6.2 -3.0
-.6b/ -1.1
7. b /7.4- 6.3
1.2-1.9
.2
7.8
12.5 15.2 19.618.7 18.2 17.6
-- 5.6
a/ Checks issued less checks paid andb/ Actual.
other accrual items.
4.1
.6
-6.5
-1.8
6.0
11.918.4
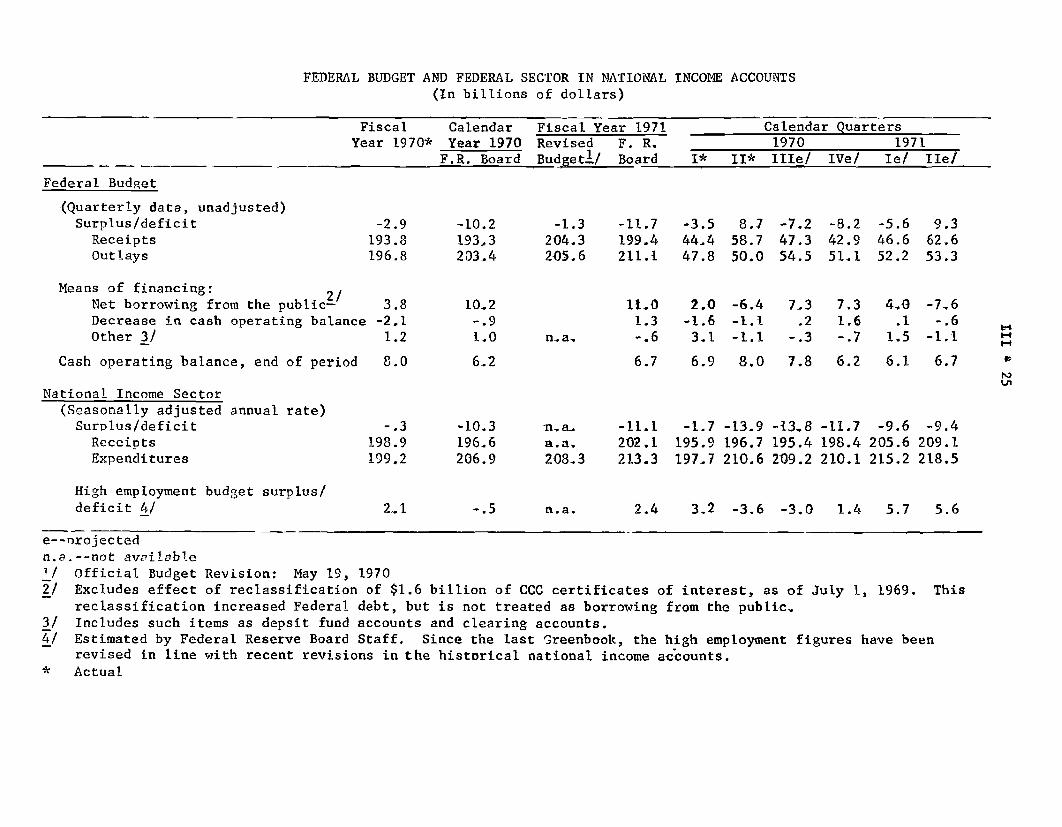
FEDERAL BUDGET AND FEDERAL SECTOR IN NATIONAL INCOME ACCOUNTS
(In billions of dollars)
FiscalYear 1970*
CalendarYear 1970F.R. Board
Fiscal Year 1971Revised F. R.Budget!/ Board
Calendar Quarters1970 1971
I* II* IIIe/ IVe/ Ie/ IIe/
Federal Budget
(Quarterly data, unadjusted)Surplus/deficit
ReceiptsOutlays
-2.9193.8196.8
Means of financing: 2/Net borrowing from the public- 3.8Decrease in cash operating balance -2.1Other 3/ 1.2
-10.2193.3203.4
10.2-. 91.0
-1.3204.3205.6
n. a-
-11.7199.4211.1
11.01.3-. 6
-3.544.447.8
2.0-1.63.1
8.758.750.0
-6.4-1.1-1.1
-7.247.354.5
-8.242.951.1
-5.646.652.2
9.362.653.3
7.3 7.3 4.0 -7,6.2 1.6 .1 -.6-.3 -.7 1.5 -1.1
Cash operating balance, end of period
National Income Sector(Seasonally adjusted annual rate)Surplus/deficit
ReceiptsExpenditures
High employment budget surplus/deficit 4/
8.0
-.3198.9199.2
-10.3196.6206.9
na-n.a,208.3
n.a.
6.7 6.9 8.0 7.8 6.2
-11.1202.1213.3
-1.7195.9197.7
-13.9196.7210.6
-13.8195.4209.2
-11.7198.4210.1
6.1 6.7
-9.6205.6215.2
2.4 3.2 -3.6 -3.0 1.4 5.7
e--projectedn.a.--not available1/ Official Budget Revision: May 19, 19702/ Excludes effect of reclassification of $1.6 billion of CCC certificates of interest, as of July 1, 1969. This
reclassification increased Federal debt, but is not treated as borrowing from the public.3/ Includes such items as depsit fund accounts and clearing accounts.4/ Estimated by Federal Reserve Board Staff. Since the last Greenbook, the high employment figures have been
revised in line with recent revisions in the historical national income accounts.* Actual
-9.4209.1218.5
5.6
__
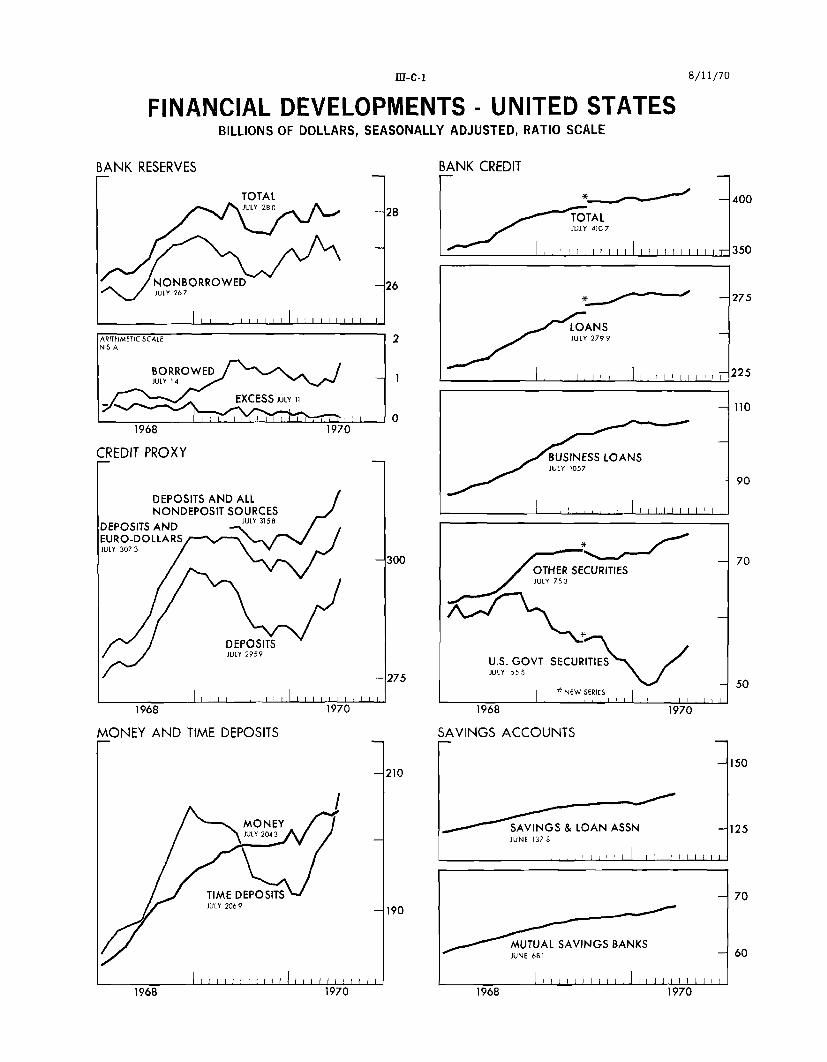
III-C-1
FINANCIAL DEVELOPMENTS - UNITED STATESBILLIONS OF DOLLARS, SEASONALLY ADJUSTED, RATIO SCALE
BANK RESERVES
1968
CREDIT PROXY
1970
DEPOSITS AND ALLNONDEPOS1T SOURCES
DEPOSITS AND JULY 31s5
EURO-DOLLARSJULY 3073 \
v\ONEY AND TIME DEPOSITS
TIME DEPOSITSJULY 206 9 -1190
BANK CREDIT
I II I I - , 1 _LOANSJULY 2799
BUSINESS LOANSJULY 1057
OTHER SECURITIESJULY 753
U.S. GOVT SECURITIESJULY 555
I *NEWSERIES I
1968 1970
SAVINGS ACCOUNTS
SAVINGS & LOAN ASSNJUNE 137 8
MUTUAL SAVINGS BANKSJUNE 681
SI I l i ) I I I I I I I l I I l I
1970 1968
8/11/70
ARITHMETIC SCALENSA
BORROWEDJULY 14
EXCESS JULY 11
-1 1 1 -1 1 . .1 1 1 1 1 1 1 1 1. 1 .
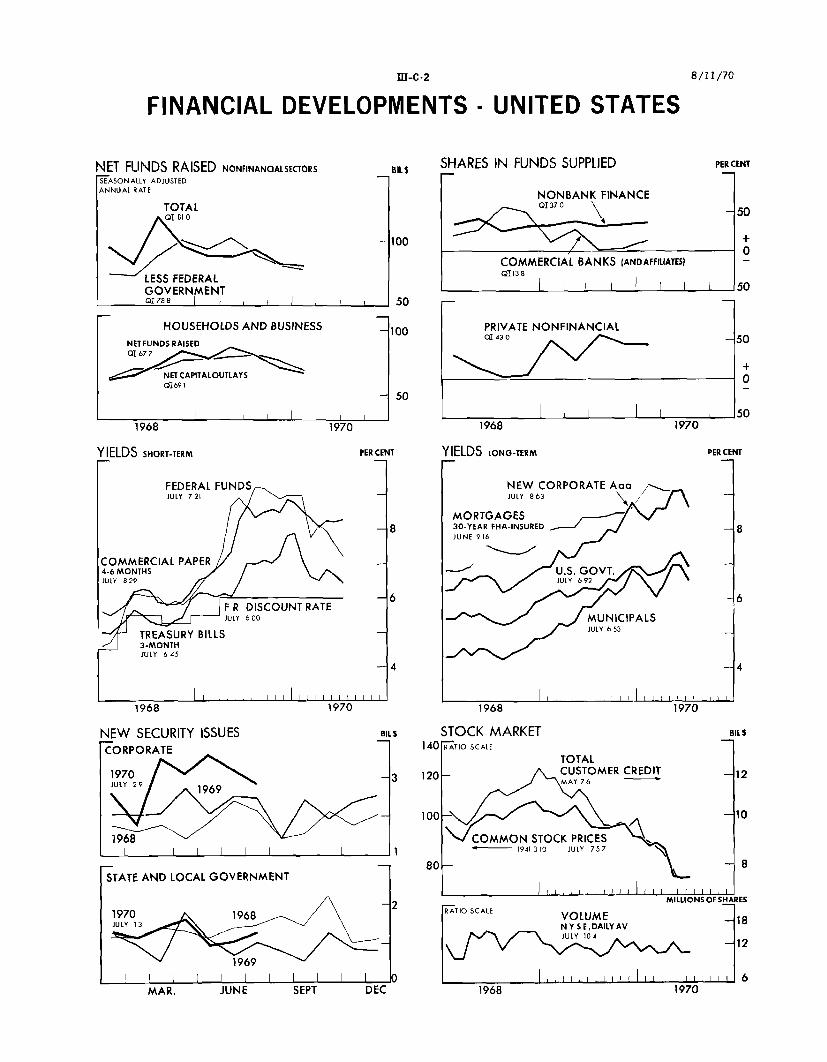
III-C-2FINANCIAL DEVELOPMENTS - UNITED STATES
NET FUNDS RAISED NONFINANCIALSECTORSSEASONALLY ADJUSTEDANNUAL RATE
TOTALS01810
LESS FEDERALGOVERNMENTQ0788 I I
BIL SHARES IN FUNDS SUPPLIED
r
-1100
HOUSEHOLDS AND BUSINESS
NET FUNDS RAISED01 677NETCAPITALOUTLAYS01691
1968 1970
YIELDS SHORT-TERM PERCENT
NONBANK FINANCE
S37o 0 - 50
COMMERCIAL BANKS (ANDAFFILIATES)01138
I I I I IJ_ I I 50
NEW SECURITY ISSUES BIL$ STOCK MARKETCORPORATE 140 RATIo SCALE
1970 -3 120-JULY 29 1969
819 69
- 1 0 0
1968 COMMON STS11941 3
-- 80STATE AND LOCAL GOVERNMENT
1970 1968 -2 ATIO SCALEJULY 13
1969
MAR. JUNE SEPT DEC 1968
8/11/70
PERCENT
BILt
IV - 1
THE ECONOMIC PICTURE IN DETAIL
International Developments
U.S. balance of payments. The data now available for the
first-half balance of payments (shown in the following table) are
scheduled to be published by the Commerce Department on August 17.
As noted in the last Green Book, the overall results before special
transactions and the allocation of SDRs show a rise in the liquidity
deficit to $2.2 billion for the second quarter, and the balance settled
by official reserve transactions in the second quarter was about the
same.
A principal feature of the accounts recently has been the
strength of exports, discussed in some detail in a following section.
Another helpful feature in the second quarter was the extraordinarily
small amount of new foreign bonds sold in this market -- about $100
million. However, indications are that the capital outflow to purchase
new foreign bonds is rising sharply in the current quarter and may
exceed $500 million. That total would include several large issues
by Canadian borrowers and a large issue by the World Bank.
Foreign transactions in U.S. corporate securities (both in
U.S. and foreign markets) resulted in a net inflow of about $300
million in the second quarter -- about the same as in the first but
far below the $800 million quarterly average of 1969. Trading in
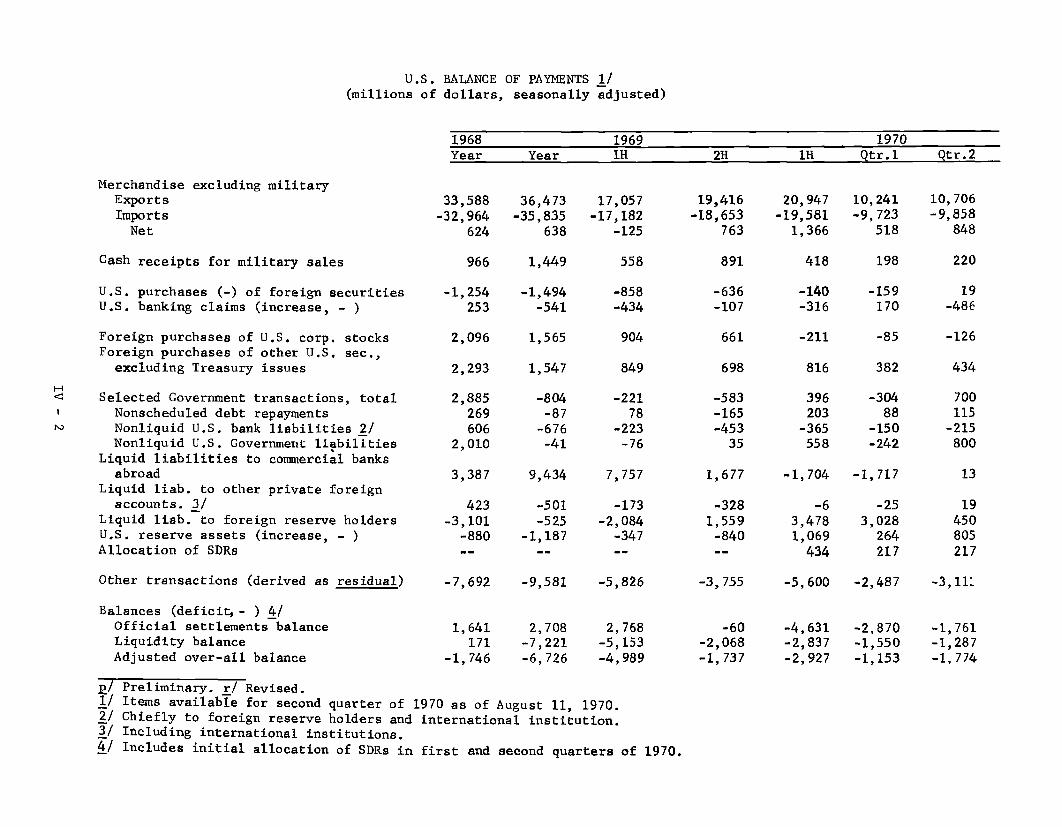
U.S. BALANCE OF PAYMENTS 1/(millions of dollars, seasonally adjusted)
1968 1969 1970Year Year 1H 2H 1H Qtr.l Qtr.2
Merchandise excluding militaryExports
ImportsNet
Cash receipts for military sales
U.S. purchases (-) of foreign securitiesU.S. banking claims (increase, - )
Foreign purchases of U.S. corp. stocksForeign purchases of other U.S. sec.,
excluding Treasury issues
Selected Government transactions, totalNonscheduled debt repaymentsNonliquid U.S. bank liabilities 2/Nonliquid U.S. Government liabilities
Liquid liabilities to commercial banksabroad
Liquid liab. to other private foreignaccounts. 3/
Liquid liab. to foreign reserve holdersU.S. reserve assets (increase, - )Allocation of SDRs
Other transactions (derived as residual)
Balances (deficit,- ) 4/Official settlements balanceLiquidity balanceAdjusted over-all balance
33,588 36,473-32,964 -35,835
624 638
966
-1,254253
2,096
2,293
2,885269606
2,010
3,387
423-3,101
-880
-7,692
1,641171
-1,746
1,449
-1,494-541
1,565
1,547
-804-87
-676-41
9,434
-501-525
-1,187
17,057-17,182
-125
558
-858-434
904
849
-22178
-223-76
7,757
-173-2,084
-347
-9,581 -5,826
2,708-7,221-6,726
2,768-5,153-4,989
19,416-18,653
763
891
-636-107
661
698
-583-165-45335
1,677
-3281,559
-840
-3,755
-60-2,068-1,737
20,947-19,581
1,366
418
-140-316
-211
816
396203
-365558
10,241-9,723
518
198
-159170
-85
382
10,706-9,858
848
220
19-486
-126
434
-30488
-150-242
-1,704 -1,717
-6
3,4781,069
434
-253,028
264217
700115-215800
13
19450805217
-5,600 -2,487 -3,111
-4,631-2,837-2,927
-2,870-1,550-1,153
-1,761-1,287-1,774
p/ Preliminary. r/ Revised.1/ Items available for second quarter of 1970 as of August 11, 1970.2/ Chiefly to foreign reserve holders and international institution.3/ Including international institutions.4/ Includes initial allocation of SDRs in first and second quarters of 1970.
IV - 3
U.S, corporate stocks recovered to a net inflow of about $60 million
in June, following a heavy sell-off in May. Although there was some
reduction in foreign purchases of bonds in the U.S. market, foreign
purchases of new issues of U.S. corporations offered in Europe rose
to about $300 million, the largest quarterly total since early in
1969. About two-thirds of the proceeds were intended for use in
the United States rather than as financing for foreign affiliates.
Rates in the Euro-bond market hardened during the second quarter, and
indications are that borrowings in that market by U.S. companies will
drop off once again.
Claims on foreigners reported by U.S. banks rose about $500
million in the second quarter, largely in claims on Canada and Japan
($200 million each). In the case of Canada the rise in claims is
presumably part of the overall inflow attracted by high interest
rates and the prospect of revaluation -- a large part of the flow
reflected activities of the banks' customers and of the U.S. agencies
of foreign banks. In the case of Japan the outflow may be partly
seasonal -- there was a comparable outflow last year -- but it is
surprising in view of the intention of the Japanese authorities to
reduce the use of foreign borrowing by Japanese banks. Outflows
by U.S. banks chargeable to their VFCR ceilings were still quite
small in the second quarter and reflected mainly export credits.
After taking account of known transactions in the second
quarter, the residual -- representing such major categories as U.S.
IV 4
Government aid and military activities, and direct investment capital
and income accounts -- showed about $3.0 billion of net payments.
This is about as large as in the periods of heavy recorded and
unrecorded capital outflows last year, and suggests that capital
outflows were larger than in the first quarter of the year.
Preliminary weekly data for July suggest that the liquidity
measure seasonally adjusted, registered a much smaller deficit than in
other recent months. However, a very large deficit persisted on the
official settlements measure as liabilities to commercial banks abroad
fell off sharply between June 24, when Regulation Q was relaxed, and
the end of July.
Euro-dollar market. Euro-dollar interest rates declined
fairly rapidly in the latter half of July. The three-month deposit
rate, for example, declined to an average of 8.36 per cent in the
week ended July 29, compared to more than 9.5 per cent in mid-June.
In August, through the 12th, rates for Euro-dollar funds of three-
month maturity and longer have remained rather stable, and rates for
one-month maturity and less have advanced moderately. The call deposit
rate averaged 7.53 per cent in the week ended August 12, after dropping
below 7 per cent in late July. (See table).
The marked decline in Euro-dollar rates during the latter
half of July reflected a sharp reduction in American bank takings from
the market as the banks replaced part of their Euro-dollar liabilities
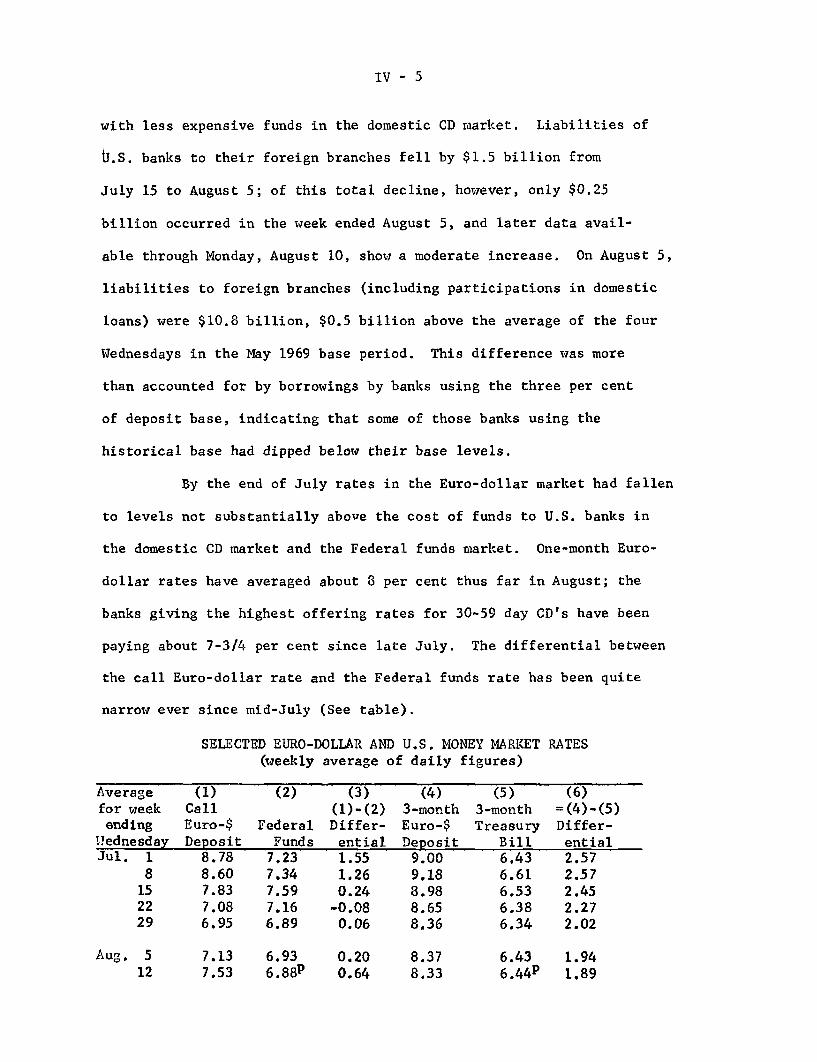
IV - 5
with less expensive funds in the domestic CD market. Liabilities of
U.S. banks to their foreign branches fell by $1.5 billion from
July 15 to August 5; of this total decline, however, only $0.25
billion occurred in the week ended August 5, and later data avail-
able through Monday, August 10, show a moderate increase. On August 5,
liabilities to foreign branches (including participations in domestic
loans) were $10.8 billion, $0.5 billion above the average of the four
Wednesdays in the May 1969 base period. This difference was more
than accounted for by borrowings by banks using the three per cent
of deposit base, indicating that some of those banks using the
historical base had dipped below their base levels.
By the end of July rates in the Euro-dollar market had fallen
to levels not substantially above the cost of funds to U.S. banks in
the domestic CD market and the Federal funds market. One-month Euro-
dollar rates have averaged about 8 per cent thus far in August; the
banks giving the highest offering rates for 30-59 day CD's have been
paying about 7-3/4 per cent since late July. The differential between
the call Euro-dollar rate and the Federal funds rate has been quite
narrow ever since mid-July (See table).
SELECTED EURO-DOLLAR AND U.S. MONEY MARKET RATES(weekly average of daily figures)
Average (1) (2) (3) (4) (5) (6)for week Call (1)-(2) 3-month 3-month =(4)-(5)ending Euro-$ Federal Differ- Euro-$ Treasury Differ-
Wednesday Deposit Funds ential Deposit Bill entialJul. 1 8.78 7.23 1.55 9.00 6.43 2.57
8 8.60 7.34 1.26 9.18 6.61 2.5715 7.83 7.59 0.24 8.98 6.53 2.4522 7.08 7.16 -0.08 8.65 6.38 2.2729 6.95 6.89 0.06 8.36 6.34 2.02
Aug. 5 7.13 6.93 0.20 8.37 6.43 1.9412 7.53 6.8 8P 0.64 8.33 6.44p 1.89

IV - 6
Foreign exchange markets. After coming under considerable
pressure in the foreign exchange markets during the second half of
July as a result of the decline in Euro-dollar interest rates, the
dollar firmed somewhat in the first two weeks of August. Intervention
purchases of dollars by major foreign central banks, which totaled
nearly $1.2 billion in the latter half of July, abated sharply after
the end of the month.
The decline in Euro-dollar interest rates during July,
combined with still tight credit conditions in Germany, led to sizable
flows of funds into marks, and the Bundesbank purchased $400 million
in spot market intervention during the last half of the month, when
it also purchased $64 million for future delivery. In early August,
however, German money market rates declined relative to Euro-dollar
rates, reducing the covered interest differential in favor of mark
investments. So far this month the Bundesbank has purchased only a
small amount of dollars.
The Dutch guilder was in strong demand in late July, partly
as a result of a very large conversion of foreign currencies by a
Dutch oil company. An OECD report on the Dutch economy, released
at about this same time, suggested that the guilder should have been
revalued last fall, stimulating discussion in the press of the
possibility of a future guilder revaluation. As a result of this
discussion, the guilder remained firm following the completion of the

IV - 7
oil company conversion. The Netherlands Bank has purchased $168
million since mid-July, and the System has provided cover for $125
million of these purchases by drawing that amount on the reciprocal
swap facility.
The Belgian franc, reflecting Belgium's strong basic balance
of payments, has been at or near its ceiling since mid-July, though it
eased somewhat after month-end. The National Bank of Belgium purchased
$93 million from July 15 to August 12, and the System provided exchange
guarantees for these uncovered dollars by drawing $65 million on the
reciprocal swap facility. The System's outstanding indebtedness on
that line is now $95 million.
The French franc was very firm in late July, partly as a result
of the bunching of conversions of export receipts prior to the August
vacation period in France. The Bank of France purchased $175 million
in the latter half of the month. After month-end the franc exchange
rate eased, and Bank of France dollar purchases in early August were
very small.
The last two weeks of July saw a temporary respite in the
selling pressures on the Italian lira, and the Bank of Italy purchased
a small amount of dollars. Paradoxically, after the formation of a
new government in early August, selling pressure resumed, and the
Bank of Italy sold over $100 million in support operations.
IV - 8
Month-end liquidity needs of Swiss commercial banks pushed
the Swiss franc exchange rate to the ceiling in the last week of
July, and the Swiss National Bank purchased $120 million. The exchange
rate declined markedly after month-end.
The Canadian dollar advanced strongly in late July and early
August, touching a high of 98 cents at one point. Factors strengthening
the Canadian dollar included the conversion of proceeds of a large bond
issue and seasonal strength in an already strong balance of payments
on current account. The Bank of Canada purchased just over (U.S.)
$50 million in moderating the rise in the exchange rate, then, in the
second week of August, sold a small amount of U.S. dollars as the rate
slid back to 97.5 cents.
Sterling rallied briefly around month-end with the settlement
of the British dock strike, and the Bank of England purchased $135
million in two days. Since month-end, sterling has moved in a narrow
range on light volume, and the Bank of England has purchased only a
small amount of dollars.
U.S. foreign trade. In June, the export surplus rose to
$5.2 billion at a seasonally adjusted annual rate (balance of payments
basis). The surplus in the second quarter of 1970, $3.4 billion at an
annual rate, was the highest since the third quarter of 1967.
The trade balance has improved steadily since mid-1969,
buoyed by a marked rise in exports. Exports in the first six months

IV - 9
U.S. MERCHANDISE TRADE 1/
(Billions of dollars; seasonally adjusted annual rates)
1968 1 9 6 9 1 9 7 0Year Year 1H 2H IHP Q-1P Q-2
Exports, total 33.6 36.5 34.1 38.8 41.9 40.8 42.9By typeAgricultural 6.3 6.0 5.5 6.5 6.9 6.7 7.2Nonaricultural 27.3 30.5 28.6 32.3 34.9 34.1 35.7
By areaCanada 8,1 9.2 9.0 9.4 9.2 9.3 9.1Jestern Europe 10.5 11.6 10.6 12.6 14.3 13.7 14.9Japan 3.0 3.5 3.1 3.9 4.6 4.5 4.7i.ll other 11.9 12.2 11.3 12.9 13.8 13.4 14,2
Imports, total 33.Q 35.8 34.4 37.3 39.1 38.7 39,5By area
Canada 8.6 10.0 9,7 10.2 10.7 10.8 10.7UTestern Europe 10.2 10.2 9.7 10.7 10.8 10.6 11.1Japan 4,1 4,9 4.6 5.1 5.6 5.5 5.6All other 10.1 10.7 10.3 11.2 12.0 11.8 12.1
Balance -+0.6 I+0.6 -0.2 +1.5 +-2.7 +-2.1 +-3.4By area
Canada -0.5 -0.8 -0.7 -0.8 -1.5 -1.5 -1.6Western Europe +0.3 +1.4 --0.9 +-1.9 +-3.5 +3.1 +3.8Japan -1.1 -1.4 -1.5 -1.2 -1.0 -1.0 -0.9Lll other +1.8 +1.5 +-1.0 -+1.7 --1.8 +1.6 +2.1
1/ Balance of payments basis.2/ PreliminaryNote: Details may not add to totals because of rounding.
of 1970 ($41.9 billion at an annual rate, balance of payments basis)
about 8 per cent greater than in the second half of 1969. This generally
reflects the high level of demand abroad. The first-half import increase
was more moderate -- almost 5 per cent greater than in the second half
of 1969.
IV - 10
A large part of the advance in exports from the latter
half of 1969 to the first half of 1970 resulted from a considerable
increase in shipments of goods to Western Europe. Exports to Japan,
primarily non-agricultural, also recorded sizable gains in the first
half. On the other hand, shipments to Canada declined slightly.
Canada and Japan accounted for most of the increase in first-
half imports. At the same time, arrivals of goods from Western Europe
were sluggish.
As a result of these changes in the geographical distribution
of exports and imports, the U.S. trade balance with Canada deteriorated
sharply in the first half of 1970, while the balance with each of the
other major areas -- Japan, Western Europe; Australia, New Zealand
and South Africa; Latin America; and all other countries as a group --
either remained the same or improved.
Exports in the second quarter of 1970 were at a $42.9 billion
annual rate (balance of payments basis), an increase of over 5 per cent
from the first quarter.
Both agricultural and non-agricultural exports registered
substantial gains in the second quarter. The surge in agricultural
products from the already high first quarter level occurred primarily
in soybeans, cotton, and PL-480 shipments of rice to Korea. During
the rest of 1970, agricultural exports are expected to continue at a
high level but not as high as in the second quarter.
IV - 11
Among the non-agricultural commodities, machinery exports
performed well in the second quarter; after falling in April, they
recovered in May and rose significantly in June. In the second half
of this year they are expected to rise further. A sharp upswing --
from a very low first-quarter level -- occurred in automobile shipments
to Canada in the April-June period, as Canadian car sales improved
slightly. Deliveries of civilian aircraft, while higher for the
second quarter as a whole, declined abruptly in June and will probably
continue to fall off somewhat during the remainder of 1970. The
expected rise in machinery exports in the second half, however, should
more than compensate for the anticipated shortfall in aircraft
deliveries. Continued strength was shown in exports of non-agricultural
industrial supplies -- especially coal, steel scrap, steel products, and
fuels and lubricants -- although exports of chemicals declined slightly.
Exports of steel products actually fell in June, but showed an extremely
strong overall increase for the second quarter because of the abnormally
high levels in April and May.
Imports in June declined 2 per cent from the relatively high
May level, but for the second quarter as a whole imports ($39.5 billion
at an annual rate, balance of payments basis) were 2 per cent above the
level of the first quarter.
The second-quarter increase was largely based on increased
automotive imports, as deliveries from Europe and Japan continued to
IV - 12
respond to strong U.S. demand for foreign-type cars. While automotive
shipments from Canada picked up in the second quarter -- U.S. sales
of American-type cars improved slightly -- they were still about 7 per
cent less in the first half of 1970 than in the second half of 1969.
Iron and steel imports increased in the second quarter from first
quarter levels but showed no significant advance for the first half
of 1970 over the last half of 1969. Fuels and lubricants declined
from the first quarter but were still imported at a higher rate
than in the last half of 1969. Second quarter increases were also
recorded for coffee, metals, nonelectric machinery and consumer goods.
Part of the strength in imports continues to reflect the relatively
high prices of coffee and nonferrous metals. Coffee prices continued
to rise throughout the second quarter while import prices of nonferrous
metals remained generally high.
Imports, therefore, have continued at high levels throughout
the first half of 1970 despite a slowing in the domestic economy.
The ratio of imports to GNP rose to 4.1 per cent in the second quarter.
In other recent periods of economic slowdown (i.e., in 1960-61
or even in 1967) the import-GNP ratio leveled off or fell. Several
factors may help explain why imports have remained as strong as they
have in the first half of 1970. The bulk of the U.S. slowdown has
resulted from lower Federal government expenditures and smaller business
inventories, while domestic expenditures on consumer goods have continued

IV - 13
to grow. Since highly finished goods (automobiles, other nonfood
consumer goods, and capital equipment) now comprise a larger share
of U.S. imports than in any earlier period (55 per cent in the first
half of this year), continued U.S. demand for these products have
sustained aggregate imports. In particular, the upward trend in
imports of autos from Canada and elsewhere has remained strong.
Persistently high domestic prices have encouraged a shift by both
consumers and producers toward lower-priced imported products; at the
same time, incomes have remained high encouraging the importation of
more luxury-type consumer goods.

IV - 14
Foreign trade of major industrial countries. In the first
half of this year, world trade expanded rapidly, particularly among
industrial countries. Imports of a number of industrial countries
expanded faster than their exports. However, increases in the trade
balances of France, the United States, Canada and Japan outweighed in
the aggregate decreases for the other industrial countries.
In each case where trade balances have increased, this has
been largely the result of stabilization measures, which in Canada
and the United States have caused the economy to operate with a
considerable degree of slack; in France, they were combined with a
devaluation last year and have removed excess demand. In Japan also,
restrictive demand management actions halted the decline in the still
large trade surplus last year, and increases in exports are once more
outrunning those in imports. Buoyant external demand was an added
factor in the reversal of trade balance trends from declines to
increases for these countries.
For most other countries, rapid expansion of exports has
added to general demand pressures. Differential developments in
trade positions resulted largely from differential responses of
import demand. Germany, like Japan, is continuing to maintain an
large trade surplus as the increase in German imports has not been
large enough--despite internal excess demand and a revaluation of
the DM--to exceed significantly the rise in exports. Still, import
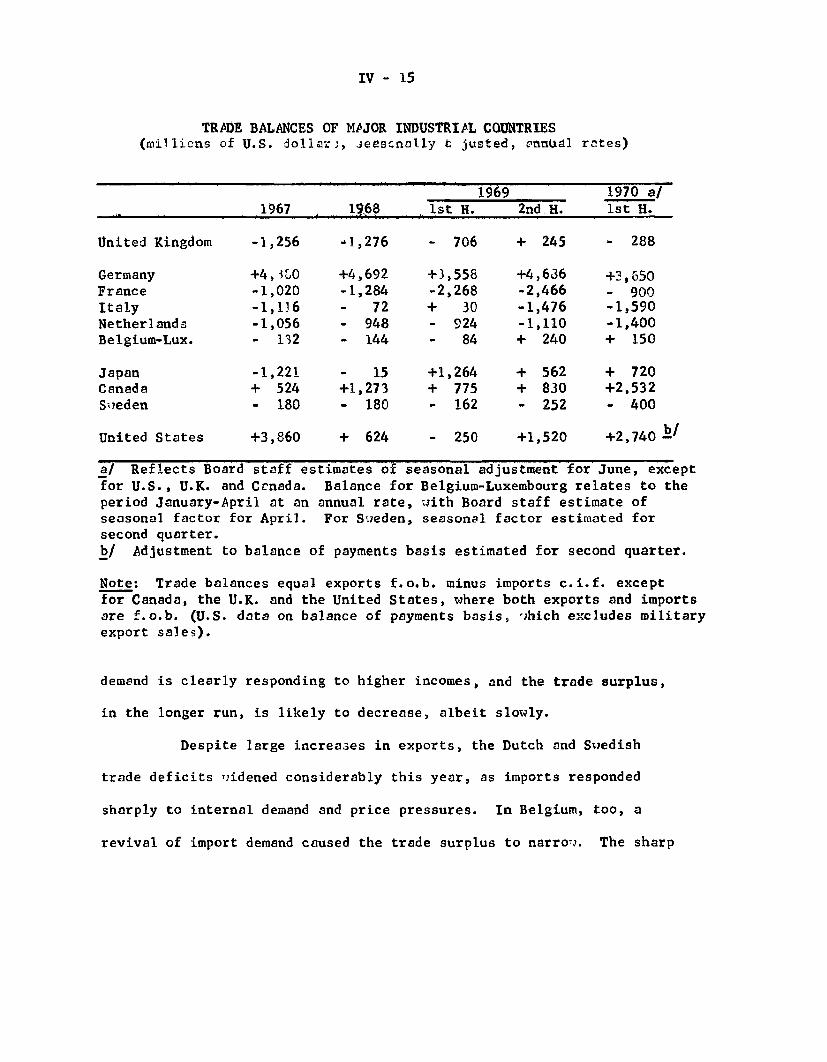
IV - 15
TRADE BALANCES OF MAJOR INDUSTRIAL COUNTRIES(millions of U.S. dollars, seasonally adjusted, annual
United Kingdom
GermanyFranceItalyNetherlandsBelgium-Lux.
JapanCanadaSweden
United States
1967
-1,256
+4, 0O-1,020-1,116-1,056- 132
-1,221+ 524- 180
+3,860
19068
-1,276
+4,692-1,284- 72- 948- 144
- 15+1,273- 180
+ 624
1969 1970 a/1969
1st H. 2nd H.
- 706 + 245
+3,558 +4,636-2,268 -2,466+ 30 -1,476- 924 -1,110- 84 + 240
+1,264 + 562+ 775 + 830- 162 - 252
- 250 +1,520
a/ Reflects Board staff estimates of seasonal adjustment for June, exceptfor U.S., U.K. and Canada. Balance for Belgium-Luxembourg relates to theperiod January-April at an annual rate, with Board staff estimate ofseasonal factor for April. For Sweden, seasonal factor estimated forsecond quarter.b/ Adjustment to balance of payments basis estimated for second quarter.
Note: Trade balances equal exports f.o.b. minus imports c.i.f. exceptfor Canada, the U.K. and the United States, where both exports and importsare f.o.b. (U.S. data on balance of payments basis, which excludes militaryexport sales).
demand is clearly responding to higher incomes, and the trade surplus,
in the longer run, is likely to decrease, albeit slowly.
Despite large increases in exports, the Dutch and Swedish
trade deficits widened considerably this year, as imports responded
sharply to internal demand and price pressures. In Belgium, too, a
revival of import demand caused the trade surplus to narrow. The sharp
rates)
1970 a/1st H.
S288
+3,650- 900-1,590-1,400+ 150
+ 720+2,532- 400
+2,740
-
IV - 16
deterioration in Italy's trade balance resulted from continuing labor
difficulties which have not only held back exports, but have also caused
a shift to imports in order to satisfy rapid rises in internal demand.
Only the United Kingdom has not fully shared in the increased
export activity, although the economy is operating at less than full
capacity. Exports have risen only slightly since the end of last year,
While imports have rebounded. As a result, the emergence of a British
trade surplus from mid-1969 proved to be short-lived and since April,
1970 there have once more been successive monthly deficits.
Trade among industrial countries expanded faster than world
trade in the first half of 1970. Imports of OECD countries from the
rest of the world during January-April, 1970 were 11 per cent above
the first half of 1969, while intra-OECD trade expanded by more than
20 per cent. OECD exports to other countries grew by 16 per cent over
the period, so that the trade surplus of the non-OECD countries has
narrowed considerably.
The steady improvement in the British trade balance,
which had begun in the second half of 1968, came to a halt early
this year. The slim surplus which had emerged in the second half
of 1969 had turned into a deficit once more by the second quarter
of 1970 (on an f.o.b.-f.o.b. basis). The second quarter deficit,
at an annual rate of almost $900 million, compares with surpluses
averaging $250 million in the preceding three quarters, but is
still fell below the rate of annual deficits recorded in the 1964-
1968 period. Although British exports to the Continent and the

IV - 17
sterling area have been buoyant, exports to the U.S. declined sharply
in the second quarter while those to Canada remained roughly the same.
Given relatively high employment, a trade deficit would
normally be expected for Britain, but the current deterioration in
the trade balance has taken place at a time when the pace of economic
activity has been below potential. In fact, GDP fell in the first
quarter of this year and probably did not grow much--if at all--in
the second quarter. Despite the sluggishness in domestic output,
imports have grown at an accelerating rate since the beginning of
the year, while exports have been increasing only slightly. Imports
rose by about 7-1/4 per cent in the second quarter of 1970 (excluding
U.S. military aircraft financed by the Export-Import Bank), over three
times as fast as in the first quarter, with about one-third of this
rise accounted for by rising unit values. The less than 3 per cent
rise in exports since the end of last year was almost entirely the
result of rising unit values.
Although several "special" factors--anticipation of a dock
strike, a bulge in imports from Canada following the end of strikes
there, and deliveries of jumbo jets in May and June--have contributed
to the re-emergence of the trade deficit, Britain's trade situation
gives cause for concern. New export orders for machinery and equip-
ment declined last spring (although orders on hand were still increasing
slightly). The rapid rise in imports, which has been concentrated
primarily in finished manufactures and industrial materials, probably
IV - 18
reflects some inventory accumulation and the response of final demand
to rising prices. Despite the rise in imports, the Government announced
last month that the import deposit requirement--which affects slightly
less than half of total British imports--would be lowered from 30 to 20
per cent, effective September 1, and totally removed in December.
The revaluation of the mark has thus far not led to a decrease
in the German trade surplus. The surplus during the first half of this
year was at an annual rate of $3.6 billion, virtually the same as during
the first 6 months of 1969. This is well below the $4-1/2 billion rate
of 1967-68 and of the second half of 1969. But the 1967-68 surpluses
were recorded at a time when the economy was operating well below capacity
and the second half of 1969 was distorted by pre-revaluation flows. This
year's surplus, although inflated somewhat by the short-run "terms of
trade" effect of the parity change, is being achieved at very high pres-
sures upon industrial capacity. Foreign demand for German output has
not yet been significantly affected by the higher prices of German goods.
The volume of German exports during the first 4 months of this year was
over 8.5 per cent higher than in the corresponding 1969 period. Imports
have risen at a somewhat faster rate, reflecting the strong domestic
expansion, but from a lower base. A very large order backlog still
exists in the export sector, and the expected moderation of domestic
demand and price pressures during the remainder of the year is likely
to slow import growth. Thus, only little shrinkage in the surplus can
be expected during the course of this year.
IV - 19
The prices of German exports, in marks, were continuing to
rise last spring--in April-May they were 2.5 per cent higher than in
September--as German producers passed on some of their substantial
increases in labor and other production costs. The revaluation,
partially offset by border tax adjustments, added roughly 5 per cent
to the foreign currency costs of German goods. On the import side,
foreign suppliers to Germany have raised their prices in their own
currencies since the DM revaluation, so that the DM prices of German
imports in May were down only 1.4 per cent from September.
There has been no marked change in the direction of German
trade since the revaluation. The other EEC member countries are
continuing to increase their share of the German market, with Dutch
and Belgian exporters enjoying the most significant gains. French
exports to Germany have not shown particular strength relative to the
other EEC countries this year even though French exporters have the
benefit of the franc devaluation as well as the upvaluation of the
mark.
The U.S. share in both
about 10 per cent, but there has
bilateral surplus for the United
that in January-May of this year,
with Germany, whereas in 1968 and
of approximately $500 million and
German exports and imports is only
been a rather substantial swing toward
States. German data sources indicate
the U.S. ran a $160 million surplus
1969, the U.S. had run trade deficits
$100 million, respectively. A large

IV - 20
increase in U.S. exports to Germany--particularly of metals and
civilian aircraft--was largely responsible for this reversal.
A strong rise in French exports, combined with only a
moderate increase in imports, resulted in a virtual balance of the
French trade account (f.o.b.-f.o.b. basis) with the non-franc area
during the first half of this year. During the corresponding 1969
period, there had been a trade deficit on this basis of $1.8 billion
at an annual rate. (In the table, the balance is shown with imports
on a c.i.f. basis and inclusive of trade with the franc area.)
The rise in French exports (17 per cent in the first 5
months of this year as compared with a year earlier) was more or less
in line with the rate of expansion of total OECD trade. France does
not seem to have improved her share in total trade despite the 11.1
per cent devaluation of the French franc in August last year. French
exporters have absorbed the devaluation advantage in profit margins
rather than passing it on in price decreases. Thus, unit values of
French exports in May 1970 were 13-1/2 per cent higher than in July
1969. The smallness of the rise in imports can be attributed to a
drawing down of imported stocks built up last summer prior to the
franc and mark parity changes, to severe installment credit controls
implemented last September which have damped down demand for consumer
durables, and to the extra rise in franc prices of imports owing to
devaluation.

IV - 21
Italy's trade deficit for the first half of 1970 was at an
annual rate of nearly $1.6 billion (with imports valued c.if.).
While only slightly larger than the $1.5 billion deficit registered
in the second half of last year, this compares to a near-zero balance
in the trade account during the first 6 months of 1969.
Labor difficulties have held industrial production well
below its potential level and have affected the foreign trade balance
primarily by restricting exports. Despite an appreciable rise in
exports in the second quarter, the total for the first half was only
7.7 per cent more than a year earlier, which compares with a 23 per
cent rise for January-June 1969 relative to the comparable 1968 period.
The export products that have been most adversely affected this year
have been textiles, paper, metals, chemicals and motor vehicles.
Internal demand has been rising quite rapidly in Italy, and
with industrial production constrained in a number of sectors, there
has been a very swift increase in the demand for imports of manufactured
and semimanufactured goods. Particularly noteworthy increases have
occurred in imports of iron and steel, motor vehicles, and copper and
copper alloys. The limited rise in domestic production, however, has
tended to depress imports of some industrial materials such as textile
fibers, iron ore and scrap metals. Total imports in the first half
showed a year-to-year rise of over 21 per cent.
The principal changes in the regional distribution of Italian
exports have been a decline in the proportion going to France since the

IV - 22
devaluation of the franc a year ago--which mainly reflects the unwinding
of anticipatory purchases by French importers before the parity change--
and an increase in the relative importance of the German market--a result
of boom conditions there and, perhaps to some extent, of the mark revalu-
ation. The relatively small increase in imports of raw materials was
the main reason why the share of the less developed countries in total
Italian imports decreased somewhat after mid-1969.
For the first 6 months of the year, the Netherlands had a
very large trade deficit of roughly $1.4 billion, at an annual rate.
While the value of Dutch exports was 20 per cent higher in this period
than in the first half of 1969, Dutch imports were 22 per cent higher--
reflecting the large import content of Dutch exports, stockbuilding,
and domestic demand for consumer goods. The prices of imported goods
have risen almost 6 per cent since the revaluation of the German mark.
Since imports are equal in value to about one-third of Dutch GNP, this
has no doubt added importantly to the price pressures being experienced
in the domestic economy.
The growing importance of the other EEC countries as suppliers
and customers continues to characterize Dutch trade. These countries
account for roughly 60 per cent of Dutch imports and exports, Germany
alone about 30 per cent. There has been an exceptionally rapid rise
this year in sales to Germany, which were up over 35 per cent from the
first half of 1969.
IV - 23
The substantial deterioration in Sweden's foreign trade
position since mid-1969 reflects an excess demand situation which
economic policy has thus far not been able to restrain successfully.
During January-June. 1970 the trade deficit ran at an annual rate
of $400 million, which compares to a deficit of $162 million during
the comparable 1969 period. Although exports increased in value by
17 per cent, imports rose about 23 per cent. The rise in imports
from Germany, the U.K., Denmark and the U.S. was particularly large.
There is as yet no indication that this high import growth rate, which
reflects domestic demand and price pressures, is slowing. There may
even be an acceleration during the remainder of this year if Swedish
consumers substantially increase their purchases before the scheduled
increase in the value-added tax at the end of this year.
The Belgium-Luxembourg Economic Union registered a trade
surplus of $150 million at an annual rate during the first 4 months
of this year. Imports had virtually ceased to expand after mid-1969,
reflecting a moderate slowdown in the expansion of internal demand,
the cessation of speculative purchases from Germany after the mark
was revalued, and inventory adjustments of imported industrial materials.
The surplus that developed then has been narrowed this year by renewed
import growth--probably a result of a higher rate of inventory accumu--
lation rather than an acceleration of domestic economic activity as a
whole.
IV - 24
Japan's trade surplus widened once more in the first half
of this year to approximately $720 million at an annual rate from
$560 million in the preceding half year (imports valued c.i.f.).
Exports rose sharply, particularly to the EEC countries, which now
purchase roughly 6 per cent of total Japanese exports. Trade with
the United States, Japan's largest single trading partner, has
represented a smaller proportion of total exports (about 30 per
cent) and a larger proportion of imports (about 29 per cent) in the
last few years.
Japan recently has experienced substantial gains in its
exports of electrical machinery and automobiles. A decline of 18
per cent in exports of iron and steel to the U.S. in 1969 was more
than offset by a three-fold rise in sales to Western Europe.
Continued strong domestic demand during the second half of
1969 contributed to a large rise in raw materials imports, particularly
metals. Imports of coal and ores from Oceania, Southeast Asia and
Latin America increased markedly. There were also large increases in
imports of certain manufactured goods such as computers and aircraft,
and certain foodstuffs, such as meat and marine products.
The Canadian trade surplus in the first half of 1970 ran at
an annual rate of $2.5 billion, very much higher than that registered
in the first half of 1969. Exports increased by 16 per cent, while
imports rose less than 2 per cent. A marked easing of demand pressures
IV - 25
in Canada and relatively high levels of denand in western Europe and
continued growth in import demand in the United States have been the
primary factors behind this substantial change in the Canadian trade
account. Increased sales of Wheat and the unwinding of the effects
of strikes which had occurred in important export industries, such
as nickel and iron ore, in 1969, were also factors in the improvement.
Rapidly growing exports of automobiles and parts added further to
Canada's trade balance. The large surplus provided one of the main
sources of the exchange inflows which preceded the floating of the
Canadian dollar on June 1.
Canada's foreign trade continues to be predominantly with the
United States; approximately 75 per cent of Canadian imports come from
the U.S., and about 68 per cent of Canada's exports are sold in the
American market. Items covered by the 1965 automobile agreement now
represent over 25 per cent of U.S.-Canadian trade, compared to less than
20 per cent in 1967 and just over 10 per cent in 1965. Exports of crude
oil to the U.S. have also sharply expanded in recent years, although
this source of export growth may be ended by recent U.S. restrictions
on oil imports from Canada.
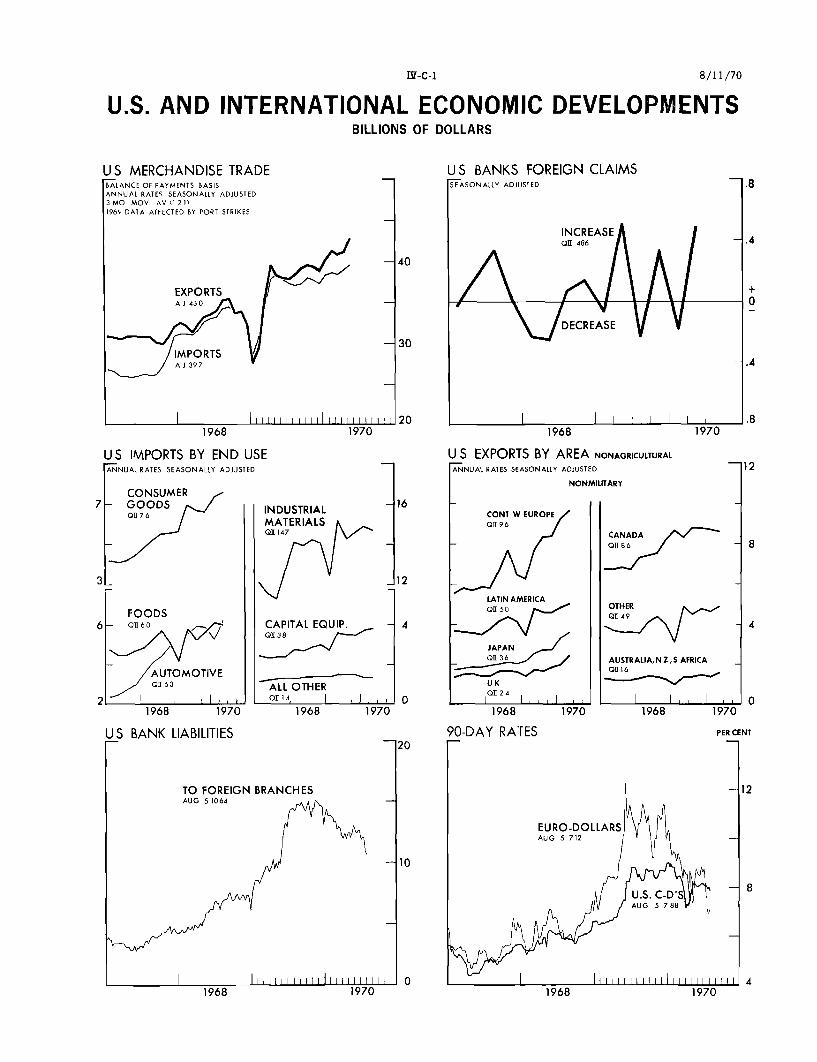
IV-C-1 8/11/70
U.S. AND INTERNATIONAL ECONOMIC DEVELOPMENTSBILLIONS OF DOLLARS
JS MERCHANDISE TRADE US BANKS FOREIGN CLAIMSBALANCE OF PAYMENTS BASIS SEASONALLY ADJUSTEDANNUAL RATES SEASONALLY ADJUSTED3 MO MOV AV (1 2111969 DATA AFFECTED BY PORT STRIKES
AS486INCREASE
,AA/\ DECREASE V
1968 19701968 1970
.8
JS IMPORTS BY END USEANNUAL RATES SEASONALLY ADJUSTED
CONSUMER- GOODS
011 76
FOODS- 060
AUTOMOTIVE1H 63
1968 1970
INDUSTRIALMATERIALS011147
CAPITAL EQUIP.
ALL OTHERo011 4 I I I
1968 1970
US EXPORTS BY AREA NONAGRICULTURALANNUAL RATES SEASONALLY ADJUSTED
I NONMILITARY
CONT W EUROPEQ1 96
LATIN AMERICAQII50
JAPAN
UKQ01 2 4
1968 1970
CANADA1186
OTHERQ149
AUSTRALIA, N Z, S AFRICAQU 16
1968 1970
-12
90-DAY RATES PERCENT
r