Embed Size (px)
Citation preview

Prefatory Note The attached document represents the most complete and accurate version available based on original copies culled from the files of the FOMC Secretariat at the Board of Governors of the Federal Reserve System. This electronic document was created through a comprehensive digitization process which included identifying the best-preserved paper copies, scanning those copies,1
and then making the scanned versions text-searchable.2
Though a stringent quality assurance process was employed, some imperfections may remain. Please note that some material may have been redacted from this document if that material was received on a confidential basis. Redacted material is indicated by occasional gaps in the text or by gray boxes around non-text content. All redacted passages are exempt from disclosure under applicable provisions of the Freedom of Information Act. 1 In some cases, original copies needed to be photocopied before being scanned into electronic format. All scanned images were deskewed (to remove the effects of printer- and scanner-introduced tilting) and lightly cleaned (to remove dark spots caused by staple holes, hole punches, and other blemishes caused after initial printing). 2 A two-step process was used. An advanced optical character recognition computer program (OCR) first created electronic text from the document image. Where the OCR results were inconclusive, staff checked and corrected the text as necessary. Please note that the numbers and text in charts and tables were not reliably recognized by the OCR process and were not checked or corrected by staff.
Content last modified 6/05/2009.

CONFIDENTIAL (FR)
CURRENT ECONOMICand
FINANCIAL CONDITIONS
Prepared for the
Federal Open Market Committee
By the Staff
BOARD OF GOVERNORS
OF THE FEDERAL RESERVE SYSTEM November 16,1996

CONFIDENTIAL (FR)
CURRENT ECONOMIC AND FINANCIAL CONDITIONS
By the StaffBoard of Governors
of the Federal Reserve SystemNovember 16, 1966

I 1
SUMMARY AND OUTLOOK
Outlook for GNP
Since midyear, real GNP has been growing at a rate close to
4 per cent. This expansion has been accompanied by some moderation in
the rate of price increases, by little change in the unemployment rate,
and by mild slackening in pressures on manufacturing capacity.
The Department of Commerce has revised GNP downward for the
third quarter, and now shows a rise on only $12.3 billion from the
second quarter, as compared with a preliminary estimate of a $13.7
billion increase. About $1 billion of the revision resulted from a
smaller-than-expected increase in inventories in September.
We are now estimating the fourth quarter rise in GNP at
about $13 billion -- or, in real terms, at an annual rate of 4 per
cent. The available evidence, including the large further build-up in
order backlogs for machinery and other durable goods through September,
indicates defense spending and business fixed investment is continuing
to rise at a fast pace. With nonfarm employment resuming an upward
course in October and wage rate increases continuing large, personal
income is also rising strongly.
The rise projected for consumer spending, while still
sizable, is somewhat below earlier estimates, however, and is not so
large as in the third quarter. Some decline for the quarter in auto
sales seems indicated by recent sales figures, and little, if any,
rise in purchases of other durables, following appreciable increases

I - 2
in the third quarter. Business inventory accumulation is expected to
decline moderately further, as a result of continued pressures to limit
stocks of consumer goods and construction materials and equipment. The
GNP deflator is expected to rise somewhat less than in the third quarter.
Looking ahead to the early months of 1967, many indications
still point to continued economic expansion at close to the current
rate, barring major changes in the pace of defense spending or in tax
policies. In view of the backlog of orders and commitments on hand,
as well as continuing strong capacity pressures in specific industries,
expansion in business plant and equipment spending should taper off
only gradually. This is likely to be the case even though recent
reports on business capital spending plans point to a distinctly smaller
increase in such outlays for the year 1967 as a whole. The possibility
of rather sharp cutbacks in business accumulation of inventories cannot
be ruled out, if retail sales remain sluggish. But if the current rate
of expansion in government and business capital expenditures is generally
maintained in the first quarter of next year, prospects are for sub-
stantial further gains in wage and salary income and for consumer
demands for goods and services to continue to rise substantially.

I-3
Resource use and prices
Expansion in industrial production has slowed in recent
months. Customary seasonal increases are greatest in September and
October, however, and in many of the business- and defense-related
industries, further expansion in output no doubt was limited by
capacity or other physical resources. In other industries where
capacity has not been strained -- such as steel, building materials,
and most consumer durable goods -- output has leveled off or declined
as a result of easing in demands. Reflecting both kinds of develop-
ments, capacity utilization rates are probably declining somewhat from
recent highs. The unemployment rate has continued just below 4 per
cent, and rates remain low for prime age and skill categories.
Industrial prices have been stable in recent months, as
prices of a few sensitive materials have been undergoing reversal of
extraordinary increases that occurred earlier and increases in other
commodities have been at a slower pace. Declines in sensitive material
prices may be about over, however, and without this offset, the
industrial average is likely to resume its rise. The rise may be no
more rapid than the 2 per cent over the past year, however, and it
could be less.
Upward pressure on prices is resulting from a spreading of
wage increases in excess of the gain in productivity. However, this
upward pressure may be tempered by some easing in demands relative to
resources in such areas as consumer durable goods, building materials,
I-4
steel and some other materials and equipment, for which prices
increased an average of 4 per cent over the past year, unfilled orders
are high and production rates are straining facilities; but the recent
survey of plant and equipment spending in 1967 suggests a coming
weakening in new orders. From a buyers' point of view, moreover,
prices of equipment have already been raised 7.5 per cent by suspension
of the investment tax credit.
The upward push of wages will also continue to exert an
important influence on prices of services, especially with the increase
in the minimum wage that takes effect next February. On the other
hand, the long-awaited improvement in supplies of foods is underway.
For the next several months at least, therefore, retail prices of foods
should decline, and the rise in the total consumer price index should
moderate.
Banking prospects
Expansion in bank loans to business over the next few weeks
preceding the mid-December tax period may be close to, and possibly
below, the moderate October pace. The trend in business loans at city
banks, after allowance for usual seasonal changes, appears to have been
weaker in late October and early November than it had been in late
September and early October. Weakness or moderation in borrowing has
been quite general among industry categories, suggesting that this is
not simply a temporary phenomenon; it probably is associated in part
with some slackening in business inventory accumulation.

I - 5
While there are scattered indications of some reduction in
loan demands, vigorous loan rationing by big banks is continuing in
response to the cumulative squeeze on liquidity that has developed as
these banks have adjusted to the run-offs in CD's. Although CD run-
offs moderated somewhat during recent weeks, banks do not appear to
expect any marked change over the coming weeks in funds available to
accommodate loan demands.
Under the circumstances, banks may have to continue
liquidating investments and bidding for Euro-dollar funds if they are
to support even relatively moderate loan growth. Still, at the moment,
banks do not foresee a market pinch as tight as, say, late summer.
This assumes monetary policy does not permit a further tightening of
money market conditions as the December tax date approaches, when bill
rates tend to rise, sales finance company and nonfinancial business
demands on banks increase, and greater pressure would be put on banks'
ability to roll over maturing CD's.
Capital markets outlook
Substantial recent additions to the forward calendar of new
corporate and municipal bonds have contributed to some recovery in
yields on recently offered issues in these markets during November.
At the moment, it appears that the December volume of corporate public
offerings may ultimately total nearly $1 billion, second only to the
$1.1 billion marketed in August. And with the AT&T issue and several
utility bonds already scheduled for January, volume in that month too

I-6
is building up. In the municipal market, estimated December offerings
are larger than a year ago; this represents a change from October-
November when offerings had fallen below year-ago levels.
Yields on Treasury notes and bonds have also been moving up
in recent weeks, reflecting in part some selling of outstanding issues
on switches into the new notes offered by the Treasury in the November
refunding. The market for Governments has also reacted to the recent
additions to the corporate bond calendar and to rumors of a possible
sale of FNMA participation certificates in December.
Bond yields during the coming weeks are likely to edge
higher on balance. The enlarged supply of corporate and municipal
securities coming to market in the weeks immediately ahead is likely
to maintain upward pressures on such yields -- particularly if other
near-term additions to the supply of new corporate issues are still in
the offing and if the Treasury does market participation certificates
in December to raise cash while remaining under the debt ceiling. The
overhang of Treasury coupon issues from the November refunding may also
add to market pressures. These pressures will be intensified if money
market conditions remain tight, as associated high dealer financing
costs make it burdensome for dealers and underwriters to carry current
relatively large positions. However, over the longer run, most market
participants look for steady to lower long-term rates, in view of the
expected moderation of the investment boom and of a fiscal-monetary
policy mix favorable to an easing of credit market pressures.

I- 7
Balance of payments
So far this year, the over-all payments position has not
been as unfavorable as was earlier feared, mainly because of large
inflows of foreign capital. However, these inflows are vulnerable to
abrupt cessation or reversal. On almost any plausible set of assump-
tions, a payments deficit of troublesome proportions (more than
$1 billion on both bases of calculation) seems likely for next year,
even if the trade surplus improves and even if voluntary programs and
the I.E.T. continue to restrain outflows of U.S. capital.
Preliminary data for October and early November suggest that
the deficit on the liquidity basis has continued at roughly the $2
billion annual rate that would have been registered during the first
9 months if foreign official and international institutions had not
shifted funds from liquid to nonliquid U.S. assets. The actual rate
for the 9 months, including such shifts, was $1.2 billion.
The balance on the official reserve transactions basis
(which has been little affected by the asset shifts mentioned) was
apparently near zero in October and early November, as inflows of
foreign liquid funds through foreign branches of U.S. banks continued
very large. During the first 9 months, there was an official settle-
ments surplus at an annual rate of $0.8 billion, thanks largely to the
unprecedented $2 billion inflow of liquid funds through the branches
in that period. Cessation and partial reversal of the inflow is
probably to be expected in the closing weeks of the year. Hence, the

I -8
official settlements balance may revert to deficit, although it may
still show a surplus for the year as a whole.
The outlook for the merchandise trade surplus in 1967 is
for some improvement from 1966, particularly from the low level reached
in the third quarter. U.S. Government analysts now expect exports to
increase at about a 12-13 per cent annual rate, despite reduced demand
from Britain, as a result of increasingly buoyant demand in Japan,
France, and Italy, and continued strength in the demands of Canada and
primary producing countries. They expect a marked slowing down in the
expansion of imports, to an annual rate from now on of less than 10 per
cent, assuming some easing of domestic demand pressures, especially for
capital equipment and inventories.
Most analysts expect that outflows of U.S. private capital
will not decline further from 1966 to 1967 and may increase. Even if
the guidelines are tightened somewhat, there may be some renewed out-
flow of bank credit, in contrast to this year's reflow, and some increase
in the outflow of direct investment capital (net of foreign borrowings).
How large the changes in capital flow might be would depend importantly
on domestic monetary conditions, on the strength of credit demands from
abroad, and on the nature and effectiveness of the voluntary restraint
programs.
November 15, 1966
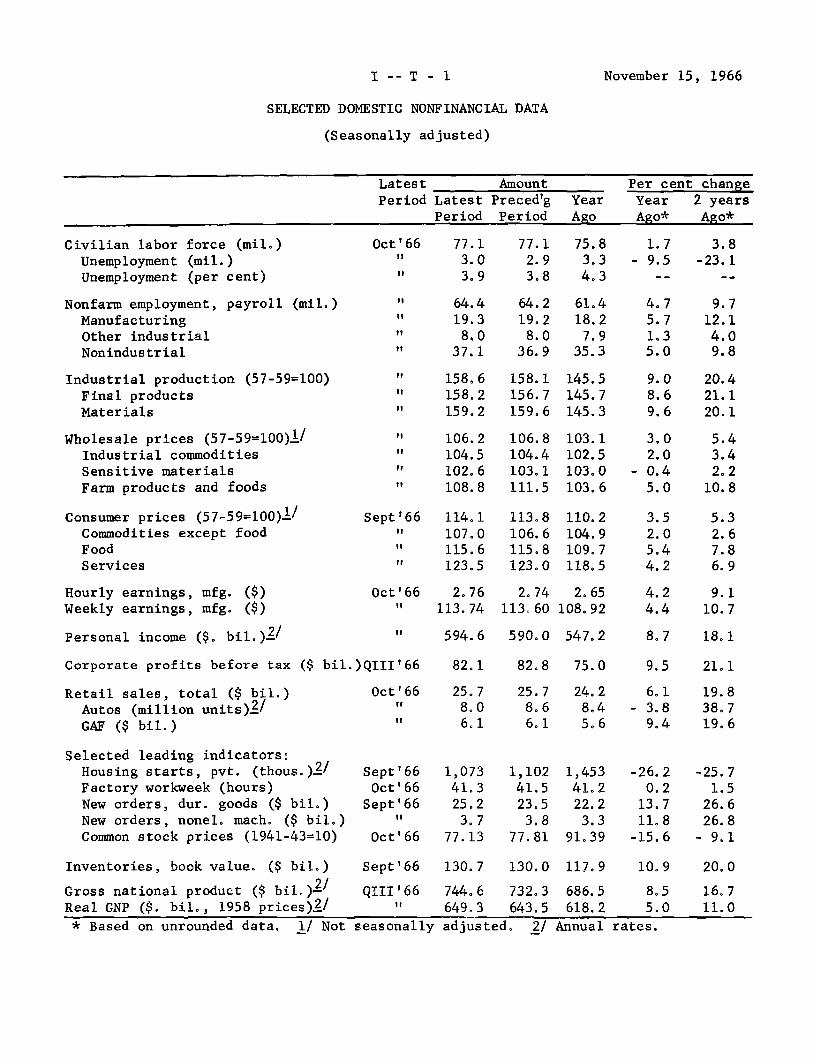
SELECTED DOMESTIC NONFINANCIAL DATA
(Seasonally adjusted)
Latest Amount Per cent changePeriod Latest Preced'g Year Year 2 years
Period Period Ago Ago* Ago*
Civilian labor force (mil.)Unemployment (mil.)Unemployment (per cent)
Nonfarm employment, payrollManufacturingOther industrialNonindustrial
Oct'66I
(mil.)
Industrial production (57-59=100)Final productsMaterials
Wholesale prices (57-59=100)!/Industrial commoditiesSensitive materialsFarm products and foods
Consumer prices (57-59=100)./
Commodities except foodFoodServices
Hourly earnings, mfg. ($)Weekly earnings, mfg. ($)
II
1
"
Sept'66I'
"
77.13.03.9
64.419.38.0
37.1
158.6158.2159.2
106.2104.5102.6108.8
114.1107.0115.6123.5
77.12.93.8
64.219.2
8.036.9
158.1156.7159.6
106.8104.4103.1111.5
113.8106.6115.8123.0
75.83.34.3
61.418.2
7.935.3
145.5145.7145.3
103.1102.5103.0103.6
110.2104.9109.7118.5
Oct'66 2.76 2.74 2.65" 113.74 113,60 108.92
1.7 3.8- 9.5 -23.1
4.75.71.35.0
9.712.14.09.8
9.0 20.48.6 21.19.6 20.1
3.02.0
- 0.45.0
3.52.05.44.2
4.24.4
5.43.42.2
10.8
5.32.67.86.9
9.110.7
Personal income ($. bil.)./ " 594.6 590.0 547.2
Corporate profits before tax ($ bil.)QIII'66 82.1 82.8 75.0
Retail sales, total ($ bil.)Autos (million units)2/GAF ($ bil.)
Selected leading indicators:Housing starts, pvt. (thous.)2 /Factory workweek (hours)New orders, dur. goods ($ bil.)New orders, nonel. mach. ($ bil.)Common stock prices (1941-43=10)
Inventories, book value. ($ bil.)
Gross national product ($ bil.)-Real GNP ($. bil., 1958 prices)_/
Oct' 66
Sept'66Oct' 66
Sept'66Oct66
Oct'66
25.78.06.1
1,07341.325.2
3.777.13
Sept'66 130.7
QIII'66 744.6" 649.3
25.78.66.1
1,10241.523.5
3.877.81
24.28.45.6
1,45341.222.2
3.391.39
130.0 117.9
732.3 686.5643.5 618.2
* Based on unrounded data. 1/ Not seasonally adjusted. 2/
8.7 18.1
9.5 21.1
6.1 19.8- 3.8 38.7
9.4 19.6
-26.20.2
13.711.8
-15.6
10.9
8.55.0
rates.
-25.71.5
26.626.8
- 9.1
20.0
16.711.0
I -- T - 1
Annual

I -- T - 2 November 15, 1966
SELECTED DOMESTIC FINANCIAL DATA
Week ending Four-Week Last six monthsNov. 11 Average High Low
Money Market 1/ (N.S.A.)Federal funds rate (per cent) 5.75 5.54 6.25 3.00
U.S. Treas. bills, 3-mo., yield (percenQ 5.41 5.32 5.59 4.33
Net free reserves 2/ (mil. $) - 249 - 312 - 94 - 583Member bank borrowings 2/ (mil. $) 646 637 928 518
Security Markets (N.S.A.)Market yields 1/ (per cent)
5-year U.S. Treas. bonds 5.34 5.28 5.89 4.8220-year U.S. Treas. bonds 4.88 4.80 5.12 4.65Corporate new bond issues, Aaa -- 5.74 5.98 5.15Corporate seasoned bonds, Aaa 5.35 5.37 5.42 5.34Municipal seasoned bonds, Aaa 3.72 3.76 3.99 3.52FHA home mortgages, 30-year 3/ 6.63 6.63 6.63 6.32
Common stocks S&P composite index 4/Prices, closing (1941-43=10) 81.49 79.83 87.45 73.20Dividend yield (per cent) 3.63 3.67 3.89 3.29
Change Average Annual rate ofin change change (%)
Oct. last 3mos. 3 mos. 1 yearBanking (S.A., mil. $) 6/Total reserves - 187 - 155 - 7.9 2.5
Bank loans and investments:Total - 600 - 400 - 1.4 6.3
Business loans 700 400 6.7 11.9Other loans 500 - 100 - 1.2 9.0U.S. Government securities -1,800 - 600 -14.0 - 9.1Other securities 100 0 - 0.8 7.3
Money and liquid assets:Demand dep. & currency - 900 0 0 2.7Time and savings dep. - 300 500 3.9 9.9Nonbank liquid assets 5 / -1,200 600 2.5 4.6
N.S.A.--not seasonally adjusted. S.A. Seasonally adjusted.1/ Average of daily figures. 2/ Averages for statement week ending November 9.3/ Latest figure indicated is for month of September. 4/ Data are for weekly closingprices. 5/ Change in September. 6/ Where necessary, comparisons shown below havebeen adjusted for definitional changes in June and July.

I - T-3
U.S. BALANCE OF PAYMENTS(In millions of dollars)
1 9 6 6 1965 1965Sept. Aug. QIII QII QI QIV QIII Year
(billions)Seasonally adjusted
Current account balance
Trade balance 1/Exports 1/Imports 1/ 2/
Services, etc., net
Capital account balance
1,084 1,348 1,290 1,527 6.0
2352,490
-2,255
2852,470
-2,185
7257,405
-6,680
8537,111
-6,258
1,1687,171
-6,003
1,2717,027
-5,756
1,2316,826
-5,595
4.826.3
-21.5
19 296 1.2
-1,175 -1,586 -1,542
Govt. grants & capital 3/U.S. private direct investmentU.S. priv. long-term portfolio
U.S. priv. short-termForeign nonliquid
-961-957-94-53890
-948-687-219
-2270
-881-731-154
-27251
-1,821
-743-569-363
105-251
-6.9
-3.4-3.4-1.1
0.80.2
Errors and omissions -66 -268 -80 -240 -0.4
Balances, with and without seasonal adjustment (- = deficit)
Liquidity bal., S.A.Seasonal componentBalance, N.S.A.
Official settlements bal.,Seasonal componentBalance, N.S.A. 4/
-217-495
112 -322 -712
993-521
25 472
Memo items:Monetary reserves
(decrease -)Gold purchases or
sales (-)
-139 -133 -82
37 -94 -173 -209
-68 -424 -271 -41 -1.2
-68 -119 -124 -1.7
Balance of payments basis which differs a little from Census basis.Monthly figures tentatively adjusted for changes in carry-over of import documents,Net of loan repayments.Differs from liquidity balance by counting as receipts (+) increases in liquidliabilities to commercial banks, private nonbanks, and international institutions(except IMF) and by not counting as receipts (+) increase in certain nonliquidliabilities to foreign official institutions.
-125-27
-152
-198-182-380
-536488-48
-226628402
-332-3
-335
-1,15833
-1,125
-534-472
-1,006
232-508-276
-1.3
-1.3
-1.3
-1.3

II - 1
THE ECONOMIC PICTURE IN DETAIL
The Nonfinancial Scene
Gross national product. GNP was at a seasonally adjusted
annual rate of $744.6 billion in the third quarter, according to the
latest Commerce Department estimates. This represents a downward
revision of $1.4 billion from the preliminary estimate. The rise from
the second quarter now totals $12.3 billion -- only about $1 billion
larger than the relatively small increase from the first to the second
quarter. Downward revision in the dollar aggregate was accompanied by
some upward revision in the price deflator and indicated real growth in
the third quarter was lowered to a 3-1/2 per cent annual rate from the
month-ago preliminary estimate of 4-1/2 per cent.
For the current quarter, we are projecting GNP at $757.5
billion, up about $13 billion from the third quarter. With price in-
creases estimated to slow somewhat further from the peak rate reached
in the second quarter, real growth is projected at the rate of 4 per
cent a year.
Despite the downward revision, the third quarter picture re-
mains one of stepped-up gains in defense spending, business fixed invest-
ment, and consumer purchases. Together gains in these sectors totaled
$16 billion, double their second quarter increase. Partly offsetting
gains in these lines, inventory investment was lower (the rate of
nonfarm accumulation was down $1.7 billion from the second quarter --
about $1 billion larger decrease than was estimated a month ago) and

II 2
residential construction activity decreased $3.2 billion, or 11 per
cent, from the second quarter. Moreover, more complete figures for the
quarter revealed a further decline in net exports rather than the leveling
off estimated earlier.
The $13 billion rise we now estimate for the fourth quarter
is nearly $1 billion less than the projection of three weeks ago,
although on the evidence of new and unfilled orders through September,
gains in defense spending and business fixed investment remain as large
as projected earlier. On the other hand, the rise in consumer spending
has been lowered about $1.5 billion. In October and early November,
unit sales of new domestic autos were running about 5 per cent below
year-earlier levels. Sales for the current quarter are now estimated
at an annual rate of 8.2 million, 5 per cent below the fourth quarter
last year and down from 8.5 million in the third quarter. With auto
sales down and other durables up only slightly, total consumer purchases
of durable goods are now estimated to be showing no change in the current
quarter. Although spending for nondurable goods appears to be rising
more rapidly in this quarter, the leveling off in durables reduces the
rise in total consumer spending to about $8 billion, around $1.5 billion
less than in the third quarter. Personal income, meanwhile, appears
to be increasing about as fast as in the third quarter. With personal
tax payments rising less, disposable income is estimated as rising
more rapidly and the saving rate is estimated to move up fractionally
from the low third quarter level,

II - 3
Developments in the auto sector will have a bearing on pros-
pects for a continuing decline in the rate of inventory accumulation
such as is now estimated for the current quarter -- as well as on the
magnitude of the rise in consumer spending. Auto stocks at the be-
ginning of this quarter, although down from the exceptionally high mid-year
levels, were still high and they appear to have increased again in
October when sales declined. To achieve a further reduction in stocks
for the quarter, at the sales level now posited, a sizable reduction in
auto output would be required by the end of the year.

II - 4
CONFIDENTIAL -- FR November 15, 1966GROSS NATIONAL PRODUCT AND RELATED ITEMS
(Expenditures and income figures are billions of dollarsseasonally adjusted annual rates)
1966
1964 1965 1966 1965 Proj.
Pro. IV I II III IV
Gross National ProductFinal sales
Personal consumption expendituresDurable goodsNondurable goodsServices
Gross private domestic investmentResidential constructionBusiness fixed investmentChange in business inventories
Nonfarm
631.7 681.2 738.9 704.4 721.2 732.3 744.6 757.5627.0 627.1 728.9 694.0 712.3 720.0 734.6 748.5
401.459.4
178.9163.1
93.027.660.7
4.75.3
431.566.1
190.6174.8
106.627.869.7
9.18.1
465.969.5
207.0189.4
115.526.079.510.010.1
445.268,0
197.0180.2
111.927.673.910.4
9.0
455.670,3
201.9183.4
114.528.677.08.98.5
460.167.1
205.6187.4
118.528.078.212.312.1
469.970.2
208.1191.5
115.024.880.3
9.910.4
478.070.2
212.3195.5
114.022.782.3
9.09.5
Net exports 8.5 7.0 4.9 6.1 6.0 4.7 4.2 4.5
Gov't purchasesFederal
DefenseOther
State & local
of goods & services
Gross National Product inconstant (1958) dollars
GNP Implicit deflator(1958=100)
Per cent change, annual rateGNP current dollarsGNP constant dollarsImplicit deflator
Personal incomeWage and salaries
Disposable incomePersonal saving
Saving rate (per cent)
Total labor force (millions)Armed forcesCivilian labor force "Unemployment rate (per cent)
Nonfarm payrollemployment (milions)
580.0 614.4 647.3 631.2 640.5 643.5 649.3 655.8108.9 110.9 114.2 111.6 112.6 113.8 114,7 115.5
7.0 7.85.3 5.91.6 1.8
496.0333.6436. 624.55.6
77.02.7
74.25.2
535.1358.4469.1
25.75.5
78.42.7
75.64.6
8.5 10.45.4 8.43.0 2.2
580.0392.0505.0
25.85.1
80.13.1
77.03.9
552.8370.8486.1
28.55.9
79.02.8
76.24.2
9.55.93.6
564.6380.0495.1
26.75.4
79.42.9
76.53.8
6.2 6.71.9 3.64.3 3.2
573.5387.4499.9
26.65.3
79.73.1
76.73.9
585.2396.7507.8
24.54.8
80.43.2
77.23.9
6.94.02.8
596.6404.0517.1
25.34.9
80.73.3
77.43.9
58.3 60.8 63.8 61.8 62.8 63.6 64.1 64.6
128,965,250.015.263.7
136.266.850.116.769.4
152.676.559.417.176.1
141.269.852.517.371.4
145.071.954.617.473.1
149.074.057.116.975.0
155.578.361.317.077.2
161.082.064.817.279.0

II - 5
Industrial production. Industrial production in October rose
to 158.6 per cent of the 1957-59 average from 158.1 per cent in September,
mainly because of a sharp rise in seasonally adjusted auto assemblies
following the new model introductions and a further small gain in output
of business equipment. The small increase in October followed little
change in September. In October, production of consumer goods other
than autos was unchanged and output of steel and some other materials
declined. The total index, however, was a respectable 9 per cent above
a year earlier.
Auto assemblies rose sharply in October to 178 per cent of
the 1957-59 average and are scheduled to hold at this index level in
November -- the highest output rate since last spring. Output of house-
hold appliances and furniture declined from the highs reached last
summer. Production of television sets changed little in October but
was almost 10 per cent below the early 1966 high mainly because of a
continuing decline in output of monochrome sets. Production of consumer
nondurable goods was little changed.
The rise in business equipment in October was only one-half
per cent -- the same as in September and much less than rates of increase
obtained earlier. Output of industrial and commercial machinery rose
further and production of defense equipment continued to increase.
Production of iron and steel and of construction materials
generally declined while that of equipment parts was unchanged. Output
of textile mill products have declined steadily since June, and is now
II - 6
4 per cent below the peak. Production of most other nondurable
materials increased somewhat in October.
Retail sales. October sales were little changed from
September but still 6 per cent above a year earlier, according to
advance figures. Declines of around 3 per cent from September were
reported for auto dealers, and for furniture and appliance stores; sales
at durable goods stores as a whole were off 2.5 per cent.
Dealer deliveries of new domestic automobiles in October were
at an annual rate of 8.0 million units, 7 per cent below the preceding
month and 5 per cent below the exceptionally high rate a year ago.
In the first 10 days of November sales apparently strengthened and
were at a seasonally adjusted rate about 5 per cent above that in
October. New car inventories on October 31, at 1.24 million units,
were virtually unchanged from a month earlier but were 17 per cent above
a year ago. At the October selling rate, the inventory level represented
41 days' supply, a high figure for this season.
Sales at nondurable goods stores were up 1.3 per cent, with
relatively large increases reported by apparel stores, eating and drinking
establishments, and gasoline service stations.
Figures for August have been revised down slightly while those
for September have been raised a little. The revised estimates now
show a small rise in August which continued at a slower pace in September.
II - 7
Sales in the third quarter were nearly 8 per cent above a year earlier
and about 2.5 per cent above the second quarter.
Consumer credit. Expansion in consumer credit has slowed
markedly further this fall. In September, the latest month for which
firm data are available, the increase in instalment debt amounted to
only $475 million, compared to $602 million in the previous month and
$686 million a year earlier. The September rise was the smallest since
November 1964 when consumer borrowing to purchase automobiles was
sharply curtailed because of a strike-induced shortage of new cars.
It now appears that October will be another slack month. This
is the conclusion to be drawn from the instalment credit figures in the
weekly reporting bank series. It is further supported by lower durable
goods sales in October.
Slowing in instalment credit expansion this year can be
attributed largely to demand factors, although monetary restraint has
also played an important role. Last month our special Consumer
Loan Survey pointed to different ways in which lenders' standards have
been tightening and consumer charges increasing. Lenders have increasingly
sought to augment their returns by increasing various fees and tacking
special surcharges on monthly payments.
Repayments on instalment debt have continued to rise in more
or less steady fashion, although at a slower pace than in 1965. The
ratio of repayments to disposable income has held steady at 14.5 per
cent throughout 1966, up only slightly from the 1965 ratio.

II - 8
The delinquency picture continues relatively favorable, both
for commercial banks and credit unions. The delinquency rate for
credit unions has been below year-ago levels in 7 of the first 9 months
this year. Meanwhile, confidential information received from GMAC and
CIT shows that in only 2 or 3 of the past 9 months auto repossessions
have been at rates above a year earlier.
Personal income. Personal income in October rose $4.6
billion -- the same as in September -- to an annual rate of $594.6
billion, 8.7 per cent higher than a year earlier. Of the October rise,
$1.4 billion was in transfer payments and was due to further increases
in Medicare payments. (Medicare payments had increased by nearly $1
billion in September.) Gains in wage and salary disbursements and
interest income accounted for most of the balance of the October rise.
Manufacturing payrolls were up $1.1 billion, the average gain in the
earlier months this year. Payrolls in other major private industries
and in government also rose about in line with earlier gains. Total
wages and salaries in October were 9.6 per cent above a year earlier and
were nearly 1.5 per cent above the average in the third quarter. Farm
income declined slightly further, reflecting some erosion of farm prices.
Business inventories. Business inventory accumulation dropped
sharply in September from the high rates prevailing in the spring and
summer months, and mainly because of that decline third quarter accumu-
lation -- although still large -- was nearly a fifth below the second

II - 9
quarter. On a GNP basis, nonfarm inventory accumulation was at an
annual rate of $10.4 billion in the third quarter, as compared with
$12.1 billion in the second.
Changes in book value of manufacturing and trade inventories
are shown in the table for July, August, and September and, in terms
of monthly averages, for the second and third quarters. (The July and
August -- and second quarter -- figures for trade have been revised
up since the October 26 Green Book.)
RECENT CHANGES IN MANUFACTURING AND TRADE INVENTORIES(Book value; seasonally adjusted; $ millions)
y A t Septem- II Q III QJuly August ber (monthly averages)
Total 1,130 1,329 693 1,318 1,051
Manufacturing 1,009 1,152 695 767 952
Durable goods 787 1.024 616 577 809
Motor vehicles 161 143 -168 2 45Machinery & equipment
and defense products 407 504 500 324 470
Other durables 219 377 284 251 293
Nondurable goods 222 128 79 190 143
Trade 1/ 121 177 - 2 551 99
Wholesale 134 298 -166 143 89
Retail - 13 -121 164 408 10Auto dealers -217 -161 183 202 - 65Other durables 136 - 90 - 21 85 8Nondurables 68 130 2 121 67
1/ Retail trade inventories have been revised beginning January 1965, as a resultof an upward adjustment to benchmark levels at the end of 1965 and of revisionin seasonals; the new June 1966 level is $730 million, or 2 per cent, higherthan the old level and the amount of accumulation in the second quarter is 18 percent larger than indicated earlier (however, first quarter accumulation waslowered). Wholesale inventories have been revised for the period 1959-1965 tomake the earlier figures comparable with 1966 monthly data (revised in June 1966).
II - 10
Salient features of recent inventory developments are as
follows:
(1) Accumulation by manufacturers, which had increased steadily
from February to August, dropped sharply in September -- to the lowest
rate since March. The major cause of the decline was a shift from
large accumulation in the motor vehicle industry in preparation for new
models to sizable liquidation in September when new model output picked
up. Another factor in September was a further slowdown in growth of
stocks of nondurable goods industries, including liquidation in some
textile and food industries. For the foods industry liquidation had
also occurred in August.
For the third quarter as a whole, inventory accumulation by
manufacturers was well above the second quarter rate, owing mainly to
a further large step-up in the business and defense equipment industries
where new and unfilled orders continued to expand at a rapid rate. Any
slackening in the period ahead from the high third quarter rate for
total manufacturing accumulation will depend importantly on developments
in these industries.
(2) Wholesale inventories were revised for August to show a
sharp spurt, which was followed by a sizable decline in September. For
the quarter, accumulation by wholesalers was less than in the second
quarter, mainly because of slower growth in durable goods -- presumably
consumer items and construction materials.

II - 11
(3) Liquidation of auto stocks in July and August and con-
siderable accumulation in September dominated movement of retail inventories,
For the quarter, auto stocks were reduced moderately, and accumulation
of other goods -- both durable and nondurable -- slowed markedly, with
the result that total retail stocks showed little change following the
large second quarter run-up. With auto stocks sharply above year-earlier
levels and sales no longer bouyant, pressure to reduce auto stocks is
expected to become stronger. Also, with retail sales generally showing
little change in recent months, retailers may extend their efforts to
limit accumulation of other consumer goods.
Orders for durable goods. New orders for durable goods have
been revised for September to show a rise of 7 per cent -- double the
increase indicated by the advance figures. With shipments raised only
fractionally, unfilled orders also were revised upward to show an
exceptionally large increase of $2.3 billion -- 3.2 per cent -- for
the month.
The bulk of the upward revision reflected a sharp boost in
orders for the Census category, "defense products." New orders for these
products now show a rise of nearly 50 per cent for the month, to a level
more than 25 per cent above the previous high in June. This category,
it should be noted, includes the entire aircraft industry and a signifi-
cant portion of its backlog represents orders from commercial airlines.
Excluding products classified in the defense group, new orders
were up slightly with increases in steel, motor vehicles, and machinery

II - 12
and equipment. There was a further decrease in construction materials
and orders for miscellaneous durable goods were also down.
Business fixed capital investment. Plant and equipment expendi-
tures of nonfarm business are expected to total $63.8 billion in 1967,
5 per cent more than this year, according to the McGraw-Hill fall survey.
This rise compares with a 17 per cent increase indicated for this year.
Fixed capital spending in 1967 reportedly would rise by more than 7
per cent were it not for the recent suspension of the investment tax
credit on equipment purchases and the elimination of accelerated
depreciation on buildings. Together, these actions are reported to have
reduced planned outlays for 1967 by $1.5 billion.
The survey fixed capital spending estimate of $63.8 billion in
1967 would be only slightly higher than the $63.6 billion annual rate
in the final quarter of this year as indicated by the August Commerce-
SEC survey of business plans. (A new quarterly Commerce-SEC survey will
be available in about a month.) However, other data relating to business
fixed investment -- unfilled orders for machinery and equipment, the
backlog of manufacturers' capital appropriations, and starts and carry-
over of plant and equipment projects by manufacturers and public
utilities -- suggest continuation at least into early 1967 of the recent
upward trend in business capital outlays. Total outlays for 1967
only 5 per cent above those in 1966 would imply an appreciable reduction
in spending rates after the early months of 1967.

II - 12
All business
ManufacturingDurable goods indusNondurable goods ir
NonmanufacturingMiningRailroadsAirlinesOther transportaticcommunications
Electric & gas utilCommercial
Direction of change in fixed capital outlays in the coming
year always has been correctly flagged by the McGraw-Hill fall surveys.
In recent years when economic activity was expanding rapidly, however,
the increases reported in the fall have substantially underestimated
the increases actually realized. A year ago, for example, the survey
indicated an increase of 8 per cent this year; it now appears that
the actual increase will be 17 per cent. In the 1964 and 1963 fall
surveys, the increases were underestimated by even larger relative
amounts. Although no suggestion of underestimate for 1967 was made in
the body of the report itself, McGraw-Hill economists were reported
as expecting capital spending "to grow at a rate somewhere between 7
per cent and 8 per cent" next year.
[ I I [
PLANNED FIXED CAPITAL SPENDING
McGraw-Hill Survey1967
Planned1967 change
from 1966(billions) from 1966
(per cent)
$63.8 4.9
28.6 5.5stries 15.0 7.2idustries 13.6 3.8
35.2 4.31.4 -2.71.7 -13.82.3 36.0
,n and7.8 2.6
Lities 9.0 10.013.1 1.0
Commerce-SECAugust Survey1966 changefrom 1965
(per cent)
17.1
20.622.518.6
14.512.313.352.2
14.017.69.7
I.I.

II - 13
Among industry groups, manufacturers plan to increase plant
and equipment spending by nearly 6 per cent in 1967, with producers of
durable goods planning 7 per cent and nondurable goods industries 4
per cent. Increases now planned by most manufacturing industries are
much smaller than those realized this year. Further sizable gains
are estimated by producers of nonferrous metals, fabricated metals and
instruments, and electrical machinery -- industries which recently have
been operating at or above preferred operating rates. Declines are
scheduled by producers of motor vehicles and parts, aerospace, and
textiles. For the aerospace and textile industries the declines follow
very large increases this year.
Manufacturers expect their 1967 sales, in physical volume,
to be 6 per cent larger than this year. Pressures on manufacturing
capacity, particularly for some durable goods industries, would
apparently continue heavy next year if sales expectations and capital
spending rise in line with the survey results. Manufacturing capacity,
according to McGraw-Hill survey estimates, is increasing 8 per cent in
1966, with fixed capital outlays by manufacturers up an estimated 21
per cent; the increase last year was also 21 per cent and in 1964,
it was 18 per cent.
Fixed capital spending by all nonmanufacturing industries
combined will be up only 4.3 per cent in 1967 from this year, according
to the survey. Airlines and gas and electric utilities plan large
further increases; but railroads, after increases averaging nearly 25

II - 14
per cent a year over the past five years, report plans to reduce spending
by nearly 15 per cent. And the commercial grouping, which is relatively
large in terms of total outlays, plans only a 1 per cent increase in
spending next year, as compared with a 10 per cent increase this year.
More than half of the estimated $1.5 billion cutback in outlays because
of Federal actions regarding the investment tax credit and accelerated
depreciation is concentrated in the commercial sector.
Construction activity. Total new construction activity edged
down further in October and was at the lowest seasonally adjusted annual
rate -- $71.8 billion -- since the summer of 1965. Residential con-
struction expenditures, which continued downward for the eighth consec-
utive month, accounted for nearly all of the decline. Both public and
private nonresidential expenditures were above their advanced levels in
October 1965 but they were below their first quarter 1966 highs.
NEW CONSTRUCTION PUT IN PLACE
October 1966 Per cent change from(billions) 1/ September 1966 October 1965
Total $71.8 -1 - 1
Private 48.1 -1 - 4Residential 21.8 -3 -17Nonresidential 26.3 -- +11
Public 23.8 -1 + 5
1/ Seasonally adjusted annual rates; preliminary.

II - 15
Although October data are not yet available, staff projections
indicate the seasonally adjusted annual rate of starts in the fourth
quarter may average little more than 1 million units. This would be
somewhat further below the already low third quarter rate and would
compare with a rate of 1.5 million in the first quarter. For the year
1966, the staff estimates starts at just over 1.2 million.
Current projections -- assuming continued stringency in
mortgage markets -- suggest that starts may fluctuate on average below
the 1 million unit mark during the first half of next year, and that
any revival that might follow thereafter might not carry the 1967 total
much above 1.1 million units. Even allowing for higher prices and some
further shift in the mix toward the more expensive single family units,
a first half rate of less than 1 million units -- which seems also to be
implied by most trade expectations -- would imply that investment in
residential structures (GNP basis) would be reduced further during most
of 1967 from the less than $23 billion rate -- now estimated for the
fourth quarter of 1966.
The number of starts in 1967, and the possibility of a
sizable recovery at some time during the year, will depend importantly
on the timing and extent of improvement in the flow of mortgage funds.
Even with a sharply increased flow of such funds, however, an advance
in starts also would depend on the speed with which uncertainties about
prevailing trends could be dispelled and dislocations in supply arrange-
ments within both the mortgage and builder markets could be smoothed

II - 16
after the substantial shock to these markets which began a year ago.
Currently, interest rates on mortgages as well as production costs in
general, are appreciably higher than at that time. Also, land develop-
ment underway is reported to have slowed in some cases and stopped
altogether in others, as pressure on builders' financing has continued
to increase. New commitments by some life insurance companies for
permanent financing, for example, are now being deferred into 1968.
Altogether, while there would undoubtedly be a fairly prompt response
to an improvement in mortgage funds availability, it seems likely that
a time lag of some consequence -- perhaps 6 months -- would have to be
assumed before the starts rate turned up substantially, and several months
thereafter before this would be reflected in an upturn in the residential
construction component of GNP. In the 1958 recovery in starts -- the
fastest in the postwar period -- a full nine months'period elapsed from
the trough to the subsequent recovery level.
While a backlog of demand is being built up, the full impact
of shortages resulting directly from the curtailment in starts this year
probably will not begin to be felt until early next year. This is
because completions tend to lag starts by some 6 months or more, and
the level of starts, supported by earlier commitments, actually was
quite high in the first two quarters of 1966.
Thus, much of the current volume of new home sales is supported
by construction activity planned and started much earlier. Nevertheless,
inventories of housing for sale by speculative builders this fall had
II - 17
already dropped to unusually low levels. Rental vacancy rates, which
had not been especially high in the North Central states and the
South also had been reduced appreciably further. In addition, with
about one-fifth of the population moving each year, the possibility of
increased pressure in specific localities from households whose demands
are neither immediately postponable nor shiftable is growing. And the
removal of units from the existing stock from demolition and other
causes is continuing at an estimated rate of at least 500,000 a year.
Because of the relatively "overbuilt" situation which had
prevailed earlier for multifamily structures, some of the initial impact
of reduced supplies will continue to be absorbed by previously vacant
units already on the market. If protracted, however, a reduced level
of starts over the next year would probably affect demands for rental
types of shelter more than on those for single-family homes. Demand
for single-family units had been unusually soft through the early 1960's,
even when mortgage funds had been easy, and the potential demand for
single-family structures based on demographic factors alone still does
not point to any marked growth over the next few years.
Although the population between the ages of 25-45 -- the major
market for single-family homes -- has begun to turn upward in the
present period, in contrast with an absolute decline during the first
five years of the decade, a major upshift is not indicated until the
1970's; moreover, the number in the core "30-40 year" group in which
single-family home demand is likely to be strongest, is still in decline.

II 18
By contrast, for those in the "20-24 year" and "45-and-over" groups,
the major sources of apartment demand, the pace of expansion is
growing.
ESTIMATES OF POPULATION -- 20 YEARS AND OVER(Millions of persons)
Age 1960 1965 Projected1970 1975
Male
20 - 24 5.6 6.9 8.7 9.7
25 - 45 23.2 23.1 23.9 26.8
(30 - 40) (12.0) (11.4) (11.1) (12.6)
45 and over 25.2 26.8 28.3 29.4
Female
20 - 24 5.6 6.8 8.6 9.6
25 - 45 23.9 23.7 24.4 27.1
(30 - 40) (12.5) (11.7) (11.4) (12.8)
45 and over 27.6 30.4 33.1 35.1
Source: Census Bureau, Series P-25, No. 329, March 1966.

II - 20
Labor market. Demands for labor were strong in October as
nonfarm employment resumed its upward course. The advance of nearly
200,000 from September was somewhat below the average monthly increase
of 250,000 over the past year. But it was still at a rate which pressed
against available experienced manpower resources. Reflecting continued
shortages of skilled workers in many industries, the average workweek
in manufacturing--41.3 hours--continued close to the postwar peak.
Most nonagricultural industries reported higher employment
in October, but there were some exceptions. Manufacturing increased
75,000, more than recovering the September decline. In durables, the
increase was somewhat below the average monthly rise over the past
year. Machinery and defense related industries continued to show
strength, but employment in construction material and furniture indus-
tries eased off as activity slowed and the rise in autos began to level
off following the model changeover. In nondurable goods industries,
employment also rose, following a decline in the previous month. In
the rubber, chemical and printing industries a moderate upward trend
was maintained but in textiles, employment slipped further from mid-
summer highs.
In trades and services, employment increased sharply in
October, following two months of relatively little change. Gains in
these industries last month were well above the average increases over
the past year, reflecting the underlying strong demands for manpower in
these areas. In contrast, construction employment declined further in
October and was down 200,000 or 6 per cent from the March 1966 high and
was only slightly above its year earlier level.

II - 21
Declines in construction employment have begun to show up
in the unemployment figures for the industry. There has been a steady
upward drift since midsummer in the seasonally adjusted unemployment
rate for this sector, but in Octiber it was still below a year earlier.
For other industries there has been no easing in labor supply even
though employment gains have moderated. In manufacturing, unemployment
has declined this fall; in durable goods the rate was down to 2.6 per
cent in October, as low as during the Korean conflict.
Wage and salary
ManufacturingDurable gooNondurable
ConstructionTransportatio
public utilTradeService indusGovernment
1/ Excludes p
UNEMPLOYMENT RATES BY INDUSTRY OF LAST JOB(Seasonally adjusted)
October 1911965 August Septi
workers 4.0 3.7 3
3.6 3.4 3>ds 3.2 2.9 2goods 4.2 4.0 3
9.6 8.4 9in andities 2.6 1.8 2
4.7 4.6 4tries 1/ 4.1 3.8 3
2.0 2.1 2
66amber
.6
.2.9,7
.1
.0
.3
.6
.4
rivate households.
Manpower supply. Continuation of a tight manpower supply
situation was clearly evident in the labor market figures for October.
The civilian labor force increased at a brisk rate over the year --
by 1.3 million -- and the-Armed Forces absorbed about half a million
men. But the usual sources of manpower supply have very nearly dried up,
October
3.6
3.02.63.6
9.2
1.74.44.01.9
II - 22
for the time being at least. Adult white males constitute over half
of the civilian labor force, but they contributed less than 5 per
cent of the additions to the manpower pool over the past year. The
adult male population is growing slowly and their rate of labor force
participation is fairly close to its maximum. In addition, their
unemployment rate, at 2.1 per cent in October was close to minimum
frictional levels.
Teenagers, who were a major source of additional manpower
earlier this year, left the labor force in very large numbers with the
beginning of the new school year, and last month numbered only 125,000
more than in the previous October. The major source of labor supply
therefore has been adult women, who added about one million additional
workers to the labor force over the past year. With the continued
movement of young men into the Armed Forces or into schools, little
increase in the adult male labor force is in prospect, and, hence,
women will continue to provide the only substantial supply of additional
civilian labor in the coming year.
Despite the tight labor market situation, which would seem to
offer unique opportunities to absorb more marginal workers into employ-
ment, there has been relatively little improvement in the unemployment
of either nonwhite workers or teenagers since October 1965. The unemploy-
ment rate of nonwhite adults has remained virtually unchanged at about
6 per cent, and the rate for all teenagers declined only slightly --
from about 13 to 12 per cent. Moreover, these high unemployment rates
II - 23
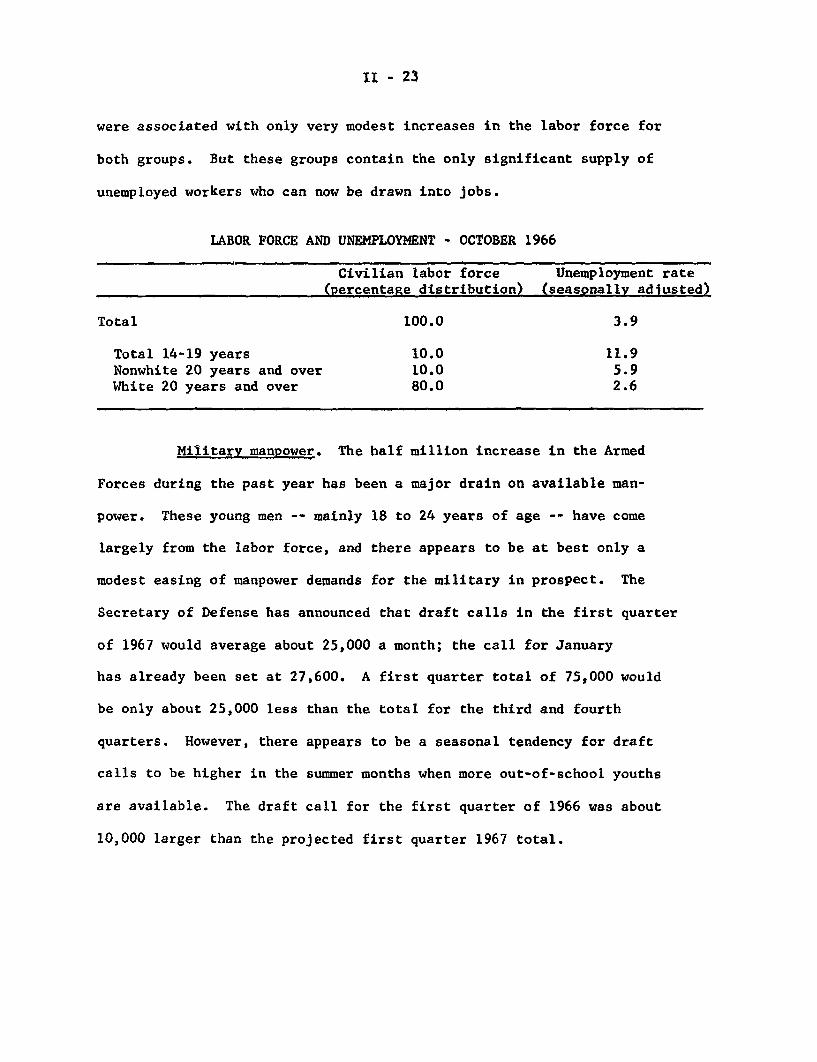
were associated with only very modest increases in the labor force for
both groups. But these groups contain the only significant supply of
unemployed workers who can now be drawn into jobs.
LABOR FORCE AND UNEMPLOYMENT - OCTOBER 1966
Civilian labor force Unemployment rate(percentage distribution) (seasonally adjusted)
Total 100.0 3.9
Total 14-19 years 10.0 11.9Nonwhite 20 years and over 10.0 5.9White 20 years and over 80.0 2.6
Military manpower. The half million increase in the Armed
Forces during the past year has been a major drain on available man-
power. These young men -- mainly 18 to 24 years of age -- have come
largely from the labor force, and there appears to be at best only a
modest easing of manpower demands for the military in prospect. The
Secretary of Defense has announced that draft calls in the first quarter
of 1967 would average about 25,000 a month; the call for January
has already been set at 27,600. A first quarter total of 75,000 would
be only about 25,000 less than the total for the third and fourth
quarters. However, there appears to be a seasonal tendency for draft
calls to be higher in the summer months when more out-of-school youths
are available. The draft call for the first quarter of 1966 was about
10,000 larger than the projected first quarter 1967 total.

II - 24
DRAFT CALLS
Quarterly totals
1965 - III 61,000IV 110,150
1966 - I 85,080II 78,300
III 102,400IV 98,900 p
1967 - I 75,000 p
p - Projected.
Wages and collective bargaining. A number of contract settle-
ments involving wage increases in the 4 to 5 per cent range -- along
with an unusually large number of deferred wage adjustments and sub-
stantial cost-of-living increases -- are being reflected in progressively
higher average earnings in manufacturing. Average hourly earnings
of manufacturing production workers rose another one cent in October to
$2.75, a level 4.2 per cent higher than a year earlier; in the third
quarter of this year manufacturing earnings had been 4.0 per cent above
year-ago levels. The annual rise in manufacturing from 1962 to 1965 had
averaged 3.0 per cent.
In recent years, hourly earnings in the nonmanufacturing sectors
have been rising faster than in manufacturing. These sectors tend to
be less unionized, or have shorter contracts, and have been more
sensitive to the tightening labor market. With the relatively sharp

II - 25
recent increases in manufacturing, most major industries are now showing
over-the-year wage increases well above 4 per cent.
PER CENT INCREASE IN AVERAGE HOURLY EARNINGS
1st half 1965 October 1965to to
1st half 1966 October 1966
Manufacturing 3.5 4.2Construction 4.3 5.0Mining 3.9 6.1Trade 4.9 4.8Hotels & motels 5.0 6.6 a/
a/ September.
Wage settlements with increases of about 5 per cent continue
to be the pattern in both manufacturing and nonmanufacturing sectors.
The recent contracts negotiated by G.E. and Westinghouse with most of
the electrical unions provided for wage and fringe increase of about 5
per cent, as did the earlier contract with the airline mechanics union.
This pattern also has spread to the first of the operating railroad
brotherhoods to negotiate a settlement. The railroads and 96,000
members of the trainmen's union agreed to a 5 per cent wage increase in
a contract retroactive to August 12 and extending through the end of
1967. The contract provides for reopening in September 1967 when the
union could present new wage demands. Similar wage gains are expected
in current contract negotiations with four other operating unions
covering 80,000 workers, as well as with the 400,000 members of the
nonoperating railroad brotherhoods.

II - 26
Prices. The wholesale price index for industrial commodities
remained nearly stable in October. Changes in component indexes and
other straws suggest that the industrial average may now be moving
upward again, although at a "creeping" rate. Prices of foodstuffs have
declined substantially (about 4 per cent) from their peak in September,
reflecting expansion in supplies of most fresh foods, and have accounted
for decreases in the total wholesale price index amounting to 0.6 per
cent in October and perhaps another .03 or .04 per cent since then.
The decreases in food prices should carry through to retail stores,
with or without buyers' strikes, and a declining trend in retail prices
through the fourth quarter is likely. The rise in the total consumer
price index thus should slow down and could even he temporarily inter-
rupted; through September, the latest month for the index, this year's
rise in the CPI on an annual rate basis was nearly 4 per cent.
The near stability in wholesale prices of industrial commodities
in October reflected a further decrease in sensitive materials, con-
tinued stability in other materials, and additional increases in both
machinery and equipment and consumer finished products. The decline in
sensitive materials -- which began in the spring and has represented
partial reversal of extraordinary increases in hides, lumber and copper
scrap -- slowed in October. The declines may be near an end for hides
and lumber, and markets for copper and copper scrap have firmed again,
partly because of recurring disturbances to production in Zambia.
In coming months, therefore, the sensitive group will not provide such an
offset to increases in other industrial commodities as it has earlier.

II - 27
Prices of industrial materials other than the sensitive group
were stable from August to October, following a nearly steady rise over
the preceding ten months at an annual rate of 3 per cent. Some portion
of that rise was associated with price increases among sensitive
materials -- e.g., plumbing equipment was influenced by copper, and
millwork by lumber -- and upward pressure from this source no longer
exists. List prices for steel were stable in September-October at a
level about 1.5 per cent higher than a year ago, and the recent increase
in stainless steel, which accounts for something over 5 per cent of
the value of all steel mill shipments, will raise the steel index by
0.1 per cent. Chemicals have been stable and paper and paper products
leveled off in the summer after a moderate rise. For some of these
materials, production has leveled off or declined in recent months,
which suggests that demands may have eased and inventories may have
gone somewhat beyond desired levels. For industrial materials other than
the sensitive ones, therefore, a prompt return toward the 3 per cent
annual rate of increase appears unlikely.
Prices of machinery and equipment over the year ending in
October rose at a nearly steady rate which cumulated to 4 per cent.
Changes ranged from zero for transportation equipment (not including
motor vehicles), up to an average increase of 6 per cent for metal-
working equipment, and they appear to be related more to particular
industry and market conditions than to pervasive influences of either
wage rates or costs of materials. Recent plant and equipment surveys
suggest that new orders for equipment will soon level off or decline,

II - 28
but pricing decisions may also be influenced by the high level of unfilled
orders and by a spreading of wage increases of 5 per cent or more as,
for example, in the electrical machinery industry. This month, increases
of 2 to 5 per cent have been announced for prices of agricultural
machinery and equipment.
For consumer goods (other than foods), the annual rate of
price increase has fluctuated around 2 per cent. Increases have been
chiefly among nondurable goods: clothing, fuels, tobacco products,
and soft drinks. Furniture prices also have increased, but major
appliances have changed little. In October, the index for consumer
goods was affected by elimination of seasonal rebates that had reduced
auto prices in August-September. BLS has not yet indicated an evaluation
of prices for the 1967 autos (and none was reflected in the October
WPI), and it is likely that the auto index after adjustment for quality
change will show little change. For the future, developments in the
markets for textiles and hides and leather suggest at least a moderation
in the rise in clothing prices. Increases have been announced for color
television and for many small appliances, but reduction in demands for
major appliances associated with the decline in residential construction
may limit or prevent price increases. Altogether, a near-term acceleration
in the rise in wholesale prices of consumer goods appears to have a
low probability.

II - 29
All commodities
Industrial
Sensitive materials
Ex. Fibers
Other materials
Machinery and equipment
Consumer goods
Foodstuffs
Livestock and products
Crops and products
WHOLESALE PRICES
Per .cent change to October 1966 fromSeptember October October
1966 1965 1964
-0.6 3.0 5.4
0.1 2.0 3.4
-0.5 -0.4 2.2
-0.5 1.0 4.1
2.6 3.7
t 0.3 3.8 5.1
0.3 1.8 2.8
-2.5 5.9 11.9
-2.5 6.2 17.3
-2.6 5.4 6.0
Developments in farm credit. The accelerated rise in farm
debt that began in the second half of 1965 continued through the first
half of this year at an annual rate of increase in outstandings of 12
per cent. Recently, there has been some slowing of pace as a result
of rising costs and tightening availability of credit.
According to Department of Agriculture estimates, total
debt owed by farmers will reach a record high of $45 billion at the end
of 1966 -- $23.5 billion in real estate debt and $21.6 billion in non-
real-estate debt. Despite this mounting volume of indebtedness the
over-all financial positions of agriculture has improved in 1966
because incomes have risen more rapidly than debts, and farm real estate
and other assets have appreciated in value. But farmers' liabilities
as a per cent of their assets edged upward during 1966 to an estimated
16.8 per cent as compared to 16.3 at the beginning of the year.

II - 30
Further substantial expansion in demand for farm credit is
expected in the coming year by respondents to a questionnaire widely
circulated among people working in the field of farm credit by the
Department of Agriculture in preparation for the November 14-17
Outlook Conference. In the view of these respondents, funds for ex-
pansion of farm real estate credit are likely to be limited by tight
credit conditions. Nevertheless, their reports indicate that the
expanded demands for short-term and intermediate-term credit are expected
to be largely met.
Farm real estate debt. The 11 per cent annual increase in
farm real estate debt estimated for 1966 is somewhat less than that of
the two preceding years. The slackening has occurred since spring and
reflects tight credit conditions.
On September 30, 1966, holdings of farm debt of the two
largest institutional leaders on farm real estate -- the insurance
companies and the Federal Land Banks -- were up from a year earlier by
12 per cent and 17 per cent, respectively. For the insurance companies,
this represented a slight deceleration; after the first quarter of 1966,
they drastically reduced their commitments for the most part in response
to more profitable alternative uses for their funds and also increased
demands for policy loans. For the Federal Land Banks, the relatively
rapid expansion in loans may reflect their interest rate of 6 per cent,
which is the statutory maximum they can charge and is below the cost
of their latest bond issue. The rapid expansion in Federal Land Bank

II - 31
loans is not likely to be sustained for the Farm Credit Administration,
in line with Administration policy, has set up criteria favoring loans
yielding immediate production. This will undoubtedly rule out many
long-term investment loans normally made by the Federal Land Banks.
Non-real-estate debt. In contrast to the less rapid pace of
expansion in farm real estate debt this year, holdings of non-real-
estate debt by the principal institutional lenders are expected to
increase by 13 per cent for the sharpest expansion of the 1960's.
By midyear, commercial banks, the major source of farm production credit,
had expanded their portfolios by approximately 11 per cent; by September
30, the Production Credit Associations had increased theirs by 15 per
cent. Optimistic price and income prospects will undoubtedly spur
further demands for short- and intermediate-term credit in 1967 to
meet expanded production of crops and livestock. The favorable farm
incomes of 1966 have increased deposits at rural banks in some areas,
a development that may broaden the lending base of these banks. Also
the Farmers Home Administration has more funds to lend in 1967.

II-C-1 11/15/66
ECONOMIC DEVELOPMENTS - UNITED STATESSEASONALLY ADJUSTED
ATIONAL PRODUCT EMPLOYMENT AND UNEMPLOYMENTARS I I l II I 800 MILLIONS OF PERSONS ESTAB BASIS ll ll l lll 66
NONAGRICULTURAL EMPLOYMENT01 7446 RATIO SCALE
750 62-- 750 - 1 OCT 644
CURRENT DOLLARS 700 TOTAL- --- 58
_ I 6493 54-- 650
I I OCT 273
INDUSTRIAL AND RELATED-- 27S 600
550
23
WHOLESALEOCT 104 5
\ INDUSTRIAL COMMODITIESOCT 102 6
1 SENSITIVE
\ "- ' ' INDUSTRIAL/ "-- MATERIALS
1960 1962 1964 1966

II-C. 2
ECONOMIC DEVELOPMENTS - UNITED STATESSEASONALLY ADJUSTED
INCOME AND SALES BUSINESS INVESTMENT
I'
1960 1962 1964 1966
MANUFACTURERS' NEW ORDERSBILLIONS OF DOLLARS I ill1 l1111 1111RATIO SCALE -1 2 25
SEPT 252- 2i20
ALL DURABLE GOODS_ 15
I I 6MACHINERY AND EPT
4 9
EQUIPM NT
SEPT d4
7
DEFENSE PRODUCTS
1960 1962 1964 1966
BUSINESS INVENTORIES, NONFARMQUARTERLY CHANGE ANNUAL RATES I I I I I 15BILLIONS OF DOLLARS Ql 10 4
-- - --- - -.--. .. toGNP BASIS. l- 5illi, ,1 lf~ l,+II : t "
5
NET CHANGE IN OUTSTANDING-E 8
I, . ..ii'iiIIIIll lll °1. 0 I l 6 6
11/15/66
GNP FIXED INVESTMENT omioeaAS SHARE OF GNP
Tli 111 11i illlll1111 1 , ,,i
1 I ~
1960 1962 1964 1966

III - 1
DOMESTIC FINANCIAL SITUATION
Flow-of-funds - third quarter. 1966. Total borrowing by
nonfinancial sectors was sharply down in the third quarter, dropping
from an $84 billion annual rate in the second quarter to a $63 billion
rate. Although U.S. Government borrowing was somewhat lower than in
the second quarter, most of the $20 billion decline was in funds
raised by nonfinancial business, which were reduced from a $44 billion
rate in the second quarter to a $27 billion rate in the third. About
half of this drop in business borrowing was in bank loans and another
third in security issues. With the sharp decline in housing starts,
there was also net repayment on construction loans by builders.
SUMMARY OF CREDIT MARKET BORROWING(Billions of dollars, seasonally adjusted, annual rate)
1965
Total borrowing
U.S. Government
Direct and guaranteedissues
Agency issues and loanparticipation
Foreign
Domestic nonfinancialsectors
State and local
Business
Households
72.1
3.5
1.2
2.3
2.6
66.0
7.8
29.7
28.5
I
81.6
13.3
1966II
83.5
6.0
8.1 -11.4
5.2
2.3
65.9
5.9
36.3
23.7
17.3
2.4
75.2
7.7
43.9
23.6
III
63.1
1.3
3.0
-1.7
1.9
59.9
6.8
26.9
26.1
Change IIto III
-20.4
- 4.7
+14.4
-19.0
- 0.5
-15.3
- .9
-17.0
+ 2.5

III - 2
The drop in third-quarter business borrowing reflected to a
large extent special factors that boosted business credit flows in the
second quarter to exceptionally high levels relative to financing needs
for capital outlays. More than $2 billion (at annual rates) of net
security issues in the second quarter consists of the sale of TWA stock
by Hughes Tool Company in what was essentially a secondary offering
with the funds used to buy Government securities. More important,
however, was the accelerated payment on corporate profit taxes, which
at annual rates was about a $10 billion drain on corporate funds during
the second quarter, while third-quarter payments were on the schedule
that had existed since 1961. The second-quarter payments are clearly
mirrored in a corporate borrowing rate that was $8 to $10 billion higher
than the general level of corporate credit demands in surrounding
quarters. Second-quarter borrowing by corporations can thus be seen
as part of a change in structure of corporate liabilities: the shift-
ing forward of corporate tax payments over the past 10 years has
gradually reduced the relative position of taxes payable on the balance
sheet, and with the further major shift forward of payments in the
second quarter, there was a clear need to increase other forms of bor-
rowings.
Comparison of borrowing with investment is consistent with
this view of the second quarter. The ratio of borrowing to net invest-
ment (line 6 of the table) is high in the second quarter, but if roughly
$10 billion of borrowing is excluded from the ratio as, primarily, extra

III - 3
"tax borrowing," in the sense indicated above, the second quarter ratio
becomes about 83 per cent and is part of a trend over this year of di-
minished borrowing relative to investment.
BUSINESS AND HOUSEHOLDSCAPITAL EXPENDITURES AND CREDIT MARKET BORROWING
(Billions of dollars, SAAR)
(1) Gross capital expenditures
Sources of finance--
(2) Capital consumption
(3) Credit market borrowing
Other sources(1) - (2) - (3)
Net investment (1) - (2)
Per cent borrowing of netinvestment
196519661965 I II
171.8 184.4 185.4
110.1
58.2
3.5
114.2
60.1
10.1
116.0
67.5
1.9
III
185.5
118.1
53.1
14.3
1961-1965
142.1
97.6
43.6
.9
61.7 70.2 . 69.4 67.4 44.5
94.3 85.6 97.3 78.8 98.0
On the supply side of financial markets, second-quarter tax
payments also distort the picture somewhat, because the Treasury used
its extra tax receipts to build up its cash balances at banks and in
the third quarter drew heavily on those deposits to finance spending.
This action accentuated both the large growth in bank credit in the
second quarter and the sharp deceleration in the third. Banks supplied
almost 35 per cent of total funds advanced in the second quarter and
I

III - 4
less than 7 per cent in the third, but if, as shown in the table below,
changes in Treasury balances are eliminated from both bank credit and
total borrowing, the share of banks in credit supply becomes 15 per
cent of the total in the third quarter, down from 30 per cent in the
second quarter and 41 per cent in 1965 as a whole. This is the decline
associated with a lower rate of time deposit inflow and decrease in the
money supply during the third quarter, with some offset by banks' bor-
rowing from foreign branches.
DIRECT LENDING IN CREDIT MARKETS(Billions of dollars, SAAR)
1965 1966 Change III II III to III
Total funds raised 72.1 81.6 83.5 63.1 -20.4
Less change in U.S. Govt. cash -1.0 -3.5 9.2 -7.4 -16.6
Total less U.S. Govt. cash 73.1 85.1 74.3 70.5 - 3.8
Funds supplied directly tocredit markets 73.1 85.1 74.3 70.5 - 3.8
Federal Reserve System a/ 3.8 3.4 2.7 4.0 + 1.3
Commercial banks (net) a/ 29.3 19.2 21.5 10.7 -10.8
Nonbank finance (net) 27.1 25.0 14.9 19.1 + 4.2
U.S. Government 4.7 11.3 10.4 7.5 - 2.9
Foreign - .2 -1.5 2.2 1.8 - 0.4
Private domestic nonfinancial 8.5 27.8 22.7 27.5 + 4.8
Households 2.7 14.8 19.2 11.8 - 7.3Business .9 6.0 - .1 7.7 + 7.8State and local governments 5.5 7.4 3.1 7.3 + 4.2Less net security credit .6 .3 - .6 - .8 - 0.2
a/ Net of change in U.S. Government cash holdings.

III - 5-
The drop in bank share of lending was picked up partly by
mutual savings banks, who recovered fairly well from their second-
quarter trough, but mainly by nonfinancial investors, who through
direct security purchases supplied about 40 per cent of total funds
raised during the third quarter. This proportion is just about the
share of direct credit from the nonfinancial public in the second
quarter of 1959, which was the peak quarter for credit flows in the
1958-61 cycle, and somewhat above the high for direct lending and
credit flows in early 1957. The direct supply in the third quarter
this year apparently took the form of shorter-term U.S. Government
securities and finance company paper purchased by business and State
and local governments. Individuals bought municipal securities in
large volume but were relatively inactive in Governments or corporate
securities and maintained their flows into bank time deposits and
savings institutions somewhat above the second-quarter rates.
Bank credit. Commercial bank credit declined $600 million
further in October, following a slight net reduction in August and
September. Over the three months, the reduction was at an annual rate
of 1-1/2 per cent, in contrast with an increase at an 8-1/2 per cent
rate over the first 7 months of the year, as shown in the following
table.

III - 6
CHANGES IN COMMERCIAL BANK CREDIT(Annual rate - per cent)
1966 1965Oct. Aug.-Oct. Jan.-July Year
Total loans & investments - 2.3 - 1.4 8.7 10.2
U.S. Govt. securities -40.0 -14.0 -10.7 - 5.6
Other securities 2.5 - 0.8 9.2 15.8
Loans 7.0 1.7 14.3 14.7
Business loans 10.7 6.7 20.8 18.5
During October, banks were under strong pressure, even
though loan expansion was at a much reduced pace compared with earlier
this year. The pressure arose mainly from a sharp outflow of demand
deposits and, in the case of large city banks, a large further run-off
in negotiable CD's. In response, banks liquidated nearly $2 billion
of U.S. Government securities. City bank data indicate that pressures
at these banks may have continued in early November.
The October decline in holdings of U.S. Government securities
was unusually large considering that banks had been allotted virtually
all the $3.5 billion of nex tax bills issued by the Treasury at mid-
month. So far this year, the cumulative decline in holdings of U.S.
Government securities has been about $5-1/2 billion, bringing such
holdings to the lowest level since early 1943, when total bank credit
was less than a third its present level.

III - 7
Holdings of other securities showed only a slight rise in
October. While holdings at outside banks expanded, those at city banks
declined much more than they usually do.
Total loans rose at an annual rate of 7 per cent in October
following little change in August and a decline in September, when
there was a large reduction in security loans. Through July of this
year, total loans had increased at a 14 per cent annual rate. One
factor limiting loan growth in October was an estimated decline of
$400 million in agricultural loans. While feeder operations are
believed to be requiring more borrowing than usual this fall, this
increase has been more than offset by larger than usual loan repayments
in those farm sectors where recent cash flow has been unusually high.
Business loans rose $700 million in October following little
change in August and a $500 million rise in September. The October
increase, which was at an annual rate of 11 per cent, was quite moder-
ate considering that about $2.5 billion in payments of withheld taxes
had been moved forward to that month under the acceleration program.
Moreover, analysis of the pattern of weekly changes at city banks
suggests that the growth rate in these loans may have slackened in
late October and early November.
In view of past statistical relationships, the recent slow-
down in business loan expansion would be expected to be associated with
some slackening in inventory accumulation by businesses. This is
indicated particularly in the metals group, where the trend in outstandings

III - 8
has shifted from sharp growth in the first half of this year to
slackened growth in the third quarter, a sidewise movement in late
September and early October, and a decline since then. In addition,
a larger than usual decline in loans has occurred recently in the
textiles and apparel group, where trade reports suggest that some
inventory trimming may have occurred. But loan weakness also has been
evident in several industry categories where inventories are an unim-
portant use of funds, especially in petroleum-chemicals, construction,
and services. Most other industry groups recently have shown about
average changes in their outstanding bank loans for this time of year.
The statistical evidence does not provide a solid basis for
judging how much of the recent slowdown in business loan expansion
reflects monetary restraint and how much, if any, is attributable to
weakness in the economy. Nor is it possible to separate the interest-
rate from the rationing effects of monetary restraint. Loan officers
at large banks attribute the slowdown mainly to the restrictiveness of
their policies, including the indirect effects of these policies in
discouraging new loan requests. The ubiquitous character of the slow-
down among industry groups and the similarity of timing would appear
to be consistent with the view that restricted availability is at least
one of the major contributing factors. On the other hand, some modera-
tion in the demand for bank credit could well be occurring as a result
of reduced inventory accumulation.

III - 9
Bank deposits. Time and savings deposits at commercial
banks, after rising at a much reduced pace in September, declined in
October at more than a 2 per cent annual rate. This decline was
accounted for entirely by a recent sharp drop in these deposits at
reserve city banks; at other banks, growth has continued at close to
an 11 per cent annual rate.
The decline at city banks was accounted for mainly by a
large further run-off in outstanding negotiable CD's. From their peak
on August 17 through November 2, net attrition totaled more than $2.8
billion, or 15 per cent. Most of the decline was in major financial
centers; for example, it amounted to 23 per cent at New York City
banks, 29 per cent at Chicago banks, but only 8 per cent at other
weekly reporting banks, where customers generally seem less sensitive
to interest rate differentials. In October, the competitive position
of CD's improved somewhat as a result of the dip in market yields on
Treasury bills. This was reflected not only in a reduced rate of
attrition but also in some lengthening in the average maturity of new
CD's sold.
Savings deposits at city banks also declined in October as
they had in April and July, following the quarterly crediting of inte-
rest payments. However, the October decline was only $200 million as
compared with $1.6 billion in April and $1 billion in July. On the
other hand, savings certificates and other consumer-type time deposits
rose only $165 million in October, compared with more than $1.7 billion

III - 10
in July. Thus, the combined total of these two categories of deposits
declined slightly in October compared with a $750 million rise in July.
The reduced October outflow of savings deposits and inflow
of consumer-type time deposits presumably were interrelated. Smaller
transfers from passbook to other time deposits would be expected during
that month in view of the ceiling rollbacks on certain time deposits in
July and September and the likelihood that the more interest-sensitive
funds had been transferred out of passbook accounts earlier in the year.
In fact, most of the reduction in the inflow of consumer-type time
deposits between July and October was in the New York, Chicago, and
San Francisco Districts, which also experienced the heaviest impacts
of the ceiling rollbacks. More generally, the substantial further rise
in market rates of interest over this period reduced the relative
attractiveness of bank time deposits as compared with market instruments.
The money supply declined $900 million in October, just
offsetting the September increase. Since April, there has been a
cumulative decline at an annual rate of 1-1/2 per cent; and since the
shift in monetary policy last December, money has increased at an
annual rate of only 2-1/2 per cent. A major factor contributing to
the October decline was the large volume of investments liquidated by
the banks and absorbed by the public during the month. Although yields
on market instruments softened somewhat in October, they remained
relatively high historically, and undoubtedly served to attract addi-
tional funds out of cash into interest-bearing investments.

III - 11
Corporate and municipal bond markets. Through early
November, yields on corporate and municipal bonds continued to extend
the decline from their late August highs, but since then they have
turned up. This week's $130 million Aaa-rated Pacific Telephone
Company bond was reoffered to yield 5.95 per cent, the same rate at
which a similar telephone issue was marketed in late September when
yields on new corporate bonds were generally 20 basis points higher
than they have been recently.
Prior to the telephone offering, syndicates were terminated
on two recent utility bonds brought to market early in November. Their
yields then rose 15 and 20 basis points in secondary market trading.
In the municipal market too, investor response to recent offerings has
been lukewarm, and yields in the more sensitive series on seasonal
issues have risen 4 to 5 basis points.
BOND YIELDS(Per cent per annum)
Corporate AaaNew Seasoned State and local Government
With call Without call Moody's Bond buyer's
Sprotection protection Aaa (mixed qualities)
1965Low 4.33(1/29)- 4.41(3/12) 2.95(2/11) 3.05(2/11)
1966Low 4.79(1/7) 4.84(1/7) 4.73(1/7) 3.39(1/21) 3.51(1/21)
Weeks endingJuly 29 5.47 5.65 5.22 3.78 3.96
Sept. 2 5.98* -- 5.44 4.02 4.24
Oct. 28 5.60 5.93 5.37 3.75 3.83
Nov. 4 5.60 5.87 5.35 3.72 3.74Nov. 11 - -- 5.35 3.72 3.79
1/ Issues with and without call protection averaged together.* Includes issues with 10-year call protection.

III - 12
The up-turn of yields on corporate and municipal bonds
reflects the sizable recent build-up of calendars. For the corporate
calendar, the estimate of publicly-offered issues for November still
stands at about $575 million. But for December, the estimated volume
has risen to nearly $1 billion, far above last December's volume. The
timing of one large offering -- Pennzoil Corporation's $215 million
short-maturity note designed to repay term loans at banks -- may be
accelerated from its tentatively scheduled early December date. While
this would redistribute the November-December monthly estimates, public
bond issues for the two months combined are expected to total $1.5
billion, or roughly 50 per cent more than in the comparable period a
year ago.
At close to $1 billion the December calendar of publicly-
offered corporate bonds would rank second only to the August 1966
record. Moreover, this December figure appears to be a minimum estimate,
(unless the Pennzoil issue is advanced) since $930 million has already
been planned. The recent announcement by AT&T of a $250 million deben-
ture early in January may encourage some companies which had been
planning early 1967 offerings to accelerate their plans in order to
get ahead of AT&T, an anticipatory pattern which has occurred at times
of earlier AT&T issues.
Current estimates of corporate debt issues placed privately
are always highly tenuous since they depend essentially on the extrapo-
lation of past patterns. Thus, it may be that the recent build-up in

III - 13
public offerings reflects the very limited availability of private
placement money. In September, however, the latest month for which
data on actual takedowns are available, the volume of private place-
ments was larger than estimated and nearly as large as a year ago.
While the September figure may have reflected some speed-up in take-
downs stemming from the general squeeze on financial markets in August,
it does suggest that recent increases in the volume of public offerings
represent more than a mere offset to the year-to-year short-fall in the
volume of private placements.
1/CORPORATE SECURITY OFFERINGS-
(In millions of dollars)
BondsPublic 2/ Private Stocks
offerings- placements
1966 1965 1966 1965 1966 1965
1st Qtr. 1,774 905 2,586 1,673 734 4292nd Qtr. 1,941 1,864 2,083 2,259 1,090 9203rd Qtr. 2,280e 1,575 1,725e 1,955 251e 3834th Qtr. 2,095e 1,226 1,800e 2,264 445e 540
October 520e 287 450e 574 120e 124November 575e 613 450e 529 175e 257December 1,000e 326 900e 1,161 150e 159
1/ Data are gross proceeds.2/ Includes refundings.
State and local government long-term financing for November
and December is now estimated at $1.8 billion only slightly below a
year ago. Nearly $350 million of this total has been added in the last
two weeks. But State of California and public housing offerings, which

III - 14
usually occur at this time of year, account for two-thirds of the
increase.
STATE AND LOCAL GOVERNMENT BOND OFFERINGS(In millions of dollars) !/
1966 1965
1st Quarter 2,963 2,8512nd Quarter 3,255 3,0463rd Quarter 2,463 2,7814th Quarter 2.500e 2.651
Total 11,181e 11,329
October 740e 844November 950e 1,043December 800e 764
1/ Data are for principal amounts of new issues.
Stock market. Common stock prices -- as measured by Standard
and Poor's composite index -- have continued to advance from their
October yearly low. At 81.69 on November 15, the index was up nearly
12 per cent from early October, but still about 13 per cent below the
February level. The first 10 percentage points of the rise occurred in
October.
During the recent market advance, investor interest -- both
on the part of individuals and institutions -- has centered increasingly
in stocks viewed as "blue-chip" and "defensive" issues -- including
those of electric utility companies, casualty insurance companies, and
banks. On the other hand, trading in low-priced and speculative stocks
has fallen off drastically from the very high volume that prevailed in

III - 15
such issues last spring. Similarly, trading on the American Stock
Exchange -- sometimes used as another measure of speculative interest --
has recently averaged only 1.5 million shares per day, down about
75 per cent from the peak rate reached last April. This contrasts with
the New York Stock Exchange where trading has fallen 35 per cent over
the same period. Since early October, the increase in the American
Stock Exchange price index has amounted to about 8 per cent and Standard
and Poor's index of 20 low-priced common stocks has advanced less than
6 per cent.
Mortgage market developments. Scattered indications suggest
the possibility of some leveling in interest rates on loans for both
residential and other types of real estate. Actual data for October
for conventional first mortgages on homes, however, show at best a
slowing in the uptrend. The advance in contract rates for conventional
home loans was limited to about 5 basis points in October, compared with
10 in most other months this year. At 6.70 per cent on new homes and
6.75 per cent on existing homes, the rate levels were 85 to 90 basis
points higher than prevailed little more than a year earlier.
The increase in yields has been associated with more stringent
screening of borrowers for both construction transactions and permanent
financing and with greater constraints in terms of loan-to-value ratios
and maturities. In September, non-rate terms generally were among the
tightest ever recorded by the FHLBB series, which began in late 1962.
At the same time, loan amounts were below their peaks last August
although holding above year-earlier levels.

III - 16
AVERAGE TERMS ON CONVENTIONAL FIRST MORTGAGES FOR HOME PURCHASES
1966 Per cent changefrom a year
August September o Septemberago in September
New home loans
Loan amount ($1,000) 20.1 19.0 5Loan/price (per cent) 74.0 71.1 -3Maturity (years) 25.4 24.3 -2
Existing home loans
Loan amount ($1,000) 14.6 14.0 2Loan/price (per cent) 70.6 69.5 -3Maturity (years) 19.8 19.4 -3
Source: Federal Home Loan Bank Board and FDIC.
Mortgage debt outstanding increased by less than $6 billion
in the third quarter of the year, based on preliminary data now avail-
able for most lender groups. This was about $2 billion under the net
increase in the third quarters of each of the two preceding years when
mortgage debt formation had been maintained near its third quarter 1963
peak. The year-to-year shortfall for savings and loan associations in
the third quarter of this year about equaled that for all holders com-
bined, since changes among other major groups were largely offsetting.
Net growth in holdings by commercial and mutual savings banks showed
year-to-year declines while year-to-year increases were reported for
life insurance companies and by the Federal National Mortgage Association.
For life insurance companies the gain is not expected to continue
because it reflected largely the effect of commitments made some time
ago when pressures on the resources of these companies were considerably

III - 17
easier than they have become. On the other hand, the possibility of
some improvement in net inflows for savings and loan associations and
a potential increase in FNMA purchases which appeared to be developing
under the recently expanded authority voted by Congress, pointed toward
some moderation from the third quarter trend.
MORTGAGE DEBT OUTSTANDING BY TYPE OF HOLDER(Billions of dollars, without seasonal adjustment)
All holders
Financial institutionsCommercial banksMutual savings banksSavings and loan assoc.Life insurance companies
Federal agenciesFNMA
Individuals and others
AmountAmountSept. 1966 p
361.1
277.753.446.6
114.063.7
15.26.7
68.1
Increase in third quarter ofIncrease in1966 p 1965
5.9 8.0
3.6 6.31.4 1.8.8 1.1.3 2.4
1.2 1.0
.8 .2
.5 .1
1.5 1.4
third quarter ofp 1964 1963
8.1 8.1
6.4 6.71.3 1.41.2 .92.8 3.5
'1.0 .9
.1 - .1- .1 - .2
1.7 1.5
Partly reflecting the sharply reduced activity by savings
and loan associations -- the major lenders on homes -- expansion in
mortgage debt on 1- to 4-family homes sagged further to a seasonally
adjusted annual rate of less than $10 billion, and was under the recent
low in the fourth quarter of the recession year of 1960. Slowing in
expansion of multifamily and commercial debt was much more moderate,
but the rate in the third quarter was a four-year low.
Ic

III - 18
INCREASES IN MORTGAGE DEBT OUTSTANDING(Seasonally adjusted annual rates in billions)
Total
1964 III
1965 I p.II p.III p.IV p.
1966 I p.II p.III p.
30.9
29.730.330.330.5
30.526.322.4
1-4family
15.1
16.015.915.916.2
15.513.1
9.8
1/ Includes estimates for holdings of iare excluded in the flow of funds series.
MultifamilyCommercial 1/
13.8
11.612.412.111.5
12.710.910.3
Farm 1/
2.12.12.32.7
2.32.22.3
ndividuals and others which
--

III - 19
Flows to financial intermediaries. During October combined
savings in flows to depositary-type institutions shrank substantially
further, as flows to commercial banks dropped to the lowest volume
in nearly three years (even when negotiable CD's are excluded). As
the table shows, the October total was 75 per cent below October 1965
compared to a much more modest 38 per cent year-to-year reduction for
the first 10 months of 1966.
SAVINGS FLOWS TO MAJOR DEPOSITARY-TYPE INTERMEDIARIES(Millions of dollars)
Commercial Savings SavingsTotal Banks I/ and Loan Banks
- Associations
October1966 697 + 471 36 -2 190 2/1965 2,295 1,543 582 1701964 1,883 894 756 233
Year to Date1966 13,703 10,631 1,370 1,7021965 22,158 13,518 5,934 2,7061964 20,289 8,964 8,058 3,267
1/ Calculated from end-of-month data; does not include negotiable CD'sat weekly reporting banks.
2/ Based on a survey of the 20 largest and 20 randomly selected S&L'sin each Federal Home Loan Bank district.
3/ F.R. estimate based on data for flows to New York State institutions.
While the estimated October net inflow at Savings and Loan
Associations was barely positive, this was the first quarterly reinvest-
ment period this year in which the S&L's had not experienced a sizable
net loss of share capital -- (net losses in January, April, and July

III - 20
had been $77 million, $770 million, and $1.5 billion respectively).
Even so, the October experience at the S&L's looks better only in
relation to these earlier quarterly outflows. Compared with previous
Octobers, it was poor. At mutual savings banks, on the other hand,
the October net inflow was better than a year ago and four-fifths as
large as the 1964 record,
The improvement of flows to mutual savings banks represents
a continuation of the pick-up begun in July with the general move to
a 5 per cent deposit rate at New York State institutions. In areas
outside New York -- where the 5 per cent rate is less prevalent --
mutuals have not done so well. Thus, the past three months, the
New York Banks, with 60 per cent of the savings capital, have been
the recipients of nearly 80 per cent of the increase in deposits.
Assuming market rates do not rise appreciably and that most of the
largest mutuals continue to pay the 5 per cent rate, these institutions
should soon resume a more normal pattern of mortgage acquisitions.
In the S&L industry, however, associations in New York and
California continue to encounter problems. Associations in the New
York Home Loan Bank district were the only ones in the country to
lose savings capital continuously throughout the month of October --
even after the reinvestment period. Although they have leeway to
offer higher rates than savings banks (on 5-1/4 per cent, 6 month
certificates), the New York Associations have been reluctant to move
in this direction since it would force them to cut into capital

III - 21
surplus as the savings banks are reportedly doing. Apparently they
prefer to look for relief through a regula ory reduction in the
maximum rate that savings banks are permitted to pay.
S&L's in California, despite their higher current dividend
rate ceiling and the grandfather protection provided for rates paid
on old accounts, experienced a net outflow of $185 million in October.
For the first 10 months of 1966, the California associations have
lost nearly $200 million in share capital, compared with a $1.4
billion net inflow over the comparable period of 1965.

Ill - 22
U. S. Government securities market. Yields have risen in all
maturity areas of the U.S. Government securities market since the latter
part of October. In this period intermediate- and long-term yields have
advanced around 15 to 25 basis points, thereby erasing 1/3 to 1/2 of the
two-month decline which began in late August. The recent increase in
Treasury bill rates has likewise offset a large part of the earlier de-
cline, with the key 3-month bill currently some 25 basis points above
its late October low.
YIELDS ON U. S. GOVERNMENT SECURITIES(Per cent)
Date 3-month 6-month(closing bids) bills bills 3 years 5 years 10 years 20 years
1959-]961Highs 4.68 5.15 5.17 5.11 4.90 4.51Lows 2.05 2.33 3.08 3.30 3.63 3.70
1966Highs 5.59 5.98 6.22 5.89 5.51 5.12Lows 4.33 4.46 4.78 4.76 4.56 4.49
1966Aug. 29 5.02 5.51 6.22 5.89 5.51 5.12Sept. 21 5.59 5.96 5.90 5.53 5.21 4.97Oct. 24 5.19 5.52 5.40 5.23 4.94 4.73
Nov. 1 5.27 5.52 5.43 5.26 4.99 4.78Nov. 15 5.45 5.66 5.57 5.37 5.22 4.92
The recent weakness in the Treasury note and bond market has
reflected in part some investor selling of outstanding issues on switches
into the new 15-month and 5-year notes offered in the Treasury's November
refunding. In addition, a moderate amount of selling of the new 5-year
notes by speculative holders has been reported, but there has been some
III - 23
partly offsetting demand. Dealer holdings of notes and bonds maturing
in more than 1-year have risen to nearly $1 billion, including some
$600 million of the new notes acquired in the November refunding. The
$1 billion total also includes about $200 million of bonds maturing in
more than 5-years. Overall dealer positions in notes and bonds maturing
in more than 1-year are at their highest level since May 1965.
The recent rise in Treasury bond yields also appears to have
reflected a growing conviction that the earlier declines had outrun
the underlying credit situation, at least for the time being. Market
attitudes have also been influenced in part by recent sizable addi-
tions to the corporate bond calendar and by talk of a possible offer-
ing of FNMA participation certificates late this year.
The recent rise in Treasury bill rates has been influenced
by generally tight conditions in the Federal funds market and
associated increases in dealer financing costs. In addition, market
demand for bills has been relatively light in recent weeks, and al-
though it has picked up in the most recent trading sessions,dealer
bill positions are still relatively large and the dealers have re-
mained willing sellers of bills. Announcement of new cash financings
by the Treasury in the bill area (discussed below) has also con-
tributed to the upward pressure on rates. A measure of the recent
movement in bill rates is given by the auction average for the 3-month
issue which was at a recent low of 5.23 per cent on October 31 and
advanced to 5.46 per cent on November 14.
Yields on short-term debt instruments other than bills have
been generally steady since late October, as the table indicates.

III - 24
SELECTED SHORT-TERM INTEREST RATES-
1966June 30 Sept. 23 Oct. 31 Nov. 10
Commercial paper 4-6 months 5.625 5.875 6.00 6.00
Finance company paper 30-89 days 5.50 5.625 5.875 5.875
Bankers' Acceptances 1-90 days 5.50 5.75 5.625 5.625
Certificates of deposit (prime NYC)Highest quoted new issue:
3-months 5.50 5.50 5.50 5.506-months 5.50 5.50 5.50 5.50
Secondary market:3-months 5.55 5.90 5.75 5.756-months 5.60 6.30 5.875 5.875
Federal Agencies (secondary market):3-months 5.29 5.76 5.64 5.586-months 5.53 6.04 5.66 5.779-months 5.64 5.96 5.93 5.98
Prime Municipals 1-year 3.50 4.25 3.75 3.75
1/ Rates are quoted on the offeredmercial paper, finance company paper,quoted on a bank discount basis whileare on an investment yield basis.
side of the market; rates on com-and bankers' acceptances arerates on the other instruments
Federal Agency securities. Since early September, various
Federal Agencies have retired about $570 million of securities held by
private investors. These paydowns have been associated with a generally
strong performance of the Federal Agency securities market, although
rates have turned up most recently.
New cash needs of the Federal Agencies have been financed
through purchases of new issues by the Treasury Trust Accounts. Such
purchases have totaled nearly $900 million since early September.
III - 25
After allowance for the $570 million paydowns of maturing issues held
by private investors, the Agencies have raised net about $325 million
of new money over the period.
Treasury finance. The purchases of Federal Agency securities
by the Treasury Trust Funds have served to augment the already large
cash needs of the Treasury over the second half of 1966. Before the
end of the year, the Treasury is expected to raise around $3.0 to $3.5
billion more of new money, including a $1.2 billion auction on November
17 of a "strip" of bills in the 1-year series. The remaining cash will
be obtained by an auction of tax bills in December and by continued
$400 million additions to the monthly auctions of 1-year bills. As
the table indicates, total cash to be raised in the second half of
this year will approximate $11.0 billion, a figure last approached,
but not equaled, in the second half of 1959. The Treasury will also
have to return to the market for additional cash in the early weeks
of 1967.

III - 26
TREASURY GROSS CASH FINANCINGS(Amounts in billions)
3rd QuarterAdditions Otherto bills
5.1 --
3.0 -0.7
5.9 --
4.1 1.6
2.5 --
4.2
3.4
4th QuarterAdditions Other
Otherto bills
2.5 2.3
3.0 --
0.8
2.1 --
1.8 0.4
1.5 0.8
6.5 *
7.2 proj. 0.3
TotalSecond half
9.9
5.3
6.7
7.8
4.7
6.5
6.5
10.9 proj.
All figures are based on payment dates.
Year
1959
1960
1961
1962
1963
1964
1965
1966
~ c
I
* Less than $50 million.
II - 27
The Federal Budget
The rapid increase in defense spending has moved the budget
into a more expansive position in the second half of calendar 1966.
Quarterly increases in national defense spending had averaged only
about $2 billion during fiscal 1966, but the third quarter increase was
$4.2 billion and the fourth quarter change may be of the same general
magnitude. Transfer payments also rose by $2 billion in the third
quarter--mainly because of the introduction of Medicare payments.
These increases are likely to reduce the high employment surplus by
almost $6 billion over the half year.
Spending on other accounts appears about as projected by the
January Budget Document. The one class of exceptions are those ex-
penditures affected by credit tightness: interest payments are higher
than projected, participation sales lower, and agency lending higher.
(Only the first of these items is in the National Accounts Budget, the
first two are in the Administrative Budget, and all are in the Cash
Budget.)
Revenues on all budgets have grown sharply throughout the
year. Although this is primarily due to the rapid growth in money in-
comes, there is some indication that personal tax revenues have in-
creased even more than can be accounted for by higher incomes. One
possible explanation is that the Treasury underestimated the potency
of the accelerated withholding measure (Tax Adjustment Act) enacted
earlier in the year. Whatever the cause, the sharp growth in revenues
has been a fortunate development moderating what/would have been an
even more dramatic decline in the high employment surplus.
The accompanying Table gives quarterly budget information for
the year, and compares it to some of the corresponding 1965 totals.

FEDERAL BUDGETS, QUARTERLY, 1965-1966(Billions of dollars)
Calendar 1965 Calendar 1966
III IV I II III IV(p) Calendar 1965 Calendar 1966
Quarterly Totals, seasonally unadjusted
Admin. BudgetReceipts 22.2 21.0 26.1 35.4 25,4 23.2 96.7 110.1Expenditures 25.7 27.3 27.2 26.8 33.2 31.8 101.4 119.0Surplus - 3.5 - 6.3 - 1.1 8.6 - 7.8 - 8.6 - 4.7 - 8.9
Cash BudgetReceipts 29.2 25.8 33.3 46.1 34.6 30.9 123.4 144.9Expenditures 33.1 34.0 34.6 36.0 41.3 40.5 127.9 152.4Surplus - 3.9 - 8.1 - 1.3 10.1 - 6.7 - 9.6 - 4.6 - 7.5
Seasonally adjusted at annual rates
SNIA BudgetReceipts 123.8 126.9 136.0 141.0 145.4 148.5 124.9 142.7Expenditures 126.3 127.0 133.7 137.2 145.1 150.0 123.4 141.5Surplus - 2.5 - .2 2.3 3.8 .3 - 1.5 1.6 1.2
High Employment BudgetReceipts 127.6 129.0 136.7 141.2 145.4 148.5 128.4 143.0Expenditures 126.0 126.8 133.7 137.1 145.1 150.0 123.1 141.5Surplus 1.6 2.2 3.0 4.1 .3 - 1.5 5.3 1.5
52.5 54.6 57.1 61.3 64.8 50.1 59.4Addendum: National Defense 50.7

III-c-1FINANCIAL DEVELOPMENTS - UNITED STATES
FREE RESERVES AND COSTSBILLIONS OF DOLLARS III
IP %VV&k_ NET FREE RESERVE!
CHANGES IN BANK CREDITSEASONALLY ADJUSTED I i
1 I ll l BILLIONS OF DOLL,
. I ATOTALA I
S3MO MOVINGAVERAGE
-- oOCT 0 6
------ d
BILLIONS OF DOLLARSEXCESOCT 73
BEXCESS
0 R R OW ED 7 7'II III,"!.P1962 1964 1966
PER CENT OF ONP
' MONEY SUPPLY A T
I t I Q if 50IME DEPOSIS 44 0
IME DEPOSITS 140
30
20
CHANGES IN BANK LOANS-BY TYPEBILLIONS OF DOLLARS I 3I M0 MOVING I I ISEASONALLY ADJUSTED AVERAGE
Ix I
2
1964 1965 1966 0 1ALL OTHER -- 21964 1965 196SAVINGS SHARES AND DEPOSITS6ILLIONS OF DOLL ARS i II lit11 IRATIO SCALE OCT 112 1
. SAVINGS AND LOANASSOCIATIONS
OCT 546MUTUAL SAVINGS BANKS
il ll 3
6 M6ONEY SUPPLY 22
1962 1964 1966
1962 1964 1966
11/15/66
1962 1964 1966

III--C-2 11/15/66
FINANCIAL DEVELOPMENTS - UNITED STATES
IET FUNDS RAISED-NONFINANCIAL SECTORS SHARES IN TOTAL CREDITIILLIONS OF DOLLARS I 1 00 PER CENT6(SEASONALLY ADJUSTED, PER CENT
,NNUAL RATES -
S____ - - 80 COMMERCIAL BANKSTOTAL - -/ \ - - 4(
-63 60m 53 ------- --- 2(
/ PRIVATE DOMESTIC 401_m 63
PER CENT I PRIVATE DOMESTIC TO , _ - - / Il l136 4(
PRIVATE INVESTMENT OUTLAYS-- 40 NONBANK DEPOSITORY
INSTITUTIONSom 287- 2 720 -- 2(
OTAL TO G.N.P. O on92
- -__ PUBLIC
1962 1964 1966 1964 1965 1966
MARKET YIELDS MARKET YIELDS-U.S. GOVT. SEC.PER CENT 1111111111 I1l1111 7 PER CENT I I lii ll I ll11lll ll 7
SEPT 66
NEW HOME FIRST MORTGAGES:
/ / s 6 A - 6, -YEAR BILLS -I 1 l-'ocT 58l 1' 3 LSOCT*5__30-YEAR, FHA-INSURED F -OCT 583 L
5 5
NEW CORPORATE Aae OCT
NEW SECUR TTY ISSUES STOCK MARKET-\ CSTATE AND LOCAL 3-MONTH BDLLSS-- .... -*--i : -, -*/ - 3 J .. . .....-- - .2.5COMMON STOC100S INVESTMENT YIELD SIS
DV 6 IDENDPR KIC R P IESTMENT IE BA
1962 1964 1966 1962 1964 1966
NEW SECURITY ISSUES STOCK MARKETBLLIONS OF DOLLARS I I I I I I 1 1 3.0 1941 43.10 . BIlllIONS OF DOLLARS
CORPORATE - RATIO SCALE -
-2.5 100-- COMMON OCT 77 1 1 0
A A Al966 STOCK PRICES2.U E
8 0O-- TRAI-- - -- - 8
ONATE OCT L L1.5 GSEPT 751.5 _ " 4
S -60 - TOTAL 61/96 1.0 CUSTOMER CREDIT
1964 NEW SERIES.5
MILLIONS OF SHARES RATIO SCALE 12
S ---- VOLUME OF TRADING- , 8-STATE AND LOCAL GOVERNMENT - 1.5 NSE A Dl Volume
1 .0 1. J 4
OCT 7.5
I I I I I I t _ _!MAR. JUNE SEPT. DEC.

IV - 1
INTERNATIONAL DEVELOPMENTS
U.S. balance of payments. Weekly indicators show an
unadjusted payments deficit on the liquidity basis for October and
early November in excess of $800 million. As noted in earlier Green
Books, the payments results for this period customarily appear un-
favorable. However, in the corresponding 6 weeks of 1965, the deficit
on the liquidity basis was less than $600 million.
The large deficit on the liquidity basis in October and
early November was financed primarily by an increase in liabilities
of U.S. banks to their foreign branches. These liabilities rose
about $700 million in this period -- close to the peak rate of in-
crease that had occurred in July during the height of the run on
sterling -- with more than $400 million of the rise occurring in
the week ending November 9. Reflecting the large inflow of foreign
private funds through the branches, the payments position on official
settlements was close to balance over the past six weeks.
CHANGES IN U.S. SHORT-TERM LIABILITIES TO FOREIGN COMMERCIAL BANKS(In billions of dollars, not seasonally adjusted)
Liab. to foreign Liab. to otherTotal branches banks
1964 +1.5 +0.3 +1.2
1965 +0.1 +0.2 -0.1
1966III
III
Oct.l-Nov.9 est.
Total, year to date est.
+0.4+0.3+1.2
+0.7
+2-3/4
+0.5+0.3+1-1/4
+0.7
+2-3/4
-0.1
--

IV - 2
In recent years, there has been some decline in U.S. banks'
liabilities to branches late in the year. In 1965 these liabilities
reached a peak at the end of October, and declined $500 million in
the ensuing two months; in 1964, the peak was not reached until mid-
December, but the decline from that point to year-end was $400 million.
The third quarter payments results which were just published
show little change in the two measures of our overall payments posi-
tion from the figures given in the Supplement to the last Green Book.
As illustrated in the table below, special receipts in the third
quarter were large, although down from the high rate of the second
quarter. Debt prepayments make both measures of our payments position
more favorable than they otherwise would be, whereas the two other
types of special receipts snown in the table primarily benefit the
balance on the liquidity basis.
U.S. BALANCE OF PAYMENTS, SELECTED ITEMS(In millions of dollars, seasonally adjusted)
Qtr. Qtr. Qtr. Total,1 2 3 3 Qtrs.
Balances -- on official reservetransactions(deficit -) -226 -198 993 569
-- on liquidity basis(deficit -) -536 -125 -217 -878
Selected Special ReceiptsPrepayments of U.S. Government debt 3 7 220 230
U.K. and International purchases (net)of U.S. securities, other thanTreasury issues 34 68 9 111
Increase in long-term liabilities toforeigners, reported by banks 55 438 90 583

IV - 3
The partial third-quarter results currently available do
provide further information on merchandise trade, and on bank-reported
capital flows and securities transactions. But these transactions,
together with the special receipts identified in the table above, do
not fully account for the relatively favorable outcome on the liquidity
basis. Other transactions (a residual, which includes both other
transactions that will ultimately be recorded and errors and omissions)
showed an improvement of nearly $400 million between the second and
third quarters, despite continued high, and probably rising, military
expenditures. It is likely that these as-yet unidentified transactions
may have reflected, at least in part, tight credit conditions in this
country and/or the run on sterling.
The reduction in the trade surplus in the third quarter to
an annual rate of slightly less than $3 billion appears to have re-
flected mainly exceptional increases in imports of certain commodities.
Of the total growth in imports from the second quarter ($25 billion
annual rate) to the third quarter ($26-3/4 billion rate), more than
one-third was attributable to unusually large increases in purchases
of steel, petroleum and sugar. Continued increases in imports of these
commodities are not expected in the fourth quarter. Apart from the
bulge in these imports, the rise from the second quarter was about in
line with the rapid increase of 4-5 per cent a quarter that has per-
sisted since the second quarter of 1965. Imports of consumer goods
and capital equipment continued their rapid advance, while imports of
industrial materials other than steel and petroleum were unchanged
(see chart below).

IV - 4
The 4 per cent increase in exports from the second to the
third quarter ($29-1/2 billion annual rate on the balance of payments
basis) reflected a spurt in sales of agricultural commodities, es-
pecially feed grains, wheat and cotton, and some further growth in
non-agricultural exports. Non-agricultural exports have risen at an
annual rate of about 5 per cent since the end of last year. As shown
in the table, much of the third-quarter strength in these exports was
attributable to sales to non-industrial countries (including Australia
and South Africa), whereas in somewhat longer perspective there has
been relatively steady growth in sales to Canada and Japan. Non-
agricultural exports to Europe have shown no significant change since
late last year.
U.S. EXPORTS BY AREA(Billions of dollars; seasonally adjusted annual rates)
Year 1965 19661965 Q-3 Q-4 Q-1 Q-2 Q-3
NONAGRICULTURAL EXPORTSIndustrial countries (excl.special categories)Canada 5.0 5.1 5.6 5.6 5.9 6.0Western Europe 6.2 6.4 6.7 6.8 6.6 6.6Japan 1.2 1.2 1.2 1.3 1.3 1.4
Total 12.4 12.6 13.5 13.7 13.9 14.0
Non-industrial countries (excl.special categories)Latin America 3.3 3.4 3.6 3.7 3.5 3.8All Other 4.2 4.4 4.0 4.1 4.1 4.5
Total 7.5 7.8 7.6 7.9 7.6 8.3
Special Categories (excl.military grant aid) 0.3 0.4 0.5 0.4 0.4 0.2
Total nonagr. exports 20.2 20.8 21.6 21.9 21.9 22.4
AGRICULTURAL EXPORTS 6.3 6.8 6.8 6.8 6.9 7.4
TOTAL EXPORTS, Census basis 26.5 27.7 28.4 28.7 28.7 29.9

IV - 5
The third-quarter reflows of bank credits, totaling slightly
more than $100 million seasonally-adjusted, consisted principally of
long-term credits. New long-term loan commitments to foreigners
averaged $70 million a month in the first nine months of 1966, com-
pared to $100 million a month in the last nine months of 1965.
According to preliminary figures, commitments in the third quarter
declined slightly further to a rate of about $60 million a month.
With commitments and disbursements down substantially this year, the
repayments and amortizations of outstanding loans have resulted in a
net reflow of long-term credits amounting to $175 million (seasonally
adjusted) through the first nine months. Net reflows of short-term
loans and acceptance credits to all areas in the third quarter
(seasonally adjusted) were roughly offset by increases in collection
claims outstanding for banks' own accounts or for customers; and for
the first nine months the reflow of short-term loans and acceptances
has also been approximately matched by increases in collection items
outstanding. The third-quarter reflow of short-term loans and
acceptances consisted of large reflows from Japan, partly offset by
outflows to other areas, particularly Latin America.

IV - 6
Interest rates abroad. Since August, interest rates have
leveled off or turned downward in a number of financial markets abroad
where rates had been rising, with few interruptions, for more than
three years. In particular, bond yields have dropped appreciably in
the United Kingdom, Germany, the Netherlands, and Canada. These changes
appear to have been caused largely by market forces rather than by active
efforts by monetary authorities to bring about easier conditions. In
contrast to the recent pattern in these countries, some firming of
interest rates has occurred in France and Switzerland, and Italian rates
have been stable. Rates in Japan have continued to decline.
In the United Kingdom, expectations of a general recession in
economic activity have become widespread in the past two months. As
a result, credit demands have diminished and long-term and short-term
interest rates have declined. From a peak of 7.31 in early September,
the War Loan yield moved down to 6.87 per cent as of November 10, while
the Treasury bill rate, at 6.38 per cent on November 14, was down
22 basis points from its September high. Beginning in August, out-
standing advances of the London clearing banks, seasonally adjusted,
fell for three consecutive months. Extension of new hire purchase
credit by finance houses and retailers was 23 per cent smaller in the
third quarter than a year earlier.
There is apparently some apprehension in government circles
that economic activity, particularly private investment spending, may
be falling off more rapidly than desired. On November 1, the Bank of
England pointed out that outstanding bank credit was well below the

IV - 7
level permitted by the ceiling the Bank has set, and it voiced
encouragement of lending to finance capital investment, exports, and
housing for workers being relocated. At the same time, the authorities
are continuing to slow down the decline in interest rates, In the last
two weeks, the Bank of England has forced the discount houses to borrow
from it at the discount rate, in order to maintain the bill rate near
present levels,
In Germany, the composite yield on public authority bonds
carrying a 6 per cent coupon has dropped more than 1/2 percentage point
from its mid-July peak of 8.60 per cent, and rates for call money and
30-day interbank loans are also well below the July peaks. Although the
cost of 90-day funds in the interbank loan market advanced in September-
October for seasonal reasons, the rise was small in comparison with
those of preceding years.
Several factors seem to have contributed to this easing of
yields. Balance of payments surpluses since late last spring have been
providing liquidity to the banking system. The marked slowing of the
expansion of private investment expenditures this year has probably
meant that business demand for funds has been rising less rapidly than
before. In addition, bond prices continue to benefit from the suspension
of new issues by the public authorities that was ordered in May and is
expected to remain in force at least through the end of this year,
Finally, during the summer the public authorities substantially increased
their net indebtedness to the Bundesbank.
IV - 8
The Bundesbank has announced a temporary 9 per cent reduction
in reserve requirements for December to offset seasonal money market
tightness at the end of the year. A parallel action was taken in
December 1965, but there is some feeling in financial circles that this
time the Bundesbank may initiate a cautious relaxation of policy by not
restoring the reserve requirements to the pre-December level in January.
Long-term rates in the Netherlands have recently been about
30 basis points below August peaks; in late October the composite yield
on three government issues was 6.55 per cent. Conditions on new issues
also seem to have begun to improve. The Bank for Dutch Municipalities,
the largest regular borrower on the Dutch capital market, floated new
bonds in May and in October with a 7 per cent coupon, but the issue price
rose from 99-1/2 in May to 100 in October. Net inflows of foreign ex-
change contributed to an easing of the money market from mid-August to
end-September. Since then, seasonal tax and other factors have caused
short-term rates to rise.
The Netherlands Bank is continuing to maintain somewhat more
restrictive quantitative ceilings on bank credit this year than it did
last year. The latest ceilings allow an 8 per cent expansion of short-
and medium-term loans to the private sector during the year to the fourth
quarter of 1966. This compares with an allowed expansion of 9.4 per
cent in the preceding year and an actual expansion of 8.9 per cent,
Lending in excess of the prescribed ceilings increased earlier this
year, but since July it has been greatly reduced by the application of

IV - 9
stiffer penalties for such excesses, and perhaps also by some weakening
of loan demand.
In France, the net export of funds by French banks, together
with an adverse shift in merchandise trade, has led to higher rates in
the Paris money market, and the commercial banks have increased their
recourse to the Bank of France quite substantially. From the spring of
1965 through last August, the Bank of France kept call money rates from
exceeding a fixed limit, almost always 4-7/8 per cent, by making
sufficient end-of-month purchases of open market paper at that rate.
But more recently the Bank allowed the call money rate to rise to
5-1/4 per cent over the September month-end, and to 5-3/8 per cent at
the end of October.
It seems very doubtful that the authorities desire higher
rates to temper the pace of economic expansion in France. Instead, rates
have probably been allowed to rise in order to discourage net exports of
funds by French banks. Such net lendings are thought to have been large,
and to have been a prime reason for the drying up of the official reserve
accruals. The French authorities have for a long time looked with dis-
favor on volatile flows of short-term funds between France and the rest
of the world.
Yields on public sector bonds averaged 6.72 per cent at the
end of September, about the same as at the end of June, but 30 or more
basis points higher than in the earlier months of this year up to May,
in reflection of the decision taken by the Treasury in early June to

IV - 10
raise the yields on new public sector bond issues by 1/2 percentage
point. In October the Treasury floated a 1.5 billion franc issue
yielding 6.55 per cent; reportedly, it was not taken up as speedily as
the 1 billion franc loan of October 1965 that yielded 6.07 per cent.
The amount of funds being raised on the French capital market
continues to be disappointingly low, especially in view of the important
tax measures that were adopted in the past year and one-half to encourage
savers to invest in long-term securities. New funds raised in January-
September were 6 per cent less than last year, and the decline for bond
and share issues by private borrowers was almost 30 per cent.
Bond yields in Italy have changed very little in recent months;
the composite yield covering all bonds in circulation except Treasury
issues averaged 6.38 per cent in September. Italian monetary policy
has remained very expansionary, inasmuch as investment expenditures
have yet to regain pre-recession levels and the recovery of over-all
output has not yet pressed strongly against available resources. In
August, the money supply was 15 per cent greater than a year earlier.
The demand for bank loans has become much stronger this year, and out-
standing loans in August exceeded the year-earlier level by 13 per cent.
At the same time the balance of payments surplus, rising Bank of Italy
credit to the Treasury, and increasing central bank rediscounts and
advances to the banking system have provided sufficient reserves to
enable the banks to increase their security portfolios by 21 per cent in
the past year. The Bank of Italy is continuing its policy, now a year

IV - 11
old, of limiting its new lira/dollar swaps to those banks which still
have a net debtor position with foreigners. As a result, nearly all of
the external surplus has been employed as a reserve base for the
acquisition of domestic assets.
The failure of interest rates to decline further, despite the
rapid monetary expansion, seems to stem from heavy demands on the
capital market and a large capital outflow from Italy to the rest of
the world. The public sector's capital market borrowings, which rose
sharply in 1965, have in all likelihood increased again this year by a
large margin, partly because of a widened budget deficit. Last year the
Italian balance of payments registered a net capital outflow of
$458 million, including $375 million of net trade credits that do not
appear from the exchange data. So far this year the capital outflow has
apparently been running at a much higher level; exchange data show a
net outflow of $363 million in January-August, compared with a $58
million net inflow in the first eight months of 1965.
Yields on long-term government bonds in Canada are currently
20 to 40 basis points below the peaks of late August, but Canadian
short-term interest rates have been increasing again since late
September. The Treasury bill rate, now 5.08 per cent, has risen from
4.84 on September 23, and is a bit above its August high of 4.97 per
cent. The rate for 90-day finance company paper, which was 6-1/4 per
cent during August, has been 6-3/8 per cent since late September.

IV - 12
A shift in investor expectations has brought long-term rates
down. Until late August, Canadian economic indicators suggested that
inflationary pressures would remain substantial, and it seemed that
monetary policy alone would be employed to restrain demand. Since then,
the government has indicated it is ready to take anti-inflationary fiscal
action and signs of softening demands have appeared in certain industrial
sectors. In late August the Finance Minister announced that an interim
budget for the purpose of curbing inflationary pressures would be
presented in the fall. Presentation of this budget has been delayed,
but is now expected in December.
In Japan, interest rates continued to decline in general
through September. The average rate on bank loans fell from 7.48 per
cent in July to 7.42 per cent in September; the previous high was 7.99
per cent at the end of 1964. On October 1, the administration took steps
to lower the structure of long-term interest rates. The standard rate
on loans by the long-term credit banks was cut from 8.4 to 8.2 per cent,
and the interest yield on one-year and five-year bank bonds was reduced
from 6.2 to 6.0 per cent, and from 7.3 to 7.2 per cent, respectively.
This move was reportedly taken in order to narrow the gap between long-
and short-term rates which had widened with the steady decline in
short-term rates.
Bank of Japan officials have indicated that because of the
high interest rates in New York, Japanese Euro-dollar borrowings have
increased. They also indicated that a rise of about $200 million in

IV - 13
the outstanding level of Euro-dollar borrowings in the first 10 months
of this year was partly offset by about a $100 million decrease in the
level of other "Euro-money" borrowings. There has been a tendency for
much of the Japanese Euro-dollar borrowing to be of an increasingly
shorter maturity.

IV-C-1 11/15/66
U.S. AND INTERNATIONAL ECONOMIC DEVELOPMENTSSEASONALLY ADJUSTED
U.S. BALANCE OF PAYMENTSBILLIONS OF DOLLARS I I
QUARTERLY2
o111 99
OFFICIAL RESERVETRANSACTION BASIS
0
1LIQUIDITY BASIS
- 2
1960 1962 1964
U.S. MERCHANDISE TRADE
1966
U.S. BANK CREDIT OUTFLOWS
90-DAY RATESPER CENT 11 11T17NOT SA NOV 9675
EURO-DOLLARS N 93
U.S. C-D'S
lil______ 3
1963 1964 1965
.S. EXPORTS BY AREALLIONS OF DOLLARS l-"™IIIIINNUAL RATES IMO MOV AV(121) I JS 74
1966

A- 1
APPENDIX A: A REVISED INDEX OF MANUFACTURING CAPACITY*
A new set of estimates of capacity utilization in U.S.manufacturing industries will be described and published in the NovemberFederal Reserve Bulletin. The estimates are a revision of figures whichhave been prepared within the Federal Reserve System for the past sixyears. In spite of the revision, they remain crude estimates, subjectto much larger measurement errors than many other time series incommon use.
The method used to calculate the present capacity estimatescan be summarized in a few sentences. The general level and majormovements of capacity utilization in the estimates are- those whichemerge from McGraw-Hill surveys of capacity utilization of manufacturingcompanies. Dividing these utilization rates into Federal Reserve indexesof production gives the general level and trend of the capacity estimates.The final capacity estimates are extrapolated before the earliestutilization survey and beyond the most recent one through the use ofcapital stock estimates and McGraw-Hill survey information on yearlycapacity changes. These two sources of information, finally, are alsoused to smooth the capacity estimates during the period of the utiliza-tion surveys.
The new estimates differ from the old for three reasons:(1) separate estimates have been prepared of capacity (and of utilization)for two subgroups of manufacturing, primary processing industries andadvanced processing industries; (2) on the basis of recent evidence,it is now assumed that respondents to the McGraw-Hill surveys adjusttheir responses for seasonal variation; and (3) the estimates are basedon additional year's data for all the time series involved, and a com-pletely different set of data for estimates of the stock of capitalgoods owned by manufacturers.
The changed assumption about seasonal adjustment makes thenew estimates of utilization a point or two lower than the old ones forthe last ten years. Earlier we had assumed that the end-of-yearutilization rates that companies reported to McGraw-Hill were notadjusted for seasonal variation; because the end of the year is, onbalance, a slack season for manufacturing production, our seasonallyadjusted utilization rates were above the figures reported by McGraw-Hill. Now we assume that the rates reported to McGraw-Hill areseasonally adjusted and our seasonally adjusted utilization estimates arelower than they were, and no longer above the McGraw-Hill reported rates.
*Prepared by Frank de Leeuw, Senior Economist, National Income,Labor and Trade Section, Division of Research and Statistics.

A- 2
The seasonal effect is also responsible in large part for a slightwidening of the gap between the old and revised series over thelast 8 or 9 years, because the implicit December seasonal factor in theindustrial production index has declined slightly during that period.
As for the other divergences, including a slight excess ofthe revised over the earlier estimates for the first few years, a greatmany minor changes in data are responsible and no one factor is dominant.
Estimated utilization rates for a new breakdown of totalmanufacturing for primary processing industries and advanced processingindustries generally move in the same direction, as seen in the tables,but the two show some significant differences during peak periods.Primary processing industries reached their highest postwar utiliza-tion rate just after the outbreak of the Korean War, whereas advancedprocessing industries did not reach their postwar peak until near the endof that conflict. In 1965, primary processing utilization was not so,high as it had been in 1955-56 but advanced processing utilization was
as high as in the earlier period.
The new utilization estimates will be prepared after the end
of each quarter and will be sent on a regular basis to anyone interested
in obtaining them.

A - T-1
November 1966
TOTAL MANUFACTURING OUTPUT AS A PER CENT(Seasonally adjusted)
OF CAPACITY
I II III IV
1948 88 88 88 861949 82 78 78 761950 80 87 94 95
1951 96 95 91 901952 91 88 88 951953 96 96 95 881954 84 83 82 841955 87 90 91 91
1956 89 88 86 881957 87 85 84 791958 72 71 75 781959 81 85 81 801960 84 82 80 77
1961 75 78 80 821962 82 83 83 821963 82 84 84 841964 85 86 87 871965 89 89 89 89
1966p 91 91 91
Note: Estimates based on data from Federal Reserve Board,Department of Commerce, and McGraw-Hill EconomicsDepartment.
p - Preliminary.

A - T-2
November 1966
OUTPUT OF PRIMARY PROCESSING INDUSTRIES AS A(Seasonally adjusted)
PER CENT OF CAPACITY
I II III IV
1948 89 90 89 871949 83 77 77 751950 83 91 98 99
1951 100 100 95 921952 92 84 87 961953 96 97 95 871954 82 82 82 851955 89 93 95 95
1956 93 92 86 911957 89 87 87 801958 71 71 77 801959 83 89 78 791960 86 82 79 74
1961 72 78 81 821962 83 82 81 811963 82 85 84 841964 86 87 88 891965 90 90 90 89
1966p 91 92 91
Note: Estimates based on data from Federal Reserve Board,Department of Commerce, and McGraw-Hill EconomicsDepartment.
p - Preliminary.

A - T-3
November 1966
OUTPUT OF ADVANCED PROCESSING INDUSTRIES AS A(Seasonally adjusted)
PER CENT OF CAPACITY
I II III IV
1948 88 87 86 851949 82 79 79 771950 79 84 91 92
1951 93 91 88 891952 90 90 90 951953 96 96 94 891954 85 83 83 821955 85 88 88 89
1956 86 86 86 861957 85 84 82 781958 73 72 74 761959 79 82 83 801960 83 82 81 79
1961 76 78 80 821962 82 83 84 831963 83 83 84 841954 84 85 85 851965 88 88 88 89
1966p 91 91 91
Note: Estimates based on data from Federal Reserve Board,Department of Commerce, and 1cGraw-Hill EconomicsDepartment.
p - Preliminary.


