Embed Size (px)
Citation preview
Prefatory Note The attached document represents the most complete and accurate version available based on original copies culled from the files of the FOMC Secretariat at the Board of Governors of the Federal Reserve System. This electronic document was created through a comprehensive digitization process which included identifying the best-preserved paper copies, scanning those copies,1
and then making the scanned versions text-searchable.2
Though a stringent quality assurance process was employed, some imperfections may remain. Please note that some material may have been redacted from this document if that material was received on a confidential basis. Redacted material is indicated by occasional gaps in the text or by gray boxes around non-text content. All redacted passages are exempt from disclosure under applicable provisions of the Freedom of Information Act. 1 In some cases, original copies needed to be photocopied before being scanned into electronic format. All scanned images were deskewed (to remove the effects of printer- and scanner-introduced tilting) and lightly cleaned (to remove dark spots caused by staple holes, hole punches, and other blemishes caused after initial printing). 2 A two-step process was used. An advanced optical character recognition computer program (OCR) first created electronic text from the document image. Where the OCR results were inconclusive, staff checked and corrected the text as necessary. Please note that the numbers and text in charts and tables were not reliably recognized by the OCR process and were not checked or corrected by staff.
Content last modified 6/05/2009.
CONFIDENTIAL (FR)
CURRENT ECONOMICand
FINANCIAL CONDITIONS
Prepared for the
Federal Open Market Committee
By the Staff
BOARD OF GOVERNORS
OF THE FEDERAL RESERVE SYSTEM July 12, 1967

CONFIDENTIAL (FR)
CURRENT ECONOMIC AND FINANCIAL CONDITIONS
By the StaffBoard of Governors
of the Federal Reserve SystemJuly 12, 1967
I-1
SUMlARY AND OUTLOOK
Outlook for economic activity
The third quarter has begun on a firm tone as consumers appear
to be buying more durable goods, especially autos, than anticipated and
the inventory adjustment has become much less of a downward drag on
economic expansion than earlier. Gains in GNP in both the second and
third quarter are now expected to be somewhat larger than previously
anticipated. Real GNP growth this quarter could increase to an annual
rate of over 4 per cent although the price deflator is also expected
to rise more rapidly than previously estimated, mainly because of rising
prices of farm products and foods. These projections would need to be
modified if there is a lengthy or widespread auto strike; contracts
are scheduled to expire in early September.
Inventories continue to move into a more favorable balance
with sales. In May there was little further accumulation in total
business inventories. Additions to stocks of manufacturing fell to
a relatively low level as shipments increased and output declined some-
what further. At the same time, there was additional liquidation of
distributors' inventories. New orders and employment in manufacturing
have begun to rise and, with the inventory situation improving, pro-
duicion should also turn up in this quarter.
Gains in retail sales in the second quarter were the major
factor lifting private final outlays above expected levels. Domestic
automobile sales increased to an 8.4 million annual rate in June,
sharply above the April and May rate; sales of department and other
general merchandise stores also showed significant improvement. Services,
meanwhile, continued their upward trend.
1-2
The outlook for total consumer expenditures, therefore, appears
to be strengthening. Along with improved consumer sentiment, which has
also been reflected in recent surveys, wages and employment will be
advancing faster and the savings rate, which fell in the second quarter,
should decline further.
Final demands are also being augmented in the third quarter by
a further rise in expenditures for residential construction. Housing
starts have responded to the greater availability of mortgage credit
over recent months, and the number of new building permits issued implies
a continuation of the upward trend in expenditures even though interest
costs on mortgages have risen somewhat recently.
In line with latest Commerce-SEC survey, our expectation is
still for some moderate rise in business fixed investment this quarter.
New orders for machinery and equipment have strengthened and, although
the evidence is still incomplete, reinstatement of the 7 per cent tax
credit seems to be having a positive effect on business expectations
and on expenditures for plant and equipment.
The Government sector, meanwhile, will also provide important
support to rising final sales in the third quarter. Defense expendi-
tures are projected to continue to rise and to exceed Budget estimates.
Exactly how huge this extra spending may be should become clearee in
the next few weeks, when the Budget Bureau is scheduled to present
revised estimates of Federal expenditures and receipts for fiscal
year 1968.

I 3
Resource use and prices
Demand for workers strengthened somewhat in June, even though
the unemployment rate rose to 4.0 per cent from 3.8 in May. Nonfarm
employment turned up after declining since March, including a small
rise in manufacturing and construction. Gains in employment are
expected to increase faster in coming months. The labor force, which
had been declining recently, recovered sharply as the inflow of workers
in June, particularly teenagers, sharply exceeded seasonal expectations.
Most of these new workers found jobs although the added supply of women
seeking seasonal jobs somewhat exceeded demands and their unemployment
rose. The higher rate of unemployment in June is not expected to continue
beyond the summer.
Industrial production is estimated to have declined somewhat
further in June, and possibly into July, reflecting attempts by both
manufacturers and distributors to reduce inventories of materials and
of consumer goods, as well as some further downward adjustment in
production of business equipment.
The rate of capacity utilization by manufacturers continued
downward from the estimated level of 85.0 per cent in May. Excess
capacity now exists in many manufacturing industries--especially those
producing industrial materials. Among the major groups, only manufactures
of aircraft and electrical generating equipment continue to operate at
peak rates of utilization.

I-4
Industrial commodity prices have continued stable as the
overhang of inventories and the level of unutilized capacity have
provided some offset to the further increase in business costs. Recent
and anticipated increases in negotiated wage contracts are likely to
produce a renewed rise in unit labor costs, but output and productivity
also should rise and help keep the rise in labor costs from being as
sharp as last year.
The expansion in market supplies of consumer food products,
which resulted in lower food prices earlier, has come to an end.
With food prices increasing again, the consumer price index increases
of 0.3 per cent in April and May may be followed by a larger rise in
June. This would add further to upward pressure on wage rates.
Outlook for banking
While distribution of the $4 billion of new tax bills is
currently a principal influence on bank credit, expansion will probably
be sustained as the summer progresses by continued active public
demand for time and savings deposits, by growth in private demand
deposits, and late in the summer probably by further Treasury cash
borrowing. Barring substantial additional increases in short- and
intermediate-term yields inflows into passbook savings and time deposits
other than negotiable CD's are likely to continue at near recent
rates. Meanwhile, net increases in outstanding CD's may continue to
be relatively small, as banks face increasing competition from new
issues of Treasury and Federal Agency securities bearing relatively
attractive yields. Private demand deposits are likely to expand over
the months ahead in view of the accelerated pace of economic activity,

I-5
but the rate of expansion may be slower than in recent months when
Treasury deposits had been declining.
During the summer, business loan demands on banks are expected
to be quite moderate, as inventory financing needs are minimal and as
corporations no longer have to deal with large accelerated tax payments.
With loan demands moderate and deposit inflows continuing in volume,
bank investments in State and local, Federal Agency, and U.S. Government
securities are likely to be fairly sizable.
Current interest rate relationships between the cost of time
and savings deposits and the return on marketable securities make
intermediate-term securities an attractive investment outlet for banks.
But banks are also likely to emphasize short-term securities in an
effort further to restock their liquidity against the prospect of sizable
fall loan demands. And the recent rise in Treasury bill yields has
made them attractive to banks, but does not appear to have attracted
individuals' savings away from banks.
Capital markets outlook
Yields on new and recently offered corporate bond issues have
dropped back from the record highs registered two weeks ago, but
prospects for further rate declines will depend on market psychology
and the forthcoming volume of new offerings. Thusfar, this volume
shows little sign of abatement over the near-term. The amount of public
bond offerings in July is expected to surpass the record June level,
and the amount of public flotations already scheduled for August is
inusually large. In the municipal market, too, the forward calendar
I-6
indicates near-term continuation of demand pressures--with July sales
of issues ultimately expected to total more than $1 billion. The
August municipal volume now appears to be relatively light, however,
and may represent the first month this year in which offerings fall
short of $1 billion,
In late July, the Treasury will announce the terms of its
mid-August refunding, which will involve $3.6 billion of publicly
held maturing issues. The sharp yield increases in the intermediate-
term sector of the Government securities market toward the end of June
probably reflected some expectation that the Treasury might take this
opportunity to use its new authority to issue securities with maturities
as long as seven years free of the interest rate ceiling. The market
is in a good technical position to absorb such issues, with dealers
having a small net short position in securities maturing in over 5
years. But over-all investor demand for such issues will be strongly
influenced by interest rate expectations, which in turn will depend
heavily on market evaluation of prospects for a tax increase.
The results of the official re-evaluation of the Federal
Government's budgetary position over the next few weeks will be
a critical factor influencing capital markets as a whole. If such a
review is accompanied by a strongly worded request for a tax increase,
it will be more likely that investor and borrower attitudes as to
the likelihood of future credit stringency will shift and that inter-
mediate- and long-term interest rates will decline further. The

I- 7
sustainability of such declines, should they develop, will be tested
by how readily the Treasury financing and private borrowings are
absorbed in the market and by the gathering evidence of Congressional
attitudes towards any tax proposal.
The earlier increases in market interest rates have led to
some tightening in mortgage markets in May and June, and to a renewal
of uncertainty about credit costs, if not mortgage availability, over
the period ahead. Nevertheless, savings flows to depositary-type finan-
cial intermediaries do not appear to have been seriously affected by the
recent increases in short- and intermediate-term rates, although only
fragmentary data for the July reinvestment period are currently avail-
able. However, there does appear to be some outflow of funds from
California S&L's as a result of the reduction in the maximum permis-
sible rate from 5.25 to 5.00 per cent on their passbook savings; these
funds may be being diverted to depositary institutions in other regions.
While short- and intermediate-term market rates have risen
dramatically, they still do not appear to be at the levels necessary to
trigger significant disintermediation. Should the upward rate trend
continue, however, in the wake of Treasury refundings and cash financings
later in the summer, there would be a real risk of a significant impact
on depositary flows in the months ahead.
I-8
The balance of payments
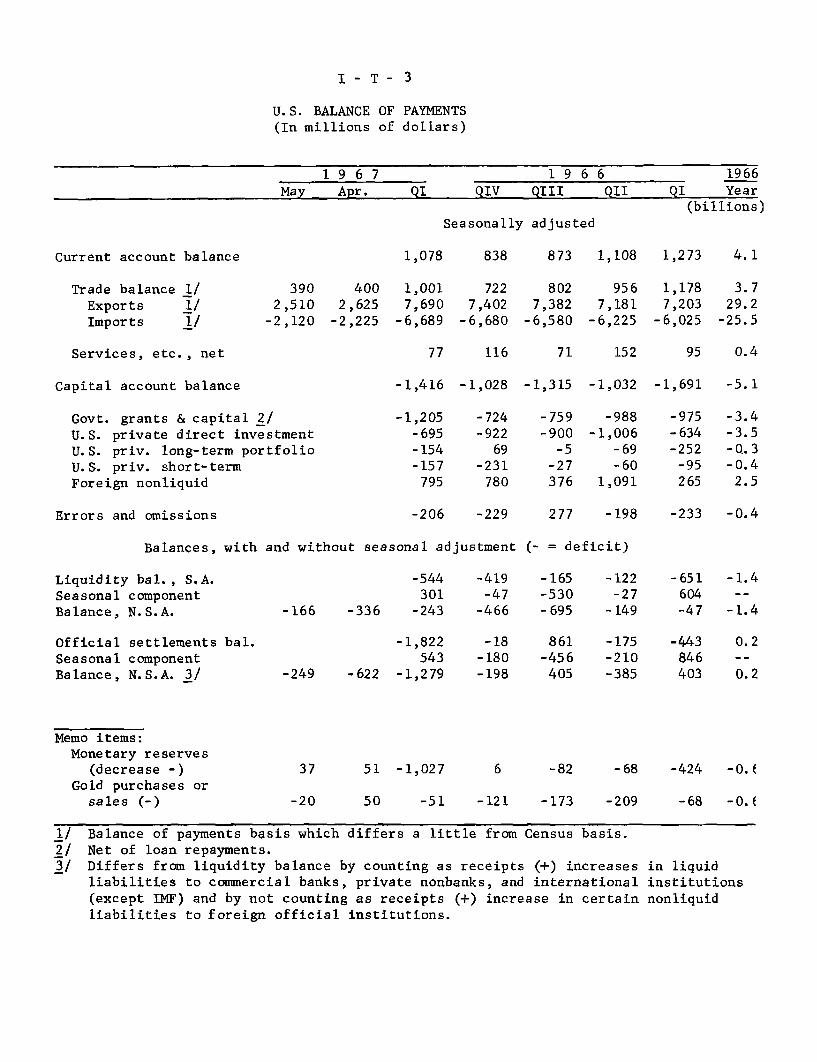
With half the year over, projections of the deficit in the
1967 balance of payments are being revised upward, by observers outside
the Government as well as within. On the liquidity basis, but before
counting the effect of net acquisitions of near-liquid assets by foreign
official and international bodies, the deficit in the first half-year
is now tentatively estimated at about $2 billion, seasonally adjusted,
and the full-year deficit may exceed $3-1/2 billion. After counting
the special transactions, the half-year deficit was only about $1 billion.
Evaluation of prospects for the full year 1967 is hampered by
lack of complete information as to the particular elements of receipts
and payments that produced so large a deficit in the first half. Inso-
far as these receipts and payments are known, or can be roughly inferred
from statistics covering the first quarter of 1967 and the final
quarter of 1966, it appears that military expenditures abroad may be
increasing more than was expected a few months ago and that U.S. receipts
of investment income from abroad (especially on direct investments)
have not been coming up to expectations. Also, it now seems likely
that U.S. merchandise exports--recently well above late-1966 levels--
will not rise as much during the rest of this year as was formerly
anticipated. The changes in expectations regarding receipts of
investment income and export earnings reflect, in part, a more pessimistic
appraisal than before of prospects for an early upturn in European
economic activity.
I - 9
Despite these shifts toward more pessimistic appraisals,
the projections imply a smaller deficit (before special transactions)
in the second half of the year than in the first half. With imports
declining in recent months and not expected to advance rapidly in
the next few months, the trade surplus is likely to increase somewhat
further--though less than if Europe's demand were growing at a normal
pace. Apart from this, much of the projected improvement depends on
unidentified items, the balance of which ("errors and omissions") was
more adverse in late 1966 and early 1967 than in most other recent
periods.
Although the liquidity deficit computed without counting
certain kinds of special transactions may reach or exceed $3-1/2 billion
for the year 1967, the generally publicized official figure for the
deficit (which is reduced by such transactions) will be much smaller.
Tentative indications are that during the first half of 1967 net
placements of foreign official and international funds in near-liquid
assets amounted to about $1 billion. It is assumed that during the
second half of the year holdings of time deposits and Agency securities
with original maturities over 12 months coming due will be rolled over
into similar assets. In addition, some moderate amount of debt prepay-
ment receipts is looked for.
On the official settlements basis, the deficits is predictable
only with a wide margin of possible error. If net changes over the year
in liquid and near-liquid liabilities to others than foreign monetary
authorities--i.e., to commercial banks, other private foreign residents,
I - 10
and international institutions--should turn out small, the deficit on
this basis would be about the same as the liquidity deficit without
benefit of special receipts--i.e., $3-1/2 billion or more. During
the first half of 1967, according to very tentative estimates, the
net run-down in U.S. liabilities to commercial banks abroad (including
U.S. bank branches) exceeded the increase in other liquid and near-liquid
liabilities to non-official holders, by some $500 million. Accordingly,
the official settlements deficit during that period, now estimated at
about $2-1/2 billion, seasonally adjusted, was considerably larger
than the first half-year liquidity deficit as measured without giving
effect to special transactions of the kinds that have been mentioned.

July 11, 1967
SELECTED DOMESTIC NONFINANCIAL DATA
(Seasonally adjusted)
Civilian labor force (mil.)Unemployment (mil.)Unemployment (per cent)
Nonfarm employment, payrollManufacturingOther industrialNonindustrial
LatestPeriod
June'67
"
(mil.)
Industrial production (57-59=100)Final productsMaterials
Wholesale prices (57-59=100)Industrial commoditiesSensitive materialsFarm products,foods & feeds
Consumer prices (57-59=100)-/Commodities except foodFoodServices
LatestPeriod
77.23.14.0
65.619.28.0
38.4
155.2155.9154.9
105.8105.2100.1105.0
115.6108.7113.9127.0
AmountPreced'gPeriod76.22.93.8
65.419.18.0
38.3
155.5156,3155.1
105.3105.1
100.7103.4
115.3108.4113.7126.6
Hourly earnings, mfg. ($) June'67 2.81 2.80Weekly earnings, mfg. ($) " 112.91 113.00
Personal income ($ bil.) 2/ May'67 616.9 614.1
Corporate profits before tax($bil) 2/QI'67 77.4 81.8
Retail sales, total ($ bil.)Autos (million units)2/GAF ($ bil.)
Selected leading indicators:
Housing starts, pvt. (thous.)2 /
Factory workweek (hours)
New orders, dur. goods ($ bil.)
New orders, nonel. mach. ($ bil.)
Common stock prices (1941-43=10)
Inventories, book val. ($ bil.)
Gross national product ($ bil.)- /
Real GNP ($ bil., 1958 prices)2/
June'67I
IT
May'67June'67May'67
June'67
26.18.46.3
1,31040.223.9
3.591.43
26.07.56.3
1,17340.422.2
3.492.59
May'67 137.4 137.3
QI'67 763.7 759.3" 656.7 657.2
2.71111.85
573.0
82.7
25.48.36.0
1,31841.324.33.6
86.06
126.2
721.2640.5
Per cent changeYear 2 Yrs.Ago* Ago*
2.1 3.7
5.2 -10.5
2.5 8.2
-0.1 6.5
-0.8 2.34.5 10.3
YearAgo
75.72.93.9
64.019.28.136.7
156.5154.9158.0
105.6104.3106.8107.9
112.6106.3113.5121.5
8.510,36.7
3.63.1-2.23.9
5.53.35.68.1
7.75.6
16.8
3.9
2.6 11.71.1 -6.04.3 19.1
-0.6-2.7-1.5-1.16.2
8.9
5.92.5
-13.6-2.013.913.17.5
19.4
15.69.4
* Based on unrounded data. 1/ Not seasonally adjusted 2/ Annual rates.
-0.80.6-2.0
0.20.9-6.3-2.7
2.72.30.44.5
3.70.9
7.7
-6.4
I -- T - 1

July 11, 1967
SELECTED DOMESTIC FINANCIAL DATA
Money Market 1/ (N.S.A.)Federal funds rate (per cent)U.S. Treas. bills, 3-mo., yieldU.S. Treas. bills, 1-yr., yieldNet free reserves 2/ (mil. $)Member bank borrowings 2/ (mil.
Week ended Four-Week Last six months
July 8 Average High Low
(per cent)
(per cent)
$)
Capital Market (N.S.A.)Market yields 1/ per cent)
5-year U.S. Treas. bonds20-year U.S. Treas. bondsCorporate new bond issues, AaaCorporate seasoned bonds, AaaMunicipal seasoned bonds, AaaFHA home mortgages, 30-year 3/
Common stocks S&P composite index 4/Prices, closing (1941-43=10)Dividend yield (per cent)
New Security IssuesCorporate public offeringsState & local gov. public offeringsComm. & Fin. co. paper, change in outstandings
3.91
4.204.84152
353
5.30
5.025.865.593.856.44
91.323.20
3.97
3.794.61231157
5.17
5.045.835.503.836.44
91.783.18
5.754.834.84
324585
5.365.115.925.593.856.77
2.503.33
3.80-170
43
4.384.445.114.993.256.29
94.44 86.463.12 3.36
Per Cent ChangeMonth Billions of Dollars from year earlierof La Avg. 3 Latest Latest Month Latest Month ThreeData Month Month MonthsData Months Months
July'67 1.9 e 1.6 e
1.1 e 1.2 e
Mav'67 17.1 16.5
236.4 76.156.9 33.949.2 47.7
Banking (S.A.)Total reserves 1/Credit Proxy 1/Bank Credit, Total 5/
Business loans
Other loansU.S. Gov't. sec.Other securities
Money and other liquid assetsTotal 1/ 5/
Demand deposits & curency 1/Time and savings deposits,
comm. banks 1/Savings accounts, otherinstitutions 5/
Other 5/ 6/
Billions of Dollars Per Cent ChangeMonth Outst. Change (Annual Rate)of In Avg. 3 From From 3 From 12
LatestLatest h Latest Latest Preceding Months Months
Data Month Month Months Month EarlierEarlierData Month Months Month EarlierEarlier
June'67i
I
"
24.46259.2326.7
82.6131.7
56.555.9
May'67 618.7
0.162.00.31.2
-0.7-1.1
0.8
0.051.81.60.70.1
-0.41.2
7.79.31.1
17.7-6.4
-22.917.4
2.9 4.0 5.7
June'67 176.0 1.9 1.1 13.1
2.68.36.0
10.90.9
-9.027.5
4.16.36.28.43.12.5
15.0
7.8 4.8
7.4 2.9
S 171.7 2.4 2.1 17.0 15.5 11.8
May'67 175.0 1.1 1.5 7.6 10.3 6.4" 100.3 -2.2 -0.8 -25.8 -9.0 -3.3
N.S.A. -- not seasonally adjusted. S.A. -- Seasonally adjusted.1/ Average of daily figures. 2/ Averages for statement week ending July 5.3/ Latest figure indicated is for month of May. 4/ Data are for weekly closingprices. 5/ Month-end data.6/ U.S. Savings bonds and U.S. Government securities maturing within 1 year.
NOTE: Where necessary, changes have been adjusted to take account of conceptual anddefinitional changes in data.
I -- T - 2
I - T - 3
U.S. BALANCE OF PAYMENTS(In millions of dollars)
1 9 6 7 1 9 6 6 1966May Apr. QI QIV QIII QII QI Year
(billions)Seasonally adjusted
Current account balance
Trade balanceExportsImports
3902,510
-2,120
4002,625
-2,225
1,078
1,0017,690
-6,689
838
7227,402
-6,680
873 1,108 1,273 4.1
8027,382
-6,580
9567,181
-6,225
1,1787,203
-6,025
3.729.2
-25.5
77 116Services, etc., net
Capital account balance
Govt. grants & capital 2/U.S. private direct investmentU.S. priv. long-term portfolioU.S. priv. short-termForeign nonliquid
-1,416 -1,028
-1,205-695-154-157
795
-724-92269
-231780
71 152
-1,315 -1,032
-759-900-5-27376
-988-1,006
-69-60
1,091
Errors and omissions -206 -229 277 -198 -233 -0.4
Balances, with and without seasonal adjustment (- = deficit)
Liquidity bal., S.A.Seasonal componentBalance, N.S.A.
Official settlements bal.Seasonal componentBalance, N.S.A. 3/
-544301
-166 -336 -243
-419-47
-466
-1,822 -18543 -180
-249 -622 -1,279 -198
Memo items:Monetary reserves
(decrease -)Gold purchases or
sales (-)
37 51 -1,027 6 -82
50 -51 -121 -173 -
-68 -424 -0.(
209 -68 -0.(
Balance of payments basis which differs a little from Census basis.Net of loan repayments.Differs from liquidity balance by counting as receipts (+) increasesliabilities to commercial banks, private nonbanks, and international(except IMF) and by not counting as receipts (+) increase in certainliabilities to foreign official institutions.
in liquidinstitutionsnonliquid
95 0.4
-1,691
-975-634-252
-95265
-5.1
-3.4-3.5-0.3-0.4
2.5
-165-530-695
861-456405
-122-27
-149
-175-210-385
-651604-47
-443846403
-1.4
-1.4
0.2
0.2
II - 1
THE ECONOMIC PICTURE IN DETAIL
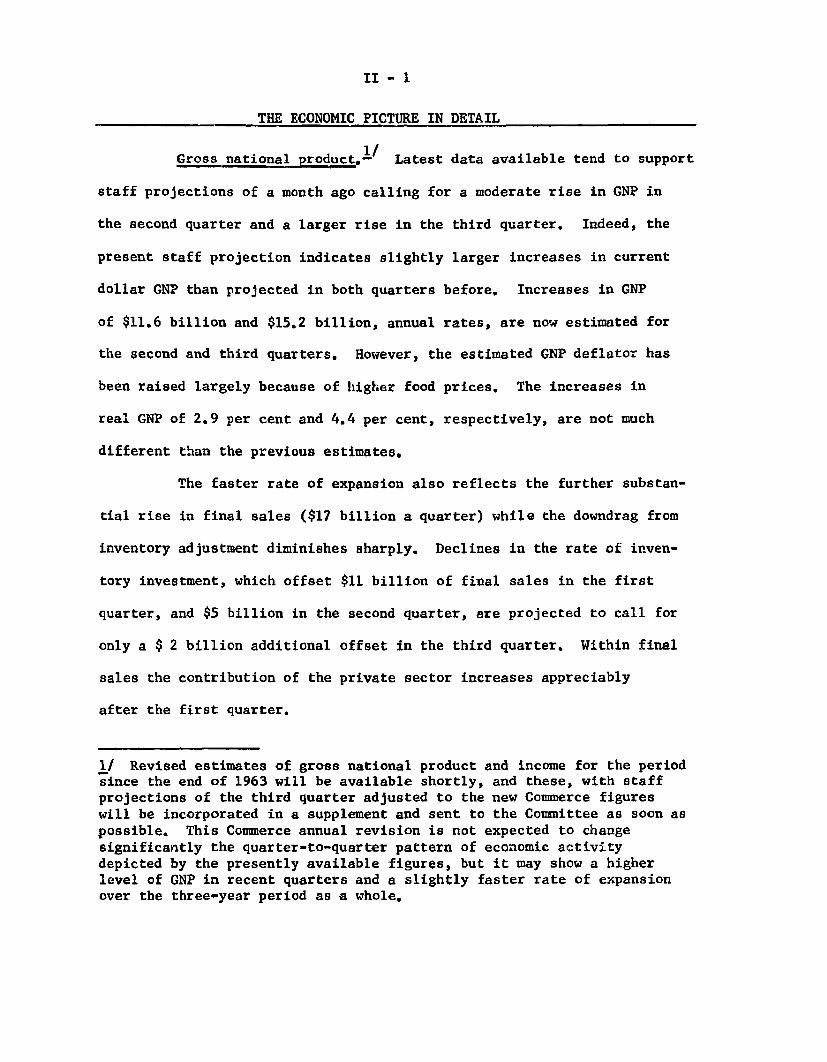
Gross national product.1/ Latest data available tend to support
staff projections of a month ago calling for a moderate rise in GNP in
the second quarter and a larger rise in the third quarter. Indeed, the
present staff projection indicates slightly larger increases in current
dollar GNP than projected in both quarters before. Increases in GNP
of $11.6 billion and $15.2 billion, annual rates, are now estimated for
the second and third quarters. However, the estimated GNP deflator has
been raised largely because of higher food prices. The increases in
real GNP of 2.9 per cent and 4.4 per cent, respectively, are not much
different than the previous estimates.
The faster rate of expansion also reflects the further substan-
tial rise in final sales ($17 billion a quarter) while the downdrag from
inventory adjustment diminishes sharply. Declines in the rate of inven-
tory investment, which offset $11 billion of final sales in the first
quarter, and $5 billion in the second quarter, are projected to call for
only a $ 2 billion additional offset in the third quarter. Within final
sales the contribution of the private sector increases appreciably
after the first quarter.
I/ Revised estimates of gross national product and income for the periodsince the end of 1963 will be available shortly, and these, with staffprojections of the third quarter adjusted to the new Commerce figureswill be incorporated in a supplement and sent to the Committee as soon aspossible. This Commerce annual revision is not expected to changesignificantly the quarter-to-quarter pattern of economic activitydepicted by the presently available figures, but it may show a higherlevel of GNP in recent quarters and a slightly faster rate of expansionover the three-year period as a whole,

II - 2
The bulk of the increase in private final sales is now
expected to be in consumer spending. New car sales figures suggest
larger second quarter gains in consumption expenditures than were
indicated a month ago. Sales of new U.S.-made autos rose sharply in
June to an annual rate of about 8.4 million units, in contrast to an
April-May rate of 7.6 million. The higher sales rate accounts for much
of the $1 billion second quarter upward revision in consumer outlays
for durable goods. Sales of domestic autos in the third quarter have
been raised to an estimated annual rate of 8-1/4 million from the
8 million indicated a month ago and sales of other durables also have
been increased. Nondurable consumption expenditures have been raised,
partly because of the expected continuation of higher food prices.
Income in the third quarter is now projected to be bolstered
by larger employment increases than estimated earlier. Consumer spend-
ing is still expected to rise more rapidly than income, reflecting recent
evidences of greater willingness of consumers to spend more freely including
recent surveys which report streugthening of consumer intentions to buy.
The ratio of personal saving to disposable income is projected to drop to
6.2 per cent in the second quarter and to 5.9 per cent in the third,
from the unusually high rate of 6.5 per cent in the first quarter.
Residential construction is predicted to rise sharply in
both the second and third quarters based on evidence of higher starts
and permits recently and later availability of credit. Housing starts
in May were somewhat higher than earlier anticipated and second
quarter outlays therefore will also be slightly higher. For the third
quarter, starts are still expected to amount to about a 1,350,000 annual
rate. Estimated business fixed investment in the second quarter has been
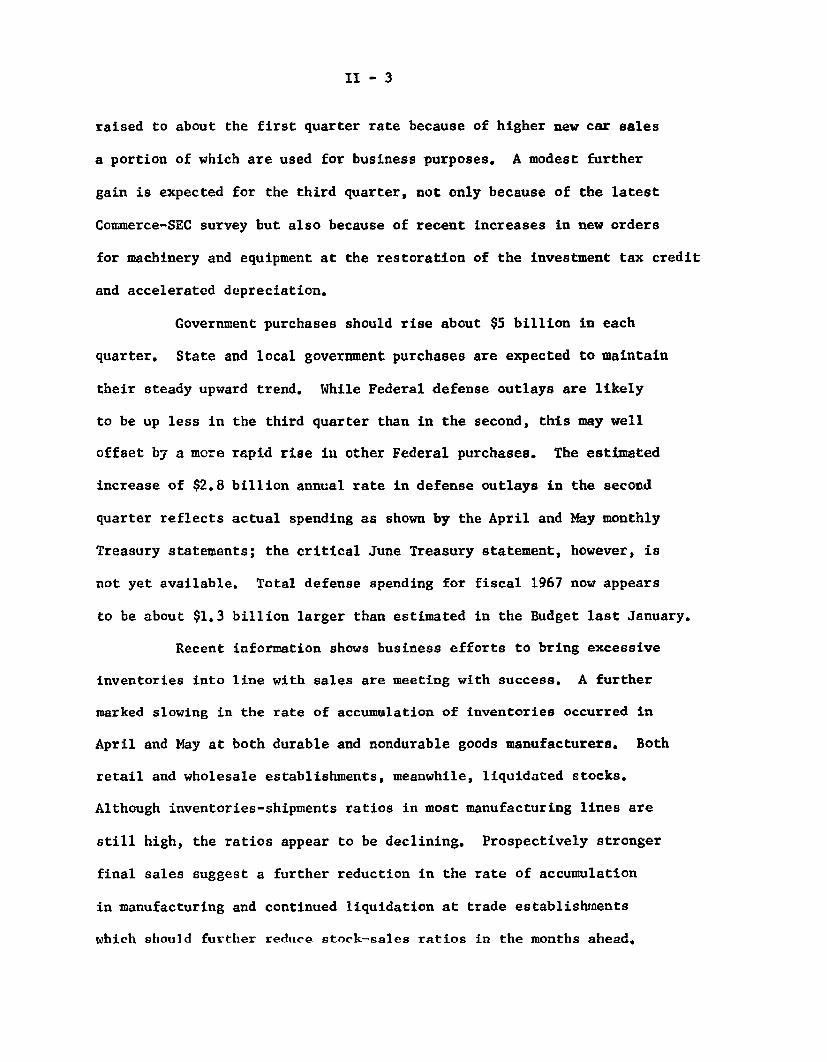
II - 3
raised to about the first quarter rate because of higher new car sales
a portion of which are used for business purposes, A modest further
gain is expected for the third quarter, not only because of the latest
Commerce-SEC survey but also because of recent increases in new orders
for machinery and equipment at the restoration of the investment tax credit
and accelerated depreciation.
Government purchases should rise about $5 billion in each
quarter. State and local government purchases are expected to maintain
their steady upward trend. While Federal defense outlays are likely
to be up less in the third quarter than in the second, this may well
offset by a more rapid rise in other Federal purchases. The estimated
increase of $2.8 billion annual rate in defense outlays in the second
quarter reflects actual spending as shown by the April and May monthly
Treasury statements; the critical June Treasury statement, however, is
not yet available. Total defense spending for fiscal 1967 now appears
to be about $1.3 billion larger than estimated in the Budget last January.
Recent information shows business efforts to bring excessive
inventories into line with sales are meeting with success. A further
marked slowing in the rate of accumulation of inventories occurred in
April and May at both durable and nondurable goods manufacturers. Both
retail and wholesale establishments, meanwhile, liquidated stocks.
Although inventories-shipments ratios in most manufacturing lines are
still high, the ratios appear to be declining. Prospectively stronger
final sales suggest a further reduction in the rate of accumulation
in manufacturing and continued liquidation at trade establishments
which should further reduce stock-sales ratios in the months ahead,

II -4
CONFIDENTIAL -- FR July 12, 1967
GROSS NATIONAL PRODUCT AND RELATED ITEMS 1/(Quarterly figures are seasonally adjusted. Expenditures and income
figures are billions of dollars, with quarterly figures at annual rates)
19671965 1966 1966 Projected
II III IV I II III
Gross National Product
Final salesPrivate
Personal consumption expenditures
Durable goodsNondurable goodsServices
Gross private domestic investment
Residential constructionBusiness fixed investmentChange in business inventories
Nonfarm
Net Exports
Gov't purchases of goods & servicesFederal
Defense
OtherState & local
Gross National Product in
constant (1958) dollarsGNP Implicit deflator (1958=100)
Personal income
Wage and salariesDisposable income
personal savingSaving rate (per cent)
Total labor force (millions)Armed forces "Civilian labor force "Unemployment rate (per cent)
Nonfarm payroll employment (millions)Manufacturing
681.2672.1535.9
431.566.1
190.6174.8
106.627.869.79.18.1
739.6727.7574.7
464.969.3
206.2189.4
117.025.879.311.912.2
732.3720.0571.0
460.167.1
205.6187.4
118.528.078.212.312.1
745.3735.4579.2
469.970.2
208.1191.5
115.024.880.3
9.910.4
759.3742.9581.8
474.169.6
209.2195.3
120.021.981.616.417.6
763.7758.1589.0
479.968.4
212.5199.1
109.322.181.6
5.66.0
775.3775.3601.0
488.970.0
216.2202.7
106.124.181.5
.5
.5
790.5792.5613.2
498.371.5
220.4206.4
106.625.982.2-1.5-1.5
7.0 4.8 4.7 4.2 4.1 5.4 6.0 6.3
136.266.850.116.769.4
153.076.960.016.976.2
149.074.057.116.975.0
156.279.062.017.07" "
161.181.765.516.2" 4
169.187.069.717.282.1
174.390.072.517.584.3
179.392.875.017.886.5
614.4 647.8 643.5 649.9 657.. 656.7 661.5 668.8110.9 114.2 113.8 114.7 115.5 116.3 117.2 118.2
535.1358.4469.1
25.75.5
77.22.7
74.54.5
580.4392.3505.3
27.05.3
78.93.1
75.83.8
573.5387.4499.9
26.65.3
78.43.1
75.43.8
585.2396.7507.8
24.54.8
79.13.2
76.03.8
598.3405.0518.4
30.45.9
79.83.3
76.53.7
609.7411.8528.5
34.46.5
80.33.4
76.93.7
617.5418.5536.5
33.16.2
80.23.5
76.73.8
630.0428.0545.3
32.15.9
80.73.5
77.23.9
60.8 63.9 63.6 64.1 64.8 65.5 65.5 65.818.0 19.1 19.0 19.2 19.4 19.4 19.2 19.3
Industrial production (1957-59=100) 143.4Capacity utilization, manufacturing
(per cent) 89
Housing starts, private (millions, A.R.) 1.51
Sales new U.S.-made autos (millions,A.R.1 8.76
156.3 155.2 157.6 158.8 157.0 155.6 157.5
91 91 91 90 87 85 85
1.22 1.37 1.09 .98 1.21 1.26 1.36
8.38 7.81 8.,7 8.13 7.33 7.83 8.25
1/ GNP revised figures will be available by July 17th.

II - 5
CONFIDENTIAL -- FR July 12, 1967
CHANGES IN GROSS NATIONAL PRODUCTAND RELATED ITEMS I/
(Quarterly changes are at annual rates)
19671965 1966 1966 Projected
II III IV I II III
(Billions of Dollars)
Gross National ProductFinal sales
Private
GNP in constant (1958) dollars
Final salesPrivate
Gross National ProductFinal sales
Private
49.5
45.137.8
34.430.227.4
58.455.638.8
33.431.122.0
11.1 13.07.7 15.43.7 8.2
3.0-0.1-2.2
14.07.52.6
4.415.2
7.2
6.4 7.3 -0.58.9 1.2 9.54.4 -2.2 4.2
(Per Cent)
11.617.212.0
4.89.96.3
15.2
17.212.2
7.39.46.2
7.8 8.6 6.2 7.1 7.5 2.3 6.17.2 8.3 4.3 8.6 4.1 8.2 9.17.6 7.2 2.6 5.7 1.8 4.9 8.1
Personal consumption expendituresDurable goodsNondurable goodsServices
Gross private domestic investmentResidential constructionBusiness fixed investment
Gov't purchases of goods & servicesFederalDefenseOther
State & local
GNP in constant (1958) dollarsFinal sales
PrivateGNP Implicit deflator
Personal IncomeWage and salaries
Disposable income
Nonfarm payroll employmentManufacturing
Industrial productionHousing starts, privateSales new U.S.-made autos
7.5
11.36.5
7.2
14.60.7
14.8
5.72.50.29.98.9
5.95.25.91.8
3.9-18.2
7.38.7
9.8 14.0-7.2 -8.413.8 6.2
12.315.119.81.29.8
5.45.14.53.0
11.011.718.3
-11.510.4
1.9-0.1-1.74.3
8.518.54.98.7
-11.8-45.710.7
19.327.034.32.4
11.7
4.05.63.43.2
3.6
-3.42.17.9
17.4-46.8
6.5
12.513.722.6
-18.811.4
4.50.7
-1.72.8
4.9
-6.96.37.8
-35.73.70.0
19.925.925.6
24.713.6
-0.35.93.32.8
-11.736.2-0.5
12.313.816.1
7.010.7
2.96.14.93.1
7.9 8.5 6.3 8.2 9.0 7.6 5.1
7.4 9.5 7.8 9.6 8.4 6.7 6.57.4 7.7 3.9 6.3 8.3 7.8 6.1
4.2 5.1 4.9 3.3 4.0 4.3 0.04.4 5.8 6.9 3.5 4.0 0.0 -4.1
8.4-3.315.0
9.0-18.9-4.4
7.9-39.5-62.8
6.2-81.333.6
3.0-39.3-15.8
-4.5
88.4-39.6
-3.616.527.3
1/ GNP revised figures will be available by July 17th.
1.929.93.4
11.512.413.86.9
10.4
4.4
5.74.73.4
8.1
9.16.6
1.82.1
4.9
31.721.5

II - 6
Industrial production. Industrial production in June was
155.2 per cent as compared to 155,5 in May, and was 1 per cent below
a year earlier. The June decline was primarily in manufacturing
industries.
Auto assemblies increased in June and were at an annual
rate of 8.0 million units as compared with 7.8 billion in May.
Schedules for the third quarter are somewhat above the June rate, after
allowance for the earlier and shorter model changeover period this yearc
Production schedules may not be met, however, as the continuing strike
in the tire industry, which started April 21, may begin to affect auto
assemblies and, in addition, a strike in the auto industry in early
September is not unlikely.
Among the limited production data available for June, the only
increases other than for autos were shown by output of creude petroleum,
as a result of the Mid-East situation, and by defense equipment. Steel
ingot production declined 4 per cent and output of steel mills products
apparently also declined further as mill inventories of these goods
reached a record level at the end of May, Production of trucks and
paperboard continued to decline and were below year ago levels. Out-
put of appliances declined and television and radio production was
sharply curtailed by a strike at RCA.
The decline of 2,4 per cent in total industrial production
in the 6 months since the high last December has been much smaller
than in corresponding postwar periods of production curtailment, as

II - 7
shown in the table. While decreases in some industries have been
sharp--autos, appliances, television sets, lumber, and steel--the
timing of the cutbacks in output have been staggered,
INDUSTRIAL PRODUCTIONPer cent decline from 6 months earlier to:
June 1967 November 1960 February 1958 January 1954 April 1949
2.4 4.1 11.9 9.3 6.5
The current contraction has been quite different from those in 1957
and 1953 when output readjustments occurred almost simultaneously in
most cyclical industries. Another major difference this time has been
the continuing sharp advance in output of defense equipment which has
almost offset the reduction in output of other business equipment.
Auto markets. Sales of new domestic automobiles in the month
of June strengthened considerably to a seasonally adjusted annual rate
of 8.4 million units, 11 per cent above the May rate. It was the
first month since last November that the sales rate exceeded 8 million
units. The higher June figure raised sales for the second quarter
to an average rate of 7.8 million units, up from 7,3 million in the
first quarter and was the same rate as in the second quarter of last
year.

II - 8
With auto assemblies at a seasonally adjusted annual rate of
about 8 million units, new car inventories at the end of June were down
to 1.4 million, a level substantially below the record 1.73 million a
year earlier. As a consequence of the higher sales, and the improved
inventory situation, the model year sales clean-up should pose no
problems. On the contrary, in the face of continued strong consumer
demand there may be some supply shortages prior to the introduction of
the 1968 models in September. Used car prices (seasonally adjusted) as
reported in the Consumer price Index continued to show unusual strength,
rising 2 per cent further in May. In June, however, used car auction
prices moved irregularly.
Consumer credit. Expansion in consumer instalment credit
apparently slowed further in the second quarter. In May the seasonally
adjusted increase in outstandings was $193 million, down from $213
million in April, and the smallest monthly rise in more than five years.
Data for June are incomplete but even assuming an acceleration in credit
use because of the improvement in new car and other retail sales, the
net increase in outstandings for the second quarter as a whole would
still not reach that in the first quarter--itself a relatively sluggish
period.
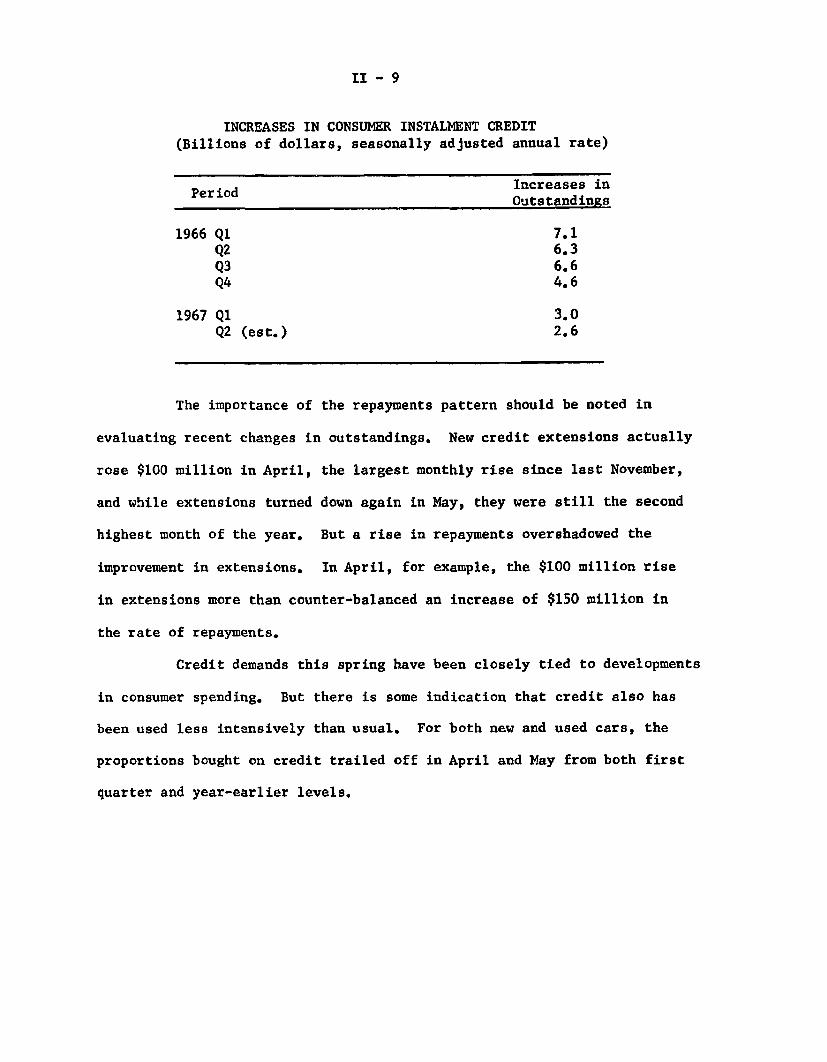
II - 9
INCREASES IN CONSUMER INSTALMENT CREDIT
(Billions of dollars, seasonally adjusted annual rate)
d Increases inerOutstandings
1966 Ql 7.1Q2 6.3
Q3 6.6
Q4 4.6
1967 Q1 3.0Q2 (est.) 2.6
The importance of the repayments pattern should be noted in
evaluating recent changes in outstandings. New credit extensions actually
rose $100 million in April, the largest monthly rise since last November,
and while extensions turned down again in May, they were still the second
highest month of the year. But a rise in repayments overshadowed the
improvement in extensions. In April, for example, the $100 million rise
in extensions more than counter-balanced an increase of $150 million in
the rate of repayments.
Credit demands this spring have been closely tied to developments
in consumer spending. But there is some indication that credit also has
been used less intensively than usual. For both new and used cars, the
proportions bought on credit trailed off in April and May from both first
quarter and year-earlier levels.

II - 10
Meanwhile, lending standards on autos--in such nonprice
terms as maturities and downpayments--are showing little further
change after a noticeable easing late last year by sales finance
companies. Perhaps the major exception to that easing was in used-
car maturities, and finance companies have continued to maintain
relatively tight controls in this area, Indeed, the proportion of used-
car contracts in the "over-30-months" category has tended to decline
since early 1966.
Retail sales, Retail sales in June, according to advance
estimates based on a partial sample, were about unchanged from the
April-May level. A rise at durable goods stores, mostly at automotive
stores, was almost offset by a decline at nondurable goods stores. For
the second quarter, total retail sales were 1.4 per cent higher than
in the first quarter.
Sales at durable goods stores in June rose 1.9 per cent,
following a rise of 1.1 per cent in May. Both of these increases
reflected relatively large gains in sales reported by automotive stores.
Furniture and appliance stores sales were indicated to be off about 3
per cent in June, following a rise of 1.6 per cent in May. For the
second quarter as a whole, furniture and appliance sales were down
from the first quarter but were higher than in the final quarter of
last year.

II - 11
Sales at nondurable goods stores were off .5 per cent in June,
after changing little in May (preliminary figures revised out the 1
per cent rise shown earlier by the advance figures.) Sales at general
merchandise stores rose in June with sales at department stores up
2 per cent. Sales at food stores were about unchanged and sales at
other types of nondurable goods stores were down from 1 to 2 per cent.
Nondurable goods sales in the April-June quarter were 1.4 per cent
higher than in the first quarter.
QUARTERLY CHANGES IN RETAIL SALES
(Per Cent)
1966 1967
IV I II
All retail stores -i1 .5 1.4
Durable goods stores -1.1 -1.1 1.4Furniture and appliances - .5 2,0 -1,1
Nondurable goods stores .3 1.2 1.4Apparel and general merchandise - .1 .6 3.6
Construction activity. Value of new construction activity edged
up further in June and was only slightly below the declining rate a year
earlier, based on confidential projections now available from the Census
Bireau and on revised data back to January 1963, which will be published
shortly.-
1/ The revisions affect virtually all component series, but their effecton the level and general pattern of movement of the annual data was minorboth for the total and the major groups. For the year 1966--where therevision was most pronounced--residential construction expenditures werereduced by 3 per cent from the already low level estimated earlier, butprivate nonresidential and public construction outlays were raised by2 and 1 per cent, respectively.
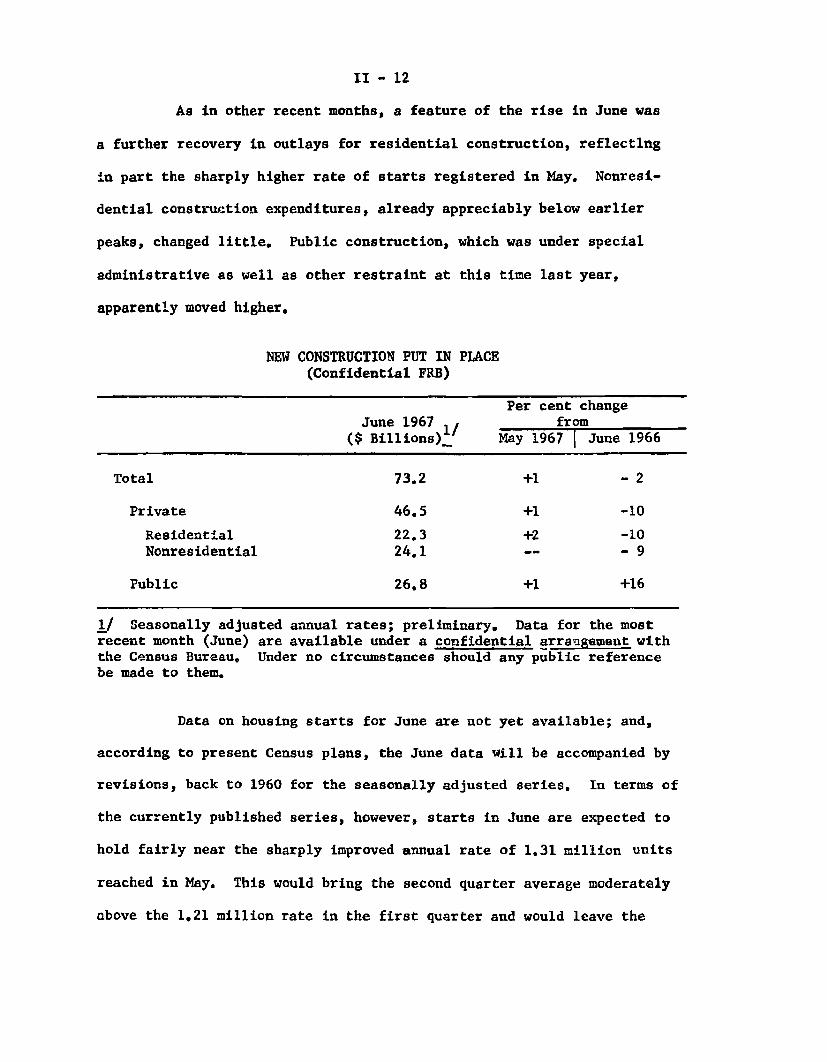
II - 12
As in other recent months, a feature of the rise in June was
a further recovery in outlays for residential construction, reflecting
in part the sharply higher rate of starts registered in May. Nonresi-
dential construction expenditures, already appreciably below earlier
peaks, changed little. Public construction, which was under special
administrative as well as other restraint at this time last year,
apparently moved higher,
NEW CONSTRUCTION PUT IN PLACE(Confidential FRB)
Per cent changeJune 1967 from
($ Billions)1/ May 1967 June 1966
Total 73.2 +1 - 2
Private 46.5 +1 -10
Residential 22.3 +2 -10Nonresidential 24.1 -- - 9
Public 26.8 +1 +16
1/ Seasonally adjusted annual rates; preliminary. Data for the mostrecent month (June) are available under a confidential arrangement withthe Census Bureau, Under no circumstances should any public referencebe made to them.
Data on housing starts for June are not yet available; and,
according to present Census plans, the June data will be accompanied by
revisions, back to 1960 for the seasonally adjusted series. In terms of
the currently published series, however, starts in June are expected to
hold fairly near the sharply improved annual rate of 1.31 million units
reached in May. This would bring the second quarter average moderately
above the 1,21 million rate in the first quarter and would leave the

II - 13
rate for the first half as a whole at or slightly above the current
Census total of 1.22 million for the year 1966.
The ability of builders to raise unadjusted starts through
the spring months at or above a normal seasonal pace indicates that a
substantial amount of momentum in housing activity has been regained.
Furthermore, figures available through May indicate that commitments
from lenders also have increased significantly. This suggests that the
recent further tightening in financial markets, discussed in the
section on mortgage market developments and elsewhere, may not appre-
ciably moderate further expansion in starts during the current quarter.
II - 14
New and unfilled orders. Manufacturers' new and unfilled
orders, shipments, and inventories all rose in May. New orders for
durable goods rose 7.5 per cent, following a rise of .7 per cent in
April; they are now only 5 per cent below their peak last September,
just before suspension of the investment tax credit and accelerated
depreciation.
For steel, motor vehicles and aircraft, the May gains were
very sharp. Also significant was the continued rise in machinery and
equipment orders which were 8.5 per cent above their February low.
The rise in new orders in May was accompanied for the first
time this year by a rise in unfilled orders. Most of the May increase
was for aircraft and parts and this raised their backlogs to a new high.
For defense products, which includes aircraft and parts, unfilled orders
were higher in May than at any time since the series began in 1952.
Backlogs for iron and steel also increased appreciably.
Inventories. Inventory building in manufacturing in May was
sharply reduced as stocks rose only $250 million (book value). This
increase, equivalent to an annual rate of $3.0 billion, compares with
a rate of $7.2 billion in the first quarter and a high of $12.1 billion
in the final quarter of last year. Defense products accounted for a
substantial proportion of the addition to durable goods inventories.
For nondurable goods, the May increase was quite small, amounting to
only $50 million.

II - 15
Stronger demands were also reflected in increased shipments
in May. Especially large gains occurred in durable goods industries.
In nondurable goods industries shipments rose slightly. With shipments
up more than inventories, stock-sales ratios declined, although stock-
sales ratios continued high for nearly all durable goods and most non-
durable goods industries.
Inventories held by distributors declined nearly $200 million
in book value in May, following a decline of $370 million in April. In
May stocks were liquidated at both durable and nondurable goods whole-
salers and at durable goods retailers, but were increased at nondurable
goods retailers. The combined April-May reduction in distributors'
stocks was more than twice as large as the total reduction in the first
three months of the year. In the earlier period nearly all of the
liquidation occurred at auto dealers, while in the more recent months
wholesale establishments participated in the reduction. At wholesale
establishments in both durable and nondurable goods lines, inventories
continue high relative to sales. But at the retail level, inventories-
sales ratios for both durable and nondurable goods are not out of line
with those of other recent years.
Labor market. After declining for two months, employment
turned around in June and gains should accelerate further in the current
quarter as the pace of real output steps up. A rise of 150,000 in non-
farm employment in June brought the level almost back to the March peak.
Especially significant were the increases--although small--reported in

II - 16
manufacturing and construction employment, which had been declining
earlier this year. Hours of work in manufacturing, however, declined
somewhat further; in contrast, the workweek in construction rose
substantially, in part reflecting improved weather conditions in June.
As expected, there was an exceptionally large influx of
workers into the labor force in June. The seasonally adjusted increase
of 900,000 in the month, reversed the downward tendencies which were
reported in previous months and brought the civilian labor force up to
77.2 million, about 1.6 million more than a year ago. In addition, the
armed forces have absorbed about 350,000 young people, so that the total
labor force is now 1.9 million larger than last June. This is a much
larger increase than would be anticipated solely from population growth
in the working age groups.
Almost all of the large June increase in the labor force was
absorbed into gainful employment. However, the unemployment rate rose
to 4.0 per cent, slightly above the May level of 3.8 but still close to
the narrow range of the past year and a half. The rise during the month
was almost entirely accounted for by an increase in unemployment among
adult women looking for seasonal work. Among adult men, there was also
a slight rise in unemployment in June and their rate is somewhat higher
than earlier this year, with a rise among semi-skilled and unskilled
workers in manufacturing and construction accounting for the higher
levels. Youths (students and graduates) entering the labor force at
the end of the school year generally found jobs, and the unemployment
rate for the group showed little change. This marks the third successive

II - 17
year that the very large number of young people entering the labor
market in the summer have, on the whole, successfully found jobs,
attesting to the continued underlying strength in demand for labor.
(On an unadjusted basis, almost 2-1/2 million youths 16-19 entered the
labor force and found jobs in June.)

II - 18
Nonfarm employment. With reductions in manufacturing and con-
struction employment is no longer offsetting the continuing substantial
gains in services and government activities, total nonfarm employment
rose in June. In manufacturing, employment increased by 30,000 in
June but was still 300,000 below the January peak level. The relatively
moderate June increase occurred despite a strike in the electrical
equipment industry which reduced employment by 40,000. Moreover, some
50,000 rubber workers continued on strike. The decline from the January
peak thus includes at least 90,000 workers on strike.
In the durable goods industries, autos, aircraft, fabricated
metals and machinery showed some strength in June, but employment con-
tinued to ease in primary metals, lumber and furniture. In nondurable
goods lines, increased demands for workers appeared to be more wide-
spread with almost all industries showing gains. Employment even rose
in the textiles and chemicals industries, which have a substantial
inventory overhang.
Although manufacturing employment expanded somewhat, the
workweek eased further to 40.2 hours and was about an hour below a year
ago. The apparent contradictory performance of hours and employment can
be explained in part by: (a) further attempts of employers to cut costs
by reducing overtime at premium pay while at the same time rehiring laid-
off workers; (b) an inadequate seasonal adjustment--the seasonally
adjusted workweek has declined by .2 hours in June of each of the past
three years; (c) industries reporting lower hours of work were mainly
in durable goods industries where inventory adjustments are still
underway.

II - 19
CHANGES IN NONAGRICULTURAL EMPLOYMENT(In thousands)
Total
IndustrialManufacturingMiningConstructionTransportation and
public utilities
NonindustrialTradeServiceGovernment
FederalState and local
June 1966to
June 1967
1,582
-78-14-12
-145
93
1,660379602679159520
June 1966to
Dec. 1966
1,093
318278
-6-7
53
77517530329758
239
Dec. 1966to
June 1967
489
-396-292
-6-138
40
885204299382101281
Notwithstanding the easing in industrial employment over the
past half year, demands for labor have continued strong in the service
and government sector. While industrial employment was falling by about
400,000, gains in nonindustrial activities totaled almost 900,000. In
fact, the increase in the latter group was somewhat larger than over the
previous half year. Recent gains in trade and service employment were
about in line with earlier trends but expansion in government employment
accelerated.
The expansion of close to 1.7 million in nonindustrial employ-
ment over the past yearwas about equal to the growth in the civilian
labor force. Taken together with demands of the armed forces in the
period, it becomes clear why sluggishness in industrial employment has
had relatively little impact on aggregate unemployment.
. 1

III - 1
DOMESTIC FINANCIAL SITUATION
Bank credit. Bank credit expansion during June was moderated
by sizable bank liquidation of Treasury securities during the last
statement week of the month. As a result, the all commercial bank
credit series, calculated from last Wednesday to last Wednesday of the
month, showed an increase of only about 1 per cent annual rate. The
credit proxy for member banks, based on daily average figures and
adjusted to include borrowing from foreign branches, is less influenced
by end-of-month developments and showed a rate of growth of almost
10 per cent.
The disparity between these two series in any one month is
reduced when a longer time span is considered. As indicated in the
table, both series show about an 11 per cent rate of growth of bank
credit during the first half of 1967, with much slower growth in the
second quarter when Treasury deposits were declining.
COMMERCIAL BANK CREDITSeasonally adjusted annual rate
(per cent)
1967June 1st Half 2nd Qtr. 1st Qtr.
Adjusted credit proxy- 9.7 11.0 7.6 14.1
All commercial bank2 1.1 10.6 6.0 15.1
/ Daily average of total member bank deposits plus change in
liabilities to overseas branches.2/ All commercial banks, last Wednesday of month series.

III - 2
Substantially all of the $1.1 billion liquidation of Treasury
securities by banks during June reflected reducedrholdings of Treasury
bills, presumably for the most part tax bills maturing on June 22. Bank
acquisitions of other securities, while sizable in June, were consider-
ably less than those of other recent months.
COMPONENTS OF COMMERCIAL BANK CREDITSeasonally adjusted annual rate
End-of-month series(per cent)
1967June Ist Half 2nd Qtr. 1st Qtr.
Total loans & investments 1.1 10.6 6.0 15.1
U.S. Gov't. securities -22.9 8.1 -9.0 25.8
Other securities 17.4 29.6 27.5 29.6
Total loans 2.8 6.9 4.7 8.9
Business loans 17.7 11.5 10.9 11.8
The reason for the slower pace of acquisitions is not clear, but may be
related to bank expectations of further rate increases. Moreover, in
May many banks lengthened their portfolios by acquiring Treasury secur-
ities in a refinancing. If, as a result, they temporarily moderated
this purchase of municipals, June deliveries of such securities would
have been reduced.
Business loans expanded by $1.2 billion in June, with
virtually every industry category showing heavy loan demands over the
tax and dividend period. An unusually small share of tax bills was
turned in for tax payments, suggesting that the build-up of corporate

III - 3
liquid assets over the spring was neither large nor broadly distributed
among firms. Thus, the record June corporate income tax payments of
$9.2 billion were translated into substantial, but probably temporary,
demands for bank loans by nonfinancial businesses.
Loans to nonbank financial institutions showed only modest
increases in June--either because of small tax period maturities of
finance company paper or the ease with which such maturing paper could
be quickly refunded. Loans to security dealers declined, mainly as the
result of a sizable reduction in Government security dealer positions
in June. Consumer and real estate loans continued to increase by modest
amounts.
Bank deposits. Net inflows of time and savings deposits in
June, on a daily average basis, were at an annual rate of over 16 per
cent--somewhat more than in May. As in other recent months, the com-
bined inflows to passbook savings accounts and time deposits other than
TIME AND SAVINGS DEPOSIT INFLOWS, WEEKLY REPORTING BANKS(Millions of dollars, not seasonally adjusted)
June I/1967 1966 1965 1964
Total time and savings deposits +1,019 +573 +882 + 12
Negotiable CD's + 84 - 4 +270 -244Other time 2/ + 481 +566 - 39 - 71Savings + 454 + 11 +591 +327
2/Memo: Other time- plus savings + 925 +577 +552 +256
1/ Four weeks ended June 28, 1967; June 29, 1966; June 30, 1965;July 1, 1964.
2/ Other than large negotiable CD's.

III - 4
negotiable CD's for weekly reporting banks--shown in the last line of
the table--were very large. By late June and early July, when most
banks credit interest payments, there had as yet been no indications
of shifts out of such deposits into market securities.
Heavy loan demands and efforts of banks to obtain funds
before the anticipated rise in short-term interest rates, led to
increases of offering rates on negotiable CD's of 1/8 to 3/8 of a per-
centage point in June. These increases carried typical CD rates 12 to
75 basis points above their April lows. With yields on most money market
assets unchanged to only somewhat higher until late in June, the yield
advantage of newly issued negotiable CD's rose to record levels, a
dramatic change from the generally noncompetitive rates posted in April.
These attractive offering rates permitted banks not only to
replace very large CD maturities in June, but also to increase outstand-
ings by about $85 million--a good performance for a month with large tax
and dividend maturities. The increase in outstandings was particularly
sharp when consideration is given to the tax payments that have appar-
ently limited corporate funds available for short-term investment.
Indeed, the difficulty in obtaining corporate time deposits probably
was a major factor in the increase in CD rates since April. During the
spring, essentially all of the increase in outstanding CD's has occurred
among holders other than individuals, partnerships, and corporations.
Earlier in the spring, the increase of "other" holders was thought to
be mainly among States and political subdivisions; more recently it has
probably been centered in acquisitions of foreign government.

III - 5
Despite record tax inflows in June, Treasury talances at
banks continued to decline sharply, particularly *n the last reporting
week of the month when $3.5 billion of tax bills were turned in for
cash. These declining balances contributed to a sharp June increase in
the money stock, which for the second consecutive month, expanded at an
annual rate of more than 13 per cent. Although these increases brought
the first half annual rate of growth in money balances to 6.7 per cent,
the money stock in June was only about 3 per cent above year-ago levels.
Much of the expansion since late last year has reflected rebuilding of
cash balances from the very low levels to which they were drawn down in
the summer and fall of 1966.
Corporate and municipal bond markets. During the latter
part of June, yields on new corporate bonds rose to their highest
level in over 45 years, slightly above the August 1966 peak. The
corporate new issue series does not reflect this peak, however, due to
a shift in the characteristics of the issues included in the series.
But issues offered at these record yield levels experienced an excellent
reception, and most recently corporate new issue yields have dropped
back from their highs. In the municipal market, on the other hand, new
issue yields advanced less sharply in June and have not shared in the
recent yield declines of other bond markets,

III - 6
BOND YIELDS(Weekly averages, per cent per annum)
Corporate AaaNew Seasoned State and local Government
With call Moody's Bond buyer'sprotection Aaa (mixed qualities)
19651/End of July- 2/ 4.58 4.48 3.16 3.25
Early December- 4.79 4.60 3.37 3.50
1966Late summer high 5.98* 5.44 4.04 4.24
Weeks ending:
February 3- -- 5.02 3.25 3.40March 31 5.21* 5.12 3.46 3.54
June 9 5.70* 5.37 3.76 3.90June 30 5.92* 5.57 3.85 4.06July 7 5.86* 5.59 3.85 4.07
1/ Week prior to President's announcement of increased U.S. involvementin Vietnam.
2/ Week preceding Federal Reserve discount rate increase.3/ 1967 low.*Some issues included carry 10-year call protection.
The decline in corporate yields over the past two weeks has
occurred in both recently offered issues and new issues. Among the
recently offered issues, two Aaa-rated utility issues with 5-year call
protection--Boston Edison Company and Illinois Bell Telephone Company
initially offered to yield investors 6 per cent in late June--are now
trading at more than 20 basis points below their reoffering yields.
Similarly, an Aa-rated gas company issue last week was priced 20 basis
points below a comparable issue brought to market only two weeks ago.
The sharp advance in yields appears to have been an over-discounting
of market pressures, and the recent turnaround, in part, constitutes a
realization of this by market participants.

III - 7
Accompanying the sharp corporate yield advance in June were
record-breaking offerings. Estimated public bondlofferings totaled
$1.65 billion in June, slightly exceeding the previous record established
in March. (Not included in this June estimate are two large rights
offerings which expire in July, and account for the larger June total
shown in other published data.) The volume of public bond offerings
during the first half advanced to more than $7.2 billion, an all-time
high and nearly double the previous record volume of such issues offered
during the first half of 1966. While total bond and stock offerings in
June, and for the first half, showed a smaller margin of increase over
a year ago--with both private placements and stocks in smaller volume--
gross funds raised with bonds and stocks of all types aggregated an
estimated $11.7 billion in the first half, $1.5 billion more than in the
like period of 1966.
The June record for public debt offerings will most likely be
short-lived, as July offerings are now estimated at $1,750 million,
$100 million more than in June. Included in this total are convertible
offerings aggregating $500 million. Even though private placements and
stock offerings in July are projected in lower volume than a year
earlier, total bond and stock offerings still are expected to amount to
$2,300 million--more than double the July 1966 volume. And public bond
offerings for August may ultimately reach $1,300 million, exceeding the
previous record August calendar of last year.

III - 8
1/CORPORATE SECURITY OFFERINGS-
(Millions of dollars)
BondsPubc Bonds PvaTotal bondsPublic Private so
2/ and stocksofferings- placements and
1967 1966 1967 1966 1967 1966
1st Quarter 3,263 1,774 1,811 2,586 5,464 5,094
2nd Quarter 3,975e 1,941 1,750e 2,083 6,250e 5.115
June 1,650e 832 550e 784 2,475e 2,427
July 1,750e 440 450e 535 2,300e 1,085
August 1,300e 1,140 450e 435 1,850e 1,712
1/ Data are gross proceeds.
2/ Includes refundings.
The volume of municipal security offerings in June ranked
with the other $1.4 billion months of January and March of this year.
This volume raised gross municipal issues during the first half to an
estimated $7.6 billion, more than 20 per cent above the like period of
1966. It now appears that July will be the seventh consecutive month
in which municipal offerings will exceed $1 billion. And since new
issues in the latter half of June did not generally experience an
enthusiastic reception, dealers entered July with some excess inven-
tories. New issue volume in August will probably be under the $1.0
billion mark, however, reflecting a tendency toward seasonal lull and
the fact that a number of large and frequent borrowers--such as the
State of California, New York City, and the Public Housing Administration-
will already have been in the market in either June or July.

III - 9
STATE AND LOCAL GOVERNMENT BOND OFFERINGS(Millions of dollars) 1/
1967 1966
1st Quarter 4,112 2,9642nd Quarter 3,529e 3,256
June 1,400e 1,143July 1,100e 702August 950e 775
1/ Data are for principal amounts of new issues.
Flows to nonbank intermediaries. Savings flows to nonbank
depositary-type intermediaries continued in record volume during June,
as the table shows. While the rate of growth in net inflows slackened
a bit relative to preceeding months, for all three months of the second
quarter the rate of growth (at a seasonally adjusted annual rate) was
11 per cent at both S&L's and mutual savings banks, which compares with
growth rates of 2.0 per cent and 2.4 per cent, respectively, for the
second quarter of 1966.
SAVINGS FLOWS TO NONBANK INTERNEDIARIES(Millions of dollars) 1/
S&L's Savings Banks
June1967 $1,821 600-1966 1,184 2241965 1,603 4361964 1,751 4781963 1,631 395
Year to date1967 5,862 2,7071966 2.088 7841965 4,190 1,6841964 5,410 1,9341963 6,143 1,537
1/ Data include interest credited which typically amounts to about75 per cent of the total.
2/ Federal Reserve estimate.

III - 10
As they moved into the July reinvestment period, spokesmen
for the thrift industry were generally not anticipating any serious
increase in gross withdrawals, despite the high level of long-term
market rates and the rapid recent advance of short-term rates. Officials
at California S&L's were less sanguine about this outlook, however,
because of the recent Home Loan Bank Board action which reduced the
California passbook rate to 5 per cent from 5-1/4 per cent, and elimi-
nated the 5-1/4 per cent certificate option for any S&L's paying the
5 per cent passbook rate. Preliminary reports from the California State
chartered S&L's for the first week of July indicate that this concern
was probably well founded although details on the size of the net out-
flow is not yet available. Thus far, the only data available from other
parts of the country are for the 15 largest savings banks in New York
City, which continued to experience a record net inflow during the first
10 days (5 business days) of July as indicated in the table.
EARLY JULY SAVINGS FLOWS AT NEW YORK CITY'S15 LARGEST MUTUAL SAVINGS BANKS
(Millions of dollars)
First 5 business Savingsdays of July Deposits
1967 +56.0
1966 -31.1
1965 - 9.5
1964 + 7.4

III - 11
Mortgage market developments. With further increases in
bond yields in June, there were widespread additional price reductions
in the secondary market for Federally-underwritten mortgages, accom-
panied in numerous areas by somewhat more restrictive rate and nonrate
terms in the primary market, according to reports from FNMA and VA
field offices. These developments imply that the sensitive official
secondary-market yield series on FHA home mortgages will show a rise
for the second consecutive month when it becomes available for June.
In May these had turned up by 15 basis points, after 5 months of decline
and this had been associated with an upturn of about 5 basis points for
the FHA series on conventional loans.
Yields on FHA loans, however, undoubtedly increased less
during June than yields on corporate bonds. Competition from some
conventional-mortgage lenders, such as savings and loan associations,
has apparently continued to limit the rise in yields required by lenders
on Federally-underwritten mortgages. The yield spread favoring home
mortgages over bonds thus has remained unusually low, and has contributed
to some further reduction in the availability of home mortgage credit
and to growing market uncertainty in an increasing number of areas.
The reduced relative attractiveness in recent months of home
mortgages in general--which are subject to more restrictive Federal and
State interest-rate ceilings than are higher-yielding business-type
mortgages secured by multifamily and commercial properties--has accounted
in part for lessened interest of diversified lenders in these investments,
and has further dampened the longer-run outlook for 1- to 4-family con-
struction.

III - 12
As secondary-market prices for FHA and VA loans declined
again last month, there was a sharp increase in offerings of these
mortgages to FNMA for purchase under its unchanged price schedule.
Offerings of about $200 million--the largest monthly volume since early
last year--were reportedly bolstered by market anticipations that FNMA
would soon announce a cut in its buying prices.
Stock market. The Standard & Poor's composite index of 500
stocks traded on the New York Stock Exchange closed at 92.48 on July 11,
two per cent below its early May peak. The decline took place in May,
and the index subsequently has been fluctuating within a narrow range.
The composite index, however, has not reflected the speculative interest
which seems to have developed. One indication of such interest is that
Standard & Poor's index of low priced stocks has advanced to a new
record high recently, sixty per cent above its 1967 low. On the
American Stock Exchange, average prices also have risen recently to an
all-time high.
Moreover, on the American Exchange, monthly share volume in
June exceeded 100 million for the first time in history. Although the
New York Stock Exchange monthly volume--at 228 million shares--was also
high in June, trading on the American Exchange was almost as large a
proportion of New York Stock Exchange volume as at the April 1966 specu-
lative peak.
Between mid-May and the end of June, 100 per cent margin
requirements were imposed by the American Exchange on 11 separate issues.
III - 13
Of these, 6 issues were added to the list during the last week in June,
and 15 more issues have been added thus far in July, making the total
number now affected 26. On 17 occasions in June, openings were delayed
on the American Exchange, and 9 times trading in certain issues had to
be halted to preserve an orderly market.
Although margin panel data are not available for June, May
statistics showed an increase of $59 million in customer credit extended
by banks and New York Stock Exchange member firms--the fourth increase
in as many months. Over the four months, total customer credit rose
$334 million, an increase cancelling about three-fourths of the July'
October decline.
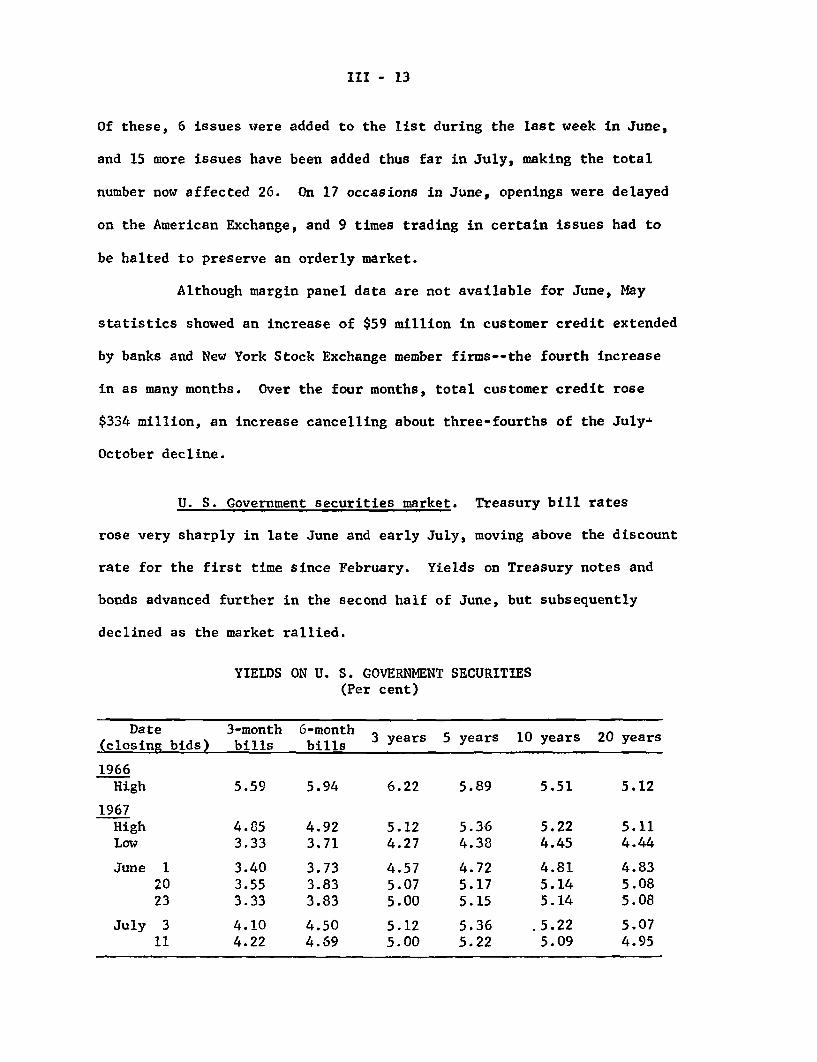
U. S. Government securities market. Treasury bill rates
rose very sharply in late June and early July, moving above the discount
rate for the first time since February. Yields on Treasury notes and
bonds advanced further in the second half of June, but subsequently
declined as the market rallied.
YIELDS ON U. S. GOVERNMENT SECURITIES(Per cent)
Date 3-month 6-monthDat(clos bids) bils 3 years 5 years 10 years 20 years(closing bids) bills bills
1966High 5.59 5.94 6.22 5.89 5.51 5.12
1967High 4.85 4.92 5.12 5.36 5.22 5.11Low 3.33 3.71 4.27 4.38 4.45 4.44
June 1 3.40 3.73 4.57 4.72 4.81 4.8320 3.55 3.83 5.07 5.17 5.14 5.0823 3.33 3.83 5.00 5.15 5.14 5.08
July 3 4.10 4.50 5.12 5.36 .5.22 5.0711 4.22 4.69 5.00 5.22 5.09 4.95

III - 14
The recent upsurge in Treasury bill rates was triggered in
late June by the announcement of large Treasury cpsh financings totaling
$6.2 billion, including the auction of $4.0 billion of March and April
tax bills on July 5. The financing "package" also included $100 million
additions to weekly 3-month and to monthly 1-year bill auctions and was
recognized to be but a beginning towards meeting the Treasury's very
large second half cash needs. Close market observers generally expect
the Treasury's total cash requirements to range from $15 billion to
$20 billion over the second half of the year, up from $10 billion in
the second half of 1966 and much smaller amounts in other recent years.
Our own projections indicate a gross cash need of around $18 billion in
the second half of 1967.
At the higher yield levels, sizable market demand for bills
developed and this demand was supplemented by large System purchases to
help meet seasonal reserve needs around the turn of the month. Higher
bill rates also stimulated bank bidding for the new tax bills, which
were being offered with 100 per cent Treasury tax and loan account
privilege, and bank sales of the new bills following the auction have
been relatively light thus far. As a result of these developments,
dealer bill inventories were reduced to quite low levels, especially in
bills maturing in three months or less.
The steadier tone which developed in the Treasury bond
market in early July seemed to be related in part to the improved
atmosphere in the corporate bond market where high yields on recent new
issues attracted good investor interest. In addition, sizable buying
III - 15
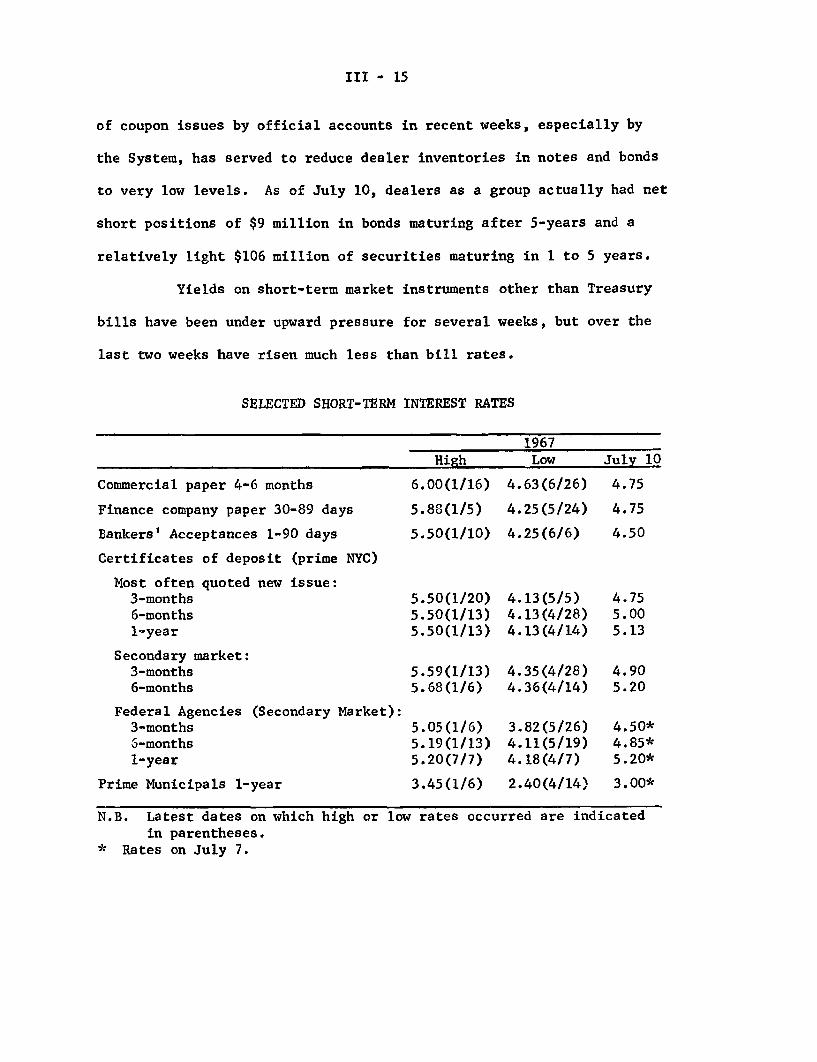
of coupon issues by official accounts in recent weeks, especially by
the System, has served to reduce dealer inventories in notes and bonds
to very low levels. As of July 10, dealers as a group actually had net
short positions of $9 million in bonds maturing after 5-years and a
relatively light $106 million of securities maturing in 1 to 5 years.
Yields on short-term market instruments other than Treasury
bills have been under upward pressure for several weeks, but over the
last two weeks have risen much less than bill rates.
SELECTED SHORT-TERM INTEREST RATES
Commercial paper 4-6 months
Finance company paper 30-89 days
Bankers' Acceptances 1-90 days
Certificates of deposit (prime NYC)
Most often quoted new issue:3-months6-months1-year
Secondary market:3-months6-months
Federal Agencies (Secondary Market):3-months5-months1-year
Prime Municipals 1-year
High
6.00(1/16)
5.88(1/5)
5.50(1/10)
5.50(1/20)5.50(1/13)5.50(1/13)
5.59(1/13)5.68(1/6)
5.05(1/6)5.19(1/13)5.20(7/7)
3.45(1/6)
1967Low
4.63(6/26)
4.25(5/24)
4.25(6/6)
4.13(5/5)4.13(4/28)4.13(4/14)
4.35(4/28)4.36(4/14)
3.82(5/26)4.11(5/19)4.18(4/7)
2.40(4/14)
July 10
4.75
4.75
4.50
4.755.005.13
4.905.20
4.50*4.85*5.20*
3.00*
N.B. Latest dates on which high or low rates occurred are indicatedin parentheses.
* Rates on July 7.

III - 16
Treasury finance. With the completion of the $4.0 billion
tax bill financing, the Treasury's next major financing will be the
regular August refunding. The terms of this refunding are expected to
be announced on July 26. Public holdings of the issues maturing in
mid-August are a moderate $3.6 billion. Given favorable market condi-
tions, many market participants expect the Treasury to offer an issue
in the intermediate-term maturity area in this refunding. Under
recently enacted legislation, the Treasury could bring to market a note
with a maturity as long as 7 years which would be exempt from the 4-1/4
per cent interest rate ceiling.
It is currently anticipated that the Treasury will need to
re-enter the market very shortly after the August refunding to raise
additional new cash, perhaps as much as $3 billion to $4 billion. The
payment date for this financing will have to be scheduled to meet a
seasonal low in Treasury balances around the second week of September.
Federal budget. Fiscal 1967 budgetary figures shown on the
accompanying table are still preliminary and final figures will not be
reported until later this month. Revised fiscal 1968 budget projections
are expected to be released by the Bureau of the Budget within two or
three weeks in keeping with a request of the Joint Economic Committee.
These figures will indicate larger deficits than those shown in the
table below for fiscal 1968 taken from the January budget document.
(Our projection for the July-September 1967 quarter shown in the table
is consistent with a considerably larger fiscal 1968 cash deficit than
that indicated in the January Budget document.)
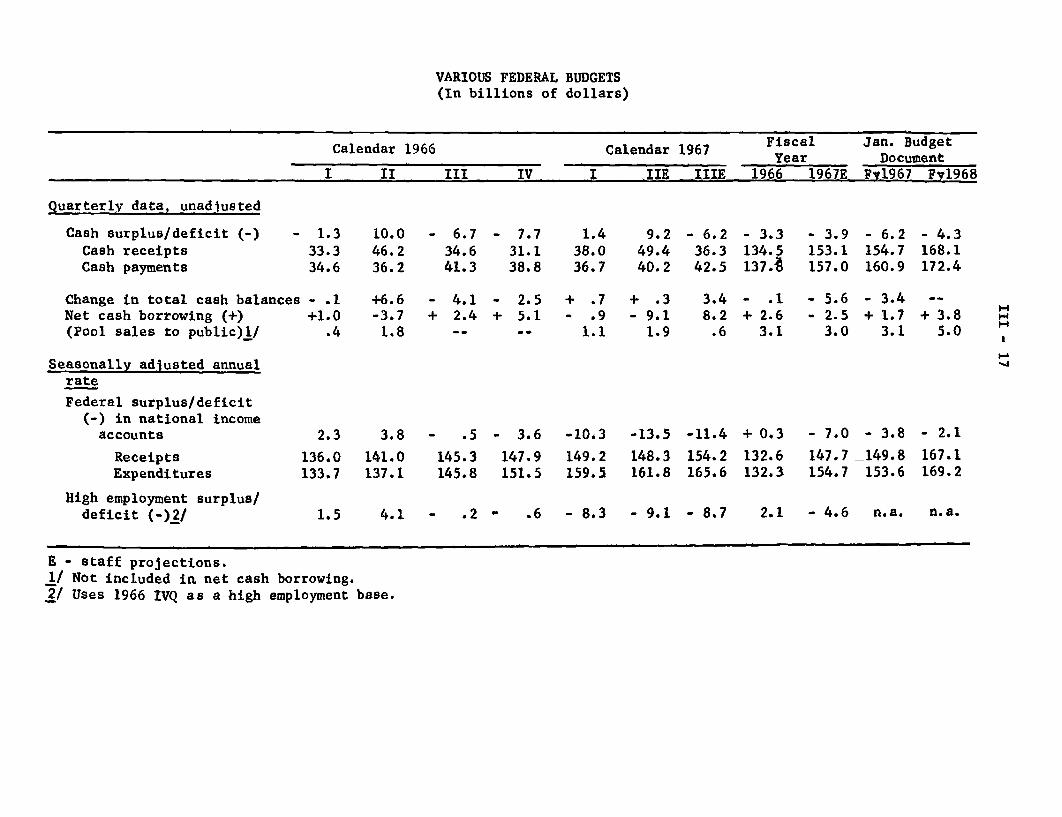
VARIOUS FEDERAL BUDGETS(In billions of dollars)
Fiscal Jan. BudgetCalendar 1966 Calendar 1967 c a a u e
Year DocumentI II III IV I lIE IIIE 1966 1967E Fy1967 Fy1968
Quarterly data, unadjusted
Cash surplus/deficit (-) - 1.3 10.0 - 6.7 - 7.7 1.4 9.2 - 6.2 - 3.3 - 3.9 - 6.2 - 4.3Cash receipts 33.3 46.2 34.6 31.1 38.0 49.4 36.3 134.5 153.1 154.7 168.1Cash payments 34.6 36.2 41.3 38.8 36.7 40.2 42.5 137.A 157.0 160.9 172.4
Change in total cash balances - .1 +6.6 - 4.1 - 2.5 + .7 + .3 3.4 - .1 - 5.6 - 3.4 --Net cash borrowing (+) +1.0 -3.7 + 2.4 + 5.1 - .9 - 9.1 8.2 + 2.6 - 2.5 + 1.7 + 3.8(Pool sales to public)/ .4 1.8 -- -- 1.1 1.9 .6 3.1 3.0 3.1 5.0
Seasonally adjusted annualrate
Federal surplus/deficit(-) in national incomeaccounts 2.3 3.8 - .5 - 3.6 -10.3 -13.5 -11.4 + 0.3 - 7.0 - 3.8 - 2.1
Receipts 136.0 141.0 145.3 147.9 149.2 148.3 154.2 132.6 147.7 149.8 167.1
Expenditures 133.7 137.1 145.8 151.5 159.5 161.8 165.6 132.3 154.7 153.6 169.2
High employment surplus/deficit (-)2/ 1.5 4.1 - .2 - .6 - 8.3 - 9.1 - 8.7 2.1 - 4.6 n.a. n.a.
E - staff projections.1/ Not included in net cash borrowing.2/ Uses 1966 IVQ as a high employment base.

I-c-1
FINANCIAL DEVELOPMENTS - UNITED STATES
FREE RESERVES AND COSTS CHANGES IN BANKCREDIT
BANK RESERVES
BILLIONS OF DOLLARS
BORROWEDJUNE 42
I_ EXCESS i :i~~JUNE 12i i.... .
1 9 6 3 1965 1967
MONEY AND TIME DEPOSITS21
1
1
1
1
26.0
24.0
12.0
20.0
.8
0
20080
160
40
20
00
80
50
40
30
CHANGES IN BANK LOANS-BY TYPEBILLIONS OF DOLLARS ' ' ' I ' ... 3SEASONALLY ADJUSTED MO MOVING
AVERAGE_ _ 2__ 2
BUSINESS MAY 030
M _ I_2
2IALL OTHER 2
MAY 0 4I~~~~~~n J iiitiIi
1965 1966
MUTUAL SAVINGS BANKSMAY 571
1967
7/11/67
B IL L IO N S O F D O L L A R S ' . . 1. ISEASONALLY ADJUSTED JUNE 1760RATIO SCAL
DE -MONEY SUPPLY JUN176
- 172 8
1963 1965 1967

TI-C-2 7/11/67
FINANCIAL DEVELOPMENTS - UNITED STATES
4ET FUNDS RAISED-NONFINANCIAL SECTORS SHARES IN TOTAL CREDITILLIONS OF DOLLARS I I I I I 00 PER CENT 1 60EASONALLY ADJUSTED,NNUAL RATES - r\ I 499 _
GI 701 60
SIM6 \ - 20COMMERCIAL BANKS
PRIVATE DOMESTIC -40
_ 0
ER CENT I PRIVATE DOMESTIC TO 1- -PRIVATE INVESTMENT OUTLAYS NONBANK DEPOSITORY 40
- -40 INSTITUTIONS
I 286 20DATA BEING REVISED 20
QI 92
SI 0 PUBLIC I I1963 1965 1967 1964 1965 1966 1967
\ARKET YIELDS MARKET YIELDS-U.S. GOVT. SEC.E, CENT 1 1 PER CENT 7
_+--- - - _+-- -_ - 74EW HOME FIRST MORTGAGES:
%MAY 6 4_
--uNE 16 1-YEAR BILLS*30-YEAR, FHA-INSURED - JUNE 58I U JUNE 437
--- / ! -5-YEAR ISSUES ///-JUNE 496 5
- 5 6BONDS AND STOCKS 20-YEAR BONDSJUNE 486
NEW CORPORATE AaaSJ IUNE 3 8
STATE AND LOCAL GOVT Aa/Ta . 3-MONTH BILLS*,- -^ / JUNE 361
JUN E 3 2 - - 3
COMMON STOCKS DIVIDEND/PRICE RATIO *INVESTMENT YIELD BASISLI I I EIII
I I IP I
I I I I Illl lji
1963 1965 1967 1963 1965 1967
JEW SECURITY ISSUES STOCK MARKETILLIONS OF DOLLARSI I I I 3.0 1941 3=10 RATIO SCAL LLIONS OF DO
_____ CORPORATECORPOATE - -2.5100 COMMON JUNE'9 10A JUNE 24 STOCK PRICES NE914
-- - 2.0 ---- 81966 - 2 .0 ' 0_ _ - 7 MAY 81
T - 1.5 6
- - 1.0 -CUSTOMER CREDIT
1965 NEW SERIES.. . .5
-STATE AND LOCAL GOVERNMENT- MILLIONS OF SHARES RAIO SCA 12
________ ___~- 5 H_----__---_---- --,/NE 97-SJUNE 14
-. o 4- - 5
I

IV - 1
INTERNATIONAL DEVELOPMENTS
U.S. balance of payments. Data for the(second quarter (still
partial for June) show a continued heavy liquidity deficit, greatly
exceeding the large first-quarter deficit when both are adjusted to
eliminate the effects of special receipts. Such U.S. receipts, prima-
rily from official foreign purchases of long-term CD's and other non-
liquid obligations, were especially large at the end of June, and will
greatly reduce the published liquidity deficit for the quarter.
In April and May combined the liquidity deficit was $502
million (before seasonal adjustment), after counting receipts of $160
million from the sale of long-term CD's and about $85 million from
purchases of bonds of U.S. Government agencies by international insti-
tutions. It now appears that very large receipts at the end of June
may have resulted in a surplus on the liquidity basis for the month
on the order of $200-300 million. Special receipts of about $450
million which contributed to this result are shown in Table 1. In
addition, there were receipts on military account from Germany
totaling over $200 million in May and June, part of which would be
matched by current deliveries.
The estimate of the June surplus is highly tentative since
at present only incomplete weekly figures are available and they
include a reported surplus of over $500 million in the week ended
July 5, which has to be distributed between June and July.
If special receipts of the types shown in table 1 are not
counted, the liquidity deficit appears to have deteriorated sharply

IV - 2
Table 1. Measures of the balance on internationaltransactions, and special receipts, Jan.-June 1967
(in millions of dollars)
~____ 1967____
June Total_- Apr. May (est.) Q-2, est.
Liquidity deficit (-), N.S.A.Seasonal adjustment
Liquidity deficit, S.A.
Special receipts 1/Investments by foreign
official agencies in long-term deposits and CD's
Investments by internationalorganizations in long-termdeposits or U.S. Govt.agency bonds 2/
Advance retirement ofCanadian bonds
Net U.K. transactions inU.S. securities (otherTreasury issues)
Total
Liquidity deficit not reducedby special receipts, N.S.A.
1" " , S.A.
Official settlements deficit(-),N.S.A.Seasonal adjustment
Official settlements deficit,S.A.Special receipts affecting
official settlementsbalance
Adjusted official settlementsbalance
-243-301-544
+306
+57
-23
+340
-583-884
-1,279-543
-1,822
-23
-1,799
-336
n.a.
-166
n.a.
+300
n.a.
+124 +39 +440 3 /
+70 +15 n.a.
- - +31
-3 +66 n.a.
+191 +120 +471
-527 -286 -171n.a. n.a. n.a.
-622 -249 +100
n.a. n.a. n.a.
-3 +66 +31
n.a. n.a. n.a.
-202-270-472
+603
+85
+31
+63
+782
-984-1,254
-770-100
-870
+94
-964
!/ As in Table A, p. 18, Survey of Current Business, June 1967, exceptas noted in footnote 2 below.
2/ Before netting out sales of bonds of international organizations inthe U.S. amounting to: Q-l, $52 million; Q-2, $100.
3/ Includes $200 million of U.S. Treasury obligations acquired by theCanadian Government.

IV - 3
from $900 million in the first quarter to $1-1/4 billion in the second
quarter. The major known changes in transactions between quarters were
an improvement in the trade surplus from an annual rate of about $4.0
billion in the first quarter to $4.8 billion in April-May, more than
offset by a shift in bank-reported lending from an inflow of $70 mil-
lion in the first quarter to an outflow of about $175 million in April-
May. U.S. purchases of foreign securities appear to have continued at
the relatively high first quarter rate. Foreign transactions in U.S.
securities, apart from the official transactions mentioned above and
dealings in bonds of the special Delaware financing affiliates, showed
a larger inflow into corporate stocks in April and May than in the
first quarter, but there appears to have been some liquidation of
corporate bonds. These securities transactions are discussed in
Appendix C.
Very little is known about major factors in the balance of
payments for June. Sales of new Canadian bond issues in the U.S.
market were relatively high, and transfers of funds to Israel as
remittances or bond purchases were probably substantial.
The deficit on the official settlements basis was reduced
from $1.8 billion in the first quarter to probably somewhat less than
$1 billion in the second quarter (this estimate is highly tentative).
The major difference in the behavior of the two balances was a large
contraseasonal shift in movements of liabilities to foreign commercial
banks (including branches of U.S. banks) from a decline of $750 mil-
lion (not seasonally adjusted) in the first quarter to a small increase
in the second quarter. There is normally a sizable seasonal inflow of

IV - 4
foreign commercial bank funds in the first quarter, and outflow in
the second, with a swing of over $400 million between the quarters.
It now appears that this outflow was relatively small in April-May
and net borrowing was resumed in June.
U.S. foreign trade. The merchandise trade surplus in May
held at the high April rate, as both exports and imports fell off. For
April and May combined, the trade surplus (on the balance of payments
basis) was at an annual rate of $4.8 billion, compared with $4.0
billion in the first quarter and $2.8 billion in the second half of
1966.
Exports in April-May averaged about $30.8 billion at an
annual rate (balance of payments basis), about the same as in the
first quarter, but higher than in the fourth quarter of 1966. In
contrast to this leveling off in exports, imports in April-May skidded
further to an annual rate of $26.1 billion, 3 per cent below the
average of the preceding two quarters.
Both the agricultural and nonagricultural components of
exports in April-May showed only minor changes in totals from the
first quarter. Shifts occurred,however, in the area distribution of
exports. Exports to Western Europe and Japan expanded sharply, while
shipments to Latin America and Asia, which had been unusually large
in the first quarter, declined. Increased deliveries of automobiles
and parts to Canada were instrumental in sustaining total exports to
that country at the first quarter rate as other types of exports
declined.
IV - 5
The further rise in exports to Japan -- some wheat but
largely industrial materials -- probably reflects the strong advance
in economic activity there, and continued growth in sales can be
expected. The bulk of the recent increase in shipments to Western
Europe consisted of machinery and aircraft. Improved supply con-
ditions and shortened delivery schedules in the United States may
have facilitated the delivery of equipment ordered previously. In
view of current demand conditions in Europe, further substantial
gains in exports are unlikely in the months ahead.
Imports of four of the five major categories declined in
April-May. Only automotive vehicles and parts increased, buoyed by
the continued expansion in arrivals of passenger cars from Canada,
which consist, to a considerable extent, of components made in the
U.S. Our net export balance on automotive trade with Canada in the
first five months of this year was about $90 million, compared with
nearly $175 million in the corresponding period of 1966.
The downturn in imports of industrial materials has been
especially marked for nonferrous metals, reflecting the slowdown in
domestic output. Imports of iron and steel products, however,
rebounded from the first quarter low to almost the peak levels of
the last half of 1966. In contrast, domestic steel output edged
downward in April-May.
Imports of machinery, after stabilizing in the first quarter,
declined in April-May, possibly reflecting the suspension of the in-
vestment tax credit last fall and the general easing in domestic
investment outlays. The strong upward movement of the past several

IV - 6
years in nonfood consumer goods (excluding autos) was interrupted in
April-May, with imports falling below those of the first quarter.
Purchases of imported foodstuffs also slipped in April-May as sugar
refiners drew down stocks previously accumulated.
Bank credit. Outflows of short-term bank credit (loans
and acceptances) in April and May rose sharply to $185 million. This
is a considerable shift from a net return flow of about $30 million
in the first quarter (before seasonal adjustment), which would
probably correspond to a small net outflow, seasonally adjusted.
Japan alone accounted for a $200 million outflow in April-May, pre-
sumably representing the major part of the borrowing from U.S. banks
anticipated by Japanese officials earlier this year to cover an
expected balance of payments deficit. Credit flows to other areas
in April-May were small and irregular, and changes in foreign-
currency assets and collections were insignificant.
Longer term bank credits registered a small net inflow of
$27 million in April and May, following a net liquidation of over
$150 million in the first quarter. Information on new loan com-
mitments through May does not suggest any increase over the 1966
rate, while the large volume of credits extended from early in 1963
through the first quarter of 1965 is continuing to mature. On balance,
it seems likely that net return flows on long-term bank credits will
continue, though the movements will be irregular. Most of the re-
duction in outstanding credits has been in claims on Europe, with
lesser but substantial reductions for Japan. In June there was a $100
million bank loan to Argentina, the proceeds of which were invested in
long-term CD's.
IV - 7
Economic activity in industrial countries abroad.
Businessmen's opinions during the last two or three months about the
chances of early upturns in activity have been pessimistic. Only
in Italy and Japan was expansion continuing during the first half of
1967.
Except in Italy and Japan, unemployment was generally increas-
ingfthrough April or May. In June, unemployment rose further in Britain.
commonly expressed opinion in many countries was that no real improve-
ment could be looked for until 1968. However, there have been rela-
tively few signs of cumulative deterioration in the situation. The
declines in industrial production in Britain and Germany appear to have
ended. In those countries inventories do not seem to be abnormally
large in relation to sales. However, since early this year there have
been declines in import demand in many industrial countries, and this
has contributed to a spreading of the slowdown in growth. Thus, after
several months of little change, French industrial production declined
noticeably in April and May.
Declines in private business investment have been a promi-
nent feature of the sluggish performance in most Western European
economies this year. In Britain and Germany, for instance, business
capital outlays will be down sharply in 1967 as compared with 1966.
European governments have moved only cautiously to spur
economic revival. In Britain, the priority given to the defense of
the pound is the obvious explanation for the restraint shown by the
authorities. However, in June the government did announce various
steps to encourage consumer spending.
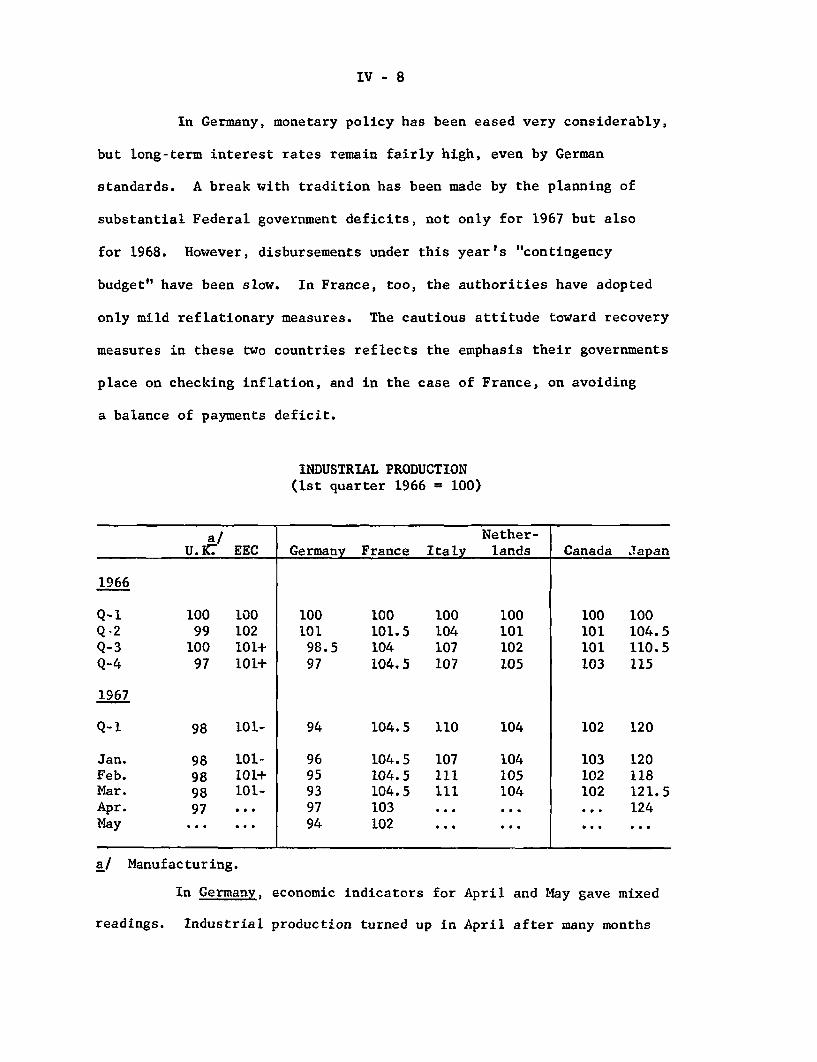
IV - 8
In Germany, monetary policy has been eased very considerably,
but long-term interest rates remain fairly high, even by German
standards. A break with tradition has been made by the planning of
substantial Federal government deficits, not only for 1967 but also
for 1968. However, disbursements under this year's "contingency
budget" have been slow. In France, too, the authorities have adopted
only mild reflationary measures. The cautious attitude toward recovery
measures in these two countries reflects the emphasis their governments
place on checking inflation, and in the case of France, on avoiding
a balance of payments deficit.
INDUSTRIAL PRODUCTION(1st quarter 1966 = 100)
a/ Nether-U.C EEC Germany France Italy lands Canada Japan
1966
Q-1 100 100 100 100 100 100 100 100Q-2 99 102 101 101.5 104 101 101 104.5Q-3 100 101+ 98.5 104 107 102 101 110.5Q-4 97 101+ 97 104.5 107 105 103 115
1967
Q-1 98 101- 94 104.5 110 104 102 120
Jan. 98 101- 96 104.5 107 104 103 120Feb. 98 101+ 95 104.5 111 105 102 118Mar. 98 101- 93 104.5 111 104 102 121.5Apr. 97 ... 97 103 ... ... ... 124
May ... ... 94 102 ... ... ... ...
a/ Manufacturing.
In Germany, economic indicators for April and May gave mixed
readings. Industrial production turned up in April after many months
IV - 9
of decline; one important factor in the turn was a pickup in auto
output. But in various industries new orders fell off after rising in
earlier months, and in May industrial production fell back somewhat.
Business investment plans, according to an April survey,
call for fixed capital expenditures this year 12 per cent below those
of 1966. German industry is currently operating at an average of
75 per cent of capacity. Spending on equipment was already 11 or 12
per cent smaller in January-April than in the corresponding period a
year earlier.
Inventory policies of industry and trade have been very
cautious, influenced by the expectation that inventories on hand when
the value-added tax is introduced January 1, 1968, would suffer double
taxation. Last week the Cabinet announced a measure of tax relief,
with maximum relief in cases where purchased inventories are at least
as large as at the end of 1966.
Consumer demand still showed some expansion in the first
quarter of 1967. As compared with early 1966, growth was mainly in the
area of services, including housing and travel. Retail sales rose in
January from their fourth-quarter low, but subsequently fell off some-
what; in April and May they showed little change.
With foreign demand weakening, Germany's new export orders
were no higher in the first four months of 1967 than in the last four
months of 1966.
Apparently, developments in the German economy in the next
few months will depend greatly on the stimulus to production and in-
comes to be provided by government expenditures. Since April the
IV - 10
placing of contracts under the Federal Government's "contingency
budget" has accelerated. Earlier in the year, despite easier borrow-
ing conditions, expenditures by Federal, State, and local authorities
were only about in line with past trends of increase. At State and
local levels, revenue shortages and legal debt ceilings have
reportedly caused widespread budgetary problems.
Economic policy differences within the Federal Government
were resolved last week by a compromise under which a second con-
tingency budget will provide for placing of orders this autumn and a
substantial budget deficit will be planned for 1968, but taxes will be
increased next year to keep that deficit within acceptable limits.
The Bundesbank made a further move toward easier money with
an additional cut of 8 per cent in the banks' reserve requirements
effective July 1.
In Britain, industrial production registered no net rise
from December through April. Retail sales, covering about half of
total consumer expenditures,rose a little to March, dropped off in
April, and were unchanged (in volume terms) in May.
The continuing rise in unemployment appears to have been a
major consideration in the Government's decision, announced June 7, to
ease restrictions on installment purchases of automobiles. A sharp
decline in automobile sales played a large role in the decrease of
consumer expenditures which took place in the last half of 1966, and
despite a pick-up early this year car sales have remained depressed.
Other expansionary measures announced in June will take
effect later. Payment of regional employment premiums will begin in
IV - 11
September, and increases in social security benefits in November. The
government announced that it will also speed up payments of invest-
ment grants to private industry.
Price rises since the beginning of the year -- when the
so-called freeze on wages and prices ended -- have been relatively
moderate. But average hourly wage rates have increased about 2 per cent
since the beginning of the year, and with the ending of the period of
"severe restraint" at midyear the wage rise is now expected to
accelerate.
So far, the impact of the war in the Middle East on the
British economy has been limited. The principal effect has been in the
foreign exchange markets. The Arab countries have switched only small
amounts of their sterling holdings into other currencies, but the
threat that they might withdraw larger amounts, coupled with general
uneasiness over the Middle Eastern situation, contributed to heavy
selling of sterling in recent weeks.
U.K. prices of all petroleum products were raised slightly
at the end of June because of increased transportation costs, but no
shortage of oil has yet developed in the United Kingdom. It is esti-
mated that at the beginning of the war the United Kingdom had oil
inventories sufficient to meet her needs for three to four months. As
long as production in the Middle East remains at more or less normal
levels, Britain can circumvent the Arab embargo on shipments to her by
increasing purchases from other nations. However, continuation of the
embargo and of the shutdown of the Suez Canal will adversely affect
IV - 12
Britain's foreign exchange reserves, since some alternative oil
suppliers are less likely to accept payment in sterling than is, for
example, Kuwait. Furthermore, only part of the increased shipping
costs can be paid for in sterling.
Economic activity in France was moving on a plateau in the
early months of 1967, with key economic indicators generally showing
little change from late 1966 levels. A sharp dip in industrial
production in April was associated with strikes in several industries,
but in May output fell further and unemployment increased further.
As in other European countries, both lower foreign demand
and a levelling off in domestic consumer expenditures have contributed
to the sluggishness of activity.
According to surveys taken in May and June, French business-
men have become progressively more pessimistic about the prospects for
resumed expansion later this year. Inventories are regarded as
excessively large by many. With regard to counter-cylical policy, the
official view reportedly has been that it is better to await business
recovery in France's main trading partners than to risk acceleration of
inflation through vigorous domestic action. Long-term interest rates
remain high, and the bond market is very tight.
Expansion continues in Italy, with the rise in industrial
production accelerating again this year after slowing in late 1966.
Italian exports to areas outside Europe re-emerged as a growth factor
in the first quarter. Domestic demand for equipment and for semi-
manufactured materials has been strong. An April survey, however,
showed that while optimism still prevailed it was somewhat less buoyant
than before.

IV - 13
The expansion has been making significant inroads into
unemployment. Nevertheless, the pace of wage rate increases has
slowed since the signing of new labor contracts in many industries in
late 1966.
In Japan, industrial production has been rising at a rate of
about 1-1/2 per cent a month since October of 1965, and in May it was
20 per cent higher than a year earlier. A survey of 330 large enter-
prises for the six months ending with March indicated that profits
were up 22 per cent, after rising by 20 per cent in the previous six
months.
On the other hand, producers' shipments tended to level off
in the first four months of this year, with the result that there was
an increase in producers' inventories in March and April. The in-
crease in both wholesale and consumer prices, seasonally adjusted,
slackened substantially in the first five months of 1967, despite the
generally buoyant economic conditions. A decline in iron and steel
prices and weakness in non-ferrous metals were partly responsible.
In line with the general rise in economic activity and imports,
and as a result of the lowering of interest rates elsewhere, Japanese
businesses have increased their foreign borrowing. Much of this has
been in the form of acceptance financing, largely in the United States,
but Euro-dollar borrowing has also increased substantially.

I--C-1 7/11/67
U.S. AND INTERNATIONAL ECONOMIC DEVELOPMENTSSEASONALLY ADJUSTED
U.S. BALANCE OF PAYMENTS U.S. BALANCE OF PAYMENTS - CONIBILLIONS OF DOLLARS FI [ I ( B ILLONS OF DOLLARS I I I I
QUARTERLY QUARTE1 --2 TRADE BALANCE
Or 10 0
OFFICIAL RESERVETRANSACTION BASIS +
| , 11 IJm OTHER TRANSACTIONS-,".,
SQ 5 I\ / 0 I 54
LIQUIDITY BASISSor r822 U.S. PRIVATECAPITAL
2 CORRESPONDING TOBALANCE ON LIQUIDITY BASIS
1961 1963 1965 1967 1961 1963 1965 1967
U.S. BANK CREDIT OUTFLOWS 90-DAY RATESNOT SEASONALLY / NOT S A
ADJUSTD EUROPE200
Y + EURO-DOLLARS0 - - - --- - ---
JULY 5JAPANV ___ 2 0 0 \\ , 53A R A*OulHIow or Apri and M n y on 498
S LATIN AMERICA/' \
/ L 20
S'+0- -,-r-
ALL OTHERC-II_ t , I I 11 i 200 - I -1 1 " 1111 11
1961 1963 1965 1967 1964 1965 1966 1967
U.S. MERCHANDISE TRADE U.S. EXPORTS BY AREABILLIONS OF DOLLARS I" " " 35 BILLIONS OF DOLLARSANNUAL RATES ADJUSTED FOR STRIKES ANNUAL RATESC |CENSUS BASIS 3 MO MOV AV (1 2 13MO MOV AV (12I) M1 M 3138 AV
- -76
--- - 30 W. EUROE E/M
EXPORTS/ - 6 - / -CADA
.M 26 3 Ac
EN
AD A
M
S- I LAIN AMERICA MM 27
IMPORTS -A - -4- -- 20 --
A- 1
APPENDIX A: RESULTS OF THE APRIL 28 SURVEY OF TIME AND SAVINGS DEPOSIT RATES
This Appendix summarizes some of the major findings of theApril 28 survey of time and savings deposit ratesl at member banks, andcomments on some of the salient developments during the three monthsfollowing the previous survey made at the end of January. A detailedreport on the April survey will appear in the July Bulletin.
The increase of 3.4 per cent in total time and savingsdeposits at member banks in the 3 months ending April 28, as shownin Table 1, was the composite result of a relatively rapid rate ofgrowth in consumer-type time deposits (defined here as all time depositsin denominations under $100,000), a slow rate of growth in passbooksavings, and a slight decline in business-type time deposits (that is,denominations of $100,000 and over). Consumer-type time depositsbecame more attractive relative to market instruments during thisperiod following the sharp decline in market rates in late 1966 andearly 1967. They expanded at an annual rate of more than 40 per cent,although this was much less rapid than during the year 1966, whenthere were large transfers into those instruments out of savingsdeposits. Passbook savings, after declining since early 1966,bottomed out in mid-February and then began to expand. Over theentire January-April period, they rose on balance at only a 5 percent annual rate. The decline in business-type deposits was duemainly to the heavy runs-off of corporate holdings in April to meettax payments and the temporary decline in bank interest in competingfor CD's at that time because of their large inflows of consumersavings.
Perhaps the most eye-catching figure in Table 1 is thelarge rate of growth which banks experienced in their new 90-daynotice open-account passbook deposits, which rose 33 per cent in the3-month period. Since it applies to a small base, the significanceof this large growth rate is limited. Nevertheless, aggressivepromotion of these deposits appears quite widespread since allexcept four Districts--Philadelphia, Richmond, Kansas City, andSan Francisco--showed increases for this period of 18 per cent ormore.
Rates of growth in total time and savings deposits werefairly uniform in the January-April period among all bank size groups,except those with total deposits of $500 million or more, as shown inTable 2. The slower growth at large banks reflects the previouslymentioned attrition in business-type time deposits, which are relatively
A-2
important at these banks. For consumer-type instruments, rapid growthprevailed among all bank-size groups. As might be expected in viewof the greater interest sensitivity of depositors at large than atsmall banks, passbook savings at the largest banks rose less rapidly,and other consumer-type time deposits rose more rapidly, than atsmaller banks.
Of particular interest in this table are the rapid rates ofgrowth that occurred in large denomination business-type time depositsat smaller banks. Here, also, the amounts outstanding are relativelysmall. These rapid growth rates also occurred between the May 1966 andJanuary 1967 surveys. One factor accounting for this expansion was asizable increase in the number of issuing banks, which rose betweenJanuary and April by more than 10 per cent. One possible explanationfor this development is that small banks also are beginning toencounter higher loan/deposit ratios and lower liquidity positionsand are finding it necessary to reach out for additional funds toaccommodate their loan demand.
Among Federal Reserve Districts, growth rates in totaltime and savings deposits over the 3-month period varied considerablyfrom a low of 0.5 per cent in the New York District, where business-type deposits showed a sizable decline, to a high of 5.7 per cent inthe Boston District. These differences reflect wide variations ingrowth rates not only on business-type deposits but on consumer-typedeposits as well.
Rate developments between late January and late April aresummarized in Table 3. In general, these data confirm the specialtelephone survey information reported by the Presidents at the FOMCmeeting on May 2 that some banks, mainly large ones, were attemptingto moderate the rapid inflow of consumer CD's by rate reductions andother means. Close to 5 per cent of all member banks reduced themaximum rate paid on consumer-type time deposits between January andApril. Among large banks with total deposits of $100 million or more,16 per cent took such action. On the other hand, another 4 per cent ofall member banks raised rates during this period and another 1 percent introduced an instrument of this kind.
The heaviest concentration of rate changes on consumer-typetime deposits, both increases and decreases, was at 1/2 of 1 per cent,but changes of 1/4 per cent also were common. Among banks raisingrates, however, more raised by a full percentage point than by 1/4per cent. These were mainly smaller banks previously having rela-tively low rates. Among large banks, the principal actions were toreduce rates on consumer-type time deposits from the 5 per cent ceilingto either 4-3/4 or 4-1/2 per cent as shown in the bottom panel ofcolumn (3).

A- 3
As might be expected rate reductions were far morewidespread among business-type deposits, which are issued in compe-tition with other money market instruments, than among consumer-type deposits. On passbook accounts, there was little rate activity,most of it upward.
Table 4 provides a rather detailed picture of the structureof offering rates on various types of instruments, as of both theJanuary 31 and April 28 Survey dates. As shown in columns (1) and(2), about half of all member banks were paying 5 per cent on atleast one consumer-type time deposit on both survey dates, butthe proportion fell slightly between these two dates. Smaller bankswere less generally at ceiling than large banks, but the differencebetween them was smaller in April than in January. Banks paying the5 per cent ceiling held nearly 80 per cent of all consumer-type timedeposits on January 31, but by April 28, they held only 71 per cent,reflecting the rate reductions at large banks.
On passbook savings, less than two-thirds of all memberbanks were at the 4 per cent ceiling at the end of April, but theseincluded over 90 per cent of all large banks. Reflecting thisconcentration of large banks at the ceiling, banks paying the ceilingheld nearly 90 per cent of all passbook deposits.
An analysis of time and savings deposit flows over the3-month period relative to the level and change in offering ratessuggests that rate was an important factor governing behavior ofthese deposits. Banks paying the higher rates tended to have thelarger inflows. Also, banks raising rates experienced larger in-flows than those leaving rates unchanged, while banks lowering ratestended to lose deposits. In all cases, of course, the experienceof the individual bank reflected not only its own rate action, butalso the relationship between its rates and those on alternativeoutlets for funds.
There was little change between January and April in theminimum denomination or minimum maturity associated with the maximumoffering rate. Thus, there is no indication that any appreciablenumber of banks raised their minimum denomination in order to moderateinflows of consumer-type time deposits. Some are reported to haveshortenei their maximum maturities for this purpose, but the surveydoes not cover this characteristic.

Types of Time and(IPC)
TABLE 1
Savings Deposits of Individuals, Partnerships, and CorporationsHeld by Member Bankson January 31 and April 28, 1967
Number of issuing __Amountbanks _Millions of dol.lars Increase or decrease (-)
Jan. 31-Apr. 28, 1967Jan. 31, Apr. 28, Jan. 31, Apr. 28, millions
Type of deposit 1967 1967 1967 1967 of dollars per cent(1) (2) (3) (4) (5) (6)
Total time and savings 116,890 120,824 3,934 3.4
Savings 5,850 5,835 70,701 71,600 899 1.3
Consumer-type time deposits--lessthan $100,000:
Total 25,081 27,749 2,668 10.6Savings bonds 174 179 1,409 1,643 234 16.6Savings certificates 1,593 1,558 8,033 8,647 614 7.6Other nonnegotiable CD's 2,932 2,986 9,402 10,434 1,032 11.0Negotiable CD's 1,885 1,923 4,381 4,561 180 4.1Time deposits, open account 977 1,008 1,856 2,465 609 32.8
Business-type time deposits--$700,000 or more:Total 17,658 17,646 -12 -0.1Negotiable CD's 828 907 13,018 12,786 -232 -1.8Nonnegotiable CD's 882 993 2,814 3,188 374 13.3Time deposits, open account 284 322 1,826 1,671 -155 -8.5
Christmas savings and other specialaccounts 4,084 4,201 3,450 3,828 378 11.0
NOfTEA T I 1 A. J. l I - -Vi nc udesL CI a smal amount of deposits outstanding in a relatively
of deposits and are not included in the number of issuing banks.of rounding.
feW ban I LnaL no ongter
Dollar amounts may notassu t aese typesadd to totals beqause

TABLE 2
Percentage Changes in Timeby Type of
and Savings Deposits, IPC, at Member Banks from January 31 to April 28, 1967Deposits and by Size of Bank and Federal Reserve District
Total time & Business-type Consumer-type depositsGroup savings deposits time Total Savings Consumer-type time
All Banks 2.9 -0.1 3.4 1.0 10.3
Size of bank (total deposits,in millions of dollars):
Under 10 3.9 33.3 3.6 1.0 7.310 - 50 3.9 16.7 3.6 1.2 8.850 - 100 4.5 21.3 3.6 1.5 9.3100 - 500 4.1 12.2 3.3 1.4 10.3500 and over 1.6 -3.1 3.3 0.7 12.4
Federal Reserve District:
Boston 5.7 1.2 6.8 3.4 25.2New York 0.5 -6.8 3.9 1.3 16.9Philadelphia 3.9 -2.9 4.5 1.2 13.0Cleveland 1.9 -3.4 2.5 1.1 8.0Richmond 4.6 5.3 4.5 2.3 12.0Atlanta 4.1 12.6 3.3 1.8 6.8Chicago 4.9 12.9 4.0 0.5 12.5St. Louis 4.4 10.9 3.8 2.3 5.6Minneapolis 5.1 10.2 4.6 0.5 6.9Kansas City 5.2 13.7 4.4 0.9 9.2Dallas 3.2 1.6 3.8 -0.4 11.3San Francisco 1.4 2.2 1.2 0.2 5.4
NOTE: Consumer-type time deposits are the following instruments issued in denominations of less than $100,000:savings certificates, savings bonds, other nonnegotiable and negotiable CD's and time deposits, openaccount. Business-type time deposits include the following instruments issued in denominations of$100,000 and over: negotiable and nonnegotiable CD's and time deposits, open account.

TABLE 3
Member Banks Changing the Maximum Rate Paid or Introducing New Time and Savings Deposit Instrumentsbetween January 31 and April 28, 1967
Consumer-type time _ Business-type time Saving depositsSize of bank, (total Size of bank, (total Size of bank, (total
Group All deposits in m . of $) All deposits in mil. of $) All deposits in mil. of
izes _ ess than 100 100 & over sizes Less than 100 100 & over sizes Less than 100 100 & over
Number of issuing banks, Apr.. 28, 1967
Total
No change in rate, Jan. 31-Apr. 28
Banks raising rateNew maximum rate (per cent)
3.50 or less3.51-4.004.01-4.254.26-4.504.51-4.754.76-5.005.01-5.255.26-5.50
Banks reducing rateNew maximum rate (par cent)
3.50 or less3.51-4.004.01-4.254.26-4.504.51-4.754.76-5.005.01-5.25
Banks introducing new instruments 2/New maximum rate (per cent)
3.50 or less3.51-4.004.01-4.254.26-4.504.51-4.754.76-5.005.01-5.255.26-5.50
(1),714
0L0.0
90.3
3.7
0.1
1.30.22.1
4.6
1/0.50.42.51.2
1.4
0.20.40.10.31/0.4
(2)
5,345
100.0
90.8
3.9
0.2
1.20.22.2
3.8
1/0.50.42.10.8
1.5
0.20.40.10.41/0.4
(4)
1,775
(5)
1,414
(3)
369
Percc
100.0
81.6
1.9
0.3
1.0
16.2
1.67.67.0
0.3
0.3
19.4
0.82.80.45.00.97.40.31.7
23.5
1.13.40.55.91.19.10.32.1
(6)
361
number of banks
100.0
44.9
2.5
.ntage distribution of
100.0 100.0
55.2 57.9
4.8 5.3
0.2 0.10.1 0.10.1 0.10.6 0.50.5 0.51.4 1.70.2 0.31.8 2.0
20.6 13.3
0.2 0.20.7 0.61.8 1.05.5 3.53.2 1.97.8 5.21.4 0.8
(7)
5,803
i group
100.0
98.3
1.0
0.10.9
0.5
0.5
0.2
0.10.1
(8)
5,430
100.0
98.3
1.1
0.11.0
0.4
0.4
0.2
0.10.1
100.0
93.4
0.3
0.3
NOTE: Consumer-type time deposits are the following instruments issued in denominations of less than $100,000: savings certificates, savings bonds, othernonnegotiable and negotiable CD's and time deposits, open account. Business-type time deposits include the following instruments issued in denominations of$100,000 and over. Negotiable and nonnegotiable CD's and time deposits, open account.1/ Less than 0.05 per cent.2/ Between January 31 and April 28, 44 banks discontinued issuance of consumer-type deposits and 61 banks discontinued issuance of business-type deposits.
Since these banks had no offering rate on those instruments as of April 28, they are excluded from this table.
0.50.5
1.4
49.3
1.15.0
13.38.3
18.33.3
3.3
0.5
1.7
0.80.3
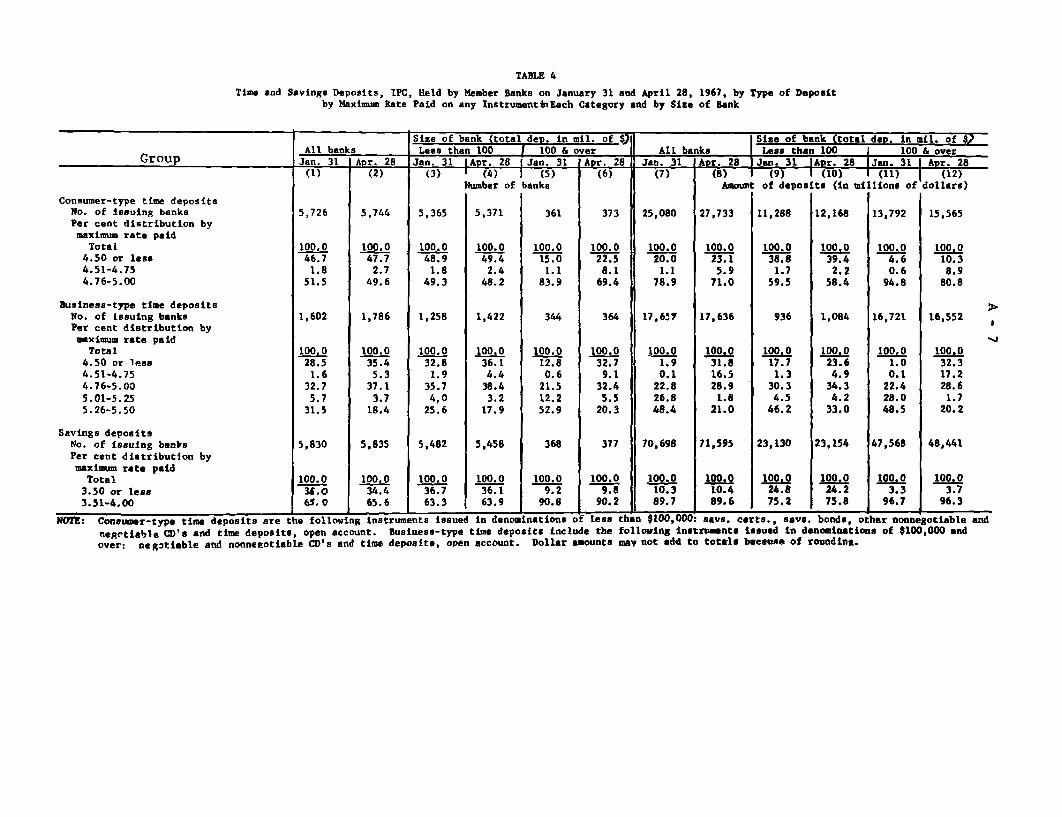
TABLE 4
Time and Savings Deposits, IPC, Held by Member Banks on January 31 and April 28, 1967, by Type of Depositby Maximum Rate Paid on any InstrumentI Each Category and by Size of Bank
Size of bank (total dep. in mil. of $)1 Size of bank (total dep. in mil. of $All banks Less than 100 1 100 & over All banks Less than 100 100 & over
Grou Jan. 31 1 Apr. 28 Jan. 31 Apr. 28 Jan. 31 Apr. 28 Jan. 31 Apr. 28 Jan. 31 lApr. 28 Jan. 31 Apr. 28
Consumer-type time depositsNo. of issuing banksPer cent distribution bymaximum rate paid
Total4.50 or less4.51-4.754.76-5.00
Business-type time depositsNo. of issuing banksPer cent distribution bymaximum rate paid
Total4.50 or less4.51-4.754.76-5.005.01-5.255.26-5.50
Savings depositsNo. of issuing banksPer cent distribution by
maximum rate paidTotal3.50 or less3.51-4.00
5,726
100.046.7
1.851.5
1,602
100.028.5
1.632.7
5.731.5
5,830
100.03S.065.0
5,744
100.047.7
2.749.6
1,786
100.035.4
5.337.1
3.718.4
5,835
100.034.465.6
5,365
100.048.9
1.849.3
1,258
100.032.8
1.935.74,0
25.6
5,482
100.036.763.3
(3) (4) 1 (5)Number of banks
5,371
100.049.4
2.448.2
1,422
100.036.14.4
38.43.2
17.9
5,458
100.036.163.9
361
100.015.01.1
83.9
344
100.012.8
0.621.512.252.9
368
100.09.2
90.8
373
100.022.5
8.169.4
364
100.032.7
9.132.4
5.520.3
377
100.09.8
90.2
25,080
100.020.01.1
78.9
17,657
100.01.90.1
22.826.848.4
70,698
100.010.389.7
(8) I (9) I (10) 1 (11) I (12)Amount of deposits (in millions of dollars)
I I I I
27,733
100.023.1
5.971.0
17,636
100.031.816.528.9
1.821.0
71,595
100.010.489.6
11,288
100.038.8
1.759.5
936
100.017.71.3
30.34.5
46.2
23,130
100.024.875.2
12,168
100.039.4
2.258.4
1,084
100.023.64.9
34.34.2
33.0
23,154
100.024.275.8
13,792
100.04.60.6
94.8
16,721
100.01.00.1
22.428.048.5
47,568
100.03.3
96.7
15,565
100.010.38.9
80.8
16,552
100.032.317.228.6
1.720.2
48,441
100.03.7
96.3£ £ A. 4. M - - . . 4
NOTE: Consumer-type time deposits are the following instruments issued in denominations of less
negotiable CD's and time deposits, open account. Business-type time deposits include the
over: negotiable and nonnegotiable CD's and time deposits, open account. Dollar amounts
than $10,00,0: says. certs., savs. bonds, other nonnegotiable andfollowing instruments issued in denominations of $100,000 andmay not add to totals beeasme of rounding.

B- 1
APPENDIX B: IMPORTANCE OF CERTAIN FACTORS IN RECENT ANDPROSPECTIVE VOLUME OF CORPORATE SECURITY ISSUES*
Two special and partly related factors that appear to havecontributed to the record volume of corporate financing in capitalmarkets this year have been (1) the bunching of flotations by verylarge companies, a number of whom have come to market for the firsttime in many years, and (2) numberous efforts to rebuild liquiditypositions which had declined persistently over a long period and insome industries had dropped precipitously. In assessing the underlyingstrength of corporate capital market demand in coming months, it isappropriate to ask whether there is still a significant number of largecompanies that appear to be long overdue for long-term financing andwhether rebuilding of liquidity still has a long way to go. The answerwould seem to be a qualified yes to both questions.
Capital market financing by very large companies
Out of a group of about 200 very large companies (comprisingthe 50 largest public utilities and all manufacturing, railroad, andother transportation companies with end-of-1966 assets of $500 millionor more), 71 are known to have undertaken or announced prospectivecapital market financing this year. They comprise (with some double-counting): 43 with public offerings or private placements in the firstquarter (vs. 30 in 1966); 21 with public offerings in the second quarter(vs. 22 in 1966); and 14 that, as of midyear, had announced prospectivepublic offerings. (Information on individual company private placements,it should be noted, is not yet available beyond the first quarter ofthis year.)
It may be more meaningful to base 1966-67 comparisons onfinancing by manufacturing companies only. The major public utilityand transportation companies come to the capital market frequently, andusually for only moderately large amounts each time. Most giant manu-facturers, on the other hand, come infrequently and, when they do, theirissues tend to be very large.
In each of the last 10 years, for example, at least 40 percent--and as many as 70 per cent--of the largest public utilities haveraised new capital through sale of long-term debt or equity securities,and all but 10 of these 50 largest utilities have come to market at
* Prepared by Eleanor J. Stockwell, Senior Economist, Capital MarketsSection, Division of Research and Statistics.

B - 2
least once in the last 2-1/2 years. Similarly, over the last decadethe proportion of large transportation companies raising funds in thecapital market has ranged between 50 and 80 per cent each year, and all
but 4 of the 24 largest companies have done so at least once since 1964.
But large manufacturers undertake capital market financingmuch less frequently. In 1958, and again in 1966, about 30 per centof the 123 largest companies raised new capital in the long-termsecurities markets; in each of the intervening years, when internallygenerated funds were large relative to investment outlays, the propor-tion ranged between 10 and 20 per cent. The peak years of 1958 and1966 have been about matched already this year, and the 1967 countincludes only private placements in the first quarter and publicofferings sold or scheduled by midyear.
Among the giant manufacturers that have sold issues for thefirst time in many years are 11 that did their first post-1958 financingin 1966 and another 9 that have either sold or scheduled offerings thusfar in 1967. But there are still 31 (or one-fourth of the group tallied)that have done no capital market financing since at least 1958. It isof course impossible to say how many of these 31 may currently be con-templating such financing or how many are likely to come to market inthe foreseeable future. The fact that 73 of these 123 companies haveobtained capital market funds quite recently, i.e., since 1964, suggeststhat the backlog of urgent demands, at least among giant concerns, maybe less than many had thought.
It should be noted, however, that the present tally did notcover manufacturers below the $500 million asset class, and hence didnot include all companies that may be not only in need of long-termfunds but also large enough to swell total capital market demands withissues of $50 million or more. Of the 28 public offerings of thissize by manufacturers in the first half of 1967, 8 were sold bycompanies with end-of-1966 assets of less than $500 million and rangingdown to $170 million.
Rebuilding corporate liquidity
Despite the substantial volume of corporate capital marketfinancing in the first quarter of this year, corporate liquiditydeclined about as much as in other recent years and reached another newlow. At the end of the first quarter, according to the latest availableSEC data, corporations held only $24.60 of cash, bank deposits and U. S.Government securities for each $100 of total current liabilities, com-pared with $34.10 three years earlier and $36.80 in the first quarterof 1962. If the definition of liquid assets is broadened to include"other" current assets (the item which, in the SEC series on corporateworking capital, includes such additional liquidity investments asfinance company paper), the story is about the same, as may be seenfrom Table 1.
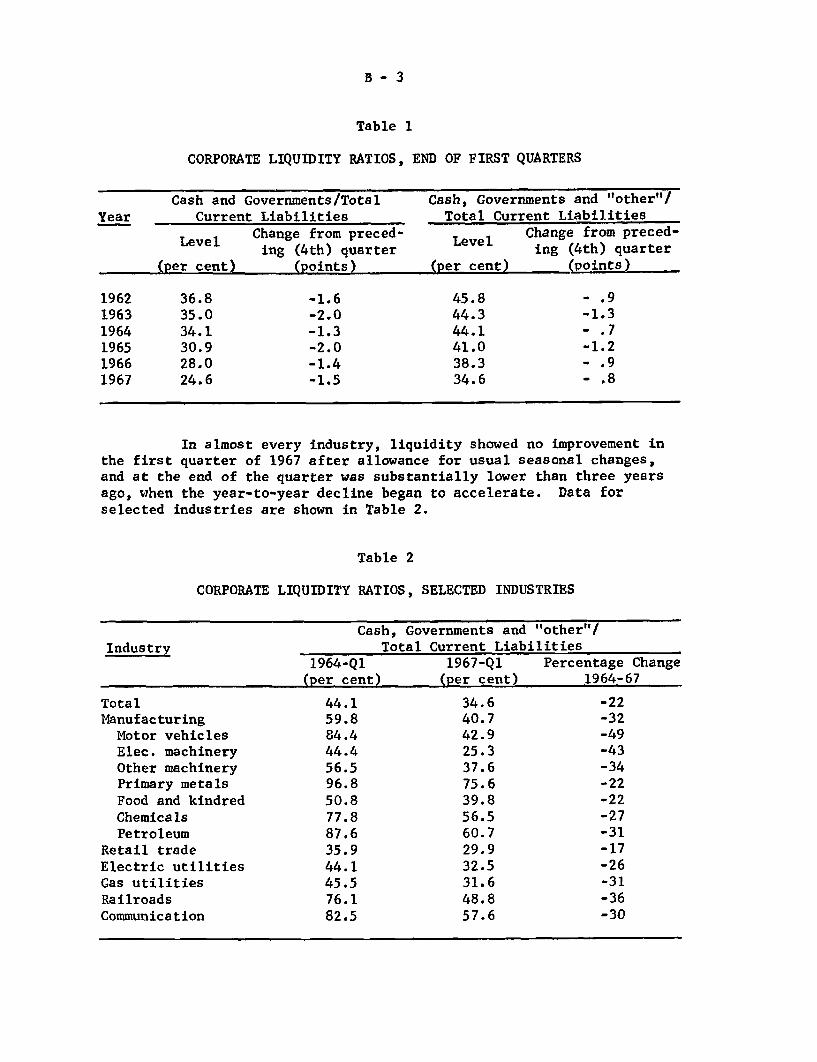
B- 3
Table 1
CORPORATE LIQUIDITY RATIOS, END OF FIRST QUARTERS
Cash and Governments/Total Cash, Governments and "other"/Year Current Liabilities Total Current Liabilities
Level Change from preced- Change from preced-
ing (4th) quarter ing (4th) quarter
(per cent) (points) (per cent) (points)
1962 36.8 -1.6 45.8 - .91963 35.0 -2.0 44.3 -1.31964 34.1 -1.3 44.1 - .7
1965 30.9 -2.0 41.0 -1.21966 28.0 -1.4 38.3 - .91967 24.6 -1.5 34.6 - .8
In almost every industry, liquidity showed no improvement inthe first quarter of 1967 after allowance for usual seasonal changes,and at the end of the quarter was substantially lower than three years
ago, when the year-to-year decline began to accelerate. Data forselected industries are shown in Table 2.
Table 2
CORPORATE LIQUIDITY RATIOS, SELECTED INDUSTRIES
Cash, Governments and "other"/Industry Total Current Liabilities
1964-Q1 1967-Q1 Percentage Change
(per cent) (per cent) 1964-67
Total 44.1 34.6 -22Manufacturing 59.8 40.7 -32
Motor vehicles 84.4 42.9 -49Elec. machinery 44.4 25.3 -43Other machinery 56.5 37.6 -34Primary metals 96.8 75.6 -22Food and kindred 50.8 39.8 -22Chemicals 77.8 56.5 -27Petroleum 87.6 60.7 -31
Retail trade 35.9 29.9 -17
Electric utilities 44.1 32.5 -26
Gas utilities 45.5 31.6 -31
Railroads 76.1 48.8 -36
Communication 82.5 57.6 -30

B - 4
Some observers have attributed the absence of liquidityimprovement in the first quarter to the fact that the bulk of thesecurity issues sold to provide funds to repay bank debt or otherwiserebuild liquidity were offered so late in the quarter that proceedswould not have been received by the corporation uptil after the closeof the quarter; further, they suggest, proceeds may have been usedinitially for other purposes, such as tax payments; or the bank loansrepaid in the first quarter may have been primarily term loans, onlythe current portion of which enters into the calculation of conventionalliquidity ratios. These kinds of explanations would lead one to expectthe liquidity improvement effect of the first quarter, and still largersecond quarter, capital market financing to show up later this year(though not necessarily in the second quarter, because of the largedrains on liquid assets then to meet tax payments).
It seems more likely, however, that it will not show up atall--in aggregate figures, over the relatively short-run future. Thepersistent decline in corporate liquidity over the past decade hasreflected relatively small additions to aggregate liquid asset holdingsin the face of much larger increases in aggregate corporate needs forday-to-day funds (measured here by total current liabilities). The de-cline could be halted--though not reversed-*with an annual growth inliquid assets about twice what is has averaged over the past five years.But massive amounts of new long-term funds would be required to reducedependence on short-term funds and/or accelerate the growth in liquidassets enough to return the all-corporate ratio to its level of evenone year ago. Table 3 illustrates the point.
Table 3
CHANGES IN CORPORATE LIQUIDITY
Changes from first quarter of preceding year:First In total current In liquid assets, In the
quarter liabilities including "other" liquidity ratio(Billions of dollars) (Billions of dollars) (points)
1963 +15 +4.5 -1.51964 +14 +5.6 - .21965 +17 +1.2 -3.11966 +24 +3.8 -2.71967 +20 -1.8 -3.7
1968-1
a +20 +7.2 0b +15 +14.8 +3.7c +20 +16.8 +3.7
1/ The examples a, b, and c show the growth in liquid assets (from Q11967 to QI 1968) which would need to accompany three hypotheticalpatterns of change in total current liabilities and in the liquidityratio. In a, total current liabilities grow by the same amount as overthe past year, and the liquidity ratio remains at the Ql 1967 level. Inb, liabilities grow more slowly (as new long-term funds are used to repaybank debt or otherwise reduce dependence on short-term funds), and theratio rises to the Q1 1966 level. Example c uses the liability hypothesisof a and the ratio hypothesis of b.

B - 5
Individual companies, of course, by undertaking majorlong-term financing, can rebuild their liquidity quickly, though itseems out of the question for corporations as a whole to do so. Ifsuccess in reversing, or at least slowing down, the prolonged declinein liquidity is attained selectively, it is not likely to affectaggregate statistics significantly, and one must look beyond the
aggregate statistics--perhaps to the financial statements of individualcorporations--for clues to the extent of satisfied vs. still unsatisfiedneeds for additional liquidity.
C- 1
APPENDIX C: INTERNATIONAL TRANSACTIONS IN SECURITIES
In the first half of this year there has been a larger flowof U.S. capital into foreign securities than in the same period of 1966.Last year the net outflow for the year was about $480 million, and $360million of that occurred in the first quarter, largely because the sale
of $150 million of new Canadian bonds originally scheduled for the end
of 1965 was delayed by agreement until early 1966. After the firstquarter, net outflows were comparatively small as the amount of new
foreign bond issues dropped, the Canadian Government made advance re-
purchaese of Canadian bonds outstanding in the U.S. (such repurchasestotaled $139 million for the year), and sizable liquidations by U.S.investors of their holdings of foreign equity securities were resumed.In the last three quarters of 1966, net purchases of foreign securitiesof all types averaged only about $40 million per quarter.
This year the amount of new issues sold through June wasprobably about $750 million, including an allowance of $50 million forextra sales of bonds of Israel. This was about as large as sales inthe first half of 1966, even though there was no carryover this year.The first half figure includes about $150 million of purchases of bondsof international institutions, which were approximately offset by in-vestments by those institutions in bonds of U.S. Government agencies.Redemptions have been lower, mainly because Canadian advance purchaseswere only $31 million -- which came at the end of June -- whereas theyamounted to $109 million in the first half of last year.
Transactions in foreign equity securities through May stillappear to reflect net liquidations by Americans, but at a rate of only
$25-30 million per quarter compared to $50 million per quarter in 1966.Although net transactions with Canada continue to show net sales byU.S. investors, data for Europe indicate that liquidations ceased inthe early months of this year.
Foreign transactions in U.S. securities other than Treasuryissues have been dominated since 1965 by purchases of debt obligationsof U.S. corporations specially organized to finance direct foreigninvestments (usually Delaware corporations), purchases of obligationsof U.S. Government Agencies by international organizations, and the
liquidation of the British Treasury portfolio of U.S. corporate stocks.Apart from these transactions, the principal regular feature of foreigndealings in U.S. securities has been a steady inflow from Canada topurchase U.S. stocks. These Canadian purchases amounted to $230 mil-
lion in 1966, and have continued this year, though on a somewhat reducedscale. Dealings by other countries in U.S. corporate stocks have been
irregular; there was a small net liquidation overall in 1966, but an
inflow of about $60 million this year through May. Transactions inU.S. corporate bonds, other than the special types mentioned above,resulted in a net sale by foreigners of about $50 million in 1966,
C - 2
mainly early in the year when purchases of bonds of the specialfinancing affiliates were large. In the first quarter this yearsuch transactions were minor, but in April and May it appears thatthere has again been some foreign selling of U.S. corporate bonds,
aside from U.K. dealings and bonds of the special financing af-filiates. Sales of bonds by those affiliates reached $422 millionin 1966 (excluding one large transaction of $178 million involvingexchange of U.S. corporate bonds for stock in a foreign corporation);so far this year sales already made or announced total nearly $300million.
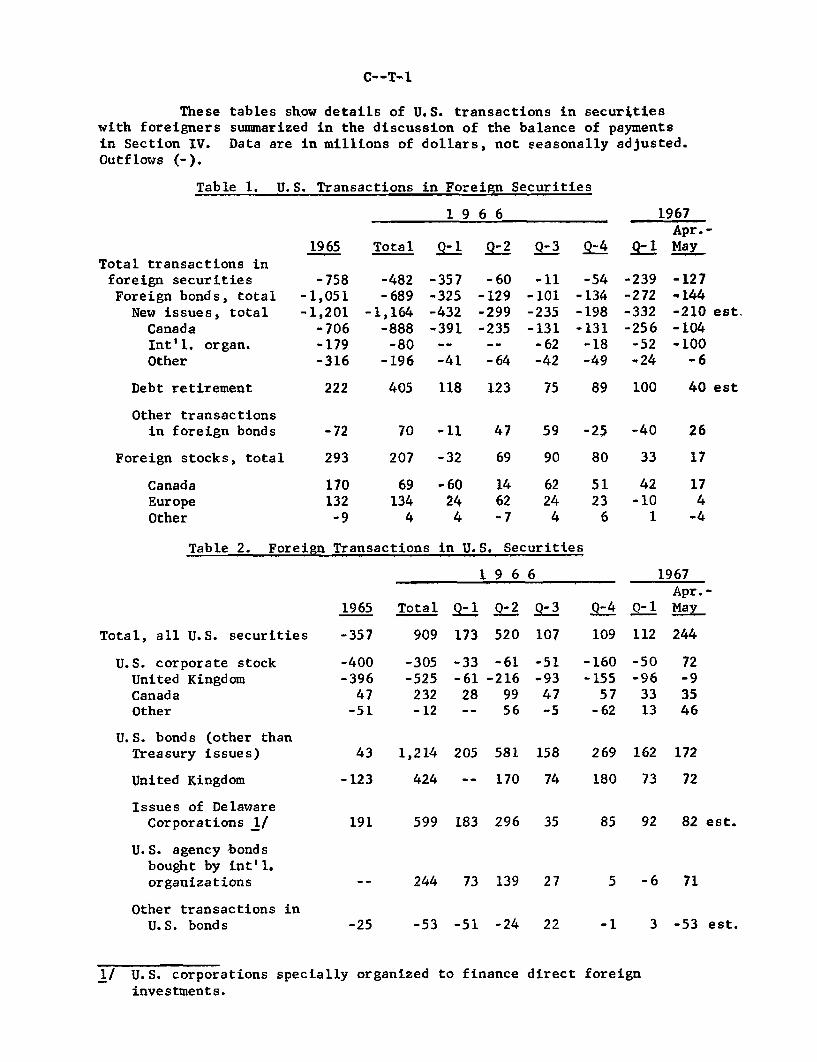
These tables show details of U.S. transactions in securitieswith foreigners summarized in the discussion of the balance of paymentsin Section IV.Outflows (-).
Data are in millions of dollars, not seasonally adjusted.
Table 1. U.S. Transactions in Foreign Securities
196 6 1967Apr.-
1965 Total Q-1 Q-2 Q-3 Q-4 Q-1 MayTotal transactions inforeign securitiesForeign bonds, total
New issues, totalCanadaInt'l. organ.Other
Debt retirement
Other transactionsin foreign bonds
Foreign stocks, total
-758-1,051-1,201
-706-179-316
222
-72
293
-482-689
-1,164-888
-80-196
-357-325-432-391
-41
-60-129-299-235
-64
-11-101-235-131-62-42
-54-134-198-131
-18-49
-239-272-332-256
-52-24
-127-144-210 est.-104-100
-6
405 118 123 75 89 100 40 est
70 -11 47 59 -25 -40 26
207 -32 69 90 80 33 17
69 -60 14134 24 62
4 4 -7
42 17-10 4
1 -4
Table 2. Foreign Transactions in U.S. Securities
1 9 6 6
1965 Total Q-2 Q-2
Total, all U.S. securities
U.S. corporate stockUnited KingdomCanadaOther
U.S. bonds (other thanTreasury issues)
United Kingdom
Issues of DelawareCorporations 1/
U.S. agency bondsbought by int'l.organizations
Other transactions inU.S. bonds
-357
-400-39647-51
909 173 520
-305-525
232-12
-33-6128
-61-216
9956
107
-51-9347-5
1967Apr.-
Q-4 0-1 May
109 112 244
-160-15557-62
-50-963313
43 1,214 205 581 158 269 162 172
-123
191
424 -- 170 74
599 183 296 35
180 73 72
85 92 82 est.
244 73 139 27 5 -6 71
-25 -53 -51 -24 22 -1 3 -53 est.
1/ U.S. corporations specially organized to financeinvestments.
direct foreign
CanadaEuropeOther
170132-9