Embed Size (px)
Citation preview

Prefatory Note The attached document represents the most complete and accurate version available based on original copies culled from the files of the FOMC Secretariat at the Board of Governors of the Federal Reserve System. This electronic document was created through a comprehensive digitization process which included identifying the best-preserved paper copies, scanning those copies,1
and then making the scanned versions text-searchable.2
Though a stringent quality assurance process was employed, some imperfections may remain. Please note that some material may have been redacted from this document if that material was received on a confidential basis. Redacted material is indicated by occasional gaps in the text or by gray boxes around non-text content. All redacted passages are exempt from disclosure under applicable provisions of the Freedom of Information Act. 1 In some cases, original copies needed to be photocopied before being scanned into electronic format. All scanned images were deskewed (to remove the effects of printer- and scanner-introduced tilting) and lightly cleaned (to remove dark spots caused by staple holes, hole punches, and other blemishes caused after initial printing). 2 A two-step process was used. An advanced optical character recognition computer program (OCR) first created electronic text from the document image. Where the OCR results were inconclusive, staff checked and corrected the text as necessary. Please note that the numbers and text in charts and tables were not reliably recognized by the OCR process and were not checked or corrected by staff.
Content last modified 6/05/2009.
CONFIDENTIAL (FR)
CURRENT ECONOMIC AND FINANCIAL CONDITIONS
By the StaffBoard of Governors
of the Federal Reserve SystemJune 2, 1971
TABLE OF CONTENTS
Page No.Section
SUMMARY AND OUTLOOK I
Nonfinancial . . . . . . . . . . . . . . . . . . . . - 1
Financial . . . . . . . . . . . . . . ...... - 3
Balance of payments . . . . . . . . . . . . . . ... - 7
THE ECONOMIC PICTURE IN DETAIL
Domestic Nonfinancial Scene II
Gross national product . . . . . . . . . . . . . - 1Industrial production . . . . . . . . . . . . . . - 8Retail sales . . . . . . . . . . . . . . . . . . . . - 9Unit auto sales and stocks . . . . . . . . . . . .. -10Consumer survey . . . . . . . . . . . . . . . . . . -11Construction and real estate . . . . . . . . . . . -13Manufacturers' orders and shipments . . . . . . . -16Inventories ... . . . . . . . . . . . .. . . . -18Cyclical indicators. .. . . . . . . . . . . .. . . -19Plant and equipment. . . . . . . . . . . . . . . .. . -21Labor market . . . . . . . . . . . . . . . .. . . . -24Collective bargaining. . . . .. . . . . . -27Wages . . . . . . . . . . . . . . . . . . . . . . . -29Consumer prices. . . . . . . . . . . . . . . . . . . -30Price index for GNP. . . . . . . . . . . . . . . . . -33Comparison of CPI with the PCE price index .. ... -35Sensitive materials. . . . . . . . . . . . . . . . . -36Foreign agricultural trade . . . . . . . . . . . . . -37
Domestic Financial Situation II
Monetary aggregates. . . . . . . . . . . . . . . .. - 1Bank credit . . . . . . . . . . . . . . . . . .. . . - 3Nonbank thrift institutions. . . . . . . . . . . ... - 5Mortgage market . . . . . . . . . .. . . . . . - 7Corporate and municipal securities market . . . . . -11Government securities market . . . . . . . . . . . . -17Other short-term credit market . . . . . . . . . .. -20Federal. . . . . . . . . . . . . . . . .. . . . . . -23
International Developments IV
U.S. balance of payments . . . . . . . . . . . . .. - 1U.S. foreign trade . . . . . . . . . . . . . . ... . 3Foreign exchange market . . . . . . . . . . . . . . - 6Euro-dollar market . . . . . . . . . ........ -13Some implications for industrial countries of
recent exchange rate developments. . . . . . . .. -16
I - 1
SUMMARY AND OUTLOOK
Nonfinancial
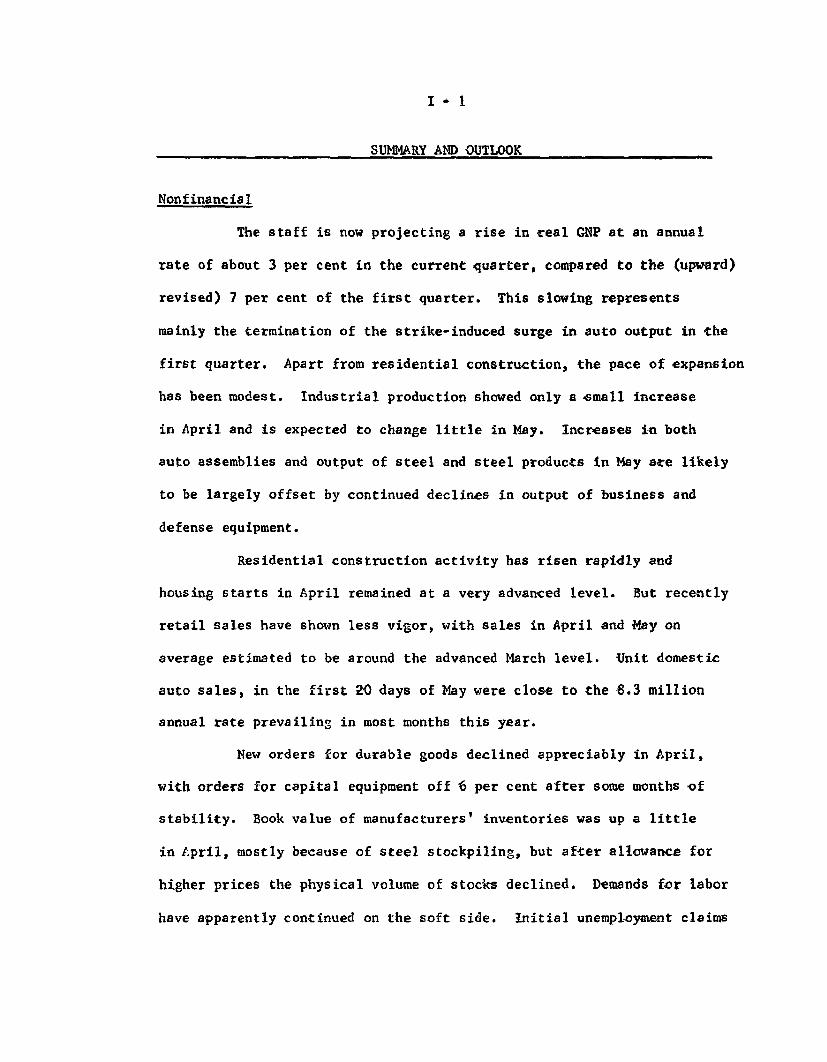
The staff is now projecting a rise in real GNP at an annual
rate of about 3 per cent in the current quarter, compared to the (upward)
revised) 7 per cent of the first quarter. This slowing represents
mainly the termination of the strike-induced surge in auto output in the
first quarter. Apart from residential construction, the pace of expansion
has been modest. Industrial production showed only a small increase
in April and is expected to change little in May. Increases in both
auto assemblies and output of steel and steel products in May are likely
to be largely offset by continued declines in output of business and
defense equipment.
Residential construction activity has risen rapidly and
housing starts in April remained at a very advanced level. But recently
retail sales have shown less vigor, with sales in April and May on
average estimated to be around the advanced March level. Unit domestic
auto sales, in the first 20 days of May were close to the 8.3 million
annual rate prevailing in most months this year.
New orders for durable goods declined appreciably in April,
with orders for capital equipment off 6 per cent after some months of
stability. Book value of manufacturers' inventories was up a little
in April, mostly because of steel stockpiling, but after allowance for
higher prices the physical volume of stocks declined. Demands for labor
have apparently continued on the soft side. Initial unemployment claims

I - 2
in May are estimated to have changed little while total insured unem-
ployment edged up further.
Consumer prices in April continued to rise at about the slower
pace prevailing this year. As in earlier months of 1971, much--but not
all--of the improved performance stemmed from a further decline in
mortgage interest rates, which are not included in the GNP deflator.
Outlook. The staff is projecting an increase of $19.5 billion
in current dollar GNP this quarter, about the same as in the last
Greenbook. We have raised our estimate of residential construction
activity on the basis of the continued strength of starts, and Federal
defense purchases are apparently declining much less in the current
quarter than had been anticipated. Increased estimates for these two
sectors are about offset by somewhat lower projections in several other
areas of final demand.
In the latter half of the year, growth in GNP is expected
to be somewhat slower than we had earlier projected. Real GNP never-
theless is expected to rise at a 3.7 per cent annual rate, moderately
more than in the current quarter. The rate of consumer spending is
expected to pick up, and the pattern of strengthened residential con-
struction is assumed to persist.
But business spending for fixed capital is now projected to
increase only minimally in the second half of the year, with some
decline in prospect in real terms. The May Commerce-SEC survey indi-
cates an increase of only 2.7 per cent in spending for plant and equip-
ment in 1971, compared with an increase of 4.3 per cent indicated in
I-3
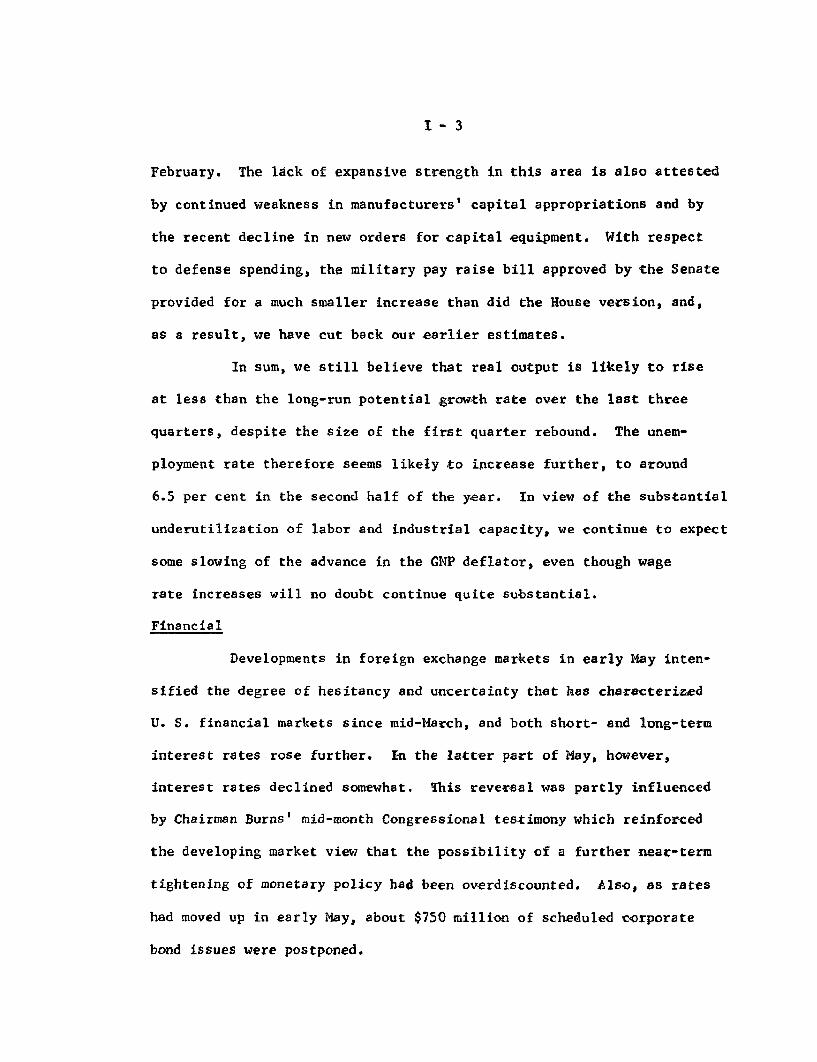
February. The lack of expansive strength in this area is also attested
by continued weakness in manufacturers' capital appropriations and by
the recent decline in new orders for capital equipment. With respect
to defense spending, the military pay raise bill approved by the Senate
provided for a much smaller increase than did the House version, and,
as a result, we have cut back our earlier estimates.
In sum, we still believe that real output is likely to rise
at less than the long-run potential growth rate over the last three
quarters, despite the size of the first quarter rebound. The unem-
ployment rate therefore seems likely to increase further, to around
6.5 per cent in the second half of the year. In view of the substantial
underutilization of labor and industrial capacity, we continue to expect
some slowing of the advance in the GNP deflator, even though wage
rate increases will no doubt continue quite substantial.
Financial
Developments in foreign exchange markets in early May inten-
sified the degree of hesitancy and uncertainty that has characterized
U. S. financial markets since mid-March, and both short- and long-term
interest rates rose further. In the latter part of May, however,
interest rates declined somewhat. This reversal was partly influenced
by Chairman Burns' mid-month Congressional testimony which reinforced
the developing market view that the possibility of a further near-term
tightening of monetary policy had been overdiscounted. Also, as rates
had moved up in early May, about $750 million of scheduled corporate
bond issues were postponed.

I-4
Business loans at commercial banks increased sharply last
month, although some of this rise reflected unusual seasonal patterns.
For April and May together, business loan growth was at a 9 per cent
annual rate, but since the first of the year--which may represent a
better averaging out of seasonal adjustment problems--such loans have
increased at about a 5 per cent annual rate. Loans to wholesalers and
retailers were particularly strong last month. Moreover, an increase
in commercial paper rates to a level that eliminated most, if not all,
of the rate advantage of that market vis-a-vis bank loans may have
contributed to the recent business loan strengthening.
The increase in interest rates in April and May created un-
certainties for mortgage bankers and others about their future ability
to place mortgages with permanent holders. As a result, market partici-
pants began to bid aggressively for the protection of forward purchase
commitments from FNMA, leading to a sharp increase in FNMA's commitment
yield. More generally, however, the supply of mortgage funds available
remained large as cash flows to depositary institutions continued un-
usually strong in April and apparently in May, and there were only
scattered reports of increases in mortgage rates in the primary market.
Outlook. A large volume of offerings in bond markets over the early
summer is likely and this should tend to limit the rally that began
in late May. Although much of the urgent, non-delayable capital re-
structuring of business firms is now reported to be over, underwriters
suggest that a sizable volume of desired corporate capital market
financing remains. Similarly, the volume of State and local borrowing

I - 5
demands shows little sign of abatement from its record pace.
After reducing security acquisitions in late April - early
May, commercial banks are reported to have begun acquiring tax-exempt
securities again in late May, but with shorter-maturities and in
significantly smaller volume than during the first quarter. The pace
of bank security purchases over coming weeks will, of course, be in-
fluenced by their interest rate expectations and business loan demands.
Business loan growth may be a little stronger than the average pace
since the first of the year, given continued economic recovery and the
high level of market rates relative to the prime rate. Under such cir-
cumstances, the basis could be laid for another increase in the prime
rate.
Barring a dramatic rise in short-term interest rates, consumer-
type time and savings deposit inflows at commercial banks are not expected
to moderate significantly further into early summer. But inflows to
the thrift institutions--which have remained unusually large thus far--
are likely to begin to be influenced by the higher level of market
yields. In addition, the $1.4 billion AT&T convertible preferred
stock rights offering could result in some deposit withdrawals in late
June and early July.
Even after allowing for competition from market instruments
inflows--including repayment flows--to the nonbank thrift institutions
are still expected to remain large by historical standards. With S&L's
no longer repaying maturing term FHLB advances or building liquidity,
their flows available for mortgage takedowns are likely to be virtually

I - 6
unchanged this summer from the pace of the first five months of 1971.
Thus, there are strong countervailing pressures to keep interest rates
in the primary market for conventional mortgages from rising during the
early summer months.
On the other hand, yields offered in the more sensitive
secondary mortgage market for government underwritten mortgages, as
reflected in the FNMA auction, may remain under upward pressure.
Developers, mortgage bankers, and others are likely to continue bidding
aggressively for FNMA purchase commitments in order to protect themselves
against the risk of rising rates and the possibility of future difficulty
of placing mortgages. And with discounts in the FHA-VA mortgage market
already near 8 points, HUD may be forced to raise--possibly by one-
half of a percentage point--the 7 per cent ceiling on government under-
written mortgages.

I - 7
Balance of payments
After the withdrawal of the Bundesbank from the foreign exchange
market early in May, the weekly U. S. balance of payments deficits were
far smaller than before, but still uncomfortably large. There was no
possibility of a net private capital inflow or outflow in Germany or the
Netherlands (unless balanced by current transactions) so long as the
central banks of these two countries refrained from intervening in the
foreign exchange markets. The relatively small market premiums for the
DM and guilder over their par exchange rates seem to have indicated that
further purchases by some hedgers and speculators were largely matched
by profit-taking sales by others aware of the risks of a return to the
old parity as well as risks of a revaluation to a higher parity.
Today's announcement by the Bundesbank that it was prepared to buy
marks (sell dollars) at yesterday's closing rate was followed initially
by a rise in the rate. (Apparently the Bundesbank hopes to sell dollars
to offset the domestic money market effects of its deliveries of marks
on forward contracts made three months ago.)
In the two weeks through May 12 the U. S. official settlements
deficit was $5.1 billion; in the next two weeks (through May 26) it
was $.6 billion. In addition to the unfavorable U. S. balance on current
and long-term capital transactions, the figure for the later two-week
period would reflect movements of funds from the United States attracted
by relatively high Eurodollar interest rates and any movements into
Japanese yen. There were some withdrawals of funds from the Swiss franc,
which was revalued by 7 per cent.

I - 8
While short-term capital flows have probably been continuing in
recent weeks, the current and long-term capital accounts combined are
undoubtedly still heavily in dificit. Merchandise imports rose sharply
in April while exports fell; the trade balance for the month was a $300
million excess of imports, compared with a $100 million average export
surplus in the first quarter. For the second quarter as a whole we are
projecting a zero trade balance and a goods and services net export
balance of about $2-1/2 billion, annual rate.
An interagency group has recently completed new projections of
the U.S. balance of payments on into next year without, however,
attempting to include the effects of recent or possible future changes in
exchange rates. For the twelve months beginning July the over-all
deficit before taking account of changes in U.S. banks' liabilities
to commercial banks abroad (including branches) was projected at about
$4 billion (on an assumption of "normal" errors and omissions of $1
billion). A tendency toward further worsening of the trade balance
would be expected as GNP rises more rapidly, but there should be improve-
ments in net investment income and in some types of capital transactions.

June 1, 1971
I -- T -
SELECTED DOMESTIC NONFINANCIAL DATA
(Seasonally adjusted)
Per Cent Change* From1971 1 mo. 3 mos. Year
Jan. Feb. March April ago ago ago
Civilian labor force (mil.) 83.9 83.4 83.5 83.8 0.4 -0.1 1.2
Unemployment rate (%) 6.0 5.8 6.0 6.1 -- -- 4.7 4/Insured unempl. rate (%) 3.7 3.8 3.9 4.0 -- -- 3.1 4/
Nonfarm employment, payroll (mil.) 70.7 70.6 70.7 70.7 0.1 0.1 -0.6Manufacturing 18.8 18.7 18.7 18.6 -0.2 -0.9 -5.8Nonmanufacturing 51.8 51.9 52.0 52.1 0.2 0.4 1.4
Industrial production (57-59=100) 165.6 165.2 165.5 166.0 0.3 0.2 -2.5
Final products, total 163.4 163.0 163.4 163.1 -0.2 -0.2 -3.2
Consumer goods 164.5 164.6 166.2 166.7 0.3 1.3 2.1Business equipment 174.3 173.0 170.5 169.8 -0.4 -2.6 -12.0
Materials 168.0 167.8 168.0 169.1 0.7 0.7 -1.64/
Capacity util. rate, mfg. 73.3 72.8 72.9 72.8 -- -- 78.9 4/
Wholesale prices (1967=100)1/ 111.8 112.8 113.0 113.3 0.3 1.3 3.1
Industrial commodities (FR) 112.0 112.3 112.6 113.1 0.4 1.0 3.7Sensitive materials (FR) 108.8 109.9 111.1 113.1 1.8 4.0 -1.8
Farm products, foods & feeds 110.7 113.6 113.4 113.3 -0.1 2.3 1.3
Consumer prices (1967=100)1/ 119.2 119.4 119.8 120.2 0.3 0.8 4.3
Food 115.5 115.9 117.0 117.8 0.7 2.0 2.8Commodities except food 115.2 115.2 115.5 115.8 0.3 0.5 3.9
Services 126.3 126.6 126.6 126.8 0.2 0.4 5.6
Hourly earnings, pvt. nonfarm ($) 3.34 3.35 3.38 3.40 0.6 1.8 6.6
Hourly earnings, mfg. ($) 3.49 3.50 3.52 3.54 0.6 1.4 6.6
Weekly earnings, mfg. ($) 139.30 139.69 140.02 140.67 0.5 1.0 6.1
Net spend, weekly earnings, mfg.
(3 dependents 1967 $) 1/ 101.13 100.76 101.39 101.11 -0.3 0.0 1.8
Personal income ($ bil.) 2/ 827.4 830.4 836.8 841.3 0.5 1.7 4.4
Retail sales, total ($ bil.) 31.2 31.6 32.2 32.3 0.5 3.8 5.9
Autos (million units) 2/ 8.3 8.3 8.6 8.3 -4.0 -0.2 6.6
GAAF ($ bil.) 3/ 8.6 8.8 8.9 8.9 0.0 4.0 5.4
12 leaders, composite (1967=100) 118.5 119.9 122.4 124.1 1.4 4.7 8.0
Selected leading indicators:
Housing starts, pvt. (thous.) 2/ 1,725 1,754 1,950 1,903 -2.4 10.3 55.5
Factory workweek (hours) 39.8 39.5 39.9 39.8 -0.35 0.05 -0.5
Unempl. claims, initial (thous.) 283 284 297 283 4.7- 0.2- 13.3-'
New orders, dur. goods, ($ bil.) 31.4 31.9 31.8 30.6 -3.7 -2.6 7.5
Capital equipment 8.8 8.8 8.9 8.4 -5.6 -4.5 4.7
Common stock prices (41-43=10) 93.49 97.11 99.60 103.04 3.5 10.2 19.9
* Based on unrounded data. 1/ Not seasonally adjusted. 2/ Annual rates.3/ Gen'l. merchandise, apparel, and furniture and appliances. 4/ Actual figures.5/ Sign reversed.

I -- T - 2
SELECTED DOMESTIC FINANCIAL DATA
1970Averages
Interest rates, per cent
Federal funds3-mo. Treasury bills3-mo. Federal agencies3-mo. Euro-dollars3-mo. finance co. paper4-6 mo. commercial paper
Bond buyer municipalsAaa corporate-new issues20-year Treasury bondsFHA mortgages, 30-year
Change in monetary aggregates(SAAR, per cent)
Total reservesNonborrowed reservesCredit proxyCredit proxy + nondep. fundsMoney supplyTime and savings depositsDeposits at S&L's and MSB'sBank credit, end-of-month 1/
Treasury securitiesOther securitiesTotal loans 1/
Business 1/
Change in commercial paper($ millions)
Total (SA)Bank-related (NSA)
New security issues(NSA, $ millions)
Total corp. issuesPublic offerings
State and local governmentbond offerings
Fed. sponsored agency debt(change)
Fed. govt. debt (change)
1971
QIII QIV QI March April
6.716.336.678.347.427.85
6.338.516.969.06
5.575.355.507.466.126.28
5.928.266.578.76
3.863.763.785.504.484.57
5.257.335.98
1970
QIII QIV
19.124.424.117.2
6.132.2
9.313.925.920.3
9.8
6.69.4
15.18.33.4
21.811.66.12.8
34.5-1.0-9.2
3.713.383.455.114.054.19
5.177.465.947.32
11.011.017.010.9
8.927.323.313.822.130.4
7.32.5
1970QIII QIV
-4,232-2,985
1969April
-760
-2,269
H2
-2,581-657
4.153.864.005.924.274.57
5.377.576.007.37
1971March
9.28.8
14. 98.9
11.625.924.910.832.230.7
-11.7
1971March
1971Week ended
May 26
4.684.404.686.864.935.25
5.968.236.32n.a.
April
2.79.7
12.25.39.8
10.721.7-0.5
-25.522.2-2.4
1.1
-1,620-209
1970 1971QI April QI April
2,748 18,445 7,977 3,170 12,190 3,910 e2,098 15,900 6,715 2,723 10,675 3,40 e
1,801 7,837 4,109 1,647
841 3,057 3,635-2,456 16,257 1,981
627-4,691
6,642 1,888 e
-1,031 37 e1,575 -221
n.a. - Not available. e - Estimated.SAAR - Seasonally adjusted annual rate.1/ Adjusted for loans sold to bank affiliates.
p - Preliminary.
NSA - Not seasonally adjusted.

I -- T- 3U.S. Balance of Payments
In millions of dollars; seasonally adjusted
1970 1 9 7 0 p/Year I JAN.* FEB.* MAR.* APR.*
Goods and services, net 1/ 3,672Trade balance 2/ 2,185 290 -20 95 215 -290Exports 2/ 42,041 11,040 3,655- 3,630 3,755 3,450Imports 2/ -39,856 -10,750 -3,675 -3,535 -3,540 -3,740
Service balance 1,487
Remittances and pensions -1,387Govt. grants & capital, net -3,235
U.S. private capital -6,351Direct investment -3,967Foreign securities -878 -375 -313 -34 -56 -130Banking claims -883 111 529 -102 -171 -64Other -623
Foreign capital 5.232Official foreign, liquid 7,613 5,048 427 1,787 2,543 2,445Official reserve holders, nonliq. -271 -224 -60 -73 -83 -92Other official foreign, nonliq. -437Foreign commercial banks, liquid -6,511 -2,987 -173 -1,426 -1,208New direct investment issues 3/ 840 373U.S. corporate stocks 702 62 130 -35 -26 11Other 3,297
U.S. monetary reserves (inc.-) 3,344 862 505 165 192 35Gold stock 787 109 32 1 76 38Special drawing rights 4/ 16 125 100 -- 25IMF gold tranche 389 255 235 -- 20 -2Convertible currencies 2,152 373 138 164 71 -1
Errors and omissions -1,274
BALANCES (deficit -) 4/Official settlements, S.A. -5,686
" " , N.S.A. -10,686 -5,401 -872 -1,879 -2,652 -2,388Liquidity, S.A. -3,258
SN.S.A. -4,715 -3,147 -1,021 -512 -1,614 -2,219Adjusted over-all, S.A. -2,699
i , N.S.A. -4,175 -2,594 -699 -453 -1,444Financed by: 5/
Liab. to comm. banks -6,511 -2,807 -173 -1,426 -1,208Official settlements 10,686 5,401 872 1,879 2,652
* Only exports and imports are seasonally adjusted.1/ Equals "net exports" in the GNP, except for latest revisions.2/ Balance of payments basis which differs a little from Census basis.3/ New issues sold abroad by U.S. direct investors.4/ Excludes allocations of SDRs; $867 million on Jan. 1, 1970, and $717 million
on Jan. 1, 1971.5/ Minus sign indicates decrease in net liabilities. Data not seasonally adjusted.
II - 1
THE ECONOMIC PICTURE IN DETAIL
Domestic Nonfinancial Scene
Gross national product. Although first quarter GNP estimates
were revised upward by OBE and now show an increase of $30.8 billion,
the overall outlook has not changed significantly since the preceding
Greenbook. We are still projecting a quite moderate gain in output
for the remainder of 1971. Several sectors now appear to show less
potential strength than we had anticipated--domestic-type auto sales
have been disappointing, there are indications of an even smaller
increase in capital investment later this year, and somewhat less
stimulus from a military pay raise is now in prospect for the second
half. On the other hand, residential construction activity has been
stronger than expected, and we are projecting a significantly higher
level of housing activity by year-end than we had earlier. Our GNP
projection for the year as a whole is now about $1,051 billion, a bit
higher than a month ago, reflecting primarily the upward revision of
the first quarter figures.

II - 2
GNP AND RELATED ITEMS, 1971(Changes in seasonally adjusted totals at annual rates)
First Quarter Second Quarter
Prel. OBE OBE Proj. of
Estimate Revised 4/28/71 Current
---------Billions of dollars----------
GNP 28.5 30.8 19.0 19.5Final sales 29.7 33.0 16.4 16.4
Personal consumption 17.7 19.4 12.3 11.6
Residential construction 3.2 3.6 1.8 2.4
Business fixed investment 3.8 3.8 1.0 .9
Net exports .2 .7 - .3 - .8Federal purchases - .1 .2 -2.1 - .7State & local purchases 4.9 5.2 3.7 3.1
Inventory change -1.2 -2.2 2.6 3.1
---------- Per Cent Per Year-----------
Real GNP 6.5 7.1 3.1 2.9GNP deflator 5.2 1/ 5.6 2/ 4.3 4.7
1/ Excluding effects of Federal pay increase, 4.2 per cent.
2/ Excluding effects of Federal pay increase, 4.6 per cent.
The first quarter GNP revision increased personal consumption
expenditures by about $1-3/4 billion, and some smaller upward adjustments
were made in residential construction, net exports, and government purchases.
On the other hand, estimated inventory change was revised down and the
rate of accumulation is now placed at only $1.4 billion for the quarter.
Apart from post-strike restocking of autos and accumulation of steel in
anticipation of a possible strike, inventories were actually reduced in
the first quarter. The price advance was somewhat more rapid than
indicated earlier and the rise in the GNP deflator is now estimated at

II - 3
5.6 per cent, annual rate. The fixed weight price index for private
GNP, which excludes the impact of compositional shifts and the Federal
pay raise, was also revised upward, and now shows a 5.2 per cent annual
increase--about unchanged from the previous quarter.
We continue to project a much smaller rise in GNP in the
second quarter than in the first--$19-1/2 billion, $1/2 billion more
than estimated last month. The upward revision reflects stronger
residential construction activity. Housing starts are now expected
to increase by 140,000 (annual rate) from the advanced first quarter
rate to a 1.95 million annual rate this quarter, suggesting a larger
gain in residential expenditures than we had formerly projected. A
slightly larger pickup in inventory investment also now seems probable
following attainment of improved inventory-sales positions in the
first quarter and in anticipation of the possible steel strike.
Most other sectors of demand are showing little ebullience.
Personal consumption expenditures are projected to rise slightly less
than was formerly estimated, primarily because of the less-than-expected
rise in domestic-type auto sales during April and the first 20 days of
May. There are also indications of a slower rise in State and local
government construction expenditures. However, Federal defense purchases
are projected to dip slightly less than projected last month. Real
growth in the second quarter, at 2.9 per cent, annual rate, is now
projected to be fractionally lower than we had indicated last month,
with a more rapid increase in the deflator.

II - 4
The outlook for the second half of the year still suggests a
moderate strengthening of the economy, although by somewhat less than
we had projected in the last Greenbook. We continue to assume a steel
strike of about 60 days duration beginning August 1. Inventory
accumulation should drop sharply as a result of a runoff of steel stocks
in the third quarter, but rebound in the fourth.
GNP AND RELATED ITEMS, 1971(Changes in seasonally adjusted totals at annual rates)
Third Quarter Fourth QuarterProj. of Proj. of4/28/71 Current 4/28/71 Current
---------Billions of dollars------------
GNP 19.0 18.5 26.0 24.5Final sales 23.0 22.0 21.0 19.0
Personal consumption 13.4 13.0 12.9 13.0Residential construction .8 1.4 .7 1.3Business fixed investment 1.0 .5 1.5 .5Net exports .0 .0 .0 .0Federal purchases 3.6 2.9 1.7 .0State & local purchases 4.2 4.2 4.2 4.2
Inventory change -4.0 -3.5 5.0 5.5
------------Per Cent Per Year-------------Real GNP 2.4 2.1 6.0 5.3GNP deflator 4.9 1/ 4.9 2/ 3.8 3.9
1/ Excluding effects of Federal pay increase, 4.0 per cent.2/ Excluding effects of Federal pay increase, 4.25 per cent.
For the third quarter, we are projecting a GNP increase of
$18-1/2 billion, about the same as last month. Recent survey results
suggest an even more modest growth in capital spending than we had
been projecting for the second half. We continue to anticipate a pay

II - 5
raise for the military, but recent Senate action suggests that the
amount will be smaller than we had expected. We are now assuming a
compromise between the House and Senate versions of the pay bill, with
outlays totaling about $1-3/4 billion, $.6 billion less than projected
last month.
On the other hand, in view of the recent strength in housing
starts and the continued heavy inflows of funds to savings institutions
we have raised starts in the third quarter to 2.05 million units,
annual rate, 100,000 above the upward revised second quarter rate; the
increase in residential construction expenditures for the third quarter
has also been raised by $0.6 billion.
We still expect a fairly vigorous post-strike rebound of
activity in the fourth quarter, reflecting largely some resurgence
of inventory investment and continued expansion in residential construction.
However, the GNP increase has been trimmed by $1-1/2 billion, to $24.5
billion. A smaller gain is now expected in business fixed investment,
in line with the latest Commerce-SEC survey, and recent estimates indicate
a somewhat sharper decline in defense outlays than previously projected.
For the second half of 1971 real GNP growth is now projected
to average 3.7 per cent, annual rate--somewhat less than expected in the
Greenbook a month ago. We are now projecting the GNP deflator to slow
to a 3.9 per cent rate of increase in the fourth quarter. With growth
in real output averaging below potential through the last three quarters
and assuming a return of labor force growth to somewhat nearer "normal",
we anticipate a continued edging up of unemployment to about a 6-1/2
per cent rate.

II - 6
CONFIDENTIAL - FR June 2, 1971
GROSS NATIONAL PRODUCT AND RELATED ITEMS
(Quarterly figures are seasonally adjusted. Expenditures and income
figures are billions of dollars, with quarter figures at annual rates.)
1970 19711970 1971 Projection
Proj. III IV I II III IV
Gross National ProductFinal purchases
PrivateExcluding net exports
Personal consumption expendituresDurable goodsNondurable goodsServices
Gross private domestic investmentResidential constructionBusiness fixed investmentChange in business inventories
Nonfarm
Net exports of goods and services
Gov't. purchases of goods & servicesFederal
DefenseOther
State & local
Gross national product inconstant (1958) dollars
GNP implicit deflator (1958 = 100)
Personal incomeWage and salary disbursements
Disposable incomePersonal saving
Saving rate (per cent)
Corporate profits before taxCorp. cash flow, net of div. (domestic)
Federal government receipts andexpenditures (N.I.A. basis)
ReceiptsExpendituresSurplus or deficit (-)
976.5973.1752.6749.0
616.789.4
264.7262.6
135.729.7
102.63.52.9
1050.71047.3812.3809.6
664.999.8
280.5284.6
148.138.6
106.13.43.3
985.5980.0759.0754.8
622.191.2
265.8265.1
138.329.2
103.65.55.0
989.9986.3763.1760.5
627.085.3
271.5270.2
137.132.2
101.33.63.0
3.6 2.7 4.2 2.6
220.599.776.623.1
120.9
235.099.373.425.9
135.7
221.098.675.822.9
122.4
223.298.274.623.5
125.0
1020.71019.3790.6787.3
646.497.5
272.8276.1
142.435.8
105.11.41.2
1040.21035.7804.7802.2
658.098.5
278.0281.5
148.738.2
106.04.54.5
1058.71057.7819.6817.1
671.0100.5283.0287.5
147.139.6
106.51.01.0
1083.21076.7834.4831.9
684.0102.5288.0293.5
154.440.9
107.06.56.5
3.3 2.5 2.5 2.5
228.798.474.024.5
130.2
231.097.773.024.7
133.3
238.1100.673.926.7
137.5
242.3100.6
72.927.7
141.7
724.1 741.1 727.4 720.3 732.7 738.0 742.0 751.134.9 141.8 135.5 137.4 139.3 140.9 142.7 144.1
801.0540.1684.8
50.27.3
857.4576.5734.9
50.76.9
807.2543.8693.0
52.77.6
813.3545.2697.251.8
7.4
831.5560.6715.1
49.87.0
851.2570.2731.554.3
7.4
864.2580.9740.7
50.16.8
882.6594.4752.448.76.5
81.3 90.5 84.4 76.3 86.4p 89.5 91.0 95.069.9 77.2 70.7 67.7 74.1p 76.3 77.9 80.6
194.8206.3-11.5
208.5223.5-15.0
194.9206.7-11.8
191.7209.9-18.1
200.8p214.2-13.3p
205.3222.8-17.5
209.8227.3-17.5
217.9229.9-12.0
High employment suprlus or deficit (-) -0.8
Total labor force (millions) 85.9Armed forces " 3.2
Civilian labor force " 82.7Unemployment rate (per cent) 4.9
Nonfarm payroll employment (millions) 70.7Manufacturing 19.4
Industrial production (1957-59=100) 168.2Capacity utilization, manufacturing
(per cent) 76.6
0.3 -1.7 1.3 1.3 -1.8 -1.0 2.6
87.0 86.0 86.5 86.5 66.8 87.1 87.52.8 3.1 3.0 3.0 2.9 2.8 2.784.2 82.8 83.5 83.6 84.0 84.3 84.8
6.2 5.2 5.9 5.9 6.2 6.4 6.4
70.9 70.5 70.2 70.6 70.8 70.9 71.118.7 19.3 18.7 18.7 18.7 18.6 18.9
167.3
72.8
167.9
76.2
162.7
72.4
165.4
73.1
166.5 167.2 170.0
72.8 72.3 72.8
Housing starts, private (millions A.R.)Sales new domestic autos (millions,
A. R.)
1.43 1.97 1.51 1.78
7.12 8.42 7.58 5.44
1.81 1.95 2.05 2.08
8.39 8.40 8.40 8.50
NOTE: Projectlon of related items such as employment and industrial production index are based on projectionof deflated GNP. Federal budget high employment surplus or deficit (N.I.A. basis) are staff estimatesand projections by method suggested by Okun and Teeters.
II - 7
CONFIDENTIAL - FR June 2, 1971
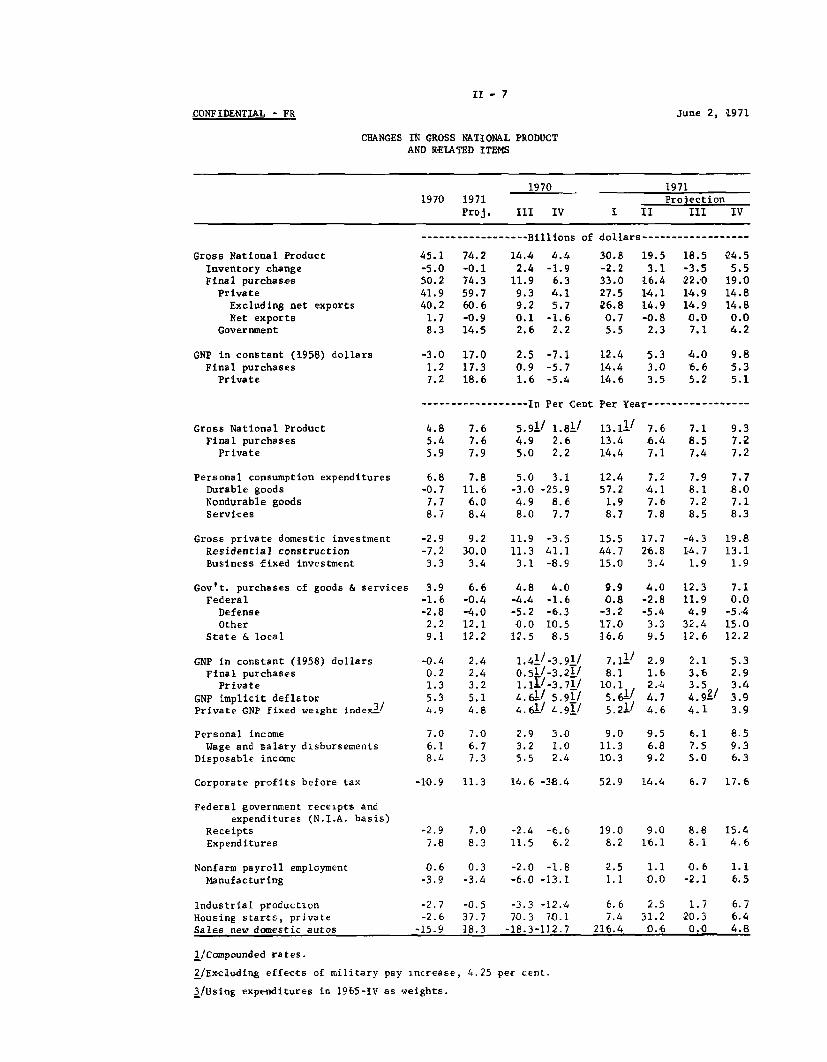
CHANGES IN GROSS NATIONAL PRODUCTAND RELATED ITEMS
1970 19711970 1971 Projection
Proj. III IV I II III IV
------------------ Billions of dollars------------------
Gross National ProductInventory changeFinal purchases
PrivateExcluding net exportsNet exports
Government
GNP in constant (1958) dollarsFinal purchases
Private
45.1-5.050.241.940.2
1.78.3
74.2-0.174.359.760.6-0.914.5
14.42.4
11.99.39.20.12.6
4.4-1.9
6.34.15.7
-1.62.2
19.53.1
16.414.114.9-0.8
2.3
18.5-3.522.014.914.90.07.1
24.55.5
19.014.814.80.04.2
-3.0 17.0 2.5 -7.1 12.4 5.3 4.0 9.81.2 17.3 0.9 -5.7 14.4 3.0 6.6 5.37.2 18.6 1.6 -5.4 14.6 3.5 5.2 5.1
-.------- ----- In Per Cent Per Year ----------------
Gross National Product
Final purchasesPrivate
Personal consumption expendituresDurable goodsNondurable goodsServices
Gross private domestic investmentResidential constructionBusiness fixed investment
Gov't. purchases of goods & servicesFederal
DefenseOther
State & local
GNP in constant (1958) dollarsFinal purchases
PrivateGNP implicit deflatorPrivate GNP fixed weight index
/
Personal incomeWage and salary disbursements
Disposable income
Corporate profits before tax
Federal government receipts andexpenditures (N.I.A. basis)
ReceiptsExpenditures
Nonfarm payroll employmentManufacturing
7.6 5.91/7.6 4.97.9 5.0
7.811.66.08.4
1.81/2.62.2
3.1-25.9
8.67.7
13.1113.414.4
12.457.21.98.7
7.1 9.38.5 7.27.4 7.2
-2.9 9.2 11.9 -3.5 15.5 17.7 -4.3 19.8-7.2 30.0 11.3 41.1 44.7 26.8 14.7 13.13.3 3.4 3.1 -8.9 15.0 3.4 1.9 1.9
6.6-0.4-4.012.112.2
2.42.43.25.14.8
4.8 4.0-4.4 -1.6-5.2 -6.30.0 10.5
L2.5 8.5
1.41/-3.91/0.51/-3.21/1.1i/-3.71/4.61/ 5.91/4.61/ 4.91/
7.0 2.96.7 3.27.3 5.5
9.90.8
-3.217.016.6
7.11/8.1
10.15.61'5.21/
4.0-2.8-5.4
3.39.5
2.91.62.44.74.6
12.311.94.9
32.412.6
2.13.63.54.9/4.1
7.10.0-5.415.012.2
5.32.93.43.93.9
9.0 9.5 6.1 8.511.3 6.8 7.5 9.310.3 9.2 5.0 6.3
-10.9 11.3 14.6 -38.4 52.9 14.4 6.7 17.6
-2.9 7.0 -2.4 -6.6 19.0 9.0 8.8 15.47.8 8.3 11.5 6.2 8.2 16.1 8.1 4.6
0.6 0.3 -2.0 -1.8 2.5 1.1 0.6 1.1-3.9 -3.4 -6.0 -13.1 1.1 0.0 -2.1 6.5
Industrial productionHousing starts, privateSales new domestic autos
-2.7-2.6
-15.9
-0.5 -3.3 -12.437.7 70.3 70.118.3 -18.3-112.7
6.67.4
216.4
2.5 1.7 6.731.2 20.3 6.40.6 0.0 4.8
1/Compounded rates.
2/Excluding effects of military pay increase,
3/Using expenditures in 1965-IV as weights.
4.25 per cent.

II - 8
Industrial production. Available output data for May are
quite limited, but suggest the possibility of another month of small
change in industrial production. If output of business and defense
equipment declined about as much in May as in April, the rise in autos
and steel, and, probably, in consumer staples would be more than off-
setting, but not by much. If so, a larger increase in industrial
production in May than in March and April would require a rise in
production of consumer durable goods other than autos and in such
materials as textiles, chemicals, and construction materials other
than steel mill products.
Auto assemblies in May are estimated to have been at an
annual rate of about 8.5 million units, up 5 per cent from April and
not quite equivalent to a .2 of one point increase in the total production
index. June output schedules indicate little change from the May rate.
Output of raw steel rose 1 per cent further in May but production of
steel mill products probably increased about 4 per cent, the same as
in April, and equivalent to about .3 of a point rise in the total
production index. Some cutbacks in raw steel production in June have
been announced by several mills (a seasonal decline of 5 per cent in
output from May to June is usual) but reductions in steel mill finishing
operations have not yet been announced. Output of television sets, which
rose 25 per cent from February to April, changed little in the first
two weeks of May. Other weekly data for the first two weeks of May
suggest little change in production of paper and crude oil and declines
in coal and refined petroleum products.

II - 9
INDUSTRIAL PRODUCTION1957-59=100, seasonally adjusted
Total index
Consumer goodsAutosHome goodsApparel & staples
Business equipmentDefense equipment
Materials, totalDurable
SteelNondurable
1/ Pre-recession peak.
1969 1971
1969July 1/
174.6
164.4178.7184.4158.1
196.9169.9
176.5167.0145.3186.4
1971Feb. March April
165.2 165.5 166.0
164.6 166.2 166.7168.1 167.3 153.9175.9 160.2 185.0161.2 162.3 163.0
173.0 170.5 169.8113.1 112.2 107.5
167.8 168.0 169.1150.3 151.4 152.6132.9 138.3 143.8185.8 185.2 186.3
Per cent changeJuly 1969 QIV 1970 to
to April 1971 QI 1971
-4.9 1.7
1.4 4.0-13.9 71.2
.3 -. 33.1 1.3
-13.8 -3.1-36.7 -4.5
-4.2 1.8-8.6 4.2-1.0 11.1- .1 .0
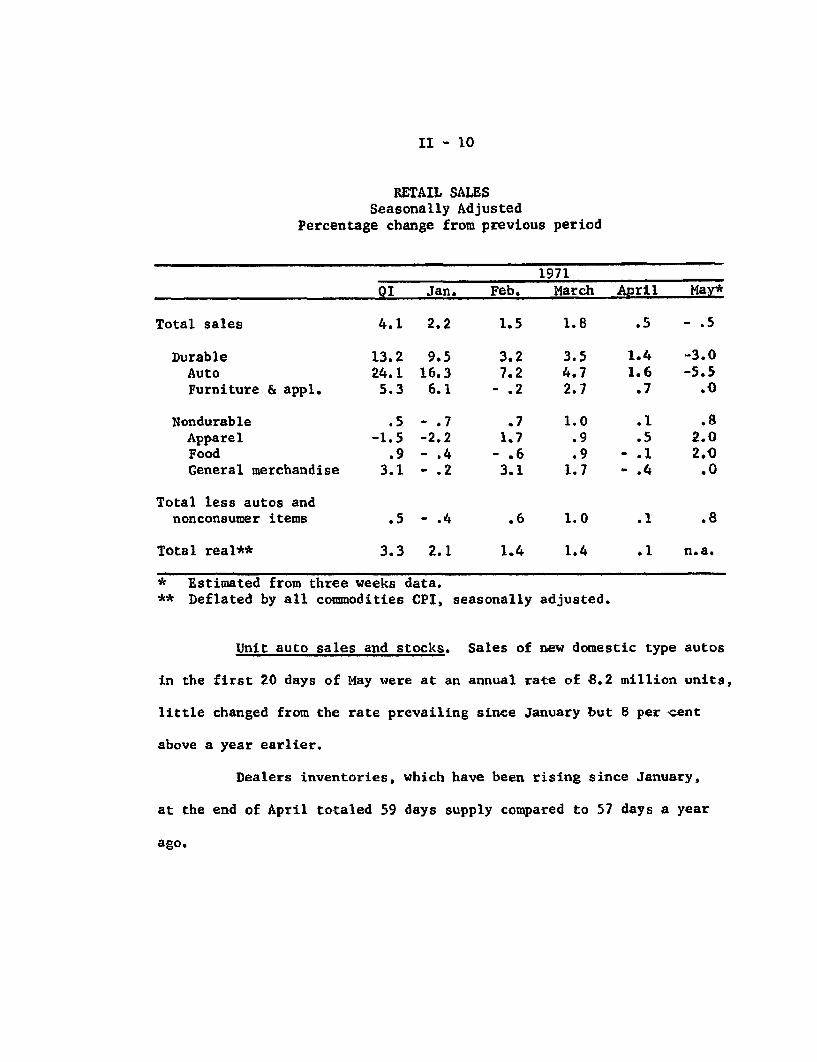
Retail sales. Retail sales in May were about 0.5 per cent
lower than in April, according to estimates based on data for three
weeks. Sales of durable goods may have fallen by about 3 per cent--
largely because of a decline in the automotive group. Excluding autos
and nonconsumer items (lumber, building materials, and farm equipment),
sales may have increased between 1/2 and 1 per cent. Nondurable goods
sales are estimated to have risen 1/2 to 1 per cent, mainly because of
apparel and foods. General merchandise sales apparently were unchanged.
Compared with a year earlier, total sales were up about 5-1/2 per cent.
II - 10
RETAIL SALESSeasonally Adjusted
Percentage change from previous period
Total sales
DurableAutoFurniture & appl.
NondurableApparelFoodGeneral merchandise
Total less autos andnonconsumer items
Total real**
QI
4.1
13.224.1
5.3
.5-1.5
.93.1
Jan.
2.2
9.516.36.1
-. 7-2.2-. 4- .2
.5 - .4
3.3 2.1
Feb.
1.5
3.27.2
-. 2
.71.7
- .63.1
.6
1.4
1971March
1.8
3.54.72.7
1.0.9.9
1.7
1.0
1.4
April
.5
1.41.6.7
.1
.5- .1- .4
.1
.1
May*
- .5
-3.0-5.5
.0
.82.02.0
.0
.8
n.a.
* Estimated from three weeks data.** Deflated by all commodities CPI, seasonally adjusted.
Unit auto sales and stocks. Sales of new domestic type autos
in the first 20 days of May were at an annual rate of 8.2 million units,
little changed from the rate prevailing since January but 8 per cent
above a year earlier.
Dealers inventories, which have been rising since January,
at the end of April totaled 59 days supply compared to 57 days a year
ago.
II - 11
Consumer surveys. The latest surveys by the Michigan Survey
Research Center (SRC) and the Conference Board (CB) reaffirm the more
optimistic findings of their reports earlier this year. The Conference
Board in the March-April survey reported a significant improvement in
buying plans for homes, autos, and major appliances; this continues
an upturn first indicated by the January-February survey. The SRC
also reported that the index of consumer sentiment increased from 78.2
in February to 81.6 in May, raising the index 6 percentage points above
the November 1970 low.
There are a number of conflicting items in the survey results,
however. Michigan reported that intentions to buy new cars were only
moderately higher than the very low level a year earlier and an
additional question suggests that high car prices are depressing pur-
chase plans. The Conference Board reported a deterioration in consumer
attitudes about both current and expected economic conditions. The
percentage of respondents saying that business conditions were bad and
that jobs were hard to get increased greatly as compared with both the
previous survey and that of a year earlier. In looking ahead six months,
more families expected worse business conditions and fewer job oppor-
tunities than in the previous survey.
Reduced pessimism, rather than increased optimism, appropriately
describes the change in the Michigan index of sentiment between February
and May. The proportion of families expecting bad times during the next
12 months declined and not as many people believe that they are financially
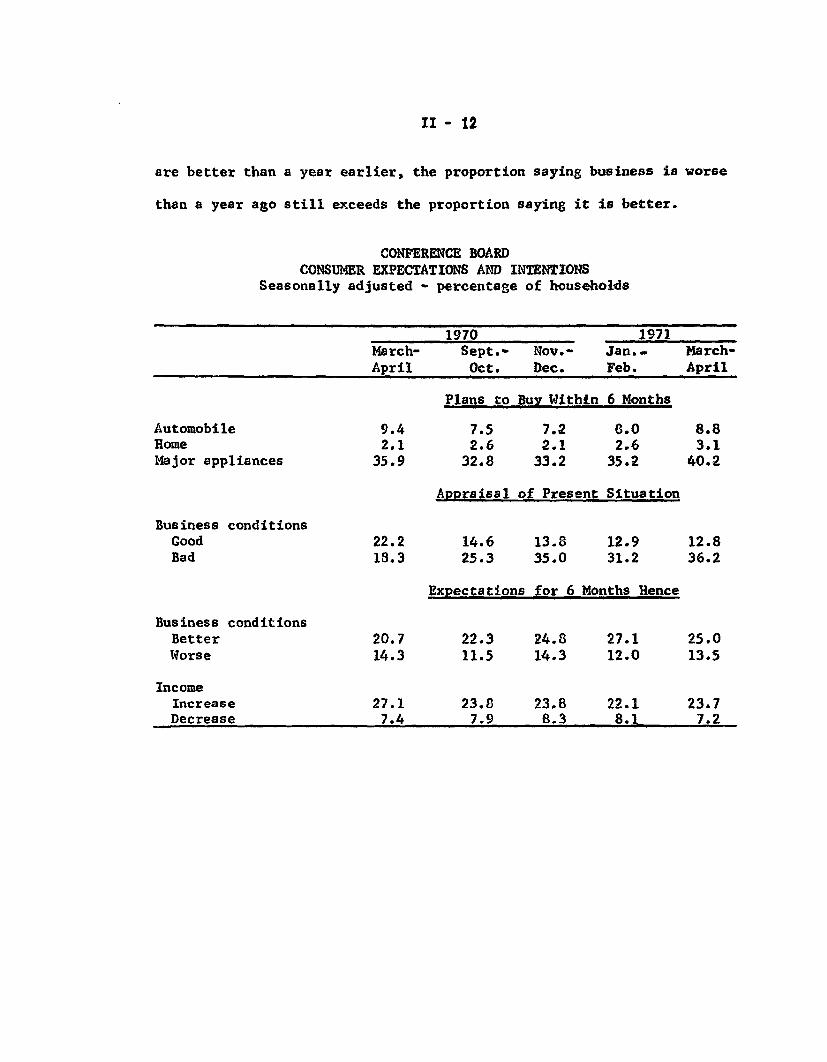
worse off than a year ago. While more people think business conditions
II - 12
are better than a year earlier, the proportion saying business is worse
than a year ago still exceeds the proportion saying it is better.
CONFERENCE BOARDCONSUMER EXPECTATIONS AND INTENTIONS
Seasonally adjusted - percentage of households
1970 1971March- Sept.- Nov.- Jan.- March-
April Oct. Dec. Feb. April
Plans to Buy Within 6 Months
Automobile 9.4 7.5 7.2 8.0 8.8Home 2.1 2.6 2.1 2.6 3.1Major appliances 35.9 32.8 33.2 35.2 40.2
Appraisal of Present Situation
Business conditionsGood 22.2 14.6 13.8 12.9 12.8Bad 18.3 25.3 35.0 31.2 36.2
Expectations for 6 Months Hence
Business conditionsBetter 20.7 22.3 24.8 27.1 25.0Worse 14.3 11.5 14.3 12.0 13.5
IncomeIncrease 27.1 23.8 23.8 22.1 23.7Decrease 7.4 7.9 8.3 8.1 7.2

II - 13
MICHIGAN SURVEY RESEARCH CENTERINDEX OF CONSUMER SENTIMENT
February 1966 = 100
Date of Survey Index
1970May 75.4August 77.1November 75.4
1971February 78.2May 81.6
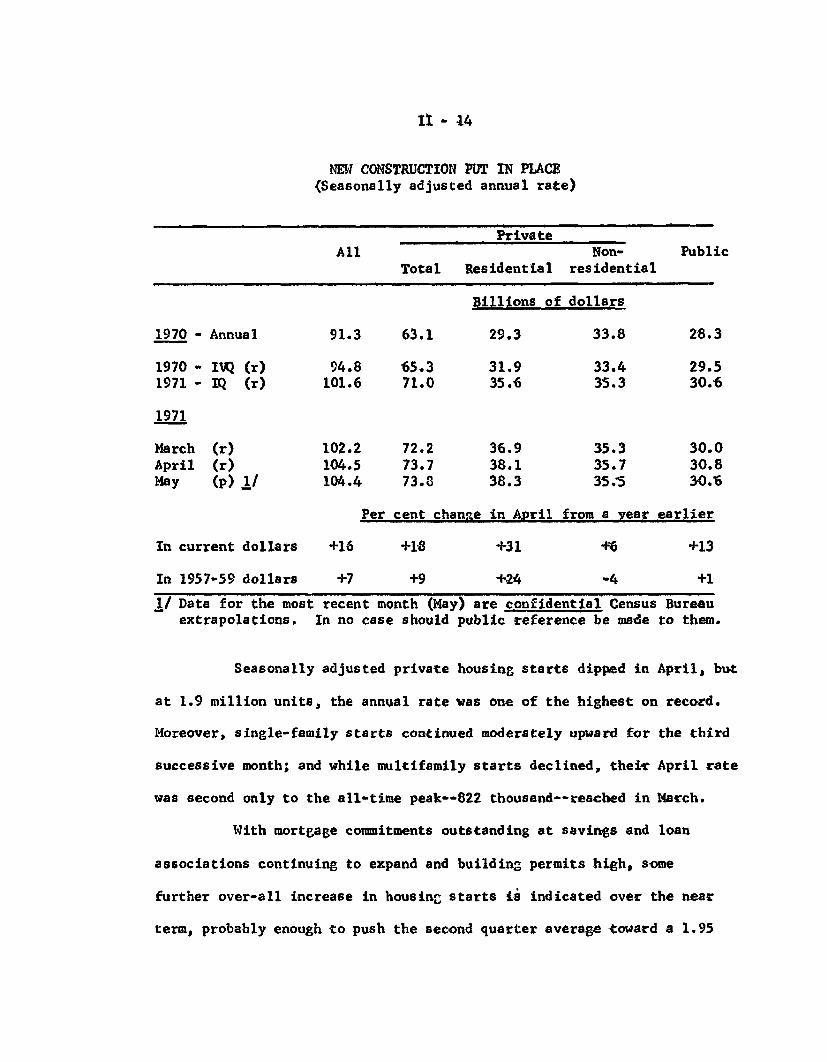
Construction and real estate. New construction put in place,
which was revised upward 1 per cent to a new peak for April, changed
little in May. Within the private sector, outlays for residential
structures slightly eclipsed the previous high reached in April and were
more than two-fifths above the low in July of 1970. Expenditures for non-
residential construction as a whole remained very close to the improved
rate which has prevailed since January. Outlays for public construction--
very largely State and local projects--declined somewhat from the down-
ward revised rate now reported for April and earlier months this year
and were 5 per cent below the record rate in December.
Total outlays for May were 16 per cent above a year earlier.
However, with construction costs still continuing to rise rapidly, the
year-to-year advance in constant dollars amounted to 7 per cent as
measured by the Census Bureau.
II - 14
NEW CONSTRUCTION PUT IN PLACE(Seasonally adjusted annual rate)
PrivateAll Non- Public
Total Residential residential
Billions of dollars
1970 - Annual 91.3 63.1 29.3 33.8 28.3
1970 - IVQ (r) 94.8 65.3 31.9 33.4 29.51971 - IQ (r) 101.6 71.0 35.6 35.3 30.6
1971
March (r) 102.2 72.2 36.9 35.3 30.0April (r) 104.5 73.7 38.1 35.7 30.8May (p) 1/ 104.4 73.8 38.3 35.5 30.6
Per cent change in April from a year earlier
In current dollars +16 +18 +31 +6 +13
In 1957-59 dollars +7 +9 +24 -4 +1
1/ Data for the most recent month (May) are confidential Census Bureauextrapolations. In no case should public reference be made to them.
Seasonally adjusted private housing starts dipped in April, but
at 1.9 million units, the annual rate was one of the highest on record.
Moreover, single-family starts continued moderately upward for the third
successive month; and while multifamily starts declined, their April rate
was second only to the all-time peak--822 thousand--reached in March.
With mortgage commitments outstanding at savings and loan
associations continuing to expand and building permits high, some
further over-all increase in housing starts is indicated over the near
term, probably enough to push the second quarter average toward a 1.95

II - 15
million rate. If attained, this would mark a rise of more than 50 per
cent from the low in the first quarter of 1970. In the first quarter of
this year, the expansion had already amounted to 45 per cent.
(SeasonallyPRIVATE HOUSING STARTS AND PERMITSadjusted annual rates, in thousands of units)
StartsPer Cent Per Cent Permits
Total 1/ Single-family FHA-insured 2/
(Census Bureau) (FHA Seried)
1970 - Annual 1,434 57 29 1,324
1970
IQ 1,252 54 23 1,085IIQ 1,286 58 28 1,257IIIQ 1,512 56 28 1,358IVQ 1,777 58 35 1,593
1971
IQ 1,810 55 24 1,608
1971
February (r) 1,754 56 27 1,563March (r) 1,950 55 20 1,627April (p) 1,903 57 22 1,618
1/ Apart from starts, mobile home shipments for domestic use in March--the latest month for which data are available--were at a seasonallyadjusted annual rate of 419,000, 4 per cent higher than in the previousmonth as well as the average in 1970.
2/ Based on unadjusted totals for all periods. FHA-insured starts in-clude both subsidized and nonsubsidized units.
Seasonally adjusted sales of new homes by speculative builders
soared to a new peak in March and were four-fifths above the reduced
rate of a year earlier. Stocks of homes held for sale by such builders
meanwhile continued little changed from last year's lows. Used home

II - 16
sales, an important support to new-home demands, were also exceptionally
high in March, according to the National Association of Real Estate
Boards.
The surge in sales through March, the latest month for which
data are available, was apparently associated with some upgrading in
the composition of demands under the more favorable financing terms
prevailing. Reflecting this development as well as further increases
in construction and land costs, the median price of new homes sold in
March--at $24,100--was almost a tenth higher than it was last October.
Even so, it was still no higher than a year earlier and about $2,000
below the reduced median price of new homes available for sale. At the
same time, the median price of used homes sold in March was $24,270--
6 per cent above a year earlier and somewhat more than the year-to-year
rise averaged during 1970.
Manufacturers' orders and shipments. New orders for durable
goods declined 3.7 per cent in April, according to preliminary data,
following a smaller March decline. In addition to expected reductions
at motor vehicle plants and iron and steel companies, orders for capital
equipment dropped to the lowest point since last October. Orders for
household durables showed a modest further increase, but all other
groups were down. When autos, steel, and defense are excluded--to
obtain a series for private demands for durable goods relatively free
from special influences--the remaining components of orders declined in
April from an advanced March level but remained slightly above the levelsthat prevailed
/from January 1970 through February 1971. Durable goods prices have
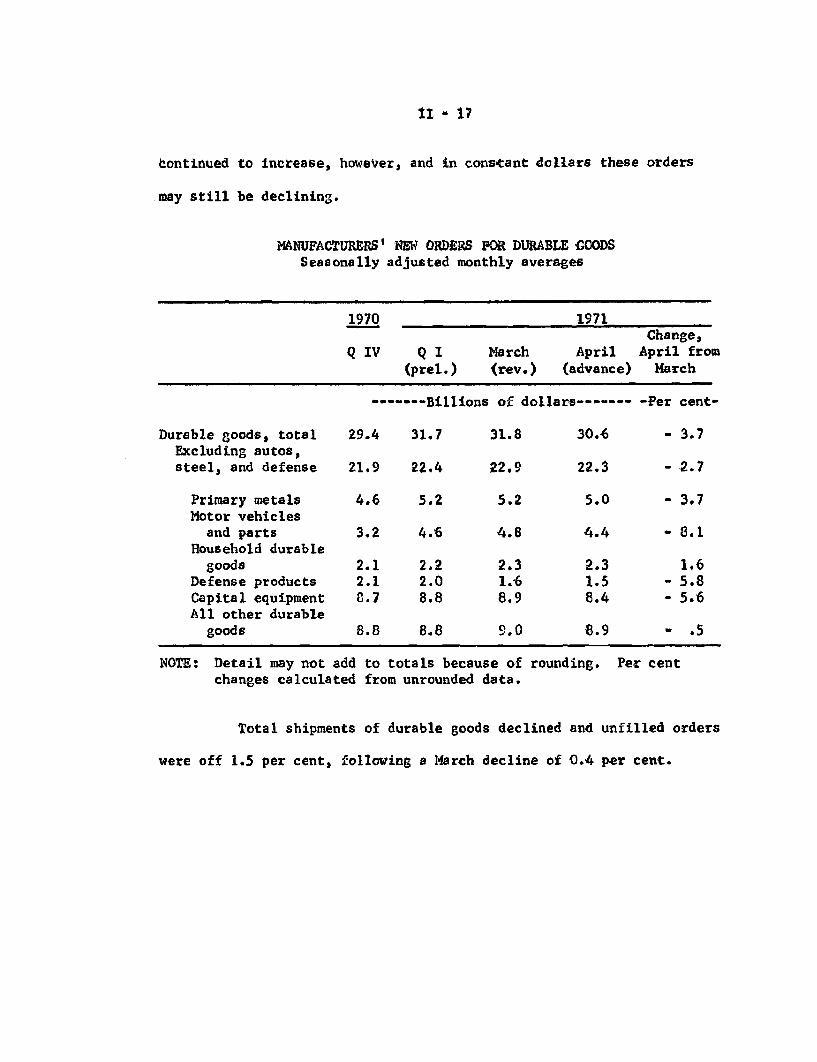
II - 17
continued to increase, however, and in constant dollars these orders
may still be declining.
MANUFACTURERS' NEW ORDERS FOR DURABLE GOODSSeasonally adjusted monthly averages
1970 1971
Q IV Q I March April(prel.) (rev.) (advance)
------- Billions of dollars -----
Change,April fromMarch
-Per cent-
Durable goods, totalExcluding autos,steel, and defense
Primary metalsMotor vehicles
and partsHousehold durable
goodsDefense productsCapital equipmentAll other durable
goods
NOTE: Detail may not
29.4 31.7
21.9 22.4
4.6
3.2
2.12.18.7
8.8
add to totals because of rounding. Per centchanges calculated from unrounded data.
Total shipments of durable goods declined and unfilled orders
were off 1.5 per cent, following a March decline of 0.4 per cent.
31.8
22.9
5.2
4.8
2.31.68.9
9.0
5.2
4.6
2.22.08.8
8.8
30.6
22.3
5.0
4.4
2.31.58.4
8.9
- 3.7
- 2.7
- 3.7
- 8.1
1.6- 5.8- 5.6
- .5
II - 18
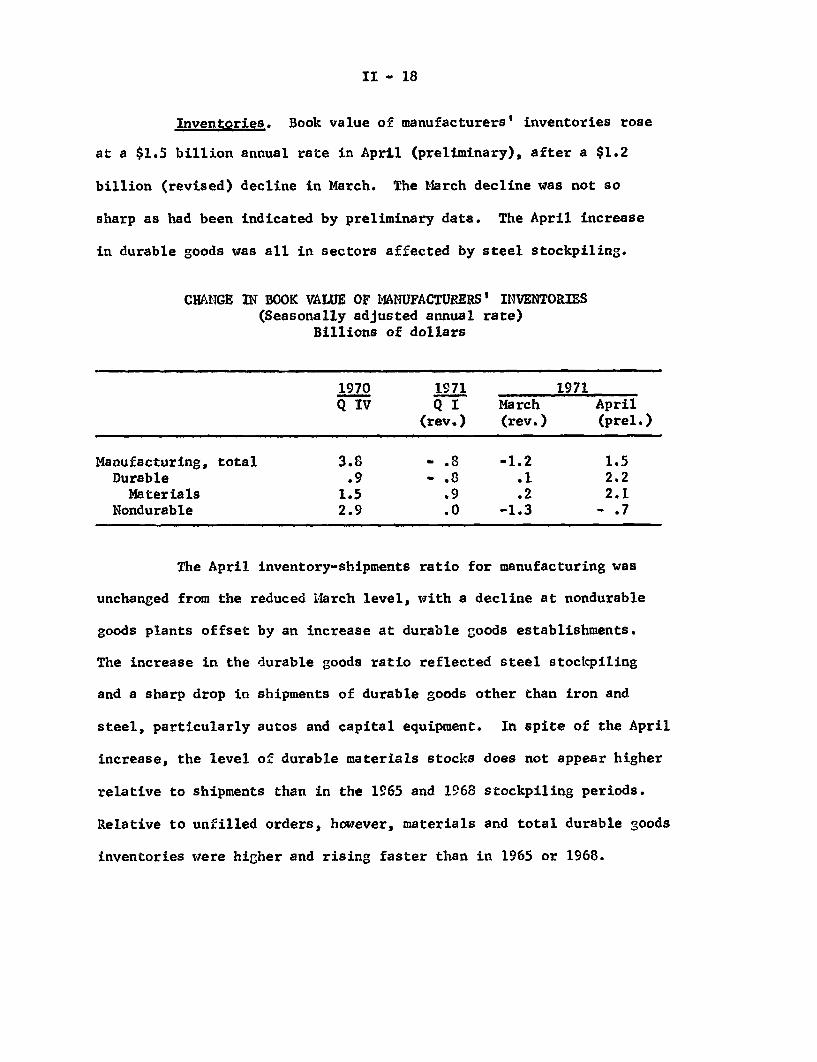
Inventories. Book value of manufacturers' inventories rose
at a $1.5 billion annual rate in April (preliminary), after a $1.2
billion (revised) decline in March. The March decline was not so
sharp as had been indicated by preliminary data. The April increase
in durable goods was all in sectors affected by steel stockpiling.
CHANGE IN BOOK VALUE OF MANUFACTURERS' INVENTORIES(Seasonally adjusted annual rate)
Billions of dollars
1970 1971 1971Q IV Q I March April
(rev.) (rev.) (prel.)
Manufacturing, total 3.8 - .8 -1.2 1.5Durable .9 - .8 .1 2.2
Materials 1.5 .9 .2 2.1Nondurable 2.9 .0 -1.3 - .7
The April inventory-shipments ratio for manufacturing was
unchanged from the reduced March level, with a decline at nondurable
goods plants offset by an increase at durable goods establishments.
The increase in the durable goods ratio reflected steel stockpiling
and a sharp drop in shipments of durable goods other than iron and
steel, particularly autos and capital equipment. In spite of the April
increase, the level of durable materials stocks does not appear higher
relative to shipments than in the 1965 and 1968 stockpiling periods.
Relative to unfilled orders, however, materials and total durable goods
inventories were higher and rising faster than in 1965 or 1968.

II - 19
MANUFACTURERS' INVENTORY RATIOS
1970 1971March April March April
(rev.) (prel.)
Inventories to shipmentsManufacturing, total 1.76 1.79 1.70 1.70
Durable 2.16 2.18 2.04 2.06Materials to end productshipments .92 .92 .88 .91
Nondurable 1.28 1.33 1.29 1.27
Inventories to unfilled ordersDurable manufacturing .769 .786 .812 .826
Materials to end productorders .298 .306 .329 .335
Retail dealers' stocks of new autos changed little in April,
but sales declined and the stock-sales ratio rose above year-earlier
levels.
Cyclical indicators. The preliminary Census composite index
of leading indicators rose 1.4 per cent in April. In addition, the
March increase is now reported to be 2.1 per cent, revised up from the
preliminary rise of .6 per cent. The April index is 9 per cent above
its October 1970 low. The coincident and lagging composites rose
slightly in April.
The rapid increase in the leading composite since October
reflects rebounds of several leading indicators from GM-strike lows
as well as apparent cyclical upturns in a number of series not affected
by the strike. The magnitude of the recovery in the leading composite
has not been a reliable indicator of the magnitudes of cyclical recovery

II - 20
in the economy in previous cycles, and the presence of the strike-
rebound factor in the recent data make it even more difficult to
gauge the significance of this indicator with respect to prospective
rates of recovery.
COMPOSITE CYCLICAL INDICATORS(1967 = 100)
12 LeadingTrend Adjusted 5 Coincident 6 Lagging
1970:October 113.8 118.8 130.8November 114.1 117.9 128.9December 116.3 119.1 128.9
1971:January 118.5 121.1 129.2February 119.9 121.8 130.1March 122.4 122.3 130.8
April (Prel.) 124.1 (H) 122.5 (H) 130.9
(H) Current high value. The lagging composite reached its high inSeptember 1970.
The revisions of the first quarter leading composites re-
flected mainly the inclusion of corporate profits for the quarter and
fairly strong increases in March in net business formation, inventory
change, and the change in consumer instalment debt. The rise in the prelim-
inary April composite came from initial unemployment insurance claims,
contracts and orders for plant and equipment, industrial materials
prices, common stock prices, and the ratio of price to unit labor cost.
There were declines in the manufacturing workweek, new orders for durable
goods, and housing permits.

II - 21
In May, according to preliminary averages, both materials
prices and common stock prices declined.
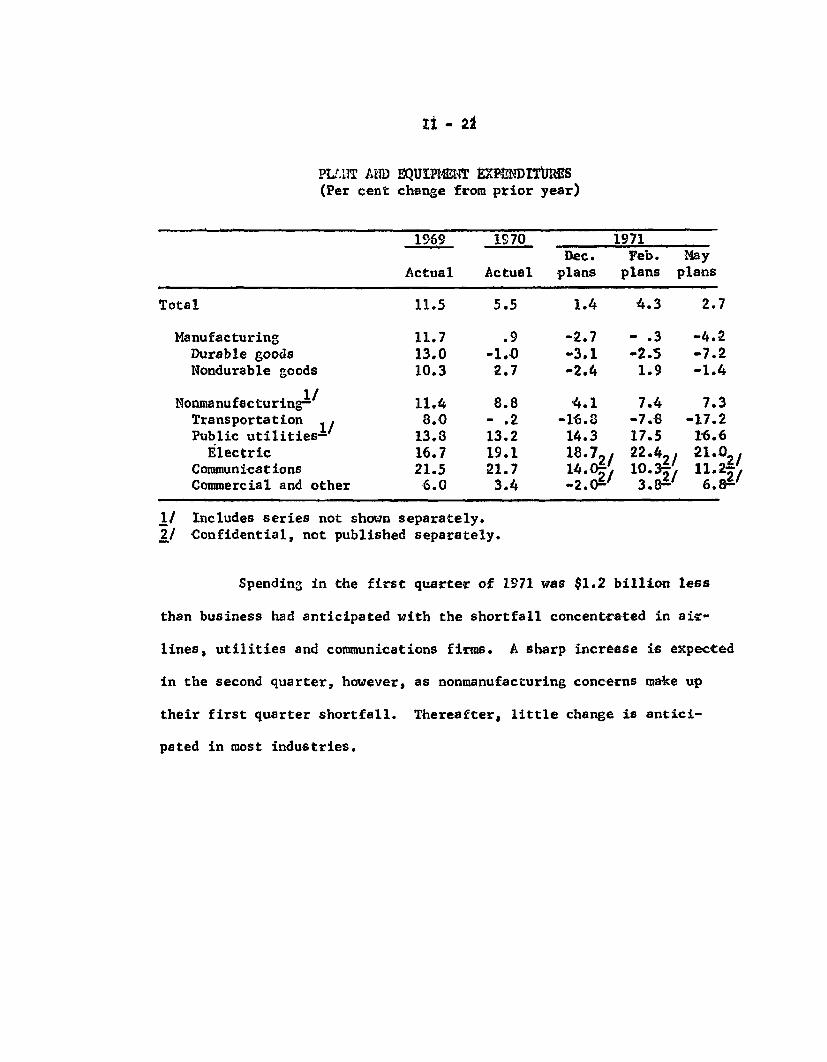
Plant and equipment. The May Commerce-SEC survey indicates
that business plans a 2.7 per cent increase in 1971 spending for new
plant and equipment. The February survey had indicated an increase of
4.3 per cent.
All of the downward revision is in manufacturing where a
decline of 4.2 per cent in expenditures is now anticipated for 1971--
rather than the no change expected earlier. Within manufacturing, large
downward revisions are reported in the electrical and nonelectrical
machinery, aircraft, food and beverages, and chemicals industries. Non-
manufacturing, as a whole, still indicates a 7.3 per cent planned gain.
However, transportation firms--especially airlines--and gas utilities
now expect larger declines than in February, while commercial and
other firms have increased their anticipated spending.
PLANT AND EQUIPMENT EXPENDITURES(Per cent change from prior year)
1969 1
Actual Ac
Total 11.5 5
Manufacturing 11.7Durable goods 13.0 -1Nondurable goods 10.3 2
1/Nonmanufacturing- 11.4 8Transportation / 8.0 -Public utilities- 13.8 13
Electric 16.7 19Communications 21.5 21Commercial and other 6.0 3
1/ Includes series not shown separately.2/ Confidential, not published separately.
970
tual
.5
.9
.0
.7
.8
.2
.2
.1
.7
.4
1971Dec. Feb. May
plans plans plans
1.4 4.3 2.7
-2.7 - .3 -4.2
-3.1 -2.5 -7.2-2.4 1.9 -1.4
4.1 7.4 7.3-16.8 -7.8 -17.214.3 17.5 16.618.7,/ 22.42, 21.0 ,14.0- 10.3=. 11.2S-2.0- 3.- 6.-
Spending in the first quarter of 1971 was $1.2 billion less
than business had anticipated with the shortfall concentrated in air-
lines, utilities and communications firms. A sharp increase is expected
in the second quarter, however, as nonmanufacturing concerns make up
their first quarter shortfall. Thereafter, little change is antici-
pated in most industries.
II - 22
II - 23
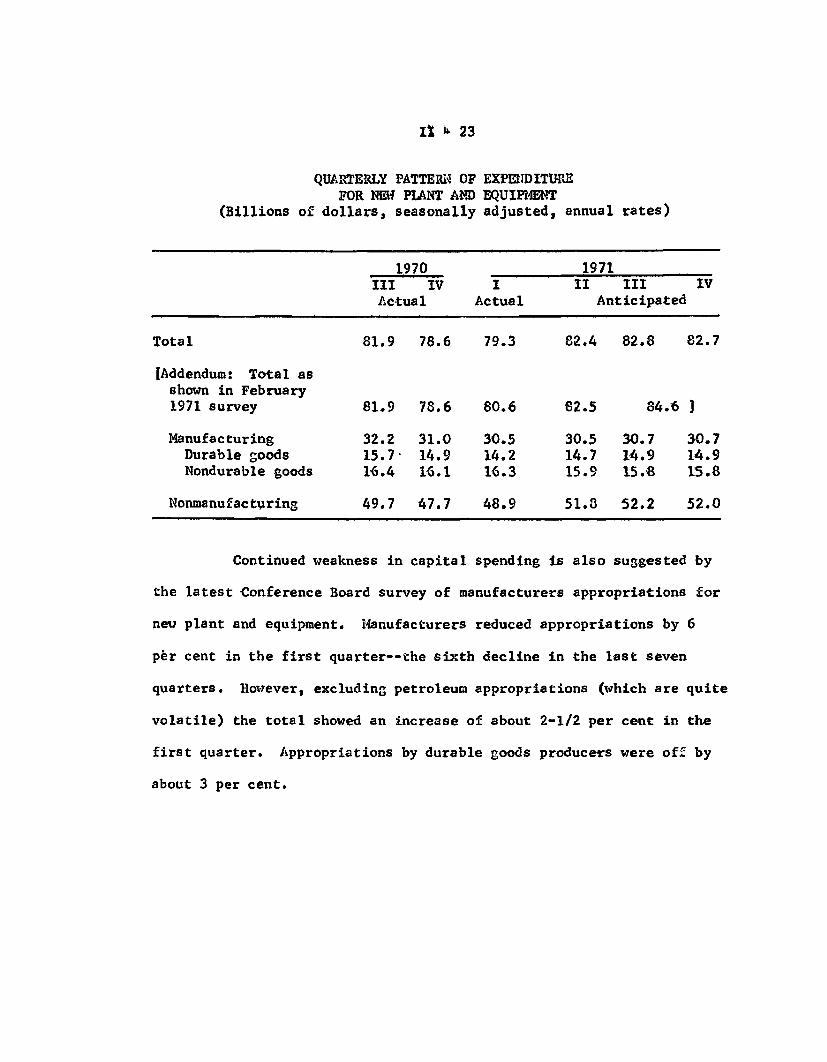
QUARTERLY PATTERN OF EXPENDITUREFOR NEW PLANT AND EQUIPMENT
(Billions of dollars, seasonally adjusted, annual rates)
1970 1971III IV I II III IVActual Actual Anticipated
Total 81.9 78.6 79.3 82.4 82.8 82.7
[Addendum: Total asshown in February1971 survey 81.9 78.6 80.6 82.5 84.6 ]
Manufacturing 32.2 31.0 30.5 30.5 30.7 30.7Durable goods 15.7 14.9 14.2 14.7 14.9 14.9Nondurable goods 16.4 16.1 16.3 15.9 15.8 15.8
Nonmanufacturing 49.7 47.7 48.9 51.8 52.2 52.0
Continued weakness in capital spending is also suggested by
the latest Conference Board survey of manufacturers appropriations for
new plant and equipment. Manufacturers reduced appropriations by 6
per cent in the first quarter--the sixth decline in the last seven
quarters. However, excluding petroleum appropriations (which are quite
volatile) the total showed an increase of about 2-1/2 per cent in the
first quarter. Appropriations by durable goods producers were off by
about 3 per cent.

II - 24
MANUFACTURES NEW CAPITAL APPROPRIATIONS(Seasonally adjusted)
1971 1970 1971
Ip I II III IV Ip
Millions Per Cent Change Fromof $ Preceding Quarter
All manufacturing 5,618 -13.4 -1.1 1.6 -9.3 -6.4Ex petroleum 4,438 - 3.5 - .5 -3.6 -14.0 2.6
Durable goods 2,628 -10.6 -2.2 3.8 -18.9 -3.1Nondurable goods 2,990 -15.9 .0 - .5 .5 -9.1
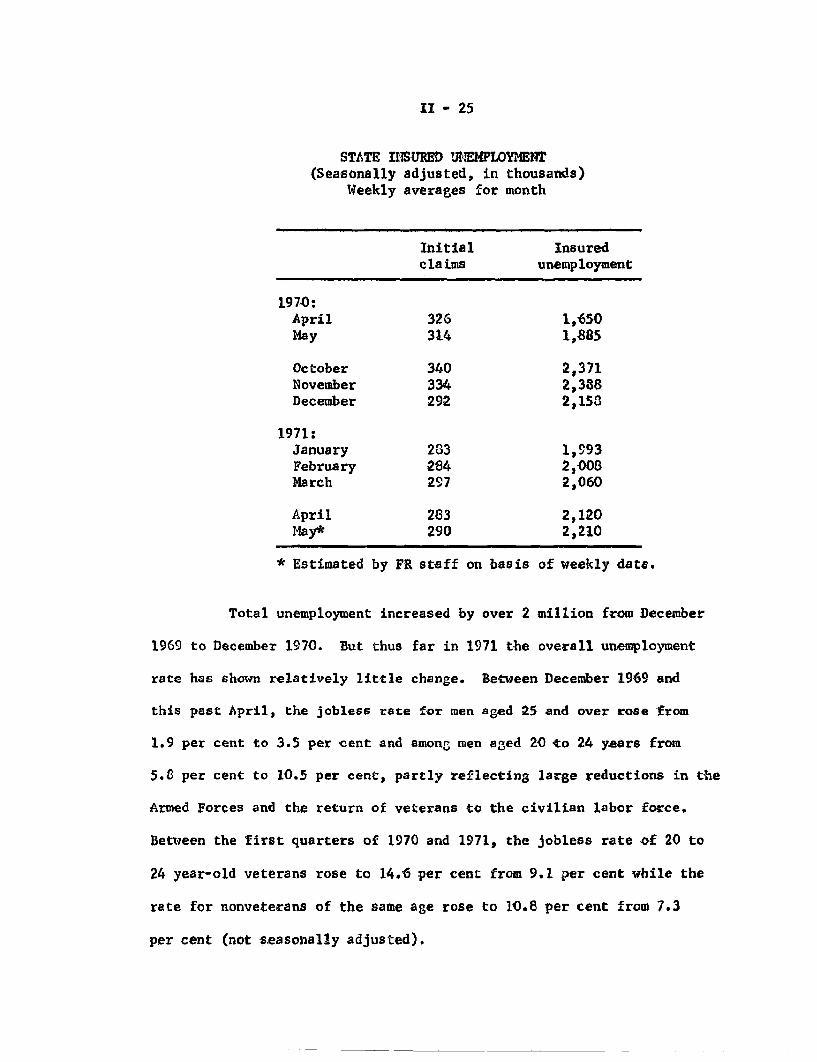
Labor market. The labor market continues slack. In May,
initial claims for unemployment insurance benefits continued at about
the same level as in earlier months of the year, but insured unemployment
apparently moved up further.
II - 25
STATE INSURED UNEMPLOYMENT(Seasonally adjusted, in thousands)
Weekly averages for month
Initial Insuredclaims unemployment
1970:April 326 1,650May 314 1,885
October 340 2,371November 334 2,388December 292 2,158
1971:January 283 1,993February 284 2,008March 297 2,060
April 283 2,120May* 290 2,210
* Estimated by FR staff on basis of weekly data.
Total unemployment increased by over 2 million from December
1969 to December 1970. But thus far in 1971 the overall unemployment
rate has shown relatively little change. Between December 1969 and
this past April, the jobless rate for men aged 25 and over rose from
1.9 per cent to 3.5 per cent and among men aged 20 to 24 years from
5.8 per cent to 10.5 per cent, partly reflecting large reductions in the
Armed Forces and the return of veterans to the civilian labor force.
Between the first quarters of 1970 and 1971, the jobless rate of 20 to
24 year-old veterans rose to 14.6 per cent from 9.1 per cent while the
rate for nonveterans of the same age rose to 10.8 per cent from 7.3
per cent (not seasonally adjusted).

II - 26
Unemployment increases have been widespread among occupations.
Cutbacks in aerospace and defense expenditures have contributed to an
unusually large rise in joblessness among white-collar workers, whose
rate increased from 2.1 per cent in December 1969 to 3.8 per cent
this April, equalling the highest rate since the series began in 1958.
The rate for professional and technical workers was 3.3 per cent in
April, more than three times as high as at its lowest point back in
1968 when demands for professional workers were strong. The blue-collar
rate moved from 4.4 to 7.4 per cent over this period.
SELECTED UNEMPLOYMENT RATES(Seasonally adjusted, in per cent)
December April April1969 1970 1971
Total 3.6 4.7 6.1
Men aged 20-24 years 5.8 7.8 10.525 years and over 1.9 2.6 3.5
Women aged 20-24 years 6.3 7.6 10.325 years and over 3.1 3.8 5.0
Teenagers 12.1 15.3 17.2White 3.3 4.2 5.6Negro and other races 5.8 8.3 10.0White-collar workers 2.1 2.8 3.8Blue-collar workers 4.4 5.6 7.4Service workers 3.7 4.9 6.3
A relatively new measure of labor market conditions is the
BLS series on job vacancies in manufacturing. Monthly data are now
available (unadjusted) since April 1969. These vacancy data confirm
that job openings are extremely scarce and have not increased since the
turn of the year. In March, vacancies comprised only .4 per cent of all

II - 27
manufacturing job slots, about the same percentage as in the preceding
four months but down by half from the .8 per cent rate in March 1970.
Vacancy rates were down by half or more from a year earlier in the
machinery, transportation equipment and primary metals industries.
Nearly one-third of job vacancies in March were in the apparel and
textiles industries, with another one-fifth in the remaining soft-
goods industries. Durable goods manufacturers accounted for about 45
per cent of all vacancies, down from about 55 per cent a year earlier.
Collective bargaining. The major aluminum companies and
40,000 workers agreed to a new three-year contract on May 31. The
settlement parallels the wage provisions of the can industry settle-
ment but apparently provides greater improvements in fringe benefits.
The more liberal fringe benefits in the aluminum contract result from
larger pension and insurance increases, a 25-cent an hour bonus for
week-end work and a winter vacation bonus. Wage increases total an
estimated $1.11 (9 per cent a year) over the life of the contract.
As in the can settlement, the wage package includes an unlimited cost-
of-living escalator clause effective in the second and third contract
years with a guaranteed minimum 12.5 cent adjustment in both years.
The first-year wage increase is 50 cents or close to 14 per cent.
Changes in job classifications are estimated to add 11 cents to wages
over the contract term.
Congress passed emergency legislation on May 18 to halt a
two-day strike by 10,000 railroad signalmen. The new strike ban, which
extends until October 1, also provided a 13.5 per cent retroactive wage
II - 28
increase; 5 per cent is retroactive to January 1, 1970 and 8-1/2 per cent
retroactive to November 1, 1970. The retroactive pay increase closely
followed the wage package recommendations of the Presidential emergency
board.
The likelihood of local and national telephone company strikes
increased as the Communication Workers Union rejected the company's
proposed pattern offer in the Washington, D.C. area of an 11 per cent
first-year wage increase and 3 per cent increases plus a cost-of-
living escalator clause effective in the second and third contract
years. The union immediately called for a strike vote of its 450,000
members, with any walkout likely to occur about June 14.
The Construction Industry Stabilization Committee issued a
formal opinion on May 16 in which it approved a three-year settlement
by a painter's union in Little Rock, Arkansas. The contract provided
for a 13-1/2 per cent first-year wage increase, 11.9 per cent the
second year and 10.6 per cent the third year. The opinion stated that
these increases do not set "new and relatively higher rates" and
"preserve the traditional craft relationships". The Committee also
approved deferred increases of up to 14.5 per cent effective this year
under contracts negotiated earlier by most other construction crafts
in the area. Deferred increases effective in 1971 under prior major
contract settlements in the construction industry average 13.3 per cent.
II - 29
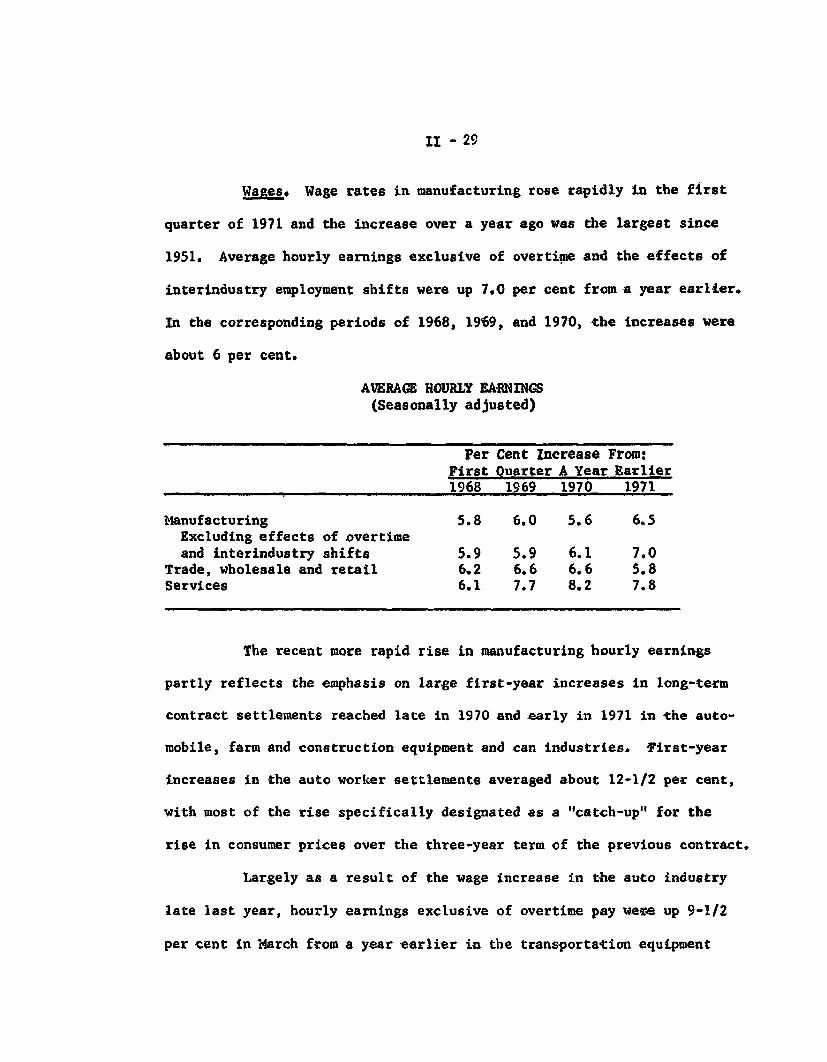
Wages. Wage rates in manufacturing rose rapidly in the first
quarter of 1971 and the increase over a year ago was the largest since
1951. Average hourly earnings exclusive of overtime and the effects of
interindustry employment shifts were up 7.0 per cent from a year earlier.
In the corresponding periods of 1968, 1969, and 1970, the increases were
about 6 per cent.
AVERAGE HOURLY EARNINGS(Seasonally adjusted)
Per Cent Increase From:First Quarter A Year Earlier1968 1969 1970 1971
Manufacturing 5.8 6.0 5.6 6.5Excluding effects of overtimeand interindustry shifts 5.9 5.9 6.1 7.0
Trade, wholesale and retail 6.2 6.6 6.6 5.8Services 6.1 7.7 8.2 7.8
The recent more rapid rise in manufacturing hourly earnings
partly reflects the emphasis on large first-year increases in long-term
contract settlements reached late in 1970 and early in 1971 in the auto-
mobile, farm and construction equipment and can industries. First-year
increases in the auto worker settlements averaged about 12-1/2 per cent,
with most of the rise specifically designated as a "catch-up" for the
rise in consumer prices over the three-year term of the previous contract.
Largely as a result of the wage increase in the auto industry
late last year, hourly earnings exclusive of overtime pay were up 9-1/2
per cent in March from a year earlier in the transportation equipment
II - 30
industry compared with a 6 per cent rise in each of the preceding three
years. In contrast, the rate of increase in wages in the less-unionized
and lower-wage manufacturing industries has slackened somewhat.
In some important nonmanufacturing industries, increases in
average hourly earnings do not appear to have accelerated. In trade,
the increase in the first quarter from a year earlier was less than
over the preceding year. In the service industries, the rise in average
hourly earnings was close to the 8 per cent increase of the previous year.
Consumer prices. In April consumer prices increased at an
annual rate of 3.4 per cent, continuing the slower rate of rise that
has characterized previous months this year. Although improvement has
been due mainly to the decline in mortgage interest rates, prices of
both durable and nondurable goods--except foods--have risen at slower
rates this year. Among nondurables, declines in gasoline prices have
been an important factor. Among durable goods, the steep rise in home
purchase prices has abated and new car prices have receded more than
seasonally from the January peak. (The unusual, sharp January increase
reflected delayed incorporation of 1971 models into the sales mix.)

II - 31
CONSUMER PRICES(Percentage change at seasonally adjusted annual rates)
All items
Food
Commodities less food 1 /
ApparelGasoline 2/
New carsUsed cars 2/
Services
1/ Includes items not listed.2/ Not seasonally adjusted.
Note: Seasonally adjusted rates
Dec. 1969to.
Dec. 1970
5.5
2.2
4.8
3.72.6
6.77.4
8.2
Dec. 1970to
Mar. 1971
2.8
6.0
1.0
1.0-5.8
4.7-9.5
3.2
Mar. 1971to
April 1971
3.4
10.7
2.1
4.1-21.4
.039.5
1.9
are based on revised seasonal factors.
On the unfavorable side, food prices, which were relatively
flat during most of last year, rose steeply in March and April. Higher
prices for fresh vegetables and fruits were a major factor in both
months; in April cereal and bakery products advanced rapidly. Increases
of these magnitudes are not expected to continue, but the trend over the
remainder of the year may compare unfavorably with 1970.
The cost of services, excluding home finance, has advanced
faster this year than last, but the rise in April was more moderate
than the average over the first quarter. Nevertheless, substantial
increases continued in April for medical care, rent, and home main-
tenance and reapirs, while insurance and residential gas rates rose
sharply.

II - 32
Estimates of the effect of mortgage interest costs on the
CPI furnished by the BLS for confidential use show that if these costs
are excluded the average annual rate of price rise over the first four
months of this year amounts to 4.4 per cent, 1.6 percentage points more
than the official CPI. In 1970, in contrast, when mortgage costs were
rising, their exclusion reduces the price increase from 5.5 per cent to
5.1 per cent. (The December-April change, based on unadjusted indexes,
is only slightly affected by seasonal factors; for all items the
seasonally adjusted figure is 0.1 per cent higher at an annual rate.)
EFFECTS OF MORTGAGE COSTS ON CONSUMER PRICES(Percentage changes at annual rates, not seasonally adjusted)
Dec. 1969 Dec. 1970to to
Dec. 1970 April 1971
All items, CPI 5.5 2.8 2 /
All items less mortgage costs 1/ 5.1 4.4
Services 8.2 2.9Services less home finance 1/3/ 7.0 7.9
1/ Confidential.2/ Seasonally adjusted, 2.9.3/ Excludes mortgage interest costs, property taxes and homeowners'
insurance.

II - 33
Price indexes for GNP. GNP price indexes suggest little abate-
ment recently in the pace of overall price advance. The GNP deflator
increased in the first quarter at an annual rate of 5.6 per cent, some-
what below the fourth quarter rate. But a large favorable shift in
weights, as production and sales of automobiles recovered, helped to
moderate the rise in the deflator, offsetting the effects of the Federal
pay raise. A fixed-weighted price index for private GNP, which is not
affected by these factors, rose at an annual rate of 5.2 per cent in
both the fourth and first quarters. One reason for the continued rapid
rate of price rise in the first quarter was a sharp climb in farm and
food prices, following a three-quarter decline.
GNP PRICE INDEXES(Percentage changes from previous quarter at seasonally adjusted annual rates
1969 1970 1971III IV I II III IV I
GNP Deflator 5.6 4.9 6.4 4.3 4.6 5.9 5.6
Private GNP: 2/fixed-weighted index 1/ 5.1 4.8 4.8 4.8 4.6 5.2 5.2
1/ Fourth quarter of 1965 weights.2/ Confidential.
The cost of fixed investment, which had been accelerating
throughout 1969 and 1970, did slow notably in the first quarter of
1971. A reduced price rise for producers' equipment reflected the
leveling off in automotive product prices after the large fourth-quarter
increase. The slowdown in the construction sector was very sharp, but
probably temporary in view of climbing wage rates and materials prices.
)

II - 34
PRICE CHANGES IN PRIVATE FIXED INVESTMENT(Seasonally adjusted annual rates computed from fixed-weighted indexes 1/)
Four-quarter One-quarter change to:change to:
Q IV QIV- / .2 1970 19711969 1970 QII QIV' QI 2/
Private fixed investment 5.3 6.6 8.4 7.5 4.3
Non-residential structures 8.5 10.2 13.4 11.7 6.1Producers' durable equipment 3.6 4.9 4.4 6.8 3.6Residential structures 5.1 5.7 9.6 4.1 3.4
1/ Fourth quarter of 1965 weights.
2/ Confidential.
An accelerated price rise in the personal consumption sector
offset the slowing in the investment area last quarter. This reflected
in part large automobile price increases early in the quarter. Food
prices also rose more rapidly, offsetting a slower rise for other
nondurables. Service costs rose at a record rate.
PRICE CHANGES IN PERSONAL CONSUMPTION EXPENDITURES(Seasonally adjusted annual rates computed from fixed-weighted indexes- )
Four-quarter One-quarter change to:change to: 1970 1971
Q IV Q IV/ 2/1969 1970 Q III' I Q // .
Personal consumptionexpenditures 4.7 4.5 3.9 4.9 5.2
Durable goods 2.5 3.5 3.8 6.4 7.1Nondurable goods 5.1 3.5 2.4 2.9 2.9Services 5.0 6.0 5.6 6.4 7.1
1/ Fourth quarter of 1965 weights.
2/ Confidential.

II - 35
Comparison of CPI with the PCE price index. The continued
rapid increase in the GNP fixed-weight index for the consumer sectors
in the first quarter contrasts markedly with the slowing of the
Consumer price index. This contrast is largely the result of
differences in the coverage of the two measures. The CPI includes
mortgage interest costs, which rose steeply in 1969 and part of
1970 preceding a sharp drop in early 1971. Interest and other home
financing costs are not directly reflected in the PCE price index,
which uses the slower-rising rent index to indicate price movements
for both owner- and tenant-occupied housing. Prices of new and used
homes are also excluded from the PCE index but included in the durable
goods component of the CPI. (Indirectly they also affect the
estimate for mortgage financing costs). Home prices rose sharply
in 1969 and 1970, but much less so this year. A third inclusion in
the CPI but not in PCE is used cars, which have contributed very substan-
tially to the occasionally erratic movement of the CPI in the last 2
years, but have had little effect on the trend.
An approximate adjustment for these differences in coverage
can be made by using confidential series for the durables and service
components and making some compensating changes in weights. The
"modified CPI" so obtained (see Table below) shows changes much
closer to those of the PCE fixed-weight price index.

II - 36
Sensitive materials prices. Two sensitive indicators of price
change are: (1) the index of prices of sensitive industrial materials
prepared by the staff of the Federal Reserve Board using BLS data and
(2) the index of raw industrial prices published by the Bureau of Labor
Statistics as part of the Bureau's Tuesday Spot Market Price Indexes
and Prices. The BLS weekly index is now an unweighted geometric average
of Tuesday spot prices for 13 commodities. The FRB monthly index has
a broader commodity coverage and is a weighted arithmetic average
incorporating BLS price aggregates (i.e., weighted prices) which are not
available until after the wholesale price index for a given month is
released. The FRB index is less volatile than the BLS index, primarily
because it includes a substantial weight of fabricated products.
Although the two indexes differ greatly in coverage and
weighting, they have traced broadly similar patterns of price movements
in recent years. Following an extended period of decline last year,
both indexes climbed fairly consistently through April of this year. The
movements of both series reflect to a considerable degree price changes
in nonferrous metals. Nonferrous metals have a weight of more than
one-third in the FRB index and nearly one-third in the BLS index,
where they are represented by 4 series, 3 of which are highly volatile
scrap metals.
The most important differences in coverage between the two
indexes is lumber and plywood, which has a large weight in the FRB
index but is not included in the BLS index. The strong rise in prices

II - 37
Foreign agricultural trade. Exports of farm products are
soaring to a new high this fiscal year, led by record shipments of
soybeans and soybean products and by the largest movement of grains
since the world food crisis of 1966. Through March, value of exports
was 18 per cent above a year earlier, reflecting increases both in
quantities shipped and in prices received. Value of imports was also
moderately higher, due to higher prices, as volume was down slightly
from last year. Reduced volume of imports of beef, coffee, tea, crude
rubber and wool were offset in part by larger imports of sugar, cacao,
bananas and nuts.
U. S. FOREIGN AGRICULTURAL TRADEJuly-March 1970-71
PercentzValue from ye
(mil. dol.) Value
age changear earlierlantity Price
(derived) 1/Exports, total 5,877 18.0 11.4 5.9
Grains & feeds 2,112 19.2 13.3 5.3Veg. oils & oilseeds 1,540 29.5 12.3 14.8Animal products 684 13.9 14.9 -0.9Tobacco, unmfg'd 441 -1.9 -5.6 3.9Cotton & linters 345 42, 33.3 7.1Fruits & vegetables 405 0.2 -6.4 7.0
Imports, total 4,271 3.3 -2.0 5.3
Supplementary 2,698 5.9 2.1 3.7(Meat, sugar, etc.)
Complementary 1,573 -0.9 -8.2 7.9(Coffee, cacao,rubber, etc.)
Agricultural trade balance 1 616 3 / 89.0 n.a. n.a.
Net contribution to balance 2/of payments 12183- 175.8 n.a. a
Source: May 1971 issues of two USDA-E.R.S. publications--Foreign AgriculturalTrade of the U.S., and Foreign Gold and Exchange Reserves.
1/ Aggregate values/quantity indexes.2/ Agricultural trade balance minus noncommercial exports plus amounts re-
couped from earlier credit and P.L. 480 transactions. July-Decembercontribution was $766 million and January-March, an estimated $417 million.
3/ $1,696.1 including preliminary April data, 82% above a year earlier.

II - 38
Terms of trade (export/import price ratios) were more favorable
than last year with export prices rising from late fall onward and
import prices edging down in the spring. The margin of farm exports
over imports widened to $1.6 billion ($1.7 billion including preliminary
April data) from $0.9 billion in the comparable period last year. All
of the increase in exports this year has been in commercial sales. The
proportion of exports under P.L. 480 programs declined from 15 per cent
of the total to about 10 per cent. Agriculture's net contribution to
the U.S. balance of payments amounted to almost $1.2 billion, nearly
triple the July-March contribution a year earlier.
A major development this year is the sharply expanded demand
for grains for food and livestock feed in the developed countries.
Poor wheat crops and low carry-in stocks increased demand for U.S.
wheat by the European countries and the third countries usually
supplied by them. Exports of wheat through March amounted to 513
million bushels compared with 385 million last year. Despite prices
a fourth above last year, U.S. corn exports were only 13 per cent below
last year's record shipment, and larger exports of other feed grains
boosted total feed grain tonnage to 6 per cent above last year. Soy-
bean and soybean products benefited from short supplies of competing
products. Through March, shipments of soybeans were up 12 per cent, meal
and cake, up 17 per cent, and oil, up 59 per cent. Cotton exports
are up a third from a year ago, reflecting smaller export availabilities
in competing countries, smaller mill stocks in major exporting countries,
and slightly higher consumption. However, tight supplies of the short
staples wanted by foreign mills for blending with synthetic fibers
are limiting expansion of our exports.
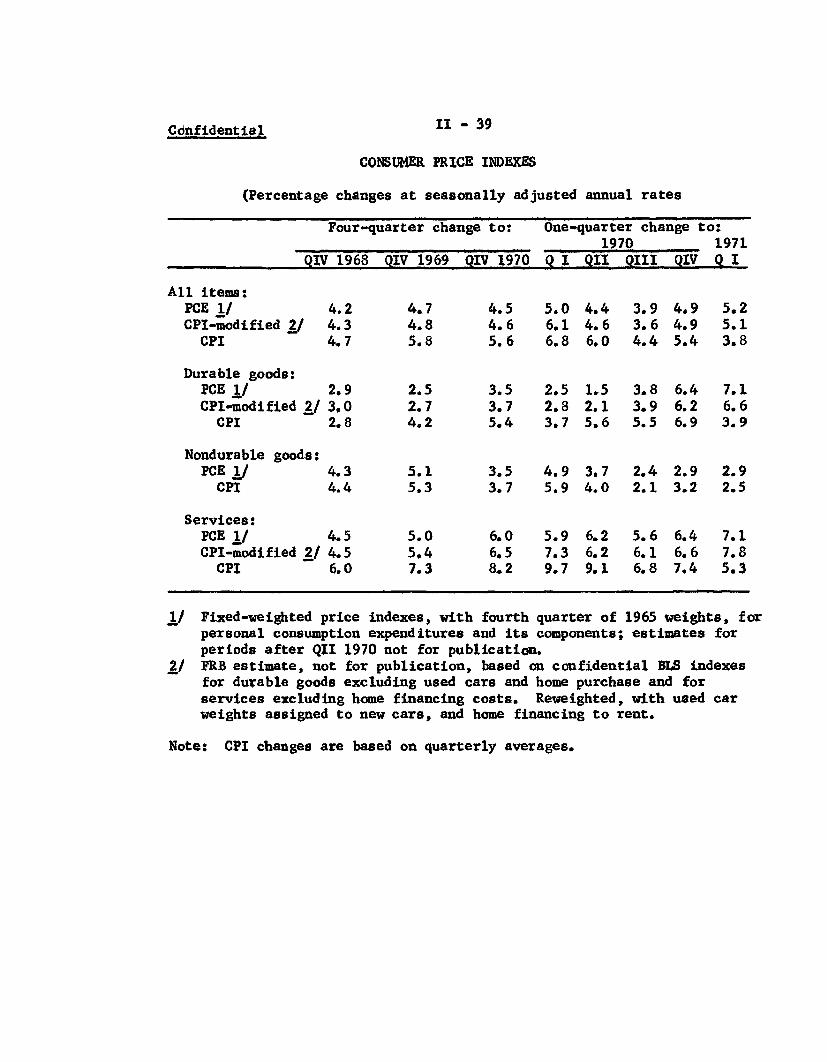
Confidential II - 39
CONSUMER PRICE INDEXES
(Percentage changes at seasonally adjusted annual rates
Four-quarter change to: One-quarter change to:1970 1971
QIV 1968 QIV 1969 QIV 1970 Q I QII III0 QIV Q I
All items:PCE I/ 4.2 4.7 4.5 5.0 4.4 3.9 4.9 5.2CPI-modified 2/ 4.3 4.8 4.6 6.1 4.6 3.6 4.9 5.1
CPI 4.7 5.8 5.6 6.8 6.0 4.4 5.4 3.8
Durable goods:PCE / 2.9 2.5 3.5 2.5 1.5 3.8 6.4 7.1CPI-modified 2/ 3.0 2.7 3.7 2.8 2.1 3.9 6.2 6.6
CPI 2.8 4.2 5.4 3.7 5.6 5.5 6.9 3.9
Nondurable goods:PCE I 4.3 5.1 3.5 4.9 3.7 2.4 2.9 2.9
CPI 4.4 5.3 3.7 5.9 4.0 2.1 3.2 2.5
Services:PCE 1/ 4.5 5.0 6.0 5.9 6.2 5.6 6.4 7.1CPI-modified 2/ 4.5 5.4 6.5 7.3 6.2 6.1 6.6 7.8
CPI 6.0 7.3 8.2 9.7 9.1 6.8 7.4 5.3
1/ Fixed-weighted price indexes, with fourth quarter of 1965 weights, forpersonal consumption expenditures and its components; estimates forperiods after QII 1970 not for publication.
2/ FRB estimate, not for publication, based on confidential BLS indexesfor durable goods excluding used cars and home purchase and forservices excluding home financing costs. Reweighted, with used carweights assigned to new cars, and home financing to rent.
Note: CPI changes are based on quarterly averages.

II - 40
of lumber and plywood earlier this year (after a protracted decline)
accounted for about 70 per cent of the increase in the FRB index in
the January-April period, although hides and skins posted the largest
increase: textiles and nonferrous metals also were important in the
rise in this period. Copper scrap, hides, and burlap were of major
importance in the rise in the BLS series.
COMPARISON OF CHANGES IN INDEXES OF PRICESOF SENSITIVE INDUSTRIAL MATERIALS
(Percentage change, January to April 1971)
Sensitive industrial materials (FRB) 4.0
Lumber and plywood 14.9Nonferrous metals 0.7Textile and fibers 1.6Hides and skins 22.4Iron and steel scrap -10.7
Raw industrials (BLS) 5.2
Copper scrap 24.2Hides 18.9Burlap 18.8Steel scrap -11.8Wood tops - 7.8
The FRB index is not yet available for May, but the BLS index
(based on prices of Tuesdays of the weeks in which the 13th fall,
declined more than 2 per cent from mid-April to mid-May as the price
of copper scrap dropped sharply; prices of hides and burlap also
declined, reversing the increases of the January-April period; and the
price of wool tops was reduced further. Additional increases in prices
of cotton, zinc, rubber and steel scrap largely offset the drop in the
other prices.
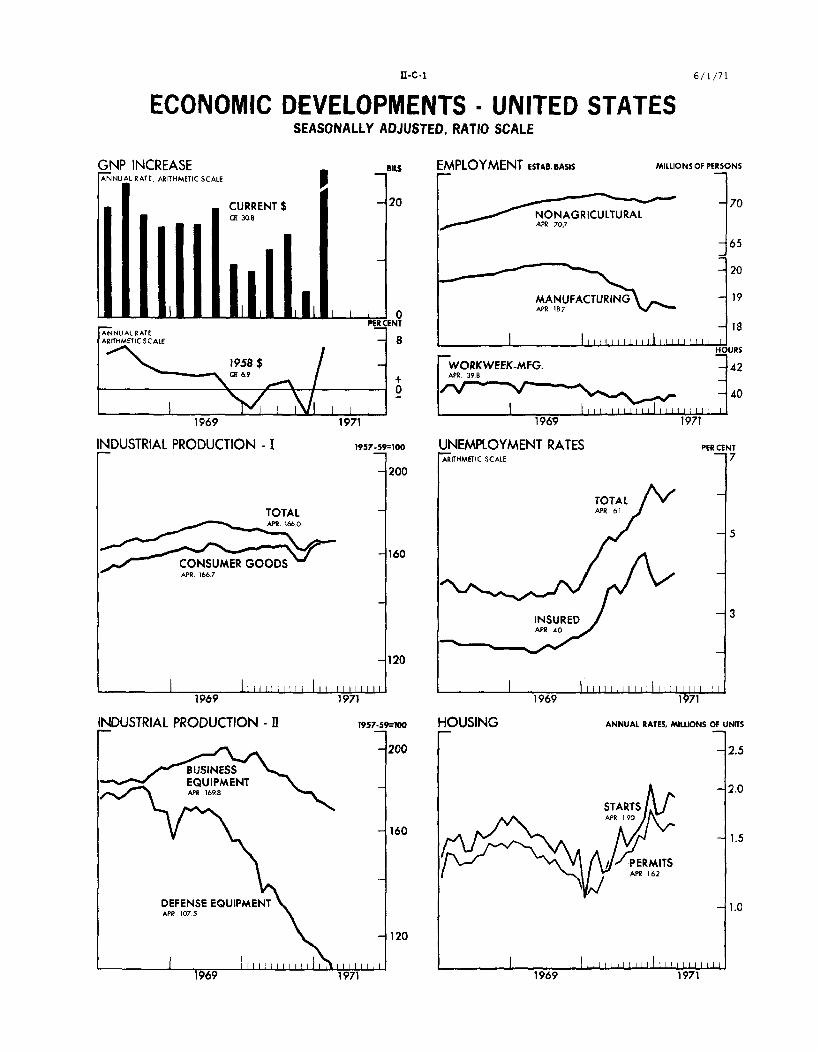
ECONOMIC DEVELOPMENTS - UNITED STATESSEASONALLY ADJUSTED, RATIO SCALE
GNP INCREASE BIL EMPLOYMENT ESTAB. BASIS MILLIONS OF PERSONSANUAL RATE, ARITHMETIC SCALE
CURRENT $ -20 - 70aM.B 308ONAGRICULTURAL
0 APR 707
65
20
MANUFACTURING - 19L a- I. 1 -- 0 APR 187
s
PER CENT g18ANNUAL RATEARITHMETIC SCALE 8I I I I I
HOURS
1958 $ - WORKWEEK-MFG. - 42C(I 6.9 . APR. 398
1 - lI 11111 40
1969 1971 1969 1971
INDUSTRIAL PRODUCTION - I 1957-59=100 UNEMPLOYMENT RATES PERCENTARITHMETIC SCALE 7
200
TOTALTOTAL - APR. 1APR 166.0
5
-160CONSUMER GOODSAPR 1667
INSURED 3
APR. 40
120
1969 1971 1969 1971
INDUSTRIAL PRODUCTION - 11 1957-s59=o HOUSING ANNUAL RATES, MILLIONS OF UNITS
-200 -2.5
BUSINESS;Z;: ~EQUIPMENT -2
STARTSAPR 1 90
160- 1.5
/ PERMITSAPR 162
DEFENSE EQUIPMENT 1.0APR 107 5
120
1969 1971 1969 19711969 1971 1969 1971
n-c.- 6/1/71

II-C-2ECONOMIC DEVELOPMENTS - UNITED STATES
SEASONALLY ADJUSTED, RATIO SCALE
INCOME eILs PRICES AND COSTSANNUAL RATE
PERSONALAPR 841 3
- 800
DISPOSABLE -700Cl 715 CONSUMER *
APR 120 2
1 600
ARIfHMETIC SCALE PER
**** /SAVING RATE
1969 1971
RETAIL SALES
TOTALAPR. 32.3
GAAFAPR. 8.9
71971
ANNUAL RATES. MILUONS OF UNITS
* f I
I____I l I I l M I b'1 I i I I I I I 4
IMPORTS -1.APR. 1.6
1.0
. .. . . . . . . .I
1971
BUSINESS INVESTMENT
PLANT AND EQUIPMENT OUTLAYSANNUAL RATECO 8274
MFG. NEW ORDERS
CAPITAL EQUIPMENTI II IIlAPR 8 A
1969
MANUFACTURERS' INVENTORIESr- RATIO TO UNFILLED ORDERS
APR 77
6/1/71
PER CENT
- .8
_JLDEFENSE PRODUCTSAPR 31 -. 4
I I III I I h I Il I .2
AUTOS
1969

III - 1
THE ECONOMIC PICTURE IN DETAIL
Domestic Financial Situation
Monetary aggregates. The monetary aggregates are estimated
to have risen substantially further in May. M 1 (currency plus private
demand deposits) is estimated to have increased at an annual rate of
14 per cent, above the pace in April and the first quarter. Growth in
M 2 (M1 plus commercial bank time and savings deposits other than large
CD's), also at about a 14 per cent annual rate, was only slightly higher
in May with much of the pickup in the growth rate of M1 offset by a
slowing in the rate of growth of the time and savings deposit component.
The May advance in M 2 was well below the growth rate during the first
quarter, when inflows of time and savings deposits were much stronger.
While May inflows of time and savings deposits other than
large CD's were down somewhat from April and significantly below those
recorded in the first quarter, they remained quite large by historical
standards. All classes of banks continued to receive large time and
savings deposit inflows. Commercial bank sales of CD's increased in
May, about offsetting the April decline in these deposits. Sales to
foreign official institutions accounted for a large part of CD expansion,
but IPC customers also were buyers toward month end, possibly in response
to the rise in CD offering rates that took place over the month.
The adjusted bank credit proxy increased at a somewhat faster
rate in May, reflecting mainly the stronger growth of private demand
deposits and large CD's. In addition, while Euro-dollar liabilities

III - 2
continued to decline in May, they did so at a slower rate than in other
recent months when foreign branch purchases of special Ex-Im and Treasury
certificates biased the liability data downward. Borrowing by bank
affiliates in the commercial paper market, measured on a daily average
basis for the month, will be somewhat higher in May than in April--though
the rise in these liabilities actually occurred in the latter half of
April. On a week to week basis, commercial paper indebtedness has been
moving down since late April.
MONETARY AGGERGATES(Seasonally adjusted, annual rates of change, in per cent)
1970 1971
QIV QI March April May e
1. M1 (currency plus privatedemand deposits) 3.4 8.9 11.6 9.8 14.0
2. M2 (M1 plus commercial banktime and savings depositsother than large CD's) 9.2 17.8 18.9 12.6 13.5
3. M3 (M2 plus savings depositsat mutual savings banksand S & L's) 9.7 19.0 19.8 16.1 n.a.
4. Adjusted bank credit proxy 8.3 10.9 8.9 5.3 7.5
5. Commercial bank time andsavings deposits 21.8 27.3 25.9 10.7 14.0
a. large CD's 79.4 27.9 19.2 -21.3 21.2
b. other time and savings 15.4 27.2 27.0 14.8 13.0
6. Savings deposits at mutualsavings banks and S & L's 11.5 23.3 24.9 21.7 n.a.
e - estimated.
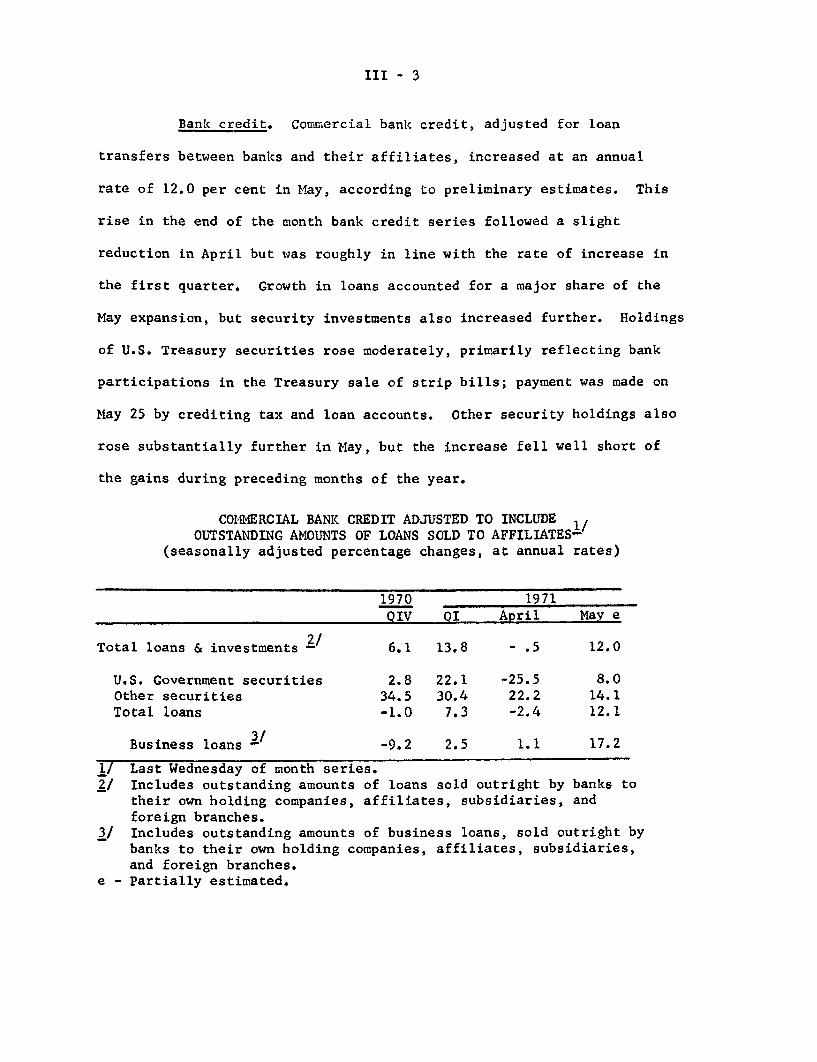
III - 3
Bank credit. Commercial bank credit, adjusted for loan
transfers between banks and their affiliates, increased at an annual
rate of 12.0 per cent in May, according to preliminary estimates. This
rise in the end of the month bank credit series followed a slight
reduction in April but was roughly in line with the rate of increase in
the first quarter. Growth in loans accounted for a major share of the
May expansion, but security investments also increased further. Holdings
of U.S. Treasury securities rose moderately, primarily reflecting bank
participations in the Treasury sale of strip bills; payment was made on
May 25 by crediting tax and loan accounts. Other security holdings also
rose substantially further in May, but the increase fell well short of
the gains during preceding months of the year.
COMMERCIAL BANK CREDIT ADJUSTED TO INCLUDEOUTSTANDING AMOUNTS OF LOANS SOLD TO AFFILIATES 1/
(seasonally adjusted percentage changes, at annual rates)
1970 1971
QIV QI April May e
Total loans & investments 2/ 6.1 13.8 - .5 12.0
U.S. Government securities 2.8 22.1 -25.5 8.0Other securities 34.5 30.4 22.2 14.1Total loans -1.0 7.3 -2.4 12.1
Business loans 3/ -9.2 2.5 1.1 17.2
1/ Last Wednesday of month series.2/ Includes outstanding amounts of loans sold outright by banks to
their own holding companies, affiliates, subsidiaries, andforeign branches.
3/ Includes outstanding amounts of business loans, sold outright bybanks to their own holding companies, affiliates, subsidiaries,and foreign branches.
e - Partially estimated.

III - 4
The sharp rise in loans in May was led by exceptionally large
increases in business loans and loans to nonbank financial institutions.
A further rapid increase was also posted for real estate loans, while
modest gains were recorded in other major loan categories.
The sharp May upturn in business loans in part reflects seasonal
adjustment problems. Borrowing around the mid-April and mid-March tax
dates was considerably lighter than in earlier years, and thus it seems
likely that loan repayments were also well below normal in May. As a
result, the use of seasonal adjustment factors reflecting borrowing
patterns of earlier years probably resulted in an overstatement of the
strength of the May loan increase. For the April-May period combined,
the expansion in business loans was at an annual rate of 9 per cent,
but since the first of the year--which may represent a better averaging
out of the seasonal adjustment problems--business loans have expanded
at about a 5 per cent annual rate. Wholesalers and retailers and
machinery producers were responsible for much of the May strengthening
in loan growth.
A marked increase in loans to nonbank financial institutions
in May may also be attributable in part to a seasonal adjustment problem.
But this also reflects heavy borrowing by mortgage brokers to finance
warehousing of mortgages. Sales finance companies also apparently
increased their bank borrowing.

III - 5
Some pickup in loans to businesses and nonbank financial
institutions was, of course, to be expected in May in view of the
improvement in business activity. In addition, the competitive
position of banks vis-a-vis the commercial paper market has improved
in recent weeks with the increase in commercial paper rates. Finally,
bank lending policies appear to have become more aggressive recently.
In a survey conducted on April 30, a large proportion of the reporting
banks indicated that their loan commitment policies had eased further
since early in the year. (A full review of this survey will be provided
in the Supplement.)
With the further rise of CD rates in May, the spread between
these rates and the prime lending rate of banks has narrowed appreciably.
Since last fall CD rates have been below their ceilings, and the prime
rate has usually been 100-150 basis points above the 3 month CD rate.
But currently, the spread is only 50 basis points. The one year CD
rate is presently at the prime rate, rather than 75-100 basis points
below it. These interest rate relations suggest that banks may raise
the prime rate, if recent strength in loan demand continues.
Nonbank thrift institutions. Despite the rise in yields on
market securities, deposit inflows to the thrift institutions continued
unusually large in April, and apparently in May--though data for May are
still incomplete. Total flows available to S&L's in April were augmented
by a further increase in repayments on outstanding mortgages, to a record
annual rate. Essentially all of this total April cash flow was used to
acquire mortgages and repay advances; liquid asset holdings were virtually
unchanged. Comparable information for savings banks is not yet available.
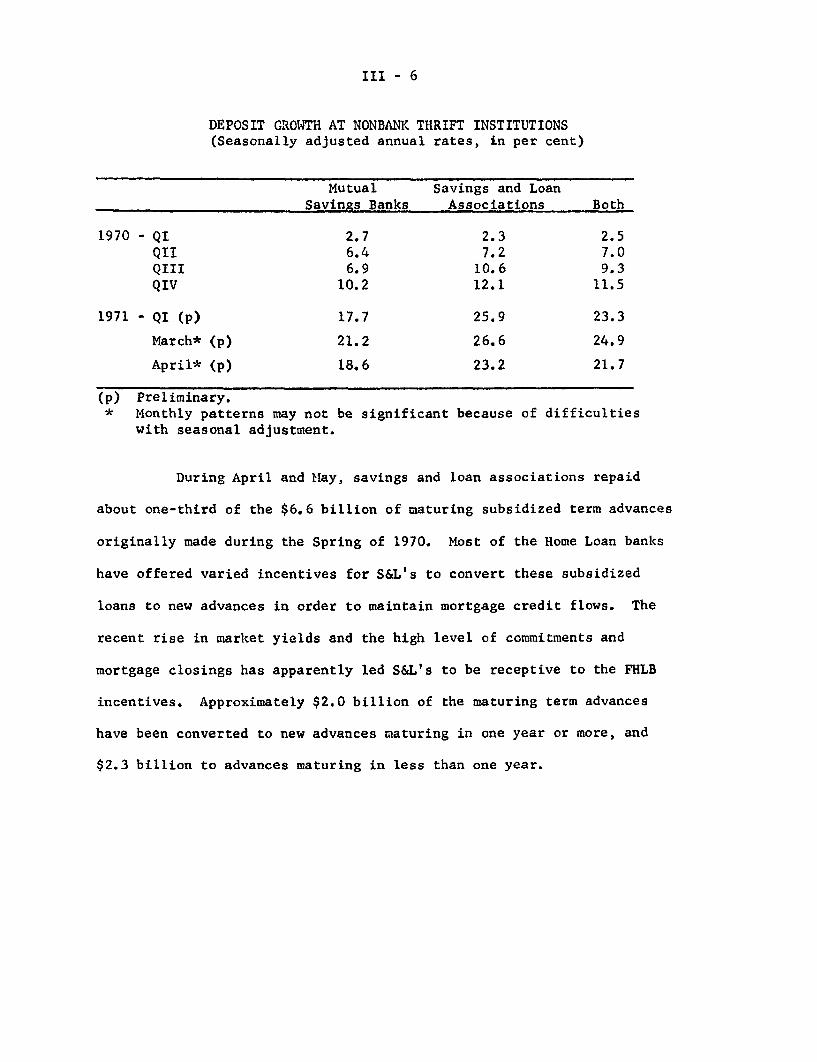
III - 6
DEPOSIT GROWTH AT NONBANK THRIFT INSTITUTIONS(Seasonally adjusted annual rates, in per cent)
Mutual Savings and LoanSavings Banks Associations Both
1970 - QI 2.7 2.3 2.5QII 6.4 7.2 7.0QIII 6.9 10.6 9.3QIV 10.2 12.1 11.5
1971 - QI (p) 17.7 25.9 23.3
March* (p) 21.2 26.6 24.9
April* (p) 18.6 23.2 21.7
(p) Preliminary.* Monthly patterns may not be significant because of difficulties
with seasonal adjustment.
During April and May, savings and loan associations repaid
about one-third of the $6.6 billion of maturing subsidized term advances
originally made during the Spring of 1970. Most of the Home Loan banks
have offered varied incentives for S&L's to convert these subsidized
loans to new advances in order to maintain mortgage credit flows. The
recent rise in market yields and the high level of commitments and
mortgage closings has apparently led S&L's to be receptive to the FHLB
incentives. Approximately $2.0 billion of the maturing term advances
have been converted to new advances maturing in one year or more, and
$2.3 billion to advances maturing in less than one year.

III - 7
Mortgage market. The continued large inflows of funds to
thrift institutions have been accompanied by ready availability of
mortgage credit, although yields have increased as market interest
rates have risen. At S&L's during April, seasonally adjusted new and
outstanding mortgage commitments as well as mortgage closings reached
new highs. Bolstered by heavy demands for credit to finance market
transactions as well as to refinance older loans, S&L mortgage commit-
ments outstanding by the end of April were more than double their April
1970 volume. At the more diversified New York State savings banks,
mortgage commitment backlogs also rose further in April, but remained
below the highs established in 1964-65 when the yield spread favoring
home mortgages over corporate bonds was quite attractive.
MORTGAGE COMMITMENTS OUTSTANDING AT THRIFT INSTITUTIONS 1/(Billions of dollars, seasonally adjusted)
N.Y. State Both ThriftDate S&L's Savings Banks Institutions
1970 - High 8.1 (Dec.) 2.6 (Jan.) 10.1 (Dec.)Low 5.2 (Mar.) 1.8 (Oct., Nov.) 7.7 (Mar.)
April 5.4 2.3 7.7
1971
January 8.3 2.1 10.4February 8.9 2.3 11.2March 10.1 2.5 12.6April 11.1 2.8 13.8
1/ Based on data, including loans in process, from Federal Home LoanBank Board and Savings Banks Association of New York State.

III - 8
The average contract interest rate on conventional new-home
mortgages in the primary market declined much less in April than in
earlier months of 1971. Two regions, in fact, posted small rate
increases, and the unusually narrow rate spread that had prevailed
in March between the Northeast and the West widened. During May,
there were reports of scattered increases in these rates, reflecting
recent shifts in borrower and investor expectations.
INTEREST RATES ON CONVENTIONAL HOME MORTGAGES(In per cent)
Selected RegionsWest minus
Date United States Northeast West Northeast(basis points)
1970 - High 8.60 8.30 9.40 110
1971 - January 7.95 7.80 8.05 25February 7.75 7.50 7.90 40March 7.60 7.45 7.60 15April 7.55 7.35 7.65 30
NOTE: FHA series, rounded to nearest 5 basis points, for first mortgagesto finance purchases of new homes.
In the particularly sensitive secondary market, returns to
lenders on Government-underwritten mortgages, which had begun to move
upward early in April in FNMA's forward commitment purchase auctions,
reached new 1971 highs in the May 24 auction. On 6-month commitments,
yields rose to 7.97 per cent, 29 basis points above the May 10 level
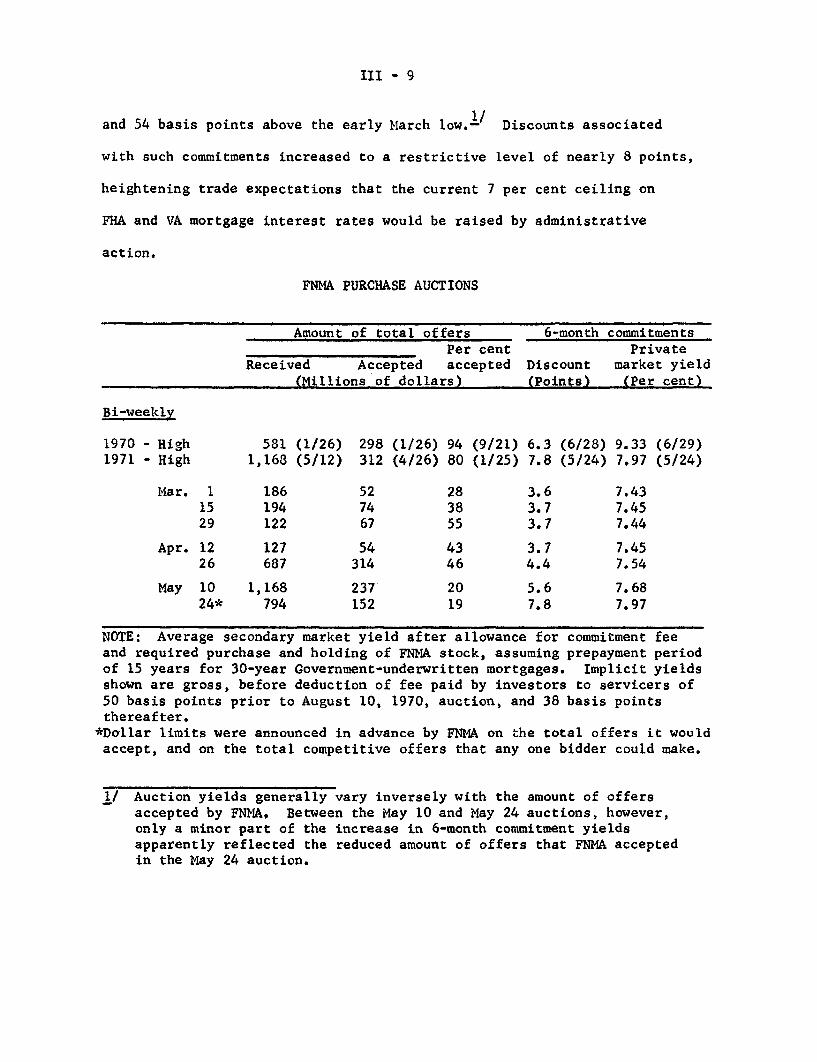
III - 9
and 54 basis points above the early March low.1/ Discounts associated
with such commitments increased to a restrictive level of nearly 8 points,
heightening trade expectations that the current 7 per cent ceiling on
FHA and VA mortgage interest rates would be raised by administrative
action.
FNMA PURCHASE AUCTIONS
Amount of total offers 6-month commitmentsPer cent Private
Received Accepted accepted Discount market yield(Millions of dollars) (Points) (Per cent)
Bi-weekly
1970 - High 581 (1/26) 298 (1/26) 94 (9/21) 6.3 (6/28) 9.33 (6/29)1971 - High 1,168 (5/12) 312 (4/26) 80 (1/25) 7.8 (5/24) 7.97 (5/24)
Mar. 1 186 52 28 3.6 7.4315 194 74 38 3.7 7.4529 122 67 55 3.7 7.44
Apr. 12 127 54 43 3.7 7.4526 687 314 46 4.4 7.54
May 10 1,168 237 20 5.6 7.6824* 794 152 19 7.8 7.97
NOTE: Average secondary market yield after allowance for commitment feeand required purchase and holding of FNMA stock, assuming prepayment periodof 15 years for 30-year Government-underwritten mortgages. Implicit yieldsshown are gross, before deduction of fee paid by investors to servicers of50 basis points prior to August 10, 1970, auction, and 38 basis pointsthereafter.
*Dollar limits were announced in advance by FNMA on the total offers it wouldaccept, and on the total competitive offers that any one bidder could make.
1/ Auction yields generally vary inversely with the amount of offersaccepted by FNMA. Between the May 10 and May 24 auctions, however,only a minor part of the increase in 6-month commitment yieldsapparently reflected the reduced amount of offers that FNMA acceptedin the May 24 auction.

III - 10
The recent rise in secondary market yields indicated in
FNMA's purchase auctions has been accompanied by record offerings
from mortgage companies anxious to obtain long-term financing commit-
ments once it became evident that interest rates had reversed their
earlier downtrend. In the expectation that mortgage prices would
continue to rise, many mortgage companies had agreed earlier to finance
homebuilders, and had been holding loans in warehouse, but without
obtaining take-out commitments from any permanent lenders. Field
reports indicate that these take-outs have become difficult to obtain
elsewhere than from FNMA, in view of uncertainties about future interest
rate developments.
To limit demands on its resources and to spread these resources
among more market participants, FNMA announced in advance of its May 24
auction that it would reinstate ceilings in effect last year on the
amount of total and individual offers that it would accept. Since then,
FNMA has tightened these ceilings and has indicated that it would resume
weekly auctions for the first time in 1971. Results of the initial weekly
auction of June 2 will be included in the Greenbook Supplement.
During the first quarter, the quality of home mortgage debt
outstanding showed no significant change, according to the Mortgage
Bankers Association series which is heavily weighted with FHA and VA
loans. The average delinquency rate declined normally for the time
of the year, as a seasonal improvement in short-term delinquencies was
partly offset by some increase in longer-term delinquencies. The over-all
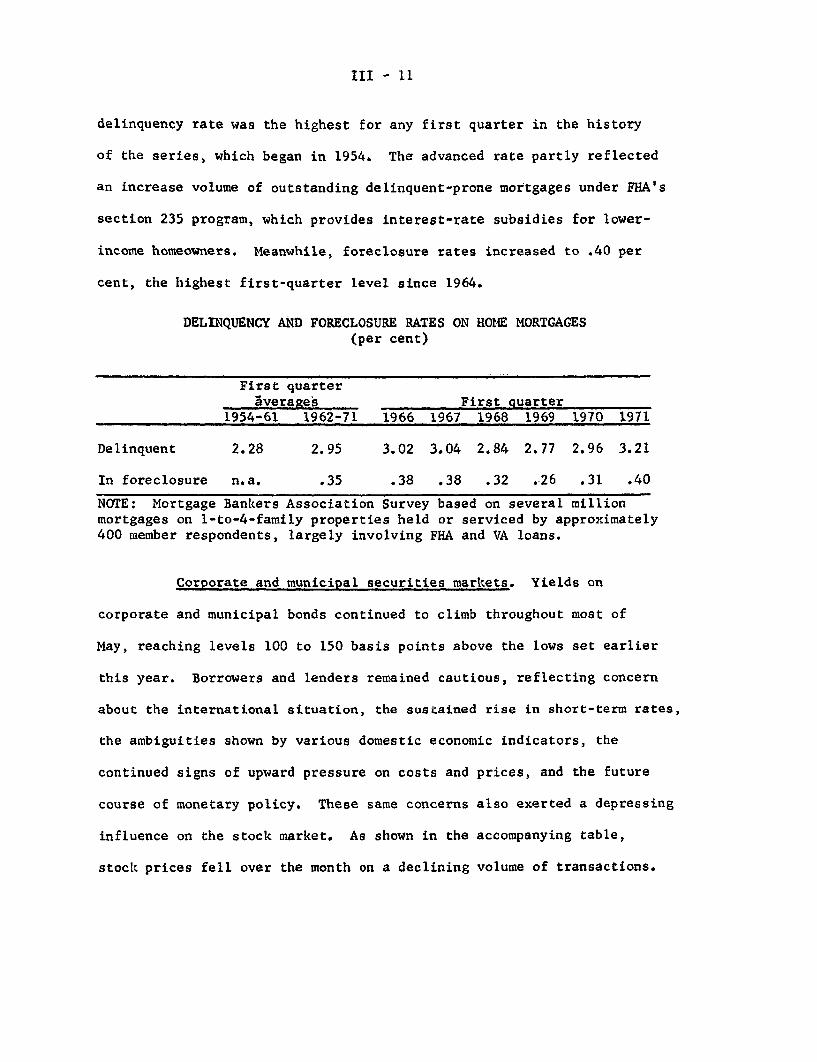
III - 11
delinquency rate was the highest for any first quarter in the history
of the series, which began in 1954. The advanced rate partly reflected
an increase volume of outstanding delinquent-prone mortgages under FHA's
section 235 program, which provides interest-rate subsidies for lower-
income homeowners. Meanwhile, foreclosure rates increased to .40 per
cent, the highest first-quarter level since 1964.
DELINQUENCY AND FORECLOSURE RATES ON HOME MORTGAGES(per cent)
First quarteraverages First quarter
1954-61 1962-71 1966 1967 1968 1969 1970 1971
Delinquent 2.28 2.95 3.02 3.04 2.84 2.77 2.96 3.21
In foreclosure n.a. .35 .38 .38 .32 .26 .31 .40
NOTE: Mortgage Bankers Association Survey based on several millionmortgages on 1-to-4-family properties held or serviced by approximately400 member respondents, largely involving FHA and VA loans.
Corporate and municipal securities markets. Yields on
corporate and municipal bonds continued to climb throughout most of
May, reaching levels 100 to 150 basis points above the lows set earlier
this year. Borrowers and lenders remained cautious, reflecting concern
about the international situation, the sustained rise in short-term rates,
the ambiguities shown by various domestic economic indicators, the
continued signs of upward pressure on costs and prices, and the future
course of monetary policy. These same concerns also exerted a depressing
influence on the stock market. As shown in the accompanying table,
stock prices fell over the month on a declining volume of transactions.

III - 12
BOND YIELDS(per cent)
New AaaCorporate Bonds-
7.68 (12/18)9.30 (6/18)
6.76 (1/29)8.23 (5/21)
7.547.81
7.887.938.238.06
Long-term Stateand Local Bonds 2/
5.33 (12/10)7.12 (5/28)
5.00 (3/18)5.96 (5/20)
5.485.69
5.845.965.965.86
1970
LowHigh
1971
LowHigh
Week of:
April 2330
May 7142128
1/ With call protection (includes some issues with 10-year protection).2/ Bond Buyer (mixed qualities).
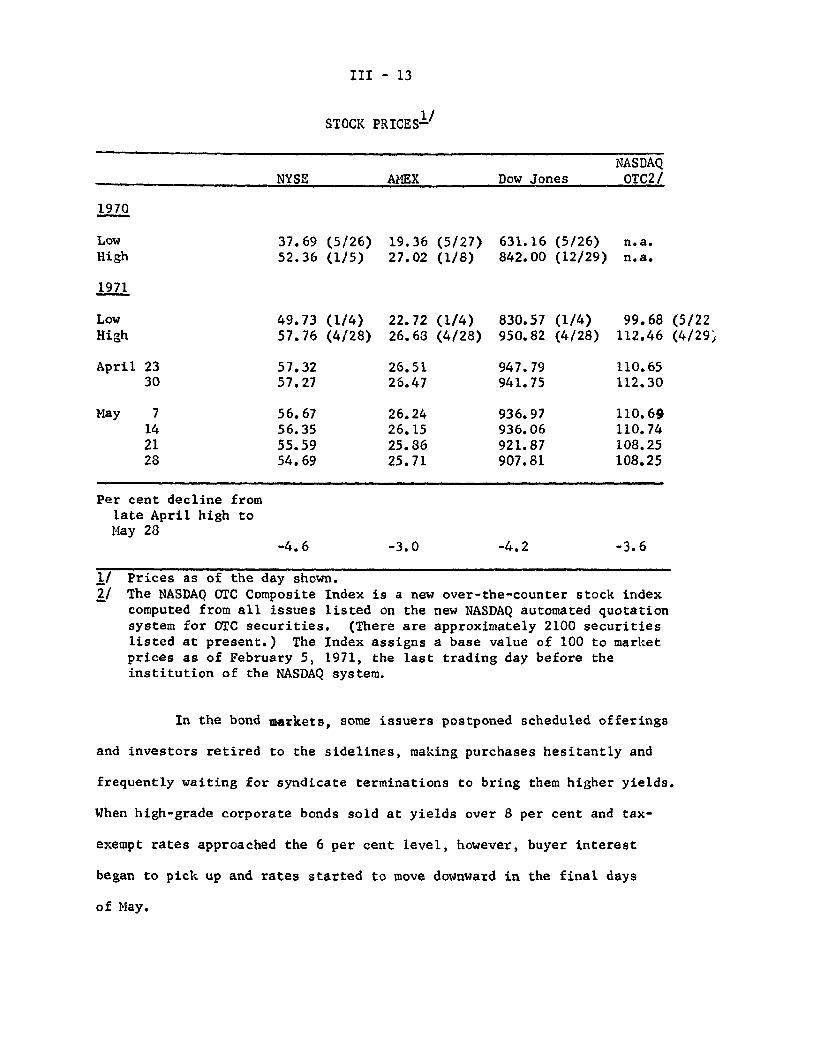
III - 13
STOCK PRICES 1/
NASDAQNYSE AMEX Dow Jones OTC2/
37.69 (5/26)52.36 (1/5)
49.73 (1/4)57.76 (4/28)
57.3257.27
56.6756.3555.5954.69
19.36 (5/27)27.02 (1/8)
22.72 (1/4)26.68 (4/28)
26.5126.47
26.2426.1525.8625.71
631.16 (5/26) n.a.842.00 (12/29) n.a.
830.57 (1/4)950.82 (4/28)
947.79941.75
936.97936.06921.87907.81
99.68 (5/22112.46 (4/29)
110.65112.30
110.69110.74108.25108.25
Per cent decline fromlate April high toMay 28
-4.6 -3.0 -4.2 -3.6
1/ Prices as of the day shown.2/ The NASDAQ OTC Composite Index is a new over-the-counter stock index
computed from all issues listed on the new NASDAQ automated quotationsystem for OTC securities. (There are approximately 2100 securitieslisted at present.) The Index assigns a base value of 100 to marketprices as of February 5, 1971, the last trading day before theinstitution of the NASDAQ system.
In the bond markets, some issuers postponed scheduled offerings
and investors retired to the sidelines, making purchases hesitantly and
frequently waiting for syndicate terminations to bring them higher yields.
When high-grade corporate bonds sold at yields over 8 per cent and tax-
exempt rates approached the 6 per cent level, however, buyer interest
began to pick up and rates started to move downward in the final days
of May.
1970
LowHigh
1971
LowHigh
April 2330
May 7142128

III - 14
As in April, the upward movement of corporate rates in May
retarded the flow of new corporate bonds to the market. With the
calendar lightened by about $750 million of postponements, the May
volume of public bond offerings remained below the record first-quarter
level. With corporate financial positions now permitting more flexible
schedulings than earlier this year, the recent uptrend of long-term
bond yields has not precipitated a rush of issuers to market, as occurred
after the February rise in rates. Underwriters report that there are
still a large number of firms planning long-term debt issues, but some
prospective borrowers do not need the money immediately and may be
delaying their financing in anticipation of lower rates this summer.
Thus, the staff estimates that the June public bond volume will be about
$2.5 billion, up less than seasonally from May.
CORPORATE SECURITY OFFERINGS(Monthly or monthly averages, in millions of dollars)
BondsPublic Private Stocks Total
1969 - Year 1,061 468 700 2,2291970 - Year 2,099 403 713 3,245
1971 - QI 2,790 505 769 4,063
QII e/ 2,287 550 1,033 3,870
April e/ 2,160 450 1,300 3,910
May e/ 2,200 500 900 3,600June e/ 2,500 700 900 4,100
e/ Estimated.

III - 15
Although second-quarter public bond volume will not match
the record first-quarter financing, issue volume in other sectors of
the long-term securities markets may well be larger than in any quarter
of the last two years. Available evidence from life insurance companies
suggests that takedowns of private placements in the second quarter will
exceed the first-quarter average. New equity issues have continued at
a brisk pace in spite of the recent downdrift in stock prices, and the
staff now estimates that volume for both May and June will be close to
$1 billion. Underwriters report a continuing trend toward more stock
issues by utilities; and, of course, the July total will be ballooned
by the closing of the subscription period for the $1.4 billion issue of
convertible preferred stock by AT&T.
The sustained large volume of offerings by State and local
governments and the reduced rate of acquisitions by commercial banks
in late April and May depressed the tax-exempt market, and yields
reached new highs for this year in mid-May. However, fire and casualty
company purchases have remained high, bank buying picked up again in
recent weeks, and the market appears to have stabilized. Several large
negotiated issues helped raise May volume to $2.2 billion. The staff
estimates that the June total will probably be around $2 billion,
binging sales of long-term municipal bonds for the second quarter to
about $6.1 billion, over 90 per cent of the total quarterly sales
anticipated by State and local units according to the latest FRB-Census
survey of State and local long-term bond anticipations. 1/
1/ An analysis of State and local borrowing plans and realizations forthe first quarter, and anticipations for the second quarter, basedon the FRB-Census survey, will be in an appendix to the Supplement.

III - 16
STATE AND LOCAL GOVERNMENT OFFERINGS(Monthly or monthly averages, in millions of dollars)
Long-term Net Short-term
1969 - Year 991 294
1970 - Year 1,515 383
1971 - QI 2,230 554e
QII e/ 2,017 n.a.
April e/ 1,888 750
May e/ 2,200 576
June e/ 2,000 n.a.
e/ Estimated.Note: Long-term offerings are gross. Short-term offerings are Federal
Reserve Board estimates of net sales.
Net short-term municipal security sales remained unusually
high in April and May. Large tax-anticipation issues--particularly by
units in the Northeast, which have had problems in financing current
operating expenditures--are responsible for much of this growth. Short-
term rates did not rise so steeply as long-term rates over May, however,
since the municipal note market has benefitted from the apparent desire
of buyers to shorten the maturity structure of their holdings.
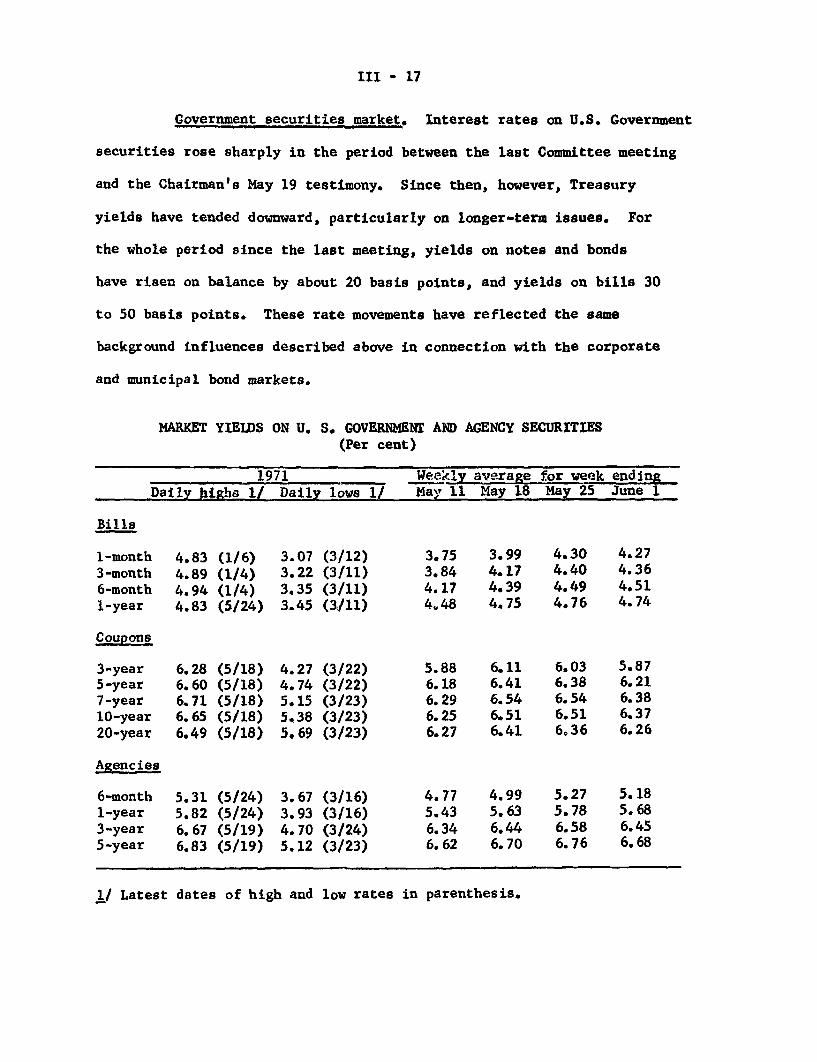
III - 17
Government securities market. Interest rates on U.S. Government
securities rose sharply in the period between the last Committee meeting
and the Chairman's May 19 testimony. Since then, however, Treasury
yields have tended downward, particularly on longer-term issues. For
the whole period since the last meeting, yields on notes and bonds
have risen on balance by about 20 basis points, and yields on bills 30
to 50 basis points. These rate movements have reflected the same
background influences described above in connection with the corporate
and municipal bond markets.
MARKET YIELDS ON U. S. GOVERNMENT AND AGENCY SECURITIES(Per cent)
1971 Weekly average for week ending
Daily highs 1/ Daily lows 1/ May 11 May 18 May 25 June 1
Bills
1-month 4.83 (1/6) 3.07 (3/12) 3.75 3.99 4.30 4.273-month 4.89 (1/4) 3.22 (3/11) 3.84 4.17 4.40 4.36
6-month 4.94 (1/4) 3.35 (3/11) 4.17 4.39 4.49 4.51
1-year 4.83 (5/24) 3.45 (3/11) 4.48 4.75 4.76 4.74
Coupons
3-year 6.28 (5/18) 4.27 (3/22) 5.88 6.11 6.03 5.875-year 6.60 (5/18) 4.74 (3/22) 6.18 6.41 6.38 6.217-year 6.71 (5/18) 5.15 (3/23) 6.29 6.54 6.54 6.3810-year 6.65 (5/18) 5.38 (3/23) 6.25 6.51 6.51 6.3720-year 6.49 (5/18) 5.69 (3/23) 6.27 6.41 6,36 6.26
Agencies
6-month 5.31 (5/24) 3.67 (3/16) 4.77 4.99 5.27 5.181-year 5.82 (5/24) 3.93 (3/16) 5.43 5.63 5.78 5.683-year 6.67 (5/19) 4.70 (3/24) 6.34 6.44 6.58 6.455-year 6.83 (5/19) 5.12 (3/23) 6.62 6.70 6.76 6.68
1/ Latest dates of high and low rates in parenthesis.
III - 18
In the market for Treasury coupon issues earlier upward rate
pressures had been intensified by selling on the part of speculative
holders seeking to capture capital gains while the upturn of interest
rates was still in an early stage. Since May 19, however, pressure to
liquidate speculative positions seems to have dissipated. The virtual
absence of any build-up of trading positions in the Treasury's May re-
financing contributed to this improvement, and dealers holdings of all
coupon issues have been substantially reduced over recent weeks to
rather moderate proportions. The System helped to reduce the overhang
of speculative positions by purchasing some $130 million of coupon
issues during the early weeks of May when yields were still rising.
Yields on Treasury bills have shown less tendency to decline
since May 19. This has reflected the combination of some further
firming in money market costs and an end-of-month concentration of
bill auctions. The latter included a $1.6 billion strip offering
of short bills for cash, as well as the usual monthly and weekly
operations. Dealers came through these auctions with bill positions
of only moderate size, after allowance for the usual month-end build-up.

III - 19
DEALER POSITIONS IN GOVERNMENT AND AGENCY SECURITIES(In millions of dollars)
AprilDaily average May 10 May 17 May 24 June 1
Treasury securities
Total 4,869 2682 2029 2093 3334
Treasury bills (total) 534 1.584 1.307 1,506 3.751
Due in 92 days or less 982 341 367 683 521
93 days or over 2,552 1,244 940 823 2,230
Treasury notes and bonds(Total) 1,336 1,098 723 587 584
Due within 1-year 483 330 193 236 237
1-5 years 416 348 189 102 138
over 5 years 437 420 341 248 209
Agency securities
Total 1 125 820 790 744 925
Due within 1-year 570 345 346 415 442
Over 1-year 555 475 444 330 483
New issue activity in the Federal agency market continued to
be relatively light in May, but the trend toward somewhat longer maturities
is still in evidence with FNMA including a $250 million 5-year maturity
in their latest offering. New agency issues have raised only a modestnew
$47 million of net/funds in May as FHLB has repaid debt on balance.
Nonetheless, with interest rates in competing financial markets rising,

III - 20
the upward movement in agency market yields which began in mid-March
was sustained. Since May 10, these yields have risen further by 10
to 48 basis points with the largest increases occurring in maturities
of one year and under.
Other short-term credit markets. Short-term rates have
continued their general upward movement over the past five weeks, with
the increases ranging from 11 to 75 basis points. The largest
advances were in commercial and finance company paper rates; 3-month
commercial paper is now at 5-1/2 per cent, and thus is as high as
the prime rate for the first time since October 1970. These rate
increases have occurred despite continued limited use of the short-
term open market by borrowers.
Commercial and finance company paper outstanding (seasonally
adjusted) increased only $209 million for April, following a $1.6 billion
decline in March. Dealer paper declined $432 million, the third con-
secutive monthly decline, while directly-placed paper outstanding,
on the other hand, rose $539 million. The rise in directly-placed
paper was primarily in auto finance company paper outstanding, re-
flecting auto sales contests held early in April. The most recent
data available for May suggest this increase was temporary.
Bank-related paper outstanding increased $102 million over
the month. This is the first monthly increase since July 1970 and the
advance reflects financing by banks of their nonbank subsidiaries.

III - 21
SELECTED SHORT-TERM INTEREST RATES(Wednesday Quotation - Discount Basis)
1970 1971 Net ChangeHighs Lows April 28 May 12 May 26 April 28 May 26
1-month
Commercial paperFinance paperBankers' acceptancesCertificates ofdeposit--new issue 1/
Treasury bill
9.259.009.00
5.505.005.50
4.504.134.88
7.75 5.00 4.387.84 4.58 3.86
4.754.505.13
5.134.745.25
4.50 4.75 +.373.80 4.33 +.47
3-month
Commercial paperFinance paperBankers' acceptancesCertificates ofdeposit--new issue 1/
Treasury bill
9.258.259.00
6.005.505.50
6.75 5.507.93 4.74
5.004.255.00
4.634.04
4.884.505.13
5.505.005.38
4.75 5.00 +.373.94 4.40 +.36
6-month
Bankers' acceptancesTreasury bill
9.00 5.50 5.007.99 4.78 4.32
5.13 5.38 +.384.22 4.43 +.11
12-month
Certificates ofdeposit--new issue 1/
Treasury bill
Prime municipal notes
7.50 5.50 5.137.62 4.74 4.54
5.80 2.95 2.85
5.25 5.50 +.374.54 4.68 +.14
3.20 3.30 +.45
1/ Investment yield basis. Highs for certificates ofceilings effective as of January 21, 1970.
deposit are
Source: Wall Street Journal's Money Rates for commercial and finance
paper and bankers' acceptances; all other data from the
Federal Reserve Bank of New York.
+.63+.62+.37
+.50+.75+.38

III - 22
COMMERCIAL AND FINANCE COMPANY PAPER(End-of-month data, in millions of dollars)
February March April
Total commercial andfinance paper 1/ 32,574 30,954 31,163
Bank related 2/ 1,901 1,692 1,794Nonbank related 3/ 30,673 29,262 29,369
Placed through dealers 13,758 12,880 12,448Placed directly 16,915 16,382 16,921
Total commercial andfinance paper 1/ - 409 -1,620 209
Bank related 2/ - 129 - 209 102Nonbank related 3/ - 280 -1,411 107
Placed through dealers - 1 - 878 - 432Placed directly - 279 - 533 539
1/ Combines seasonally adjusted nonbank-related paper and seasonallyunadjusted bank-related paper.
2/ Seasonally unadjusted.
3/ Seasonally adjusted.

III -23
Federal finance. The staff continues to project a Federal
deficit in the unified budget of about $21 billion for the current fiscal
year. However, recent experience suggests that both receipts and outlays
may be below the levels projected in the preceding Greenbook. The
expected shortfall in outlays is reflected in several categories of
expenditures and lending, while the shortfall in receipts is in personal
income tax payments on current 1971 liabilities. Not only did the final
April figure on such payments come in below earlier estimates, preliminary
data for May also appear to have been on the low side.
Since the preceding Greenbook, the staff has also lowered
Federal expenditure estimates for fiscal 1972, by about $2.0 billion. Of
course, the fiscal 1972 outcome is still highly uncertain because Congress
has not completed action on a number of important bills. But if the
current trend continues, the net effect of Congressional action may be
to lower outlays below previous staff estimates. For example, it now
appears likely that the $5.0 billion general revenue sharing program
proposed by the Administration will not be enacted in time to affect out-
lays in fiscal year 1972, Furthermore, the present version of Congressman
Mills' $10 billion welfare reform and social security bill (HR-1), which
was expected to offset the loss of general revenue sharing, would not
take effect until the start of fiscal 1973. Additional areas of un-
certainty include the specifics of a bill involving a pay raise for the
military (to move toward an all volunteer army); the threatened
Presidential veto of legislation providing for an acceleration of public
works program; and increases in social security taxes included in
Congressman Mills' welfare bill.
III - 24
The revisions in the budget estimates since the preceding
Greenbook reduce the high employment surplus in calendar 1971 slightly,
since spending on an NIA basis--in contrast to the unified budget
measurement--has been running slightly stronger than recently estimated.
Thus, the near balance in the high employment budget experienced in 1970
is still expected to persist this year.
The Treasury cash balance at the end of May was about $6.9
billion. This is $3.5 billion above the level projected a month ago,
partly because the international currency crisis brought in a large
amount of money--nearly $3 billion in May--through the issuance of
special Treasury certificates to foreign central banks, and partly
because the Treasury borrowed $1.6 billion sooner than had been
expected--in the form of a short-term bill strip.
The timing and amount of future Treasury market borrowing
operations will be significantly affected by what happens to the
special issues held by foreign central banks. The present staff pro-
jection assumes that these holdings will remain about unchanged on
balance over the next two months. On this basis, the Treasury may
require a total of about $5.5 billion of new cash from now until late
July with the next borrowing probably to be announced in late June.
This amount of late June-July borrowing would be roughly similar in
magnitude to Treasury borrowing a year ago, but somewhat larger than
in some other recent years.

III - 25
PROJECTION OF TREASURY CASH OUTLOOK(In billions of dollars)
May June July
Total net borrowing 2.5 -2.5 5.5
Weekly and monthly bills 1.6 -- --Tax bills -- -2.5Coupon issues -1.7 -- --As yet unspecified new
borrowing -- 5.5Other (debt repayments, etc.) 2.6- -
Plus: Other net financial sources- -.9 -1.9 .1
Plus: Budget surplus or deficit (-) -3.6 4.0 -7.5
c/Equals: Change in cash balance -2.0- -.4 -1.9
Memoranda: Level of cash balance,end of period 6.9-" 6.5 4.6
Derivation of budgetsurplus or deficit:Budget receipts 13.7 22.6 13.5Budget outlays 17.3 18.6 21.0
Maturing coupon issues d/held by public 5.8- -- --
Net agency borrowing -.4 .3 .5
a/ Includes about $2.8 billion in sales of Treasury securities to foreigncentral banks.
b/ Checks issued less checks paid and other accrual items.c/ Actuald/ The May refunding fell short of its goal by $1.8 billion.

III - 26
FEDERAL BUDGET AND FEDERAL SECTOR IN NATIONAL INCOME ACCOUNTS(In billions of dollars)
F.R. Board Staff estimatesFiscal 1971e/ Fiscal 1972e/ Calendar Years Calendar QuartersJan. F.R. Jan. F.R. 1970 1971e/ 1970 1971Budget Board Budget Board Actuel IV* I* II III IV
Federal Budget
(Quarterly data, unadjusted)Surplus/deficit -18.6 -21.0 -11. -21.5 -11.4 -26.6 -8.9 -8.2 3.6 -10.6 -11,4
Receipts 194.2 189.0 217.6 211.0 190.5 194.8 41.1 44.1 57.3 49.2 44.2Outlays 212.8 210.0 229.2 232.5 201.9 221.3 49.9 52.2 53.7 59.8 55.6
Means of financing:Net borrowing from the public 17.6 17.6 10.6 20.5 11.8 24.0 8.9 1.6 -.3 10.8 Tl.9Decrease in cash operating balance n.a. 1.5 n.a. -- -2.8 .5 .7 3.6 -2.0 -1.4 .3Other 1/ n.a. 1.9 n.e. 1.0 2.4 2.0 -. 7 2.9 -1.3 1.2 -. 8
Cash operating balance, end of periodn.a. 6.5 n.a. 6.5 8.1 7.6 8.1 4.5 6.5 7.9 7.6
Memo: Net agency borrowing 2/ n.a. 1.7 n.a. n.e. 8.2 n.e. 1.5 -1.0 - .3 1.2 n.e.
National Income Sector
(Seasonally adjusted annual rate)Surplus/deficit -15.0 -15.2 -4.2 n.e. -11.1 -15.1 -18.1 -13.3 -17.5 -17.2 -12.2
Receipts 200.0 198.2 225.9 n.e. 195.2 208.5 191.7 200.8 205.3 209.8 217.9-,xpenditures 215.0 213.4 230.1 233.7 206.3 223.6 209.9 214.2 222.8 227.3 229.9
High employment surplus/deficit(NIA basis) 3/ n.a. -.2 n.a. 1.5 -.8 .3 1.3 1.3 -1.8 -1.0 2.6
*Actual e--Droiected n.e.--not estimated n.a.--not availableI/ Includes such items2/ Federally-sponsored
Land Banks, Federal
as deposit fund accounts and clearing accounts.credit agencies, i.e., Federal Home Loan Banks, Federal NationalIntermediate Credit Banks, and Banks for Cooperatives.
3/ Estimated by Federal Reserve Board Staff. The level offrom the estimates by the Council of Economic Advisers.recently proposed by the Treasury.
Mortgage Assn., Federal
the estimated series shown here differs considerablyContinues to show effect of accelerated depreciation

FINANCIAL DEVELOPMENTS - UNITED STATESBILLIONS OF DOLLARS, SEASONALLY ADJUSTED, RATIO SCALE
BANK CREDIT
CREDIT PROXY
MONEY AND TIME DEPOSITS
MONEYAPR 2212
TIME DEPOSITSAPR 2488
-1 220
-I200
I I I I I I I I ii I I i i I I I I
TOTALAPR 447 6
LOANSAPR 2939
BUSINESS LOANSAPR 1100
OTHER SECURITIESAPR 93 8
SAVINGS ACCOUNTS
-ISAVINGS & LOAN ASSN.
,.. .IAPR 1584
MUTUAL SAVINGS BANKSAPR 753
1971 1969'~'~''''''''"'''''' ''''
m-c-1 6/1/71
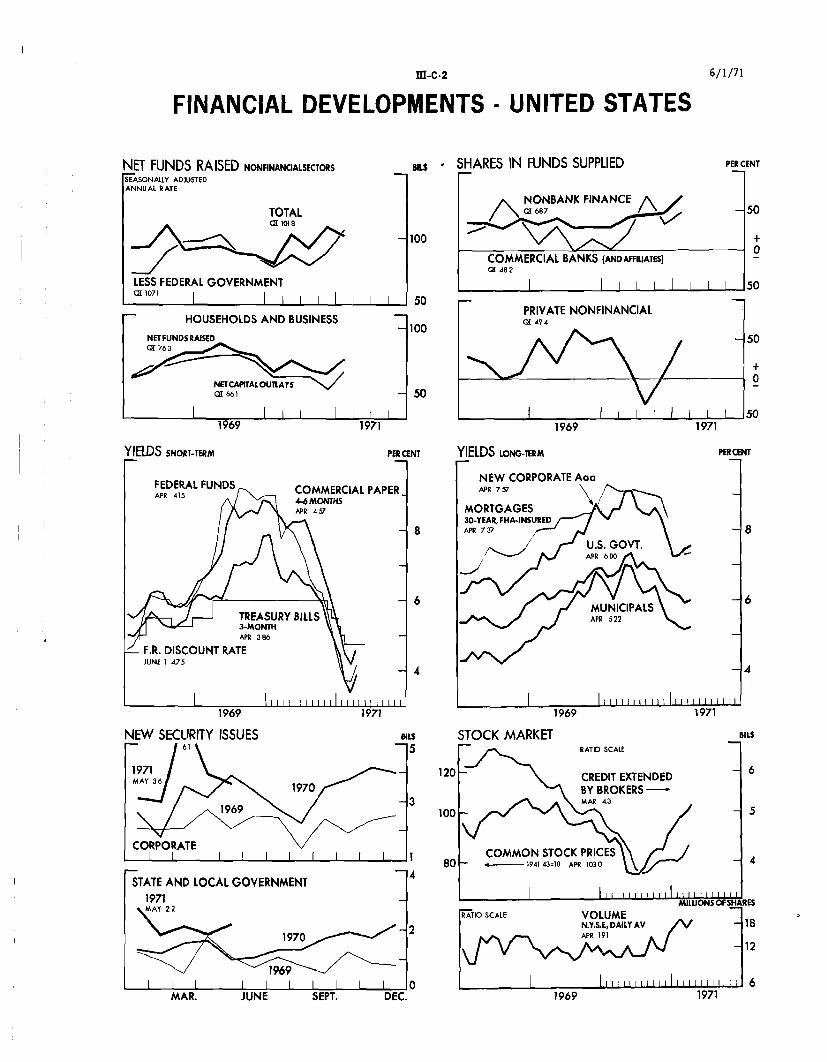
III-C-2FINANCIAL DEVELOPMENTS - UNITED STATES
NET FUNDS RAISED NONFINANCIAL SECTORSSEASONALLY ADJUSTEDANNUAL RATE
TOTAL01 101 8
LESS FEDERAL GOVERNMENT011071 I I
BIL$ - SHARES IN FUNDS SUPPLIED
-100o
I 1 5
CORPORATE VC RPOTI I I I I I I I I I 1
STATE AND LOCAL GOVERNMENT
1971MAY 22
I IY I 1970 2
PERCENT
NONBANK FINANCES687 - 50
+
COMMERCIAL BANKS (ANDAFFILATES)048 2
| | | | | _50
PRIVATE NONFINANCIALar 494
50
- v- '-I I I 1 i so
1969 1971
6/1/71
S HOUSEHOLDS AND BUSINESS
NETFUNDS RAISED01763
NET CAPITALOUAYSQ[ 661
1969 1971
V
MAR. JUNE SEPT. DEC.

IV - 1
THE ECONOMIC PICTURE IN DETAIL
International Developments
U.S. balance of payments. The principal feature of the
balance of payments in late April and early May was, of course, the
enormous official settlements deficit resulting from the culmination
of speculation on the revaluation of the German mark and other Euro-
pean currencies. Since the week ending May 12, when the weekly
deficit peaked at $4.3 billion, there has been an interval of
relative calm. But weekly deficits in the two weeks ended May 26
still averaged $300 million, indicating that any profit-taking by
American speculators was more than offset by new outflows -- perhaps
to take advantage of higher interest rates abroad or to hedge against
a yen revaluation. There is also the possibility that developments
in the current and long-term capital account are unfavorable. The
following table summarizes the course of over-all balances so far
this year.
MEASURES OF OVER-ALL DEFICIT(billions of dollars, N.S.A.)
1971Year May May1970 1Q Mar. Apr. 1-12 13-26
Official settlements basis 1/ 11.1 5.4 2.7 2.5 5.0 .6Liquidity basis 1/ 4.8 2.9 1.5 2.2 4.7 .6
Special transactions affecting:Official settlements basis .4 -- -- .1Liquidity basis .1 -.2 -. 1
1/ Before special transactions and allocations of SDR.

CONFIDENTIAL (FR) IV - 2
Data available now explain only a small part of the
worsening in the deficit since the beginning of the year; the
main factor was undoubtedly an outflow of liquid capital partly
as advances to foreign affiliates (early reports suggest a record
first quarter outflow of perhaps $1-3/4 billion) and partly through
channels that escape the normal reporting procedures. While interest
rate differentials were an important influence, the pace of outflows
related to exchange rate uncertainties rose sharply by April. (A
survey is being made of major banks to obtain some background infor-
mation on purchases of foreign exchange at the height of the speculation
in early May).
A major adverse development in U.S. transactions in April
was a shift in the trade balance from surpluses averaging $100 million
per month in the first quarter to a deficit of nearly $300 million.
On the other hand, the reduction of liabilities to foreign branches
(including Treasury borrowings) was much less in April than before.
Other known changes in capital account transactions through April
were relatively minor. Foreign dealings in U.S. corporate stocks
may have yielded a small net inflow in April, after small net
liquidations in February and March. U.S. purchases of foreign
securities remained relatively low -- the only notable feature was
a rise in purchases of Japanese equities, bringing net purchases of
such equities for the year to about $100 million. The April outflow
in connection with bank-reported claims on foreigners was moderate,

CONFIDENTIAL (FR) IV - 3
but banks contributed to the large deficit in the week of May 12
when they increased their loans and balances abroad by over $500
million. The rise in balances was quickly reversed but loans to
foreign banks rose further after May 12.
Financing of the official settlements deficit this year --
about $13-1/2 billion through May 26 -- has been effected very
largely through a huge increase in liabilities to foreign official
reserve holders. U.S. reserve assets have declined by about $1.4
billion, including $503 million of gold (of which $290 million was
used by foreign countries for payment to the IMF), $330 million of
SDR, $311 million of foreign currencies, and a $259 million reduction
in the U.S. reserve position with the IMF. Reserve gains of the EEC
countries for the year through May 26 totaled about $7 billion, of
which Germany accounted for about $5 billion. These countries'
reserves have changed only slightly since the first week of May,
when the German mark and the guilder were allowed to float. The net
reserve gain for the United Kingdom has probably considerably exceeded
$2 billion, and the gain for Japan was about $2 billion. Since May 7,
Japan has been the only country with major reserve increases.
U.S. foreign trade. The trade balance in April showed a
sizable import balance, as exports declined sharply and imports
rose steeply. For January-April, the trade balance was zero on the
balance of payments basis, down from the $.8 billion annual rate
surplus for the last four months of 1970.

CONFIDENTIAL (FR) IV - 4
The weakening in our trade position this year stems mainly
from the strong rise in imports. Much of this strength in imports
has been in non-food consumer goods, as well as in foodstuffs.
Exports rose more than imports in the first three months
largely because of exceptionally heavy shipments of agricultural
commodities throughout the quarter and deliveries of a large number
of jumbo jets in March. In April, exports fell as shipments of these
goods declined sharply. There were also decreases in exports of
other goods in April -- particularly of machinery. However, machinery
exports are expected to pick up if there is a sustained resumption of
growth in foreign industrial activity.
In January-April, the trade balance with all major
industrial areas was worse than in the last four months of 1970.
Imports from Canada and Western Europe were up more than U.S. exports
to those areas. In trade with Japan, the worsening reflected both
declining exports and increasing imports.
U.S. TRADE BY MAJOR WORLD AREAS 1/(billions of dollars, seasonally adjusted annual rate)
Sept.-Dec. 1970 Jan.-April 1971Exports Imports Balance Exports Imports Balance
World 41.9 41.2 .8 43.5 43.5
Canada 8.7 10.9 -2.2 9.8 12.2 -2.4Western Europe 14.1 11.7 2.2 14.3 12.4 1.9U.K. 2.5 2.2 0.3 2.7 2.4 0.3EEC 8.3 6.9 1.4 8.2 7.6 0.6
Japan 4.8 6.3 -1.6 4.1 7.1 -3.0Rest of World 14.5 12.3 2.2 15.2 11.7 3.5
1/ Estimated balance of payments basis.

CONFIDENTIAL (FR) IV - 5
Exports, for the period January-April were $43.5 billion,
at an annual rate (balance of payments basis), almost 11 per cent
higher at an annual rate than in the last four months of 1970.
This rate of increase is slightly less than the year-to-year change
from 1969 to 1970, when allowance is made for the 1969 dock strike.
In the first four months of this year, increases in ship-
ments of agricultural commodities and of transport equipment (especially
commercial aircraft) were partially offset by declines in exports of
industrial materials. The rise in exports of automobiles and parts
to Canada was associated with the recovery from the GM strike. Exports
of machinery were essentially unchanged.
The increase in agricultural exports resulted mainly from
larger shipments of soybeans, cotton, and tobacco; exports of grains
declined markedly.
Based on unit-value data for the first quarter, almost all
of the increase in the value of total exports in January-April can be
attributed to higher export prices, particularly in autos and machinery.
In contrast, about one-third of the total rise in the value of exports
from 1969 to 1970 was accounted for by price increases.
Imports in January-April were also at an annual rate of
$43.5 billion (balance of payments basis), 17 per cent higher at an
annual rate than in the last four months of 1970. The year-to-year
increase from 1969 to 1970 was 10 per cent. About a third of the

CONFIDENTIAL (FR)
increase in the value of imports in January-April over the preceding
four months represents higher prices, whereas price rises accounted
for two-thirds of the increase from 1969 to 1970.
The rise in imports was spread over a broad range of
commodities, with significant increases occurring in foods (coffee
and sugar), machinery, automotive equipment, and a wide variety of
consumer goods. Imports of industrial materials remained roughly
unchanged -- declines in imports of petroleum products and copper
offset hedge-buying of steel and aluminum in anticipation of possible
strikes this year.
The strong showing of automotive imports reflects both
the post-strike recovery of Canadian auto production and the con-
tinued strength of Japanese and Western European car sales in the
United States. Imports of other consumer goods (clothing, footwear,
television sets, radios, furniture) continued their upward climb
despite little growth in domestic expenditures on such goods.
Foreign exchange markets. Since May 10, when the foreign
exchange markets began trading with the Swiss franc and Austrian
schilling revalued (by 7.07 and 5.05 per cent, respectively) and
the German mark and Dutch guilder floating as an official "interim"
policy, the major foreign central banks in the aggregate have made
only moderate net additions to their reserves through exchange
market intervention. While there has been a fairly large flow of
IV - 6

IV - 7
funds out of the Swiss franc since its revaluation, the German mark
and Dutch guilder have remained in a range of about 2-1/2 to 4-3/4
per cent and 1-1/2 to 2-3/4 per cent above their respective par values,
and neither the Bundesbank nor the Netherlands Bank has intervened
in the exchange market. The Swiss reserve losses in the exchange market
and a moderate amount of net sales of dollars by the Bank of England
since the first week of May have been more than offset by dollar
purchasesby the National Bank of Belgium and the Bank of Japan.
Shortly after the decision was made to float the mark
the Bonn government announced certain measures designed to encourage
a reduction in the demand for marks. Interest payments to non-
residents on new and maturing DM deposits were prohibited, and non-
residents may not purchase short-term German securities, or long-
term securities under repurchases agreements, unless a special exemp-
tion is obtained from the central bank.
Despite these measures, and the announced intention of
German authorities to see the mark exchange rate eventually return
to its current par value, the mark advanced fairly steadily in the
first two weeks after it was allowed to float. The mark reached a
high of about 28.63 U.S. cents (or 4.8 per cent above par) on May 19,
apparently in response to rumors that the Bundesbank would very soon
enter the market buying marks (selling dollars) at an exchange rate
about 5.2 per cent above the mark's par value. But by the last week

IV - 8
of May, with no such action having been taken, and Euro-dollar rates
sharply higher, the mark declined steadily and on June 1 was quoted
at about 28.03 cents, or 2.6 per cent above par. On June 2 the
Bundesbank offered to buy marks at 28.03 cents, but the market
immediately firmed to about 28.20 cents (or 3.2 per cent above par)
and the Bundesbank did not intervene.
During the first two weeks of June the Bundesbank will be
receiving about $1/2 billion from the market as its forward mark
sales contracts of early March mature; a further $2.1 billion of
forward contracts will mature in July. These receipts of dollars
(deliveries of marks) by the Bundesbank will add substantially to
reserves in the German banking system; in order to absorb some of
these additions to domestic liquidity the Bundesbank on June 2
announced an across the board increase in required reserve ratios
applying to all classes of German banks' liabilities.
The Dutch guilder exchange rate has more or less passively
followed the German mark since the two were floated. The guilder
reached its peak level of about 28.4 U.S. cents, about 2.8 per cent
above par, at the same time that the mark reached its high; the
guilder has since eased to about 1.8 per cent above par. Conditions
in the guilder market for the forseeable future will probably continue
to be largely determined by developments in the market for German marks.
About one half of the Netherlands Bank's $340 million reserve gain in
the first week of May has been offset by deliveries of dollars on

IV - 9
maturing forward contracts with Dutch banks -- arising from swaps
done with these banks three months earlier.
The Swiss franc -- which now has slightly wider upper and
lower limits of about 1.85 per cent on either side of par -- traded
at less that 1/2 per cent below its par value in the first few days
following the revaluation, firmed to a level moderately above par in
the third week of May, but has since eased to about 24.40 cents --
compared to its new par value of 24.485. The Swiss National Bank,
which purchased about $700 million in the first week of May, has
since made net sales of dollars (spot and on a swap basis) totaling
about $670 million. Of this amount, $250 million was sold to Swiss
banks on a three-month swap basis. By prior agreement the Swiss banks
placed these funds on deposit with the BIS, which in turn deposited
the funds in the U.S. CD market. At the same time the BNS requested
the Federal Reserve to draw $250 million on the swap facility, providing
an exchange rate guarantee for that amount of Swiss reserves. The
purpose of these transactions was to accomplish a reduction in
Swiss official reserves, and Swiss franc liquidity in the Swiss
banking system, but in a way that would indirectly channel funds to
the United States rather than to other central banks.
On May 11 the National Bank of Belgium resumed dealings in
the exchange market with no change in the franc's parity, but at
the same time introduced a modification in its existing "dual"
exchange rate system -- channeling all capital account transactions
through the free (floating) Belgian franc market. (See p. IV - 21).

IV - 10
Since May 11 the free market franc rate has been in a range of about
1/2 to 1 per cent above the official rate; until the last few days
of May the official market rate remained at its upper limit and the
central bank purchased about $130 million.
In late April and the first week of May the French franc
advanced to its upper limit and the Bank of France purchased about
$1/4 billion. The exchange rate then declined for a week or so
then advanced following the Bank of France's decision to raise both
the bank rate and the rate on secured advances and to raise reserve
requirements on French banks' domestic and foreign deposit liabilities;
but in the last few days of May and the first two days of June the
French franc, with other European currencies, declined as Euro-dollar
rates rose rapidly.
Sterling, the Canadian dollar and the Italian lira
remained largely on the sidelines during and after the early May
exchange market crisis, but eased with the recent advances in
Euro-dollar rates. The Bank of England has sold, net, about $50
million since the first week of May. The Canadian dollar moved from a
high of 99.4 U.S. cents in the first week of May to as low as
98.7 cents on June 2; The Bank of Canada did a small amount of
business on both sides of the market during the month. The Italian
lira nearly reached its upper limit in the first week of May, when the
Bank of Italy purchased $30 million, but has declined fairly steadily
since and the Bank of Italy has sold a small amount of dollars.

IV - 11
The Japanese yen remained at its upper limit throughout
the month reflecting both speculative positioning in yen and a
seasonally strong basic payments balance. For the month as a whole
the Bank of Japan purchased over $1 billion, of which about $0.4
billion was purchased in the first week. Japanese authorities have
repeatedly rejected the possibility of a revaluation and have taken
certain steps to dampen the demand for yen. On May 7 the central
bank discount rate was reduced by 1/4 per cent, to 5-1/2 per cent;
more recently the Japanese authorities "temporarily" prohibited
non-resident purchases of Japanese stocks, bonds, and mutual funds
not listed on the exchanges; no prohibition was applied to listed
securities in order to avoid a violation of OECD agreements on
capital controls.
The large increases in central banks' dollar holdings
in early May have prompted numerous transactions on the System swap
line and foreign central bank purchases of reserve assets from
U.S. holdings. During May the U.S. Treasury sold a total of
$367 million of gold, $85 million to the National Bank of Belgium and
$282 million to the Bank of France, the latter in connection with
a French repayment to the IMF. The Swiss National Bank has recently
requested the purchase of $100 million of gold, but final
arrangements on the sale have not been completed. The Treasury also
sold $55 million of SDR's to the Belgians and $150 million in SDR's
to the Dutch in May.

IV - 12
During May the System drew a total of $95 million equiva-
lent on the Belgium swap line and repaid a total of $55 million
equivalent on that line using Belgian franc balances acquired as
a result of the U.S. Treasury SDR sales to Belgium. System drawings
on the $500 million Belgian line now stand at $490 million
equivalent. In addition a special $100 million swap line was
established between the U.S. Treasury and the National Bank of
Belgium during the month, on which the Treasury has drawn the full
amount.
Immediately following the floating of the Dutch guilder
the System fully repaid its $250 million equivalent obligation on
the Dutch swap line using guilder balances purchased from the
Netherlands Bank, at the guilder's official upper limit. The clear-
ing up of this swap line was the result of a standing agreement by
participants in the swap arrangements to repay all balances if the
creditor's currency is revalued or floated. This transaction, in
combination with nearly $350 million of reserve gains in the first
week of May left the Netherlands Bank with substantial uncovered
dollar holdings. So far the only move made by the Dutch to reduce
these holdings has been the SDR purchase mentioned above.
Gold prices advanced from around $39.50 in early May to
nearly $42.00 at mid-month but have since declined to about $40.75.
CONFIDENTIAL (FR) IV - 13
Euro-dollar market. Euro-dollar market conditions in May
were dominated by developments in the foreign exchange markets.
Euro-dollar rates rose very rapidly in the first week of the month
as market participants either liquidated Euro-dollar holdings or
sought to increase their borrowings from the Euro-dollar market in
the course of shifting funds into German marks and other continental
currencies. In the next two weeks Euro-dollar rates declined on
balance, but remained well above late April levels, primarily because
of the lack of any substantial reflow of funds from the major foreign
currencies. Then in the last week of May and first two days of June
Euro-dollar rates rose markedly; rates in most maturities reached
levels above those of the first week of May. The recent sharp advances
in Euro-dollar rates have been attributed, primarily, to needs to
acquire dollars to deliver to the Bundesbank as the latter's $1/2
billion of forward DM sales contracts made in early March mature in
the first two weeks of June. (See Foreign Exchange Markets, p. IV - 8).
Call Euro-dollar deposits were not quoted throughout most
of May and meaningful quotes remain difficult to obtain. (As a
result the overnight Euro-dollar rate has been substituted for the
call rate in the interest rate comparison table below). Overnight
Euro-dollars were quoted at 10 to 12 per cent for a few days in early
May, declined to around 5-1/4 per cent near mid-month, but reached
extraordinarily high levels on the last day of May and averaged over
CONFIDENTIAL (FR)
8 per cent in the first two days of June. Three-month deposits
advanced from around 6 per cent in late April to as high as 7-5/8
per cent in the first week of May; after falling to about 7 per
cent near mid-month the three-month rate increased to nearly 8 per
cent as of June 2.
These Euro-dollar rate developments brought the excess of
Euro-dollar rates over the cost of domestic sources of funds to U.S.
banks to very high levels in early May and again in late May and early
June (See Table), and substantially raised the incentive for U.S.
investors to place funds in Euro-dollar deposits.
SELECTED EURO-DOLLAR AND U.S. MONEY MARKET RATES
Average for (1) (2)month or Over-week ending Night FederalWednesday Euro-$1/ Funds/
1971January 5.13 4.14February 4.38 3.72March 4.43 3.76April 4.82 4.15
May 5 5.63 4.4112 9.86 4.5919 5.29 4.5526 5.81 4.68
June 2 15.93 4.83p
1/ All Euro-dollar rates arenight rate adjusted for certaincost of funds to U.S. banks.
(3)= (4) (5) (6)(1)-(2) 3-month 60-89 day (4)-(5)Differ- Euro-$. CD rate Differ-ential Deposit" (Adi.)2 ' ential
0.99 5.92 5.10 0.820.66 5.54 4.34 1.200.67 5.11 3.79 1.320.67 5.92 4.41 1.51
1.22 6.41 4.87 1.545.27 7.36 4.87 2.490.74 7.06 5.00 2.061.13 6.86 5.13 1.73
11.10p 7.70 5.13p 2.57p
noon bid rates in the London market; over-technical factors to reflect the effective
2/ Effective rate.3/ Offer rate (median, as of Wednesday) on large denomination CD's by
prime banks in New York City; CD rates are adjusted for the cost ofrequired reserves. p/ Preliminary.
IV - 14
CONFIDENTIAL (FR) IV - 15
Despite the adverse development in cost differentials there
was no marked acceleration in Euro-dollar repayments by U.S. banks
between late April and the end of May. Gross liabilities of U.S.
banks to their foreign branches declined about $0.6 billion, to
$1.7 billion, from April 28 to May 26. (These liabilities increased
slightly from April 30 to May 26 owing to a nearly $1 billion decline
on the last day of April that was largely reversed in the first few
days of May.) From May 26 to 31 partial data show little net change
in these liabilities.
In the four week Euro-dollar reserve requirement computation
period ended May 12, U.S. banks' Euro-dollar liabilities and foreign
branch holdings of special Ex-Im and Treasury securities averaged
$475 million less than in the prior computation period; the preceeding
period-to-period decline had been about $3/4 billion.

IV - 16
Some implications for industrial countries of recent exchange
rate developments. The key to an understanding of recent foreign
exchange developments certainly lies in what has happened in the
German economy. Although economic indicators still give an ambiguous
picture of the strength of aggregate demand in that country, it seems
quite clear that prices and wages there will continue to increase at
higher than desired rates for some time.
So long as the Bundesbank was constrained to support the
mark rate within a relatively narrow band around 3.66 marks per
dollar, and was unwilling or unable to impose controls on capital
inflows, attempts to pursue a more restrictive, anti-inflationary
monetary policy tended to be partially frustrated by inflows of interest-
sensitive funds. This dilemma was highlighted by the series of reports
and official statements -- now well known -- that led to sharply
increased speculative pressures on the mark.
Speculation also spread to other currencies, including
those of Austria, Switzerland, and the Netherlands. As seen in the table,
these three countries obtain a particularly large proportion of their
total imports from Germany. Thus, in the absence of exchange rate
action of their own, an appreciation of the mark would tend to have
a significant direct impact on their domestic price levels, in
addition to the indirect inflationary effects of any increase in their
trade and balance-of-payments surpluses (or decrease in their deficits).

IV - 17
Consequently, when the German authorities decided to allow
the mark rate to rise, Austria, Switzerland, and the Netherlands --
each with its own concern about inflation -- also felt obliged to
raise the dollar value of their currencies (Austria and Switzerland),
or to allow it to float (the Netherlands). The Belgians, however,
adapted their dual-exchange rate system so as to channel capital
inflows into the free market where the National Bank of Belgium
does not have to intervene.
The problem of inflation -- not a balance-of-payments
disequilibrium, per se -- was what caused exchange rate actions to
be considered at this time. (When it became known that such action
was being considered, capital inflows forced the decision.) Thus,
IMPORT SHARES IN SELECTED INDUSTRIAL COUNTRIES, 1970(Per cent of total imports in receiving country)
Supplying CountryImporting Country Germany Netherlands Switzerland Austria Other Total
Germany -- 12 3 2 83 100Netherlands 27 -- 1 1 71 100Switzerland 30 3 - 4 63 100Austria 41 3 7 - 49 100
United Kingdom 6 5 2 1 86 100France 22 6 3 a/ 69 100Italy 20 4 2 2 72 100Belgium 23 15 1 a/ 61 100
Japan 3 1 1 a/ 95 100United States 8 1 1 a/ 90 100
a/ Less than 0.5 per cent.

IV - 18
in trying to evaluate the implications of all the various measures
that have been adopted in the past month, it is necessary to consider
the extent to which they enable anti-inflationary policy in Europe to
be more effective or more palatable than it would otherwise have been.
In Germany, it is likely that some of the constraints on
monetary policy will be removed, and some time may be bought to allow
the deflationary impact of fiscal actions to be felt, although the
Bonn Government's reluctance to use fiscal policy actively still per-
sists. In the other revaluing countries, however, it is not clear that
the exchange rate developments will make it significantly easier to
combat inflation than if the Germans had not allowed the mark to float.
Policy options in Germany prior to the floating of the mark
had become quite limited. Essentially, the Germans could shift more
of the burden from monetary to fiscal policy, or they could try to
isolate the domestic financial markets from international flows of
funds. Increased reliance on fiscal policy had been rejected earlier,
and by early May the effects of fiscal actions would take far too
long to work themselves out to be of any help against the strong
speculative pressures. The idea of attempting to set up an effective
system of exchange controls appears to have been ruled out on grounds
of social philosophy, leaving exchange rate action as the only means
of achieving an isolation of domestic from international financial
markets. Thus, the mark was allowed to float.

IV - 19
In order to support the government's stabilization efforts,
and to complement the presumably more effective monetary policy,
several fiscal measures were also announced (on May 9). These
measures appear to be little more than a moderate tightening of the
expenditure ceilings announced in March by former Finance Minister
Moeller. As a counterpart to the expenditure ceilings, a reduction --
amounting to about DM 2.3 billion -- in the government's right to
borrow was approved on May 21, largely as a means of enforcing the
expenditure ceilings at the state and local levels. The total package
represents a cut-back on the order of only about 1 per cent of the
total public sector budget.
The appreciation of the German mark, assuming it persists,
should have some direct impact on the underlying German balance of
payments, and thus on the domestic economy, in addition to the impli-
cations cited above. In particular, the invisibles account will show
a larger deficit, as it did following the 1969 revaluation. The
surplus on current account in 1971 may be slightly lower than previously
expected (the current balance was $666 million in 1970), but the bulk
of any effect probably will not be felt until 1972.
The Netherlands was compelled, following the German move,
to let the guilder rate rise. Had the rate remained unchanged, large
speculative flows would probably have been directed from the mark to
the guilder, creating serious problems for the Dutch monetary
authorities. In addition, a revalued mark -- reflected in higher

IV - 20
prices of German imports -- would have added significantly to already
severe domestic cost inflation, since almost 30 per cent of total
Dutch imports come from Germany. Finally, given the tight labor
market situation in the Netherlands, the pull of labor to Germany
would have been unwelcome.
Increased deficits on both trade account (from $350 million
in 1969 to $650 million 1970) and current account (from $4 million
to $480 million) normally would have precluded such a decision. However,
about one-third of Dutch exports go to Germany, thereby mitigating
the adverse effects of an appreciated mark on the Dutch trade balance.
Also, a large portion of Dutch agricultural trade may remain unaffected
because of arrangements made within the framework of the Common Market
agricultural policy.
The Swiss revaluation was decided upon largely for domestic
reasons. Inflationary pressures have caused consumer prices in
Switzerland to rise nearly 7 per cent in the past year. With about
30 per cent of Swiss imports originating in Germany, failure to
appreciate the exchange rate of the franc would have aggravated that
problem.
Unlike the Netherlands case, however, the Swiss revaluation
was justifiable on balance-of-payments grounds as well. Although
the current account is believed to have been about in balance last
year, there was a large capital inflow, partly because Swiss interest
rates, which had been low relative to others, held fairly level while

IV - 21
Euro-dollar and other rates declined. The Swiss National Bank's net
foreign assets rose $880 million in the 12 months through last April.
The Austrian decision to revalue the schilling was clearly
a reaction to the German and Swiss actions. The main objective was
to safeguard price stability. An additional consideration was the
possibility of intensified labor migration to Germany at a time of
acute labor shortage in Austria.
Given Austria's close trade relationships with Germany and
Switzerland, the impact of all the parity changes on Austria's trade
balance (which is showing a significant deficit) should be small.
Moreover, measures to encourage exports have been announced.
The Belgian government announced on May 9 that it would
amend the regulations pertaining to Belgium's dual-exchange market
system. The new regulations provide that current transactions, excluding
unilateral transfers and certain tourism items, are to be settled in
the official market -- where the National Bank must intervene when
the rate reaches its allowed upper or lower limit -- and that all
other transactions, including all capital flows, are to pass through
the free market. If there is no official intervention in the free
market, the movement of the rate would prevent any net capital inflow
or outflow, assuming that the regulations can be enforced so that the
two markets are in fact completely separated.
While the new exchange market regulations will protect the
Belgian economy from net capital inflows, speculative or otherwise,
IV - 22
they will not serve to reduce the large Belgian current account surplus.
In 1970, this surplus amounted to $750 million, and another large
current account surplus was expected this year, even before the
recent realignment of exchange rates.
The failure of Belgium to revalue or float the franc seems
to have several explanations. The authorities there probably share
in some degree the French view that present external surpluses of
European countries are caused by disequilibrium on the part of the
United States which this country ought to correct by its own actions.
Secondly, Belgian officials are very cautious about any action that
might weaken their balance of payments. Thirdly, inflation in Belgium
in the past year has been less severe than in a number of other industrial
countries, so that the inflationary consequences of maintaining the
official exchange rate while others revalue may be less acutely felt.
France, Italy, and the United Kingdom took no exchange rate
actions. France has had large balance-of-payments surpluses since
late 1969, and is currently experiencing high rates of price and wage
inflation. Nevertheless, the French chose not to revalue the franc,
perhaps because the French feel it is up to the United States, not the
Europeans, to take actions to correct international payments imbalances,
but also because the French external accounts may not remain as strong
as they now appear. This would be the case if, as we suspect, much of
the 1970-71 surplus -- all of which was on capital account -- has been
due to a reflow of capital that fled France prior to the devaluation.

IV - 23
On May 13, the Bank of France tightened its policy, by
raising its discount rate (from 6-1/2 to 6-3/4 per cent) and its
reserve requirements. It is unlikely that these actions will signi-
ficantly help to reduce domestic inflationary pressures, especially
in view of the reduced importance of rediscounting and the relatively
free access of banks to reserve funds supplied by the Bank of France
through the so-called money market. But at any rate monetary policy
in France, unlike that in Germany, would be somewhat protected by
exchange controls from inflows of funds from abroad if an effort
were really made to check credit expansion.
Italy also has been having a balance-of-payments surplus.
But Italy's external position could deteriorate sharply if labor
unrest intensified, or if the government and central bank decided
to ease their policy stance, as now seems quite possible.
Since about 30 per cent of trade in both France and Italy
is with the revaluing countries, the latest exchange rate developments
will have an impact on price levels and external balances in both
countries, assuming that Germany and the Netherlands do in fact
revalue their currencies or let them float above the earlier range for
any length of time. Presumably, this impact is considered tolerable.
The United Kingdom is in a position different from the other
countries. Specifically, resolution of the exchange "crisis" by cur-
rency appreciations can yield only positive net results for Britain,
in terms of both its balance of payments and its domestic economy.

IV - 24
The favorable effect of appreciation by the other currencies
on Britain's balance of payments may be of significant magnitude. A
large part of the gain would derive from increased exports to third
countries. In the first four months of 1970, Britain appears to have
been running a current account surplus at an annual rate of about
$1.3 billion, but with wage costs and prices rising at rates higher
than elsewhere, the relative devaluation of the pound may help to
prevent a serious deterioration in Britain's balance of payments from
emerging as early as otherwise might have happened. Moreover, there
is considerable spare capacity at present (unemployment is exceptionally
high, and industrial output is depressed), so that stimulus provided
by increased exports is welcome, and may not have significant infla-
tionary implications. Finally, since imports from the revaluing
countries account for a relatively small proportion of total British
imports, the direct effect on British prices will be correspondingly
small.
Japanese exports would tend to benefit from a permanent
revaluation of the German mark, primarily because that would tend
to improve Japan's competitive position in third markets. Further
pressures for a revaluation of the yen have thus developed.
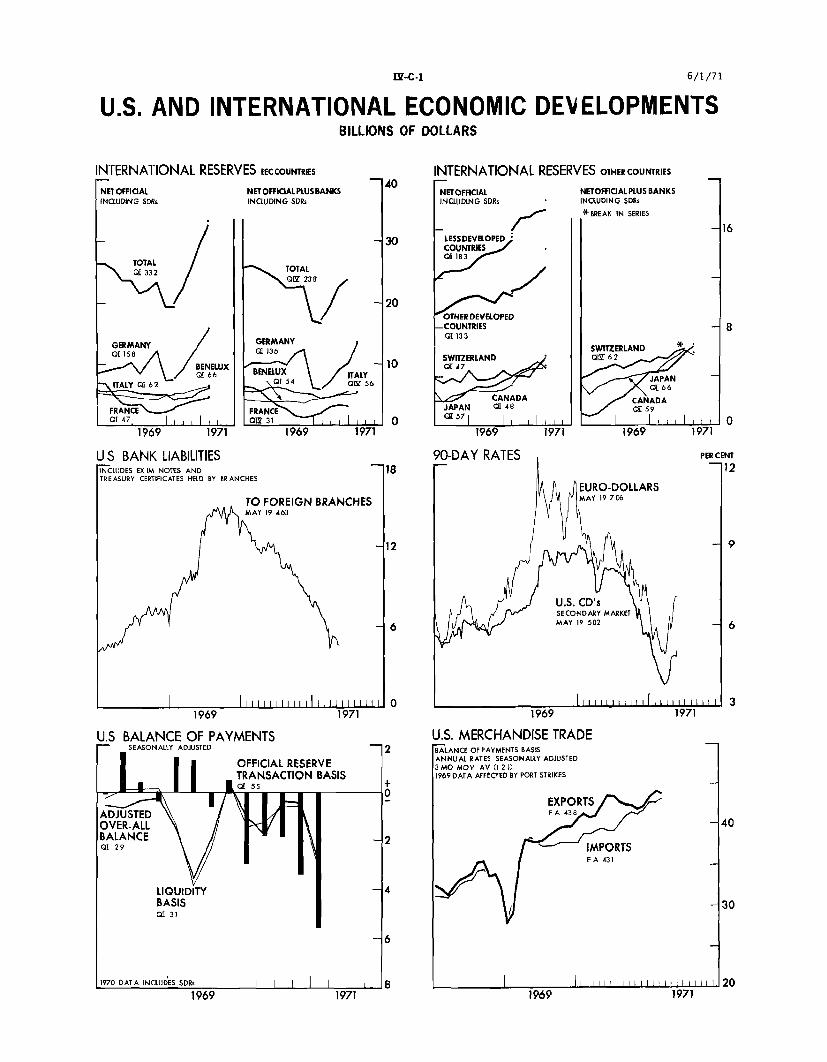
IV-C-1 6/1/71
U.S. AND INTERNATIONAL ECONOMIC DEVELOPMENTSBILLIONS OF DOLLARS
NTERNATIONAL RESERVES EECCOUNTRES INTERNATIONAL RESERVES OTHERCOUNTRIES-- 40 -
NET OFFICIAL NET OFFICIAL PLUS BANKS NETOFFICIAL NETOFFICIAL PLUS BANKSINCLUDING SDRs INCLUDING SDRs INCLUDING SDRs INCLUDING SDRs
*BREAK IN SERIES
-30 LESSDEVELOPEDCOUNTRIESSGERMANY 183 3
015 % / 3 / -13A SWITZERLAND .- / \ ./ BENELUX "BENE0UX 14\ /7 ~ " 10 -- v ^^- f ' "
BE
TOTAL
LY
FRANCE FANCE JAPAN 48 7 v: 59 ,QI 332
TTAQ, 47. i i , , , l os 31 I1l I, , I , , I J , I 1 0
1969 1971 1969 1971 1969 1971 1969 1971
US BANK LIABILITIES 90-DAY RATES PERCENT
INCLUDES EXIM NOTES AND 18 12TREASURY CERTIFICATES HELD BY BRANCHES
EURO-DOLLARSTO FOREIGN BRANCHES MAY 19 706
MAY 19 463
-12 19
U.S. CD'sSECONDARY MARKET
6 MAY 19 502 6
I l l l l i i l l l l l 0 0 i l l ll l l11 1 l l l 1 1 3
1969 1971 1969 1971
U.S BALANCE OF PAYMENTS U.S. MERCHANDISE TRADESEASONALLY ADJUSTED 2 ALANCE OF PAYMENTS BASIS
O F LRE R E ANNUAL RATES SEASONALLY ADJUSTEDOFFICIAL RESERVE 3 MO MOV AV (1 2 1)TRANSACTION BASIS 1969 DATA AFFECTED BY PORT STRIKES
[0 |EXPORTSADJUSTED FA 438
OVER-ALL -40BALANCE 2oQ 29 IMPORTS
FA 431
LIQUIDITY 4BASIS I -30
r


