Embed Size (px)
Citation preview
Prefatory Note The attached document represents the most complete and accurate version available based on original copies culled from the files of the FOMC Secretariat at the Board of Governors of the Federal Reserve System. This electronic document was created through a comprehensive digitization process which included identifying the best-preserved paper copies, scanning those copies,1
and then making the scanned versions text-searchable.2
Though a stringent quality assurance process was employed, some imperfections may remain. Please note that some material may have been redacted from this document if that material was received on a confidential basis. Redacted material is indicated by occasional gaps in the text or by gray boxes around non-text content. All redacted passages are exempt from disclosure under applicable provisions of the Freedom of Information Act. 1 In some cases, original copies needed to be photocopied before being scanned into electronic format. All scanned images were deskewed (to remove the effects of printer- and scanner-introduced tilting) and lightly cleaned (to remove dark spots caused by staple holes, hole punches, and other blemishes caused after initial printing). 2 A two-step process was used. An advanced optical character recognition computer program (OCR) first created electronic text from the document image. Where the OCR results were inconclusive, staff checked and corrected the text as necessary. Please note that the numbers and text in charts and tables were not reliably recognized by the OCR process and were not checked or corrected by staff.
Content last modified 6/05/2009.
CONFIDENTIAL (FR)
CURRENT ECONOMIC AND FINANCIAL CONDITIONS
By the StaffBoard of Governors
of the Federal Reserve SystemMarch 4, 1970

TABLE OF CONTENTS
Page No.Section
SUMMARY AND OUTLOOK
Outlook for Economic Activity . . .Outlook for Resource Use and Prices.Prospective Financial Developments ,Balance of Payments Outlook . . . .
THE ECONOMIC PICTURE IN DETAIL:
Domestic Nonfinancial Scene
Gross National Product . . . . .Industrial Production . . . . . .Retail sales .. . ... .. ..January Census Buying ExpectationsCyclical Indicators. . . . . . . .Orders and Shipments.. . . . . .Inventories . . . . . . . . . . .Construction and Real Estate . .Anticipated Spending for Plant andLabor Market . . . . . . . . . . .Industrial Relations . . . . . .Wholesale Prices . . . . . . . . .Consumer Prices. . . . . . . .
DOMESTIC FINANCIAL SITUATION
Bank Credit . . . . . . . . . .Monetary Aggregates . . . . . . .Nonbank Depositary Intermediaries.Life Insurance Companies . . . . .Mortgage Market . . . . . . . . .Corporate Securities and MunicipalGovernment Securities Market. .Other Short-Term Credit Markets. .Federal Finance . . . . . . . . .
E~u ome eS. . .
. . .. . t . .
Equipment. . . . .
* . . . .
. . . . .
. . . . .
. . . . .
. . . . .
. . . . .
* . . . .
Bond Markets.
INTERNATIONAL DEVELOPMENTS
U.S. Balance of Payments .. ...Foreign Trade . . . . . . . . . .Foreign Exchange Markets . . . . .Euro-dollar Market . . ....Monetary Policy in Major Industrial Nations . . . . .
- 1- 2-4- 8
- 1-8-10-12-13-15-17-18-21-23-26-27-29
-11-16-20-22
- 1-3-6- 8-10
. . . . . . .

TABLE OF CONTENTS-2-
APPENDIX A
Mortgage-Backed Securities Guaranteed by TheQovernment National Mortgage Association . . . . . . ... . A-i
APPENDIX B
Survey of State and Local Government BorrowingRealizations Fourth Quarter, 1969. . . . . . . . . .. . B-I
APPENDIX C
Seasonal Adjustments of Consumer Price Indexes . ..... .. C-l
I- 1
SUMMARY AND OUTLOOK
Outlook for economic activity
Key indicators of economic activity continue bearish. The
composite of leading indicators was down--and sharply--for the fourth
successive month in January. New orders for durable goods dropped con-
siderably following three months of moderate declines, and backlogs were
also reduced in most industries and market groups. Both initial claims
and insured unemploymentrose in January and again in February. Retail
sales remain generally weak, although unit auto sales were strong in
late February.
Given these and other incoming statistics, our expectations of
further slowing in current dollar GNP and of a moderate decline in real
GNP this quarter are apparently being confirmed. Much of the weakness
stems from a sharp reduction in the growth of final demands, re-
flecting a drop in auto and other consumer goods sales, curtailed
housing activity, and declining defense expenditures. Inventory
investment probably is also declining in the current quarter as
producers endeavor to adjust output to sluggish sales.
Growth of GNP in current dollars is expected to pick up only
moderately in the second quarter. There are prospects for a somewhat
faster rise in consumer expenditures this spring in response to the
boost to disposable income resulting from a large increase in Social
Security benefits beginning in April and retroactive to the first of
the year. Federal defense expenditures, however, are scheduled to

I - 2
decline substantially in the second quarter as the size of the armed
forces and spending for military equipment are further curtailed. The
recent decline in housing starts, with a further drop in prospect,
seems certain to result in substantial further reductions in residential
construction expenditures over the first half of the year. Inventory
investment is expected to fall further in the second quarter as in-
centives for inventory building weaken further.
Spending for business fixed investment remains the major
expansive force in the first half of the year. Recent private surveys
indicate that business has increased its capital spending plans for
1970 since late last fall. It is difficult to evaluate these surveys,
however, as they appear inconsistent with the decline over recent
months in orders for machinery and equipment and the leveling off of
output of business equipment. Moreover, a recent NICB report showed
some decline in fourth quarter capital appropriations of large manu-
facturers, although the backlog of unspent appropriations remained
very high. More definitive information on capital spending plans
for 1970 will become available with release of the Commerce-SEC survey
in the next several days. Meanwhile, we have not changed out pro-
jections of business fixed investment from the recent chart show
pattern.
Outlook for resource use and prices
Pressure on manpower and industrial resources has continued
to lessen and further easing is anticipated. Industrial production is
expected to be down for the first quarter as a whole, although the index
I-3
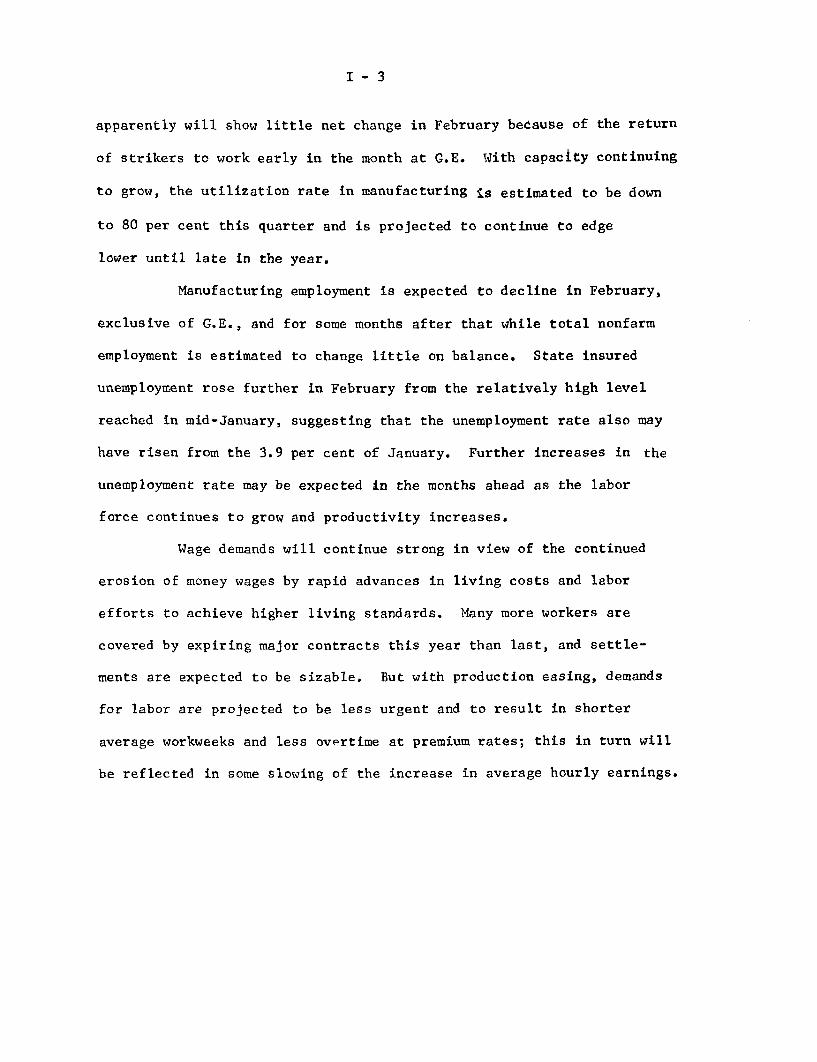
apparently will show little net change in February because of the return
of strikers to work early in the month at G.E. With capacity continuing
to grow, the utilization rate in manufacturing is estimated to be down
to 80 per cent this quarter and is projected to continue to edge
lower until late in the year.
Manufacturing employment is expected to decline in February,
exclusive of G.E., and for some months after that while total nonfarm
employment is estimated to change little on balance. State insured
unemployment rose further in February from the relatively high level
reached in mid-January, suggesting that the unemployment rate also may
have risen from the 3.9 per cent of January. Further increases in the
unemployment rate may be expected in the months ahead as the labor
force continues to grow and productivity increases.
Wage demands will continue strong in view of the continued
erosion of money wages by rapid advances in living costs and labor
efforts to achieve higher living standards. Many more workers are
covered by expiring major contracts this year than last, and settle-
ments are expected to be sizable. But with production easing, demands
for labor are projected to be less urgent and to result in shorter
average workweeks and less overtime at premium rates; this in turn will
be reflected in some slowing of the increase in average hourly earnings.

I-4
We continue to project a slowing in the pace of price in-
creases over the course of this year. One hopeful development was
the moderation in February of the increase in wholesale prices of
industrial commodities and their much less widespread nature than
earlier. While one month can hardly establish or confirm a trend,
it can offer some basis for hope. So far as consumer prices are
concerned, a significant slowing will be heavily dependent on the
course of prices of foods and services. Prospects of moderation are
more hopeful for the former than the latter.
Prospective financial developments
The combination of increased Regulation Q rate ceilings and
sharply reduced yields on market securities appears to be easing
pressures on the supply of funds available to banks. Deposit attrition
for the banking system as a whole seems to be halting. And for the
next two months a resumption of net deposit growth is projected,
assuming Treasury bill yields range a little below current levels.
While there may be a little growth in private demand deposits (and
the money supply), this improvement in deposit flows is likely to be
centered, as in recent weeks, in consumer-type time and savings deposits
at banks outside major money centers and in accounts of foreign official
institutions at large banks. Some small net pick-up in large domestic
CD's also seems likely, but major banks should continue to find it
advantageous to issue bank-related commercial paper as well.

I - 5
With respect to the demand for bank funds, there are
scattered reports of some lessening of pressure for loans from
businesses. With many firms continuing under severe liquidity strain,
however, over-all business demands for bank credit still appear to be
substantial. Factors likely to maintain business loan demands in the
period ahead include large March-April Federal income tax payments,
the deepening profits squeeze, and the continuing need to finance
capital spending programs already in train. On the other hand, if
staff estimates of reduced inventory accumulation in the second quarter
are confirmed by events, needs for business inventory financing might
slacken relative to their recent pace. Also, the very large calendar
of near-term corporate financing in capital markets probably will be
reflected to some extent in repayment of bank debt.
In other sectors of bank lending, demands for consumer in-
stalment loans, which recently have weakened substantially, are likely
to remain sluggish. There could be some further expansion of
security loans, particularly if the day-to-day cost of borrowing from
banks to position speculative security inventories should decline
further. And banks have recently increased their own takings of market
securities to some extent, chiefly at institutions outside the money
centers.
Securities markets. Any major effort by banks to step up
their investments would, of course, tend to be reflected in further
declines of security yields, particularly in the market for municipals.
I- 6
But the extent of relief now in prospect for banks seems unlikely to
permit any large volume of security acquisitions. Moreover, the
sharpness of the recent decline in municipal security yields has
reflected in large part dealer positioning of new issues in anticipa-
tion of some pick-up in bank investment. And the volume of pent-up
State and local government financing that could be triggered by further
yield declines is huge.
In markets for fully-taxable securities, the prospective calen-
dar of new offerings is also heavy. Capital market financing scheduled
by business corporations for March and April is already at a record level
for the period, and borrowing by FNMA and the FHLB is scheduled to con-
tinue at or somewhat above its recent active pace. Taken by itself, the
unusually large forward calendar of corporate, agency, and municipal
security offerings can be expected to act as a substantial brake against
further near-term declines in note and bond yields. But the outlook
for yields will also continue to depend importantly on the degree to which
signs of business easing cumulate and the extent to which the degree of
monetary restraint is lessened. Moreover, the U.S. Treasury, although
still expected to raise possibly $2 - $2.5 billion of new money over
the next few weeks, including additions to regular Treasury bill
offerings, will become a large net repayer of debt during the second
quarter of the year.
Mortgage markets. Despite the recent general easing of
security market yields, upward pressures on mortgage interest rates
and continued restrictions on the availability of mortgage funds seem
I-7
likely over the near-term. Improvement of savings inflows to thrift
institutions should remain relatively slow unless there are appreciable
further declines in short-term interest rates, and much of any initial
improvement in flows may well be allocated to a rebuilding of liquidity.
Thus, some further near-term reduction in new mortgage commitments seems
likely at a time when demands for such credit are normally expanding
seasonally.

I-8
Balance of payments outlook
The scanty information presently available on U.S. external
transactions in December, January and February is on the whole consis-
tent with the projections of the over-all balance of payments given to
the Committee in February, though the trend in merchandise trade is
in doubt. There are likely to be large deficits in the current
quarter and half-year on both the liquidity basis and the official
settlements basis. Important factors in the change from the surpluses
of the fourth quarter are the virtual cessation of repatriations of
funds out of German marks and probably some partial reversal of the end
of year inflows stimulated by OFDI controls.
U.S. foreign trade statistics for January are at least as
discouraging as the December figures were encouraging. In view of
the problems of seasonal adjustment of the monthly data, attention
should be focused on moving averages rather than single months. Even
with moving averages, the picture is one of virtual lack of growth in
merchandise exports over the past six months together with a leveling
off of merchandise imports. Unless some improvement becomes observable
in the next month or two, some downward revision of our 1970 net
exports projection will be called for.
Euro-dollar interest rates have remained fairly stable during
the past month despite declines in U.S. money market rates. It is
therefore not surprising that liabilities of U.S. banks to their foreign

I - 9
branches have tended to decline, though a large part of the decline
apparently represents a shift of foreign official dollar holdings
into CD's. Last week liabilities to branches were lower than at any
time since mid-July 1969 except for the end-of-October and end-of-
December temporary dips. Failure of Euro-dollar interest rates to
continue their January decline--which was primarily seasonal--reflects
the tight money market conditions in most major European countries.
A review of these conditions given in Part IV below indicates that the
likelihood is slight of any significant easing abroad in bank credit
availability during the next few months. This means that declines in
Euro-dollar rates are likely to continue lagging behind any further
declines in U.S. rates.
I -- T - 1March 3, 1970
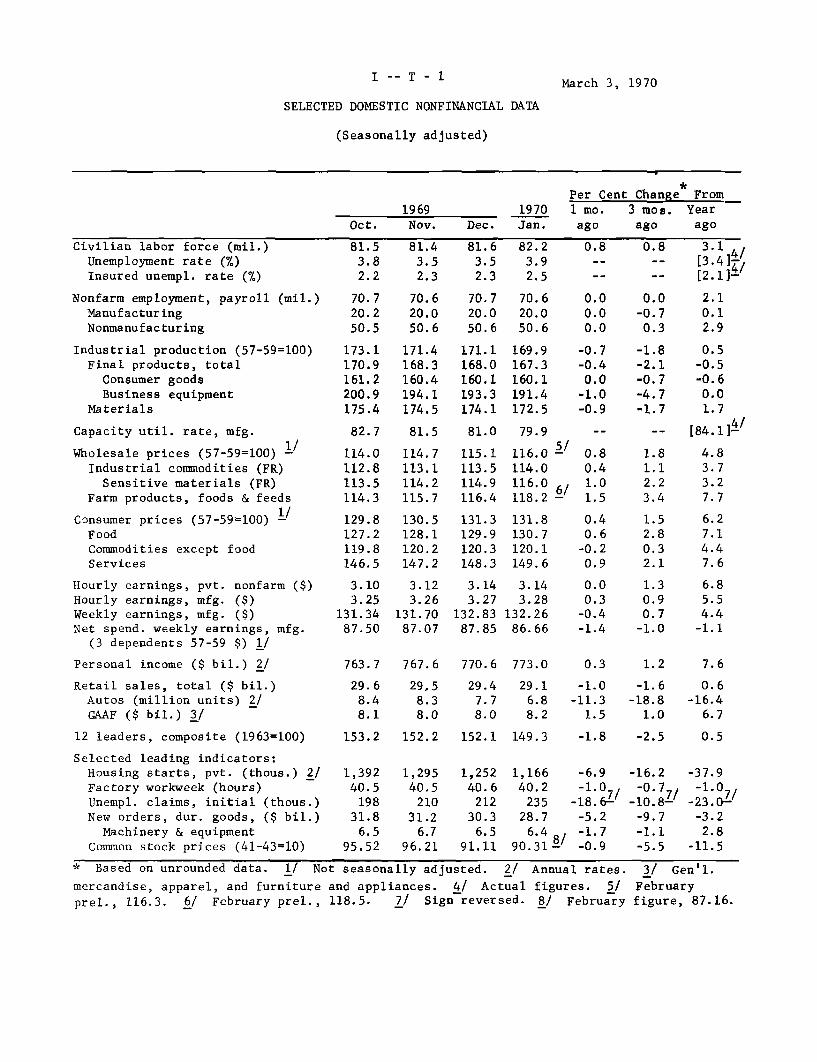
SELECTED DOMESTIC NONFINANCIAL DATA
(Seasonally adjusted)
Per Cent Change From1969 1970 1 mo. 3 mos. Year
Oct. Nov. Dec. Jan. ago ago ago
Civilian labor force (mil.)
Unemployment rate (%)
Insured unempl. rate (%)
Nonfarm employment, payroll (mil.)
Manufacturing
Nonmanufacturing
Industrial production (57-59=100)
Final products, total
Consumer goods
Business equipment
Materials
Capacity util. rate, mfg.
Wholesale prices (57-59=100)
Industrial commodities (FR)
Sensitive materials (FR)
Farm products, foods & feeds
Consumer prices (57-59=100)
Food
Commodities except food
Services
Hourly earnings, pvt. nonfarm ($)
Hourly earnings, mfg. ($)Weekly earnings, mfg. ($)Net spend. weekly earnings, mfg.
(3 dependents 57-59 $) 1/
Personal income ($ bil.) 2/
Retail sales, total ($ bil.)
Autos (million units) 2/
GAAF ($ bil.) 3/
12 leaders, composite (1963=100)
Selected leading indicators:
Housing starts, pvt. (thous.) 2/
Factory workweek (hours)
Unempl. claims, initial (thous.)
New orders, dur. goods, ($ bil.)
Machinery & equipment
Common stock prices (41-43=10)
81.53.82.2
70.720.250.5
173.1170.9161.2200.9175.4
81.43.52.3
70.620.050.6
171.4168.3160.4194.1174.5
81.63.52.3
70.720.050.6
171.1168.0160.1193.3174.1
82.23.92.5
70.620.050.6
169.9167.3160.1191.4172.5
0.8 0.8 3.1-- -- [3.41]
- -- [2.11-
0.0 0.0 2.10.0 -0.7 0.10.0 0.3 2.9
-0.7-0.4
0.0-1.0-0.9
82.7 81.5 81.0 79.9
114.0112.8113.5114.3
129.8127.2119.8146.5
3.103.25
131.3487.50
763.7
29.68.48.1
114.7113.1114.2115.7
130.5128.1120.2147.2
3.123.26
131.7087.07
767.6
29,58.38.0
115.1113.5114.9116.4
131.3129.9120.3148.3
3.143.27
132.8387.85
116.0 -114.0116.0 6/118.2 6
131.8130.7120.1149.6
3.143.28
132.2686.66
770.6 773.0
29.47.78.0
29.16.88.2
153.2 152.2 152.1 149.3
1,39240.5198
31.86.5
95.52
1,29540.5
21031.2
6.796.21
1,25240.6
212
30.36.5
91.11
1,16640.2
23528.7
6.4 890.31
-1.8-2.1-0.7-4.7-1.7
0.5-0.5-0.60.01.7
-- -- [84.1]-
0.80.41.0
1.5
0.4
0.6-0.2
0.9
0.00.3-0.4-1.4
0.3
-1.0-11.3
1.5
1.30.90.7
-1.0
1.2
-1.6-18.8
1.0
4.83.73.27.7
6.27.14.47.6
6.8
5.54.4
-1.1
7.6
0.6-16.4
6.7
-1.8 -2.5 0.5
-6.9-1.0
-18.6--5.2
-1.7-0.9
-16.2
-0.7
-10.8-z
-9.7-1.1-5.5
-37.9-1.0/
-23.0--3.2
2.8-11.5
* Based on unrounded data. 1/ Not seasonally adjusted. 2/ Annual rates. 3/ Gen'l.
February
figure, 87.16.
mercandise, apparel, and furniture and appliances. 4/ Actual figures. 5/prel., 116.3. 6/ February prel., 118.5. 7/ Sign reversed. 8/ February
I-- T - 2
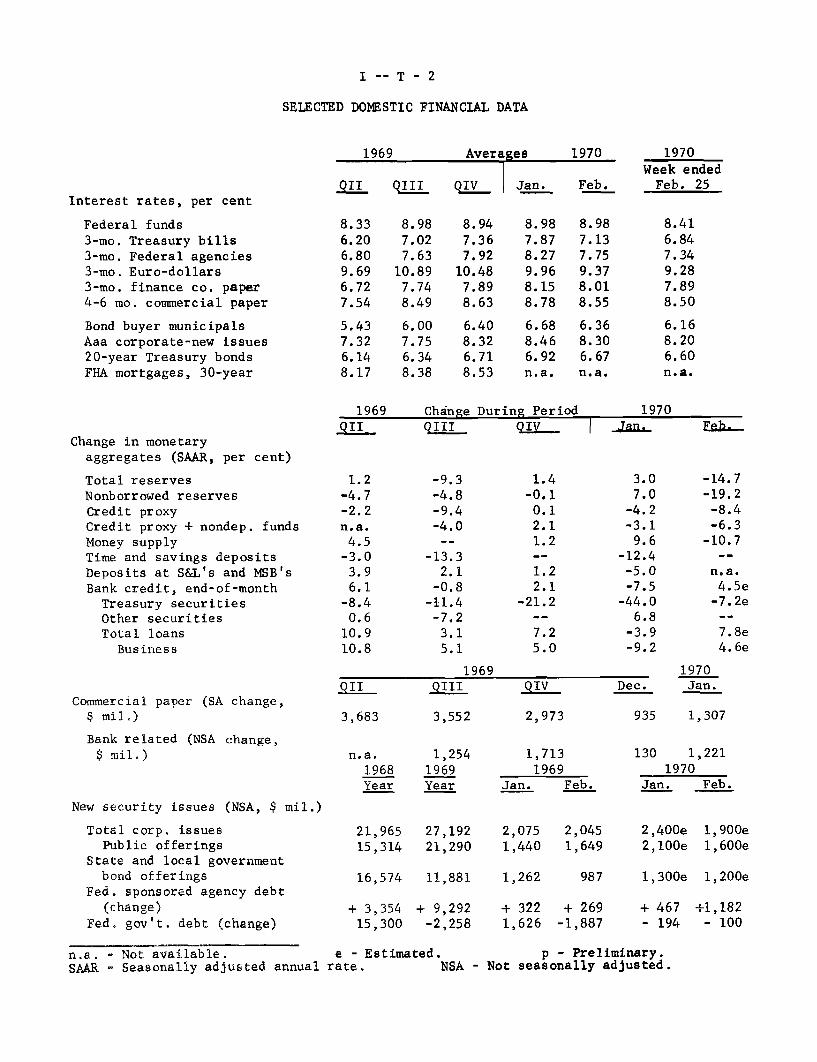
SELECTED DOMESTIC FINANCIAL DATA
1969 Averages
QII QIII QIV Jan.Interest rates, per cent
Federal funds3-mo. Treasury bills3-mo. Federal agencies3-mo. Euro-dollars3-mo. finance co. paper4-6 mo. commercial paper
Bond buyer municipalsAaa corporate-new issues20-year Treasury bondsFHA mortgages, 30-year
8.336.206.809.696.727.54
5.437.326.148.17
8.987.027.63
10.897.748.49
6.007.756.348.38
1969
8.947.367.9210.487.898.63
6.408.326.718.53
8.987.878.279.968.158.78
6.688.466.92n.a.
1970 1970Week ended
Feb. Feb. 25
8.987.137.759.378.018.55
6.368.306.67n.a.
Chanee Durine Period
8.416.847.349.287.898.50
6.168.206.60n.a.
1970
Change in monetary
aggregates (SAAR, per cent)
Total reservesNonborrowed reservesCredit proxyCredit proxy + nondep. fundsMoney supplyTime and savings depositsDeposits at S&L's and MSB'sBank credit, end-of-month
Treasury securitiesOther securitiesTotal loans
Business
Commercial paper (SA change,$ mil.)
Bank related (NSA change,$ mil.)
New security issues (NSA, $ mil.)
Total corp. issuesPublic offerings
State and local governmentbond offerings
Fed. sponsored agency debt
(change)
Fed. gov't. debt (change)
QII
1.2-4.7-2.2n.a.
4.5-3.03.96.1-8.4
0.610.910.8
QII
3,683
n.a.1968Year
QIII
-9.3-4.8-9.4-4.0
-13.32.1
-0.8-11.4
-7.23.15.1
1969QIII
3,552
1,2541969Year
OIV I Jan.
1.4-0.10.12.11.2
1.22.1
-21.2
7.25.0
QIv
2,973
1,7131969
Jan. Feb.
21,965 27,192 2,075 2,04515,314 21,290 1,440 1,649
16,574 11,881 1,262
+ 3,354 + 9,292 + 322 + 26915,300 -2,258 1,626 -1,887
3.07.0
-4.2-3.1
9.6-12.4
-5.0-7.5
-44.06.8
-3.9-9.2
-14.7-19.2
-8.4-6.3
-10.7.-
n.a.4.5e-7.2e
7.8e4.6e
n.a. - Not available. e - Estimated. p - Preliminary.SAAR - Seasonally adjusted annual rate. NSA - Not seasonally adjusted.
1970Dec. Jan.
935 1,307
130 1,2211970
Jan. Feb.
2,400e 1,900e2,100e 1,600e
1,300e 1,200e
+ 467 +1,182- 194 - 100
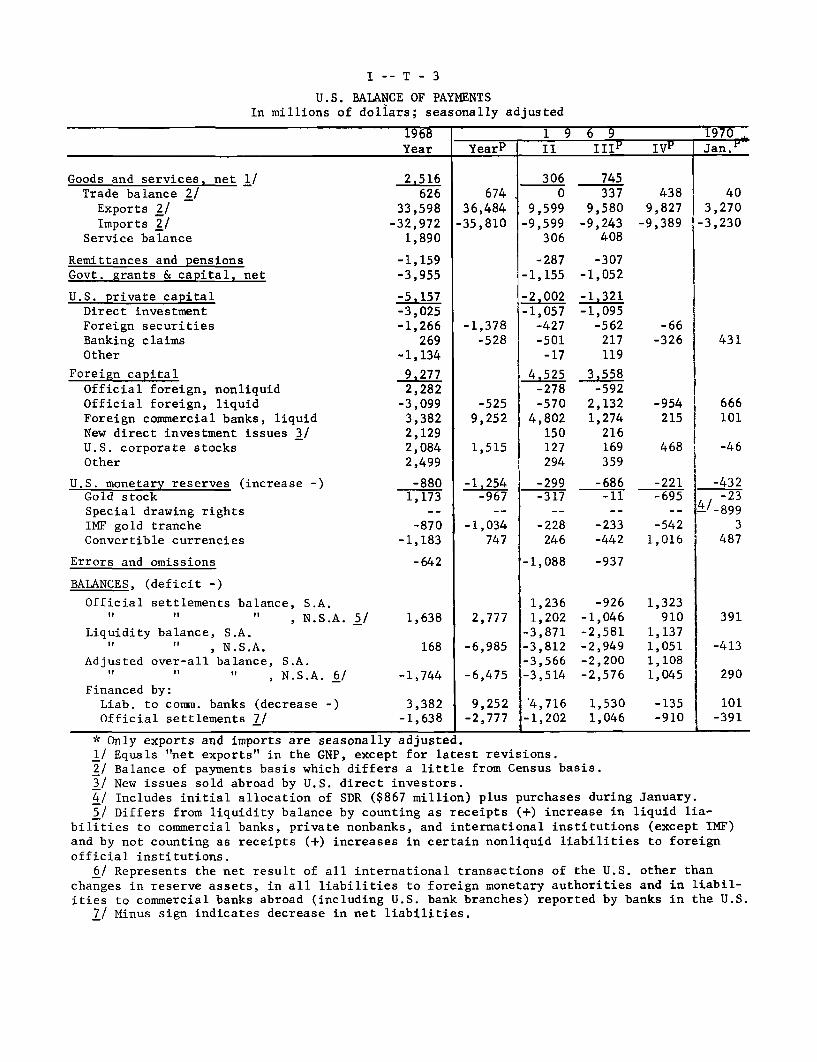
I -- T - 3
U.S. BALANCE OF PAYMENTSIn millions of dollars; seasonally adjusted
1968 1 9 6 9 1970Year YearP II III IV' Jan.
Goods and services, net 1/ 2,516 306 745Trade balance 2/ 626 674 0 337 438 40
Exports 2/ 33,598 36,484 9,599 9,580 9,827 3,270Imports 2/ -32,972 -35,810 -9,599 -9,243 -9,389 -3,230
Service balance 1,890 306 408
Remittances and pensions -1,159 -287 -307Govt. grants & capital, net -3,955 -1,155 -1,052
U.S. private capital -5,157 -2,002 -1,321Direct investment -3,025 -1,057 -1,095Foreign securities -1,266 -1,378 -427 -562 -66Banking claims 269 -528 -501 217 -326 431Other -1,134 -17 119
Foreign capital 9,277 4,525 3,558Official foreign, nonliquid 2,282 -278 -592Official foreign, liquid -3,099 -525 -570 2,132 -954 666Foreign commercial banks, liquid 3,382 9,252 4,802 1,274 215 101New direct investment issues 3/ 2,129 150 216U.S. corporate stocks 2,084 1,515 127 169 468 -46Other 2,499 294 359
U.S. monetary reserves (increase -) -880 -1,254 -299 -686 -221 -432Gold stock 1,173 -967 -317 -11 -695 / -23Special drawing rights - -- - - - -899
IMF gold tranche -870 -1,034 -228 -233 -542 3Convertible currencies -1,183 747 246 -442 1,016 487
Errors and omissions -642 -1,088 -937
BALANCES, (deficit -)
Official settlements balance, S.A. 1,236 -926 1,323S" " , N.S.A. 5/ 1,638 2,777 1,202 -1,046 910 391
Liquidity balance, S.A. -3,871 -2,581 1,137S" , N.S.A. 168 -6,985 -3,812 -2,949 1,051 -413
Adjusted over-all balance, S.A. -3,566 -2,200 1,108" " , N.S.A. 6/ -1,744 -6,475 -3,514 -2,576 1,045 290
Financed by:Liab. to comm. banks (decrease -) 3,382 9,252 '4,716 1,530 -135 101Official settlements 7/ -1,638 -2,777 -1,202 1,046 -910 -391
* Only exports and imports are seasonally adjusted.1/ Equals "net exports" in the GNP, except for latest revisions.2/ Balance of payments basis which differs a little from Census basis.3/ New issues sold abroad by U.S. direct investors.4/ Includes initial allocation of SDR ($867 million) plus purchases during January.
5/ Differs from liquidity balance by counting as receipts (+) increase in liquid lia-bilities to commercial banks, private nonbanks, and international institutions (except IMF)and by not counting as receipts (+) increases in certain nonliquid liabilities to foreignofficial institutions.
6/ Represents the net result of all international transactions of the U.S. other thanchanges in reserve assets, in all liabilities to foreign monetary authorities and in liabil-ities to commercial banks abroad (including U.S. bank branches) reported by banks in the U.S.
7/ Minus sign indicates decrease in net liabilities.
II - 1
THE ECONOMIC PICTURE IN DETAIL
Domestic Nonfinancial Scene
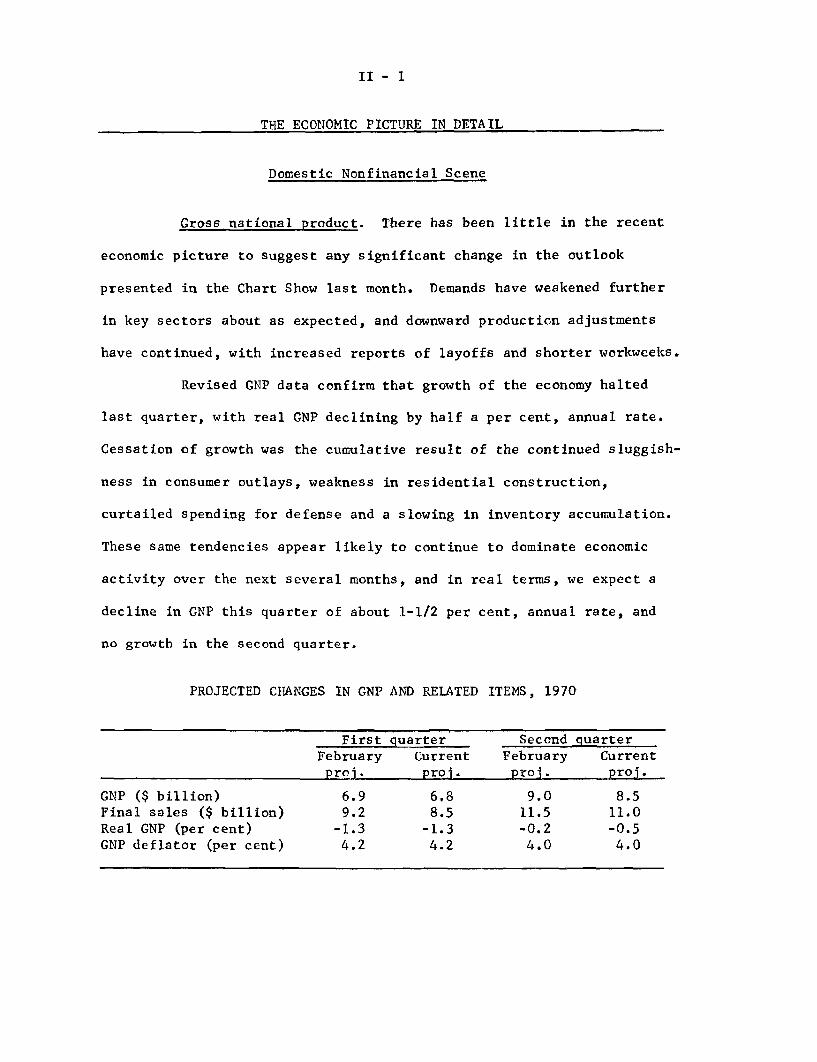
Gross national product. There has been little in the recent
economic picture to suggest any significant change in the outlook
presented in the Chart Show last month. Demands have weakened further
in key sectors about as expected, and downward production adjustments
have continued, with increased reports of layoffs and shorter workweeks.
Revised GNP data confirm that growth of the economy halted
last quarter, with real GNP declining by half a per cent, annual rate.
Cessation of growth was the cumulative result of the continued sluggish-
ness in consumer outlays, weakness in residential construction,
curtailed spending for defense and a slowing in inventory accumulation.
These same tendencies appear likely to continue to dominate economic
activity over the next several months, and in real terms, we expect a
decline in GNP this quarter of about 1-1/2 per cent, annual rate, and
no growth in the second quarter.
PROJECTED CHANGES IN GNP AND RELATED ITEMS, 1970
First quarter Second quarterFebruary Current February Current
proj. proj. proj. proj.
GNP ($ billion) 6.9 6,8 9.0 8.5Final sales ($ billion) 9.2 8.5 11.5 11.0Real GNP (per cent) -1.3 -1.3 -0.2 -0.5GNP deflator (per cent) 4.2 4.2 4.0 4.0
II - 2
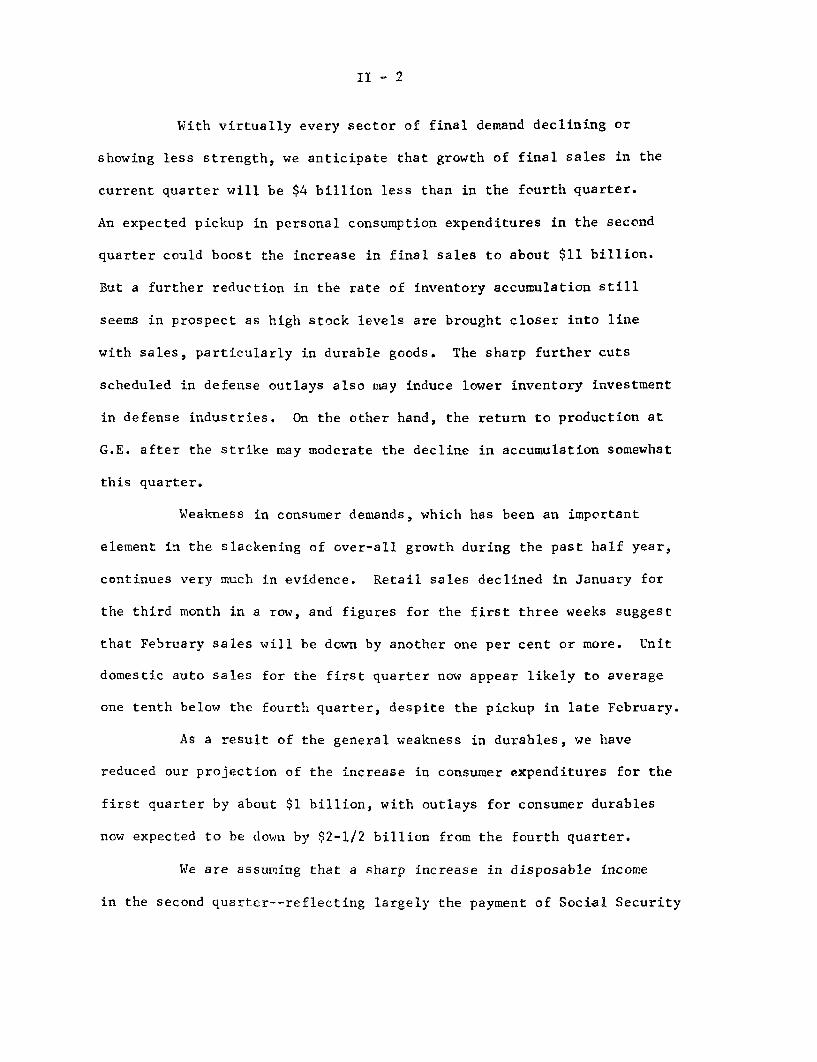
With virtually every sector of final demand declining or
showing less strength, we anticipate that growth of final sales in the
current quarter will be $4 billion less than in the fourth quarter.
An expected pickup in personal consumption expenditures in the second
quarter could boost the increase in final sales to about $11 billion.
But a further reduction in the rate of inventory accumulation still
seems in prospect as high stock levels are brought closer into line
with sales, particularly in durable goods. The sharp further cuts
scheduled in defense outlays also may induce lower inventory investment
in defense industries. On the other hand, the return to production at
G.E. after the strike may moderate the decline in accumulation somewhat
this quarter.
Weakness in consumer demands, which has been an important
element in the slackening of over-all growth during the past half year,
continues very much in evidence. Retail sales declined in January for
the third month in a row, and figures for the first three weeks suggest
that February sales will be down by another one per cent or more. Unit
domestic auto sales for the first quarter now appear likely to average
one tenth below the fourth quarter, despite the pickup in late February.
As a result of the general weakness in durables, we have
reduced our projection of the increase in consumer expenditures for the
first quarter by about $1 billion, with outlays for consumer durables
now expected to be down by $2-1/2 billion from the fourth quarter.
We are assuming that a sharp increase in disposable income
in the second quarter--reflecting largely the payment of Social Security
II - 3
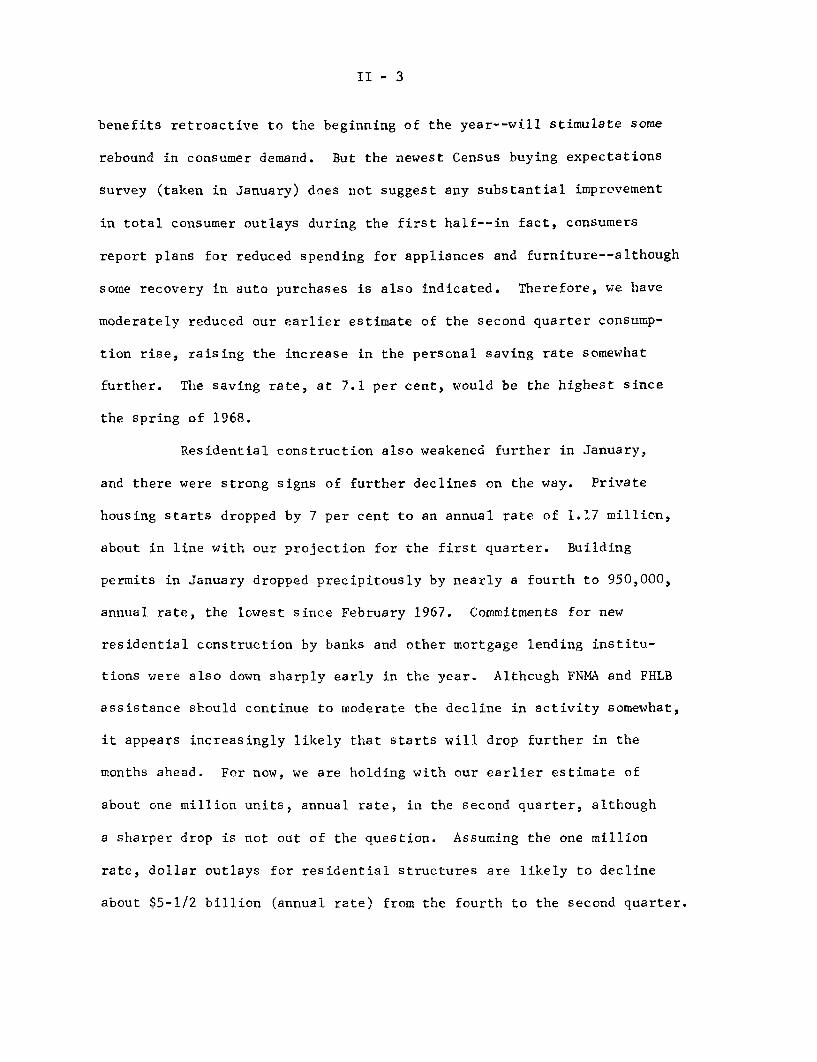
benefits retroactive to the beginning of the year--will stimulate some
rebound in consumer demand. But the newest Census buying expectations
survey (taken in January) does not suggest any substantial improvement
in total consumer outlays during the first half--in fact, consumers
report plans for reduced spending for appliances and furniture--although
some recovery in auto purchases is also indicated. Therefore, we have
moderately reduced our earlier estimate of the second quarter consump-
tion rise, raising the increase in the personal saving rate somewhat
further. The saving rate, at 7.1 per cent, would be the highest since
the spring of 1968.
Residential construction also weakened further in January,
and there were strong signs of further declines on the way. Private
housing starts dropped by 7 per cent to an annual rate of 1.17 million,
about in line with our projection for the first quarter. Building
permits in January dropped precipitously by nearly a fourth to 950,000,
annual rate, the lowest since February 1967. Commitments for new
residential construction by banks and other mortgage lending institu-
tions were also down sharply early in the year. Although FNMA and FHLB
assistance should continue to moderate the decline in activity somewhat,
it appears increasingly likely that starts will drop further in the
months ahead. For now, we are holding with our earlier estimate of
about one million units, annual rate, in the second quarter, although
a sharper drop is not out of the question. Assuming the one million
rate, dollar outlays for residential structures are likely to decline
about $5-1/2 billion (annual rate) from the fourth to the second quarter.
II - 4
Business capital spending remains the only sector of the
economy continuing to show signs of significant expansiveness. Recent
private surveys indicate that businessmen are now planning somewhat
higher outlays for 1970 than they had reported in the late fall of
last year, though a better indication of current plans will be provided
by the Commerce-SEC survey, soon to be released. On the other hand,
new orders for machinery and equipment have edged down in the past few
months, and new appropriations may be topping out: NICB reported a
5 per cent decline in its fourth quarter survey of large manufacturers,
although the backlog remains very large. With sales continuing to
weaken, and corporate profits apparently declining, we continue to
believe that there will be little if any further increase in capital
spending after midyear.
We are still anticipating a resumption of growth of real GNP
after midyear. Construction activity is likely to begin to recover,
following an assumed easing during the spring in monetary restraint.
In addition, gains in aggregate final sales are expected to strengthen
after the first quarter, reflecting mainly improved consumer goods
sales. This should help to improve stock-sales ratios, and to encourage
resumption of a somewhat higher rate of inventory investment after mid-
year. We anticipate that the recovery in real growth will be modest,
however, with expansion in real GNP rising to an annual rate of only
about 2-1/2 per cent in the fourth quarter.
Some moderate easing of price pressures should be evident
during the coming months, largely as a result of less urgent demands

II - 5
and an increased reluctance of markets to accept price increases.
Moreover, some abatement of cost pressures should begin to be evident
as well by the second half of the year. Given these expectations, we
are projecting a slowing in the rise of the price deflator to 4 per
cent in the second quarter and to about 3-1/2 per cent by yearend.

CONFIDENTIAL - FR
GROSS NATIONAL PRODUCT AND RELATED ITEMS(Quarterly figures are seasonally adjusted. Expenditures and income
figures are billions of dollars, with quarterly figures at annual rates.)
1969 19701970 Projected
1968 1969 Proj. II III IV I II III IV
Gross National ProductFinal sales
PrivateExcluding net exports
Personal consumption expendituresDurable goodsNondurable goodsServices
Gross private domestic investmentResidential constructionBusiness fixed investmentChange in business inventoriesNonfarm
Net exports of goods and services
Gov't. purchases of goods & servicesFederal
DefenseOther
State & local
Gross national product inconstant (1958) dollars
GNP implicit deflator (1958 = 100)
Personal incomeWages and salaries
Disposable incomePersonal savingSaving rate (per cent)
865.7858.4658.1655.6
536.683.3
230.6222.8
126.330.288.87.37.4
932.1924.1709.5707.4
576.089.8
243.6242.6
139.432.299.28.07.8
975.7971.2750.5746.8
612.289.0
260.0263.2
139.127.6
107.04.54.5
924.8917.9705.0703.4
572.890.6
242.1240,1
137.432.797.8
6.96.7
942.8932.0715.0712.3
579.889.8
245.1244.9
143.331.4
101.110.7S10.3
952.2944.5726.2723.5
589.590.4
248.7250.3
141.831.6
102.57.77.4
959.0953.0734.4730.4
596.587.7
253.3255.5
139.928.9
105.06.06.0
967.5964.0744.6740.3
607.388.2
258.3260.8
136.526.0
107.03.53.5
980.7976.7755.4752.5
618.289.5
262.9265.8
138.326.3
108.04.04.0
995.7991.1767.4763.8
626.790.5
265.4270.8
141.729.1
108.04.64.6
2.5 2.1 3.7 1.6 2.7 2.7 4.0 4.3 2.9 3.6
200.399.578.021.5
100.7
214.6101.9
79.222.7
112.7
220.897.574.223.2
123.3
212.9100.6
78.522.1
112.3
217.0103.280.322.9
113.8
218.3102.3
79.223.1
116.0
218.699.877.322.5
118.8
219.497.974.923.0
121.5
221.396.673.123.5
124.7
223.795.571.623.9
128.2
707.6 727.5 729.5 726.7 730.6 729.8 727.3 726.5 729.7 734.4122.3 128.1 133.8 127.3 129.0 130.5 131.9 133.2 134.4 135.6
687.9465.0590.038.46.5
747.2509.9629.7
37.66.0
794.2540.5675.8
46.76.9
740.5504.3622.0
33.35.3
756.5516.9639.043.16.7
767.4525.0647.5
41.76.4
776.3531.0658.344.96.8
792.3536.3671.9
48.07.1
799.0543.1682.6
47.57.0
809.3551.5690.3
46.56.7
Corporate profits before tax 91.1 94.0 85.3 95.4 92.5 92.5* 87.5 85.0 84.0 84.5
Federal government receipts andexpenditures (N.I.A. basis)
Receipts
ExpendituresSurplus or deficit (-)
Total labor force (millions)
Armed forces "Civilian labor forceUnemployment rate (per cent)
Nonfarm payroll employment (millions)
Manufacturing
Industrial production (1957-59=100)Capacity utilization, manufacturing
(per cent)
Housing starts, private (millions A.R.)Sales new domestic autos (millions,
A.R.)
176.3181.5
-5.2
201.6192.0
9.6
196.8201.1-4.3
202.8189.313.5
201.3193.6
7.7
203.7*196.7
7.0*
197.4197.4
0.0
198.7205.2
-6.5
194.2201.0
-6.8
196.7200.9-4.2
82.3 84.2 85.6 83.9 84.6 85.0 85.2 85.3 85.7 86.13.5 3.4 3.2 3.5 3.5 3.5 3.4 3.2 3.1 3.1
78.7 80.7 82.4 80.4 81.0 81.5 81.8 82.1 82.6 83.13.6 3.5 4.7 3.5 3.6 3.6 4.2 4.6 4.9 5.1
67.9 70.1 70.8 70.0 70.4 70.6 70.7 70.6 70.6 71.219.8 20.1 19.7 20.1 20.2 20.1 20.0 19.7 19.5 19.7
165.5
84.6
1.51
8.62
172.8
83.7
1.46
8.46
169.9
78.1
1.15
7.64
172.6
84.5
1.51
8.54
174.3
84.2
1.43
8.45
171.9
81.7
1.31
8.13
169.8
79.5
1.12
7.20
168.5
78.0
1.03
7.60
169.7
77.6
1.15
7.75
171.7
77.4
1.30
8.00
* Implied in Commerce estimate for 1969.
II - 6 March 4, 1970
CONFIDENTIAL - FR II - 7
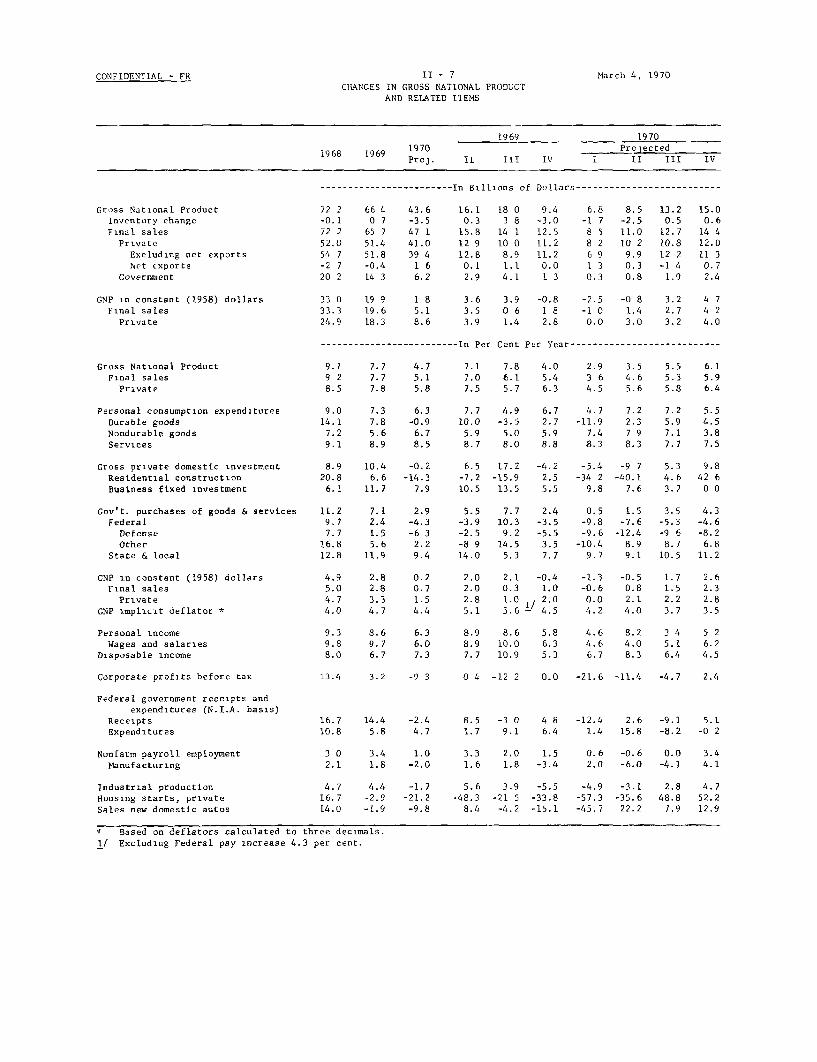
CHANGES IN GROSS NATIONAL PRODUCT
AND RELATED ITEMS
1968 1969 1970Proj.
1969
TT TT ITV
1970
ProjectedI II III IV
------------------------ In Billions of Dollars--------------------------
Gross National Product
Inventory change
Final sales
Private
Excluding net exports
Net exports
Government
GNP in constant (1958) dollars
Final sales
Private
33 0 19 9 1 833.3 19.6 5.1
24.9 18.3 8.6
-2.5 -0 8 3.2
-1 0 1.4 2.7
0.0 3.0 3.2
-------------------------In Per Cent Per Year ---------------------------
Gross National Product
Final sales
Private
Personal consumption expendituresDurable goodsNondurable goodsServices
Gross private domestic investmentResidential constructionBusiness fixed investment
Gov't. purchases of goods & servicesFederalDefenseOther
State & local
GNP in constant (1958) dollarsFinal sales
PrivateGNP implicit deflator *
Personal incomeWages and salaries
Disposable income
Corporate profits before tax
Federal government receipts andexpenditures (N.I.A. basis)
ReceiptsExpenditures
Nonfarm payroll employmentManufacturing
9.0 7.314.1 7.8
7.2 5.6
9.1 8.9
8.9 10.4 -0.220.8 6.6 -14.3
6.1 11.7 7.9
6.3 7.7 4.9 6.7-0.9 10.0 -3.5 2.76.7 5.9 5.0 5.98.5 8.7 8.0 8.8
6.5 17.2-7.2 -15.9
10.5 13.5
4.7
-11.9
7.4
8.3
-4.2 -5.4
2.5 -34 2
5.5 9.8
0.5-9.8-9.6
-10.49.7
2.1 -0.40.3 1.01.0 2.05.6- 4.5
8.6 5.810.0 6.310.9 5.3
13.4 3.2 -9 3 0 4 -12 2 0.0
-9 7-40.1
7.6
1.5-7.6
-12.48.99.1
-1.3 -0.5 1.7-0.6 0.8 1.50.0 2.1 2.24.2 4.0 3.7
-21.6 -11.4 -4.7 2.4
16.7 14.4 -2.4 8.5 -3 0 4 8 -12.4 2.6 -9.1 5.110.8 5.8 4.7 1.7 9.1 6.4 1.4 15.8 -8.2 -0 2
3 0 3.4 1.0 3.3 2.0 1.5 0.6 -0.6 0.0 3.4
2.1 1.8 -2.0 1.6 1.8 -3.4 2.0 -6.0 -4.1 4.1
Industrial productionHousing starts, privateSales new domestic autos
4.7 4.4 -1.7 5.6 3.9 -5.516.7 -2.9 -21.2 -48.3 -21 5 -33.8
14.0 -1.9 -9.8 8.4 -4.2 -15.1
Based on deflators calculated to three decimals.1/ Excluding Federal pay increase 4.3 per cent.
March 4, 1970
2.9 3.5
3 6 4.64.5 5.6
-4.9 -3.1
-57.3 -35.6-45.7 22.2
2.8 4.7
48.8 52.27.9 12.9

II - 8
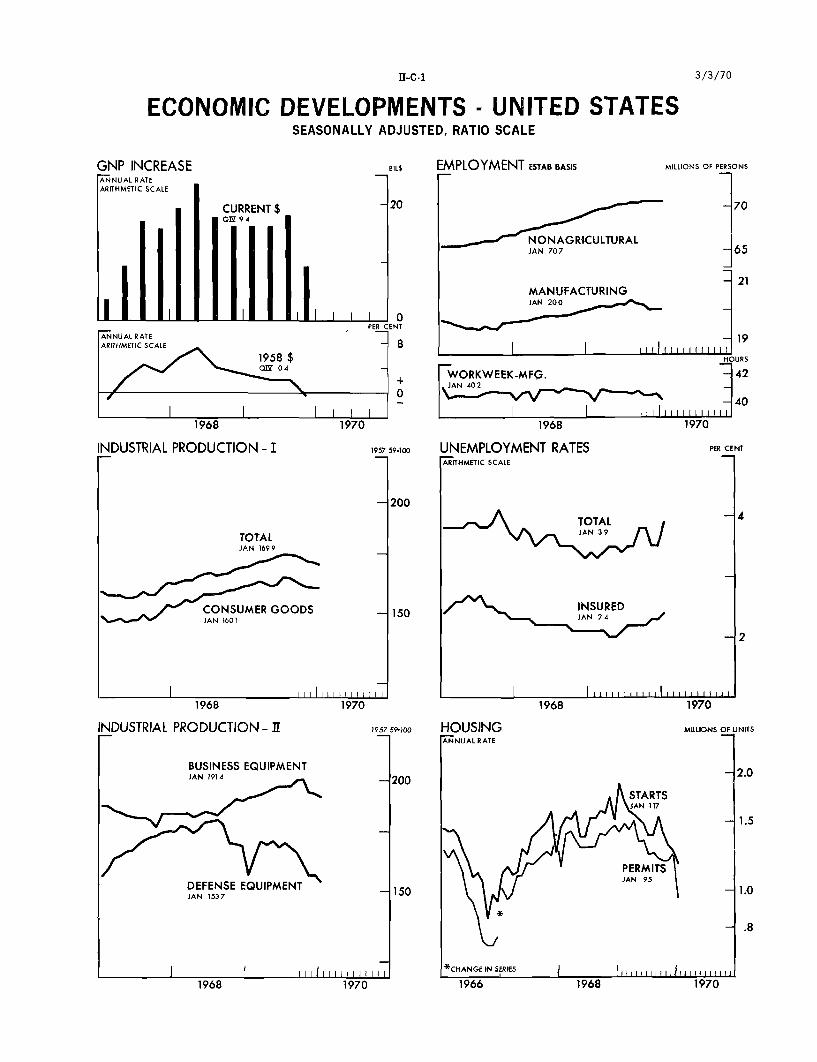
Industrial production. Industrial production is tentatively
estimated to have changed little in February from the preliminary
January index of 169.9 per cent of the 1957-59 average. The rise in
output because of the settlement of the G.E. strike in early February
is expected to offset further production declines in some other industries.
Auto assemblies were reduced further in February to a
seasonally adjusted annual rate of 6.5 million units from 6.8 million
units in January. Preliminary production schedules for March are at a
6.9 million unit rate. Among other consumer goods, output of television
sets rose in February from the low January level and production of
electrical appliances increased from the earlier strike reduced level.
Output of business equipment is estimated to have recovered
partially in February because of the strike settlement. Truck produc-
tion, however, declined further as sales dropped sharply in January
and were 10 per cent below a year earlier. New strikes in the electrical
equipment industry and at International Harvester also will dampen some-
what the February recovery in business equipment. Output of raw steel,
the only other major industry for which February data are available,
was down about 2 per cent.
The decline in industrial production from the July 1969 peak
to January 1970 has amounted to only 2.7 per cent, of which about .7 per
cent is directly attributable to the G.E. strike. The largest downward
readjustments in output have been in consumer durable goods and durable
goods materials and half of the decline in these two sectors is attrib-
utable to the 30 per cent curtailment in auto production. If unit sales

II - 9
INDUSTRIAL PRODUCTION IN JANUARY 1970
Total index
Final productsConsumer goods
DurableNondurable
EquipmentBusinessDefense
MaterialsDurableNondurable
* High for total index.
Per cent changes January 1970 fromMonth ago July 1969*
- .7 - 2.7
- .4 - 3.20 -2.6
- .9 -12.0.3 .8
-1.2 - 4.2-1.0 - 2.8-1.8 - 9.5
- .9 - 2.3-1.6 - 4.3- .3 - .5
of new domestic autos level off at about or moderately below the 7.9
million unit rate of February, some increase in auto assemblies might
occur in the second quarter. With output of television sets and
appliances curtailed 25 per cent since mid-1969, factory stocks declined
almost 15 per cent from September to the end of January. Unless retail
sales of these goods decline appreciably further, output readjustments
in these lines may also be about completed.
Production of business equipment rose at an annual rate of
8 per cent from July to October 1969, when the total index was easing
off, but then declined 5 per cent (20 per cent annual rate) through
January largely because of the G.E. strike. At present the major
apparent weaknesses in this sector are in farm machinery and trucks.
Demand is increasing for telephone and electrical utility equipment and
~-C
II - 10
has not diminished for manufacturing equipment. Output of defense
equipment, however, is expected to decline further in the months ahead.
Output of metal goods materials declined 4 per cent from
July to January, mainly because consumption was curtailed in the pro-
duction of consumer metal goods. If the readjustments in production
of consumer durable goods are largely over and if output of business
equipment is maintained, any further cutbacks in durable materials may
well be small. Under such circumstances, large additional declines in
the industrial production index in coming months would be quite unlikely.
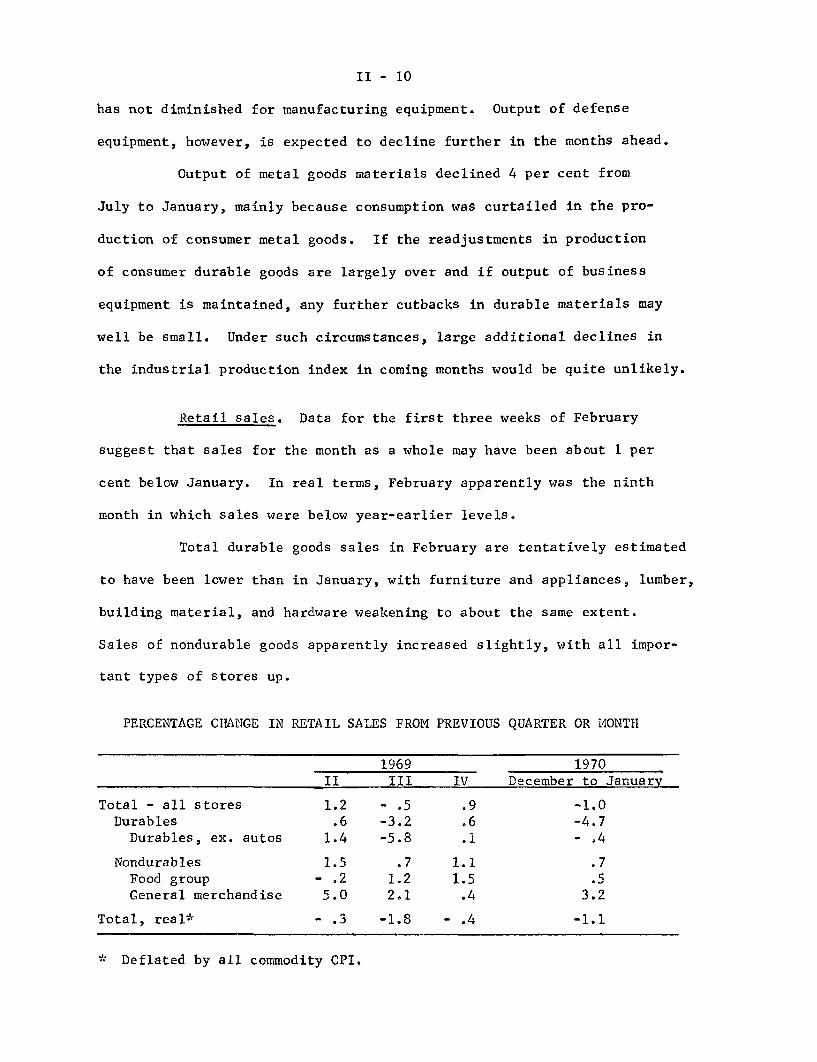
Retail sales. Data for the first three weeks of February
suggest that sales for the month as a whole may have been about 1 per
cent below January. In real terms, February apparently was the ninth
month in which sales were below year-earlier levels.
Total durable goods sales in February are tentatively estimated
to have been lower than in January, with furniture and appliances, lumber,
building material, and hardware weakening to about the same extent.
Sales of nondurable goods apparently increased slightly, with all impor-
tant types of stores up.
PERCENTAGE CHANGE IN RETAIL SALES FROM PREVIOUS QUARTER OR MONTH
1969 1970II III IV December to January
Total - all stores 1.2 - .5 .9 -1.0Durables .6 -3.2 .6 -4.7
Durables, ex. autos 1.4 -5.8 .1 - .4
Nondurables 1.5 .7 1.1 .7Food group - .2 1.2 1.5 .5General merchandise 5.0 2.1 .4 3.2
Total, real* - .3 -1.8 - .4 -1.1
* Deflated by all commodity CPI.
II - 11
Unit sales of new domestic autos, which had been weak in the
first 20 days of February, advanced sharply in the last 10 days bringing
the total for the month to a seasonally adjusted annual rate of 7.9
million units--one-sixth above the January total of 6.8 million. It
is difficult to appraise the significance of this recent upsurge for
the months immediately ahead. Newspaper accounts suggested that it was
largely attributable to the introduction of two new GM models and the
widespread resort in the industry to dealer incentive contests.
II - 12
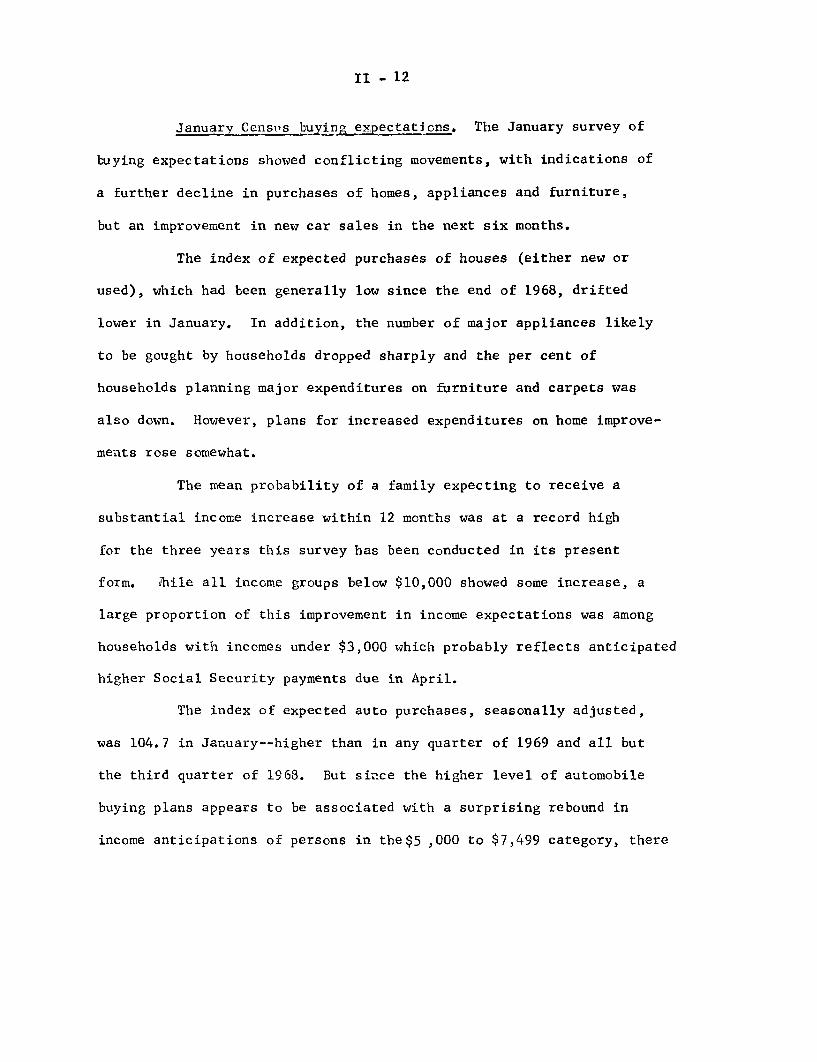
January Census buying expectations. The January survey of
buying expectations showed conflicting movements, with indications of
a further decline in purchases of homes, appliances and furniture,
but an improvement in new car sales in the next six months.
The index of expected purchases of houses (either new or
used), which had been generally low since the end of 1968, drifted
lower in January. In addition, the number of major appliances likely
to be gought by households dropped sharply and the per cent of
households planning major expenditures on furniture and carpets was
also down. However, plans for increased expenditures on home improve-
ments rose somewhat.
The mean probability of a family expecting to receive a
substantial income increase within 12 months was at a record high
for the three years this survey has been conducted in its present
form. While all income groups below $10,000 showed some increase, a
large proportion of this improvement in income expectations was among
households with incomes under $3,000 which probably reflects anticipated
higher Social Security payments due in April.
The index of expected auto purchases, seasonally adjusted,
was 104.7 in January--higher than in any quarter of 1969 and all but
the third quarter of 1968. But since the higher level of automobile
buying plans appears to be associated with a surprising rebound in
income anticipations of persons in the$5 ,000 to $7,499 category, there

II - 13
is more doubt than usual about the significance of the increase in car
purchase plans.
CONSUMER BUYING EXPECTATIONS - SELECTED RESULTSBY QUARTERS
1969 1970Jan. Apr. July Oct. Jan.
INDEXES OF EXPECTED 6-MONTH UNITPURCHASES
(Seasonally adjusted.Jan. and Apr. 1967 = 100)
New cars 99.4 103.3 104.0 100.8 104.7Houses 89.3 99.3 93.0 94.1 94.1
EXPECTATIONS TO BUY FURNITURE,APPLIANCES, AND HOME IMPROVEMENTS
WITHIN 12 MONTHS
Number of major appliances reportedLikely to be bought per 100households 27.9 25.8 26.2 28.6 25.5
Per cent of households reportingprobable major expenditures on--
Furniture and carpets 25.2 26.9 25.3 28.0 25.2Home improvements 8.1 9.5 8.5 7.7 8.4
MEAN PROBABILITIES OF RECEIVING SUB-STANTIAL INCOME INCREASES WITHIN 12
MONTHS(Average number of chances in 100)
All households 16.5 18.1 18.6 17.6 20.1
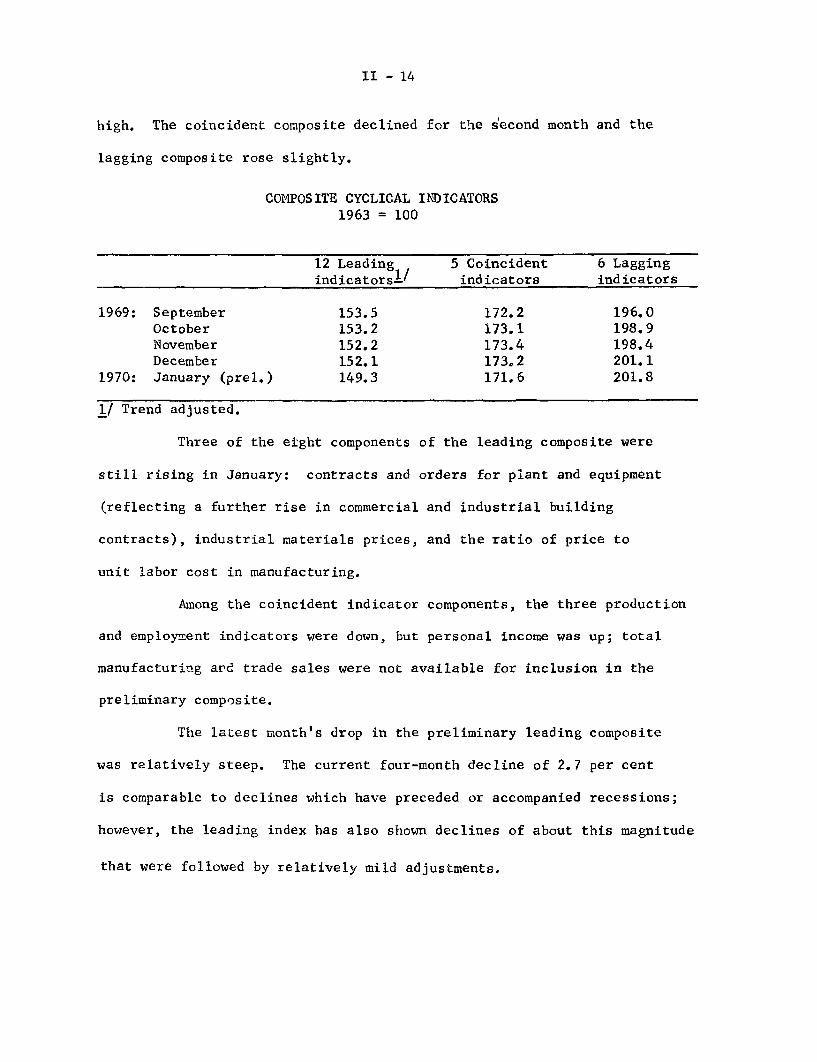
Cyclical indicators. The preliminary leading indicator composite
declined 1.8 per cent in January and was 2.7 per cent below its September
II - 14
high. The coincident composite declined for the second month and the
lagging composite rose slightly.
COMPOSITE CYCLICAL INDICATORS1963 = 100
12 Leading 5 Coincident 6 Laggingindicators' / indicators indicators
1969: September 153.5 172.2 196.0October 153.2 173.1 198.9November 152.2 173.4 198.4December 152.1 173.2 201.1
1970: January (prel.) 149.3 171.6 201.8
I/ Trend adjusted.
Three of the eight components of the leading composite were
still rising in January: contracts and orders for plant and equipment
(reflecting a further rise in commercial and industrial building
contracts), industrial materials prices, and the ratio of price to
unit labor cost in manufacturing.
Among the coincident indicator components, the three production
and employment indicators were down, but personal income was up; total
manufacturing and trade sales were not available for inclusion in the
preliminary composite.
The latest month's drop in the preliminary leading composite
was relatively steep. The current four-month decline of 2.7 per cent
is comparable to declines which have preceded or accompanied recessions;
however, the leading index has also shown declines of about this magnitude
that were followed by relatively mild adjustments.
II - 15
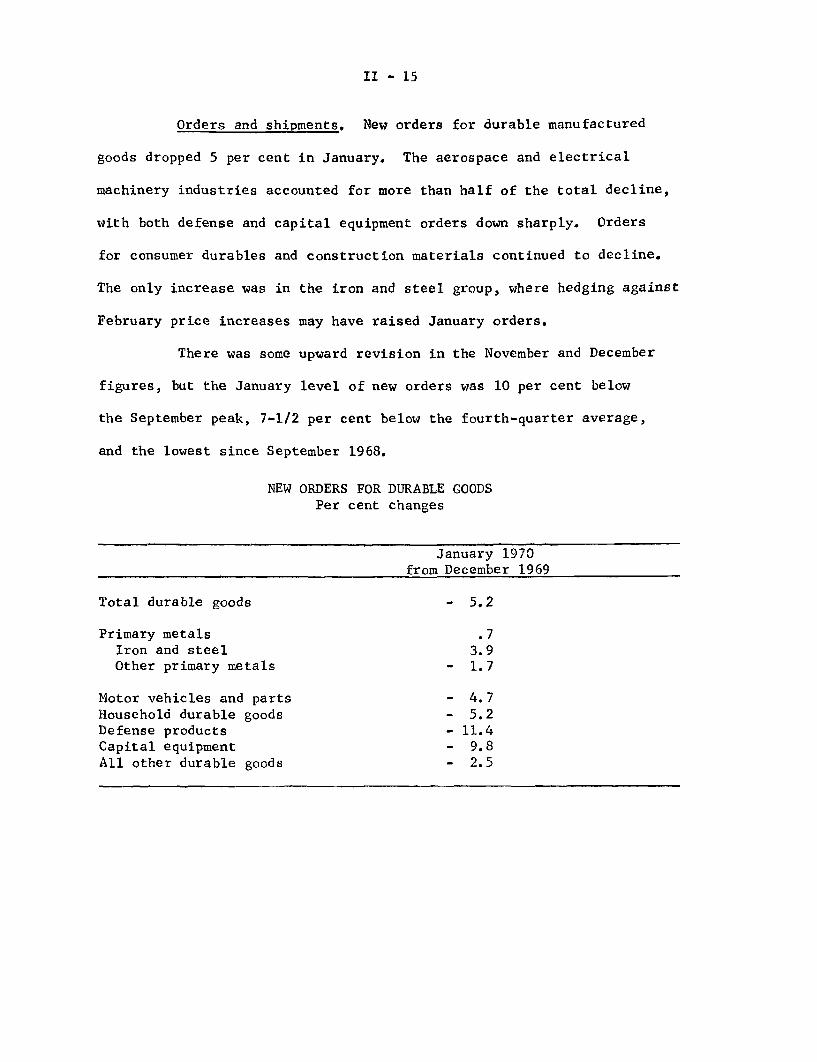
Orders and shipments. New orders for durable manufactured
goods dropped 5 per cent in January. The aerospace and electrical
machinery industries accounted for more than half of the total decline,
with both defense and capital equipment orders down sharply. Orders
for consumer durables and construction materials continued to decline.
The only increase was in the iron and steel group, where hedging against
February price increases may have raised January orders.
There was some upward revision in the November and December
figures, but the January level of new orders was 10 per cent below
the September peak, 7-1/2 per cent below the fourth-quarter average,
and the lowest since September 1968.
NEW ORDERS FOR DURABLE GOODSPer cent changes
January 1970from December 1969
Total durable goods - 5.2
Primary metals .7Iron and steel 3.9Other primary metals - 1.7
Motor vehicles and parts - 4.7Household durable goods - 5.2Defense products - 11.4Capital equipment - 9.8All other durable goods - 2.5
II - 16
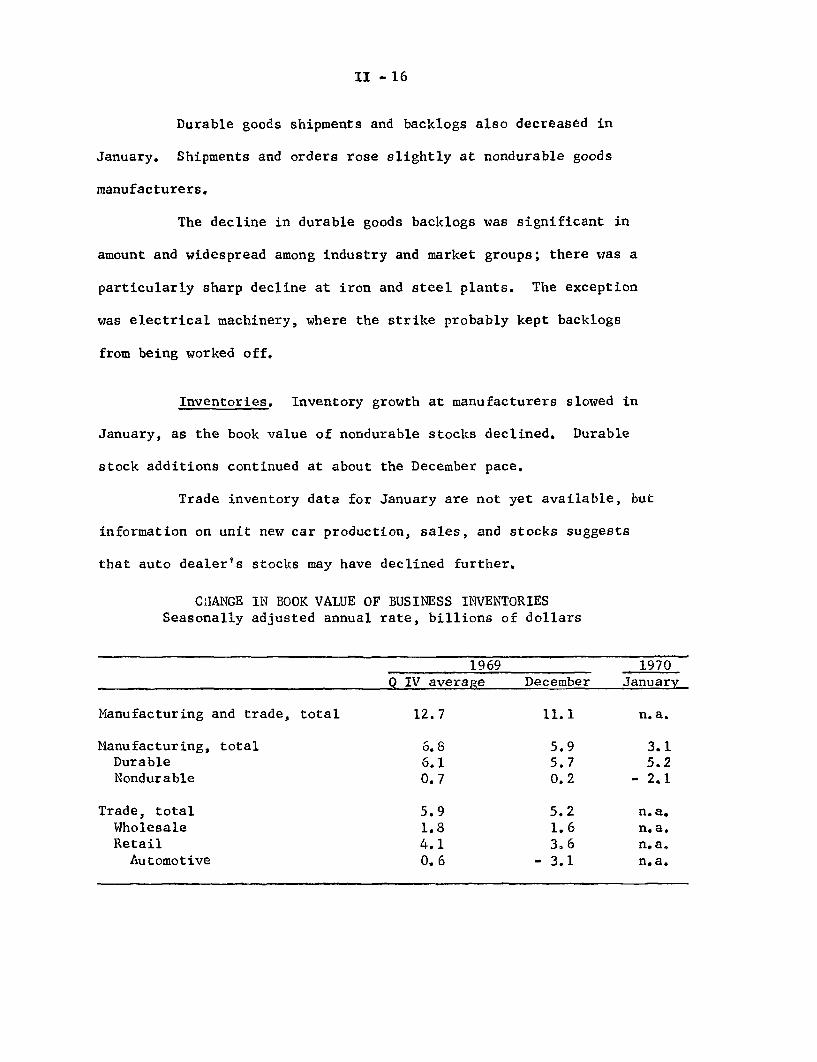
Durable goods shipments and backlogs also decreased in
January. Shipments and orders rose slightly at nondurable goods
manufacturers.
The decline in durable goods backlogs was significant in
amount and widespread among industry and market groups; there was a
particularly sharp decline at iron and steel plants. The exception
was electrical machinery, where the strike probably kept backlogs
from being worked off.
Inventories. Inventory growth at manufacturers slowed in
January, as the book value of nondurable stocks declined. Durable
stock additions continued at about the December pace.
Trade inventory data for January are not yet available, but
information on unit new car production, sales, and stocks suggests
that auto dealer's stocks may have declined further.
CHANGE IN BOOK VALUE OF BUSINESS INVENTORIESSeasonally adjusted annual rate, billions of dollars
Manufacturing and trade, total
Manufacturing, totalDurableNondurable
Trade, totalWholesaleRetailAutomotive
19691969Q IV average December
12.7 11.1
6.8 5.96.1 5.70.7 0.2
5.9 5.21.8 1.64.1 3.60.6 - 3.1
1970January
n.a.
3.15.2
- 2.1
n.a.n.a.n.a.n.a.
-- ~~~- ~- ~

II - 17
Durable goods manufacturing inventory-sales and inventory-
backlog ratios continued to climb in January, and were above the
levels of January 1967, when a substantial slowdown in inventory
accumulation was underway.
INVENTORY RATIOS
1966 1967 1969 1970December January December January
Inventories to sales:Manufacturing and trade, total 1.56 1.57 1.59 n.a.
Manufacturing, total 1.72 1.76 1.73 1.74Durable 2.00 2.06 2.10 2.13Nondurable 1.37 1.40 1.29 1.28
Inventories to unfilled orders,durable manufacturing .639 .653 .733 .749

II - 18
Construction and real estate. Total outlays for new construc-
tion put in place, which were revised somewhat for January, edged off
further in February and, at a seasonally adjusted annual rate of $88.0
billion, were 5 per cent below the peak reached last April. While the
year-to-year decline in current dollars amounted to only 4 per cent, it
came to nearly 10 per cent after allowance for cost increases as measured
by the Census Bureau.
Within the private sector, expenditures for residential
construction, which lag starts, continued to move steadily downward and
in February were nearly a fifth under the high achieved in April of 1969.
Outlays for private nonresidential structures, although still above a
year-earlier, remained moderately below the peak established last
September.
Public construction outlays--already down sharply from their
April 1969 high--changed little in February as expenditures by State
and local governments held at their reduced January rate. Some further
decline in such expenditures is indicated for the period ahead, as
discussed in Appendix B on the results of our recent survey of State
and local borrowing realizations in the fourth quarter of last year.

II -19
NEW CONSTRUCTION PUT IN PLACE(Confidential FRB)
February 1970 Per cent change from
($ billions)!/ January 1970 February 1970
Total 88.0 -1 - 4
Private 60.9 -1 - 3Residential 27.7 -3 -12Nonresidential 33.2 -- + 7
Public 27.1 -- - 8
Federal 3.3 +4 - 5State and local 23.8 -- - 9
1/ Seasonally adjusted annual rates; preliminary. Data for the mostrecent month, February, are confidential Census Bureau extrapola-tions. In no case should public reference be made to them.
Seasonally adjusted private housing starts continued downward
in January to an annual rate of 1.17 million units, the lowest since
April 1967. As in most other recent months, the decline was most pro-
nounced for multifamily units, which--unlike single-family starts--had
been at a near-peak in January of 1969 and had actually achieved a
record total for 1969 as a whole. Regionally, starts in the Northeast
and North Central states--already close to their 1966 lows--turned
upward sharply, although not by enough to offset further reductions in
the South and West.
The magnitude of the January drop in residential building
permits was unprecedented, although the preliminary figures may have
overstated the actual decline. (For December, for example, the rate
initially reported was revised upward by 5 per cent.) These and related
mortgage market indications continue to point to persistence of the

II - 20
decline in starts over the period immediately ahead. Thus, even if
starts held at or near a 1.15 million seasonally adjusted annual rate
in February, the first quarter average seems unlikely to be much over
a 1.1 million unit rate. This would compare with a 1.31 million rate
in the fourth quarter of 1969 and would be the lowest for any quarter
in the past three years.
PRIVATE HOUSING STARTS AND PERMITS
January 1970January 197Per cent change from(Thousands
of units) I/ December 1969 January 1969
Starts 1,166 - 7 -38
1-family 695 - 3 -352-or-more-family 471 -12 -42
Northeast 171 +20 -46North Central 315 +23 -44South 467 -18 -39West 213 -26 -15
Permits 952 -23 -32
1-family 457 -28 -322-or-more-family 495 -19 -32
1/ Seasonally adjusted annual rates; preliminary.
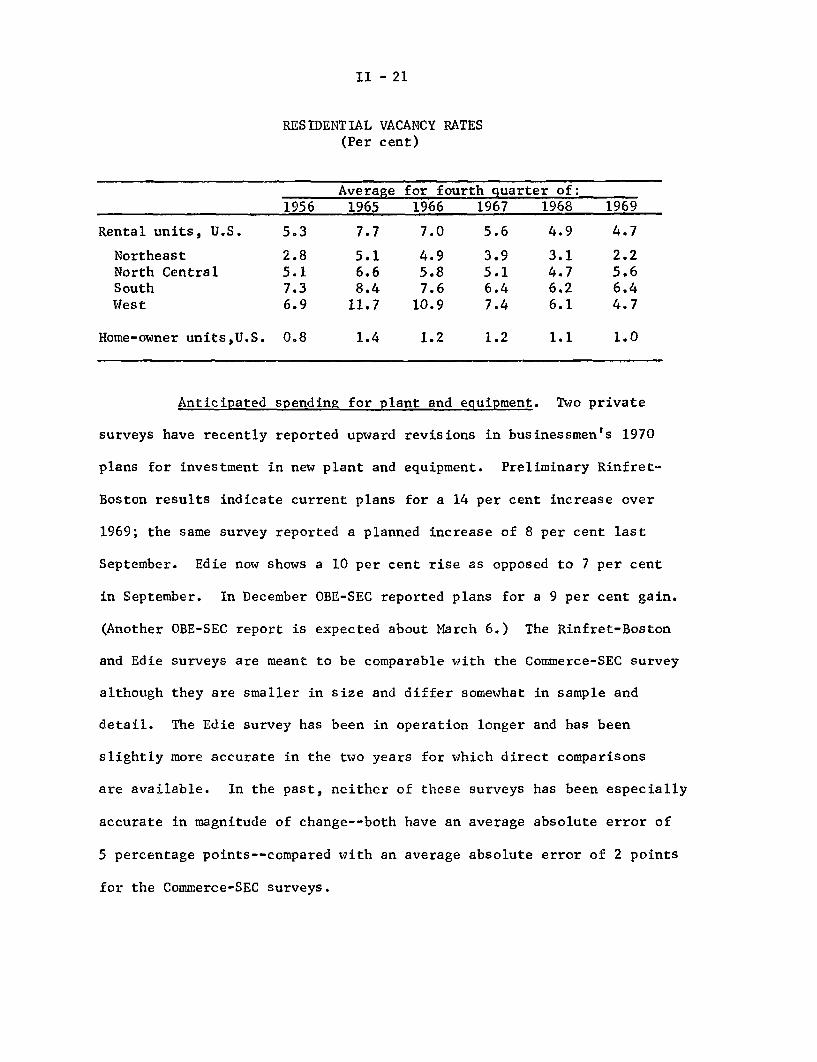
Underscoring the pressure of demands on available residential
space this winter, rental vacancy rates moved downward further during
the fourth quarter of 1969. The national average--at 4.7 per cent--was
the lowest for any quarter in the history of the series, which began in
1956. Vacancy rates for home-owner properties available for sale--a
less sensitive series--also remained exceptionally low by most earlier
standards.
II - 21
RESIDENTIAL VACANCY RATES(Per cent)
Average for fourth quarter of:1956 1965 1966 1967 1968 1969
Rental units, U.S. 5.3 7.7 7.0 5.6 4.9 4.7
Northeast 2.8 5.1 4.9 3.9 3.1 2.2North Central 5.1 6.6 5.8 5.1 4.7 5.6South 7.3 8.4 7.6 6.4 6.2 6.4West 6.9 11.7 10.9 7.4 6.1 4.7
Home-owner units,U.S. 0.8 1.4 1.2 1.2 1.1 1.0
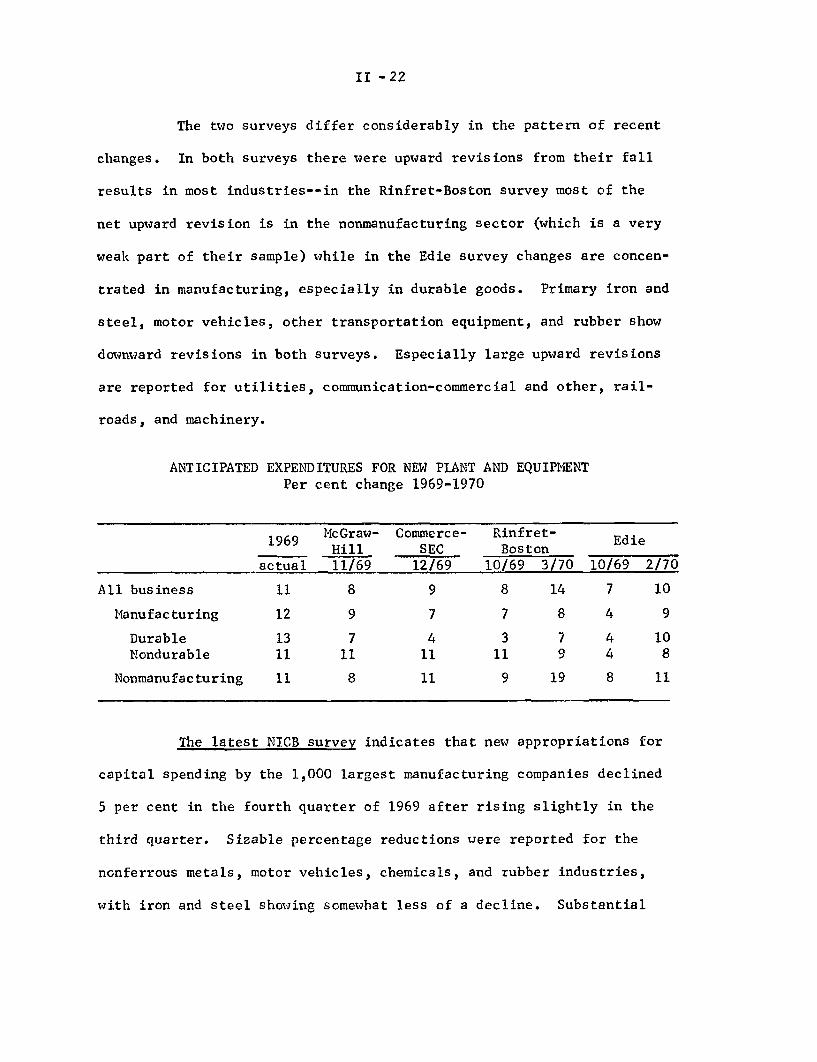
Anticipated spending for plant and equipment. Two private
surveys have recently reported upward revisions in businessmen's 1970
plans for investment in new plant and equipment. Preliminary Rinfret-
Boston results indicate current plans for a 14 per cent increase over
1969; the same survey reported a planned increase of 8 per cent last
September. Edie now shows a 10 per cent rise as opposed to 7 per cent
in September. In December OBE-SEC reported plans for a 9 per cent gain.
(Another OBE-SEC report is expected about March 6.) The Rinfret-Boston
and Edie surveys are meant to be comparable with the Commerce-SEC survey
although they are smaller in size and differ somewhat in sample and
detail. The Edie survey has been in operation longer and has been
slightly more accurate in the two years for which direct comparisons
are available. In the past, neither of these surveys has been especially
accurate in magnitude of change--both have an average absolute error of
5 percentage points--compared with an average absolute error of 2 points
for the Commerce-SEC surveys.
II -22
The two surveys differ considerably in the pattern of recent
changes. In both surveys there were upward revisions from their fall
results in most industries--in the Rinfret-Boston survey most of the
net upward revision is in the nonmanufacturing sector (which is a very
weak part of their sample) while in the Edie survey changes are concen-
trated in manufacturing, especially in durable goods. Primary iron and
steel, motor vehicles, other transportation equipment, and rubber show
downward revisions in both surveys. Especially large upward revisions
are reported for utilities, communication-commercial and other, rail-
roads, and machinery.
ANTICIPATED EXPENDITURES FOR NEW PLANT AND EQUIPMENTPer cent change 1969-1970
9 McGraw- Commerce- Rinfret- E1969 Edie
Hill SEC Boston
actual 11/69 12/69 10/69 3/70 10/69 2/70
All business 11 8 9 8 14 7 10
Manufacturing 12 9 7 7 8 4 9
Durable 13 7 4 3 7 4 10Nondurable 11 11 11 11 9 4 8
Nonmanufacturing 11 8 11 9 19 8 11
The latest NICB survey indicates that new appropriations for
capital spending by the 1,000 largest manufacturing companies declined
5 per cent in the fourth quarter of 1969 after rising slightly in the
third quarter. Sizable percentage reductions were reported for the
nonferrous metals, motor vehicles, chemicals, and rubber industries,
with iron and steel showing somewhat less of a decline. Substantial

II - 23
increases in appropriations by producers of fabricated metals, food and
beverages, and petroleum products helped cushion the over-all decline.
Despite the fourth quarter decline in newly approved appro-
priations, the manufacturing capital spending outlook for 1970 remains
relatively strong. Backlogs of unspent appropriations were at a record
level at the end of the year and were sufficient to maintain recent
rates of expenditures through the summer. A rate of expenditures by
these manufacturing companies throughout 1970 at the 1969 third and
fourth quarter average rate would itself result in outlays 4.7 per cent
above those in 1969, compared with a 12 per cent increase in 1969.
Labor market. State unemployment insurance claims continued
to increase through mid-February and the unemployment rate seems likely
to rise further. The number of workers drawing unemployment pay in
mid-February was 28 per cent above a year earlier, while initial claims
were up 43 per cent over the year. To a large extent, the higher levels
reflect the effects of sharply reduced demand for autos; more indefinite
layoffs have occurred, a number of assembly plants have been temporarily
closed in recent weeks and some supply and service firms have been
forced to reduce production and employment. Layoffs also have increased
in other sectors of manufacturing (largely defense-related activities
such as ordnance and aircraft).
Recent increases in unemployment have occurred mainly among
male blue-collar workers last employed in manufacturing or construction.
Manufacturing separations exceeded hirings by a significant margin in
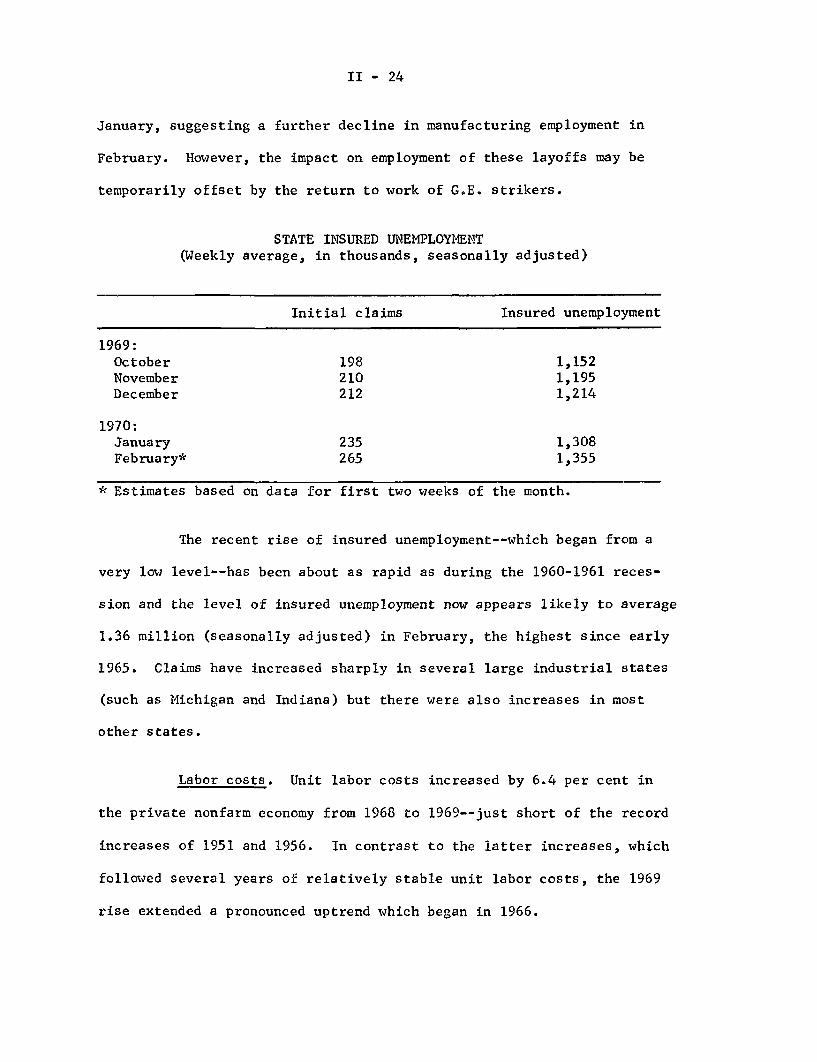
II - 24
January, suggesting a further decline in manufacturing employment in
February. However, the impact on employment of these layoffs may be
temporarily offset by the return to work of G.E. strikers.
STATE INSURED UNEMPLOYMENT(Weekly average, in thousands, seasonally adjusted)
Initial claims Insured unemployment
1969:October 198 1,152November 210 1,195December 212 1,214
1970:January 235 1,308February* 265 1,355
* Estimates based on data for first two weeks of the month.
The recent rise of insured unemployment--which began from a
very low level--has been about as rapid as during the 1960-1961 reces-
sion and the level of insured unemployment now appears likely to average
1.36 million (seasonally adjusted) in February, the highest since early
1965. Claims have increased sharply in several large industrial states
(such as Michigan and Indiana) but there were also increases in most
other states.
Labor costs. Unit labor costs increased by 6.4 per cent in
the private nonfarm economy from 1968 to 1969--just short of the record
increases of 1951 and 1956. In contrast to the latter increases, which
followed several years of relatively stable unit labor costs, the 1969
rise extended a pronounced uptrend which began in 1966.

II - 25
The small increase of output per manhour in 1969, in conjunc-
tion with the large rise in compensation per manhour, gave rise to the
sharp increase in unit labor costs. In the fourth quarter, however,
output per manhour increased, reflecting reductions in average hours
and selective employment cuts. Such employment adjustments continued
in a number of industries in January.
PRIVATE NONFARM ECONOMY(Per cent)
Increase from Increase from priora year earlier quarter (annual rate)1968 1969 IV 1969
Output per manhour 3.3 0.4 1.9
Compensation per manhour 7.4 6.8 7.5
Unit labor costs 3.9 6.4 5.5
The rate of increase of unit labor costs eased slightly in
the fourth quarter and some further improvement in labor costs would
be likely if productivity gains accelerated this year. However, sub-
stantial and sustainable improvement in the labor cost picture would
also require a reduction in the size of wage and benefit increases.
As of now, it appears unlikely that union and nonunion wage demands
will be reduced; in fact, pre-bargaining position statements by Teamster
and United Auto Worker union officials incorporate or imply very large
wage demands. Such large increases are likely to be strongly opposed
by employers who are now faced with weaker product demand, rising costs,
and falling profits.
II - 26
Industrial relations. Westinghouse and 80,000 union members
reached agreement on a 40-month contract patterned after the G.E. pact.
Wages are to be increased 8 per cent the first year (including a 3-cent
immediate cost-of-living adjustment), 4 per cent the second year, and
3 per cent the third year. The average increase in wages and benefits,
including likely cost-of-living adjustments, is estimated at slightly
more than 7 per cent per year--less than the 8 per cent median increase
in major contract settlements in 1969.
Negotiations between 48,000 members of four shopcraft unions
and the railroads were resumed March 2, just as a court issued an
injunction against selective or "whipsaw" strikes by the unions. How-
ever, possibility of a nationwide rail strike remains although the
President has requested new legislation immediately to forestall this
strike.
A three-year agreement reached in January by 80,000 garment
workers with the women's dress industry provided for a 10 per cent
first-year wage increase. Contracts affecting another 90,000 womens'
garment workers expire at the end of May.

II -27
Wholesale prices. The rise in industrial prices slowed in
February, according to early estimates, and the rise in prices of
agricultural products was less rapid than in recent months. The in-
dustrial commodity index rose at an annual rate of about 2 per cent
between mid-January and mid-February, the smallest rise since last
summer when lumber and plywood prices were dropping precipitously.
Moreover, price increases in February were less widespread than in
recent months, and announcements of increases since the February
pricing date have been similar to the February experience.
WHOLESALE PRICES(Percentage changes at annual rates)
Dec. 1968 June Sept. Dec. Jan.
Commodity Group to to to to toJune 1969 Sept. 1969 Dec. 1969 Jan 1970 Feb. 1970
All commodities 6.1 1.5 5.4 8.8 3.1
Industrial commodities 3.6 3.6 4.6 5.4 2.1Farm products, and
processed foods andfeeds 13.0 - 4.0 7.4 18.0 3.0
Note: These percentage changes may differ from those derived from figurespublished by the BLS owing to differences in rounding procedures.
The Federal Reserve sensitive commodity index declined slightly
in February according to preliminary estimates, reflecting stability in
non-ferrous metals--which have been the fastest-moving component in
industrial prices for some time--and a further decline in lumber and
II - 28
plywood prices. BLS sensitive crude material prices have risen about
2 per cent between mid-December and mid-February, but the rise is
largely attributable to one item--iron and steel scrap prices, which
may have reached their peak.
Supplies of most non-ferrous metals are improving. Aluminum
supplies are adequate, while downward pressures on tin, lead, and zinc
prices may be developing. (Planned sales of lead from the government
stockpile have been cancelled, according to reports, owing to an ex-
pected plunge in prices if leaded gasoline is banned).
The steel industry continued in the pricing spotlight in
February as a policy of not raising prices on rolled-steel products
more than once in a twelve-month period was adopted by the industry.
Price increases on about two-thirds of steel industry shipments have
already been announced, and further price increases are considered
likely. Nevertheless, the new policy, along with lower demand for
steel products, seems to promise that steel price increases will be
much less than last year when there were two major rounds of increases
and continuous advances in between.
Despite signs of lessening pressure on metal prices, metals
and metal products were mainly responsible for the rise in industrial
commodities in February as increases were posted for steel mill
products, iron and steel scrap, metal containers, and other metal
products. The rise in prices of machinery, which accelerated in late

II - 29
1969, showed some signs of easing, but this may have been partly seasonal.
Fuels, agricultural chemicals, and paper products also increased while
some textiles, leather and gasoline were lower. Although lumber prices
exhibited contra-seasonal weakness, prices of other major building
materials continued to rise sharply.
Meat prices declined in February, but prices of livestock--
which were 15 per cent above a year earlier in January--rose further.
Production of red meat in January was 4 per cent below last January,
although beef production was up slightly. A decline in prices of
eggs, chickens, vegetables, and sugar helped the food price picture.
Consumer prices. Consumer prices rose at a seasonally adjusted
annual rate of over 7 per cent in January, about the same as in the
preceding 2 months. Much of the January increase derived from an
exceptionally sharp rise in service prices. However, food prices also
continued to rise, and the decline in nonfood commodities was less
than seasonal.
The sharp rise in service prices in January is attributable
largely to transportation, especially the New York City transit fare
increase, and higher automobile registration fees and insurance costs.
The December increase was also very large; for 1969 as a whole there
was a sharp acceleration in this category. Mortgage interest rates
have been rising relatively slowly in the last few months. The rise

II - 30
in permitted interest rates on FHA and VA mortgages is being spread over
several months in the series to allow for take-downs of previous commit-
ments at lower rates. (A reduction in points will not affect the BLS
series since it is assumed they are paid by the seller).
The rise in food prices in January was less sharp than in the
preceding two months. Meat prices rose, seasonally adjusted, as did
eggs, poultry, and milk, but fresh vegetables dropped. Although the
advance in food prices may be moderating, a further rise is indicated
for February by a preliminary run of BLS data.
Among nonfood commodities, new car prices declined less than
seasonally. However, the usual clearance sales in January produced a
seasonal decline in apparel prices, which last year increased almost
without interruption. House prices, a component of durable goods,
climbed fairly sharply.

II - 31
CONSUMER PRICES*(Percentage changes, seasonally adjusted, annual rates)
Dec. 1968 June Sept. Nov. Dec 1969to to to to to
June 1969 Sept. 1969 Dec, 1969 Dec 1969 Jan 1970
All items 6.3 5.0 6.5 7.4 7.3
Durable commodities 1 / 5.5 1.8 5.0 4.2 3.2New cars 2.2 0 4.3 5.8 5,8
Nondurable commodities 5.6 4.2 7.3 9.5 3.8Food 6.3 5.4 10.1 14.9 4.6Apparel 5.4 4.4 5.6 0.9 0
Services 7.5 7.5 6.3 9.0 10.5Medical care 9.5 7.3 1.4 7.0 6.9Rent 3.1 4.0 4.3 5.0 3.0Transportation 8.0 4.8 12.2 21.4 36.4Mortgage interest rates 15.3 9,8 4.1 2.6 2.6
Addendum:Nonfood commodities 5.0 2.4 5.1 5.0 3.0Durable products/ 4.1 1.5 1.8 3.3 3.3Services less
home finance3/ 5.7 5.8 5.3 7.9 10.1
1/ Includes home purchase as well as new and used cars and household durables.2/ Excludes home purchase and used cars.3/ Excludes mortgage interest, property taxes and insurance.* Seasonal adjustment factors have been furnished by the BLS on a confidentialbasis. Services are not adjusted since seasonality is veryslight.
II-C-1
ECONOMIC DEVELOPMENTS - UNITED STATESSEASONALLY ADJUSTED, RATIO SCALE
GNP INCREASE
INDUSTRIAL PRODUCTION - I
TOTALJAN 1699
. CONSUMER GOODSJAN 1601
1968 1970
INDUSTRIAL PRODUCTION- Ir
BUSINESS EQUIPMENTJAN 191 4
1957 59100
1957 5900
DEFENSE EQUIPMENTJAN 1537
SI l l 1970l l1970
Bti$ EMPLOYMENT ESTAB BASIS MILLIONS OF PERSONS
NONAGRICULTURALJAN 707
MANUFACTURINGJAN 200
19
HOURS
WORKWEEK-MFG. - 42JAN 402
-40
1968 1970
UNEMPLOYMENT RATES PER CENTARITHMETIC SCALE
TOTAL 4
JAN 39
INSUREDlJAN 24
1968 1970
3/3/70

ECONOMIC DEVELOPMENTS - UNITED STATESSEASONALLY ADJUSTED, RATIO SCALE
BILS PRICES AND COSTSE
PERSONALJAN 7730 750
DISPOSABLE - 65001Z6450 CONSUMER PRICES*
-550
SPER CENT UNIT LABOR COSTCALE 8 JAN 185
SAVING RATE
6 INDUSTRIAL WHOLESALE*S JAN 1140
I I I I I I 4 * N SA | , , i, |
-1.2
- .8
1968 1970
BUSINESS INVESTMENT
PLANT AND EQUIPMENT OUTLAYSANNUAL RATE
n1170829
MFG. NEW ORDERS
MACIINERY AND EOUIPMENTJAN 64
SI I I I
1957 59100
7
1968 1970
INVENTORIES, NONFARM - CHANGESARITHMETIC SCALEANNUAL RATE
GNPa1 74
PER C
ARITHMETIC SCALE
INVENTORY SALES RATIODEC 159
1970 1968
TOTALJAN 291
GAAFJAN 82
IMPORTSJAN 11
3/3/70II-C-2
1970

III - 1
THE ECONOMIC PICTURE IN DETAIL
Domestic Financial Situation
Bank credit. Commercial bank credit, adjusted to include
loans sold to affiliates, rose substantially in February, following
a small decline in January and little net growth over the second
half of 1969. The February rise in bank credit resulted from a
rapid rate of increase in bank loans that was only partially offset
by moderate liquidation of security holdings.
1/COMMERCIAL BANK CREDIT, INCLUDING LOAN SALES- /
(Seasonally adjusted percentage change, at annual rates)
1969 19701st Half 2nd Half January February-
3/Total loans & investments- 5.1 1.5 - 1.5 6.0
U.S. Gov't. securities -17.2 -16.0 -44.0 -7.2
Other securities 1.4 - 3.6 6.8 0.0
Total loans- / 11.5 6.4 4.7 9.84/
Business loans- 16.1 7.1 12.3 8.9
1/ Last Wednesday of the month series.2/ Preliminary estimates. Loan sales are through February 18.3/ Includes outright sales of loans by banks to their own holding
companies, affiliates, subsidiaries, and foreign branches.4/ Includes outright sales of business loans by banks to their own
holding companies, affiliates, subsidiaries, and foreign branches.

III - 2
The February pick-up in loan expansion reflected in large
part a sizable increase in security loans--in contrast to sharp
reductions in these loans during the prior two months--as dealers built
up inventories of securities, apparently in anticipation of lower
interest rates. Business loans, adjusted to include business loans
sold to affiliates, also registered a substantial increase, although
less than that in January, which followed a quite low December increase.
Other major types of loans continued to expand at close to the moderate
pace of recent months.
The rate of growth in adjusted business loans since year-end
has been greater than during the second half of 1969, but it is still
well below the rapid rate that prevailed in the first half of last
year. Recent increases, although fairly widely distributed geographi-
cally, have been concentrated in a relatively few industry categories,
particularly machinery, transportation equipment, other fabricated
metals, chemicals, and retail trade--in the latter case possibly
reflecting the financing of involuntary inventory accumulation.
Bank portfolio liquidity declined further in February. Banks
continued to reduce their holdings of U.S. Government securities--
mainly Treasury bills--but at a rate sharply below that in January,
when outflows of time and savings deposits were large. Banks kept
their holdings of other securities unchanged, after having acquired
some of these securities, on balance, in the previous few months.
But current bank holdings of such securities are still about $90.

III - 3
million below those at midyear 1969, when sizable bank liquidation
of these securities began.
Monetary aggregates. Daily average deposits of member banks
declined more rapidly in February than in January, reflecting a large
reduction in private demand deposits. Time and savings deposits at
all commercial banks remained unchanged in February, as did U.S.
Government deposits. The additional funds obtained by banks from
nondeposit sources continued to offset only a small part of total deposit
outflows.
MONETARY AGGREGATES(Seasonally adjusted percentage changes, at annual rates)
1969 1970 2/Ist Half 2nd Halt January Feburary-
Member bank deposits -3.5 -4.6 - 4.2 - 8.4
Iember bank deposits plusnondeposit sources n.a. -1.1 - 3.1 - 6.3
Commercial bank time andsavings deposits -4.0 -6.7 -12,4 0.0
Money stock 4.3 .6 9.6 -10.7
1/ Based on monthly average of daily figures for deposits and monthlyaverage of weekly figures for nondeposit funds.
2/ Preliminary estimates.
At all commercial banks, the February decline in private
demand deposits more than offset the increase in January, with the
result that these deposits have remained essentially unchanged, on
balance, since February of last year. Even with continued growth in
currency in the hands of the public, the money stock in February declined
nearly to the level prevailing in November of last year.
III - 4
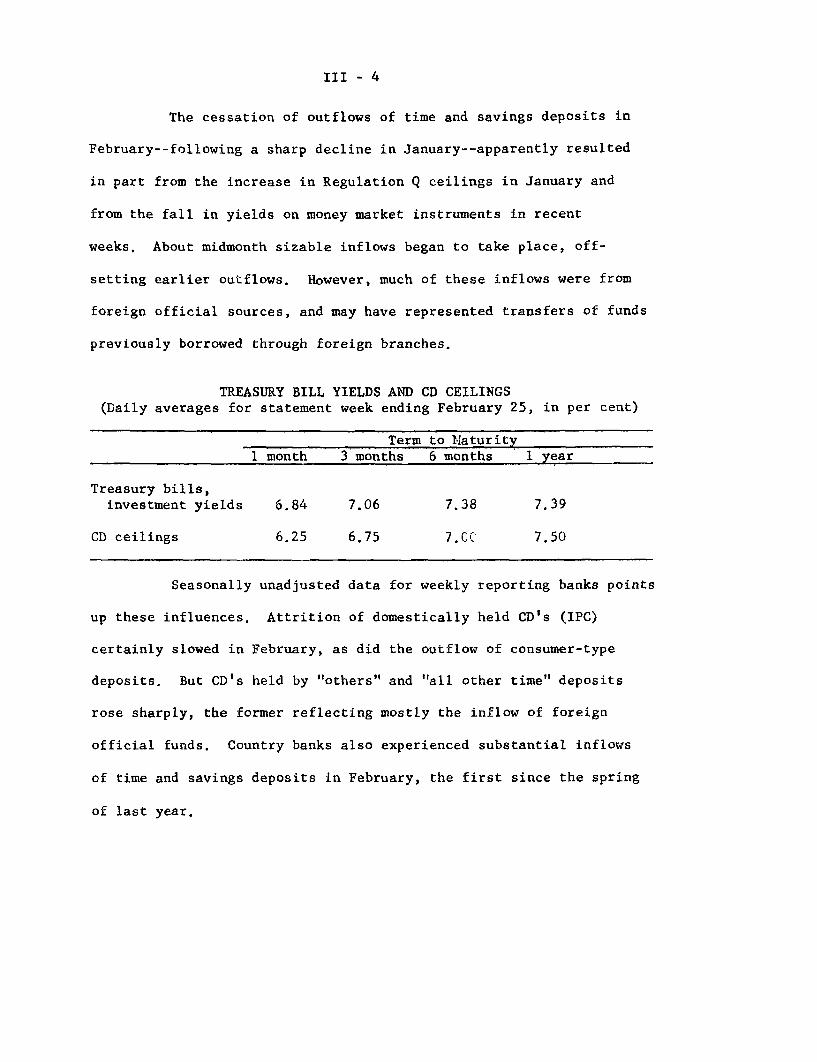
The cessation of outflows of time and savings deposits in
February--following a sharp decline in January--apparently resulted
in part from the increase in Regulation Q ceilings in January and
from the fall in yields on money market instruments in recent
weeks. About midmonth sizable inflows began to take place, off-
setting earlier outflows. However, much of these inflows were from
foreign official sources, and may have represented transfers of funds
previously borrowed through foreign branches.
TREASURY BILL YIELDS AND CD CEILINGS(Daily averages for statement week ending February 25, in per cent)
Term to laturity1 month 3 months 6 months 1 year
Treasury bills,investment yields 6.84 7.06 7.38 7.39
CD ceilings 6.25 6.75 7.CC 7.50
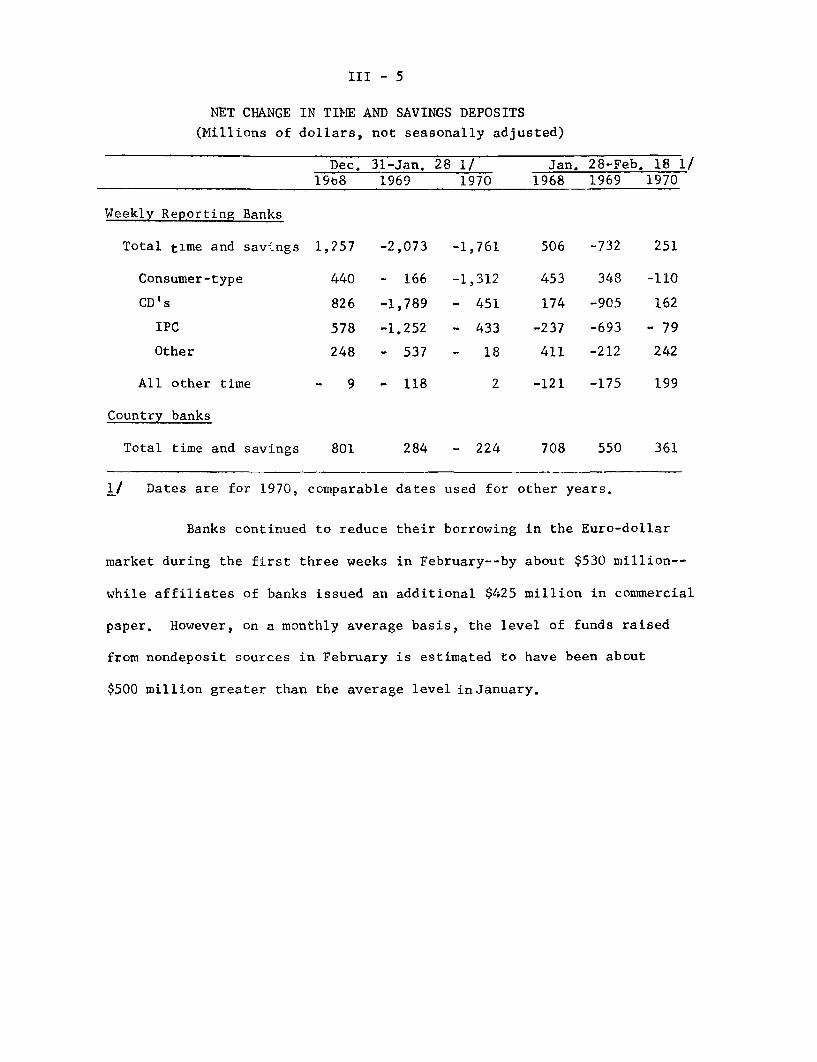
Seasonally unadjusted data for weekly reporting banks points
up these influences. Attrition of domestically held CD's (IPC)
certainly slowed in February, as did the outflow of consumer-type
deposits. But CD's held by "others" and "all other time" deposits
rose sharply, the former reflecting mostly the inflow of foreign
official funds. Country banks also experienced substantial inflows
of time and savings deposits in February, the first since the spring
of last year.
III - 5
NET CHANGE IN TIME AND SAVINGS DEPOSITS
(Millions of dollars, not seasonally adjusted)
Dec. 31-Jan. 28 1/ Jan.19b8 1969 1970 1968
Weekly Reporting Banks
Total time and savings
Consumer-type
CD's
IPC
Other
All other time
Country banks
Total time and savings
1,257
440
826
578
248
- 9
801
-2,073
- 166
-1,789
-1.252
- 537
- 118
284
-1,761
-1,312
- 451
- 433
- 18
2
- 224
506
453
174
-237
411
-121
28-Feb. 18 1/1969 1970
-732
348
-905
-693
-212
-175
251
-110
162
- 79
242
199
708 550 361
1/ Dates are for 1970, comparable dates used for other years.
Banks continued to reduce their borrowing in the Euro-dollar
market during the first three weeks in February--by about $530 million--
while affiliates of banks issued an additional $425 million in commercial
paper. However, on a monthly average basis, the level of funds raised
from nondeposit sources in February is estimated to have been about
$500 million greater than the average level inJanuary.

III - 6
Nonbank depositary intermediaries. Following extraordinarily
large outflows during January, the thrift institutions in early February
had modest, smaller than seasonal, inflows. According to a FHLBB
sample survey for the first ten days of February, savings and loan
associations in most areas other than the West Coast received small
net deposit inflows, and the sensitive New York City mutual savings
banks also showed a minor net gain. For the whole month of January,
more complete data confirm the earlier estimates of massive withdrawals
from both groups of intermediaries.
DEPOSIT GROWTH ATNONBANK THRIFT INSTITUTIONS
(Seasonally adjusted annual rates, in per cent)
Mutual Savings and LoanSavings Banks Associations Both
1969 - Q I 6.1 6.0 6.0Q II 4.3 3.7 3.9Q III 2.0 2.1 2.1Q IV 2.7 0.4 1.2
1969 - November* 4.9 2.4 3.2December* 2.3 0.4 1.0
1970 - January * -1.9 -6.6 -5.0. .. . --. .. .. .. .. . . .... .-- .----.---- - -.. . .. ... ... . .. .. .. . -.. . . .. ... .. . . .. .
hemo: December & January 0.2 -3.1 -2.0
* Monthly patterns may not be significant because of seasonaladjustment problems.
III - 7
Savings and loan associations have continued to reduce their
mortgage commitments, and in the first three weeks of February they
borrowed an additional $150 million from the Federal Home Loan Banks--
in a period when net repayments usually occur. These advances have
become an increasingly less profitable source of funds to borrowing
associations. Interest rates on the nearly $10 billion of FHLB advances
outstanding now range from 7-1/2 per cent to 7-5/8 per cent, compared
with the approximately 8-1/2 per cent nationwide average gross interest
rate on conventional new home mortgage loans. Moreover, the sizable
early March FHLB financing, part of which will replace maturing paper,
will probably serve to increase the costs of these advances since
the interest rates S&Ls must pay on all outstanding advances very with
the FHLB's own average cost of money./
Life Insurance companies. After some abatement during the
fourth quarter of 1969, the net increase in policy loans from life
insurance companies rebounded sharply in January, perhaps in association
with the reported large activity on the part of individuals in recent
corporate bond offerings. If the usual seasonal patterns hold true,
policy loan claims against life insurance funds will be extraordinarly
large during the next few months, as policyholders in the past have
typically used this source of funds for their income tax payments.
1/ The FHLBB is now considering ways to subsidize the cost to associationsof these advances. The yields on its most recent financing onFebruary 11 were 8.45 per cent on a $650 million, 16-month issueand 8.35 per cent on a $350 million, 3-year issue.
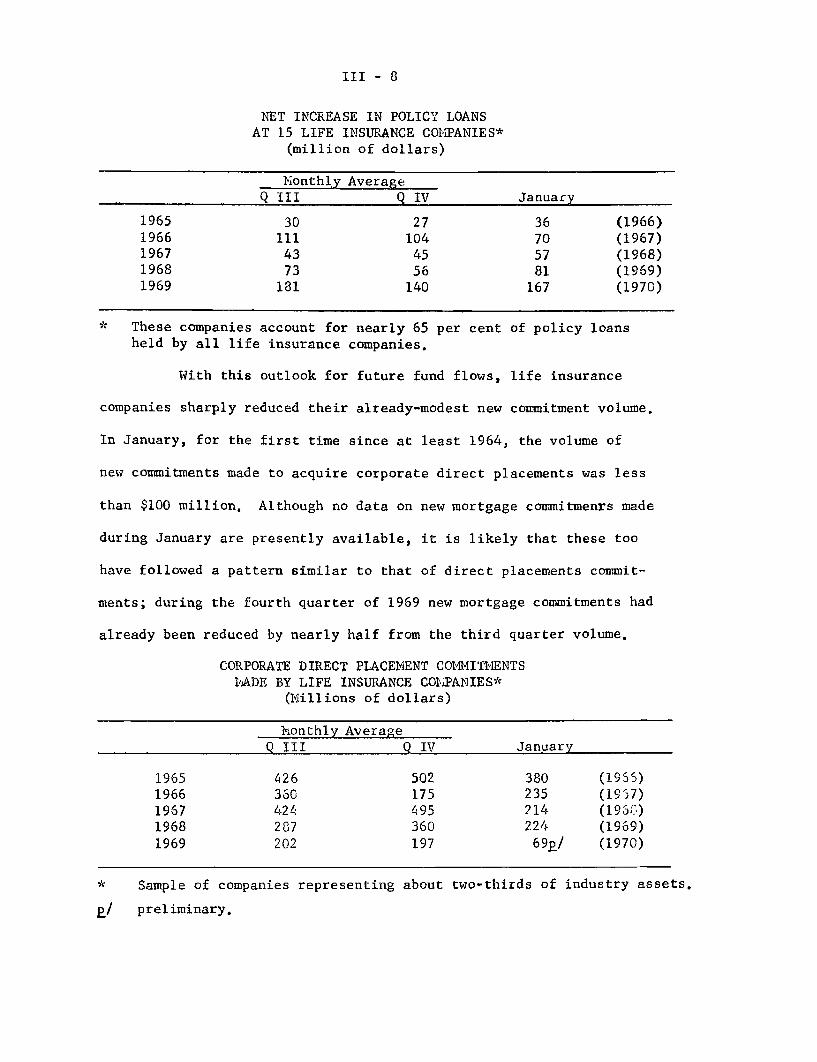
III - 8
NET INCREASE IN POLICY LOANS
AT 15 LIFE INSURANCE COMPANIES*(million of dollars)
Monthly AverageQ III Q IV January
1965 30 27 36 (1966)1966 111 104 70 (1967)1967 43 45 57 (1968)1968 73 56 81 (1969)1969 181 140 167 (1970)
* These companies account for nearly 65 per cent of policy loansheld by all life insurance companies.
With this outlook for future fund flows, life insurance
companies sharply reduced their already-modest new commitment volume.
In January, for the first time since at least 1964, the volume of
new commitments made to acquire corporate direct placements was less
than $100 million. Although no data on new mortgage commitmenrs made
during January are presently available, it is likely that these too
have followed a pattern similar to that of direct placements commit-
ments; during the fourth quarter of 1969 new mortgage commitments had
already been reduced by nearly half from the third quarter volume.
CORPORATE DIRECT PLACEMENT COMMITMENTSMADE BY LIFE INSURANCE COMPANIES*
(Millions of dollars)
honthly AverageQ III Q IV January
1965 426 502 380 (1955)1966 360 175 235 (1957)1967 424 495 214 (1965)1968 287 360 224 (1969)1969 202 197 6 9 p/ (1970)
* Sample of companies representing about two-thirds of industry assets.
p/ preliminary.

III - 9
Mortgage market. Secondary market yields on FHA and VA
home loans in FNMA's auction of its forward purchase commitments
declined very little in February from the record level reached
shortly after the contract rate on these loans was adjusted upward
in early January. With returns on high-grade corporate bonds dropping
sharply, yield spreads favoring investment in Federally underwritten
home mortgages have recently regained much of the ground lost during
the past year. Even so, field reports from FNMA suggest that investor
interest in this type of mortgage has as yet shown only slight
improvement.
FNMA AUCTION
Implicit privateAmount of total offers market yield on
Received Accepted 6-month commitments(Millions of Dollars) (Per cent)
Highs for Weekly Auction
1968 $232(6/3) $ 89(7/1) 7.71(6/10)1969 410(6/16) 152(9/8) 8.87(12/29)
1970
Weekly Auction
January 5 $705 123 9.1912 638 151 9.36
Bi-Weekly Auction
January 26 $581 298 9.29
February 9 497 295 9.2824 438 280 9.25
Note: Average secondary market yield after allowance for commitmentfee and required purchase and holding of FNMA stock, assumingprepayment period of 15 years for 30-year Government-underwrittenmortgages. Yields shown are gross, before deduction of 50 basispoint fee paid by investors to servicers. The first auctiondate was May 6, 1968.

III - 10
In the primary market, the average interest rate on conven-
tional home mortgages rose in January along with yields on FHA and VA
loans. Below-market usury ceilings continued to inhibit an upward
movement in interest rates on conventional mortgages in such areas as
the Middle Atlantic states. In that region, the average slipped further
behind the more competitive levels attained in the West, where higher
usury limits have not yet become an important market restriction.
AVERAGE RATES ON CONVENTIONAL HONE MORTGAGES
Middle West MinusU.S. Atlantic West Middle Atlantic
(Per Cent) (Per cent) (Per cent) (Basis Points)
1969
Low (Jan.) 7.55 7.45 7.85 40High (Dec,) 8.35 7.65 9.05 140
October 8.30 7.65 9.00 135November 0.35 7.65 9.00 135December 8.35 7.65 9.05 140
1970
January 8.55 7.65 9.40 175
Note: FHA series. Interest rates on conventional first mortgages(excluding additional fees and charges) are rounded to thenearest 5 basis points. The FHA Middle Atlantic regionincludes New Jersey, Pennsylvania, Delaware, District ofColumbia, Maryland, and Virginia.

III - 11
While average loan-to-value ratios and average maturities
on conventional home mortgages made in January remained well below
earlier peaks, prices of homes being financed continued quite high,
probably reflecting in part a further rationing-out by lenders of
higher-risk borrowers generally in the market for lower-priced homes.
As a result, the amount of first-mortgage credit extended per
transaction continued unusually large.
Despite continued support in near-record volume from FNMA,
the total net flow of funds into mortgages of all types declined
further in January. Net acquisitions of residential and nonresiden-
tial loans by savings and loan associations reached the lowest
seasonally adjusted rate since the spring of 1967. Further declines
in S&L lending are in prospect, judging from the dwindling backlog
of outstanding S&L mortgage commitments, which reached the lowest
point in more than two years. Commercial banks, now the second
largest private lender in the depressed mortgage market, also
continued to acquire mortgages at a sharply reduced pace.
Corporate securities and municipal bond markets. A basic
shift in expectations, produced by the cumulating evidence of a slowing
economy and by rumors of--and hopes for--an easier monetary policy,
resulted in a spirited rally in both corporate and municipal bond
markets in February. The expected easing in monetary restraint con-
tributed to some improvement in stock prices, too, even though there
were still sustantial market uncertainties about the future of business
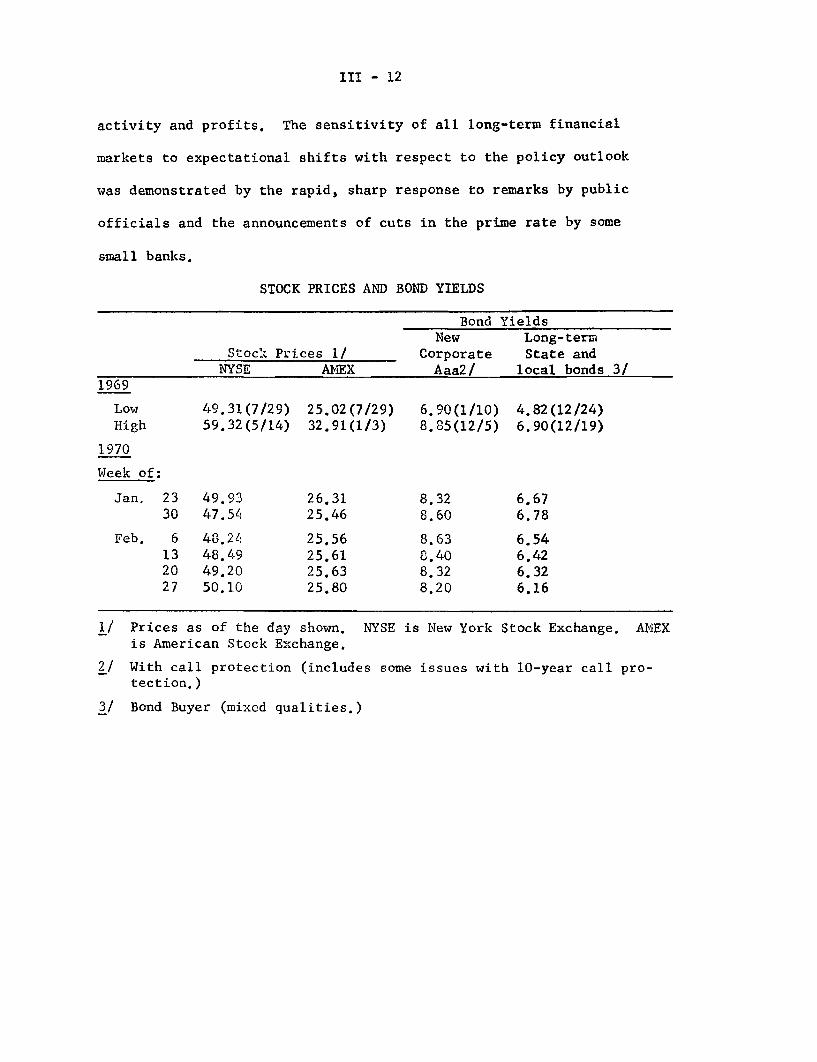
III - 12
activity and profits. The sensitivity of all long-term financial
markets to expectational shifts with respect to the policy outlook
was demonstrated by the rapid, sharp response to remarks by public
officials and the announcements of cuts in the prime rate by some
small banks.
STOCK PRICES AND BOND YIELDS
Bond YieldsNew Long-term
Stock Prices 1/ Corporate State andNYSE AMEX Aaa2/ local bonds 3/
1969
Low 49.31(7/29) 25.02(7/29) 6.90(1/10) 4.82(12/24)High 59.32(5/14) 32.91(1/3) 8.85(12/5) 6.90(12/19)
1970
Week of:
Jan. 23 49.93 26.31 8.32 6.6730 47.54 25.46 8.60 6.78
Feb. 6 48.21 25.56 8.63 6.5413 48.49 25.61 8.40 6.4220 49.20 25.63 8.32 6.3227 50.10 25.80 8.20 6.16
1/ Prices as of the day shown. NYSE is New York Stock Exchange. AMEXis American Stock Exchange.
2/ With call protection (includes some issues with 10-year call pro-tection.)
3/ Bond Buyer (mixed qualities.)

III - 13
In the public corporate bond market, yields declined about
40 basis points during February. Underwriters, encouraged by sustained
demand for new bonds and notes by individual investors, a noticeable
pickup in institutional demand, and their own light inventory
positions, continued to raise prices even as the volume of new offer-
ings picked up substantially in the latter half of the month. This
pricing was generally ahead of the market, with dealers indicating
willingness to absorb inventory in expectation of still higher bond
prices, in spite of the large forthcoming volume.
In the stock market, the general decline in prices since
late 1969 has proved to be expansive to issuers of equities. Esso,
for example, will be able to raise only $387 million in its February-
March rights offerings instead of the $450 to $475 million originally
planned. But, despite the greater cost of equity financing, the
current and projected volume of stock offerings has remained unusually
large as many large corporations make efforts to improve their debt-
to-equity ratios. In addition, the number of small offerings of
stock, while less than in 1969, has remained quite large.
Despite the sustained volume of stock offerings, total
corporate security financing volume declined sharply in February.
Public bond offerings fell to $1.0 billion because of the cancellation
or postponement of about $250 million of convertibles, resulting from
uncertainty in the stock market. In addition, staff estimates of
private placements have been revised downward substantially on the
basis of recently released SEC data. Indeed, the continued evidence

III - 14
of a decline in commitments by life insureance companies suggests
that future takedowns of private placements will remain relatively
low.
CORPORATE SECURITY OFFERINGS-/(Monthly or monthly averagesin millions of dollars)
Public PrivateOfferings Placements Stocks Total
1969 1970 1969 1970 1959 1970 1969 1970
Year 1,060 -- 492 -- 709 -- 2,261
Q I 866 1,417e 513 330e 674 683e 2,073 2,433e
January 980 1,550e 636 300e 460 550e 2,075 2,400eFebruary 342 1,000e 395 300e 807 600e 2,045 1,900eMarch 935 1,700e 509 400e 755 900e 2,098 3,000e
1/ Data are gross proceeds.
e/ Data estimated.
On the other hand, public bond issues in March are expected
to increase sharply. Recent announcements of new offerings have
raised the estimated volume to $1.7 billion, and March offerings could
move even higher--if no congestion develops--because of the continued
build-up in the demand for long-term financing by large industrial
corporations. Looking even further ahead, the forward calendar through
June is building rapidly, with a number of industrial and financial
firms added in recent weeks. Large corporations are also becoming
increasingly evident in the future stock issue calendar and, with
the giant Esso stock issue, the staff estimates that total corporate
financing in March will rise to a record $3.0 billion.

III - 15
Yields on tax-exempts, which had risen sharply in the last
two weeks of January, fell steadily throughout February, event
though the volume of new long-term municipal bonds remained relatively
large. Underwriters report that shorter-term issues have been
supported by bank purchases, particularly by banks outside New York,
as well as by a considerable volume of individual buying. Interest
in the longer maturities has been mainly from dealers, who are said
to be willing holders, a reflection of their optimism about future
monetary ease and declining rates.
STATE AND LOCAL GOVERNMENT OFFERINGS(Monthly or monthly averages
in millions of dollars)
1969 1970
Year 990
Q I 927 1,237eQ II 1,216Q III 821Q IV 994
January 1,262 1,311e
February 987 1,200e
Narch 538 1,200e
e/ Estimated.
Visible supply in the municipal market is still large and
if yields continue to decline, volume may begin to pick up noticeably
1/as previously postponed issues reenter the market.- At this time
the staff estimates that total long-term State and local borrowing
in March will be about $1.2 billion.
1/ Appendix B discusses the volume of postponed tax-exempt issues inthe fourth quarter of 1969, as estimated by the Board's experimentalsurvey of State and local borrowing anticipations and realizations.
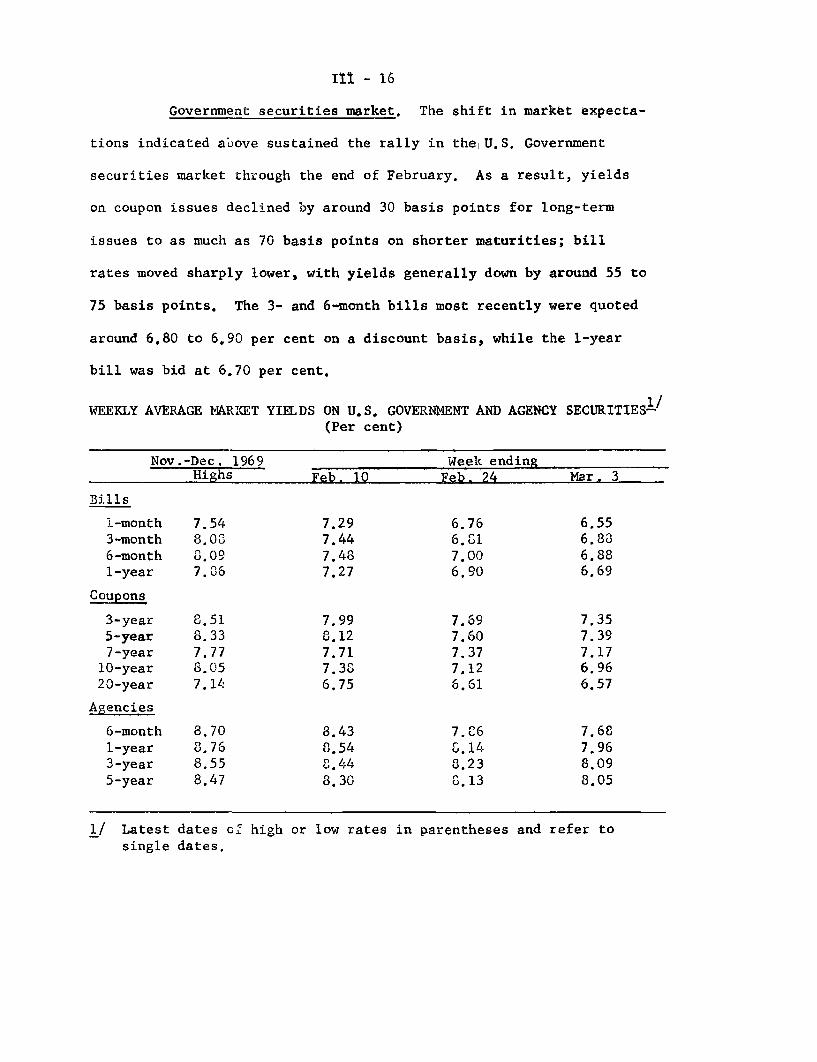
II - 16
Government securities market. The shift in market expecta-
tions indicated above sustained the rally in the U.S. Government
securities market through the end of February. As a result, yields
on coupon issues declined by around 30 basis points for long-term
issues to as much as 70 basis points on shorter maturities; bill
rates moved sharply lower, with yields generally down by around 55 to
75 basis points. The 3- and 6-month bills most recently were quoted
around 6.80 to 6.90 per cent on a discount basis, while the 1-year
bill was bid at 6.70 per cent.
WEEKLY AVERAGE MARKET YIELDS ON U.S. GOVERNMENT AND AGENCY(Per cent)
SECURITIES-/
Nov.-Dec. 1969 Week endingHighs Feb. 10 Feb. 24 Mar, 3
Bills
i-month 7.54 7.29 6.76 6.553-month 8.00 7.44 6.G1 6.886-month 8.09 7.48 7.00 6.881-year 7.86 7.27 6.90 6.69
Coupons
3-year 8.51 7.99 7.69 7.355-year 8.33 8.12 7.60 7.397-year 7.77 7.71 7.37 7.1710-year 8.05 7.38 7.12 6.9620-year 7.14 6.75 6.61 6.57
Agencies
6-month 8.70 8.43 7.c6 7.681-year 8.76 8.54 -.14 7.963-year 8.55 8.44 8.23 8.095-year 8.47 8.30 8.13 8.05
1/ Latest dates of2single dates.
high or low rates in parentheses and refer to

III - 17
The Treasury's February refunding operation was more
successful than expected at the time of its announcement, with an
attrition rate of only 13 per cent on the $5.6 billion of publicly
held maturing issues. Moreover, reflecting the shift in interest
rate expectations, public subscriptions to the 7-year, 8 per cent
note totaled $1.4 billion. As indicated by data on dealers' positions
in coupon issues in the 1-5 year and over-5 year categories, the
professional portion of the market participated actively in the
refunding, taking $905 million of the issues. Since the books
were closed early in February, holdings have shown only moderate declines,
indicating a general willingness to position both these and other
securities, despite a level of dealer loan rates at the banks that
has continued higher than the yields on dealer inventories.
The level of financing costs for dealers has had little
influence on the bill market in recent weeks, in part because the
market has continued to be characterized by considerable shortages
of bills, particularly in the less-than-92-day category. Also, the
reserve supplying operations of the Desk through repurchase agreements
have served to finance a large portion of the dealers' bill positions
at a 6 per cent cost, and the market- has been expecting capital
gains on existing holdings. Recent Treasury additions of $100
million to the weekly 6-month bill auctions and of $200 million to

III - 18
the monthly 12-month bill auction and an offering of $1.75 billion
of April tax bills, however, have relieved the market shortages
of bills in some degree, and in early March bill rates were
backing up somewhat.
The Treasury recently made an administrative decision to
issue Treasury bills in minimum denominations of $10,000 thus elimina-
ting the $1.000 and $5,000 bills. The Federal Home Loan Banks and
FNMA took similar actions. Purchases of Treasury bills in the two
smallest denominations accounted for about 1 to 2 per cent of total
bill sales in recent months, and thus made up only a minor fraction
of the noncompetitive tenders. In January and February, when non-
competitive tenders were very large, an estimated $400 million of
bills was purchases in the smaller than $10,000 denominations.
DEALER POSITIONS IN GOVERNMENT AND AGENCY SECURITIES(In millions of dollars)
February 2 February 9 February 16 March 2
Treasury securities
Total 2.821 2 886 2.575 3,334
Treasury bills (totals) 2,188 1,f89 1,729 2,436
Due in 92 days or less 95 102 18 459
93 days or over 2,093 1,787 1,711 1,976
Treasury notes and bonds 847 98633 997 847 898
(total)-
Due within 1 year 718 84 78 225
1-5 years 4 498 392 313
over 5 years - 88 415 376 361
Agency securities
Total 543 458 547 739
Due within 1 year 298 228 202 312
over 1 year 244 229 345 427

III - 19
Four new Federal Agency issues were offered in February,
raising a total of $1,334 million in new money. This compares with
six offerings by Agencies in January for a total of $1,439 million
in new money. Reflecting improvement in securities markets, the
February issues were priced at successively wider margins below
similar January issues, with the FNNA offering on February 26 priced
around 60 basis points under the late January issue. Yields on
outstanding Agency securities moved lower in line with declines
in the Treasury market.
NEW ISSUE ACTIVITY BYFEDERAL AGENCIES IN FEBRUARY
(In millions of dollars)
Laturity and AniouncsDate Agency Rate less than over 3-5 Of Which
one year 1-3 Years New Money:
Feb. 5 FLB 8.50 300 )8.38 220 )
11 FHLB 8.45 650 )3508.35 350 )
18 FICB 8.10 332 )8.15 203 )
26 FNA 8,12 500 )89.10 300 )
Total 332 2,003 520 1,334

III - 20
Other short-term credit markets. Interest rates on most
private short-term securities have declined considerably from turn-of-
the-year peaks, but the February decline was smaller than that of
January. Offered yields on all maturities of bankers' acceptances are
8.13 per cent, down from a year-end peak of 9.00 per cent. End-of-
February commercial paper yields, at 8.38 per cent on 3-month maturities
and 8.25 per cent on 6-month maturities, are down around a full percentages
point from year-end and 1/8--1/4 of a per cent from the end of January.
The yield on 1-month finance company paper, however, edged up
slightly during February--to 8.38 per cent, and most of the supply of
finance company paper is apparently concentrated in the short maturities.
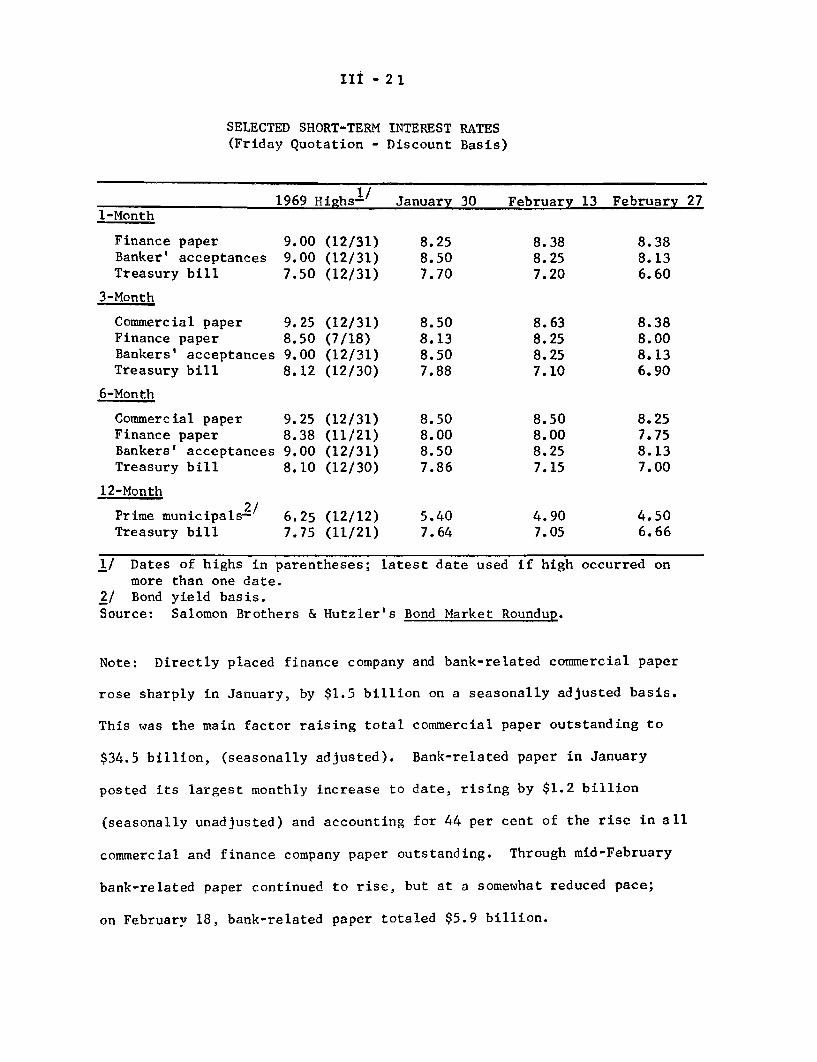
III - 21
SELECTED SHORT-TERM INTEREST RATES(Friday Quotation - Discount Basis)
1969 Highsl- January 30 February 13 February 271-Month
Finance paper 9.00 (12/31) 8.25 8.38 8.38Banker' acceptances 9.00 (12/31) 8.50 8.25 8.13Treasury bill 7.50 (12/31) 7.70 7.20 6.60
3-Month
Commercial paper 9.25 (12/31) 8.50 8.63 8.38Finance paper 8.50 (7/18) 8.13 8.25 8.00Bankers' acceptances 9.00 (12/31) 8.50 8.25 8.13Treasury bill 8.12 (12/30) 7.88 7.10 6.90
6-Month
Commercial paper 9.25 (12/31) 8.50 8.50 8.25Finance paper 8.38 (11/21) 8.00 8.00 7.75Bankers' acceptances 9.00 (12/31) 8.50 8.25 8.13Treasury bill 8.10 (12/30) 7.86 7.15 7.00
12-Month
2/Prime municipals-2 6.25 (12/12) 5.40 4.90 4.50Treasury bill 7.75 (11/21) 7.64 7.05 6.66
1/ Dates of highs in parentheses; latest date used if high occurred onmore than one date.
2/ Bond yield basis.Source: Salomon Brothers & Hutzler's Bond Market Roundup.
Note: Directly placed finance company and bank-related commercial paper
rose sharply in January, by $1.5 billion on a seasonally adjusted basis.
This was the main factor raising total commercial paper outstanding to
$34.5 billion, (seasonally adjusted). Bank-related paper in January
posted its largest monthly increase to date, rising by $1.2 billion
(seasonally unadjusted) and accounting for 44 per cent of the rise in all
commercial and finance company paper outstanding. Through mid-February
bank-related paper continued to rise, but at a somewhat reduced pace;
on February 18, bank-related paper totaled $5.9 billion.
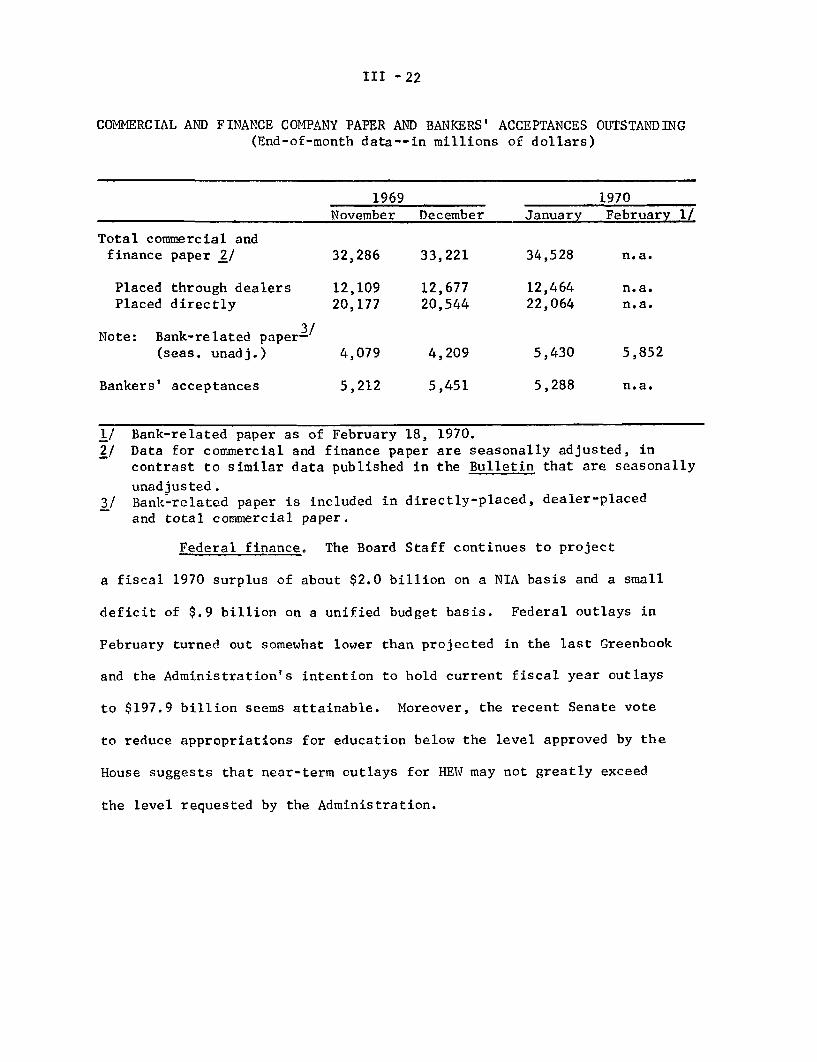
III -22
COMMERCIAL AND FINANCE COMPANY PAPER AND BANKERS' ACCEPTANCES OUTSTANDING(End-of-month data--in millions of dollars)
1969 1970November December January February 1/
Total commercial andfinance paper 2/ 32,286 33,221 34,528 n.a.
Placed through dealers 12,109 12,677 12,464 n.a.Placed directly 20,177 20,544 22,064 n.a.
3/Note: Bank-related paper-(seas. unadj.) 4,079 4,209 5,430 5,852
Bankers' acceptances 5,212 5,451 5,288 n.a.
1/ Bank-related paper as of February 18, 1970.2/ Data for commercial and finance paper are seasonally adjusted, in
contrast to similar data published in the Bulletin that are seasonally
unadjusted.3/ Bank-related paper is included in directly-placed, dealer-placed
and total commercial paper.
Federal finance. The Board Staff continues to project
a fiscal 1970 surplus of about $2.0 billion on a NIA basis and a small
deficit of $.9 billion on a unified budget basis. Federal outlays in
February turned out somewhat lower than projected in the last Greenbook
and the Administration's intention to hold current fiscal year outlays
to $197.9 billion seems attainable. Moreover, the recent Senate vote
to reduce appropriations for education below the level approved by the
House suggests that near-term outlays for HEW may not greatly exceed
the level requested by the Administration.

III - 23
The end-of-February cash balance at the Treasury ($6.6
billion was $1.2 billion higher than projected in the last Greenbook,
partly because of the lower than anticipated outlays in February,
mentioned above. The Board Staff now estimates an end of March cash
balance of $5.7 billion, which includes funds from the Treasury's
recent sale of new April tax bills in the amount of $1.75 billion,
payable on March 3, and also the increase in the size of the regularly
scheduled weekly and monthly bill issues, amounting to $100 million
and $200 million, respectively.
These increments to the regular bill issues are assumed to be
continued beyond the month of March. The Staff now estimates that the
Treasury will need to raise only about $1.5 to $2.0 billion of additional
new money in early April prior to the inflow of April tax receipts.
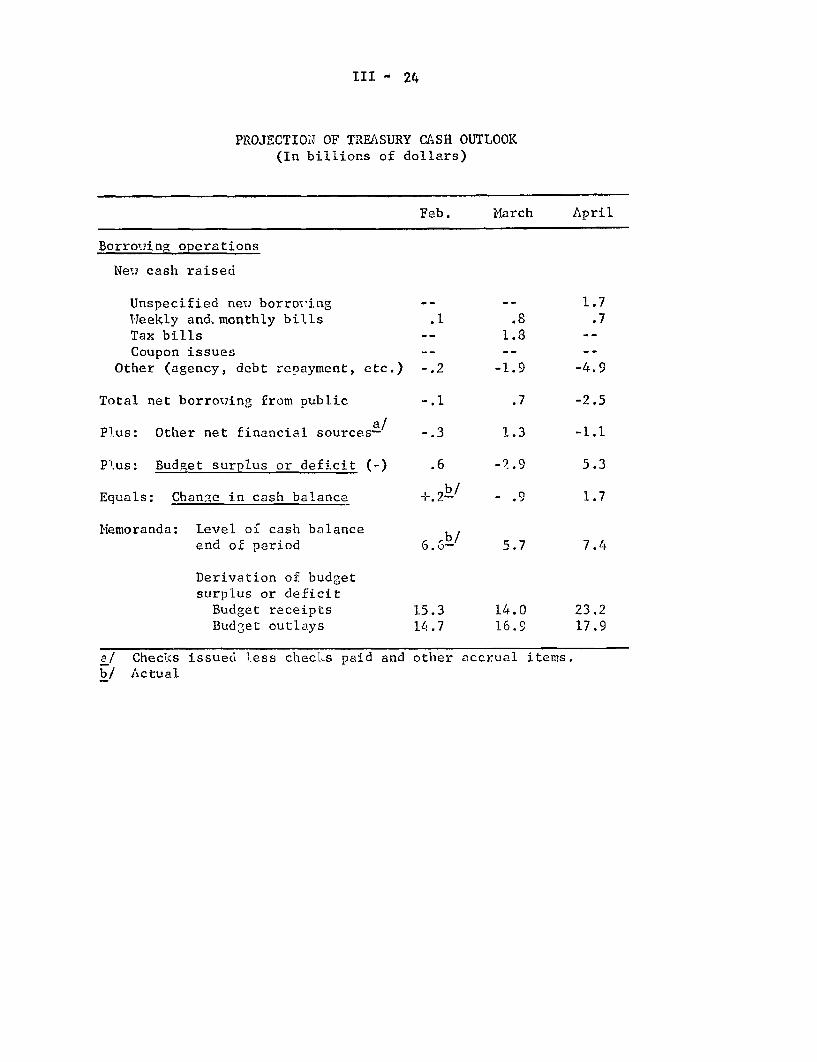
III - 24
PROJECTION OF TREASURY CASH OUTLOOK(In billions of dollars)
Feb. March April
Borroving operations
Nev cash raised
Unspecified neu borrovingWeekly and, monthly billsTax billsCoupon issues
Other (agency, debt repayment, etc.)
Total net borrowing from public
a/Plus: Other net financial sources--
Plus: Budget surplus or deficit (-)
Equals: Change in cash balance
Memoranda: Level of cash balanceend of period
Derivation of budgetsurplus or deficit
Budget receiptsBudget outlays
s/ Checks issued less checks paid andb/ Actual
.1
-. 2
-. 1
-. 3
.6
+.21b/
,b/6.3o-
15.314 .7
other
-- 1.7
.8 .71.8 --
-1.9 -4.9
.7 -2.5
1.3 -1.1
-2.9 5.3
.9 1.7
5.7 7.4
14.0 23.216.9 17.9
accrual items.

FEDERAL BUDGET AND FEDERAL SECTOR IN NATIONAL INCOME ACCOUNTS(In billions of dollars)
Fiscal 1970 e/Jan. F.R.
Budget Board
Fiscal 1971 e/JanuaryBudget
Calendar Years
1969
Calendar Querters1969
1970 1/ 1969IV
1970 1/II III IV
Federal Budget
(Quarterly data, unadjusted)Surplus/deficit
ReceiptsOutlays
Means of financing:Net borrowing from the publicDecrease in cash operating balanceOther 3/
Cash operating balance, end of period
National Income Sector
(Seasonally adjusted annual rote)Surplus/deficitReceiptsExpenditures
1.5199.4197.9
-2.6
n.a.
3.6201.7198.1
-. 9197.0197.9
2/
-1.3.6
2.1200.3198.2
High employment budget surplus/deficit- n.a.
1.3202.1200.8
-1.2
n.a.
1.6205.4203.8
5.3195.6190.3
-4.1- .6- .7
5.3
9.6
201.6192.0
-3.4195.1198.5
-5.742.948.5
-2.445.648.0
9.660.651.0
3.1 5.1 .4 -7.1-. 3 1.3 -. 4 -5.1.6 -.8 2.4 -1.0
5.6 5.3 5.7
-4.4196.8201.1
n.a.
7.0203.7196.7
5.5 10.1
0.0197.4197.4
6.4
-2.347.249.5
-8.341.750.0
1.7 8.1.6 1.0
-. 8
7.2 6.6
-6.5198.7205.2
-6.8
194.2201.0
3.0 4.3
-4.2 "
196.7200.9
8.3
e--Projected.n.a.--Not available.1/ Estimated by Federal Reserve Board Staff.2/ Excludes effect of reclassification of $1.6 billion of CCC certificates of interest from Budget transactions to
borrowing from the public.3/ Includes such items as deposit fund accounts and clearing accounts.
5.6
___ I
_____

III-c-1FINANCIAL DEVELOPMENTS - UNITED STATES
BILLIONS OF DOLLARS, SEASONALLY ADJUSTED, RATIO SCALE
BANK RESERVES
ARITHMETIC SCALENSA
BORROWEDFEB 109
EXCESS FEB 20
1968 1970
CREDIT PROXY
DEPOSITS AND ALLNONDEPOSIT SOURCES
DEPOSITS AND FB 3033
EURO-DOLLARFEB 2958 / \ v
1968 1970
MONEY AND TIME DEPOSITS
TIME DEPOSITSFEB 1921
197Il l l l l1970
BANK CREDIT
*
TOTALJAN 3961
/___________ I Irl r , , ,
-- 190
-400
350
LOANSJAN 2753
BUSINESS LOANSJAN 1041
*
OTHER SECURITIESJAN 709
U.S. GOVT. SECURITIESJAN 499
S NEW SERIES
1968 1970
SAVINGS ACCOUNTS
SAVINGS & LOAN ASSN.JAN 1336
MUTUAL SAVINGS BANKSJAN 674
1968 1970
3/3/70
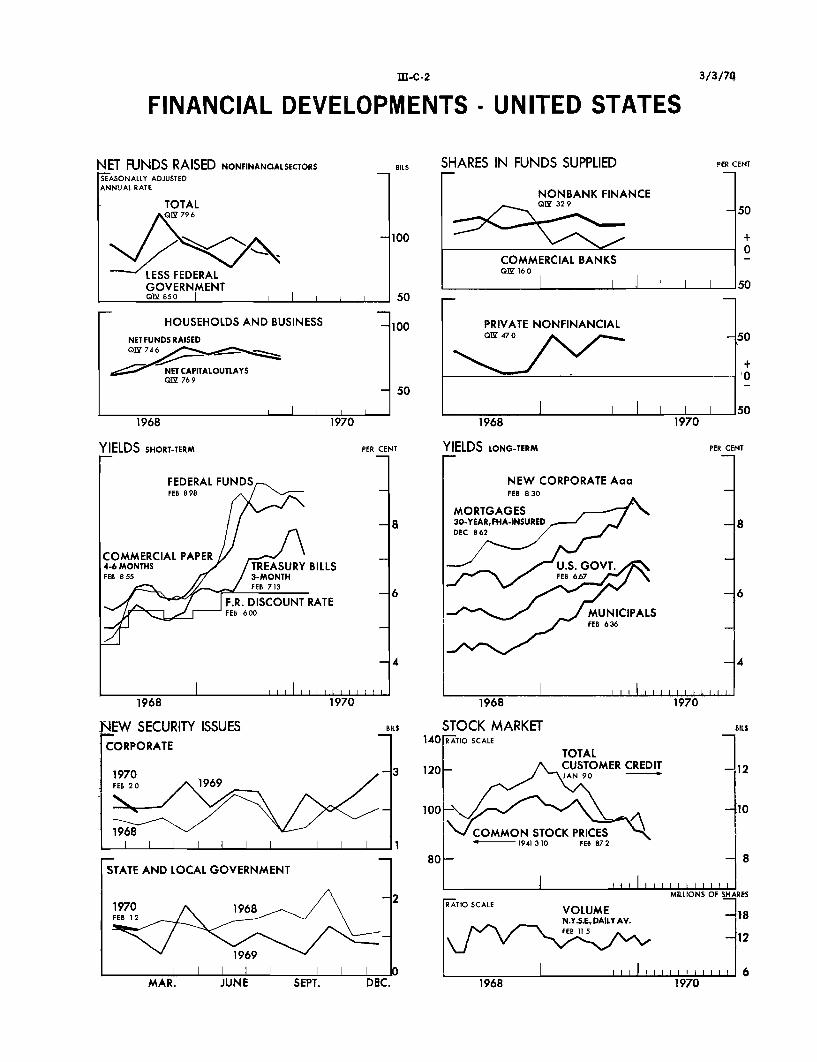
III-C-2FINANCIAL DEVELOPMENTS - UNITED STATES
NET FUNDS RAISED NONFINANCIALSECTORS[EASONALLY ADJUSTEDANNUAL RATE
LESS FEDERALGOVERNMENT01 85 I I I
NEW SECURITY ISSUESCORPORATE
1970FEB 20 1969
1968
STATE AND LOCAL GOVERNMENT
1970 1968FEB 12
1969
|1 | I II 0
SHARES IN FUNDS SUPPLIED PER CENT
NONBANK FINANCEQI 329
0
COMMERCIAL BANKSQI" 16 0
50I I 1 I I 50
PRIVATE NONFINANCIALQ17 470 -50
+'0
I_ 1I 501968 1970
PER CENTYIELDS LONG-TERM
NEW CORPORATE AaaFEB 8 30
I I I I I I I I I I f 8 II 11968 1970
STOCK MARKET140 ATIO SCALE
TOTAL
120- / CUSTOMER CREDITJAN 90
100
COMMON STOCK PRICES1941 3 10 FEB 872
80
SEPT. DEC. 1968
3/3/74
HOUSEHOLDS AND BUSINESS
NET FUNDS RAISEDGIV 746
NET CAPITALOUTLAYSQI9 769
1968 1970
I I
MAR. JUNE 1970

IV - 1
THE ECONOMIC PICTURE IN DETAIL
International Developments
U.S. balance of payments. Such information as is now
available for the balance of payments in the early weeks of the
year is not reassuring, though repercussions from the favorable
inflows at the end of 1969 were probably responsible for a large
part of the recorded deficit.
In January the liquidity deficit, seasonally adjusted,
was $1.5 billion (not including the initial allocation of $867 million
of SDR's). Of this, about $0.5 billion reflected the liquidation of
medium-term U.S. Treasury notes issued to Germany under the military
offset agreement, and there was also a reduction of $125 million in
other officially held nonliquid claims on the U.S. It seems likely
that a large part of the remaining deficit occurred in the first week
of the year as U.S. corporations and others returned to their foreign
affiliates, or to the Euro-dollar market, some of the funds brought to
the U.S. just prior to the end of the year. A favorable element in
the January results was a reduction of $431 million in claims on
foreigners reported by U.S. banks. This was comparable to the inflow
in January 1969, but larger than the seasonal inflow in earlier years.
Transactions in securities with foreigners resulted in a
minor net outflow for the month. U.S. investors bought a modest
amount of foreign bonds, but sold (net) a nearly equal amount of
IV - 2
foreign corporate stocks. Meanwhile, foreign investors were net
purchasers of U.S. bonds, but swung over in January to net selling
of U.S. corporate stocks. This liquidation was the first since last
July. Although the outflow of U.S. funds to purchase foreign
securities was quite low in January -- and in fact has been relatively
small since last September -- this favorable shift was smaller than the
drop in receipts from the inflow of foreign capital to purchase
securities of U.S. corporations.
The trade surplus in January narrowed to an annual rate of
only $500 million. As discussed below, although the data for a single
month can be misleading, the change from the preceding months casts
doubt on the trend toward an improved trade balance that had been
suggested by the earlier data.
For February, the weekly payments indicators through the
25th add up to a sizable liquidity deficit -- about $800 million --
though this includes a guess that there was a large deficit in the
February part of the week ended February 4. There were no major
"special" transactions in the period. If the monthly data confirm
a deficit of that size it would be even higher than last year's
record for the month.
On the official settlements basis there was a January
deficit of $0.5 billion (excluding here also the initial allocation
of SDR's). This deficit will be substantially larger in February, as
liabilities of U.S. banks to private foreigners are drawn down. Part

IV - 3
of this decline represents reduced borrowing by U.S. banks via their
foreign branches -- though the extent of the reduction in the use of
foreign funds is exaggerated by the movement of foreign official hold-
ings out of the Euro-dollar market into CD's at U S. banks. However,
there has also been some reduction in liabilities to private foreigners
other than branches, probably reflecting higher interest rates in some
foreign national money markets.
U.S. foreign trade. In January the export surplus fell
abruptly from the sizable December level as imports expanded sharply
while exports advanced only moderately. / Though too much significance
should not be attached to this change, since month-to-month fluctuations
in foreign trade movements are not unusual, it does cast doubt on the
extent of our underlying trade strength.
An examination of trade movements since mid-1969, after
smoothing out monthly aberrations, indicates that the export surplus
has shown little growth during the period. For the three months ending
January, the export surplus was $1.4 billion at an annual rate (balance
of payments basis), slightly lower than in the preceding three months
of August-October. Both exports and imports have apparently stabilized
since mid-1969. The levelling off of imports was expected as the pace
of domestic economic activity slowed; increases in imports of foodstuffs
have been balanced by declines in other categories of imports. However,
1/ The January trade figures are still very preliminary because of theprovisional seasonal adjustment factors used in that month. Whether thechange that will probably be made in these factors will improve or worsenour January trade surplus cannot be estimated at this time.

IV - 4
there has been an unexpected sluggishness in U.S. exports despite the
dynamic growth in world trade.
Exports in November-January were at an annual rate of $39.1
billion, virtually unchanged from the rate in August-October. Ship-
ments of agricultural products continued to drift downward from the
October peak, mainly the result of a sharp drop in shipments of
tobacco. Exports of nonagricultural commodities were only slightly
greater in November-January than in the preceding three months.
Although there were no deliveries of the new Boeing 747 to foreign
customers through January, sales of other types of commercial planes
were very strong, increasing by nearly 30 per cent between the two
periods. Exports of steel, coal and chemicals expanded further.
However, these advances were just about offset by a decline in
exports of crude industrial materials, miscellaneous manufactured
articles -- largely scientific instruments -- and lower deliveries
of automobiles and parts to Canada. Exports of machinery remained
weak; the expected upturn in exports of these products has not yet
materialized.
The expansion in exports from August-October to November-
January was limited to shipments to the Common Market countries and
to the developing countries of Asia and Africa; exports to all other
areas were lower.
Preliminary data indicate that world trade (excluding ship-
ments to the United States) expanded at a record rate of nearly 15 per
IV - 5
cent from 1968 to 1969. U.S. exports, however, increased at about
9 per cent and our share in world exports fell by nearly one percentage
point, equivalent to about $2 billion at current levels of world trade.
Even more pronounced was the sharp drop in our position in the fourth
quarter when world trade rose very sharply -- by over 10 per cent --
from the third quarter, while U.S. exports (including military commodities)
increased by about 1 per cent. A prime factor in the expansion in world
trade in 1969 was the acceleration in trade among the Common Market
countries. Among other countries, Japan's exports still grew rapidly,
but at a slower rate than in 1963, while the increase in exports of the
United Kingdom was the highest in the 1960's.
Imports in November-January combined were $37.7 billion at
an annual rate (balance of payments basis), marginally higher than the
rate in August-October. An accelerated rise in import prices and a
strong rise in the volume of foodstuffs were important factors in
sustaining the current value of imports at a high level. In the first
three quarters of 1969, the total unit-value indexes of imports had
shown a quarter-to-quarter rise of less than 1 per cent. From the
third to the fourth quarter, the index rose by 3.5 per cent, with the
rise spread across all major commodity categories.
Food was the only major category of imports that increased
in November-January, rising by 12 per cent as both volume and prices
increased. Despite strong price increases, the value of other categories --
machinery, automobiles and other consumer goods, semiprocessed industrial
IV - 6
materials -- all declined. The decreases ranged from about 1/2 of
one per cent for apparel, footwear and miscellaneous manufactured
consumer items to about 6 per cent for machinery (including electrical
appliances).
Foreign exchange markets. Foreign exchange activity during
February centered mostly on sterling and the Italian lira. Demand
for sterling was strong throughout the month. The Italian lira, on
the other hand, continued under substantial selling pressure. Late
in the month stronger demand for the Canadian dollar pushed the
exchange rate to its upper limit and the Bank of Canada purchased
about $150 million in the market. Tight liquidity conditions in
Swiss financial markets caused Swiss banks to repatriate funds from
abroad during most of February; the Swiss franc rate rose to or
close to its upper limit on several occasions and the Swiss National
Bank purchased about $140 million in the market.
Very strong demand for sterling pushed the pound exchange
rate to a new two-year high of $2.408 during February, at the same
time allowing the Bank of England to purchase almost $900 million in
the market -- more than double its January market purchases. At times
heavy bursts of demand for sterling were triggered by special factors
such as the announcement at mid-month of a £39 million trade surplus
for January, the sixth consecutive month of trade surpluses. A
generally growing bullishness over sterling was evident throughout
the month. In early March the announcement of a reserve increase of

IV - 7
$65 million in February triggered further heavy demand for sterling,
and the Bank of England purchased $450 million in the first three
trading days of the month.
The Bank of England made substantial debt repayments during
February. Its monthly reserve release included announcement that it
had repaid $150 million to the IMF and $75 million to the BIS and
associated central banks under the First Sterling Balances Arrangement.
It repaid substantial additional debt, including the final $350 million
outstanding on its swap drawings with the System and $40 million of
guaranteed sterling held by the System and an equal amount held by
the U.S. Treasury -- at the same time financing part of these repayments
by borrowing $250 million on a short-term basis from the BIS. During
the first two months of 1970, the Bank of England made debt repayments
(including repayments to the IMF) totaling $1.6 billion.
The Italian lira continued under heavy selling pressure during
February, when the Bank of Italy lost an estimated $570 million in
exchange market support of the lira rate. (During January it had sold
$400 million in exchange markets.) A massive capital outflow -- being
generated largely by political uncertainties in Italy -- together with
a seasonally adverse current account appear to be the major factors
behind the selling pressure on the lira. Italian authorities took
several measures during the month to moderate the pressure on the lira,
including restrictions on the scope for adverse shifts in leads and lags
on trade payments, and administrative moves designed to tighten sur-
veillance of lira banknote conversions and short-term lending by Italian
commercial banks.

IV - 8
Euro-dollar market. Euro-dollar rates changed little, on
balance, over the past four weeks. A slight easing of rates in mid-
February was followed by some firming during the week ended March 4.
Averagefor weekending
Jednesday
Jan. 23Feb. 4
111C25
Mar. 4
SELECTED EURO-DOLLAR AND U.S. MONEY MARKET RATES(weekly average of daily figures)
(1) (2) (3) (4) (5)Call =(1)-(2) 3-month 3-month
Euro-$ Federal Differ- Euro-$ TreasuryDeposit Funds ential Deposit Bill
3.62 9.04 -0.42 9.52 7.899.06 9.21 -0.15 9.49 7.779.07 9.13 -0.11 9.47 7.369.03 9.39 -0.36 9.31 6.039.22 8.41 0.81 9.27 6.849.30 C.34P 0.96P 9.36 6.84P
(6)=(4)-(5)Differ-ential
1.631.722.112.482.432. 5 2P
Liabilities to foreign branches of U.S. banks declined by
$466 million in the four weeks ended February 25, but a substantial
part of the decline apparently represented a shift of foreign official
funds from foreign branches to CD's at the head offices of U.S. banks,
with little net effect on conditions in the Euro-dollar market.
While U.S. banks were decreasing their demands on the Euro-
dollar market, German banks were increasing their's. Partial data
indicate that German banks decreased their net foreign asset position
by $330 million in the first three weeks of February, virtually all
of which was accounted for by an increase in foreign liabilities.
On the supply side, very large intervention gains by the
Bank of England during February probably reflected some shifting of
--

IV - 9
funds out of the Euro-dollar market into sterling. The effects of
British reserve gains on the supply of funds to the Euro-dollar market
may have been largely offset, however, by large Italian reserve losses,
part of which probably augmented the supply of Euro-dollar funds.

IV - 10
Monetary policy in major industrial nations. During 1969
monetary policy was progressively tightened in all major industrial nations.
Some countries may find it necessary to tighten their restraint further
if demand pressures remain strong.
Inflationary pressures were the paramount reason for monetary
tightening in Germany, Canada, Japan, Belgium, the Netherlands and
Switzerland. In France the external deficit was also a factor, and in
the United Kingdom the need to restore external balance has been the
prime reason for applying monetary brakes. The large Italian capital
outflow in 1969 induced a shift in policy toward moderate restraint in
the final months of last year. Until the mark revaluation, German
monetary policy was mainly aimed at offsetting large current account
surpluses with capital outflows and at reversing short-term inflows.
In France, Belgium, and some Scandinavian countries very high Euro-dollar
rates may have led monetary authorities--in order to protect reserves--
to allow domestic interest rates to rise to a level higher than demand
management considerations warranted.
In Germany, Italy and Japan, a significant degree of monetary
restraint was not reached until late 1969 or even early this year, and
the effectiveness of restraint cannot yet be ascertained. In both the
United Kingdom and France, the marked tightening of monetary policy late
in 1968 contributed to improvement in the external balance.

IV - 11
Interest rate levels in the United States are an important
influence on interest rates in the Euro-dollar market and in financial
markets within other industrial nations. But demand pressures in all
of these nations and concern over reserve levels in some of them strongly
imply that an easing of monetary policy in this country would not be
followed promptly by similar action abroad.
In Germany, monetary policy became progressively more restrictive
during the first three quarters of 1969, but the impact on domestic
liquidity was slight, mainly because of speculative capital inflows before
the revaluation of the German mark in October. Following the lead of
other major central banks, the Bundesbank raised its discount rate from
3 to 6 per cent in three steps between April and September. Reserve
requirements of the commercial banks were increased by about 20 per cent
during the same period. On several occasions last year, the central bank
expressed concern over the growing signs of economic overheating, but
found it difficult to achieve significant monetary tightening. It
was considered desirable to offset the continued large surplus on goods
and services--$2.6 billion for January through September--with long-term
capital outflows. Such flows were facilitated by keeping German interest
rates lower than rates elsewhere. This did not, however, prevent the
inflow of speculative funds.

IV - 12
SELECTED GERMAN MONETARY INDICATORS
--------------------- 1 9 6 9 - - -* 9 71 9 6 9 1 9 7 0
Q-1 Q- 2 Q-3 Sept. Oct. Nov. Dec. Jan. Feb.
3-month interbankloan rate-a 4.0 4.7 6.4 7.0 7.4 7.7 8.8 9.5 9.5
Banks' "free liquidreserves" as per centof total deposits / 11 13 12 12 11 8 7./ 6 n.a.
a/ Average of weekly averages.b/ End of period. "Free liquid reserves" includes excess reserves, short-
term money market paper, advances against securities and unused rediscount
quotas.c/ FRB staff estimate.
The revaluation of the mark was followed by massive capital
outflows through December which put sharp pressure on bank liquidity, and
led to a dramatic rise in German interest rates, as shown in the table.
To keep the rise in German interest rates from being too abrupt, the
Bundesbank lowered reserve requirements by 10 per cent in November and by
an additional 10 per cent only for the month of December.
In early December the Bundesbank raised its "Lombard" rate for
short-term advances against commercial paper from 7.5 to 9.0 per cent.
This was done to discourage banks from borrowing against commercial paper
in order to lend in the Euro-dollar market as well as to encourage the
banks to draw on their foreign assets to meet domestic lending requirements.
The Bundesbank discount rate was not raised, but expansion of rediscounts
was limited by the existing quotas for each bank,
IV - 13
Short-term interest rates in Germany are now at post-war highs
and covered interest differentials--which moved substantially in favor of
Euro-dollars late in 1969--are now virtually eliminated as the forward
premium on the mark narrowed sharply. In these circumstances, the net
foreign position of German banks has swung from a net creditor to a net
debtor vis-à-vis non-residents. But the squeeze on liquidity continues,
as the January seasonal easing in the money markets did not materialize,
and the termination of the seasonal reduction in reserve requirements for
December added pressure.
While some observers fear that too much fiscal and monetary
tightening may result in a recession--as it did in 1966-67--there is a
wide measure of agreement that the boom is still strong and that recent
price increases have been excessive. Consumer prices in January were
3.5 per cent higher than a year earlier. The excess demand on the labor
market--vacancies in December were 670 thousand--and the degree of
utilization of capacity are the highest on record. There is strong
sentiment in the Bundesbank for further monetary tightening on domestic
grounds.
In France both fiscal and monetary policies became very
expansionary after the May 1968 disturbances. But the huge basic balance
of payments deficit--$2.4 billion in the second hald of 1968--forced a
reversal of these policies during and after the November 1968 crisis.

IV - 14
SELECTED FRENCH MONETARY INDICATORS
1967 1 S 6 8 1 9 6 9
Q-4 Q-1 Q-2 Q-3 Q-4 Q-1 Q-2 9-3 Q-4
Annual rates of change (percent) from preceding period:
Money supply (Ml), s.a. + 1 - 1 +16 +13 + 6 + 5 0 + 4 + 2*Domestic credit, n.s.a. +20 - 6 +35 +19 +17 + 6 +19 + 6 + 4*
Call money rate 4.6 469 5.5 6.2 8.2 8.7 8.9 9.2 9,8
* October and November only.
In the spring of 1969 the political crisis that culminated in
the de Gaulle resignation foreclosed the intensification of fiscal restraint.
The rapidly overheating French economy had to be contained by monetary
restraint only. Bank credit expansion slowed and money supply, which
had been expanding at an annual rate of 10 per cent in the second half
of 1968, rose by only 3 per cent (at an annual rate) in the first half
of 1969. The tightening was reinforced in June by restrictions on install-
ment purchases and by an increase from 6 to 7 per cent in the discount rate.
The large current account deficit and the continuing overheating
of the economy, both reflecting in part lack of confidence in the franc
on the part of Frenchmen, led to the decision on August 8 to devalue the
franc by 11.1 per cent. In early September a series of restraint measures
was announced including the elimination of the budget deficit for 1970.
Monetary measures included an extension of the very restrictive short-term
credit expansion ceiling until June 1970, the placing of moderately
restrictive ceilings on medium- and long-term credit expansion, and a
IV - 15
drastic tightening of installment purchase terms. In October 1969 the
Bank of France again raised its discount rate--to the historically high
level of 8 per cent.
Monetary and fiscal restraints are beginning to show results in
France. Consumer demand is slackening, (the savings ratio moved markedly
up during the autumn) and--following the revaluation of the German mark--
confidence in the stability of the franc appears to be returning. The
improvement in the external balance has been substantial--the trade
account, seasonally adjusted for the period November 1969 through
January 1970, was virtually in balance. Since devaluation French official
reserves have increased by nearly $1.5 billion, chiefly because of a
shift in leads and lags back toward normal.
The expansionary impact of reserve gains on French monetary
conditions has not been offset thus far by the authorities and has
resulted in a slight easing of the squeeze on liquidity. However, the
economy is still operating very close to capacity--unfilled vacancies,
equal to about one-half of one per cent of the French labor force, remained
unchanged from November through January. The improvement in the trade
balance is precarious, and prices continue to increase in excess of the
official target of 4 per cent for 1970. Hence we can expect continued
monetary restraint in France, at least through the first half of 1970.
In Britain, monetary policy was tightened from November 1968
through mid-1969 in support of the government's over-all restraint program.
The principal monetary moves included a directive in November 1968 to the
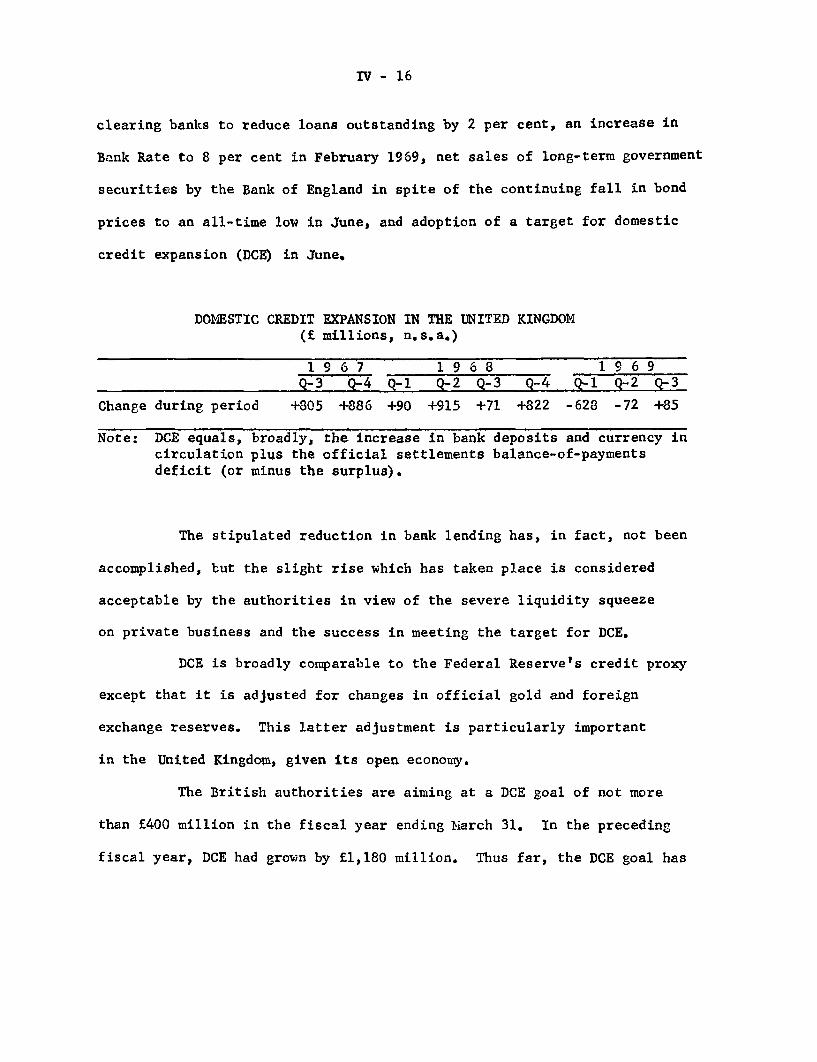
IV - 16
clearing banks to reduce loans outstanding by 2 per cent, an increase in
Bank Rate to 8 per cent in February 1969, net sales of long-term government
securities by the Bank of England in spite of the continuing fall in bond
prices to an all-time low in June, and adoption of a target for domestic
credit expansion (DCE) in June.
DONESTIC CREDIT EXPANSION IN THE UNITED KINGDOM(£ millions, n.s.a.)
1 9 6 7 19 68 1 9 6 9
Q-3 Q-4 Q-1 Q-2 q-3 Q-4 Q-1 Q-2 Q-3
Change during period +805 +886 +90 +915 +71 +822 -628 -72 +85
Note: DCE equals, broadly, the increase in bank deposits and currency incirculation plus the official settlements balance-of-paymentsdeficit (or minus the surplus).
The stipulated reduction in bank lending has, in fact, not been
accomplished, but the slight rise which has taken place is considered
acceptable by the authorities in view of the severe liquidity squeeze
on private business and the success in meeting the target for DCE.
DCE is broadly comparable to the Federal Reserve's credit proxy
except that it is adjusted for changes in official gold and foreign
exchange reserves. This latter adjustment is particularly important
in the United Kingdom, given its open economy.
The British authorities are aiming at a DCE goal of not more
than £400 million in the fiscal year ending March 31. In the preceding
fiscal year, DCE had grown by £1,180 million. Thus far, the DCE goal has

IV - 17
been met with a wide margin to spare. The public sector surplus, limited
credit expansion to the private sector, and the balance of payments
surplus all combined to restrict DCE expansion in the period April 1 to
September 30--latest available information--to only £13 million.
British reserves have registered substantial gains since early
last autumn and the Bank of England has offset only a part of these gains
by government bond sales, thus permitting some easing of the liquidity
squeeze which reaches a seasonal peak during the first-quarter tax
collection period.
Although the GNP growth rate in the fourth quarter of 1969
appears to have been negligible, growth during 1970 is expected to
accelerate to about a 3 per cent annual rate. Weekly wage rates rose
by 5.5 per cent from the fourth quarter of 1960 to the fourth quarter
of 1969 and the rate of increase will certainly be even faster this year,
providing considerable stimulus to aggregate demand. The expected strong
export performance will also contribute to the strength of demand.
It is not likely that monetary policy will be significantly
eased soon. Bank Rate may be lowered from its present level of 8 per cent--
chiefly to encourage investment--but, as long as credit expansion is
regulated mainly by administratively imposed ceilings, such a move would
not represent a major step away from tight money.
During the past 10 months, monetary policy in Italy has undergone
a substantial modification because of the changing outlook for both the
balance of payments and the domestic economy. Interest rates have advanced
IV - 13
considerably in response to moves by the Bank of Italy, the attraction
of high yields in external markets, and--more recently--probably some
expectations of further moves to tighten credit.
In the spring and summer of 1969, Bank of Italy actions resulted
in a rise of 1-1/4 percentage point in the commercial banks' prime lending
rate, and the legal maximum rate on interbank deposits rose from 3-2/3
to 5 per cent. In addition, the Bank allowed the composite yield on all
bonds other than Treasury bonds to rise from about 6.5 per cent in May
to 7-1/4 per cent in December, and further increases have been recorded
in recent weeks. In January and February, two large borrowings by public
sector lending agencies were sold to yield 7.9 per cent. A previous
offering by one of them in June 1969 yielded only 6.6 per cent. In
recent days the interbank loan rate, pegged to the Treasury bill rate,
advanced further to 6.5 per cent.
The Bank of Italy began to slow down the expansion of the
monetary base in the last quarter of 1969. The progressively stronger
application of monetary brakes has reflected growing concern over the
balance of payments, which registered a $1.4 billion deficit last year
because of rapidly rising net outflows of private capital. In addition,
the rise in aggregate demand is currently excessive because very large
wage increases were granted late last year after a wave of strikes. This
year, wage rates in the metal, engineering, chemical and construction
industries will be about 17 per cent higher than in 1969 (inclusive of
projected automatic cost-of-living increases). For the economy as a whole,
IV - 19
wage increases this year will be somewhat less than this, but unit labor
costs will increase sharply. Treasury Minister Colombo has publicly
projected that the GNP deflator will increase from an estimated 3.4 per
cent in 1969 to 6 per cent or more in 1970.
Capital outflows will probably decline in 1970 because of higher
Italian interest rates and increased borrowing abroad by public sector
entities, but the decline may be entirely offset by an expected deterioration
in what has been a persistently large current account surplus. Given these
prospects for the domestic economy and the balance of payments, it appears
likely that monetary restraint will not be eased in coming months.
The Swiss authorities became concerned with growing signs of
economic overheating that appeared during the summer of 1969. Accordingly,
at the end of July the Swiss National Bank obtained an agreement from the
commercial banks to limit their loan expansion during the year ending
July 31, 1970 to an average of about 10 per cent. The action was reinforced
by a rise in the discount rate of 3/4 of a percentage point in mid-
September.
The revaluation of the German mark has strong inflationary
implications for Switzerland and the Swiss National Bank has felt it
necessary to further limit bank loan expansion. A new agreement,
recently negotiated, restricts credit expansion during the period
February through July to 85 per cent of the original target. This move
has been backed by anti-inflationary fiscal measures.

IV - 20
Yields on government bonds rose by a full percentage point
during 1969. The call money rate has risen sharply since mid-January,
indicating increasingly tight credit conditions.
In Belgium, monetary policy, characterized by very flexible
use of discount rate changes, became progressively more restrictive
during 1969. Credit expansion was limited by administratively imposed
ceilings last May in an effort to prevent overheating of the economy and
to minimize losses of international reserves that might occur because of
higher interest rates outside Belgium.
These policies were very effective insofar as the external
balance is concerned, and Belgium recorded a large balance of payments
surplus last year. However, demand pressures intensified during 1969
and Belgian officials expect them to remain excessively strong this year.
The latest projections show no slowing of domestic demand in 1970 and--as
in 1969--a rise in the GNP deflator of about 4 per cent. This outlook
suggests a continuation of the present degree of monetary restraint at
least for the next several months.
Inflationary pressures in the Netherlands intensified during 1969.
Consumer prices, in part because of the introduction of value-added taxes
last year, rose so rapidly in the first quarter that the authorities
imposed a price freeze in April and did not lift it until mid-September.
Monetary policy became progressively more restrictive and the
Netherlands Bank increased its discount rate from 5-1/2 to 6 per cent in
August. Short-term credit expansion was placed under ceilings by agreement

IV - 21
between the central bank and commercial banks. Long-term credit expansion
is to be limited to the extent that any increase in assets is to be
balanced by an increase in long-term liabilities.
Inflationary pressures in the Dutch economy remain strong and
the present restrictive monetary stance is likely to be continued.
In Japan, monetary policy moved toward restraint last September,
the first time in the post-war period such a move has been made with the
balance of payments in surplus.
The Bank of Japan raised its discount rate from 5.84 to 6.25 per
cent and increased reserve requirements for demand deposits of large city
banks from 1.0 to 1.5 per cent. At the same time, reserve requirements
for other financial institutions were raised. The Bank of Japan also
moderately tightened its "position guidance" policy, under which, in
monthly conferences with large commercial banks, central bank lending
quotas for each bank are adjusted so as to restrain aggregate commercial
bank credit expansion. The Bank is hoping to restrict year-over-year
bank credit expansion in the first quarter of this year to 5 per cent--a
fairly severe restraint.
A further indication of monetary tightening was the announcement
on February 4 that in March-April interest rates on new issues of public
and corporate bonds would be increased by about 1/2 percentage point,
rates on long-term bank loans by 30 basis points, and rates on one-year
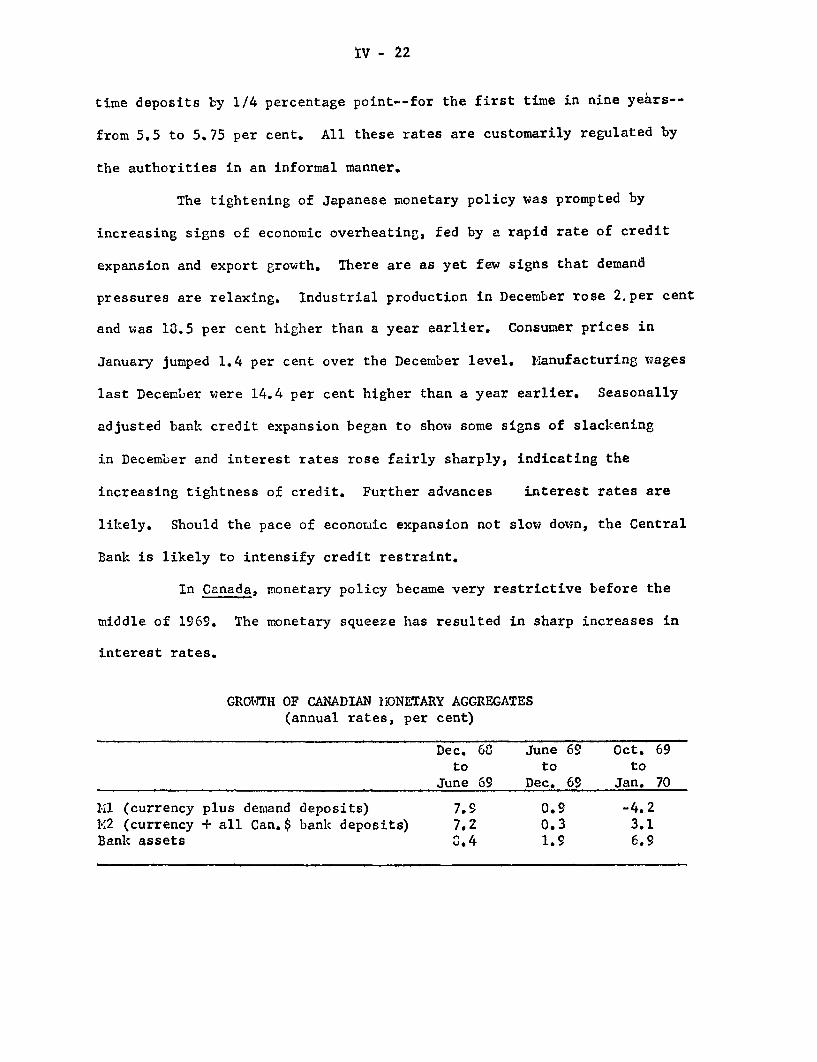
IV - 22
time deposits by 1/4 percentage point--for the first time in nine years--
from 5.5 to 5.75 per cent. All these rates are customarily regulated by
the authorities in an informal manner.
The tightening of Japanese monetary policy was prompted by
increasing signs of economic overheating, fed by a rapid rate of credit
expansion and export growth. There are as yet few signs that demand
pressures are relaxing. Industrial production in December rose 2.per cent
and was 13.5 per cent higher than a year earlier. Consumer prices in
January jumped 1.4 per cent over the December level. Manufacturing wages
last December were 14.4 per cent higher than a year earlier. Seasonally
adjusted bank credit expansion began to show some signs of slackening
in December and interest rates rose fairly sharply, indicating the
increasing tightness of credit. Further advances interest rates are
likely. Should the pace of economic expansion not slow down, the Central
Bank is likely to intensify credit restraint.
In Canada, monetary policy became very restrictive before the
middle of 1969. The monetary squeeze has resulted in sharp increases in
interest rates.
GROWTH OF CANADIAN ONETARY AGGREGATES(annual rates, per cent)
Dec. 68 June 69 Oct. 69to to to
June 69 Dec. 69 Jan. 70
il (currency plus demand deposits) 7.9 0.9 -4.2I2 (currency + all Can.$ bank deposits) 7.2 0.3 3.1Bank assets 8.4 1.9 6.9

IV - 23
A number of large-scale labor disputes in the second and third
quarters of 1969 distorted the Canadian GNP statistics and made it
difficult to judge the effects of monetary restraint on aggregate demand.
Real GNP is estimated to have grown at an annual rate of only 1.1 per cent
in the second half of 1969, as compared with 5.8 per cent in the first half.
However, consumer prices at the end of the year were still rising at
about a 5 per cent annual rate.
The pull of higher interest rates in the U.S. and Euro-dollar
markets undoubtedly had some effect on Canadian interest rate levels.
Canadian banks increased their net external asset position in foreign
currencies by nearly $500 million during 1969. The dominant concern
of the monetary authorities continues to be domestic inflation, and there
is less concern over a possible recession than may be the case in the
United States. In these circumstances, if monetary conditions in the
United States ease, Canadian interest rates will follow U.S. interest
rates only partially and with some lag.
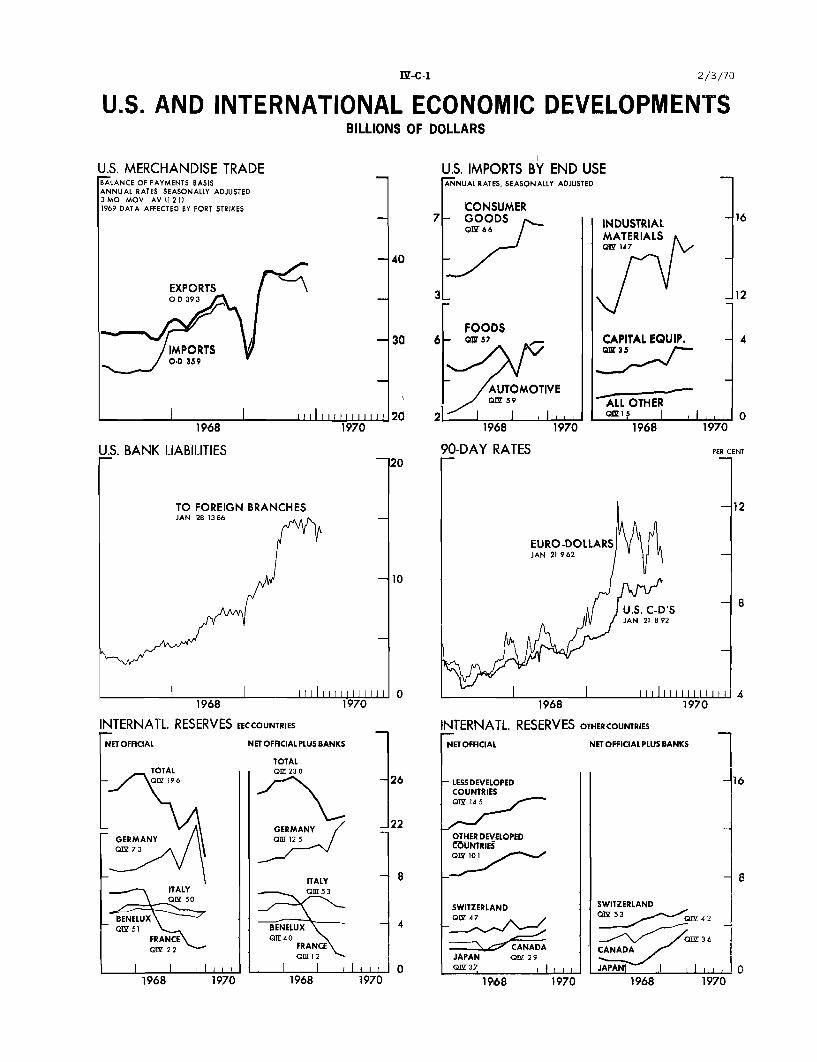
U.S. AND INTERNATIONAL ECONOMIC DEVELOPMENTSBILLIONS OF DOLLARS
U.S. MERCHANDISE TRADEBALANCE OF PAYMENTS BASISANNUAL RATES SEASONALLY ADJUSTED3 MO MOV AV(1 21)1969 DATA AFFECTED BY PORT STRIKES
- 40
EXPORTSOD393 f
\
II ii l l| |1ii i i i I 2 01968 1970
5. BANK LIABILITIES
U.S. IMPORTS BY END USEANNUAL RATES, SEASONALLY ADJUSTED
CONSUMER- GOODS
QI966
FOODS6- Qws 5
AUTOMOTIVEQI7 5 9
21 1 11968 1970
90-DAY RATES
1968 1970 1968 1970
INTERNATL. RESERVES EECCOUNTRIES INTERNATL. RESERVES OTHERCOUNTRIES
ET OFFICIAL NET OFFICIALPLUS BANKS FETOFFICIAL NETOFFICIAL PLUS BANKS
TOTALOIV 196
GERMANYQI 73
ITALYgI50
BENELUXOW 51
FRANCEOI 22
1 I i96 11968 1970
TOTALOQ 23 0
GERMANYO 12 5 /
-26
22
1ITALY
1 5O53
BENELUX
FRANCEQI 12
I 8 I I 1 I1968 1970
- LESS DEVELOPEDCOUNTRIESo 14 5
OTHER DEVELOPEDCOUNTRIESQzo 11
SWITZERLAND
A CANADAJAPAN Q 29
1 37 I I 1 i I
1968 1970
SWITZERLAND0W52 0W42
CO 36CANADA
JAPANI I1968 1970
I-C-1 2/3/70
APPENDIX A: MORTGAGE-BACKED SECURITIES GUARANTEED BY THE GOVERNMENTNATIONAL MORTGAGE ASSOCIATION*
As part of the Housing Act of 1968, in which the GovernmentNational Mortgage Association was spun off from the old Federal NationalMortgage Association, GNMA was authorized to guarantee the payment ofprincipal and interest on securities sold by approved issuers and backedby pools of Government-underwritten mortgages. The final regulationsfor the pass-through security program were established in mid-Novemberand following approval by the Treasury, preliminary regulations for asecond-type of GNMA security, a mortgage-backed bond, will soon bereleased.
Since the introduction of the pass-through arrangement inNovember, GNMA has received only $26.9 million in applications to formmortgage pools. The first sale of a pass-through -- a private place-ment -- did not occur until mid-February. In view of the limited demandfor the pass-through and some undesirable features which are discussedbelow, the staff feels that the pass-through arrangement will continueto be relatively unattractive to the investment community. However, thebond-type security should have substantially more investor appeal.
The mortgage-backed securities are designed to enable mortgagesto compete more effectively with alternative capital market instrumentsin general and particularly to encourage pension funds -- and other non-mortgage investors -- to shift a part of their resources into the mort-gage market. Although pass-through securities can take one of threeforms, all applications received by GNMA have been for the "fully modified"version, in which holders receive specified installments of principaland a fixed rate of interest on the outstanding principal balance, whetherthese are collected or not. In all three types of pass-through, prepay-ments of principal are passed on as they are collected. GNMA guaranteesthe timely payment of principal and interest in accordance with the termsset forth in the security instrument.
The favorable characteristics of this type of security, fromthe standpoint of the investor, centers on its reduction of the problemof servicing a mortgage. By participating in the pool, the investor is
freed from the time and effort involved in servicing individual loans inhis own mortgage portfolio. Some of the additional work associated with
* Prepared by Fred Taylor, Economist, Capital Markets Section, Divisionof Research and Statistics.
the investment in individual mortgages, such as property inspectionand processing of foreclosures, is also eliminatedl. Furthermore, theGIA guarantee assures the security holder that the mortgages involvedwill be properly serviced and that if any mortgage is found to be defective,the issuer will make the adjustments to the pool which GNMA requires.
Despite these favorable characteristics, there are a number ofother features that may limit the effectiveness and appeal of the currentprogram. One of the basic objectives of the guarantee program was toprovide an instrument, backed by a pool of Government-underwritten mort-
gages, that included many of the characteristics appealing to bond investors.In a number of ways, the pass-through fails to accomplish this. In thefirst place, in the pass-through, as in the case of any mortgage, the
principal is repaid monthly as long as the mortgages remain outstanding,unlike most bonds which are repaid at maturity. Secondly, lacking callprotection, the investor has no guarantee that his expected yield willbe forthcoming for at least a minimum period of time. Prepayments arestill possible under the pass-through arrangement and these could present
problems for investors in terms of anticipating flows and in schedulingfuture investments. The problems associated with prepayments could becomeparticularly acute in periods of declining interest rates. Finally, it
is possible that the pass-through may be truly competitive,on a yieldbasis, only during periods when rates are generally falling. Thispossibility reflects the fact that mortgage interest rates normally
move in lagged response to other long-term rates and historically havebeen less sensitive than other capital market rates. This could beovercome to an extent, however, if the issuer sells the security at adiscount.
To date only one GNMA-backed security issue, for $2.0 million,has actually been sold. The securities were sold to three state pension
funds, all of which normally hold part of their assets directly inGovernment-underwritten mortgages. Judging from an informal interviewwith the investor, the purchase of the pass-throughs were only a sub-stitute for direct mortgage investment.
In addition to the pass-through security, GNMA is expected to announe,within the next few weeks, proposed regulations governing a bond-type mort-
gage-backed security. The staff expects that bond issues will have tobe in a minimum size of $200 million -- a limit designed to restrict the
use of this instrument to FNMA and the FHL Banks.because of the risksassumed by G A. As currently envisioned, the mortgage-backed bond will
have a fixed maturity and feature some call protection. In addition, the
bond may be offered publicly at a competitive rate. By eliminating the

A-3
practice of passing on prepayments as collected, the bond-type securityshould solve some of the difficulties associated with the pass-through.In order to compensate for the prepayments that do occur, however,the issuer may have to overcollateralize considerably.
Although the regulations covering the GNMA guaranteed bondmay not appear in final form for at least 30 days, the staff expectsinvestors to exhibit considerably more interest in the bond than in thepass-through arrangement.
APPENDIX B: SURVEY OF STATE AND LOCAL GOVERNMENT BORROWING REALIZATIONSFOURTH QUARTER, 1969*
The experimental survey of State and local government borrow-ing realizations for the fourth quarter of 1969 suggests that highinterest rates induced at least a $2.25 billion shortfall in long-termborrowing. Such shortfalls are equivalent to 80 per cent of the $2.75billion in State and local long-term borrowing actually accomplishedlast quarter.1/ As a consequence of these shortfalls capital outlaycutbacks are estimated to range between $1.1 and $1.3 billion, or about15 per cent of the estimated fourth quarter total of $8 billion ofState and local capital expenditures. Essentially all these delaysand abandonments of capital construction occurred in areas with someform of legal rate ceilings. Analysis of borrowing expectations ofunits in the sample indicates that State and local governments wouldlike to be borrowing at approximately a $20 billion gross annual rateduring the first half of 1970, as compared to less than $12 billion inall of 1969.
Borrowing Shortfalls
Table 1 displays a breakdown by type of governmental unit ofthe long-term borrowing accomplished and of the shortfalls induced byhigh interest rates. Only those shortfalls attributable to highborrowing costs are discussed below. Approximately $1.4 billion inadditional shortfalls stemmed from other factors, some of which mayhave been partly related to the level of interest rates. Thus, theestimates for interest rate effects on borrowing--and on spending--maybe understated.
1/ Long-term bond sales for the fourth quarter of 1969 amounted to$2.90 billion, while the estimates for total borrowing,based on thesurvey sample, are $2.75 billion. Evidently the blown-up survey resultsreported herein captured only 95.1 per cent of the borrowing actuallyaccomplished. No attempt has yet been made to correct for this dis-crepancy. Of the 625 units included in the quarterly survey, all but4 responded, for a response rate of 99.5 per cent.
* Prepared by John E. Petersen, Economist, Capital Markets Section,currently on leave to the Urban Institute.

B-2
Table 1
LONG-TERM BORROWING AND SHORTFALLSINDUCED BY HIGH INTEREST RATES
4th Quarter 1969, Millions of Dollars
(1) Actual (2) Shortfalls induced (2)/(1)Type of unit Borrowing by high interest rates- Ratio
2/
State- $1,235 $ 572 .46
County 122 209 1.71
City & town 739 475 .64
Special District 147 203 1.38
School District 510 785 1.54
Total $2,754 $2,242 .81
1/ Includes postponements, abandonments and reductions in issues.2/ Includes State authorities and colleges.
High interest rates in the fourth quarter of 1969 displaced$2.25 billion in desired long-term borrowing, 30 per cent greaterthan the displacements for similar reasons in the third quarter of 1969.
2/ The total amount of the long-term borrowing shortage where highinterest rates were at least a contributing factor was $2.5 billion.When multiple reasons for bond postponements or reductions were given,the amount of the shortfall was distributed proportionately among them.The same procedure was used in allocating spending impacts among reasons.
The $2.25 billion figure for bond postponements in the fourth quartercontrasts sharply with the $600 million increase in cumulative displace-ments as reported by the Bond Buyer. The latter source carries a strongdownward bias because it counts only those issue that have advertisedfor bid and counts issues only as of the date they were originallypostponed.
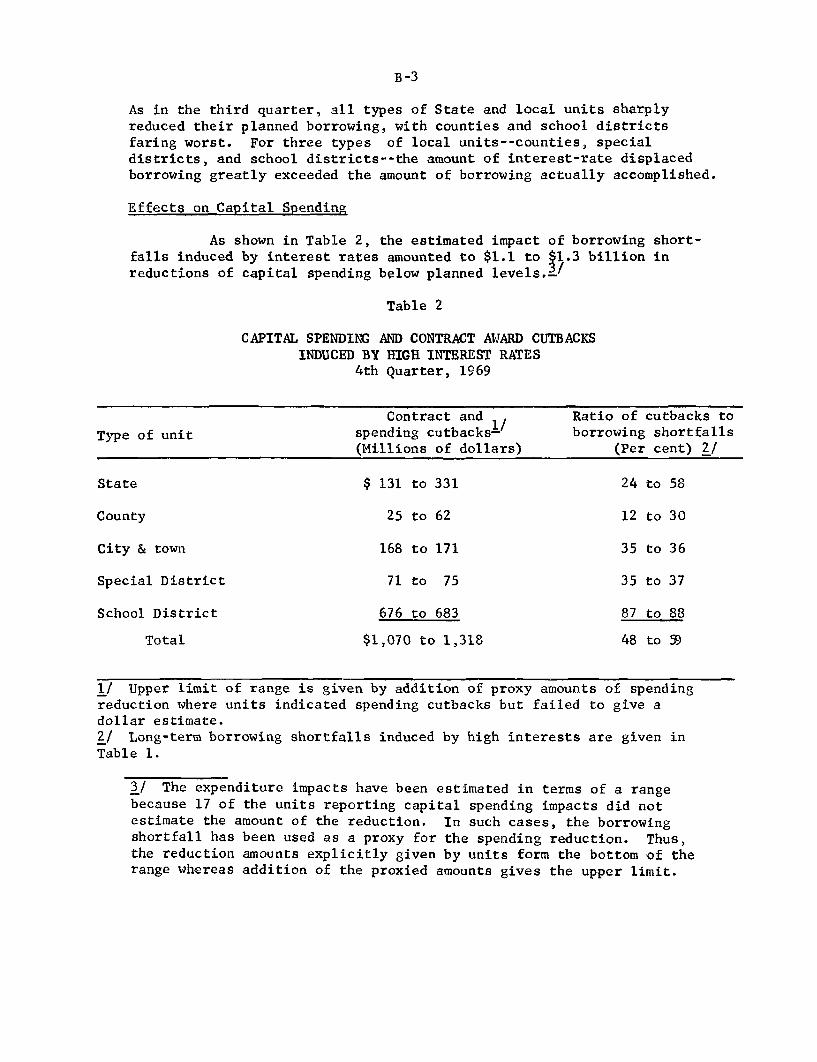
B-3
As in the third quarter, all types of State and local units sharplyreduced their planned borrowing, with counties and school districtsfaring worst. For three types of local units--counties, specialdistricts, and school districts--the amount of interest-rate displacedborrowing greatly exceeded the amount of borrowing actually accomplished.
Effects on Capital Spending
As shown in Table 2, the estimated impact of borrowing short-falls induced by interest rates amounted to $1.1 to $1.3 billion inreductions of capital spending below planned levels.-/
Table 2
CAPITAL SPENDING AND CONTRACT AWARD CUTBACKSINDUCED BY HIGH INTEREST RATES
4th Quarter, 1969
Contract and Ratio of cutbacks to
Type of unit spending cutbacks- borrowing shortfalls(Millions of dollars) (Per cent) 2/
State $ 131 to 331 24 to 58
County 25 to 62 12 to 30
City & town 168 to 171 35 to 36
Special District 71 to 75 35 to 37
School District 676 to 683 87 to 88
Total $1,070 to 1,318 48 to 99
1/ Upper limit of range is given by addition of proxy amounts of spendingreduction where units indicated spending cutbacks but failed to give adollar estimate.2/ Long-term borrowing shortfalls induced by high interests are given inTable 1.
3/ The expenditure impacts have been estimated in terms of a rangebecause 17 of the units reporting capital spending impacts did notestimate the amount of the reduction. In such cases, the borrowingshortfall has been used as a proxy for the spending reduction. Thus,the reduction amounts explicitly given by units form the bottom of therange whereas addition of the proxied amounts gives the upper limit.

B-4
Such spending reductions are evidently heaviest for schooldistricts, providing further evidence to the proposition that thesmaller units have the greatest difficulty in finding alternativeforms of financing projects in periods of restrictive credit. Forthese units, nearly ninety per cent of the dollar volume of long-termborrowing shortfalls have given rise to construction cutbacks.
The ratio of aggregate spending reductions to total borrowingshortfalls attributed to the high cost of borrowing is approximately53 per cent. This is more than ten percentage points higher than the40 per cent ratio found in the third quarter of 1969 and 2-1/2 timesthe ratio found in the System's survey of State and local borrowingin 1966.
The bulk of these spending reductions are net additionsto the $600 to $750 million in spending delays reported by the thirdquarter survey. Only about $200 million of the $1.1 to $1.3 billionfigure represent continuation of spending hold-ups first reported inthe third quarter. Hence, it appears that high interest rates in thesecond half of 1969 (no data are available for the first half) setoff about $1.6 to $1.8 billion in capital spending delays and reductions.
Because of lags inherent in the construction process, thefull impact of these reductions on capital outlays will take time towork themselves out. But on an annual rate basis, they suggest a$3.0 to $3.6 shortfall of State and local capital spending belowintended levels. Preliminary State and local construction statisticsfor the fourth quarter of 1969 do indeed show an actual downturn inseasonally adjusted expenditures amounting to approximately $1.0billion on an annual rate basis. Even though some relaxation in thebond markets this spring may allow resumption of many postponed pro-jects, it seems unlikely that State and local construction expenditureswill increase significantly on balance throughout 1970. A contributingfactor of unmeasured magnitude is the voluntary postponement ofFederally-aided capital expenditures by State officials in responseto the President's request of last August.
State-by-State Experience
As might be expected, the extent of bond postponements inducedby adverse market conditions varied greatly among the states. Thoseten states with no rate ceilings (or suspended ceilings) in force duringthe fourth quarter;- accounted for 26 per cent of all borrowing cut-backs associated with high interest rate. But, virtually none of theseborrowing shortfalls resulted in construction cutbacks. Apparently,interest-rate induced postponement of borrowings in these states onlyoccurred if other financing means were available. Of course, this
4/ Connecticut, Idaho, Indiana, Maine, Massachusetts, New Hampshire,North Carolina, New Jersey, New York, and Wyoming.

B-5
means that essentially all of the reductions in capital outlays atthe State and local level,that were associated with high borrowingcosts, occurred in those areas with some form of legal rate ceiling.
Those states with the largest volume of construction delaysor abandonments were Pennsylvania, ($111 million), California ($100million), and Texas ($72 million). In several states the amount ofborrowing postponed due to high interest rates was several times thevolume actually accomplished: Michigan, 6 times; Maryland, 5;Oklahoma, 10; Kansas, 25. Although regional tabulations have not yetbeen completed, it is clear that the New England states have beenmost successful in avoiding spending cuts as a result of long-termborrowing shortfalls. None of these states carries interest rate ceil-lings, and most of them typically make much heavier use of short-termborrowing than states in other regions of the country.
Alternative Means of Financing
Approximately $800 million in long-term shortfalls attributedto high interest rates did not lead to spending cutbacks. As depictedin Table 3, short-term borrowing supplied over half the alternativefunds used to finance expenditure plans. Liquid asset reductions,which were of relatively little importance in the third quarter, sup-plied 22 per cent of the alternative funds used in the fourth quarter.The increased importance of this source may reflect the fact thatlocal tax collections are relatively heaviest in the fourth quarterof the year when, typically, 35 per cent of the year's revenues arecollected. Of greatly decreased importance in sheltering expenditureplans from capital market difficulties was the "no immediate need forfunds" category. With prolonged stringency, relatively few units havebeen borrowing well in advance of cash needs. The erosion of thesebuffers, discussed in the Greenbook Appendix of October 1969, accountsfor much of the growing severity of the bond financing shortages uponspending plans.
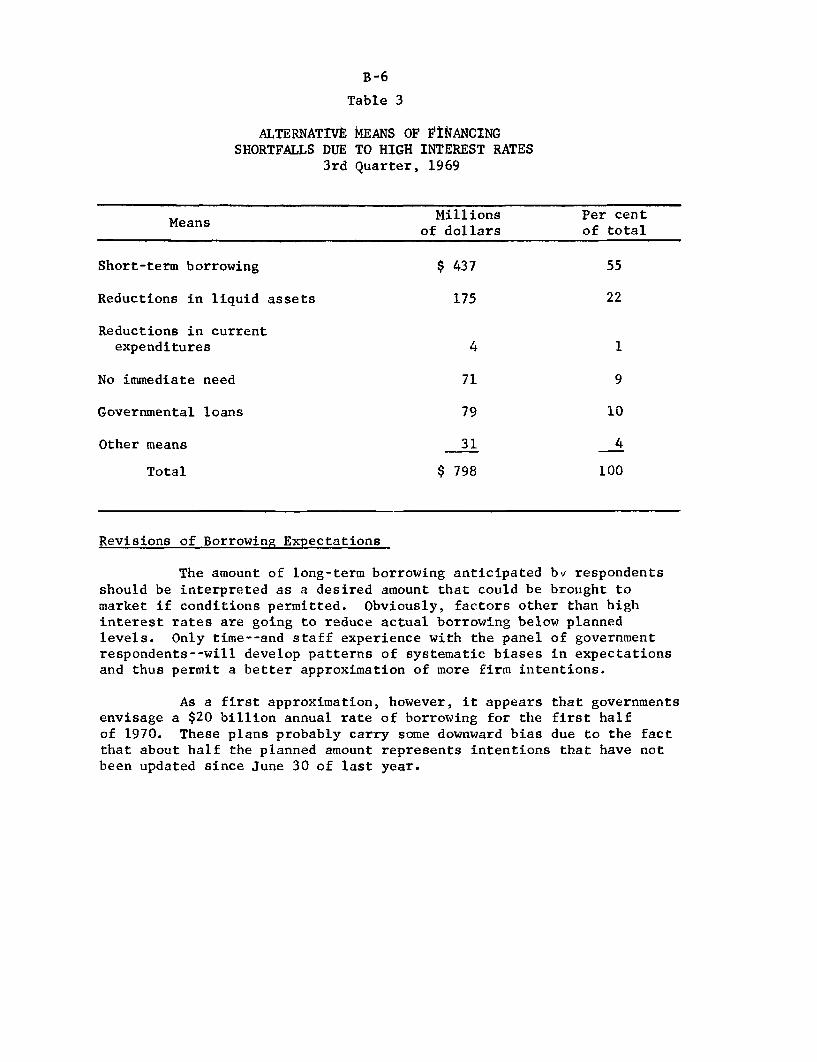
B-6
Table 3
ALTERNATIVESHORTFALLS DUE
3rd
MEANS OF FINANCINGTO HIGH INTEREST RATESQuarter, 1969
s Millions Per centMeans
of dollars of total
Short-term borrowing $ 437 55
Reductions in liquid assets 175 22
Reductions in currentexpenditures 4 1
No immediate need 71 9
Governmental loans 79 10
Other means 31 4
Total $ 798 100
Revisions of Borrowing Expectations
The amount of long-term borrowing anticipated by respondentsshould be interpreted as a desired amount that could be brought tomarket if conditions permitted. Obviously, factors other than highinterest rates are going to reduce actual borrowing below plannedlevels. Only time--and staff experience with the panel of governmentrespondents--will develop patterns of systematic biases in expectationsand thus permit a better approximation of more firm intentions.
As a first approximation, however, it appears that governmentsenvisage a $20 billion annual rate of borrowing for the first halfof 1970. These plans probably carry some downward bias due to the factthat about half the planned amount represents intentions that have notbeen updated since June 30 of last year.
APPENDIX C: SEASONAL ADJUSTMENT OF CONSUMER PRICE INDEXES*
Although seasonally adjusted percentage changes in consumerprices from month to month and quarter to quarter have been releasedfrom time to time, most of the seasonally adjusted indexes themselveshave not been published or made available because of technical problemsin obtaining accurate seasonal factors. However, BLS has made avail-able for our analytical use on a confidential basis recently revisedseasonal factors for 1969 and 1970. Factors for major commodity groupsare shown in the table. Seasonality in service prices is negligible.
*Prepared by Mary W. Smelker, Senior Economist, Business ConditionsSection, Division of Research and Statistics.
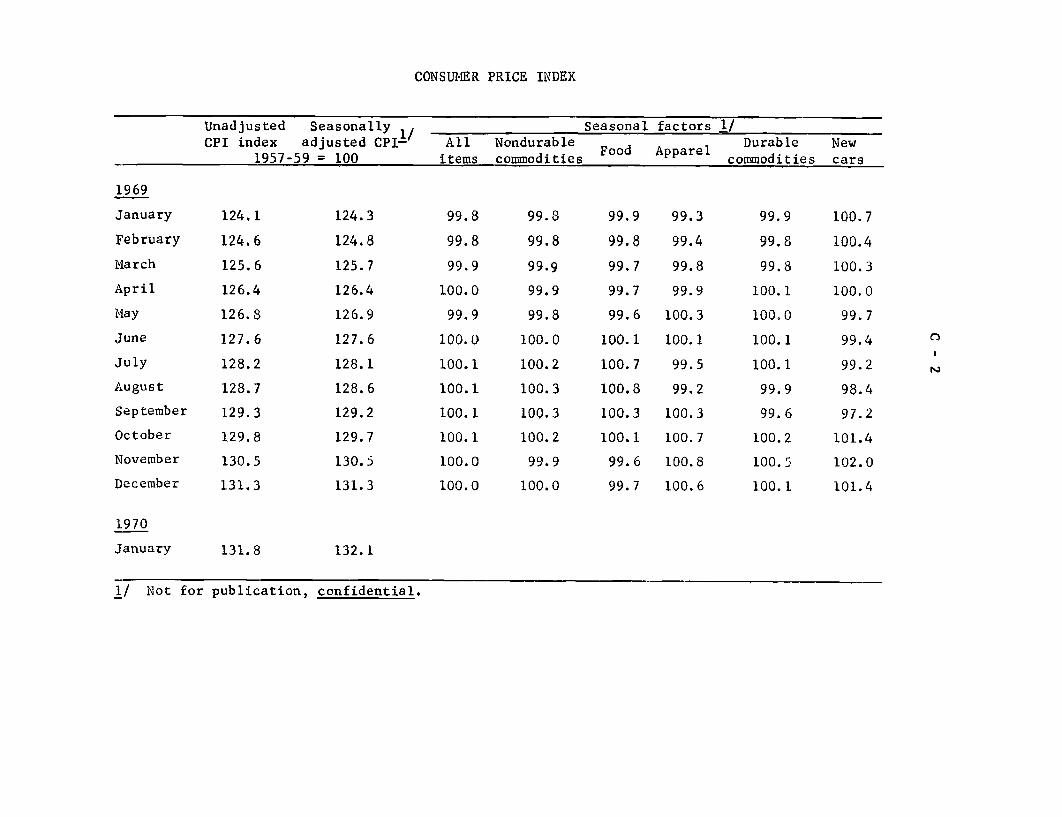
CONSUMER PRICE INDEX
Unadjusted Seasonally 1. Seasonal factors 1/CPI index adjusted CPI- All Nondurable Durable New
1957-59 = 100 items commodities commodities cars
1969
January 124.1 124.3 99.8 99.8 99.9 99.3 99.9 100.7
February 124.6 124.8 99.8 99.8 99.8 99.4 99.8 100.4
March 125.6 125.7 99.9 99.9 99.7 99.8 99.8 100.3
April 126.4 126.4 100.0 99.9 99.7 99.9 100.1 100.0
May 126.8 126.9 99.9 99.8 99.6 100.3 100.0 99.7
June 127.6 127.6 100.0 100.0 100.1 100.1 100.1 99.4
July 128.2 128.1 100.1 100.2 100.7 99.5 100.1 99.2
August 128.7 128.6 100.1 100.3 100.8 99.2 99.9 98.4
September 129.3 129.2 100.1 100.3 100.3 100.3 99.6 97.2
October 129.8 129.7 100.1 100.2 100.1 100.7 100.2 101.4
November 130.5 130.5 100.0 99.9 99.6 100.8 100.5 102.0
December 131.3 131.3 100.0 100.0 99.7 100.6 100.1 101.4
1970
January 131.8 132.1
1/ Not for publication, confidential.


