Embed Size (px)
Citation preview

Prefatory Note The attached document represents the most complete and accurate version available based on original copies culled from the files of the FOMC Secretariat at the Board of Governors of the Federal Reserve System. This electronic document was created through a comprehensive digitization process which included identifying the best-preserved paper copies, scanning those copies,1
and then making the scanned versions text-searchable.2
Though a stringent quality assurance process was employed, some imperfections may remain. Please note that some material may have been redacted from this document if that material was received on a confidential basis. Redacted material is indicated by occasional gaps in the text or by gray boxes around non-text content. All redacted passages are exempt from disclosure under applicable provisions of the Freedom of Information Act. 1 In some cases, original copies needed to be photocopied before being scanned into electronic format. All scanned images were deskewed (to remove the effects of printer- and scanner-introduced tilting) and lightly cleaned (to remove dark spots caused by staple holes, hole punches, and other blemishes caused after initial printing). 2 A two-step process was used. An advanced optical character recognition computer program (OCR) first created electronic text from the document image. Where the OCR results were inconclusive, staff checked and corrected the text as necessary. Please note that the numbers and text in charts and tables were not reliably recognized by the OCR process and were not checked or corrected by staff.
Content last modified 6/05/2009.
CONFIDENTIAL (FR)
CURRENT ECONOMIC AND FINANCIAL CONDITIONS
By the StaffBoard of Governors
of the Federal Reserve SystemNovember 10, 1970

TABLE OF CONTENTS
SUMMARY AND OUTLOOK
Nonfinancial. ........ .. . . . . . . .. . . . . . . . 1Financial .. .. . . . . . . . . . . . . . . . . . . . . . . 3Balance of payments . . . . . . . . . . . . . . ...... .. . . 7
THE ECONOMIC PICTURE IN DETAIL:
Domestic Nonfinancial SceneGross national product. . . . . . . . . . . . .Industrial production . . . . . . . . . . . . .Retail sales . . . . . . . . . . . . . . . . . .Autos . . . . . . . . . . . . . . . . . . . . . .Consumer credit . . . . . . . . . . . . . . . . .Census consumer purchase and income expectations.Inventories . . . . . . . . . . . . . . . . . . .Manufacturers' new orders . . . . . . . . . . . .Cyclical indicators . . . . . . . . . . . . . . .Construction and real estate . . . . . . . . . .Anticipated plant and equipment spending. . ..Labor market . . . . . . . . . . . . . . . . . .Productivity . . . . . . . . . . . . . . . . . .Industrial relations and wages. . . . . . . . . .
S . . . . . 10-11-12-13-15-16-17-19-21
. . . . . -24
. . . . . -25Wholesale prices . . . . . . . . . . . . . . . . . . . .. -27Consumer prices .... ... . . . . . . . . . . . . . ... -30GNP deflators .. . . . . . . . . . . . . . . . . . . . . -33Meat supply prospects . . . . . . . . . . . . . . . . . . -34
DOMESTIC FINANCIAL SITUATION
Monetary aggregates . . . . . . . . . . . . . . . .... . ..- 1Bank credit ....... . . . . . . . . . ... . . . . - 3Nonbank depositary institutions . .. . ... . .... ... - 5
Mortgage market . . . . . . . . . .. . . . . . ....... - 8
Corporate and municipal security markets . . . . . . . .. . -11
Government securities market. . . . . . . . . . . . . . .. -14Other short-term credit markets . . . . . . . . . . . ... -17
Federal finance . . . . . . . . . . . . . . . . . .... -20
*

INTERNATIONAL DEVELOPMENTS IV
U.S. Balance of Payments. ... . . . . . . . . . . . . .- 1U.S. Foreign Trade . . . . . . . . . . . . . . . . . . - 4Foreign Exchange Markets. . . . . . . . . . . . . . .. . . - 7Euro-dollar........ . . . . . . . . . . . ........ .. -10Cyclical developments in major industrial nations . . ... -13
Appendix A-British Government Announces Tax and Expenditures Cuts. . . A- I
Appendix B-Staff Estimates of High Employment Surplus . . . . . . . . B- 1
I-1
SUMMARY AND OUTLOOK
Nonfinancial
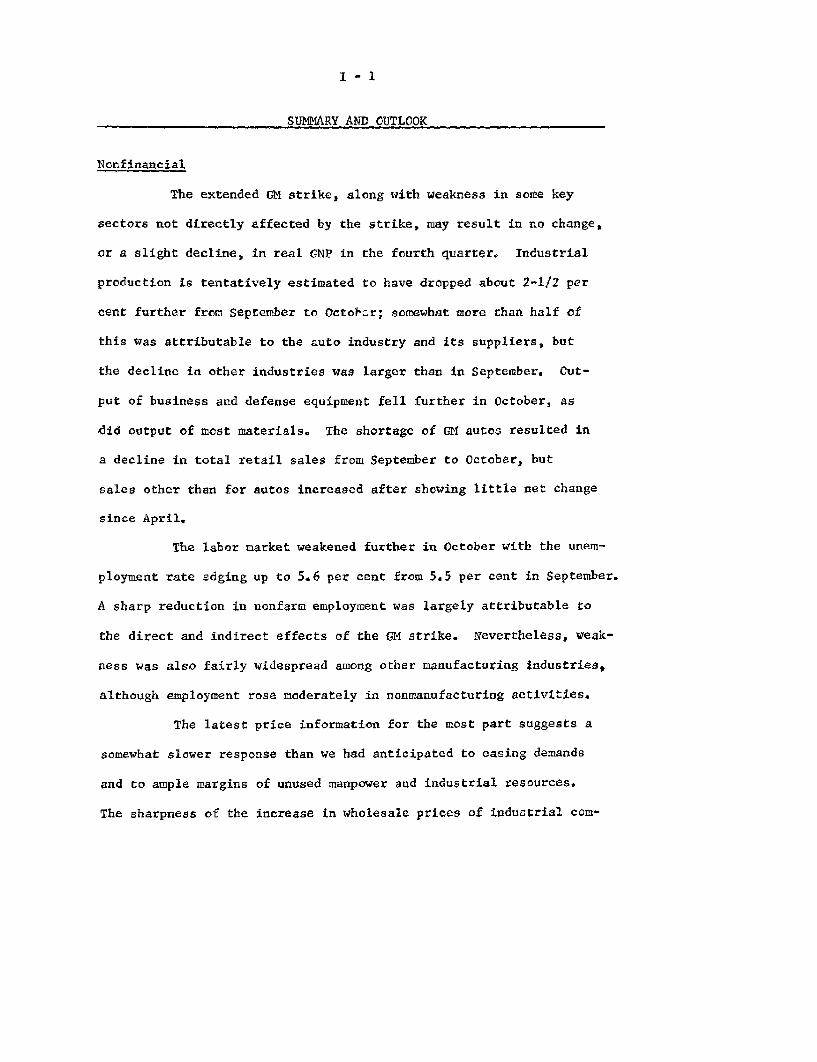
The extended GM strike, along with weakness in some key
sectors not directly affected by the strike, may result in no change,
or a slight decline, in real GNP in the fourth quarter. Industrial
production is tentatively estimated to have dropped about 2-1/2 per
cent further from September to October; somewhat more than half of
this was attributable to the auto industry and its suppliers, but
the decline in other industries was larger than in September. Out-
put of business and defense equipment fell further in October, as
did output of most materials. The shortage of GM autos resulted in
a decline in total retail sales from September to October, but
sales other than for autos increased after showing little net change
since April.
The labor market weakened further in October with the unem-
ployment rate edging up to 5.6 per cent from 5.5 per cent in September.
A sharp reduction in nonfarm employment was largely attributable to
the direct and indirect effects of the GM strike. Nevertheless, weak-
ness was also fairly widespread among other manufacturing industries,
although employment rose moderately in nonmanufacturing activities.
The latest price information for the most part suggests a
somewhat slower response than we had anticipated to easing demands
and to ample margins of unused manpower and industrial resources.
The sharpness of the increase in wholesale prices of industrial com-

I-2
modities, seasonally adjusted, from mid-September to mid-October was
largely the result of a considerable advance in prices on new model
autos. But numerous other increases also were posted. Most of the
rise in industrial commodity prices was offset in the total index,
however, by a substantial decline in prices of farm products. After
several months of moderating increases, consumer prices rose more
rapidly in September, but the increase over the quarter still was
smaller than over the preceding two quarters.
Outlook. After discounting GM strike effects (esti-
mated at around $5 billion on current dollar GNP in the fourth quar-
ter, our analysis of recent data suggests that the economy is not
very expansive. On balance, we now expect no change this quarter
from last in total real GNP, on the assumption that autos will be
in full production by early December. Next quarter, we expect a
very large advance in current dollar GNP, with real GNP growth
around a 4 per cent rate, as strike losses are partially made up.
But the rates of nominal and real growth are projected to fall back
in the second quarter, as auto output--reflected in auto sales and
inventories--is cut back from its catch-up pace.
The expansion in real GNP from the third quarter of 1970
to the second quarter of 1971 is projected to average only about a
2 per cent annual rate. Further sizable advances in residential con-
struction activity and State and local purchases are expected, and
consumer spending is projected to increase moderately. On the other
hand, business spending on fixed capital is expected to decline mod-
I - 3
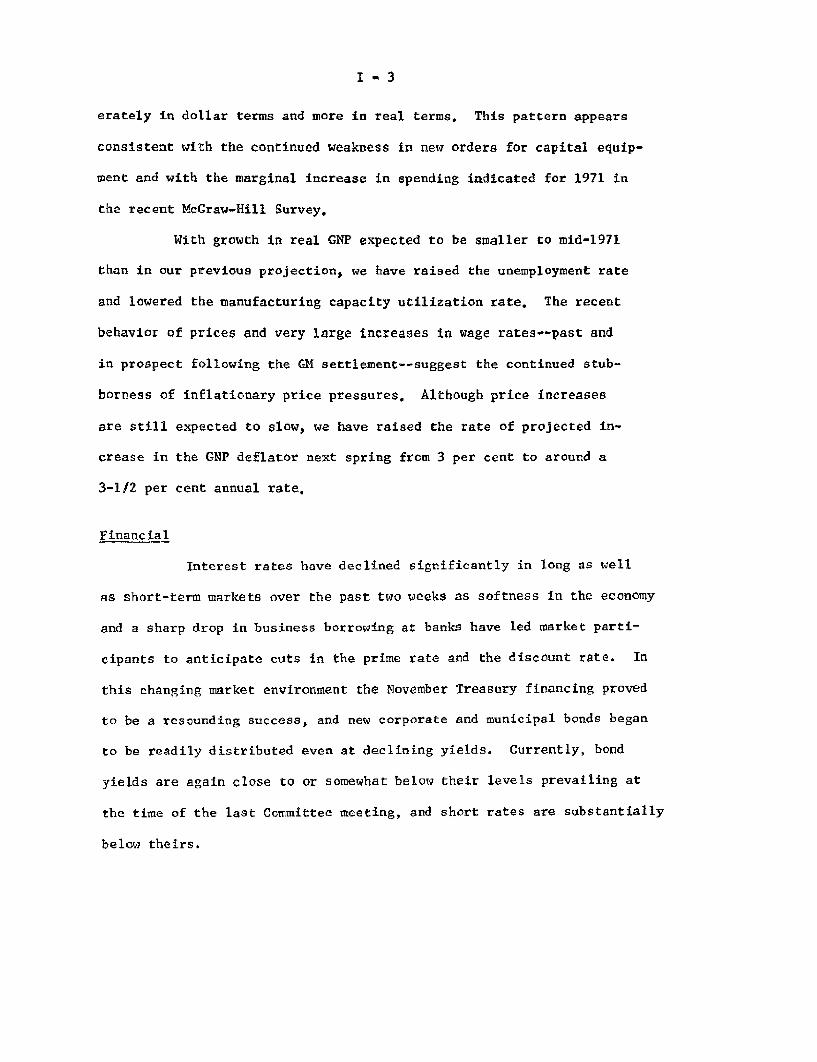
erately in dollar terms and more in real terms. This pattern appears
consistent with the continued weakness in new orders for capital equip-
ment and with the marginal increase in spending indicated for 1971 in
the recent McGraw-Hill Survey.
With growth in real GNP expected to be smaller to mid-1971
than in our previous projection, we have raised the unemployment rate
and lowered the manufacturing capacity utilization rate. The recent
behavior of prices and very large increases in wage rates--past and
in prospect following the GM settlement--suggest the continued stub-
borness of inflationary price pressures. Although price increases
are still expected to slow, we have raised the rate of projected in-
crease in the GNP deflator next spring from 3 per cent to around a
3-1/2 per cent annual rate.
Financial
Interest rates have declined significantly in long as well
as short-term markets over the past two weeks as softness in the economy
and a sharp drop in business borrowing at banks have led market parti-
cipants to anticipate cuts in the prime rate and the discount rate. In
this changing market environment the November Treasury financing proved
to be a resounding success, and new corporate and municipal bonds began
to be readily distributed even at declining yields. Currently, bond
yields are again close to or somewhat below their levels prevailing at
the time of the last Committee meeting, and short rates are substantially
below theirs.

I-4
Contraction of business borrowing at banks intensified in
October. While loan repayments financed by heavy capital market borrowing
probably contributed importantly to this shrinkage, the general softness
of the economy and the spreading effects of the General Motors strike
also exerted a strong influence. With overall loan growth very small,
banks continued to add substantially to their investment portfolios,
chiefly in State and local government securities.
Weakness in the economy, including strike effects, apparently
also affected the demand for money balances. Thus, the average level
of the money stock in October was about unchanged from September. Growth
of time and savings deposits slowed somewhat from the very rapid July-
September rate, although net funds provided to banks from this source
still remained very large. Nevertheless, with U.S. Government deposits
declining, and banks continuing to reduce their reliance on nondeposit
sources of funds, growth of total bank credit, as measured by the ad-
justed credit proxy, virtually halted.
Preliminary data for nonbank thrift institutions suggest that
their savings inflows continued relatively large in October, particularly
after allowance for seasonal factors. As a result, the build-up of loan
commitments and the enlargement of mortgage loan flows evident at these
institutions during the third quarter were apparently extended into
October.

I- 5
Outlook. If full production of autos is resumed by early
December, as is assumed in the economic projection, business and consumer
demands for bank credit are likely to strengthen appreciably, although
the full effect of this change may not develop until after the turn of
the year. As these demands develop, it would not be surprising if banks
became somewhat more aggressive in the CD market than recently and/or
slowed the rate at which they repaid nondeposit sources of funds.
However, business loan repayments financed by new issues of securities
are likely to remain large at least through year-end, and with commercial
paper rates now below the prime rate, some prime borrowers may elect to
finance short-term needs outside the banks. On balance, therefore, with
rate ceilings no longer a constraint on the sale of CD's, banks should
have ample leeway to move toward more expansive loan policies.
Business financing in capital markets is scheduled to remain
large in November and probably December (after adjustment for the usual
holiday lull). Moreover, early listings for the January calendar are on
the high side for this far ahead. There are scattered reports from
underwriters, however, of fewer large corporate financing projects in the
pipeline, and this might be the first indication of the drop-off in
corporate capital market borrowing generally anticipated sometime in
early 1971.
In the State and local government bond market, expanded bank
interest in October stimulated the largest volume of new offerings for
any month since October 1968. While listings for November and December
I- 6
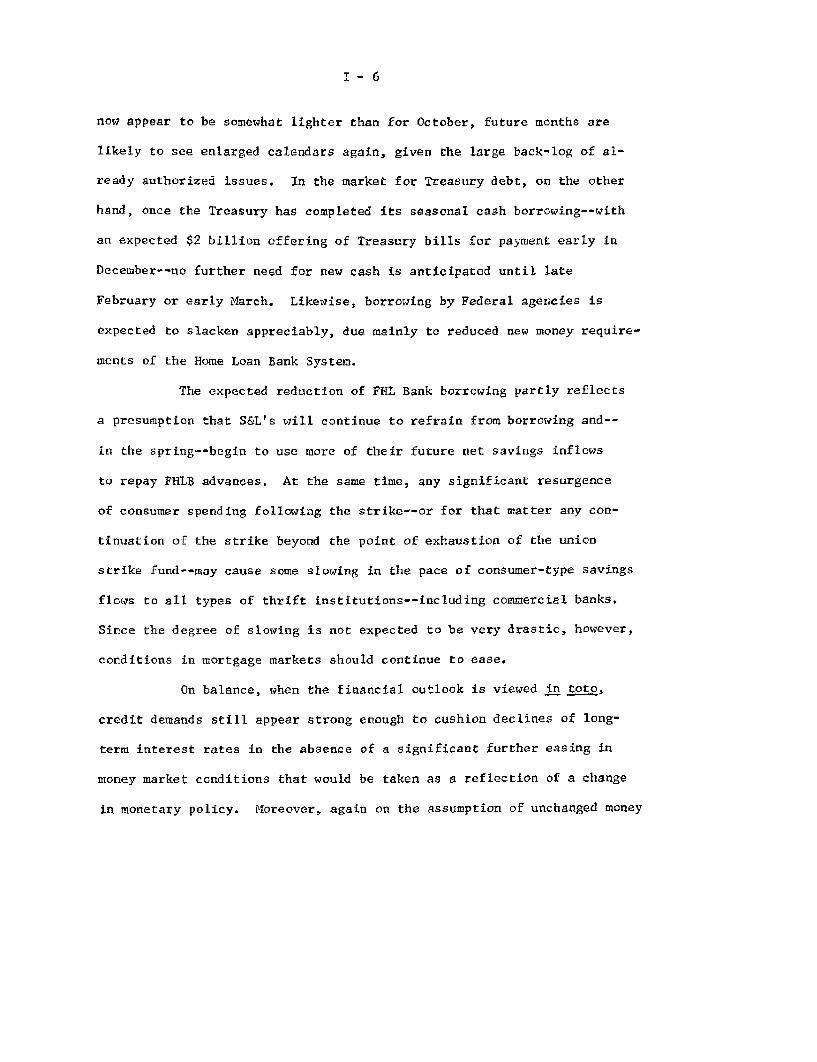
now appear to be somewhat lighter than for October, future months are
likely to see enlarged calendars again, given the large back-log of al-
ready authorized issues. In the market for Treasury debt, on the other
hand, once the Treasury has completed its seasonal cash borrowing--with
an expected $2 billion offering of Treasury bills for payment early in
December--no further need for new cash is anticipated until late
February or early March. Likewise, borrowing by Federal agencies is
expected to slacken appreciably, due mainly to reduced new money require-
ments of the Home Loan Bank System.
The expected reduction of FHL Bank borrowing partly reflects
a presumption that S&L's will continue to refrain from borrowing and--
in the spring--begin to use more of their future net savings inflows
to repay FHLB advances. At the same time, any significant resurgence
of consumer spending following the strike--or for that matter any con-
tinuation of the strike beyond the point of exhaustion of the union
strike fund--may cause some slowing in the pace of consumer-type savings
flows to all types of thrift institutions--including commercial banks.
Since the degree of slowing is not expected to be very drastic, however,
conditions in mortgage markets should continue to ease.
On balance, when the financial outlook is viewed in toto,
credit demands still appear strong enough to cushion declines of long-
term interest rates in the absence of a significant further easing in
money market conditions that would be taken as a reflection of a change
in monetary policy. Moreover, again on the assumption of unchanged money

I - 7
market conditions, short-term credit market rates may decline little
further, if at all, in view of the sharp anticipatory drop off in rates
that has already occurred.
Balance of payments
The sharp drop in imports in September expected at the time
of the last meeting did not materialize after all, and the trade surplus
now appears to have been a little smaller in the third quarter than in
the second, not larger. Nevertheless, with our current projections of
slack domestic demand and an anticipated pickup in commercial aircraft
export deliveries, we expect the trade balance to improve somewhat in
the current quarter and the next.
Projections of foreign countries' demand in world trade in the
current period and on into next year have been reduced a little since
last summer. Industrial production in Western Europe has been virtually
level since the beginning of 1970, but forecasts are that output may be
rising again before long. This year's leveling off seems to have re-
flected a drop in inventory investment demand, while the growth of final
sales (in real terms) has not ceased. Inflationary pressures continue
to be felt from the side of wage costs--though in some countries not so
strongly as at the beginning of 1970--while some easing on the demand
side is becoming noticeable, particularly for machinery and equipment.
This outlook carries mixed implications for U.S. exports.
With costs and prices rising both here and abroad, no clear trend in the

I- 8
international competitive position in finished goods is visible. Order
backlogs for machinery are still large in Europe, and U.S. exports in this
category should continue strong. Growth in U.S. exports of materials,
however, is likely to slow.
In the over-all balance of payments, the marked improvement
(on the liquidity basis) in the third quarter--a drop to a $3 billion
annual rate from a $6-1/2 billion rate in the first half--was the result
mainly of a favorable swing in U.S. bank lending to foreigners and a
renewal of foreign buying of U.S. stocks. A substantial shrinkage of
U.S. corporate outflows is expected at the end of the year, to keep within
the limits set by the direct investment control regulations. However,
with U.S. credit conditions easing, U.S. bank lending flows may be less
favorable this quarter than in the third quarter. Farther ahead, the
trends of private capital flows will be influenced by the relative
degrees of easing in financial markets here and abroad.
The outlook for the official settlements balance continues to
be more unsatisfactory than for the liquidity balance. Repayment of
Euro-dollar borrowings by U.S. banks has been going on at a moderate but
fairly steady pace, and seems likely to continue.
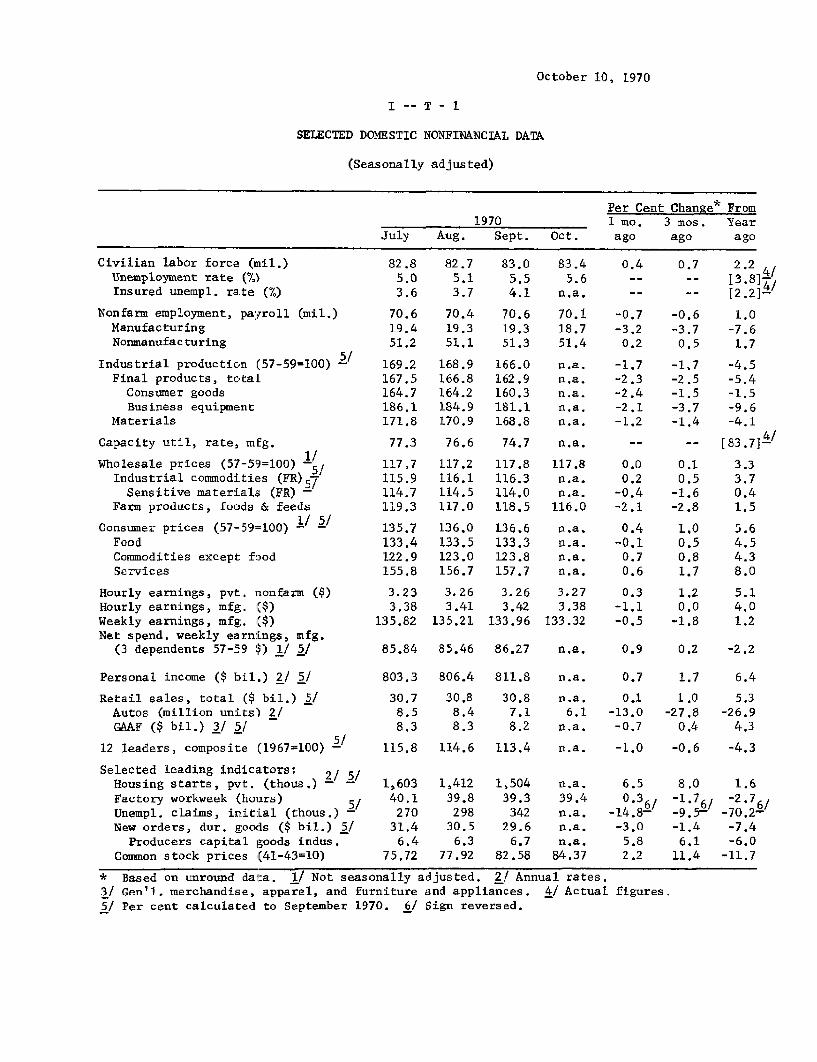
October 10, 1970
I - T - 1
SELECTED DOMESTIC NONFINANCIAL DATA
(Seasonally adjusted)
Per Cent Change* From1970 1 mo. 3 mos. Year
July Aug. Sept. Oct. ago ago ago
Civilian labor force (nil.)Unemployment rate (%)Insured unempl. rate (%)
Nonfarm employment, payroll (mil.)ManufacturingNonmanufacturing
Industrial production (57-59=100)Final products, total
Consumer goodsBusiness equipment
Materials
Capacity util, rate, mEg.1/Wholesale prices (57-59=100) - /
Industrial commodities (FR)57Sensitive materials (FR)
Farm products, foods & feeds
Consumer prices (57-59=100) 1 / 5/
FoodCommodities except foodServices
Hourly earnings, pvt. nonfarm ($)Hourly earnings, mfg. ($)Weekly earnings, mfg. ($)Net spend. weekly earnings, mfg.
(3 dependents 57-59 $) i/ 5/
Personal income ($ bil.) 2/ 5/
Retail sales, total ($ bil.) 5/Autos (million units) 2/GAAF ($ bil.) 3/ 5/
12 leaders, composite (1967=100) 5
Selected leading indicators: 2/ 5/Housing starts, pvt. (thous.) -Factory workweek (hours) 5/Unempl. claims, initial (thous.) -New orders, dur. goods ($ bil.) 5/
Producers capital goods indus.Common stock prices (41-43=10)
82.8
5.0
3.6
70.619.4
51.2
5 169.2167.5164.7186.1171.8
82.7
5.1
3.7
70.4
19.351.1
168.9
166.8
164.2184.9170.9
83.05.54.1
70.619.351.3
166.0162.9160.3181.1168.8
83.4
5.6n.a.
70.118.751.4
n.a.
n.a.n.a.
n.a.
n.a.
77.3 76.6 74.7 n.a.
117.7115.9114.7119.3
135.7
133.4122.9155.8
3.233.38
135.82
117.2116.1114.5117.0
136.0133.5123.0156.7
3.263.41
135.21
117.8116.3114.0118.5
136.6133.3123.8157.7
3.263.42
133.96
117.8n.a.n.a.
116.0
a.a.n.a.n.a.n.a.
3.273.38
133.32
-0.7-3.2
0.2
-1.7-2.3-2.4-2.1
-1.2
0.7 2.2-- 13.8]
-- [2.2]-
-0.6 1.0-3.7 -7.60.5 1.7
-1.7 -4.5-2.5 -5.4-1.5 -1.5-3.7 -9.6-1.4 -4.1
-- -- [83.7]4
0.0 0.1 3.30.2 0.5 3.7
-0.4 -1.6 0.4-2.1 -2.8 1.5
0.4 1.0 5.6-0.1 0.5 4.50.7 0.8 4.30.6 1.7 8.0
0.3-1.1-0.5
1.20.0
-1.8
85.84 85.46 86.27 n.a. 0.9 0.2 -2.2
803.3
30.78.58.3
806.4
30.88.48.3
811.8
30.87.18.2
n.a.
n.a.
6.1n.a.
0.7
0.1-13.0
-0.7
1.7
1.0-27.8
0.4
6.4
5.3-26.9
4.3
115.8 114.6 113.4 n.a. -1.0 -0.6 -4.3
1,60340.1270
31.4
6.475.72
1,41239.8
29830.5
6.377.92
1,50439.3
34229.6
6.782.58
n.a,
39.4
n.a.n.a.n.a.
84.37
6.5 8.0 1.6-1.76/-9. --1.4
6.111.4
0.36-14.8- /
-3.05.82.2
-2.7-70.2-
-7.4-6.0
-11.7
* Based on unround data. 1/ Not seasonally adjusted. 2/ Annual rates.
3/ Gen'1. merchandise, apparel, and furniture and appliances. 4/ Actual figures.5/ Per cent calculated to September 1970. 6/ Sign reversed.
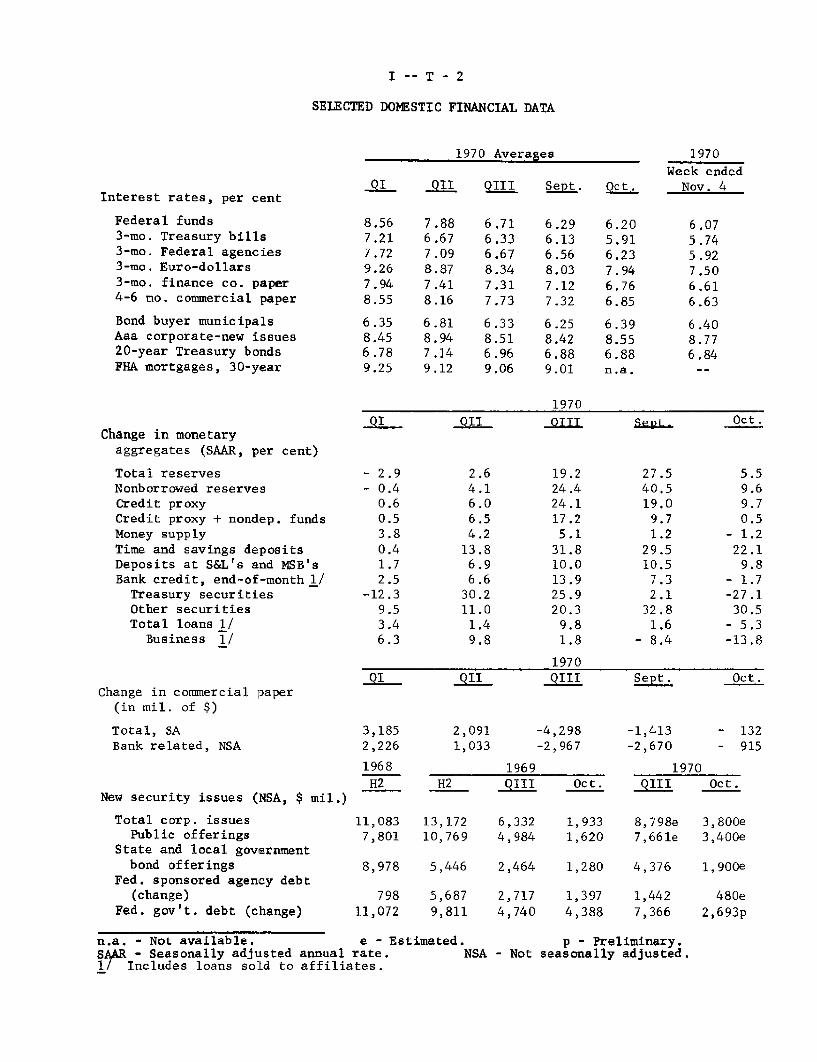
I-- T - 2
SELECTED DOMESTIC FINANCIAL DATA
Interest rates, per cent
Federal funds3-mo. Treasury bills3-mo. Federal agencies3-mo. Euro-dollars3-mo. finance co. paper4-6 mo. commercial paper
Bond buyer municipalsAaa corporate-new issues20-year Treasury bondsFHA mortgages, 30-year
Change in monetaryaggregates (SAAR, per cent)
Total reservesNonborrowed reservesCredit proxyCredit proxy + nondep. fundsMoney supplyTime and savings depositsDeposits at S&L's and MSB'sBank credit, end-of-month 1/Treasury securitiesOther securitiesTotal loans 1/
Business 1/
Change in commercial paper(in mil. of $)
Total, SABank related, NSA
New security issues (NSA, $ mil.)
Total corp. issuesPublic offerings
State and local governmentbond offerings
Fed. sponsored agency debt(change)
Fed. gov't. debt (change)
1970 Averages 1970
Week ended_Q1 QIL QII Sept. Oct. Nov. 4
8.567.217.729.267.948.55
6.358.456.789.25
Q1
- 2.9- 0.40.60.53.80.41.72.5
-12.39.53.46.3
3,1852,226
1968
H2
7.886.677.098.877.418.16
6.818.947.149.12
6.716.336.678.347.317.73
6.338.516.969.06
QII
2.64.16.06.54.2
13.86.96.630.211.01.49.8
QII
2,0911,033
1969H2 QIII
6.296.136.568.037.127.32
6.258.426.889.01
1970OIII
19.224.424.117.2
5.131.810.013.925.920.3
9.81.8
1970
QIII
-4,298-2,967
6.205.916.237.946.766.85
6.398.556.88n.a.
Sept.
27.540.519.0
9.71.2
29.510.57.32.1
32.81.6
- 8.4
Sept.
-1,413-2,670
6.075.745.927.506.616.63
6.408.776.84
Oct.
5.59.69.70.5
- 1.222.1
9.8- 1.7-27.1
30.5- 5.3-13.8
Oct.
- 132- 915
1970Oct. QIII Oct.
11,083 13,172 6,332 1,933 8,798e 3,800e7,801 10,769 4,984 1,620 7,661e 3,400e
8,978 5,446 2,464 1,280 4,376 1,900e
798 5,687 2,717 1,397 1,44211,072 9,811 4,740 4,388 7,366
480e2,693p
n.a. - Not available. e - EstimatedSAAR - Seasonally adjusted annual rate.
/ Includes loans sold to affiliates.
p - Preliminary.NSA - Not seasonally adjusted.
C_

I -- T - 3
U.S. Balance of PaymentsIn millions of dollars; seasonally adjusted
1969 1 9 7 0 PYear I II III SEPT. *
Goods and services, net 1/ 1 949 851 1 119Trade balance 2/ 638 518 847 780 167
Exports 2/ 36,473 10,241 10,714 10,680 3,494Imports 2/ -35,835 -9,723 -9,867 -9,900 -3,327
Service balance 1,311 333 272
Remittances and pensions -1,191 -328 -359Govt. grants & capital, net -3,828 -855 -785
U.S. private capital -5,233 -1 686 -1 813Direct investment -3,070 -1,411 -1,363Foreign securities -1,494 -133 64 -352 3Banking claims -541 147 -459 134 -239Other -128 -289 -55
Foreign capital 12,330 1,679 1 547Official foreign, liquid -517 3,044 450 1,487 747Official reserve holders, nonliquid -996 -422 506 -243 -54Other official foreign, nonliquid 259 -32 -175Foreign commercial banks, liquid 9,217 -1,916 -118 -1,359 -407New direct investment issues 3/ 1,029 155 267U.S. corporate stocks 1,565 -85 -123 364 207Other 1,773 935 740
U.S. monetary reserves (inc.-) -1,187 481 1 022 801 269Gold stock -967 -44 14 395 323Special drawing tights -- -53 -37 -34 -30IMF gold tranche -1,034 -253 227 406 379Convertible currencies 814 831 818 34 -403
Errors and omissions -2,841 -144 -729
BALANCES (deficit -) 4/Official settlements, S.A. -3,103 -1,978 -2,045
" " , N.S.A. 2,700 -2,829 -2,061 -2,612 -962Liquidity, S.A. -1,598 -1,421 -878
,N.S.A. -7,012 -1,496 -1,412 -1,687 -508Adjusted over-all, S.A. -1,187 -1,860 -686" " , N.S.A. -6,517 -1,093 -1,858 -1,503 -555Financed by: 5/
Liab. to comm. banks 9,217 -1,736 -203 -1,109 -407Official settlements -2,700 2,829 2,061 2,612 962
* Only exports and imports are seasonallyadjusted.1/ Equals "net exports" in the GNP, except for latest revisions.2/ Balance of payments basis which differs a little from Census basis.3/ New issues sold abroad by U.S. direct investors.4/ Excludes initial allocation of SDRs on January 1, 1970; total $867 million,
quarterly S.A., $217 million.5/ Minus sign indicates decrease in net liabilities. Data not seasonally adjusted.
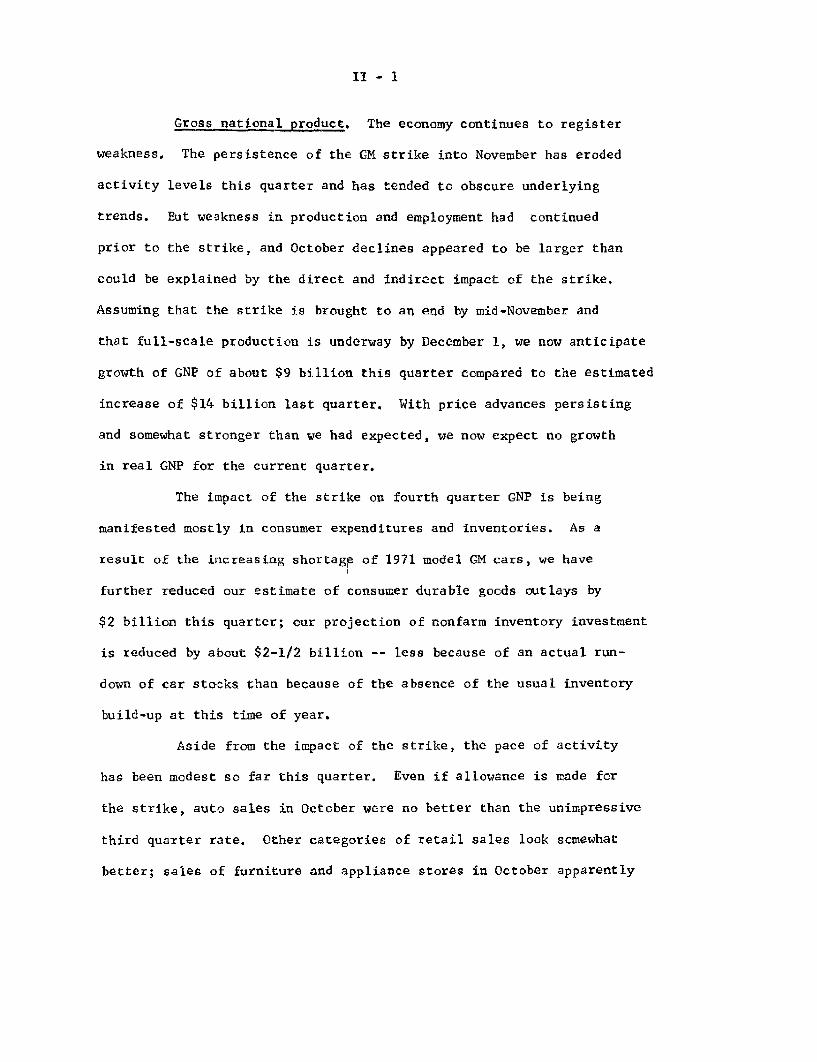
II - 1
Gross national product. The economy continues to register
weakness. The persistence of the GM strike into November has eroded
activity levels this quarter and has tended to obscure underlying
trends. But weakness in production and employment had continued
prior to the strike, and October declines appeared to be larger than
could be explained by the direct and indirect impact of the strike.
Assuming that the strike is brought to an end by mid-November and
that full-scale production is underway by December 1, we now anticipate
growth of GNP of about $9 billion this quarter compared to the estimated
increase of $14 billion last quarter. With price advances persisting
and somewhat stronger than we had expected, we now expect no growth
in real GNP for the current quarter.
The impact of the strike on fourth quarter GNP is being
manifested mostly in consumer expenditures and inventories. As a
result of the increasing shortage of 1971 model GM cars, we have
further reduced our estimate of consumer durable goods outlays by
$2 billion this quarter; our projection of nonfarm inventory investment
is reduced by about $2-1/2 billion -- less because of an actual run-
down of car stocks than because of the absence of the usual inventory
build-up at this time of year.
Aside from the impact of the strike, the pace of activity
has been modest so far this quarter. Even if allowance is made for
the strike, auto sales in October were no better than the unimpressive
third quarter rate. Other categories of retail sales look somewhat
better; sales of furniture and appliance stores in October apparently

II - 2
showed the first appreciable improvement in six months, and we are
estimating a good recovery for nondurable goods stores following
two months of little change.
CHANGES IN GNP AND RELATED ITEMS, 1970(Seasonally adjusted, annual rates)
GNP
Final SalesPersonal consumptionResidential constructionBusiness fixed investmentNet exportsFederal purchasesState and local purchases
Inventory change
Real GNPGNP deflator
Third Quarter Fourth QuarterCommerce ProjectionPrel. of Current10/14/70 10/14/70 Projection
------ Billions of dollars---------
14.1 12.5 9.3
13.1 14.0 13.38.0 9.9 8.0.7 2.6 2.9.9 - .5 -. 5.6 .3 1.0
- .7 - 1.3 -1.23.7 2.9 3.0
.9 - 1.5 -4.0
---- ------- Per cent--------------
1.4 1.5 - .24.4 3.6 4.0
But output of business equipment has continued to trend
down and we are still projecting a small downturn in dollar outlays
for business fixed investment this quarter. On the other hand,
residential construction activity continues to generate substantial
additional strength with a broadly-based rise in starts and permits
suggesting a rise in outlays in the current quarter of about $3 billion,
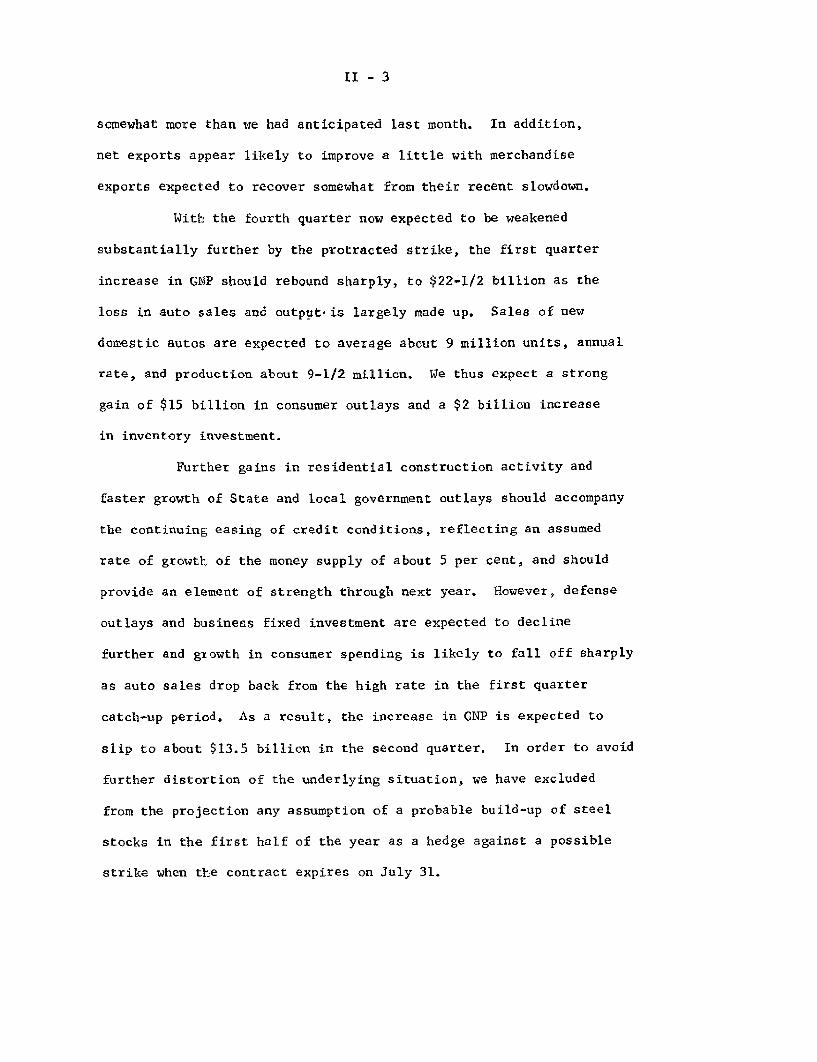
II - 3
somewhat more than we had anticipated last month. In addition,
net exports appear likely to improve a little with merchandise
exports expected to recover somewhat from their recent slowdown.
With the fourth quarter now expected to be weakened
substantially further by the protracted strike, the first quarter
increase in GNP should rebound sharply, to $22-1/2 billion as the
loss in auto sales and output- is largely made up. Sales of new
domestic autos are expected to average about 9 million units, annual
rate, and production about 9-1/2 million. We thus expect a strong
gain of $15 billion in consumer outlays and a $2 billion increase
in inventory investment.
Further gains in residential construction activity and
faster growth of State and local government outlays should accompany
the continuing easing of credit conditions, reflecting an assumed
rate of growth of the money supply of about 5 per cent, and should
provide an element of strength through next year. However, defense
outlays and business fixed investment are expected to decline
further and growth in consumer spending is likely to fall off sharply
as auto sales drop back from the high rate in the first quarter
catch-up period. As a result, the increase in GNP is expected to
slip to about $13.5 billion in the second quarter. In order to avoid
further distortion of the underlying situation, we have excluded
from the projection any assumption of a probable build-up of steel
stocks in the first half of the year as a hedge against a possible
strike when the contract expires on July 31.

II - 4
CHANGES IN GNP AND RELATED ITEMS, 1971(Seasonally adjusted, annual rates)
First juarter Second QuarterProjection Projection
of Current of Current10/14/70 Projection 10/14/70 Projection
----------------- Billions of dollars-----------
GNP 20.5 22.5 15.0 13.5
Final sales 20.2 20.5 12.1 11.5
Personal consumption 13.5 15.0 9.0 7.9Residential construction 2.4 2.2 1.4 1.6Business fixed investment -1.0 -1.2 -1.0 -1.0Net exports .6 ,3 .1 .2Federal purchases 1.2 1.2 -1.2 -1.0State and local purchases 3.5 3.0 3.8 3.8
Inventory change .3 2.0 2.9 2.0
--------------------- Per cent-----------------
Real GNP 3.8 4.3 2.9 1.7GNP deflator 4.3 4.7 1 3.0 3.6
I/ Excluding effects of Federal pay increase, 3.8 per cent per year.
Despite a fairly strong pickup in productivity in the past
two quarters and an associated moderation of the rise in unit labor
costs, price increases have continued at a disappointingly sharp
rate in the industrial sphere. The wage settlement in autos will
presumably be large and will likely set a pattern for upcoming
negotiations in such important industries as cans, aluminum and
steel. As a result, and reflecting also the likely reemergence of
some increases in food prices by next spring, we have adjusted up
II - 5
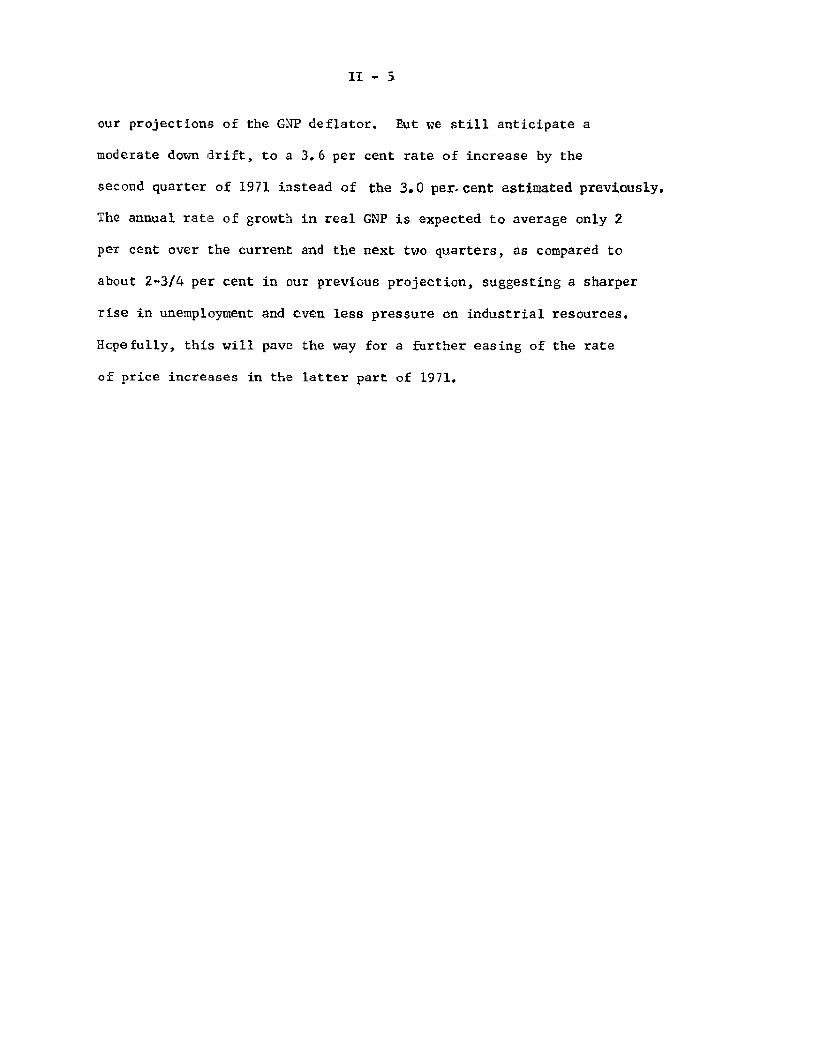
our projections of the GNP deflator. But we still anticipate a
moderate down drift, to a 3.6 per cent rate of increase by the
second quarter of 1971 instead of the 3.0 per-cent estimated previously.
The annual rate of growth in real GNP is expected to average only 2
per cent over the current and the next two quarters, as compared to
about 2-3/4 per cent in our previous projection, suggesting a sharper
rise in unemployment and even less pressure on industrial resources.
Hcpefully, this will pave the way for a further easing of the rate
of price increases in the latter part of 1971.
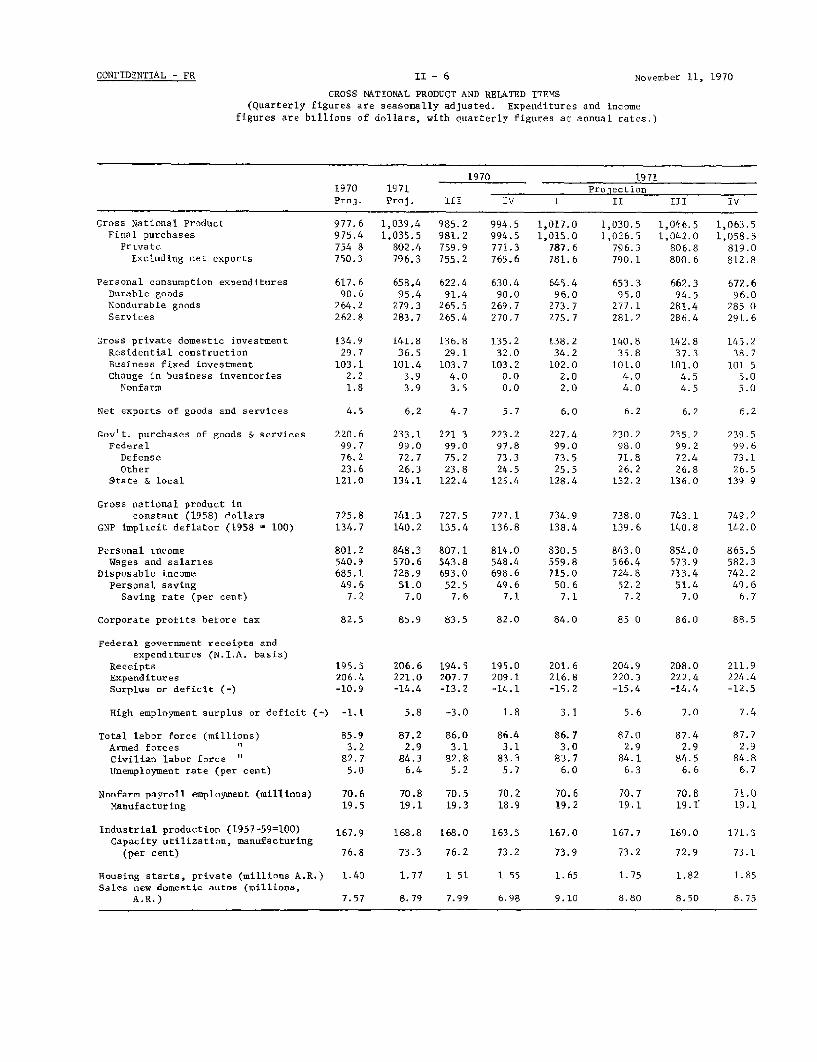
CROSS NATIONAL PRODUCT AND RELATED ITEMS(Quarterly figures are seasonally adjusted. Expenditures and income
figures are billions of dollars, with quarterly figures at annual rates.)
1970 19711970 1971 ProjectionProj. Proj. III IV I II III IV
Gross National ProductFinal purchases
PrivateExcluding net exports
Personal consumption expendituresDurable goodsNondurable goodsServices
Gross private domestic investmentResidential constructionBusiness fixed investmentChange in business inventories
Nonfarm
Net exports of goods and services
Gov't. purchases of goods & servicesFederal
DefenseOther
State & local
Gross national product inconstant (1958) dollars
GNP implicit deflator (1958 - 100)
Personal incomeWages and salaries
Disposable incomePersonal saving
Saving rate (per cent)
Corporate profits before tax
Federal government receipts andexpenditures (N.I.A. basis)
ReceiptsExpendituresSurplus or deficit (-)
977.6975.4754 8750.3
617.690.6
264.2262.8
134.929.7
103.12.21.8
4.5
220.699.776.223.6
121.0
1,039.41,035.5
802.4796.3
658.495.4
279.3283.7
141.836.5
101.43.93.9
985.2981.2759.9755.2
622.491.4
265.5265.4
136.829.1
103.74.03.5
994.5994.5771.3765,6
630.490.0
269.7270.7
135.232.0103.20.00.0
1,017.01,015.0
787.6781.6
645.496.0
273.7275.7
138.234.2
102.02.02.0
1,030.51,026.5
796.3790.1
653.395.0
277.1281.2
140.835.8
101.04,04.0
1,046.51,042.0
806.8800.6
662.394.5
281.4286.4
142.837.3
101.04.54.5
1,063.51,058.5
819.0812.8
672.696.0
285 0291.6
145.238.7
101 55.05.0
6.2 4.7 5.7 6.0 6.2 6.2 6.2
233.199.072.726.3
134.1
221 399.075.223.8
122.4
223.297.873.324.5
125.4
227.4
99.0
73.5
25.5
128.4
725.8 741.3 727.5 727.1 734.9134.7 140.2 135.4 136.8 138.4
801.2540.9685.1
49.67.2
848.3570.6728.9
51.07.0
807.1543.8693.0
52.57.6
814.0548.4698.649.6
7.1
830.5559.8715.050.67.1
82.5 85.9 83.5 82.0 84,0
195.5206.4-10.9
206.6221.0-14.4
194.5207.7-13.2
195.0209.1-14.1
201.6216.8-15.2
230.298.071.826.2
132.2
235.299.272.426.8
136.0
239.599.673.126.5
139 9
738.0 743.1 749.2139.6 140.8 142.0
843.0566.4724.852.27.2
854.0573.9733.4
51.47.0
865.5
582.3
742.2
49.6
6.7
85 0 86.0 88.5
204.9220.3-15.4
208.0222.4-14.4
211.9224.4-12.5
High employment surplus or deficit (-) -1.1 5.8 -3.0 1.8 3.1 5.6 7.0 7.4
Total labor force (millions)Armed forcesCivilian labor forceUnemployment rate (per cent)
Nonfarm payroll employment (millions)
Manufacturing
Industrial production (1957-59=100)Capacity utilization, manufacturing
(per cent)
Housing starts, private (millions A.R.)Sales new domestic autos (millions,
A.R.)
85.9 87.2 86.0 86.4 86.73.2 2.9 3.1 3.1 3.082.7 84.3 82.8 83.3 83.75.0 6.4 5.2 5.7 6.0
70.6 70.8 70.5 70.2 70.619.5 19.1 19.3 18.9 19.2
167.9
76.8
1.40
7.57
168.8 168.0 163.5 167.0
73.3 76.2 73.2 73.9
1.77 1 51
8.79 7.99
1 55 1.65
6.98 9.10
87.0 87.4 87.72.9 2.9 2.9
84.1 84.5 84.86.3 6.6 6.7
70.7 70.8 71.019.1 19. 19.1
167.7 169.0 171.5
73.2 72.9 73.1
1.75 1.82 1.85
8.80 8.50 8.75
CONFIDENTIAL - FR II - 6 November 11, 1970

II - 7
CHANGES IN GROSS NATIONAL PRODUCTAND RELATED ITEMS
November 11, 1970
1970 1971
1970 1971 ProjectionProj. Proj. III IV I II III IV
---------------------- Billions of dollars----------------------
Gross National ProductInventory changeFinal purchases
PrivateExcluding net exportsNet exports
Government
GNP in constant (1958) dollarsFinal purchases
Private
46.2-6.352.544.141.5
2.68.4
61.81.7
60.147.646.0
1.712.5
-1.3 15.5 2.64.1 13.8 2.49.5 15.1 2.4
-0.4 7.83.0 5.93 5 6.8
--------------------- In per cent per year---------------------
Gross National Product
Final purchases
Private
Personal consumption expendituresDurable goodsNondurable goodsServices
Gross private domestic investmentResidential constructionBusiness fixed investment
Gov't. purchases of goods & servicesFederal
DefenseOther
State & local
GNP in constant (1958) dollars
Final purchasesPrivate
GNP implicit deflator
Personal incomeWages and salaries
Disposable income
Corporate profits before tax
Federal government receipts and
expenditures (N.I.A. basis)
ReceiptsExpenditures
Nonfarm payroll employmentManufacturing
Industrial productionHousing starts, privateSales new domestic autos
6.9 6.6 5.2 5 1 9.5 4.9 5.5 6.20.7 5.3 -2.2 -6.1 26.7 -4.2 -2.1 6.37.5 5.7 4.4 6.3 5.9 5.0 6.2 5.18.8 8.0 8.5 8.0 7.4 8.0 7.4 7.3
-3.5 5.1 7.4 -4.7 8.9 7.5 5.7 6.7-7.2 22.9 9.9 39.9 27.5 18.7 16.8 15.03.8 -1.6 3.5 -1.9 -4.6 -3.9 0.0 2.0
3.4-4.8
-10.111.8
9.8
-0.2 2.10.6 1.91.7 2.65.1 4.1
1.4 -0.2 4.31.3 1.7 3.21.7 2.4 4.61/4.4 4.0 4.7 -
6.0 5.24.7 5.35.5 4.7
-9.5 7.5 7.3 -7.2 9.8 4.8 4.7 11.6
-2.5 5.7 -4.5 1.0 13.5 6.5 6.0 7.57.9 7.1 -6.1 2.7 14.7 6.5 3.8 3.6
0.4 0.3 -1.9 -1.7 2.3 0.6 0.6 1.1-3.5 -2.1 -5.9 -8.3 6.3 -2.1 0.0 0.0
-3.1-4.6
-10.6
0.5 -3.1 -10.826.4 68.4 12.513.5 2.0 -50.5
8.625.0
121.6
1.7 3.124.2 17.1
-13.2 -13.6
it Exldn fet fFeea a nrae 38prcn e er
CONFIDENTIAL-FR
If Excluding effects of Federal pay increase, 3.8 per cent per year.

II - 8
Industrial production. Industrial production in October
is tentatively estimated to have declined about 4 points or about
2-1/2 per cent to an index level of around 162 per cent, as compared
with the preliminary September figure of 166. At 162, the total
index would be 6.5 per cent below a year earlier and 7.2 per cent
below the July 1969 high. As indicated in the table, the October
decline in the nonautomotive sector of the index is estimated to have
been larger than in September.
INDUSTRIAL PRODUCTION1957-59=100, Seasonally adjusted
Total index
Motor vehicles & partsAll other
August
168.9
164.1169.0
Total index -.3
Motor vehicles & parts .0
Auto supplying industries e -.0
All other -,3
e - estimated
p - preliminary
1970
September p October e
166.0 162.0
128.8 100.0167.7 165.0
Change in points in totalindex from previous month
-2.9 -4.0
-1.5 -1.4-. 4 - .7- .9 -1.9
Because of the GM strike, auto assemblies declined further
in October to an annual rate of 4.0 million units. Production of
furniture, appliances, and television sets was maintained at about
the September level. Output of apparel probably eased off in October
but this may have been offset by a rise in consumer staples. Output

II - 9
of business and defense equipment declined further in October as
did production of most materials--steel, nonferrous metals,
chemicals, paper, and rubber.
In 1964, the strike against GM. was settled in the last
week of October and the rise in the motor vehicle and parts index
amounted to 2.2 points in the total index for November and an
additional 1 point in December.
Retail sales. Retail sales in October declined 1.5 per
cent from September, according to estimates based on reports for the
five weeks through October 31. Sales of automotive stores dropped
about 16 per cent, largely reflecting the GM strike. Excluding the
automotive sector, retail sales were indicated to be upabout 1.5
per cent in October following a period of little change since April.
Among durable goods stores, furniture and appliance sales
are estimated to have increased 6 per cent in October for the first
sizable improvement in six months. Sales of nondurable goods stores
apparently increased 1.5 per cent, with all major categories except
food reporting higher sales. Sales of general merchandise stores
may have increased close to 2 per cent.

II - 10
SALES OF RETAIL STORES, 1970
July Aug. Sept. Oct.*
----- (Billions oi $)---
July Aug. Sept. Oct.*
-- Per cent change from--previous month
All stores
Total, excluding auto
Durable goodsAutoFurniture & appliance
NondurableFoodGeneral merchandise
* Estimated on the basis o
30.8 30. 7
25.3 25.2
9.5 9.55.5 5.51.4 1.4
21.2 21.36.8 6.85.2 5.2
f reports for
30.8 30.3 .7 .2 .1
25.2 25.6 .6 .3 .4
9.5 8.7 .8 .2 .55.6 4.7 1.1 -. 4 2.21.3 1.4 -1.3 ,3 -3.6
21.3 21.6 .6 .2 - .16.8 6.7 -1.0 .9 .45.2 5.4 2.7 -1.1 1.0
the five weeks ending October 31.
Autos. Sales of new domestic autos declined further in
October and were at a seasonally adjusted annual rate of 6.1 million
units, 13 per cent below September and 27 per cent below a year earlier.
The decline in sales was primarily due to the GM strike, as
indicated by the table.
UNIT AUTO SALES(Seasonally Adjusted, Per cent change)
September 1970 October 1969to to
October 1970 October 1970
-33 -5615 4
AlM .All other
-1.5
1.5
-8.0-16.06.0
1.5-1.5
2.0

II - 11
Stocks of new domestic autos at the end of October were
17 per cent below a month ago and 27 per cent below a year earlier.
Because of the decline in sales, the days supply continued high and
was the same as a year earlier, 61 days.
Sales of foreign cars rose sharply in October to a new high
from the reduced September rate,when Volkswagen sales declined 37
per cent because of shortages, and, at an annual rate of 1.3 million
units were 10 per cent above a year earlier.
Consumer credit. Consumer instalment credit outstanding
rose at a seasonally adjusted annual rate of $4.3 billion in September;
for the third quarter as a whole the rate was $4.1 billion--compared
with $4.6 billion in the second quarter and $4.0 billion in the first
quarter. The increase in September was centered in personal loans
and nonautomotive consumer goods, although automobile credit, which
had declined in July and August, rose slightly. For the third
quarter as a whole the reduction in auto credit was the largest for
any quarter since the third quarter of 1961.
Both extensions and repayments of instalment credit reached
new highs during the third quarter but the September figures for
these series were below the peak levels recorded in July. Extensions
of auto credit, relative to retail sales of the automotive group,
declined 2 percentage points from July to September (from 49.3 per
cent to 47.3 per cent) and the ratio of credit extensions for non-
automotive consumer goods to GAF sales eased slightly (37.4 per cent
to 37.0 per cent) in this two-month period.

II - 12
NET CHANGE IN CONSUMER INSTALMENT CREDIT OUTSTANDING(Billions of dollars, seasonally adjusted annual rates)
Other Home repairconsumer Personal and
Total Automobile goods loans modernization
1969--QI $8.3 $2.7 $2.5 $3.0 $ .2QII 9.6 3.1 2.9 3.2 .4QIII 7.7 1.9 2.6 3.1 .0QIV 6, 2.0 2.4 2.6 - .2
1970--QI 4.0 .0 2.4 1.7 .0QII 4.6 .2 2.3 1.9 .1QIII 4.1 - .6 2.4 2.1 .1
Census consumer purchase and income expectations. The
October Census Survey can be interpreted as suggesting that house-
holds probably will not be expanding non-essential purchases soon.
There was a decrease in households reporting current income higher
than a year earlier and the percentage of households expecting
substantial decreases in income remains relatively high. Buying
plans for new cars declined but purchase plans for houses increased
further -- however, the Census Bureau does not believe either change
was statistically significant.

II - 13
SELECTED SURVEY RESULTS(Seasonally adjusted)
1969 1970October January April J
Index of Expected Unit Purchases in the Next Year(January - April 1967 = 100)
uly October
All Households:New carsHouses
103.196.7
Actual and Exoected
106.093. 6
Chanees in
105.827.9
Income
105.8 103.892.9 95.6
All Households:Per cent reporting highercurrent income compared toa year earlier 37.4
Per cent reporting lowercurrent income compared toa year earlier 11.1
Probability of substantialfuture decrease in income* 6.0
* This is the average chance in 100 whichsubstantial future decrease in income.
35.4
11.3
41.3 39.9 37.3
12.4 13,0 13,6
6.3 7.0
all respondents
7.3
assign
7.3
to a
Inventories. Growth in book value of manufacturers'
inventories slowed further in September, according to preliminary
data. The August rate, however, was revised up to $2.7 billion
from the $1 billion originally reported. Book values declined in
September at durable goods manufacturers; the strike-related
decline at motor vehicle plants was at a $2.1 billion annual rate
and was largely offset by increases elsewhere, notably at con-
struction materials industries. Manufacturers of household durables
cut back their stocks, which still remained heavy relatively to
their order backlogs.
- -- -----..-- ,-- --
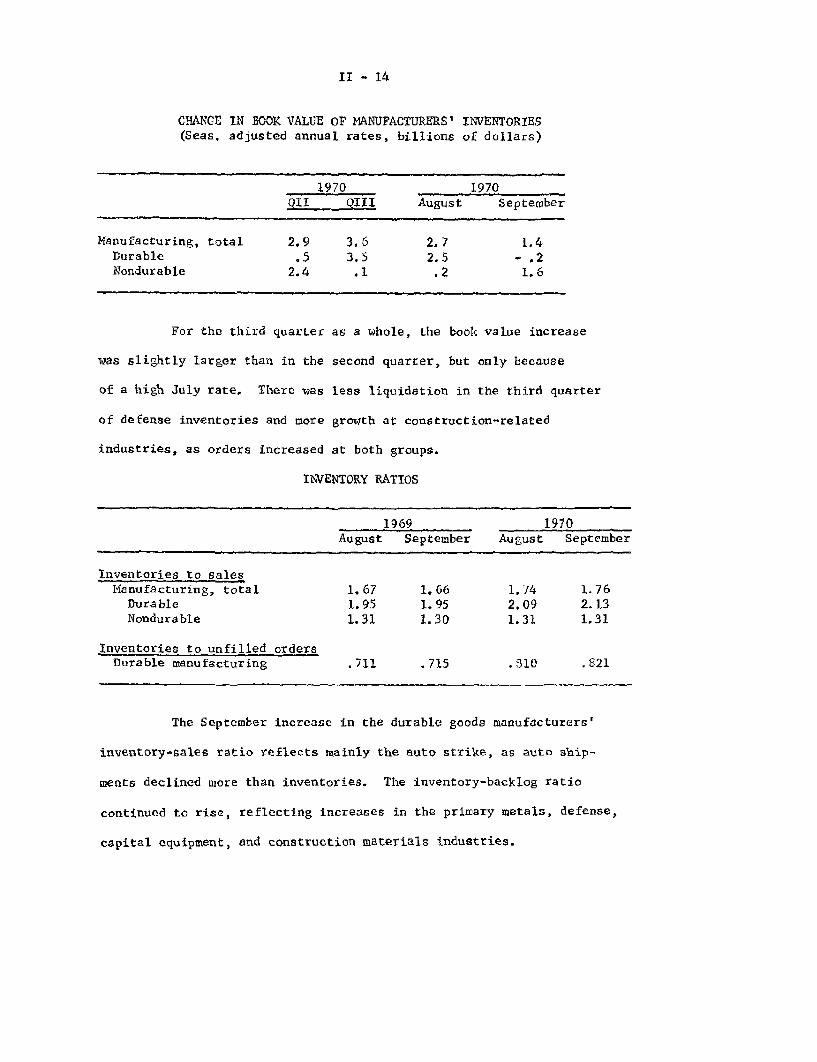
II - 14
CHANGE IN BOOK VALUE OF MANUFACTURERS' INVENTORIES(Season adjusted annual rates, billions of dollars)
1970 1970QII III August September
Manufacturing, total 2.9 3,6 2.7 1.4Durable .5 3.5 2.5 - .2Nondurable 2.4 .1 .2 1.6
For the third quarter as a whole, the book value increase
was slightly larger than in the second quarter, but only because
of a high July rate. There was less liquidation in the third quarter
of defense inventories and more growth at construction-related
industries, as orders increased at both groups.
INVENTORY RATIOS
1969 1970August September August September
Inventories to salesManufacturing, total 1.67 1.66 1.74 1.76
Durable 1.95 1.95 2.09 2.13Nondurable 1.31 1.30 1.31 1.31
Inventories to unfilled ordersDurable manufacturing .711 .715 .310 .821
The September increase in the durable goods manufacturers'
inventory-sales ratio reflects mainly the auto strike, as auto ship-
ments declined more than inventories. The inventory-backlog ratio
continued to rise, reflecting increases in the primary metals, defense,
capital equipment, and construction materials industries.

II - 15
Dealer sales of domestic new autos also declined more than
their stocks and their stock-sales ratio, still high by historical
standards, rose further, affected by both the strike and by the late
model changeover dates.
Manufacturers' new orders. New orders for durable goods
declined 3 per cent in September, according to preliminary data. In
addition to the decline in motor vehicles there was a drop in orders
for capital equipment from an upward-revised August level. Defense
orders increased, reflecting the placing of large shipbuilding orders.
Orders for the "all other" group also rose, mainly as a result of
increases at construction materials industries, and orders for
household durables strengthened.
MANUFACTURERS' NEW ORDERS(Seasonally adjusted montlhy averages, billions of dollars)
Durable goods, total
Primary metalsIron and steelOther primary metals
Motor behicles and partsHousehold durable goodsDefense productsCapital equipmentAll other durable goods
Nondurable goods, total
NOTE: Detail may not add
1969Q III
Q III Q II prel.
31.5 29.5 30.5
5.2 4.8 4.82.6 2.2 2.32.7 2.7 2.5
4.6 3.9 4.12.3 2.1 2.11.8 1.7 2.38.6 8.2 8.38.9 8.8 9.0
24.5 25.3 25.6
to totals because of
1970
August
30.5
4.82.32.5
4.42.01.88.58.9
25.4
rounding.
SeptemberSeptemberprel.
29.6
4.72.32.4
3.62.12.08.19.2
25.6
- -
~--~

II - 16
For the third quarter as a whole, orders for most groups
were above their second-quarter levels; but capital equipment orders
were little changed, and the average for this group was 5.5 per cent
below its peak reached in the fourth quarter of last year. Defense
orders increased sharply in the third quarter, bringing the six-month
average for this group to a level 12 per cent above a year earlier.
The durable goods order backlog was down further in September,
by more than I per cent. Declines in unfilled orders were fairly wide-
spread, but were particularly sharp at both ferrous and nonferrous
primary metals industries.
Cyclical indicators. In September, the preliminary composite
leading indicator dropped 1 per cent, to a level below its most recent
low point last May. The August decline, originally reported at 0.4
per cent, was revised down and is now also a drop of 1 per cent. The
coincident composite declined 0.9 per cent in September to well below
its May low, and the lagging composite increased 1.2 per cent to a new
high. The September declines in the leading and coincident composite
indicators and the September rise in the lagging composite were all
caused, to a considerable extent, by the auto strike.

II - 17
COMPOSITE CYCLICAL INDICATORS(1967 = 100)
12 Leading
Trend Adjusted 5 Coincident 6 Lagging
1970:April 114.9 122.1 130.6May 113.6 121.2 130.7June 114.1 121.3 130.6
July 115.8 121.4 130.7August 114.6 121.1 131.7Sept. (Prel.) 113.4 120.0 133.3 (H)
(H) Current high value.
Leading indicators contributing to the September decline
were the manufacturing workweek, unemployment insurance claims, new
orders for durable goods, industrial materials prices, and the ratio
of price to unit labor cost. There were increases in common stock
prices, housing permits, and contracts and orders for plant and
equipment. This last series would have declined, however, except
for a sharp increase in defense shipbuilding orders.
In October, according to preliminary data, upward
influences on the leading composite may be provided by common stock
prices, the workweek, and unemployment claims, while industrial
materials prices declined.
Construction and real estate. Seasonally adjusted value
of new construction put in place, which in September had about
matched its April 1969 high, continued upward in October for the fifth
consecutive month. The annual rate of $93.7 billion was a new peak in

II - 18
current dollars, 3 per cent higher than a year earlier. However,
it was 4 per cent lower than a year earlier after allowance for cost
increases as measured by the Census Bureau.
Residential outlays--bolstered by the appreciably improved
rate of housing starts in recent months--continued to dominate the
over-all advance. On a current dollar basis in October, they were
more than a tenth above their low of last May, although still
moderately short of their peak in April of 1969. Outlays for private
nonresidential construction also were estimated to have increased from
September, to a rate about 4 per cent under the high reached last
March. Reflecting mainly a decline in outlays for Federally owned
projects, public construction expenditures edged off in October, but
remained relatively near the high established in April 1969.
NEW CONSTRUCTION PUT IN PLACE(Confidential FRB)
October 1970 Per cent change from($ billions) 1/ September 19701 October 1969
Total 93.7 +1 +3
Private 65.1 +2 +2Residential 31.6 +3 +8Nonresidential 33.5 +1 -2
Public 23.6 -1 +5Federal 3.4 -5 -2State and local 25.2 -- +7
1/ Seasonally adjusted annual rates; preliminary. Data for the mostrecent month (October) are confidential Census Bureau extrapolations.In no case should public reference be made to them.

II - 19
Sales of new homes by merchant builders rose further in
September and, at a seasonally adjusted annual rate of 566,000
units, were the highest since early 1966. Reflecting a continuing
shift in the sales mix toward smaller and less expensive houses, the
median price of homes sold dropped again, to $22,500, as much as
13 per cent below a year earlier and the lowest since late 1967.
By contrast, prices of homes being held for sale by builders remained
little changed at a median level of $27,100. And in the market for
used homes, the median price of the units actually sold was $23,100
in September; this was 6 per cent above a year earlier, the same
as the average year-to-year increase in the first nine months as
a whole.
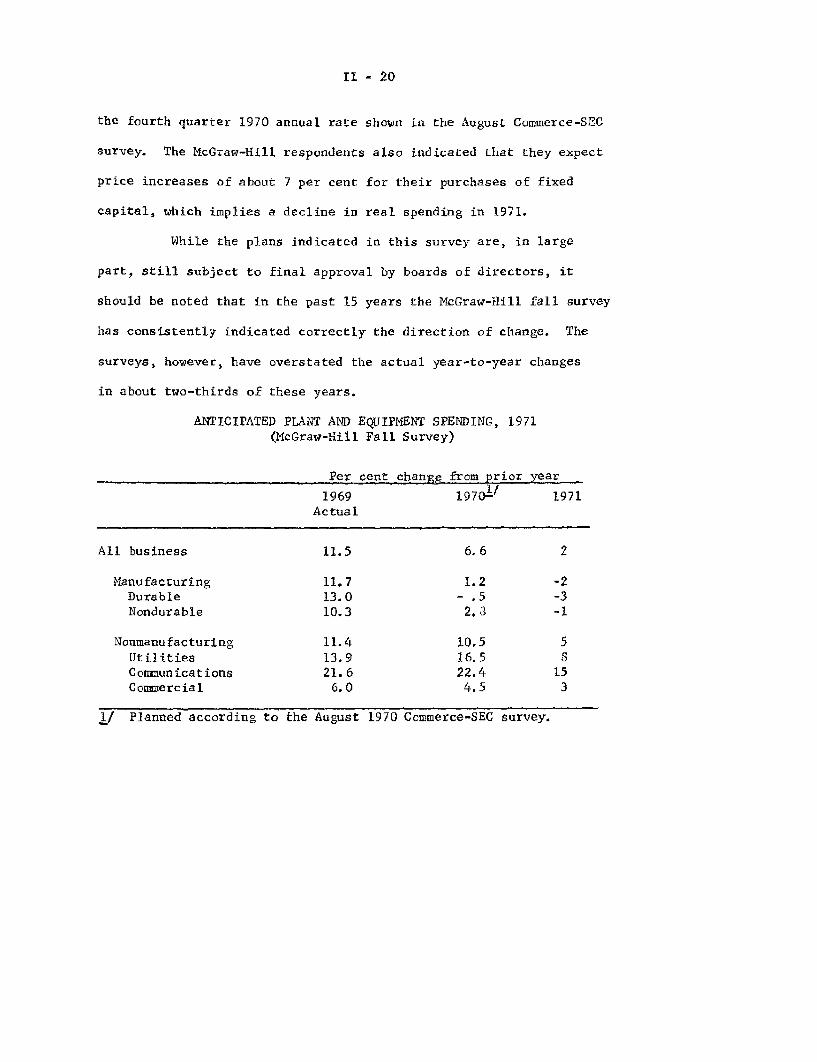
Anticipated plant and equipment spending. The McGraw-Hill
fall survey of business plans for new plant and equipment expenditures
in 1971 indicates that such spending will be up about 2 per cent
from 1970. (The Commerce-SEC August survey indicated an increase in
1970 of about 6.5 per cent.) Manufacturers expect spending on new
plant and equipment in 1971 to decline 2 per cent; relatively large
percentage cutbacks are indicated by producers of primary metals,
aircraft, other non-auto and nonaircraft transportation equipment,
rubber, paper, and nonelectric machinery. Nonmanufacturing outlays
are expected to rise about 5 per cent, mainly as the result of large
increases in communications and electric utilities spending. Overall,
these anticipated expenditures for 1971 are at about the same level as
II - 20
the fourth quarter 1970 annual rate shown in the August Commerce-SEC
survey. The McGraw-Hill respondents also indicated that they expect
price increases of about 7 per cent for their purchases of fixed
capital, which implies a decline in real spending in 1971.
While the plans indicated in this survey are, in large
part, still subject to final approval by boards of directors, it
should be noted that in the past 15 years the McGraw-Hill fall survey
has consistently indicated correctly the direction of change. The
surveys, however, have overstated the actual year-to-year changes
in about two-thirds of these years.
ANTICIPATED PLANT AND EQUIPMENT SPENDING, 1971(McGraw-Hill Fall Survey)
Per cent change from prior year
1969 1970- 1971Actual
All business 11.5 6.6 2
Manufacturing 11.7 1.2 -2Durable 13.0 - .5 -3Nondurable 10.3 2.3 -1
Nonmanufacturing 11.4 10,5 5Utilities 13.9 16.5 8Communications 21.6 22.4 15Commercial 6.0 4.5 3
1/ Planned according to the August 1970 Commerce-SEC survey.

II - 21
Labor market. The labor market has eased further, with
the strike at General Motors accounting for much of the softening.
Nonfarm payroll employment fell by 480,000 in October, reflecting a
sharp decline in factory employment. The unemployment rate edged up
to 5.6 per cent at mid-month from 5.5 per cent in September, and
insured unemployment continued to rise through month's end.
Employment and hours. Employment in manufacturing fell
by 609,000 in October, with all but 12,000 of the drop occurring
among production workers. Compared to a year earlier, manufacturing
employment was down more than 1.5 million, with about 175,000 of the
drop occurring among nonproduction workers.
The General Motors strike was directly responsible for
close to two-thirds of the October drop in manufacturing jobs, with
the remaining decline reflecting both secondary layoffs at supplier
firms and some further general easing of demand for factory labor.
There were reductions of employment in all durable goods manufacturing
industries, totaling 525,000. Employment declined by 85,000 in the
nondurable goods industries, with the largest reductions in food,
rubber, apparel and textiles.
The average factory workweek, at 39.4 hours in October,
was up only slightly from the 39.3 hours of September, when it reached
its lowest level since the 1960-61 recession. Some firms probably
were on short workweeks because of the auto strike.

II - 22
Employment rose moderately in nonmanufacturing industries
in October, and September estimates were revised up substantially,
especially in services. Private nonmanufacturing employment now
shows increases in excess of 100,000 in September and also in October.
Total payroll employment now shows a rise of 200,000 in September;
preliminary estimates had shown no change in total nonfarm employ-
ment.
CHANGES IN NONFARM PAYROLL EMPLOYMENT, 1970(Seasonally adjusted, in thousands)
July August September October
Total -42 -173 196 -481
Government 32 5 51 19Private -74 -178 145 -500
Manufacturing -75 -131 27 -609Nonmanufacturing 1 -47 118 109
Unemployment. Unemployment rates for adult men rose in
October, after showing signs of leveling off over the summer, while
rates for younger workers and women held near the high September
levels. In durable-goods manufacturing industries, the jobless rate
rose sharply to 7.1 per cent in October from 6.3 per cent in
September. The rise was partly due to secondary layoffs resulting
from the General Motors strike; it was heavily concentrated among
semi-skilled operatives. Insured unemployment continued to move higher
through month's end, suggesting a widening impact of the GM strike
and the likelihood of a further rise in the total unemployment rate
in November.

II - 23
SELECTED UNEMPLOYMENT RATES(Seasonally adjusted)
1970Q I Q II Q III September October
Total 4.1 4.8 5.2 5.5 5.6
Men:20 to 24 6.5 7.6 9.5 11.0 11.325 years and over 2.2 2.8 3.0 3.0 3.2
Women aged 20 and over 4.1 4.7 5.0 5.1 5.1Teenagers 13.7 14.9 15.6 168, 17.1
Whites 3 . 4.4 4.9 5,1 5.2Negroes 6.8 8.4 8.5 9,0 9.3
Insured unemployed 2.6 3.5 3.3 4,2 4.4

II- 24
Productivity. Productivity growth quickened in the third
quarter. Judging by preliminary GNP data, output per manhour rose
at an annual rate of nearly 5 per cent in the private nonfarm sector,
as employment and hours were cut while output rose modestly. This
was the second sizable quarterly advance in productivity after five
quarters of downdrift. With productivity advancing more rapidly,
unit labor costs continued to rise more moderately. In the second
and third quarters together, the increases were at the lowest rate
since mid-1967. However, unit labor costs are still running about
5-1/2 per cent higher than a year ago, compared to an average rise
of 6-1/2 per cent in 1969.
COMPENSATION, PRODUCTIVITY AND UNIT LABOR COSTSPrivate Nonfarm Sector
Compensation Output per Unit Labor
per manhour manhour CostsPer cent change from previous
quarter, annual rate
1969: QIII 7.3 .6 6.6QIV 7.7 .3 7.3
1970: QI 6.6 -2.9 9.8QII 5.9 3.9 1.9QIII 7.8 4.8 2.9
Per cent change from ayear earlier
1968 7.3 2.9 4.3
1969 6.7 .3 6.4
1970: QI 6.8 - .6 7.5QII 6.9 .5 6.4QIII 7.0 1.5 5.4

II - 25
Industrial relations and wages. General Motors and the
UAW stepped-up their bargaining sessions and agreed to a news
blackout at the end of October in an apparent effort to reach an
early agreement on national issues.
The General Motors settlement will provide the basis for
contracts negotiated by the other automobile companies and will be
an important factor in settlements in the farm and construction
equipment industry. It will also influence settlements in major
negotiations involving about 1.5 million workers in the can,
aluminum, aerospace and steel industries in 1971.
Wage rates increases provided in contract settlements
concluded during the third quarter in private nonfarm industries
were somewhat smaller than during the second quarter, but were
significantly larger than in 1968 and 1969. Most of the slowdown
was in the nonmanufacturing sector outside of the construction
industry. In manufacturing settlements, first-year wage increases
continued to rise rapidly, averaging 9 per cent in the third quarter
compared with 8 per cent in 1969 and 7 per cent in 1968.
The Board appointed by the President to avert a threatened
strike of over 400,000 members of four railroad unions this fall
submitted its recommendation for a wage settlement which would
provide wage rate increases averaging about 11 per cent a year over
the life of the three-year contract. This about in line with
increases negotiated in major nonmanufacturing contracts settled
this year. If the proposals are accepted the unions are free to
strike on December 10.

II - 26
Inflationary anticipations continued to play a large role
in recent contract settlements. Wage increases provided in the second
and third years of long-term contracts were somewhat larger than in
1969, and considerably larger than in 1968. These large deferred
wage raises are laying the groundwork for continuing pressures on
unit labor costs in unionized industries in 1971 and 1972, regardless
of demand conditions.
WAGE RATE ADJUSTMENTS IN MAJOR COLLECTIVEBARGAINING SETTLEMENTS
19701968 1969 I II III
All private nonfarm industriesAverage over life of contract: 5.9 7.6 7.7 10.6 9.7
First year 7.4 9.2 10.2 15.4 13.1Average 2nd and 3rd year
increases: 5.2 6,8 6.5 8.2 8.0
ManufacturingAverage over life of contract: 5.2 6.0 5.5 6.6 6.9
First year 7.0 7.9 8.2 8.4 9.0Average 2nd and 3rd year
increases: 4.3 5.1 4,2 5.7 5.9
ConstructionAverage over life of contract: 8.6 13.1 13.1 14.6 16.0
First year 8.7 13.1 15.5 18.2 22.1Average 2nd and 3rd year
increases: 8.5 13.1 11.9 12.8 13.0
1/ Covers settlements affecting 1,000 workers or more.
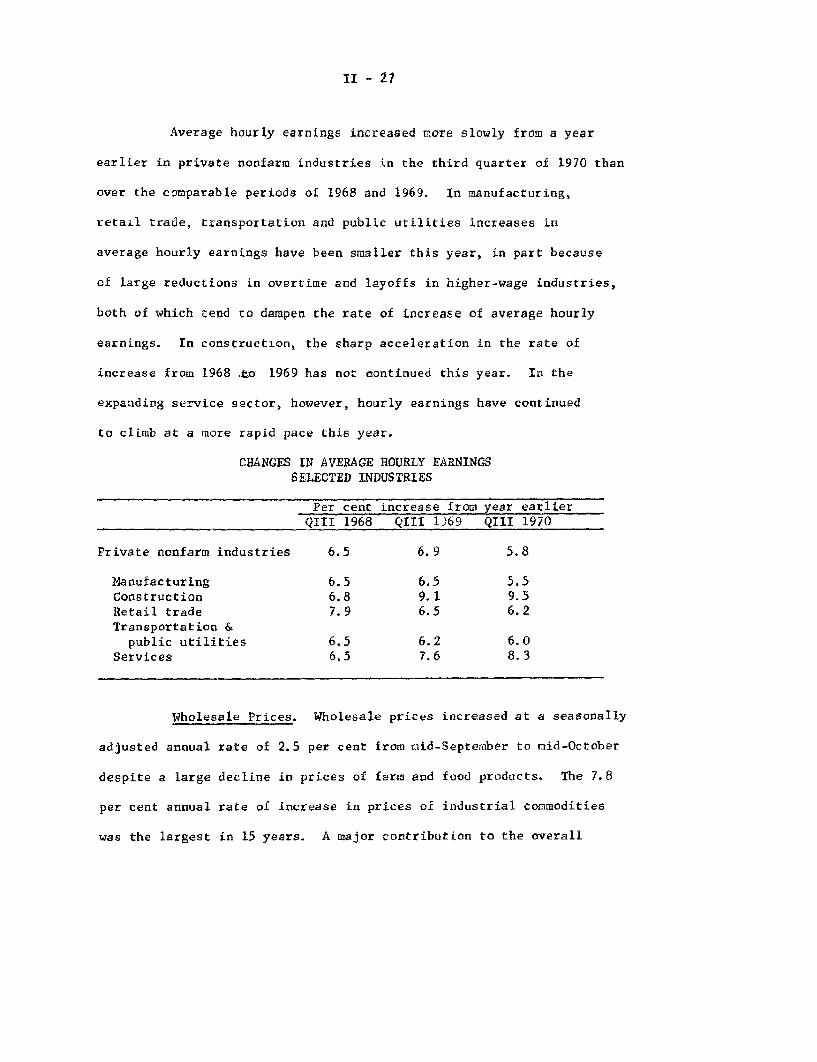
II - 27
Average hourly earnings increased more slowly from a year
earlier in private nonfarm industries in the third quarter of 1970 than
over the comparable periods of 1968 and 1969. In manufacturing,
retail trade, transportation and public utilities increases in
average hourly earnings have been smaller this year, in part because
of large reductions in overtime and layoffs in higher-wage industries,
both of which tend to dampen the rate of increase of average hourly
earnings. In construction, the sharp acceleration in the rate of
increase from 1968 to 1969 has not continued this year. In the
expanding service sector, however, hourly earnings have continued
to climb at a more rapid pace this year.
CHANGES IN AVERAGE HOURLY EARNINGSSELECTED INDUSTRIES
Per cent increase from year earlierQIII 1968 QII 1)69 QIII 1970
Private nonfarm industries 6.5 6.9 5.8
Manufacturing 6.5 6.5 5.5Construction 6.8 9.1 9.5Retail trade 7.9 6.5 6.2
Transportation &public utilities 6.5 6.2 6.0
Services 6.5 7.6 8.3
Wholesale Prices. Wholesale prices increased at a seasonally
adjusted annual rate of 2.5 per cent from mid-September to mid-October
despite a large decline in prices of farm and food products. The 7.8
per cent annual rate of increase in prices of industrial commodities
was the largest in 15 years. A major contribution to the overall

II - 28
increase was a much larger than seasonal rise in prices of new-model
automobiles, but large increases were also reported for fuels, machinery,
chemicals, and pulp and paper.
It now appears that the 1970 (December 1969 to December 1970)
rise in prices of industrial commodities will approximate the 3.9
per cent advance of 1969, with little slowing, if any, between the
first and second halves of the year. The widespread October rise in
prices of industrial commodities (nearly one-half of the 228 industrial
product classes posted price increases) will offset several months
of relatively slow increases. However, farm and food products are
expected to show little change compared with the large increase of
1969, so that the rise in the overall average this year is likely to
be less than 3 per cent compared with 4-3.4 per cent last year.
WHOLESALE PRICES(Seasonally adjusted percentage changes at annual rates)
Dec 1969 June 1970 Aug 1970 Sept 1970to to to to
June 1970 Sept 1970 Sept 1970 Oct 1970All commodities 2.6 3.9 5.8 2.5
Farm & food products -1.9 8.9 16.5 -14.7
Industrial commodities 3.8 2.9 3.4 7.8
1/Transportation equipment / 11.7 1.2 3.5 68.4Fuels & related product & power- 4.8 9.1 16.5 18.7Machinery and equipment- 3.6 3.9 4.9 6.9Hides, skins, leather, & related
products 1/ 1/ 1.3 0.0 1.9 5.8Chemicals and allied products- 3.5 1.6 -2.3 6.1Pulp, paper, & allied products- / 5.0 0.7 1.1 6.6Lumber & wood products 1/ -3.7 0.7 2.0 -11.3
1/ Not seasonally adjusted.

II - 29
Price increases for 1971-model passenger cars averaged 5.9
per cent and accounted for about half of the unadjusted rise of 0,8
per cent in industrial commodities in October. Advances in the prices
of fuels and power, machinery, and chemicals accounted for most of the
remaining increase. Agricultural and industrial machinery increased
sharply. Price delcines were reported for lumber and wood products,
textiles and apparel, and some paper products.
Prices of metal products rose in October, despite a decline
in nonferrous metals for the fifth consecutive month. Most nonferrous
metals are now substantially below levels at mid-year, but aluminum
producers have thus far maintained the price of aluminum ingots by cutting
back production. Ferro-alloys increased in October, and a recent
rise in the U.S. dollar price of nickel (which is largely imported
from Canada) was posted by the International Nickel Company of Canada
to compensate for the rise in the value of the Canadian dollar resulting
from the new floating exchange rate policy.
PRICES OF SELECTED METAL AND METAL PRODUCTS(Percentage changes at annual rates)
Dec 1968 June 1969 Dec 1969 June 1970 Sept 1970to
June 1969Metals and metal products 9.2
Iron and steel 8.1Steel mill products 6.9Foundry and forge shop
products 3.6Pig iron and ferroalloys-2.7Iron and steel scrap 50.6
Nonferrous metals 20.4Aluminum ingot 7.9Copper ingot 20.4Copper ingot (foreign) 54,3Lead 33.1Zinc (prime Western) 14.9Mill shapes 5.5Wire and cable 20.8
to
Dec 196910.3
6.66.5
2.212.124.222.79.4
28.434.113.813.819,623.6
toJune 1970
8.7
11.49.9
7. 111.445.16.67.3
32.0-19.4
6.40.04.3
22.6
to toSept 1970 Oct 1970
- 1.2
2.32.6
5.930. 3
-15.5-16.0
0.0- 0.2-50.3-36.2-12. 1-14.6- 6.2
2.8
7.27.1
19.626.8
-22.1- 7.00.00.0
-48.30.00.0
- 1.8- 0.7
47.3 34.7 -23.9 -38.5 -15.4Nonferrous scrap

II - 30
Steel mill product Prices are continuing to rise, as costs
reflect large increases for metallurgical grade coal, pig-iron, and
alloys, as well as for wage rates. Ferrous scrap prices have fallen
sharply as a result of the General Motors strike but are still above
a year earlier. Steel prices are generally expected to continue on an
upward trend.
Since the October pricing date, domestic producers have cut
the price of copper ingots by 4 cents per pound, or nearly 7 per cent. The
reduction was the first since January 1961 and stemmed largely from
drastically-reduced prices of imported copper; the cut in the ingot
price has been reflected in the prices of fabricated products.
Wholesale prices of livestock and meat have declined steadily
since July, primarily as a result of increased supplies of hogs and
pork. Livestock prices were about 11 per cent lower in mid-October
than in mid-July, while the price for hogs was down 28 per cent.
Meats declined 9 per cent over the same period, while the price of
pork dropped 17 per cent.
Consumer prices. In September consumer prices rose at a
seasonally adjusted annual rate of 6.5 per cent. Food and gasoline
prices rose, following declines in August, and there were substantial
increases for houses, cars, and apparel. However, the rate of rise
in the CPI over the three-month period ending in September--4.2 per
cent--was well below that for the preceding two quarters and for 1969.
The recent slowing in the pace of price increase is still
centered on food, although increases for apparel and household durables
goods have been less rapid this year than last. The decline in meat
II - 31
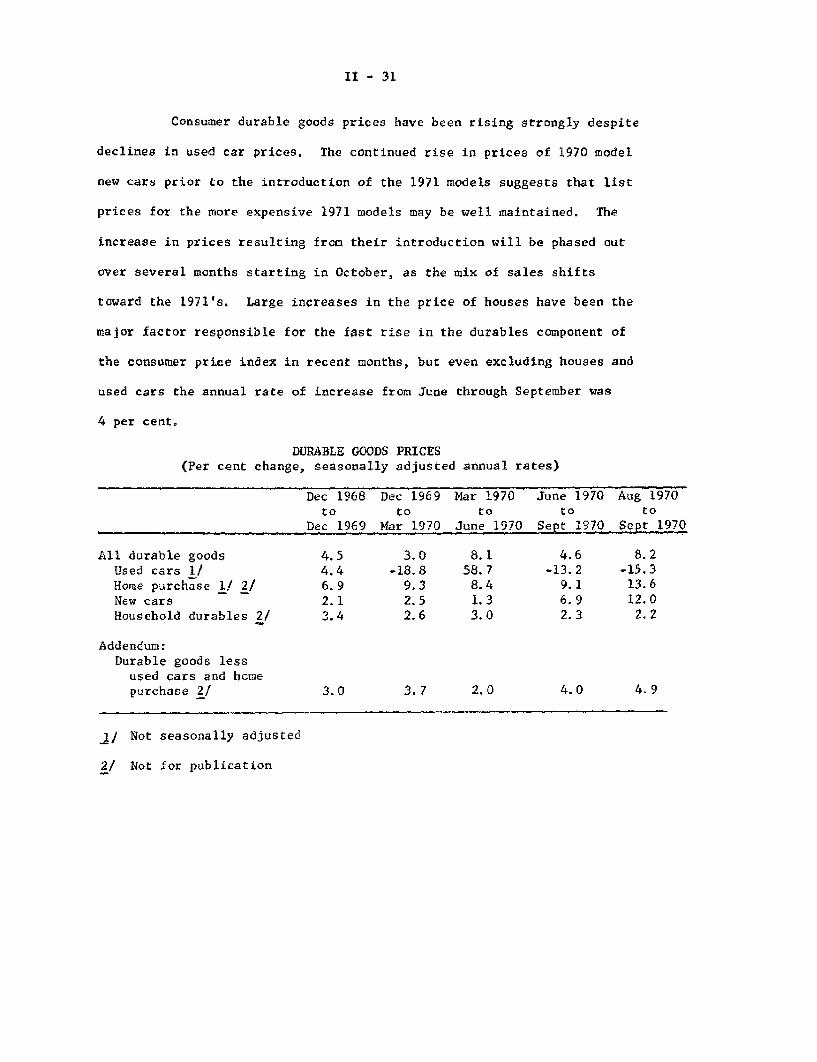
Consumer durable goods prices have been rising strongly despite
declines in used car prices. The continued rise in prices of 1970 model
new cars prior to the introduction of the 1971 models suggests that list
prices for the more expensive 1971 models may be well maintained. The
increase in prices resulting from their introduction will be phased out
over several months starting in October, as the mix of sales shifts
toward the 1971's. Large increases in the price of houses have been the
major factor responsible for the fast rise in the durables component of
the consumer price index in recent months, but even excluding houses and
used cars the annual rate of increase from June through September was
4 per cent.
DURABLE GOODS PRICES(Per cent change, seasonally adjusted annual rates)
Dec 1968 Dec 1969 Mar 1970 June 1970 Aug 1970to to to to to
Dec 1969 Mar 1970 June 1970 Sept 1970 Sept 1970
All durable goods 4.5 3.0 8.1 4.6 8.2Used cars 1/ 4.4 -18.8 58.7 -13.2 -15.3Home purchase 1/ 2/ 6.9 9.3 8.4 9.1 13.6New cars 2.1 2.5 1.3 6.9 12.0
Household durables 2/ 3.4 2.6 3.0 2.3 2.2
Addendum:Durable goods less
used cars and homepurchase 2/ 4.0 4.9
Not seasonally adjusted
Not for publication
Iii I

II - 32
prices at retail has been slow with retailers taking advantage of falling
pork prices to widen the spread over wholesale prices. According to
the Department of Agriculture, retail prices of pork in October had
fallen from October 1969 levels by less than 10 per cent, wholesale
prices by about 17.5 per cent, and farm prices by about 31 per cent.
However, meat prices did decline significantly in October, and further
declines are expected this month and next. Nevertheless, the favorable
effect of lower meat prices on the consumer food budget may be offset
by further rises in prices of other foods and in the cost of restaurant
meals and snacks.
CONSUMER PRICES(Per cent change, seasonally adjusted annual rates)
Dec 1968 Dec 1969 Mar 1970 June 1970 Aug 1970to to to to to
Dec 1969 Mar 1970 June 1970 Sept 1970 Sept 1970All items 6.1 6.3 5.8 4.2 6.5
Foods 7.2 5.4 1.3 1.4 4.2
Nondurable commoditiesless foods 4.5 2.5 4.7 3.6 6.3Apparel 5.3 2.4 3.5 4.1 7.6Other 4.0 3.0 5,3 3.5 3.6
Durables 4.5 3.0 8.1 4.6 8.2
Services 1/ 7.4 11.2 7.3 7.2 7.9Services less home
finance 1/ 2/ 6.0 7.9 6.2 7.0 7.4
1/ Not seasonally adjusted
2/ Confidential

II - 33
The rise in the cost of consumer services does not appear to
be moderating. However, in the estimates to be released for October,
the average increase is expected to be reduced by a downward adjustment
in medical service prices, for which the rise over the past year has been
over-estimated.
GNP deflators. The rate of price increase in the private
economy has been unchanged at close to a 5 per cent annual rate over
the past year, according to the deflator for the gross private product
estimated on a constant weight basis. This is contrary to the
impression conveyed by the implicit deflator for the GNP that the peak
rate of price rise was in the first quarter of this year.
Price rises for items of personal consumption, particularly
food, have moderated somewhat, but this has been offset by 'an apparent
acceleration in construction .
CHANGES IN THE GNP DEFLATOR(Per cent changes at annual rates)
TOTAL GNP PRIVATE GNPImplicit Implicit Fixed-weightdeflator deflator Deflator 1/ 2/
1968 3/ 4.5 3.8 4.1
1969Q I 4.7 4.8 4. 5
QII 5.0 4.9 5.0QIII 5.6 4.4 5.1Q IV 4.9 4.6 4.8
1970Q I 6.4 5.3 4.8QII 4.3 4.0 4.8QIIIp 4.4 4.5 4.8
1/ Fourth quarter 1965 weights2/ Confidential3/ Average of the four quarterly rates.

II - 34
Meat supply prospects. Record supplies of red meats are in
prospect during the next five or six months as producers market the
large output already in process before the likelihood of a short corn
crop boosted feed costs. Livestock-feed price ratios new are far
less favorable than a year ago both because of lower livestock prices
and higher feed costs. As a result, producers are likely to be less ex-
pansion-minded in planning production of short cycle products, such as
pork and poultry, for marketing next summer and fall.
Normally, supplies of meats are 5 to 6 per cent larger in the
fall and winter months because of seasonally larger marketings of hogs,
grass-fed cattle, and turkeys. The major change in supply prospects
this fall and winter compared with a year ago is the return to a more
normal seasonal pattern in hog marketings. Last fall and winter, the
increase was less than half the normal rise and hog prices rose sharply.
The price rise spread to other livestock prices and producers expanded
output in response to generally favorable profit prospects. Hog producers
raised 13 per cent more hogs for this year's fall and winter markets.
October is the seasonal peak month in marketings. This October, output
of pork was up 13 per cent from a year earlier.
Supplies of fed cattle are larger than last year. The turkey
crop is also larger but broiler production is slackening from the
earlier record levels.

ECONOMIC DEVELOPMENTS - UNITED STATESSEASONALLY ADJUSTED, RATIO SCALE
GNP INCREASEANNUAL RATEARITHMETIC SCALE
II
Bits EMPLOYMENT ESTAB BASIS
CURRENT $Qm 141
ENEI. L EAT
IHMETIC CALE 1958
I Ir' ~^ T ^ V< ,1968
NCUSTRIAL PRODUCTION - I
III II
1970
MILLIONSOFPERSONS
NONAGRICULTURALOCT 701
MANUFACTURINGOC 187
-ii .1 jHOHOURS
WORKWEEK-MFG 242
S" 40
1957 59=100
TOTALSEPT 1660
CONSUMER GOODS| -_ 51 PT 160 3
UNEMPLOYMENT RATESFJ TTHMETIC SCALE
PER CENT
__6
TOTAL
11111.1I I i' .1 11,11970
In-C-1 11/10/70
1968

II-C 2
ECONOMIC DEVELOPMENTS - UNITED STATESSEASONALLY ADJUSTED, RATIO SCALE
INCOMEANNUAL RATE
PERSONALSEPT 811i
DISPOSABLEQ , 693 ,,
p I\i TIMETIC SCALE PEI
SAVING RATEcm 76
1968 1970
RElAlL SALES
TOTALSEPT 30
GAAFSEPT 83
I I I 1 i i
IMPORTSSEPT 12
1968 1970
BILS PRICES AND COSTS
32
28
9
7
CONSUMER PRICES*
UNIT LABOR COSTSEPT 1232
INDUSTRIAL WHOLESALE ESEPT 1163
*NSA II I I I I I I
BUSINESS INVESTMENT
PLANT AND EQUIPMENT OUTLAYSANNUAL RATE
OQM 8224
MFG NEW ORDERS
PRODUCERS CAPITAL_-' GOODS INDUSTRIES
SEPT 67
1968 1970
INVENTORIES, NONFARM - CHANGESAR1THMETIC SCALEANNUAL RATE
SGNP1I35
ARITHMETIC SCALE
INVENTORY SALES RATIOIAUG 156
-- . . . . . . . . I . .1968 1970
11/10/
957 59-100
40
120
BIt$
"-80
--60
97
- 5
BILt
10
5
0ENT
1 6
1 1
PER C
,]-1.2
- .8
I II I I I I
I

III - 1
THE ECONOMIC PICTURE IN DETAIL
Domestic Financial Situation
Monetary aggregates. The money supply (as currently
published) declined slightly in October, as a drop in private demand
deposits more than offset a fairly sharp advance in currency holdings.
This was the second consecutive month of weakness in the money stock.
Over a longer period, the money supply still shows moderate growth--at
a seasonally adjusted annual rate of 3.5 per cent since June and at a
3.8 per cent annual rate since the beginning of this year.
Growth of time deposits declined to a seasonally adjusted
annual rate of 20 per cent in October, about 9 percentage points belo
the rate in August and September and 15 percentage points below that
for July, despite continued strong inflows at country banks. The slow-
ing was partly attributable to a marked reduction in CD sales, which
reflected some decline in the size of the runoff of affiliates' indebt-
edness in the commercial paper market. At large commercial banks, CD's
showed an average weekly increase of about $325 million during October,
about $80 million less than the average weekly advance recorded in
September. Other time deposit categories at large commercial banks
were also weaker in October. Consumer-type deposits increased at a much
slower pace than in other recent months. And "other' time deposits
dropped sharply, mainly as a result of a sharp cut-back in foreign
official deposits, a development which apparently reflected bank decisions
to compete less aggressively for the funds of these institutions--the

III - 2
rates offered on these deposits in most maturity ranges dropped further
in October after having declined substantially from mid-August to the
end of September.
MONETARY AGGREGATES(Seasonally adjusted percentage changes, at annual rates)-
1970 1970QII QIII August September October?
Money supply 4.2 4.5 10.0 1.2 -1.0
Commercial bank timeand savings deposits 13.8 31.6 28.4 29.5 22.0
Member bank depositsplus nondepositsources 2/ 6.5 16.8 23.2 9.7 .5
p - Preliminary.1/ Based on monthly average of daily figures for deposits and monthly
average of weekly figures for nondeposit funds. Quarterly changesare calculated from the average amounts outstanding in the lastmonths of each quarter.
2/ Includes all deposits subject to reserve requirements plus thefollowing nondeposit sources: commercial paper issued by a holdingcompany or bank affiliate; loans or participation in pools of loanssold under repurchase agreement to other than banks and other thanbanks' own affiliates or subsidiaries; Euro-dollars borrowed directlythrough brokers or dealers; liabilities to banks' own branches inU.S. territories and possessions; and liabilities to banks' ownforeign branches.
NET CHANGE IN TIME AND SAVINGS DEPOSITS(Billions of dollars, seasonally unadjusted)
Aug. 26-Sept. 3011 Sept. 30-Oct. 281967-69 1970 3-year 1970average average
Weekly reporting banks
Total time and savings 0 3.9 -.3 1.2Consumer-type .7 2.0 0 .4CD's -.5 2.2 -.3 1.3All other -.2 .2 0 -.6
Country banksTotal time and savings .6 1.1 .5 1.1
1/ Dates are for 1970; comparable dates used for other years.

III - 3
Large banks continued to use a large portion of their incoming
deposit funds in October to reduce their nondeposit liabilities. Further
substantial reductions were made in the commercial paper indebtedness of
affiliates and in borrowings from foreign branches. Funds obtained from
other sources outside the United States also declined moderately, and
outstanding loan RP's edged off slightly. These reductions in nondeposit
liabilities, combined with declines in private demand deposits and in
U.S. Treasury deposits, about offset growth in total time and savings
deposits and the adjusted credit proxy remained essentially unchanged
over the month.
Bank credit. Commercial bank credit, adjusted for loans sold
to affiliates, declined at a 1.7 per cent seasonally adjusted annual
rate from the last Wednesday in September to the last Wednesday in
October. A $1.3 billion reduction in total loans (adjusted for loans
sold), which followed a marked slowdown in growth in September, was
partly responsible for this further weakening in the bank credit picture.
In addition, bank holdings of U.S. Treasury securities, which had
remained essentially unchanged in September after growing at an excep-
tionally strong pace earlier in the summer, also declined $1.3 billion.
In contrast to these developments, bank acquisitions of other securities
rose approximately $2 billion further, about matching the strong
September advance in holdings of these securities.
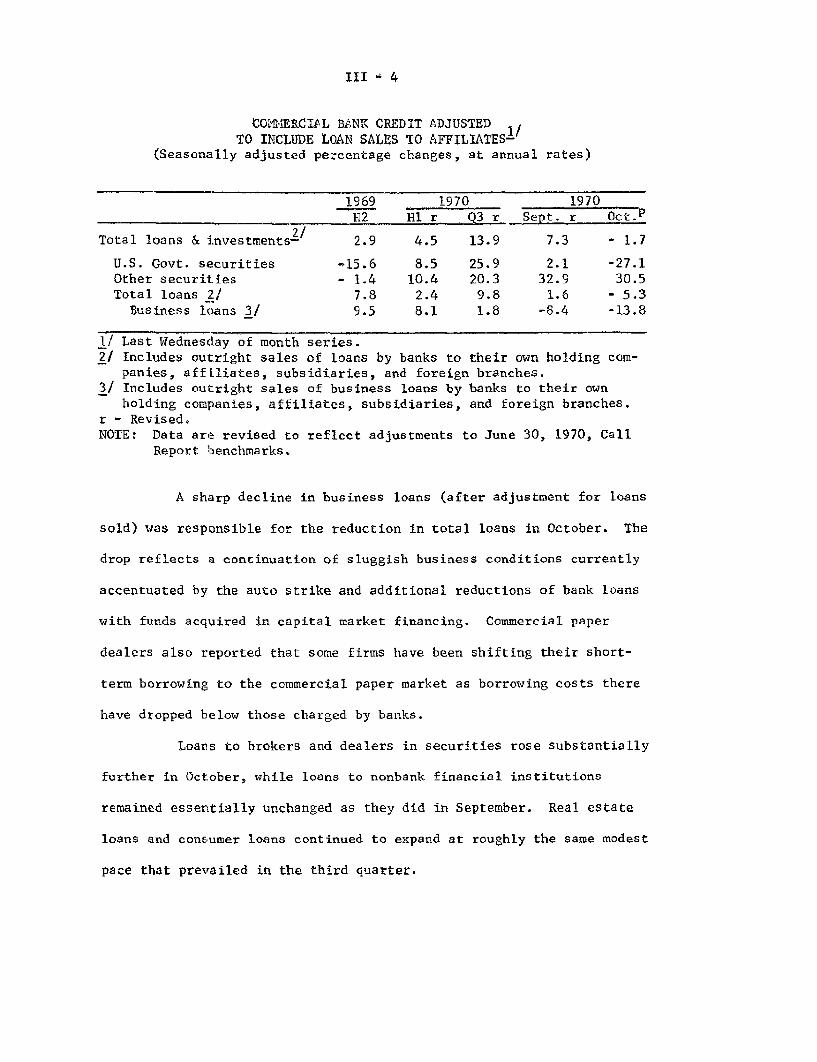
III - 4
COMMERCIAL BANK CREDIT ADJUSTEDTO INCLUDE LOAN SALES TO AFFILIATES-
(Seasonally adjusted percentage changes, at annual rates)
1969 1970 1970H2 H1 r Q3 r Sept. r Oct.p
2/Total loans & investments- 2.9 4.5 13.9 7.3 - 1.7
U.S. Govt. securities -15.6 8.5 25.9 2.1 -27.1Other securities - 1.4 10.4 20.3 32.9 30.5Total loans 2/ 7.8 2.4 9.8 1.6 - 5.3
Business loans 3/ 9.5 8.1 1.8 -8.4 -13.8
1/ Last Wednesday of month series.2/ Includes outright sales of loans by banks to their own holding com-
panies, affiliates, subsidiaries, and foreign branches.3/ Includes outright sales of business loans by banks to their own
holding companies, affiliates, subsidiaries, and foreign branches.r - Revised.NOTE: Data are revised to reflect adjustments to June 30, 1970, Call
Report benchmarks.
A sharp decline in business loans (after adjustment for loans
sold) was responsible for the reduction in total loans in October. The
drop reflects a continuation of sluggish business conditions currently
accentuated by the auto strike and additional reductions of bank loans
with funds acquired in capital market financing. Commercial paper
dealers also reported that some firms have been shifting their short-
term borrowing to the commercial paper market as borrowing costs there
have dropped below those charged by banks.
Loans to brokers and dealers in securities rose substantially
further in October, while loans to nonbank financial institutions
remained essentially unchanged as they did in September. Real estate
loans and consumer loans continued to expand at roughly the same modest
pace that prevailed in the third quarter.

III - 5
The expansion in "other" security holdings in October included
a substantial increase in holdings of Federal Agency issues as well as
a sharp advance in holdings of municipal securities. Most of the acquisi-
tions of municipal securities were reported to be in the short and
intermediate maturity range. but some dealers have reported bank pur-
chases of such securities with maturities as long as 15 to 20 years.
The fairly substantial decline in Treasury security holdings may be
attributable in part to a smaller than normal volume of Treasury financ-
ing during the month. Holdings of Treasury issues had shown little net
change in September after having risen by more than $7 billion since
February of this year. After rebuilding liquidity, banks apparently
have been placing more emphasis on yield in their allocation of invest-
ment funds over the past two months.
Nonbank depositary institutions. Preliminary indications are
that deposit growth at savings banks and savings and loan associations
continued very strong during October. As during the favorable reinvest-
ment period earlier in the month, thrift institution inflows have been
bolstered by lower short-term market yields, as well as consumers'
hesitancy to spend and their related desire for safe and liquid assets.
There were no reports of particularly heavy individual purchases in the
recently-concluded Treasury note auction, although it may be a bit
premature to assess its impact on deposit flow patterns at the thrift
institutions.

III - 6
DEPOSIT GROWTH AT NONBANK THRIFT INSTITUTIONS(Seasonally adjusted annual rates, in per cent)-
Mutual Savings and LoanBoth
Savings Banks Associations
1970 - QI 2.4 1.4 1.7QII 6.3 7.1 6.9QIII 6.6 11.5 9.9
August* 4.7 6.8 6.1September* p/ 7.6 12.0 10.5October* e/ 5.5 11.9 9.8
1/ Table reflects updated seasonal adjustment.* Monthly patterns may not be significant because of difficulties
with seasonal adjustment.p/ Preliminary.
e/ Estimated on the basis of sample data.
During the third quarter, savings and loan associations not
only acquired a larger volume of mortgages--both gross and net--but
also allocated more funds to liquid assets than in any other comparable
period since before 1965. In part, this reflects the strong improvement
realized in deposit inflows. But it also reflects special conditions
this year that have served to preclude repayment, in any volume, of
funds borrowed from the FHLBanks; as a condition of the PHLB's program
to subsidize the cost to S&Ls of advances, the associations agreed not
to repay them for a one year period that expires in the spring of 1971.
During October, there appeared to be a continuation of the minimal net
change in these outstanding advances that has obtained, with only one
exception, in every month since January.
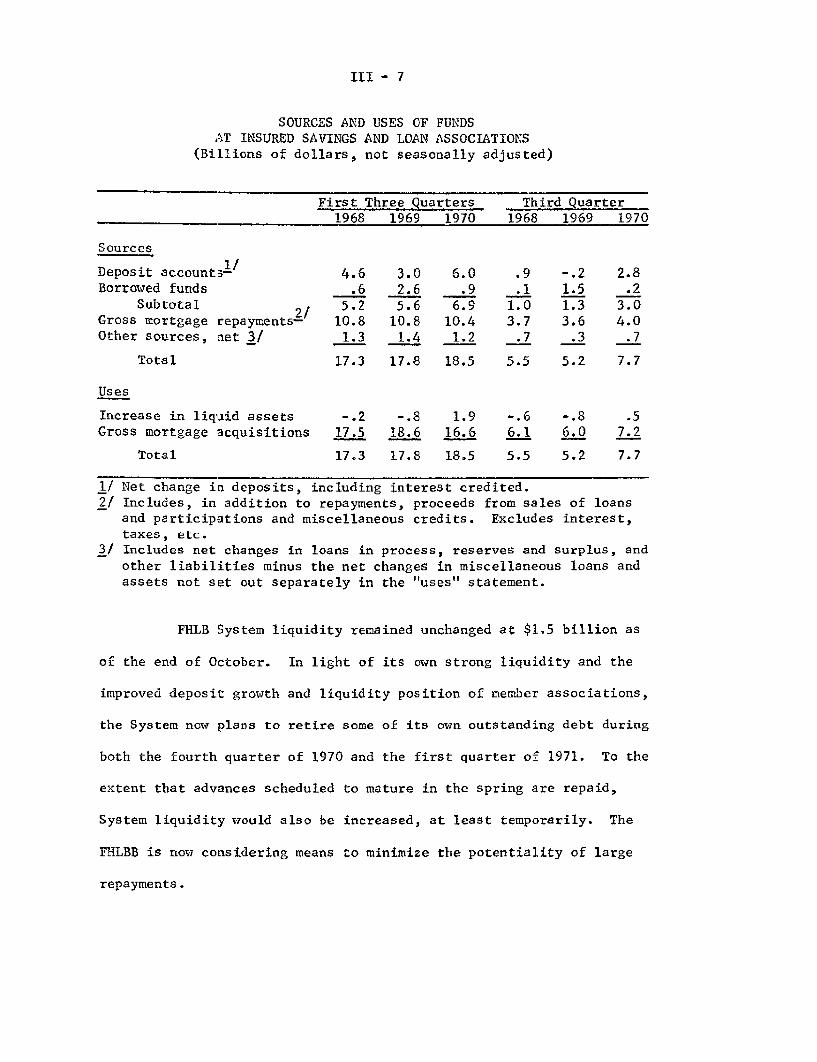
III - 7
SOURCES AND USES OF FUNDSAT INSURED SAVINGS AND LOAN ASSOCIATIONS
(Billions of dollars, not seasonally adjusted)
First Three Quarters Third Quarter1968 1969 1970 1968 1969 1970
Sources
Deposit accounts1 / 4.6 3.0 6.0 .9 -. 2 2.8Borrowed funds .6 2.6 .9 .1 1.5 .2
Subtotal 5.2 5.6 6.9 1.0 1.3 3.0Gross mortgage repayments- 10.8 10.8 10.4 3.7 3.6 4.0Other sources, net 3/ 1.3 1.4 1.2 .7 .3 .7
Total 17.3 17.8 18.5 5.5 5.2 7.7
Uses
Increase in liquid assets -. 2 -. 8 1.9 -. 6 -. 8 .5Gross mortgage acquisitions 17.5 18.6 16.6 6.1 6.0 7.2
Total 17.3 17.8 18.5 5.5 5.2 7.7
1/ Net change in deposits, including interest credited.2/ Includes, in addition to repayments, proceeds from sales of loans
and participations and miscellaneous credits. Excludes interest,taxes, etc.
3/ Includes net changes in loans in process, reserves and surplus, andother liabilities minus the net changes in miscellaneous loans andassets not set out separately in the "uses" statement.
FHLB System liquidity remained unchanged at $1.5 billion as
of the end of October. In light of its own strong liquidity and the
improved deposit growth and liquidity position of member associations,
the System now plans to retire some of its own outstanding debt during
both the fourth quarter of 1970 and the first quarter of 1971. To the
extent that advances scheduled to mature in the spring are repaid,
System liquidity would also be increased, at least temporarily. The
FHLBB is now considering means to minimize the potentiality of large
repayments.

III - 8
The Federal Home Loan Mortgage Corporation recently completed
its first issue of securities connected with the mortgage pool it
acquired from member associations this past summer. The issue was split
between a long-term $140 million security and a 2-year $175 million
security, with $77 million of the latter acquired by Government Trust
Funds. The Corporation is now endeavoring to amass a new pool of
mortgages.
Mortgage market. With savings inflows to nonbank thrift
institutions apparently continuing strong, field reports and trade
opinion suggest that the volume of new residential mortgage commitments
picked up again last month at the savings and loan associations--which
have thus far accounted for most of the recovery in over-all commitment
activity since last spring--as well as at the savings banks. During
September, when savings inflows to nonbank thrift institutions were also
quite strong, a large amount of new mortgage commitments was approved by
these lenders and S&L new commitments attained the highest seasonally
adjusted rate in more than three years. The aggregate seasonally
adjusted backlog of mortgage commitments outstanding at both institu-
tions reached the largest total in a year.
With new mortgage commitment volume apparently rising, returns
required by lenders on home mortgages, which were edging down in
September, may have declined a little further during October on conven-
tional loans, according to field reports and trade opinion. However,
/ The long-term issue was an 8.60 per cent, 25-year security with12 year call protection. The 2-year issue yielded 7.10 per cent.

III - 9
data on either conventional loan rates or mortgage commitment volume
are not yet available for October.
In FNMA's latest (November 2) auction of its forward commit-
ments to purchase Government underwritten home mortgages, yields remained
close to their recent lows, which were about 40 basis points below the
peak reached earlier this year. The large volume of offerings did not
reflect an inability to obtain commitments from private investors.
Rather, FNMA field reports indicate that bidders continued to be inter-
ested in replacing lower older-priced commitments with newer higher-
priced ones, as is also suggested by the unusually large share of bids
for short-term commitments. Also, as in other recent auctions, some
bidders were said to be seeking FNMA commitments for loans being
accumulated in warehouse. The FNMA commitments have been needed in
order to obtain interim warehousing credit from commercial banks, and
as a hedge against the anticipated sale of the mortgages to private
investors (rather than for delivery to FNMA, which is optional) at
prices that the trade generally believes will rise further.
The resulting volume of recent and prospective cancellations
and expirations of FNMA's commitments has led to a sharp reduction in
FNMA's borrowing plans for the first quarter of next year. FNMA's
borrowings could ease still further if the growing number of inquiries
about purchasing loans out of its portfolio eventuates in sales.
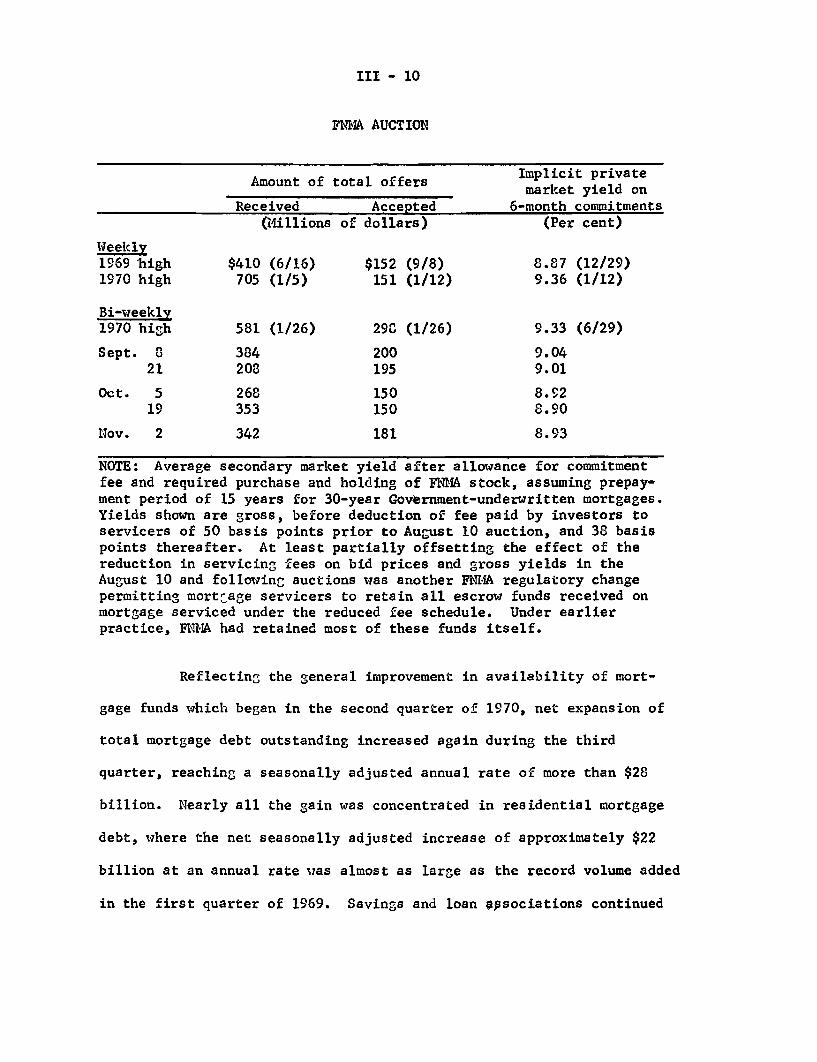
III - 10
FNMA AUCTION
Amount of total offers
Received Accepted(Millions of dollars)
Implicit privatemarket yield on
6-month commitments(Per cent)
Weekly1969 high1970 high
Bi-weekly1970 high
Sept. 821
Oct. 519
Nov. 2
$410 (6/16)705 (1/5)
581 (1/26)
384208
268353
342
$152 (9/8)151 (1/12)
290 (1/26)
200195
150150
181
8.87 (12/29)9.36 (1/12)
9.33 (6/29)
9.049.01
8.928.90
8.93
NOTE: Average secondary market yield after allowance for commitmentfee and required purchase and holding of FNMA stock, assuming prepay-ment period of 15 years for 30-year Government-underwritten mortgages.Yields shown are gross, before deduction of fee paid by investors toservicers of 50 basis points prior to August 10 auction, and 38 basispoints thereafter. At least partially offsetting the effect of thereduction in servicing fees on bid prices and gross yields in theAugust 10 and following auctions was another FNMA regulatory changepermitting mortgage servicers to retain all escrow funds received onmortgage serviced under the reduced fee schedule. Under earlierpractice, FNMA had retained most of these funds itself.
Reflecting the general improvement in availability of mort-
gage funds which began in the second quarter of 1970, net expansion of
total mortgage debt outstanding increased again during the third
quarter, reaching a seasonally adjusted annual rate of more than $28
billion. Nearly all the gain was concentrated in residential mortgage
debt, where the net seasonally adjusted increase of approximately $22
billion at an annual rate was almost as large as the record volume added
in the first quarter of 1969. Savings and loan associations continued

III - 11
to account for most of the net growth in total mortgage debt. At
commercial banks in the third quarter, there was some pick-up in the
pace of net mortgage lending from the reduced second quarter levels.
Corporate and municipal security markets. Yields on newly
issued corporate bonds rose about 40 basis points during October, in
response to the steady pressure of a very high pace of public bond
offerings and the prospect of an even higher volume in November. But
in recent days, corporate yields dropped sharply as a rally developed
in the long-term markets. This rally was based, in part, on growing
speculation that the improved position of the money markets and the
banking system, combined with the continued sluggishness of the economy,
would result in near-term cuts in both the discount rate and the prime
rate. But it also reflected the conviction that the volume of new
offerings will subside in early 1971.
The general improvement in early November extended to the
municipal market, where yields declined somewhat. Supported by heavy
bank buying, tax-exempt yields had shown less upward movement in October
than corporates, despite the heaviest monthly volume of new State and
local offerings in two years.

III - 12
BOND YIELDS
New Aaa / Long-term State2 ,
Corporate Bonds- and Local Bonds
1970
Low 8.20 (2/27) 5.95 (3/12)Hish 9.30 (6/18) 7.12 (5/28)
Week of:
October 9 8.35 6.3816 8.53 6.3523 8.64 6.4530 8.77 6.40
November 6 8.63 6.28
1/ With call protection (includes some issues with 10-year protection).2/ Bond Buyer (mixed qualities).
In the equity markets, a relatively strong rise in stock
prices during the first week of November carried prices generally to
the late September level. But trading volume, which set a new record
weekly total a month ago, has fallen off about one-third in recent
weeks to a level below the average volume thus far in 1970.
Despite shifts in timing of several large bond issues that
reduced the scheduled October volume, new corporate bond and stock
offerings last month reached the second highest total in the postwar
period. Equity issues were boosted by an unusual volume of public
utility offerings, and public bond issues remained at the September
level of $2.4 billion. The staff estimates that the November bond
volume will be over 10 per cent higher but expects some decline in
stock offerings. Most of the issues postponed in late October--when
some congestion developed--were sold at declining yields in the first
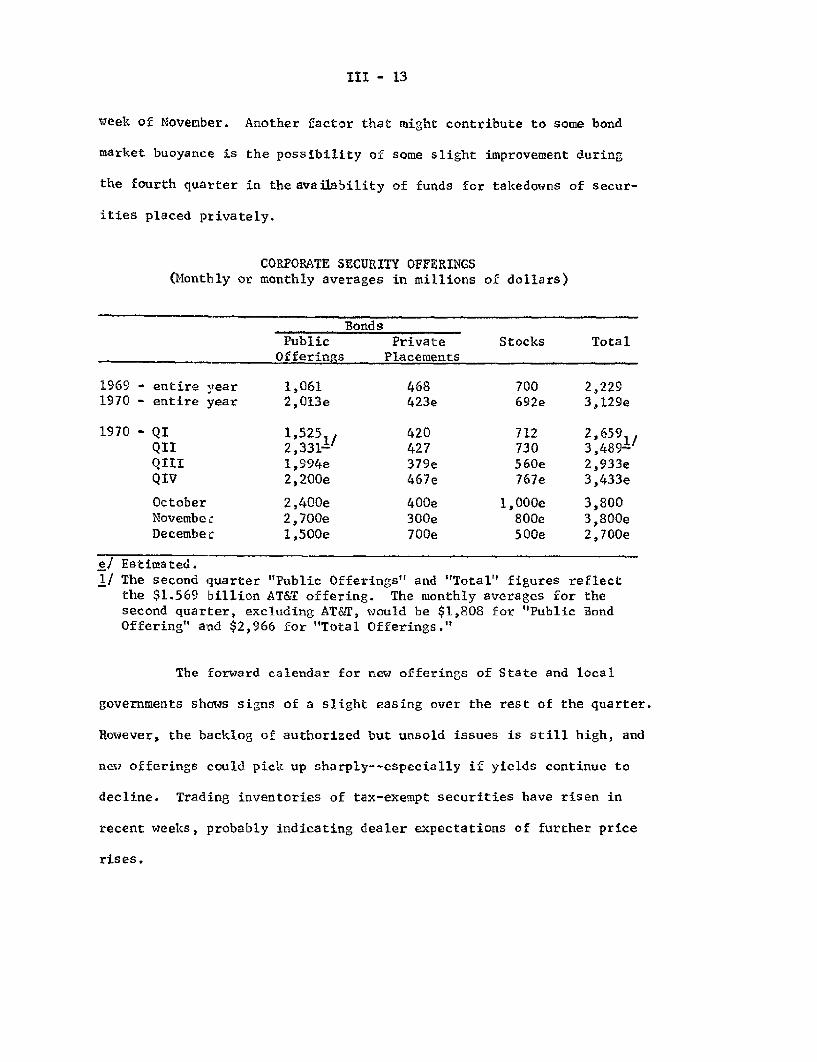
III - 13
week of November. Another factor that might contribute to some bond
market buoyance is the possibility of some slight improvement during
the fourth quarter in the availability of funds for takedowns of secur-
ities placed privately.
(Monthly orCORPORATE SECURITY OFFERINGSmonthly averages in millions of dollars)
BondsPublic Private Stocks Total
Offerings Placements
1969 - entire year 1,061 468 700 2,2291970 - entire year 2,013e 423e 692e 3,129e
1970 - QI 1,525 420 712 2,659 ,QII 2,331- 427 730 3,489-QIII 1,994e 379e 560e 2,933eQIV 2,200e 467e 767e 3,433e
October 2,400e 4 00 e 1,000e 3,800Novembec 2,700e 300 e 800e 3,800eDecember 1,500e 700e 500e 2,700e
e/ Estimated.1/ The second quarter "Public Offerings" and "Total" figures reflect
the $1,569 billion AT&T offering. The monthly averages for thesecond quarter, excluding AT&T, would be $1,808 for "Public BondOffering" and $2,966 for "Total Offerings."
The forward calendar for new offerings of State and local
governments shows signs of a slight easing over the rest of the quarter.
However, the backlog of authorized but unsold issues is still high, and
new offerings could pick up sharply--especially if yields continue to
decline. Trading inventories of tax-exempt securities have risen in
recent weeks, probably indicating dealer expectations of further price
rises.

III - 14
STATE AND LOCAL GOVERNMENT OFFERINGS(Monthly or monthly averages, in millions of dollars)
1969 - entire year 9901970 - entire year 1,393e
1970 - QI 1,368QII 1,237QIII 1,449eQIV 1,533e
October 1,900eNovember 1,700eDecember 1,000e
e/ Estimated.
Government securities market. Attention in the U.S. Govern-
ment securities market over the last four weeks has been primarily
focused on the Treasury's November rights financing and the subsequent
note auction. Both of these financings were extremely well received,
with attrition on the rights exchange amount to only about 11 per cent--
or about $650 million--and with the average issuing rate on the auctioned
6-3/4 per cent 18-month note turning out at 6.21, well below earlier
expectations. Yields throughout the Government market, particularly in
the bill area, were also pushed sharply lower in recent weeks by
heightened expectations of a near-term reduction in the discount rate
and/or the commercial bank prime rate. In all, yields on Treasury notes
and bonds are generally 15 to 45 basis points lower than at the time of
the mid-October meeting, while Treasury bill rates have declined by
around 40 to 50 basis points, with the 3-month issue recently at a 24-
month low of 5.50 per cent.

III - 15
WEEKLY AVERAGE MARKET YIELDS ON U.S. GOVERNMENT AND AGENCY SECURITIES 1 /
(Per cent)
1970 Week endingDaily Highs Daily Lows Oct. 20 Oct. 27 Nov. 3 Nov. 9
Bills
1-month 7.84 (1/28) 5.15 (11/9) 5.51 5.36 5.42 5.273-month 7.93 (1/16) 5.49 (11/9) 5.92 5.80 5.82 5.516-month 7.99 (1/5) 5.74 (11/9) 6.15 6.13 6.00 5.771-year 7.62 (1/30) 5.73 (11/9) 6.22 6.20 6.06 5.83
Coupons
3-year 8.42 (1/7) 6.54 (11/9) 6.98 7.01 6.85 6.655-year 8.30 (1/7) 6.74 (11/9) 7.12 7.16 7.03 6.877-year 8.12 (4/26) 6.98 (11/9) 7.35 7.39 7.22 7.0710-year 8.22 (5/26) 6.90 (2/27) 7.33 7.44 7.32 7.1720-year 7.73 (5/26) 6.55 (2/27) 6.88 6.98 6.89 6.76
Agencies
6-month 8.65 (1/27) 6.24 (11/9) 6.80 6.73 6.65 6.351-year 8.75 (1/2) 6.58 (11/9) 6.96 6.96 6.93 6.693-year 8.54 (1/2) 7.12 (11/9) 7.25 7.30 7.30 7.175-year 8.43 (1/15) 7.37 (11/9) 7.52 7.55 7.52 7.42
1/ Latest dates of high or low rates in parentheses.
On October 23, the Treasury announced a rights exchange for
holders of the maturing 5 per cent notes, $6.0 billion of which were
publicly held, either into a new 7-1/4 per cent 3-1/2 year note at par
or into a re-opened 7-1/2 per cent 5-3/4 year note priced to yield 7.39
per cent. The announcement was enthusiastically received by the market
and all of the issues involved rose to substantial premiums over the
period for which books were open. Attrition on the $5.6 billion public
holdings amounted to about $650 million, compared with earlier estimates
of $1.0 billion; and the when-issued securities have continued to post

III - 16
price gains in subsequent trading sessions. At the time the Treasury
announced the results of the rights exchange, it also announced that it
would auction, in the same manner as Treasury bills, $2.0 billion of
18-month, 6-3/4 per cent notes, with a minimum acceptable bid of 99.76,
or about 6.93 per cent. As it turned out, the average issuing rate was
6.21 per cent. Noncompetitive tenders, thought to be largely from
smaller banks, were quite heavy totalling $500 million, or 25 per cent
of the issue.
Dealers' positions in Treasury bills were inflated somewhat
by the tax bill financing in mid-October. However, this build-up was
perhaps less than expected since in a number of instances the banks
that had initially been awarded the bills took them into portfolio
rather than selling them to dealers. At month-end dealer bill positions
were also augmented by awards from the regular monthly auction. Coupon
positions, of course, have been swollen by the November rights financing
(about $950 million) and the recent note auction ($195 million). In
all, total positions have risen by around $1.0 billion since about the
time of the October 20 meeting. Despite the large increase in positions,
there has been little in the way of apparent restiveness on the part of
the dealers, as the Federal funds rate has declined to around 6 per cent
and financing costs, both in New York and outside, have also moved lower
and as expectations of a discount rate cut have heightened.
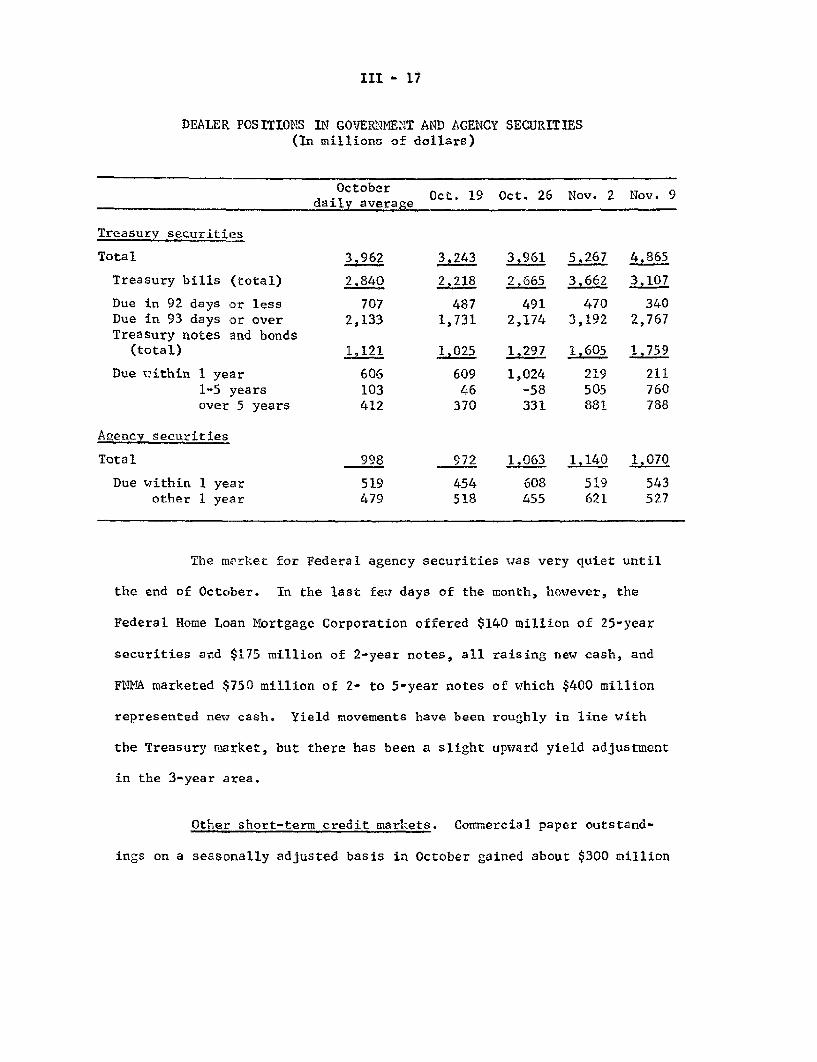
III - 17
DEALER POSITIONS IN GOVERNMENT AND AGENCY SECURITIES(In millions of dollars)
October Oct. 19 Oct. 26 Nov. 2 Nov. 9_____daily average
Treasury securities
Total 3243 3961 267 4865
Treasury bills (total) 2.840 2.218 2 665 3.662 3107
Due in 92 days or less 707 487 491 470 340Due in 93 days or over 2,133 1,731 2,174 3,192 2,767Treasury notes and bonds
(total) 1,121 1,025 1.297 1a605 1.759
Due within I year 606 609 1,024 219 211
1-5 years 103 46 -58 505 760over 5 years 412 370 331 881 788
Aaency securities
Total 998 972 1.063 1,140 1 070
Due within 1 year 519 454 608 519 543other 1 year 479 518 455 621 527
The market for Federal agency securities was very quiet until
the end of October. In the last few days of the month, however, the
Federal Home Loan Mortgage Corporation offered $140 million of 25-year
securities and $175 million of 2-year notes, all raising new cash, and
FNMA marketed $750 million of 2- to 5-year notes of which $400 million
represented new cash. Yield movements have been roughly in line with
the Treasury market, but there has been a slight upward yield adjustment
in the 3-year area.
Other short-term credit markets. Commercial paper outstand-
ings on a seasonally adjusted basis in October gained about $300 million

III - 13
(based on data available through October 28) as compared with a decline
of $1.4 billion in September. The October increase was the result of
large rises in direct and dealer nonbank paper that more than offset
the $915 million decline in bank-related paper. This third consecutive
monthly decline in bank-related paper has reduced outstandings to $3.7
billion, $4.0 billion below the mid-August level, when the new reserve
requirement was announced.
Finance company paper outstanding rose about $450 million,
with other borrowers picking up the funds usually absorbed by General
Motors. This greater availability of funds also explains in part the
increase of $760 million over the month in dealer-issued paper outstand-
ing. However, small firms with excellent credit ratings are still having
difficulty raising money in the commercial paper market.
Short-term rates continued to move down during the month, the
declines ranging from 1/4 to 6/10's of a point. The spread between
commercial paper and Treasury bills has narrowed somewhat to 114 basis
points in one-month maturities, but remains unchanged at 132 basis
points in three-month maturities. With the prime rate at 7.50 per cent,
there may be a shifting out of bank loans into commercial paper. At
this time, however, commercial paper rates as quoted may be somewhat
misleading, as lower-quality borrowers are paying higher rates and other
borrowers are paying a slight premium on funds for the year-end.

III - 19
SELECTED SHORT-TERM INTEREST RATES(Wednesday Quotation - Discount Basis)
1969 Net changeNov.-Dec. Oct. 7 Oct. 21 Nov. 4 (Oct. 7-highsi/ Nov. 4)
1-month
Commercial paper 9.25 (12/31) 6.88 6.75 6.50 -. 38Finance paper 9.00 (12/31) 6.75 6.63 6.38 -.37Bankers' acceptances 9.00 (12/31) 6.88 6.50 6.38 -.50Certificate of deposit--new issue 2/ 6.25 6.75 6.50 6.38 -.37
Treasury bill 7.54 (12/31) 5.63 5.42 5.36 -.27
3-month
Commercial paper 9.25 (12/31) 7.38 7.13 6.88 -.50Finance paper 8.13 (12/31) 6.75 6.75 6.50 -.25Bankers' acceptances 9.00 (12/31) 6.83 6.50 6.38 -.50Certificate of deposit--
new issue 2/ 6.50 6.88 6.75 6.50 -.38Treasury bill 8.00 (12/29) 6.32 5.82 5.56 -.50
6-month
Bankers' acceptances 9.00 (12/31) 6.88 6.50 6.38 -.50Treasury bill 8.09 (12/29) 6.32 6.16 5.78 -.54
12-month
Certificates of deposit--new issue 2/ 7.50 7.00 7.00 6.75 -.25
Treasury bill 7.86 (11/24) 6.26 6.23 5.89 -.37Prime municipals 2/ 6.25 (11/12) 3.90 3.65 3.30 -.60
1/ Dates of highs in parentheses; latest date used if high occurred on morethan one date.
2/ Investment yield basis. Highs for certificates ofeffective as of January 21, 1970.
deposit are ceilings
Source: Wall Street Journal's Money Rates for commercial and finance paperand bankers' acceptances; all other data from the Federal Reserve Bankof New York.

III - 20
COMMERCIAL AND FINANCE COMPANY PAPER(End-of-month data, in millions of dollars)
I/August September October-
Amounts Outstanding
Total commercial andfinance paper 2/ 35,697r 34,284r 34,591e
Bank related 3/ 7,257r 4,586 3,671eNonbank related 4/
Placed through dealers 10,872 11,365 12,129ePlaced directly 17,568 18,333r 18,791e
Net Change
Total commercial andfinance paper 2/ -852 -1,413r +307e
Bank related 3/ -513 -2,671r -915eNonbank related 4/
Placed through dealers -577 +493 +764ePlaced directly +238 +765r +458e
r - Revised.e - Estimated; see footnote 1.1/ As of October 28. The end-of-month data will differ from these
Wednesday figures, due to the difference in dating.2/ Combines seasonally adjusted nonbank-related paper and seasonally
unadjusted bank-related paper.3/ Seasonally adjusted.4/ Seasonally adjusted.
Federal finance. The staff's present projections indicate a
budget deficit for the current fiscal year of nearly $15 billion. The
best evidence available tentatively suggests a deficit of about the
same magnitude for calendar 1971. Considerable uncertainty still
exists, however, because Congress failed to act on several important
tax and appropriations bills--including defense--before it adjourned
temporarily in mid-October, and, of course, the Administration's fiscal
1972 budget estimates will not be released until next January.
III - 21
Staff projection of outlays for fiscal 1971 is now about
$211.4 billion, an increase of $.8 billion since the last Greenbook.
The revision is mostly attributable to anticipated increases for
unemployment compensation and veterans benefits and to the assumption
of a larger increase in social security benefits (effective January
1971) than previously allowed for. The projection assume that there
will be a compromise in Congress between those who favor the 5 per cent
increase in social security benefits provided in the House bill (last
Greenbook assumption) and the 10 per cent increase proposed in the
Senate. Recent data on defense orders and contract awards suggest that
defense expenditures may eventually begin to reverse the present decline,
but this is not expected to occur until after the end of the current
fiscal year.
On the receipts side, the staff estimate for the fiscal year
of $196.6 billion is $.8 billion below the amount forecast in the last
Greenbook. The downward revision is mostly in the areas of social
insurance tax receipts and corporate tax receipts and is the result of
lower income assumptions than those used previously.
Subject to the Budget uncertainties mentioned above, the
staff projects a NIA Federal deficit of about $14.5 billion in the
1971 calendar year compared to about $11.0 billion in calendar 1970.
This projected increase in the deficit is not an indication of an easing
in fiscal policy--in fact, the high employment budget moves in the
direction of greater restraint, as shown in the table at the end of
III - 22
this section.- The projected $11.0 billion growth in actual receipts
from calendar 1970 to calendar 1971 compares to an estimated $21 billion
increase at high employment; both include a $2.7 billion increase result-
ing from discretionary changes in the tax law (mainly social security
taxes). The projected $15 billion increase in expenditures is the same
as in the previous calendar year.
In its recent quarterly refunding and note auction the
Treasury raised $1.4 billion of net new money, payable November 16. As
a result, the Treasury's end-of-November cash balance is expected to be
$4.3 billion. The Treasury is expected to raise an additional $2.0
billion in early December, probably through the offering of tax bills.
Also additions to weekly and monthly bill auctions are assumed to con-
tinue until the cycle is completed in mid-February. Alternatively, the
Treasury could sell a bill strip early in December; this option would
probably result in a larger one-time financing and substitute for con-
tinuing additions to weekly and monthly bill auctions. After allowance
for this December financing, present estimates of Treasury cash flows
over the next few months suggest that no further special financing
operations will be needed until the February refunding.
1/ For further discussion of the high employment budget, see Appendix B.
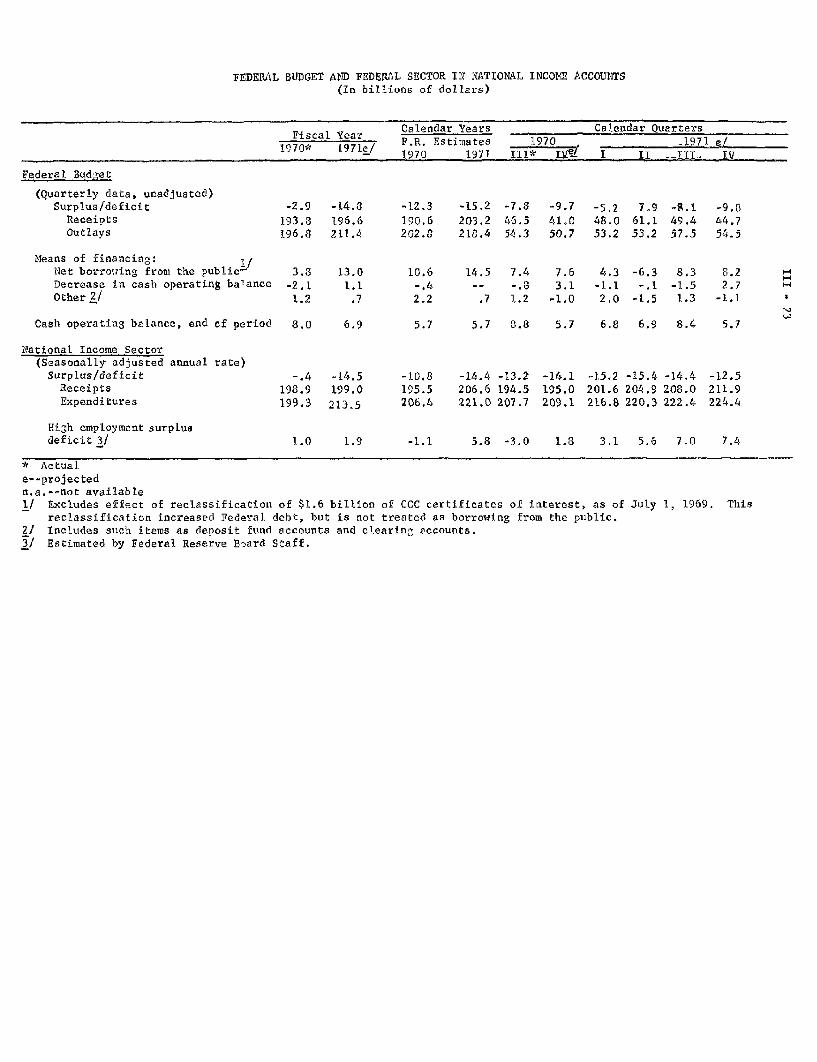
FEDERAL BUDGET AND FEDERAL SECTOR IN NATIONAL INCOME ACCOUNTS(In billions of dollars)
Calendar Years Calendar Quarters
197* l97e/ P.R. Estimates 1970 / 1971 _1970 1971 III* IM- I II --II- IV
Federal Budget
(Quarterly data, unadjusted)Surplus/deficit -2.9 -14.8 -12.3 -15.2 -7.8 -9.7 -5.2 7.9 -S.I -9.8
Receipts 193.8 196.6 190.6 203.2 46.5 41.0 48.0 61.1 49.4 44.7Outlays 196.8 211.4 202.8 218.4 54.3 50.7 53.2 53.2 57.5 54.5
Means of financing: I/Net borrowing from the public- 3.8 13.0 10.6 14.5 7.4 7.6 4.3 -6.3 8.3 8.2 HDecrease in cash operating balance -2.1 1.1 -. 4 -- -.8 3.1 -1.1 -. 1 -1.5 2.7Other 2/ 1.2 .7 2.2 .7 1.2 -1.0 2.0 -1.5 1.3 -1.1
Cash operating balance, end cf period 8.0 6.9 5.7 5.7 3.8 5.7 6.8 6.9 8.4 5.7
National Income Sector(Seasonally adjusted annual rate)
Surplus/deficit -. 4 -14.5 -10.8 -14.4 -13.2 -14.1 -15.2 -15.4 -14.4 -12.5Receipts 198.9 199.0 195.5 206.6 194.5 195.0 201.6 204.9 208.0 211.9Expenditures 199.3 213.5 206.4 221.0 207.7 209.1 216.8 220.3 222.4 224.4
High employment surplusdeficit 3/ 1.0 1.9 -1.1 5.8 -3.0 1.8 3.1 5.6 7.0 7.4
* Actuale--projectedn.a.--not available1/ Excludes effect of reclassification
rPaclssifiratnn inrrTanAe Feralof $1.6 billion
lht. hbit is nn--of CCC certificates of interest, as of Julytreated as borrowing from the public.
2/ Includes such items as deposit fund accounts and clearing accounts.3/ Estimated by Federal Reserve Board Staff.
1, 1969. This
r lt i

III - 24
PROJECTION OF TREASURY CASH OUTLOOK(In billions of dollars)
Oct. Nov. Dec. Jan.
Total net borrowing:
Weekly and monthly billsTax billsCoupon issuesAs yet unspecified new
borrowingOther (agency, debt repayments, etc.)
us: Other net financial sourcesplus: Other net financial sources-
2.7 2.0 2.9
.5 .8 .72.5-- 2.0 --
-- -- 2.0-. 3 -. 8 .2
1.2 -.6 -1.6
Plus: Budget surDlus or deficit (-)
Equals: Change in cash balance
-6.3 -3.5
-2.4 -2.1
.1 .2
Level of cash balance,end of period
Derivation of budgetsurplus or deficit:
Budget receiptsBudget outlays
Maturing coupon issuesheld by public
6.4 4.3
11.5 13.8 15.717.8 17.3 15,6
S 6.0
Memoranda:
a/b/
7.0
18.017.8
Checks issued less checks paid and other accrual items.Actual.
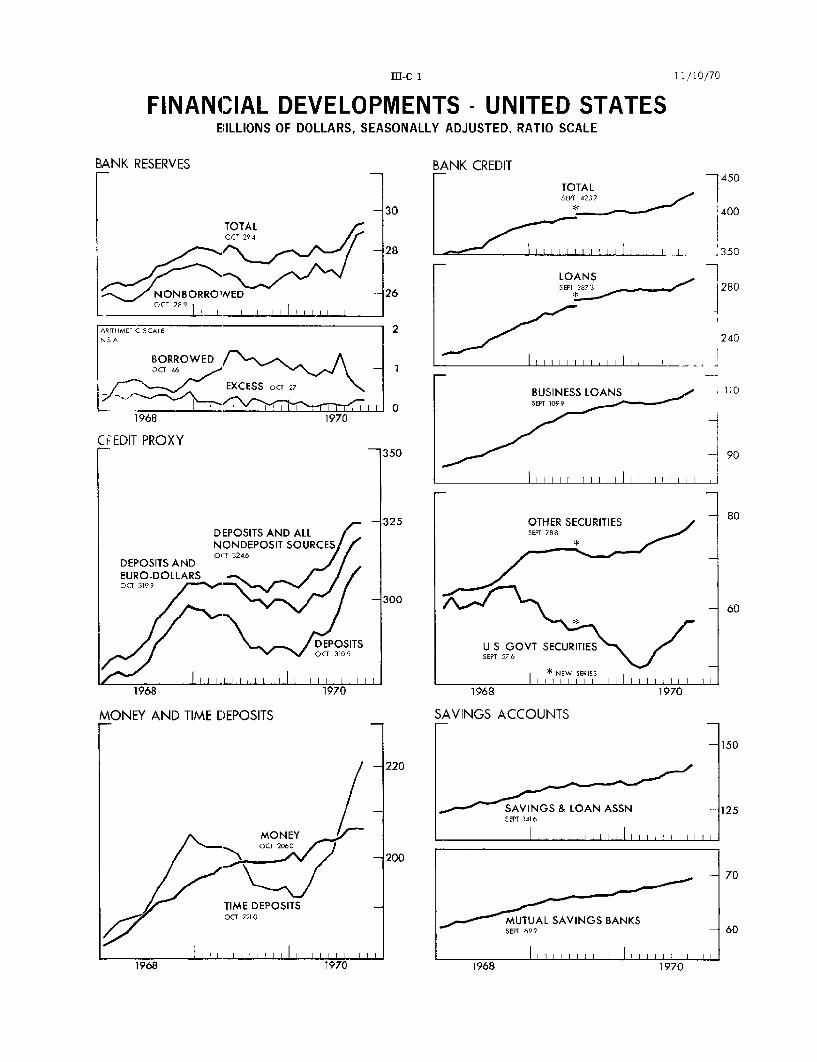
III-c i
FINANCIAL DEVELOPMENTS - UNITED STATESBILLIONS OF DOLLARS, SEASONALLY ADJUSTED, RATIO SCALE
BANK RESERVES
TOTALOCT 294
NONBORROWEDOCT 289 I
ARTHMETIC SCALENS A
BORROWED A
1/ ',-EXCESS OCT 27
BANK CREDIT
TOTALSEPT 2
LOANSSEPT
BUSINESS LOANSSEPT 1099
i I I l i I I II I II
SNEW SERIES
I 1968 1970IIIl1968 1970
SAVINGS ACCOUNTS
SAVINGS & LOAN ASSNSEPT 1416
S II' I l i t i i
MUTUAL SAVINGS BANKSSEPT 69 2
1I l l i I I I l l I I l1 l l l I I I
11/10/70
1 450
400
,350
280
240
1:0
-90
80
60

III-c.2FINANCIAL DEVELOPMENTS - UNITED STATES
NET FUNDS RAISED NONFINANCIALSECTORSSEASONALLY ADJUSTEDANNUAL RATE
TOTAL
LESS FEDERALGOVERNMENT
HOUSEHOLDS AND BUSINESSNET FUNDS RAISED
NAlL
71O
QM 617
I I I , I I I
BILS SHARES IN FUNDS SUPPLIED
NONBANK FINANCE' E->' 1QT 1426 /
COMMERCIAL BANKS (ANDAI-FItIATES)Q0I587
I I I i I I
NEW SECURITY ISSUES BILMCORPORATE
1970OCT as 1969
T1968I I I I l I 1
STATE AND LOCAL GOVERNMENT
1970 1968
1969
MARI JUNE SEPT. DECMAR, JUNE SEPT. DEC
STOCK MARKETRATIO CALE
CREDIT EXTENDED120 BY BROKERS-
SEPT 39
100
COMMON STOCK PRICESI ---- 1913-10 OCt 84
80 I9l A'HU
MIIJONSOFU U HARKB
7ATIO SCALE VOLUMENYS.. DAILYAV -18OCT 119
12
61968 1970
11/10/70
PERCENT
+
15so
I I

IV - 1
THE ECONOMIC PICTURE IN DETAIL
International Developments
U.S. balance of payments. More complete information confirms
the earlier impression that the liquidity deficit in the third quarter
was considerably improved -- to an annual rate of about $3 billion,
compared with a rate of about $6-1/2 billion in the first half (sea-
sonally adjusted and before SDR allocations and special transactions).
Incomplete weekly data for October and the first few days of November,
after allowance for seasonal factors, suggest a continuation of liquidity
deficits at about the third quarter rate.
There have been a few modifications in the pattern of third-
quarter transactions previously estimated. The trade balance weakened
slightly to about a $3.1 billion annual rate in the third quarter, instead
of rising as expected from the $3.4 billion second-quarter rate. Never-
theless, in the current quarter the trade balance is expected to edge up
again, partly on the strength of a resurgence of aircraft exports.
The flow of bank-reported claims on foreigners was also some-
what less favorable in the third quarter than earlier expected, because
of sizable outflows in September. But even so, there was a net inflow
through repayments of $135 million, compared with an outflow of $460
million in the second quarter. This accounts for nearly half of the
shift in the over-all liquidity balance between the two quarters. The

IV - 2
MEASURES OF THE OVER-ALL BALANCE OF PAYMENTS(In millions of dollars; seasonally adjusted; deficit, -)
1 9 6 9 1 9 7 0_Q-1 Q-2 Q-3 Q-4 Q-1 Q-2 0-3
Liquidity balance 1/ -1,375 -3,461 -1,600 498 -1,249 -2,067 -723Official settlements balance !/ 1,467 1,281 -420 450 -3,176 -2,120 -2,120Adjusted over-all balance 2/ -1,485 -3,524 -1,731 301 -1,260 -2,002 -777
Memo: Net transactionsexcluded above:Liquidity basis
Special transactions 23 -340 -679 -78 -349 647 -155Seasonal fluctuations 84 -15 -693 624 102 9 -809
Official settlements basisSpecial transactions -14 34 -162 64 73 142 75Seasonal fluctuations 258 -111 -458 311 274 -83 -567
1/ Before special transactions and allocation of SDRs. Special transactions areredefined to exclude non-liquid assets held by international and regional institu-tions -- this does not affectthe official settlements balance.
2/ The balance financed by official reserve transactions (as adjusted) andchanges in liabilities to foreign commercial banks.
increase of some $250 million in short-term bank loans to foreigners in
September suggests that an easing of credit conditions in this country
could lead to considerably greater outflows. The September outflow was
spread over many countries, although there was a small reduction in
claims on Japan.
A more encouraging development in September was a net inflow
of over $200 million of foreign capital to purchase U.S. corporate
stocks, bringing the third quarter net inflow to $365 million. There
was also a continued relatively small inflow to purchase corporate
bonds. Another factor tending to improve the balance has been a renewed
IV - 3
slowdown in the sale of new foreign bonds in the United States, following
a spurt in July and August. In September sales of new issues were
negligible, and in October the only significant issue was $95 million
by the Inter-American Development Bank -- and most of the proceeds were
invested in long-term time deposits. The calendar of known new foreign
issues for the rest of the year is at present quite small -- reflecting
largely a slowdown in offerings of Canadian issues.
The deficit on the official settlements basis was about as
large in the third quarter as in the second, at $2.1 billion (seasonally
adjusted and before SDR allocations and special transactions). The
October deficit rate appears to be little changed. Although liabilities
to foreign branches dropped by about $800 million in October, this was
partly offset by increases in liabilities to other foreign commercial
banks. U.S. reserve assets fell by $801 million in the third quarter --
there was a $395 million reduction in the gold stock (largely because
of the unwinding of part of the IFM's 1956-60 sales of gold to United
States to acquire earning assets) and a reduction of $406 million in
our reserve position in the IMF as France and others repaid drawings,
on balance, and the IMF sold $102 million of gold to the United States
to obtain dollars. Liabilities to foreign official accounts rose by
$1.8 billion, including $2.1 billion for Germany. In October U.S.
reserve assets declined by $407 million -- mainly reflecting U.K.
repayments of swap drawings, and a reduction in the U.S. reserve position
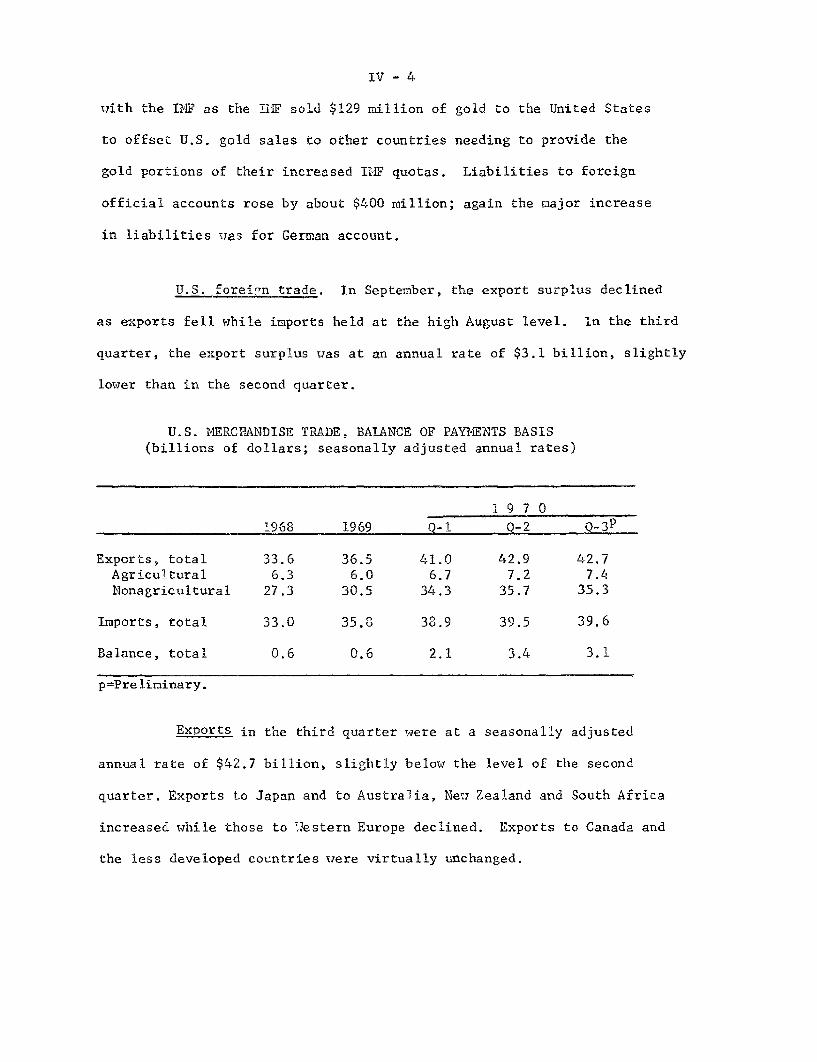
IV - 4
with the IMF as the IMF sold $129 million of gold to the United States
to offset U.S. gold sales to other countries needing to provide the
gold portions of their increased IMF quotas. Liabilities to foreign
official accounts rose by about $400 million; again the major increase
in liabilities was for German account.
U.S. foreign trade. In September, the export surplus declined
as exports fell while imports held at the high August level. In the third
quarter, the export surplus was at an annual rate of $3.1 billion, slightly
lower than in the second quarter.
U.S. MERCHANDISE TRADE, BALANCE OF PAYMENTS BASIS(billions of dollars; seasonally adjusted annual rates)
1970
1968 1969 Q-1 Q-2 Q-3P
Exports, total 33.6 36.5 41.0 42.9 42.7Agricultural 6.3 6.0 6.7 7.2 7.4Nonagricultural 27.3 30.5 34.3 35.7 35.3
Imports, total 33.0 35.8 38.9 39.5 39.6
Balance, total 0.6 0.6 2.1 3.4 3.1
p=Preliminary.
Exports in the third quarter were at a seasonally adjusted
annual rate of $42.7 billion, slightly below the level of the second
quarter. Exports to Japan and to Australia, New Zealand and South Africa
increased while those to Western Europe declined. Exports to Canada and
the less developed countries were virtually unchanged.

IV - 5
Agricultural exports rose moderately from the second to the
third quarter as increases in exports of soybeans and grains -- especially
corn and wheat -- more than offset sharp declines in exports of cotton
and tobacco. The increase in corn exports is attributable to anticipation
of possible shortages in the U.S. resulting from the corn blight, a smaller-
than-expected Argentine corn crop, and higher export prices. Foreign demand
for wheat has also been strong because new harvests abroad are somewhat
smaller than in the last few years. The drop in cotton exports in the
third quarter was primarily caused by shortages in U.S. supplies of short-
staple cotton preferred by foreign customers.
Exports of non-agricultural products declined slightly between
the second and third quarters. With the easing of supply conditions in
Western Europe and Japan, exports of iron and steel products fell from the
peak levels of the second quarter. Almost all other industrial materials,
except copper, also registered declines. Exports of copper advanced
because of the change in the U.S. export controls on copper in July,
which allows U.S. companies having difficulty in meeting the more stringent
U.S. pollution regulations, to ship copper ore abroad for refining if the
refined copper is returned to the United States. As noted below, U.S.
imports of refined copper also increased from the second to the third
quarter.
Exports of commercial aircraft fell abruptly in the third quarter,
but delivery schedules indicate that aircraft exports will begin to increase
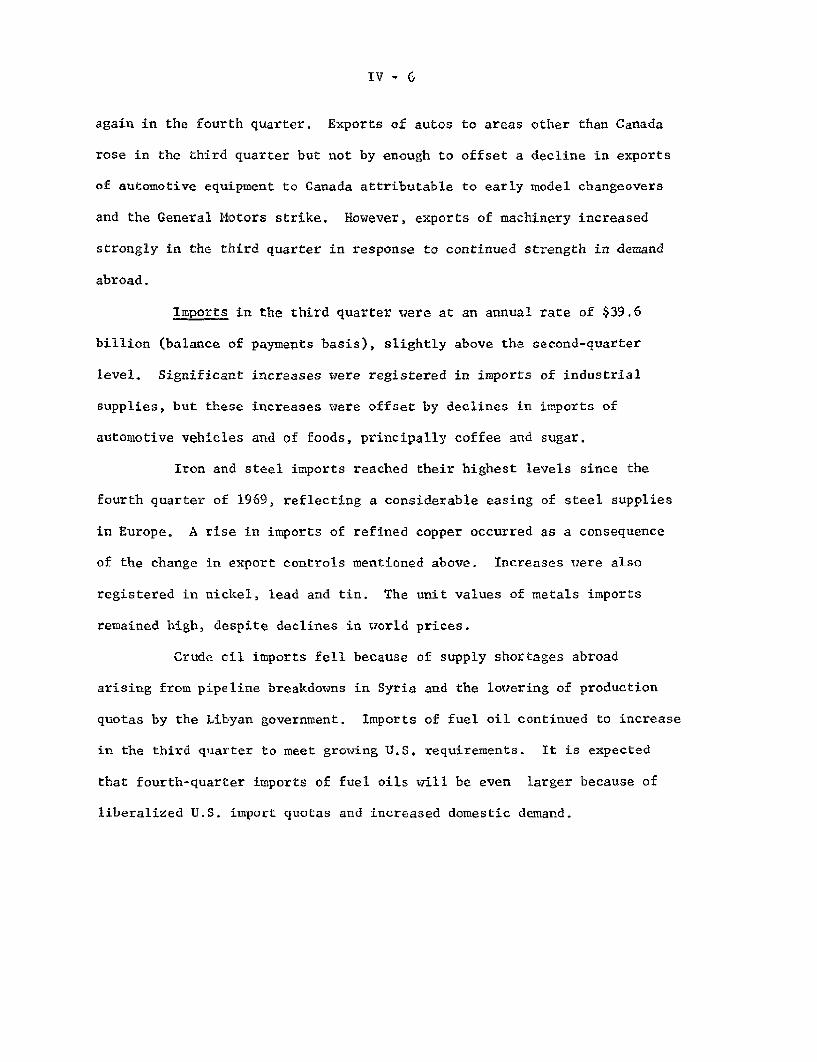
IV - 6
again in the fourth quarter. Exports of autos to areas other than Canada
rose in the third quarter but not by enough to offset a decline in exports
of automotive equipment to Canada attributable to early model changeovers
and the General Motors strike. However, exports of machinery increased
strongly in the third quarter in response to continued strength in demand
abroad.
Imports in the third quarter were at an annual rate of $39.6
billion (balance of payments basis), slightly above the second-quarter
level. Significant increases were registered in imports of industrial
supplies, but these increases were offset by declines in imports of
automotive vehicles and of foods, principally coffee and sugar.
Iron and steel imports reached their highest levels since the
fourth quarter of 1969, reflecting a considerable easing of steel supplies
in Europe. A rise in imports of refined copper occurred as a consequence
of the change in export controls mentioned above. Increases were also
registered in nickel, lead and tin. The unit values of metals imports
remained high, despite declines in world prices.
Crude oil imports fell because of supply shortages abroad
arising from pipeline breakdowns in Syria and the lowering of production
quotas by the Libyan government. Imports of fuel oil continued to increase
in the third quarter to meet growing U.S. requirements. It is expected
that fourth-quarter imports of fuel oils will be even larger because of
liberalized U.S. import quotas and increased domestic demand.

IV - 7
Total imports of automobiles declined in the third quarter.
A decrease in imports from Canada caused by the early model changeover
and the GM strike outweighed increases in imports of European and
Japanese automobiles. In October, domestic sales of foreign-type
cars -- especially Japanese Toyotas and Datsuns -- continued to expand,
raising the share of such cars in the U.S. market above the 13.1 per cent
in the second quarter.
Despite the sluggishness in the U.S. economy, the ratio of
imports to GNP was still a very high 4.01 per cent in the third quarter.
This is only slightly below the 4.05 per cent in the first and second
quarters and higher than the 3.85 per cent in calendar 1969. The ratio
of imports of non-food consumer goods (other than automotive) to personal
consumption expenditures on similar types of goods in the third quarter
remained at the high 4.66 per cent level of the first half of 1970.
Foreign exchange markets. Most major foreign currencies moved
higher against the dollar in the period since the last Green Book, reflect-
ing in part a sharp decline in Euro-dollar interest rates. Several central
banks made large additions to their reserves during the period.
Sterling posted a strong advance between mid-October and early
November, with the exchange rate climbing to well over $2.39 and the
Bank of England purchasing over $450 million. Bank of England reserve
gains were particularly large following the announcement in late October
of an increase in reserve requirements of British commercial banks, and

IV - 8
throughout most of the period under review sterling benefited from a
flow of short-term interest arbitrage funds from the Euro-dollar
market. In the most recent week, however, some softness developed in
the sterling market as a new round of very high wage settlements in
Britain's public sector again aroused concern over Britain's inflation
problem. During October the Bank of England repaid $275 million of its
swap indebtedness to the System, reducing the outstanding balance on
that line to $125 million.
The lira continued its strong recovery, and the Bank of Italy
purchased $360 million from October 14 to November 4, bringing its
reserve gains since the first of August to just over $700 million.
Most of the recent strength in the lira is apparently the result of
short-term capital flows, although Italian exports have begun to pick
up lately.
The German mark eased substantially in the last two weeks of
October, following the passing of the mid-month tax date and large
deliveries of marks to the market by the Bundesbank as its forward
exchange market contracts mature. Call money rates in Germany, which
had been running at around 9 per cent, dropped to an average of 5-6
per cent during these two-weeks, and may have contributed to the sharp
decline in very short-term Euro-dollar rates. At the beginning of
November, however, the German call rate shot back up to 9 per cent.
As it became apparent to the market that no end of German monetary

IV - 9
restraint was in sight, the exchange rate moved to the ceiling, and
on November 4 the Bundesbank purchased $130 million -- its first
market intervention in about a month.
Despite a cut in the Belgian discount rate, the Belgian franc
remained at or near its ceiling during the period, and the National Bank
of Belgium purchased about $100 million. The System drew $95 million on
the Belgian swap line, bringing its outstanding indebtedness on that
line to $250 million.
The Dutch guilder remained very firm, mainly as a result of
relatively tight Dutch money market conditions plus some foreign interest
in guilder-denominated bond issues. The Netherlands Bank purchased over
$100 million spot and $85 million in swaps with Dutch commercial banks
from mid-October to November 6. In early November, the central bank
raised its intervention point, presumably lessening the accruals to
its reserves. The System drew the remaining $30 million on the $300
million swap facility with the Netherlands Bank so that that facility
is now fully drawn. On November 5, the Dutch purchased $30 million in
gold and $30 million in SDRs from the U.S. Treasury.
The French franc firmed towards the end of October, mainly
reflecting the monthly pattern of conversion of French export proceeds,
and the Bank of France purchased $100 million in late October and early
November.
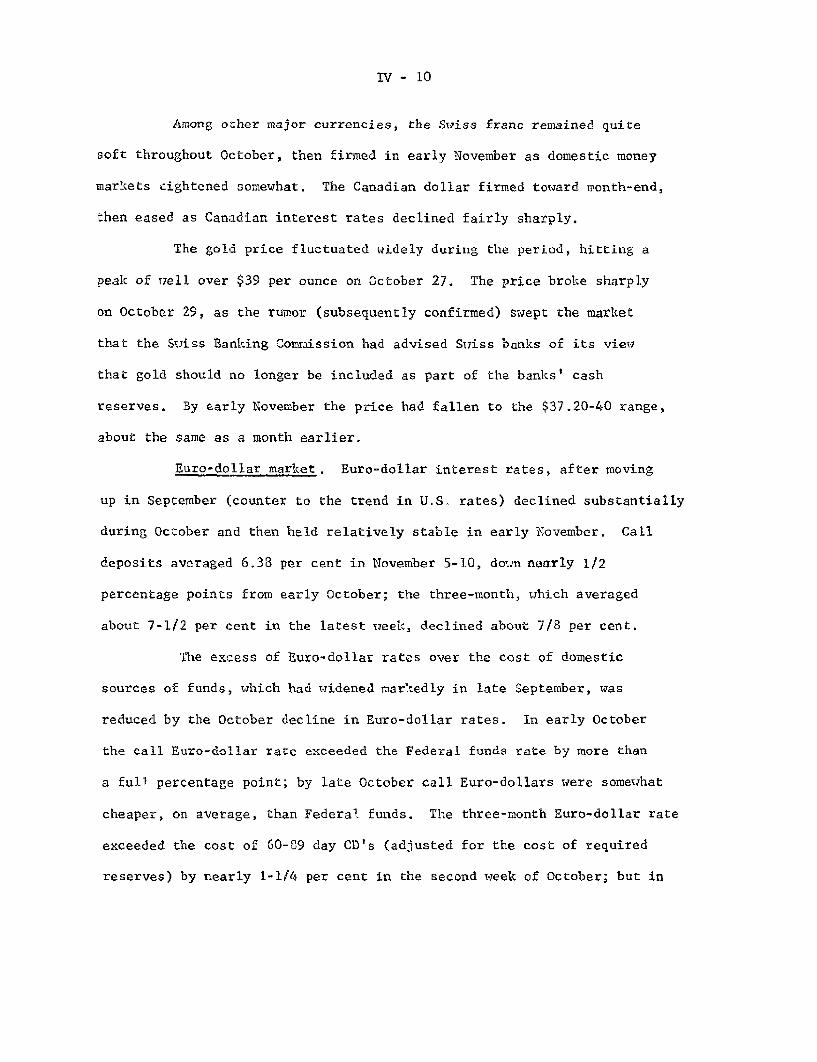
IV - 10
Among other major currencies, the Swiss franc remained quite
soft throughout October, then firmed in early November as domestic money
markets eightened somewhat. The Canadian dollar firmed toward month-end,
then eased as Canadian interest rates declined fairly sharply.
The gold price fluctuated widely during the period, hitting a
peak of well over $39 per ounce on October 27. The price broke sharply
on October 29, as the rumor (subsequently confirmed) swept the market
that the Swiss Banking Commission had advised Swiss banks of its view
that gold should no longer be included as part of the banks' cash
reserves. By early November the price had fallen to the $37.20-40 range,
about the same as a month earlier.
Euro-dollar market. Euro-dollar interest rates, after moving
up in September (counter to the trend in U.S. rates) declined substantially
during October and then held relatively stable in early November. Call
deposits averaged 6.38 per cent in November 5-10, down nearly 1/2
percentage points from early October; the three-month, which averaged
about 7-1/2 per cent in the latest week, declined about 7/8 per cent.
The excess of Euro-dollar rates over the cost of domestic
sources of funds, which had widened markedly in late September, was
reduced by the October decline in Euro-dollar rates. In early October
the call Euro-dollar rate exceeded the Federal funds rate by more than
a full percentage point; by late October call Euro-dollars were somewhat
cheaper, on average, than Federal funds. The three-month Euro-dollar rate
exceeded the cost of 60-09 day CD's (adjusted for the cost of required
reserves) by nearly 1-1/4 per cent in the second week of October; but in
IV - 11
late October this differential had narrowed to about 0.8 per
cent.
In recent days, however, the excess of Euro-dollar rates over
the cost of domestic sources of funds has widened once again as Euro-
dollar rates have remained fairly stable in the longer maturities (and
advanced moderately on call and one-month funds) while U.S. rates
have declined. On November 10, call Euro-dollars were quoted at 6-1/2
per cent, or 1-1/4 per cent in excess of the Federal funds rate; three-
month Euro-dollars, at 7-1/2 per cent, exceeded the (adjusted) cost of
60-89 day CD's by about 0.9 per cent.
Gross Liabilities of U.S. banks to their foreign branches
(including participations in domestic loans) declined about $550 million
from October 14 to November 4, to a total of $9.3 billion. This decline
in part reflected a decision by at least two banks to give up some of
their reserve-free historical bases (for calculation of required reserves
against Euro-dollar positions). In the four-week computation period
ended October 20, First National City of New York (which in late October
announced its intention to reduce its Euro-dollar takings) gave up about
$270 million of its reserve-free base and one other New York City Bank
reduced its reserve-free base by $165 million. Thus, it appears that in
the computation period ended October 28 the reserve-free base for banks
using an historical base was reduced by about $435 million, to $10.3 billion,
compared to the original May 1969 base of $11.2 billion. (Data are not
yet available for banks outside of New York).

IV - 12
Developments in some foreign national money markets may have
also contributed to the decline in Euro-dollar rates in recent weeks.
The Bank of France, on October 20, announced a 1/2 per cent reduction
in its discount rate, to 7 per cent, and the Belgian National Bank, a
day later, reduced its discount rate by 1/2 per cent, to 7 per cent.
Near the end of October major Canadian banks cut their prime lending rates
by 1/2 per cent to 7-1/2 per cent. Very short-term rates in the German
money market dropped sharply in late October (to about 5-6 per cent) but
have since rebounded to about 9 per cent. Until very recently the Swiss
money market was quite liquid, since large repatriations of funds had been
made by Swiss banks at the end of September.
SELECTED EURO DOLLAR AND U.S. MONEY MARKET RATES(monthly or weekly averages of daily figures)
Average for (1) (2) (3)= (4)month or Call (1)-(2) 3-monthweek ending Euro-$ Federal Differ- Euro-$Uednesday Deposit Funds ential Deposit
August 7.26 6.61 0.65 8.19Sept. 7.68 6.29 1.39 8.03Oct. 7 7.73 6.36 1.37 8.35
14 7.13 6.21 0.92 8.1821 6.08 6.18 -0.10 7.7628 6.00 6.11 -0.11 7.66
Nov. 4 6.10 6.07 0.03 7.5310 2/ 6.38 5 .386 0.522 7.53
p/ Preliminary.1/ Median rate offered by prime banks in New
of holding required reserves).2/ Data through Tuesday.
(5)60-89 dayCD Rate(Adj) I/
8.177.647.246.976.846.846 . 6 5
6.651
(6)=(4)-(5)Differ-ential
0.020.391.111.210.920.820.93O.G8 P/
York (adjusted for the cost

IV - 13
Cyclical developments in major industrial nations. In most
industrial countries, the main policy problem over the past year has
been to bring inflation under control by reducing the pressures of
excess demand on resources. This process has gone furthest in the
United States, Canada, and the United Kingdom, where there have been
actual declines in output, and where renewed advances in activity at
a moderate rate are now looked for. By the summer, some easing of
demand pressures had also been achieved in Germany, France and Japan,
permitting some recent relaxation of policies of restraint in the latter
two countries. In Italy there appears to be scope for further rapid
advances in output. In most smaller European countries, excess demand
pressures have remained severe, and new measures of restraint have
recently been introduced. For all countries, and especially for the
United Kingdom, the problems of cost-push inflation after excess demand
is reduced remain serious.
In the two major continental countries, Germany and France,
industrial production has been flat through the first 8 months of 1970,
unchanged from the high levels of activity reached by these economies
by the end of 1969. In Germany the economy's resources remain strained;
new orders in real terms have fallen since the beginning of the year,
but backlogs are still large. In France pressure on resources has
moderated sufficiently during the year to lead the authorities to
reduce credit restraint, particularly on consumer demand.
IV - 14
In Britain, some slack in the economy has developed this
year. Real output dipped in the first quarter, but since then has
been rising again. In Canada, real GNP has shown virtually no growth
since the first quarter of 1970, industrial production has declined
slightly, and unemployment has increased.
While inflationary pressures seem to be moderating in many
major countries, excess demand, rapidly rising prices, and growing
current account deficits have recently forced several smaller European
countries to take severely restrictive measures. These include a price
freeze in Sweden, both a price and a wage freeze in Denmark, and price
and wage controls in the Netherlands. The slowing in German economic
expansion may help the effectiveness of the various restraining measures
that the Dutch government is imposing on the economy.
For the future, there is uncertainty as to whether the desired
reduction in excess demand pressures in continental European countries
will be possible without some actual declines in real GNP next year, and
also whether the desired slowing of wage and price advances will follow
easily. But country representatives at an OECD forecasting session in
mid-October were reasonably optimistic on both scores.
In Germany pressures on resources have moderated slightly since
the beginning of the year. Industrial production has been essentially
flat and the inflow of orders in real terms has fallen. However, indicators
of final demand remain strong. Since the spring retail sales have been
IV - 15
advancing fairly strongly; in particular, consumer demand for durable
goods has been expanding rapidly. Domestic private investment demand
has remained at a high level. The current flatness of industrial out-
put is largely explained by the cessation and reversal of the inventory
build-up of steel and other materials that had been occurring earlier.
The German trade surplus continues large. While imports of
finished goods have continued to grow strongly, imports of crude and
semifinished materials have leveled off since the spring. On the other
hand, exports are continuing to rise rapidly, supported by large order
backlogs. Unit values of imports have declined since the spring, but
those of exports have risen, adding to the trade surplus in current value
terms. The surplus for 1970 is likely to equal the $5.2 billion registered
in 1969.
The German labor market, although remaining very tight, shows
signs of easing a little -- with job vacancies edging down and unemployment
up. Average hourly earnings rose very rapidly after the large wage settle-
ments of September 1969, but increases -- although large -- have been on
a smaller scale this year.
Wholesale prices for finished consumer goods and capital
equipment have continued to rise, while prices of materials have declined
a little since the spring. The consumer price index is rising at a year-
to-year rate of 4 per cent; recent slowing in monthly increases has been
due to decreases in food prices which are largely seasonal.

IV - 16
In France, the stabilization program that was introduced just
over a year ago has met with mixed success. The huge trade deficit of
1969 shifted to a small surplus and French official reserves grew as
confidence in the franc returned. Price increases, however, have been
larger than hoped for and unemployment has been increasing throughout the
year largely because of labor force growth. Industrial production was
flat in the January-August period.
In September 1969, as part of a post-devaluation package, the
Government had imposed severe restrictions on installment purchasing, in
order to reduce the level of imports and to curb consumer demand. At the
same time, tax and interest rate inducements to private savings were
offered. France's trade account rapidly returned to equilibrium and
consumer demand leveled off at the end of 1969 and remained virtually
unchanged through August 1970. The shift of resources to export production
exceeded official expectations.
Supported by buoyant external demand and a high level of private
domestic investment, real GNP was growing rapidly until recently -- at a
rate of about 6 per cent between the first half of 1969 and the first half
of 1970. When external and investment demand began to slacken off, the
authorities found it desirable to relax their restrictive policies somewhat.
The Bank of France's discount rate was lowered in two steps from 8 to 7 per
cent this summer, as the Euro-dollar rates declined. In September, install-
ment purchase terms were relaxed a little, and late in October the National
Credit Council abolished all bank credit expansion ceilings. However,
rediscount ceilings for individual banks were reduced. The Government has
drawn up a balanced budget for 1971; the 1970 budget will probably register a
small surplus.
IV - 17
In the United Kingdom, real GNP fell by over 1 per cent in the
first quarter of this year as both fixed capital investment and inventories
declined. However, GNP rebounded in the second quarter to about the level
of the last quarter of 1969, and has since apparently continued to grow at
about a 3 per cent annual rate, a rate that seems likely to be sustained
well into next year. The advance in consumption is expected to continue.
Also, export order backlogs are still substantial and the export sector
should contribute to continuing economic expansion.
The pattern of growth in the British economy since last spring
suggests future problems. Growth has been consumption-led, while industrial
investment lags, and wage and price increases continue to be rapid. The
United Kingdom is the clearest example among the industrialized countries
of inflation that is primarily of a cost-push nature. From January-February
through July-August of this year weekly wage earnings rose at an annual rate
of 13 per cent, while retail and wholesale prices rose at an annual rate of
7 per cent from the first through the third quarter.
The Conservative Government has emphasized the importance of
tightening monetary policy to counter inflation, and at the end of October
the Bank of England announced a rise in the special deposits requirements
effective November 11. The move is mainly significant as a signal that the
Bank of England and the Chancellor intend to press the clearing banks to
curb the rate of growth in their lending.
The Government has recently announced that it will cut public
expenditures and personal and corporate income taxes as of April 1971
(see Appendix A).

IV - 18
In the small open economies of continental Europe demand
pressures and external deficits created mounting problems and forced
the authorities to adopt some unusually stringent measures. In
Denmark and Sweden the already very restrictive monetary stance was
reinforced by a general price freeze and Danish wage rates have also
been partially frozen. Norway's inflation seems less serious and its
currency has not been subjected to periodic speculative attacks this
year as has been the case in Denmark and Sweden. Nonetheless, demand
pressures and worsening external accounts forced the authorities recently
to adopt a pointedly restrictive stance. Finland also has been pursuing
a strict incomes policy and Iceland has imposed price controls.
The economy of the Netherlands is faced with similar problems.
Pressure on resources remains severe because of high domestic as well
as foreign demand. The labor market is very tight, with the labor
shortage aggravated by an accelerated movement of border residents to
Germany, where wages are higher partly because of large increases in
wage rates and partly because of revaluation. Wage increases continue
to be very large. The resulting cost push on prices, augmented by the
DM revaluation, forced a relaxation in August of price controls that
were instituted in Anril 1969. Retail prices have been rising at an
annual rate of nearly 7 per cent, with non-food prices rising rather faster.
The Dutch authorities recently announced very restrictive
measures in the 1971 budget. These measures, which will be in effect
for a period of 12 months, include a wage freeze (effective January 1),
IV - 19
cutback in government spending and temporary hikes in some tax rates.
Monetary policy remains restrictive and consumer credit has been
further tightened.
Italy is one major European country where no slowing of
economic growth is likely next year. The Italian economy has been
bedeviled by damaging strikes that started in the autumn of 1969.
Although the major strikes were settled by the end of last year,
industrial activity continued to be affected by localized stoppages
and a prolonged political crisis through August of this year. Not
until the Colombo cabinet took office in August did confidence in
the lira reappear. Italian industrial production in the first 9
months of the year was only 4 per cent higher than a year earlier,
and after the initial recovery at the turn of the year it remained
fairly level until September, when a sharp pickup occurred.
Domestic output, reduced by the labor unrest, has been
insufficient to meet internal demand, particularly since inventories
had to be replenished after their severe rundown in 1969. This was
a major cause of the deficit in the external balance on goods and
services in the first half of 1970, equal perhaps to as much as 1.5
per cent of GNP.
Throughout 1970, monetary policy in Italy has been restrictive,
and since August it has been reinforced by some fiscal restraint in the
form of increased taxes on gasoline and on other items. Although the
restraining effects of these fiscal measures may be partially offset

IV - 20
by a reduction in the savings ratio -- which has been unusually
high this year -- demand pressures in Italy should moderate.
In Canada, this has been a year of economic adjustment,
with the Government vigorously pursuing anti-inflationary policies.
Real GNP hardly increased in the second quarter, after a strong
6.7 per cent annual rate rise in the first quarter and a 5.6 per
cent rise in the last quarter of 1969. Industrial production declined
slightly in the second quarter, and this tendency persisted in the
third quarter. Labor disputes, including the continuing automobile
strike, contributed to this leveling in output and to the high level
of unemployment in recent months. Exports and construction have
been major elements sustaining domestic output this year. There has
been a marked slowing in the rate of price increases, but wage increases
in recent settlements exceed 8 per cent per year when averaged out
over the contract period.
In Japan, the economy is experiencing its longest
advance in postwar history. Most signs point to a further strong
advance next year. For the fiscal year ending March 1971, the GNP
is estimated by the Japanese Economic Research Center to increase
by 11.4 per cent in real terms as compared with a 13 per cent real
growth in the preceding fiscal year.
All sectors of the Japanese economy have shared in this
year's expansion but business investment plans appear to have eased
moderately since mid-year. From September 1969 to mid-1970 the Bank

IV - 21
of Japan pursued a tight monetary policy. Since July, however,
commercial banks have been allowed to expand their credits at
a faster rate. On October 28, the Bank of Japan lowered its
basic discount rate by one-quarter of a point.
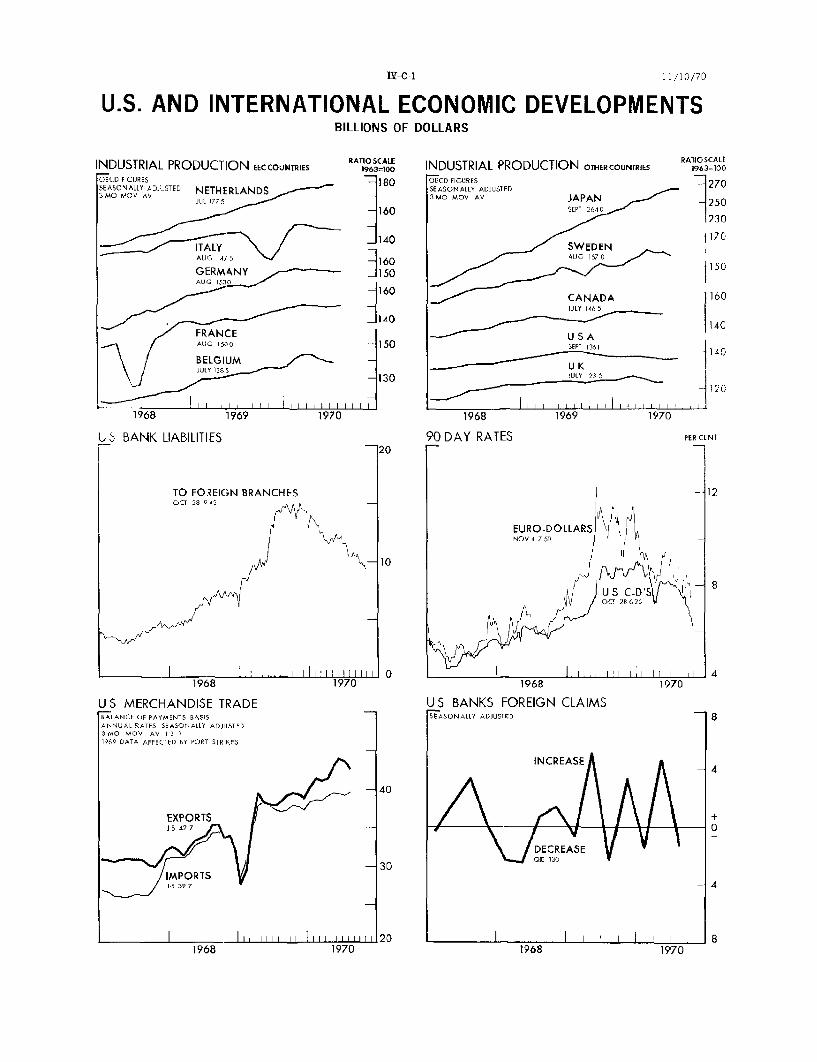
U.S. AND INTERNATIONAL ECONOMIC DEVELOPMENTSBILLIONS OF DOLLARS
INDUSTRIAL PRODUCTION EECCOUNTRIESOECD F GURESSEASONALLY ADJUSTED NETHERLANDS3MO MOV AV L
JUL 1775
ITALYAUG 7 5
GERMANYAUG 1530
RATIO SCALE19637100
180
160
]140
160150
160
FRANCEAUG D150 -
BELGIUMJULY 138
I l,, , i, I , II1968 1969
LU BANK LIABILITIES
1970
US MERCHANDISE TRADESBLANCE OF PAYMENTS BASFS
ANNUAL RATES SEASONALLY ADJUSTED3 M MOV AV I 2969 DAATA AFFECTED BY PORT STRIKES
140
150
130
R A7o SCALEINDUSTRIAL PRODUCTION OTHERCOUNTRIES 9 A3-100
oECD FIGURES 270SEASONALLY ADJUSTED3MO Mov AV JAPAN 250
SEPT 361140- 230
16D SWEDENAUG 1570
150
/ CANADA 160JU LY 146 5 4
-USA
19Y I638 196 19
1968 1969 1970
JS BANKS FOREIGN CLAIMSSEASONALLY ADJUSTED
INCREASE
DECREASEom Q 130
I-C-1 11/10/70
1968 1968 1970

Appendix A: BRITISH GOVERNMENT ANNOUNCES TAX AID EXPENDITURE CUTS*
Britain's Conservative Government announced on October 27that it will reduce public sector expenditures below the amounts thatwould have been spent had the Labor Government remained in office.The decreases in planned outlays will be accompanied by moderate cutsin both personal and corporate income taxes.
The measures presented to Parliament by Chancellor Barberare intended primarily as a long-range program for reducing thegovernment's role in guiding economic activity and in subsidizing avariety of goods and services consumed by the public. Chief amongthe slashes in public sector outlays -- which include total netexpenditures by the central government and local authorities andcapital expenditures by the nationalized industries and other publiccorporations -- are the abolition of grants to finance private sectorcapital investment; the replacement of deficiency payments to Britishfarmers by a system of variable levies on agricultural imports tomaintain a floor under farm prices; and elimination or reduction ofa number of social welfare subsidies. For example, prescriptioncharges will be raised, recipients of dental care will have to payhalf of the cost of treatment, the price of school meals will beraised, and -- in 1972 -- rents in public sector housing are to beraised to more economic levels.
Though there will be some decrease below previous plans inpublic sector demand for goods and services -- for instance, defensespending and capital investment by nationalized industries will becut -- the emphasis is on curtailing transfer payments, the programnot being intended to restrict total output or growth. Thus invest-ment grants will give way to more liberal depreciation allowances, inorder to encourage private sector capital investment with a minimumof government participation in determining the allocation of investment.The objective of switching to import levies is not to reduce farm incomebut to transfer the burden of supporting it from the taxpayer to theconsumer, who will have to pay higher prices for farm produce. Nor arethe cutbacks in social welfare subsidies intended to reduce consumptionof the items they help pay for. The theory is that offsetting reductionsin taxes will prevent such a decline.
* Prepared by Martin J. Kohn, Europe and British Commonwealth Section,Division of International Finance.

A - 2
However, to prevent hardship resulting from the redistributionof income implicit in the program, the Government will increase welfarebenefits for those at the bottom of the income scale. Thus the maximumlevel of income below which individuals or families are entitled toreceive various welfare benefits free of charge is being raised. Further-more, the raising of rents on public sector housing will be accompaniedby a system of rebates to needy tenants occupying rental housing, privatelyas well as publicly owned. That amounts to a small negative income tax --to be known as the Family Income Supplement -- will also be introduced in1972. It will take the form of weekly payments up to £3 to poor families,even where the head of the household is employed, and will be in additionto other welfare benefits.
The full impact of the program will not be felt for several years.In 1974-75, it is anticipated that public sector expenditures will bereduced by about £1.1 billion in 1970-71 prices (after deducting the revenueloss from the liberalized depreciation allowances) -- or by about 4-1/2per cent -- below what they otherwise would have been. The Governmentestimates that the new program will cut the rate of growth of real publicsector expenditures to 2.8 per cent per annum from 1971-72 to 1974-75 fromthe 3.5 per cent annual rate it maintains they would otherwise have grownat in the absence of these changes.
In the fiscal year 1971-72 -- which begins April 1 -- savingswill total about £330 million (equal to about 3/4 of one per cent of GNP)and will apparently be slightly more than offset by the tax cuts. The basicrate of personal income tax is being reduced, effective next April, from41.25 to 38.75 per cent, a step expected to cost the Government over £300million annually. The corporate tax reduction, from 45 to 42.5 per cent,applies to taxes due in the current fiscal year and will lower revenue in1969-70 by about £60 million. The estimated loss in the next fiscal yearwill be about £90 million.
Though the margin by which tax cuts are expected to exceedspending cuts is narrow, the new program may nevertheless have someinflationary repercussions, for two main reasons. First, cutting taxesin the current inflationary climate may further fuel inflationary expecta-tions; and second, the rise in food prices stemming in particular from thenew method of supporting farm income -- expected to be introduced soon --will increase already high wage demands. Consequently, the new program,whatever its long-range merits, seems likely to hamper the Government indealing with Britain's most pressing economic problem -- severe wage andprice inflation.

APPENDIX B: STAFF ESTIMATE OF HIGH EMPLOYMENT SURPLUS*
The high employment surplus is an estimate of the surplus ordeficit in the Federal sector (NIA accounts) that would exist if theeconomy were operating at a hypothetical high employment level of eco-nomic activity. Our estimates show a shift in the high employmentbudget from a large deficit (about $12.0 billion) in the 1967-68 periodto a surplus of nearly $4.0 billion in calendar year 1969. The staffnow projects a small high employment budget deficit of $1.1 billion incalendar 1970 followed by a nearly $6.0 billion surplus in 1971 asshown in Table I below. This projected shift toward fiscal restrictionin 1971 is expected to occur despite an estimated increase in the actualNIA budget deficit from $11 billion in 1970 to almost $15 billion in 1971.Thus the projected deficit in the NIA budget is viewed entirely asthe result of a shortfall in receipts arising from reduced economicgrowth. The staff estimates indicate that the gap between potential andactual GNP will be $24.6 billion for the 1970 calendar year and $57.5billion for 1971. The shortfall in actual receipts associated withthese gaps is $8.2 billion and $18.9 billion respectively. The largerelative shortfall in receipts results from the fact that corporateprofits--on which marginal tax rates are high--have declined relativeto other income shares under current sluggish economic conditions. Incalculating the high employment budget, however, income shares arecalculated at high employment levels, as discussed below.
Calculating and Interpreting the High Employment Budget
The high employment budget is an attempt to measure discretionaryfiscal activity alone. It has long been recognized that the actualFederal surplus or deficit is not a satisfactory measu of discretionaryfiscal policy because changes in revenues and to some extentexpenditures reflect not only the budget's influence on the economybut also the economy's influence on the budget. Any analysis of thetotal fiscal impact of the budget should include both the automaticand the discretionary aspects. But measures of discretionary fiscalpolicy must abstract from the automatic feedback effect of fluctuationsderiving from business cycles. 1/ The high employment budget seeks toaccomplish this objective by estimating what the budget position wouldbe if there were no business cycle and if the economy were growingalong a path of relatively full capacity output.
* Prepared by Bill Beeman, Sally Hey and Helmut Wendel, GovernmentFinance Section.
1/ The feedback effect occurs mainly because of the sensitivity ofFederal receipts, particularly corporate profit and personal incometax receipts, to business fluctuations.

(Billions ofHIGH EMPLOYMENT BUDGET
current dollars; seasonally adjusted
Receipts ExpendituresCalendarYear
1967I
III
IV
1968I
III
III
IV
1969
I
III
IVIV197 e
I
IIIIVeI
IIIIIIVe
Ie
IVe
150.6146.2
148.5
152.7
155.1
170.6
158.0
161.6
179.2
183.7
195.3
190.4
194.9
195.6
200.1
204.3
199.8
204.0
203.7
209.7
225.5
218.6
224.5
228.2
230.7
163.7159.4
161.3
165.0
169.0
181.8
174.5
180.8
184.3
187.4
I 1.4
137.7
189.4
192.5
195.9
205.4
197.1
209.9
206.7
207.9
219.7
215.5
218.9
221.2
223,3
annual rates)
P GRap eceiptsGNP GaGa Gap
Surplus orDeficit
-13.1-13.2
-12.8
-12.3
-13.9
-11.2
-16.5
-19.2
- 5.1
- 3.7
3.9
2.7
5.5
3.1
4.2
- 1.1
2.7
- 5.9
- 3.0
1.8
5.8
3.1
5.6
7.0
7.4
- 6.0
-19.2
-12.8
+24.6
+57.5
e--projected
- .6
- 4.8
- 5.3
+ 8.2
+18.9

A general description of the method employed by the staff andmost other analysts to estimate the high employment budget is ratherstraight forward. The staff estimate of high employment receipts involves(1) defining high employment and calculating a hypothetical high-employment level of GNP in current dollars, (2) estimating three incomecomponents of high employment GNP--corporate profits, personal incomeand wages and salaries, and (3) applying the appropriate tax ratesto the income components to get the high employment estimate of thefour categories of receipts in the Federal sector accounts. 2/ Allreceipts that result from the trend growth in potential output andincomes are included in high employment receipts. Thus the differencebetween high employment and actual receipts measures the effect ofpurely cyclical automatic flexibility in tax collections.
Adjustments of expenditures are less complicated, since itis assumed that, except for unemployment compensation, actual expendituresare not related to cyclical movements in the level of economic activity.Thus high employment expenditures equal actual expenditures adjustedfor changes in unemployment compensation. However an increase inexpenditures does not appear as a discretionary change in the budgetbalance if there is a corresponding growth in potential receipts.Thus the secular growth in the size of the economy shows up as a growthtrend in potential receipts. If there is no corresponding growth inexpenditures the high employment surplus would increase to hugeamounts over time. The presumption is that the budget would maintaina constant degree of influence on an economy that operates along agiven growth path, when the trend growth in receipts and expendituresis the same.
Changes in the high employment budget surplus or deficitgive an indication of the direction of change in discretionary fiscalpolicy. The budget balance, however, does not measurediscretionary changes in the size of the public sector relative tototal output if, for example, both receipts and expenditures increasefaster than potential GNP. This is an aspect of fiscal policy whichis also important according to traditional theory. An additional short-coming of the high employment budget (as well as the actual budget)is that any dollar of receipts and expenditures is given the same weight,though the impact on the economy of different categories need not beidentical.
A number of technical problems arise in estimating highemployment receipts. Because a considerable amount of judgement must
2/ These income components are proxies for the actual tax base. Thefour categories of NIA receipts are personal taxes, corporateprofit tax accruals, indirect business taxes, and socialinsurance contributions.
be used to resolve these problems, there is substantial variabilityin the estimates of different analysts. Some of the problem areas and
the staff method of dealing with them are discussed briefly below.
(1) Treatment of price level changes
Perhaps the most serious difficulty involves the choice of
deflator used to convert potential real GNP to current dollars. 3/Ideally, the deflator employed in the calculation should not be affected
by economic conditions. Since the GNP deflator includes the impactof price conditions generated by the cycle, it is not an appropriatemeasure. Yet most estimates of high employment GNP--both for the pastand the projected period--use the GNP deflator and thereby seriouslybias the estimate of the high employment receipts.
When actual prices (rather than prices that would prevail inthe economy of steady high employment growth) are incorporated intoreceipts estimates for historical periods of excess demand inflation,estimates of high employment income and receipts are overstatedbecause no adjustment is made for (stabilizing) revenue gains arisingfrom price acceleration. Similarly in projections for future periods,the high employment budget can be made to appear more restrictivesimply by assuming a higher rate of inflation.
The effects are not symmetrical over the cycle. High employ-ment revenues are exaggerated during periods of excess demand inflation,but when output is below potential, high employment revenues areunderstated because the price rise is lower than it would be athigh employment. The latter distortion is not as important, however,because average prices rarely decline even during a recession (only therate of increase is slowed). The upward ratchet effect on pricesof excess demand inflation on the other hand has a cumulative effectover a period of years that can seriously distort the estimates.Nevertheless the effect of inflation on receipts needs to be incorporatedin the estimates at some point--at least into the historical data--since public policy generally does not seek to push prices back tothe level that existed prior to an inflation.
No completely satisfactory method of dealing with the priceproblem has been found. The Board staff has chosen not to employ thepublished implicit price deflator, but instead the staff estimatesfor past and projected periods uses a moving average of the deflatorproposed by Arthur Okun. This method was designed to compensate forinflation that is avoidable in the short-run while permitting theup ard ratchet of the past to stand. The Okun deflator is, in effect,
3/The prior estimate of the growth in potential real GNP also raisessome difficulties. The higher the growth rate assumed, the morerestrictive discretionary policy appears. However, the staff doesnot attempt to estimate this figure, but adopts the growth pathcalculated by the CEA.
an average of the rate of price increase four quarters prior to theestimated quarter and a "reasonable" high employment increase of 2per cent annually. The staff uses a moving average of the Okun deflatorbecause of the instability in the series reflecting changes in theGNP deflator four quarters past. The calculated change in the deflatoris added to the actual level of prices four quarters ago.
The substitution of the staff's adjusted deflator for thepublished GIP deflator has a considerable impact on the estimateof potential GNP. During periods of rapid price acceleration the adjusteddeflator increases less rapidly and follows a relatively smoothgrowth path at a level below the published deflator. This price adjustmenttends to make the Staff estimate of high employment receipts systemticallylower in periods of inflation than other estimates using the actualdeflator. 4/
(2) Measurement of income comoonents
The estimation of the major components of GNP at highemployment (the proxies for the tax base) is a critical step in thecalculations because shifts in the components over time greatly affectreceipts. In general, estimates of high employment income sharesare based upon an examination of actual shares in past periods ofhigh employment, generally specified as approximately 4 per centunemployment. The corporate component is far more critical than theestimate of the other income shares--personal income and wages andsalaries--used in the calculations. A dollar increase in the corporateshare will add more than 42 cents to high employment revenues, whilea dollar increase in the personal income share will increase personaltax receipts by only about 11.5 cents. Variations in estimates ofthe high employment corporate profits share over time account forsome of the discrepancies among estimates of the high employment budgetby various analysts.
Figure 1, below, shows measured corporate profits beforetax as a per cent of actual GNP for most of the post- World War IIperiod. Though there appears to be a downward trend in the corporateprofit component over the period, this trend is somewhat obscuredby the large cyclical movements of the corporate profit share. 5/ In
4/ Although the adjusted deflator appears to be appropriate in earlyperiods of excess demand inflation, its treatment of the (costpush) inflation momentum during economic slowdown is more questionable.During such periods, the attainment of high employment presumablywould require greater than actual inflation. Thus the Okun formuladoes not show the level of receipts that would be attained ifemployment were maintained (or restored) under the condition actuallyprevailing, but rather the condition that might have been achievedif the price momentum begun in a earlier period were not so strong.
5/ These are not income shares in the traditional sense because they donot relate total factor payments but to GNP.

an effort to isolate the time trend from cyclical behavior, the corporateprofits share for the 1949-1969 period was regressed on time and therate of change in real GNP. The resulting time trend in the 6/corporate profits share at high employment is also shown in Figure .-These corporate shares, which are incorporated in the Staff estimates,are somewhat lower than the shares used by some outside analysts,particularly for the period after 1960. This fact partiallyexplains that our estimates of the high employment surplus are oftenlower than those of other analysts.
(3) Calculations of tax receipts
All major discretionary changes in the tax system must beincorporated in the effective tax rates applied to the income shares.Initially these effective tax rates are the tax rates observed inbenchmark high employment years. Between these benchmark years theeffective rates have to be adjusted for the effects of major discretionarychanges in the tax laws.
In some cases considerable judgement is involved in estimatingthe future revenue effect at high employment of these tax lawchanges. Generally the staff incorporates the expected (or historical)effect on actual receipts rather than on high employment receipts,as the difference is rather small. Another complication arises inthe matter of the timing of the effects of discretionary tax changes.As a general rule the high employment budget follows the procedureused in NIA accounts which puts most categories of receipts on aliability basis. But in some instances NIA procedures are not followed,if such treatment is inappropriate for purposes of measuringstabilization policy. For example, retroactive changes are phasedinto the high employment budget from the time the change becomes alaw rather than from the period of liability. Finally the tax ratesmust be adjusted between benchmarks to allow for drift in effectivetax rates due to the combined effect of such things as economic growthand the progressivity of tax rates.
6/ Of the several equations examined the best fitting equation was:1 2
7 = 7.68 + 6.55 ( -- ) + 0.27G R = .78
V t
wherefTis the corporate profits share before taxes, t is time, andG is the rate of change in real GNP. All of the coefficients weresignificant in terms of t-tests.

B-7
FIGURE I
ACTUAL & HIGH EMPLOYMENT CORPORATE PROFITSAS A % OF GNP (1949-1969)
15.0
14.5
14.0 - Actual
13.5
13.0
12.5
12.0 '
11.5 '
11.0
High Employment10.5
10.0
9.5
- Ac tua 1----------- High Employment
1956 1958 1960 19621950 1952 1954 1964 1966 1968


