Embed Size (px)
Citation preview
Prefatory Note The attached document represents the most complete and accurate version available based on original copies culled from the files of the FOMC Secretariat at the Board of Governors of the Federal Reserve System. This electronic document was created through a comprehensive digitization process which included identifying the best-preserved paper copies, scanning those copies,1
and then making the scanned versions text-searchable.2
Though a stringent quality assurance process was employed, some imperfections may remain. Please note that some material may have been redacted from this document if that material was received on a confidential basis. Redacted material is indicated by occasional gaps in the text or by gray boxes around non-text content. All redacted passages are exempt from disclosure under applicable provisions of the Freedom of Information Act. 1 In some cases, original copies needed to be photocopied before being scanned into electronic format. All scanned images were deskewed (to remove the effects of printer- and scanner-introduced tilting) and lightly cleaned (to remove dark spots caused by staple holes, hole punches, and other blemishes caused after initial printing). 2 A two-step process was used. An advanced optical character recognition computer program (OCR) first created electronic text from the document image. Where the OCR results were inconclusive, staff checked and corrected the text as necessary. Please note that the numbers and text in charts and tables were not reliably recognized by the OCR process and were not checked or corrected by staff.
Content last modified 6/05/2009.
CONFIDENTIAL (FR)
CURRENT ECONOMICand
FINANCIAL CONDITIONS
Prepared for the
Federal Open Market Committee
By the Staff
BOARD OF GOVERNORS
OF THE FEDERAL RESERVE SYSTEM April 6, 1966
CONFIDENTIAL (FR)
CURRENT ECONOMIC AND FINANCIAL CONDITIONS
By the StaffBoard of Governors
of the Federal Reserve System
April 6, 1966
I- 1
SUMMARY AND OUTLOOK
Outlook for GNP
The advance in business activity now appears a little stronger
than indicated three weeks ago. Output has continued to rise sparked
by further expansion in final outlays by consumers, business and govern-
ment. Inventory accumulation, while substantial, appears to be somewhat
lower than in the final quarter of last year. Over-all, we estimate
a first quarter rise in GNP that will approximate the very rapid fourth
quarter increase; the second quarter is expected to maintain a similarly
rapid pace of expansion.
Spurred by very sharp gains in income and employment, personal
consumption expenditures in the first quarter appear to have increased
more than in the fourth quarter, despite the rise in social security
taxes in January. Business fixed investment was up sharply from the
preceding quarter, a larger increase than anticipation surveys had
suggested. Substantial upward revisions in manufacturers' inventories
for January point to a first quarter increase only moderately below the
fourth quarter and about in line with what was projected here earlier.
On the other hand, defense purchases of goods and services appear to have
lagged slightly behind previous estimates.
Maintenance of the rapid pace in over-all activity in the
second quarter is expected to come mainly from further large gains in
consumption, business fixed investment and Federal spending. These
second quarter projections do not allow for a cutback in plant spending
I -2
in response to the President's request; in any event, the second quarter
may be too early to expect to see a response in the aggregate figures.
Neither do these projections allow for a speed-up in Federal defense
spending above the pattern implied in the Economic Report; a reassess-
ment of defense needs currently under way, however, may change prospects
for this and subsequent quarters, Meanwhile, Congressional approval
has been given or appears likely to be given to nondefense programs
and military pay increases costing over one billion dollars more than
allowed for in the Budget.
Resources and prices
Further expansion in business fixed investment continues to
add to productive capacity, but final demands are rising rapidly enough
to maintain and possibly intensify pressure on utilization rates. In
important sectors of durable goods manufacturing unfilled order backlogs
have continued to rise, even while manufacturers, as a group, have been
producing at or over 92 per cent of capacity.
Demands for labor are continuing very strong. Shortages of
experienced adult workers are becoming a major factor in labor market
developments, and a growing proportion of current adult unemployment is
of short-term duration and frictional in nature. Although unemployment
rose slightly in March, as did the unemployment rate, the increase was
mainly among teenagers, a group whose unemployment rate tends to
fluctuate from month to month.
I - 3
A decline in the unemployment rate to a second-quarter average
of about 3.5 per cent is expected to accompany the projected further
rapid rise in GNP; much of the decline will have to reflect increased
employment in the teenage group, since adult unemployment is already
about as low as during the Korean conflict.
Hourly earnings in manufacturing are continuing to rise at a
rate slightly faster than in 1965. At the same time, gains in output
per manhour have slowed and unit labor costs have begun to show an
upward trend. In union and nonunion sectors outside of manufacturing,
recent data indicate wage gains have continued to accelerate. With
increases well above productivity gains, higher wage costs are contribu-
ting to upward price pressures in construction, retailing, services,
and other locally oriented activities.
Even though food prices recently have tended to stabilize,
industrial commodity price increases have become more widespread, and
declines fewer and largely restricted to some consumer goods industries.
Purchasing agents have increasingly reported some hedging against pro-
spective shortages and further price increases. Federal actions
recently have been taken to limit upward price pressures in particular
cases such as hides and nonferrous metals.
Declines in food prices are in prospect for later in the year,
and this should moderate the rise in the total wholesale and consumer
price indexes. The weekly wholesale price measures -- which cover only
a limited range of commodities -- have shown stability recently, but
I-4
the pressures extent on labor and plant resources, and the projected
further growth in demands, strongly suggest continued upward price
pressures throughout the nonfarm economy.
Availability of lendable funds
Restrictive bank lending policies are likely to continue,
and probably become more general over the next few months, as banks
continue to find it necessary to liquidate securities in order to satisfy
loan customers. However, there may be some respite from these pressures
at very large banks, where net time deposit inflows have recently
accelerated from the sharply reduced rates of earlier in the year. This
turn-around appears to reflect the higher recent offering rate on both
negotiable CD and other time deposits; some of the funds appear to have
been diverted from smaller banks and also from nonbank financial
institutions.
So long as loan demands remain strong, the more aggressive
competition for funds from large banks may be expected to continue and
tend to extend restraint throughout the financial system. Smaller banks
and nonbank intermediaries will have to raise deposit rates or face
reduced deposit growth and increased asset liquidation. Most recently,
it appears as if smaller banks have reduced their municipal acquisitions,
after sharply increasing them earlier in the year.
With respect to nonbank institutions, savings and loan
associations and mutual savings banks, already under pressure earlier
in the year, are likely to experience continued difficulty in obtaining
I - 5
new funds from the public. Despite reduced net inflows from the public,
the total flow of funds to mortgage markets was strongly supported in
the first quarter by a contraseasonal volume of advances to savings and
loan associations from the Home Loan Bank System and by mortgage
purchases by FNMA. These sources of support are likely to be
more limited in the period ahead. Not only has FNMA taken further steps
to reduce the volume of the mortgage purchases, but the Federal Home
Loan Banks -- responding to the increased costs of their own borrowing --
have also raised rates on advances to record levels, in some cases as
high as 5-3/8 per cent.
Outlook for credit demands
Business loans at banks expanded at about a 15 per cent annual
rate in February-March. After a probable bulge over the April tax date,
some slowing of the growth rate seems likely. But business loan demands
may continue sufficiently strong to keep the expansion rate at about
the same 10-12 per cent range as obtained in most of the second half
of 1965.
Higher interest rates and credit rationing at banks may help
to inhibit some business borrowers, with the result that some financing
demands may be diverted to other sectors of the credit market. In the
weeks just past, however, the aggregate flow of new corporate and
minicipal bond offerings moderated, contributing to the recent sizable
downturn in yields. Security flotations were exceptionally high in the
winter, in part apparently reflecting some anticipatory borrowing.
I-6
Because of this and also the postponements of several issues as yields
reached peaks, the calendar immediately ahead appears light relative
to earlier in the year, although about equal to a year ago. Still, with
stringency continuing at banks, capital market financing may be supported
as some borrowers find the new market rate levels attractive. At the
same time, the money market may have to absorb more liquid asset dis-
position and larger commercial and finance company paper offerings.
Looking beyond the immediate capital market calendar, pro-
jections of continued heavy capital spending by both businesses and State
and local government suggest that demands for long-term funds will
remain large. With interest rates presently sharply below their early
March high, borrowers may be encouraged to add further to near-term
offerings, which would renew upward pressures on interest rates.
While there are no indications as yet of a sizable build-up in calendar,
it still appears likely on balance that rates in corporate and municipal
markets will rise above current levels. The mortgage market has not
shared in the easing of credit conditions that have recently characterized
bond markets, and present indications are for continued upward pressures
on rates and terms in this sector.
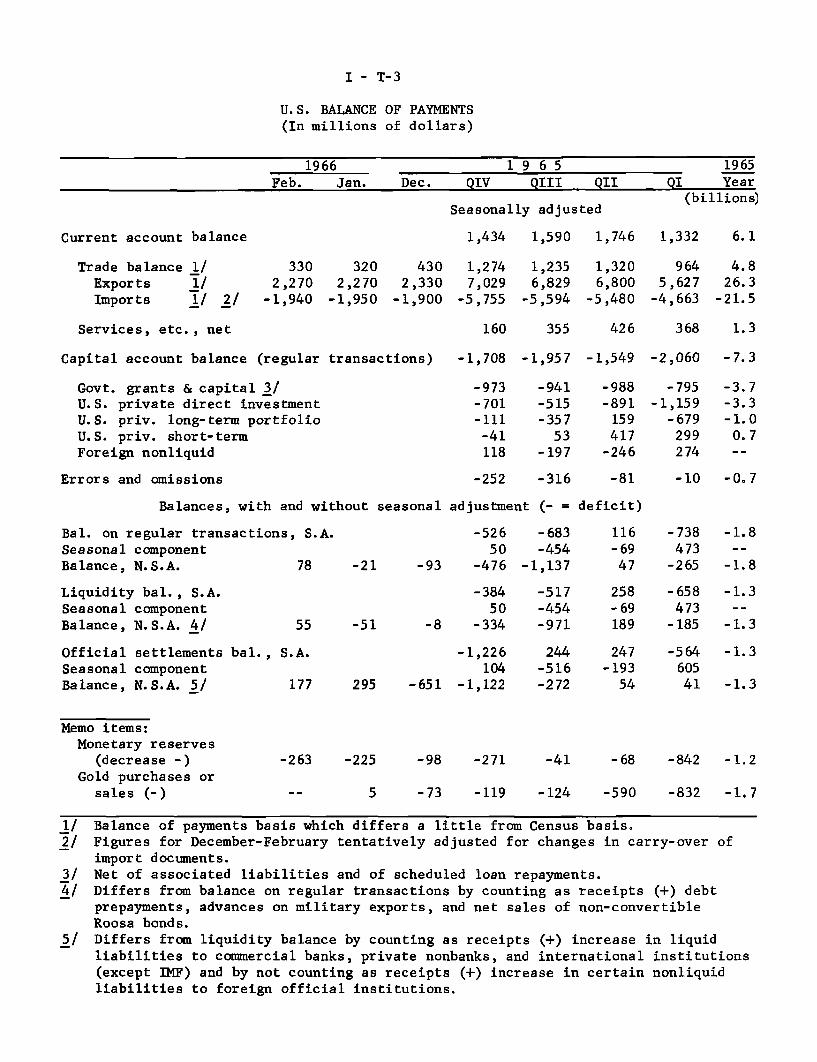
Balance of payments
In the first quarter of 1966, the payments position showed
neither the kind of improvement earlier hoped for by the Administration
nor a renewed deterioration such as has more recently been feared.
I- 7
The deficit on the liquidity basis remained at an annual rate of about
$1-1/2 billion. On the official reserve transactions basis, the deficit
fell very sharply from the swollen level of the previous quarter as
foreigners added to their liquid dollar balances after reducing them
earlier.
The merchandise trade surplus shrank to an annual rate of $4
billion in January-February, with exports down and imports up. This
deterioration in trade was offset by improvements elsewhere in the
balance of payments accounts that cannot yet be identified. While
seasonally adjusted reflows of U.S. bank credit increased sharply from
the fourth quarter to January-February as domestic credit conditions
tightened, there was a nearly offsetting increase in U.S. purchases of
foreign securities (mainly Canadian) newly issued in this country.
Probably investment income receipts recovered from their sharp fourth-
quarter dip, but data on these and on other service and capital trans-
actions are lacking.
There is little prospect of substantial over-all improvement
in the balance of payments this year. The outcome will depend importantly
on domestic demand and credit developments: e.g., on whether inflationay
pressures are sufficiently restrained to permit recovery of the merchandise
trade surplus; on whether the continued pressure on U.S. banks leads to
further reflows of bank credit; and on the extent to which direct invest-
ment outflows are held down by a squeeze on the liquidity of U.S.
I-8
corporations as well as by the Commerce Department's voluntary program.
A favorable resolution of these uncertainties might hold the liquidity
deficit in 1966 to a rate of about $1-1/2 billion despite increasing
military expenditures in Vietnam, with the official settlements
deficit somewhat lower, although not as low as in the first quarter.
April 5, 1966
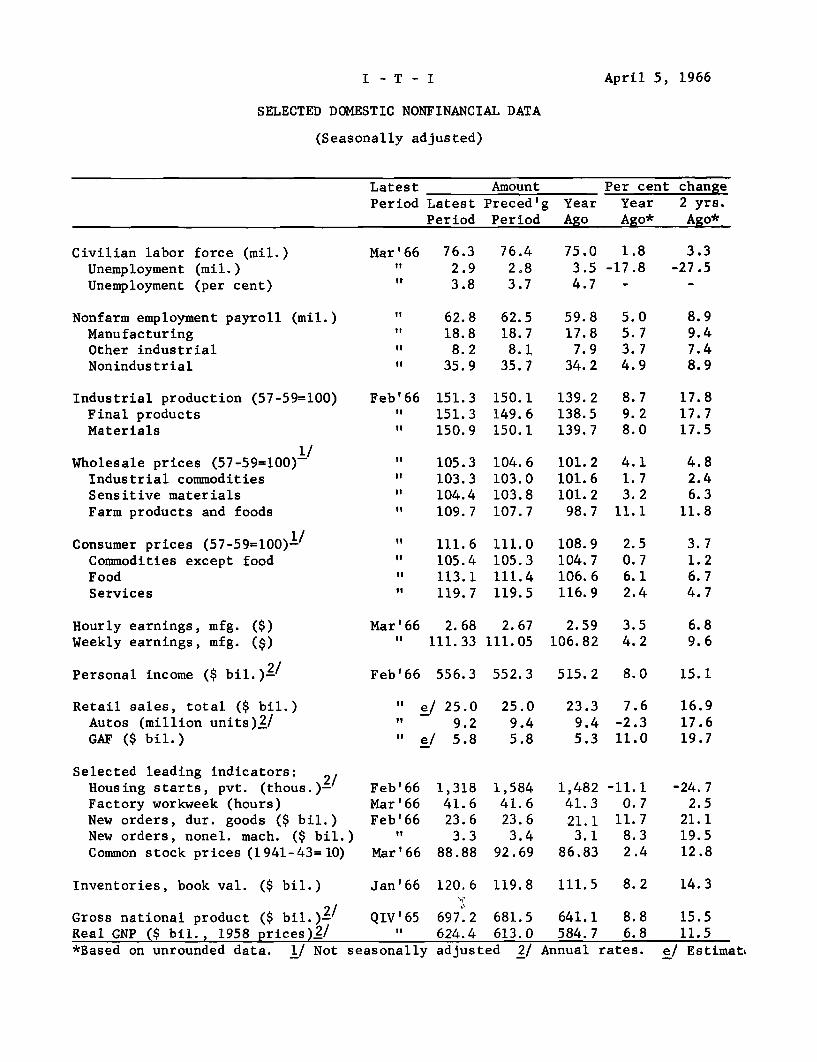
SELECTED DOMESTIC NONFINANCIAL DATA
(Seasonally adjusted)
Latest Amount Per cent changePeriod Latest Preced'g Year Year 2 yrs.
Period Period Ago Ago* Ago*
Civilian labor force (mil.)Unemployment (mil.)Unemployment (per cent)
Nonfarm employment payroll (mil.)ManufacturingOther industrialNonindustrial
Industrial production (57-59=100)Final productsMaterials
1/Wholesale prices (57-59=100)~
Industrial commoditiesSensitive materialsFarm products and foods
Consumer prices (57-59=100)-/Commodities except foodFoodServices
Hourly earnings, mfg. ($)Weekly earnings, mfg. ($)
Personal income ($ bil.)-'
Retail sales, total ($ bil.)Autos (million units) 2/GAF ($ bil.)
Selected leading indicators:Housing starts, pvt. (thous.)-2
Factory workweek (hours)New orders, dur. goods ($ bil.)New orders, nonel. mach. ($ bil.)Common stock prices (1941-43=10)
Inventories, book val. ($ bil.)
Gross national product ($ bil.) /
Real GNP ($ bil., 1958 prices)2/
Mar'66it
It
itiii
I11
Feb'66If
If
76.32.93.8
62.818.88.2
35.9
151.3151.3150.9
105.3103.3104.4109.7
111.6105.4113.1119.7
76.42.83.7
62.518.7
8.135.7
150.1149.6150.1
104.6103.0103.8107.7
111.0105.3111.4119.5
Mar'66 2.68 2.67" 111.33 111.05
Feb'66 556.3
" e/ 25.0S 9.2
" e/ 5.8
Feb'66Mar'66Feb'66
Mar'66
1,31841.623.6
3.388.88
552.3
25.09.45.8
1,58441.623.6
3.492.69
Jan'66 120.6 119.8
QIV'65 697.2" 624.4
681.5613.0
75.03.54.7
59.817.87.9
34.2
139.2138.5139.7
101.2101.6101.2
98.7
108.9104.7106.6116.9
2.59106.82
1.8-17.8
5.05.73. 74.9
8.79.28.0
4.11.73.2
11.1
2.50.76.12.4
3.54.2
3.3-27.5
8.99.47.48.9
17.817.717.5
4.82.46.3
11.8
3.71.26.74.7
6.89.6
515.2 8.0 15.1
23.39.45.3
1,48241.321.1
3.186.83
111.5
7.6-2.311.0
-11.10.7
11. 78.32.4
16.917.619.7
-24.72.5
21.119.512.8
8.2 14.3
641.1 8.8 15.5584.7 6.8 11.5
*Based on unrounded data. I/ Not seasonally adjusted
I - T - I
2/ Annual rates. e/ Estimati
April 5, 1966
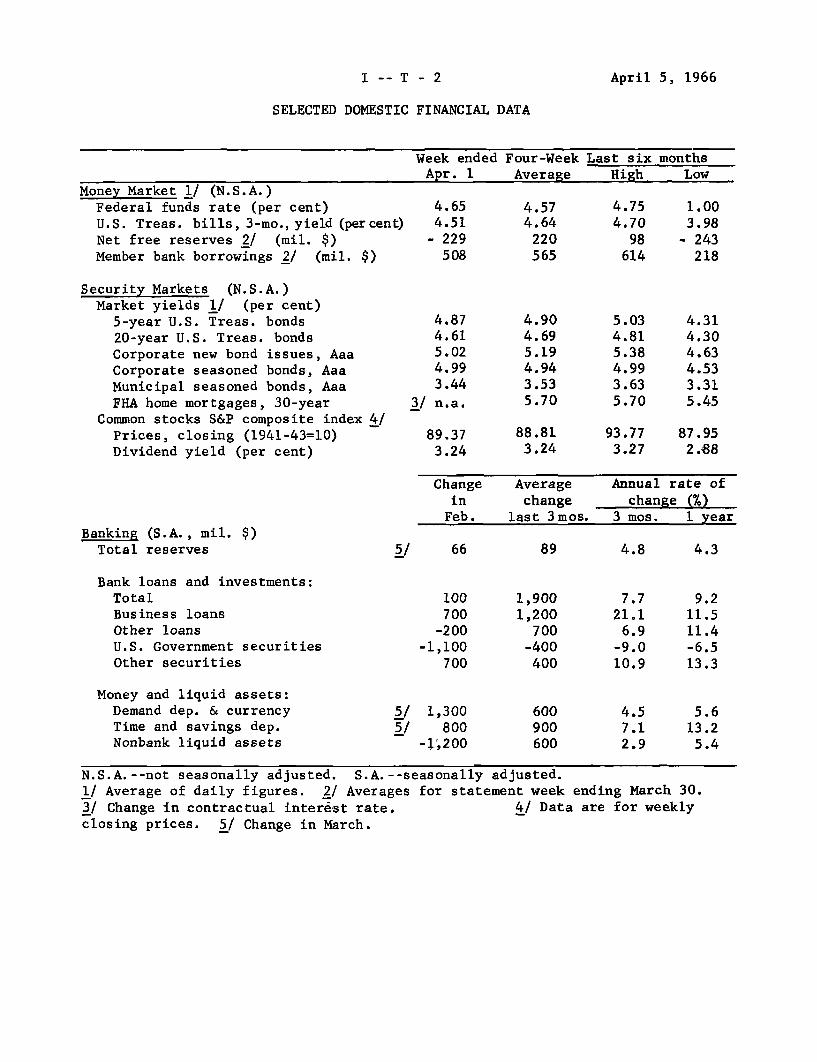
SELECTED DOMESTIC FINANCIAL DATA
Week ended Four-Week Last six monthsApr. 1 Average High Low
Money Market 1/ (N.S.A.)Federal funds rate (per cent)U.S. Treas. bills, 3-mo., yield (percent)Net free reserves 2/ (mil. $)Member bank borrowings 2/ (mil. $)
4.654.51
- 229508
4.574.64
220565
4.754.70
98614
Security Markets (N.S.A.)Market yields 1/ (per cent)
5-year U.S. Treas. bonds
20-year U.S. Treas. bonds
Corporate new bond issues, Aaa
Corporate seasoned bonds, Aaa
Municipal seasoned bonds, Aaa
FHA home mortgages, 30-year
Common stocks S&P composite index 4/
Prices, closing (1941-43=10)
Dividend yield (per cent)
Banking (S.A., mil. $)Total reserves
Bank loans and investments:
TotalBusiness loans
Other loans
U.S. Government securities
Other securities
Money and liquid assets:
Demand dep. & currencyTime and savings dep.
Nonbank liquid assets
4.874.615.024.993.44
3/ n.a.
89.373.24
4.904.695.194.943.535.70
88.813.24
5.034.815.384.993.635.70
4.314.304.634.533.315.45
93.77 87.953.27 2.88
Change Average Annual rate ofin change change (%)Feb. last 3mos. 3 mos. 1 year
5/ 66
100700
-200-1,100
700
1,300800
-1,200
89
1,9001,200
700-400400
600900600
4.8
7.721.16.9-9.010.9
4.57.12.9
4.3
9.211.511.4-6.513.3
5.613.25.4
N.S.A.--not seasonally adjusted. S.A.--seasonally adjusted.
1.003.98- 243218
1/ Average of daily figures. 2/ Averages for statement week ending March 30.
3/ Change in contractual interest rate. 4/ Data are for weeklyclosing prices. 5/ Change in March.
I -- T - 2
I - T-3
U.S. BALANCE OF PAYMENTS(In millions of dollars)
1966 1 9 6 5 1965Feb. Jan. Dec. QIV QIII QII QI Year
Seasonally adjusted (billions)Seasonally adjusted
Current account balance
Trade balance 1/Exports 1/Imports 1/ 2/
Services, etc., net
1,434 1,590 1,746
3302,270
-1,940
3202,270
-1,950
4302,330
-1,900
1,2747,029
-5,755
1,2356,829
-5,594
1,3206,800
-5,480
426
1,332
9645,627
-4,663
6.1
4.826.3
-21.5
368 1.3
Capital account balance (regular transactions) -1,708 -1,957 -1,549
Govt. grants & capital 3/U.S. private direct investmentU.S. priv. long-term portfolioU.S. priv. short-termForeign nonliquid
Errors and omissions -252 -316 -10 -0.7
Balances, with and without seasonal adjustment (- = deficit)
Bal. on regular transactions, S.A.Seasonal componentBalance, N.S.A. 78
Liquidity bal., S.A.Seasonal componentBalance, N.S.A. 4/ 55 -51
Official settlements bal., S.A.Seasonal componentBalance, N.S.A. 5/ 177
-52650
-93 -476
-38450
-8 -334
-1,226104
295 -651 -1,122
-683-454
-1,137
-517-454-971
244-516-272
116 -738-69 47347 -265
258 -658-69 473189 -185
247-19354
-56460541
Memo items:Monetary reserves
(decrease -)Gold purchases or
sales (-)
-263 -225 -98 -271 -68 -842 -1.2
5 -73 -119 -124 -590 -832 -1.7
1/ Balance of payments basis which differs a little from Census basis.2/ Figures for December-February tentatively adjusted for changes in carry-over of
import documents.3/ Net of associated liabilities and of scheduled loan repayments.4/ Differs from balance on regular transactions by counting as receipts (+) debt
prepayments, advances on military exports, and net sales of non-convertibleRoosa bonds.
5/ Differs from liquidity balance by counting as receipts (+) increase in liquidliabilities to commercial banks, private nonbanks, and international institutions(except IMF) and by not counting as receipts (+) increase in certain nonliquidliabilities to foreign official institutions.
-973-701-111
-41118
-941-515-35753
-197
-2,060
-795-1,159
-679299274
-988-891
159417
-246
-7.3
-3.7-3.3-1.00.7
-1.8
-1.8
-1.3
-1.3
-1.3
-1.3
II - 1
THE ECONOMIC PICTURE IN DETAIL
The Nonfinancial Scene
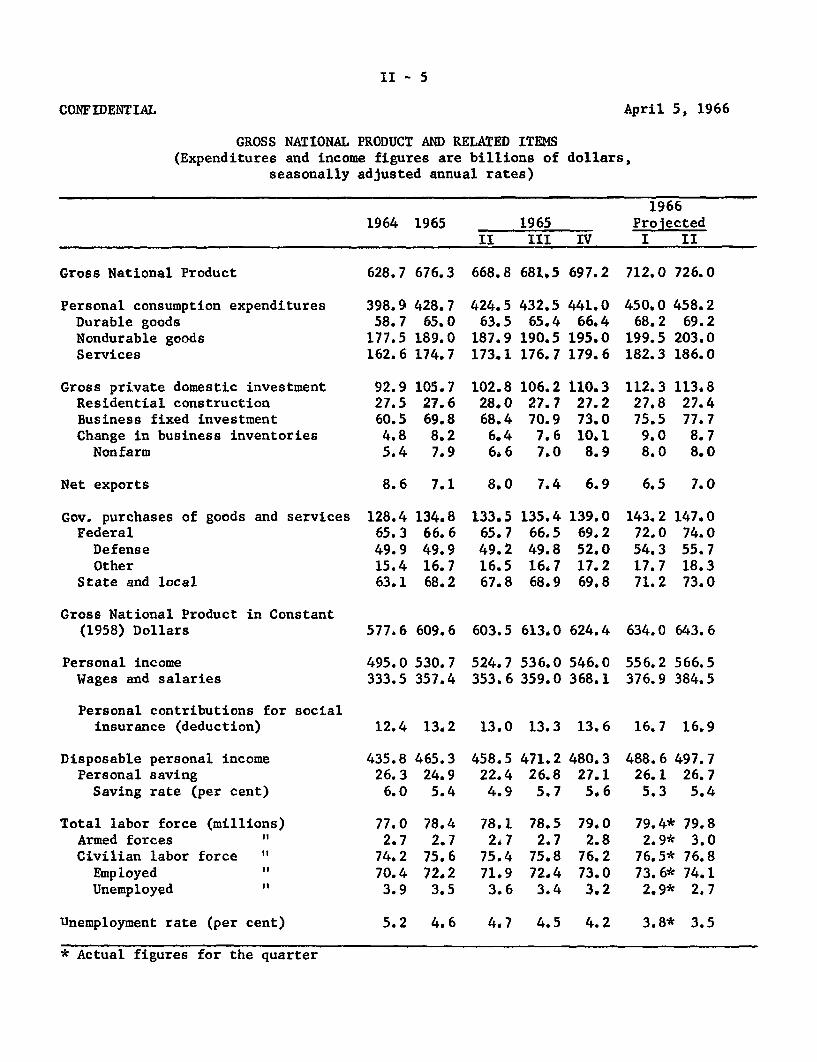
Gross National Product. The first quarter gain in GNP is
likely to be a little larger than was indicated three weeks ago. A
GNP of $712 billion is now estimated for the first quarter (data for
the quarter are still quite incomplete) and is expected to be followed
by a rise to $726 billion for the second quarter. The quarterly in-
crease, $14.8 billion and $14.0 billion, respectively, are each $1
billion more than expected at the time of our last report. However,
the small differences noted do not alter the over-all picture of general
expansion or materially affect the anticipated level of GNP of $731
billion depicted earlier for 1966.
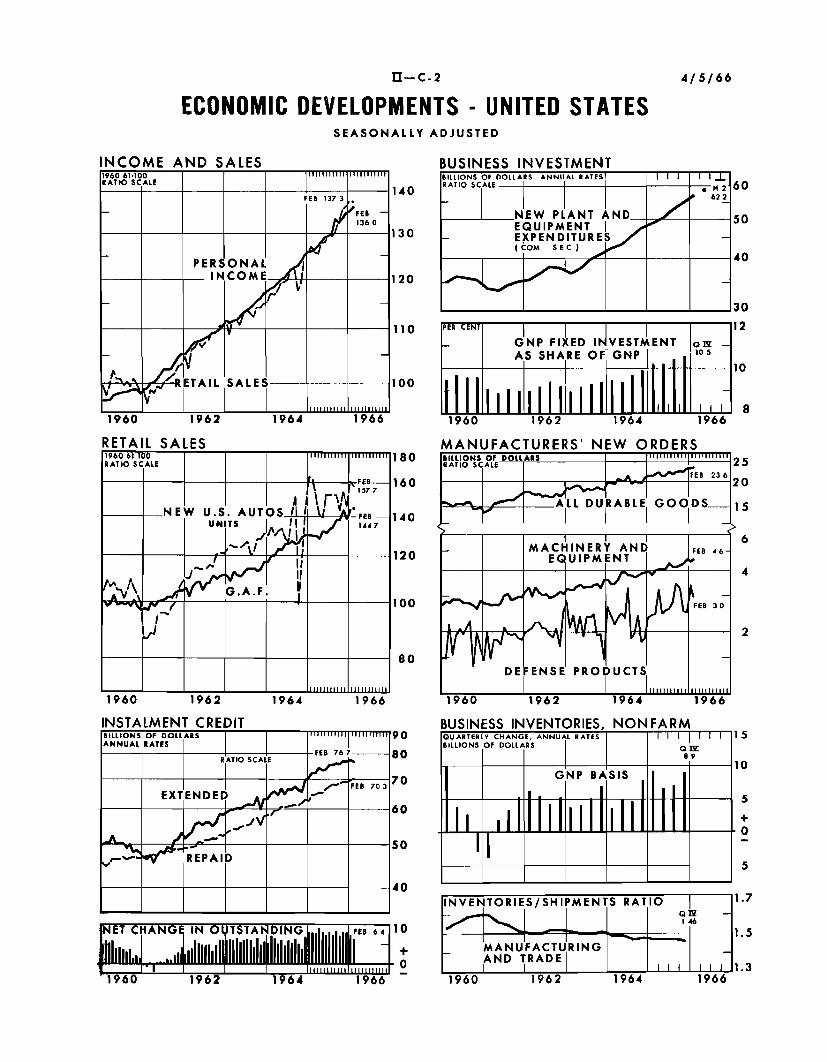
A rise in consumption expenditures of $9 billion (annual
rate) is now indicated for the first quarter as compared with $8.5
billion in the fourth quarter. Retail sales were revised up consi-
derably in January for both durable and nondurable goods. Available
evidence for February can be interpreted as showing sales being main-
tained at the high January level and weekly figures for March indicate
a probable further rise.
The high and rising level of consumer expenditures for goods
and services largely reflects another very sharp jump in personal in-
come in the first quarter--over 9.5 per cent on an annual rate basis
for wages and salaries, and 7.5 per cent for total personal income.
II - 2
While the savings rate is now estimated to fall somewhat in the first
quarter this is almost entirely due to a statistical technicality in
national income accounting practice. The current national income
practice counts as personal contributions to social insurance at the
beginning of the year the whole increase in social security taxes--i.e.,
that part due to the lifting of the base effective January 1, 1966, from
$4,800 to $6,600 as well as that due to the higher tax rate. Since most
individuals in fact will not pay taxes on the higher earnings until after
midyear, less than half of the $3.0 billion, annual rate, increase in
social security contributions indicated for the first quarter is likely
currently to affect personal spending decisions. If allowance were
make for actual timing of the increased contributions resulting from the
higher wage base, the savings rate would remain about unchanged from
the fourth quarter 5.6 per cent level.
Business fixed investment apparently increased somewhat more
in the recent quarter than had been projected in the Commerce-SEC
anticipation survey. The combined showing of large increases in
nonresidential construction activity and in shipments of machinery
and equipment in January and February from their fourth quarter averages
suggest some underestimation in the February survey first quarter total
on which our preceding estimate had been based.
Business inventory investment in the first quarter remains
as estimated earlier; moderate declines are indicated from the very
high fourth quarter rates for both farm and nonfarm inventory
II - 3
accumulation. Inventory data available for the first quarter are still
quite fragmentary. The moderate decline estimated for nonfarm accumula-
tion is based on January figures for manufacturers, recently revised
upward, and distributors, and on preliminary February data for manu-
facturers only which are also assumed to be subject to upward revision.
Exports of goods and services in the first quarter did not
increase as much as anticipated earlier according to present data,
and net exports have been revised down from our earlier estimate to a
level below the fourth quarter rate. In the second quarter, however,
exports are expected to increase more than the relatively large rise
projected for imports, with the result that net exports are projected
to rebound to their fourth quarter rate.
Purchases of goods and services by Federal and by State and
local governments in the first quarter are now indicated to have in-
creased slightly less than estimated three weeks ago, which in turn
had been revised down slightly from the preceding projection. Federal
government expenditures (N.I.A. basis) have been increasing somewhat
less rapidly than had been expected, with slight shortfall indicated
for defense spending. However, it is expected that any shortfall in
defense spending will be made up later. The somewhat slower-than-
expected rise in State and local government purchases reflects the slower
pace at which projects supported by Federal grants-in-aid are get-
ting underway.
II - 4
A further substantial expansion in economic activity is
expected in the second quarter. The increases now projected for con-
sumption expenditures and for private domestic investment take into
account the upward revisions in our estimates for the first quarter.
While a number of businesses, in response to the President's request,
have indicated willingness to pare their capital investment projects,
it is unlikely that any significant effects on expenditures will be
achieved in the current quarter, although salutary psychological
effects on price pressures may well result from the request. Thus,
for the present, the increase in business fixed investment indicated
by the February Commerce-SEC survey is incorporated in our projection
for the second quarter. In addition, a rise is projected for net
exports.
II - 5
CONFIDENTIAL April 5, 1966
GROSS NATIONAL PRODUCT AND RELATED ITEMS(Expenditures and income figures are billions of dollars,
seasonally adjusted annual rates)
19661964 1965 1965 Projected
II III IV I II
Gross National Product 628.7 676.3 668.8 681.5 697.2 712.0 726.0
Personal consumption expendituresDurable goodsNondurable goodsServices
Gross private domestic investmentResidential constructionBusiness fixed investmentChange in business inventories
Nonfarm
Net exports 8.6 7.1 8.0 7.4 6.9
Gov. purchases ofFederal
DefenseOther
State and local
goods and services
Gross National Product in Constant(1958) Dollars
Personal incomeWages and salaries
Personal contributions for socialinsurance (deduction)
Disposable personal incomePersonal savingSaving rate (per cent)
Total labor force (millions)Armed forces "Civilian labor force "
Employed "Unemployed "
Unemployment rate (per cent)
577.6 609.6
495.0 530.7333.5 357.4
12.4 13.2
435.826.3
6.0
77.02.7
74.270.4
3.9
465.324.9
5.4
78.42.7
75.672,2
3.5
5.2 4.6
603.5 613.0 624.4
524.7 536.0 546.0353.6 359.0 368.1
13.0 13.3 13.6
458.522.44.9
78.12,7
75.471.93.6
471.226.8
5.7
78.52.7
75.872.4
3.4
480.327.15.6
79.02.8
76.273.0
3.2
4.7 4.5 4.2
634.0 643.6
556.2 566.5376.9 384.5
16.7 16.9
488.6 497.726.1 26.75.3 5.4
79.4* 79.82.9* 3.0
76.5* 76.873.6* 74.12.9* 2.7
3.8* 3.5
* Actual figures for the quarter
398.958.7
177.5162.6
92.927.560.54.85.4
428.765.0
189.0174.7
105.727.669.88.27.9
424.563.5
187.9173.1
102.828.068.46.46.6
432.565.4
190.5176.7
106.227.770.9
7.67.0
441.066.4
195.0179.6
110.327.273.010 1
8.9
450.068.2
199.5182.3
112.327.875.5
9.08.0
458.269.2
203.0186.0
113.827.477.7
8.78.0
128.465.349.915.463.1
6.5 7.0
134.866.649.916.768.2
133.565.749.216.567.8
135.466.549.816.768.9
139.069.252.017.269.8
143. 272.054.317.771.2
147.074.055.718.373.0

II - 6
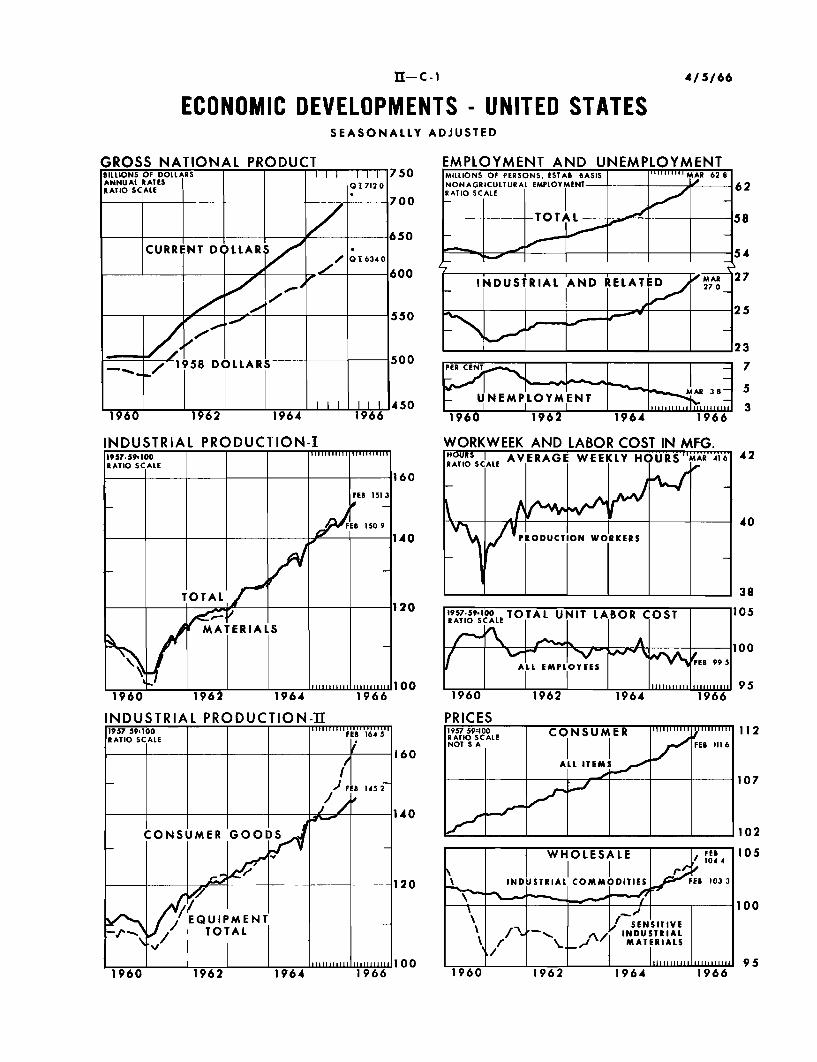
Industrial production. Industrial production in March is
estimated to have increased further but at a somewhat less rapid pace
than in other recent months. Output in the first quarter of 1966
averaged about 151 per cent--3 per cent above the average for the
fourth quarter of 1965 and 8 per cent above a year earlier.
The table shows estimated first quarter output for the
total index and major market groupings and per cent changes from the
first and fourth quarters of 1965 to the first quarter of 1966.
INDUSTRIAL PRODUCTION1957-59=100, Seasonally adjusted
Per cent increase from:QI 1966 QIV 1965 QI 1965
Total 151 2.9 8.2Consumer goods 145 1.4 4.4Equipment, incl.
defense 164 6.9 17.7Materials 151 3.1 7.6
Auto assemblies increased slightly in March and were at an
annual rate of about 9.4 million units compared with 9.1 million in
February. A strike at General Electric, which began March 3, curtailed
output of appliances. Production of color television sets, however,
continued to set new records. Employment data for March indicate a
further rise in both business and defense equipment. Output of trucks
was maintained at a record level.
II - 7
Output of iron and steel rose again in March to a level
within 90 per cent of the high level reached during the strike-threat
buildup last summer. Other weekly production data indicate increases
in output of crude oil, refined petroleum products, and coal. Out-
put of paperboard continued at record levels.
Consumer credit. The seasonally adjusted rise in consumer
credit during February was the smallest in the 1965-66 period. There
was slackening of growth in all loan categories with auto credit and
home improvement loans slowing the most. Growth in total instalment
credit outstanding was only $537 million for the month, or $6.4 billion
on a seasonally adjusted annual rate basis. This compares with an
annual rate in January of $7.5 billion and a total expansion of
$8.0 billion for all of 1965. Noninstalment credit rose $120 million
in February, about in line with the high level of retail sales.
Instalment credit extensions in February were below the
January level with decreases evident in all loan categories. Repay-
ments on the other hand rose slightly, owing to a substantial increase
in auto credit payments; in other loan categories, repayments showed
little change or declined slightly.
Manufacturers' shipments, orders, and inventories. Manu-
facturers'unfilled orders increased further in February and so also
did inventories while shipments and new orders were little changed
II - 8
from high January levels. With shipments holding at the advanced
January level while inventories increased, the ratio of inventories
to shipments edged up further. The ratio of unfilled orders to ship-
ments also rose further in February for durable goods producers,
although shipments of such goods advanced. Increases in shipments
were reported by metal producers and fabricators and transportation
equipment manufacturers, while shipments by producers of other durable
goods and of nearly all nondurable goods declined a little.
New orders for durable goods were unchanged from their record
January level, instead of being down somewhat as indicated by the
advance figures. February orders declined about 4 per cent for both
electrical and nonelectrical machinery and 9 per cent for aircraft.
Despite the declines, backlogs of unfilled orders in these three
industries rose moderately further. New Orders received by iron and
steel producers in February were a fifth larger than in the preceding
month.
Manufacturers further increased their inventories in
February, with most industries contributing to the rise. However,
the February rise was at a slower rate than in January and in the
fourth quarter.
II - 9
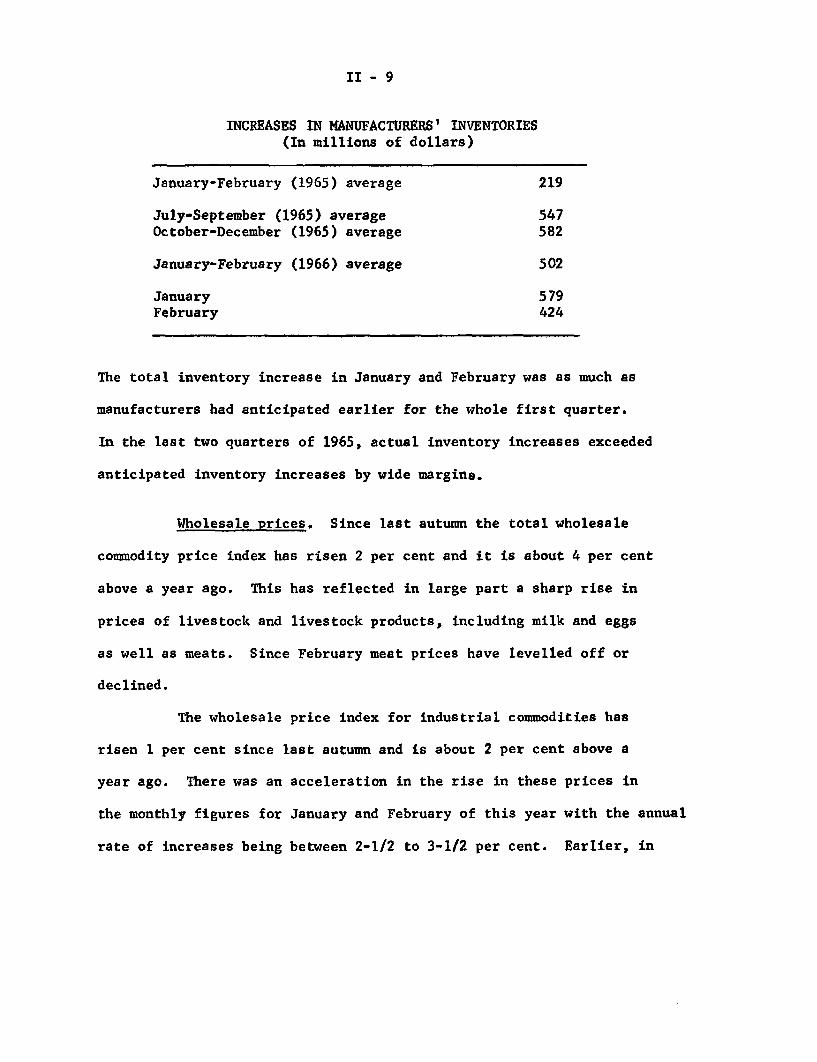
INCREASES IN MANUFACTURERS' INVENTORIES(In millions of dollars)
January-February (1965) average 219
July-September (1965) average 547October-December (1965) average 582
January-February (1966) average 502
January 579February 424
The total inventory increase in January and February was as much as
manufacturers had anticipated earlier for the whole first quarter.
In the last two quarters of 1965, actual inventory increases exceeded
anticipated inventory increases by wide margins.
Wholesale prices. Since last autumn the total wholesale
commodity price index has risen 2 per cent and it is about 4 per cent
above a year ago. This has reflected in large part a sharp rise in
prices of livestock and livestock products, including milk and eggs
as well as meats. Since February meat prices have levelled off or
declined.
The wholesale price index for industrial commodities has
risen 1 per cent since last autumn and is about 2 per cent above a
year ago. There was an acceleration in the rise in these prices in
the monthly figures for January and February of this year with the annual
rate of increases being between 2-1/2 to 3-1/2 per cent. Earlier, in
II - 10
1965, about 40 per cent of the published groups were rising, another
40 per cent were unchanged and the remaining 20 per cent were declining.
In January and February this year, the proportion rising increased
to 53 while 32 per cent were unchanged, and 15 declined.
The BLS weekly series for the industrial component of the
total index is based on a limited number of items. This series was
unchanged from mid-February to mid-March. It probably does not pro-
vide an adequate advance estimate of the monthly industrial total
because it does not include a number of products in which price ad-
vances have occurred or have been announced since early February,
including electrical and nonelectrical machinery, fabricated metal
products, nonmetallic minerals, lumber, paper, chemicals, heavy trucks,
rubber, and leather goods. Reports in purchasing journals suggest
some attempts at protective buying in response to expected price
increases and material shortages.
Consumer prices. The consumer price index from mid-January
to mid-February rose .5 per cent to 111.6 per cent of the 1957-59
average, with food accounting for about three-fourths of the increase.
Meat prices rose nearly 2 per cent further; as noted earlier, at
wholesale, meat prices have levelled off or declined somewhat since
then. Poultry prices increased 8 per cent in February partly because
of seasonally reduced supplies and also because of some shift in de-
mand away from high priced red meats. Prices of fresh vegetables
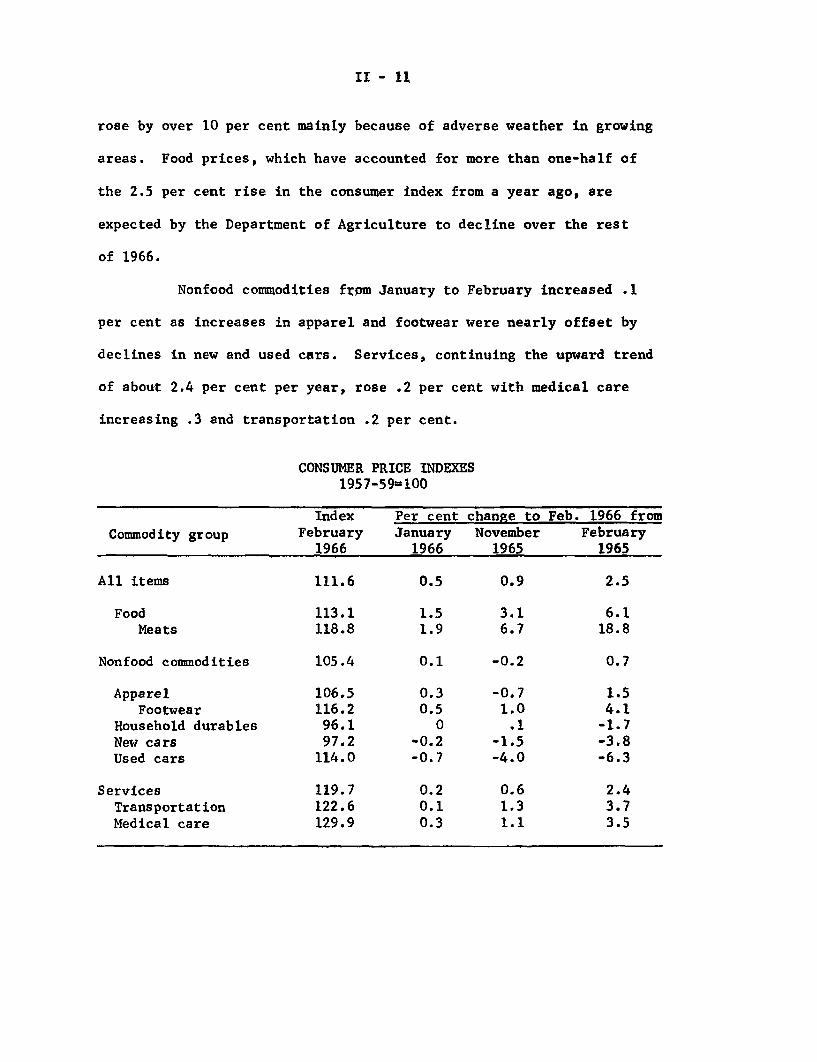
II - 11
rose by over 10 per cent mainly because of adverse weather in growing
areas. Food prices, which have accounted for more than one-half of
the 2.5 per cent rise in the consumer index from a year ago, are
expected by the Department of Agriculture to decline over the rest
of 1966.
Nonfood commodities from January to February increased .1
per cent as increases in apparel and footwear were nearly offset by
declines in new and used cars. Services, continuing the upward trend
of about 2.4 per cent per year, rose .2 per cent with medical care
increasing .3 and transportation .2 per cent.
Commodity group
All items
FoodMeats
Nonfood commodities
ApparelFootwear
Household durablesNew carsUsed cars
ServicesTransportationMedical care
CONSUMER PRICE INDEXES1957-59=100
Index Per cent c1February January
1966 1966
111.6 0.5
113.1 1.5118.8 1.9
105.4 0.1
106.5 0.3116.2 0.596.1 097.2 -0.2
114.0 -0.7
119.7 0.2122.6 0.1129.9 0.3
hange to Feb. 1966 fromNovember February
1965 1965
0.9 2.5
3.1 6.16.7 18.8
-0.2 0.7
-0.7 1.51.0 4.1.1 -1.7
-1.5 -3.8-4.0 -6.3
0.6 2.41.3 3.71.1 3.5
II - 12
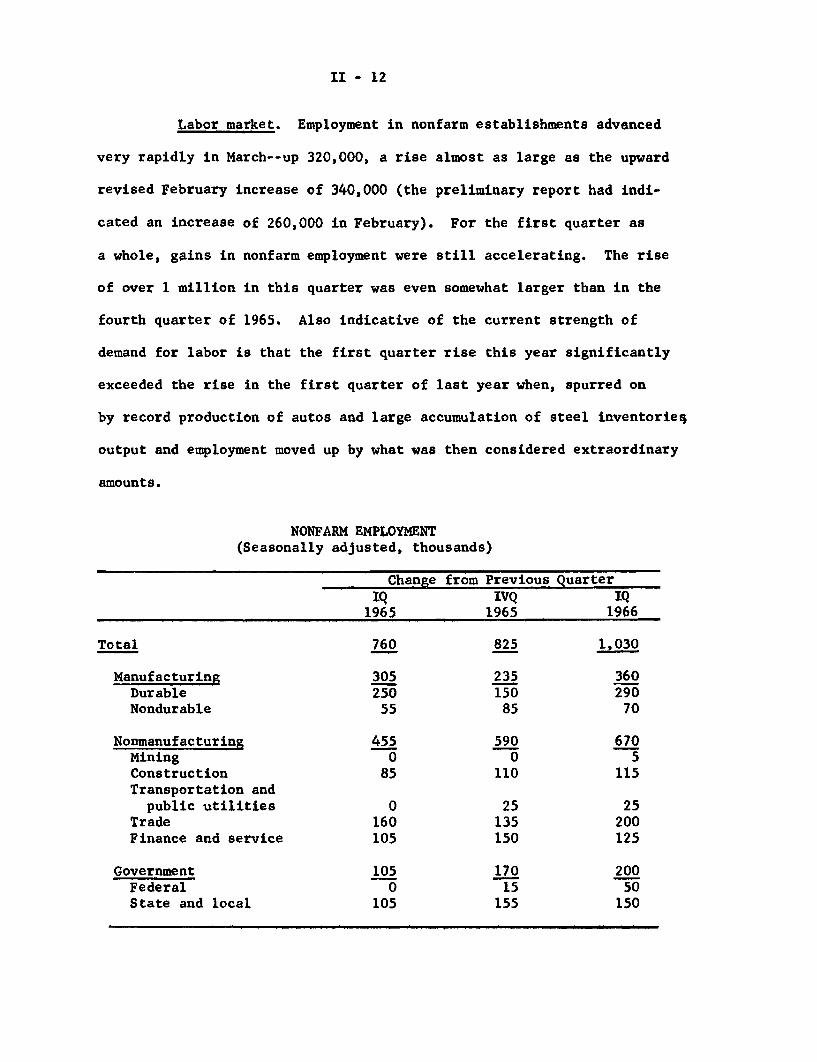
Labor market. Employment in nonfarm establishments advanced
very rapidly in March--up 320,000, a rise almost as large as the upward
revised February increase of 340,000 (the preliminary report had indi-
cated an increase of 260,000 in February). For the first quarter as
a whole, gains in nonfarm employment were still accelerating. The rise
of over 1 million in this quarter was even somewhat larger than in the
fourth quarter of 1965. Also indicative of the current strength of
demand for labor is that the first quarter rise this year significantly
exceeded the rise in the first quarter of last year when, spurred on
by record production of autos and large accumulation of steel inventories
output and employment moved up by what was then considered extraordinary
amounts.
NONFARM EMPLOYMENT(Seasonally adjusted, thousands)
Change from Previous QuarterIQ IVQ IQ
1965 1965 1966
Total 760 825 1,030
Manufacturing 305 235 360Durable 250 150 290Nondurable 55 85 70
Nonmanufacturing 455 590 670Mining 0 0 5Construction 85 110 115Transportation and
public utilities 0 25 25Trade 160 135 200Finance and service 105 150 125
Government 105 170 200Federal 0 15 50State and local 105 155 150
II - 13
While the over-all increase in March in nonfarm employment
about equalled the previous month, the rise of 85,000 in manufacturing,
although large, was somewhat smaller than in February. In part the
slowing reflected a leveling-off of employment in the machinery industry
where supplies of skilled labor have become increasingly scarce. Hours
of work in the industry, in contrast, continued to rise and at 44.1
hours in March were the longest workweek in the industry since World
War II. Employment in other metal producing industries continued to
advance fairly rapidly but the pace was somewhat slower than the
previous month. Availability of experienced workers may now also be
limiting employment advances in these industries. A smaller employ-
ment gain in the nondurable goods sector in March, however, can be
largely attributed to the previous month's sharp rise in the apparel
industry following settlement of the New York transit strike rather
than to current labor shortages. Average hours of work, in manufactur-
ing in March were maintained at the postwar record high of 41.6 hours
reached in February.
Outside of manufacturing, employment gains showed no signs
of moderating. Construction employment had declined in January and
February from a very high year-end level but advanced again sharply
in March to a level well above December and was about 200,000, or
more than 6 per cent, higher than a year ago. Trade, services and
Government have been able to continue to absorb large numbers of
workers most of whom would apparently be inexperienced women and
II - 14
youth. In these industries the rate of increase in the first quarter
(an annual rate of about 2 million) was sharper than in the fourth
quarter of last year.
In all, 3 million workers were added to nonfarm industries
in the past 12 months, the largest yearly increase in the postwar
period. Interestingly, manufacturing gains have been especially
rapid this past year, in contrast to the earlier employment experience,
but nevertheless accounted for only one-third the total rise in non-
farm employment, about the same proportion that manufacturing employ-
ment is to total nonagricultural (payroll) employment.
Unemployment. The limited number of experienced adult
workers available for jobs continues to be a dominant factor in labor
market developments. Although the unemployment rate rose slightly to
3.8 per cent in March, following 6 consecutive months of decline, the
rise was mainly accounted for by an increase in unemployment among
teenage youth , a group whose unemployment rate has been more volatile
from month to month than that for older workers. For adults--men and
women 20 years of age and over who comprise 90 per cent of the civilian
labor force--the unemployment rate in March was 2.9 per cent. This is
the second month it has been under 3 per cent and about as low a rate
for this group as during the Korean conflict. This suggests that the
jobless rate for most workers in the labor force is close to what can
be considered a frictional unemployment level.
II - 15
Recent data from unemployment compensation programs also
strikingly point up the low and diminishing supplies of available
workers with past employment experience. Since the survey week
(week ending March 12) for the household and establishment reports,
the seasonally adjusted number of persons filing claims under the
State unemployment compensation programs has declined sharply. In
the last week of March new claims dropped to 160,000, the lowest
number for the comparable week in any year since the end of World
War II. Moreover, by the end of March less than 2.5 per cent
(seasonally adjusted) of all covered workers were receiving benefits,
which is about as low a rate as was reached any time during the
Korean conflict.
With the unemployment rate among adult workers low, the
over-all unemployment rate may be less responsive in coming months
to strong demands for labor. (For men 25 years of age and over, for
example, the unemployment rate has shown little change in the past
4 months.) Therefore, the elasticity of the unemployment rate in
coming months will increasingly reflect (1) a rising rate of tran-
sitional unemployment and job changing, (2) the high proportion of
very mobile young workers among the job seekers and (3) any inability
to make important inroads in the extremely high rates of unemployment
among nonwhite youths.
With labor demands continuing strong and supplies dwindling,
turnover has increased in recent months, and voluntary worker mobility
II - 16
has speeded up. This usually happens in a tightening labor market as
more workers find they can sucessfully shop around for better jobs.
With a higher proportion of workers changing jobs, the rate of frictional
unemployment may tend to rise. Short-term unemployment becomes a much
larger proportion of total unemployment in periods of labor shortage
than during periods of labor surplus.
In addition to rising cyclically, the frictional unemployment
rate may now be higher secularly than in other low unemployment years,
such as in the 1955-57 expansion or the Korean period. The reason can
be traced to the changing demographic composition of the labor force
and its effect on unemployment. Of particular significance is the
higher proportion of young workers in the job market currently than
a decade or so ago.
Total
Teenagers
Adult men
Adult women
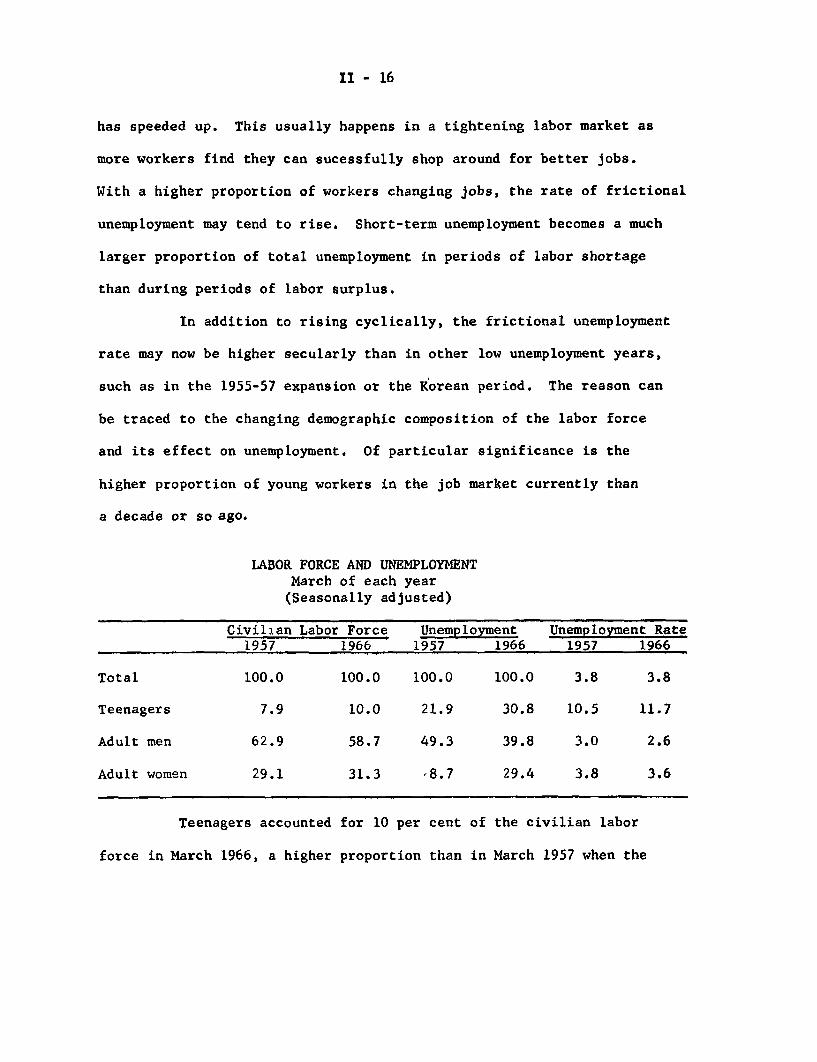
LABOR FORCE AND UNEMPLOYMENTMarch of each year(Seasonally adjusted)
Civilian Labor Force Unemployment1957 1966 1957 1966
100.0 100.0 100.0 100.0
7.9 10.0 21.9 30.8
62.9 58.7 49.3 39.8
29.1 31.3 ,8.7 29.4
Unemployment RateUnemployment Rate1957 1966
3.8 3.8
10.5 11.7
3.0 2.6
3.8 3.6
Teenagers accounted for 10 per cent of the civilian labor
force in March 1966, a higher proportion than in March 1957 when the
II - 17
total unemployment rate was the same as currently. With more teenagers
now in the work force, their share of total unemployment has increased
sharply--from 22 to 31 per cent. In contrast, women accounted for only
a slightly higher share of labor force and unemployment than in 1957,
while the adult male fraction declined sharply. Of the three groups,
however, only the jobless rate of teenagers worsened over the period,
partly reflecting the pressure of large population growth.
Young workers take longer to find jobs and typically move
frequently from job to job before settling in their chosen vocation.
As a result, their rate of job turnover, and consequently their implied
frictional unemployment rate, tends to be well above the average. Even
in the tightest labor market in the postwar period, the teenage job-
less rate has remained 2-1/2 to 3 times higher than the total un-
employment rate. The increasing proportion of these highly mobile
young workers in the current unemployment count would naturally tend
to weigh up the total unemployment rate and the proportion considered
frictional. Thus, current unemployment rates would tend to overstate
the availability of unemployed labor resources when compared with
earlier periods of low unemployment.
II - 18
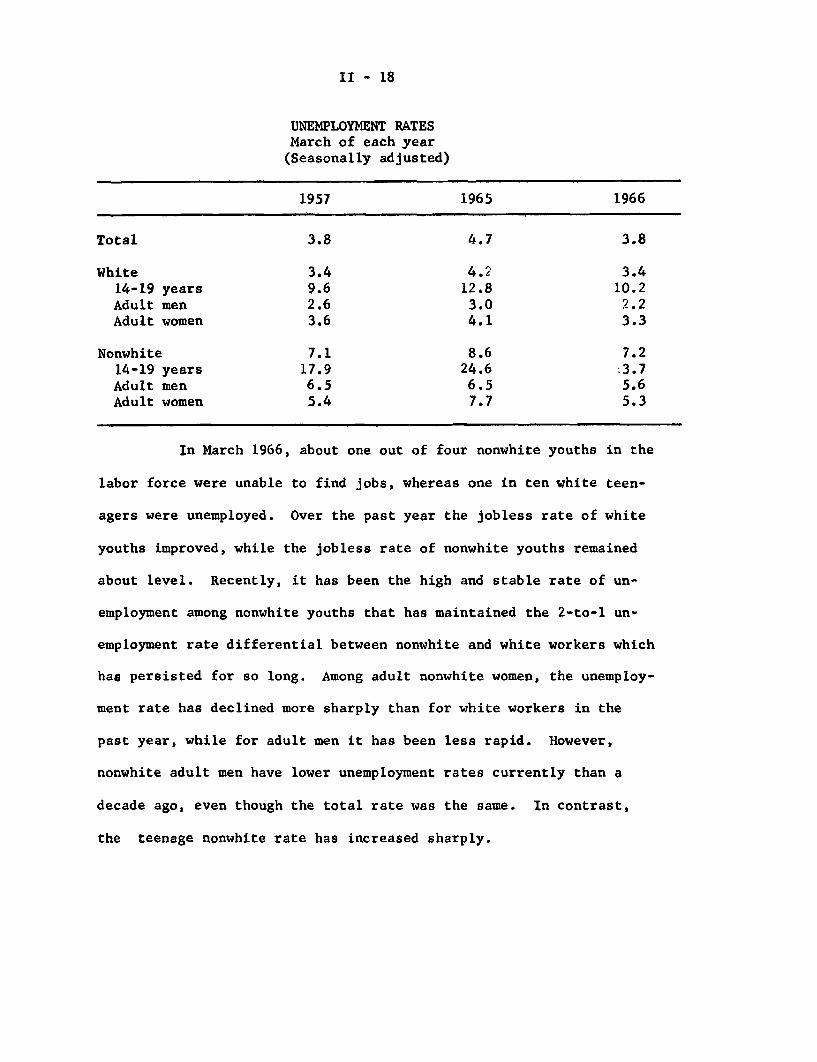
UNEMPLOYMENT RATESMarch of each year(Seasonally adjusted)
1957 1965 1966
Total 3.8 4.7 3.8
White 3.4 4.2 3.414-19 years 9.6 12.8 10.2Adult men 2.6 3.0 2.2Adult women 3.6 4.1 3.3
Nonwhite 7.1 8.6 7.214-19 years 17.9 24.6 .3.7Adult men 6.5 6.5 5.6Adult women 5.4 7.7 5.3
In March 1966, about one out of four nonwhite youths in the
labor force were unable to find jobs, whereas one in ten white teen-
agers were unemployed. Over the past year the jobless rate of white
youths improved, while the jobless rate of nonwhite youths remained
about level. Recently, it has been the high and stable rate of un-
employment among nonwhite youths that has maintained the 2-to-l un-
employment rate differential between nonwhite and white workers which
has persisted for so long. Among adult nonwhite women, the unemploy-
ment rate has declined more sharply than for white workers in the
past year, while for adult men it has been less rapid. However,
nonwhite adult men have lower unemployment rates currently than a
decade ago, even though the total rate was the same. In contrast,
the teenage nonwhite rate has increased sharply.
II - 19
Construction activity. Outlays for new construction reached
a record rate this winter, reflecting mainly the continued upthrust in
expenditures for business and related installations and a temporary
surge in private housing starts toward the end of last year. However,
in February, building contracts dipped for the second successive month,
according to F. W. Dodge, and there were other indications of possible
weakening in construction activity as a whole. In the residential
sector, the further rise in residential construction initially re-
ported for February will probably be revised downward because of the
sharp reduction in starts reported after the expenditure release.
In the public sector,recent announcement of steps taken to
reduce Federal expenditures may begin to have some effect on outlays
as the year progresses. These steps were undertaken not only to dampen
over-all demands but also as an example for private industry and State
and local government. In recent years, public construction as a whole
has accounted for 30 per cent of total construction outlays, with high-
ways alone accounting for 10 per cent of the total. Through February
of this year, public construction had been fluctuating within a narrow
range just below the high level last November.
The sharp decline in private housing starts in February --
like the unusual rise in December -- apparently reflected weather
influences for the most part, although firming of mortgage market was
also a factor. Assuming some recovery in March, starts in the first
quarter of the year may have approximated the 1.45 million annual rate
II - 20
of first two months of the year. If so, this would make the first
quarter only moderately lower than 1965 as a whole and about the
same as the recent low in the third quarter. It would also be about
in line with our earlier projections for the quarter and with re-
cently revised trade expectations for the year 1966.
A test of the viability of this rate of housing starts may
come later this spring, when many commitments made before the end of
1965 will have been worked off and when financing demands will be
seasonally higher, particularly in the northern states.
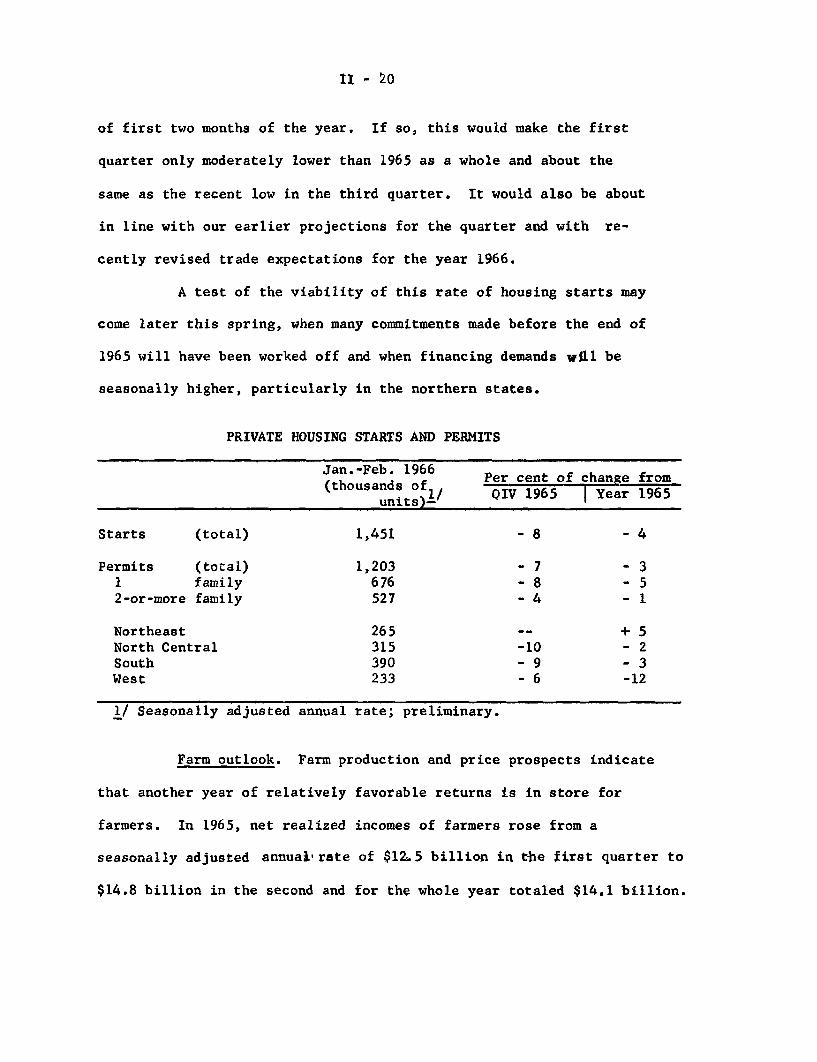
PRIVATE HOUSING STARTS AND PERMITS
Jan.-Feb. 1966 Per(thousands of l
units)-
Starts (total) 1,451
Permits (total) 1,2031 family 6762-or-more family 527
Northeast 265North Central 315South 390West 233
1/ Seasonally adjusted annual rate; preliminary.
r cent of change fromIV 1965 | Year 1965
-4
- 3- 5- 1
--
-10- 9- 6
Farm outlook. Farm production and price prospects indicate
that another year of relatively favorable returns is in store for
farmers. In 1965, net realized incomes of farmers rose from a
seasonally adjusted annual rate of $12.5 billion in the first quarter to
$14.8 billion in the second and for the whole year totaled $14.1 billion.
II - 21
This was the highest net return realized by farmers since 1952. Sharply
rising prices received for meat animals sparked by expanding consumer
demands coinciding with cyclically low hog marketings, were largely
responsible for the increased income. Production costs rose but at
a slower pace than sales receipts.
It seems safe to assume that net returns were equally favor-
able in the first quarter of 1966. It is unlikely, however, that such
returns can be sustained throughout the year in view of production
prospects. Through March, the volume of marketings were somewhat
larger than a year earlier and farm prices averaged 13 per cent higher.
The volume of crops marketed from the record 1965 harvest was an
eighth above a year earlier and average prices were off a little
despite sharply higher prices received for short crops of fresh winter
vegetables. Prices of livestock and products averaged 25 per cent
above the relatively low prices that prevailed a year ago and the
volume of marketings was approximately 3 per cent less.
In the months ahead supplies of hogs, poultry, and eggs are
expected to become more plentiful as production in process reaches
markets. Milk production, now running well below a year earlier be-
cause of reductions in cow numbers and lower output per cow, should
increase somewhat in response to the hike in the dairy price supports
announced on March 31. Beef cattle numbers are large enough to permit
somewhat larger marketings than in 1965 throughout the year, but
probably not at the 5 per cent higher rate of the first quarter.
II - 22
Another year of large crop output is in prospect. Farmers'
planting intentions on March 1 indicated that the 1966 acreage of 17
major field crops would be about the same as the acreage actually
planted to these crops in 1965. Some important shifts in acreage
plans were made in response to changes in Federal programs. Rice and
soybean acreages were increased, largely because of eased planting
curbs, and cotton acreage was cut 23 per cent reflecting participation
in the new cotton acreage diversion program. Corn farmers planned to
increase acreage 2 per cent which, with favorable growing conditions,
would add to surplus stocks.
March 31 announcements of an increase in the soybean price
support 11 per cent above the 1965 level and an extension of the sign-
up period for the feed grain program may induce farmers to shift more
acreage from corn to soybeans. Such a shift would supplement a
reduced cottonseed crop and avoid surplus production of corn.
4/5/66
ECONOMIC DEVELOPMENTS - UNITED STATESSEASONALLY ADJUSTED
GROSS NATIONAL PRODUCTBILLIONS OF DOLLARS I I I 750ANNUAL RATES 017120RATIO SCALE 70
/- -650CURRENT DOLLARS
S0 01 6340
--- -- ------ _ - -- 6 0 0
500- j550
__ 1958 DOLLARS - 500
Ill IlR 45016 1962 1964 1966
INDUSTRIAL PRODUCTION-I1957-59.100 Mi.im.i iimrnr
RATIO SCALE
- 160
FEB 151 3
FEB 150 9
S40
TOTAL-- -- - - _ 120
MATERIALS
l.. .. ............ 10 01960 1962 1964 1966
INDUSTRIAL PRODUCTION-II1957 o59.100 ........ B m1 51
RATIO SCALE 160
S160/
CONSUMER GOODS
P-- -120
EQUIPMENTTOTAL
•v
I .................. ... .1 0 0
EMPLOYMENT AND UNEMPLOYMENT
RATIO SCALE
-TOTAL 5
INDUSTRIAL AND RELATED 27^
_ 2
2
PER CENT
MAR 38UNEMPLOYMENT
I~~~ ~~ ......... ILIIII~
1960 1962 1964 1966
WORKWEEK AND LABOR COST IN MFG.
4
7
5
3
4U
PRODUCTION WORKERS
38
19I57-'.1 L TOTAL UNIT LABOR COST 105RATIO SCALE
t ^ ^A V f 100
ALL EMPLOYEES 99
l l l .. . . . .. . . 9 5
1960 1962 1964 1966
PRICES1957 59=100 CONSUMER 1""""" 1 """" 11:RATIO SCALENOT S A _ / 10,FEB 111 6
ALL ITEMS ,
1- 10;
_10:
WHOLESALE FEs 101
\ INDUSTRIAL COMMODITIES FEB 1033
10(
/ SENSITIVE\ / < INDUSTRIAL
\ \ MATERIALS
l/mlsa
n n 9
AOUSCAE AVERAGE WEEKLY HOURS MARRATIO SCALE
-
II--c-1
1960 1962 1964 1966 1960 1962 1964 1966
II-C-2 4/5/66
ECONOMIC DEVELOPMENTS - UNITED STATESSEASONALLY ADJUSTED
RETAIL SALES
BUSINESS INVESTMENTBILLIONS OF DOLLARS ANNUAL RATESI IRATIO SCALE - H 2 60
622
NEW PLANT AND 50EQUIPMENT iEXPENDITURES(COM SEC)
30
PER C.N I 12GNP FIXED INVESTMENTAS SHARE OF GNP 105
10
11 11 II llllllll .1960 1962 1964 1966
iTTT5Tmn I - Y IfrrrrTrrrr,,,, rrll y IITOv i0 iuvRATIO SCALE
I__ _r
NEW U.S. AUTOS_/UNITS I
lI,
FEB-1577
FEB-1447
S!o \
11G G. A.F. \
IV A .--y- -or-- --- 10<
8(
1960 1962 1964 1966
INSTALMENT CREDITBILLIONS OF DOLLARS ilIlll ll 1IIIII llt 90ANNUAL RATES I
-- -- -- - -- FEB 767--- 80RATIO SCALE
-- ^/ -- FEB 70 3 70E X T EN D E D , FE .70 0
eA-. - p 50- -, REPA1D
40
ET TA NG FEB 64 10
BUSINESS INVENTORIES, NONFARMQUARTERLY CHANGE, ANNUAL RATES I 1 I IBILLIONS OF DOLLARS
GNP BASIS
1960U 1962 1964 1966
III - 1
DOMESTIC FINANCIAL SITUATION
Bank credit. Loans and investments at all commercial banks,
under the pressure of heavy tax-related demands, apparently expanded
at a seasonally adjusted annual rate of about 10 per cent in March,
following essentially no growth in February. The seesaw February-March
movement reflects an unusual temporary reduction in bank credit in
the last statement week of February and an unusually large increase
late in March. The former decline was due mainly to large repayments
of Government security dealer loans as positions were temporarily
reduced, while the latter increase was due to a large rise in dealer
financing needs late in the month and heavy tax borrowings by finance
companies. These developments, late in each month, tend to bias
February credit expansion downwards, while biasing the March data
upwards.
Total loans in March rose more rapidly than in any month since
last summer, mainly as a result of the above-mentioned expansion in
loans to finance companies and to Government security dealers. Finance
companies, with bank loans more expensive and less available, had in-
creased their sale of commercial paper by an unusually large amount
early in 1966. At the tax date, these companies faced very large
maturities and consequently increased their bank loans quite sharply at
midmonth, borrowing over $1 billion from weekly reporting banks alone;
their subsequent repayments have been slow,
III - 2
Business loan expansion also accelerated from February to
March, and was especially heavy over the tax and dividend period.
However, business loan growth during the past two months remained below
the extremely rapid December-January pace. Loan demands have recently
been strong in most industrial sectors, but especially in the metals,
textiles, and miscellaneous manufacturing industries, and among trade
firms,
CHANGES IN COMMERCIAL BANK CREDITSeasonally Adjusted Annual Rates
(Per cent)
Total U.S.a Other Total Businessloans and Government
nsn ersecurities loans loansinvestments securities
1965-66
Dec. - Jan, 11,3 - 2.1 6.8 16.4 25.5
1966
January 12.2 - 4.2 -- 20,0 25.9
February 0.4 -23.0 18.7 3,0 11.8
March / 10.1 - 8.5 -15.9 21.5 18.4
1/ Preliminary, subject to revision.
To finance loan demand in March,banks in the aggregate had to
bite deeper into their security portfolios. Liquidation of Treasury
issues were smaller than in February, in part because many large banks
were nearing minimum levels of such security holdings. However, bank
liquidation of other securities -- mainly municipals -- was very large
in March, about $600 million, seasonally adjusted. Last month's reduction
III - 3
in such securities was the largest month-to-month decline of the current
expansion; indeed, in only one other previous month since 1961 have
holdings of other securities declined. In addition, banks were forced
to increase their borrowings from the Federal Reserve to an average of
$550 million, from the average $470 million in February, as nonborrowed
reserves declined on a seasonally adjusted basis.
Since year-end, weekly reporting banks have accounted for all
of the liquidation of securities by commercial banks. Larger banks
over this period have been liquidating both Treasury issues and other
securities, on balance, while smaller banks -- with their loan demands
less strong and their time and savings deposit inflows better maintained
than was the case at larger banks -- have added to their portfolios
of all securities, especially municipals.
In recent weeks, however, preliminary indications suggest
that the smaller banks have also been adjusting their security portfolios --
liquidating Treasury issues and reducing their rate of acquisition of
other securities -- apparently without any unusually large expansion in
loans. As indicated below, this change probably reflects a shift of time
and savings deposits from smaller to larger banks, a shift that tends to
spread monetary restraint to a larger group of banks.
Bank deposits and the money stock. The seasonally adjusted
annual rate of growth of time and savings deposits at all commercial
banks in March was the same as the 6.5 per cent rate of February.
III - 4
However, there were unusually large shifts in the composition and
location of inflows of such deposits during the month.
City banks were able to expand their inflows of time deposits
quite sharply last month; the rate of inflow of total time and savings
deposits at reserve city banks more than doubled from February to March
on a seasonally adjusted basis. Time deposits other than negotiable
CD's rose by almost $600 million in the first four reporting weeks last
month, over twice as rapidly as in the same period last year. This
increased inflow apparently reflects higher rates on and more aggressive
advertising of smaller denomination nonnegotiable certificates. It is
likely that some of these funds were withdrawn not only from savings
deposits -- which continue weak -- but also from smaller banks. For
example, total time and savings deposit inflows at country banks de-
celerated in March, on a seasonally adjusted basis. The reduced inflow
of time and savings deposits at smaller banks is an important reason
for their smaller municipal purchases noted above.
Also contributing to the increased inflow of time deposits to
reserve city banks was their success in attracting CD money. Despite
heavy March maturities, New York banks added almost $500 million to
outstanding CD's in the last two weeks of March, bringing total out-
standings just short of the peak late January level. Other banks are
apparently adding to their outstandings also.
New York City banks have been very aggressive in the CD
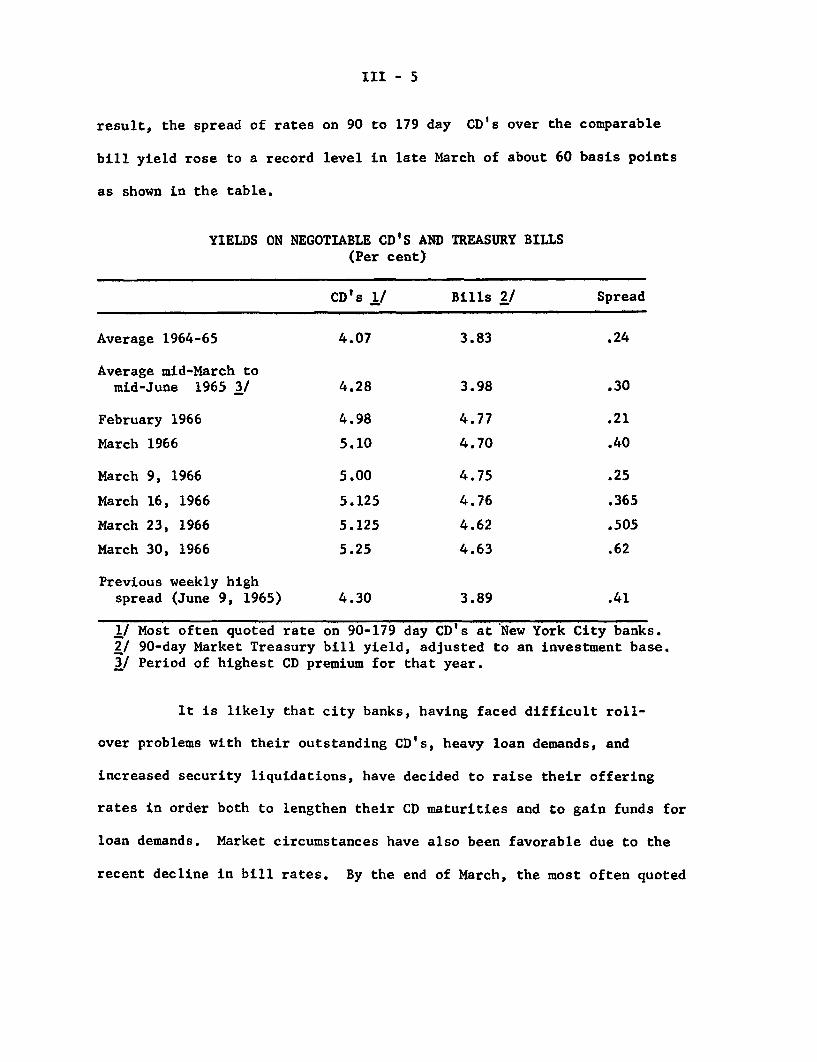
market, increasing offering rates from 12 to 25 basis points. As a
III - 5
result, the spread of rates on 90 to 179 day CD's over the comparable
bill yield rose to a record level in late March of about 60 basis points
as shown in the table.
YIELDS ON NEGOTIABLE CD'S AND TREASURY BILLS(Per cent)
CD's 1/ Bills 2/ Spread
Average 1964-65 4.07 3.83 .24
Average mid-March tomid-June 1965 3/ 4.28 3.98 .30
February 1966 4.98 4.77 .21
March 1966 5.10 4.70 .40
March 9, 1966 5.00 4.75 .25
March 16, 1966 5.125 4.76 .365
March 23, 1966 5.125 4.62 .505
March 30, 1966 5.25 4.63 .62
Previous weekly highspread (June 9, 1965) 4.30 3.89 .41
1/ Most often quoted rate on 90-179 day CD's at New York City banks.2/ 90-day Market Treasury bill yield, adjusted to an investment base.3/ Period of highest CD premium for that year.
It is likely that city banks, having faced difficult roll-
over problems with their outstanding CD's, heavy loan demands, and
increased security liquidations, have decided to raise their offering
rates in order both to lengthen their CD maturities and to gain funds for
loan demands. Market circumstances have also been favorable due to the
recent decline in bill rates. By the end of March, the most often quoted
III - 6
CD rates at New York banks were 5 per cent on less than 90 day CD's,
5-1/4 per cent for 90 to 269 day maturities, and 5-3/8 for 270 day and
over money -- an increase since early March of 25 basis points for short-
term CD's and 12.5 basis points for longer maturities; the highest reported
rates rose 35 and 25 basis points, respectively, over the month.
Since late February, the seasonally adjusted money stock has
risen sharply, increasing at an annual rate of over 9 per cent during
March. Most of this increase reflected a reduction in seasonally
adjusted Treasury balances about equal to the increase in private demand
balances. Over the first quarter, the money stock rose at a 4.5 per
cent annual rate, somewhat below that for all of 1965.
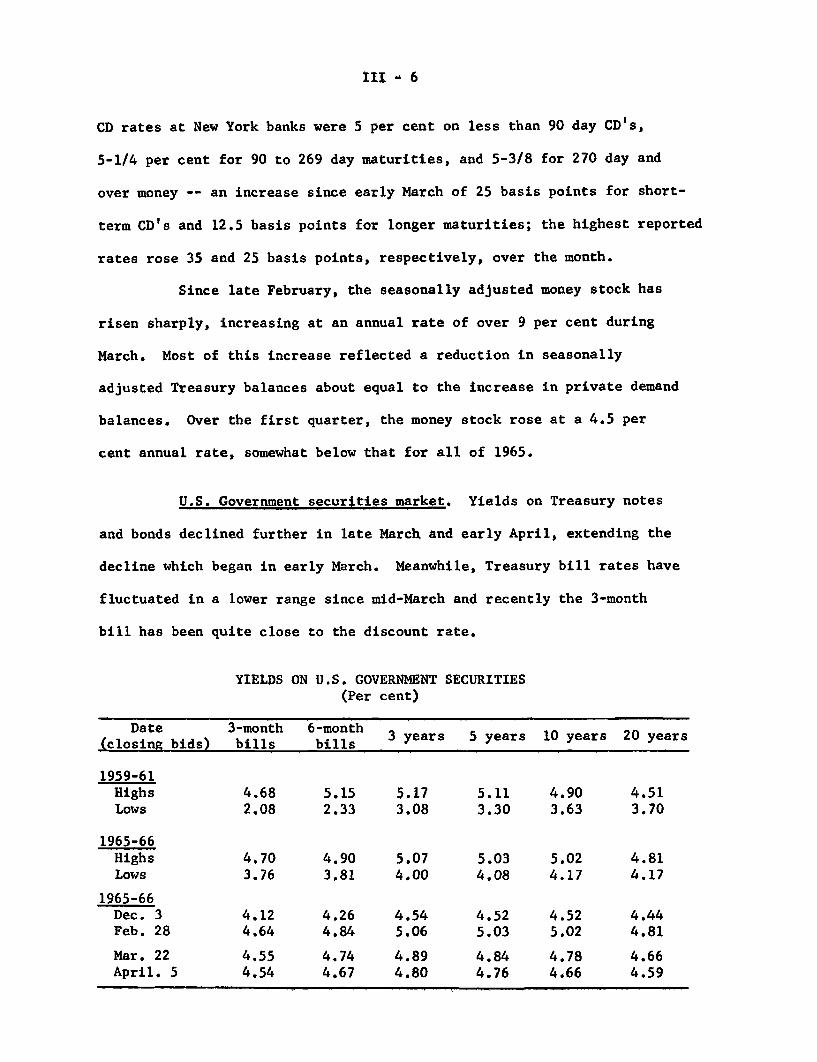
U.S. Government securities market. Yields on Treasury notes
and bonds declined further in late March and early April, extending the
decline which began in early March. Meanwhile, Treasury bill rates have
fluctuated in a lower range since mid-March and recently the 3-month
bill has been quite close to the discount rate.
YIELDS ON U.S. GOVERNMENT SECURITIES(Per cent)
Date 3-month 6-month(lsi bids) b s b s 3 years 5 years 10 years 20 years
(closing bids) bills bills
1959-61Highs 4.68 5.15 5.17 5.11 4.90 4.51Lows 2.08 2.33 3.08 3.30 3.63 3.70
1965-66Highs 4.70 4.90 5.07 5.03 5.02 4.81Lows 3.76 3.81 4.00 4.08 4.17 4.17
1965-66Dec. 3 4.12 4.26 4.54 4.52 4.52 4.44Feb. 28 4.64 4.84 5.06 5.03 5.02 4.81
Mar. 22 4.55 4.74 4.89 4.84 4.78 4.66April. 5 4.54 4.67 4.80 4.76 4.66 4.59
III - 7
The month-long decline in Treasury bond yields has served to
erase 1/2 to 2/3 of the yield advance on intermediate- and long-term
Treasury issues that occurred after the discount rate increase in early
December. Factors contributing to recent market strength have included
a growing conviction that the earlier market correction had outpaced
economic developments and also a developing feeling that the
Administration is moving toward a proposal to raise taxes, thereby
lightening the task of monetary policy and relieving pressure on interest
rates. An additional strengthening influence on Treasury bond prices
has been the excellent receptions accorded many recent major corporate
and municipal issues.
The main thrust of the rally in U.S. Government bond prices
has come from strong dealer demand, however, rather than from invest-
ment buying. In recent weeks dealers have made strong efforts, first,
to cover sizable short positions and subsequently to build up net
long positions. In doing so, they have absorbed moderate investor
selling at rising prices. On April 4, dealers held $115 million, net,
of bonds due in over 5 years, their largest position in such issues since
November, as compared with a net short position of around $40 million
at the beginning of March.
Treasury bill rates, unlike other short-term rates, have been
under downward pressure in recent weeks. Even though net market demand
for bills has tapered off since mid-March, dealer inventories were
depleted by previous strong demand and dealers' willingness to build up
III - 8
their inventories in recent auctions has helped to keep rates at the
lower end of their recent range. In addition, the maturity of $3.0
billion March tax bills as well as the completion in late March of the
Treasury's $100 million additions to the weekly bill auctions have served
to reduce available supplies of bills. The Treasury is not expected to
need to raise any cash through short-term debt issues in the current
quarter.
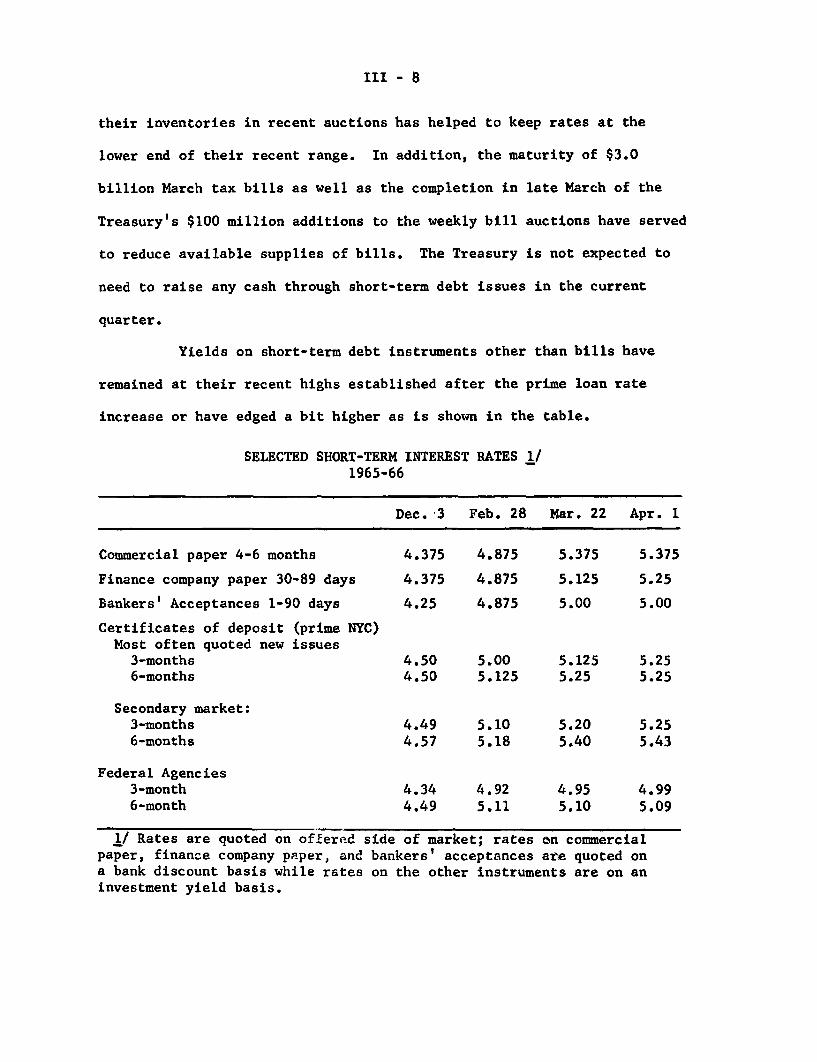
Yields on short-term debt instruments other than bills have
remained at their recent highs established after the prime loan rate
increase or have edged a bit higher as is shown in the table.
SELECTED SHORT-TERM INTEREST RATES 1/1965-66
Dec. 3 Feb. 28 Mar. 22 Apr. 1
Commercial paper 4-6 months 4.375 4.875 5.375 5.375
Finance company paper 30-89 days 4.375 4.875 5.125 5.25
Bankers' Acceptances 1-90 days 4.25 4.875 5.00 5.00
Certificates of deposit (prime NYC)Most often quoted new issues
3-months 4.50 5.00 5.125 5.256-months 4.50 5.125 5.25 5.25
Secondary market:3-months 4.49 5.10 5.20 5.256-months 4.57 5.18 5.40 5.43
Federal Agencies3-month 4.34 4.92 4.95 4.996-month 4.49 5.11 5.10 5.09
1/ Rates are quoted on offered side of market; rates on commercialpaper, finance company paper, and bankers' acceptances are quoted ona bank discount basis while rates on the other instruments are on aninvestment yield basis.
III - 9
Treasury finance. The next Treasury financing operation will
be the regular May refunding, which will involve a relatively small
amount, $2.5 billion of publicly-held maturing debt. The terms of the
refunding will be announced in late April.
The Treasury is not expected to have to raise any further cash
in the current fiscal year through issues of its own debt. However,
consistent with the Budget Document, the Treasury's cash position may
be augmented by further sales of participation certificates by the
Export-Import Bank and, if necessary legislation is secured, by the
Small Business Administration. In addition, other Federal Agencies
are expected to continue to be sizable net borrowers of new cash in
the current quarter.
Corporate and municipal bond markets. The decline of bond
yields since early March has amounted to more than 1/3 of a percentage
point on new corporate bond issues and to about 1/5 of a percentage
point on State and local government bonds. In both markets, these
declines have erased more than half of the sharp yield advances which
had occurred from early December, when the discount rate was increased,
to early March. Although yields on seasoned corporate bonds have
moved divergently from other bond series in the past few weeks, they
always show a lagged response to rapid changes in other bond series.
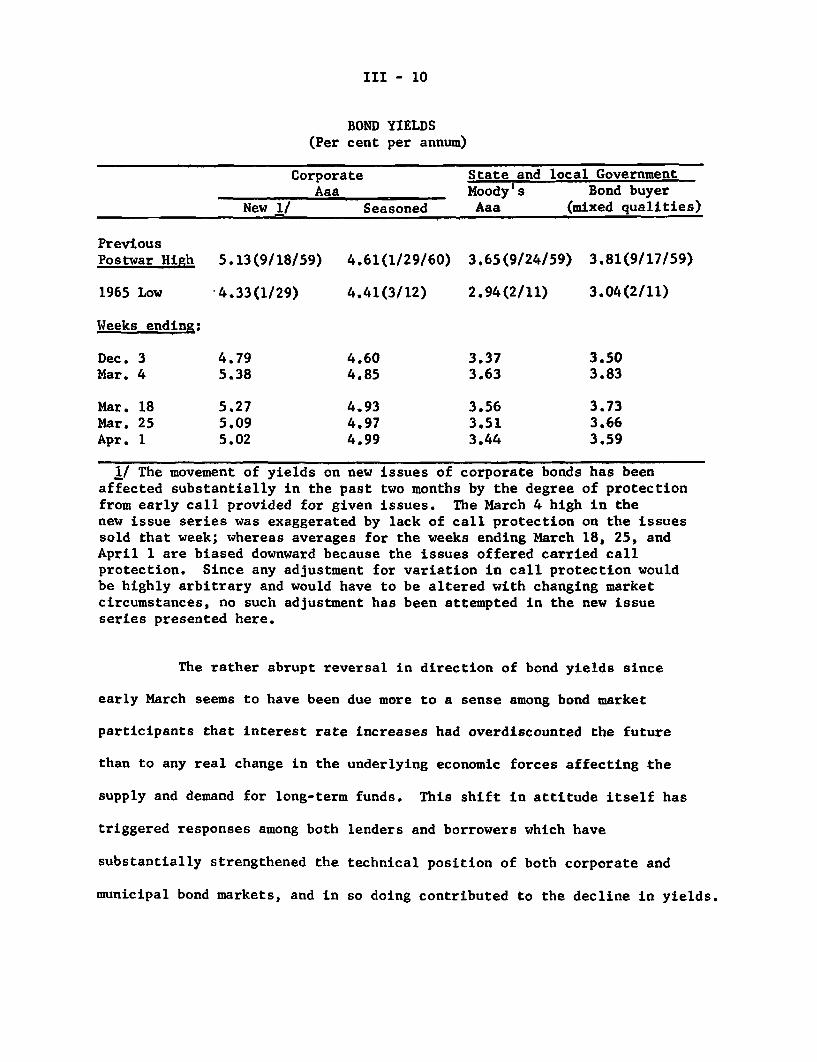
III - 10
BOND YIELDS(Per cent per annum)
Corporate State and local GovernmentAaa Moody's Bond buyer
New !/ Seasoned Aaa (mixed qualities)
PreviousPostwar High 5.13(9/18/59) 4.61(1/29/60) 3,65(9/24/59) 3.81(9/17/59)
1965 Low -4.33(1/29) 4.41(3/12) 2.94(2/11) 3.04(2/11)
Weeks ending:
Dec. 3 4.79 4.60 3.37 3.50Mar. 4 5.38 4.85 3.63 3.83
Mar. 18 5.27 4.93 3.56 3.73Mar. 25 5.09 4.97 3.51 3.66Apr. 1 5.02 4.99 3.44 3.59
l/ The movement of yields on new issues of corporate bonds has beenaffected substantially in the past two months by the degree of protectionfrom early call provided for given issues. The March 4 high in thenew issue series was exaggerated by lack of call protection on the issuessold that week; whereas averages for the weeks ending March 18, 25, andApril 1 are biased downward because the issues offered carried callprotection. Since any adjustment for variation in call protection wouldbe highly arbitrary and would have to be altered with changing marketcircumstances, no such adjustment has been attempted in the new issueseries presented here.
The rather abrupt reversal in direction of bond yields since
early March seems to have been due more to a sense among bond market
participants that interest rate increases had overdiscounted the future
than to any real change in the underlying economic forces affecting the
supply and demand for long-term funds. This shift in attitude itself has
triggered responses among both lenders and borrowers which have
substantially strengthened the technical position of both corporate and
municipal bond markets, and in so doing contributed to the decline in yields.
III - 11
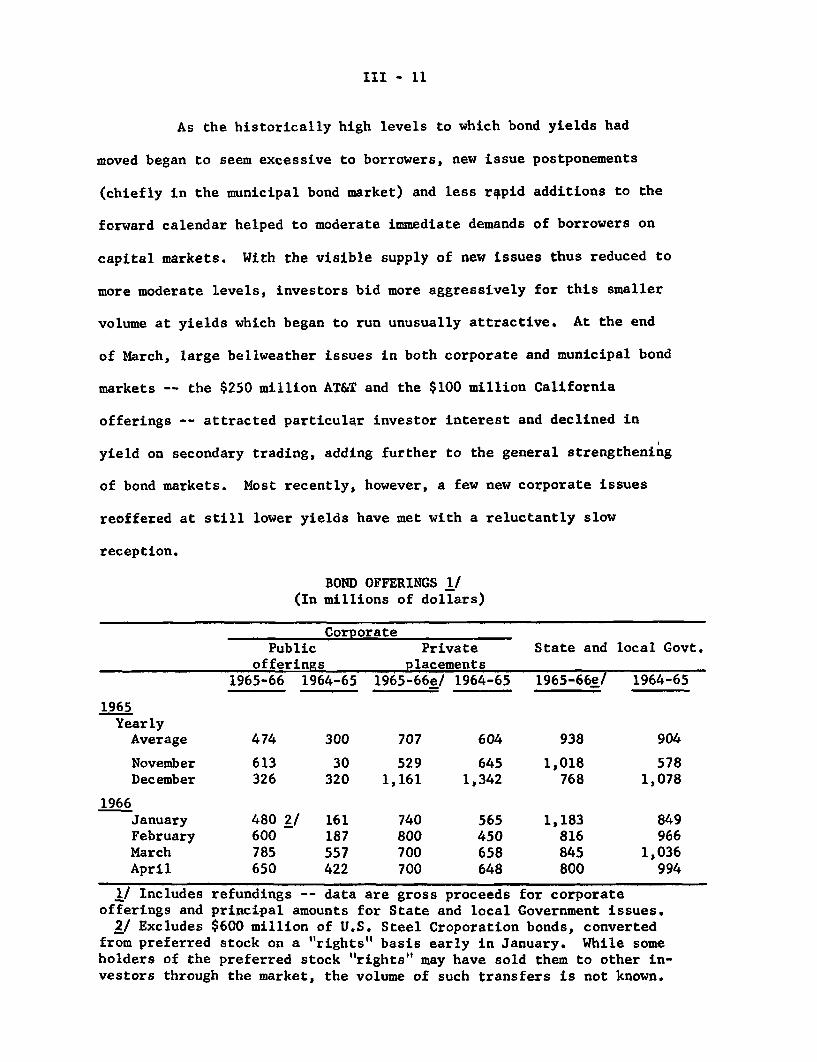
As the historically high levels to which bond yields had
moved began to seem excessive to borrowers, new issue postponements
(chiefly in the municipal bond market) and less rapid additions to the
forward calendar helped to moderate immediate demands of borrowers on
capital markets. With the visible supply of new issues thus reduced to
more moderate levels, investors bid more aggressively for this smaller
volume at yields which began to run unusually attractive. At the end
of March, large bellweather issues in both corporate and municipal bond
markets -- the $250 million AT&T and the $100 million California
offerings -- attracted particular investor interest and declined in
yield on secondary trading, adding further to the general strengthening
of bond markets. Most recently, however, a few new corporate issues
reoffered at still lower yields have met with a reluctantly slow
reception.
BOND OFFERINGS 1/(In millions of dollars)
CorporatePublic Private State and local Govt.
offerings placements1965-66 1964-65 1965-66e/ 1964-65 1965-66e/ 1964-65
1965YearlyAverage 474 300 707 604 938 904
November 613 30 529 645 1,018 578December 326 320 1,161 1,342 768 1,078
1966January 480 2/ 161 740 565 1,183 849February 600 187 800 450 816 966March 785 557 700 658 845 1,036April 650 422 700 648 800 994
1/ Includes refundings -- data are gross proceeds for corporateofferings and principal amounts for State and local Government issues.2/ Excludes $600 million of U.S. Steel Croporation bonds, converted
from preferred stock on a "rights" basis early in January. While someholders of the preferred stock "rights" may have sold them to other in-vestors through the market, the volume of such transfers is not known.
III - 12
Because the forward calendar of new corporate bond offerings
has grown less rapidly in recent weeks, the volume of new corporate issues
presently expected for public offering in April is about $100 million
smaller than the March volume -- which itself fell somewhat below earlier
estimates. This change follows a first quarter in which corporate
public offerings totaled over $1.8 billion or roughly twice the amount
offered in the like period of 1965.
Two key questions now facing the corporate market are
(1) the extent to which first quarter borrowing may have anticipated second
quarter business requirements, and (2) whether with yields now at lower
levels, new additions to the calendar will again pick up momentum.
Very recently several new offerings have been added to the near-term
projections that show large continuing business needs for funds. But
firm answers to the two questions must await further evidence.
Municipal bond offerings in March fell well below the volume
originally expected -- reflecting cancellations and postponements aggre-
gating in excess of $600 million (offset in part by advancement of the $100
million State of California offering). With the April calendar currently
estimated at about $800 million, this year's volume of offerings appears
to be running well behind last year's, except for the outsized January
supply. Here too, however, market participants are sensitive to the
possibility that the recent drop-off in yields may encourage a pick up
in new issues -- including some of those that were recently postponed.
III - 13
Mortgage markets. Even though net inflows of funds to
depository-type institutions have slowed further this year net expansion in
mortgage debt in the first quarter is estimated to have approached the
advanced level of a year earlier. This increase, if realized, would
be somewhat larger than we had projected earlier. The difference reflects
a sharper-than-expected expansion in holdings by the Federal National
Mortgage Association, and a higher-than-anticipated rate of mortgage
activity by savings and loan associations -- supported in part by a much
less than seasonal reduction in borrowings from Federal Home Loan Banks.
As the quarter ended, however, such borrowing became more
excessive to the associations, when virtually all the Home Loan Banks
raised their rates on borrowings by amounts ranging from 1/8 to 5/8
per cent -- to levels between 5 and 5-3/8 per cent.
In February, FNMA purchases of Government-underwritten
home mortgages in the secondary market soared far above a year
earlier and well above the previous record in January. While offerings
of eligible mortgages for purchase by FNMA slackened a bit in
February, they appeared to be rising again in March. In a further
attempt to discourage this tendency, FNMA in early April announced
that it would limit the unpaid amount of mortgages it will buy to
$15,000. This compares with potential maxima of $30,000 for FHA-
insured mortgages and $21,425 for VA-guaranteed mortgages.
III - 14
Trade reports continue to emphasize that the recent 1/4 per
cent upward adjustment in maximum permitted rates for Government-
underwritten mortgages for homes is too low to attract lenders under
current market conditions. As a result, discounts have continued,
especially-in the West, and there is concern about the availability of
mortgage funds, particularly for the sale of existing homes on which
new home-purchases depend to a marked extent.
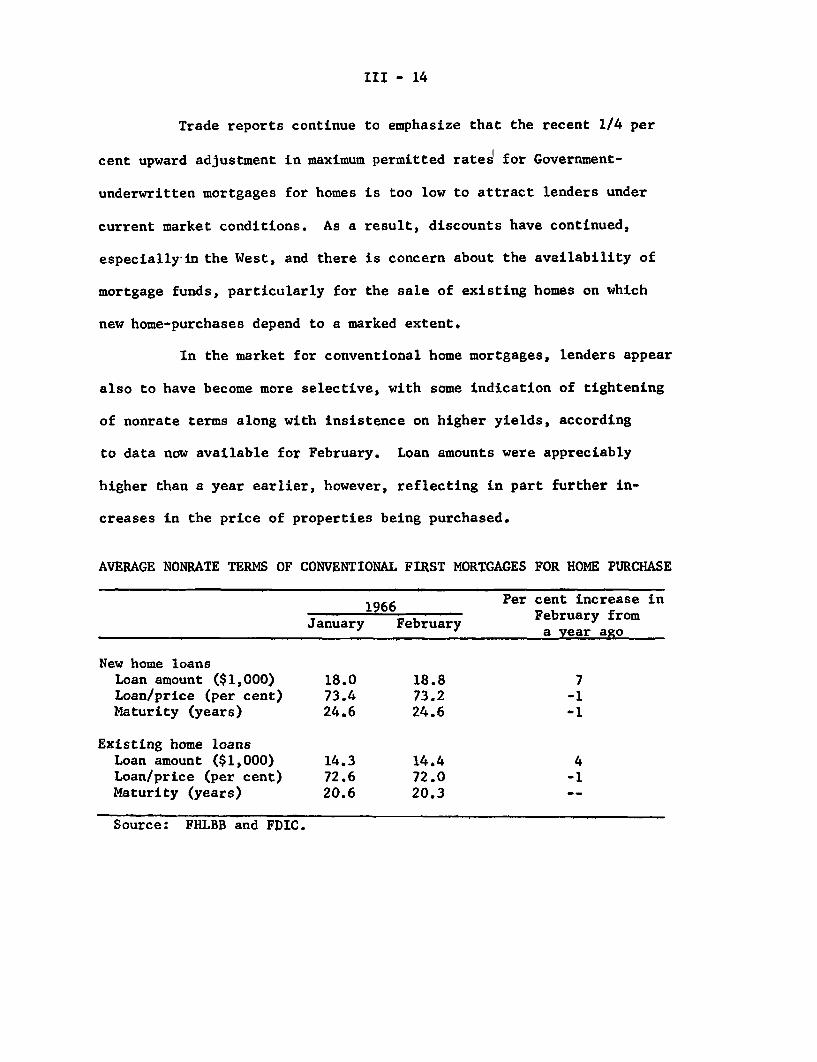
In the market for conventional home mortgages, lenders appear
also to have become more selective, with some indication of tightening
of nonrate terms along with insistence on higher yields, according
to data now available for February. Loan amounts were appreciably
higher than a year earlier, however, reflecting in part further in-
creases in the price of properties being purchased.
AVERAGE NONRATE TERMS OF CONVENTIONAL FIRST MORTGAGES FOR HOME PURCHASE
196 Per cent increase in1966
February fromJanuary February February from
a year ago
New home loansLoan amount ($1,000) 18.0 18.8 7Loan/price (per cent) 73.4 73.2 -1Maturity (years) 24.6 24.6 -1
Existing home loansLoan amount ($1,000) 14.3 14.4 4Loan/price (per cent) 72.6 72.0 -1Maturity (years) 20.6 20.3
Source: FHLBB and FDIC.
III - 15
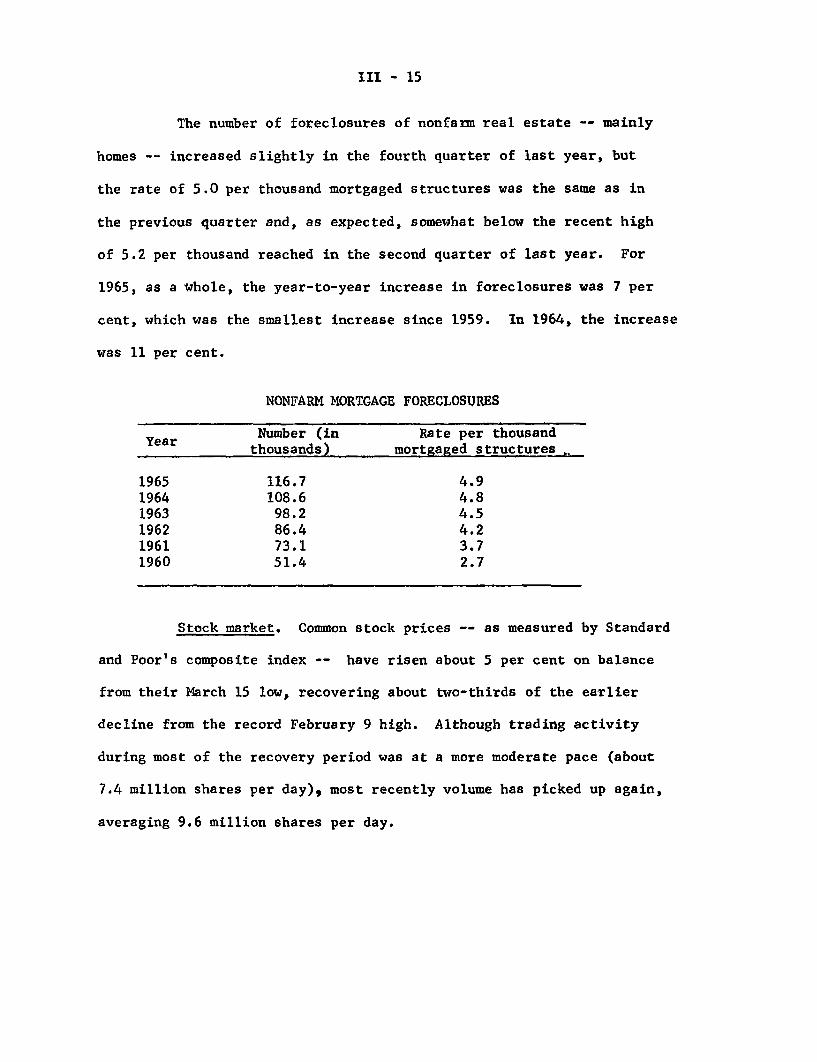
The number of foreclosures of nonfarm real estate -- mainly
homes -- increased slightly in the fourth quarter of last year, but
the rate of 5.0 per thousand mortgaged structures was the same as in
the previous quarter and, as expected, somewhat below the recent high
of 5.2 per thousand reached in the second quarter of last year. For
1965, as a whole, the year-to-year increase in foreclosures was 7 per
cent, which was the smallest increase since 1959. In 1964, the increase
was 11 per cent.
NONFARM MORTGAGE FORECLOSURES
Number (in Rate per thousandYear thousands) mortgaged structures .
1965 116.7 4.91964 108.6 4.81963 98.2 4.51962 86.4 4.21961 73.1 3.71960 51.4 2.7
Stock market. Common stock prices -- as measured by Standard
and Poor's composite index -- have risen about 5 per cent on balance
from their March 15 low, recovering about two-thirds of the earlier
decline from the record February 9 high. Although trading activity
during most of the recovery period was at a more moderate pace (about
7.4 million shares per day), most recently volume has picked up again,
averaging 9.6 million shares per day.
III - 16
The price recovery associated with the period of moderate
trading was a bit hesitant, reflecting continued market sensitivity
to discussion of possible Federal actions on the tax and wage-price
fronts. But very recently the advances have been strong with
institutional investors reportedly buying blue chip stocks. Moreover,
market analysts expect that March earnings statements, soon to be
released, will prove to be more favorable than some had feared,
adding further to general investor interest.
Trading in low-priced stocks and special industry stock
groupings, which have consistently attracted a speculative following,
continues to be quite heavy. In fact these groups have registered
substantial price advances even in weeks when the broad indexes were
declining; and the indexes for stocks in the electronics, air transport,
radio-TV, and metal fabricating industry groupings have all moved
recently to new 1965-66 highs. To a considerable extent this continued
speculative activity in low-priced stocks and favored industry groupings
probably explains why stock market credit reported by firms in the New
York Stock Exchange margin panel showed an $88 million increase in
February at a time when the popular stock market averages were showing
sharp net declines.
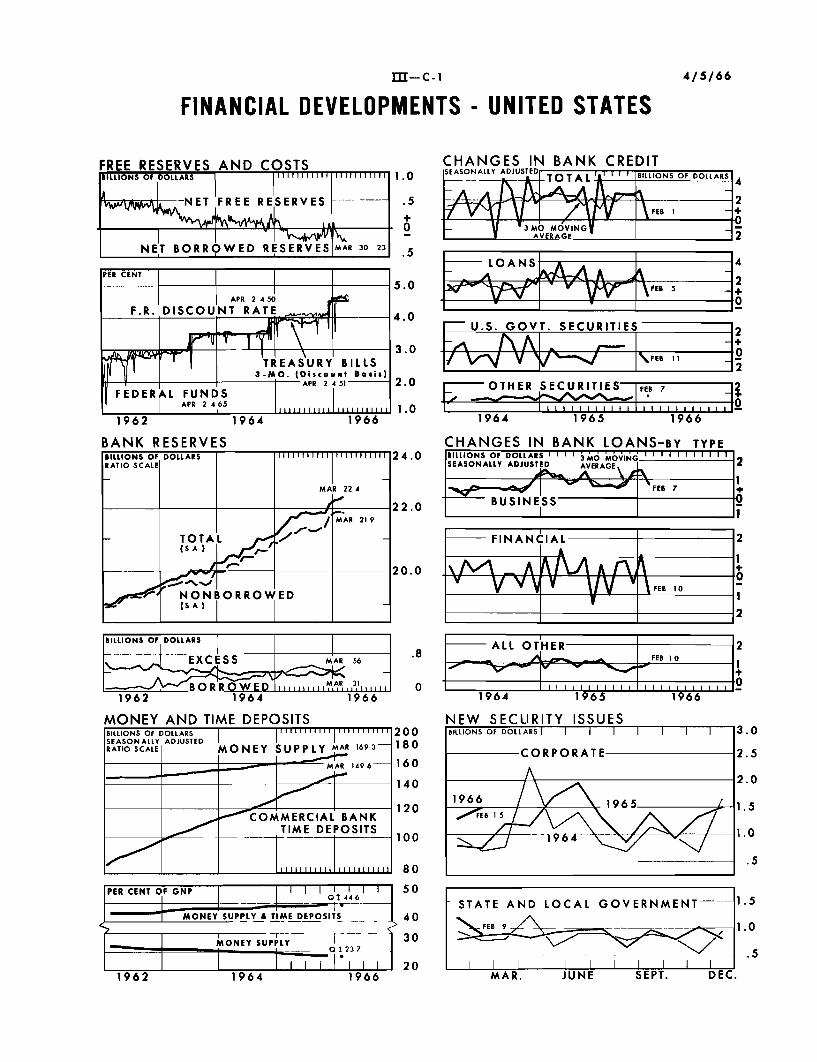
III -C.1
FINANCIAL DEVELOPMENTS - UNITED STATES
FREE RESERVES AND COSTSBILLIONS OF DOLLARS IIllIIIII I II l.l.l.l..
ET FREE RESERVES
NET BORROWED RESERVES MAR 30 23
-U.S. GOVT. SECURITIES 2
3.0 L6 nA , I +\FEB 11
2.0 OTHER SECURITIES F 7 t2
1.0 if iI i i I 21964 1965 1966
BANK RESERVES
MONEY AND TIME DEPOSITSBILLIONS OF DOLLARS | | I...SEASONALLY ADJUSTEDRATIO SCALE MONEY SUPPLY MAR 163-
-- , - 'FM 6-
PER CENT OF GNP I I I I 500146J I - -. . . ' -- T r - -
SMONEY SUPPLY A TIME DEPOSITS 40
-r --- 30MONEY SUPPLY 3 30
_ O I l 23 7
I I I I I 2 0
CHANGES IN BANK LOANS-BY TYPE4.0 uBLLlONS OF DOLLARS I I I I M I I I I I I
SEASONALLY ADJUSTED AVERAGE- 2
FEB 7
BUSINESS 0I 1
FINANCIAL 2
S1
V V UV FEB 10
12
NEW SECURITY ISSUESBILLIONS OF DOLLARS I I I I I I I 3
CORPORATE 2
2A 2
1966 1965 11
SE VE1964N 1
STATE AND LOCAL GOVERNMENT-- 1
4/5/66
I/ v v '--
1962 1964 1966 MAR. JUNE SEPT. DEC.
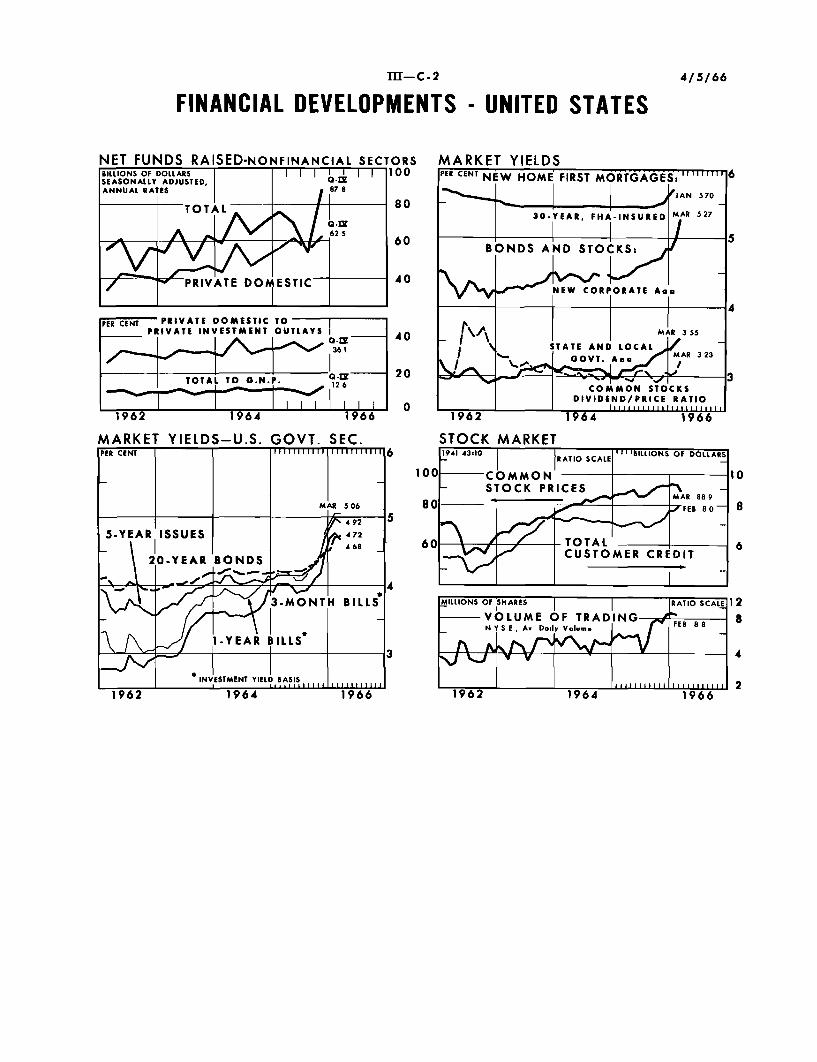
III-C-2FINANCIAL DEVELOPMENTS - UNITED STATES
NET FUNDS RAISED-NONFINANCIALBILLIONS OF DOLLARSSEASONALLY ADJUSTED,ANNUAL RATES
TOTAL
87 8
Ix 2
1062'
SECTORST-I1100
-IFF V
/ PRIVATE DOMESTIC-
PER CENT PRIVATE DOMESTIC TOPRIVATE INVESTMENT OUTLAYS
361
TOTAL TO o.N.P. 1
1962 1964 1966
MARKET YIELDS-U.S. GOVT. SEC.PER CENT IIIIII I III 11 1111 1 6
MAR 506
492 5
O4 68 --
20-YEAR BONDS
3-MONTH BILLS
1 - Y E A R BILLS
INVESTMENT YIELD BASIS
MARKET YIELDSPER CENT NEW HOME FIRST MORTGAGES:" ' 6
I ,. JAN 570
30-YEAR, FHA-INSURED MAR 527
BONDS AND STOCKS:
SNEW CORPORATE ao
4
MAR 3 55
STATE AND OCA" --:, - . "0
vT " A .A 3 23
COMMON STOCKS
DIVIDEND/PRICE RATIO
1962 1964 1966
STOCK MARKET1941 4310 RATIO S E II BILLIONS OF DOLLARS
-- COMMON - 10STOCK PRICES . M AR 88 e
.- FEB 80 8
S / -TOTAL 6CUSTOMER CREDIT
4/5/66
1962 1964 1966
IV - 1
INTERNATIONAL DEVELOPMENTS
U.S. balance of payments. Preliminary weekly indicators
for March, before seasonal adjustment, show a U.S. payments surplus on
the liquidity basis of roughly $100 million for the month, following
approximate balance in the 2-month period January-February. This implies
a deficit for the first quarter, after preliminary seasonal adjustment,
at an annual rate of about $1-1/2 billion, unchanged from the fourth
quarter. However, as indicated in the March 16 Green Book, adjustments
for the postponement into the first quarter of Canadian security issues
and for certain other unusual developments indicate that on other trans-
actions there was a moderate improvement from the fourth quarter.
Data presently available do not account for the improvement.
While there was a substantial reflow from abroad of outstanding U.S.
bank credits, this was offset by further narrowing of the trade surplus.
Merchandise imports in February continued at about the high
January rate of $23-1/4 billion annually; at this level they were un-
changed from the average for November-December, although up slightly from
the fourth quarter. (The February import figure reflects a tentative
statistical adjustment for carryover of import documents that is still
subject to revision.)
Exports in February were unchanged from January; the $27-1/4
billion annual rate in these months was down 3 per cent from the fourth
quarter. The decline was concentrated in non-agricultural exports;
agricultural exports, seasonally adjusted,were unchanged in January-
February from the fourth-quarter rate.
IV - 2
By geographical area, the decline in exports through January
is apparently more than fully accounted for by reduced shipments to
Japan and to less developed countries in Asia and Africa. In December-
January (the latest data with country detail), total exports seasonally
adjusted but without other adjustments were down 3 per cent from October-
November. Exports to Japan were down one-sixth, possibly reflecting
the seamen's strike in that country from November to January. Exports
to Australia, South Africa and LDC's outside Latin America together
were off about 7 per cent, and those to Continental Europe fell slightly.
On the other hand, exports to Canada and the United Kingdom increased.
There were large reflows of U.S. bank credits again in
February; in the first two months of the year, banks under the VFCR
reported a net reduction of $385 million in claims covered by the
voluntary program--not seasonally adjusted. This figure differs only
slightly from the reduction in claims reported by all banks in the
United States (including agencies and branches of foreign banks) both
for their own account and for account of customers. With the February
data, there is evidence of a more widespread geographical pattern of
reflows than was apparent earlier, and hence an increased likelihood
that the reflows resulted from constraints on the supply of credit.
There have been sharp reductions in outstanding bank loans and
acceptance credits to Europe and Latin America, as well as in credits
to Japan. Much of the reduction has been accounted for by banks in
the New York Federal Reserve District, and may well reflect special
pressures on these banks. At the end of February, New York District
IV - 3
banks reported outstanding claims under the VFCR below the October 31
level, while Chicago and San Francisco banks both remained about even
with their positions at end October.
Additional evidence of the effects of credit restraint may
be found in recent information on commitments on long-term loans.
Total commitments thus far reported for the first quarter amount to
$115 million -- approximately one-third of the average rate in the
second half of last year. Even with some additional reports still to
be received, it seems highly likely that the rate for the first
quarter will prove to be under half that of the last six months of
1965. Commitments on loans to developed and to less developed countries
have each been reduced proportionately; commitments for loans to finance
U.S. exports have been reduced by a slightly smaller percentage than
total commitments.
Foreign trade of other industrial countries. Strong upswings
in imports were occurring during the second half of 1965 in Canada, in
all of the Common Market countries but Germany, and in some other
European countries as well. These upswings in some cases continued
and intensified advances that had already been under way for periods
of varying length (from January 1965 for Belgium, from mid-1964 for
Italy, from early 1963 for Canada). In other cases, as in France, the
Netherlands, and Switzerland, there had been pauses of 12 months or more
during which imports were comparatively stable, before new upturns
occurred at the middle of last year.
While it is true that total 1965 imports of Common Market
countries were only 9 per cent above those of 1964 (see Appendix C), the
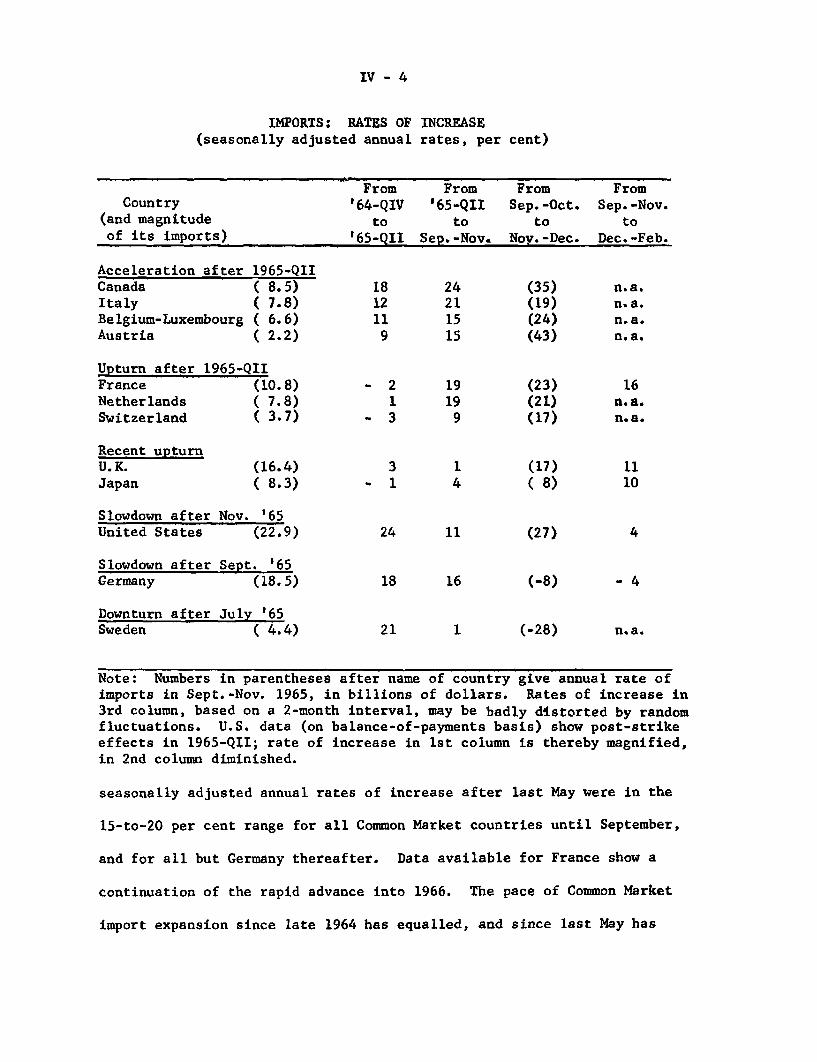
IV - 4
IMPORTS: RATES OF(seasonally adjusted annual
INCREASErates, per cent)
From From From FromCountry '64-QIV '65-QII Sep.-Oct. Sep.-Nov.
(and magnitude to to to toof its imports) '65-QII Sep.-Nov. Noy.-Dec. Dec.-Feb.
Acceleration after 1965-QIICanada ( 8.5) 18 24 (35) n.a.Italy ( 7.8) 12 21 (19) n.a.Belgium-Luxembourg ( 6.6) 11 15 (24) n.a.Austria ( 2.2) 9 15 (43) n.a.
Upturn after 1965-QIIFrance (10.8) - 2 19 (23) 16Netherlands ( 7.8) 1 19 (21) n.a.Switzerland (3.7) - 3 9 (17) n.a.
Recent upturnU.K. (16.4) 3 1 (17) 11Japan ( 8.3) - 1 4 (8) 10
Slowdown after Nov. '65United States (22.9) 24 11 (27) 4
Slowdown after Sept. '65Germany (18.5) 18 16 (-8) - 4
Downturn after July '65Sweden ( 4.4) 21 1 (-28) n.a.
Note: Numbers in parentheses after name of country give annual rate ofimports in Sept.-Nov. 1965, in billions of dollars. Rates of increase in3rd column, based on a 2-month interval, may be badly distorted by randomfluctuations. U.S. data (on balance-of-payments basis) show post-strikeeffects in 1965-QII; rate of increase in 1st column is thereby magnified,in 2nd column diminished.
seasonally adjusted annual rates of increase after last May were in the
15-to-20 per cent range for all Common Market countries until September,
and for all but Germany thereafter. Data available for France show a
continuation of the rapid advance into 1966. The pace of Common Market
import expansion since late 1964 has equalled, and since last May has
IV - 5
exceeded the largest year-over-year rate of increase shown by Common
Market imports in recent years, which was 13 per cent from 1962 to 1963.
German imports reached a peak last September which was not
surpassed in the five subsequent months, though after a sharp dip in
October the advance was resumed at a moderate pace. The one case in
Europe of a marked downturn in imports is that of Sweden, whose imports
fell almost continuously (to the year-end at least) after reaching a
peak in July.
The long awaited upturn in Japanese imports has now become
more clearly evident, with a sharp jump in February, possibly delayed
by the Japanese seamen's strike. For 1965 as a whole Japanese imports
were up only 3 per cent from 1964. In contrast, January-February 1966
imports were 10 per cent above those of the first two months of 1965.
British imports, which had been relatively level from last
spring until September or October, moved up to a new high in January-
February.
Data are not available on a seasonally adjusted basis to show
the sources from which the various countries have been drawing their
increased imports, except in the case of the United Kingdom. The expan-
sion of British imports since last autumn has been entirely from North
America (including, as we know, a sharp increase in purchases from the
United States) and Continental Europe.
Export statistics indicate marked accelerations in recent
months in the exports of Germany, Belgium, and the Netherlands. French
exports, on the other hand, have shown a considerably slower rise from
IV - 6
last autumn up to the latest three-month period, December-February,
than France experienced earlier in 1965. An even more marked change
appears to have developed in Italian exports: their uptrend, which
was one of the most striking features of international trade during
1964 and the early months of 1965, came virtually to a halt after June --
though irregular month-to-month fluctuations cloud the picture somewhat.
A similar leveling off occurred in Japanese exports, also after strong
growth in 1964 and early 1965. However, in the latest three-month
period (December-February) Japanese exports have once again shown vigorous
expansion. (Distortions of Japanese export statistics due to the seamen's
strike are largely removed by combining December with the following two
months.)
The slowing in French and Italian export gains, coinciding
as it has with upturn or acceleration in those countries' imports,
reflects the growth of domestic demands described in recent Green Books.
To the extent that these countries are drawing their additional imports
from other Common Market countries, especially Germany, the effect is
to sustain the pressures of aggregate demand upon available resources
in the other countries.
Canadian exports, after rising moderately from mid-1964 to
mid-1965 (when Canadian imports were sharply expanding) advanced more
rapidly after last summer. Even so, with Canadian import expansion
also accelerating, the trade balance deteriorated further; seasonally
adjusted, exports fell short of imports in the fourth quarter for the
first time since early 1962. Over the past year Canada's trade deficit
with the United States especially has been rising; in relative terms
Canada's exports to us have not increased as rapidly as its exports elsewhere.
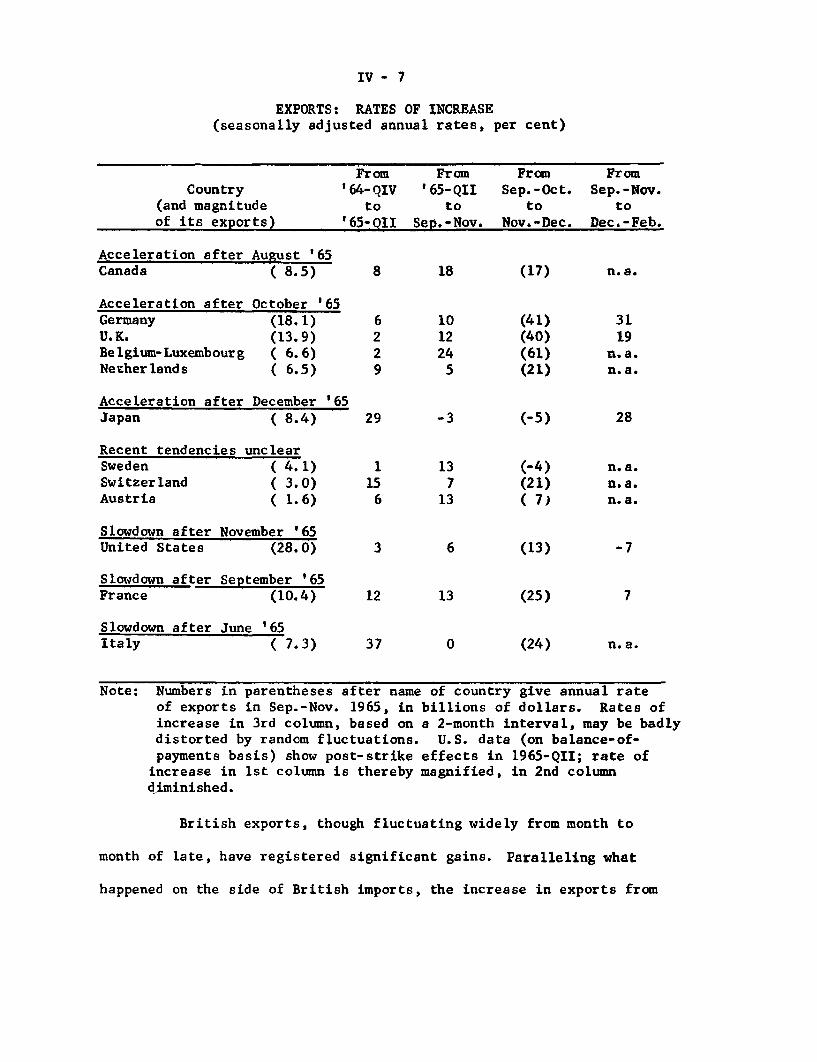
IV - 7
EXPORTS: RATES OF INCREASE(seasonally adjusted annual rates, per cent)
From From From FromCountry '64-QIV '65-QII Sep.-Oct. Sep.-Nov.
(and magnitude to to to toof its exports) '65-QII Sep,-Nov. Nov.-Dec. Dec.-Feb.
Acceleration after August '65Canada ( 8.5)
Acceleration after October '65Germany (18.1)U.K. (13.9)Belgium-Luxembourg ( 6.6)Netherlands ( 6.5)
Acceleration after December '65Japan ( 8.4)
Recent tendencies unclearSweden ( 4.1)Switzerland ( 3.0)Austria ( 1.6)
Slowdown after November '65United States (28.0)
Slowdown after September '65France (10.4)
Slowdown after June '65Italy ( 7.3)
(17)
(41)(40)(61)(21)
(-5)
(-4)(21)( 7)
(13)
(25)
(24)
n.a.
3119
n.a.
n.a.
28
n.a.n.a.n.a.
-7
7
n. a.
Note: Numbers in parentheses after name of country give annual rateof exports in Sep.-Nov. 1965, in billions of dollars. Rates ofincrease in 3rd column, based on a 2-month interval, may be badlydistorted by random fluctuations. U.S. data (on balance-of-payments basis) show post-strike effects in 1965-QII; rate of
increase in 1st column is thereby magnified, in 2nd columndiminished.
British exports, though fluctuating widely from month to
month of late, have registered significant gains. Paralleling what
happened on the side of British imports, the increase in exports from
IV - 8
September-November to December-February was entirely in shipments
to Western Europe and North America. The U.K. trade deficit in these
last three months was at an annual rate of $0.5 billion (seasonally
adjusted balance of payments basis) compared with $0.7 billion in the
preceding three months or in the full year 1965.
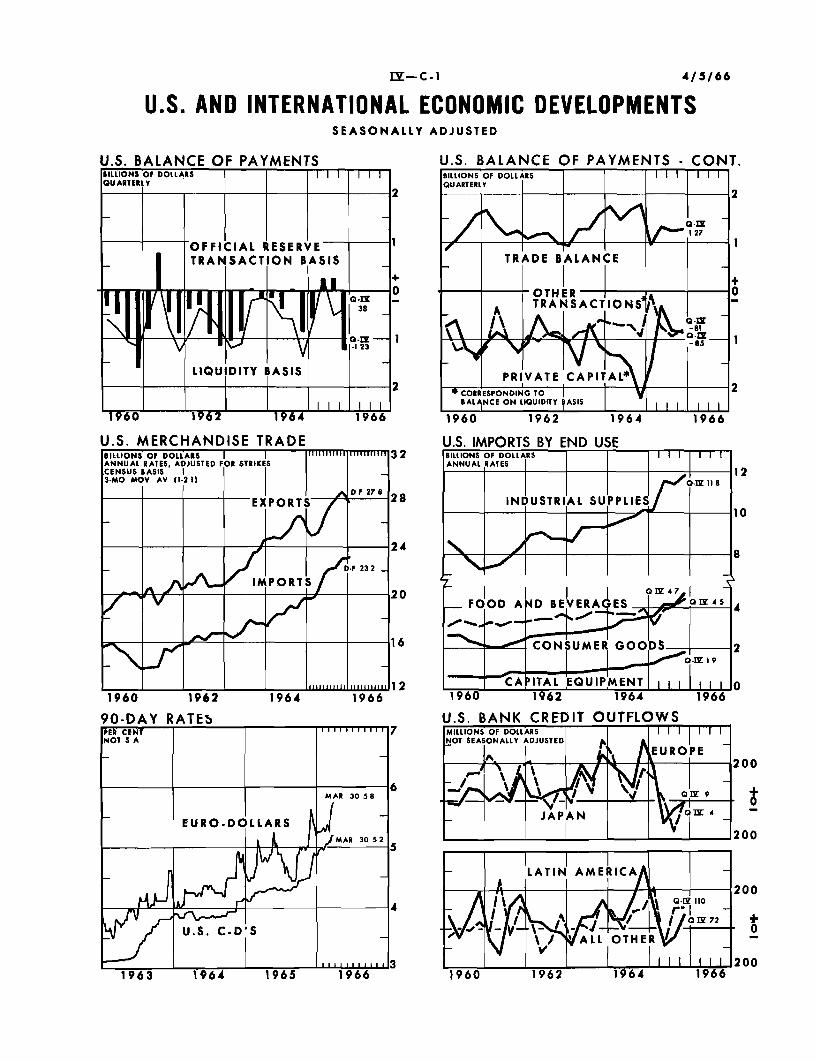
IV-C.1 4/5/66
U.S. AND INTERNATIONAL ECONOMIC DEVELOPMENTSSEASONALLY ADJUSTED
ALANCE OF PAYMENTS U.S. BALANCE OF PAYMENTS - CONT.OF DOLLARSI I I I I BILLIONS OF DOLLARSy QUARTERLY
2 2
1 27
OFFICIAL RESERVE 1TRANSACTION BASIS TRADE BALANCE
0 OTHER I 038TN TRANSACTIONS11a-. -- 1
.1 23
LIQUIDITY BASIS PRIVATE CAPITAL*
2 * CORRESPONDING TO
II I BALANCE ON LIQUIDITY BASIS
1960 1962 1964 1966
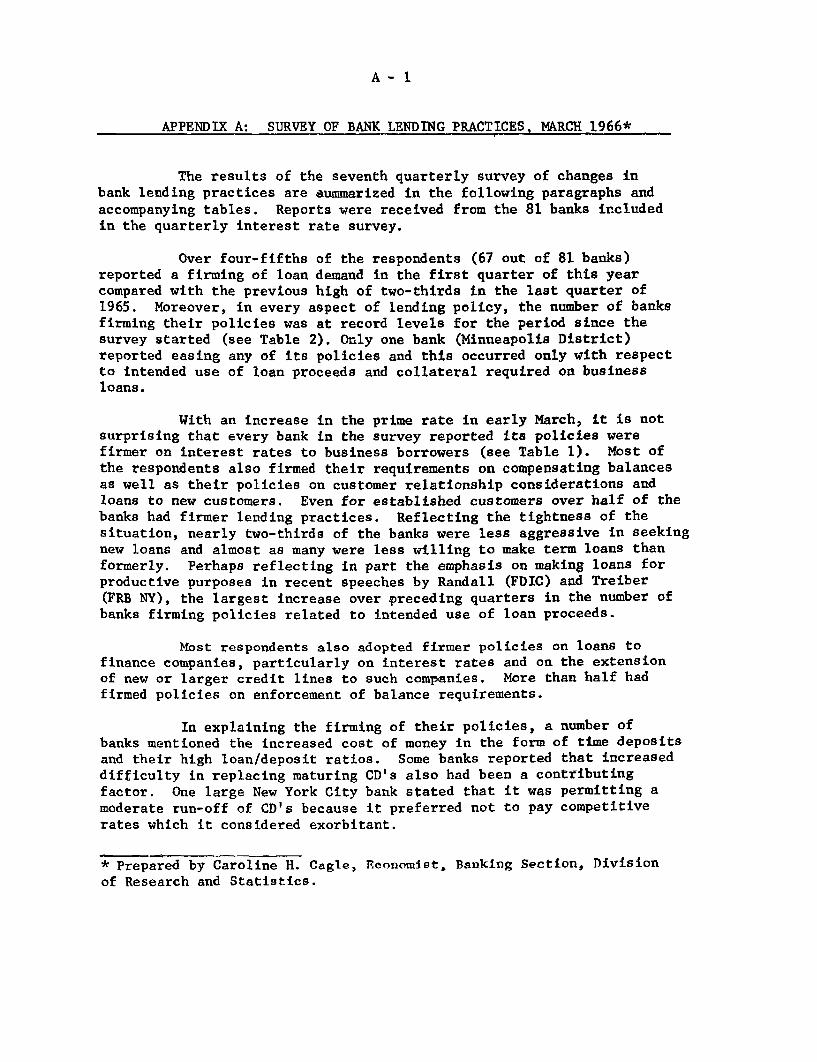
A-
APPENDIX A: SURVEY OF BANK LENDING PRACTICES, MARCH 1966*
The results of the seventh quarterly survey of changes inbank lending practices are summarized in the following paragraphs andaccompanying tables. Reports were received from the 81 banks includedin the quarterly interest rate survey.
Over four-fifths of the respondents (67 out of 81 banks)reported a firming of loan demand in the first quarter of this yearcompared with the previous high of two-thirds in the last quarter of1965. Moreover, in every aspect of lending policy, the number of banksfirming their policies was at record levels for the period since thesurvey started (see Table 2). Only one bank (Minneapolis District)reported easing any of its policies and this occurred only with respectto intended use of loan proceeds and collateral required on businessloans.
With an increase in the prime rate in early March, it is notsurprising that every bank in the survey reported its policies werefirmer on interest rates to business borrowers (see Table 1). Most ofthe respondents also firmed their requirements on compensating balancesas well as their policies on customer relationship considerations andloans to new customers. Even for established customers over half of thebanks had firmer lending practices. Reflecting the tightness of thesituation, nearly two-thirds of the banks were less aggressive in seekingnew loans and almost as many were less willing to make term loans than
formerly. Perhaps reflecting in part the emphasis on making loans for
productive purposes in recent speeches by Randall (FDIC) and Treiber(FRB NY), the largest increase over preceding quarters in the number of
banks firming policies related to intended use of loan proceeds.
Most respondents also adopted firmer policies on loans tofinance companies, particularly on interest rates and on the extensionof new or larger credit lines to such companies. More than half hadfirmed policies on enforcement of balance requirements.
In explaining the firming of their policies, a number ofbanks mentioned the increased cost of money in the form of time deposits
and their high loan/deposit ratios. Some banks reported that increased
difficulty in replacing maturing CD's also had been a contributingfactor. One large New York City bank stated that it was permitting amoderate run-off of CD's because it preferred not to pay competitive
rates which it considered exorbitant.
* Prepared by Caroline H. Cagle, Economist, Banking Section, Divisionof Research and Statistics.

A - 2
Several banks mentioned that they were rationing credit.Some were refusing to make loans for speculative purposes and one bankstated that loan proceeds must be for "useful economic, productive pur-poses". Several banks also pointed out that they were not taking on anynew finance company lines and they were attempting to avoid term loancommitments.
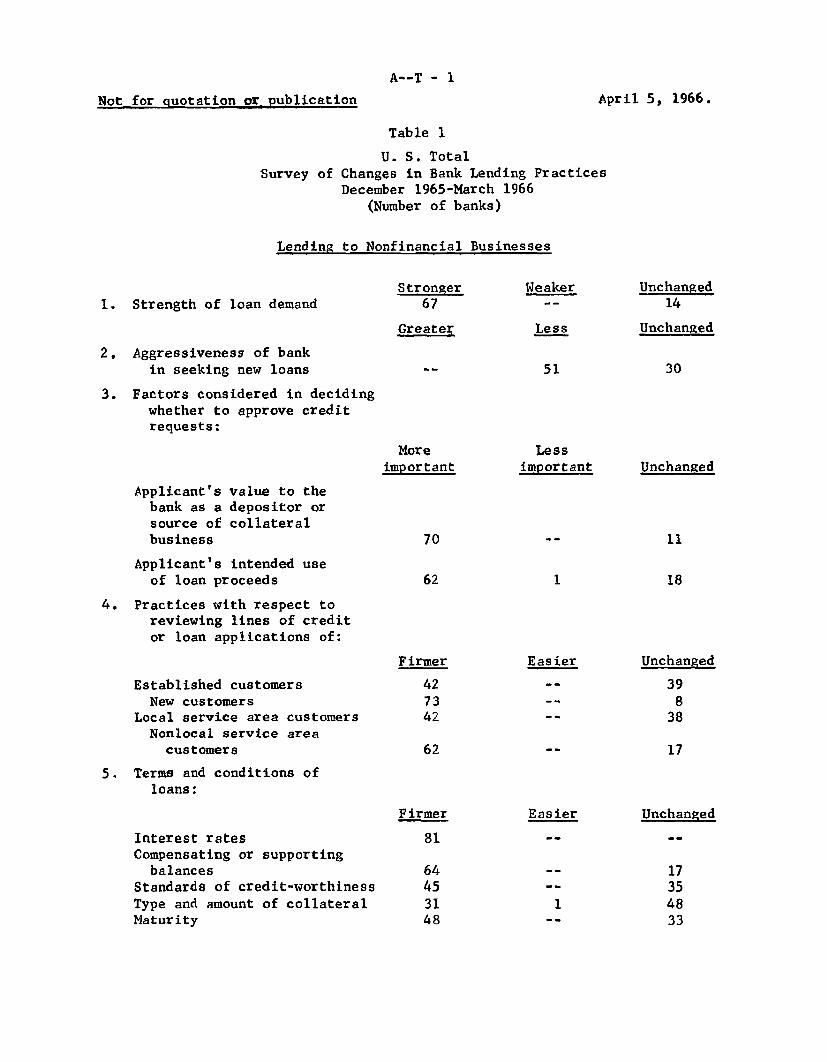
A--T - 1
Not for auotation or publication April 5, 1966.
Table 1
U. S. TotalSurvey of Changes in Bank Lending Practices
December 1965-March 1966(Number of banks)
Lending to Nonfinancial Businesses
1. Strength of loan demandStronger
67
Greater
2. Aggressiveness of bankin seeking new loans
3. Factors considered in decidingwhether to approve creditrequests:
Weaker
Less
51
Unchanged14
Unchanged
30
Moreimportant
Applicant's value to thebank as a depositor orsource of collateralbusiness
Applicant's intended useof loan proceeds
4. Practices with respect toreviewing lines of creditor loan applications of:
Established customersNew customers
Local service area customersNonlocal service area
customers
5, Terms and conditions ofloans:
Interest ratesCompensating or supporting
balancesStandards of credit-worthinessType and amount of collateralMaturity
Firmer
427342
Firmer
81
64453148
Lessimportant
Easier
-*
Easier
1--
Unchanged
Unchanged
39838
Unchanged
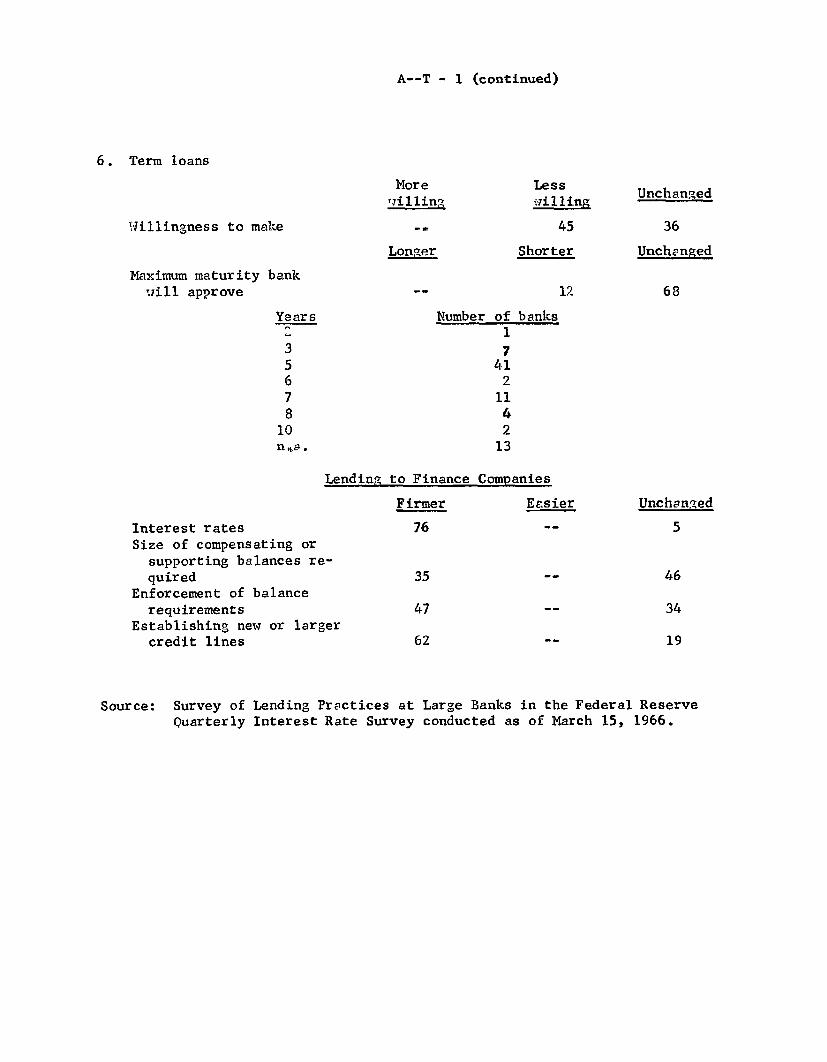
A--T - 1 (continued)
6. Term loans
More LessUnchanged
illing willing Uncha
Willingness to make - 45 36
Longer Shorter Unchenged
Maximum maturity bankwill approve -- 12 68
Years Number of banks2 13 75 416 27 118 4
10 2n*0. 13
Lending to Finance Companies
Firmer Easier Unchsnged
Interest rates 76 -- 5Size of compensating or
supporting balances re-quired 35 -- 46
Enforcement of balancerequirements 47 -- 34
Establishing new or largercredit lines 62 -- 19
Source: Survey of Lending Practices at Large Banks in the Federal ReserveQuarterly Interest Rate Survey conducted as of March 15, 1966.
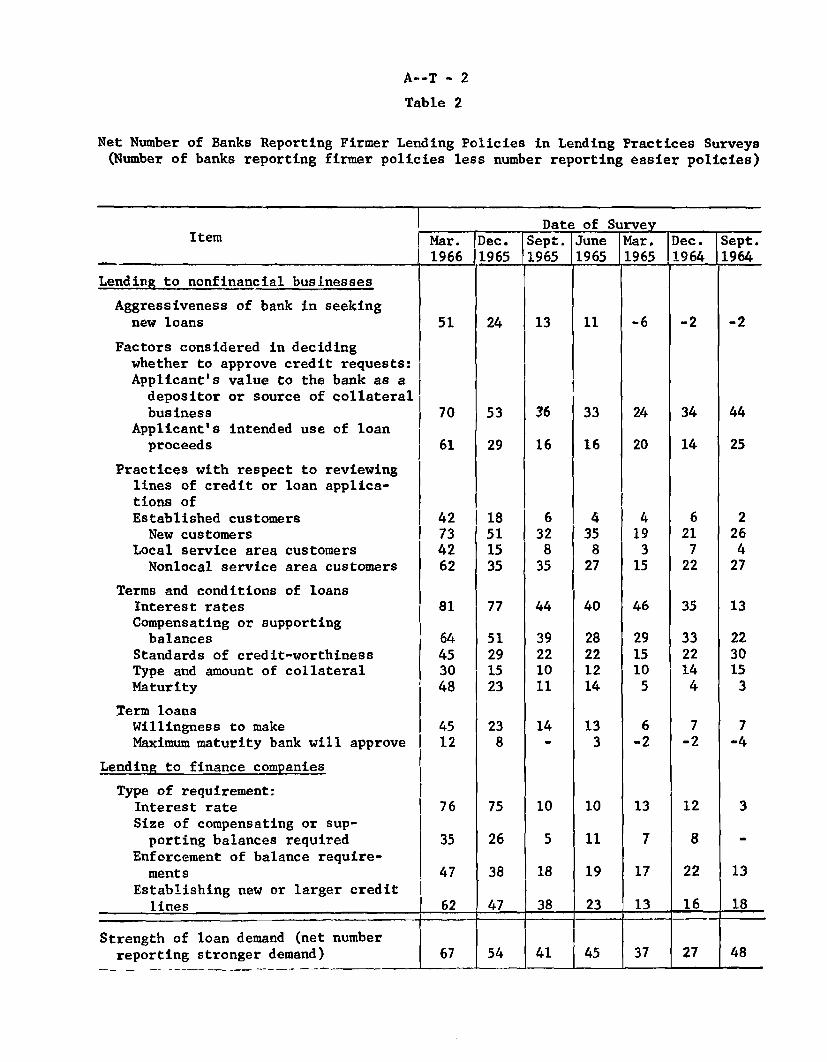
A--T - 2
Table 2
Net Number of Banks Reporting Firmer Lending Policies in Lending Practices Surveys(Number of banks reporting firmer policies less number reporting easier policies)
Date of SurveyItem Mar. Dec. Sept. June Mar. Dec. Sept.
____1966 1965 1965 1965 1965 1964 1964
Lending to nonfinancial businesses
Aggressiveness of bank in seekingnew loans 51 24 13 11 -6 -2 -2
Factors considered in decidingwhether to approve credit requests:Applicant's value to the bank as adepositor or source of collateralbusiness 70 53 36 33 24 34 44
Applicant's intended use of loanproceeds 61 29 16 16 20 14 25
Practices with respect to reviewinglines of credit or loan applica-tions ofEstablished customers 42 18 6 4 4 6 2New customers 1 73 51 32 35 19 21 26
Local service area customers 42 15 8 8 3 7 4Nonlocal service area customers 62 35 35 27 15 22 27
Terms and conditions of loansInterest rates 81 77 44 40 46 35 13Compensating or supporting
balances 64 51 39 28 29 33 22Standards of credit-worthiness 45 29 22 22 15 22 30Type and amount of collateral 30 15 10 12 10 14 15Maturity 48 23 11 14 5 4 3
Term loansWillingness to make 45 23 14 13 6 7 7Maximum maturity bank will approve 12 8 - 3 -2 -2 -4
Lending to finance companies
Type of requirement:Interest rate 76 75 10 10 13 12 3Size of compensating or sup-porting balances required 35 26 5 11 7 8 -
Enforcement of balance require-ments 47 38 18 19 17 22 13
Establishing new or larger creditlines 62 47 38 23 13 16 18
Strength of loan demand (net number
reporting stronger demand) 67 54 41 45 37 27 48
B- 1
APPENDIX B: PRODUCTION INDEX*
The question has been raised whether the industrial productionindex currently may be overstating the rise in output because of theproductivity factors used to adjust the monthly manhour series in theindex. Any great overstatement in the manhour series, on average,would clearly have a significant effect on the index, because theseseries comprise half the total. The hypothesis of too much increasefor these series, moreover, seems to gain support from the fact thatthese manhour series, as adjusted, on the whole are showing considerablymore rise in production than the other series,designated here as Qseries. It is clear, additionally, that in a period of high productionand strong pressure on available resources important forces are at worktending to slow down increases in productivity; additional workerstaken in, for example, typically are less skilled and in many plantsthe problem of getting products out and delivered assumes more impor-tance than usual relative to the problem of getting the most outputper dollar of production cost. Finally, in thinking about measurementproblems, the difficulty of determining almost instantaneously justexactly what is happening to productivity in any particular line isevident for all to see. A discerning critic might argue that while itis important to try to measure output in equipment and other lines forwhich few relatively unambiguous measures are available, the manhourfigures as adjusted should be scrutinized and used with special care.
Does this all add up to a persuasive case for discountingthe 8 per cent rise in the index over the past year and especially the18 per cent increase in equipment production, which is represented inlarge part by manhour series? Those familiar with the history of theindex, with the methods by which it is currently compiled and with theresults shown by alternative approaches to measurement of output in theindustries represented by manhours will recognize that the case forskepticism has been greatly overstated in the preceding paragraph;no mention was made, for example, of the large volume of new laborsaving equipment already installed and now coming on stream foreffective use. Further, while no current figure can be expected tocorrespond exactly to the final figures adjusted to Census benchmarks,it can be shown (1) that the productivity factors for the manhourseries--practically all in the manufacturing component--are underconstant review, with special attention being given to their behavior
*--Prepared by Frank R. Garfield, Adviser, Division of Research andStatistics, and Edward A. Manookian, Economist, Business ConditionsSection.
B - 2
in relation to that in industries for which relatively unambiguousproduction figures are available to compare with manhour figures;(2) that the course of production shown by the adjusted manhourseries is fairly reasonable in the light of evidence in the form ofrelated data on shipments by manufacturers and on electric powerconsumption; and (3) that the rise in industrial production has beenunusually rapid over the past year, almost irrespective of anyalteration one might reasonably choose to make in the productivityfactors affecting the manhour half of the index.
On (3) above, suppose the average productivity rise shownshould be reduced from the current reduced rate of about 3 per centper year to about 2 per cent--an action not advocated here--how muchwould the course of the index be affected? It would show a rise of
7-1/2 per cent rather than 8 per cent over the past year; and anaverage figure as low as 2 per cent for productivity increases inthe manhour area would be hard to justify. The equipment series,moreover, have been showing so much more rise than the consumergoods series and the materials series (both less heavily representedby manhour series) that any change that might be made in productivityfactors would have little impact on the differences; the showing wouldstill be that output of equipment is rising very much faster than otherindustrial output.
On (2) above, it may be noted that while the manhour seriesas adjusted for productivity change have indicated a production riseof 13 per cent for their half of the index over the past year, electricpower consumption in these same industries has risen 14 per cent. Thereis a tendency for electric power consumption to rise a little more thanproduction but not enough to alter the substantial agreement thesefigures suggest.
Considering (1) above, account is taken of a wide diversityof rates of increase in output and productivity evident within boththe Q series and the MH series. The individual allowances used toadjust the 60 series based on manhour data vary at present from 1-1/2per cent per year for cereals and feeds up to 6 per cent in the caseof basic chemicals, averaging about 3 per cent. The productivityfactors for each manhour series over past years are derived fromannual indexes based primarily on independent product data. For thecurrent years, these factors are tentatively extrapolated in a smoothline and the rate of increase is based, in part, on the past performanceof each series. But the implied changes in productivity for the wholeMH area are continuously checked against the implied productivity forthe total of the 150 Q series in the index. Any related data availablepertaining to various parts of the MH area are also used as checks.
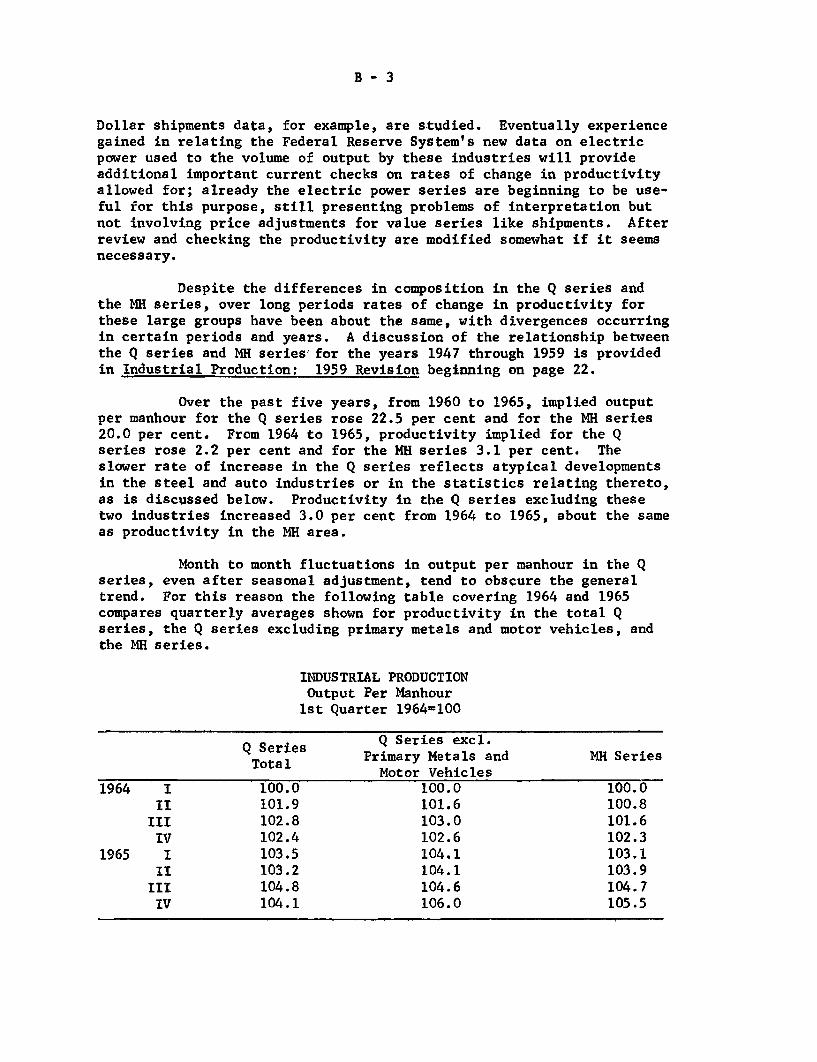
B- 3
Dollar shipments data, for example, are studied. Eventually experiencegained in relating the Federal Reserve System's new data on electricpower used to the volume of output by these industries will provideadditional important current checks on rates of change in productivityallowed for; already the electric power series are beginning to be use-ful for this purpose, still presenting problems of interpretation butnot involving price adjustments for value series like shipments. Afterreview and checking the productivity are modified somewhat if it seemsnecessary.
Despite the differences in composition in the Q series andthe MH series, over long periods rates of change in productivity forthese large groups have been about the same, with divergences occurringin certain periods and years. A discussion of the relationship betweenthe Q series and MH series'for the years 1947 through 1959 is providedin Industrial Production: 1959 Revision beginning on page 22.
Over the past five years, from 1960 to 1965, implied outputper manhour for the Q series rose 22.5 per cent and for the MH series20.0 per cent. From 1964 to 1965, productivity implied for the Qseries rose 2.2 per cent and for the MH series 3.1 per cent. Theslower rate of increase in the Q series reflects atypical developmentsin the steel and auto industries or in the statistics relating thereto,as is discussed below. Productivity in the Q series excluding thesetwo industries increased 3.0 per cent from 1964 to 1965, about the sameas productivity in the MH area.
Month to month fluctuations in output per manhour in the Qseries, even after seasonal adjustment, tend to obscure the generaltrend. For this reason the following table covering 1964 and 1965compares quarterly averages shown for productivity in the total Qseries, the Q series excluding primary metals and motor vehicles, andthe MH series.
INDUSTRIAL PRODUCTIONOutput Per Manhour1st Quarter 1964=100
SSeries Q Series excl.Total Primary Metals and MH Series
Motor Vehicles1964 I 100.0 100.0 100.0
II 101.9 101.6 100.8III 102.8 103.0 101.6IV 102.4 102.6 102.3
1965 I 103.5 104.1 103.1II 103.2 104.1 103.9
III 104.8 104.6 104.7IV 104.1 106.0 105.5
B-4
Even on a quarterly basis, the Q series show somewhat irregularmovements but the general upward trend is clearly revealed--through thethird quarter of 1965 for the total, and through the fourth quarter forthe total excluding primary metals and motor vehicles and parts. Theproductivity factors shown for the NH series indicate a steady quarterto quarter rise in this period and at the end of 1965 showed less in-crease over early 1964 than is indicated for the Q series excludingprimary metals and motor vehicles.
Output per manhour in primary metals was unchanged, on theaverage from 1964 to 1965. It increased in the first half of 1965,when steel production rose rapidly, changed little in the third quarter,and then declined sharply in the fourth quarter when steel output wassharply curtailed after the September wage contract settlement.
Implied output per manhour for motor vehicles and parts hasshown an unusual decline since the second quarter of 1964. For 1965as a whole it declined 1.3 per cent from 1964. This decline is probablystatistical only. In the September 1965 revision of the employmentdata, implied productivity for this industry for the years 1961-1964was raised appreciably; a similar revision in the 1965 data wouldchange the decline in productivity from 1964 to 1965 to a rise.
Reflecting in part a marked increase in steel productionfrom December to January the latest month for which there are fairlyreliable productivity data, output per manhour implied for the total Qseries increased sharply to a level above the third quarter averagewhile the productivity rise for the MH series was .25 per cent; asnoted earlier changes indicated in a single month are not necessarilysimilar for the MH and Q series or very significant.
Whether and by how much in the period ahead installation ofnew more efficient equipment at a rapid rate and various innovationsin production practices will more than offset factors operating toreduce productivity are questions yet to be resolved. Unfortunatelythere will be a time lag in answering these questions--good estimatesof changes in productivity in the Q series are two months late and theirregular nature of the month to month fluctuations does not help insignalling changes in trends. But the record of past developmentssuggests that except for periods of dramatic change in production levels,changes in the rate of productivity increase for any broad group ofindustries occur only gradually. And in thinking about the totalproduction index changes from month to month it is to be remembered thatthe current productivity allowances amount to only about 1/8 of one percent.
C- 1
APPENDIX C:ANNUAL FOREIGN TRADE BALANCES OF THE EUROPEAN ECONOMIC COMMUNITY*
In 1965 the six Common Market countries had a sharply improvedtrade balance with the world outside the trading bloc. On the balance-of-payments basis (exports and imports both f.o.b.) the Community had anincreased trade surplus estimated at $2.2 billion, compared with roughly$0.9 billion in 1964. As reported monthly, with insurance and freightincluded in the import valuations (c.i.f.), the balance was a deficit,but a much smaller one than in 1964. After narrowing sharply in the firsthalf of 1965, the trade deficit widened somewhat in the second half;nevertheless, for the year as a whole it was only $1.70 billion, comparedwith $2.66 billion in 1964.
EEC trade balance with the rest of the world
There have been two periods in the eight years since the CommonMarket Treaty went into effect at the beginning of 1958 when the exportsof the area as a whole to non-member countries have grown faster than itsimports from outside the area. The first such period was in 1958-59.The other began in 1964.
During 1958-59 the large trade deficits (imports valued c.i.f.)of earlier years--which hit a peak of over $3 billion in 1957--turned tosurplus as exports grew moderately while imports leveled out below theirearlier peak. Major improvement in the trade balances of France (follow-ing the franc devaluations of 1957 and 1958) and of Italy contributed tothis result. There followed two years of near balance in EEC trade accountsvis-a-vis the outside world. Then, in 1962 and 1963, growth in CommonMarket exports fell far short of the rise in imports--the latter mainlyreflecting booming economic expansion in all the courtries of the area--and in 1963 a deficit of over $3 billion with the outside world was re-corded. In 1964 and 1965, deficits diminished again--this time becauseexports rose especially strongly compared with imports.
From 1963 to 1964 total exports to non-EEC destinations rose 12per cent and from 1964 to 1965 they increased 11 per cent further. On theother hand, total imports from non-members increased by 9 per cent in 1964from 1963 and by an additional 6 per cent in 1965.
* Prepared by Carl H. Stem, Economist, Europe and British CommonwealthSection, Division of International Finance.
NOTE: Tables are at the end of the appendix.
C- 2
Trade balances of individual members with non-members
The European Community's declining trade deficit with non-members
over the past two years has been due mainly to the shrinking Italian
deficit vis-a-vis non-EEC countries. However, from 1964 to 1965 the French
deficit with non-members also diminished.
In 1965 Italian exports to destinations outside the EEC were8 per cent above 1964 levels. Although 1965 was a year of recovery fromrecession in Italy, domestic demand continued at a reduced level, and ro-
bust foreign demand drew an increased volume of sales into the exportsector. Italian imports from third countries, on the other hand, fellfrom 1963 to 1964; in 1965 imports for the year were unchanged from 1964although they were increasing sharply during the course of the year. TheItalian trade deficit with the non-EEC world dropped from $1.8 billion in1963 and $1.2 billion in 1964 to $860 million in 1965. (However, becauseof sharply increased shipments to EEC partners, the overall Italian tradebalance was practically in balance for the year, in contrast with deficitsof $2.55 billion in 1963 and $1.27 billion in 1964.)
The improvement in the French deficit vis-a-vis non-EEC countriesfrom 1964 to 1965, like that for Italy, reflected the absence of any netincrease in French imports from non-members On the other hand, the rise
in French exports to the non-EEC world was 8 per cent, the same as forItaly but lower than for the other member countries.
Exports and imports by major external areas
Among the Common Market's major marketing areas, the sharpincrease in exports to North America was the most prominent feature in1965, compared with 1964 when exports to all external trading areas grewpretty much in line with each other. Heavy consumer and investment demandin the United States resulted in a 19 per cent increase in shipments tothe United States from the six countries of the EEC, a considerable jumpfrom the 11 per cent increase in 1964. EEC shipments to industrial Asiaand the developing parts of the world were also up sharply--almost 15 percent. On the other hand, exports to EPTA destinations grew more slowlythan in 1964, probably reflecting to some extent the impact of the importsurcharge in the United Kingdom.
In contrast, EEC purchases from the United States increasedonly 3 per cent in 1965, down from 8 per cent in 1964 and less thanincreases in purchases from other major trading areas.
C - 3
Intra-EEC trade
Since 1958 intra-Market trade has grown at an average annualrate of 15 per cent, which is much more than the 8 per cent average risein both exports to and imports from non-members. The 12 per cent growthin internal Common Market trade from 1964 to 1965, however, was the low-est annual increase since the beginning of the Community.
Italy's exports to EEC partners have registered the sharpestgains in both of the past two years. They increased 27 per cent between1963 and 1964 and a further 39 per cent between 1964 and 1965. SinceItalian imports from the area in 1965 totalled about the same as they hadin 1963, the Italian trade balance vis-a-vis the EEC countries improvedfrom a $720 million deficit in 1963 to a $670 million surplus in 1965.
French intra-EEC sales have also shown a pattern of vigorousgrowth during the past two years. Between 1963 and 1964 they increased13 per cent and between 1964 and 1965, 18 per cent.
On the other hand, in Germany booming economic expansion hasincreased import demand sharply. Its 1964 imports from EEC partners were18 per cent above 1963, and in 1965 its intra-EEC purchases skyrocketed 31per cent above the previous year, Since sales to EEC destinations gainedmore moderately during the same period, the German intra-EEC trade balanceturned from a surplus of $1.1 billion in 1963 to a deficit of $360 millionin 1965. This was the major factor responsible for the sharp decline inthe overall German trade surplus from $1.6 billion in 1963 to $310 millionin 1965.
Trade balance with imports valued f.o.b.
In 1964 the over-all trade balances of the EEC countries as
given in their balance of payments accounts showed a combined surplus of
about $0.9 billion. Imports in these accounts are valued exclusive of
insurance and freight charges, and there are various differences in
statistical coverage between the data used in the balance of payments andthe trade data reported monthly. The insurance and freight charges
appear to have averaged, for the Community as a whole, about 8 per centof the value of imports c.i.f. as reported in the monthly trade data(i.e., with insurance and freight charges included).
For 1965 balance of payments statements are not yet available.However, other things being equal, the improvement in the trade account
of the combined EEC balance of payments from 1964 to 1965 should be
C - 4
greater by about $0.4 billion than the improvement in the monthly reportedtrade data, imports c.i.f. (This estimate is based on applying an 8 percent insurance-and-freight ratio to the increase of about $5 billion intotal EEC imports.) Since the monthly trade data show an improvement of$0.96 billion in the trade balance from 1964 to 1965, the improvement inthe balance of payments trade account may be estimated at $1.36 billion.This would indicate that in 1965 the combined trade account of the EECcountries as given in their balance of payments account should show a sur-plus of about $2.2 billion.
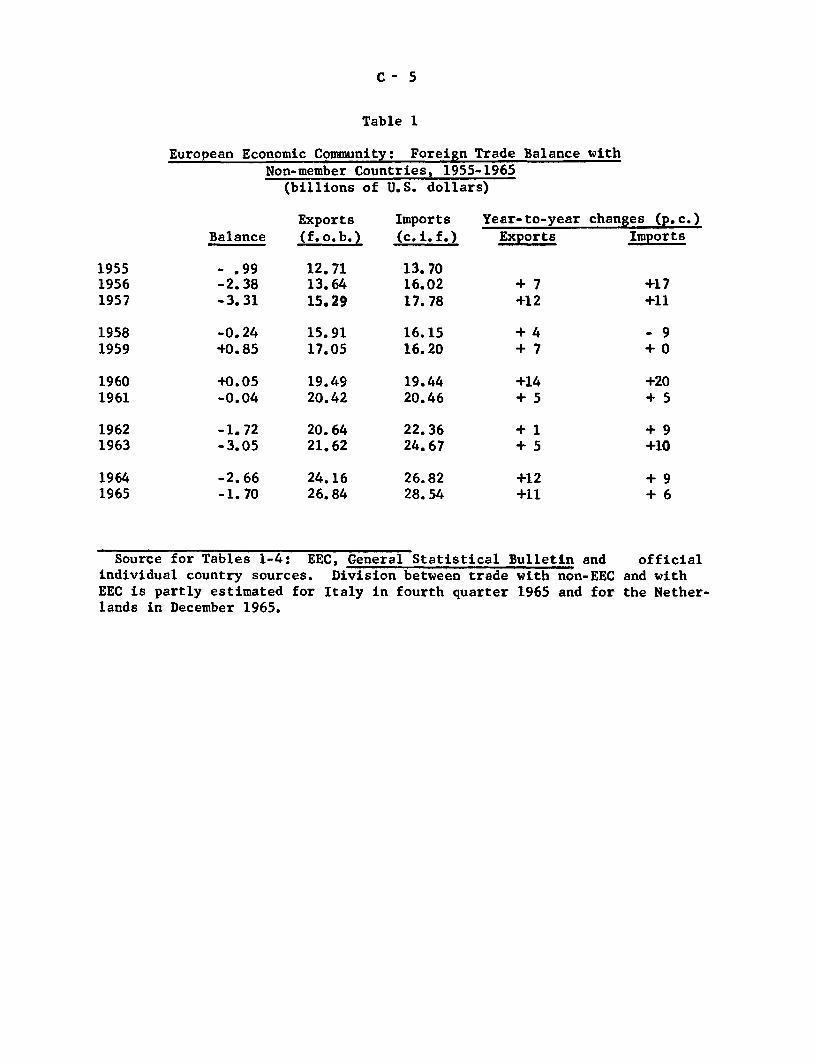
C- 5
Table 1
European Economic Community: Foreign Trade Balance withNon-member Countries, 1955-1965
(billions of U.S. dollars)
ExportsBalance (f.o.b.)
- .99-2.38-3.31
-0.24+0.85
+0.05-0.04
-1.72-3.05
-2.66-1.70
12.7113.6415.29
15.9117.05
19.4920.42
20.6421.62
24.1626.84
Imports(c.i.f.)
13.7016.0217.78
16.1516.20
19.4420.46
22.3624.67
26.8228.54
Year-to-year
Exports
+7+12
+4+7
+14+5
+ 1+5
+12+11
changes (p.c.)Imports
+17+11
- 9+0
+20+5
+9+10
+9+6
Source for Tables 1-4: EEC, General Statistical Bulletin andindividual country sources. Division between trade with non-EECEEC is partly estimated for Italy in fourth quarter 1965 and forlands in December 1965.
officialand withthe Nether-
195519561957
19581959
19601961
19621963
19641965
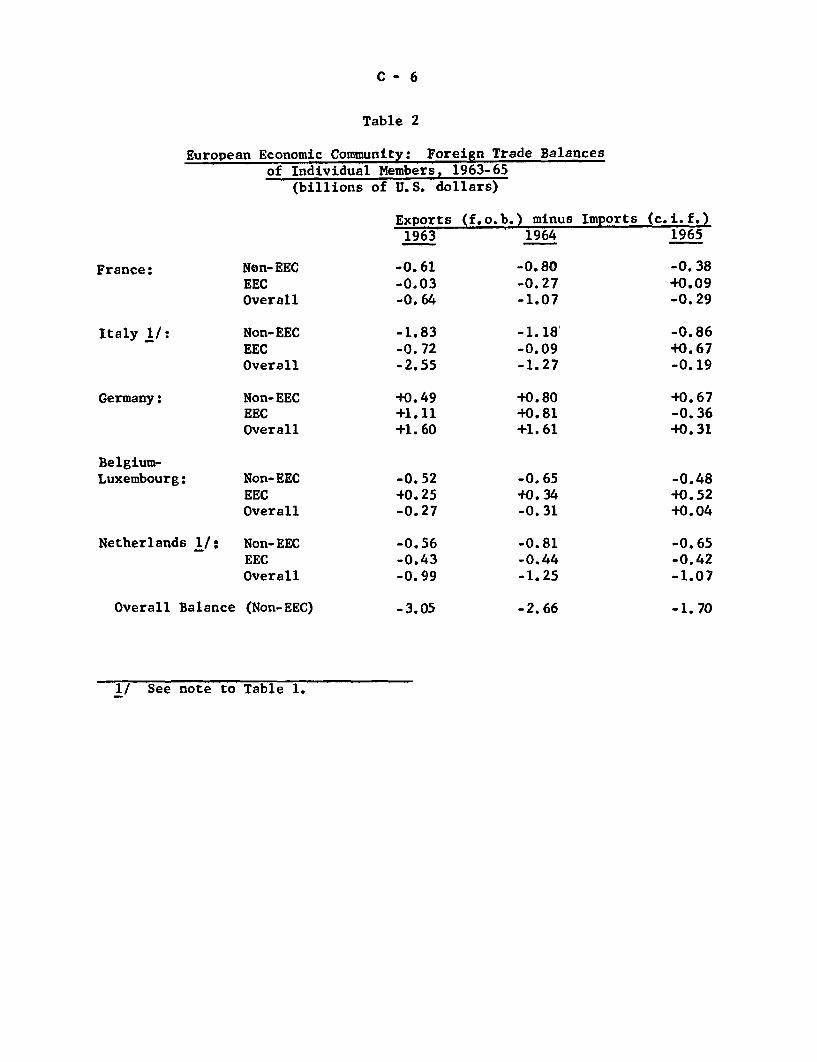
C - 6
Table 2
European Economic Community: Foreign Trade Balances
of Individual Members, 1963-65(billions of U.S. dollars)
(f.o.b.) minus1964
Imports (c.i.f.)1965
France:
Italy 1/:
Germany:
Non-EECEECOverall
Non-EECEECOverall
Non-EECEECOverall
Belgium-Luxembourg: Non-EEC
EECOverall
Netherlands 1/: Non-EECEECOverall
Overall Balance (Non-EEC)
1/ See note to Table 1.
Exports1963
-0.61-0.03-0.64
-1.83-0.72-2.55
+0.49+1.11+1.60
-0.52+0.25-0.27
-0.56-0.43-0.99
-3.05
-0.80-0.27-1.07
-1.18'-0.09-1.27
+0.80+0.81+1.61
-0.65+0.34-0.31
-0.81-0.44-1.25
-2.66
-0.38+0.09-0.29
-0.86+0.67-0.19
+0.67-0.36+0.31
-0.48+0.52+0.04
-0.65-0.42-1.07
-1.70
*
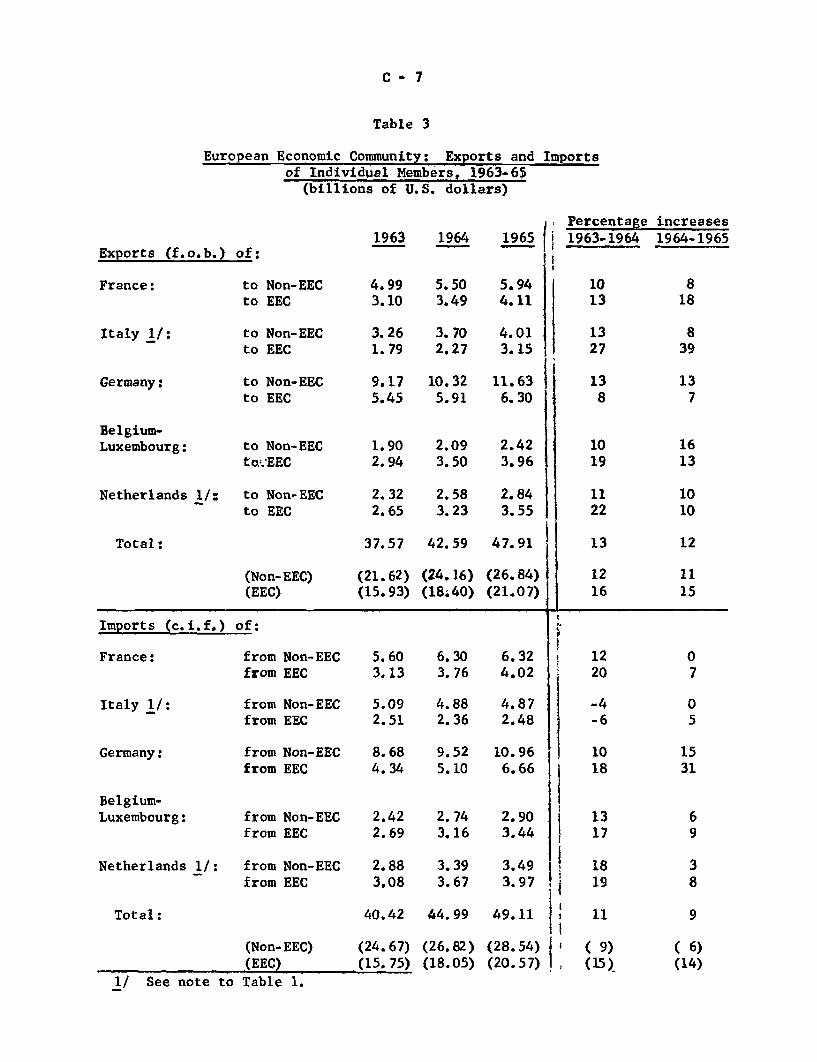
C - 7
Table 3
European Economic Community: Exports and Importsof Individual Members, 1963-65
(billions of U.S. dollars)
Exports (f.o.b.) of:
France:
Italy 1/:
Germany:
Belgium-Luxembourg:
Netherlands 1/:
Total:
to Non-EECto EEC
to Non-EECto EEC
to Non-EECto EEC
to Non-EECto.EEC
to Non-EECto EEC
(Non-EEC)(EEC)
1963 1964 1965
4.99 5.50 5.943.10 3.49 4.11
3.26 3.70 4.011.79 2.27 3.15
9.17 10.32 11.635.45 5.91 6.30
1.902.94
2.09 2.423.50 3.96
2.32 2.58 2.842.65 3.23 3.55
37.57 42.59 47.91
(21.62) (24.16) (26.84)(15.93) (18.40) (21.07)
Imports (c.i.f.) of:
France:
Italy 1/:
Germany:
Belgium-Luxembourg:
Netherlands 1/:
from Non-EECfrom EEC
from Non-EECfrom EEC
from Non-EECfrom EEC
from Non-EECfrom EEC
from Non-EECfrom EEC
Total:
(Non-EEC)(EEC)
1/ See note to Table 1.
5.60 6.30 6.323.13 3.76 4.02
5.09 4.88 4.872.51 2.36 2.48
8.68 9.52 10.964.34 5.10 6.66
2.42 2.74 2.902.69 3.16 3.44
2.88 3.39 3.493.08 3.67 3.97
40.42 44.99 49.11
(24.67)(15.75)
(26.82)(18.05)
(28.54)(20.57)
Percentage increases1963-1964 1964-1965
1122
13
1216
( 9)(15)
( 6)(14)
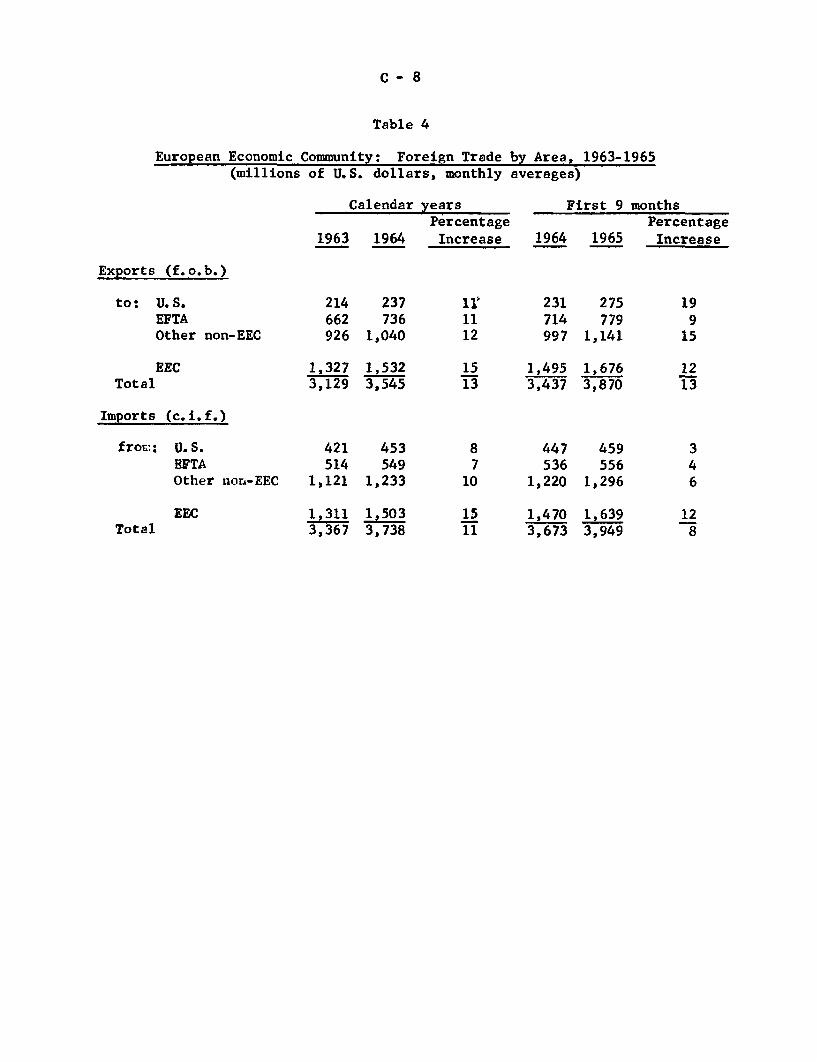
C- 8
Table 4
European Economic Community: Foreign Trade by Area, 1963-1965(millions of U.S. dollars, monthly averages)
Calendar yearsPercentage
1963 1964 Increase
First 9 monthsPercentage
1964 1965 Increase
Exports (f.o.b.)
to: U.S.EFTAOther non-EEC
EECTotal
214 237662 736926 1,040
1,327 1,5323,129 3,545
231714997
275779
1,141
1,495 1,6763,437 3,870
Imports (c.i.f.)
from:: U.S.BFTAOther non-EEC
EECTotal
421514
1,121
453549
1,233
1,311 1,5033,367 3,738
447536
1,220
1,4703,673
459556
1,296
1,6393,949