Embed Size (px)
Citation preview

Prefatory Note The attached document represents the most complete and accurate version available based on original copies culled from the files of the FOMC Secretariat at the Board of Governors of the Federal Reserve System. This electronic document was created through a comprehensive digitization process which included identifying the best-preserved paper copies, scanning those copies,1
and then making the scanned versions text-searchable.2
Though a stringent quality assurance process was employed, some imperfections may remain. Please note that some material may have been redacted from this document if that material was received on a confidential basis. Redacted material is indicated by occasional gaps in the text or by gray boxes around non-text content. All redacted passages are exempt from disclosure under applicable provisions of the Freedom of Information Act. 1 In some cases, original copies needed to be photocopied before being scanned into electronic format. All scanned images were deskewed (to remove the effects of printer- and scanner-introduced tilting) and lightly cleaned (to remove dark spots caused by staple holes, hole punches, and other blemishes caused after initial printing). 2 A two-step process was used. An advanced optical character recognition computer program (OCR) first created electronic text from the document image. Where the OCR results were inconclusive, staff checked and corrected the text as necessary. Please note that the numbers and text in charts and tables were not reliably recognized by the OCR process and were not checked or corrected by staff.
Content last modified 6/05/2009.
CONFIDENTIAL (FR)
CURRENT ECONOMICand
FINANCIAL CONDITIONS
Prepared for the
Federal Open Market Committee
By the Staff
BOARD OF GOVERNORS
OF THE FEDERAL RESERVE SYSTEM June 9. 1965

CONFIDENTIAL (FR)
CURRENT ECONOMIC AND FINANCIAL CONDITIONS
By the StaffBoard of Governors June 9, 1965
of the Federal Reserve System
I -
IN BROAD REVIEU
Recently available information is consistent with earlier
evidence of a slowdown in the pace of economic expansion. A period of
testing is apparently under way in many key areas. The sizable decline
in stock market prices since mid-May is both a reflection of -- and an
influence contributing to -- increased uncertainties about prospects.
The decline in the money supply in May, the moderation of loan
demands in both April and Iay, the congested condition and higher yields
in corporate and municipal bond markets are all making for less certainty with
respect both to the business and financial outlook. Declining Treasury
bill rates along with little change in other money markets rates are also
adding to uncertainty.
On business demands, the latest official survey essentially
confirms the increase in fixed capital spending this year shown by the
official survey of three months earlier, rather than supporting the
higher increase reported in the interim by McGraw-Hill, Inventory
accumulation continues in large volume. The continued buildup in steel
stocks through May has operated to maintain overall activity, but is
generally interpreted as aggravating the subsequent adjustment problem.
Retail sales apparently rose in May, but recent expansive strength has
been mainly confined to nondurable goods; auto sales in May remained at
the lower April level.
The labor market, although generally stronger with i!ay un-
employment down to 4.6 per cent, has experienced a tapering of the rate
of growth in employment and, unexpectedly, in the labor force. Wage

I - 2
settlements recently appear to be pressing more firmly against the
upper end of the range this year. Industrial commodity prices have risen
a little further but the rise has remained selective. Expectations of
rising prices do not appear to be a significant influence on forward
buying and inventory building. But there have been marked price advances
recently for livestock, meats, and fresh fruits and vegetables. Meat
prices, because of reduced supplies -- particularly of pork, are likely
to remain strong for some time.
A further though small U.S. payments surplus is indicated for
May by partial data. Outstanding bank credit to foreigners declined by
about $150 million in April. Most of the improvement in the payments
balance in larch and April resulted from a smaller net outflow of bank
credit and from inflows of U.S. liquid funds from abroad.
The turn in the U.S. balance of payments around the beginning
of March was partly matched by reduction of Continental European and
Japanese payments surpluses. France, however, continued to have large
surpluses in March and April.
Renewed weakness in foreign exchange markets for sterling
appeared toward the end of May. On June 3, when the British Bank rate
was reduced from 7 per cent to 6 per cent, requirements for minimum
downpayments on instalment credit were increased.

June 8, 1965.
I -- T - 1
SELECTED DOMESTIC NONFINANCIAL DATA
(Seasonally adjusted)
LatestPeriod
Civilian labor force (mil.)Unemployment (mil.)Unemployment (per cent)
Nonfarm employment, payroll (mil.)ManufacturingOther industrialNondustrial
Industrial production (57-59=100)Final productsMaterials
Wholesale prices (57-59=100)1/Industrial commoditiesSensitive materials
Farm products and foods
Consumer prices (57-59=100)1/Commodities except foodFoodServices
Hourly earnings, mfg. ($)Weekly earnings, mfg. ($)
Personal income ($ bil.)2/
Retail sales, total ($ bil.)Autos (million units)2/GAF ($ bil.)
Selected leading indicatorsHousing starts, pvt. (thous.)2/Factory workweek (hours)New orders, dur. goods ($ bil.)New orders, nonel. mach. ($ bil.)Common stock prices (1941-43=10)1/
Inventories, book val. ($ bil.)
Gross national product ($ bil.)2/Real GNP ($ bil. 1964 prices)2/
May '65II
11
Apr. '65It
ifIt
11I!
I""
LatestPeriod
75.43.54.6
59.917,97. 9
34.2
140. 8139.9141.8
101.7101.7101.6100.2
109.3105.0107.3117.3
AmountPrecedtPeriod
75.43.74.9
60.017.98.0
34.1
140.5139. 7141.2
101.13101.6101.4
99.0
109.0104.8106. 9117.0
YearAgo74.5
3.85.2
57.817.27.7
32.9
130.5130.6130.6
100.3100.8
99.397.8
107.8104.3105.7114.8
Per cent chang(Year 2 Yrs.Ago* Ago*
1.3 3.4-8.7 -18.7
3.63.92.53.8
6.35.34.97.2
7.9 14.87.1 14.08.6 15.6
2.01.55.32.7
2.91.82.94.3
" 2.59 2.60 2.52 2.8 6.1" 105.67 107.55 102.57 3.0 8.4
" 514.5 513.8 486.6 5.7 12.4
I
May '65Apr. '65
I11
11
11
May '65
22.98.15.2
1,54840.822. 13.1
89.28
Apr. '65 112.0
22.88.25.2
1,54641.421.73.1
87.97
21.47.84.9
1,53140.720.52.9
80.72
7.1 12.94.0 12.46.0 17.2
1. 10.28.06.9
10.6
-7.71.7
16.121.727.3
111.3 106.4 5.3 10.5
Ql-65 648.8 634.6 608.8 6.6 13.5S 641.5 630.6 612.9 4.7 9.3
*Based on unrounded data. 1/ Not seasonally adjusted. 2/ Annual rates.

June 8, 1965.
SELECTED DOMESTIC FINANCIAL DATA
Money Market/ (N.S.A.)Federal funds rate (per cent)
U.S. Treas. bills, 3-mo. yield (per cent)Net free reserves 2/ (mil. $)Member bank borrowings 2/ (mil. $)
Security Markets (N.S.A.)Market yields 1/ (per cent)
5-year U.S. Treas. bonds20-year U.S. Treas. bondsCorporate new bond issues, AaaCorporate seasoned bonds, AaaMunicipal seasoned bonds, AaaFHA home mortgages, 30-year3/
Common stocks S&P composit index 4/Prices, closing (1941-43=10)Dividend yield (per cent)
Banking (S.A., mil. $)Total reserves
Bank loans and investments:TotalBusiness loansOther loansU.S. Government securitiesOther securities
Money and liquid assets:Demand dep. & currency 6/Time and savings dep. 6/Nonbank liquid assets
Week ended Four-Week Last six monthsJune 4 Average High Low
4.093.85-153
518
4.154.22
--
4.453.095.45
87.113.00
Changein
May
-46
5/1,800
9001,300-600200
-1,1001,100
7/ 2,500
4.073.88-161500
4.154.224.524.443.095.45
88.602.95
Averagechange--last 3 mos.
107
2,300900
1,500-600
200
1001,2001,800
4.123.94
256572
4.184.224.554.453.095.45
2.003.76-198
122
4.044.154.334.412.945.45
90.10 83.663.05 2.89
Annual rate ofchange (,)
3 mos. 1 year
5.9
10.318.416.6
-11.313.0
0.811.08.9
10.117.612.1-3.015.0
3.214.56.1
N.S.A.--not seasonally adjusted. S.A.--seasonally adjusted.Average of daily figures. 2/ Averages for statement week ending June 2.Latest figure indicated is for month of April. 4/ Data are for weekly closingprices. 5/ Changes based on data revised in accordance with the December 31Call; may be subject to further revision. 6/ Based on preliminary reviseddata; not for publication. 7/ Change in April.
I -- T - 2

I - T-3
U.S. BALANCE OF PAYMENTS
1965 1964 1964
Apr. Mar. Feb. QI QIV QIII QII Year
Seasonally adjusted annual rates, in billions of dollars
Balance on regular transactions - 3.1 - 6.0 - 2.4 - 2.2 - 3.1
Current account balance
Trade balance 1/Exports 1/Imports 1/
Services, etc., net
Capital account balance
Govt. grants & capital 2/U.S. private direct inv.U.S. priv. long-term portfolioU.S. priv. short-termForeign nonliquid
7.5 7.6 6.6 7.4
10.432.6
-21.8 -22.2
- 0.318.7
-19.0
3.922.6
-18.7
7.126.7
-19.6
6.625.5
-18.9
0.4 1.0 0.8 0.8
-11,8 - 9.0 - 8.7 - 9.5
(- 2.2)(- 3.0)( 1.0)
4.02.63.32.20.5
3.72.42.41.60.8
Errors and omissions - 1.7 - 0.7 - 0.3 - 0.9
Monthly averages, in millions of dollars
Deficit on regular transactions(seas. adjusted)
Additional seasonal element231162
502 202 182- 6 - 135 - 14
Financing (unadjusted)Special receipts 3/Liabilities increaseNonofficial 4/Official 5/
Monetary reserves decreaseof which: Gold sales
- 143 - 5280 0
- 49- 332
238(159)
- 330- 363
165(354)
4800
22154348
(215)
6919
56- 287
281(277)
50851
337 1961 - 10
207 184299 129
- 50 23
36 12669 86
101 14(57)(- 7)(- 24) (10
EMemo: Official financing] j(- 94)(- 198) (502) ( 13) (300) (153) (159)
1/ Balance of payments basis which differs a little from Census basis.2/ Net of associated liabilities and of scheduled loan repayments.3/ Advance repayments on U.S. Govt. loans and advance payments for military exports:assumed zero in absence of information.4/ Includes international institutions (except IMF), commercial banks and privatenonbank.
5/ Includes nonmarketable bonds.6/ Decrease in monetary reserves, increase in liabilities to foreign officialinstitutions, and special receipts.
5.824.2
-18.4
6.625.2
-18.6
3.72.21.02.20.5
3.72.32.02.10.5
(128

II - 1
THE DOMESTIC ECONOMY
Industrial production. Available May production data indicate
a continued high rate of output but data are too scant to determine whether
the index was maintained or advanced further. A final estimate for April
and a preliminary estimate of the May production indexes will probably be
available late this Friday or early Monday.
Auto assemblies were at a seasonally adjusted annual rate of
9.5 million units in May compared with 9.4 million in April. June pro-
duction schedules are set at the May rate. Output of trucks increased
further in May to a record high and production of television sets was
maintained at the April level.
In the three weeks following the interim steel agreement,
steel ingot output declined 5 per cent; then in the next three weeks,
ending June 5, rose 3 per cent. For May as a whole seasonally adjusted
ingot production was down slightly. Among other materials, paperboard
production rose to a new record and output of bituminous coal increased
sharply, while output of crude petroleum and activity at refineries declined.
Consumer spending. Data for April and May suggest a moderate
further increase in consumer expenditures in the second quarter. A
rough estimate is $3-1/2 - $4 billion, annual rate, for goods and serv-
ices, compared to the exceptional $11.5 billion reported for the first
quarter. The difference is largely attributable to expenditures for
automobiles, for which a decline in the vicinity of $2.5 billion is
indicated in contrast to an increase of about $5.5 billion in the first

II- 2
quarter. Purchases of nondurable goods are showing another substantial
increase although the month-to-month changes are, as usual, irregular.
Altogether, the prospective increase in consumer purchases of goods is
small while outlays for services are continuing their steady advance.
Revised retail sales data now show a slight increase from
March to April rather than the slight decline reported earlier. In
particular, April sales of nondurable goods stores were raised to about
the February high. Weekly data for Hay indicate a significant further
rise in total sales to a level close to, and perhaps exceeding, the
February peak, despite the sharp reduction in auto sales since February.
Sales of nondurable goods apparently rose sharply in May to a new high,
with strength widespread among types of stores.
Automobiles. Unit sales of new domestic automobiles in May
were at a seasonally adjusted annual rate of 8.1 million cars. This
compared with 8.2 million in April and an average of 9.3 million in the
first quarter. A Chevrolet dealers' contest increased sales early in
May, but in the last 10-day period sales declined so that for the month
sales were only 4 per cent above a year ago. In the current model year
the average sales rate has been 8.3 million units. Dealer inventories of
new cars at the end of May were 5 per cent larger than a month earlier
and represented 42 days' supply, about average for this time of year.
Consumer credit. Consumers borrowed more heavily than usual
to pay tax bills in April. Part of their borrowing took the form of
personal instalment loans from banks, credit unions, and other lenders,
and part of it was reflected in a sizable increase in single payment loans.

II - 3
Consumers also borrowed somewhat more than they usually do in
April to buy cars. The proportion of new cars bought on credit increased
somewhat and this, together with higher used car sales, tended to offset
the effect on total auto credit of a declining volume of new car sales.
Nonauto consumer goods credit also rose in April, but in less striking
fashion. Repair and modernization credit actually declined slightly.
The net effect of these changes was a record seasonally ad-
justed rise of $744 million in total instalment credit--and annual rate
of $8.9 billion. During the first four months of 1965, instalment credit
expanded at an annual rate of $8.1 billion, compared with $5.8 billiop
a year earlier. The April increase was a record in dollar amount only.
In percentage terms, the increase ranked below several months in 1955
and 1959.
Noninstalment credit turned down in April, following sharp
increases in the first three months. The reversal came about largely
because of declining charge account activity which some observers
linked to the pressure of tax payments. Charge accounts had been very
active in the first quarter, approaching the high rates in the period
immediately following the tax cut in 1964.
Delinquency rates on instalment loans at commercial banks
dipped in April, according to the ABA series, following a period of
gradual rise from last summer. The ratio of repayments to disposable
income had increased to 14.3 per cent in the first quarter from 14.0
per cent in the final quarter of 1964. Lenders' standards, as reflected
in down payments and contract maturities, have continued easier than a
year or two ago, but there is little evidence of increased difficulty
in collections.

II - 4
Consumer buying plans. Changes in consumer spending in
recent quarters are mostly attributable to the special circumstances
affecting supplies of new autos. Underlying demands have been much
steadier than the aggregate spending data themselves suggest.
Consumer demands for durable goods are still strong, accord-
ing to the Census quarterly survey of consumer buying intentions con-
ducted in April. Plans to buy a new car within 12 months were re-
ported by 9.3 per cent of households in April -- the same high level
as in January and moderately above the 8.9 per cent of the April 1964
survey. Reported intentions to buy used autos and houses were little
changed from January and also from April 1964.
For household durable goods, 17.4 per cent of households re-
ported intentions to buy within six months one or more of 7 major
items, as compared with 16.3 per cent in January and 17.1 per cent in
April 1964. The increase in demands for household durable goods were
concentrated in the first half of the six-month planning period; in
fact, stated intentions to buy in the second 3 months were lower than
in January and in April 1964.
Business inventories. Such data as are available suggest
that inventory accumulation in the second quarter is likely to remain
at a high rate. These data include book value figures for April, the
results of the Commerce May survey of manufacturers' inventory antici-
pations, and the maintenance through May of advanced levels of steel
and auto output.

II - 5
Book value. In April book value of nonfarm business inven-
tories increased by $680 million, moderately below the average monthly
increase of $760 million reported for the first quarter.
BUSINESS INVENTORIESBook value changes, seasonally adjusted
in millions of dollars
Average per monthQ4. 1964 Ql, 1965 1965
Total 568 763 680
Manufacturing 642 255 253Durable 458 187 226Nondurable 183 68 27
Retail -154 308 381Durable -216 286 233Nondurable 62 22 148
Wholesale 80 201 46Durable 69 117 15Nondurable 11 84 32
Retail stocks showed the largest advance in April with
increases widespread among durable and nondurable goods lines. The
rise in the automotive group amounted to $172 million.
In manufacturing, the increase of about $250 million was the
same as the first quarter average and was also in line with manufac-
turers' anticipations for the second quarter as a whole, as reported
in the Commerce survey conducted in May. Nearly all of the April rise
at manufacturers was in durable goods industries, with most major
groups showing increases. The major exception was the iron and steel
producing industry where stocks showed a sizable decline as shipments
spurted. Steel stocks held by consuming manufacturing industries

II - 6
again rose sharply, apparently accounting for the very sharp increase
reported in stocks of materials and supplies held by durable goods
industries. According to data from the Census survey, not adjusted
for seasonal variation, holdings of finished steel shapes by these
consumers increased 1.3 million short tons, compared with a rise of
1.2 million tons in March.
The stock-sales ratios of durable goods producers increased
in April but remained low. The rise reflected a 2 per cent decline in
shipments, because of a drop of 9 per cent in motor vehicles and parts,
as well as the overall rise in stocks. The stock-sales ratio of non-
durable goods manufacturers was unchanged from its very low March
level.
Inventory anticipations. Manufacturers, on the basis of
a Commerce survey conducted in May, expect their inventories to rise
by about three-quarters of a billion dollars in both the second and
the third quarters, seasonally adjusted. Durable goods manufacturers
account for about two-thirds of the expected rise. At annual rates
the anticipated total accumulation amounts to $3 billion, the same
as the actual rise in the first quarter. They are also consistent
with the April rate of accumulation.
Manufacturers'sales anticipations were more sanguine in May
than reported in the February survey. Thus, durable goods manufacturers
expected sales to be off only 1 per cent in the second quarter instead
of the 3 per cent indicated earlier and then sales are expected to
show a rise of 1 per cent in the third quarter. These anticipated
changes are small in relation to the exceptional rise of 6 per cent

II - 7
realized in the first quarter because of the special developments in
steel and autos. Nondurable goods manufacturers in May anticipated a
rise of 2 per cent in the second quarter, compared to 1 per cent
expected earlier, and they look for a further rise of 2 per cent in
the third quarter. These anticipated increases are about in line
with actual increases over the last year. It is below the 15 per cent
increase indicated by the McGraw-Hill survey taken in late Mlarch and April.
The difference is presumably due to the smaller McGraw-Hill sample which
includes only the larger companies in each industry and has a more limited
coverage of the "commercial and other" group.
The latest survey indicates that capital outlays will rise more
rapidly in the second half of the year than in the first. As is shown
in the table, however, the quarterly increases in prospect this year
are considerably smaller than last year. Outlays in the fourth quarter
of 1965 are indicated to be 9 per cent above a year earlier; spending in
the fourth quarter of 1964 was 16 per cent above a year earlier.
NEW PLANT AND EQUIPMENT EXPENDITUPES
Quarter-to-quatter increases1965 1964
.Dollars - Per cent Dollars-/ Per cent
1st quarter 1.25 2.6 1.35 3.32nd quarter .60* 1,2 .95 2.23rd quarter 1.20* 2.4 2.15 4.94th quarter 1.30* 2.6 2.10 4.6
* Planned.1/ In billions of dollars, seasonally adjusted annual rates.
Increases in expenditures for new plant and equipment this year
are planned by all major industry groups, as shown in the following
table.

II - 8
All industries
1ManufacturingDurable goodsNondurable goods
IiningRailroadsTransportation,
nonrailPublic utilitiesCommunications,
commercial & othe
EXPENDITURES FOR NEU PLANT AND EQUIPIENT
Planned for 1965
lla Per cent increase Per
amount 1965 4th Qtr. 1965 1964amount(billions) from from from
1964 4th Qtr. 1964 1963
50.4 12.2 9.1 14.5
21.8 17.2 11.9 18.410.9 15.5 12.3 20.110.9 18.9 11.0 16.8
1.3 10.9 6.2 14.41.6 15.6 17.4 28.2
2.6 10.9 6.2 24.06.7 7.2 5.2 10.1
!r 16.4 8.1 6.9 9.5
Actual 1964cent indrease
4th Qtr. 1964from
4th Qtr. 1963
15.9
22.522.322.7
23.314.3
23.89.5
9.0
Construction activity. The construction industry continued to be
a relatively neutral factor in the economy in flay. Seasonally adjusted
new construction outlays changed little at a level just below the record
set in March. Expenditures for residential construction remained at
about the improved ilarch rate and were only moderately below the peak
for this series, reached in early 1964. Business and other private non-
residential construction eased slightly in May from the record April figure
but were considerably higher than a year earlier. Public construction
expenditures continued unchanged at a level somewhat below earlier highs.
I I m
I
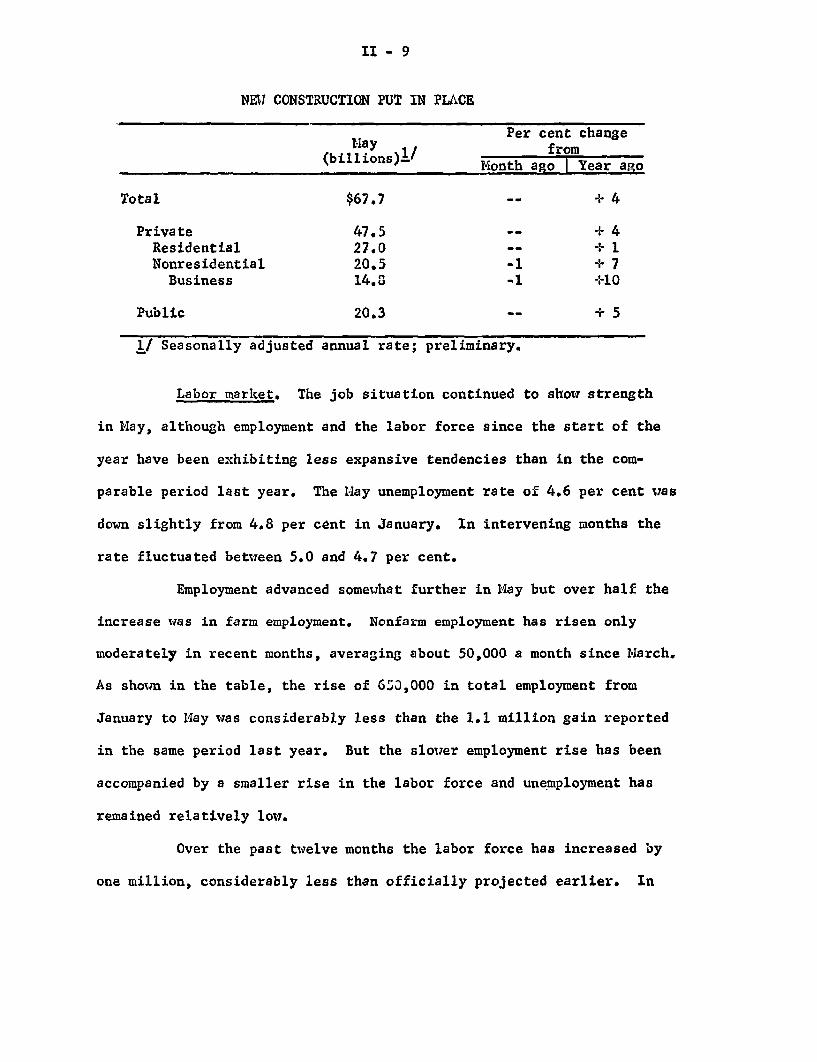
II - 9
NEW CONSTRUCTION PUT IN PLACE
lay Per cent changeHay from ,
(billions) 1/ f(bllns onth ago I Year ago
Total $67.7 - + 4
Private 47.5 - + 4Residential 27.0 - + 1Nonresidential 20.5 -1 + 7
Business 14.3 -1 +10
Public 20.3 -- + 5
1/ Seasonally adjusted annual rate; preliminary.
Labor market. The job situation continued to show strength
in May, although employment and the labor force since the start of the
year have been exhibiting less expansive tendencies than in the com-
parable period last year. The May unemployment rate of 4.6 per cent was
down slightly from 4.8 per cent in January. In intervening months the
rate fluctuated between 5.0 and 4.7 per cent.
Employment advanced somewhat further in May but over half the
increase was in farm employment. Nonfarm employment has risen only
moderately in recent months, averaging about 50,000 a month since March.
As shown in the table, the rise of 650,000 in total employment from
January to May was considerably less than the 1.1 million gain reported
in the same period last year. But the slower employment rise has been
accompanied by a smaller rise in the labor force and unemployment has
remained relatively low.
Over the past twelve months the labor force has increased by
one million, considerably less than officially projected earlier. In

II - 10
LABOR FORCE CHANGES(Seasonally adjusted, thousands of persons)
January to May 1965 January to Hay 1964Labor Employ- Unem- Labor Employ- Unem-force ment ployment force ment ployment
Total, all ages 529 653 -124 823 1,071 -248
14 to 19 years 521 491 30 239 173 66Males 20 yrs. & over 122 234 -112 220 450 -238Females 20 yrs. & over -144 - 72 - 42 364 440 - 76
the twelve months ending May 1964 the labor force had increased by over
1.5 million. Only among youths have employment and labor forces gains
this year been greater than earlier. The number of adult women in the
labor force has declined since the start of the year and in NI-ay was only
200,000 larger than a year earlier. This compares with a rise of 800,000
over the preceding year. The sharp curtailment of women entrants into
the labor force in part may be explained by the growing number of youths
who are competing for the part-time or other jobs that earlier had been
readily available for women. However, the combined labor force increase
of adult women and youths is still well below the inflow reported in 1964
and this may reflect lessening of growth in job opportunities and some
resultant withdrawal from the labor force of some marginal women workers.
On the other hand, strength of labor demand is seen in the
recent sharp decline in unemployment among the long-term unemployed
(15 weeks or more); their number was down to 700,000 in May, almost 300,000
less than a year ago. Unemployment in May was lower for adult men and
women, and for married men unemployment remained at the relatively low
rate of 2.5 per cent.

II - 11
The jobless rate in May among teenagers continued in the
vicinity of 15 per cent, as a rise in employment was about offset by an
equivalent rise in the labor force. Both teenage employment and labor
force have increased by 400,000 in the past year with little change in
unemployment. By midsummer about 600,000-700,000 more youths are
expected to be in the labor force than were in the labor force in mid-1964.
Prices. Over the past nine weeks, the wholesale commodity
price index has increased about 1 per cent to 102.4 per cent of
the 1957-59 average, a new high. Most of the increase reflects a rise
of nearly 4 per cent in prices of foodstuffs brought about mainly
by reduction in market supplies of fresh foods. The index for industrial
commodities has edged up .2 per cent from its February-March level, and
the end-of-May estimate is 1 per cent above the level around which the
index fluctuated in the first nine months of last year.
The sharp rise in foodstuffs, to a point 6-1/2 per cent
higher than a year ago, reflects delays in harvesting vegetables because
of unfavorable weather and, more importantly, reduced marketings of live-
stock in response to low prices last year. Since mid-March prices of
livestock have risen a fifth and those for meats more than a tenth.
Government surveys of farmers' production plans indicate that reduced
output and higher prices for livestock will continue for some months
to come. The last comparable shift in the livestock situation occurred
in 1957, and livestock prices rose about a third to a peak in the spring
of 1958. The total wholesale and consumer price indexes rose appreciably

II - 12
in late 1957 and early 1958, provoking a certain amount of comment about
"inflation in the midst of recession."
Industrial commodity price developments of recent weeks appear
similar to those of last year, with rising prices for nonferrous metals
and semifabricated products, stability in the average for steel mill
products, increases for some types of machinery and equipment resulting
in a slight upward drift in the group index, and selective and generally
small changes among other industrial commodities. Thus an index for metals
and machinery combined, which rose nearly 2 per cent last year, has increased
.7 or .8 per cent further in the first five months of this year. An
index for all other industrial commodities has remained relatively
stable.
The consumer price index rose .3 per cent in April, mainly as
a result of price increases for foods and gasoline along with the
persistent rise for services. Apparel also edged up uhile used cars
declined slightly and other consumer durable goods were virtually un-
changed. A BLS review of the changes noted that cigarette taxes were
raised in some states and that increases in college tuition were a
significant factor in the April rise in services.
The April increase of .4 per cent in the retail food index
reflected mainly increases for fruits and vegetables and eggs. By early
in the month, when food prices are collected for the CPI, the sharp rise
in livestock and wholesale meat prices had not yet been reflected in
retail prices. Should retail meat prices show a rise of as much as

II - 13
15 per cent from April to a summer peak, they would raise the total
inde:- by slightly more than .5 per cent.
A partial offset to the index-raising effect of meat prices
would be provided by enactment of excise tax reduction on autos, appliances
and some other goods and services. The effect on the total CPI, if the
cuts are passed along to consumers, could be as much as .5 per cent
by midsummer.
CONSUMER PRICE INDEX1957-59 = 100
All items
Services
Food
Commodities less foodApparelOther nondurablesNew carsUsed carsHousehold durables
Inde::April1965
109.3
117.3
107.3
105.0105.3107.6100.7120.697.9
Per cent increase
to April from:March April1965 1964
.3 1.4
.3 2.2
.4 1.5
.2 .7
.3 .6
.7 1.4-.1 -.9-,9 -.2-.1 -.8
Agriculture. Reduced supplies of pork and beef in recent weeks
have given a substantial boost to prices at the farm, and index of prices
received by farmers in mid-May was 3 per cent higher than a month earlier
and 6 per cent above mid-May 1964. Vegetables also added a fillip to
farm prices but the main source of strength was in meat animals, especially
II - 14
hogs. Prices paid by farmers for family living, productive inputs, and
overhead also increased in May, but by only 1 per cent, and the parity
ratio increased to 78 (1910-14 = 100), 2 points higher than a month
earlier and 3 points higher than a year earlier.
heat animal prices are likely to continue strong throughout
the year. Per capita supplies of red meat for 1965 as a whole will
probably be about 3 per cent below the record supplies of last year
because of sharply curtailed hog production. In the first quarter, with
beef production up more than hog production was down, production of red
meat averaged 1.7 per cent above a year earlier, an increase a little
greater than the growth in population. In the current quarter however,
beef production is not likely to quite equal to the high level of a year
earlier and pork production is down sharply.
In the second half of the year, hog slaughter will continue
substantially below year-earlier levels, according to inventory and
pig crop data. As yet there is no evidence that hog producers are re-
building breeding herds in response to the current favorable hog-corn
price ratios. Fed beef production is likely to be about the same as in
the second half of last year. In the absence of a USDA beef purchase
program this year, however, fed beef available in commercial channels will
probably be around 3 per cent greater. Fed cattle prices, however, should
be maintained near year-earlier levels considering the high incomes of
consumers, gains in population, and the relatively short supplies of
pork in prospect in the second half of the year.

1-C-1
ECONOMIC DEVELOPMENTS - UNITED STATESSEASONALLY ADJUSTED
6/8/65
EMPLOYMENT AND UNEMPLOYMENTMILLIONS OF PERSONS, ESTAB BASIS i II'IR5NONAGRICULTURAL EMPLOYMENT AP1 5
s9
----------- 5 8
TOTAL
54
APR 25 8INDUSTRIAL AND RELATED 2
25
23
PER CENT 7"E UNEMPLOYMENT
MAY 4i5
1960 1962 1964
1957 59-0o TOTAL UNIT LABOR COST 105
ALL EMPLOYEES AR----- Ii ni i 9 5
1960 1962 1964
PRICES1957 59.100 wl C . 1 1 2
0NTs A CONSUMERAPR 109 3
ALL ITEMS 107
102

6/8/65-U-C- 2
ECONOMIC DEVELOPMENTS - UNITED STATESSEASONALLY ADJUSTED
RETAIL SALES1960 61 10b i 200
160INEW U.S. AUTOS ISNITS \ MAY
1.* f
)h APR^ 128 1--- --- "----./s A. l AU P -- 2 0S, 120
I I,
^ G.A.F.
1"' Ir .ll ll "l 8 01960 1962
NET CHANGE IN OUTSTANDING I Bri '0
6 1962 1964
ANNUAL RATES HOUSING STARTS
STOTA, ----
3 MO MOV AV
1960 1962 1964
BUSINESS INVESTMENTBILLIONS OF DOLLARS III ll lll 6
| QI50I -o*
NEW ORDERS MACHINERYAND EOUIPMENT APR 41
- 4
1000 MFR5: CAPITAL APPROPRIATIONS
BILLIONS OF DOLLARS 6ANNUAL RATES
QIO 521
*5
NEW PLANT AND EQUIPMENTEXPENDITURES, TOTAL
I I nlaIn .I 1
1960 1962 1964
2.00
1.75
1.50
1.25
1.00
1964
1960 1962 1964

III - 1
DOMESTIC FINANCIAL SITUATION
Bank credit. The seasonally adjusted growth in bank credit
during May was the same as in April -- $1.8 billion, as compared with a
$2.8 billion average monthly increase in the first quarter. The increase
of bank credit during the last two months has been at a less than 8 per
cent annual rate, somewhat below the growth rate for the entire year
1964 and considerably below the unusual expansion during the first quarter
of this year -- an annual rate of over 12 per cent.
The slowdown of the growth in bank credit since the first
quarter has reflected a retardation in loan growth. Although the expan-
sion of loans in May was higher than April, the annual growth rate of
loans over the last two months was about the same as for 1964 as a
whole -- a little less than 12 per cent -- and considerably below the 21
per cent annual rate of increase of the first quarter. Moreover, most
of the April to May increase in loans occurred in financed loans.
While the unusual demands for loans in the first quarter
associated with the dock strike, foreign loans, the high level of auto-
mobile sales, demands for business loans have remained high. These loans
increased somewhat more rapidly in May than in April, but the increase
over the two months, at an annual rate of 15.5 per cent, was considerably
less than the first quarter.rate. City banks continued to show strength
in loans to metals and metal products and textile firms, as well as in
loans to trade and public utility companies.

III - 2
Bank holdings of Treasury issues continued to decline at
about the same average rate as earlier this year -- about $600 million
a month -- and holdings of non-Treasury issues rose somewhat less than
the average increase for March and April and much less than in January-
February when time deposit inflows had accelerated.
Total loans & i
U.S. Gov't. sec
Other securitie
Total loans
BusinessReal estateConsumer
Loans excludingand nonbank f
NET CHANGES IN COMMERCIAL BANK CREDIT(Seasonally adjusted, billions of dollars)
Na April Average1965 p 1965 p monthly
Ist Q 65 p
nvestments 1.8 1.8 2.8
urities -0.6 -0.5 -0.6
s 0.2 1.0 0.5
2.2 1.3 2.9
0.9 0.7 1.30.3 0.3 0.40.3 0.5 0.3
securityinancial 1.6
Averagemonthly
April-May, 65 p
1.8
-0.6
0.6
1.8
0.80.30.4
1.7
Loans and investmentsLoansBusiness loans
Note: Changes are basedDecember 31, 1964
Percentage
7.8 7.014.9 8.917.2 13.5
on data revisedcall.
Annual Rate of Increase
12.4 7.820.8 11.926.1 15.5
in accordance with the
Money supply and time deposits. After expanding in March-
April, the money stock (using the new, unpublished, seasonal factors)
declined $1.1 billion to the January level of $159.5 billion. The
decline was associated with a large increase in seasonally adjusted

III - 3
Treasury deposits after mid-April, when tax payments were larger than
usual. Projections suggest that these deposits will be drawn down
sharply the first two weeks in June, contributing to an increase in
the public's holdings of money. Since November, the money stock has
increased less than 1 per cent (annual rate).
Time deposit growth in May slackened somewhat further from
the March-April annual rate of growth of over 11 per cent to less than
10 per cent. Savings deposits at weekly reporting banks grew somewhat
more rapidly than last year, but the increase in negotiable CD's out-
standing was significantly less than in the same period last year, when
the level of rates allowed nonprime banks to participate more heavily
in this market.
Prime banks -- mainly in New York City -- were large issuers
of CD's in April and early May, in part to restore liquidity, which had
been depleted in meeting strong loan demands earlier in the year, as
well as to anticipate further loan growth and sizable CD maturities in
June. The acquisition of funds by the issue of CD's and the slowdown
in loan growth improved reserve positions of prime New York City banks
in April-May. This was reflected in a considerable reduction in their
basic reserve deficit, their borrowings from the Federal Reserve, and
their purchases of Federal funds.
Bank reserves. Average net borrowed reserves of member banks
increased moderately from $132 million in April to $159 million in

III - 4
May./ Borrowings by member banks increased about $20 million, on the
average, to $490 million in May, while excess reserves declined less than
$10 million to $331 million.
The effective rate on Federal funds was 4-1/8 per cent for
13 of the 20 trading days in May and 4 per cent the remaining 7 days.
U. S. Government securities market. The most prominent de-
velopment recently in the Treasury securities market was the relatively
sharp decline in bill rates that followed the 1 percentage point re-
duction in the British bank rate on June 3. Prior to that time, bill
rates had been tending to decline as continued investor demand was
augmented by System purchases from dealers amounting to $562 million
in the last two weeks of May (with an additional $249 million purchased
from foreign accounts). Uith market bill demand already tending to
outrun available supply at current yield levels, the reduction in the
British discount rate was a critical factor which seemed to tip the
market to the view that lower bill rates might prevail over the near-term.
In the weekly bill auction held on June 7, the 3-month bill
was issued at average yield of 3.78 per cent, down 9 basis points from
the week before. Other short-term rates--such as on CD's, bankers'
acceptances, and finance company paper--did not decline along with bill
rates in the recent period. For some time now, these other short-cerm
rates have not reflected the relatively minor declines that have tended
1/ Based on the average of daily figures for all of the reserve weeksending in the month as used in the reserve memorandum of the FOMC.

III - 5
to develop in bill rates. It is not clear at this time, however,
whether the most recent further widening of the spread between bill
and other short-term rates will tend more to restrain declines in the
former or more to put downward pressure on the latter.
While bill rates have been declining, yields on intermediate-
and longer-term U. S. Treasury notes and bonds were under upward pres-
sure for much of the period since completion of the May refunding.
But so far these pressures have been relatively minor, have been
tempered by official account bond purchases, and most recently have
diminished.
YIELDS ON U. S. GOVERNMENT SECURITIES
Date 3-month 6-monthc 3 years 5 years 10 years 20 years
(Closini bids) bills bills
1965Highs 4.00 4.05 4.16 4.18 4.24 4.22Lows 3.76 3.86 4.00 4.08 4.17 4.17
1964-65December 31 3.82 3.92 4.06 4.12 4.21 4.21May 17 3.89 3.95 4.12 4.15 4.21 4.21
May 25 2.89 3.94 4.10 4.15 4.22 4.22June 8 3.81 3.89 4.10 4.15 4.23 4.22
In general, the Treasury bond market has been characterized
by a sharp contraction of activity since mid-May as investment demand
for intermediate and long-term Treasury bonds appears to have been at
least temporarily satiated by the $2 billion of public exchanges into
the 4-1/4's of May 1974. Also contributing to this investment apathy
in the Treasury bond market has been the buildup in the corporate and
Federal agency calendars and the resulting improvement in yields in
those sectors of the capital market.

III - 6
During the past month U. S. Government securities dealers
have made no progress aside from official account buying in reducing
their holdings of longer-term bonds. The dealers came out of the re-
funding with holdings of $851 million bonds due in more than 5 years.
Through June 7 they had reduced these holdings by $159 million while
the System and the Treasury purchases amounted to $172 million in this
period.
System purchases in the coupon area were part of an effort
to keep some downward pressures off bill rates in a period of large
reserve need on the part of the banking system. In addition to coupon
purchases totaling nearly $200 million in all maturities since mid-
May, the System also put on over $1 billion of new repurchase agreements.
Corporate and municipal bond markets. The corporate bond
market has weakened further during the past three weeks with average
yields on new corporate issues rising to their highest level since
early 1962. Recently, most yield series on municipal bonds have also
risen as dealers' advertised inventories of unsold securities have con-
tinued to mount. Although municipal yields are at their 1965 highs,
they are still 7-12 basis points below their 1964 peaks.
In mid-May, underwriters for a number of issues had been forced
to break syndicate price restrictions, and yield increases of 2 to 7
basis points were required to move small, but hard-core, balances. Then
at the close of the month, when a $250 million issue of capital notes
by the Chase Manhattan Bank was added to the already heavy June calendar
for public offerings, investment demand dried up at prevailing yields,

III - 7
BOND YIELDS
Corporate State and local governmentAaa Bond buyer
New Seasoned oo (mixed qualities)
1964High 4.53 4.45 3.16 3.32Low 4.30 4.35 2.99 2.12
1965High 4.55(5/28) 4.45(6/4) 3.09(6/3) 3.20(6/3)Low 4.33(1/29) 4.41(3/12) 2.94(2/11) 3.04(2/11)
Week ending May 14 4.51 4.45 3.09 3.14S " June 4 4.55- 4.45 3.09 3.20
1/ Ueek ending May 28.
and syndicate agreements on three issues with sizable unsold balances
were terminated. Among these issues was the largest offering of the
month--$125 million of Pacific Telephone and Telegraph Company deben-
tures--with about $100 million in bonds still undistributed. The imme-
diate price reaction in free market trading was sufficient to raise the
yield 10 basis points, while the price adjustment in another issue
recently released from syndicate raised its yield 17 basis points. The
early announcement of an unexpectedly low offering yield on the Chase
Manhattan Bank notes has led to some market firmness early this week
as dealers expect a possible postponement or revision of the issue.
In the second quarter of 1965, public offerings of corporate
bonds have exceeded private placements in the seasonally high spring
quarter for the first time since 1962. The total amount of new capital
raised in the current quarter is somewhat less than a year ago, but the
publicly offered portion is 40 per cent above last year's small volume
and somewhat above the average for other recent years. Public utilities

III - 8
Public utilities account for only about one-fourth of this total, but
banks and manufacturing concerns are more important than usual as borrowers
in the public market. Two huge commercial bank issues will account
for over two-thirds of the $725 million total public offerings for June.
Since one of these is in the form of convertible notes ($267 million),
the market impact of this month's financing is expected to be less than
the dollar magnitude suggests. But market expectations are being in-
fluenced by the prospect of a special issue -- the $525 million FNIA
participation certificates to be offered to the public on June 15 -- which
is not included in the above volume figures.
In the municipal market, dealers' advertised inventories of
unsold securities are currently in an all-time high range close to $905
million as a result of both a large volume of new offerings and retorted
less active buying by commercial banks. This inventory has already put
some upward pressure on yields, although the Moody's Aaa series fails to
reflect it, but further impact on the market may be dulled by the expected
decline in the supply of new offerings this month.
Home mortgage markets. Contract interest rates and yields have
been unusually stable this spring, as mortgage funds have generally re-
mained ample and lender competition for mortgages has been active.
In April, as in other recent months, average loan amounts for conventional
first mortgages for both new and existing hoie purchases were above those
a year earlier, reflecting mainly upgrading of purchases by borrowers.
For new home loans, nonrate terms showed no further liberalization on the
average as compared with a year earlier. For existing home loans, both

III - 9
maturities and loan-to-value ratios remained more liberal than in April
of last year, but some shift toward less liberality was apparent from
March averages.
AVERAGE TERMS ON CONVENTIONAL FIRST
March
New home loansPurchase price ($1,000)Loan amount ($1,000)Loan/price (per cent)Maturity (years)
Existing home loansPurchase price ($1,000)Loan amount ($1,000)Loan/price (per cent)Maturity (years)
25.318.573.724.9
20.114.672.720.9
MORTGAGES FOR HOME PURCHASE
Per cent increase inApril April 1965 from a
year ano
24.918.173.724.9
19.614.071.820.4
+ 6+5
+ 7+ 6S1+- 3
A public offering
in a pool of mortgages held
This offering is being made
of $525 million in certificates of participation
by FNIA and the VA is scheduled for June 15th.
under amendments to the National Housing
Act which became effective in September of last year and reflects, in
part, the success of an initial offering of $300 million of such certifi-
cates last November. As planned, about $250 million of the proceeds from
the new offering vill go to FNIA and about $275 million to the VA.
Stock market. Common stock prices (based on Standard and Poor's
500 stock price index) have continued to recede from their all-time high
of 90.27 reached on May 13. The sharpest one-day drop since the
assassination of President Kennedy occurred on Tuesday, June 8, with prices

III - 10
closing at 85.93, 5 per cent below their lay high. Trading volume, which
had approached the 6 million share per day level in the weeks prior to
the May high, has declined. Transactions averaged 5.2 million shares
per day during the latest three-week period and have been well below the
5 million level during most sessions in which have registered sharp price
declines.
Uhile the long bull market of the past three years had carried
prices to a point 72 per cent above their June 1962 low, it was marked by
5 previous interruptions. The sharpest of these brought an average
price decline of 6.5 per cent, but the others did not carry beyond 4 per
cent. In contrast, the most recent major decline -- that during the
spring of 1962 -- reduced market values by about 25 per cent.
Since recent price increases have been tied rather closely to
the upward trend in corporate earnings, current developments may reflect
increasing sensitivity to the prospect of less favorable quarter-over -
quarter earnings comparisons. At the same time, vulnerability to further
decline may be limited to some extent by the fact that recent valuations
of earnings have been somewhat below those associated with the market rise
which peaked out in late 1961 and broke sharply in May and June 1962.
The composite price-earnings ratio for the stocks in the Standard and
Poor's index reached nearly 21 to 1 in late 1961, whereas the ratio in
mid-May this year was 18 to 1.

In-c-i
FINANCIAL DEVELOPMENTS - UNITED STATESBANK RESERVESBILLIONS OF DOLLARS I IITnT 2l 22
21 68
/. . 21
TOTAL- --- 20SA
-19
-- 18
BANK ASSETSBILLIONS OF DOLLARSSEASONALLY ADJUSTEDRATIO SCALE I
STOTAL
- LOANS-LESS REAL ESTATE
U.S. GOVT. SECURITII
J~c~--~_7-- - - -?*!. -I ---- s-rAPR 58 5
---- ,," OTHER SECURITIESAND REAL ESTATE LOANS
1960 1962
^ ArK IJI Y v-
APR 659
-l
1964
MARKET YIELDS-BONDS & MORTGAGESPER CENT
NEW HOME FIR
YEAR s^
- FHA-INSURE
-BONDS:
STATEAND L
STATE AND L
ST MORTGAGES:
CONVENTIONALSAPR 580
" D - -I APR 545
30-YEAR
NEWCORPORATE Aaa MAY 451
MAY4 21
0-YEAR U.S. GOVT.
MAY 309
3CAL GOVT. Aaa1960 162 196
-140
LOANSI
6/8/65
APR 98 8
U.S. GOVT.SAVINGS BONDS
AND SHORT TERM SEC.
if A h
APR 1768
19641960 1962

IV - 1
INTERNATIONAL DEVELOPMENTS
U.S. balance of payments. Present indications suggest a small
over-all payments surplus in May of perhaps $50 million on the conventional
basis. The surplus financed by official settlements may have been close
to the same amount.
The over-all deficit figure for the first quarter has been
somewhat reduced as a result of further revisions in data on bank-reported
liabilities to foreigners. The revised deficit on regular transactions
now totals $700 million, seasonally adjusted, or $2.8 billion at an annual
rate. (The earlier estimate had been $3.1 billion.) The official
settlements deficit remains unchanged at $2.6 billion, annual rate. The
changes affected principally the months of February and March, reducing
the February deficit and increasing the March surplus.
U.S. BALANCE OF PAYMENTS(monthly averages in millions of dollars,not adjusted for seasonal variation)
Oct.- Mar.- MFeb. Apr.
Balance on regular transactionsIncrease in liquid liabilities
to others than reserve holders
Official settlements balance
Selected U.S. capitaltransactions
(outflows (-))Bank creditLiquid fundsSecurities transactions
-458
230
-228
-3050
-139
332
-190
142
- 8200+
- 75
ay
50e.
?
0 to 50e.
n. a.n.a.n.a.
ChangeOct.-Feb. toMar.-Apr.
790
420
70
297200+64
e. Estimated.

IV - 2
The payments surpluses in March and April resulted in large,
part from a reduction in the outflow of bank credit and from return flows
of liquid funds, as shown in the table. The large March surplus probably
also reflected abnormally large net receipts from trade, as export
shipments were accelerated after the dock strike. Absence of export data
for April precludes an estimate of the importance of this factor in
April.
Net U.S. purchases of foreign securities in March and April
were sharply reduced from the advanced levels of the preceding five
months. Early indications for May also suggest only a moderate volume
of such purchases. However, the calendar of new foreign issues for June
is very heavy, and current estimates of U.S. purchases of such issues
for the year 1965 are for a 30 per cent increase over the $1.1 billion
recorded last year.
Outstanding long-term bank loans to foreigners were reduced by
$96 million in April, a reduction that more than offset the further
expansion of these loans in March. Almost half of the April decline
reflected large repayments by Prazil but there were net decreases in
outstanding loans to other countries as well. Short-term bank loans
and acceptance credits to foreigners were also reduced in April, by
$56 million. (Outstanding long- and short-term claims on foreigners by
domestic banks within the VFCR declined by $140 million in April.)
Return flows of U.S. capital out of deposits and short-term
investments abroad totaled $325 million in March and possibly a further
$100 million or so in April. The bulk of these reflows have been out
IV - 3
of dollar deposits in Canadian banks; there have also been significant
reductions in holdings of Canadian finance paper. Confidential
Canadian data show that Canadian banks in turn reduced their net U.S.
dollar assets in the U.K. substantially in addition to reducing their
dollar assets in the U.S.
Foreign commercial bank balances in this country (including
those of foreign branches of U.S. banks) were reduced by nearly $500
million in March and April. About half of the reduction represented
withdrawals by Canadian banks of funds invested in New York accompanying
the withdrawal of U.S. capital from dollar deposits in Canada. The
shift from a substantial build-up in foreign commercial bank balances
from October through February to a large reduction in March and April
lies behind the much smaller improvement in the official settlements
balance than in the balance on regular transactions between these two
periods.
Payments balances of Continental European countries. In the
two-month period March-April a selected group of nine Continental European
countries, including the largest reserve gainers of recent years, seem
to have been close to balance in their combined external payments. A
marked shift occurred in the external payments position of this group of
countries around the beginning of March. In 1964 the combined surplus
of these countries as shown in the table had amounted to nearly $3 billion,
or a monthly average of nearly $250 million. In the last quarter of
1964 and the first two months of 1965, their combined surplus had been
running at an even higher rate of almost $350 million a month (not

IV - 4
adjusted for seasonality). The sudden change from heavy surplus to a
position of near-balance coincided with the change in the U.S. position
from heavy deficit to surplus.
PAYMENTS BALANCES MEASURED BY CHANGES INNET OFFICIAL RESERVES AND COMMERCIAL BANKS' POSITIONS 1 '
(monthly averages in millions of dollars)
March- Oct.'64 Year March- Oct. 63April to April to1965 Feb.'65 1964 1964 Feb.'64
France 97S/ 88 65 - 3 58Germany - 53 26 8 117 37Switzerland- - 92 38 33 26 8
Austria 4/ - 18 9 13 0Belgium 27-/ 20 15 10 - 18Netherlands - 3a / 55 6 - 11 - 10Spain2/ - 40 15 30 15 12Sweden - 15 16 16 - 14 14
Subtotal - 75 239 180 154 103
Italy 50 107 67 - 65 - 148
Total - 25 346 247 89 - 45
I/ The data available are not strictly comparable for all periods, butthe inconsistencies appear to be minor.2/ Balances measured by changes in official reserves only. Consequently,
unlike the balances for other countries, these balances reflect increasesin commercial bank foreign assets (outflows) and liabilities (inflows).
j/ Approximate, due to lack of April data for commercial banks.
This change in the U.S. position was due not only to the program
of voluntary foreign credit restraint by U.S. banks and the activation of
the Gore Amendment but also to temporary factors affecting the U.S. trade
surplus and to a large reflux of U.S. corporate liquid funds, especially
from Canada. Undoubtedly some of these factors also operated, directly
and indirectly, to cut Continental surpluses, but other factors may also

IV 5
have been at work. The surpluses and deficits shown in the table have
been measured in most cases by changes in gold reserve, IMF position,
and short-term foreign assets less liabilities of the central bank and
the commercial banks together; except for Switzerland and Spain these
measures would not reflect changing flows of credit between commercial
banks or of Euro-dollar deposits of nonresidents with commercial banks
in the European countries.
Within the group of nine countries, only three -- France, Austria,
and Belgium -- showed larger surplus payments positions on the average in
March-April than in the preceding five-month period, and these changes
may have been partly of a seasonal character. Sweden's shift from
surplus to deficit may also have been partly seasonal. In three countries --
Germany, Switzerland, and Spain -- very large shifts from surplus to deficit
occurred, contrary to the experience of a year earlier shown in the last
two columns of the table. In the Netherlands, too, where large surpluses
had been realized in the five months through February, a sharp shift
occurred, bringing the Dutch position to near balance in March-April.
Finally, in Italy, where a strong swing since the middle of last year
has carried the balance from heavy deficit back to substantial surplus,
the average surplus was somewhat smaller in March-April than in the
immediately preceding five months.
For most of these Continental countries the very large surpluses
around the turn of the year reflected in some degree the flight from
sterling, as well as capital outflows from the United States. Swiss
official reserves were heavily affected by such influences, as repatriation

IV - 6
of Swiss commercial bank assets from London and increase in Swiss bank
liabilities to foreigners made Swiss official reserve gains much larger
than they would otherwise have been. With the cessation, or even
reversal, of such inflows, underlying weakness in the Swiss current
account contributed to Swiss reserve losses in March and April. For
Germany, shifts in flows of long-term capital are known to have been an
important factor in the shift from over-all surplus to deficit as
measured in the table. An additional factor was further shrinkage in
the German trade surplus.
Preliminary data indicate that both Switzerland and Germany
had further deficits in May. French official reserve gains were negligible
from mid-April through the third week of May. During that period the
franc was slightly below its upper limit against the dollar, but it rose
to its ceiling again by May 28.
Japan's payments balance. As measured by changes in gold, IMF
gold tranche position, and gross official foreign exchange reserves,
Japan's average monthly surplus of $22 million in the five months October-
February gave place to an average deficit of $12 million a month during
March-May. With allowance for changes in official liabilities and in
commercial banks' positions the shift was somewhat greater than these
figures indicate.
Cut in Bank rate in Britain. On June 3, Bank rate was reduced
from 7 to 6 per cent and restrictions on hire-purchase credit were
tightened. These measures appear to have been prompted by a desire --
based partly on political considerations -- to reallocate the impact

IV - 7
of existing policies without affecting the over-all degree of fiscal
and monetary restraint in Britain.
Information publicly available up to June 3 indicated no
fundamental change in the British economic situation. Renewed weakness
in exchange markets for sterling had appeared in late May, after a
period of nearly two months during which the forward discount had
narrowed to 1.8 per cent from its pre-Budget maximum of over 3 per
cent per annum. Unemployment in May was 1.3 per cent of the labor force.
Prices, even with adjustment for the impact of new excise taxes and
postal charges, continued to move upward through April. Wage settlements
in April and May averaged around 6 per cent, about equal to the first-
quarter average but well above the 3 to 3-1/2 per cent guideline. Al-
though the index of industrial production, seasonally adjusted, fell
two points in March to 130 per cent of the 1958 average, work stoppages
and the incidence of holidays were probably much more important factors
than any slackening of demand; indeed, output in many industries is
still hampered by supply bottlenecks.
Credit restrictions and the 7 per cent Bank rate since last
November have had a considerable impact on residential construction.
Funds flowing into home mortgages have been sharply reduced, since
building societies found it difficult to attract funds at the rates
they were maintaining, while some local authorities ceased lending for
new house purchases altogether because the rates they had to pay for
funds were higher than their lending rates. The reduction in Bank rate
may have an effect of channeling more funds into this politically

IV - 8
sensitive sector. As an offset to this relaxation, however, minimum down-
payments on hire-purchase contracts were raised by 5 percentage points --
from 20 to 25 per cent on automobiles and from 10 to 15 per cent on
consumer durables; consumer expenditures on durables had been continu-
ing to run at a high level.
Over-all bank credit expansion is being restrained by Special
Deposit requirements for the banks and by the 5 per cent ceiling on in-
creases in bank advances this year imposed in April. Seasonally adjusted
bank advances fell by £76 million between mid-April and mid-May, follow-
ing the record rise of £88 million in the preceding month.
EZ-C-1 6/8/65
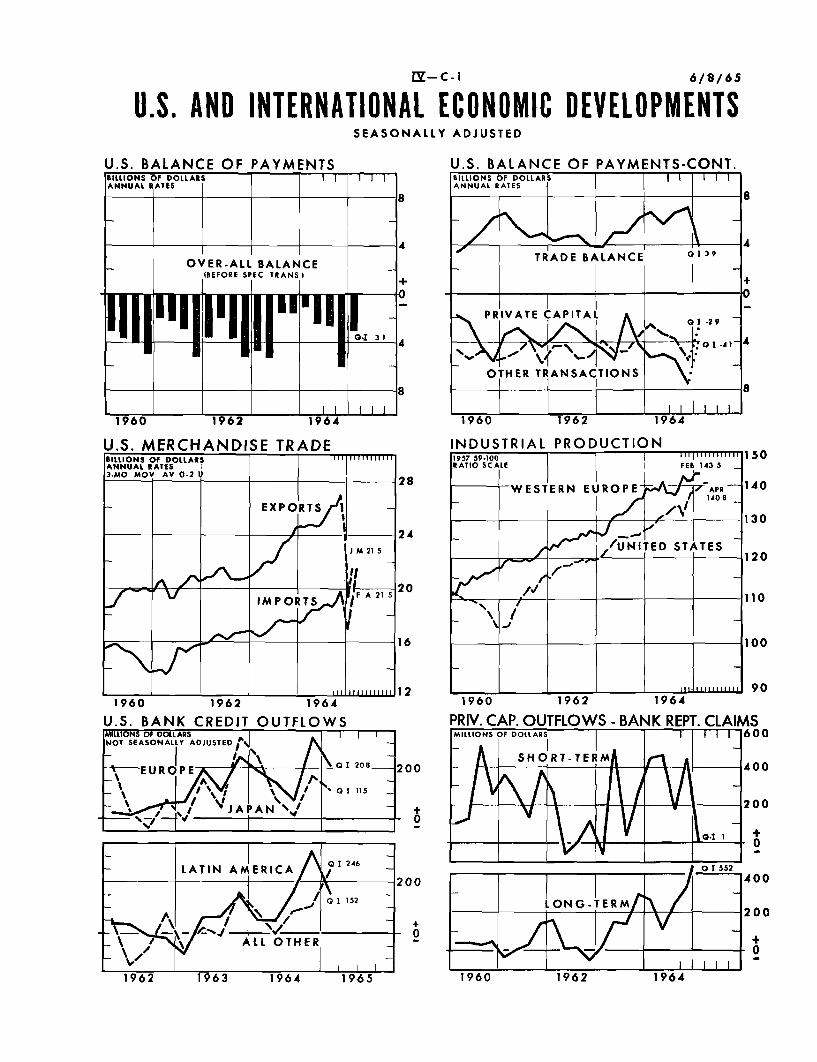
U.S. AND INTERNATIONAL ECONOMIC DEVELOPMENTSSEASONALLY ADJUSTED
U.S. MERCHANDISE TRADEBILLIONS OF DOLLARS Ill lI lllllIANNUAL RATES3-MO MOV AV 0-2 I) 2
28
EXPORTS I
24
JM 21 5
v IMP OT
F A 2 1 52
16
U.S. BANK CREDIT OUTFLOWS
U.S. BALANCE OF PAYMENTS-CONT.BILLIONS OF DOLLARSANNUAL RATES
4TRADE BALANCE 39
+0
PRIVATE CAPITAL AOTE TRANSTI -29
OTHER TRANSACTIONS
-- ------- II I I I
1960 1962
1960 1962
IY64
1964

A- i
APPENDIX A: THE ALUMINUM AGREEMENT*
In its new 3-year contract with the major aluminum producersthe United Steelworkers union appears to have gained most of its bargaininggoals. The contract is valued by the union at 50.1 cents or 4.1 per centper year (3.9 per cent compounded) based on a total hourly labor cost of$4.10. The companies have neither confirmed nor denied these cost estimates.In almost all essential provisions, the new agreements are similar to thecontracts signed earlier this year between the same union and the cancompanies. Although the can company pact was estimated to have cost some-what less, 3.5 per cent, the difference mainly reflects higher pensioncosts in the aluminum industry to provide approximately equivalent pensiongains for a work force of higher average age and more years of service.Prices were raised in both industries after negotiations were concluded.
The current aluminum pact provides for somewhat higher increasesin hourly compensation than the 2-1/2 per cent gains negotiated in 1962and 1963, but are about the same as in 1960. However, the current settle-ment is far below the wage and fringe increase of about 8 per cent peryear agreed to in 1956. Cost-of-living clauses in the industry wereeliminated in 1962.
In the past, the aluminum and basic steel contracts were similarboth as to terms and rates of increase. In preceding periods, however,aluminum industry settlements have generally followed steel settlements.While aluminum contracts this year again expired after those in steel,the usual course of negotiations was reversed.
In negotiations now being resumed in basic steel the union willundoubtedly demand that the aluminum contracts be accepted as a patternfor final agreement and the relationship of wages and fringe benefitsgains in the two industries be maintained as in the past.
The total amount of the union's demands made this year in boththe steel and the aluminum industry was based on a combination of theguidepost adjustment and prospective increases in consumer prices. Sincethe industry opposed an explicit cost-of-living clause, the union arguedthat in addition to overall productivity gains some allowance should bemade to maintain "real" wages. The alternative it presented incorporatedan adjustment for price increases into the amount of the package which isthen distributed between wages and fringes by negotiation. The computationof the total package demanded by the union included an increase of 3.2 percent in total hourly compensation (guidepost) plus 1.2 per cent for
prospective cost-of-living increases.
*Prepared by Murray S. Wernick, Senior Economist, Division ofResearch and Statistics.

A - 2
COST OF ALUMINUM - USW SETTLEMENTJune 1, 1965 - June 1, 1968(Based on Union estimates)
Estimated cost(cents per hour)
First year beginning June 1, 1965 16.17
WagesCombining grades 1 & 2 .50Basic lnage increase 10.00Increase to maintain grade differentials 1.53
12.03Fringes
20 per cent of wage increase for added costof current fringes 2.41
Increases in group insurance and hospitalbenefits 1.73
4.14
Second year beginning June 1, 1966 20.37
PensionsVoluntary retirement after 30 years of
service and $100 per month supplementarypay for retirement resulting from disabil-ity or layoffs 5.26
Increase in pensions to $5.00 per month foreach year of service 15.11
Third year beginning June 1, 1967 13.55
WagesBasic -uage increase 7.00Increase to maintain grade differentials 1.53
8.53
Fringes20 per cent of wage increase for added cost
of current fringes 1.71Increased sickness and accident insurance 3.21
5.02
Recapitulation:
Total cost (cents) 50.09Average annual cost (cents) 16.7Simple average increase (per cent) 4.1Compound rate based on the year increases
go into effect (per ceht) 3.9

A- 3
In aluminum, the union bargaining demand was for about 16.5 centsper hour per year and in steel it is 17.9 cents per year. The larger steelfigure reflects a higher hourly compensation -- $4.40 per hour versus$4.10 in aluminum; the difference is mainly due to an incentive wage systemprevailing in the steel industry.
The guidepost policy of 3.2 per cent (compounded) is based ontrend productivity increases for the private nonfarm economy and makes noallowance for changes in consumer prices. One of the anomalies of the policyis that specific cost-of-living clauses in contracts have been ignored inevaluating the potential inflationary impact of settlements. But where anallowance for a trend price increase is included as a part of total cost,as in the aluminum contract, the cost may be higher than the guidepost onthis account. It can be argued that in the first case the cost-of-livingincrease is not a definite cost but depends on future price movements, whilein the second case it is a contracted cost. Nevertheless, experience
would seem to indicate that the guidepost policy as now applied tends tofavor unions that have negotiated cost-of-living clauses.
The breakdown of the 50.1 cent aluminum package is shown in thetable. It includes direct wage increases averaging 12 cents the first
year and 8.5 cents in the third year, and is the first time since 1961 thatwage rates have been increased in the industry. Nonwage items accountfor about three-fifths of the total. Host important, is the sharp jump inbasic pension payments. They are almost doubled to $5.00 per month foreach year of service from $2.60. (In the can contract, benefits wereraised to $5.50 per year of service from a higher base of $3.25. Becauseof the difference in age structure the cost of pension increase was greaterin the case of aluminum, but the can workers continue to receive a higherbasic pension allowance.) In addition, workers will now be able to retirevoluntarily at full pension after 30 years of service regardless of age.Workers who are forced to retire because of disability or layoff willreceive $100 in supplemental benefits until their social security paymentsgo into effect. Increased sickness, accident and hospitalization benefitsare also provided.
If the aluminum contracts do become a precedent in steelnegotiations, final value of any agreement is likely to rest largely on theestimates of the cost of the pension and early retirement provisions. Theinterim steel agreement seems to imply at least an 11.5 cent per hourincrease in wage rates in the first year compared to 12 cents in the aluminumcontract. Presumably, the smaller third-year wage increase would also be
acceptable. If a pension program comparable to that in aluminum were pro-
vided in the steel settlement the final cost of the contract would then
be close to 3.9 per cent (compounded) since the age structure in steel is
closer to the aluminum than to the can industry.
A - 4
Although the steel and aluminum industries have followed a similarnegotiated wage pattern in recent years, productivity development have beensubstantially different in the two industries, according to the Councilof Economic Advisers. In aluminum, output per manhour has been risingat a rate of 6 per cent per year but in steel, only 3 per cent. Accordingly,the aluminum industry was in a position to reduce prices given the currentsettlement but instead increased them. A rise in steel wage costs of 4per cent per year would be above the Council estimate of the industry andoverall productivity gains and might be followed by some price increase.However, in the aluminum industry demand conditions have been such thata price increase occurred despite the guidepost arithmetic. In steel,domestic and foreign competitive conditions and a large inventory overhangmay well prevent the industry from agreeing to as high a wage increaseas the union desires.