Embed Size (px)
Citation preview

Prefatory Note The attached document represents the most complete and accurate version available based on original copies culled from the files of the FOMC Secretariat at the Board of Governors of the Federal Reserve System. This electronic document was created through a comprehensive digitization process which included identifying the best-preserved paper copies, scanning those copies,1
and then making the scanned versions text-searchable.2
Though a stringent quality assurance process was employed, some imperfections may remain. Please note that some material may have been redacted from this document if that material was received on a confidential basis. Redacted material is indicated by occasional gaps in the text or by gray boxes around non-text content. All redacted passages are exempt from disclosure under applicable provisions of the Freedom of Information Act. 1 In some cases, original copies needed to be photocopied before being scanned into electronic format. All scanned images were deskewed (to remove the effects of printer- and scanner-introduced tilting) and lightly cleaned (to remove dark spots caused by staple holes, hole punches, and other blemishes caused after initial printing). 2 A two-step process was used. An advanced optical character recognition computer program (OCR) first created electronic text from the document image. Where the OCR results were inconclusive, staff checked and corrected the text as necessary. Please note that the numbers and text in charts and tables were not reliably recognized by the OCR process and were not checked or corrected by staff.
Content last modified 6/05/2009.
CONFIDENTIAL (FR)
CURRENT ECONOMICand
FINANCIAL CONDITIONS
Prepared for the
Federal Open Market Committee
By the Staff
BOARD OF GOVERNORS
OF THE FEDERAL RESERVE SYSTEM March 26,1969

CONFIDENTIAL (FR)
CURRENT ECONOMIC AND FINANCIAL CONDITIONS
By the StaffBoard of Governors
of the Federal Reserve SystemMarch 26, 1969

I- 1
SUMMARY AND OUTLOOK
Outlook for economic activity
Increases in GNP in the first and successive quarters are
likely to be larger than we had earlier anticipated, but the rate of
real GNP growth is still expected to be somewhat slower than in the
fourth quarter of 1968. Growth of real GNP should dip from the 3.4
per cent rate of the fourth quarter of 1968 to about 2.5 per cent by
midyear. The prospect, however, is for little easing of price pressures.
Views on the economic outlook have been strengthened by the
survey results indicating business plans to accelerate expenditures
for plant and equipment. These heightened expectations are being
confirmed, at least for the short run, by the rise in new orders for
durable goods and increased output of business equipment. In addition,
a somewhat stronger pattern of consumer expenditures this quarter has
emerged after the recent revision in the seasonal adjustment factors
for the retail sales figures. The trend of retail sales, excluding
autos,appears to be stronger while auto sales are weaker this quarter.
Much of the impact of the 14 per cent pick-up in capital
expenditures now projected by businessmen for this year is concentrated
in the current quarter, to be followed by a dip in the second quarter
and moderate increases for the remainder of the year. We are doubtful
that all of this increase will be realized, either in the first quarter--
when physical limitations are a factor--or later in the year, when

I- 2
financial constraints may force stretch-outs in spending plans. For
the year as a whole, the staff projection shows a rise in business
fixed investment of 12 per cent. Also the increasing pressure from
monetary restraint should begin to cut significantly into building
activity before long, with housing starts probably easing by the
next quarter.
The growth of disposable income is being reduced this quarter
by higher social security taxes, and the rise in consumption is
apparently being supported in significant part by a sharp cut in the
savings rate. Since unusually large income tax payments will continue
to dampen growth of disposable income through midyear, and with the
saving rate apparently at a relatively low level and not expected to
fall further, a slower rate of growth of consumption still seems
likely in the upcoming quarter.
Outlook for prices and resource use
Industrial prices at wholesale rose an estimated 0.4 per
cent from mid-February to mid-March; the January-to-February increase
was revised up to 0.5 per cent; and the January rise holds at 0.6
per cent. Thus, for the first three months of this year industrial
prices were rising at an exceptionally rapid 6 per cent annual rate.
Lumber and plywood continued to bulk large in the overall rise--
accounting, for the three months, for almost a third of the total
increase. Prices of metals, petroleum and products, and machinery
and equipment have also increased sharply.

I- 3
Lumber and plywood prices, now up 40 per cent from a year
ago and nearly 60 per cent from early 1967, are vulnerable to any
significant shifts in the supply-demand balance and perhaps also to
the belated outcry over the extraordinary price run-up of the past
2 years. Excluding lumber and plywood, industrial prices have been
increasing this year at the high annual rate of nearly 4-1/2 per
cent and the diffusion of increases has been unusually widespread.
Continued strong demands from the construction and producers' equip-
ment sectors are likely to exert a continuing upward pull on prices,
and upward pressure from the labor cost side appears likely to
continue quite strong in the coming quarter.
The consumer price index continued to rise in February at
about the 4-1/2 per cent annual rate of the past year. Food prices
leveled off, in line with longer-run expectations, but the price
increase for non-food commodities showed a step-up from recent
moderate rates. The increase in service prices in February was at a
6 per cent annual rate--little changed from increases prevailing
over the past year--with boosts in housing costs and medical care
again prominent and, within the housing sector, higher conventional
mortgage interest rates augmenting the rise. Excluding mortgage
interest-rates--with their heavy weight in the CPI--the consumer
price rise may slow somewhat if food prices continue to show little
change.

I-4
The expansion in industrial production thus far in 1969 has
been considerably slower than in the late months of 1968, in part
because of a slower rise in total output of consumer goods. The
rate of manufacturing capacity utilization has drifted off slightly
to about 84 per cent.
Employment increased sharply in January and February, with
the emphasis on non-manufacturing activities. Employment demands
might ease in the second quarter, especially if industrial production
continues to rise only slowly, and the unemployment rate is expected
to rise slightly.
Outlook for credit demands
Demand for business loans from banks is expected to continue
strong over the next several weeks, influenced in part by large
corporate tax payments to be made in April. The further rise in the
prime rate in mid-March is likely to be a marginal factor, however,
in dampening demands on banks, and may induce businesses to divert
some additional short-term borrowing to the commercial paper market,
where borrowing costs are somewhat less expensive.
There is also likely to be some increase in corporate bond
offerings during the spring, reflecting rising outlays for plant
and equipment, a widening gap of corporate financing needs over
internal sources of funds, recent erosion in corporate liquidity,
and continued constraints on bank credit availability. Many bond
offerings may continue to contain equity features to increase the
attractiveness of the security and to reduce interest costs.

I- 5
In the municipal market, offerings of new issues are likely
to remain modest, though rising from the exceptionally low March volume.
Some prospective issues are likely to be postponed at current interest
costs, but, on the other hand, adjustment of State interest rate ceil-
ings will permit some borrowers to enter the market who would other
wise be blocked out.
Around the end of April, the U.S. Treasury will announce
terms for refunding almost $4 billion of publicly-held coupon securities
maturing in mid-May. The Treasury could also include the over $2 billion
of publicly-held bonds maturing in mid-June in the package. It is too
early to have a clear notion as to the nature of the Treasury exchange
offering and whether they will make use of the large second quarter budget
surplus to redeem some coupon debt as well as bill issues.
With the Treasury's net cash needs now behind and debt repay-
ment in prospect, the principal sources of upward interest rate pressure
from the demand side are likely to be from corporations and in the
mortgage area. These demands may be strong enough to lead to some
further upward interest rate movement in long-term markets as a whole,
or at least would tend to forestall a sustained downward movement. A
factor that could ease long-term rate pressures as the spring progresses
would be a continued downward drift in Treasury bill yields, since that
might permit banks to maintain security portfolios as CD's became more
competitive.

I-6
Outlook for supply of funds
The outlook for the supply of funds through banks and other
financial institutions to the business loan, State and local Government,
and mortgage markets will depend very much on the extent to which prospec-
tive Treasury debt repayment leads to lower market interest rates,
particularly in the short-term area. Assuming that short-term rates
at least do not rise much from current levels, the run-off of large
CD's at banks may slow somewhat in spring (after adjustment for April
tax period seasonal declines). Not only are amounts maturing declining,
but also banks may be able to take advantage of the reduced availability
of Treasury bills to market relatively more CD's than has been the case
in recent months. With respect to demand deposits, private deposits
will be affected by continued pressure on businesses to economize on
cash balances to help finance current outlays, given bank loan policies
and high market interest rates. April tax payments and the recent bill
financing will also tend to drain private demand deposits.
Consumer-type time and savings deposits are likely to be
withdrawn in some volume from banks in early April (after the March
interest-crediting), to be invested in high yielding market securities.
But if recent experience is any guide, these deposits are likely to
resume a moderate growth trend in subsequent weeks. However, banks
will face somewhat more competition from savings and loan associations
for such deposits, since associations (effective April 1) can now issue
90-day notice accounts at the same ceiling rate as has applied to com-
mercial banks.

I- 7
While this new account will provide S&L's with a little more
ammunition, net inflows of funds to them are still expected to be
further constricted in the coming March-April reinvestment period and
possibly in subsequent weeks. Current market interest rates are relatively
attractive, although it is not clear to what extent savings deposits
would substitute for long-term bonds,which have shown the greatest yield
increase in recent months. In addition, thrift institutions, as well
as banks, may be affected by withdrawals by individuals to finance large
April tax payments.
In view of these inflow prospects, new mortgage commitments
by thrift institutions may be cut back, and mortgage yields should
continue upwards. To meet outstanding commitments, thrift institutions
will probably have to reduce liquid assets further and S&L's will have
to increase their borrowing from the Home Loan Banks. FNMA is expected
to continue its support of Government-underwritten mortgages at its
current pace, but this will tend only to modify mortgage market pressure
somewhat and will over time require sizable marketing of new FNMA debt
issues.
Balance of payments outlook
It seems improbable that the deficit on the liquidity basis
will continue during the second quarter at the extremely high rate
experienced in the first 2-1/2 months of the year. However, in the
absence of an adequate explanation of recent large monthly deficits,

I -
prediction is hazardous. Possibly the net balance on goods and services
will prove to have been negative in the first quarter, as a result of
more rapid catching up in the flow of imports than in exports after
the ending of the longshoremen's strike last month at most ports. If
so, before long we should be seeing a swing toward a smaller rate of
over-all deficit as exports catch up.
Guesses that have beem made as to the magnitude of the port
strike impact on the first-quarter deficit are not large enough to
explain even half of the liquidity deficit in this period, which is
currently estimated in the $1-1/2 to 2 billion (per quarter) range.
As foreign purchases of U.S. corporate stocks appear to have continued
on a large scale in January and February, and as U.S. bank credit reflows
have been at least as large as at this time a year ago, it seems possible
that U.S. corporations have been taking advantage of the large leeways
many have under the direct investment controls to place funds abroad
with their subsidiaries. Conceivably this in turn may help to some
extent to explain the success U.S. banks have been having during March
in bidding for fresh Euro-dollar money.
March 25, 1969
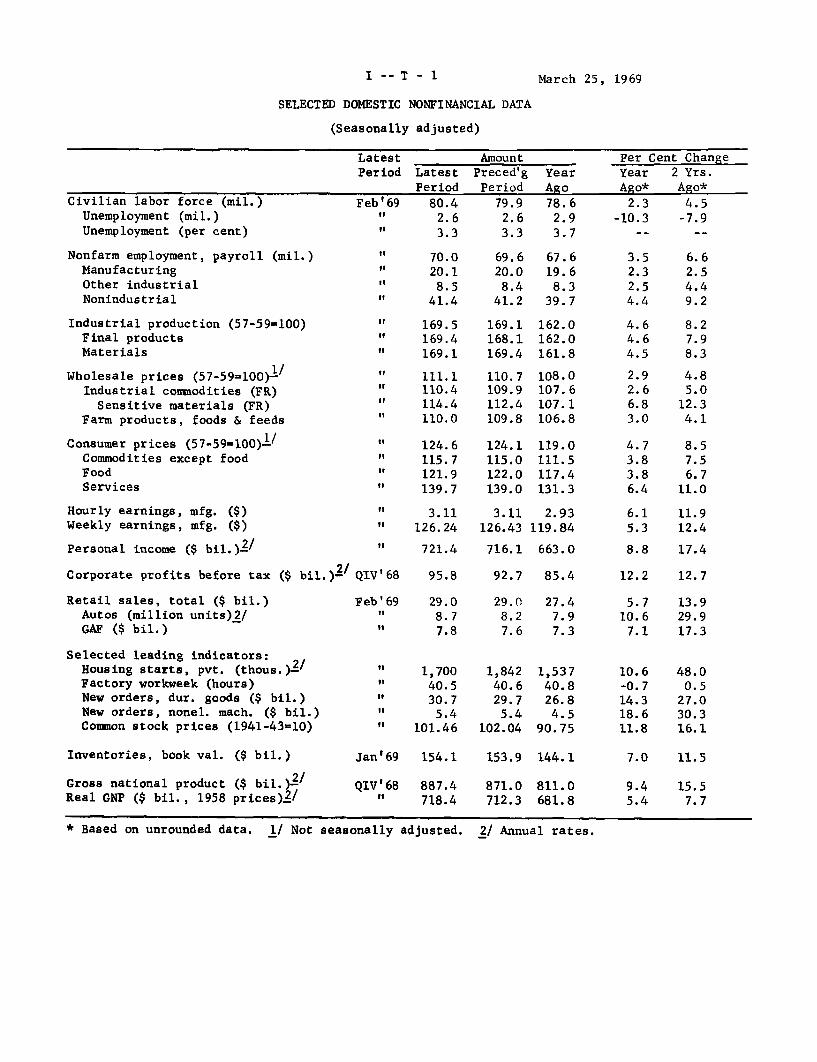
SELECTED DOMESTIC NONFINANCIAL DATA
(Seasonally adjusted)
LatestPeriod
Civilian labor force (mil.)Unemployment (mil.)Unemployment (per cent)
Nonfarm employment, payroll (mil.)ManufacturingOther industrialNonindustrial
Industrial production (57-59=100)Final productsMaterials
Wholesale prices (57-59=100)-1/
Industrial commodities (FR)Sensitive materials (FR)
Farm products, foods & feeds
Consumer prices (57-59=l00)-/Commodities except foodFoodServices
Feb'69
It
It
II
II
If
oIIit
LatestPeriod
80.42.63.3
70.020.1
8.541.4
169.5169.4169.1
111.1110.4114.4110.0
124.6115.7121.9139.7
AmountPreced'gPeriod
79.92.63.3
69.620.0
8.441.2
169.1168.1169.4
110.7109.9112.4109.8
124.1
115.0122.0139.0
YearAgo78.6
2.93.7
67.619.6
8.339.7
162.0162.0161.8
108.0107.6107.1106.8
119.0111.5117.4131.3
Hourly earnings, mfg. ($) " 3.11 3.11 2.93Weekly earnings, mfg. ($) " 126.24 126.43 119.84
Personal income ($ bil.).2/ " 721.4 716.1 663.0
Corporate profits before tax ($ bil.)2 / QIV'68 95.8 92.7 85.4
Per Cent Change
Year 2 Yrs.
Ago* Ago*
2.3 4.5
-10.3 -7.9
3.5 6.62.3 2.52.5 4.44.4 9.2
4.6 8.24.6 7.94.5 8.3
2.9 4.82.6 5.06.8 12.33.0 4.1
4.7 8.53.8 7.53.8 6.76.4 11.0
6.1 11.95.3 12.4
8.8 17.4
12.2 12.7
Retail sales, total ($ bil.)Autos (million units)2/GAF ($ bil.)
Selected leading indicators:Housing starts, pvt. (thous.).-Factory workweek (hours)New orders, dur. goods ($ bil.)New orders, nonel. mach. ($ bil.)Common stock prices (1941-43=10)
Inventories, book val. ($ bil.)
Gross national product ($ bil.)2/Real GNP ($ bil., 1958 prices).2/
Feb'69
"
29.08.77.8
1,70040.530.7
5.4101.46
29.08.27.6
1,84240.629.7
5.4102.04
27.47.97.3
1,53740.826.8
4.590.75
Jan'69 154.1 153.9 144.1
QIV'68 887.4 871.0 811.0" 718.4 712.3 681.8
5.710.6
7.1
10.6-0.714.318.611.8
13.929.917.3
48.00.5
27.030.316.1
* Based on unrounded data. 1/ Not seasonally adjusted.
7.0 11.5
9.4 15.55.4 7.7
I -- T - 1
2/ Annual rates.

I-- T- 2
SELECTED DOMESTIC FINANCIAL DATA
Week ended 4-week Last 6 months
March 22 average Hiah LowMoney Market 1/ (N.S.A.)
Federal funds rate (per cent) 9/U.S. Treas. bills, 3-mo., yield (per cent)U.S. Treas. bills, 1-yr., yield (per cent)Net free reserves 2/ ($ millions)Member bank borrowings 2/ ($ millions)
Capital Market (N.S.A.)Market yields (per cent)
5-year U.S. Treas. bonds 1/20-year U.S. Treas. bonds 1/Corporate new bond issues, Aaa adj. 8/Corporate seasoned bonds, Aaa 1/Municipal seasoned bonds, Aaa 1/FHA home mortgages, 30-year 3/
Common stocks, S&P composite series 4/Prices, closing (1941-43=10)Dividend yield (per cent)
New Security Issues (N.S.A., $ millions)Corporate public offerings 5/State & local govt. offeringsComm. & fin. co. paper (net change inoutstandings) 6/
Banking (S.A.)Total reserves 1/Credit proxy 1/ 10/Bank credit, total 6/
Business loansOther loansU.S. Govt. sec.Other securities
Total liquid assets 1/ 6/Demand dep. & currency 1/Time & sav. dep., commn. banks 1/Savings, other thrift instit. 6/Other 6/ 7/
6.856.006.17-719
775
6.426.277.576.945.02
99.633.17
6.686.066.25-637
785
6.426.217.256.774.917.99
98.603.19
6.856.226.38- 52
1,320
6.446.277.576.945.027.99
5.085.12
5.15-719
337
5.455.256.246.004.207.28
108.37 98.003.21 2.87
Change fromLatest 3-month year earlier
Amountmonth average Latest 3-month
month average
Apr. e/ 1,400Apr. e/ 750
Feb. '69 +1,052
1,361 408767 -568
+215 +1,609
288-526
+399
Annual rate ofOut- Change change from
Latest standings Latest 3-month Pre- 3 12month Latest month average ceding months months
month monthmonth ago ago($ billions) (per cent)
Fet,. '69 27" 294
" 3897
" 16("57
.18 -0.01 0.15
.8 -0.3 0.55.7 1.4 1.7
.7 1.2 1.1
.2 2.9 1.4
.8 -2.6 -1.1- - 0.3
704.6193.8201.0197.0112.8
-1.10.2
-1.51.2
-1.0
2.20.6
-0.30.61.2
-0.6-1.2
4.414.922.1
-51.7 -
-1.91.2
-8.97.3
-10.5
6.72.25.3
14.410.521.0
4.6
5.56.69.3
12.212.7-6.813.2
3.84.0
-1.83.9
13.6
N.S.A. -- not seasonally adjusted. S.A. -- Seasonally adjusted.
e. Estimated by F.R.B. 1/ Average of daily figures. 2/ Average for statementweek ending March 19. 3/ Latest figure is monthly average for Feb. 4/ End of weekclosing prices; yields are for Friday. 5/ Corporate security offerings include both
bonds and stocks. 6/ Month-end data. 7/ U.S. savings bonds and U.S. Government
securities maturing within 1 year. 8/ Adjusted to Aaa basis. 9/ Federal funds
data are 7-day averages for week ending Sunday: latest figure is for week endingMarch 23. 10/ Reflects $400 million reduction in member bank deposits resultingfrom withdrawal of a large country bank from System membership. Percentage annual
rates are adjusted to eliminate this break in series.

I-- T- 3
U.S. BALANCE OF PAYMENTS(In millions of dollars)
1967 1 9 68 1969Year YearP Ir f IIIr IVP Jan.P Feb.P
Seasonally adjusted
Goods and services, net 1/Trade balance 2/
Exports 2/Imports 2/
Service balance
Remittances and pensionsGovt. grants & capital 3/
4,7693,477
30,468-26,991
1,292
1,965103
33,376-33,273
1,864
29835
7,914-7,879
263
62244
8,379-8,335
578
-1,275 -1,159 -266 -286-4,211 -3,977* -1,164 -1,072
854243
8,835-8,592
611
193-219
8,248-8,467
412
U.S. private capitalDirect investmentForeign securitiesBanking claimsOther
Foreign capital, nonliquidOfficial foreign accounts
Long-term depositsU.S. Govt. liabilities
International and regionalorganizations 4/
Other 5/
-5,505-3,021-1,266
-459-759
3,1861,293
839454
2991,594
Errors and omissions
-4,860*-2,743*-1,288
254-1,083
8,3842,448
5241,924
-707-374-385
303-251
1,410334122212
-1,448-1,035
-83196
-526
2,485928148780
159 -98 -195,777 1,174 1,576
-195 -276 -483
Balances, with and without seasonal adjustment (- deficit)
Liquidity balance, S.A.Seasonal component
Balance, N.S.A.
Official settlements bal., S.A.Seasonal component
Balance, N.S.A. 6/
-3,571
-705 -182 55443 255 -488
158 -262 73 -433
-571 1,509661 54
-3,405 1,617 90 1,563
423-350
73
Reserve changes, U.S.A. (decrease -)
Total monetary reservesGold stockConvertible currenciesIMF gold tranche
-52-1,170
1,02494
880-1,173
1,183870
-9041,362
40157
137-22
-267426
1,076137575364
1/ Equals "net exports" in the GNP, except for latest revisions.2/ Balance of payments basis which differs a little from Census basis.3/ Net of scheduled and non-scheduled repayments.4/ Long-term deposits and Agency securities.5/ Includes some foreign official transactions in securities.6/ Differs from liquidity balance by counting as receipts (+) increase in liquid
liabilities to commercial banks, private nonbanks, and international institutions(except IMF) and by not counting as receipts (+) increases in certain nonliquidliabilities to foreign official institutions.
* Data for 1968 marked (*) strictly confidential until released by the Commerce Dept.** Not seasonally adjusted.Note. Details may not add because of rounding.
101,980
-1,970
-315 -293-938 -803*
-1,798-1,168
-323-200-107
1,833437129308
56
1,340
-908*-167*-497
-45-199
2,656749125624
2201,687
-151**384**
5** -19**133** 5**
89** 31**
419 145
990-210
780
256-365-109
-270 -544
1,358

II - 1
THE ECONOMIC PICTURE IN DETAIL
The Nonfinancial Scene
Gross national product. Overall activity appears likely to
be stronger this quarter and for the remainder of 1969 than we had
anticipated earlier, although real growth is still expected to be some-
what below the fourth quarter 1968 rate. The major factor is the upward
adjustment in planned spending by business for plant and equipment,
especially in the first quarter. A larger-than-expected recovery in
consumer spending from the weak yearend rate also has added to the
firming of the economic outlook. With final sales up sharply, the
inventory position of business has apparently improved and a lower rate
of inventory accumulation now seems likely this quarter. The increase
in current dollar GNP is now expected to total about $15 billion this
quarter, and with price increases continuing strong, the growth of real
GNP should edge down to under a 3 per cent annual rate.
In the second quarter, the GNP increase in both dollar and
real terms has been revised up to about the first quarter rate of
growth, although easing should become apparent in several sectors. A
smaller gain in business spending for fixed capital is called for after
the first quarter, the rise in consumption is likely to slow somewhat
in the upcoming period with only a relatively moderate increase antici-
pated in disposable income, and residential construction activity is
expected to turn downward as the tightening monetary conditions of
recent months begin to take effect. However, inventory accumulation is

II - 2
not expected to decline further. The easing indicated in these areas
of final sales will probably be offset in part by a sharp rebound of
exports following settlement of the protracted dock strike.
The sharp upward adjustment in anticipated expenditures for
business fixed investment reported in the February Commerce-SEC survey
appears to be generally confirmed by increased new orders for durable
goods and rising output in the machinery and equipment sectors. However,
the $5.8 billion increase in fixed capital outlays indicated for the
current quarter seems excessively large in comparison with recently
achieved quarterly gains. Typically in recent quarters, actual increases
in business spending have fallen $1 to $2 billion behind anticipated
levels, and we have assumed a similar shortfall this quarter, with the
remainder carried over as a small increase in the second quarter rather
than the dip indicated in the survey.
Our projections of consumption expenditures for the first
quarter has been increased also, reflecting mainly recently revised
retail sales figures. The new sales figures--the result of a revision
of the seasonal adjustment factors--indicate that January and February
sales had risen more from the fourth quarter than had been shown earlier.
Consumer spending is now expected to rise by about $10 billion this
quarter. With the rise in disposable income sharply curtailed by higher
social security taxes, the indicated gain in consumption is associated
with a marked drop in the savings rate from 6.8 to 6.0 per cent, the
lowest level for the figure since early 1966.

II - 3
The consumption picture remains mixed in a number of respects.
Total retail sales in February were only slightly higher than the 1968
high in September, but exclusive of autos, retail sales were up appre-
ciably since then. Unit auto sales for the first 20 days of March
suggest another dip after the February recovery; sales of domestic cars
for the quarter should average about 8.5 million units, down from 8.8
million in the fourth quarter of 1968. In addition, sales of foreign
cars have been curtailed by the dock strike. But sales of furniture and
appliances, which had been tending down for several months, rebounded
early in the year, and the nondurables goods group showed some recovery
from its weak end-of-year performance.
We anticipate that consumer spending will rise somewhat less
in the second quarter than in the first. Retroactive tax payments will
continue to dampen gains in disposable income, so that even the smaller
rise in consumption projected assumes a continuation of the relatively
low first quarter saving rate. Little further change in unit auto sales
is expected and gains in furniture and appliance sales are likely to be
more moderate.
Residential construction activity thus far has remained a
source of strength in the economy, with private housing starts expected
to exceed a 1.7 million annual rate in the current quarter, up about
120,000 from the fourth quarter of last year. But the current level of
starts probably involves some borrowing from the future, and mortgage
funds have become increasingly scarce. Thus, a dip in housing starts is

II - 4
still anticipated for the next quarter, though construction outlays--
which lag starts--are likely to decline only modestly.
A slower rate of inventory accumulation is indicated in this
period following last quarter's rather high rate, apparently reflecting
the greater-than-expected strength in final demands in conjunction with
some moderation in the rise in industrial output. As a result, business-
men would appear to have less incentive to trim inventories significantly
further, and we have projected little change in the rate of accumulation
in the second quarter.
Quarterly changes in GNP are being affected substantially by
erratic movements in net exports, reflecting the effects of the dock
strike. Net exports were reduced significantly to $1 billion in the
fourth quarter of 1968, and were apparently below this low level in the
current quarter. But, with the strike now largely over, a rebound is
expected at a rate of about $4-1/2 billion in the second quarter.
Federal purchases of goods and services are expected to be
kept generally within budget guidelines, and little increase is likely
in the first half of this year. But third quarter outlays will be
stepped up, mainly as a result of the pay raise for the military and
civilian employees. The budget surplus is expected to drop significantly
then, and the impact of fiscal policy on the economy will be somewhat
less restrictive, even assuming continuation of the surtax.
Given the same assumptions as to fiscal policy and monetary
restraint that underlay the last chart show presentation, we have revised
upward the projected increase in GNP for the second half. In significant

II - 5
measure this reflects upward adjustment of business spending in fixed
capital in response to the recent survey findings. Consumption also may
be expected to expand moderately faster after midyear as increasing
capital expenditures and a somewhat stronger employment picture boost
disposable income more than we had projected earlier. The main effects
of continued monetary restraint will be reflected in residential con-
struction activity, which is likely to fall significantly in the second
half, somewhat smaller increases in State-local capital spending than
projected earlier, and some shortfall in business investment below survey
findings. (Our current projection shows a year-over-year increase of
12 per cent in such outlays, versus the 13.9 per cent rise indicated by
the survey.)
As a result of these changes, GNP should be greater than we
had earlier expected--$925 billion for the year 1969 compared with $919
billion shown in the previous projection. This sharper expansion in GNP
implies a lesser moderation in activities and inflationary pressures than
we had hoped for. Real growth would average a little less than the first
half year rate of less than 3 per cent. We now think that the unemploy-
ment rate will not rise above 4 per cent this year and that the GNP
deflator will edge down only to about a 3-1/2 per cent rate of increase
by the final quarter of the year.

CONFIDENTIAL - FR
GROSS NATIONAL PRODUCT AND RELATED ITEMS(Quarterly figures are seasonally adjusted. Expenditures and income
figures are billions of dollars, with quarterly figures at annual rates)
1967 1968 1969 1968 1969 - ProjectedProi. III IV I II III IV
Gross National ProductFinal sales
Private
Personal consumption expendituresDurable goodsNondurable goodsServices
Gross private domestic investmentResidential constructionBusiness fixed investmentChange in business inventories
Nonfarm
Net Exports
Gov't purchases of goods & servicesFederal
DefenseOther
State & local
Gross national product inconstant (1958) dollars
GNP Implicit deflator (1958=100)
Personal incomeWages and salaries
Disposable incomePersonal saving
Saving rate (per cent)
Corporate profits before tax
Federal government receipts andexpenditures (N.I.A. basis)
ReceiptsExpendituresSurplus or deficit (-)
Total labor force (millions)Armed forcesCivilian labor force "Unemployment rate (per cent)
Nonfarm payroll employment (millions)Manufacturing
Industrial production (1957-59-100)Capacity utilization, manufacturing
(per cent)
Housing starts, private (millions A.R.)Sales new domestic autos (millions,
A.R.)
789.7783.6605.2
492.272.6
215.8203.8
114.324.683.6
6.15.6
860.6852.9655.7
533.882.5
230.3221.0
127.729.990.0
7.77.3
924.8917.7705.4
570.887.9
244.0238.9
138.831.0
100.77.16.9
871.0863.5663.9
541.185.1
232.7223.4
127.129.590.1
7.57.3
887.4876.8673.8
546.885.1
233.7228.0
136.631.694.310.6
9.7
902.5895.1688.6
556.986.5
238.0232.4
138.632.798.5
7.46.7
917.0910.0701.0
565.087.0
241.3236.7
138.431.999.5
7.07.0
932.5925.5710.5
575.688.5
246.0241.1
138.630.1
101.57.07.0
4.8 2.0 2.9 3.3 1.0 0.5 4.6 3.3
178.490.672.418.287.8
197.2100.0
78.921.197.2
212.3104.181.622.5
108.2
199.6101.2
79.621.598.4
203.0101.7
80.021.7
101.2
206.5102.580.322.2
104.0
209.0102.280.521.7
106.8
215.0105.482.722.7
109.6
947.0940.0721.5
585.689.5
250.6245.5
139.629.1
103.57.07.0
3.3
218.5106.082.923.1
112.5
673.1 706.7 729.5 712.3 718.4 723.2 727.7 731.2 736.1117.3 121.8 126.8 122.3 123.5 124.8 126.0 127.5 128.7
628.8423.4546.3
40.27.4
685.8463.5589.040.7
6.9
738.9502.9624.138.0
6.1
694.3469.0592.7
37.16.3
708.2479.0602.440.9
6.8
81.6 92.3 94.8 92.7 95.8
151.2163.6-12.4
176.9182.2
-5.3
198.3194.24.1
80.8 82.3 84.03.4 3.5 3.5
77.3 78.7 80.53.8 3.6 3.6
182.1184.9
-2.8
82.43.6
78.83.6
187.1186.9
0.2
82.63.5
79.13.4
720.5489.8608.636.3
6.0
732.5498.5617.737.66.1
745.5507.2630.739.8
6.3
757.0516.0639.438.3
6.0
93.8 94.3 95.3 95.8
195.8190.05.8
198.5191.3
7.2
83.7 83.93.5 3.580.2 80.43.3 3.5
198.3196.9
1.4
200.8198.7
2.1
84.1 84.33.5 3.5
80.6 80.83.7 3.8
66.0 68.1 70.3 68.3 69.0 69.8 70.1 70.4 70.719.4 19.7 20.0 19.8 19.9 20.1 20.0 19.9 19.9
158.1
85.3
164.7 171.5 165.2 167.4
84.5 83.3 84.0 84.2
1.29 1.51
7.57 8.62
1.49
8.67
1.55
9.01
1.60
8.82
169.5 171.2 171.9 173.0
84.0 83.5 83.0 82.6
1.72
8.47
1.53
8.50
1.35
8.75
1.35
8.95
II- 6 March 26, 1969

CONFIDENTIAL - FR
CHANGES IN GROSS NATIONAL PRODUCTAND RELATED ITEMS
1967 1968 1969 1968 1969 - ProjectedProj. III IV I II III IV
----------------- In Billions of Dollars---------------------
Gross National ProductInventory changeFinal sales
PrivateGovernment
GNP in constant (1958) dollarsFinal sales
Private
42.1-8.650.828.622.2
70.91.6
69.350.518.8
16.0 33.624.0 32.49.8 23.9
64.2-0.664.849.715.1
22.824.119.4
18.1-3.221.417.53.9
16.43.1
13.39.93.4
8.9 6.112.0 3.211.1 2.1
15.1-3.218.314.8
3.5
14.5-0.414.912.4
2.5
15.50.0
15.59.56.0
4.8 4.5 3.5 4.98.3 5.1 3.3 4.76.9 4.5 2.2 3.6
-------------------- In Per Cent Per Year--------------------
Gross National ProductFinal sales
Private
5.6 9.0 7.5 8.5 7.56.9 8.8 7.6 10.2 6.25.0 8.3 7.6 10.8 6.0
6.8 6.4 6.8 6.28.3 6.7 6.8 6.38.8 7.2 5.4 6.2
Personal consumption expendituresDurable goodsNondurable goodsServices
Gross private domestic investmentResidential constructionBusiness fixed investment
Gov't. purchases of goods & servicesFederal
DefenseOther
State & local
GNP in constant (1958) dollarsFinal sales
PrivateGNP implicit deflator
Personal incomeWages and salaries
Disposable income
Corporate profits before tax
Federal government receipts andexpenditures (N.I.A. basis)
ReceiptsExpenditures
Nonfarm payroll employmentManufacturing
Industrial productionHousing starts, privateSales new domestic autos
8.513.6
6.78.4
10.020.2
7.98.6
-5.4 11.7 8.7 -0.6 29.9 5.9 -0.6 0.6-0.8 21.5 3.7 0.0 28.5 13.9 -9.8 -22.62.8 7.7 11.9 14.3 18.6 17.8 4.1 8.0
14.217.119.58.3
11.4
2.43.71.93.1
10.510.49.015.910.7
5.04.9,4.53.8
7.74.13.46.6
11.3
3.23.43.54.1
8.0 6.84.8 2.03.0 2.09.5 3.7
11.7 11.4
5.0 3.46.9 1.88.2/ 1.53.4- 4.1
6.93.11.59.2
11.1
2.74.74.94.1
4.8-1.2
1.0-9.010.8
2.62.83.23.9
11.512.510.918.410.5
1.91.81.524.8-/
2.9-13.3
7.9
6.52.31.07.0
10.6
2.72.62.53.5
7.2 9.1 7.7 9.6 8.0 6.9 6.7 7.1 6.27.3 9.5 8.5 10.0 8.5 9.0 7.1 7.0 6.96.8 7.8 6.0 4.4 6.5 4.1 6.0 8.4 5.5
-4.7 13.1 2.7 1.7 13.4 -8.3 2.1 4.2 2.1
5.7 17.0 12.1 23.5 11.0 18.6 5.5 -0.4 5.014.9 11.4 6.6 6.6 4.3 6.6 2.7 11.7 3.7
3.1 3.2 3.2 2.9 4.1 4.6 1.7 1.7 1.71.0 1.5 1.5 2.0 2.0 4.0 -2.0 -2.0 0.0
1.2 4.2 4.1 2.4 5.3 5.0 4.0 1.6 2.610.9 16.3 -1.4 29.7 12.9 29.7 -45.8 -45.9 0.0-9.7 13.9 0.5 27.3 -8.4 -15.9 1.5 11.8 10.0
1/ Excluding Federal pay increase,2/ Excluding Federal pay increase,
2.8 per cent per year.3.7 per cent per year.
14.50.0
14.511.03.5
II - 7 March 26, 1969

II - 8
Industrial production. The rate of growth in total industrial
production from December 1968 to February 1969 was considerably smaller
than during the latter part of 1968. As may be seen in the table, the
smaller rate of overall growth resulted from widespread slowing in
growth of production. A major exception was the faster increase in
output of home goods. Production of defense equipment did not decline
quite as sharply as earlier, but auto assemblies were reduced far more
than in late 1968.
INDUSTRIAL PRODUCTION
Per centchange
Dec. 1967to
Dec. 1968
Total indexConsumer goodsAutosHome goodsApparel & staples
Business equipmentDefense equipmentDurable materials
Iron & s teelConstruction materialsNondurable materials
4.14.6
- 0.36.74.24.1
- 3.32.7
-11.74.95.4
Per cent changeannual rates
Sept. 1968 Dec. 1968to to
Dec. 1968 Feb. 1969
8.7 2.87.1 3.4
- 8.4 -27.310.8 16.26.9 1.6
12.1 9.1-19.6 -16.815.6 5.368.8 15.29.6 6.42.5 - 2.0
Auto assemblies thus far in March have been running at an
annual rate of 8.4 million units, the same as in February, and pre-
liminary output schedules for the second quarter are set at about an
8.5 million unit rate. In view of the recovery in new private housing
I

II - 9
starts, output of home goods may expand further but at a slower rate than
in the December to February period. Production of business equipment is
expected to continue to increase rapidly, and the sharp decline in defense
equipment--due in part to a strike--should moderate or level off. Steel
production rose further in March, but the rate of increase in the second
quarter should slow considerably as inventories at steel mills have been
about built up again--by the end of January, such stocks were up 20 per
cent from the liquidation low at the end of July 1968.
On balance, it is expected that industrial production in March
and during the second quarter will continue to rise, probably at around
the long-run average annual rate of 4 per cent. This would be less than
half the rate of increase from September to December 1968, but somewhat
more than in the opening months of the year.
Capacity utilization. The February rate of manufacturing
capacity utilization was estimated to be 84.1 per cent, down only
slightly from 84.2 per cent the previous month. Little change is ex-
pected in March.
The recent Commerce-SEC plant and equipment survey indicates
that manufacturers anticipate investment outlays in 1969 totaling 16 per
cent above 1968. If their investment plans are realized, the estimated
manufacturing capacity growth rate would increase from the estimated
5.8 per cent of 1968 to about 6.5 per cent in 1969. This would still
be slightly below the rates of growth which prevailed in 1965 and 1966.

II - 10
The pattern of industry operating rates was little changed in
early 1969. Recent utilization rates have been quite high in the rubber,
nonferrous metals and paper industries, and above normal in aircraft,
motor vehicles, petroleum, and textiles. Producers of most other manu-
factured products have appreciable amounts of unused capacity.
UTILIZATION RATES(Per cent)
Industry 1967 1968QIV QI QII QIII QIV Dec. Jan. Feb.
Manufacturing 84.8 84.9 84.8 84.0 84.2 84.4 84.2 84.1
Primary processingindustries 85.6 85.5 86.5 84.6 85.5 86.1 86.3 86.1
Advanced processingindustries 84.3 84.4 83.6 83.5 83.3 83.2 82.7 82.6
Retail sales. Recently revised data indicate that total
retail sales have shown a small net increase since September. On the
basis of the newly revised seasonals, February retail sales are indicated
to be unchanged from the new high reached in January at a level only a
little above that of last September. When deflated by the all commodity
retail price index, the new January-February level was down 1 per cent
from September. (Prior to revision of the seasonal factors, the retail
sales series had reached a 1968 high in August--rather than in September--
and the advance figures for January had suggested a decline from August
rather than the new high now shown.

II - 11
It should be noted, however, that retail sales exclusive of
the automotive group were appreciably larger in February than last
September, as may be seen in the table. Sales of durable goods stores
have trended downward since September as a result of a downdrift in
auto sales. Auto sales might have been higher in February if the dock
strike had not affected sales of foreign cars, by perhaps as many as
30,000 units. Sales of new domestic autos rose in the second ten days
of March. For the first 20 days, sales were at a seasonally adjusted
annual rate of about 8.3 million units, up 6 per cent from the corres-
ponding period in February but down 3 per cent from a year earlier.
Dealers' stocks changed seasonally in the first ten days of March at
the advanced level first reached last November which is about one-fifth
above a year earlier.
Sales of durable goods other than automobiles remained more
or less on a plateau in the latter part of 1968. In the first 2 months
of this year, however, they rose to a level 2.3 per cent above the second
half of 1968 as furniture and appliance sales strengthened.
Nondurable goods sales rose in February to a level close to
1 per cent above their November 1968 peak. After a very strong rise in
early 1968, most nondurable categories had changed little during the
second half of the year.

II - 12
RETAIL SALES
February 1969 Percentage Change to February from:(millions $) January September
1969 1968
Total 29,021 0.0 0.4Total, less
automotive 23,537 0.4 2.3Durables 9,355 - 1.3 - 3.4Durables, less
automotive 3,871 - 0.6 2.2Nondurables 19,666 0.6 2.3
Total, adjusted forprice changes* 24,636 - 0.4 - 1.0
* Deflated by the all-commodity component of the CPI.
Consumer credit. The increase in instalment credit outstanding
during February may be somewhat larger than the $7.7 billion rise
(seasonally adjusted annual rate) in January, according to an estimate
based on a limited number of reports from commercial banks. However,
it is expected to be well below the monthly increase in late 1968. In
January, credit extensions advanced moderately with the increase centered
in automobile and personal loans; repayments rose substantially in
nearly all categories and were at a record high.
On the surface, the January increase in auto credit extensions
appears to be at odds with the decline in unit sales of new cars reported
for the month. Part of the disparity is accounted for by a rise in the
proportion of new cars (including imported models) sold on credit. After
allowance for seasonal factors, the January rate of credit sales--nearly

II - 13
72-1/2 per cent--was 6 percentage points above the fourth quarter rate
and nearly 3 points above the relatively high year-earlier month. For
the full year 1968, approximately 2 of every 3 new cars sold were
financed. During their recent meeting at the Board, members of the
Consumer Bankers Association reported that loan applications for auto
purchases this winter have been more typical of the marginal type usually
encountered late in the summer and near the end of the model year. This
suggests that the widespread dealer sales contests during January and
February led to credit purchases of new cars that normally would not
have been made at this time of the year.
Another factor that bolstered auto credit extensions in January
was a further increase in the size of the average note written for both
new and used cars. The seasonally adjusted increase of more than $20
in average new car notes from December to January may reflect the higher
sticker prices associated with mandatory installation of certain safety
features, since contract terms--both down-payment and maturity--were
little changed. On the other hand, larger used car notes may be due
to higher financing charges resulting from a 2 percentage point rise
in the proportion of contracts over 30 months in length (from 44.8 per
cent in December to 46.8 per cent in January), and an increase in the
proportion of low down-payment contracts (from 28.3 per cent to 31.2 per
cent). Seasonally adjusted used car prices were about unchanged from
December to January.

II - 14
Extens(Billions o
Annual
1968: IIIIIIIV
1969: Jan.
1968: IIIIIIIV
1969: Jan.
AUTOMOBILE INSTALMENT CREDIT DEVELOPMENTS(Seasonally adjusted)
Lons Number financed)f dollars) Average note (Millions of units)rate (Dollars) Annual rate
NEW CARS
Per centfinanced
18.4 2975 6.2 68.718.7 3000 6.2 66.920.0 3032 6.6 64.520.1 3065 6.6 66.2
20.7 3095 6.7 72.3
USED CARS11.111.011.611.4
11.4
1553156715761585
1616
Changes in other key components of consumer credit have been
mixed this winter. Loan extensions and repayments for consumer goods
other than autos have fluctuated in a narrow range since October;
personal loan extensions, after a sharp drop in November have returned
close to the October peak, and repayments reached a new high in January.
The Michigan Survey of Consumer Demand. The index of consumer
sentiment rose significantly in February 1969, primarily as a result of
an increase in the number of families expecting business conditions to
improve in the next 12 months. In the past, changes in response to
this question have been a better indicator of cyclical changes in demand

II - 15
than the other 4 attitudinal questions used to compute the index of
sentiment. The rise in the February index follows 2 surveys which
reported almost no change, and moves the level back to that of February
1968. Intentions to purchase automobiles are also at about the same
level as 12 months ago.
INDEX OF CONSUMER SENTIMENT(February 1966 = 100)
1968: February 95.0May 92.4August 92.9Nov.-Dec. 92.1
1969: February 95.1
Regular, as well as special one-time, survey questions suggest
that the improvement in consumer attitudes is still associated with some
ambivalence. Thus, despite an increased number of families expecting
an improvement in general business conditions, there was an unusually
large number who expected an increase in unemployment during the year.
Moreover, respondents were aware of higher interest rates and generally
thought that the higher rates would be bad for business. The Survey
Research Center suggests that the overall optimism may reflect faith
in the new Administration's economic policies and less concern with
international problems.
Moreover, despite the acceleration in price increases--and
the very large number of families reporting that their higher money

II - 16
incomes were offset by higher prices--there was a decrease in inflationary
expectations and fewer unsolicited complaints about prices. Generally,
families thought that it was a better time to buy large household goods,
cars, and houses than in the previous survey. Although consumers ex-
pected the surtax to be extended, 84 per cent of the households inter-
viewed thought that even with price increases they would be at least
as well off a year from now--the highest percentage since November 1965.
Surveys condJanuary-Febi
196419651966196719681969
INTENTIONS TO BUY CARS DURING NEXT 12 MONTHS(Percentage of family units)
Lucted in All Newiuary of: Cars Cars
15.1 8.017.8 10.818.6 10.517.3 9.717.2 9.017.5 9.2
Personal income. The increase in personal income was sharp
in February--$5.3 billion, at an annual rate. Wage and salary payments
increased $4.2 billion, reflecting large employment and wage rate in-
creases, with all major industry divisions contributing to the advance.
In addition to the strong February gain, the estimated January payroll
increase was revised up to $3.2 billion from the $2.4 billion reported
last month.
On average, the rate of growth of wage and salary payments
appeared to be slightly stronger in early 1969 than during late 1968.
UsedCars
7.17.08.17.68.28.3

II - 17
The acceleration occurred in the nonmanufacturing activities. In
manufacturing, increases in wage rates and employment have been offset
to some extent by small but steady reductions in average hours of work.
Income increases from other sources were mostly in line with late 1968
patterns.
On the average, gross personal income rose at an annual rate
of nearly $5 billion in January and February, continuing the pattern of
stronger-than-expected income, output, and employment gains. But,
because of the January increase in Social Security taxes (which are
deducted from wage disbursements before calculating personal income)
the increase of personal income in the first quarter of 1969 is likely
to be slightly smaller than in late 1968.
Leading indicators. The preliminary Census composite index
of selected leading indicators increased to a new high in February.
Component series increasing in February were nonagricultural placements,
durable goods new orders, building permits for private housing, in-
dustrial materials prices, and the ratio of price to unit labor cost
in manufacturing. Stock prices, the manufacturing workweek, and
contracts and orders for plant and equipment declined.

II - 18
COMPOSITE CYCLICAL INDICATORS1963 = 100
12 Leading 5 CoincIndicators Indica
144.0
143.6
144.6
identtors
160.2
162.1
163.3
6 LaggingIndicators
168.7
170.8
174.3
January
February p
The leading
of the five are below
the kind of downtrend
indicator subgroups remain at high levels; three
their early 1966 highs, but none of them now shows
that characterized all five throughout 1966.
Inventories. In January, the book value of manufacturing and
trade inventories rose at a pace considerably below the fourth quarter
average. Durable manufacturers continued to build inventories, especially
in the machinery and equipment industries. Inventories declined at non-
durable manufacturers, and trade inventories also declined, as a decrease
at wholesale more than offset a small increase at retail. Inventory-sales
ratios declined in manufacturing and trade, giving reason to anticipate
continued inventory building over the first half of the year, although
probably at rates somewhat lower than in the fourth quarter of 1968.
1968:
October
November
December
1969:
144.0
145.7
164.6
166.3
177.9
181.5
I - -

II - 19
Manufacturing
ManufacturinDurableNondurable
Wholesale trRetail tradeDurableNondurable
INVENTORY CHANGE (BOOK VALUE)(Seasonally adjusted, millions of dollars)
1968 QIV(Monthly average)
and trade, total 1,045
ig 490321169
ade 144411280131
At retail , stock-sales ratios dropped back to around their
November levels, which were moderate for nondurables and relatively
high for durables. (For comparison, the table shows the monthly
averate ratios for 1964, before the Vietnam build-up, and the December
1966 ratios that preceded 1967's inventory slowdown.) In February,
stocks of domestic autos were reduced somewhat but were still high in
relation to sales.
19691969January
282
326457-131-12783
161- 78

II - 20
SELECTED INVENTORY RATIOS
1964annual 1966 1968 1969average Dec. Nov. Dec. Jan,
Inventories to SalesManufacturing, total 1.64 1.72 1.67 1.72 1.68
Durable 1.88 2.00 1.98 2.07 1.97Nondurable 1.38 1.37 1.30 1.31 1.32
Home goods and apparel 1.74 1.98 2.15 2.07 1.93
Retail trade, total 1.40 1.51 1.47 1.50 1.47Durable 1.87 2.11 2,08 2.11 2.07Nondurable 1.19 1.22 1.19 1.21 1.18
Inventories to Unfilled ordersDurable manufacturing, total .71 .64 .69 .68 ,69Defense products industries .29 .30 .35 .35 .35Machinery & equipment industries .66 .58 .63 .66 .64
Manufacturing, total: Materials held and ordered to --Sales of end products 1.79 2.08 1.79 1.86 1.80Unfilled orders for end products 1.11 1.07 .99 .98 .98
At the time of the OBE quarterly survey in February, durable
goods manufacturers anticipated that they would increase inventories
faster than sales in both the first and second quarters. There was a
sharp decrease in the proportion of durables manufacturers who reported
that their inventories at the end of the previous quarter were too high
relative to sales and unfilled orders. This may have resulted partly
from a change in the questionnaire which may increase the tendency of
reporters to record their inventory level as "about right," but it
would also appear to be consistent with January's declines in some of

II - 21
the inventory ratios, including those for materials. For example,
inventories of steel mill shapes at producing mills and manufacturing
consumers at the end of January were at a reduced level in relation to
January's high level of steel use in manufacturing.
Nondurable manufacturers projected inventory increases in
line with sales. There has been some decrease in the proportion of
nondurable manufacturers considering their inventories low; though this
could reflect the questionnaire change, it seems consistent with the
recent increase in their inventory-sales ratio.
New orders for durable goods. The reported strength in new
and unfilled orders for durable goods in January and February also
supports the prospect that durable goods manufacturers are likely to
add to their inventories in coming months. In total, durable goods
orders rose 3 per cent in February and were above last October's peak.
As in October, a significant amount of the increase was in defense
orders. Fabricated metals orders recovered somewhat but were still
below last autumn's highs.
NEW ORDERS FOR DURABLE GOODS(Seasonally adjusted, billions of dollars)
1968 QIV(Monthly average)
Total durable manufacturers 29.7
Iron & steel 2.0Motor vehicles & Parts 4.2Consumer durables (exc. autos) 2.0Machinery and equipment 6.3Defense products industries (old series) 4.2All other durable manufacturers 11.0
Defense products (new series) 2.2
1969Jan. Feb.
29.7 30.7
2.1 2.14.2 4.22.1 2.26.2 6.34.0 4.6
11.1 11.3
1.8 2.5-

II - 22
Machinery and equipment orders and backlogs continued at high
levels, and the anticipated second-half increase in plant and equipment
expenditures raises the possibility of further increases, rather than
decreases, in capital goods orders. Although inventory-backlog ratios
for business and defense equipment seem quite high, these industries
usually continue building inventories until after their backlogs have
leveled off or declined.
Construction and real estate. Outlays for new construction
put in place, which were revised upward by 2 per cent for January to
$89 billion, changed little in February, according to preliminary
Census Bureau estimates. Residential construction, bolstered by an
exceptionally strong starts performance in recent months, continued
close to previous highs at a level 15 per cent above a year earlier.
Outlays for commercial, industrial and other nonresidential structures
also apparently changed little, after a sharp upward revision to a
record rate in January.
Expenditures for public construction--though also little
changed in February--were 3 per cent below their advanced year-earlier
rate, reflecting in part slowing in State and local activity much of
which is dependent on Federal financial assistance. With borrowing
difficulties also apparently an increasingly limiting factor, new State
and municipal construction projects reaching the architectural stage so
far this year have been averaging about 7 per cent below a year earlier
according to the Engineering News-Record.

II - 23
NEW CONSTRUCTION PUT IN PLACE(Confidential FRB)
February 1969 Per cent change from($ billions)1/ January 1969 February 1968
Total 88.8 - + 6
Private 61.3 - + 11Residential 30.7 -- + 15Nonresidential 30.5 -- + 7
Public 27.5 -- - 3
1/ Seasonally adjusted annual rates; preliminary. Data for the mostrecent month (February) are confidential Census Bureau extrapola-tions. In no case should public reference be made to them.
Seasonally adjusted housing starts dropped in February as
expected. But the decline was associated with some upward revision
(to an annual rate of 1.84 million units) in the already unusually
high January rate and left the February rate at 1.7 million units, still
moderately above the advanced fourth quarter average. Although multi-
family starts also shared in the February decline, the rate remained
particularly high, at a level more than 50 per cent above the reduced
year-earlier level. The February decline in total starts was quite
general, but the rate in the North Central states actually rose further
to a new peak for the Census series which began in 1959.
Unlike starts, seasonally adjusted building permits turned
upward again in February and exceeded the recent high reached last
December. Partly reflecting the greater ability of multifamily
builders to negotiate required financing under recent market conditions,
all of the February rise in permits was concentrated in multifamily units.

II - 24
These not only climbed to a new high but also accounted for a record
share--56 per cent--of total permits in permit-issuing areas. Until
last January multifamily permits had never accounted for as much as
half of the total.
PRIVATE HOUSING STARTS AND PERMITS
February 1969(Thousands Per cent change fromof units)1 / January 1969 February 1968
Starts 1,700 - 8 +11
1-family 982 - 7 - 92-or-more-family 718 - 9 +55
Northeast 211 -29 + 3North Central 594 + 8 +39South 670 -12 + 5West 225 - 4 -17
Permits 1,506 + 7 + 8
1-family 661 - 1 - 92-or-more-family 845 +15 +26
1/ Seasonally adjusted annual rates; preliminary.
Despite the February upturn in building permits and the very
large backlog of commitments still outstanding, some further drop in
the rate of starts seems likely for March on technical as well as other
grounds. Even so, with January-February already at a combined 1.77 million
rate, indications now are that starts will hold at or above 1.70 million
average for the first quarter as a whole.

II - 25
Looking toward the spring quarter, availability of labor and
materials--particularly lumber--should combine with financing problems
to limit the normal seasonal rise of about three-fifths typical for the
seasonally unadjusted series at this time. Nevertheless, pressures on
builders to attempt to maintain schedules in response to pent-up shelter
demands will also continue to be a significant factor in these develop-
ments. In January, the latest month for which data are available, such
demands remained quite strong in the face of both higher interest rates
and other costs. In that month, stocks of new homes offered by specula-
tive builders turned downward again as sales of these homes held near
their advanced December rate. Sales of used homes, moreover, averaged
a sixth above the improved year-earlier level, with prices of the mix
of homes sold running 7 per cent more than in January of 1968.
Business fixed capital spending. Outlays for new plant and
equipment in 1969 will total $73 billion--$9 billion, or 13.9 per cent,
more than last year--according to the Commerce-SEC survey of business
plans in February. Plans for 1969 as reported in this survey are about
3.5 per cent higher than indicated in the unpublished and confidential
Commerce-SEC survey taken in December. In 1968, business plant and
equipment spending was 3.9 per cent above 1967, but little if any
higher in real terms.
The relatively large year-to-year increase now indicated for
1969 includes a very large rise in the current quarter--$5.8 billion,
annual rate, or almost 10 per cent. (The $5.8 billion increase being

II - 26
planned in February for the first quarter compares with last November's
planned increase of $3.9 billion.) A decline in outlays is planned in
the second quarter and then a rise in the last half of the year. Total
spending in the July-to-December period would be 4.8 per cent above
the total for the first half of the year.
The Commerce-SEC plant and equipment investment surveys have
almost always correctly indicated the direction of change in such spend-
ing but not always the exact magnitude of the change. And recent ex-
perience suggests that the very large rise indicated for the first
quarter may not be realized. Fixed capital outlays in the final quarter
of last year were up only $2.7 billion, although November plans had
indicated an increase of $3.8 billion, which in turn had exceeded
August plans by $1.3 billion. The short-fall of actual spending from
that being planned about midway in the quarter had been $1.6 billion
in the third quarter last year and $1.9 billion in the second quarter.
Increases in outlays now planned for 1969 by major industry
groupings range upward from 7 per cent for the "commercial and other"
category to nearly 30 per cent for railroads. Manufacturers--which
generally account for more than two-fifths of total spending--anticipate
a rise of almost 16 per cent, and this sharp increase contrasts with
declines of about 1 per cent last year and also in 1967.
Following the large rise anticipated for the first quarter,
second quarter plans indicate only a moderate increase by nondurable
II - 27
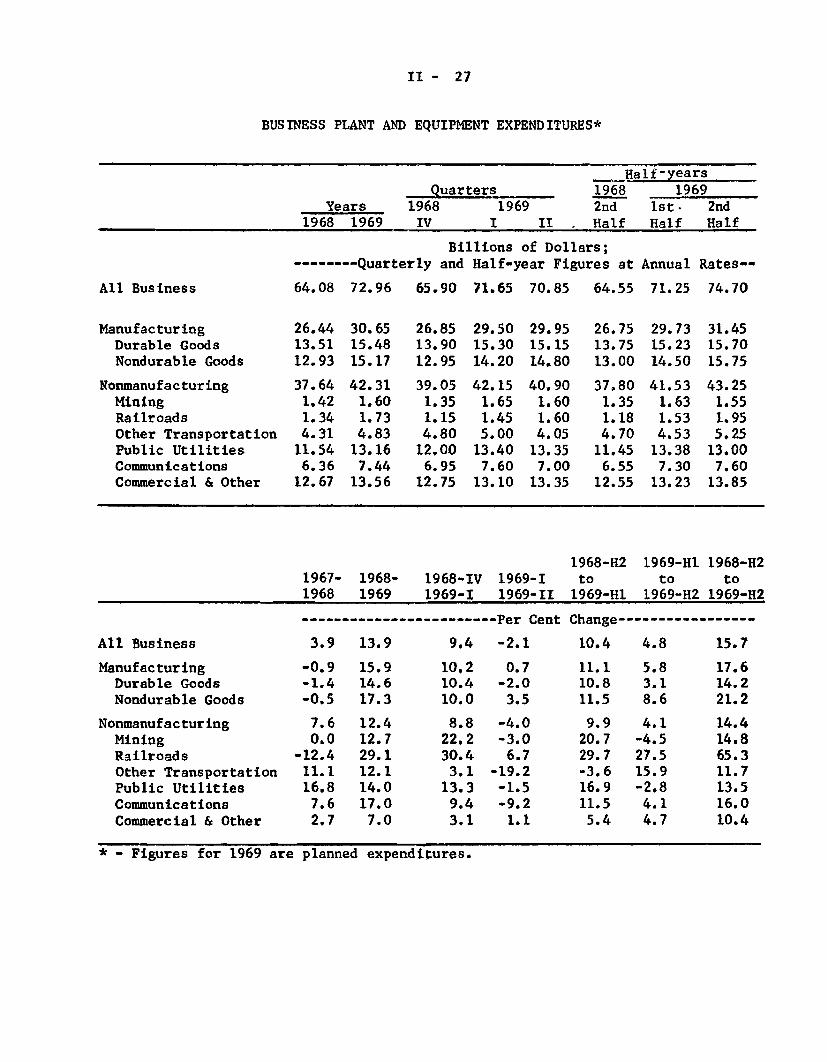
BUSINESS PLANT AND EQUIPMENT EXPENDITURES*
Half-yearsQuarters 1968 1969
Years 1968 1969 2nd 1st. 2nd1968 1969 IV I II . Half Half Half
Billions of Dollars;--------Quarterly and Half-year Figures at Annual Rates--
All Business 64.08 72.96 65.90 71.65 70.85 64.55 71.25 74.70
Manufacturing 26.44 30.65 26.85 29.50 29.95 26.75 29.73 31.45Durable Goods 13.51 15.48 13.90 15.30 15.15 13.75 15.23 15.70Nondurable Goods 12.93 15.17 12.95 14.20 14.80 13.00 14.50 15.75
Nonmanufacturing 37.64 42.31 39.05 42.15 40.90 37.80 41.53 43.25Mining 1.42 1.60 1.35 1.65 1.60 1.35 1.63 1.55Railroads 1.34 1.73 1.15 1.45 1.60 1.18 1.53 1.95Other Transportation 4.31 4.83 4.80 5.00 4.05 4.70 4.53 5.25Public Utilities 11.54 13.16 12,00 13.40 13.35 11.45 13.38 13.00Communications 6.36 7.44 6.95 7.60 7.00 6.55 7.30 7.60Commercial & Other 12.67 13.56 12.75 13.10 13.35 12.55 13.23 13.85
1968-H2 1969-H1 1968-H21967- 1968- 1968-IV 1969-I to to to1968 1969 1969-I 1969-II 1969-H1 1969-H2 1969-H2
------------------------ Per Cent Change----------------
All Business 3.9 13.9 9.4 -2.1 10.4 4.8 15.7
Manufacturing -0.9 15.9 10.2 0.7 11.1 5.8 17.6Durable Goods -1.4 14.6 10.4 -2.0 10.8 3.1 14.2Nondurable Goods -0.5 17.3 10.0 3.5 11.5 8.6 21.2
Nonmanufacturing 7.6 12.4 8.8 -4.0 9.9 4.1 14.4Mining 0.0 12.7 22.2 -3.0 20.7 -4.5 14.8Railroads -12.4 29.1 30.4 6.7 29.7 27.5 65.3Other Transportation 11.1 12.1 3.1 -19.2 -3.6 15.9 11.7Public Utilities 16.8 14.0 13.3 -1.5 16.9 -2.8 13.5Communications 7.6 17.0 9.4 -9.2 11.5 4.1 16.0Commercial & Other 2.7 7.0 3.1 1.1 5.4 4.7 10.4
* - Figures for 1969 are planned expenditures.

II - 28
goods manufacturers and declines by most other industry groups, in-
cluding durable goods producers. Spending by most industry groups in
the last half of the year will rise moderately, according to February
plans.
Manufacturing and public utility firms reported that the value
of their new projects started in the final quarter of last year (net of
cancellation) exceeded their capital expenditures on projects underway.
The value of new projects started in the fourth quarter by public
utilities rose sharply, totaling more than at any time since the beginn-
ing of 1963, when the series began. New projects started by manufacturers
declined a little following a very sharp rise to a record high in the
third quarter. For both manufacturers and public utilities the amounts
still to be spent on investment projects already underway were at all-
time highs at the end of December.
Manufacturing companies owning 47 per cent of fixed assets
in manufacturing at the end of 1968 reported the need for more facilities.
The greatest need was reported by nondurable manufacturers. This 47 per
cent proportion is still below the 51 per cent figure in the first quarter
of 1966, but it is the highest porportion since the end of that year and
reflects the third successive increase. Producers with 48 per cent of
fixed assets in manufacturing viewed their facilities as "about adequate"
for 1969 sales requirements.

II - 29
Labor market. Employment posted another sharp advance in
February, wages and personal income rose considerably, and the un-
employment rate continued at a 15-year low of 3.3 per cent. Job
gains were especially large in the nonmanufacturing industries, but
in manufacturing increases (after allowance for strikes) were not
as brisk as they had been in other recent months. Also the factory
workweek was again down slightly.
Employment. Nonfarm employment increased by 380,000 in
February, continuing the recent pattern of accelerated growth.
Since September, employment has increased by 1.6 million (seasonally
adjusted) or by an average monthly rise of 325,000. From January
1968 to September 1968, monthly employment gains had averaged 166,000.
In part, employment increases in recent months appear to be
attributable to the retention of workers who would normally be laid-
off during the winter and rehired over the spring months. In con-
struction, for example, the usual sharp seasonal employment decline
failed to occur in February and the seasonally adjusted employment
figure rose by 110,000 to 3.5 million, a new high. However, further
large employment gains in construction may be limited by sharply
rising costs, mortgage fund limitations, and a shortage of skilled
construction workers.
Manufacturing employment continued to rise in February, but
less strongly than in other recent months. After allowance for the
return of petroleum workers on strike the previous month, the
increase was about 37,000. Growth rates slowed in primary metals,

II - 30
machinery and fabricated metals--the industries that had contributed
heavily to the earlier pick-up. The construction-related lumber and
stone, clay and glass industries also added fewer employees in
February than they had in other recent months and employment
declined somewhat in apparel.
The average workweek of production workers in manufacturing
edged down to 40.5 hours in February, for a total reduction of 0.6
hours from September 1968. Over the last several months, aggregate
production worker manhours have risen very little because the steady
easing of the workweek has offset much of the rise in employment.
In fact, manhours of work have declined in consumer goods but have
been offset by a pick-up in the producers' goods industries. On an
industry basis, manhours have declined in autos, apparel, textiles,
printing, and petroleum (due to the strike). Reflecting the rise in
plant and equipment expenditures, manhours have continued to increase
in fabricated metals, primary metals and machinery.
MANUFACTURING MANHOURS, EMPLOYMENT AND HOURSPercentage Changes
(Seasonally adjusted)
Production October 1968 to December 1968 toworkers December 1968 February 1969
Employment 1.0 0.4
Average weekly hours -0.7 -0.5
Manhours 0.3 0.1

II - 31
Wages. In February, the hourly earnings of workers on
private nonfarm payrolls averaged $2.96, an increase of 6.5 per
cent from a year earlier. This was smaller than the year-to-year
gains of 7.3 per cent in the last three months of 1968. In manu-
facturing, hourly earnings in February averaged $3.12, an increase of
6.1 per cent from a year earlier.
Labor force and unemployment. The rapid expansion in the
civilian labor force which began late last year continued in February.
With demands for labor strong and widespread, labor force growth was
equaled by employment gains and the unemployment rate held steady at
3.3 per cent.
Unemployed workers totaled 2.9 million in February. Nearly
one-fourth of these workers wanted part-time jobs only and the
majority of the jobless had been unemployed for less than 5 weeks.
Adult unemployment usually reaches its seasonal peak in February but
with the labor market very tight and demand still strong, layoffs
apparently have been smaller and less widespread than usual this
winter. Jobless rates for worker groups most likely to be laid-off
during seasonal slowdowns--construction workers, laborers, and
nonwhite men--have dropped this winter and the layoff rate in
manufacturing has been very low in recent months.
Collective bargaining. Relatively few major wage settle-
ments have been concluded in the first quarter, but approximately 1.2
million workers received deferred wage increases provided by major
contracts negotiated in 1968 or earlier years. The deferred increases

II - 32
were relatively smaller than recently negotiated increases and went
mainly to railroad workers (2 per cent) and to workers at glass and
can factories (4 to 4-1/2 per cent). The median deferred increase
due in 1969 as a whole is 4.1 per cent.
Relatively few of the 700,000 workers covered by contracts
up for renegotiation in the current quarter have reached agreement so
far. Prolonged bargaining on the railroad and airline contracts,
which expired in the current quarter, is expected to lead to settle-
ments at mid-year or later. It is apparent, however, that the
airline negotiations will lead to substantial wage increases for
75,000 airline mechanics. Two settlements, one with the Flying
Tiger Line and the other with American Airlines on March 19, following
a 20-day strike, have provided average annual wage increases of
about 8-1/2 per cent over the life of the contract. It is likely that
this pattern will spread to the remaining settlements.
New negotiations are due in lumber and with the maritime
unions in addition to the usual heavy spring schedule in construction,
in the second quarter. Furthermore, more than 2.2 million workers
will receive deferred wage increases in the second quarter. About
800,000 are construction workers and half of them will receive an
increase of 7 per cent or more; most of the rest are telephone and
trucking workers whose increases will average approximately 4-1/2
per cent. Relatively few of the workers are in manufacturing where
the median boost due in 1969 is small, 3.8 per cent; in nonmanufacturing,
the median deferred increase for the year as a whole is nearly 5 per
cent.

II - 33
Consumer prices. The consumer price index rose 0.4 per
cent in February--an advance about the same as the average monthly
increase over the past year. At 124.6 per cent of the 1957-59
average, the CPI was 4.7 per cent above a year earlier.
Food prices stabilized, following a sharp, contraseasonal
rise over the preceding 2 months. The February index of retail food
prices was close to the level anticipated by Agriculture Department
experts for 1969 as a whole.
Average prices of non-food commodities showed a step-up in
February, but the bulk of the February rise stemmed from a 6 per cent
rise in used car prices recovering from a sharp decline in December
and January. The validity of these large fluctuations in used car
prices is debatable: the BLS has been having trouble maintaining the
used car price series over the past year. The February level of used
car prices was slightly below a year earlier.
Prices of services continued up at about a 6 per cent
annual rate. (From February 1968 to February 1969 they rose 6.4
per cent.) But in February, as over the past year, a sizable boost
in mortgage interest rates contributed significantly to the rise in
the service component of the CPI. Other housing costs also rose
substantially as did medical care. Prices of utilities and public
transportation, which had jumped sharply from October through
January, showed only a moderate further rise in February.
II - 34
Wholesale prices. The BLS estimates sharp increases in whole-
sale prices of industrial commodities and of farm products between mid-
February and mid-March and a rise of 0.5 per cent in the total wholesale
price index, to 111.7 per cent of the 1957-59 average. At an estimated
111.7 the March WPI was 3.2 per cent above a year earlier, with farm
products and processed foods and feeds up 3.6 per cent and industrial
commodities up 3 per cent.
Industrial prices rose 0.4 per cent in March, with the dis-
tinct possibility--in view of experience with preliminary estimates in
recent months--that the final figure will round up to an 0.5 per cent in-
crease. The preliminary estimate for February was raised 0.1 to show a
rise of 0.5 per cent. With the January index up 0.6 per cent, the rise
in industrial prices during the first 3 months of the year was at an
annual rate of 6 per cent plus.
In March, as in other recent months, sharp increases in lumber
and plywood were major factors in the overall industrial price rise.
For the first 3 months these commodities accounted for about a third of
the total price rise; excluding lumber and plywood, average industrial
prices increased at an annual rate of about 4-1/4 per cent, which in
itself represents a step-up from the average rate of increase in late
1968. The diffusion of increases thus far in 1969 has considerably
exceeded that in the late months of 1968 and has about equalled the
early 1968 experience. In addition to lumber, average prices of metals
showed unusually large increases early this year, and in March there

II - 35
were substantial boosts in petroleum and products and in machinery and
equipment.
Recent sharp increases in lumber and plywood and sizable boosts
in nonferrous metals have brought about an especially sharp rise in the
Federal Reserve index of sensitive industrial materials--to a new 18-year
high in March. Relative rates of increase in the special FR groupings
of sensitive and other industrial materials and consumer industrial
products and producers' equipment from last August through March (as
estimated roughly) are shown in the table below.
WHOLESALE PRICES OF INDUSTRIAL COMMODITIES(FR groupings of BLS data; 1957-59 = 100)
Per cent1968 1969 cn
Aug. Dec. Jan. Feb. Mar.e change8 68 to 3/69 e
Total 108.1 109.3 109.9 110.4 110.9 4.4
Materials 106,6 107.9 108.8 109.5 n.a. 5.5
Sensitive 106.6 110.1 112.4 114.4 115.6 14.5Other 106.8 107.5 108.0 108.3 n.a, 2.9
Products 110.0 111.1 111.4 111.6 n.a. 3.1
Consumer nonfood 107.5 108.3 108.4 108.7 n.a. 2.4Producers' equipment 115.4 117.1 117.6 117.8 n.a. 4.3
e. Estimated
Lumber prices. Average prices of lumber and plywood rose almost
4 per cent further in March and were about 40 per cent above a year earlier.
This represents the sharpest increase in lumber and plywood prices of the
past 42 years except for a period immediately following World War II.
Within the past four months alone these prices have spurted 23 per cent.

II -36
Such increases provide a classic example of how extremely strong demands
and inadequate supply interact to raise prices of sensitive industrial
materials dramatically.
The main factors operative on the demand side have been the
marked expansion in the construction and furniture industries, large
purchases of logs by Japan, and heavy exports of lumber and plywood to
Vietnam. Unfavorable weather, various strikes (including the East Coast
dock strikes which reduced shipments from the West Coast), the reduced
number of plywood plants, and freight car shortages have all been in-
volved in limiting domestic supplies. According to industry sources,
another significant factor has been underutilization of Federal timber-
land. Higher prices have contributed to increases in production amount-
ing to about 8 per cent for lumber and 15 per cent for softwood plywood,
over the year 1968.
In an attempt to alleviate domestic shortages and price in-
creases, exports of logs from Federal timberlands will be reduced and
the President has recently directed the Defense Department to keep pur-
chases of lumber to a minimum, the Departments of Agriculture and
Interior to release more timber from Government lands, and the Inter-
state Commerce Commission to take action to ease the boxcar shortage.
Such actions to change underlying conditions together with the normal
forces of the market can be expected to reverse the course of prices
in coming months.

II - 37
Commodity Credit Corporation expenditures. It appears that a substantial
part of the surplus in the National budget projected for fiscal 1969 will
be erased by Commodity Credit Corporation spending. The Corporation has
exhausted its borrowing authority and will have to suspend payments in
April unless its request for a billion dollars in supplemental funds is
granted by Congress. Through January, the CCC had spent $4.2 billion
net for price support and had already exceeded the $3.8 billion limit
imposed for the entire fiscal year by the Supplemental Appropriations
Act for 1969 enacted last fall.
The CCC dilemma stems from a shortfall in receipts and a very
large increase in mandatory outlays for price support. Through January,
receipts from sales from inventory were 75 per cent below the same period
last year. Instead of providing a $900 million offset to outlays as in
fiscal 1968, net additions to inventories cost $130 million, as shown
in the table. Dock strikes caused some of the decline, but rising world
surpluses of agricultural products were the major obstacle. Sales of
certificates of interest to private lenders also lagged far behind a
year earlier despite an increase in the interest rate to 6.625 in mid-
January. Receipts from certificates sales through January provided an
offset to expenditures of only $324 million, compared with $933 million
in the corresponding period a year earlier.
Outlays for commodities going under price-support loan from
the huge 1968 crops amounted to $1.8 billion through January, nearly
$700 million more than in the same period a year earlier. Cotton and

II - 38
NET PRICE SUPPORT EXPENDITURES OF THE CCCFor periods, July 1 through January 30
Inventory operationsJuly-January change in inventoryLosses on inventory operationsJuly-January change in loansInterest and other expenses
Direct payments
Total, net expenditure
Certificates of interest, July-Januaryincrease in bank holdings (minus)
Total, net expenditure, less certificates
1968 1969(In millions of
860 2,362- 896 130
509 2501,092 1,786
155 196
1,717 2,214
2.577 4,576
933
1,644
342
4,234
soybeans, and to a lesser extent, wheat, accounted for nearly all the in-
crease in loans this year. Redemptions of price-support loans were small.
Direct payments to farmers through January were a half billion higher
than a year earlier, an outcome of the more attractive terms offered
farmers to encourage them to hold 1968 feed grain, wheat, and cotton
acreage out of production.
The CCC is currently estimating that net outlays for price sup-
port will amount to about $4.7 billion for the fiscal year. Of course,
if a large quantity of certificates are turned in for redemption, it
will be more. The seasonal peak in outlays for price-support loans was
reached in Febuary when the movement of commodities under price-support
loan tapered off. Major expenditures during the rest of the year will be
for advance payments of about $350 million due farmers signing up for the
Changedollars)
1,5021,026- 259
69441
497
1,999
- 591
2,590
I =, • •--~--

II - 39
1969 acreage diversion programs, and for purchases of manufactured milk
and other products, and possibly redemption of some certificates of in-
terest. Receipts from sales of inventory will provide more offsets
than in the earlier part of the year.
Prospective plantings of 1969 crops. Another year of large
price-support operations is in prospect if farmers actually seed the
somewhat larger acreage of spring-planted crops reported in the March 1
intentions report and the weather is favorable. According to their
plans, acreages of feed grains and hay will be about the same as last
year; cotton and flaxseed will be up sharply; and wheat and rice will
be down. Major shifts in cotton and food grain acreages reflect grower
compliance with changes in Federal programs. Cotton acreage is expected
to be 10 per cent larger, all wheat, 13 per cent smaller, and rice, 9
per cent smaller.
Farmers reported an intended 3 per cent increase in soybean
plantings in the March 1 survey. Now that the price support has been
reduced from $2.50 per bushel to $2.25 in an effort to cope with
mounting surpluses, it is hoped that some of this acreage will be
shifted to other crops.

II-C-I
ECONOMIC DEVELOPMENTS - UNITED STATESSEASONALLY
3/25/69
ADJUSTED
GROSS NATIONALBILLIONS OF DOLLARS I I I I 1 950ANNUAL RATESRATIO SCALE 900
CURRENT DO LARS/ - 850QIZ 887 4
---- --- --- --- > -- -- --- 0 0
750
0- -- 700
650
600
' 1958 DOLLARS" oy71 84 - 1 1 - 550
I ------ lil 5001963 1965 1967 1969
INDUSTRIAL PRODUCTION-I1957.59-100 Irn llf l1 1 n 1
RATIO SCALE_ 200
180
MATERIALSFEB 1691-- 160
140
TOTALFEB 1695
-- L120
1963 1965 1967 1969
INDUSTRIAL PRODUCTION-T1957 59=100RATIO SCALE,--- -200
EQUIPMENT TOTAL .^/FEB 1871 -- 180
- --- 160
// 1 o140
EMPLOYMENT AND UNEMPLOYMENTMILLIONS OF PERSONS, ESTAB BASIS 72NONAGRICULTURAL EMPLOYMENT--RATIO SCALE 68
68TOTALFEB 700 64
--- 60
-28
26
.---^"INDUSTRIAL AND RELATED -FEB 2B 6 1 1 1 .24
WORKWEEK AND LABOR COST IN MFG.rn1 42
_I- I - - L- I •4UPRODUCTION WORKERSFEB 405
1957 59=100 115RATIO SCALE
TOTAL UNIT LABOR COST1_110
ALL EMPLOY EES 1FEB 1132 /----- -105
S___ 00
_,,UW il. .. . 9 51963 1965 1967 1969
PRICES195759 CONSUMER 130RATIO SCALENOT S A -- -125
-ALL ITEMS - 120FEB 126 115
- 115
- 110
105
WHOLESALE
INDUSTRIAL 1 105COMMODITIES _0
FEB 1104 | iI , -,_ _\' _, "-- 1 onn
1969 1963 1965
HOURS I AVERAGE WEEKLY HOURS 'RATIO SCALE
CONSUMERFEB 1610
SENSITIVE INDUSTRIALMATERIALS FEB 1144
I I Ll.H.llllI I ........... 1 " I .. . . . . . . . .
PRODUCT
GOODS
1963 1965 1967 1967 1969
,

II -C-2
ECONOMIC DEVELOPMENTS - UNITED STATESSEASONALLY
3/25/69
ADJUSTED
BUSINESS INVESTMENTBILLIONS OF DOLLARS, ANNUAL rATES I I I I 1 7 0RATIO SCALE -H _ 80
NEW P. & E. OUTLAYS _ 60(COM.-S.E.C.) BUSINE 6 0
S ALL BUSINESS 4040
HlI 315
MANUFACTURING 20
10
PER CENT GNP FIXED INVESTMENTAS SHARE OF GNP 12O 106
1963 1965 1967 1969
0 NET CHANGE IN OUTSTANDING
120 h1n ..AN 77
20
SURPLUS QTZ 02
,, I I.m I 11 ---
_ _DEFICIT|
1963 1965 1967 1969 1963 1965 1967 1969

III - 1
DOMESTIC FINANCIAL SITUATION
Bank credit. As measured by the daily average credit proxy,
adjusted to include Euro-dollar borrowings, member bank credit is
projected to decline somewhat in March, following no net change over
January and February. Thus, for the first quarter as a whole, this
measure of bank credit would show a small decline.
The pressure on bank credit in recent months has been con-
centrated at large banks. From mid-December, when heavy CD attrition
began, to mid-March, total loans and investments at weekly reporting
banks have declined on balance--as indicated by the chart on the
following page. The reduction in outstanding credit at these banks
reflects liquidation of security holdings that more than offset further
increases in loans, which have been buoyed by continued strong loan
demands by businesses.
From mid-December to mid-March, weekly reporting banks have
run-off nearly $4.8 billion in holdings of U.S. Government securities--
particularly Treasury bills--with about 45 per cent of this liquidation
taking place at New York City banks. Although rising somewhat during
the first week in March as banks underwrote nearly all of the $1 billion
Treasury bill strip, bank holdings of Governments resumed their decline
in the following week.
Weekly reporting banks have also reduced their holdings of
other securities since mid-December, although these holdings have shown
little change in recent weeks. The total reduction over this period

III - 2
Billions LOANS AND INVESTMENTS AT WEEKLY REPORTING BANKS 1/
ofDollars
Total Loans and Investments / /224
222
220
218
216
30
28
26
38
36
158
156
154
152
150
72
70
68
U.S. Government SecuritiesU.S. Government Securities
Other Securities
Loans /
Business Loans
. I I . i I L...~ I. * IOctober November December January February March
1 9 6 8 e1 9 6 9
1/ Seasonally adjusted levels; experimental series based on preliminary seasonal factors
i s l - . . . . . .l
i 1

III - 3
was concentrated at banks in New York City and reflected contraseasonal
declines in short-term municipals and agency issues as well as much less
than usual acquisitions of long-term municipals and participation certif-
icates.
Following a substantial increase in late 1968 and early 1969,
total loans at weekly reporting banks have risen only slightly, on
balance, in recent weeks in spite of further increases in business
loans. Of the other major loan categories, only consumer and real
estate loans expanded further so far in March, maintaining approximately
the advanced rate of growth of recent months. Broker-dealer loans con-
tinued to decline during the first half of March, and finance company
loans, although fluctuating, have remained unchanged, on average, since
mid-December.
Much of the growth in business loans during the first half of
March was at New York City banks and was also fairly widespread among
industry categories. But business borrowing at New York banks was
extremely light during the week ending March 19, when corporate tax
payments were due, which suggests that the early-March surge in business
loans at these banks represented in large part earlier-than-usual tax
borrowing, possibly in anticipation of the prime rate increase to 7.5
per cent that occurred on March 17. Moreover, tax-related business
borrowing in New York may have been understated by the business loan
figures during the tax week because of special factors, including large
loan repayments by the New York Telephone Company--following their
recent $150 million bond issue--as well as transfers of domestic loans
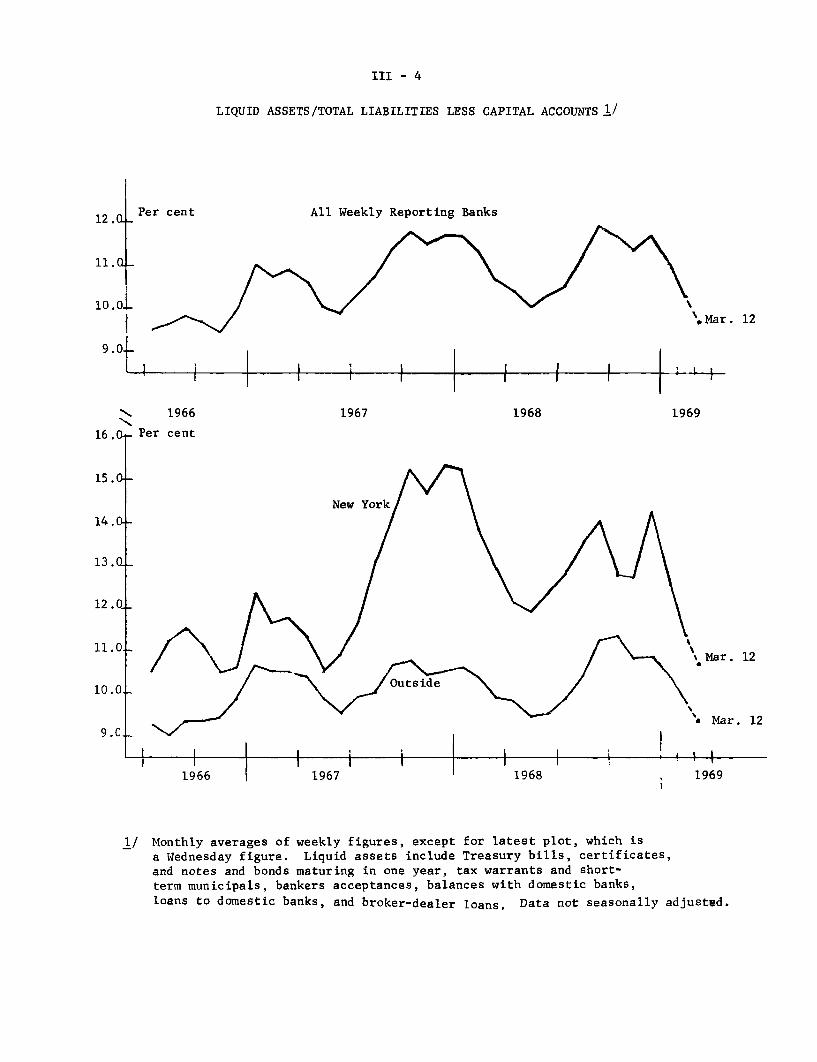
III - 4
LIQUID ASSETS/TOTAL LIABILITIES LESS CAPITAL ACCOUNTS 1/
All Weekly Reporting Banks
I 1 II i I I
I I Ii I I I
1966
Per cent
1967 1968 1969
9.0-
16.0-
15.0
14.0-
13.0.
12.0.
11.0.
10.0.
-,i I I I
1966 19671967 1968
1/ Monthly averages of weekly figures, except for latest plot, which is
a Wednesday figure. Liquid assets include Treasury bills, certificates,and notes and bonds maturing in one year, tax warrants and short-
term municipals, bankers acceptances, balances with domestic banks,loans to domestic banks, and broker-dealer loans. Data not seasonally adjusted.
12.OLPer cent
p11.0
10.0
I i
".Mar. 12
S I I
' Mar. 12
'* Mar. 12
1969
J I I I I I i - - -5 m1 ,

III - 5
to foreign branches by one New York bank. For the first three weeks
of March combined, business loan expansion at New York banks was nearly
as large as in comparable periods of other recent years.
With continued CD attrition, bank accommodation of loan
demands has entailed further reductions in their liquidity positions--
as indicated by the chart on the following page. Current liquidity at
all weekly reporting banks--measured by the ratio given here for the
week ending March 12--is approaching the low point in late 1966, with
liquidity at New York City banks having already reached that level.
At nonweekly reporting banks, changes in total loans and
investments since mid-December have remained close to those in other
recent years. With continued strong loan demands, these banks have
made much larger than usual reductions in their holdings of U.S.
Government securities, but they have continued to take other securities
into portfolio at a pace well above that in comparable periods of other
recent years.
Bank deposits. Total time and savings deposits at large
banks continued to decline contraseasonally in the latter part of February
and in the first half of March. This reduction reflects mainly further
large CD attrition, since net inflows of consumer-type time and savings
deposits--although still somewhat less than usual--have picked up sub-
stantially in recent weeks.

III - 6
NET CHANGE IN TIME AND SAVINGS DEPOSITS
Weekly Reporting Banks
(Millions of dollars, not seasonally adjusted)
1966 1967 1968 1969
Feb. 9- Feb. 8- Feb. 14- Feb. 12-
March 9 March 8 March 13 March 12
Total time & savings deps. 863 1,512 971 -623
Consumer-type deposits n.a. 899 748 666Savings deposits 55 255 284 211Time deposits, IPC
(other than CD's, IPC) n.a. 644 464 455
Negotiable CD's 349 487 239 -1,089
1/All other time deposits- n.a. 126 -16 -200
MEMO:
2/Euro-dollar borrowings- n.a. n.a. -118 565
1/ Consists primarily of time deposits held by State and local govern-ments and by foreign institutions.
2/ Liabilities of major U.S. banks to their foreign branches, weekly
averages of daily figures. These banks increased their Euro-dollarborrowings by $220 million in the week ending March 19.
n.a. - Not available.
Outstanding CD's at weekly reporting banks declined by an
additional $573 million during the first half of March, bringing the
total decline since mid-December close to $4.9 billion. About 55 per
cent of these run-offs took place in New York, and New York and Chicago
banks lost another $363 million in the week ending March 19. With the
volume of maturing issues in March comparable to that in February, the
attrition of CD's at all weekly reporting banks during the first half
of March continued at about the February pace--measured either by the
average weekly dollar volume or by the per cent of maturing issues.

III - 7
In view of continued CD run-offs, banks with foreign branches
borrowed an additional $687 million in the Euro-dollar market during the
first three weeks in March, bringing the total increase in head office
liabilities to foreign branches to nearly $2.3 billion since mid-December.
Following a contraseasonal outflow over January, consumer-type
time and savings deposits expanded in February and in the first half of
March, although still by somewhat less than in comparable periods of
other recent years. Savings deposits inflows, however, have contributed
to the increase in the first half of March, rising substantially--
although still less than usual--in contrast to net declines in the pre-
vious two months. And as has been the case since yearend, inflows of
time certificates and open accounts in the first half of March continued
at a pace somewhat reduced from that in comparable periods of past years.
Country banks began experiencing savings deposit inflows in early
February--as compared to outflows earlier in the year--resulting in an
advanced, but still less than usual, rate of growth of total time and
savings deposits at these banks recently.
The money stock, measured on a daily average basis, is
expected to show little further change in March, after having grown at
a sharply reduced 2.2 per cent annual rate in the previous two months.
U.S. Government deposits are expected to decline in March, following
substantial increases earlier in the year.

III - 8
Nonbank depositary institutions. Net new money inflows in
February to the two major types of specialized thrift institutions were
approximately the same as a year earlier, and fragmentary data suggest
the same pattern persisted in the first half of March. On a seasonally
adjusted basis, the acceleration shown in February--and probably the
deceleration in January--is probably overstated as a result of seasonal
measurement difficulties. Even so, it is clear that while inflows have
apparently slowed since late last fall, this slowing is less than might
have been expected on the basis of current record market yields. Desire
for liquid assets, accumulation of funds for April tax payments, the
convenience and safety of deposit-type claims, and the earlier shifts of
the most interest sensitive deposits out of these institutions have been
among the major factors sustaining inflows.
1/NET NEW MONEY FLOWS-
($ millions)Not Seasonally Adjusted
Insured S&L's MSB's BothJan. Feb. Total Jan. Feb. Total Jan. Feb. Total
1966 -65 505 440 144 179 323 79 684 763
1967 290 741 1,031 331 286 617 621 1,027 1,648
1968 -270 559 289 162 301 463 -108 860 752
1969/ -130 574 444 100 260 360 -30 834 804
1/ Net savings inflows less interest credited.p/ Preliminary.

III - 9
GROWTH IN SAVINGS 1
NONBANK DEPOSITARY INTERMEDIARIES(Seasonally adjusted annual rate in per cent)
MSB's S&L's Both
1968 - I 7.1 5.6 6.1II 6.7 5.7 6.0III 6.5 5.9 6.1IV 7.0 6.2 6.5
January-February average1968 6.8 4.5 5.21969 5.5 5.1 5.2
Monthly:
1968 - October 6.9 7.1 7.0November 7.5 5.7 6.3December 6.4 5.7 5.9
1969 - January p/ 4.1 4.9 4.6February 2/ 7.0 5.2 5.8
1/ Data reflect FHLB revisions of the S&L series, and updating ofseasonal factors for both.
/p Preliminary.
In recent months, savings and loan association borrowing
from the FHLB has risen only modestly as the sustained, though moderate,
pace of inflows and a small increase in mortgage return flows have
facilitated the step-up in their net mortgage acquisitions. After the
one-time adjustment to new reduced requirements at mid-1968, the asso-
ciations have also been able to maintain and lately to increase their
liquidity position about in line with seasonal pressures.

III - 10
CASH FLOW OF INSURED SAVINGS AND LOAN ASSOCIATIONSJanuary-February Combined
($ millions, not seasonally adjusted)
1966 19671/ 1968 1969 2/
Sources
Net savings inflow 471 1,067 333 517FHLB advances 2/ -248 -1,111 -34 55Gross mortgage return flows- 2,400 1,860 2,220 2,255Other 3/ 699 753 918 992
Total 3,322 2,569 3,437 3,819
Uses
Gross mortgage acquisitions 3,341 1,949 3,147 3,537Liquid items -75 308 96 144Other 4/ 56 312 194 138
Memo: Net mortgage acquisitions 941 89 927 1,282
1/ Patterns are distorted because of the S&L's post-1966 effort torebuild liquid positions.
2/ Includes mortgage repayments, sales of loans and participations,plus some noncash items.
3/ Includes changes in loans in process, reserves and surplus, reservefor dividend payments, and non-FHLB borrowed funds.
4/ Generally miscellaneous "other asset" items, which includes changesin non-mortgage loans.
2/ Preliminary.
Outflows during the March-April reinvestment period may be
large in view of the volume of projected April personal income tax
payments and the considerable publicity given to the record level of
long-term security yields.- With mortgage commitments remaining large
1/ Beginning April 1, S&L's are authorized to offer a 90-day noticeaccount with a 5 per cent rate ceiling. The account/rate structureotherwise remains unchanged: with some geographical exceptions,S&L's may offer 4.75 per cent on regular accounts and 5.25 per centon minimum term/balance accounts.

III - 11
relative to cash flows, as discussed in the next section, at last the
typical seasonal increase in borrowing from the FHLBanks will no doubt
occur, and possibly more--the volume to depend, of course, on the
reinvestment period experience. Further implications of such borrowings
are discussed in Appendix A.
Mortgage market. Although the pace of net inflows to thrift
institutions has moderated a little since late last year, new mortgage
commitment activity remained strong in early 1969, at least for the
S&L's, as mortgage yields continued to rise.
Yields in the sensitive secondary market for FHA and VA home
mortgages edged higher in the most recent auction of March 24, as
bidders increased their offerings and adjusted their bid prices to
reflect the latest increase in the bank prime rate. In the two preceding
auctions, yields had declined slightly as FNMA attempted to stablize
auction prices by setting the volume of accepted bids near record highs
despite a sizable reduction in bids received. However, after the
March 24 auction, the average yield on FNMA 6-month forward purchase
commitments, at 8.09 per cent, was only 8 basis points below the high
reached early in the month.

III - 12
FNA WEEKLY AUCTIONS
Total bid Total bids Implicit privatereceived accepted market yield (per cent)
(6-month forward commitment)1968 high -June 10 231.8 74.5 7.71
February 17 226.7 100.9 8.0924 167.2 100.1 8.14
March 3 118.9 90.5 8.1710 127.1 84.7 8.1317 132.7 88.5 8.0824 220.9 84.2 8.09
Note: Average secondary market yield after allowance for commitmentfee and required purchase and holding of FNMA stock, assumingprepayment period of 15 years for 30-year Government-underwrittenmortgages. Yields shown are gross, before deduction of 50 basispoint fee paid by investors to services. The first auction datewas May 6, 1968.
For February as a whole, home mortgage rates continued upward
at a time of increased rate pressure throughout the capital markets.
In the primary market, the average contract rate on conventional first
mortgages rose further, although at a somewhat slower pace than in
January--when upward rate pressures throughout the mortgage market were
intensified by the sharp regulatory increase in contract rates on FHA
and VA loans. In the private secondary market for FHA and VA mortgages,
average yields in February moved moderately higher reaching a level
just short of 8 per cent. Though the spread between yields on Federally-
underwritten loans and new issues of high grade corporate bonds had
improved considerably over the past two months, a sharp rise in corporate
bond yields during the first three weeks in March has narrowed that

III - 13
spread again. But future upward pressure on rates for both conventional
and Federally-underwritten mortgages is anticipated as lenders adjust to
the latest rise in the prime rate.
AVERAGE RATES AND YIELDS ON SELECTED NEW-HOME MORTGAGES
Primary Market: Secondary Market:Conventional loans FHA-insured loans
Yield YieldLevel Level(per spread er spread Discounts
er (basis (per (basis (points)cent) cent)
cent points) points)
1968
February 6.75 50 6.78 53 6.6March 6.80 23 6.83 26 7.0
April 6.90 40 6.94 44 7.9May 7.15 51 7.50e 86e 6.leJune 7.25 60 7.52 87 6.3
July 7.30 79 7.42 91 5.5August 7.30 115 7.35 120 5.0September 7.30 103 7.28 101 4.4
October 7.25 78 7.29 82 4.5November 7.30 69 7.36 75 5.1December 7.40 61 7.50 71 6.2
1969
January 7.55 63 7.85e 93e 2.8eFebruary 7.60 68 7.99 107 3.9
Note: FHA series: Interest rates on conventional first mortgages(excluding additional fees and charges) are rounded to thenearest 5 basis points. Secondary market yields and discountsare for certain 6 per cent, FHA-insured Sec. 203 loans throughApril 1968. Data for May 1968 estimated by Federal Reservebased on 6-3/4 per cent regulatory interest rate in effectthrough December 1968. Data for January 1969 estimated byFederal Reserve on 7-1/2 per cent regulatory interest rates, onwhich a change of 1.0 points in discount is associated with achange of 12 to 14 basis points in yield. Gross yield spread isaverage mortgage return, before deducting servicing fees, minusaverage yield on new issues of high grade corporate bonds with5-year call protection.

III - 14
Even though borrowing costs increased to new record highs in
February, demands for residential mortgage credit continued stronger
than usual at this seasonally slack time of the year. Sufficient funds
to accommodate these demands continued to be available in most major
areas, according to both FHA and FNMA field office reports, albeit at
higher costs.
As shown in the table, the backlog of outstanding commitments
at all Savings and Loan Associations and New York State Mutual Savings
Banks continued to rise during February, after adjustment for seasonal
variations. However, the more diversified New York State Mutual Savings
Banks somewhat reduced the rate at which they were approving new commit-
ments, according to Federal Reserve Board derived estimates. The Savings
and Loan Associations, which in recent months have stepped up their
mortgage commitment activity in an effort to lock-up high yields, further
increased their new commitment volume in February to the highest level in
almost two years.
The quality of outstanding mortgage debt generally improved
again during the fourth quarter of last year, judging from such after-
the-fact measures as delinquency and foreclosure rates relating to loans
closed mainly in earlier periods. The composite delinquency rate on
home mortgages rose less than usual during the fourth quarter, reflect-
ing for the most part a slight rise in short-term delinquencies from a
reduced level. Sixty-day-and-over delinquencies showed a further year-
over-year decline to the lowest level in 8 years. The over-all fore-
closure rate on nonfarm mortgages again edged down, and reached the
lowest-level since 1960.
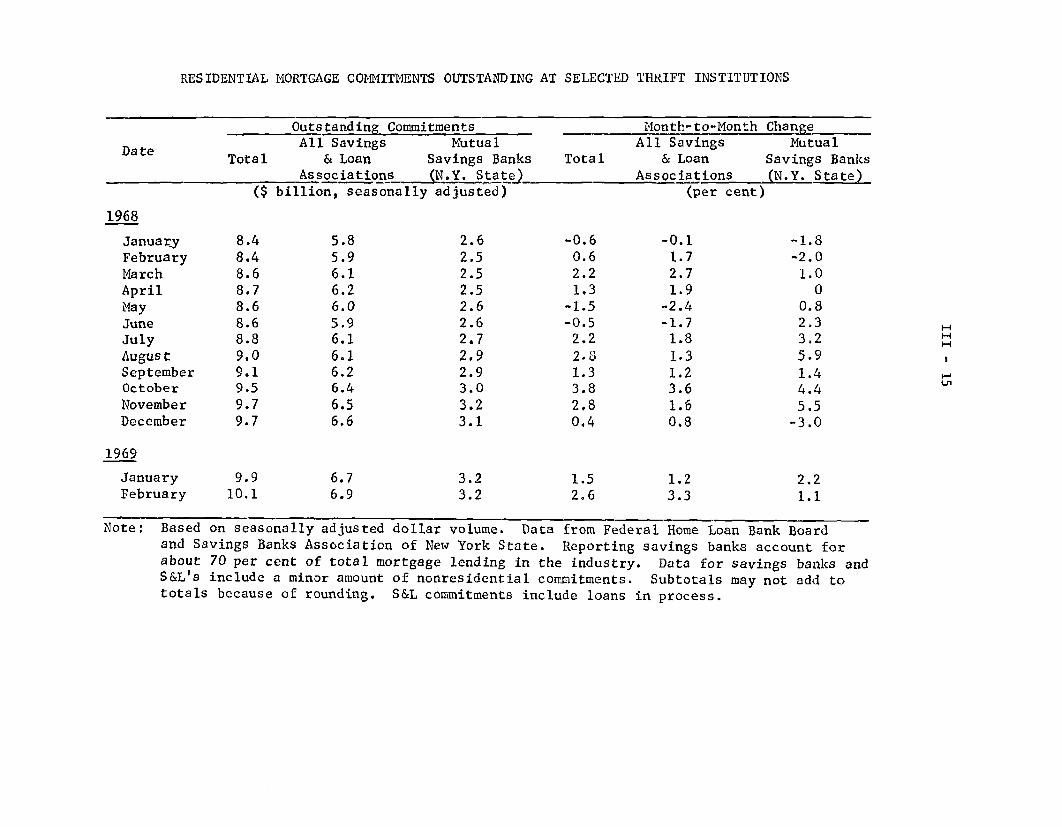
RESIDENTIAL MORTGAGE COMMITMENTS OUTSTANDING AT SELECTED THRIFT INSTITUTIONS
Outstanding CommitmentsAll Savings Mutual
Total & Loan Savings BanksAssociations (N.Y. State)
($ billion, seasonally adjusted)
Month-to-Month ChangeAll Savings Mutual
Total & Loan Savings BanksAssociations (N.Y. State)
(per cent)
1968
JanuaryFebruaryMarchAprilMayJuneJulyAugustSeptemberOctoberNovemberDecember
1969
JanuaryFebruary
8.48.48.68.78.68.68.89.09.19.59.79.7
9.910.1
5.85.96.16.26.05.96.16.16.26.46.56.6
2.62.52.52.52.62.62.72.92.93.03.23.1
3.23.2
-0.60.62.21.3-1.5-0.52.22.81.33.82.80.4
1.52.6
-0.11.72.71.9-2.4-1.71.81.31.23.61.60.8
1.23.3
-1.8-2.01.0
00.82.33.25.91.44.45.5
-3.0
2.21.1
Note: Based on seasonally adjusted dollar volume. Data from Federal Home Loan Bank Boardand Savings Banks Association of New York State. Reporting savings banks account forabout 70 per cent of total mortgage lending in the industry. Data for savings banks andS&L's include a minor amount of nonresidential commitments. Subtotals may not add tototals because of rounding. S&L commitments include loans in process.
Date

III - 16
Corporate and municipal bond markets. Yields on corporate and
municipal bonds advanced sharply to new peaks in recent weeks. New cor-
porate bond yields increased more than 60 basis points since the end of
February, while municipal bond yields rose about 25 basis points from
their advanced level at month-end. Most recently, yield pressures have
moderated reflecting peace rumors, a light calendar over the balance of
the month, low dealer inventories, and the enthusiastic investor response
to two attractively-priced utility offerings. On the basis of information
available through mid-week, corporate new issue yields are estimated to
have declined significantly in the week ended March 28. However, this
week's volume of new issues is very light and yield developments may be
a reflection of short-term technical and expectational factors. Even
with this decline corporate new issue yields at the end of March re-
mained 50 basis points above their February high.
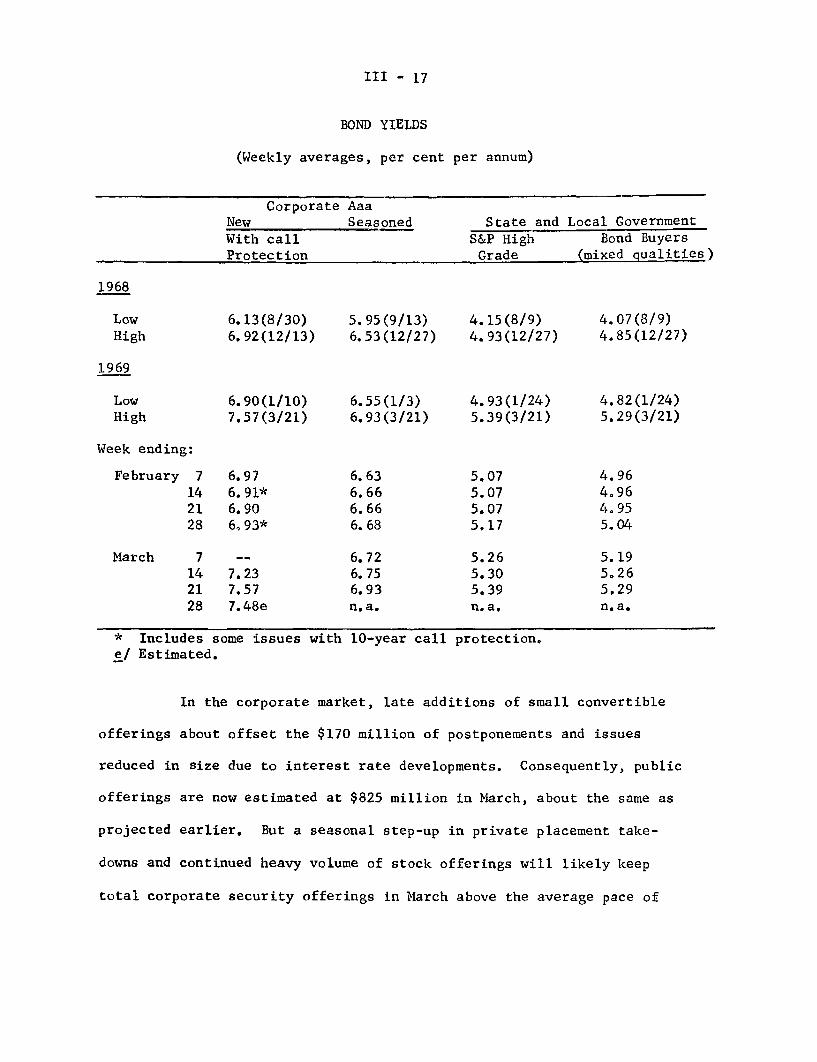
III - 17
BOND YIELDS
(Weekly averages, per cent per annum)
Corporate AaaNew Seasoned State and Local Government
With call S&P High Bond BuyersProtection Grade (mixed qualities)
1968
Low 6.13(8/30) 5.95(9/13) 4.15(8/9) 4.07(8/9)High 6.92(12/13) 6.53(12/27) 4.93(12/27) 4.85(12/27)
1969
Low 6.90(1/10) 6.55(1/3) 4.93(1/24) 4.82(1/24)High 7.57(3/21) 6.93(3/21) 5.39(3/21) 5.29(3/21)
Week ending:
February 7 6.97 6.63 5.07 4.9614 6.91* 6.66 5.07 4.9621 6.90 6.66 5.07 4.9528 6,93* 6.68 5.17 5.04
March 7 -- 6.72 5.26 5.1914 7.23 6.75 5.30 5.2621 7.57 6.93 5.39 5.2928 7.48e n.a. n.a. n.a.
* Includes some issues with 10-year call protection.e/ Estimated.
In the corporate market, late additions of small convertible
offerings about offset the $170 million of postponements and issues
reduced in size due to interest rate developments. Consequently, public
offerings are now estimated at $825 million in March, about the same as
projected earlier. But a seasonal step-up in private placement take-
downs and continued heavy volume of stock offerings will likely keep
total corporate security offerings in March above the average pace of

III - 18
last year. Indeed, over the first quarter, the staff estimates that
total stock and convertible bond issues accounted for an unusually
large 45 per cent of corporate security offerings--exceeded only in
the last half of 1968. The high cost of bond financing and the apparent
relatively higher financing requirements of medium-sized corporations
have probably been the major factors associated with this changing
composition of financing.
CORPORATE SECURITY OFFERINGS1 /
(Millions of dollars)
BondsPublic Private Stocks Total bonds
Offerings./ Placements and stocks
1967 1968 1967 1968 1967 1968 1967 1968
YEAR - Monthly avg. 1,249 894 580 554 237 382 2,066 1,830
1968 1969 1968 1969 1968 1969 1968 1969
Q I - Monthly avg. 821 872e 574 597 330 501e 1,726 1,970e
January 903 980 546 591 332 453 1,771 2,024February 796 810e 585 550e 226 550e 1,607 1,910March 766 825e 593 650e 441 500e 1,799 1,975eApril 719 900e 438 550e 271 500e 1,428 1,950e
e/ Estimated.1/ Data are gross proceeds.
2/ Includes refundings.
The ultimate total financing volume in April is expected to be
about as large as in March, with an increase in public bond offerings to
$900 million about offsetting the seasonal decline in private placements.

III - 19
As in March, convertible bonds and stock offerings are expected to
account for a large proportion of the total. Actual April financing
experience will thus depend not only on interest rate developments, but
also on the course of stock prices.
In the tax-exempt market, an estimated $400 million of post-
ponements is expected to reduce the ultimate volume of offerings in
March to about $450 million, the lowest level in more than 5 years.
Most of the postponements in March--as during the entire first quarter--
have resulted from statutory interest rate ceilings, and considerable
pressure has once again been building up in State legislatures to raise
maximum permissible ceiling rates.
STATE AND LOCAL GOVERNMENT BOND OFFERINGS AND POSTPONEMENTS(Millions of dollars) 1/
Postponements
1967 1968 1968
Year - monthly average 1,230 1,381 86
1968 1969 1969
QI - monthly average 1,245 913e 285e
January 1,178 1,239 181February 1,155 975e 275March 1,404 450e 400e
April 1,318 750e
e/ Estimated.1/ Data are for principal amounts of new issues.

III - 20
Postponements shown in the table understate the actual degree
to which market developments have impeded financing since under recent
market conditions many governmental units have not even attempted to
market their bonds. It is likely that the current volume of postpone-
ments will have a more sizable impact on capital outlays than in earlier
periods of monetary restraint since there are reasons to believe that
the financial flexibility of State and local governments has been sharply
reduced by three years of relatively high interest rates.
The cutback of offerings in March tended to moderate upward
rate movements in the municipal market, but to distribute even the small
volume of offerings, yields still advanced 25 basis points. Commercial
banks--generally the largest buyers--are continuing to reduce their
activity in the tax-exempt market, but have not yet become large net
sellers. Press reports suggest that individuals and some fire and
casualty companies have been important buyers of State and local govern-
ment securities.
The volume of municipal offerings currently scheduled in
April amounts to a sizable $1.1 billion. After adjustment for an
expected high rate of postponements, however, new offerings of tax-
exempt bonds are estimated to total about $750 million, well above the
March volume. The increase from March primarily reflects several large
issues that do not have interest ceilings or have recently had their
ceiling rates raised (such as the State of California). Some of the
scheduled offerings are planned by borrowers apparently without sufficient
flexibility to await improved market conditions.

III - 21
Stock market. With continued reduced trading volume, stock
prices fluctuated in a narrow range through March, and by late in the
month were near their lows for the year. The increase in the prime
rate--which already had been discounted--had no apparent effect on
prices. By late in the month, the major indices were running 7 to 9
per cent below the highs of last December and 4 to 8 per cent under the
highs of mid-February. Blue chip stocks--as measured by the Dow-Jones
Industrial Index--have declined less than stocks in general, in part
because of upgrading of portfolios and in part because the price of
such stocks had not increased as rapidly as stocks in general over the
last year.
STOCK PRICE INDICES
Dow-Jones New York Stock American StockIndustrials Exchange Index Exchange Index
1968
December high 985.21(12/3) 61.14(12/2) 33.25(12/20)
1969
High (Feb.) 952.70(2/13) 58.70(2/17) 32.69(2/4)Low (Feb./Mar.) 903.97(2/24) 54.93(3/14) 29.48(3/14)
March high 923.11(3/5) 56.01(3/5) 30.23(3/5)
March 25 917.08 55.84 30.11
Per cent change:
December high toMarch 25 -6.9 -8.7 -9.4
February high toMarch 25 -3.7 -4.9 -7.9
1969 low toMarch 25 +1.5 +1.7 +2.1

III - 22
With volume continuing relatively low, failure to make timely
delivery of securities by members of the New York Stock Exchange declined
again in February from the December peak; the February rate of $3.0
billion was the lowest since April 1968 when the series began. However,
despite the lower March volume, "fails" might rise again this month
because of technical difficulties associated with the New York Stock
Exchange's computerized Central Certificate Service, which produced some
bookkeeping delays.
AVERAGE WEEKLY TRADING VOLUME
New York Stock American Stock Memo: Fails to DeliverExchange Exchange by members of the New
(millions of (millions of York Stock Exchangeshares) shares) (billions of dollars)
1968
October 61.5 26.3 3.4November 58.7 26.4 3.3December 60.6 32.7 4.1
1969
January 58.4 32.8 3.3February 52.6 26.1 3.0
Week ending:
Feb. 21 1/ 45.6 23.1 --Feb. 28 53.3 24.4
March 77 49.5 22.5 --March 14 46.2 18.9March 21 50.2 21.5
1/ Four-day trading week reflecting George Washington Birthday holiday.
Preliminary indications are that margin debt extended
broker-dealers on the New York Stock Exchange declined again in
by
February,

III - 23
this time by about $200 million; at the end of the month such credit
was almost 15 per cent below the mid-1968 peak of $6.7 billion. By
contrast, securities credit extended by banks last month rose $60
million.
Policy loan activity at life insurance companies. After the
relatively sharp January increase in net policy loans advanced by life
insurance companies, activity in February leveled off, on balance.
January-to-February patterns among individual companies of the fifteen
reporting were mixed, however, with some experiencing fairly sharp
increases during February which were offset by smaller increases at
other firms. Policy loan volume so far in 1969 is considerably larger
than in prior years; and there tends to be a seasonal increase in policy
loans at the March-April income tax period. As of the end of 1968, life
insurance companies expected policy loan volume to increase somewhat in
the first two quarters of 1969, while expecting very little additional
1/volume in total funds for investment.-
NET CHANGE IN POLICY LOANS15 Life Insurance Companies*
($ millions)
January February March April
1965 20 25 35 37
1966 36 33 57 69
1967 70 56 64 60
1968 57 57 67 73
1969 81 82 .. -
* Companies account for about two-thirds of policy loans held by theindustry.
1/ The Supplement will contain an analysis of commitment and investmentactivity of the life insurance companies in 1968.

III - 24
U.S. Government securities market. Yields on Treasury bills
have declined generally 20-30 basis points since the last meeting of
the Committee, with the rate on the 3-month issue falling to about 5.90
per cent. While yields on longer-term Treasury coupon issues continued
to advance during most of the period, more recently yields on all coupon
issues have turned down. Those on intermediate-term issues are currently
below levels prevailing at the last meeting, but yields on longer-term
issues are still slightly above those levels.
MARKET YIELDS ON U.S. GOVERNMENT SECURITIES(Per cent)
1968 1969Lows Highs Mar. 3 Mar. 12 Mar. 17 Mar. 25
Bills
1-month 4.55 (1/2) 6.35 (12/23) 5.80 5.45 5.45 5.623-month 4.82 (1/29) 6.29 (12/24) 6.17 5.99 6.09 5.926-month 4.98 (1/29) 6.41 (12/24) 6.31 6.14 6.20 6.041-year 5.05 (8/1) 6.47 (12/24) 6.33 6.15 6.22 6.08
Coupons
3-year 5.34 (8/19) 6.52 (12/23) 6.51 6.38 6.40 6.315-year 5.42 (1/12) 6.34 (12/24) 6.45 6.42 6.45 6.3910-year 5.37 (8/8) 6.27 (12/24) 6.25 6.31 6.35 6.3020-year 5.14 (8/2) 6.12 (12/24) 6.15 6.24 6.32 6.22
N.B. - Latest dates of high or low rates in parentheses.
The further decline of bill yields has been partly seasonal;
reinvestment demands generated by cash redemptions of maturing March
tax bills, and temporary bank buying over the quarterly statement and
Coock County, Illinois, property tax dates usually create some downward
III - 25
pressure on bill yields toward the end of March. Seasonal bill buying
has been strongly reinforced this year, however, by the cumulative
effect of swapping out of maturing bank CD's and by demands from
investors seeking temporary liquidity in a period of general uncertainty
about interest rates and stock prices. With dealers reluctant to accum-
ulate any sizable positions, in view of the continuing high level of
financing costs and expectations about possible further System tightening
actions, investor demands have kept dealer holdings of bills at rather
low levels.
The Treasury's recent announcement of a $1.8 billion bill-
strip, for auctioning on March 25, produced little perceptible upward
movement in bill rates. Since settlement on the offering is due on the
quarterly statement date and can be paid for wholly with tax and loan
credit, banks bid aggressively in the auction forcing the average rate
down to 5.03 per cent, 70-90 basis points below yields prevailing on
the outstanding bills being augmented by the strip. With regular weekly
and monthly bill auctions occurring just before and just after the strip
auction, and with banks expected to liquidate acquisitions of strip
bills fairly rapidly, dealers bill positions should be substantially
enlarged in the period immediately ahead.

III - 26
DEALER POSITIONS IN GOVERNMENT SECURITIESI(Millions of dollars)
March 3 March 10 March 17 March 24
Total 1978 1556 81 1851
Treasury bills 1.613 1,260 1,533 1445
Due in92 days or less -75 3 211 736-Over 92 days 1,689 1,257 1,321 709=
Coupon issues 365 296 277 407
Due within 1 year 174 181 210 2851-5 years 38 -22 -53 -56Over 5 years 153 137 120 178
1/ Monday figures.2/ Change from March 17 reflects a maturity shift in the June tax bill.
The recent general down-turn of yields on Treasury coupon
issues has developed primarily on professional activity. Reports that
negotiations with the North Vietnamese have been occurring secretly
were generally interpreted by market participants as improving the odds
for a cease-fire. The rather sensitive reaction of bond markets to
this interpretation--particularly in the corporate sector--apparently
encouraged dealers to cover short-positions. Short-covering, along with
the further decline of bill yields and the influence this has had on
market expectations about System policy, has accentuated the dimensions
of the yield reversal. But for the longer-run, the general concern
about continuing inflationary pressures that had contributed to the
steady updrift of yields on long-term bonds over the preceding three
weeks, still appears strongly embedded in current market psychology.

III - 27
Other short-term rates. Interest rates on bankers' acceptances
and short-term Federal agency debt have declined somewhat since the last
meeting of the Committee, responding to the lead of the Treasury bill
market. Rates on commercial and finance company paper, secondary market
CD's, and short-term municipal debt, however, have all risen further.
Supplies of acceptances and commercial and finance paper outstanding all
increased considerably in February. And, while data are not yet avail-
able for March, early indications suggest that this growth has continued,
as pressure on banks have accumulated.

SHORT-TERM INTEREST RATES
1968 1 1969Lows Highs Mar. 3 Mar. 12 Mar. 17 Mar. 24
1-monthCD's (prime NYC)
Highest quoted new issueSecondary market
3-monthBankers' acceptancesFederal agenciesFinance paperCD's (prime NYC)Highest quoted new issueSecondary market
6-monthBankers' acceptancesCommercial paper.Federal agenciesCD's (prime NYC)
Highest quoted new issueSecondary market
1-yearPrime municipals
4.88 (2/8)4.90 (1/31)
5.255.005.13
(3/7)(2/9)(3/7)
5.25 (2/8)5.20 (1/3)
5.385.505.25
(3/7)(3/7)(2/9)
5.50 (3/7)5.45 (1/31)
2.75 (8/8)
5.50 (12/31)6.45 (12/26)
6.506.386.25
(12/31)(12/26)(12/31)
6.00 (12/31)6.54 (12/26)
6.626.256.62
(12/31)(12/31)(12/26)
6.25 (12/31)6.75 (12/26)
3.80 (12/26)
5.506.45
6.756.446.38
6.006.60
6.886.756.60
6.256.70
4.25
5.506.45
6.756.436.38
6.006.55
6.886.756.55
6.256.65
4.30
5.506.45
6.636.296.50
6.006.55
6.756.756.52
6.256.65
4.50
5.506.60
6.626.356.50
(3/20)
(3/20)
6.006.75 (3/20)
6.756.886.54 (3/20)
6.256.80 (3/20)
4.55 (3/20)
1/ Latest dates on which rates occurred are indicated in parentheses.

III - 29
Federal finance. The $1.8 billion Treasury bill strip
auctioned March 25, for payment March 31, completes Treasury cash
financing operations for the current fiscal year. This borrowing can
be managed within the existing debt ceiling of $365 billion because $2
billion of March tax bills have been repaid and Federal trust funds
will redeem more than $1 billion of special issues near the end of the
month to finance the mail out of benefit checks. Although the debt
subject to ceiling reached an intra-monthly high of $364.7 billion on
March 14, by month-end it is expected to drbp to around $363 billion.
Just prior to the redemption of April tax anticipation bills, however,
the debt subject to limit will again rise to about $365 billion as a
result of further increases in special issues. In fact, unless Congress
quickly completes action on the pending bill that increases the temporary
debt ceiling to $377 billion, the Treasury may have to resort to special
measures to avoid breaching the ceiling in this period.
The end-of-March financing allows the Treasury only a minimum
estimated cash balance of $2.2 billion at mid-April. But heavy inflows
of tax receipts thereafter will buoy the balance to almost $10.0 billion
by the end of April. Since seasonal tax receipts would tend to maintain
an unusually high cash balance through most of the remainder of the
fiscal year, the Treasury may decide to repay additional debt beyond the
$2.0 billion of tax bills maturing in April and the $6.8 billion of tax
bills maturing in June. This could be done by allowing some attrition
in the refinancing of note and bond issues scheduled to mature in May
and June.

III - 30
The outlook for Budget receipts and outlays remains substan-
tially the same as that shown in the last Greenbook, with receipts
still expected to be about $1.0 billion and outlays about $1.7 billion
larger than the Budget document estimate. Most of the $1.7 billion
difference in projected outlays stems from unexpected changes in CCC
spending and interest costs. Because redemptions of bank-held CCC
certificates and other CCC price support operations tend to fluctuate
rather widely, the magnitude of total CCC outlays is difficult to
project; nevertheless, the current staff estimate, at $4.6 billion,
exceeds the January Budget forecast by $1.0 billion. Gross interest
costs are expected to be $0.6 billion above the Budget. Data on defense
spending appear thus far to be conforming to earlier Budget Bureau
estimates.

III - 31
PROJECTION OF TREASURY CASH OUTLOOK(In billions of dollars)
Feb.!/ March April May-June
Borrowing operations
New cash raised
Weekly billsTax billsCoupon issuesPC's
Other (agency, debt repayment, etc.)
Total net borrowing from public
Plus: Other net financial sources-b
Plus: Budget surplus or deficit (-)
Equals: Change in cash balance
Memorandum: Level of cash balanceend of period
a Actual and estimated data.b/ Checks issued less checks paid and
-1.9
-1.9
-. 6
.2
-2.3
4.9
2.8-2.0
.8
.9
-1.1
.6
-2.0
- .1
-2.1.
.6
6.2
4.7
5.5 10.2
other accrual items.
i-
-6.8
-1.4
-8.2
.1
6.7
-1.4
8.8

NEW BUDGET AND FEDERAL SECTOR IN NATIONAL INCOME ACCOUNTS(In billions of dollars)
Fiscal years 1968 1969Actual Jan. budget F.R. Bd
1967 1968 1969 1969Quarterly data, unadjusted
New budget:Surplus/deficit - 8.8 -25.2 2.4 1.7 - 3.2 - 7.1 -. 8 12.9
Receipts 149.6 153.7 186.1 187.1 43.6 39.3 44.2 60.0Total expenditures and net lending 158.4 178.9 183.7 185.4 46.9 46.3 45.1 47.1
Means of financing:Total borrowing from the public 2.9 23.1 - 3.1 1.3 7.7 3.4 .5 -10.3Decrease in cash operating balance 5.2 .4 n.a. - 3.5 -3.3 3.9 -. 8 - 3.3Other 1/ .7 1.7 n.a. .5 -1.1 - .2 1.1 .7
Cash operating balance, end of period 5.7 5.3 n.a. 8.8 8.6 4.7 5.5 8.8
Seasonally adjusted annual rate
Federal surplus/deficitin national income accounts - 6.7 -11.3 2.7 2.6 - 2.8 .2 5.8 7.2Receipts 2/ 147.7 161.1 190.0 190.9 182.1 187.1p 195.8 198.5Expenditures 154.4 172.4 187.3 188.3 184.9 186.9p190.0 191.3
e--Projected.p--Preliminary.1/ Includes various accrual items, such as deposit fund2/ Corporate tax accruals in first two quarters of 1969
accounts and clearing accounts.assume extension of surtax through calendar 1969.

FINANCIAL DEVELOPMENTS - UNITED STATES
_ ._r 5.
F.R. DISCOUNT-4.
TREASURY BILLS MAR 225503-MO. (Discount Basis)MAR 22 600
| 1 1 1 1 1 1 1 1 1 1 1 1 1 1 1 2 .
1965 1967 1969
BANK RESERVESBILLINS OFDC IL AR
TOTAL(S A)
FEB 27 2 24.0
22.0NONBORROWED 22.0(SA )FEB 26 4
20.0
BILLIONS OF DOLLARSBORROWED FEB 82
.8
1965 1967 1969
MONEY AND TIME DEPOSITS
SEASONALLY ADJUSTED 2RATIO SCALE
- MONEY SUPPLY - 1FEB 193 | [
, ^COMMERCIAL BANK_/ TIME DEPOSITS 1
FEB 2010
*EXCLUDES HYPOTHECATED DEPOSITS-------- L --- 1
4020
!00
80
60
40
20
[PER CENT OF GNP
SAVINGS SHARES AND DEPOSITS
SREFLECTS CONVERSION OF A S & L ASSN WITH SHARE CAPITALOF ABOUT $175 MILLION TO A MUTUAL SAVINGS BANK... .. ...... 11111
1965 1967
PER CENT |FEDERALMAR 21 685
FUNDS ahAI AM ,
BILLIONS OF D(RATIO SCALE
BILLIONS OF DRATIO SCALE
OLLARSi 1 , 1 [
SAVINGS AND LOANASSOCIATIONS. -FEB 1320 I
LMONEY SUPPLY & TIME DEPOSITS 443 I 40
1 7 I I 30S_MONEY SUPPLY G 216
I I T- i i 20
MUTUAL SAVINGS BANKS.FEB 650
-
I I I I -~
I I I I I I II I 1 1I
I I I I 1 1 50
l i I Il
3/25/69I--c- I
ILLARS
m
1969 1965 1967 1969

III -C.2
FINANCIAL DEVELOPMENTS - UNITED STATES
NET FUNDS RAISED.NONFINANCIAL. ,~~ ,
SECTORSI I 1140
120
100
80
60
40
PER CENT PRIVATE DOMESTIC TO PRIVATEINVESTMENT OUTLAYS--- -----
QZ 36 0
TOTAL TO ONP - - 20Qon 103
I II I II 01965 1967 1969
NEW SECURITY ISSUESBILLIONS OF DOLLARS I I I I I I I I 3
CORPORATE
MAR0 1967 2MAR 20 o - - -
1969
1968
-STATE AND LOCAL GOVERNMENT-2
MA 2
MAR 6
BILLIONS OF DOLLARSSEASONALLY ADJUSTEDANNUAL RATES
1965 1967 1969
SEPT. DEC. 1965
3/25/69
TOTALQN 918
oV 79 4PRIVATE
_ DOMESTICI(.x. ST. 4L. Gov 's.
I I I
SHARES IN FUNDS SUPPLIEDPER CENT OMMERCIAL BANKS I I I 1 I 60
9528
40
NONBANK DEPOSITORY 0INSTITUTIONS0| 1 180
40
20
PVT. 0NONFINANCIALQOI 20 _____20
14201
1965 1967 1969
MARKET YIELDS-U.S. GOVT. SEC.PER CENT 7 1 l "l TTTTTTT T 7
1.YEAR BILLS*
5-YEARISSUESFEB 634
S FEB 6 30
3*INVESTMENT YIELD BASIS
Slllllt ll lt I IIII 1
M\ R. JUNE 1967 1969
IV - 1
INTERNATIONAL DEVELOPMENTS
Contents Page
U.S. balance of payments IV - 1Foreign trade 4The 1968 balance of payments 5
The Euro-dollar market 11Foreign exchange market developments 12Financial developments in other industrial countries 15
U.S. balance of payments. It seems likely that the liquidity
deficit in the first quarter of 1969 will be among the largest on record.
Relatively complete figures for January and February show a deficit of
about $800 million (before seasonal adjustment) and incomplete weekly
figures for March through the 19th would add a further deficit probably
in excess of $500 million. Since the first quarter is seasonally favor-
able, the seasonal adjustment will raise the recorded deficit for the
quarter by some $400 million. Thus, unless there is a turnabout in the
final days of the quarter, the recorded deficit (seasonally adjusted)
would be comparable to the $1.7 billion registered in the final quarter
of 1967.
Measured on the official settlements basis, however, the first
quarter will show a very large surplus. Through March 19 this totaled
about $1.5 billion before seasonal adjustment, and about $1 billion
seasonally adjusted. The sharp contrast with the deficit on the liquidity
basis results primarily from the rapid growth in liabilities to foreign
branches of U.S. banks, which, however, was offset in part by a decline
in U.S. liabilities to other commercial banks abroad. From the beginning

IV - 2
of the year through March 19, liabilities to U.S. branches increased
by $3.8 billion. This measurement tends to exaggerate the growth of
these liabilities however; if measured from the previous peak on
December 11 the increase would be $2.4 billion.
The data currently in hand do not fully account for the great
size of the liquidity deficit as compared with the year-ago first-quarter
deficit of about $700 million (seasonally adjusted). Foreign purchases
of U.S. equity securities for instance, were very high this January
at $365 million, and partial figures for February indicate that although
there was some decline the inflow was still on the order of $200 million.
Last year the two-month inflow to purchase corporate equities was only
about $250 million. Similarly, bank-reported claims on foreigners were
reduced by $384 million this January, and do not appear to have increased
significantly in February; last year the inflow of banking capital for
the two months was about $175 million.
A major negative factor has been the squeeze on the trade balance
resulting from the dock strike, which is discussed below. The net effect,
as compared to the first quarter of last year, could be over $1/2 billion.
It is still expected that the shortfall in the trade balance caused by
the strike will be made up in the second quarter.
There has been a reduction so far this year in receipts from
foreign governments under special arrangements with the Treasury
(including receipts under the German offset agreement). In the first
quarter of 1968 such receipts totaled $395 million, while through

IV - 3
March 19 this year they were only about $50 million. A major problem
this year, insofar as the published liquidity deficits are concerned,
is the difficulty of replacing the $2.7 billion of special receipts
from foreign governments that reduced that deficit in 1968.
An alternative way of stating the balance of international
transactions, which is still far from satisfactory but avoids some
of the pitfalls of the two conventional methods, is to take the sum
of official settlements and changes in liabilities to foreign commercial
banks. For the year 1968 this sum showed a deficit of $1.8 billion,
and in the first quarter of 1968 $1.2 billion (seasonally adjusted).
On the same basis the deficit this year through March 19 was on the
order of $1-3/4 billion, with a rough seasonal adjustment.
This measure is not affected either by shifts between U.S.
liabilities to foreign official reserve holders and U.S. liabilities
to the Euro-dollar market (as the official settlements balance is) or
by changes in the maturity of claims on the United States held by
foreign monetary authorities (as the liquidity balance is). This
measure serves, therefore, as a useful measure of the changes in all
other international transactions, though not in itself as an indicator
of the absolute degree of disequilibrium.
An adequate explanation of the first quarter deficit this
year must wait until the data on merchandise trade are available and
can be adjusted for the effects of the strike, and until there is some
indication of the course of capital outflows by corporate investors
during this period.
IV - 4
Foreign trade. As expected, U.S. exports and imports in
January were badly distorted by the dock workers' strike which began
on December 20, 1968. The strike lasted until February 15 in the
port of New York; most other ports reopened by the end of February
except for Boston and West Gulf ports which were still closed as of
March 26.
In December the strike, and an anticipation of it, caused
exports to be a little lower and imports a little higher than would
otherwise have been recorded. In January there was a small trade
surplus (on the balance of payments basis) as exports fell somewhat
less from their December level than did imports--30 per cent versus
33 per cent.
In February1 / , imports began to recover more rapidly than
exports, rising by more than one-third from the low January figures;
exports advanced by less than 15 per cent. Consequently a large
trade deficit was recorded in February. Evidently the huge backlog
of cargo from the many vessels waiting to be unloaded had to be
cleared from the port area before outbound cargo liftings could begin.
In addition, the value of waterborne cargo imports through New York,
which reopened earlier than other ports, is greater than for exports.
It is expected that the value of both exports and imports will be
exceptionally high in March, though with imports still in the lead,
and also through most of the second quarter when an export surplus
should emerge. The underlying trade trends may not be apparent for
some time.
1/ February trade data are STRICTLY CONFIDENTIAL until released bythe Bureau of the Census on March 27 or 28.

IV - 5
Exports of agricultural products were particularly hard hit
by the strike; they fell by more than two-thirds from December to
January. The bulk of these commodities are exported through Gulf
ports, some of which are still on strike. As a result, the weakness
in such exports, apparent even before the strike, may be accentuated
as foreign buyers turn to other suppliers.
The 1968 balance of payments. Most of the highlights of the
1968 balance of payments are already generally familiar, but it may be
useful to review the full set of data to be issued by the Commerce
Department next week (Strictly Confidential until publication). Net
exports of goods and services were a little under $2 billion for the
year as a whole, but at an annual rate of only about $800 million in
the fourth quarter. Income and fees from direct investments were
somewhat lower than in the third quarter, though for the year as a
whole these receipts rose by $1/2 billion to $6.2 billion. Military
expenditures continued to rise, reaching an annual rate of $4.7 billion
in the fourth quarter, while military exports were down from their third
quarter peak.
As may be seen in the following table, the balance on goods
and services was very sharply reduced during 1968 with Europe (especially
the E.E.C.), Canada, and Japan. Small gains were registered primarily
in transactions with Latin America and the grouping of Australia,
New Zealand and South Africa.

IV - 6
REGIONAL DISTRIBUTION OF TRANSACTIONS IN GOODS AND SERVICES(in millions of dollars)
1967 1968 Change
Balance of goods and services 4,768 1,965 -2,803United Kingdom 227 -120 -347EE.C. 237 -664 -901Other Western Europe 39 -104 -143Eastern Europe 19 19 0Canada 705 -86 -791Other Western Hemisphere 1,420 1,614 +194Australia, New Zealand, and
South Africa 904 986 +82Japan -591 -1,403 -812Other Asia and Africa 2,166 2,014 -512International and unallocated -359 290 +69
In most cases the year-to-year change reflected shifts in the
merchandise trade balance. For Canada, heavy deterioration in the trade
balance was offset somewhat by lower U.S. tourist expenditures and higher
income on investments. There was a small increase in the trade balance
with Latin America, as well as some gains in income receipts. With the
area "Other Asia and Africa" our trade balance worsened by over $500
million between 1967 and 1968, and military expenditures rose by nearly
$200 million, but there was an increase of nearly $400 million in income
receipts and a sizable increase in military sales.
In the capital accounts, the main new information given in
the Commerce data relates to the behavior of U.S. corporate investors.
The following table summarizes those categories of capital flows that
reflect either investment abroad by direct investors or their activity

IV - 7
in obtaining financing abroad for their direct investment operations.
The border lines are not precise--for example, some of the long-term
borrowing was probably for other purposes--but the figures indicate
the main developments. Between 1967 and 1968 the net outflow of
corporate funds, after netting out proceeds of foreign borrowing,
dropped from $2.6 billion to $0.9 billion. Moreover, the effect of
the restraint program, and perhaps the tightening of U.S. credit
sources, shows up very sharply in the fourth quarter, when there was
a net inflow of over $600 million. In that quarter foreign borrowing
by U.S. parent companies accelerated, and Euro-bond issues continued
large. In addition, foreign subsidiaries also borrowed in large
volume from Euro-dollar and other sources and reduced their accounts
payable to parent companies, so that the net direct investment outflow
(first line of the table) was reduced to less than $200 million.
SELECTED CAPITAL TRANSACTIONS OF DIRECT INVESTORS(in millions of dollars)
19681967 Total I II III IV
(Seasonally Adjusted)Direct investment
capital outflow (-) as shown inbalance of payments accounts -3,020 -2,743 -374 -1,035 -1,168 -167
New issues (+) sold to foreigners 446 2,190 581 585 588 436
Long-term liabilities toforeigners (+) 89 687 154 176 26 331
Short-term investment abroad (-) offunds obtained through foreignsecurity issues 1/ -96 -1,073 -393 -522 -206 48
Total: net outflow of U.S. funds -2,581 -939 -32 -796 -760 6481/ This represents an estimate of the amount of the proceeds of new issues
sold abroad (but not the proceeds of other borrowings) that was retained abroadin liquid form. Such funds do not result in a balance of payments saving untilused for direct investment (substituting for the use of U.S. funds) or returnedto the U.S.

IV - 8
Balance-of-payments savings attributable to the control program
were even greater than the $1.6 billion decline in net outflow of U.S.
funds for 1967 and 1968 shown in the table, for two reasons: The exempted
net outflow to Canada included in these figures rose by about $150 million,
and the net return flow of liquid assets not covered in the table to meet
the requirements of the program was probably over $1/4 billion.
The tabulation also shows that in the first quarter of 1968,
when the companies were not clear how the program operated, there was
only a very minor net outflow of U.S. funds. In contrast, a considerable
part of the large deficit in the first quarter of 1969 probably reflects
a large net outflow of U.S. funds for direct investment. Certainly
there is ample room under the 1969 restraint program for a substantial
rise in corporate outflows. The ceilings themselves will be substantially
higher; even the modifications proposed last November would have permitted
an increase of about $300 million, and further easing, both in absolute
ceilings and in specific kinds of investment activity, is generally
expected. To this must be added the very large carryover of unused
investment allowable from 1968 to 1969--though not all of this will be
used this year.
Plans by U.S. companies for expenditures abroad on plant and
equipment in 1969 show a rise of 7 per cent after a slowdown
in 1968 that was probably attributable in part to the new controls.
Growth in investment outlays for manufacturing facilities in Canada
slowed very abruptly beginning in 1967, and in Europe last year. The

IV - 9
continued strong growth in the extractive industries (which includes
sizable outlays for tankers) shows up mainly in Latin America and
"Other areas".
CHANGES IN PLANT AND EQUIPMENT EXPENDITURES OFFOREIGN AFFILIATES OF U.S. CORPORATIONS
(per cent)
TotalBy industryManufacturingMining and smeltingPetroleumOther industries
By areaCanadaLatin AmericaEuropeOther areas
Actua 11965 to 1966 to
1966 1967
16 7
18 -225 1411 1914 9
28 -62 16
23 113 9
The levelling off in outlays for foreign manufacturing plants
is heavily influenced by a decline for the chemical industry, which in
recent years had been especially active. All other manufacturing sectors
combined project a 9 per cent increase in outlays in 1969. These figures
indicate that though the hectic pace of the pre-1967 foreign expansion
has slowed, there is still a strong urge to expand abroad. The absolute
amount of the increase in foreign plant and equipment expenditures this
year is projected at about $3/4 billion.
Foreign financing for these investments, and for working
capital of the foreign affiliates, is now considerably less easy to
Estimated1967-68
3
-614119
-426
-1018
Projected1968-69
7
1131122
312214

IV - 10
obtain than last year. Sales abroad of new issues to finance direct
investments remained high in the first quarter at over $1/2 billion,
but in March such issues slowed down.
Another striking feature of the 1968 balance of payments
was the dramatic increase in the flow of foreign private capital to
the United States. As shown below, the inflow in nonliquid forms
reached $5.8 billion, nearly triple the already high amount for 1967.
A large part of this ($2.8 billion) has already been counted above as
an offset to U.S. direct foreign investments. Other large inflows
included $1.9 billion to purchase outstanding U.S. corporate securities
(mostly stocks), a record inflow of $.4 billion for direct investments,
and another record inflow of $.7 billion to U.S. non-banking concerns.
Some of the latter may have been used by direct investors, but another
very large part--about $300 million--is accounted for by an increase
in accounts of foreigners with U.S. securities dealers and brokers.
This was no doubt related to the increased volume of dealings in U.S.
securities; it was partially offset by an increase of about $200 million
for the year in U.S. dealers' accounts due from foreigners.
1/INFLOW OF PRIVATE FOREIGN CAPITAL-1
(in millions of dollars)
TotalNon-liquid
Direct investmentsPurchases of U.S. corporate securitiesNew issues to finance U.S. direct foreign
investmentsOcher corporate securities
Long-term liabilities of U.S. non-banksShort-term liabilities of U.S. non-banks
LiquidForeign commercial banksOther private foreigners
1/ Excludes flows for foreign official accountsorganizations.
1967 1968
3,750 9,5222,076 5,772
250 3631,349 4,056
(446) (2,190)(903) (1,866)
89 687388 666
1,675 3,7501,262 3,382
413 368and international and regional

IV - 11
The Euro-dollar market. Euro-dollar interest rates have
changed little during the first three and a half weeks of March,
remaining at or close to their record levels established during the
first few days of the month. One-, three- and six-month deposits
have remained around 8-1/2 per cent per annum. One-year deposit
rates have been relatively steady at about 8-3/8 per cent; call
deposit rates have remained close to 7-7/8 per cent.
Since February 26 the liabilities of U.S. banks to their
foreign branches have increased nearly $1.0 billion and totaled
$9.8 billion on March 19. Supplies of funds to the Euro-dollar
market in March have probably come from a wide range of sources.
The German and Italian central banks have no longer been encouraging
their commercial banks to place funds abroad, and indeed the Bank of
Italy is now moving in the other direction (see page IV - 12 below).
Early in the month, movements out of francs may have been a source of
supply. The widespread weakness of European currency exchange rates in
March suggests that the high Euro-dollar interest rates have exerted
a pull on funds from many directions. It is possible--though confirmatory
data are not available--that funds of U.S. corporations and investors
withdrawn from domestic CD's have been moving indirectly into the Euro-
dollar market. Placement of funds in U.S.-dollar deposits with Canadian
banks is not contrary to any U.S. regulations or guidelines, and under
the Canadian "pass-through" guidelines the banks there may have had
some leeway to put funds in London. Similarly, U.S. funds could have

IV -12
been moving to and through corporate affiliates abroad without con-
travening regulations, since the very large foreign borrowing done
by direct investors and their affiliates last year generated large
"carryovers" for companies to add to their 1969 "allowables."
SELECTED U.S. MONEY MARKET RATESAND EURO-DOLLAR RATES
(weekly average of daily figures)
Average (1) (2) (3) (4) (5) (6)for Call = (1)-(2) 3-month 3-month =(4)-(5)
week Euro-$ Federal Differ- Euro-$ Treasury Differ-ending Deposit Funds ential Deposit Bill ential
Jan. 8 7.67 6.43 1.24 7.45 6.18 1.27
Feb. 5 7.30 6.32 0.98 7.56 6.19 1.37
Feb. 26 7.80 6.43 1.37 8.24 6.06 2.18Mar. 5 7.90 6.75 1.15 8.34 6.16 2.18
12 7.92 6.76 1.17 8.49 6.03 2.4619 7.85 6.82 1.03 8.51 6.02 2.4926 7.82 6.82- 1.00 8.48 5.94 2.54
p/ preliminary
Foreign exchange market developments. Most foreign currencies
were generally under selling pressure during March, reflecting the
continued pull of high Euro-dollar rates and seasonal payments imbalances
in some cases. The major exception was the rate for the Swiss franc,
which climbed to its upper limit early in the month in response to
tightening financial markets in Switzerland. Late in the month demand
for both the Canadian dollar and Italian lira strengthened moderately,
the latter in response to measures taken by the Bank of Italy to contain
the outflow of funds from Italy into the Euro-dollar market.

IV - 13
The market for sterling was generally weak during March. In
late February and early March stronger demand for the pound pushed the
exchange rate to its highest level since last May--$2.3960. However,
rumors of a franc devaluation during the first week of the month
caused heavy selling pressures to develop against sterling. As the
month came to a close sterling was displaying greater firmness. The
discount on forward sterling widened sharply from 2.0 per cent per
annum to 3.7 per cent at the time of growing anxiety over the French
franc parity, but recently it has narrowed to 2.5 per cent.
The German mark was under fairly constant selling pressure
throughout March, partly reflecting sales of marks for dollars by
parties with maturing forward contracts to deliver dollars to the
Bundesbank. The Bundesbank sold over $1 billion on an outright spot
basis and about $250 million on a swap basis (although its swap rate
was no more attractive than the market rate during the four weeks ending
March 26.) However, receipts from maturing forward contracts totaled
slightly more than $1 billion, leaving Bundesbank reserves practically
unchanged for the month as a whole.
Early in March selling pressure on the French franc increased
in response to growing uncertainty about the outcome of wage negotiations
and the scheduling of a one-day strike on March 11. At the high point
of the anxiety about the franc, the discount on 3-month forward francs
rose to 21 per cent per annum. By the end of the month, however, this
discount had narrowed to 12 per cent.

IV - 14
The Bank of Italy allowed the lira exchange rate to drop to
its lower limit early in March--the first time the lira rate had been
that low in several years. Its support during the second and third
weeks of March cost the Bank $120 million. However, on March 24 the
Bank of Italy announced measures to induce an inflow of short-term
bank funds into the country, which gave a fillip to the lira market.
The price of gold in London rose to a new peak level of
$43.83 an ounce in early March, as French residents reportedly rushed
to purchase gold illegally outside the country in the face of rising
anxiety about developments in France. More recently the gold price has
been around $43.20 to $43.30 an ounce.

IV - 15
Financial developments in other industrial countries. Financial
markets have tightened in most industrial countries since last autumn because
of domestic demand pressures and, in some instances, in reaction to capital
outflows from these countries as a result of United States monetary policy
and sharply rising Euro-dollar interest rates. Three-month Euro-dollar
deposit rates rose by about 1-1/4 percentage points from end-December to
mid-March, a direct result of the $3.4 billion increase in American
banks' borrowings from foreign branches during this period.
A substantial rise in short-term interest rates in all other
industrial countries except Japan and Italy since late 1968 has accompanied
the sharp increase in Euro-dollar rates. Several central banks, particularly
those in countries experiencing inflationary pressures, recently have
moved defensively by raising their discount rates: Belgium, Canada, the
Netherlands, Sweden and the United Kingdom. France, facing a serious
balance of payments problem, has since November been restraining short-
term outflows through exchange controls as well as through monetary
policy.
In Germany, short-term rates remain relatively low but the
market has tightened somewhat in the past several weeks. To counter the
tendency of rates to rise, the Bundesbank since late January has discouraged
short-term capital outflows by the German commercial banks. Of all
European countries Italy probably has experienced the least rise in its
short-term interest rates, but the Bank of Italy's concern about its
official reserve position has led it to take measures to force a reflow

SHORT-TERM INTEREST(Per
RATES IN INDUSTRIAL COUNTRIES1 /cent per annum)
1968 Recent Dates_____ ___Low _Hih 12/6 1/3 1/31 2/28 3/14 3/21
4.50 (Jan.)5.44 (Feb.)
6.44 (Oct.)6.94 (Nov.)
1.00 (Nov.)3.22 (Jan.)
2.75 (May)
4.75 (Feb.)5.02 (Feb.)
United KingdomTreasury billLocal authority
GermanyCall money3-month inter-bank
SwitzerlandS 3-month bank deposit
FranceCall money12-month Treasury bill
Belgium3-month Treasury bill
Netherlands3-month local authority
JapanCall loans repayable onday's notice
Canada91-day Treasury bill
8.00 (Dec.)7.94 (Mar.)
7.38 (Feb.)8.50 (June)
4.75 (Dec.)4.75 (Oct.)
4.25 (Dec.)
15.00 (Nov.)8.41 (Dec.)
3.75 (Sept.) 5.00 (Dec.)
4.44 (Sept.) 6.69 (Dec.)
7.30 (Nov.)
5.31 (Aug.)
8.40 (Aug.)
6.79 (May)
Euro-dollarCall3-month
1/ Rates shown are Friday rates or rates for the nearest date if Friday rates were not available.
6.56 7.50 7.12 7.88 7.88 8.127.06 7.25 7.56 8.44 8.50 8.50
6.69 6.63 6.58 7.55 7.64 7.647.50 8.00 8.00 8.63 8.63 9.00
2.00 3.12 3.50 3.50 3.44 3.944.56 4.50 3,88 3.88 4.12 4.38
4.25 4.00 4.00 4.38 4.38 4.75
8.12 8.25 7.75 8.00 8.12 8.258.11 8.71 8.56 8.60 8.85 n.a.
4.50 5.00 5.40 5.70 5.95 5.95
6.13 6.25 5.94 6.56 n.a. n.a.
7.30 n.a. 7.30 7.67 7.67 n.a.
5.54 6.15 6.18 6.24 6.43 6.43

LONG-TERM INTEREST RATES IN INDUSTRIAL COUNTRIES'/(Per cent per annum)
1968_ _ Rcent Dates________ _ ___ Low High 12/6 1/3 1/31 2/28 3/14 3/21
Euro-dollar bondsForeign governments
United Kingdom3-1/2% War Loan
Germany6% public authority
FrancePublic sector
ItalyComposite2 /
BelgiumGovernment! /
NetherlandsGovernment
Japan 2Bank debentures-Tel. & Tel. bondsg/
Canada4-1/2% 1983Government (average)
7.38
7.12
6.19
6.45
6.48
6.44
6.21
8.008.03
6.456.43
(Feb.)
(Jan.)
(Oct.)
(May)
(Feb.)
(June)
(Jan.)
(Aug.)(Aug.)
(Aug.)(Aug.)
7.81 (July) 7.53
8.08 (Dec.) 8.01
6.88 (Mar.) 6.21
7.06 (Dec.) 6.87
6.55 (June) 6.52
6.63 (Dec.) 6.63
6.71 (Dec.) 6,50
8.84 (June) 8.678.83 (June) 8.66
7.48 (Mar.) 7.277.30 (Dec.) 7,07
7.54
8.05
6.21
7.02
n.a,
6.65
6.71
8.828.71
7.357.27
7.54 7.41
8.46 8.54
6.19 6.19
7.30 7.28
* *" n.a.
. 6.76
6.83 7.01
* n.a.S n.a.
7.29 7.417.16 7.20
7.42
8.75
6.24
7.38
n.a.
n.a.
n.a.
n.a.n.a.
7.487.23
7.42
8.82
n.a.
n.a.
* *
7.467.30
1/ Rates shown are Friday rates, or rates2/ Monthly average.3/ Beginning of month.
for the nearest date if Friday rates were not available.-- -I -~~--- -L--- I--I -I"-----I-'Y-~----~
IV - 18
over the next several months of Italian funds from the Euro-dollar
market. Swiss rates have also risen somewhat in reaction to Euro-dollar
rates and rates in other money markets. Japanese interest rates are
little changed, at levels which until recently were high enough to
encourage Japanese importers to borrow abroad.
Long-term interest rates in the U.K., France and the Netherlands
have increased substantially since early December, while elsewhere long
rates have increased only slightly. The German bond market tightened in
recent weeks, but the authorities are trying to moderate the rise in
long-term rates. The future course of long-term rates in Germany is of
particular significance since a major increase in German rates relative
to those in other countries could undermine Germany's policy of attaining
balance of payments equilibrium through the export of long-term capital.
There has been a definite tightening of short-term credit
markets in Germany in the last several weeks. From November through
February, German short-term rates had moved contrary to usual seasonal
changes. During and just after the period of large speculative inflows
to Germany, rates had been unusually low. After the turn of the year,
instead of easing off seasonally, they rose as a result of the massive
outflow of funds from Germany into the Euro-dollar market and the ebbing
of speculation on the mark. Commercial banks increased their foreign
assets by about $900 million from end-November to end-January, while their
liabilities to foreigners fell by nearly $700 million. As the Bundesbank
became concerned at the effect of this outflow on domestic liquidity, in
late January it increased the cost of forward cover it would provide

IV - 1
through mark-dollar swaps with commercial banks. This greatly reduced
the banks' incentives to export dollars on a covered basis, and in
February the net foreign position of the German commercial banks fell
by $275 million. Banks, however, may be placing funds abroad on an
uncovered basis.
Despite the rise in German short-term interest rates this year,
they remain relatively low. The net advance to mid-March since August-
September, for example, has been only from 3-1/2 per cent to 4-3/8 per cent
for three-month interbank loans and from somewhat under 3 per cent to
about 4 per cent for call loans.
Long-term interest rates have been essentially stable since
September, but since the beginning of March yields on long-term govern-
ment bonds have begun to creep upward again.
As the economy moves closer to capacity operation, the German
authorities are switching from a moderately expansive to a cautiously
restrictive policy stance, while endeavoring to hold back the rise in long-
term interest rates. For the moment, policymakers are relying primarily
on selective fiscal and trade measures to moderate the expansion. Following
a March 18 Cabinet meeting, the Federal Government announced measures
delaying government expenditures, accelerating tax collections, and
raising certain import quotas.
Certain monetary control measures have also been taken recently.
Just as the Bundesbank's policy on dollar-mark swaps tends to keep interest
rates from rising, so these measures are largely precautionary, with

IV - 20
little immediate effect on rates. On March 3, the Bundesbank reached
an agreement with the federal government and the railway and postal
authorities to discontinue the use of central bank credit in supporting
the prices of their bonds. This move had no immediate impact, since the
Bundesbank had not been a net purchaser of bonds since October. On
March 20, the central bank further announced a reduction in rediscount
quotas for financial institutions, amounting to 20 per cent for commercial
banks. This move, too, will have little immediate effect since banks at
present are well below their quotas, but it is a clear sign of the
Bundesbank's concern over the potential inflationary situation. In
another small policy move, the Bundesbank raised its Lombard rate, at
which it makes advances against securities, from 3.5 to 4 per cent.
It remains to be seen whether fiscal policy measures will
effectively contain aggregate demand and upward price pressures within
bounds that the German authorities regard as tolerable. It is reasonable
to assume that the Bundesbank would prefer not to have to tighten its
policy severely, since continued capital exports are necessary to prevent
Germany's large current account surplus from straining the international
monetary system.
The British government remains committed to a policy of credit
restraint, and on several occasions in recent months the authorities have
taken action to intensify restrictions on credit to the private sector.
Installment purchase terms were tightened, effective November 2, and

IV - 21
from October through January there was a steady decrease in the amount
of installment credit extended, reversing the upward trend of April
through October.
At the end of November, the Bank of England sought to curtail
bank lending to the private sector by requesting the clearing banks to
reduce by mid-March their outstanding loans (seasonally adjusted) to
98 per cent of the amount outstanding in mid-November 1967. Certain
loans for exports and shipbuilding were exempted from this ceiling.
This credit ceiling request met with strong opposition from
the clearing banks, and the 98 per cent level was not reached by mid-March.
Indeed, from mid-November to mid-February, total clearing bank loans
(seasonally adjusted) increased by 4 per cent. While some of the
increase was undoubtedly accounted for by exempt credits, the Bank
of England has acknowledged that there was some increase even in loans
subject to the ceiling. Despite the resistance from the banks, the
government continues to insist that the target be reached, although
it no longer specifies the date by which the reduction must be achieved.
Paradoxically, while urging the banks to restrict credit to the
private sector, the Bank of England's support operations in the securities
market at the tine of the international currency crisis in November--
when heavy purchases of short-maturity government bonds were made--had
the effect of moderating the rise in short-term interest rates and
facilitating bank credit expansion. On February 27, in a move explicitly
characterized as an antidote to the increase in bank loans, the Bank

IV - 22
of England increased its discount rate from 7 to 8 per cent, bringing
this rate back to the level set immediately following devaluation in
November 1967. Loan rates of the banks are closely tied to the discount
rate, and it is expected that the increase in rates should ease somewhat
the banks' credit rationing task.
Short-term interest rates in the U.K. have been rising since
end-November in line with attempts at credit restriction at home and
rising rates in the Euro-dollar market. The yield on 90-day local
authority deposits, which stood at 7.75 per cent just prior to the change
in the discount rate, had climbed to 9 per cent by mid-March, almost
2 percentage points higher than at end-November. The covered interest
differential was around 4 per cent in favor of Euro-dollar deposits over
local authority deposits in December, but has since dropped to slightly
under 3 per cent.
Long-term interest rates in Britain have also increased substan-
tially in recent months, much more than in other industrial countries,
despite a considerable improvement in the government's budget position.
The yield on the 3-1/2 per cent War Loan was some 70 basis points higher
in mid-March than at end-December. There does not seem to be any single
reason for this increase in long rates, but the movement is consistent
with heightened concern over continuing inflation and the future of
sterling, as well as expectations of even higher short-term rates in
the near future.
IV - 23
Interest rates in France, both short- and long-term, have
shown sizable increases since the franc crisis in late November. This
has resulted more from a restrictive credit policy domestically than
from a flow of funds abroad, since French money and capital markets are
largely isolated from foreign markets by the existence of tight exchange
controls imposed after the November crisis--though some capital is being
exported in the form of bank notes. In December, stringent regulations
were issued regarding foreign exchange cover for import contracts.
In January, the Bank of France acted to require commercial banks with net
asset positions in foreign currency to deposit these net assets with the
Bank of France in three installments.
Domestically, banks were instructed to reduce their short-term
credits by mid-January to the level of September 30, and to expand such
credits by no more than 4 per cent above this level by end-June.
Treasury bill rates increased by about 60 basis points from
end-November to mid-January as a result of the French government's
increased reliance on short-term borrowing to finance its sizable budget
deficit, leaving more room in longer term markets for private and other
public sector borrowers. Long-term public sector bonds nevertheless
showed yield increases of over 40 basis points from end-November to
mid-January. Neither long rates nor short rates showed much change
from mid-January to early March. Call money rates, however, have risen
in the last few weeks, and other short-term rates also registered some
increases.

IV - 24
Short-term interest rates in Belgium have risen very rapidly
since end-November, and the Belgian National Bank has raised its basic
discount rate twice, from 3.75 to 4.50 per cent on December 19 and again
to 5 per cent on March 6. The discount rate increases in both cases were
aimed at reducing the loss of official external reserves. In connection
with the March 6 increase, Governor Ansiaux also mentioned a need to
moderate the rate of expansion of bank credit but there is little
evidence that aggregate demand in Belgium is likely to become excessive
in the near future. Belgian commercial banks' net foreign assets increased
by $48 million in the fourth quarter and a further $42 million in January,
reflecting the pull of high Euro-dollar rates.
Treasury bill rates increased by nearly 1-1/2 percentage points
between end-November and mid-March, reflecting both the capital outflow
and the discount rate increases. Long-term rates remain virtually
unchanged with long-term government bonds yielding just below 6 per cent.
In the Netherlands, the picture is again one of sharply rising
short-term rates, but here long-term rates have also shown a significant
increase since end-November. Three-month local authority rates increased
more than 60 basis points in the 3-1/2 months to mid-March, while long-
term government yields increased by about 50 basis points.
The interest rate increases in the Netherlands were closely
related to domestic inflationary developments and a move toward a policy
of credit restriction, although they too had been responsive to the outflow
of funds to the Euro-dollar market.

IV - 25
The Netherlands Bank increased its discount rate on December 20,
and on December 31 imposed ceilings on bank credit to the private sector,
These restrictive credit measures were part of a broader package including
tax changes, government expenditure restraints, and a partial price freeze
adopted to contain inflation in the domestic economy.
Interest rates in Switzerland have risen during the period under
review because of the pull exerted by rising rates in the Euro-dollar
market and some national money and capital markets outside Switzerland.
After a seasonal easing of the money market in early January, call money
rates moved up and reached the very high level of 8-1/2 per cent early in
March before dropping back to 7 per cent. The changes in the three-month
deposit rate have been less spectacular: after dropping from 4-1/4 to
4 per cent in the second week of January, this rate moved up to 4-3/8 at
the beginning of February and to 4-3/4 per cent in mid-March.
Bond yields were quite steady for most of the period but rose
somewhat in March, the composite yield on Federal government bonds advancing
from 4.40 to 4.55 per cent between February 28 and March 14.
In the fourth quarter, Swiss commercial banks reduced their net
foreign assets by $620 million. They increased them in October and
November, and then drew them down sharply in December to meet the year-end
currency drain and window-dressing needs. This was done in the usual way
by entering into dollar-franc swaps with the Swiss National Bank. In
January these swaps were completely unwound.

IV - 26
Almost simultaneously with the British Bank rate increase on
February 27, the Bank of Sweden raised its discount rate from 5 to 6 per
cent, effective February 28. This increase brought the Swedish discount
rate again to the level established in mid-December 1967, when the
Swedish currency came under speculative attack in the wake of sterling
devaluation. In 1968, the rate had been reduced to 5 per cent in two
stages, in February and October.
The most recent changes was prompted by the disparity between
Swedish interest rates and market rates elsewhere. Largely as a result
of outflows of bank funds attracted to other money markets, Swedish
official reserves declined by about $160 million in the three months
November-January. Sweden experienced a $200 million drain in the comparable
period in 1967-68, when the Swedish krona was under selling pressure.
For several months Italy has been experiencing upward pressure
on short-term rates arising from the outflow of funds to the Euro-dollar
market. The net outflow of private non-bank capital was $430 million in
the fourth quarter, up from $230 million a year earlier. Commercial banks'
net foreign assets increased by $210 million in December and January, as
rising Euro-dollar rates continued to pull funds abroad. This outflow
was made easier by a liberalization in December of the Bank of Italy's
policy on dollar-lira swaps with commercial banks whereby swaps were
permitted for all banks and not just those with net liability foreign
positions.

IV - 27
In February, the Bank of Italy became concerned about the
magnitude of the outflow and progressively raised the premium on forward
lire from 1 per cent to 5 per cent per annum. The Bank of Italy's concern
stems from the decline in its external reserves rather than the effect
of the capital outflow on domestic credit markets. In February banks
stopped adding to their swaps with the central bank because of their
high cost, and the banks' net foreign assets actually declined by $26 mil-
lion. On March 24, the Bank of Italy took the drastic action of requiring
Italian banks to reduce their net foreign assets (presently about $800 mil-
lion) to zero by the end of June.
Long-term interest rates, have remained stable for several
months, but are likely to experience upward pressure in coming months.
The government's program to raise social security pensions will be financed
in large part in 1969 by issuing Treasury bonds. Such new issues will
amount to 13 per cent of net new issues by government and private borrowers
in 1968. In view of the concern in Italy over the unsatisfactory rate of
growth, however, the Bank of Italy may try to prevent long-term rates
from rising substantially.
Interest rates in Japan have remained virtually unchanged in
recent months at a level which until recently was high enough to encourage
Japanese importers to borrow abroad. Bank credit expansion has been
accelerating, but the country's large balance of payments surplus has
provided liquidity to the banking system. Japanese importers are
reportedly putting pressure on the authorities to permit more import
financing from domestic sources owing to the sharply higher cost of

IV - 28
funds abroad. There are indications that the Bank of Japan and the
Ministry of Finance may move in the direction of allowing more yen
financing in view of Japan's very healthy external reserve position.
Such a move could mean that interest rates in Japan will soon join in
the upward trend of rates in other industrial economies. But there
are some signs of slackening growth in the economy and it is doubtful
that the Bank of Japan would permit a very sharp increase in domestic
interest rates.
Short-term interest rates in Canada in mid-March were substantially
higher than at end-November reflecting both a move toward monetary restraint
by the Bank of Canada, and the apparent capital outflow from Canada during
this period. The Bank of Canada raised its discount rate from 6 to 6-1/2 per
cent on December 18, and again to 7 per cent on March 3.
The first increase, immediately following the increase in the
Federal Reserve's discount rate, signaled a tighter monetary policy in
the face of domestic inflation. The Bank of Canada had probably wanted
to make such a move for some time, but did not want to attract short-term
capital from the U.S. The Federal Reserve's action, plus the relaxation
two days earlier of the Canada-U.S. agreement on Canada's official
reserve ceiling allowed the Bank of Canada to act.
The March 3 discount rate increase served to bring the rate
in line with market rates which had risen partly in response to higher
rates abroad. Yields on 91-day Treasury bills increased by some 90 basis
points in the 3-1/2 months to mid-March. The gross yield advantage

IV - 29
of Canadian bills over U.S. bills increased from nearly nil in
February to about 1/2 per cent on March 21. The covered interest
arbitrage moved from a few basis points in favor of New York in
January to about 50 basis points in favor of Canada in late February
and to 109 basis points on March 21.
In contrast to short-term interest rate movements, Canadian
long-term rates have increased by only about 20 basis points since
end-November, after having risen by over 50 basis points from end-August
to end-November. In view of the government's improved budget position and
consequently smaller government demands on the capital market for the
remainder of this year, long-term rates are not likely to rise substantially
over the next few months.

IV-C.1 3/25/69
U.S. AND INTERNATIONAL ECONOMIC DEVELOPMENTSSEASONALLY ADJUSTED
U S BALANCE OF PAYMENTS-CONT.
1966 1967 1968 1969
XPORTS OF MANUFACTURES - I
U.S. BANK CREDIT OUTFLOWS
1963 1965 1967 1969
LIAB OF US BANKS TO FOR. BRANCHES
1966 1967 1968 1969
0BILLIONS OF DOLLARS I I I I I I I I I 1
NOT SEASONALLY ADJUSTED 19 9
* END OF QUARTER

APPENDIX A: PROSPECTIVE DEMANDS ON THE MONEY AND CAPITAL MARKETS BY THEFEDERAL HOME LOAN BANKS AND THE FEDERAL NATIONAL MORTGAGE ASSOCIATION *
A feature of mortgage market developments is recent monthshas been the high level of commitment activity by the savings and loanassociations and the Federal National Mortgage Association. However,the pattern of inflows to the S&L's and the potentially increasedpressure on FNMA's resources--should lenders take down their commit-ments--point to the possibility of substantially increased borrowings-by these institutions to meet their commitments over the period ahead,Consequently, the staff estimates that the total new funds requiredby the Federal Home Loan Banks and the Federal National MortgageAssociation may amount to as much as $3 billion during the next twoquarters, of which borrowing would total about $2 billion, with thebalance coming from FHL Bank asset liquidations. The total volumeof funds obtained from all sources is about the same as during the lastperiod of credit stringency in 1966.
Savings and Loan Associations
Although experiencing more moderate inflows recently, thesavings and loan associations have apparently continued to approve newcommitments at an advanced rate. Since June, the seasonally adjustedannual rate of commitments outstanding at all savings and loan associa-tions has increased each month through February, while the monthlyvolume of loans closed has remained relatively high, (See table inFinancial Section of the Greenbook - "Mortgage Market".) The stimulusfor such a high rate of new commitments arises in part from the desireof associations to lock-up attractive yields as well as assurance fromthe Federal Home Loan Bank Board that expansion advances would be granted.
The ability of S&L's to finance current take downs from thebacklog of commitments, and to meet some part of future demand, dependsof course on the pattern of future net savings inflows--especially duringthe March-April reinvestment period. If, for example, the S&L's suffera serious loss of funds in April as a result of depositor withdrawals tomeet 1968 income tax payments and to take advantage of higher yieldingmarket securities, the association would be forced to borrow heavily fromthe Federal Home Loan Banks.
Taking a longer view, our best "guess" is that net inflowsfrom share capital over the second and third quarters--assuming thecurrent level of market yields--will be off about a third from the 1968pace. With higher market interest rates expected to heighten borrower
* Prepared by Fred Taylor, Economist, Capital Markets Section, Divisionof Research and Statistics.

A-2
reluctance to repay debt ahead of schedule, repayment flows over thesame period may total about $7.2 billion--somewhat below the 1968 rate.
At the projected rate of take downs, S&L's would be required
to finance about $12 billion in new home loans over the next two quarters.
If as seems possible, total inflows from savings capital and mortgage
portfolios will aggregate no more than $9.2 billion within the period,
and assuming that associations will reduce liquid assets by no more than
$700 million,*S&L's would need to borrow a net of over $2 billion in thenext 6 months. At present, the FHL Banks have enough resources to
finance at least one-half of the $2 billion total by liquidating theirportfolio assets--mainly short-term bills. Assuming that the FHL Banks
do not draw down their resources below $300 million--the low for 1966--this will leave an additional $1 billion of net new money to be borrowed.
Federal National Mortgage Association
The Federal National Mortgage Association, which helps tosupport the government-underwritten home mortgage market through its
weekly forward comitment "auction" system, has come under increaseddemand for its funds over the past several months. Mortgage purchases
by FIMA have risen in each month since October as bidders (for themost part mortgage companies) have found it increasingly difficult to
obtain commitments for FHA and VA mortgages from other sources. As
the volume of FNMA's outstanding commitments have increased, the ratioof takedowns to commitments scheduled to mature has advanced from 65per cent to more than 96 per cent, the highest since the auction systembegan in the spring of last year. 1/
Since January, demand for FNMA's new commitments has intensi-fied following the upward adjustment in the FHA and VA ceiling rate to
7-1/2 per cent on January 24, as bidders attempted to lock-up large
volumes of FNMA's forward purchase commitments at what they consideredto be favorable prices. Since this date, FNMA has raised its averageweekly volume of accepted bids in a desire to accommodate the increaseddemand and to stabilize yields. FNMA's weekly commitment volume wasincreased to over $90 million, over a third higher than during theearlier May-December period.
Taking account of the volume of outstanding commitmentsscheduled for near-term takedown, the recent takedown ratio, projectedfuture offerings, and assuming no significant reduction in marketinterest rates, FMMA mortgage purchases during the second quarter may
1/ Ratio of takedowns to commitments is the per cent of commitments*scheduled to expire during a month that were actually taken down.

A-3
average $180 million a month. An additional $230 million a month maybe acquired during the third quarter. Of the total $1.1 to $1.3 billionprojected to be taken down within the next two quarters, 80 per cent ornearly $1.0 billion may have to be financed by issuing additional short-term and longer-term credit instruments. 2/
Table 1
Commitments and Takedown Under the FNMA
"Free Market System"(millions of dollars)
Commitment BacklogNew Commitments Takedowns (End of month)
1968
May 191,3 -- 191.3June 295.9 8.0 479.2July 393.7 44.1 817.2August 232.3 87.1 963.4September 219.9* 85.6 1,039.1October 169.8 124.7 1,091.4November 211.9 130.3 1,166.5December 289.3* 145.0 1,190.2
1969
January 240,1 191.4 1,206.2February 383.4 199.4 1,380.2March 348.7e 210.Oe 1,518.9e
* 5 Auctions were conducted during the month.e/ Estimated.
Because higher interest rates have discouraged prepayments,FNMA cannot rely on repayments from its portfolio to finance a majorportion of its mortgage purchases. In order to help accommodate takedowns, FNMA has been issuing short-term discount notes (average maturityis less than three months) purchased primarily by State and local pensionand retirement funds. By the end of February, these outstanding noteshad increased by over $1 billion since the end of 1967 and totaled more
2/ The remaining 20 per cent would be financed through FNMA earnings,funds derived through sale of stock, the commitment fees, andmortgage repayments.
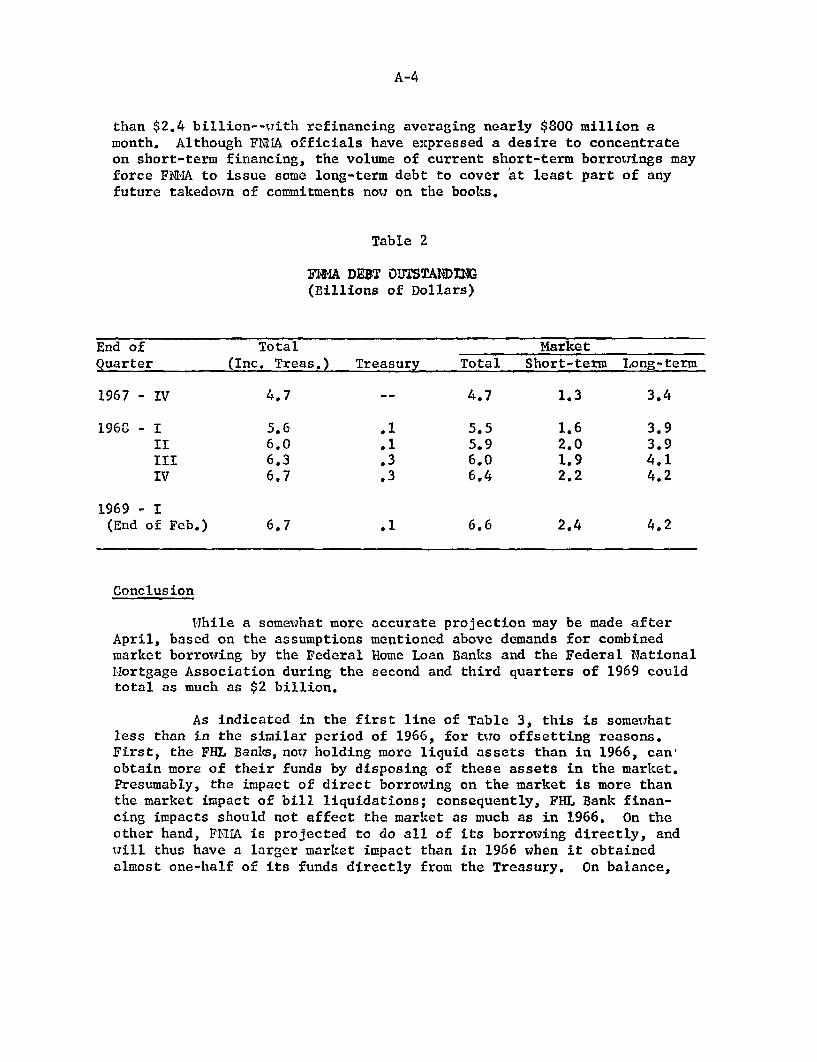
A-4
than $2.4 billion--with refinancing averaging nearly $800 million amonth. Although FNHA officials have expressed a desire to concentrateon short-term financing, the volume of current short-term borrowings mayforce FNMA to issue some long-term debt to cover at least part of anyfuture takedown of commitments now on the books.
Table 2
FNMA DEBT OUTSTANDING(Billions of Dollars)
End of Total MarketQuarter (Inc. Treas.) Treasury Total Short-term Long-term
1967 - IV 4.7 -- 4.7 1.3 3.4
1968 - I 5.6 .1 5.5 1.6 3.9II 6.0 .1 5.9 2.0 3.9III 6.3 .3 6.0 1.9 4.1IV 6.7 .3 6.4 2.2 4.2
1969 - I(End of Feb.) 6.7 .1 6.6 2.4 4.2
Conclusion
While a somewhat moreApril, based on the assumptionsmarket borrowing by the FederalMortgage Association during thetotal as much as $2 billion.
accurate projection may be made aftermentioned above demands for combinedHome Loan Banks and the Federal Nationalsecond and third quarters of 1969 could
As indicated in the first line of Table 3, this is somewhatless than in the similar period of 1966, for two offsetting reasons.First, the FHL Banks, now holding more liquid assets than in 1966, canobtain more of their funds by disposing of these assets in the market.Presumably, the impact of direct borrowing on the market is more thanthe market impact of bill liquidations; consequently, FHL Bank finan-cing impacts should not affect the market as much as in 1966. On theother hand, FNMA is projected to do all of its borrowing directly, andwill thus have a larger market impact than in 1966 when it obtainedalmost one-half of its funds directly from the Treasury. On balance,
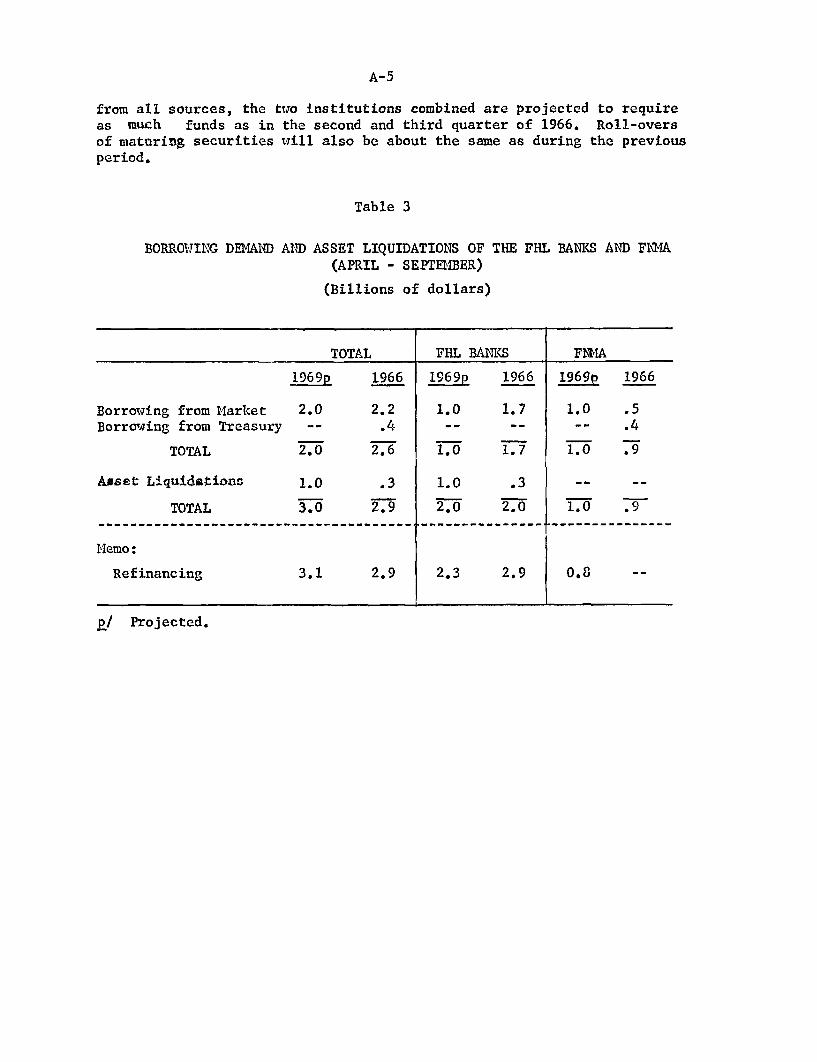
A-5
from all sources, the two institutions combined are projected to requireas much funds as in the second and third quarter of 1966. Roll-oversof maturing securities will also be about the same as during the previousperiod.
Table 3
BORROWING DEMAND AND ASSET LIQUIDATIONS OF THE FHL BANKS AND FNMA(APRIL - SEPTEMBER)
(Billions of dollars)
TOTAL FHL BANKS FNMA
19 6 9p 1966 19 6 9p 1966 1969p 1966
Borrowing from Market 2.0 2.2 1.0 1.7 1.0 .5Borrowing from Treasury -- .4 -- -- -- .4
TOTAL 2.0 2.6 1.0 1.7 1.0 .9
Asset Liquidations 1.0 .3 1.0 .3 -- --
TOTAL 3.0 2.9 2.0 2.0 1.0 .9
Memo:
Refinancing 3.1 2.9 2.3 2.9 0.8
p/ Projected.