Embed Size (px)
Citation preview

Prefatory Note The attached document represents the most complete and accurate version available based on original copies culled from the files of the FOMC Secretariat at the Board of Governors of the Federal Reserve System. This electronic document was created through a comprehensive digitization process which included identifying the best-preserved paper copies, scanning those copies,1
and then making the scanned versions text-searchable.2
Though a stringent quality assurance process was employed, some imperfections may remain. Please note that some material may have been redacted from this document if that material was received on a confidential basis. Redacted material is indicated by occasional gaps in the text or by gray boxes around non-text content. All redacted passages are exempt from disclosure under applicable provisions of the Freedom of Information Act. 1 In some cases, original copies needed to be photocopied before being scanned into electronic format. All scanned images were deskewed (to remove the effects of printer- and scanner-introduced tilting) and lightly cleaned (to remove dark spots caused by staple holes, hole punches, and other blemishes caused after initial printing). 2 A two-step process was used. An advanced optical character recognition computer program (OCR) first created electronic text from the document image. Where the OCR results were inconclusive, staff checked and corrected the text as necessary. Please note that the numbers and text in charts and tables were not reliably recognized by the OCR process and were not checked or corrected by staff.
Content last modified 6/05/2009.
CONFIDENTIAL (FR)
CURRENT ECONOMICand
FINANCIAL CONDITIONS
Prepared for the
Federal Open Market Committee
By the Staff
BOARD OF GOVERNORS
OF THE FEDERAL RESERVE SYSTEM March 29, 1967

CONFIDENTIAL (FR)
CURRENT ECONOMIC AND FINANCIAL CONDITIONS
By the StaffBoard of Governors
of the Federal Reserve SystemMarch 29, 1967

I- 1
SUMMARY AND OUTLOOK
Outlook for economic activity
The sharply reduced first quarter growth in GNP has
generally been confirmed by the incoming flow of statistics. With
retail sales down in February--and probably in March--and other private
demands sluggish, we are holding to our earlier estimates of dollar
gains of about $5 billion per quarter for the first half. Although
price increases have moderated, and are projected to slow further, real
GNP growth is still expected to be very small in this and the next
quarter.
Selective inventory adjustments apparently did get underway
in January, as distributors--and particularly auto dealers--began to
liquidate stocks in contrast to their sharp rate of accumulation earlier.
Manufacturers continued to add to stocks in January about as rapidly as
earlier, but sharp reductions in production in February point to a sig-
nificant slowdown in inventory building in this sector. Nonfarm inven-
tory accumulation in the first quarter thus may be at a rate about
$7 billion less than in the fourth quarter, although declining sales in
manufacturing and trade may be slowing the necessary inventory adjust-
ments at both levels.
With further reductions in industrial activity in prospect,
we project inventory accumulation in the second quarter to be at a rate
$7 billion less than in the first quarter, and to be the major influence
underlying declines in hours and employment which began in February to

1- 2
affect aggregate wage and salary income adversely. If, as expected,
employment in industrial activities declines further, and over-all
employment levels off, wage and salary gains would slow further in the
second quarter. Furthermore, first quarter additions to income from
increases in minimum wages and veteran's insurance dividend payments
will not be present in the second quarter. With retail sales already
sluggish, and an increasing number of workers facing reduced earnings,
continued weakness in personal consumption expenditures is likely in
the second quarter although further declines in purchases of durable
goods are not anticipated. With the rise in total consumer outlays
projected to be only slightly more rapid than the rise in disposable
income, the savings rate would remain high and close to the first
quarter rate.
Outlook for resource use and prices
So far, easing in the markets for labor and services has
generally been relatively limited, with unemployment in February still
at a low 3.7 per cent. But some additional weakness now appears to be
developing in demands for labor. Meanwhile, industrial activity and
capacity utilization rates are declining and prices of primary commod-
ities continue to fall.
Output curtailments undertaken in an effort to reduce
inventories spread from consumer durable goods to nondurable goods in
February and March. Also, slower inventory building, reduced orders,
and falling backlogs have eased pressures on resources in machinery
S- 3
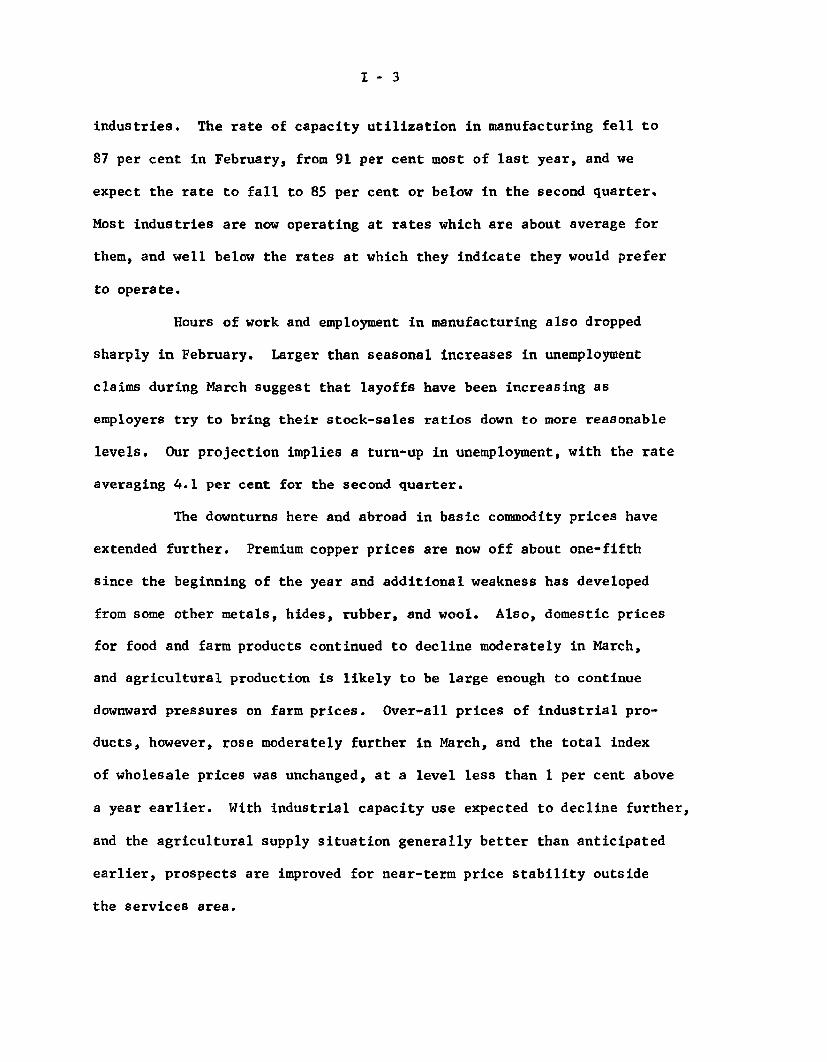
industries. The rate of capacity utilization in manufacturing fell to
87 per cent in February, from 91 per cent most of last year, and we
expect the rate to fall to 85 per cent or below in the second quarter.
Most industries are now operating at rates which are about average for
them, and well below the rates at which they indicate they would prefer
to operate.
Hours of work and employment in manufacturing also dropped
sharply in February. Larger than seasonal increases in unemployment
claims during March suggest that layoffs have been increasing as
employers try to bring their stock-sales ratios down to more reasonable
levels. Our projection implies a turn-up in unemployment, with the rate
averaging 4.1 per cent for the second quarter.
The downturns here and abroad in basic commodity prices have
extended further. Premium copper prices are now off about one-fifth
since the beginning of the year and additional weakness has developed
from some other metals, hides, rubber, and wool. Also, domestic prices
for food and farm products continued to decline moderately in March,
and agricultural production is likely to be large enough to continue
downward pressures on farm prices. Over-all prices of industrial pro-
ducts, however, rose moderately further in March, and the total index
of wholesale prices was unchanged, at a level less than 1 per cent above
a year earlier. With industrial capacity use expected to decline further,
and the agricultural supply situation generally better than anticipated
earlier, prospects are improved for near-term price stability outside
the services area.

I-4
Outlook for commercial banking system
Accelerations of both corporate income and withheld tax
payments will be a major factor influencing demand for bank loans in
April. The total of these tax payments, net of the $2.5 billion of
maturing tax anticipation bills, will be more than $7 billion, or
almost twice last year's payments. This represents one of the largest
year-over-year increases for any month since acceleration began. Even
with businesses perhaps somewhat more liquid than in recent months--at
least as judged by acquisitions of CD's--the need to make tax payments
suggests a very substantial, though temporary, growth in business loans
in April. To the extent that corporations draw upon liquid assets for
meeting tax payments, banks still will be called upon to help finance
those payments--mainly by lending to dealers and finance companies and
by purchasing bills direct from corporations. In addition, they might
need to redeem substantial amounts of maturing CD's.
An offset to such potential loan growth may be forthcoming
as some corporations repay bank loans from the proceeds of the recent
surge of corporate bond issues, many of which have an April payment
date; some market observers have suggested that a larger proportion of
recent issues than earlier this year may be used to reduce indebtedness
to banks. Another offset may be provided by further reductions in
inventory accumulation and, hence, in the need for short-term credit.
The large increases of time and savings deposits over recent
months, accompanied by substantial bank purchases of short-term U.S.
Government and other securities, suggests that banks have to a degree

I-5
anticipated these tax period demands. Moreover, the spreading reduction
in prime loan rates may indicate growing bank awareness of the weakening
outlook for loan demands after the tax period.
As banks have restocked their security holdings, they have
provided support to both short- and longer-term credit markets. It is
possible that there will be some diminution of this support in the period
immediately ahead as a result of some slowing in bank deposit growth
and as banks accommodate the expected bulge in short-term loans. However,
liberalization of bank lending terms--particularly for term loans--may
tend to reduce capital market pressures by encouraging businesses to
utilize bank sources rather than bond financings.
We expect some falling off in the pace of time and saving
deposit growth in coming months. The rate of growth in these deposits
during the first quarter of 1967 was the sharpest quarterly gain since
that following the increase in Regulation Q ceilings at the beginning
of 1962. Consumer-type deposits (with passbook savings net inflows
picking up in recent weeks) have been a major source of time deposit
funds to banks. Some of the flow of consumer-type deposits to banks
during the first quarter must represent one-time return of funds that
had moved into market investments during last year's rise in market
rates; the continued sluggishness of consumer purchasing would also
help explain consumers' desire for interest-earning depository claims.
Outstanding large denomination CD's may grow relatively
little in April, reflecting both corporate redemptions for tax payments
and less vigorous sales efforts by banks. And if banks feel that April

I- 6
loan demand is temporary, they may not make strong efforts to obtain
CD funds but may prefer to satisfy temporary needs in the Federal funds
market or through short-term borrowing abroad or from the System.
The combined total of Government and private demand deposits,
after increasing moderately in January and February, rose more sharply
in March and is likely to increase further in April. Large expected tax
payments, however, are producing sizable shifts between public and private
balances.
Outlook for capital markets
While interest rates have declined markedly in short-term
markets in recent weeks, they have moved down more sluggishly in markets
for corporate and municipal securities. Long-term rates have been held
up mainly by the record March volume of publicly offered securities,
especially corporate issues but also including sizable amounts of munic-
ipal bonds, Federal participation certificates, and foreign and IBRD
bonds. In the face of the massive volume of new flotations, one might
conclude that even the relatively small rate declines would not have
been likely without the effect on money market conditions and bank credit
expansion of the recent easing in open market policy and without expecta-
tions of further easing.
In April the new issue volume in the corporate and municipal
markets is expected to remain at a high level, although noticeably below
the March record. Another participation certificate may be in the offing,
but it may be of moderate size in April, and foreign and other inter-
national issues are not likely to approach their March volume. The

I-7
Federal Government will announce the terms on its May refunding toward
the end of April; there are almost $3 billion of publicly-held coupon
issues maturing in May and another $1.3 billion of such issues maturing
in June.
All in all, the moderation of the new issue calendar is
likely to be reflected in a tendency for long-term market rates to
drift further downwards. However, any reduced bank activity on the
buying side in longer-term markets will tend to hold back a tendency
for rates to decline. Indeed, shifts in market expectations about the
course of monetary policy might even generate some upward rate pressures.
Net inflows of funds to depositary-type lenders have continued
to grow sharply, and home mortgage rates have dropped substantially more
from their November peak through February than in any other three-month
period. The abruptness of the rate decline this time has reflected the
extreme shortage of residential mortgages in the pipeline. Lags in the
reassembling of builder's resources and in making financing arrangements
are, as expected, taking time; seasonal slackness in building activity
and in real estate transfers has accentuated the effect of these delays
on the availability of mortgages. In the meantime, lenders have used a
large part of their increased flows to repay debt and acquire market
securities. Given the continuing shortage of mortgages and the size of
recent savings inflows, further mortgage rate declines are likely.

1-8
International developments
The payments deficit on the liquidity basis has been rather
large in the first quarter of 1967, after allowance for favorable seasonal
factors. Apart from special transactions, which held the deficit down
in late 1966 but thus far this year have been small, the seasonally ad-
justed liquidity deficit in the first quarter appears to have been over
$1 billion, and not very different from a comparable figure for the
fourth quarter though well above the average for 1966. There was a
sharp improvement in the trade balance in January-February and a continued
reflow of U.S. bank credit. But in March U.S. oil companies made tax
payments of 1O00 million ($280) to Libya: similar payments last year
came somewhat later in the spring.
Without seasonal adjustment, the liquidity deficit through
March 22 came to about $600 million, while the deficit on the official
reserve transactions basis--enlarged by repayments of U.S. liabilities
to commercial banks abroad--came to about $1.2 billion. But the main
foreign reserve gains in this period accrued to the United Kingdom, and
U.S. reserve losses were concentrated upon holdings of convertible
foreign currencies, sterling and other, which fell by nearly $1 billion.
During the months ahead, the payments deficit before seasonal
adjustment is likely to remain substantial on both bases of calculation.
Seasonal factors will become progressively less favorable in the next
two quarters; in the April-June quarter the liquidity balance will be
about the same unadjusted as adjusted. In the absence of unforeseen
adverse developments, and with the help of some further decline in U.S.

I-9
imports, the liquidity deficit in this quarter apart from special transac-
tions could lie in the half-billion-to-three-quarter-billion range.
Whether the official settlements balance is larger than that will probably
depend importantly on whether U.S. banks make further repayments to the
Euro-dollar market. Incentives to do so might not be strong, especially
if European interest rates continue to decline along with U.S. rates.
But some further repayments are to be expected, if the liquidity position
of U.S. banks improves substantially.
Prospects for U.S. exports are especially difficult to assess.
Exports would clearly be favored by an early upturn in general demand
conditions in Germany, the expansive repercussions of which in other
countries would help offset unfavorable repercussions from the expected
easing in U.S. import demand. But the timing of an upturn in Germany
is still very uncertain. Adjustments in inventory positions have ap-
parently gone much further than in the United States, but German consumer
buying attitudes and business fixed investment intentions are apparently
still very cautious.

March 28, 1967
SELECTED DOMESTIC NONFINANCIAL DATA
(Seasonally adjusted)
LatestPeriod
Civilian labor force (mil.)Unemployment (mil.)Unemployment (per cent)
Nonfarm employment, payroll (mil.)ManufacturingOther industrialNonindustrial
Industrial production (57-59z-100)Final productsMaterials
Wholesale prices (57-59=100)1/Industrial commoditiesSensitive materialsFarm products and food
Consumer prices (57-59=100)-/
Commodities except foodFoodServices
Feb'6711"
LatestPeriod
77.02.93.7
65.519.4
8.237.9
155.9155.6156.1
106.0n. a.n. a.
105.7
144.8107.6114.2125.9
AmountPreced'gPeriod
77.12.83.7
65.419.5
8.237.7
158.0157.8158.2
106.2n.a.n.a.
107.0
114.7107.3114.7125.5
YearAgo
75.12.83.7
62.818.7
8.136.0
152.4152.1152.6
105.4n.a.n.a.
109.8
111.6105.4113.1119.7
Per cent changeYear 2 YearsAgo* Ago*2.5 4.23.7 -22.1
4.33.61.95.1
9.69.55.3
10.6
2.3 11.72.3 12.12.3 11.3
0.6n. a.n. a.
- 3.7
292.11.05.2
4.7n. a.n.a.7.1
5.42.87.17.7
Hourly earnings, mfg. ($) "Weekly earnings, mfg. ($) "
Personal income ($ bil.) 2 / "
Corporate profits before tax ($bil.)2/ V'66Corporate profits before tax ($ bil.)- QIV'66
2.78 2.76 2.67112.04 113.36 110.82
609.9 6
81.9
4.1 7.31.1 4.9
)07.5 564.7 8.0 17.9
81.9 78.7 4.1 21.0
Retail sales, total ($ bil.)Autos (million units)./GAF ($ bil.)
Selected leading indicators:Housing starts, pvt. (thous.)-/Factory workweek (hours)New orders, dur. goods ($ bil.)New orders, nonel. mach. ($ bil.)Common stock prices (1941-43=10)
Manufacturers inventories,book value ($ bil.)
Gross national product ($ bil.)I/Real GNP ($ bil., 1958 prices)Z/
Feb'67
if
25.37.06.1
1,08940.322.2
3.287.37
Jan'66 78.9
25.77.86.2
1,28241.022.4
3.484.45
25.39.25.9
1,37441.523.73.3
92.69
0.1-23.73.9
-20.7- 2.9- 6.5
4.6- 5.7
8.7-25.5
15.3
-26.5- 2.2
5.03.70.7
77.9 68.6 15.1 24.8
QIV'66 759.3 745.3 704.4 7.8 17.9" 657.2 649.9 631.2 4.1 11.9
* Based on unrounded data. 1/ Not seasonall y adjusted. 2/ Annual rates.
II
I -- T - 1
* Based on unrounded data. I/ Not seasonally adjusted. 2/ Annual rates.

March 28, 1967
SELECTED DOMESTIC FINANCIAL DATA
Week ended Four-Week Last six months
Mar. 24 Average High LowMoney Market 1/ (N.S.A.)
Federal funds rate (per cent) 4.75 4.63 4.75 3.75
U.S. Treas. bills, 3-mo.,yield (per cent) 4.14 4.32 5.48 4.10
Net free reserves 2/ (mil. $) 2P2 153 282 - 583
Member bank borrowings 2/ (mil. $) 30Z 211 928 167
Security Markets (N.S.A.)Market yields 1/ (per cent)
5-year U.S. Treas. bonds 4.47 4.58 5.64 4.44
20-year U.S. Treas. bonds 4.54 4.58 4.92 4.44
Corporate new bond issues, Aaa 5.33 5.38 5.99 5.11
Corporate seasoned bonds, Aaa 5.13 5.12 5.53 4.99
Municipal seasoned bonds, Aaa 3.46 3.49 3.83 3.25
FHA home mortgages, 30-year 3/ 6.46 6.46 6.81 6.46
Common stocks S&P composite index 4/Prices, closing (1941-43=10) 90.35 88.79 90.94 79.67
Dividend yield (per cent) 3.26 3.30 3.89 3.26
Change Average Annual rate ofin change change (%)
Feb. Last 3 mos. 3 mos. 1 year
Banking (S.A., mil. $)Total reserves 268 207 10.7 2.9
Bank loans and investments:Total 1,700 2,600 10.1 6.7
Business loans 100 500 7.6 13.0
Other loans - 700 600 5.9 5.8
U.S. Government securities 1,100 700 15.1 - 1.8
Other securities 1,200 800 19.9 9.5
Money and liquid assets:Demand dep. & currency 900 400 3.1 13.7
Time and savings dep. 2,600 2,100 16.1 9.8
Nonbank liquid assets - 500 0 0.1 3.3
N.S.A. -- not seasonally adjusted. S.A. Seasonally adjusted.
1/ Average of daily figures. 2/ Averages for statement week ending March 22.
3/ Latest figure indicated is for month of February. 4/ Data are for weeklyclosing prices.
I -- T - 2

I - T-3
U.S. BALANCE OF PAYMENTS(In millions of dollars)
1967 1 9 6 6 1966 1965Feb. Jan. QIV QIII QII QI Year Year
Seasonally adjusted(billions)
Current account balance
Trade balanceAs published in B/PRevised 1/
Exports 1/Imports 1/
Services, etc., net
882
3702,575
3002,595
-2,205 -2,295 (
834(716)
(7,403)-6,687)
929 1,147 1,346 4.3 6.0
787(794)
(7,386)(-6,592)
48 142
878(959)
(7,185)(-6,226)
269
1,174(1,204)(7,206)
(-6,002)
3.7 4.8
29.2-25.5
26.3-21.5
172 0.6 1.2
Capital account balance
Govt. grants & capital 2/U.S. private direct investmentU.S. priv. long-term portfolioU.S. priv. short-termForeign nonliquid
Errors and omissions
-1,167 -1,302 -1,074 -1,596 -5.1 -6.9
-690-963100
-278664
-273
-797-737
-143
243
173
-952-976
-80-38972
-195
-957-687-219
-22289
-3.4-3.4-0.2-0.3
2.2
-3.4-3.4-1.10.80.2
-294 -0.6 -0.4
Balances, with and without seasonal adjustment (- = deficit)
Liquidity bal., S.A.Seasonal componentsBalance, N.S.A.
Official settlements bal.Seasonal componentBalance, N.S.A. 3/
-266
-55830
136 -528
-24471
-304 -469 -173
-200-499--69-9
952-525
427
-122-27
-149
-203-182-385
-544496-48
-234636402
-1.4
-1.4
-1.3
-1.3
Memo items:Monetary reserves
(decrease -)Gold purchases or
sales (-)
-198 -686
-33 -121
6 -82
-173
-68
-209
-424 -0.6 -1.2
-68 -0.6 -1.7
/ Based on revised Census seasonal adjustments which will not be incorporated inbalance of payments statistics until June,when seasonal adjustment revisions willbe made for all components of the balance of payments. January and Februaryfigures are on the balance of payments basis which differs a little from thepublished Census basis.
2/ Net of loan repayments.3/ Differs from liquidity balance by counting as receipts (+) increases in liquid
liabilities to commercial banks, private nonbanks, and international institutions(except IMF) and by not counting as receipts (+) increase in certain nonliquidliabilities to foreign official institutions.
0.3 -1.3
0.3 -1.30.3 -1.3

II - 1
THE ECONOMIC PICTURE IN DETAIL
The Nonfinancial Scene
Gross national product. The staff's current projection of
gross national product is essentially the same as that of a month ago,
with an average increase of $5 billion per quarter expected for the
first half of the year. Despite an apparent moderation in the pace of
price increase, the annual rate of growth in real GNP would be small--
between 1/2 per cent and 1 per cent--a rate well below current gains in
productivity and so low as to be accompanied by further declines in
industrial output and employment and a rise in unemployment to about
4.2 per cent by midyear.
Private final demand for goods continued sluggish in the
first quarter. Consumer outlays for goods were particularly weak and
are expected to show no rise from the fourth quarter. Durable goods
expenditures are likely to decline by $2 billion, with unit sales of
new domestic automobiles down to an estimated 7-1/4 million from
8.1 million in the fourth quarter. Expenditures for appliances, furni-
ture and other household goods remain soft, while nondurable goods sales
continue to be disappointing after allowance for an early Easter.
A major new factor dampening prospective consumer outlays
appeared in February when private payrolls decreased because of declines
in hours and employment in manufacturing. Payroll advances in government
more than offset the decline in the private sector but total wage and
salaries increased only $1/2 billion. Almost half of the $2-1/2 billion

II - 2
increase in total personal income in February was accounted for by a
speed-up in life insurance dividend payments to veterans. With the
marked slowdown in employment gains and payrolls expected to be extended
through the second quarter, disposable income is projected to rise by
only $5 billion, less than one-half of the $11 billion quarterly increase
shown for the fourth and first quarters.
Such a slowdown in income growth provides little basis for
anticipating a resurgence in consumer spending for goods. We do, how-
ever, expect a leveling off of automobile sales at current reduced rates
in contrast to the decline in the first quarter, and this, along with a
rise in nondurable goods purchases at about the same rate as in the first
quarter, and the continued inexorable rise, in service outlays, would
result in a small increase in total personal consumption expenditures.
But this rise in consumer expenditure is only a little more than the
projected increase in disposable income, so the saving rate would re-
main high at 6.7 per cent.
The decline in housing starts in February was a reminder that
it may take some time to generate a strong expansion in residential con-
struction expenditures, and only a slight increase of $0.5 billion is
projected for the second quarter. The latest Commerce-SEC survey suggests
that expenditures for plant and equipment investment will decline in the
first half of 1967 from the fourth quarter level. These figures reflect
a downward revision of business investment plans from the previous survey
in November and, broadly speaking, are consistent with the sustained
decline in new orders for machinery and equipment and the more recent

II - 3
decline in unfilled orders. The auto component of business fixed
investment is also declining in the first quarter. On the other hand,
sales of farm equipment still appear to be rising and nonresidential
construction, including commercial, has been increasing briskly in
recent months. It should be noted that the sales expectations that
accompanied the investment survey indicated that manufacturers anticipate
sales gains of 8 per cent for the year. Since these sales expectations
appear overly optimistic, at least in terms of likely short-run develop-
ments, another downward revision in investment plans is possible. On
the other hand, the reinstatement of the 7 per cent investment tax credit
and accelerated depreciation allowances may encourage some extra fixed
investment, but probably not showing up in GNP until later this year.
In view of these various considerations we have held the estimate of
business fixed investment for the first two quarters at $81.6 billion,
the same as in the fourth quarter of 1966. This contrasts with the
small increases shown in the preceding projection.
Weakness in private takings of goods have tended to make
attempts to curtail inventory expansion more difficult and to delay
desired reductions in the stock-sales ratios. But it is the inventory
adjustment that is primarily responsible for the projected slowdown in
the rate of growth in GNP. Nonfarm inventory accumulation is now
recorded in the GNP accounts at an annual rate of $17.6 billion in the
fourth quarter of 1966, but this figure is probably low by $1 billion
or so since it does not reflect the recent upward revision in the
December book value figures. In January the book value of total manu-
facturing and trade inventories increased at an annual rate of approxi-

II - 4
The over-all business stock-sales ratio increased further in
January and was at the highest level since the spring of 1961. With
stocks of autos and other consumer durable goods excessive, with outlays
for business fixed capital at best levelling off, and with defense
spending rising more slowly than earlier, it seems clear that further
marked reductions in inventory accumulation are in prospect. On
balance, then, the private sector of the economy contributes little to
economic expansion. Business fixed investment is at a standstill, with
little likelihood of a major breakout from current levels, at least
until much later in the year. Residential construction is recovering--
slowly--and is not yet providing much strength to final expenditures,
although this should be more in evidence by summer. And business inven-
tory adjustments are more than offsetting the feeble rise in consumer
spending for goods.
Government outlays continue to provide an important stimulus
to economic activity. A $5-6 billion increase per quarter is expected
to come from the public sector as both Federal and State and local
purchases continue to rise at a relatively stable rate. Recent infor-
mation suggests that Federal non-defense and State and local expenditures
are rising somewhat faster than previously estimated. While its still
too early to re-evaluate our defense expenditure projections based on
Budget estimates, there is some evidence that they also may be running
slightly higher than originally planned. All told, government purchases
are estimated about $1.5 billion higher for the second quarter than in
the earlier projection.

GROSS NATIONAL PRODUCT AND RELATED ITEMS(Expenditures and income figures are billions of dollars;quarterly figures are seasonally adjusted annual rates)
1967
1965 1966 1966 Projected
I II III IV I II
Gross National ProductFinal salesPrivate
Personal consumption expendituresDurable goodsNondurable goodsServices
Gross private domestic investmentResidential construction
Business fixed investmentChange in business inventories
Nonfarm
681.2672.1535.9
431.566.1
190.6174.8
106.627.869.79.18.1
739.6727.7574.7
464.969.3
206 2189.4
117.025.879.311.912.2
721.2712.3567.3
455.670.3
201.9183.4
114.528.677.08.98.5
732.3720.0571.0
460.167.1
205.6187.4
118.528.078.212.312.1
745.3735.4579.2
469.970.2
208.1191.5
115.024.880.3
9.910.4
759.3742.9581.8
474.169.6
209.2195.3
120.021,981.616.417.6
764.0753.3586.2
478.067.4
211.3199.3
114.322.081.610.711.0
769.4765.4593.5
483.867.4
213.3203.1
108.122.581.6
4.04.0
Net exports 7.0 4.8 6.0 4.7 4.2 4.1
Gov't purchases of goods & servicesFederal
DefenseOther
State & local
Gross National Product inconstant (1958) dollars
GNP Implicit deflator(1958=100)
Personal incomeWage and salaries
Disposable incomePersonal savingSaving rate (per cent)
Total labor force (millions)Armed forces "Civilian labor force "Unemployment rate (per cent)
Nonfarm payroll employment (millions)Manufacturing "
136.266.850.116.769.4
153.076. 960.016.976.2
145.071.954.617.473.1
149.074.057.116.975.0
614.4 647.8 640.5 643.5110.9 114.2 112.6 113.8
535.1-358.4469. 1
25.75.5
77.22.7
74.54.5
580.4392.3505.3
27.05.3
78.93.1
75.83.8
60.8 63.918.0 19.1
564.6380.0495.1
26.75.4
78.12.9
75.23.8
573.5387.4499.9
26.65.3
78.43.1
75.43.8
156.279.062.017.077.2
161.181.765.516.279.4
649.9 657.2114.7 115.5
585.2396.7507.8
24.54.8
79.13.2
76.03.8
598.3405.0518.4
30.45.9
79.83.3
76.53.7
167.185.568.317.281.6
171.988.170.617.583.8
658.0 659.6116.1 116 7
610.0411.3529.5
37.37.0
80.43.4
77.03.8
615.5416.0534.5
36.06.7
80.63.5
77.14.1
62.8 63.6 64.1 64.8 65.4 65.418.7 19.0 19.2 19.4 19.4 19.0
Note: Labor force revised to exclude persons age 14 and 15. Quarterly data for 1966 alsoreflect new seasonal factors; projections for 1967 reflect new definitions of unemployment.
4.6 5.6
CONFIDENTIAL -- FR March 29, 1967

PERCENTAGE CHANGES IN GROSS NATIONAL PRODUCTAND RELATED ITEMS
(Quarterly changes are at annual rates)
19671965 1966 1966 Projected
I II III IV I II
Gross National ProductFinal sales
Private
Personal consumption expendituresDurable goodsNondurable goodsServices
Gross private domestic investment
Residential constructionBusiness fixed investment
Gov't purchases of goods & servicesFederal
Defense
OtherState & local
Gross National Product inconstant (1958) dollars
GNP Implicit deflator (1958=100)
Personal incomeWage and salaries
Disposable income
Nonfarm payroll employment
Manufacturing
7.8 8.6 9.57.2 8.3 10.57.6 7.2 10.5
7.511.3
6.57.2
14.6 9.80.7 - 7.2
14.8 13.8
12.315.119.8
1.29.8
5.9 5.41.8 3.0
7.9 8.57.4 9.57.4 7.7
4.3 5.14.0 6.1
9.313.59.97.1
9.314.516.8
10.812.016.02.39.5
6.2 7.1 7.54.3 8.6 4.12.6 5.7 1.8
3.9-18.2
7.38.7
14.0- 8.4
6.2
11.011.718.3
-11.510.4
8.518.54.98.7
-11.8-45.7
10.7
19.327.034.3
2.411.7
3.6- 3.4
2.17.9
17.4-46.8
6.5
12.513.722.6
-18.811.4
5.9 1.9 4.0 4.53.6 4.3 3.2 2.8
8.5 6.3 8.2 9.09.9 7.8 9.6 8.47.4 3.9 6.3 8.3
6.5 5.1 3.1 4.46.5 6.4 4.2 4.2
2.5 2.85.6 6.43.0 5.0
3.3-12.64.08.2
-19.01.80.0
14.918.617.124.711.1
-21.79.10.0
11.512.213.5
7.010.8
0.5 1.02.0 2.0
7.8 3.66.2 4.68.6 3.8
3.7 0.00.0 - 8.2
CONFIDENTIAL -- FR March 29, 1967

II - 7
Industrial production. The March index of industrial
production is difficult to estimate yet. However, some basic elements
indicating a further decline are in evidence: new orders for durable
goods declined further in February, manufacturer's and retail sales
continued sluggish, and inventories continued to rise. However, avail-
able production data for March, very scanty at this time, do not indicate
any substantial declines but rather a continued softening. Truck
assemblies have decreased further and are about 10 per cent below a year
earlier. In contrast, auto assemblies have risen 10 per cent from the
storm- and strike-affected February low, although still 25 per cent below
March 1966. In late March, output of color and monochrome television
sets was reduced. Further cutbacks are anticipated, as factory and dis-
tributor stocks have continued to rise rapidly. Paperboard production
has been at about year ago levels, but new orders have been running
24 per cent below a year earlier. Steel ingot production has declined
somewhat further. Freight car loadings of miscellaneous goods, mostly
manufactured goods, and intercity truck tonnage have both been below
year ago levels.
The January decline in industrial production of 0.6 per cent
was largely due to the drops in auto and steel output while the February
decline of 1.3 per cent was more general in both final products and
materials. The decline in March is expected to be widespread, but--on
the basis of fragmentary evidence now available--is not likely to be as
large as in February.

II - 8
Retail sales. Retail sales in the first three weeks of
March showed very little change from February, but with a rather large
decline occurring in apparel. Sales for the entire first quarter on
the basis of the figures now available may be somewhat lower than in
the second half of last year, as shown in the table.
RETAIL SALESSeasonally adjusted annual rates
(Billions of dollars)
1965 1966 1967
1st Quarter 276.2 303.3 305.5 (est.)
2nd Quarter 278.0 299.3
3rd Quarter 284.0 306.6
4th Quarter 294.7 306.1
According to the advance February estimate, retail sales
were off almost 2 per cent from January figures which have been raised--
on the basis of the full sample--to a level 1.3 per cent above December
and equal to the peak of last September. Final upward revisions in
December brought retail sales in the entire fourth quarter almost up to
the third quarter level.
The February decline in retail sales was accounted for by a
5 per cent drop in durable goods sales. Dealer deliveries of new U.S.-
made cars were down 10 per cent, and total dollar sales of the automotive
group of stores declined 6 per cent. Sales were off about 4.5 per cent
at furniture and appliance stores. Nondurable goods sales were about

II - 9
the same as in January, with a sizable decline at apparel stores and a
more moderate one at department stores offset by small gains at the
other types of nondurable goods stores.
Auto markets, Unit sales of new domestic automobiles in
March are expected to be at an annual rate of about 7 million cars,
unchanged from the preceding month, but down about 15 per cent from the
end of 1966 rate. This dropoff was about as much as during a similar
period during the 1960-61 readjustment when dealers' stocks had also
risen sharply and auto outpqt was reduced by onew"furth,
First quarter sales of new cars were substantially below
year-earlier rates, and unless an upturn develops in auto demands this
spring, there could be further curtailments in assemblies and in output
in auto-supplying industries. In response to lagging sales and mounting
dealer inventories, the industry planned output curtailments in the
first quarter, and these cutbacks were accentuated by strikes and storms
in February. In that month, assemblies fell to a rate of 6 million,
which was about one-third below the rate a year earlier and below the
rate of dealers' sales. Subsequently in March assemblies rose to a rate
of around 7 million--about the same as sales.
On a seasonally adjusted basis, stocks of new cars declined
further in February but in March are expected to show little change.
Stocks are still high in relation to prevailing sales, representing a
70 days' supply--probably a record high for the industry.

II - 10
According to trade papers, sales of imported cars in the
United States are running ahead of sales in the preceding year, in con-
trast to the declines for domestically produced cars. In February,
sales of imports were at a seasonally adjusted annual rate of 725,000
units, about 3 per cent above the rate in February a year ago and sub-
stantially ahead of the 660,000 units sold in calendar year 1966.
Seasonally adjusted prices of used cars rose slightly in
February. Prices still remain below the low level reached four years
earlier, but are about 10 per cent above the 1960-61 price low.
Consumer credit. Sluggishness in spending for automobile
and other consumer durable goods continues to be reflected in reduced
demands for instalment credit. New credit extensions have been moving
irregularly downward since last summer, and in February they may have
reached their lowest point in the past year and a half, judging by early
reports from commercial banks.
In the meantime, repayments have continued to increase,
although at a slower rate than earlier in the expansion period. With
extensions declining and repayments growing slowly, outstandings have
been increasing by progressively smaller amounts. Last November, con-
sumer instalment credit was expanding at a seasonally adjusted annual
rate of $5.3 billion. The rate slowed to $3.9 billion in December, and
to $3.4 billion in January--the smallest increase in more than 4 years--
and a further reduction is expected in February. Indeed, for some
lenders and some types of credit, there may have been a net decrease in
outstandings in February.
II - 11
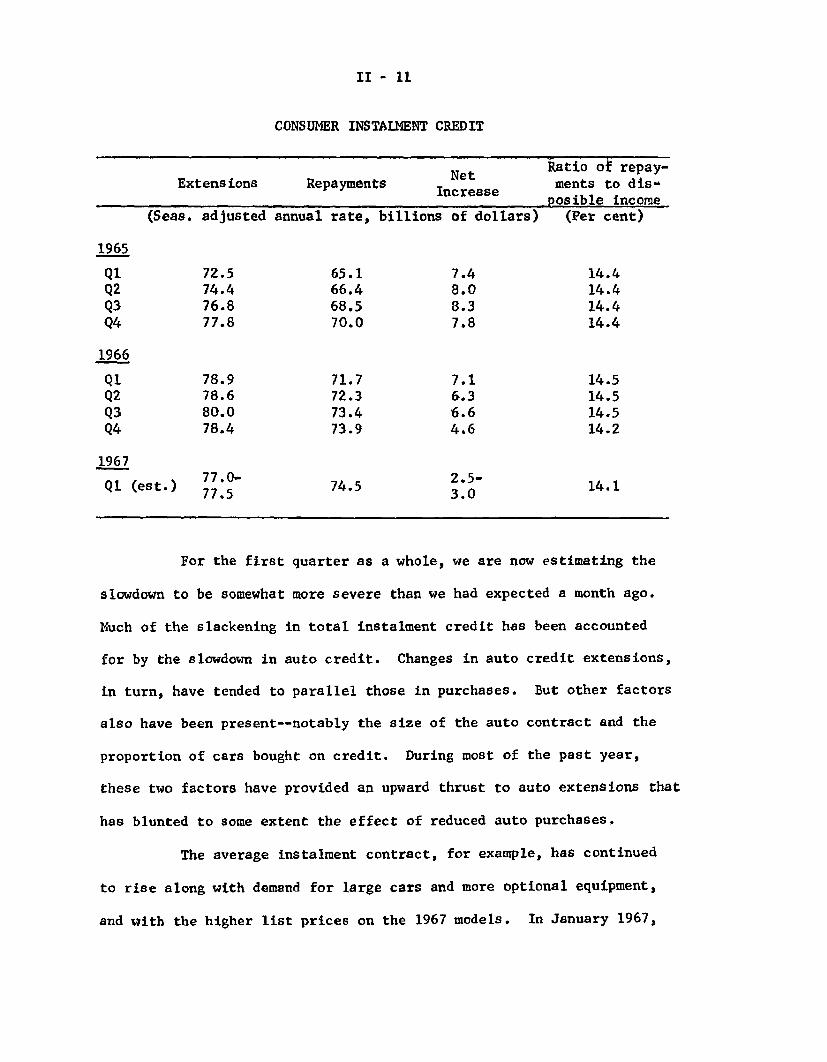
CONSUMER INSTALMENT CREDIT
Nt Ratio ot repay-Extensions Repayments I e ments to dis-
Increaseposible income
(Seas. adjusted annual rate, billions of dollars) (Per cent)
1965
Q1 72.5 65.1 7.4 14.4Q2 74.4 66.4 8.0 14.4Q3 76.8 68.5 8.3 14.4Q4 77.8 70.0 7.8 14.4
1966
Q1 78.9 71.7 7.1 14.5Q2 78.6 72.3 6.3 14.5Q3 80.0 73.4 6.6 14.5Q4 78.4 73.9 4.6 14.2
1967
S(est 77.0- 74.5 2.5- 14.1Q1 (est.) 74.5 14.177.5 3.0
For the first quarter as a whole, we are now estimating the
slowdown to be somewhat more severe than we had expected a month ago.
Much of the slackening in total instalment credit has been accounted
for by the slowdown in auto credit. Changes in auto credit extensions,
in turn, have tended to parallel those in purchases. But other factors
also have been present--notably the size of the auto contract and the
proportion of cars bought on credit. During most of the past year,
these two factors have provided an upward thrust to auto extensions that
has blunted to some extent the effect of reduced auto purchases.
The average instalment contract, for example, has continued
to rise along with demand for large cars and more optional equipment,
and with the higher list prices on the 1967 models. In January 1967,

II - 12
the typical new-car note was $2,780 as compared with $2,700 a year
earlier. Meanwhile the proportion of new cars purchased on credit rose
to an average of 66 per cent in 1966, up almost 3 percentage points from
1965. The year-to-year increase widened to 4 percentage points in
January, as dealers waged a vigorous campaign to reduce auto stocks.
As shown in the table, the ratio of repayments to disposable
personal income has been relatively stable since the first quarter of
1965. For some years prior to that, however, repayments had tended to
run ahead of income and the ratio had advanced, on average, about 1 per-
centage point over each 5-year interval. The ratio edged down in the
final quarter of 1966, the first such decline since mid-1961. A further
small decline is estimated to have taken place in the first quarter of
this year.
New orders for durable goods. New orders for durable goods
declined further in February and were 12.2 per cent below the September
1966 peak. The decline in February was less than 1 per cent in contrast
to the very sharp 6.7 per cent drop which occurred in January. But sub-
stantial declines were experienced in machinery, which fell nearly 4 per
cent, and in transportation equipment, where the decline was 2.3 per
cent. Defense orders--which had declined sharply in January--rose in
February.
Although shipments declined substantially in both January and
February, the backlog of orders also fell in both months. At the end of
February, unfilled orders for durable goods were down $1.4 billion or
II - 13
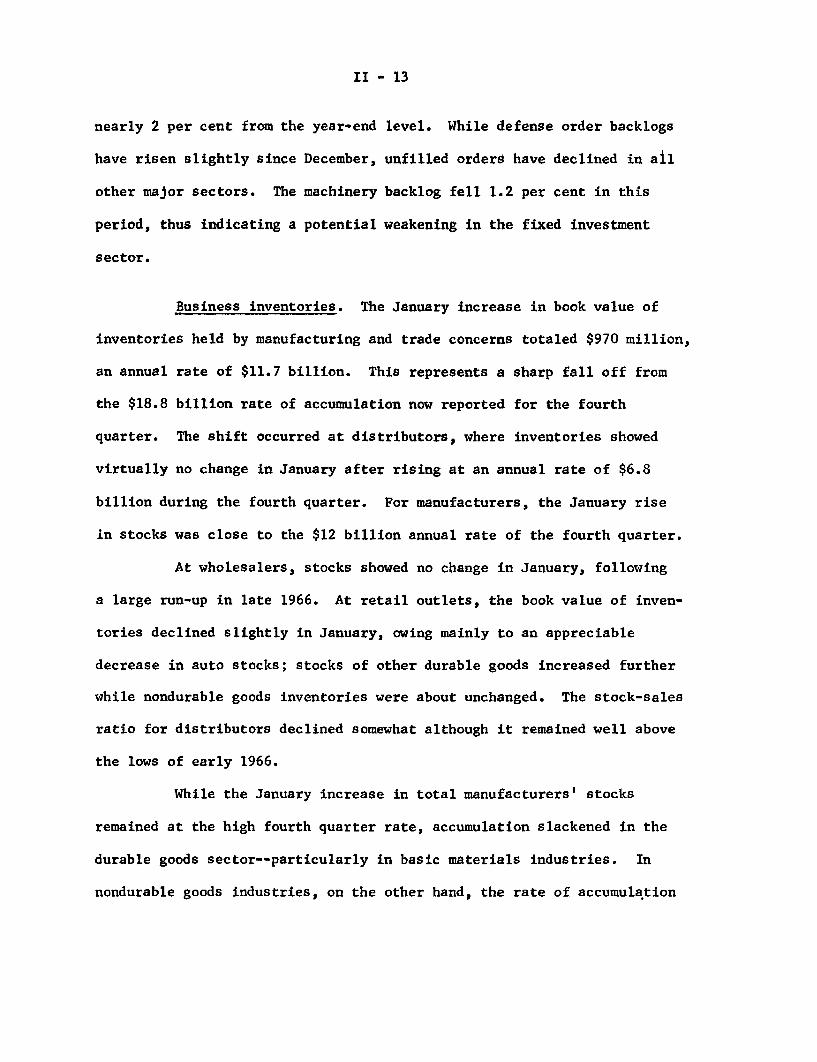
nearly 2 per cent from the year-end level. While defense order backlogs
have risen slightly since December, unfilled orders have declined in all
other major sectors. The machinery backlog fell 1.2 per cent in this
period, thus indicating a potential weakening in the fixed investment
sector.
Business inventories. The January increase in book value of
inventories held by manufacturing and trade concerns totaled $970 million,
an annual rate of $11.7 billion. This represents a sharp fall off from
the $18.8 billion rate of accumulation now reported for the fourth
quarter. The shift occurred at distributors, where inventories showed
virtually no change in January after rising at an annual rate of $6.8
billion during the fourth quarter. For manufacturers, the January rise
in stocks was close to the $12 billion annual rate of the fourth quarter.
At wholesalers, stocks showed no change in January, following
a large run-up in late 1966. At retail outlets, the book value of inven-
tories declined slightly in January, owing mainly to an appreciable
decrease in auto stocks; stocks of other durable goods increased further
while nondurable goods inventories were about unchanged. The stock-sales
ratio for distributors declined somewhat although it remained well above
the lows of early 1966.
While the January increase in total manufacturers' stocks
remained at the high fourth quarter rate, accumulation slackened in the
durable goods sector--particularly in basic materials industries. In
nondurable goods industries, on the other hand, the rate of accumulation

II - 14
picked up. For both durable and nondurable goods, shipments declined
and stock-sales ratios rose--for all manufacturing industries combined
the ratio was about the highest of this expansion period.
Despite the sustained high rate of accumulation in January,
manufacturers apparently hope to reduce sharply the rate at which their
stocks increase in subsequent months. According to the Commerce survey
of manufacturers' inventory and sales anticipations conducted in February,
manufacturers anticipate inventory accumulation at an annual rate of
$7.2 billion for the first quarter as a whole and at a rate of $5.2
billion in the second quarter--as compared with $12 billion in the
fourth quarter. Along with these inventory anticipations, manufacturers
are anticipating a moderate gain in sales--most of it in the second
quarter.
Business fixed investment. Planned expenditures for new
plant and equipment in 1967 totaled $63.0 billion according to the
Commerce-SEC survey taken in February. This is $2.4 billion, or 3.9 per
cent, more than last year and is substantially smaller than the increases
of over 15 per cent in each of the last three years.
The survey of 1967 expenditures was made before the proposal
was announced to restore the investment tax credit and the special accel-
erated depreciation allowances. Thus, the February plans could be
modified to take account of the restoration of these investment incentives.
However, with available capacity increasing sharply and manufacturing
capacity utilization and order backlogs declining, it seems unlikely that

II - 15
total outlays this year should be adjusted upward by the full $2.3
billion they were reportedly reduced when the investment stimuli were
suspended. (See Greenbook of March 1, 1967.)
Although increases planned for this year were generally
smaller, relatively large additions to plant and equipment were again
indicated by producers of electrical machinery and equipment,nonelec-
trical machinery, and rubber. More moderate gains were indicated by
producers of primary metals and food and by the mining and electric
utility industries. In contrast, February plans of railroads showed a
25 per cent cutback from last year and motor vehicles and textiles
showed reductions of more than 10 per cent. The large reduction planned
by the railroads apparently reflected the effects of the temporary sus-
pension of investment incentives. These plans could well be revised
sharply upward when the investment incentives are reinstated.

II - 16
BUSINESS PLANT AND EQUIPMENT EXPENDITURES
ALL BUSINESSManufacturing industries
Durable goods industriesIron and steelNonferrous metalElectrical machinery
and equipmentNonelectrical machineryMotor vehicles and partsOther transportation
Nondurable goods industriesFood and beverageTextilesPaperChemicalsPetroleumRubber
Nonmanufacturing industriesMiningRailroadOther transportationPublic utilitiesCommunicationCommercial and other
* February 1967 plans.
Billionsof dollars
1966 1967*
60.63 63.0026.99 27.9413.99 14.642.17 2.31
.86 .92
1.19 1.472.86 3.511.93 1.691.09 1.06
13.00 13.301.39 1.491.13 1.001.50 1.552.99 3.044.42 4.59.42 .52
33.64 35.061.47 1.581.98 1.483.44 3.948.41 9.155.6215.62 18.91
12.74
Per cent increasefrom year earlier1966 1967*
16.7 3.920.2 3.522.7 4.612.4 6.526.5 7.0
40.0 23.529.4 22.7
- 2.5 -12.487.9 - 2.817.6 2.312.1 7.215.3 -11.533.9 3.315.4 1.715.7 3.823.5 23.814.0 4.213.1 7.514.5 -25.322.4 14.521.2 8.813.88.1
Manufacturing industries planning large increases in plant
and equipment outlays this year were generally producing above their
preferred operating rates last December; those planning large declines
were generally operating below preferred rates and in at least two of
the past three years had increased investment outlays by exceptionally
large amounts.
The survey shows that plant and equipment expenditures are
expected to fall off in the first two quarters and then rise moderately

II - 17
in the last half of the year. The new first half estimates ate
considerably lower than indicated in the preceding Commerce-SEC survey.
In part this may reflect a more considered evaluation of the impact of
the suspension of the investment credit but easing in economic activity
was probably also an important factor. It is not at all clear why
businessmen in February anticipated reneved 1 upturn in expenditures
after midyear.
BUSINESS PLANT AND EQUIPMENT EXPENDITURES(Annual rates)
November survey February survey1966 1967 1966 1967IV I II IV I II 2nd Half*
(Per cent change quarter-to quarter)
ALL BUSINESS 8.8 5.4 3.8 10.1 -1.3 -2.2 3.9Manufacturing 3.6 .7 8.6 2.9 -2.2 1.4 4.0Durable goods 8.4 1.4 10.9 4.2 -1.4 -5.5 7.7Nondurable goods -1.5 0.0 6.1 1.5 -3.0 9.1 0.0
Nonmanufacturing 12.5 9.8 0.0 16.0 - .6 -5.1 3.9
* From first half average to second half, annual rates.
The 3.9 per cent rise in business plant and equipment
expenditures this year shown by the February Commerce-SEC survey is not
necessarily out of line with the 6.3 per cent increase reported by a
McGraw-Hill re-check survey taken only a month earlier. Although the
McGraw-Hill survey is designed to provide comparable results, the sample
is concentrated more heavily in the larger companies and has weak cover-
age in the commercial sector. The effects of the suspensions of the tax
credit and accelerated depreciation allowances were especially sharp for
commercial enterprises and smaller companies. A further deterioration

II - 18
in the economic climate from January to February may also have led to
some reductions in investment plans in the time between the surveys.
Construction activity. Outlays for new construction, which
were revised upward by 2 per cent for January, edged higher in February
to a seasonally adjusted annual rate of nearly $72 billion. Although
this rate was still appreciably under the peak reached in March of last
year, it was up moderately from the late 1966 low reached before the
mortgage market began to ease.
Residential construction expenditures--benefiting from an
irregular but improved flow of starts since October--rose for the second
successive month in February. Private nonresidential construction appar-
ently held its advanced level in February. Within this category, outlays
for industrial plants have declined irregularly since last summer, but
outlays for public utilities have tended higher and outlays for most
other types of properties have recovered appreciably. Public construc-
tion, which shared in the February rise, also continued fairly near its
early 1966 peak.
NEW CONSTRUCTION PUT IN PLACE
Per cent changeFebruary 1967 from
($ billions)./ January 1967 March 1966
Total 71.7 +1 -10
Private 48.2 +1 -12Residential 21.2 +2 -22Nonresidential 27.1 - - 2
Public 23.4 +1 - 4
1/ Seasonally adjusted annual rates; preliminary.

II - 19
Supplementing the broad movement toward general credit ease
in money and capital markets, several steps taken by the Administration
in early March promise further stimulus to nonresidential as well as
residential construction activity over the period ahead. These included
a request that the Congress restore the investment tax incentives and
the most accelerated forms of property depreciation allowances, plus a
restoration of part of an $800 million reduction in amounts originally
appropriated for road building in this fiscal year, with the possibility
that additional sums may be restored later this spring.
Seasonally adjusted private housing starts--revised upward
3 per cent further for January--dropped in February to an annual rate
just under 1.1 million units. This decline, which was in line with
staff expectations, raised the possibility of a further drop in March
and also April. In these months, such momentum as builders have achieved
in the abruptly altered and now fluid mortgage market will be tested
against the steeply rising seasonal allowances that are normal for spring.
Reflecting in part the unexpectedly advanced rate reached in
January, indications now are that both the first and second quarters
will moderately exceed a seasonally adjusted annual rate of 1.1 million,
as compared with a low of less than a million in the fourth quarter. If
achieved, this would result in a first-half average about a tenth higher
than seemed tenable as recently as last December. A starts rate of
1.1 million for the first half would be consistent with some further
expansion in the rate of residential outlays in the second quarter.

II - 20
Regionally, seasonally adjusted starts in February dropped
substantially in the Northeast--where most of the over-all advance in
January occurred--and in the North Central states. In the West, which
showed the only month-to-month rise, the advance amounted to a fifth,
but still left the level well below the already reduced rate a year
earlier.
Seasonally adjusted building permits, which had turned up
sharply further in January, turned down in February and were substantially
under a year earlier when the level was still relatively high. All of
the February drop was accounted for by structures of 5-or-more units.
Such units--which usually require a longer lead time for planning and
financing arrangements than other types--had shown an unexpectedly large
advance in January.
PRIVATE HOUSING STARTS AND PERMITS
Starts
Permits1-family2-or-more family
NortheastNorth CentralSouthWest
February(thousandsof units) /
1,089
847551296
153217311166
Per cent
January 1967
-15
-10
-25
-45- 3+ 4+18
change from
Year earlier
-21
-29-15-46
-33-37-22-27
1/ Seasonally adjusted annual rate; preliminary.
I
Januarv 1967

II - 21
Personal income. A $2-1/2 billion increase (at annual rates)
in personal income in February was the smallest monthly increase since
April, 1966, and less than half as large as the $5-3/4 billion rise
which occurred in January. Moreover, a large one-time rise in transfer
payments--primarily the acceleration in life insurance dividend payments
to veterans--accounted for almost half of the small February increase in
personal income.
Total wages and salaries increased by only $1/2 billion in
February, as private payrolls actually decreased for the first time
since April, 1965. Most of the private payroll decline was centered in
the manufacturing sector where a billion-dollar decline was reported.
This reduction in manufacturing payrolls was attributable to the sharp
decrease in average hours worked and substantial reduction in employment.
Other private industries and the government sector recorded payroll
advances which overcame the decline in manufacturing, thus providing the
$1/2 billion rise in total wages and salaries.

II -22
Labor market. The labor market in February showed some
significant signs of weakness. While nonfarm payroll employment as a
whole continued to increase--125,000 over the month--the rise was
less than half the growth of other recent months. More important,
manufacturing employment and hours showed widespread declines,
particularly in durable goods industries. Reductions in employment
were not yet reflected in the unemployment figures in February, how-
ever, and the unemployment rate remained unchanged at 3.7 per cent.
However, an upward trend in unemployment insurance claims in
recent weeks suggests a rise in total unemployment is likely in
March.
The reduction of 65,000 in February was the first substantial
decline in manufacturing employment in more than four years. This
cutback was preceded--as is typical--by a reduction in the workweek.
After drifting down gradually from extremely high levels early in
1966, average weekly hours dropped by four tenths of an hour in
December, and even more sharply--by seven tenths of an hour--in
February to average 40.3 hours, 1.2 hours below a year ago. In
durable goods, the workweek in February was cut by one full hour,
reflecting sharply curtailed work schedules in primary and fabricated
metals, machinery and electrical equipment industries. The workweek
in durable goods, at 40.9 hours, was 1-1/2 hours below February a year
ago. The workweek was also down sharply in a number of nondurable
goods industries. In apparel, hours as well as employment were sharply
reduced, while in textiles and leather, employment declines were small
relative to reductions in hours of work.

II -23
AVERAGE WEEKLY HOURS IN MANUFACTURING INDUSTRIES(Seasonally adjusted)
Durable Goods Nondurable Goods1966 Total industries industries
QI 41.5 42.4 40.4QII 41.4 42.2 40.3QIII 41.3 42.1 40.2QIV 41.2 42.0 40.1
1967
January 41.0 41.9 40.140.3 40.9 39.5
February
The reduction in the manufacturing workweek in February was
one of the sharpest for a single month in the postwar period and may
have reflected storms and strikes as well as reductions in demand.
The extent of the cutback also reflected in part the very high level
of overtime prevailing earlier. Hours of work during most of 1966
were higher than at any time since World War II, and despite the sharp
drop in February, overtime--at 3.4 hours--still remained higher than
at the cyclical peaks of 1957 and 1960. Employers still appear to
have a considerable margin to adjust labor input by further cutting
hours.
In the nonmanufacturing sectors, employment continued
strong in government and private services. In contract construction,
employment increased by 50,000 in February and has shown substantial
recovery in recent months after its sharp decline in the spring
and summer. Construction employment has risen by 150,000 since
November, and in February was only 60,000 below the March 1966 peak.

II - 24
In addition to cutbacks in both hours and employment in
manufacturing, there has been other confirming evidence of an easing
in the labor market. The number of nonfarm workers on part time for
economic reasons has shown a steady rise in recent months, and increased
by over 150,000 in February to 2.1 million. In addition, unemployment
insurance claims toward the end of February began to show the first
year-over-year increases in more than 3 years. Initial claims in late
March were running 35 to 40 per cent above the same week a year ago.
Although possibly still affected to some extent by the G.M. strike of
mid-February, the figures undoubtedly reflect increasing layoffs in
autos, appliances, and other industries where production cutbacks
have followed reduced sales and excessive inventory accumulation.
Outlook for employment and unemployment. The virtual leveling
off in real GNP projected for the first half of 1967 suggests a rise
of possibly half a percentage point in the unemployment rate by midyear.
Most of the increase can be expected to occur in the second quarter,
reflecting a lag in the adjustment of employment to changes in output.
Typically, the biggest declines in both production and employment
occur in manufacturing, particularly in durable goods industries.
Because the factory labor force consists largely of full-time workers
with a relatively permanent attachment to the labor market, much of
the employment reduction tends to become translated into rising un-
employment.

II - 25
An additional upward pressure on unemployment could also
come from the rising number of young men in the population now reaching
20 years of age and looking for permanent jobs. Inasmuch as they
are relatively inexperienced their job opportunities would be cur-
tailed in a weak labor market. On the other hand, the expected
leveling off in real output could cause some slow-up in labor force
growth, thus tending to limit increases in unemployment. Women and
teenagers typically withdraw from or postpone entrance into the labor
force as it becomes apparent that job opportunities are becoming less
available.
Earnings in manufacturing. Average hourly earnings in
manufacturing industries rose in February to $2.78, and were 4.1 per
cent above a year earlier. In many low-paying industries the year-
over-year rise accelerated following the increase in the minimum
wage to $1.40 from $1.25 an hour in early February. A particularly
noticeable increase occurred in leather. Food industry workers also
benefited from the increased minimum, as to a smaller degree did workers
in the lumber and furniture industries. In most of these industries
the over-the-year rise in hourly earnings is now at or close to 5
per cent.
Unit Labor Costs. The rise of hourly earnings in manufac-
turing and the levelling off and decline in production have continued
to put pressure on unit labor costs. There has been relatively little
increase in manufacturing productivity and unit labor costs are
reflecting most of the increase in wages and fringe costs. In the

II - 26
fourth quarter of 1966, unit labor costs were about 2-1/2 per cent
higher than a year earlier; in the first quarter of this year they
appear to be running over 4 per cent higher than a year earlier.
Prices. The wholesale price index was unchanged in March
at 106.0 per cent of the 1957-59 average, according to the preliminary
BLS estimate. Prices of farm products and foods continued to decline,
while industrial commodities rose moderately further--continuing the
pattern of recent months except for January, when farm products
temporarily reversed the declining trend that began last fall. From
last September's peak, prices of farm and food products have declined
about 6 per cent--and the total wholesale price index has declined
0.8 per cent. Over that 6-month period, prices of other commodities
(now labeled "industrial" by the BLS, instead of "other than farm and
foods") have increased 1 per cent, or an annual rate of 2 per cent
as compared with about 2.5 per cent over the preceding year.
Prices of industrial commodities increased 0.2 per cent in
February--instead of showing no change as estimated originally by
the BLS--and another 0.2 per cent in March, according to the BLS
advance estimate. Major advances in February were reported for refined
petroleum and lumber and wood products. In March, gasoline prices
continued to rise and price increases were reported for a heterogeneous
collection of items, including toys, fertilizers, rubber products, paper
boxes and containers, floor tiles, household furniture, and photo-
graphic equipment. On the other hand, the February increase for the

II - 27
lumber and wood products group was reversed, as prices of plywood
declined; and there were significant declines for some fiber
products, leather and leather products, and copper scrap and some
copper products. Moreover, prices of machinery and equipment
apparently remained virtually stable for the second month, following
steady and sizable gains up to the turn of the year. Altogether--
in view of the current easing in the over-all demand and supply
situation--it seems likely that the price rise for industrial
commodities will slow in coming months.
Price'declines for farm products and foods have largely
reflected expanded supplies--particularly of livestock and products.
Production of foods is likely to be large enough to continue the
downward pressure on farm prices during 1967. Commodities expected
to be, in larger supply this year than last include beef, port, poultry
meat, eggs, and citrus fruits. Dairy products will be slightly
smaller. Planned acreages indicate that food crops will be in ample
supply.
The consumer price index edged up 0.1 per cent in February,
to 114.8, bringing the increase since last October to 0.3 per cent
or an annual rate of 1 per cent as compared with 4 per cent earlier
in 1966. Food prices decreased further (and contraseasonally) in
February, with reductions fairly widespread. Prices of
commodities other than food, which had been relatively stable during
the preceding three months, rose moderately in February, with apparel,
household textiles, used cars and gasoline up. Prices of new

II - 28
cars declined somewhat further. Service prices c6ntinued to rise--
although at a somewhat slower pace than in most months of 1966. A
slight decline in mortgage interest rates has contributed to some
slackening of the pace of advance in over-all costs of consumer
services.

II - 29
Farm and food developments. With favorable weather, farm
production of foods is likely to be large enough to continue the
downward pressure on farm prices during 1967 but this does not preclude
some further edging upward in retail prices because of nonfarm costs.
The index of per capita consumption of food in 1967 may exceed last
years' index of 102.5 (1957-59) and may equal the record high index
of 103.5 reached in 1946. Commodities expected to be in larger supply
in 1967 than last year include beef, pork, poultry meat, eggs, and
citrus fruits. Dairy products will be in slightly smaller supply.
Planned acreages indicate that food crops will be in ample supply.
Within the year there may be some temporary shortages or gluts with
accompanying fluctuations in prices. The March survey of planting
intentions shows that farmers plan substantial increases in acreage
of the major field crops but not enough to rebuild stocks of feed
grains to levels considered desirable. The March report on pig crops
planned for the next six months shows that producers are scaling
down production plans a little.
Hog producers are apparently cutting down production in
response to current low profit margins and probably because of the
changed cattle price outlook. According to the March Pig Crop Report,
producers in the 10 Corn Belt states have revised their plans and
intend to raise 3 per cent fewer hogs than a year earlier for sale in
the seasonally high fourth quarter instead of the same number which
they had reported earlier. Furthermore, they indicated intentions
to cut production to 5 per cent below a year earlier for hogs to be
marketed in the first quarter of 1968. This move by hog farmers will

II - 30
probably add strength to end-of-year markets which had been expected
to sag and thus justify reinstatement of earlier predictions of meat
animal prices equal to those in late 1966.
The current unrest among farmers should not go without
comment. This discontent is widespread and is being expressed in many
ways. Immediate causes of discontent are the steadily falling farm
prices since last August, Administration requests for boosts in
acreage without additional incentives, and finally, the 4 per cent
upward revision in beef cow numbers to a new Census checkpoint. The
significance of this revision in cattle numbers is that it shows us
still to be at the crest of the cattle numbers cycle rather than on
the downswing as had been thought earlier. Instead of 2 or 3 years
of relatively strong cattle prices in prospect to lend strength to hog
prices, the prospect is now for relatively stable prices close to
current levels.
Farmer discontent may be a factor in the lagging response to
government measures to expand acreages as revealed in the March Survey
of Planting Intentions although it is true that farmers find it
difficult to change planting plans drastically in a years' time. Of
the 17 principal field crops covered in the March survey, increases
in 1967 planted acreage of only 2.7 per cent are planned. With
winter wheat and other fall-planted crops included, the increase amounts
to 6 per cent over 1966.

II - 31
PLANTED ACREAGE(Thousands of acres)
Selected cropsand
total plantings
Feed grains
CornSorghumOatsBarley
SoybeansCottonSpring wheatOther survey crops
Total (17 spring-planted crops)
Winter wheatOther crops
Y Planned
1961-65 1966 Plannedaverage 1967
123.2
66.116.127.913.0
30.515.311.677.2
257.9
44.35.6
117.0
66.316.323.211.2
37.410.411.673.8
250.1
42.95.0
120.3
70.618.321.210.2
40.610.013.972.0
256.8
54.15.2
316.2 6.1
Per centchange1966-67
2.8
6.612.2-8.7-8.9
8.6-3.719.7-2.4
2.7
26.24.2
I----~--
Total (59 crops) 305.9 298.0

II - 32
Population. The birth rate continued on its downward course
in 1966 but the decline was not as pronounced as a year earlier. The
downtrend, which began in 1957, has now brought the birth rate very
close to the low rates experienced in the mid-30's. Because of the
small number of births last year, net addition to the population and
the rate of increase were the smallest in two decades, Moreover, the
marriage rate, which has been rising moderately since 1962, increased
by only 2 per cent in 1966, despite the larger number of young persons
reaching marriage age.
With the number of births reduced again in 1966 the net
addition to the population was 2,150,000, nearly one-third less than
in 1956. The increase of only 1.1 per cent in 1966 was the lowest
since 1945, and was far below the 1.8 per cent growth rate of 1956.
Even under the most optimistic series of population projections by the
Census Bureau, population growth does not return to a rate of 1.8
per cent until 1974; under all but the gloomiest projections, however,
some small rise is predicted in the years to come.
Marriages. The marriage rate for 1966 again showed only
modest response to the more favorable age composition of the population
and the continued rapid growth in economic activity. Some evidence
of an acceleration in the marriage rate occurred in the last half of
1966. This probably reflected in part the concentration of the increase
in population at age 20, close to the median age at first marriage of
young women whi.ch was 20.5 years in 1966.
A continuation of this acceleration in 1967 would seem to
hinge largely on the impact of population change. More young persons

II - 33
will reach age 21, and many of them will thus be graduating from
college, permanently entering the labor market and becoming financially
able to marry and set up households. These expectations are, however,
tempered by the uncertainty of the economic outlook, the continuing
sizable, if smaller than in 1966, number of unmarried young men
entering the armed services and the fact that most of these young men
will still be below the median age of 22.8 years for first marriage
of men.
MARRIAGES AND BIRTHS(Seasonally Adjusted)
Number 2/ Rate 3/Marriages Births Marriages Births
(000 omitted)
1965 1966 1965 1966 1965 1966 1965 1966
Q I 1,748 1,756 3,868 3,676 9.2 9.1 20.0 18.9Q II 1,708 1,796 3,764 3,660 8.8 9.2 19.5 18.8Q III 1/ 1,880 1,920 3,744 3,544 1/ 9.7 9.8 19.2 18.1Q IV 1,820 1,916 3,692 3,628 9.3 9.6 19.0 18.4
Year 1,789 1,844 3,767 3,629 9.2 9.4 19.4 18.5
1/ Reflects the change in draft status of married men without childreneffective August 29.2/ Annual rate.3/ Per 1,000 total population.
Births. Births in 1966 declined by 140,000 to 3.6 million,
the smallest number since 1950. The birth rate dropped further by
close to 5 per cent in 1966 to a rate of 18.5 per thousand, bringing
it to the lowest levels of the 1935-39 depression years. However, the
fertility rate (which measures the number of births per 1,000 women
15 to 44 years) has remained substantially higher than in the mid-
1930's. At 93 in 1966 compared with 76 in the mid-1930's, 1966 'fertility
rate, however, is far below the 1957 postwar peak of 123.

II - 34
Birth statistics for 1966 do not provide any firm evidence
of a change in the birth rate trend. The rate was still very low
in the final quarter of the year, although it had rebounded somewhat
after a precipitous decline in the preceding quarter. There is
evidence, however, that the fertility rate was bottoming ouL at year-
end at a level about one per cent below the 1966 average. The
substantially larger rise in the number of women in the 20 to 24
age group this year than in 1966, and the further rise in marriages
portend some abatement if not reversal in the downtrend in number of
births in the near future.

n--c-1 3/28/67
ECONOMIC DEVELOPMENTS - UNITED STATESSEASONALLY ADJUSTED
kTIONAL PRODUCT EMPLOYMENT AND UNEMPLOYMENT
INDUSTRIAL PRODUCTION-I195759100 I Tllll1200RATIO SCALE
180
-- 160FEB 1561FEB 1559 -
1 1 , In
S 1 1IAU
MATERIALS
A_/ iii , 1001961 1963 1965 1967
INDUSTRIAL PRODUCTION-I1957 59100 | 20Il
rr rrl
RATIO SCALE
--- FEB - 18S 178 9
16
i-4 7 14
CONSUMER GOODS
, EQUIPMENT/ TOTAL
1 101963
WORKWEEK AND LABOR COST IN MFG.HOURS I AVERAGE WEEKLY HOURSI''""'"RATIO SCALE
_FEB 40 3
SPRODUCTION WORKERS
el-TOTAL
1961 1965 1967

I- -c-2
ECONOMIC DEVELOPMENTS - UNITED STATESSEASONALLY ADJUSTED
INCOME AND SALES1960 61=100RATIO SCALE
IFEB 1492
SFEB 138 7
p-PERSONALINCOME
/-/ vI, RETAIL
r SALES
1961 1963 1965 1967
RETAIL SALESI1960 61=100 I 2
RATIO SCALE
NEW U.S.UNITS I
I iAUTOS
i \r A/wFEB
150 2
12C
l__ , ., -8(1961 1963 1965 1967
INSTALMENT CREDITBILLIONS OF DOLLARS RATIO SCALE l.... 90ANNUAL RATES JAN 760
60
../ REPAYMENTS
50
40
NET HANGE IN OUTSTANDI G 1121I 6 T6JAN 3 49
6 8
0---- --------- -. ........-- 1 8 0
- |
3/28/67
1
BUSINESS INVESTMENTBILLIONS OF DOLLARS, ANNUAL RATES I I 70
RATIO SCALEI '- - 6 0I U 6 2 3NEW PLANT ANDEQUIPMENT
-- EXPENDITURES --- - -50(COM -S.E.C.)
-- -- - -40
PER CENT I 12GNP FIXED INVESTMENT I 107AS SHARE OF GNP
10
lnllll l l o1961 1963 1965 1967
MANUFACTURERS' NEW ORDERSBILLIONS OF DOLLARS iIRATIO SCALE _ 5
FEB222 201.- -" 20
ALL DURABLE GOODS - 15
6MACHINERY AND FEB 43EQUIPMENT
F EB
31
e 2
DEFENSE PRODUCTS
I1 1 11961 1963 1965 1967
BUSINESS INVENTORIES, NONFARMQUARTERLY CHANGE, ANNUAL RATES I I I1 20BILLIONS OF DOLLARS Q I 176
15
GNP BASIS10
5
0
5
INVENTORIES/SHIPMENTS RATIO 1.9IQ _ 1 72
1.7
IMANUFACTURERS I
1961 1963 1965 1967
1
1961 1963 1965 1967

III - 1
DOMESTIC FINANCIAL SITUATION
Flow of funds. Preliminary estimates of fourth-quarter flows
of funds present two contrasting pictures of financial markets, with
the data on borrowing showing characteristics of severely restricted
credit conditions while supply data are typical of periods of ease. The
total of credit flows in the fourth quarter was roughly equal to the low
level of the third quarter, after seasonal adjustment, bringing the
total for the year below that of 1965, the highest year on record.
SUMMARY OF CREDIT MARKET BORROWING(Billions of dollars, seasonally adjusted annual rates)
1966
1965 1966 Firsthalf
Total borrowing 72.1 70.1 81.0 60.8 57.6
U.S. Government 3.5 6.8 9.0 2.8 6.4
Foreign 2.6 1.1 2.3 .2 - .3
Private domesticnonfinancial sectors 66.0 62.2 69.8 57.8 51.5
State and local obligations 7.4 5.9 6.3 4.8 6.1Corporate securities 5.4 11.1 13.6 11.7 5.7Mortgages 25.5 21.6 25.7 19.7 18.1Bank loans n.e.c. 13.6 9.8 11.5 9.5 6.8Other 14.1 13.8 14.1 12.2 14.8
The year 1966 thus divides essentially into two halves, with
credit flows in the first half at slightly over an $80 billion annual
rate and in the second half at less than a $60 billion rate. While
this division appears in all major forms of credit flows, it is seen

III - 2
most clearly in private domestic borrowing, where corporate security
issues, mortgage lending, bank loans, and consumer credit all fell
off sharply in the latter part of the year. Federal borrowing was
also somewhat less in the second half of the year. The Federal Govern-
ment shifted from surplus to deficit over the course of the year in
income-and-product transactions, but this was largely offset.by a
sharp reduction in loan outflows, particularly FHLB loans to the savings
and loan industry, which were at a $2.5 billion annual rate in the
first quarter and at a $2.5 billion repayment rate in the fourth.
The fourth quarter drop in private borrowing contrasted
sharply with movements in private capital outlays, particularly the
surge in inventory accumulation. Part of the decrease in credit flows
was in mortgage lending on single-family houses, both construction
loans to builders and permanent financing for households. This
decrease closely paralleled the decline in home construction activity;
both expenditures and home-mortgage lending were about $4 billion less
(at annual rates) in the fourth quarter than in the first quarter.
With homebuilding set aside, the table below indicates the extent
to which plant and equipment and inventories were financed from
sources other than credit and capital consumption allowances.

III - 3
NONFINANCIAL BUSINESSCapital Expenditures and Credit Market Borrowing
(Billions of dollars, seasonally adjusted annual rates)
1966
1965 Total First I IVhalf
(1) Total capital outlays- 81.3 92.9 91.2 91.8 97.6
Sources of finance--
(2) Capital consumption 2150.2 53.2 52.4 53.7 54.5
(3) Credit market borrowing- 29.5 34.1 39.4 30.3 27.2(4) Other sources 1.6 5.6 - .2 7.8 15.9
(5) Net investment ( (1)-(2) ) 31.1 39.7 38.8 38.1 43.1
Percent borrowing ofnet investment 96.5 86.0 101.6 79.6 63.0
1/ Excludes net investment in 1- to 4-family residential construction.2/ Excludes 1- to 4-family residential mortgages.
These other sources (line 4), which are the sum of retained
income, reduction of liquid assets, and miscellaneous other financial
transactions, had worked out on a net basis to virtually zero during
1961-65 and continued so in the first six months of 1966, when bor-
rowing was heavy partly to meet accelerated payment schedules on corpor-
ate taxes. In the second half of the year, however, they rose to an
unprecedented rate of almost $12 billion. Part of the increase was
in retained income, which on an income-and-product basis was $1.5
billion higher than the first half, despite the downward tendency in
book profits. This increase in internal funds reflects no more than the
$3 billion rise in inventory valuation adjustment during the fourth
quarter, which constitutes virtually all of the $3 billion increase in

III - 4
corporate inventory investment in the quarter. Leaving aside the IVA,
both retained earnings and inventory change are almost constant over
most of 1966. A more important internal source, however, was liquid
assets, which seem to have been reduced heavily by business to pay
for capital outlays during the latter half of the year. Although there
was a clear tendency toward more internal financing of investment as
the year progressed, tax borrowing in the first half made the shift
more abrupt than it would otherwise have been. Taking the two halves
of the year together, however, the total of $6 billion in internal
sources was large in comparison with earlier years and represented a
sharp departure in trend.
The supply of funds to credit markets showed clear signs
of easing market conditions during the fourth quarter, despite the low
volume of total credit flow. Inflows to savings institutions were up
sharply from spring and summer rates and were used to a considerable
extent for repayment of FHLB debt. Allowing for such repayments,
credit flows through nonbank financial institutions rose from 35 per
cent of total borrowing in the third quarter to over 50 per cent in
the fourth. Bank credit at the same time increased at about double
the rate of the summer, and rose from 7 per cent of total credit flows
in the summer to over 30 per cent in the fourth quarter. The third-
quarter figure was depressed by the large runoff in Federal cash, but
the bank-credit increase was substantial even after allowance for the
drop in Treasury balances. Another evidence of reduced credit market
pressure was the reduction in volume of securities bought directly by

III - 5
FORM OF FUNDS SUPPLIED TO CREDIT MARKETS(Billions of dollars, seasonally adjusted annual rates)
Total borrowing
Funds supplied by--
Private nonfinancial sectors
Demand deposits and currencyTime and savings deposits at banksSavings accounts at savingsinstitutions
Direct lending
Federal loan programs
Federal cash balances
Other sources
1965 1966 19661966
1965 1966III IV
72.1 70.7 60.8 57.6
49.3
7.920.2
13.18.3
4.7
-1.0
19.0
42.5
2.613.2
17.419.3
7.5
- .1
20.8
36.9
-4.611.0
5.125.3
6.3
-7.3
24.9
29.2
5.78.0
11.04.5
2.3
1.1
25.0
nonfinancial investors from the $20-25 billion rate of the first three
quarters to about a $5 billion rate in the fourth. This shift brought
the volume of such direct investment back to the moderate levels that
prevailed during much of 1961-65.
To some extent the drop in direct lending by nonfinancial
sectors in the fourth quarter was exaggerated by special developments.
About $12 billion of the decline was in Government securities, and
roughly half of that reflected transient circumstances such as the
large buildup in positions of Government security dealers at year end.
Direct investment also included an exceptionally large liquidation of
corporate stock holdings by households, roughly $8 billion at annual

III - 6
rates. Part of this sell-off of stocks reflected the retirement of
Consolidated Coal shares (about $2 billion at annual rates) in
October. / The rest of the stock sell-off arose mainly from a shift
by investment companies into security buying. During preceding
quarters investment companies had been accumulating sizable balances
of cash and Governments with proceeds of share sales, but from the
third to the fourth quarter a net shift of such flows into stocks
occurred that ranged around $4 billion at annual rates. This was
reflected in household transactions as a corresponding shift into
net sales of stocks.
Professional portfolio management was thus the source of
much of the drop in direct lending during the fourth quarter. A re-
bound by households from this position can be expected in the current
quarter, and it is likely that security sales to individuals can
increase somewhat from recent levels without pressures on interest
rates.
Flows to Non-bank financial intermediaries. Net flows to
savings and loan associations and mutual savings banks showed a marked
seasonally adjusted expansion in the closing months of 1966. The change
was particularly pronounced at the S&L's, which until November had not
shared in the improved flow already evident at savings banks since July.
1/ The Consolidation Coal transaction affected several comparisonsbetween the third and fourth quarters, because it was financed bya bank loan in the third quarter, the proceeds of which were carriedinto the fourth quarter as a time deposit. If the entire transactionhad occurred in the third quarter, both total borrowing and time-deposit flows into banks would have been more closely equal in thetwo quarters.

III - 7
As in the market for publicly-offered corporate bonds, bond
offerings of State and local government also set an all-time high in
the first quarter--25 per cent larger than in the like period of 1966.
In each month of the quarter volume was in excess of $1 billion, with
March registering an estimated $1.2 billion. The March volume was
digested with some difficulty and several recent offerings still have
substantial unsold balances. As a result, the Blue List of dealer's
advertised inventories has risen to $700 million, the highest level
since October 1965. The April municipal calendar, however, now estimated
at about $850 million, would represent the smallest monthly volume of
offerings since October.
STATE AND LOCAL GOI atMENT BOND OFFERINGS(In millions of dollars)
1966 1965
Total 11,362 11,329
1967 1966
January 1,350e 1,219February 1,160e 867March 1,200e 879
1st Quarter 3,710e 2,965
April 850e 1,211

III - 8
Mortgage market developments. Mortgage markets eased further
in March as demands for new credit and the ready supply of existing
laons apparently continued to expand less than inflows of savings to
mortgage lenders. As evidence of additional easing, seasonally adjusted
weekly applications to FHA for insurance on home mortgages increased
again through late March, and market observers noted further declines
in mortgage yields. Secondary-market offerings of FHA-insured and VA-
guaranteed home mortgages to FNMA, however, turned up somewhat, reflecting
the increase in FNMA's buying price on March 6--the second 1/8 of 1 per
cent increase made within a month.
Additional direct Government steps toward stimulating the
marekt included another 1/4 of 1 per cent reduction in rates charged
on Federal Home Loan Bank advances, effective March 1, bringing the
level down to 5-1/2 per cent. Also, FNMA on March 6 released an ad-
ditional $380 million to buy mortgages under its various special assistance
functions, mainly for low and medium priced homes with Government-
underwritten loans; on April 1, $250 million more will be made available.
If all this additional $630 million is actually used, it could ultimately
finance more than 40,000 new dwellings. Of the $250 million originally
made available late last November under FNMA's special $1 billion support
program authorized for new homes, about four-fifths had been committed
by early March on more than 12,000 mortgages, but only a few loans had
actually been taken down.
Data for Feburary indicate that easing of interest rates
and yields on home mortgages was even more marked than in January.

III - 9
In the primary marekt, a 10 basis point decline in conventional mortgage
rates (FHA series) reduced the average to 6.50 per cent for loans on
new homes. But the rate was still 45 basis points above the rising
level a year earlier and 70 basis points above the 1963-65 low. Re-
flecting the abruptness of easing in the secondary market, where loans
available for immediate delivery continue in particularly short supply,
discounts on certain FHA-insured new-home loans eased furhter to 4.0
points from 5.3 points. As a result, the secondary market yield on
these 6 per cent FHA mortgages declined by a record 16 basis points.
Overall, the decline from the November peak in interest
rates and yields for these two mortgage series has ranged from 20 to 35
basis points. As the table shows, their reported decline has been
substantially greater than during the first three months after turning
points in earlier cyclical downturns in mortgage rates that followed
less dramatic periods of tightness.
CYCLICAL DECLINES IN YIELDS ON NEH-HOME MORTGAGES
Interest Rate or Yield:Date of Decline in firstcyclical At peak 3 months after peak
peak (per cent) (basis points)in rate Conventional FHA Conventional FHA
loans loans loans loans
November 1966 6.70 6.81 20 35
January 1960 6.30 6.25 5 4
October 1957 6.00 5.63 5 4
September 1953 n.a. 4.86 n.a. 8
NOTE: FHA series, for interest rates on conventional first mortgagesin primary market (excluding additional fees and charges, androunded to nearest 5 basis points), and yields on FHA-insuredSec. 203 loans in secondary market.

III - 10
Nonfarm real estate foreclosures were down further in the
fourth quarter of last yea; registering one of the few year-over-year
decreases of the postwar period. With some additional rise in outstand-
ing mortgages, the foreclosure rate dipped to the lowest level in 3
years.
NONFARM MORTGAGE FORECLOSURES
Number(In Per cent Rate per
Fourth thousands increase thousandQuarter at annual over year mortgaged
rate) earlier structures
1966 114 -4 4.61965 119 10 5.01964 108 11 4.81963 97 10 4.51962 88 16 4.31961 76 34 3.91960 57 33 3.0
SOURCE: Federal Home Loan Bank Board. Data not adjusted for seasonalvariation.
Flows to depositary-type intermediaries. Savings flows to
depositary-type intermediaries continued to show dramatic improvement
during February, and preliminary evidence for commercial and mutual
savings banks indicates that growth has persisted in March as well.
For all depositary type institutions combined, February inflows of
consumer-type savings were a record. Flows to both commercial and
mutual savings banks exceeded any previous February, and the growth in
share capital at S&L's was only 7 per cent less than the previous high

III - 11
for the month, reached in 1963. On a seasonally adjusted basis, the
annual growth rate in February was 10 per cent for savings banks, 9.5
per cent for S&L's, and a little less than 9 per cent for commercial
banks (on consumer-type accounts).
NET FLOWS TO DEPOSITARY-TYPE FINANCIAL INTERMEDIARIES(Millions of dollars)
/ Commercial BanksFebruary Total-l S&L's MSB's Without CD' s With CD's
1967 2,754 790 300 1,664 2,360
1966 1,499 528 203 768 821
1965 2,356 579 203 1,574 1,807
1964 1,806 760 244 802 1,124
1/ Excludes CD's in excess of $100,000 at weekly reporting banks.
Further acceleration of inflows in February was not signifi-
cantly reflected in expanded mortgage acquisitions by either savings
banks or S&L's. Final February reports for mutual savings banks (not
yet available) are expected to show a pattern similar to January's when
these institutions purchased nearly as many securities as they did
mortgages, an unusual distribution of available funds even for this time
of year.
Thus far in 1967, savings and loan associations have repaid
nearly $1.7 billion of their outstanding indebtedness to the Federal
Home Loan Bank System, raising to $2.1 billion the overall reduction in
such debt from the peak reached late last July following the heavy

III - 12
summer withdrawals of share capital. Reflecting these large net repay-
ments, outstanding S&L advances dropped recently to a level $360 million
below that prevailing a year ago. Taking advantage of the large repay-
ments, the Federal Home Loan Bank System has retired more than $1
billion of its own debt within the past month and a half, and even so
still holds unusually large reserves.
FHL BANK ADVANCES AND MEMBER DEPOSITS(Millions of dollars)
Ad : Member Deposits_____ Advat FHL Banks:
Change from Outstanding Change from Level of DepositsJan 1.-March 23 as of March 23 Jan. 1-March 23 March 23
1967 -1,677 5,258 +389 1,425
1966 - 538 5,618 -240 803
1965 - 700 4,623 -169 1,030
1964 - 927 4,055 -200 952
Stock market. As measured by Standard & Poor's index of 500
stocks, stock prices have advanced another 3-1/2 per cent in March,
extending the total advance to 12 per cent since the end of last year
and to 23 per cent from the 1966 low of last October. Thus, roughly
four-fifths of last year's February-to-October decline has been recovered.
Further price advances in the past month have been broadly based including
blue chip issues as well as low priced stocks.

III - 13
Trading volume on the New York Stock Exchange in the first
half of March was extremely high, averaging 11.1 million shares a day;
and on March 10 alone it totaled nearly 15 million shares, close to the
all time daily record of 16.4 million shares recorded in 1929. In the
most recent week, ending March 24, however, volume receded somewhat to
an average of 9.3 million shares per day and has since remained at or
below that level. On the American Stock Exchange volume also rose
during the first half of March, averaging about 4,6 million shares per
day, compared with an average of 3.7 million shares in February, but
there too volume has receded somewhat most recently.
Customer's net debit balances at New York Stock Exchange
firms carrying margin accounts rose about $60 million in February. Over
the longer period of generally rising prices since last October,
customer's net debit balances have risen $180 million. But to some
extent both the February rise and the longer-range increase reflect
increases of changing balances in cash accounts arising from higher
levels of trading activity since last fall. Purpose loans at banks
which showed little change in February are nearly $90 million below their
outstanding level at the beginning of October last year.
In view of the continuing evidence of slowing economic
activity, further advances in stock prices seem somewhat paradoxical.
But this divergence between current economic facts and stock price
movements apparently reflects an investor consensus that any weakening
in economic activity will be short lived. Additional support for this
view has been provided recently by the recommended restoration of the
investment tax credit, and by the further easing in monetary policy,

III - 14
Some slowing of economic activity and squeezing of corporate
profit margins this year had been widely anticipated and discounted in
last year's general stock price decline. But, the sharpness of the
1966 decline was accentuated by the special impact of tight money on
competitive yields provided by fixed income investments, as well as on
the cost and availability of stock market credit. Thus, with corporate
profit positions not yet so deeply eroded as had been feared, and with
money easing again, stock prices have risen. Institutions which had
established large positions in high yielding short-term securities during
last year's stock market break have provided a strong upward stimulus to
prices by switching aggressively back into stocks as yields on market
securities have declined.
Price-earnings ratios on many good quality stocks are still
well below levels that have typically prevailed in recent years, but
the ratio of recent prices to estimated fourth quarter profits for issues
included in Standard and Poor's composite index has risen to 16.7,
which compares with the 17.3 level reached in February a year ago, just
before prices turned down. Thus, any serious further deterioration in
business activity might lead to a reappraisal of recent stock market
tendencies. The fact that short-positions on the New York Stock Exchange
rose to a record volume at mid-March suggests that an increasing number
of investors already expect at least some near-term price decline, although
any decline that did occur would tend to be cushioned in the first in-
stance by the potential demand represented in these positions.

III - 15
Bank credit. Total loans and investments at all commercial
banks, on an end-of-month basis, are tentatively projected to rise at
an annual rate of around 16 per cent in March. With this increase,
bank credit will have expanded at approximately a 12 per cent annual
rate since the end of November, compared with a less than one per cent
annual rate over the July through November period last year and 9.8 per
cent for the first half of 1966.
Continued large inflows of time and savings deposits in March,
together with the marked easing in reserve positions, enabled banks not
only to expand loans substantially, but also to make large further addi-
tions to their security holdings. For all commercial banks, it now appears
that holdings of Governments may increase at better than the 25 per
cent annual rate of February while holdings of other securities may rise
at cicee to the February rate of 29 per cent.
The increase in investments during March was heavily concentrated
in short maturities, suggesting continued bank desire to rebuild liquidity
positions, though banks also showed interest in longer-term securities.
City banks apparently acquired a considerable amount of Treasury bills
in March, with the $2.7 billion of tax anticipation bills paid for on
March 13--50 per cent payable through tax and loan credit--undoubtedly
helping to enlarge this total. In addition, nearly two-fifths of city
bank acquisitions of municipal and other securities over the four weeks
ending March 22 was in tax warrants and other short-term issues, although
the proportion was much higher at banks in New York City than at outside
banks.

III - 16
Business loans are estimated to show a rise of about $1 billion
in March, about twice the average increase over the previous three months
and slightly more than the monthly increase of a year earlier. The sub-
stantial growth in business loans in March, as in the periods of rapid
business loan expansion in 1966, was associated in part with large pay-
ments of income and withheld taxes. These payments were estimated at
$12.8 billion in March--slightly more than a year earlier and well above
the $8.5 billion in February.
Businesses also have been satisfying a substantial part of
their financing needs outside the banking system, as indicated by the
record volume of capital market financings by corporations in March and
in the first quarter. Apparent reluctance by some banks to make term
loans because of a desire to rebuild liquidity--as well as the continued
cost advantage of borrowing in capital markets--probably contributed to
this surge of market financings by corporations seeking to rebuild liquid-
ity.
An analysis of the changes in loans by industry suggests that
loan demand has remained strong in the heavy goods industries, where
order backlogs still remain large, but in other sectors it has been
weaker. Over the three weeks ending March 15, about half of the increase
in business loans at weekly reporting banks was accounted for by borrow-
ings of machinery and transportation equipment producers. Over one-tenth
was in bankers' acceptances. Loans in other major business loan categories
either expanded only moderately or declined more than seasonally. Loans

III - 17
to food processors, trade firms, textile manufacturers and other manu-
facturers--industries where borrowing is generally associated with inven-
tory demand--have been especially weak. The recent reduction in the
prime rate to 5-1/2 per cent by many large banks which had maintained
a 5-3/4 per cent rate also possibly may indicate some weakening in the
longer-run demand for bank loans.
Increases in real estate and consumer loans appear to have
remained relatively moderate in March. However, bank loans to security
dealers increased sharply during the month--following a marked decline
in February--reflecting changes in dealer inventory positions and in
their expectations for near-term interest rate movements.
Bank deposits. Time and savings deposit inflows at commercial
banks, which had slackened briefly in late February, resumed their rapid
growth in March. On a seasonally adjusted basis total time and savings
deposits are estimated to have increased at an annual rate of 16 per cent
for the month. Over the first quarter, these deposits rose at about an
18 per cent annual rate--the highest rate for any calendar quarter since
the first quarter of 1962.
A major part of the recent growth has been in passbook savings,
which have staged a dramatic turn-around beginning about mid-February
after a year of almost continuous decline. The recent expansion has been
about as large at reserve city as at country banks. It is estimated that
these deposits accounted for over one-third of the March increase in total

III - 18
time and savings deposits at all commercial banks. Despite the noncom-
petitiveness of the 4 per cent ceiling, this growth probably reflects
in part the sluggishness of retail sales, particularly for large-ticket
durable goods.
With the rate of personal saving high and interest rates on
short-term market instruments declining further in March, inflows of
consumer-type time deposits continued at a rapid pace at both country
and reserve city banks. Thus, total time and savings deposits at country
banks accelerated to an annual rate of about 15.5 per cent, well above
the 13 per cent average rate of increase in the preceding two months.
At reserve city banks, however, reflecting mainly the reduced growth on
a monthly average basis of large CD's, the rate of growth in total time
and savings deposits slackened considerably from the very rapid pace of
the preceding two months.
Even though offering rates on large CD's declined during the
month, their yields remained attractive relative to those on Treasury
bills; however, they continued to be lower than yields on commercial paper.
Nevertheless, large banks were able to add $560 million to their outstand-
ing CD's over the first four weeks of March in spite of the nearly $1
billion of maturities over the tax and dividend dates. During the tax
week, the loss was only $82 million as compared with nearly $400 million
in the comparable week last year. Banks outside of New York City continued
to account for most of the growth in CD's.

III - 19
The money stock rose sharply in March--at about a 16 per cent
annual rate--with growth in private demand deposits accounting for the
major portion of the increase. Since November, the money stock has
increased at an annual rate of about 6 per cent, as compared with a
decline of nearly 3 per cent from the end of June through November of
1966.
Reflecting the increase in demand deposits--as well as the
slowing in the economy's rate of growth--the seasonally adjusted rate of
turnover of demand deposits at 232 Standard Metropolitan Statistical
Areas (excluding New York City) declined to an average rate of 39.4
for the first two months of 1967 from an average rate of 39.7 for the
fourth quarter of last year. Turnover was still about 6 per cent higher
than a year earlier, however.

II-C-1
FINANCIAL DEVELOPMENTS - UNITED STATES
FREE RESERVES AND COSTSBILLIONS OF DOLLARS
NET FREE RESERVES MAR 22 28
NET BORROWED RESERVES
IANK RESERVES
TOTAL E
S LI FES 23 5*^^^-" 2
NONBORROWED(SA)
BILLIONS OF DOLLARS IBORROWED
1 FEB 36
EXCESS FEB 36
4.0
2.0
0.0
.8
0
CHANGES IN BANK LOANS-BY TYPEBILLIONS OF DOLLARS I I f I I Ir , I I , 3SEASONALLY ADJUSTED AMO MOVING
AVERAGE-- 2
FEB 01 - +
FINANCIAL
SFEB 05
2
ALL OTHER 2A I
\? FEB 02
1965 1966 1967
SAVINGS SHARES AND DEPOSITSBILLIONS OF DOLLARS I I IRATIO SCALE
. FEB 1149
SAVINGS AND LOANASSOCIATIONS
MUTUAL SAVINGS BANKS FEB 559
1967
3/28/67
BILLIONS OF DOLLARSRATIO SCALE|
FEB 23 9
1963 1965

NT -- 2
FINANCIAL DEVELOPMENTS - UNITED STATES
NET FUNDS RAISED-NONFINANCIAL SECTORSSBILLIONS OF DOLLARS I I I I I 1' 00SEASONALLYANNUAL RATE
ADJUSTED,S
TOTAL
J \ 57 2
PRIVATE DOME STIC-PRIVATE DOMESTIC- °Q
4 51--
SHARES IN TOTAL CREDITPER CENT
o. 32 9
COMMERCIAL BANKS
IA
NONBANK DEPOSITORYINSTITUTIONS
O \ I 2, _ 121
PUBLIC I I I I
1964 1965 1966 1967
MARKET YIELDS-U.S. GOVT. SEC.PER CENT ' -' - i' i 7
1-YEAR BILLS*
5-YEAR ISSUES J /\FEB 474 - 5-\ 20-YEAR BONDS
FEB 461
-3-MONTH BILLS*FEB 468
*INVESTMENT YIELD BASIS_ I II ,_ I-,, ,-
1965 19671963
STOCK MARKET
3/28/67
P-q i

IV - 1
INTERNATIONAL DEVELOPMENTS
U.S. balance of payments. The balance of payments measured
on the liquidity basis appears to have deteriorated in March, unless
month-end transactions and official operations effect a sharp reversal.
In January and February combined the deficit was $130 million, before
seasonal adjustment, but in the first three weeks of March a deficit of
$460 million has been reported. The seasonal adjustment now in use
raises the reported first quarter deficit by about $500 million.
However, the figures for the quarter are greatly influenced by special
factors that must be taken into account in assessing the underlying
condition of U.S. international payments.
Tax payments to Libya by U.S. petroleum companies amounting
to £100 million ($280 million) were advanced in timing to March this
year. Last year the payments were somewhat smaller and were made in
April. Also, the first-quarter liquidity balance has not, through
March 22, benefited from official transactions nearly as large as
those arranged in the fourth quarter of last year. In that quarter
the seasonally adjusted deficit was $550 million, but special receipts
included additions to foreign official holdings of long-term U.S.
assets amounting to $300 million, and advance debt repayments of
about $190 million. Taking into account the special factors affecting
the balance in the past two quarters, the basic situation still seems
to be one of very substantial liquidity deficits.
Measured on the official settlements basis, the first quarter
deficit was extraordinarily large. In January and February this deficit

IV - 2
totalled $770 million, before seasonal adjustment, and there was a
further $400 million deficit in the first three weeks of March. The
seasonal adjustment will increase this quarterly deficit by a further
substantial amount. The difference between the two measurements re-
flects principally changes in U.S. liabilities to commercial banks
abroad. From mid-December to early February U.S. banks returned about
$1.0 billion of borrowed funds to their foreign branches. Since then
net flows have been small and the two measures of balance have been
less divergent.
U.S. reserve assets were reduced very little in March, The
gold stock rose by about $25 million through the 22nd, but this was
offset by a reduction of $110 million in convertible currencies, almost
entirely sterling. In the first quarter through March 22 the gold
stock and IMF gold tranche position changed very little, while holdings
of sterling and other convertible currencies were reduced by nearly
$1.0 billion.
The available information on merchandise trade and capital
flows does not suggest any weakening in basic trends. The merchandise
trade surplus in January-February was at an annual rate of $4.0 billion.
This represented a major improvement over the fourth quarter cyclical
low of $2.9 billion. Exports moved up about 5 per cent over the fourth
quarter rate, to an annual rate of $31.0 billion on the balance of
payments basis. Country and commodity detail are lacking as yet, but
the following table indicates that non-agricultural commodities ac-
counted for this increase. Export orders for manufactures were
relatively high at year end.

IV - 3
U.S. EXPORTS(billions of dollars, seasonally adjusted annual rates)
1966 19671965 1st 2nd 3rd 4th Jan.-
Qtr. Qtr. Qtr. Qtr. Feb.
Agricultural 6.3 6.8 6.9 7.4 7.0 6.7R7
Non-agricultural 20.4 22.0 22.1 22.4 22.9 24.6E/
Total, Censusbasis 26.7 28.8 29.0 29.8 29.9 31.3
Total, Balance ofpayments basis 26.3 28.8 28.7 29.5 29.6 31.0/
p2/ Preliminarye/ Estimate
U.S. imports in January-February were at an annual rate of
about $27.0 billion, a little over 1 per cent higher than in the
fourth quarter. Earlier rapid advances at rates around 20 per cent
a year ceased after October.
There is no indication yet of any noteworthy outflow of U.S.
private capital, apart from the amounts required to make the March
tax payments mentioned above. On balance, banks reduced their claims
on foreigners by $56 million in February, following a seasonally high
reduction of $263 million in January. Bank commitments for long-term
loans in the first quarter were quite low, and disbursements may well
continue to be exceeded by maturing loans. Now that long-term
dollar loans by foreign branches of U.S. banks are exempt from the
IET there may well be a tendency to use the branches for financing

IV -4
foreign affiliates of U.S. firms as well as other foreign customers,
if deposit funds of suitable maturities are obtained.
Foreign new security issues sold in the U.S. in the first
quarter were about average for the past few years, at about $300 million.
Most of the sales came relatively early in the year, and were for Canadian
or international organization borrowers.
Economic activity abroad. The widespread slowdown in economic
activity in Europe which began in mid-1966 apparently continued into the
first two or three months of 1967. However, there have been indications
that the decline in Britain may have been leveling out. In Japan, expansion
has continued vigorously.
Declines during the latter half of 1966 in British and German
demands for goods had repercussions elsewhere in Europe, contributing, for
example, to the moderation of demand pressures in France and in the
Netherlands. Even in Italy, where supply conditions and Government policies
both favor further rapid expansion of output this year, there was some slow-
ing in growth of production of finished consumer and capital goods toward
the end of 1966. Weakness of demand for textiles was particularly wide-
spread in Europe from September onwards. The mainspring of the European
slowdown, however, continues to be slackness in British and German private
capital outlays.
In January 1967, manufacturing production rose in Britain for
the second month in succession. In Germany there was a further decline
in industrial production, and French industrial output stayed at its
November-December level.

IV - 5
INDUSTRIAL PRODUCTION(1st quarter 1966 = 100)
U.K. EEC Germany France Italy Nether- Canada Japan U.S.lands
1001019998
1019699
999796
100104107109
105107108
107109110
100101101103
101101102
103103103
1966
Q-1Q-2Q-3Q-4
JulyAug.Sept.
Oct.Nov.Dec.
1967
Jan.
100102103.5104
103104104
104104104
120 104
Central bank discount rates have been reduced twice (by 1/2 per cent
steps) since the beginning of the year in Germany, Britain, Sweden, and (by
1/4 per cent each time) in Belgium, and there have been single cuts in the
Netherlands and (by 1/4 per cent) in Canada. Evidence is still lacking that
these and other measures to stimulate renewed expansion have begun to exert
their desired effects.
In Britain, the recession that started in the spring of 1966 and
was sharply accelerated by the July measures of restraint appears to have
been checked by factors closely related to those involved in the previous
decline. First, consumer expenditure on goods picked up somewhat around
the end of the year, after dropping sharply in the third quarter. Second,
95 105
10099
10096
10110098
97-9597-

IV -6
according to the U.K. Treasury, inventory accumulation was cut back sharply
in the fourth quarter, possibly even to the extent of an absolute reduction
in volume of stocks; with inventory adjustment thus proceeding in line
with intentions, there was little pressure on manufacturers to reduce out-
put still further. Other factors contributing to stopping the recession
were the continuing increase in central and local government spending and
the rise in U.K. exports. On the other hand, private fixed investment out-
lays, which fell off slightly in real terms in the third quarter, are
thought to have declined further.
Retail sales (excluding autos) were 2-1/2 per cent lower in terms
of volume at constant prices in September-October than in March-May of last
year. Part of the loss was then recovered, and in the three months through
January the volume of sales was only 1 per cent below the peak. New car
registrations fell sharply in the summer and early autumn, reaching a fourth-
quarter level about 25 per cent below a year earlier. In January, however,
car registrations showed an exceptionally big rise, and in February, though
they fell back somewhat, they remained better than in the fourth quarter.
Consumer behavior reflected the stand-still in incomes and prices
during the second half of 1966. Hourly earnings rose only 1 per cent from
April to October, apparently all in the first part of that period. Weekly
earnings declined slightly from July through the rest of the year, because
of less overtime and more short-time working. Retail prices rose by 1-1/2 per
cent from July to December, mostly as the result of higher indirect taxes
and the selective employment tax. A White Paper published on March 22 states
the Government's intention of allowing its powers to prevent or nullify price
IV - 7
and wage increases to lapse in August, in place of which it will reactivate
powers to delay increases.
Slackening in private fixed capital expenditure last year occurred
mainly in residential construction and the distributive and service in-
dustries; manufacturing capital expenditures were well maintained. However,
the outlook for 1967 according to the Board of Trade's quarterly survey
taken in late November and December was for 10 per cent declines in real
volume of outlays by both manufacturers and the distributive and service
industries. A Confederation of British Industry survey in January seemed
to suggest a larger drop, but at the same time it evidenced less pessimism
than had a CBI survey last September. The Board of Trade survey was too
early to reflect reactions to the Government's announcement on December 1
of its decision to raise investment grants by five percentage points, and
both surveys were of course too early to indicate responses to the decision,
announced last week, to start payments of the grants in April rather than
in July.
U.K. exports in the three months through February were 1-1/2 per
cent higher than in the preceding three months, and up 8 per cent from the
corresponding months a year earlier. Imports, which had been low in antici-
pation of the removal of the surcharge at the end of November, have been
substantially higher since then. In the six-month period September-February
as a whole they were 2 per cent lower than a year earlier.
Unemployment rose again in March after two months of little or
no change, but this may have little significance since unusually good
weather had helped to hold down unemployment in the winter.

IV - 8
By January, German industrial production (as seasonally adjusted
by OECD) was down 7 per cent from the peak reached in March-April 1966.
Unemployment rose further in January, and, for the first time in years,
the number of job vacancies fell below the number of unemployed.
New orders also fell further in January. Since last May orders
have been consistently below current deliveries, with a consequent running
down of order backlogs. This development has been especially marked for
the nondurable goods industries, including textiles, and also for steel.
According to press reports, steel inventories have fallen lower than they
did in 1958. It is adjustments such as these, together with the Government's
public works expenditure plans, that give support to views occasionally
heard that an upturn may occur sooner rather than later this year. On the
other hand, bearish views emphasize the profit squeeze and the decline that
has been occurring in business outlays and orders for machinery and equipment.
In late 1966, survey results exhibited an extraordinary degree of
pessimism on the part of businessmen, according to the January Monthly Report
of the Deutsche Bundesbank. As compared with earlier times when capacity
utilization ratios and ratios of unfilled orders to current production were
comparable to those of last December, many more businesses than before con-
sidered their orders on hand to be smaller than they wanted. Reportedly
business sentiment has brightened somewhat in the past few weeks.
Through the end of 1966 major factors working to sustain economic
activity were the rise in German exports and the advance in wage rates, which
helped to support consumption. Wage rate increases were the principal factor
in the 5.5 per cent year-over-year advance, to the fourth quarter of 1966, in

IV - 9
gross wages and salaries. The year-over-year rise of about 4 per cent
in private consumption expenditures, when contrasted with the 9 per cent
rise from first half of 1965 to first half of 1966, suggests, however,
that seasonally adjusted there was very little further advance in con-
sumption expenditures during the second half of 1966.' Since the cost of
living index rose about 1/2 per cent further from'mid-year to year-end
(with food down, services up substantially, and industrial products up
slightly), the real volume of consumption may even have declined a little.
Automobile and motorcycle purchases were 10 per cent lower in the fourth
quarter than a year earlier.
Apart from the marked easing of monetary policy in recent months,
major actions to foster economic revival have included liberalization of
depreciation allowances to stimulate private investment and central bank
financing of a government investment program involving projects that can
be started with minimum delay.
In France the pace of advance in economic activity slackened in
the latter half of 1966, with industrial production showing less than a
1 per cent rise from July to January 1967. The slowdown is attributable
to easing in both consumer and investment demand, as well as to leveling
off in exports. Department store sales, in value terms, were virtually
level from mid-year to year-end. So also was production of automobiles
after a rapid rise during 1965.
Unemployment increased noticeably in January and February. How-
ever, the rate of unemployment is still very low -- less than one per cent
in February.

IV - 10
Private industry had been planning a moderately larger increase
in capital expenditures this year than occurred in 1966, with an especially
large increase in the steel industry, according to an INSEE survey taken
in November. Public sector industries plan a substantial increase, and
there is also to be an increase in public housing construction. Private
housing starts will be aided by releases of funds under the housing savings
program initiated at the end of 1965.
In Italy GNP rose about 5-1/2 per cent in real terms last year.
The fourth-quarter-to-fourth-quarter rise in industrial production was
12 per cent, despite a slowing of advance in output of finished consumer
and capital goods after midyear.
Italy is still in a period of recovery and advance following the
severe recession of 1964. With no shortage of labor or capital facilities
having yet materialized, the Italian authorities have refrained from any
action that might damp the current expansion.
In the Netherlands the excessive demand pressures which troubled
the economy for the preceding three years abated in mid-1966. The easing
was evident both in a slowing of increase in Dutch exports and in internal
demand, with weakening clearest in the private investment sector.
With the rate of growth in production slowing and order backlogs
dwindling, the Netherlands Bank reduced the discount rate on March 15
from 5 to 4-1/2 per cent and also took steps which in effect raised the
limits on credit expansion imposed on Dutch commercial banks.
In Canada, seasonally adjusted gross national product in constant
prices may have increased again in the fourth quarter after declining in

IV - 11
the third. Industrial production advanced again, and unemployment dropped
a little. However, housing starts declined further, retail sales leveled
off, and there were indications of marked slowing in the investment boom.
Unemployment was again increasing slightly in January and February.
Japan has been experiencing a vigorous expansion in economic
activity, supported by a strong capital investment trend. The Government,
in a special session of the Diet in mid-March, warned businessmen to ex-
ercise caution in their plant and equipment investments to avoid overheating.
In January, industrial production reached a level 20 per cent
higher than a year earlier. New orders for machinery have been brisk, and
in January of 1967 were 44 per cent higher than a year earlier. Unfilled
orders for machinery have also been rising since mid-1965, and in December
were up 17 per cent from a year earlier.
Producers' inventories of finished goods have risen only 1 per
cent from a low in mid-1966. In January, they were still 4 per cent below
the previous high in September of 1965. But raw materials inventories have
been rising faster since early 1966, and in December were 10 per cent above
their level a year earlier.
Business profits have been improving and a survey of smaller firms
indicates that profits in the 6 months ending March 1967 are expected to be
up 17 per cent over the previous six months.

I-C-1 3/28/67
U.S. AND INTERNATIONAL ECONOMIC DEVELOPMENTSSEASONALLY ADJUSTED
U.S. BALANCE OF PAYMENTS - CONT.
?0-DAY RATESPER CENT 7NOT S A
EURO-DOLLARS6
MAR. 22 538
MAR 22 494
4U.S. C-D'S
i964 1L65 1966I19671966 19671964 1965


