Embed Size (px)
Citation preview

Prefatory Note The attached document represents the most complete and accurate version available based on original copies culled from the files of the FOMC Secretariat at the Board of Governors of the Federal Reserve System. This electronic document was created through a comprehensive digitization process which included identifying the best-preserved paper copies, scanning those copies,1
and then making the scanned versions text-searchable.2
Though a stringent quality assurance process was employed, some imperfections may remain. Please note that some material may have been redacted from this document if that material was received on a confidential basis. Redacted material is indicated by occasional gaps in the text or by gray boxes around non-text content. All redacted passages are exempt from disclosure under applicable provisions of the Freedom of Information Act. 1 In some cases, original copies needed to be photocopied before being scanned into electronic format. All scanned images were deskewed (to remove the effects of printer- and scanner-introduced tilting) and lightly cleaned (to remove dark spots caused by staple holes, hole punches, and other blemishes caused after initial printing). 2 A two-step process was used. An advanced optical character recognition computer program (OCR) first created electronic text from the document image. Where the OCR results were inconclusive, staff checked and corrected the text as necessary. Please note that the numbers and text in charts and tables were not reliably recognized by the OCR process and were not checked or corrected by staff.
Content last modified 6/05/2009.

CONFIDENTIAL (FR)
CURRENT ECONOMICand
FINANCIAL CONDITIONS
Prepared for the
Federal Open Market Committee
By the Staff
BOARD OF GOVERNORS
OF THE FEDERAL RESERVE SYSTEMDeeme 6 16

CONFIDENTIAL (FR)
CURRENT ECONOMIC AND FINANCIAL CONDITIONS
By the StaffBoard of Governors
of the Federal Reserve System
December 6, 1967

I - 1
SUMMARY AND OUTLOOK
Outlook for economic activity
The firmer tone reflected in the newly available statistics
on recent developments and the increased buoyancy reported for
prospective plant and equipment expenditures point to more rapid ex-
pansion in GNP in the first quarter--assuming no tax increase effective
in this period. New orders for durable goods were revised up for
October and now show a very small decline from September; the production
index turned up in November and unemployment is likely to show a decline;
and housing starts recently have shown further strength.
In part, the recent quickening in activity reflects recovery
in automobile production following the Ford and Chrysler settlements.
It now seems likely that with more time allowed for bargaining at
General Motors, plant shutdowns in January may be relatively minor.
Business inventory investment is expected to accelerate in the first
quarter, as auto inventories are rebuilt and an increased volume of
steel is set aside in anticipation of a possible strike in the summer.
With plans for business fixed investment now indicated to be substan-
tially higher than reported in earlier private surveys, prospects are
for all major private sectors of the economy to show strength in coming
months.
Government purchases appear to be the only major category
likely to be slowing in early 1968. According to recent Administration
testimony, both Federal defense and nondefense expenditures should rise
more slowly in the first half of next year than in recent months, and
increases in State and local government outlays also may slow as
grants-in-aid are reduced or deferred.

I -2
Overall, GNP is likely to increase about $20 billion in
the first quarter and possibly an even larger amount in the second
quarter, when higher social security benefits are expected to be
added to the income stream. Prices are expected to remain under
upward pressure.
Outlook for prices and resource use
Persistence of upward momentum in prices of industrial
commodities has been affirmed bythe official estimate of a further
increase from mid-October to mid-November, and by resumption in recent
weeks of more numerous announcements of price increases--including
prices of steel sheets. Over the past 4 months, industrial commodities
increased at an annual rate of 2.8 per cent and a continuing rise of
about this order appears likely. At retail, prices of non-food
commodities have been increasing at a considerably faster rate but
some slowing to near a 3 per cent rate appears likely, in part because
of the special nature of some of the recent advances in prices of
apparel and autos. With food prices tending to stabilize, the CPI
may be expected to continue to rise at about the 3 per cent rate of the
early autumn.
Sizable increases in industrial prices in recent months have
occurred in a context of rising costs but moderate consumer and
business demands. In the period ahead, however, demand pull may
become a more important contributor to further advances in prices.
Because of the expected recovery in auto output, prospects for
inventory building by steel consuming industries, and major additions
to consumer income from existing and pending legislation, we appear
to be moving into a period of strongly increased demands.

1-3
Manufacturing capacity is projected to remain relatively
ample, over-all despite the expected spurt in output. Expansion in
the labor force is expected to result in the unemployment rate
remaining close to 4 per cent. Many types of skilled labor, however,
are already in short supply. Mere rapid increases in output per
manhour and some lengthening of the work week are likely to add to
effective manpower resources as over-all demands increase further,
and to moderate the rise in unit labor costs.
Outlook for Banking
Given the current level and structure of interest rates, time
and savings deposit inflows will probably decelerate over the winter
months. Longer-term CD's are already non-competitive with other
market instruments, and any further upward pressure on money market
rates will tend to limit the sale of shorter-term CD's. And inflows
of consumer-type time deposits will likely slow further, as consumer
shifts to market instruments increase, particularly around the end-
of-year interest crediting period.
Private demand deposit balances will probably continue to expand
as transactions demands rise, but the pull of high interest rates may
tend to moderate this expansion to a pace below the unusually rapid
growth of 1967. Moreover, the Federal Government's cash and debt
management policies will not be contributing to growth in private
deposits and the money stock, since the Government's cash balance is
not expected to decrease from the relatively low December average, and
may rise.

I-4
With the supply of funds to banks constrained, and with
inventory investment rising and accelerated economic growth contributing
to a loan expansion more rapid than in late summer and early fall, banks
are likely to reduce acquisitions of municipals and real estate loans.
Treasury financings over the first quarter will contribute to some
further expansion in Government security holdings and security loans
of banks as they help in the underwriting of the new issues.
With their fund inflows diminished and loan demands strengthening,
bank portfolio adjustments may exert upward pressure on market interest
rates, particularly municipal yields. While banks have accumulated
considerable portfolio liquidity over the past year, the combination
of increased loan demands and slower deposit growth could result in
reductions in their liquid asset holdings rather quickly. Moreover,
Euro-dollar funds are likely to become less readily available than in
recent months, in view of the rise in interest rates in the United
Kingdom and as confidence in the pound is restored.
Outlook for capital markets and nonbank intermediaries
In corporate and municipal markets the heavy current volume of
new offerings will taper off seasonally after mid-December, and thus far
new offerings scheduled for January are quite moderate. However, substan-
tial further additions to the January calendar could develop, since a
number of recent postponements--notably the U.S. Steel offering--have not
yet been rescheduled, and rumors of tentative plans by other sizable
borrowers persist. Moreover, while institutional funds available for
1 - 5
investment in long-term debt often show some seasonal expansion in
January, a number of such institutions have reportedly already committed
a part of their expected January flows for delayed take-down of bonds
sold earlier in the fall. And, as noted above, banks are not likely
to be a positive factor in capital markets. Thus the odds would seem
to favor some upwarddrift in bond yields over the next few months. Even
so the chances of a levelling off in interest rates over the weeks
immediately ahead, cannot be ruled out, and a rally could develop parti-
cularly if prospects for tax action should turn more favorable.
Mortgage rates are likely to rise further. Because recent
advances in bond yields have narrowed the spread with mortgage rates
to one of the smallest margins since World War II, diversified institu-
tional lenders have greatly reduced their loan commitments for home
financing and are increasing the share of total funds being allocated
to corporate bonds. With the home financing market thus relying for
new money largely on the savings and loan industry and the FNMA, the
likelihood of further shrinkage in S&L growth during January takes on
added significance. Net flows to the savings and loan industry already
showed signs of shrinking in October. Since short-term interest rates
have recently advanced further, another substantial shrinkage in flows
to S&L's can probably be expected during January, when shareholders at
associations with semi-annual as well as quarterly interest accrual
periods will be free to shift to higher yielding investment alternatives
without loss of accrued interest.
I -6
International developments
Gold and foreign exchange markets have calmed down considerably
following the hectic post-devaluation week. But there has been no further
substantial reflow of funds into sterling, and this week demand for
sterling weakened sharply as a result of renewed labor difficulties in
Britain. The U.K. Government has obtained approval of the requested
$1.4 billion standby arrangement from the IMF, after tentatively
agreeing to reduce Government borrowing and money supply growth in 1968
and to consult periodically with the Fund about the possible need for
additional measures of domestic restraint.
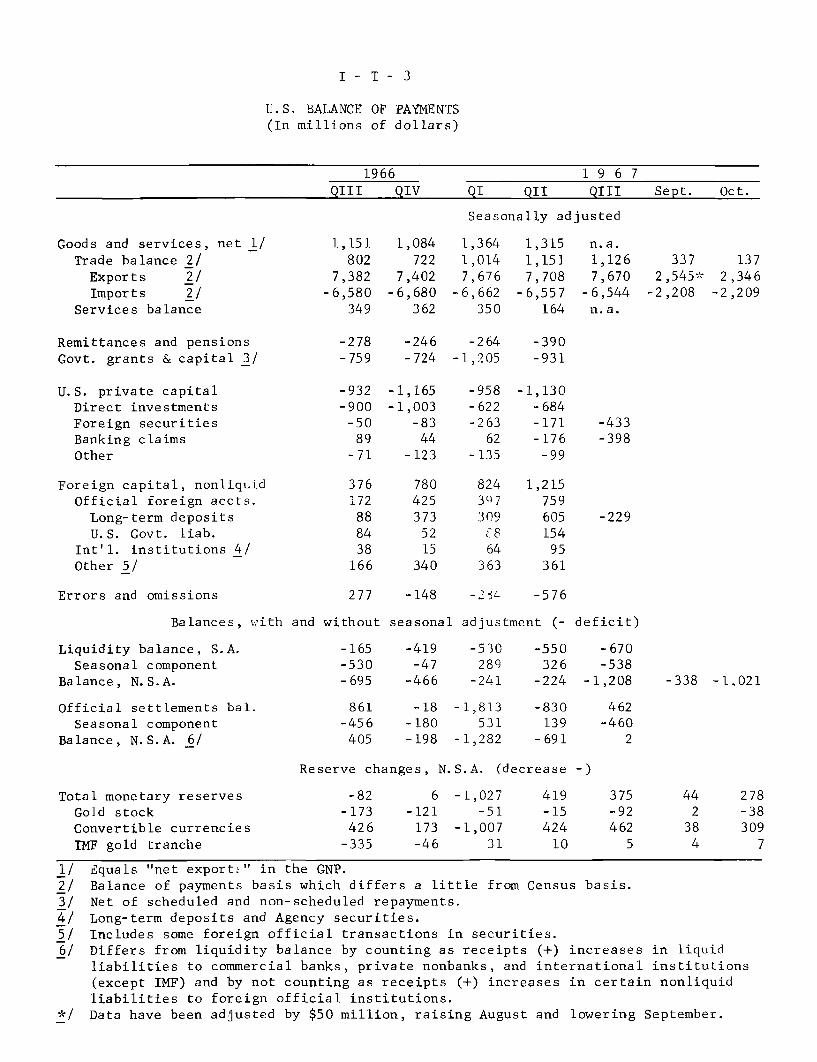
The U.S. balance of payments deficit has increased further
during the current quarter. Part of the increase is attributable to
a large shift of U. K. official holdings out of U.S. Government agency
securities into more liquid U.S. assets. But even apart from that
shift, there appears to have been renewed deterioration. It now seems
likely that unless large special transactions can be arranged at
year-end, the published liquidity deficit will exceed $3 billion for
the year; the deficit apart from special transactions will probably
exceed $4 billion. The balance of the official reserve transactions
basis has reverted to deficit, partly because of the U.K. conversions;
this deficit also seems likely to be on the order of $3 billion for
the year. The prospect is for a continuation of large deficits in
coming months.

I - 7
The merchandise trade surplus diminished sharply in October
because of an unexpected drop in exports, partly as a result of strikes
and other special circumstances. For the July-October period, the
trade surplus was at an annual rate of $3.8 billion, down from a $4.3
billion rate in the first half year and about equal to the low 1966
rate. The decline from the first half of 1967 was the result of a
drop in exports while imports held steady. Both agricultural and
nonagricultural exports in July-October were about 3 per cent lower
than in the first half, the latter despite the beginning of renewed
expansion in economic activity in Europe and Canada.

December 5, 1967
SELECTED DOMESTIC NONFINANCIAL DATA
(Seasonally adjusted)
Civilian labor force (mil.)
Unemployment (mil.)
Unemployment (per cent)
Nonfarm employment, payroll (mil.)
ManufacturingOther industrialNonindustrial
Industrial production (57-59=100)
Final productsMaterials
Wholesale prices (57-59=100)-i
Industrial commodities (FR)Sensitive materials (FR)
Farm products, foods & feeds
Consumer prices (57-59=100)-/
Commodities except foodFoodServices
Latest AmountPeriod Latest Preced'g Year
Period Period AgoOct'67 78.0 77.8 76.1
" 3.4 3.2 2.94.3 4.1 3.8
66.219.28.1
38.9
156.2156.3156.6
106.1105.9101.1104.1
117.5110.6115.7129.1
66.019.2
8.138.8
156.7156.8157.0
106.2105.6101.1105.3
117.1110.0115.9128.7
64.719.48.1
37.2
159.4158.7159.7
106.2104.6102.6108.8
114.5107. 6115.6124.1
Per Cent Change
Year 2 Yrs.Ago* Ago*2.5 4.4
16.8 5.3
2.3- 1.30.34.6
- 2.0- 1.5- 1.9
- 0.1
1.2- 1.5- 4.3
2.62.80.14.0
7.54.7
2.110.2
7.47.37.8
2.93.3
- 1.80.5
6.45.05.58.8
Hourly earnings, mfg. ($)Weekly earnings, mfg. ($) "
Personal income ($ bil.). "
Corporate profits before tax ($ bil.)- QIII'67
Retail sales, total ($ bil.)Autos (million units)2/
GAF ($ bil.)
Selected leading indicators:
Housing starts, pvt. (thous.)- /
Factory workweek (hours)
New orders, dur. goods ($ bil.)New orders, nonel. mach. ($ bil.)Common stock prices (1941-43=10)
Manufacturers' Inventories,book val. ($ bil.)
Gross national product ($ bil.)2/
Real GNP ($ bil., 1958 prices)?/
Oct'671
II
I"
I"
Nov 1 67
2.86 2.85 2.76116.40 116.69 113.96
636.0 634.4
80.1 78.9
26.27.06.4
1,49640.723.43.6
92. 66
26.88.16.5
1,42940.823.43.7
95.66
Oct'67 81.5 81.2
QIII'67 791.2 775.1" 672.0 664.7
597.5
84.0
25.68.06.1
84541.324.23. 6
80.99
75.8
748.8654.8
3.6 7.92.1 6.4
6.4 15.5
- 4.6 5.7
2.4-12.5
4.5
77.0- 1.5-3.7
-2.114.4
7.5-15.8
13.7
2.0- 1.2
4.26.60.6
7.6 22.4
5.7 14.72.6 8.3
* Based on unrounded data. 1/ Not seasonally adjusted.
I -- T - 1
2/ Annual rates.
I-- T - 2
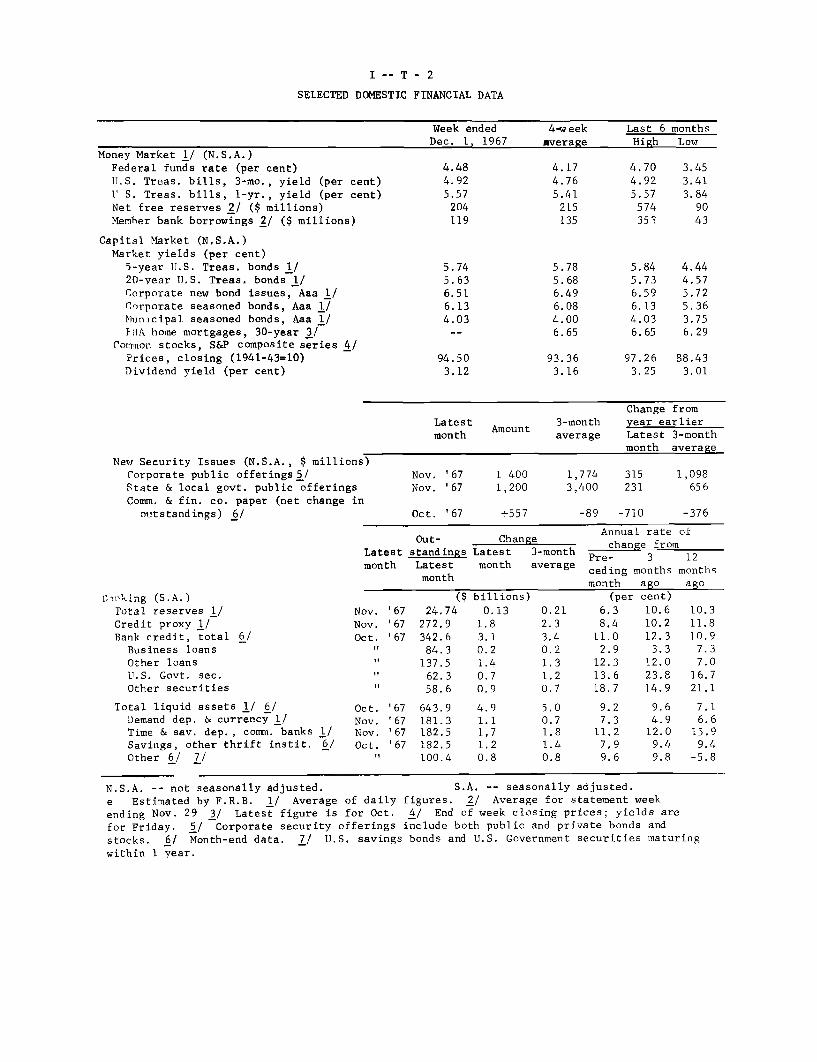
SELECTED DOMESTIC FINANCIAL DATA
Week ended 4-week Last 6 monthsDec. 1, 1967 average High Low
Money Market 1/ (N.S.A.)Federal funds rate (per cent)U.S. Treas. bills, 3-mo., yield (per cent)V S. Treas. bills, 1-yr., yield (per cent)Net free reserves 2/ ($ millions)Member bank borrowings 2/ ($ millions)
Capital Market (N.S.A.)Market yields (per cent)
5-year U.S. Treas. bonds 1/20-year U.S. Treas. bonds 1/Corporate new bond issues, Aaa 1/Corporate seasoned bonds, Aaa 1/Municipal seasoned bonds, Aaa 1/}HA home mortgages, 30-year 3/
Common stocks, S&P composite series 4/Prices, closing (1941-43=10)Dividend yield (per cent)
New Security Issues (N.S.A., $ millions)Corporate public offerings5/State & local govt. public offeringsComm. & fin. co. paper (net change in
outstandings) 6/
Cwpking (S.A.)Total reserves 1/Credit proxy 1/Bank credit, total 6/
Business loansOther loansU.S. Govt. sec.Other securities
Total liquid assets 1/ 6/Demand dep. & currency 1/Time & sav. dep., comm. banks 1/Savings, other thrift instit. 6/Other 6/ 7/
4.484.925.57
204119
5.745.636.516.134.03
94.503.12
4.174.765.41
215135
5.785.686.496.084.006.65
93.363.16
4.704.925.57
574353
5.845.736.596.134.036.65
3.453.413.84
9043
4.444.575.725.363.756.29
97.26 88.433.25 3.01
Change fromLatest 3-month year earliermonth average Latest 3-month
month average
Nov. '67 1 400
Nov. '67 1,200
Oct. '67 +557
1,774 3153,400 231
-89 -710
1,098656
-376
Annual rate ofOut- Change change from
Latest standings Latest 3-month Pre- 3 12month Latest month average ceding months months
month month ago ago
($ billions) (per cent)
Nov.Nov.
Oct.
it
11
Oct.Nov.Nov.Oct.
t
24.74272.9342.684.3
137.562.358.6
643.9181.3182.5182.5100.4
0.131.83.10.21.40.70.9
6.3 10.68.4 10.2
11.0 12.32.9 3.3
12.3 12.013.6 23.818.7 14.9
9.27.3
11.27.99.6
9.64.9
12.09.49.8
10.311.810.9
7.37.0
16.721.1
7.16.6
15,99.4
-5.8
N.S.A. -- not seasonally adjusted. S.A. -- seasonally adjusted.
e Estimated by F.R.B. 1/ Average of daily figures. 2/ Average for statement week
ending Nov. 29 3/ Latest figure is for Oct. 4/ End of week closing prices; yields are
for Friday. 5/ Corporate security offerings include both public and private bonds and
stocks. 6/ Month-end data. 7/ U.S. savings bonds and U.S. Government securities maturing
within 1 year.
I- T - 3
U.S. BALANCE OF PAYMENTS(In millions of dollars)
1966 1 9 6 7
QIII QIV QI QII QIII Sept. Oct.
Seasonally adjusted
Goods and services, net 1/ 1,151 1,084 1,364 1,315 n.a.Trade balance 2/ 802 722 1,014 1,151 1,126 337 137
Exports 2/ 7,382 7,402 7,676 7,708 7,670 2,545* 2,346Imports 2/ -6,580 -6,680 -6,662 -6,557 -6,544 -2,208 -2,209
Services balance 349 362 350 164 n.a.
Remittances and pensions -278 -246 -264 -390Govt. grants & capital 3/ -759 -724 -1,205 -931
U.S. private capital -932 -1,165 -958 -1,130Direct investments -900 -1,003 -622 -684Foreign securities -50 -83 -263 -171 -433Banking claims 89 44 62 -176 -398Other -71 -123 -135 -99
Foreign capital, nonliquid 376 780 824 1,215Official foreign accts. 172 425 307 759Long-term deposits 88 373 309 605 -229U.S. Govt. liab. 84 52 C8 154
Int'l. institutions 4/ 38 15 64 95Other 5/ 166 340 363 361
Errors and omissions 277 -148 -2 L -576
Balances, with and without seasonal adjustment (- deficit)
Liquidity balance, S.A. -165 -419 -530 -550 -670Seasonal component -530 -47 289 326 -538
Balance, N.S.A. -695 -466 -241 -224 -1,208 -338 -1.021
Official settlements bal. 861 -18 -1,813 -830 462Seasonal component -456 -180 531 139 -460
Balance, N.S.A. 6/ 405 -198 -1,282 -691 2
Reserve changes, N.S.A. (decrease -)
Total monetary reserves -82 6 -1,027 419 375 44 278Gold stock -173 -121 -51 -15 -92 2 -38Convertible currencies 426 173 -1,007 424 462 38 309IMF gold tranche -335 -46 31 10 5 4 7
1/ Equals "net exports" in the GNP.2/ Balance of payments basis which differs a little from Census basis.3/ Net of scheduled and non-scheduled repayments.4/ Long-term deposits and Agency securities.5/ Includes some foreign official transactions in securities.6/ Differs from liquidity balance by counting as receipts (+) increases in liquid
liabilities to commercial banks, private nonbanks, and international institutions(except IMF) and by not counting as receipts (+) increases in certain nonliquidliabilities to foreign official institutions.
*/ Data have been adjusted by $50 million, raising August and lowering September.

II - 1
THE ECONOMIC PICTURE IN DETAIL
The Nonfinancial Scene
Gross national product. The GNP outlook continues to be
affected to an important extent by questions concerning fiscal
restraint. In addition, there are uncertainties concerning the effec-
tive date of the Federal pay raise, the duration and severity of a
possible strike at GM, and the initial date and amount of increase in
Social Security benefits. We have assumed that the proposed surtax
will not become effective in the first quarter but that restraint on
Federal spending is moderating substantially the rise in Federal
outlays, We have also assumed that the Federal pay raise will be
enacted shortly and be retroactive to October 1. The increase in
Social Security benefits, on the other hand, is assumed not to take
place until April. We have also assumed that there will be no strike
on national issues at GM but that a number of plant stoppages will
occur in January; the loss in the first quarter because of strikes,
however, is likely to be much smaller than in the third and fourth
quarters of this year.
Under these assumptions, economic expansion should continue
to strengthen in the present quarter and be followed by an even
larger increase in the first quarter of next year. GNP in current
dollars is estimated to rise at an annual rate of nearly $20 billion
in the first quarter to a level of close to $828 billion. This compares

II - 2
with an anticipated increase of almost $17 billion in the current
quarter. The annual rate of growth in real GNP in the January-March
period would be 6 per cent, up from just under 5 per cent in the fourth
quarter. The rise in the GIP deflator of about 3.7 per cent, annual
rate, in the fourth quarter would be somewhat lower in the first quarter
because the Federal pay raise would not contribute to an increase in the
deflator; but the private GNP deflator is projected to rise somewhat
more rapidly.
Our fourth quarter GNP projection is not substantially dif-
ferent from that included in the last full Greenbook--dated November 8--
but the composition of the rise is different in several respects. It
now seems that there will be more inventory accumulation in the current
quarter than we anticipated earlier, partly because a strike deadline
at GM has been postponed until after the first of the year. In addition,
a somewhat larger increase in expenditures on new plant and equipment
now seems likely while consumer expenditures, net exports, and Government
purchases are expected to be lower than estimated earlier.
Projected defense outlays for fiscal 1968 are now being cut
back by substantial amounts. Until very recently it had been assumed
that defense outlays would top the Budget estimated by from $2 to $4
billion, but the expectation now is that NIA expenditures, which reflect
actual deliveries of goods, will be close to the January Budget. Thus,
we have reduced our fourth quarter estimate of defense outlays below our
previous projections by almost $1 billion, annual rate, to $75.0 billion,
and the first quarter rise is now estimated at only $500 million.
II - 3
However, as with many Budget adjustments, the effect on GNP may be
less than indicated since in many instances deliveries of goods may be
merely deferred. Some part of defense expenditure cuts may therefore
be reflected in private inventories in the first half of 1968.
Production of autos is rising following the settlements at
Ford and other producers continue at close to full production. The
possibility of an early settlement in the steel industry has lessened
and steel inventory building is under way and reflected in higher
orders and output. The upward revision in durable goods orders in
October suggests more strength in business demand than had been evident
earlier. Further, the failure to enact the proposed surtax is reinforc-
ing inflationary expectations which may be inducing more widespread
inventory accumulation.
The rise in consumer expenditures at an annual rate of $8
billion in the fourth quarter is commensurate with the projected rise
in spendable income, which was slowed in October and November by strikes.
The Federal workers' pay raise, even if received in December, will be
reflected in December retail sales, but should have a greater impact
in early 1968.
An important development now indicated for the first quarter
is an expected $3 billion (nearly 20 per cent annual rate) increase in
outlays for new plant and equipment, after virtually no increase for
the year 1967. An additional increase of about $1 billion is indicated
for the second quarter, according to the November Commerce-SEC survey
of business plans for new plant and equipment outlays (confidential

II - 4
until released) continuation of even moderate gains in the second half
of next year would result in an increase for the full year 1968 well
in excess of indications from recent private surveys.
Residential construction outlays are expected to be somewhat
larger in the first than in the fourth quarter, according to present
indications. Starts rose to an annual rate of 1.5 million in October
and permit applications also increased. Inventories of unsold new
homes are very low and demand for homes is still rising, despite a
higher rate of completions recently and rising costs of financing.
Uncertainties concerning the supply and price of mortgage funds is
expected to limit housing starts to a level of between 1.4 and 1.5
million in the next few months, but given the usual lags between starts
and expenditures--as well as higher costs--the dollar value of resi-
dential construction is expected to continue to rise in early 1968.
Nonfarm inventory accumulation is projected to rise to a
rate of about $7 billion in the first quarter from an estimated rate
of $3.5 billion in the current quarter. In addition to steel and autos,
the anticipated rise in business plant and equipment outlays should
also give rise to some accumulation of materials and work-in-process.
The trend in distributor inventories depends somewhat on the strength
of retail sales, but with capacity utilization rates low in most indus-
tries, inventories and sales could rise simultaneously.
Consumer income in the first quarter will benefit from
several special influences. In February, minimum wage increases of
15 per cent should add at least $2 billion to workers' income, with

II - 5
additional increases likely later as other workers endeavor to restore
traditional differentials. In the private economy, pay increases con-
tinue large and employment and hours are expected to rise.
Our projected growth of $10 billion in consumer expenditures
in the first quarter includes domestic sales of new cars at an annual
rate of 8.5 million units--not especially high in view of the probable
deferral of fourth quarter sales.
Growth in consumer outlays is assumed to be in line with the
increased income flow and the savings rate is projected to remain at
about 7 per cent of disposable income. We know of no satisfactory
explanation of why the savings rate has remained so high throughout
1967, and the large, lumpy additions to income expected in coming
months may not be spent immediately. Therefore, since we are not
postulating an increase in income taxes effective in the first quarter,
there is no basis for assuming any significant shift in the savings
rate in a downward direction.
Corporate profits before taxes, which were at an annual rate
of about $80 billion before taxes in the third quarter, should rise to
about $82.5 billion in the current quarter and approach $85 billion in
the first quarter, if our GNP estimates prove correct. Somewhat higher
rate of capacity utilization and a higher rate of productivity gain are
expected to contribute to the rise, along with growth in aggregate
expenditures and income.
Total Federal expenditures for fiscal 1968, NIA basis, are
assumed to be somewhat belou the $170.4 billion projected in the midyear

II - 5a
Budget review. As indicated above, the rise in defense spending is
expected to slow further in the first quarter and to level off or
possibly decline in the second quarter. Part of the proposed budget
cuts are expected to be in grants to States and localities, so that
the rise in State and local outlays also may be somewhat less than
previously anticipated.
The deficit, NIA basis, reached a peak in the second quarter
of 1967 at an annual rate of $14.7 billion, and fell to $13.1 billion
in the third quarter. A reduction is expected in the current quarter
and a further decline to a rate of about $6.5 billion in the first
quarter of next year is possible, reflecting a further increase in
receipts arising from both the projected increase in incomes and the
rise in payroll taxes incorporated in the legislation increasing social
security benefits. (This will not result in an immediate rise in cash
receipts, since the increase in taxes has been accomplished by raising
the taxable wage base, which would not affect cash flows appreciably
until the final quarter of calendar 1968; in the NIA accounts, however,
the higher taxable base for earnings will be reflected in a higher and
fairly stable level of receipts throughout the calendar year.)

GROSS NATIONAL PRODUCT AND RELATED ITEMS(Quarterly figures are seasonally adjusted. Expenditures and income
figures are billions of dollars, with quarterly figures at annual rates)
1967 1968
1966 1967 1966 Proj. Proj.
Proj. IV I II III IV I
Gross National Product
Final salesPrivate purchases
Personal consumption expendituresDurable goodsNondurable goodsServices
Gross private domestic investmentResidential constructionBusiness fixed investmentChange in business inventoriesNonfarm
Net Exports
Gov't purchases of goods & servicesFederal
DefenseOther
State and local
Gross National Product in constant(1958) dollarsGNP Implicit deflator (1958-100)
Personal incomeWage and salaries
Disposable incomePersonal saving
Saving rate (per cent)
Corporate profits before tax
Federal government receipts andexpenditures (N.I.A. basis)
ReceiptsExpendituresSurplus or deficit (-)
Total labor force (millions)Armed forces "
Civilian labor force "Unemployment rate (per cent)
743.3729.9575.6
465.970.3
207.5
188.1
118.024.480.213.413.7
785.2
781.3604.6
492.272.0
218.0202.1
110.8
24.582.5
3.93.7
762.1
743.6581.9
473.870.6
210.3192.9
122.220.982.818.519.0
766.3759.2588.8
480.269.4
214.2196.6
110.421.481.97.1
7.3
775.1
774.6
599.6
489.772.5
217.2200.0
105.123.181.5
.5
.6
791.2
787.4609.2
495.372.7
218.5204.1
112.225.682.8
3.83.4
808.0804.0620.6
503.573.5
222.2
207.8
115.6
27.883.84.03.5
827.5820.2634.2
513.576.3
225.7211.5
122.528.486.87.36.8
5.1 5.4 4.3 5.3 5.3 5.4 5.5 5.5
154.377.060.516.577.2
176.890.472.817.686.4
161.7
81.565.615.980.2
170.487.170.216.883,3
175.089.572.517.085.4
178.290.973.317.687.4
183.4
93.975.018.989.5
186.094.775.519.291.3
652.6 669.4 661.1 660.7 664.7 672.0 680.0 690.7113.9 117.3 115.3 116.0 116.6 117.7 118.8 119.8
584.0394.6508.8
29.85.9
626.5423.7544.6
38.27.0
601.6407.4522.034.6
6.6
612.9414.7532.7
38.87.3
619.1418.3
540.036.06.7
631.0426.2548.2
38.57.0
643.0435.5557.539.57.1
83.8 80.1 83.9 79.0 78.9 80.1p 82.5
143.2142.9
.3
78.93.1
75.83.8
151.7164.5-12.9
80.83.5
77.33.9
148.6151.9
-3.3
79.83.3
76.53.7
149.1160.9-11.9
80.33.4
76.93.7
148.1162.8-14.7
80.23.5
76.73.8
152.8p165.9-13.lp
81.13.5
77.73.9
156.6168.3-11.7
81.63.5
78.14.0
656.0446.2568.139.97.0
84.5
162.2168.8-6.6
82.03.5
78.53.8
Nonfarm payroll employment (millions) 64.0Manufacturing 19.2
Industrial production (1957-59=100) 156.3Capacity utilization, manufacturing
(per cent) 90.5
Housing starts, private (millions A. R.) 1.17Sales new U.S.-made autos (millions,A. R.) 8.38
66.0 65.0 65.7 65.7 66.1 66.5 67.1
19.3 19.5 19.5 19.3 19.2 19.3 19.5
156.9 159.3 157.1 155.9 157.2 157.3
84.7 89.8 87.0 84.8 83.8 83.1
1.30 .92 1.12 1.21 1.40 1.46
160.5
83.7
1.47
7.69 8.13 7.33 7.83 8.00 7.6 8.5
CONFIDENTIAL -- FR II - 6 December 6, 1967

CONFIDENTIAL -- FR
CHANGES IN GROSS NATIONAL PRODUCTAND RELATED ITEMS
1967 1968
1966 1967 1966 Proj. Proj.
Prol. IV I II III IV I
------------------- In Billions of Dollars --------------------
Gross National ProductFinal sales
Private purchases
GNP in constant (1958) dollarsFinal sales
Private purchases
Gross National ProductFinal sales
Private purchases
Personal consumption expendituresDurable goodsNondurable goodsServices
Gross private domestic investment
Residential constructionBusiness fixed investment
Gov't purchases of goods &servicesFederal
Defense
OtherState & local
GNP in constant (1958) dollarsFinal sales
Private purchases
GNP Implicit deflator
Personal income
Wage and salariesDisposable income
Corporate profits before tax
Federal government receipts andexpenditures (N.I.A. basis)
ReceiptsExpenditures
Nonfarm payroll employmentManufacturing
Industrial production
Housing starts, privateSales new U.S.-made autos
59.455.437.5
35.932.121.9
41.951.429.0
16.826.0
11.4
13.3 4.26.2 15.62.2 6.9
6,3 -. 4-0.3 10.1-2.8 3.7
8.815.410.8
16.112.89.6
16.816.611.4
19.5
16. 23.6
4.0 7.3 8.1 10.610.3 4.2 8.4 8.3
7.1 3.0 5.8 7.9
----- In Per Cent; Quarterly Changes are at Annual Rates ------
8.7 5.6 7.18.2 7.0 3.47.0 5.0 1.5
7.66.5
8.56.9
9.9-9.612.8
13.115.320.8-1.210.9
5.85.34.42.7
5.62.45.17.4
-6.10.42.9
14.617.420.36. 7
11.9
2.64.12.23.0
3.1-1.7
1.56.5
19.9-47.3
7.9
10.110.116.5
-16.910.8
3.8-0.2-2.23.1
8.6 7.3 8.39.9 7.4 7.87.8 7.0 7.5
2.2 4.6 8.3 8.58.4 8.1 6.6 8.44.7 7.3 6.4 7.5
5.4-6.8
7.47.7
-38.69.6
-4.3
21.527.528.022.615.5
-. 26.32.92.4
7.917.9
5.66.9
-19.231.8-2.0
10.811.013.14.8
10.1
2.46.35.52.1
4.6
1.12.48.2
27.043.3
6.4
7.36.34.4
14.19.4
4.42.52.33.8
6. 64.46.87.2
12.134.44.8
11.713.2
9.329.5
9.6
4.85.04.43. 7
7.915.2
6. 37.1
23.98.6
14.3
5.73.42.76.38.0
6.24.95.93.5
7.5 4.0 7.7 7.67.2 3.5 7.6 8.78.2 5.5 6.1 6.8
9.5 -4.4 -. 5 -23.4 -0.5 6.lp 12.0
14.7 5.9 8.2 1.3 -2.7 12.7p 9.915.8 15.1 15.3 23.7 4.7 7.6 5.8
5.3 3.1 4.46.1 0.5 4.1
9.0-20.4
-4.4
.4 4.111.1 -59.3-8.2 -15.8
9.7
14.31.2
4.3 0.0 2.4 2.40.0 -4.1 -2.1 2.1
-5.587.0
-39.6
-3.132.127.3
3.362.88.7
.317.1
-20.0
8.12.7
47.4
December 6, 1967II - 7
II - 8
Industrial production. Industrial production in November
is estimated to have increased somewhat more than one full point iron
the preliminary October figure of 156.2 per cent, mainly because of
settlement of the Ford and Caterpillar strikes and an increase in
output of iron and steel. At about the 157.5 per cent level the
November index would be about 2 points below the peak in December 1966.
The partial recovery in production of autos, trucks, and
automotive parts- amounts to about .6 of one point in the total index,
a recovery of almost one-half the loss due to the Ford strike. If,
with the settlement of the strike at Caterpillar, output of nonelectrical
machinery recovers to the September level, this would add another .3
of one point to the November index. Steel ingot production through the
week ending November 25 had increased 4.5 per cent from the October
level, partly in response to improved auto production. In addition,
steel mills have been adding to stocks in anticipation that steel
consuming industries, whose stocks of steel mill shapes and forms are
extremely low, will start another round of accumulation in preparation
for a possible strike next summer. Output of crude oil, which had
declined sharply from August to October, increased somewhat in early
November. Paperboard production in November was above year earlier
levels for the first time since last February.
In the first half of 1967, under the impact of cutbacks in
output in most of the cyclical industries which account for about 70
per cent of the total index, industrial production declined 4 points.
1/ In the first eleven days of November, Ford produced only 17,000 cars;in each of the following two weeks, Ford produced 40,000 as comparedwith 50,000 units at its highest weekly rate in 1967.
II - 9
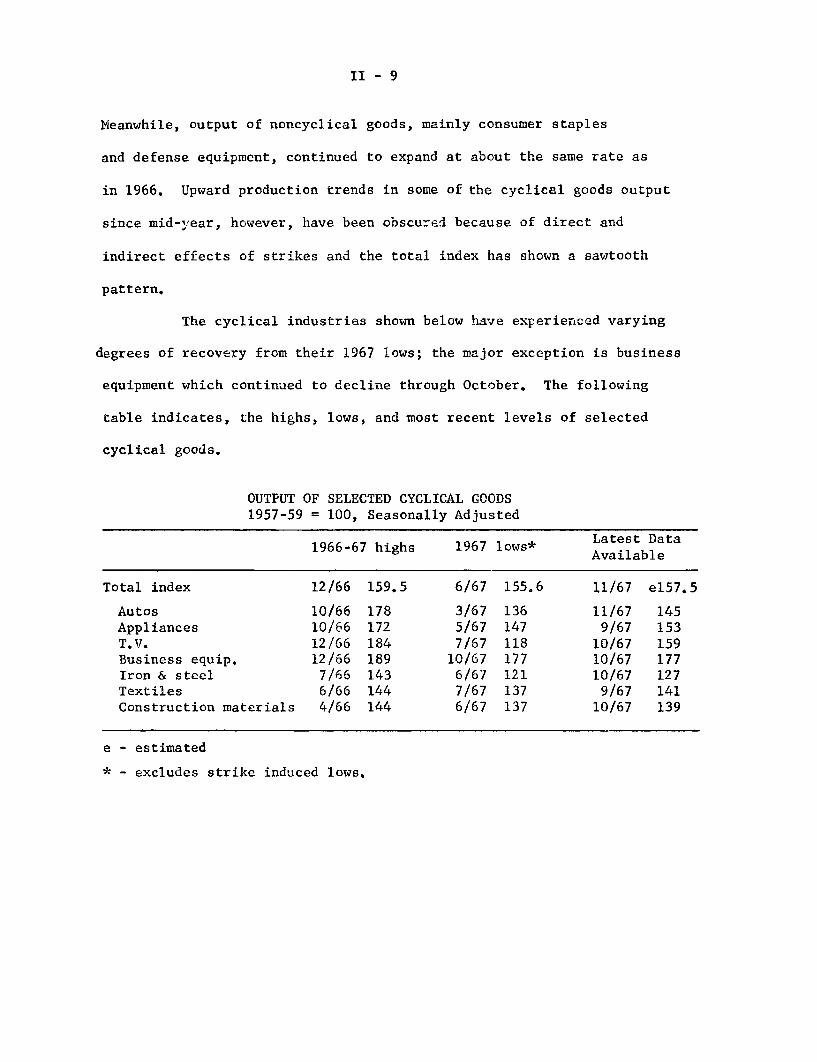
Meanwhile, output of noncyclical goods, mainly consumer staples
and defense equipment, continued to expand at about the same rate as
in 1966. Upward production trends in some of the cyclical goods output
since mid-year, however, have been obscured because of direct and
indirect effects of strikes and the total index has shown a sawtooth
pattern.
The cyclical industries shown below have experienced varying
degrees of recovery from their 1967 lows; the major exception is business
equipment which continued to decline through October. The following
table indicates, the highs, lows, and most recent levels of selected
cyclical goods.
OUTPUT OF SELECTED CYCLICAL GOODS1957-59 = 100, Seasonally Adjusted
Latest Data1966-67 highs 1967 lows* a a
Available
Total index 12/66 159.5 6/67 155.6 11/67 e157.5
Autos 10/66 178 3/67 136 11/67 145Appliances 10/66 172 5/67 147 9/67 153T.V. 12/66 184 7/67 118 10/67 159Business equip. 12/66 189 10/67 177 10/67 177Iron & steel 7/66 143 6/67 121 10/67 127Textiles 6/66 144 7/67 137 9/67 141Construction materials 4/66 144 6/67 137 10/67 139
e - estimated
* - excludes strike induced lows.

II - 10
Capacity utilization. Utilization of capacity by manufacturers
is likely to have increased by one'-or two tenths of a point in November
if the manufacturing production index rose by a point or so, as expected.
The operating rate was estimated to be 83,0 per cent in October, down
from 83.6 per cent the previous month. About two-thirds of the decline
was a result of the continuing increase in capacity. The remaining
decrease was a result of lower manufacturing output caused in large
part by a strike at Caterpillar. The Ford strike apparently did not
contribute much to the October decline since motor vehicle production
showed little change from the already reduced September level.
Unused capacity exists in most industries. Only producers of
aircract and electric power generating equipment are now operating
at higher than usual rates.
UTILIZATION RATES
Industry July August September October
Manufacturing 84.0 84.6 83.6 83.0
Primary processing
Industries 81.7 83.0 82.8 82.5
Advanced processingIndustries 85.7 85.8 84.1 83.3

II - 11
Orders. New orders received by manufacturing of durable
goods were down only 0.3 per cent in October according to the latest
Census figures; an earlier Census release had shown a much larger
decline. The latest decline was the third in the past four months
and the series is now about 4 per cent below its recovery high in June.
New orders for durable goods had risen strongly from April through June.
The decreases in the latest two months were much less than the
amounts which could be attributed to the Ford strike. Motor vehicle
orders were down about 15 per cent in October after falling a similar
amount the previous month. However, this must be balanced against the
fact that the highly volatile aircraft orders series was up 25 per cent
in October and an even greater amount the previous month. If autos
are excluded from the total, durable goods orders were up 4.0 per
cent between August and October, but if both autos and aircraft are
excluded orders declined 3.5 per cent in that period.
New orders tended slightly lower in October in other industries.
Primary metals, all other durable goods, and the special machinery and
equipment grouping each showed a small decrease. Fabricated metal
products was the only industry other than aircraft to register an
increase.
Unfilled orders moved up 1.3 per cent in October, continuing
the rise which began in May. Most of the increase in the latest
month came in the aircraft industry. Since the low point of last
spring, backlogs have increased about 6 per cent and aircraft backlogs
accounted for over half of this increase.

II - 12
NEW ORDERS
(Billions of dollars, seasonally adjusted)
In y 1966 1967 1967Industry IIIQ IQIIIQ IQ
hvonthly Average June October
Total durable goods 24.39 22,16 24.26 23.36
Primary metals 3.98 3.25 3.59 3.47Autos 3.51 3.49 3.89 2.74Aircraft 2.61 2.11 3.07 2.95Machinery & equip. 4.94 4.37 4,79 4.64
Business inventories. Business inventories have been behaving
a little more erratically than usual in recent months. The large
adjustment during the first half of the year which culminated in sizable
liquidation in June was followed by a shift back to substantial accumu-
lation in July and August (the revised August estimate shows accumulation
of nearly $800 million, double the original estimate). Then, in an
abrupt turnabout, in September there was a small amount of liquidation
again. Despite the September decline, the book value of business
inventories increased at a seasonally adjusted annual rate of $3.9 billion
for the entire third quarter--up considerably from the nominal rise in
the second quarter. Preliminary indications for October are available
only for manufacturers and these show an increase in book value of
factory stocks at a seasonally adjusted annual rate of $4.4 billion.
The recent large fluctuations in the rate of change in total
business inventories have reflected a variety of influences, but the

II - 13
auto manufacturing industry and wholesalers as a group have been major
contributors. Thus auto producers shifted from liquidation of $96
million in June to accumulation averaging $240 million a month in July
and August (reflecting partly inadequate seasonal allowance for the
effects of the earlier model changeover) and then, with the Ford strike
underway, back to liquidation of $253 million in September and slight
accumulation in October. At wholesalers, a shift from sizable liquida-
tion in July to large accumulation in August and then back to no change
in September contributed significantly to the total business inventory
change in those months.
MONTHLY CHANGES IN BOOK VALUE OF BUSINESS INVENTORIES
(In millions of dollars, seasonally adjusted)
June July August September October
Manufacturing & trade, total -274 257 794 - 79
Manufacturing -188 507 473 -194 367Auto industry - 96 266 213 -253 37Other manufacturing - 92 241 260 59 330
Trade - 86 -250 321 115Auto dealers -161 -188 - 99 174Other retail stores - 15 98 130 - 59Wholesalers 90 -160 290 0
Book value of auto dealer stocks, which had declined steadily
during the first 8 months of the year, increased substantially in September
despite little change in unit stocks of new cars. This book value increase
and the large September decline reported by auto manufacturers, apparently
reflected in part a bookkeeping transfer of ownership from manufacturers
to dealers when the new models were introduced.

II - 14
The stock-sales ratio for manufacturers in October, at 1.84,
was well above the already high rate at the end of last year, owing in
large part to sharply depressed sales of the auto industry in October
when the book value of stocks was about unchanged from last December.
In addition, stork-sales ratios for defense industries and also for
all other manufacturing industries combined were moderately higher than
last December. In the trade sector, the stock-sales ratio for auto
dealers was unusually low in September and for all other lines together
was down from late 1966 and close to the more normal end-of-1965 level.
Auto sales and stocks. Dealer deliveries of new domestic
autos in November were 17 per cent below a year ago. The seasonally
adjusted annual rate of sales for November was 7.2 million units, only
3 per cent higher than the reduced October level.
Excluding Ford, sales in November were up slightly from a
year earlier but in the final ten-day period were down 4 per cent from
last year. Ford sales, while still sharply below a year earlier, increased
dramatically in the latest ten-day period. Ford production in November
totaled 140,000 units and for December is expected to reach about 230,000
units which is near capacity and 13 per cent higher than in December
1966. Stocks of all makes of domestic new cars on November 20 remained
about one-fourth below a year earlier.
Sales of used cars in the first twenty days of November were
slightly below a year earlier while stocks were 4 per cent below.
Seasonally adjusted used car prices, as reported in the CPI, eased
slightly in October but remained 4 per cent above a year earlier.
II - 15
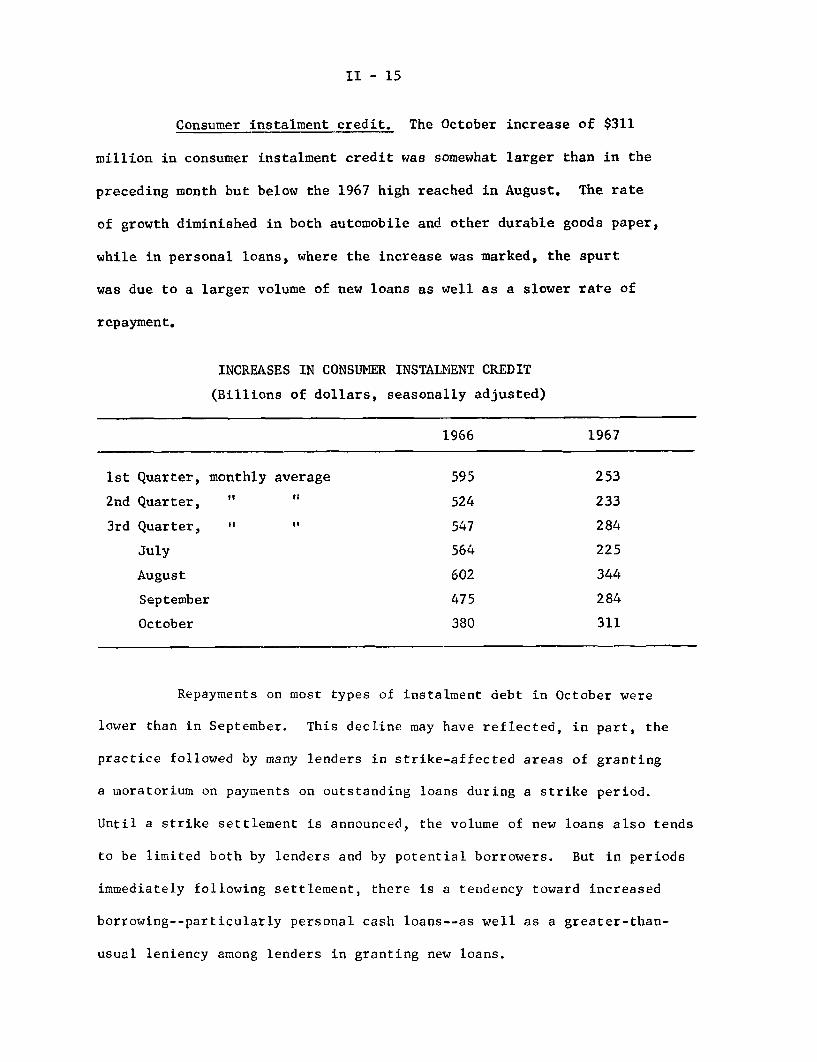
Consumer instalment credit. The October increase of $311
million in consumer instalment credit was somewhat larger than in the
preceding month but below the 1967 high reached in August. The rate
of growth diminished in both automobile and other durable goods paper,
while in personal loans, where the increase was marked, the spurt
was due to a larger volume of new loans as well as a slower rate of
repayment.
INCREASES IN CONSUMER INSTALMENT CREDIT
(Billions of dollars, seasonally adjusted)
1966 1967
1st Quarter, monthly average 595 253
2nd Quarter, " " 524 233
3rd Quarter, " " 547 284
July 564 225
August 602 344
September 475 284
October 380 311
Repayments on most types of instalment debt in October were
lower than in September. This decline may have reflected, in part, the
practice followed by many lenders in strike-affected areas of granting
a moratorium on payments on outstanding loans during a strike period.
Until a strike settlement is announced, the volume of new loans also tends
to be limited both by lenders and by potential borrowers. But in periods
immediately following settlement, there is a tendency toward increased
borrowing--particularly personal cash loans--as well as a greater-than-
usual leniency among lenders in granting new loans.

II - 16
Extensions of auto credit in October were little changed from
September despite some improvement in sales and a small rise in the
average amount of the note. The net increase in auto credit--i.e., ex-
tensions minus repayments--amounted to only $20 million, the smallest
rise in the past five months.
Construction and real estate. Total construction expenditure,
which had reached a new peak seasonally adjusted annual rate of $78.9
billion (revised) in September, changed little in October and November.
Residential construction outlays continued upward however, and in
November, were the highest since March 1966. Outlays for private
nonresidential construction, which have fluctuated within a narrow
range since spring, held at the moderately reduced October rate.
Although plans call for some curtailment in Federal construction expendi-
tures over the period ahead, state and local expenditures are continuing
to rise and, in November, total public construction outlays were at
another new high.
NEW CONSTRUCTION PUT IN PLACE
(Confidential FRB)
November 1967 Per cent ChangeNovember 1967f
($billions) 1/ from
October 1967 Novrmber 1966
Total 79.0 -- + 10
Private 51.5 -- + 9
Residential 26.2 + 1 + 29
Nonresidential 25.4 -- - 5
Public 27.5 + 1 + 10
1/ Seasonally adjusted annual rates; preliminl/, Data for the r-ostrecent month (November) are available under a confidential arrange-ment with the Census Bureau. Under no circumstances should publicreference be made to them.

II - 17
Because of growing uncertainties about the course of the
economy and, in particular, the course of domestic capital markets,
the pace and duration of recovery in housing activity beyond the inter-
mediate period ahead remains open to question. However, total housing
starts have been running somewhat above earlier projections in recent
months. By October, starts had regained the 1.5 million rate average
of the fourth quarter of 1965, just before the 1966 downturn in housing
starts began. The major impetus to the current recovery has come from
multifamily structures, the most volatile sector of residential
construction activity and the one in which basic demographic and other
demand factors are particularly strong.
Starts
1 - family2 - or more fa
NortheastNorth CentralSouthWest
Permits
1 - family2 - or more fa
PRIVATE HOUSING STARTS AND PERMITS
October 1967(Thousands Per centof units) 1/ 4th Q 19(
1,496
914 - 7mily 582 + 14
265 - 3
399 + 1552 - 4280 + 10
1,202 - 5
655 - 10imily 547 - 1
1/ Seasonally adjusted annual rates; preliminary.
change
65 14th
+
++
++++
+
++
fromQ 1966
63
43109
77813988
64
4693
II - 18
The upturn in single family starts from the unusually reduced
rate in the fourth quarter of 1966 has been less pronounced than for
multifamily starts, but since last spring it has persisted in the face
of growing concern about the impact on potential home-owner demands of
the shift toward rising mortgage interest rates and the deepening
discounts required for loans on both existing and new properties. At
the same time, speculative builders have continued to show little dis-
position or ability to build ahead of the market. In September (the
latest month available) seasonally adjusted sales of new homes by
speculative builders again turned up appreciably after three months
of relatively little change. The number of new homes available for
sale (including those under construction) remained among the lowest in
the history of the series, which began in late 1962,
Defense expenditures. Military contract awards have been
stable since June 1967. Thus, even recognizing the long lags between
such awards and actual spending, expenditures for military goods may
level off shortly, unless a new spurt in military orders occurs.
Personnel compensation will still rise, though, due to the expected
pay increase

II - 19
MILITARY PRIME CONTRACT AWARDS
(In millions of dollars, seasonally adjusted)Monthly
1967 - January 3,338February 3,849March 2,984April 2,920May 4,121
June 3,626July 3,610August 3,686September 3,665October 3,665
Other evidence of a leveling off of military expenditures can
be found in the recent relationship between purchases and contracts.
Contract awards are a leading indicator of military outlays, with
purchases tending to lag behind when awards rise rapidly; at such
times, the ratio of purchases to contracts falls. In periods of
stability in contract awards, military purchases other than for
personnel compensation tend to be fairly constant at a level about
5-10 per cent above contracts. The following table shows that pur-
chases were lagging behind contract awards during the rapid build-up
of 1965 and 1966, but they have reestablished their typical relationship
during 1967. Thus spending appears to have caught up with the
prevailing level of contract awards.

II - 20
NATIONAL DEFENSE
(In billions of dollars, seasonally adjusted annual rates)
Ratio: OtherPurchases Personnel Other Contract
Purchases toof goods and Compensation Purchases Awards
contractservices AwarAwards
1964-Q1 50.5 20.0 30.5 29.2 1.052 50.7 20.1 30.6 28.2 1.083 49.8 20.6 29.2 26.8 1.094 48.9 20.7 28,2 24.2 1.17
1965-Q1 48.4 20,5 27.9 25.6 1.092 49.2 20.5 28.7 29.5 .973 -50.2 21.3 29.0 30.0 .974 52.4 22.5 29.9 35.1 .85
1966-Q1 55.1 23.5 31.6 34.8 .912 58.4 24.1 34.3 40.6 .853 63.0 25.5 37.5 42.9 .884 65.6 26.3 39.3 40.6 .97
1967-Q1 70.2 26.8 43.4 40.7 1.072 72.5 27.1 45.4 42.7 1.063 73.3 27.5 45.8 43.8 1.05
Plant and equipment expenditures. The November Commerce-SEC
survey of business plans to spend on plant and equipment (confidential
until released) has two major findings. First, spending for this year
has been further written down. Thus, the March survey indicated a
rise of 3.9 per cent for the year 1967; the latest survey, after two
intervening scaling-downs, shows an increase of only 1.4 per cent,
and, after allowance for price and cost increase, suggests a decline
in the physical volume of investment. Anticipated spending for the
fourth quarter is now $500 million (annual rate) smaller than shown
in the August survey.

II - 21
The second major finding is the sharp increase now planned
from the current quarter, which shows a moderate advance, to the second
quarter of 1968, as may be seen in the table. The increase over these
2 quarters amounts to 6 per cent or an annual rate of 12 per cent. For
the spring of 1968, anticipated expenditures are 7 per cent above the
further reduced average for the year 1967, suggesting that even moderate
increases in the second half of the year would result in an advance for
the year as a whole significantly above those indicated by recent
private surveys.
An unusual feature of this prospective rise, however--and cne
for which we now have no adequate explanation--is its concentration in
the first quarter. Thus, $3 billion of the total rise of $3.8 billion,
annual rates, is planned for early 1968. Moreover, public utilities
account for $1.5 billion of this first quarter increase and manufacturing
for $1.2 billion, for a combined total of $2.7 billion. In the second
quarter, utilities are unchanged from the preceding quarter and the
rise in manufacturing is much smaller.

II - 22
EXPENDITURES FOR NEW PLANT AND EQUIPMENT
19671967 19681967
1966 November Actual PlannedActual Plans I II III IV I II
(Billions of dollars; quarterly figures, seasonallyadjusted annual rates)
All industries 60.6 61.5 61.7 61.5 60.9 62.1 65.1 65.9
Manufacturing 27.0 26.8 27.9 27,0 26.2 26.5 27.7 28.4Durable Goods 14.0 13.8 14.2 13.8 13.5 13.8 14.6 15.0Nondurable Goods 13.0 13.1 13.7 13.2 12.7 12.8 13.1 13.4
Nonmanufacturing 33.6 34.6 33.8 34.5 34.7 35.5 37.3 37.5Mining 1.5 1.4 1.4 1,3 1.5 1.5 1.6 1.5Railroad 2.0 1.6 1.8 1.6 1.4 1.5 1.5 1.5Non-rail Transpor-
tation 3.4 3.9 3.1 3.9 4.1 4.5 4.8 4.8Public Utilities 8.4 9.6 9.2 9.7 9.8 9.6 11.1 11.1Communications,
Commercial andOthers 18.4 18.2 18.3 18.1 18.0 18.5 18.3 18.7
Labor market. With settlement of several major strikes,
indications of firmness are again becoming apparent in the labor market.
The end of the Ford, Caterpillar tractor and steel haulers strikes
returned over 200,000 workers to payrolls between October and November
and should result in a rebound of manufacturing employment. High rates
of activity to recover strike-lost auto production and to build inven-
tories against possible industrial strife in the steel industry, are
strong expansionary factors for the next several months. If in addition,
II - 23
increases in private demands for plant and equipment, now anticipated,
materialize and there is no extended strike at GM the next several
months should show strong gains in durable goods manufacturing output,
employment and hours. Under these circumstances, a significant
recovery of overall employment growth, and some decline in overall
unemployment seems likely in the next few months. Unemployment insurance
claims already have shown substantial improvement from their late
spring summer highs, and by late November were only slightly above
year-earlier levels--when the total unemployment rate was at its lowest
level of 1966.
The combined impact of a recovery in employment and the work
week--with more hours worked at premium pay--and the direct and indirect
effects of substantial increases in wages and fringes, will undoubtedly
be reflected in sharp gains in wage and salary income during the next
several quarters.
Wages and industrial relations. Although increases in
wage rates and fringes negotiated during 1967 were substantially
larger than during the same period a year earlier, their effect on
average hourly earnings so far in 1967 has been tempered by a decline
in overtime hours of work at premium pay and some reduction of employ-
ment in high wage manufacturing industries. These declines moderated
the rise in earnings in total manufaccuring and offset somewhat the
generally larger increases in earnings in nonmanufacturing sectors.

II - 24
As a result, earnings of production workers in all private nonfarm
industries rose little more between the third quarters of 1966 and
1967 (4.7 per cent) than in the preceding year (4.5 per cent).
AVERAGE HOURLY EARNINGS OF PRODUCTION WORKERS(Per cent increases)
IIIQ 1965to
III Q 1966
Private nonfarm 4.5
Manufacturing 4.2
Mining 5.5Construction 5.6Communication 2.9Trade 4.8Finance, insurance, etc. 3.6Laundries, cleaning and dyeing 5.3Hotels, motels, and tourist courts 6.4
III Q 1966to
III Q 1967
4.7
4.0
4.55.64.35.65.89.07.7
In the coming months, however, increased upward pressure on
wage rates may be anticipated in manufacturing industries as the impact
of substantial wage rate increases in recent contract settlements pervade
the economy. The settlements at Ford and Chrysler--an average increase
in wages and fringes of about 6 per cent over the life of the contract
(and 7-1/2 per cent in wages rates alone in the first year)--is expected
to set a pattern for contracts yet to be negotiated in the automobile
and machinery industries, and affect next year's negotiations in can,
steel, aerospace and shipbuilding industries. Recovery of employment
and hours of work should also act to accelerate the growth of average
earnings in manufacturing in the next several months.

II - 25
At the same time, continued rapid gains in earnings may be
anticipated in other, lower-wage industries, at least through the first
half of 1968. This will reflect the expected further tightening of the
labor market, as well as the increase in the Federal minimum wage on
February 1, 1968, which is likely as in 1967 to have substantial impact
on wages in retail trade, the service sectors and in lower-wage manu-
facturing industries. Increases in wage rates to maintain traditional
wage differentials may also be anticipated.
Compensation, Productivity and Unit Labor Costs. Rapid rates
of increase in compensation per manhour will undoubtedly be reflected
in pressure on unit labor costs. Some offset to their impact on labor
costs should come with a further recovery of productivity. The over-
the-year rate of growth of unit labor costs for the total private economy
had eased somewhat to under 4 per cent in the past two quarters, the
result both of the dampening effect on employee earnings of the dip in
manufacturing, and a modest recovery in productivity from its first
quarter of 1967 low. But the annual rate of productivity growth for
the private economy in the second and third quarters of about 2 per
cent is still well below the postwar average of about 3.2 per cent. A
somewhat higher rate of productivity growth should be apparent in the
next few quarters, however, accompanying a pick-up in growth in real
GNP.

II - 26
OUTPUT PER MANHOUR AND UNIT LABOR COSTSFOR THE TOTAL PRIVATE ECONOMY
Per Cent Change From Year Earlier
Output per Unit Labormanhour Costs
1966 - 1Q 3.9 1.92Q 3.8 3.13Q 2.5 4.14Q 2.0 5.2
1967 - 1Q 0.5 6.52Q 1.9 3.93Q 2.2 3.6
Wholesale prices. The BLS index of wholesale prices of industrial
commodities increased 0.3 per cent in October, instead of 0.2 per cent as
estimated originally. The preliminary estimate for November shows a further
increase of 0.2 per cent--to 107 per cent of the 1957-59 average--bringing
the rise for the 4 months from mid-July to mid-November to an annual rate
of 2.8 per cent, compared with less than 1 per cent over the preceding
year.
Prices of farm products and processed foods and feeds, which
had declined 1 per cent in October, were down an estimated 0.6 per cent
further in November and the total wholesale price index remained at the
mid-October level of 106.1. This is down moderately from this year's
high (to date) of 106.5 in July and from the August-September 1966
high of 106.8--with sharp decreases for both major farm categories--
livestock and products, and crops and products--accounting for the
decreases.

II - 27
The larger-than-estimated increase in the industrial commodity
average from mid-September to mid-October reflected in part higher
prices for motor vehicles than had been anticipated. Manufacturers'
prices for both autos and trucks increased about 2.4 per cent from
September to October as 1967 models, at moderate end-of-year discounts,
were replaced by 1968 models priced about 2 per cent higher than 1967
models in October 1966. For autos, according to the BLS, the actual
increase in manufacturers' prices for 1968 models (relative to intro-
ductory prices for 1967 models) average 3-3/4 per cent, but nearly
half of this increase was credited as quality improvement (primarily
safety improvements and anti-air-pollutant devices). This year's 2
per cent rise in prices of new model autos is the largest since the late
1950's; from 1959 to 1966 new car prices after adjustment by the BLS
for quality improvements tended to drift down, from 102.1 per cent of the
1957-59 average in October 1959 to 98.0 in October 196.6 (part of the
decline--in 1965--reflected reductions in Federal excise taxes).
The rise in prices of motor vehicles was the major influence
on the September-to-October change in the industrial commodity average;
with a weight of only 8 percent in this total, motor vehicles accounted
for over two-fifths of the total rise for those commodity sectors showing
increases. However, there were also major increases in October for copper
products and inorganic chemicals, and in addition there were widespread,
though generally small, gains for other producers' equipment and consumer
products. Gasoline, lumber, plywood, and steel scrap chowed rather
pronounced declines.

II - 28
CHANGES IN PRICES OF INDUSTRIAL COMMODITIESMID-SEPTEMBER TO MID-OCTOBER
(BLS, WPI)
All industrial commodities
Major decreases, total
GasolineLumber and plywoodSteel scrap
Other (mostly increases), total
Major increases
Motor vehiclesNonferrous metalsInorganic chemicals
All other commodities
Per cent of Per centPer cent oftotal index
100.0
5.4
2.72.30.3
94.6
13.2
7.74.41.1
81.4
Per centChange
0.3
-3.6
-5.3-2.0
-3.4
0.5
2.1
2.51.1
2.7
0.2
The slackening in public announcements of price increases
in late October and early November apparently did not noticeably affect
the upward movement of industrial prices. The present BLS estimate
suggests some slowing of the rise between mid-October and mid-November,
but this would seem to follow mainly from a leveling off in motor
vehicle prices after the sharp October increase. In view of this
development and reported further declines in prices of gasoline, lumber
and plywood, the estimated 0.2 per cent increase in the industrial
average from mid-October and mid-November is significant. And in
recent weeks, business has resumed its earlier "open-mouth" policy
on price increases.
II - 29
According to the BLS price report, "metals and textiles
led the [November] advance." Among metals, prices of steel scrap
have risen from the October low and price increases for copper scrap
and various copper products have accelerated further with no end of the
copper strike in sight. Metal price increases have continued apace since
mid-November, with silver up sharply furhter, molybdenum boosted.4 per
cent, and further increases in steel mill products--the most recent
being announcements by several major producers of a 3.4 per cent
increase effective December 15 on cold rolled steel sheets and the
move of a single producer to raise prices on hot-rolled sheets and
galvanized sheet and strip. If these steel increases should become
industry-wide, prices will have been raised this year on roughly 85 per
cent of all steel mill products--with the bulk of the increased since
mid-August.
Higher metals--as well as labor--costs are prompting further
price increases in producersa equipment, as, for example, the recently
announced 4.7 per cent price increase by G. E. for transit-car equipment
and the 10 per cent increase by Boeing on several major commercial
aircraft models ordered after January 1. (Aircraft is not directly
represented in the BLS wholesale price index.)
Upward price pressures persist for cotton and some cotton
products as freezing weather during November reportedly lowered further
cotton crop prospects, possibly to the lowest level since 1895, With
prices of manmade textile products also increasing, wholesale prices
of apparel have been rising this fall, although not nearly so rapidly
as at retail. Over the past year, retail prices of apparel have shown
more than twice the increase reported at wholesale.

II - 30
Consumer prices. The consumer price index increased 0.3
per cent in October to 117.5 per cent of the 1957-59 average, with
food prices down slightly further and other commodities and services
continuing upward. For the first 10 months of the year the CPI in-
creased at an average annual rate of nearly 3 per cent, with the
rate much lower (1.5 per cent) in the first four months of the year
when food prices were declining, much faster (4.2 per cent) from
April to August when food prices rose sharply, and 3 per cent from
August to October when food prices declined seasonally. In the
recent period, lower food prices were accompanied by a step-up in
already rapid price increases for other commodities and some accelera-
tion in the upward trend of service prices.
Average retail prices of nonfood commodities have increased
sharply this year, with gains widespread among durable and nondurable
goods. Through October, the nonfood commodity average had increased
at an annual rate of over 3.5 per cent--double last year's increase;
moreover, a third of this year's rise occurred in September and
October.
Throughout the year, apparel has been a prime mover in the
over-all increase, and sharp increases in used car prices played a
major role up to midsummer. In September and October, when fall and
winter lines are introduced, retail prices of apparel increased more
than 2 per cent--double the usual seasonal rise--to a level almost

II - 31
4.5 per cent above a year earlier. Used car prices--up 11 per cent
(7 per cent, seasonally adjusted) from January to August--showed a
further increase in September but then stabilized in October.
In October, new car prices--which had declined somewhat
less than seasonally earlier in the year and had contributed rela-
tively little to the over-all change in nonfood commodity prices--
jumped 5.2 per cent. Roughly half of this rise is estimated by the
BLS to have reflected the usual seasonal increase occurring between the
last month of the old models and the first month of sales of (pre-
dominantly) new models. The remainder of the rise represents higher
retail prices for 1968 models relative to introductory prices for
1967 models, after allowance for quality improvements, it should be
noted that 1968 models were first priced and included in the October
index, even though, because of this year's earlier introduction date,
a number of 1968 models were sold in September. Also, 1967 models
accounted for roughly one-fifth of October new car sales, and some
further rise in the CPI average of new car prices is to be expected
in November as the 1968 model component of total new car sales expands.
Altogether, the sharp increases in apparel and new car prices
(without adjustment for seasonal variations) accounted for nearly two-
thirds of the rise in average prices of nonfood commodities in
September and October. As noted above, sizable seasonal price changes
occur in the autumn, particularly for food apparel, and new cars--
II - 32
although they tend to be offsetting in the total index with food
prices tending lower and prices of other commodities tending higher.
In coming months, the rise in average retail prices of
nonfood commodities will undoubtedly be slower than in September and
October--and it is likely to be less than the average increase for the
year to date. The earlier sharp run-up in used car prices appears to
have ended. Apparel prices are not likely to continue to increase so
rapidly unless demands pick up very sharply; over the past year, price
increases appear to have absorbed the bulk of the rise in the dollar
value of retail apparel sales. Future changes in new car prices will
depend partly on the strength of consumer demands--which will determine
the timing and extent of dealer discounts--and partly on the effects
of continuing materials cost increases and any price effects of the
new safety equipment required as of January 1. Prices of other goods--
including appliances and furniture--are likely to continue to rise.
Even though food prices may start creeping up again--largely
because of the steady and rapid growth in prices of restaurant meals,
with their very large labor component--the rise in the CPI in coming
months seems likely to hold nearer to the recent 3 per cent rate than
to the 4.2 per cent annual rate of late spring and summer.
Current situation and outlook for agriculture. After a
brief respite in 1966, farm operators are again caught in a cost-price

II - 33
squeeze in 1967. This squeeze is essentially a reflection of in-
creasing supplies and not one of weakening domestic demands as
foreign takings, although exports are running 8 per cent below the
abnormally large volume of 1966. Farm prices generally have followed
a downward course this year under the impact of record production
while prices paid by farmers for the inputs of production have moved
upward, but at a slower pace than in 1966. As a result, net realized
farm income this year is expected to decline to $14.8 billion, 10
per cent below the near-record of 1966. Gross incomes have lagged
behind year-earlier levels by a relatively narrow margin. Cash
receipts from the 4 per cent larger marketings and the 5 per cent
lower prices of both livestock and crops are only slightly under last
year, but Government payments are substantially less.
Domestic consumers have benefitted from the record farm
output of livestock and crops this year because of its moderating
effect on retail food prices, especially meats. The estimated rise
in food expenditures of between 3 and 4 per cent is less than the
rise in consumer incomes. Consequently, the percentage of income
spent on food has declined to 17.7 per cent from 18.3 in 1966. Most
of the rise in food expenditures has been due to increased consumption:
consumption is up 2.6 per cent, and retail prices of food are averaging
1 per cent above last year because of rising prices of food eaten

II - 34
away from home. Through October prices of food eaten at home have
averaged about the same as in the first 10 months of 1966.
Prospects for 1978 were characterized as "more of the same"
by Department of Agriculture analysts at the mid-November Outlook
Conference. A record gross farm income just above $50 billion and
about $1 billion higher than in 1967 is foreseen, but the gain will
probably again be offset by rising production expenses, leaving
realized net income at about the same level as in 1967--about $14.75
billion. Supplies of farm products are expected to continue large in
1968, but prices received are likely to strengthen from the reduced
levels of late 1967. With consumer incomes continuing to expand,
prices of meat animals may be stronger than the relatively low levels
of the first half of 1967. Large supplies of feed, lower prices of
feed, and prospects for improved prices may stimulate production of
livestock products after mid-1968. Although no big gains are likely,
output of livestock products for 1968 as a whole may at least match
the 1967 record.
In order to adjust output more closely to prospective demand,
program changes for 1968 have been announced to encourage cuts in
wheat, corn, and sorghum grain production and to encourage an in-
crease in cotton. However, the USDA suggests that there is little
basis for expecting overall crop output to change very much in 1968
from the 1967 performance, assuming average growing weather.
II - 35
Farm debt rose faster than the value of farm assets during
1967 according to preliminary Balance Sheet of Agriculture data pre-
sented at the Outlook Conference. Debts rose 9 per cent, approaching
the rapid rate of the year before. Farm real estate debts increased
at a slower pace than non-real-estate debts, partly because of restraints
on new mortgages made particularly during the second half of 1966. Ex-
pansion of farm real estate debt continued to lag in 1967, apparently
reflecting weakened demand for farm mortgage loans in part and competi-
tion of nonfarm borrowers for funds. Dollar volume of farm mortgages
recorded in the first half of 1967 was 2L per cent below a year earlier.
Farm finance analysts of the USDA suggest that a greater part than
usual of operating and short and intermediate term investment expendi-
tures may have been financed with nonreal-estate credit instead of
farm real estate credit. Apparently borrowers did not refinance their
old mortgage loans or make advance payments on them as frequently as
they do in a period when interest rates are not rising and credit is
more readily available.
Value of farm assets advanced about 4 per cent in 1967
compared with a gain of 5 per cent in 1966. Most of the rise was in
farm real estate values which were estimated at $191.5 billion, 5
per cent above a year earlier. In the four previous years, values
had advanced about 6 per cent annually. Other physical assets--

II - 36
inventories of livestock, crops, and machinery--increased 2 per cent
compared with an increase of 5 per cent last year.
Real estate dealers, farmers, and lenders polled by the
Department of Agriculture in preparation for the outlook conference
reported that although national credit needs have been strong much
of the year, farmers' access to credit has been fairly well maintained.
On interest rates, reporters indicated that rates on new mortgage
loans have been higher by one-half to one percentage point than in
early 1966 and rates on nonreal-estate loans are probably up by one-
fourth percentage point. Although farmers were reported as becoming
accustomed to the higher rates, they were reported to be appraising
their investment needs more carefully and some of them are postponing
longer-term investments in expectations of lower rates later.

n-c-1
ECONOMIC DEVELOPMENTS - UNITED STATESSEASONALLY ADJUSTED
INDUSTRIAL PRODUCTION-II1957 59 100 iII
l 2
RATIO SCALE
1/
/ / OCT 146 9
CONSUMER GOODS
- 1// EQUIPMENT
/ TOTAL
/-,/
EMPLOYMENT AND UNEMPLOYMENTMILLIONS OF PERSONS ESTAB BASISNONAGRICULTURAL EMPLOYMENTRAT
'O SCALE OCT 662
TOTAL
PER CENTER CENT IUNEMPLOYMENT
OCT '3
HOURSi "IERG WEKL r HRi OCT
HOURS AVIERAGE WEEKLY HOURSIRATIO SCALE OCT
PRODUCTION WORKERS
1961
1961
PRICES
1963
1963 1965 1967
1965 1967
WORKWEEK AND LABOR COST IN MFG
1
12/5/67
95759100 TOTAL UNIT LABOR COST ocCRATIO CALE 107 9
ALL EMPLOYEES
I 1 1 1
42
40
110
105
100
95
1963 1965 19671961

12/5/67
ECONOMIC DEVELOPMENTS - UNITED STATESSEASONALLY ADJUSTED
INCOME AND SALES1960 61=101oRATIO SCALEI
PERSONAL
1961 1963
RETAIL SALES
BUSINESS INVENTORIES, NONFARMQUARTERLY CHANGE, ANNUAL RATESBILLIONS OF DOLLARS
GNP BASIS
I 1I.^tini nnf
INSTALMENT CREDIT
INVENTORIES/SHIPMENTS RATIO Qm , 1.9 L I 1 1 I40
NET CHANGE IN OUTSTANDING 12
MANUFACTURERS' I lllll l196 I I6 I I , 1 1 5 1.63 1 6 1..... 0
OCl 155 5
_____ OCT
SO143 5.
INCOME
RETL'RETAIL
BUSINESS INVESTMENTBILLIONS OF DOLLARS ANNUAL RATESI I I 7
SRATIO SCALE -
NEW PLArT AND on 65!EQUIPMENT EXPENDITURES(COM -S E C ) .
- - Ii %, a
120
120
196519671967
-U
^--7
1961 1963 1965 1967
II-C-2
SALES
1961 1963 1965 1967
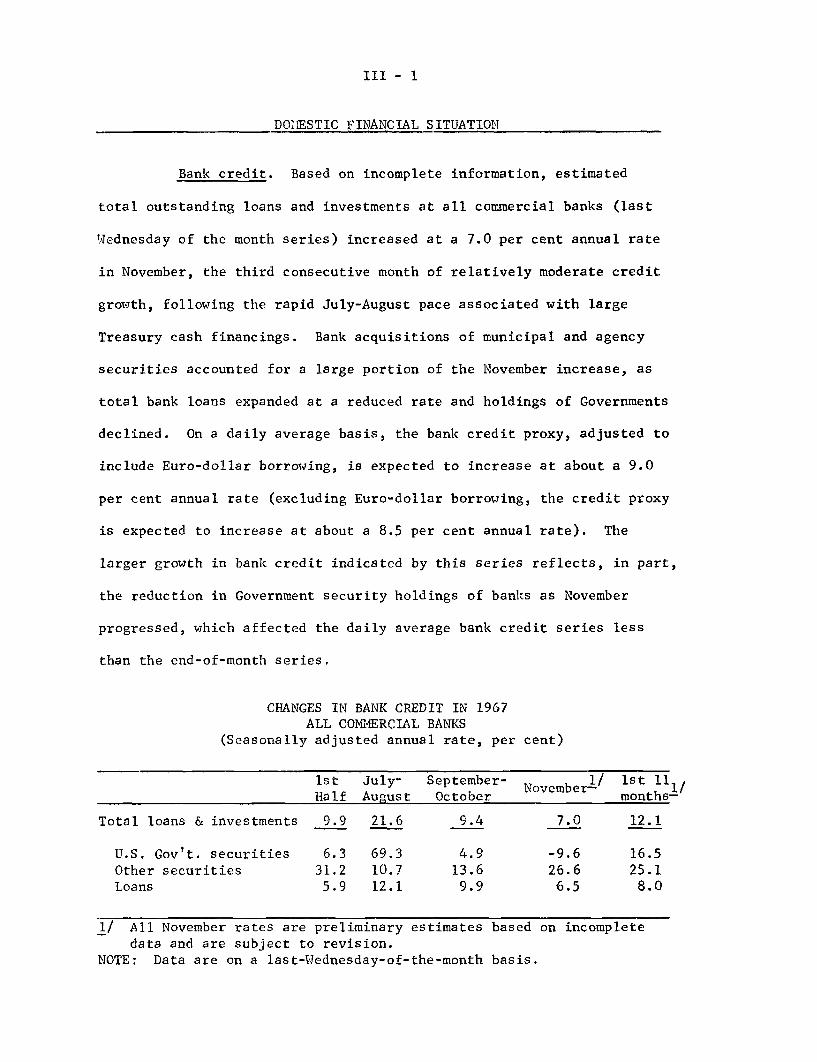
III - 1
DOIESTIC FINANCIAL SITUATION
Bank credit. Based on incomplete information, estimated
total outstanding loans and investments at all commercial banks (last
Wednesday of the month series) increased at a 7.0 per cent annual rate
in November, the third consecutive month of relatively moderate credit
growth, following the rapid July-August pace associated with large
Treasury cash financings. Bank acquisitions of municipal and agency
securities accounted for a large portion of the November increase, as
total bank loans expanded at a reduced rate and holdings of Governments
declined. On a daily average basis, the bank credit proxy, adjusted to
include Euro-dollar borrowing, is expected to increase at about a 9.0
per cent annual rate (excluding Euro-dollar borrowing, the credit proxy
is expected to increase at about a 8.5 per cent annual rate). The
larger growth in bank credit indicated by this series reflects, in part,
the reduction in Government security holdings of banks as November
progressed, which affected the daily average bank credit series less
than the end-of-month series.
CHANGES IN BANK CREDIT IN 1967ALL COMMERCIAL BANKS
(Seasonally adjusted annual rate, per cent)
Ist July- September- 1/ Ist 11November- 1/
Half August October months-
Total loans & investments 9.9 21.6 9.4 7.0 12.1
U.S. Gov't. securities 6.3 69.3 4.9 -9.6 16.5Other securities 31.2 10.7 13.6 26.6 25.1Loans 5.9 12.1 9.9 6.5 8.0
1/ All November rates are preliminary estimates based on incompletedata and are subject to revision.
NOTE: Data are on a last-Wednesday-of-the-month basis.

III - 2
Although the 6.5 per cent November expansion rate in total
loans was less than the average for the preceding four months, business
loans grew at an 8.5 per cent seasonally adjusted annual rate--their
highest rate since July. At weekly reporting banks, most of the
November expansion in business loans occurred at banks outside New York
City.
The increased pace of business loan expansion may reflect in
part the indicated more rapid inventory accumulation this fall, but it
also is associated with some special factors. Loans to food processors,
commodity dealer and retail trade all showed more than seasonal expan-
sion, apparently reflecting some shifting of October demands into
November. And, the fact that November was a five-week month imparted
some upward bias to the monthly estimate. On the other hand, net
acquisitions of bankers' acceptances, which had been important to the
increase in business loans in September and October, contributed a
relatively small proportion to the November expansion.
COMPOSITION OF LOAN GROWTH IN 1967
ALL COIMMERCIAL BANKS(Seasonally adjusted annual rate, per cent)
1st July- September- 1 / 1st I/November- I/
Half August October 11 months-
Total loans 5.9 12.1 9.9 6.5 8.0
Business 10.9 6.5 3.6 8.5 8.7Real Estate 5.6 7.6 7.5 10.6 6.9Consumer 4.1 6.1 9.0 8.9 5.9Security -17.7 158.3 39.6 -37.1 20.7Nonbank Financial -11.6 -5.3 37.2 20.0 0.9
1/ All November rates are preliminary estimates based on incompletedata and are subject to revision.
NOTE: Data are on a last-Wednesday-of-the-month basis,

III - 3
Among other loan components, consumer loans continued to
expand at the higher rate which began about midyear. The acceleration
in these loans has occurred mainly in the nonautomobile consume durables
area and in personal loans--perhaps associated with expanded use of
bank credit cards. Loans to nonbank financial institutions also con-
tinued to rise, although apparently not as rapidly as in other recent
months, and security loans declined for the first time since midyear.
The indicated acceleration in growth of real estate loans is probably
largely statistical, resulting from the five statement weeks in November.
With total loan demand moderate, bank holdings of other
securities expanded sharply--at an annual rate of more than 26 per cent,
or almost twice the September-October pace. These purchases reflected
acquisitions of attractively priced municipals and also, as in October,
participation certificates. In both October and November, an increasing
proportion of the municipals acquired by banks have had maturities
greater than one year.
During November, banks reduced somewhat their holdings of
Government securities. Although, on balance, banks acquired a portion
of the new note in November, the financing this month was of less than
seasonal size. In addition, there were large bank liquidations of
Treasury bills over the month, probably reflecting in part sales of tax
anticipation bills underwritten in October.
Bank deposits. The pace of total time and savings deposit
inflows in November, on a daily average basis, fell slightly further

III - 4
to about an 11.0 per cent annual rate, down from the 12 per cent rate
of September-October and the 17 per cent rate of the first half. Nego-
tiable CD's sales accounted for a substantial part of the November
growth, increasing an estimated $1 billion, on an end-of-month basis.
The unusually large increase in outstanding CD's probably reflects an
effort to prepare for large December maturities as well as the higher
cost of Euro-dollars following the devaluation of the British pound.
Euro-dollar borrowings increased approximately $450 million through the
week ending November 22, when they reached a new high of $4.8 billion.
However, preliminary data indicate a more than seasonal decline in such
borrowing the last week in November, reflecting in part at least the
increase in Euro-dollar rates associated with the devaluation and the
rise in the British Bank rate.
Probably most of the domestic CD sales by banks were in the
shorter maturity ranges, as the 5.50 per cent ceiling made longer
maturities noncompetitive. Some indication of this noncompetitiveness
can be read from the fact that CD's were available in the secondary
market, at the end of November, at a 6 per cent yield for 6-month
maturities. To attract CD funds, banks raised rates on shorter-term
CD's along with the general upward adjustment in short-term rates,
including the discount rate and the prime lending rate at the time of
the devaluation. By month-end, offering rates of 5.50 per cent were
available on 60- to 90-day maturities. Early in December, it was
reported that two large New York City banks were offering 5.00 per cent
on 30-day maturities.
III - 5
Inflows of time and savings deposits other than CD's
moderated further in November, after rough seasonal adjustments. It
is quite likely that the recent Treasury note offering at 5-3/4 per
cent diverted some individual savings to this issue that otherwise
would have gone to banks.
The money stock is estimated to have increased at about a
7.0 per cent annual rate in November, roughly the same as in October
and the first half of the year. A large part of the recent expansion
reflects runoffs in Treasury balances over the last three weeks of
November, despite the midmonth cash refunding.
Thus, as yet, there has been little evidence that high
interest rates on available money substitutes have begun ,- produce
significant efforts to economize on money holdings, as has occurred in
earlier postwar periods of rising interest rates. Reports continue to
circulate in financial markets that corporations are adding large
amounts to their demand balances in an effort to cement bank relation-
ships in order to assure continued access to bank credit. At some
point, the desire to obtain higher yields may tend to offset this
building of compensatory balances and at that point expansion in the
money stock would tend to recede.
Corporate and municipal bond markets. Yields on corporate
and municipal bonds showed signs of stabilizing in the immediate post-
devaluation period when prospects for a quick tax increase seemed to
have improved. Thereafter, as hopes for a tax increase faded again,

III - 6
yields in both markets edged upward to new highs. At these highs,
investor demands have improved and new issues most trecently have moved
out.quite well, particularly in the corporate bond market.
BOND YIELDS(Weekly averages, per cent per annum)
Corporate AaaNew Seasoned
With callprotection
1965 1/End of July- 2/ 4.58 4.48Early December- 4.79 4.60
1966Late summer high 5.98* 5.44
1967Weeks ending:
February 3 3/ -- 5.02
September 22 5.82 5.64
November 3 6.12* 5.93November 17 6.53 6.10
December 14/ 6.49 6.13December 8- 6.55*
1/ Week prior to President's announcementment in Vietnam.
2/ Week preceding Federal Reserve discount3/ 1967 lows.4/ Preliminary estimate based on the terms
relevant issues that will ultimately beaverage.
* Some issues included carry 10-year call
State and local Government
Moody's Bond Buyer'sAaa (mixed qualities)
3.16
3.37
4.04
3.25
3.82
3.923.98
4.03
3.25
3.50
4.24
3.50
4.14
4.274.33
4.42
of increased U.S. invol
rate increase.
of three of the fourincluded in the weekly
protection.
ve-
An unmanageably large volume of offerings scheduled for
mid-November, in conjunction with unsettled market conditions following
the devaluation, forced substantial adjustments in the corporate and

III - 7
municipal bond calendars. In the corporate market, a total of more
than $550 million of scheduled bond offerings were postponed or cut
back in size. Included in this total was the indefinite postponement
of U.S. Steel's $225 million debenture issue. Some scheduled municipal
offerings were also postponed during the post-devaluation week and
several issuers rejected the bids they received.
Flotations of publicly-offered corporate bonds in November
aggregated an estimated $750 million--little more than half the volume
expected earlier. Total bond and stock offerings estimated at $1.7
billion, remained relatively high, however, as increases in stock
offerings and in the projected volume of private placement partially
offset the decline in public offerings.
Public bond offerings already scheduled for December aggre-
gate over $900 million, and further additions to the calendar may raise
the ultimate volume to $1.0 billion. Fragmentary evidence also sug-
gests that private placement takedowns in December are likely to show
the usual seasonal bulge. Thus, the total volume of bond offerings is
expected to exceed the reduced November total by one fourth or more.
With one large exception, amounting to $150 million; nearly all of the
December calendar of public offerings is concentrated in the first half
of the month.

III - 8
1/CORPORATE SECURITY OFFERINGS-
(Millions of dollars)
1st Quarter
2nd Quarter
3rd Quarter
4th Quarter
October
November
December
Year
Public2/
Offerings-
1966 1967
1,774 3,263
1,941 4.017
2,256 4,604
2,047 3,100e
499 1,350e
569 750e
980 l,000e
8,018 14,984e
BondsPrivate
Placements
1966 1967
2,586 1,811
2,083 1,465
1,627 1,552
1,247 2,200e
256 550e
435 650e
555 1,000e
7,543 7,028e
Total bondsand stocks
1966
5,094
5,115
4,197
3,669
892
1,115
1,661
18,075
1967
5,464
6.208
6,834
6,100e
2,250e
1,700e
2,150e
24,606e
1/ Data are gross proceeds.2/ Includes refundings.
State and local government bond offerings in November totaled
$1.2 billion, and December flotations are expected to be about $1.3
billion. As noted in earlier Greenbooks, this large continuing flow of
offerings reflects an unprecedently large supply of industrial revenue
issues. In November such issues totaled almost $300 million and some
analysts predict more than $500 million will enter the market in
December.
Bonds

III - 9
STATE AND LOCAL GOVERNM4ENT BOND OFFERINGS(Millions of dollars) 1/
1966 1967
1st Quarter 2,964 4,171
2nd Quarter 3,256 3,872
3rd Quarter 2,510 3,050e
4th Quarter 2,674 3,450e
October 759 950e
November 976 1,200e
December 940 1,300e
Year 14,404 14,543e
1/ Data are for principal amounts of new issues.
Mortgage markets. As bond yields have edged higher in recent
weeks, upward pressures on home mortgage rates have continued. During
October and November, these pressures were reflected in a sharply
increased volume of offerings of Government underwritten mortgages to
FNMA. In consequence, FNMA cut its secondary market purchase prices by
one per cent effective November 25, increasing the yield to FNMA on such
loans by about 12 basis points. This was the second price reduction
made by FNMA since spring in an effort to bring its prices into closer
alignment with the general advance of home mortgage yields. According
to FNMA field reports made at the end of last month, the combination of
the FNMA price cut and the increase in the Federal Reserve discount
rate produced fairly widespread price reductions on FHA and VA mortgages

III - 10
by institutional investors still active in the secondary market. The
field reports also indicate somewhat less willingness on the part of
investors to commit ahead on these loans, particularly in view of
uncertainties about prospective savings behavior after the end-of-year
dividend crediting period.
Reflecting the considerably improved availability of mortgage
funds which developed earlier this year, total mortgage debt outstanding
rose more than seasonally during the third quarter to reach a level
exceeding $362 billion. The quarterly increase was again sparked by
the dominant savings and loan associations. Net acquisitions of S&L's
along with expanded support from FNIJA considerably more than offset a
leveling-off or decline by more diversified lender groups. Altogether,
the S&L share of aggregate expansion in residential mortgages--the
major component of total outstanding debt--was the largest for any
third quarter since 1963, the record year for association net lending.
Data available for October suggest that these trends were continuing
into the current quarter.
PERCENTAGE DISTRIBUTION OF INCREASES INOUTSTANDING RESIDENTIAL MORTGAGE DEBT
1965 1966 p. 1967 p.I II III IV I II III IV I II III
Total 100 100 100 100 100 100 100 100 100 100 100
S & L Assns. 45 49 44 38 39 35 9 1 16 53 53
All others 55 51 56 62 61 65 91 99 84 47 47
IEMO:Total increasein debt, H.S.A.($ billions) 3.9 5.3 5.4 5.2 3.7 4.1 2.7 2.1 2.2 3.7 4.5

III - 11
The additional upsurge during the third quarter in the rate
of net lending on home mortgages, which still remained considerably
below its late 1965 peak, more than offset some indicated decline in
growth of mortgage debt secured by multifamily as well as by commercial
properties. The reduced growth rate in mortgage debt on income-
producing properties reflected the exceptionally rapid spurt in the
second quarter and the sharply reduced takedowns by life insurance
companies during the third quarter that seem likely to be reversed in
the current quarter. Farm mortgage debt again picked up its rate of
growth.
INCREASES IN MORTGAGE DEBT OUTSTANDING(Seasonally adjusted annual rates in billions of dollars)
Residential C r-Commer- 1/
Total 1-4 Multi- c FarnSfamily family/ cial
1965 III 26.8 20.3 16.4 3.9 4.2 2.2IV 26.5 20.6 16.9 3.7 3.8 2.6
1966 I p. 27.3 17.7 14.1 3.7 7.4 2.3II p. 23.4 14.9 12.0 2.9 6.6 2.1III p. 18.1 10.0 7.9 2.1 5.8 2.2IV p. 14.9 8.5 6.9 1.6 4.5 1.9
1967 I p. 17.0 10.7 7.6 3.0 5.0 1.4II p. 19.9 13.4 10.1 3.3 5.2 1.6III p. 23.6 16.8 13.7 3.1 4.6 1.9
1/ Includes estimates for holdings of individual and others which areexcluded in the flow of funds series.

III - 12
The quality of outstanding mortgage debt improved further
during the third quarter, judging from such after-the-fact measures as
long-term delinquency rates and foreclosure rates relating chiefly to
loans closed in earlier periods. Although the composite delinquency
rate on home mortgages (MBA series) rose more than seasonally, the
increase reflected a rise in short-term delinquencies, partly triggered
by strikes and related layoffs. The 60-day-or-more delinquency rate,
on the other hand, showed further year-over-year improvement. The
over-all foreclosure rate on nonfarm mortgages (FHLBB series) again
dipped further, registering the lowest level for the period in four
years.
Stock market. Since November 8--when they reached their
recent low--stock prices have advanced nearly 5 per cent. As a result,
the broad stock price averages on both the New York and American
exchanges have recovered nearly two-thirds of the preceding decline
from their 1967 highs. Trading activity since November 8 has been
heavy, averaging about 11 million shares per day on the New York
exchange.
RECENT CHANGES IN STOCK PRICE INDEXES
S&P Dow-JonesAMEX
500 Industrial1/
Per cent decline from high-to November 8 -6.6 -9.9 -7.0
Per cent increase fromNovember 8 to present +4.5 +4.5 +4.8
Per cent of decline presentlyerased 63.4 41.2 63.6
1/ October 8 for AMEX index, September 25 for others.

III - 13
The November increase in stock prices began as only a
technical rally of the sort which had occurred several times during
the preceding decline. And it was broken temporarily by sharp one-day
declines after the British devaluation and again after the recent
indication that no tax increase is likely in 1967. Despite these
temporary setbacks, however, the rising price tendency has persisted.
In October, despite the drop in stock prices then, margin
debt increased by $180 million to $6,090 million, and bank loans to
other than brokers and dealers rose by $86 million. Total customer
credit, including both margin debt and bank loans, rose to $8,513
million at the end of October, up $1,608 million since the low in
January. Customers net free credit balances also rose in October--by
$112 million-- to $2,513 million.
U. S. Government securities market. Yields on Treasury
obligations have fluctuated over a wide range since mid-November. On
balance, Treasury bill rates have risen some 30 to 40 basis points from
their levels just prior to the sterling devaluation and the concomitant
increases in U.K. and U.S. discount rates, while yields on intermediate-
and long-term issues have changed only slightly, as is shown in the
table. Currently, yields on Treasury coupon issues are somewhat below
their highs of the year reached just before mid-November and again
approximated immediately following the devaluation.

III - 14
MARKET YIELDS ON U. S. GOVERNMENT SECURITIES(Per cent)
1966 1967
High Low High Nov. 17 Dec. 5
Bills
3-months 5.59 (9/21) 3.33 (6/23) 5.01 (12/1) 4.67 4.96
6-months 5.98 (9/19) 3.71 (5/22) 5.60 (12/1) 5.13 5.55
1-year 5.94 (9/21) 3.80 (4/24) 5.67 (12/1) 5.27 5.66
Coupons
3-years 6.22 (8/29) 4.27 (4/10) 5.87 (11/13) 5.66 5.69
5-years 5.89 (8/29) 4.38 (4/10) 5.91 (11/13) 5.72 5.77
10-years 5.51 (8/29) 4.45 (3/20) 5.87 (11/13) 5.75 5.73
20-years 5.12 (8/29) 4.44 (1/16) 5.81 (11/20) 5.70 5.64
Market reaction to news of devaluation and advances in U.K.
and U.S. discount rates was softened by sizable Desk purchases of
Treasury bills and coupon issues. In the two weeks following the
devaluation, the Desk was a net buyer of over $800 million of bills
from dealers, with purchases about evenly divided between those for
System account and for official foreign accounts. Immediately after
the devaluation, the Desk also bbought $186 million of coupon issues,
thereby relieving dealers of the bulk of their inventories in over .1-year
Treasury obligations. Since then, dealers have further reduced their
holdings of notes and bonds and as of December 4 they had small net
short positions in securities due after 1-year.
Following their initial adjustments in the wake of the
sterling devaluation, yields in both the bill and bond markets remained

III - 15
highly volatile, as market participants were swayed by apparently
changing prospects for some restrictive fiscal measures. Developments
in the gold market also affected market psychology. Most recently,
fading market hopes for enactment this year of the Administration's tax
surcharge proposals have given rise to speculation about a further move
in the near future to a less easy monetary policy, including a possible
further increase in the discount rate, and a generally weak atmosphere
has prevailed in all maturity sectors of the market.
Yields on key short-term market instruments other than bills
generally have adjusted up from 1/8 to 1/2 of a percentage point since
mid-November as the table shows.
SELECTED SHORT-TERM INTEREST RATES
1966 1967
High Low Nov. 17 Dec. 5
3-months
Bankers' acceptances 5.75 (10/25) 4.25 (6/6) 4.88 5.38Federal agencies 5.76 (9/21) 3.82 (5/26) 5.05 5.20*Finance paper 5.88 (12/31) 4.25 (5/24) 5.13 5.38CD's (prime NYC)
Highest quoted new issue 5.50 (12/31) 4.25 (4/21) 5.25 5.50Secondary market 5.90 (9/21) 4.35 (4/28) 5.30 5.55
6-months
Bankers' acceptances 6.00 (9/23) 4.38 (6/16) 5.13 5.63Commercial paper 6.00 (12/31) 4.63 (6/26) 5.13 5.50Federal agencies 6.04 (9/21) 4.11 (5/19) 5.40 5.45*CD's (Prime NYC)
Highest quoted new issue 5.50 (12/31) 4.25 (4/21) 5.38 5.50Secondary market 6.30 (9/28) 4.35 (4/14) 5.60 6.00
1-year
pr?-i =c -,-- ,.1 - (q./231 4.18 (4/7) 5.75 5.95*Prime municipals 4.25 (9/21) 2.40 (4/14) 3.40 3.75*
N.B. Latest dates on which high or low rates occurred are indicatedin parentheses.
* Yields on December 1.

III - 16
Federal Agency offering. An excellent reception was accorded
the $1.0 billion sale of new FNMA participation certificates which came
to market on November 28. Of the $1.0 billion total, $650 million were
sold to private investors, including $450 million due in 26 months at
a 6.35 per cent yield and $200 million maturing in 20-years at a 6.40
per cent yield. These yields were about one percentage point higher
than those set on the previous PC issues marketed in mid-June 1967.
Federal Budget. Budgetary prospects, as projected by the
staff, assuming the passage of a higher wage base for social security
contributors, are shown in the table with data through the first
quarter of 1968. The seasonally adjusted Federal deficit, in the
national income accounts, is projected to decline from its third
quarter level of $13 billion to about $6-1/2 billion in the first
quarter of next year. If the Administration's surtax proposals were
to be enacted early next year, the seasonally adjusted national income
budget would be in balance toward the end of fiscal year 1968.
The corresponding cash deficit in the first quarter in 1968
is projected in the amount of $5 billion, giving rise to an equal
amount of net cash borrowing through direct Treasury debt. In addition,
$2 billion of P.C. sales are assumed for the first quarter. The
Treasury may begin cash financing in January, possibly by selling
additional June tax bills.

VARIOUS FEDERAL BUDGETS(In billions of dollars)
Fiscal Year 19681966 1967 1968 FY 1967 F i c a l
January SummerIII IV I II III IVe Ie Actual Budget3/ Review4/
Quarterly data, unadjusted
Cash surplus/deficit (-) - 6.7 - 7.7 1.4 11.3 - 9.2 -11.1 - 5.0 - 1.8 - 4.3 -11.5Cash receipts 34.6 31.1 38.0 49.8 35.9 32.0 37.6 153.5 168.1 164.0Cash payments 41.3 38.8 36.7 38.6 45.1 43.1 42.6 155.3 172.4 175.5
Change in total cash balance - 4.1 - 2.5 .7 1.2 .3 - 2.5 1.2 - 4.7 -- --Net Cash borrowing (+) 2.4 5.1 - .9 -10.3 9.3 8.4 5.0 - 3.8 3.8 11.0(Pool sales to public) 1/ - .5 -- 1.1 1.8 -- .7 2.0 2.9 5.0 5.0
Seasonally adjusted annual rate
Federal surplus/deficit (-)in national income accounts - .7 - 3.3 -11.9 -14.7 -13.1 -11.6 - 6.6 - 7.7 - 2.1 - 6.4
Receipts 145.6 148.6 149.1 148.1 152.8 156.6 162.2 147.9 167.1 164.0Expenditures 146.3 151.9 160.9 162.8 165.9 168.3 168.8 155.5 169.2 170.4
High employment surplus/deficit (-) 2/ - .4 - 3.3 -10.5 -13.0 -12.2 -11.0 - 5.9 - 6.8
e - Staff projections. Based on existing tax rates.1/ Not included in net cash borrowing.2/ Uses 1966 IVQ as a high employment base.3/ Includes tax legislation proposed in January 1967 estimated to raise $5.8 billion in fiscal 1968.4/ The President's tax increase proposals were projected to produce $7.4 billion of additional revenues in
fiscal 1968, assuming a 10 per cent surcharge effective July 1, 1967, for corporations, and October 1,1967, for individuals. Figures also assume lowest expenditure totals considered possible by theAdministration.

rI-c-i
FINANCIAL DEVELOPMENTS - UNITED STATES
FREE RESERVES AND COSTSBILLIONS OF DOLLARS
NET FREE RESERVES
NET BORROWED RESERVESNET BORROWED RESERVES
BILLIONS OF DOLLARS
- ---- BORROWED - j .8NOV 3
EXCESS NOV 01963 1965 1967 13
MONEY AND TIME DEPOSITSBILLIONS OF DOLLARS I T' 181'9 200
EASONALL ADJUSTED MONEY SUPPLY 180
B 12 160
- - 140
COMMERCIAL BANK 120TIME DEPOSITS
100
*INCLUDES HYPOTHECATED DEPOSITSI-----I-ILIII 80
PER CENT OF GNP a50 50
MONEY SUPPLY A TIME DEPOSITS 40
MONEY SUPPLY 30oM 226 -
1 1 r 201963 1965 1967
1 MG \/III AVERAGE
SLOANS -i
2_+
U S. GOVT. SECURITIES ' 4
0OCT 07 2
OTHER SECURITIES OCT 092
0
1965 1966 1967
CHANGES IN BANK LOANS-BY TYPEBILLIONS OF DOLLARS 3SEASONALLY ADJUSTED 3 MO MOVING
AVERAGE 2
OCT 02 1
2FINANCIAL OCT 07 1
+I0
1
2
ALL OTHER OCT 0 7 2
_____ 0
1965 1966 1967
SAVINGS SHARES AND DEPOSITSBILLIONS OF DULLARS' ' 'RATIO SCAL
OcT 123 0
I- -
SAVINGS AND LOANASSOCIATIONS
" ~ -- \ -__
MUTUAL SAVINGS BANKSSOCT 59 5
. . .. . .. . .. ..
1963 1965
120
100
80
60
50
40
12/5/67
1967

IB-C-2
FINANCIAL DEVELOPMENTS - UNITED STATES
1967
BILLIONS OF DOLLARS I I 1 3CORPORATE
2
S1966 NOV 1 ' 4
1965
STATE AND LOCAL GOVERNMENT
NOV 1 2
12/5/67
SHARES IN FUNDS SUPPLIED
MARKET YIELDS-U S GOVTIPER CENT
S0
.5 1
!.0
.5
.0
SEC
1-YEAR BILLS*NOV 469
5-YEAR ISSUESNOV 5 78 /
20-YEAR BONDSNOV 56
I
3-MONTH BILLS*NOV 4 8
*INVESTMENT YIELD BASIS
1963 1965 1 67
STOCK MARKET1941 4 -10 BILLIONb OF [ OLLARS
IRATIO SCALE
COMMON o ov ?27STOCK PRICES
OCT 94
TOTALS CUSTOMER CREDIT
*NEW SERIES
RATIO SCALE.MILLION OF SHARES
-A --- NOV 106-
v V
VOLUME OF TRADINGN Y S E , Av Daily Volume/ I .........l l .
PER CENT PRIVATE DOMESTIC TO IPRIVATE INVESTMENT OUTLAYS
0111 277
TOTAL TO GNP m 12 5
1963 1965
MARKET YIELDS
NEW SECURITY ISSUES
BONDS AND STOCKS.
NEW CORPORATE Aaa
STATE AND LOCAL GOVT Aaa /R/\
COMMON STOCKS DIVIDEND/PRICE RATIO
MAR. JUNE SEPT. DEC 1963 1965 1967
IV - 1
INTERNATIONAL DEVELOPMENTS
Contents Page
U.S. balance of payments IV - 1U.S. foreign trade - 3
Sterling devaluation aftermath - 6Short-term capital flows - 6Interest rates - 8Forward exchange rates and
covered interest differentials --sterling and the German mark - 9
Other European financial markets - 11Repercussions in Japan - 12
Stand-by credits for U.K. - 13Domestic economic conditions in Britain - 14Current conditions in Germany - 15The Canadian economy: fiscal policy - 15
U.S. balance of payments. Since September the balance of
payments has registered further large deficits and a major attrition
of gold reserves has occurred. While heavy gold losses and some of
the overall deterioration that has taken place can be traced to the
sterling crisis and its aftermath, there was also some weakening of
the trade account in October.
The October liquidity deficit (not seasonally adjusted) was
near $1.0 billion; excluding "special" transactions, primarily the
negative effect of conversions of about $300 million of long-term
U.K. Government assets and an offsetting investment of $125 million
by Germany in a non-liquid U.S. Treasury issue, the deficit amounted
to about $850 million. This would be about $1/4 billion above the
average of October deficits for the past several years. Several
possible explanations for the larger than usual deficit were offered
in the last Green Book, but it now appears that lower exports
IV - 2
(discussed below) may have been an important factor, while bank
lending was quite small according to early reports.
In November, using weekly data through the 29th, the
unadjusted liquidity deficit was on the order of $700 million.
About $240 million of the increase in liquid liabilities represented
the conversion of the remainder of the U.K. Government investments,
but no other large negative factors are known at this time. However,
there were probably speculative capital outflows from the United
States that will not be recorded in the statistics and, if not
reversed in December, may have a sizable impact for the fourth
quarter as a whole. In the eleven months through November the
liquidity deficit (not seasonally adjusted) amounted to an estimated
$3.4 billion, and to about $4.4 billion before reduction by "special"
transactions.
Measured on the official reserve transactions basis the
deficit in October (NSA) is estimated at about $300 million, and the
amount would have been negligible if it had not been for the con-
version of the U.K. official portfolio. The contrast with the large
liquidity deficit reflected in part increases of about $150 million
in liabilities to foreign branches of U.S. banks and about $100 mil-
lion in U.S. assets of Canadian banks. During November the official
reserve transactions balance has gyrated widely, and will probably
show a sizable deficit for the month. Liabilities to foreign branches
built up considerably in the early part of November, but then fell off
again as deposits shifted into sterling, gold and continental currencies.
IV - 3
In the week ending December 6, the Treasury gold stock showed a loss
of $475 million, reflecting a transfer to the Stabilization Fund in
anticipation of settlement for the U.S. share of the November losses
of the gold pool.
Reserve gains by the Common Market countries, including net
foreign assets of the commercial banks of these countries, were about
$2 billion for the year through October, and a very large further gain
accrued to them in November.
In Appendix A some comments are provided about the U.S.
balance of payments outlook for 1968, as modified by the possible
effects of the U.K. devaluation.
U.S. foreign trade: The U.S. merchandise trade surplus
fell sharply in October from the September rate, as exports declined
by about 8 per cent while imports held firm. This was a surprising
drop, since foreign demand was not expected to weaken. About three-
quarters of the total drop of $200 million (seasonally adjusted) in
exports from September to October appears to be related to the following
special events.
1. Emergency crude oil shipments, particularly to the
United Kingdom, necessitated by the Arab-Israeli war, came to an end.
2. Exports of aircraft, which fluctuate greatly from month
to month, fell sharply in October following a steep rise in September.
3. Automobile exports, which ordinarily increase seasonally
from September to October, failed to rise this October because of the
Ford strike. It is likely that some shipments were only temporarily
postponed and that exports of automobiles around the end of the year
may be greater than usual.

IV - 4
4. Shipments of tobacco to the United Kingdom and wheat to
Pakistan fell substantially in October because of delays in shipments
under government programs. Deliveries of these products are expected
to return to a more normal rate sometime later in the marketing year.
The decline in exports to the U.K. in October was particularly
pronounced. In addition to the reductions in tobacco and crude oil
shipments mentioned above, there were reduced exports of chemicals and
machinery which may stem, in part, from dock strikes in London and
Liverpool.
U.S. FOREIGN TRADE(billions of dollars; balance of payments basis)
Seasonally adjusted annual rates
1 9 6 6 1 9 6 71st 2nd 1st July-half half half Oct.
Exports 28.8 29.6 30.8 30.0Imports 24.5 26.5 26.4 26.3
Trade balance 4.3 3.0 4.3 3.8
Note: Figures may not add due to rounding.
For the four months of July-October combined, the U.S. trade
surplus on the balance of payments basis was at an annual rate of $3.8
billion, compared with $4.3 billion in the first half of the year. The
entire drop can be attributed to exports (mainly because of the low
October figure) as imports in the July-October period were close to
those in the first half. Both agricultural and nonagricultural exports
in July-October were about 3 per cent lower than in the first half of
the year.

IV - 5
By area, shipments to Japan and Western Europe in July-
October were running at a higher rate than in the first half of
the year. Excluding emergency oil shipments, however, exports to
Western Europe would have been about the same in both periods.
Deliveries of goods to Canada, Latin America and other Asia and
Africa countries in July-October were below the average rate of
the first six months, seasonally adjusted.

IV - 6
Sterling devaluation aftermath. The financial repercussions
of the British devaluation and accompanying measures of domestic re-
straint have thus far been fairly limited -- at least apart from the rush
to buy gold in the London market in the first week after the devaluation.
No important devaluations subsequent to those mentioned-1 in the Interim
Green Book have occurred. There have been moderate increases in short-
term interest rates in some countries, and sharp advances in sterling
money market and Euro-dollar rates -- the latter partly reversed since
November 28. There were movements of private funds from Euro-dollars
into German marks; these were subsequently more than offset by outflows,
of German bank funds, stimulated by Bundesbank provision of forward cover
at attractive rates.
Despite high short-term rates in sterling money markets, the
persistence of a sizable discount on forward sterling has inhibited in-
flows of covered-interest-sensitive funds into sterling.
Short-term capital flows. Exchange rates and reserve data
indicate that movements of funds into Continental European currencies,
which had developed in the week following sterling devaluation on
November 18, tapered off after Friday, November 24.
Disappointingly, there has been no further massive reflow into
sterling since the first few days after the devaluation. For the month
of November Britain's published reserves showed a $127 million gain in-
cluding $490 million of proceeds of liquidation of the dollar securities
1/ On page 15 of the November 25 Interim Report the footnote to thetable should have included Ceylon and Iceland. Various small Britishdependencies and former dependencies also devalued; Nepal did not.

IV - 7
portfolio, or a $363 million loss without that. The total drain (un-
published) arising from underlying deficit plus net short-term capital
flows was much larger, as the British received official assistance, in-
cluding a $250 million net increase in their swap drawings with the
Federal Reserve.
Massive buying of gold in the London market in the week after
sterling devaluation gave place last week and this week to diminishing
dealings. Sales by the Gold Pool fell off sharply after the Frankfurt
meeting of central bank governors on Sunday, November 26, and this week
there have been some net purchases by the Pool.
Capital flows into Continental European currencies after the
sterling devaluation apparently included sizable movements into German
marks and French francs, reaching peak intensity on Friday, November 24.
In the following week, as a result of Bundesbank actions described below,
German commercial banks made large placements of funds in dollar assets
(or other foreign exchange). The Bank of France's official reserves(in-
cluding IMF position) rose by about $290 million during the month of November
as a whole.
Probably the movements out of dollars into gold and Continental
currencies were in large part movements of Euro-dollar funds, no doubt in-
cluding funds that had moved out of sterling before the devaluation. It
is therefore not surprising that the liabilities of U.S. banks to their
branches abroad have declined somewhat since devaluation. On November 29
they were about $400 million lower than on November 15. (The high figure
on Wednesday, November 22, was a pre-Thanksgiving abnormality.)

IV - 8
Interest rates. In the London Euro-dollar market, rates jumped
sharply after the devaluation weekend. They rose further until Tuesday,
November 28, but have fallen back somewhat since then. On Wednesday,
December 6, the 3-month rate stands at 6-1/4 per cent, compared with 5-3/4
per cent before the devaluation and a peak of 6-7/8 per cent in between.
EURO-DOLLAR DEPOSIT RATES/(per cent per annum)
Call 1-month 3-month 6-month Year
Fri. Nov. 17 4.56 4.94 5.75 5.94 6.19
Tues. Nov. 21 4.88 5.25 6.44 6.50 6.63Fri. Nov. 24 5.13 5.75 6.75 6.81 6.88Tues. Nov. 28 5.88 6.50 6.88 6.88 7.13
Fri. Dec. 1 5.38 6.63 6.63 6.63 6.75Tues. Dec. 5 5.25 6.19 6.19 6.25 6.44Wed. Dec. 6 5.26 6.06 6.25 6.19 6.44
1/ London brokers' bid rates.
The sharp rise of around 1 per cent in Euro-dollar rates between
November 17 and November 28 accompanied a comparable rise in sterling in-
terest rates, both on Treasury bills and on local authority deposit obliga-
tions, following the 1-1/2 per cent increase in Bank Rate announced
November 18. It is likely that withdrawals of dollar supplies by buyers
of gold and Continental currencies were a factor in the Euro-dollar rate
rise. The subsequent easing reflected the calmer state of exchange markets
in recent days, and was undoubtedly pushed along by the additional supplies
of funds put into the market by German commercial banks.
For U.S. banks, the current level of the 3-month Euro-dollar
rate, 6-1/4 per cent, is high relative to the new issue rate on CD's
which is now at the 5-1/2 per cent Regulation Q ceiling.

IV - 9
Continental European interest rates have in general risen
comparatively little since November 17. The Canadilan Treasury bill rate,
abnormally high in mid-November in relation to the Bank of Canada's dis-
count rate, rose further by 1/2 per cent in the two weeks after sterling
devaluation, following the 1 per cent rise in the Canadian discount rate.
In all major industrial countries, long-term rates have changed little
since mid-November.
Forward exchange rates and covered interest rate differentials.
The discount on forward sterling, which had widened in the first half of
November to 1.6 per cent per annum on the three-month contract, settled
down during the second week after the devaluation at around 1-1/4 per cent,
with the spot rate at the $2.42 ceiling and the forward rate about $2.413.
(This week both spot and forward rates have weakened, and the forward dis-
count has widened.) With a 1-1/4 per cent discount, the covered rate differ-
ential favoring Euro-dollars over local authority deposits at the end of
last week was about 1/4 per cent. Since October 20, just after the
October 19 advance in the U.K. Bank Rate, the local authority rate has
risen a little more than the Euro-dollar rate, but the forward discount
is larger now than at that time. Thus, because of high Euro-dollar rates
and the persistence of sizable forward discounts on sterling, covered
switching from Euro-dollars into sterling has not developed.
For the German mark, the market rate of forward premium against
dollars widened to 3 per cent or more on November 24. However, since
Monday, November 27, following the Sunday decision of the Bundesbank to
offer the German commercial banks swaps at an attractive rate, the market
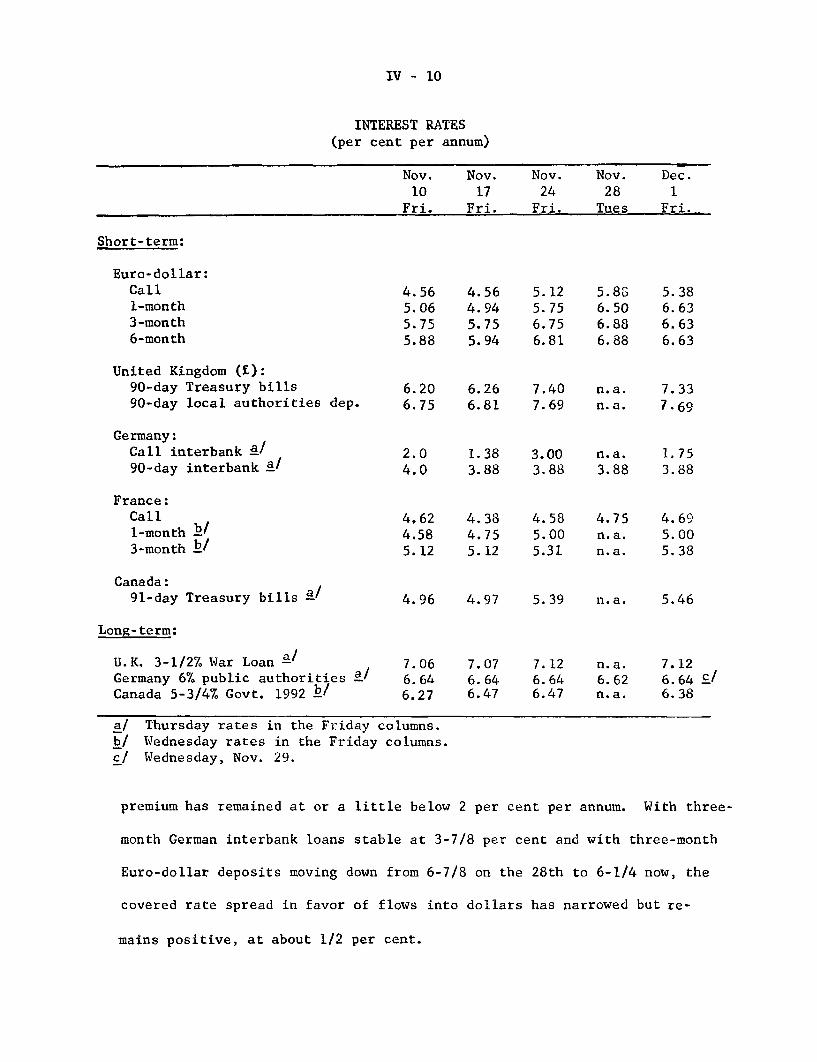
IV - 10
INTEREST RATES(per cent per annum)
Nov. Nov. Nov. Nov. Dec.10 17 24 28 1
Fri. Fri. Fri. Tues Fri.
Short-term:
Euro-dollar:Call 4.561-month 5.063-month 5.756-month 5.88
United Kingdom (f):90-day Treasury bills 6.2090-day local authorities dep. 6.75
Germany:Call interbank a / 2.090-day interbank a/ 4.0
France:Call 4,621-month b/ 4.583-month b/ 5.12
Canada:91-day Treasury bills a / 4.96
Long-term:
U.K. 3-1/2% War Loan a / 7.06Germany 6% public authorities E/ 6.64Canada 5-3/4% Govt. 1992 h/ 6.27
a/ Thursday rates in the Friday columns.b/ Wednesday rates in the Friday columns.c/ Wednesday, Nov. 29.
4.564.945.755.94
5.125.756.756.81
5.8G6.506.886.88
5.386.636.636.63
6,26 7.40 n.a. 7.336.81 7.69 n.a. 7.69
1.38 3.00 n.a. 1.753.88 3.88 3.88 3.88
4.384.755.12
4.585.005.31
4.75n.a.n.a.
4.97 5.39 n.a.
7.076.646.47
7.126.646.47
n. a.6.62n.a.
4.695.005.38
5.46
7.126.64 c/6.38
premium has remained at or a little below 2 per cent per annum. With three-
month German interbank loans stable at 3-7/8 per cent and with three-month
Euro-dollar deposits moving down from 6-7/8 on the 28th to 6-1/4 now, the
covered rate spread in favor of flows into dollars has narrowed but re-
mains positive, at about 1/2 per cent.

IV - 11
For two days last week (November 27 and 28) the Bundesbank
offered the banks swaps into dollars with a special forward premium
rate of only 1-3/4 per cent per annum as the cost of DM cover. This
gave the banks very favorable covered interest spreads (1-1/4 per cent
on three-month investments) and produced a very large outflow of funds --
contributing to the easing of Euro-dollar rates, as noted above. To
damp this outflow, which was threatening to tighten the German money market,
the Bundesbank raised its special swap rates. Effective November 29 the
rate for swaps maturing in January was raised to the relatively unattractive
level of 2-1/4 per cent, and a further increase to 2-1/2 per cent was made
on December 1. For longer swaps the Bundesbank changed its rate to 2 per
cent at first and then to 2-1/4 per cent.
It is possible that some of the $600 million of preferential
rate swaps entered into by German banks in the four days November 27-30
replaced maturing market cover, and did not put fresh money into the Euro-
dollar market. However, if the market rate for forward DM had remained
at 3 per cent or more (as might have happened in the absence of the
Bundesbank's intervention) outstanding covered investments in dollars
might not have been renewed at maturity.
Other European financial markets. Conditions in Swiss financial
markets appear to have been little affected by the sterling devaluation.
The Swiss money market began to tighten in mid-November in anticipation
of the usual end-of-year liquidity pressures and windowdressing. The
Zurich 3-month deposit rate has held at 4 per cent since the end of October,
when it rose from a low of 2.75 per cent in mid-September. In the Swiss
capital market, new issues are being well subscribed. Swiss National Bank

IV - 12
reserves declined during the first half of November, when transfers of
the Swiss banks' loan to the U.K. occurred; changed little in the state-
ment period straddling the devaluation weekend; and rose by $64 million
in the period November 24-30 inclusive.
The U.K. devaluation had no major effects on financial conditions
in Italy. Bank of Italy reserve gains in the first half of November re-
flected primarily the favorable underlying balance of payments, which
this autumn has been benefiting from German supplies of commercial credit.
Repercussions in Japan. On November 25, Japanese banks in-
creased by 1/4 per cent the interest rate on dollar import acceptance
credits. (The rate for 90-day bills with letter of credit, for example,
was increased from 7-1/2 to 7-3/4 per cent.) This followed the increase
in American bankers' acceptance rates after the U.S. discount rate in-
crease. The usual seasonal outflow of short-term capital has been inten-
sified.
The Japanese stock market in the week of November 20-25 had
one of its worst drops in years, as investors considered the possible
effects of sterling devaluation on Japanese trade, On November 20 the
stock average fell even more than the historic decline on July 19, 1963,
when President Kennedy proposed the Interest Equalization Tax.
Call loan money rates are expected to rise in December by about
one-third of a percentage point as a result of a tightening of Bank of
Japan credit to commercial banks. This would increase the over-month-end
call loan rate to 8.03 per cent, the highest level in two and a half years.
On the fiscal side, the Government reportedly plans to make
the budget for the fiscal year beginning next April more restrictive,

IV - 13
particularly by restraining the growth of public works expenditures.
This move, prompted by the British devaluation and subsequent actions,
is designed mainly as a defensive measure to reduce adverse pressures
on the balance of payments.
Stand-by credits for U.K. The British Government announced
on November 23 that new credit arrangements totalling $1.5 billion had
been worked out with foreign governments and central banks. Also, the
$1.4 billion IMF stand-by arrangement was formally approved on November 29,
after participants in the Fund's General Arrangements to Borrow (GAB)
accepted the proposed financing arrangements.
The British Government's letter of intent to the IMF stated
as one of its goals a balance of payments surplus on current and long-
term capital account at an annual rate of $480 million in the second
half of 1968, and "a further substantial rise" beyond that. (In 1967
there will have been a deficit on this basis. Swollen by extra imports
after the late-1966 removal of the surcharge, by effects of the Suez
Canal closing, and by dock strike repercussions, this deficit may exceed
$800 million.) In outlining the measures taken and to be taken to back
up the devaluation, the letter referred to the measures to restrain
domestic public and private demand and to hold back wage and price in-
creases that were announced on November 18 (see Interim Green Book,
November 25). In addition, a tentative judgment was expressed that it
would be desirable to hold the Exchequer's borrowing requirement in the
fiscal year beginning next April to not more than £1 billion. This goal,
and the measures necessary to reach it, will be reviewed with the Fund

IV - 14
staff next February, and again in July and November 1968. Finally, the
Government stated that the course of bank credit expansion "will be
taken into account in determining appropriate policy actions"; its expec-
tation at present, taking account of past and future measures, is that
the expansion "will be sufficiently limited to ensure that the growth of
money supply will be less in 1968 than the present estimate for 1967 ...
despite the expected substantial recovery of reserves."
Domestic economic conditions in Britain. The pace of economic
activity did not accelerate significantly in the months preceding devalu-
ation, so far as the available data go. Industrial production, which had
risen markedly in June and July, fell off again in August and September.
Output for the third quarter as a whole was a scant 1/4 of one per cent
higher than in the second quarter.
Unemployment fell slightly in October and November -- the first
declines in 1967 -- suggesting a resumption of last spring's recovery in
activity. However, at 2.3 per cent, the unemployment rate is only a little
below the 2.4 per cent peak reached during July and August, and is far
above the rate of 1.8 per cent in November 1966 and the rate of 1.2 per
cent which prevailed in the first half of 1966.
Price rises have been moderate since the period of severe re-
straint ended at midyear. Retail prices fell from June through September
and then rose sharply in October, but not quite up to June's level. The
index was only 2 per cent higher than in October 1966. Wholesale prices
of manufactured goods (home market sales) rose slightly less than one per
cent in the June-October period.

IV - 15
Wages shot up in July by 1.6 per cent in a single month, but
advanced less than 1 per cent over the next three months.
Concern over the depressing effect on business of the government's
already announced restrictive measures, coupled with fears that the govern-
ment will impose further restraints in the months ahead, has produced a
slide in stock prices. The Financial Times index of 30 industrials was
over 6 per cent lower yesterday (Tuesday, December 5) than it had been
the day before devaluation.
Current conditions in Germany. The beginning of recovery in
industrial orders and production which became apparent with the July data
has continued. Though the production index in August and September was
below its sharply raised July level, a new advance in October brought the
average for the third quarter to 2 per cent above that of the preceding
quarter.
German business opinion looks for a strong first quarter of
1968 -- with inventory investment stronger after the shift to the value
added tax system is made, and with construction activity picking up after
the winter season. For the final months of this year there is little
bullishness. Part of the strength in orders and output in October was
related to end-of-month deadlines for orders under the special investment
budget and also under the special depreciation allowance plan. However,
a considerable advance in nondurable goods output also occurred in October.
The Canadian economy: fiscal policy. Canada this year has been
faced with the unpleasant combination of slow industrial demand and
accelerating inflation. Pressures on prices have grown out of a combination

IV - 16
of rapid increases in wages and heavy federal budget deficits. Manu-
facturing hourly earnings rose by 8 per cent in the twelve months to
July of this year, while most studies suggest that productivity is ris-
ing less rapidly in Canada than in the United States. The current federal
budget requires financing of $1.5 billion, approximately double the
requirements of last year.
The Canadian Government has now responded to these difficulties
with a restrictive fiscal policy. On November 30 Finance Minister Sharp
announced a tax program which, in combination with restraints on expendi-
tures, will reduce next year's federal borrowing requirements to $750
million. A 10 per cent increase in liquor and tobacco taxes takes effect
immediately, and a 5 per cent surtax on personal income taxes is scheduled
for January 1. Corporate profits tax payments are to be speeded up, but
the effect of this will be offset by the beginning of refunds of the
special refundable tax on corporate profits. The repayments begin in
June 1968.
In addition to providing a restraint on aggregate demand and
an easing of pressures on financial markets, the tax program seems to be
aimed particularly at consumers; the absence of any increase in the tax
burden on corporations suggests that the government may be trying to shift
resources out of consumption and into investment.

U.S. AND INTERNATIONAL ECONOMIC DEVELOPMENTSSEASONALLY ADJUSTED
IALANCE OF PAYMENTS U S BANK CREDIT OUTFLOWSOF DOLLARS I I I 1 1 IMILLIONS OF DOLIARS
LY NOT SEASONILY EUR OPE- - 2.ED EUROPE202 \ \ 200
- -- -- - 1 ^ - -f - ^ 1 0OFFICIAL RESERVE M 4,6 1 49
TRANSACTION BASIS 200S| JAPAN
0
LATIN AMERICA
- ' - I-- /-- 1 , ,A 1200
LIQUIDITY BASIS 0 +
2 / y ALL OTHER_III I 1 ____200
1963 1965 1967 1961 1963 1965 1967
MERCHANDISE TRADE 90-DAY RATESOF DOLLARS I
n i111 35 PER CENT I
RATES ADJUSTED FOR STRIKES NOT S A NOV 29 6'
BASISOV AV (1 2 AO 305
--- --- ---- 30 EURO-DOLLARS-- 1 6
25 2
XIM PO RTS ' 5-- --- ~ ^------ 0 "Pj 3o\20
- -15 U.S. C-D'S
1963 1965 1967 1964 1965 1966 1967
RTS OF MANUFACTURES - I EXPORTS OF MANUFACTURES - III I I I3 0 =100I I I I
SHARE OF WORLD TOTAL PRICE INDEXESS--120
1967 20 6
S20 U. K. / 1966 112
W. GERMANY 167 196 1 110" W. GERMANY W. GERMANY 19 6610
U.K. I \ - f 1966 106
1967 126 .
FRANCE ._-r. I ,\ I AwFA I-P! 100
I--c-1 12/5/67
A- 1
APPENDIX A: IMPACT OF U.K. DEVALUATION ON THE U.S. BALANCE OF PAYMENTS
The most recent inter-agency projections of the U.S. balanceof payments for 1968 were made in early November, before the devaluationof sterling and before data for U.S. merchandise trade in October were
available. That projection was based on a number of assumptions that
might now be modified, including those made for GNP here and industrialproduction abroad, both of which may be too high, but for presentpurposes the reassessment in this note is confined mainly to the effectsof the U.K. devaluation.
On the liquidity basis, the projected deficit for next yearwas estimated to be well over $3 billion; no allowance was made (exceptfor the German agreement) for possible reductions in the publishedresult through special financing operations by foreign governments,partly because of their unpredictability, but also because it wasanticipated they might not be forthcoming. It now appears that thisyear's liquidity deficit, as published, will also be well over $3billion, even after deducting very large amounts of "special" receipts.
The main elements of the 1968 projection were: (1) amerchandise trade surplus of about $4-1/2 billion, about the sameas was then projected for 1967; (2) an improvement in other currentaccount items and private remittances of $1/2 million, stemminglargely from gains in investment income receipts and from eliminationof the extraordinary remittances to Israel and travel payments toCanada of 1967, partly offset by an increase in military expenditures,(3) reduced outflows of U.S. private capital of most types, though anallowance was made for larger direct investments in less-developedcountries, and (4) some increase in the rate of U.S. Government netcredits to foreigners.
In these projections no specific assumptions were made aboutthe situation of the U.K. other than to include an estimate of the rateof growth of industrial production in the U.K. Implicitly some shareof the overall increase in exports would be expected to go to the U.K.,and some share for the U.K. of the rise in U.S. imports would besimilarly implied. A summary of U.S. current transactions with theU.K. is given in Table 1. The U.K. accounts for 5.7% of U.S. exportsand 7% of U.S. imports. Assuming roughly pro rata shares of 1967-68projected changes in merchandise trade, U.S. exports to the U.K.would have risen about $125 million, and imports from the U.K. wouldhave risen by about $150 million. Receipts of income and fees wouldalso have been expected to rise about $50 million. On balance,therefore, these earlier estimates did not imply any significantchange in the U.S.-U.K. bilateral current balance between 1967 and1968. On the other hand, the projections did not allow for a major

A - 2
change in the U.K. balance of current and long-term capital transactions,which showed only a minor deficit in the first half of 1967 and couldhave shifted into a modest surplus in 1968 without a major modificationof world trade patterns. As it turned out, the basic deficit of theU.K. worsened sharply in the second half of 1967, and a substantialshift will now be necessary to meet U.K. goals as communicated to theInternational Monetary Fund.
Effects of Devaluation on U.K. Trade Balance
Although it is not the purpose of this note to evaluate thechances of the U.K. achieving a large surplus, or to enumerate theobstacles to be overcome, some rough judgments have to be made of theextent of the change in the U.K. current account that might occurbecause of devaluation and associated measures, in order to come tosome conclusions about the consequences for the United States.
It now appears that the deficit in the U.K. current accountin the second half of 1967 may be on the order of £200 million, and forthe full year about £300 million. In terms of the old exchange rate,this is a deficit for the year of about $850 million. On merchandisetrade alone (balance of payments basis) this would represent a deficitof about $1.1 billion, including exports of about $14.5 billion andimports of $15.6 billion. Before devaluation, the OECD had projectedsome improvement in the U.K. trade balance for 1968. The OECD assumeda 5.5% increase in exports (though from a 1967 export estimate thatwas probably too large) and a 3% increase in imports. In this note(see following table) the export increase to be expected is raisedslightly to 67%, but a larger increase of 5% is used for imports onthe grounds that the OECD projection assumed a slower growth rate forthe U.K. economy than was assumed in the inter-agency projection.This results in only a minor gain in the trade balance in 1968 over1967.
There is considerable debate about whether, with devaluation,domestic demand in the U.K. can be damped down enough to make room forgreatly enlarged exports, and whether U.K. exporters will aggressivelyseek larger foreign sales through price cuts and more energetic pro-motion. It seems to be the judgment of the IMF, and also of the OECDstaff, that the U.K. is likely to achieve a modest current accountsurplus for 1968, which might be taken to mean on the order of £150million, or $360 million. The full potential of the devaluation wouldbe delayed into 1969, when a current account surplus at a rate of£400-500 million is suggested, on the assumption of adequate domesticpolicy measures. However, the gain from a large deficit in 1967 toeven a modest surplus in 1968 amounts to a net shift of over $1billion (it would be even larger from the rate of the last half of1967). A further large gain for 1969 over 1968, as noted above,would therefore be a considerable achievement.

A - 3
These target levels of current account surplus for the U.K.could be reached through various combinations of export and importchanges. The choice made here is to assume that about one third ofthe gain will come from increases in exports above the levels theymight have attained without devaluation, and two thirds from reducedimports. In the following table, the U.K. export gain from year toyear in dollar terms is put at 9%, which amounts to an incrementalincrease resulting from devaluation of about 3%, added to the 6%increase that might otherwise have occurred. The total export gainfor the year would then amount to $1.3 billion, of which about $450million represents the added effect of devaluation. These rates ofexports are up sharply over the last half of 1967, when dock strikesheld down exports. Of course, the 1968 estimates make no allowancefor similar work stoppages. On the import side, it is assumed thathigher sterling prices, and measures taken to dampen internal demand,will hold the dollar cost of imports down to the 1967 amount, ratherthan the 5% gain that might have occurred. As a rough approximation,the U.K. trade balance overall in 1968 might improve by $1.3 billioncompared to the 1967 balance, and by $1.2 billion over the balancethat might have resulted without devaluation. The following sectionattempts to evaluate the direct and indirect trade effects for theU.S. of such an improvement in the U.K. trade balance.
ESTIMATE OF U.K. CURRENT ACCOUNT, 1967 AND 1968(in billions of dollars)
1 9 6 7 1 9 6 8I II Without With
1966 half half Year devalu- devalu-(est.) ation I/ ation /
Merchandise trade 3/Exports 14.3 7.5 7.0 14.5 15.4 15.8Imports (f.o.b.) 14.6 8.0 7.6 15.6 16.4 15.6
Net -. 3 -. 5 -. 6 -1.1 -1.0 +.2Other current account,net +.2 +.2 -- +.2 +.2 +.2
Total current account,balance -.2 -.3 -.6 -.9 -.8 +.4
I/ Assumes exports +6% and imports +5%, 1968 over 1967. An earlierOECD projection assumed exports +5.5% and imports +3%, 1968 over1967, but using a different 1967 estimate.
2/ Assumes exports +9% over 1967; imports are held at the 1967estimated dollar amount.
3/ As included in the balance of payments accounts.

A- 4
Effect on Trade Balance
In 1966, U.S. exports to, and imports frdm, the UnitedKingdom were roughly in balance, at about $1.7 billion each. About17 per cent of total exports to the U.K. were foodstuffs, 38 per centwere industrial materials (including tobacco) and 32 per cent werecapital goods, principally machinery. Automobiles and other consumergoods were 7 per cent of the total. In contrast about one third ofour imports from the U.K. in 1966 were automobiles and other consumergoods. Imports of industrial supplies and equipment together were50 per cent of the total and another 15 per cent were foodstuffs,mainly alcoholic beverages (see Table 2).
Most of our exports to the U.K. are not generally sensitiveto price changes since they are essential and demand for them wouldbe relatively inelastic. Food shipments are primarily determined bysupplies both in the U.K. and in other exporting countries, such asArgentina and Canada, rather than by U.K. price movements. Sales tothe U.K. of industrial supplies and equipment are primarily affectedby the rates of economic activity there, and on the capacity-utilization ratio. It can be presumed that the U.K. needs thesematerials to support industrial expansion. Alternative foreignsuppliers would offer no price advantage, unless there were widespreadprice cutting because of continued economic slack in Europe, and onlya small portion of these goods is likely to be produced domesticallyby utilizing unused capacity.
Our exports to the U.K. (excluding emergency shipments ofcrude oil resulting from the Arab-Israeli war) in 1967 increased byabout 8 per cent from 1966, despite the sluggishness of the Britisheconomy. With an economic upturn there anticipated in 1968 evenbefore the devaluation, further increases in exports to that countryof about $125 million in the coming year were expected. Withdevaluation, this increase is less likely to occur, although itseems unlikely that shipments would fall below the 1967 rate.
Exports of consumer goods (about $100 million in 1966 andholding at that rate in 1967), which are more responsive to pricechanges, can be expected to drop somewhat. Shipments of industrialmaterials (including tobacco) and equipment might also be held downtemporarily if the U.K. were to reduce inventories. (There is someindication that there was some increase in stocks of manufactures,particularly machinery, by the U.K. in the first half of 1967,possibly reflecting the abolition of U.K. import surcharges at thebeginning of the year.) Machinery and aircraft, however, are long-lead items and no immediate change in deliveries of such equipmentis to be expected. In summary, a rough guess would suggest a declineof about $100 million below previously projected exports to the U.K.

A - 5
in 1968 as the initial effect of the devaluation. If the U.K. succeedsin increasing output and export sales there is a strong possibility thatthe U.K.'s requirements for imported industrial materials and equipmentmay increase, and the U.S., which accounts for about 12 per cent of theU.K.'s total imports, can be expected to provide part of these ad-ditional imports beginning in the later part of 1968. To the extentthe anticipated increase in U.K. exports is at the expense of internaldemand, with only a very small change in total output, such a "feedback"effect would be negligible.
Imports from the United Kingdom, with about one third con-sisting of consumer goods, may be effected to a greater degree thanexports by the devaluation. Demand for consumer goods is highlyelastic and imports of such items may rise appreciably above the$600 million total purchased from the U.K. in 1966. A major question,however, is the extent to which the potential lowering of dollar pricesmade possible by the devaluation will be passed on to the U.S. importersor retained by British exporters to increase their profit margin. Inthe latter case, the dollar value of U.K. exports might be unaffectedin the short run, but promotional efforts and investment aimed atfuture export business might yield longer-run gains. First reportsindicate that the dollar price for scotch whiskey has held, with thesterling price being increased by the full 14.3 per cent of thedevaluation. This may be equally true for other commodities such asgem diamonds, where the supply is limited and demand relativelyinelastic. For still other commodities, such as metals, currentdelivery contracts are in terms of U.S. dollars. Dollar prices ofsuch commodities would not quickly be changed by the devaluation.
A basic difficulty limiting possible reductions in U.K.prices is the high dependence of the U.K. on imported raw materials.For example, in the case of woolens, the sterling price of raw woolfrom Australia, which has not devalued, can be expected to increase,and this increase, compounded by markups through the channel ofproduction, is likely to be carried through to the finished woolenproduct. The import content of total consumption in the U.K. isabout 20 per cent, and it may be higher for exports. In any case,with more aggressive marketing by the British there are likely tobe shifts among suppliers, e.g., British woolens may now competemore effectively against Italian woolens, British cars with Germancars, etc. Such substitution would not add to total imports butwould replace one foreign source by another.
Under the recent inter-agency projection, imports from theU.K. could have been expected to increase by about $150 million in1968, assuming the U.K. holds its 7 per cent share of total U.S.imports. After devaluation, a further increase of $100 millionmight be reasonable, largely in consumer goods. About $50 millionof this additional rise in imports from the U.K. might represent ashift from other foreign suppliers.

A - 6
On balance the direct effects of the devaluation may resultin a reduction of about $200 million in our trade balance with the U.K.in 1968, but this includes about $50 million of imports diverted fromother countries, so the net direct trade effect might be adverse by$150 million.
The effect of the U.K. devaluation on U.S. exports to othercountries might be of the same order of magnitude. As noted above,some gain in U.K. exports in 1968 was anticipated before devaluation,and the incremental export gain from devaluation (including not onlyprice effects but also increased sales effort) might be on the orderof $450 million.
The U.S. share of world exports of manufactured products(excluding those to the U.S. and the U.K.) was about 21 per cent in1966. On a pro rata basis, an incremental British gain of $450 mil-lion in exports of manufactured products (of which $100 million mightbe to the U.S.) could mean a loss of about $100 million in U.S.shipments to these markets. The amount of this loss could vary,depending on a number of factors. In terms of the area distributionof trade, a strong gain in U.K. export sales to Canada and LatinAmerica, where the U.S. predominates as a supplier, would have greateradverse effects on our exports than an expansion by the U.K. in
European and Asian countries where the U.S. is a less significantsupplier (see Table 5).
The reduction in income from reduced exports to the U.K. bythose countries which are traditionally large suppliers to the U.K.may also affect our trade balance. Sterling area countries, such asAustralia, India, and Pakistan, which have not devalued, may be par-ticularly hard hit. U.S. exports to those countries may drop whilethose countries try to adjust to their loss of sales in the U.K.market.
Perhaps the greatest uncertainty is the reaction ofexporters and governments in countries that compete in world marketswith U.K. manufactured goods. There is already some evidence ofconcern that local firms will be at a competitive disadvantage, andgovernments may well try to effect an offset to devaluation by ad-justing border taxes or through other means. Manufacturing firmsin some of the countries where domestic demand has not been strongand where there is unused capacity would certainly try to match anyBritish price reductions. As a consequence, U.S. exports could befaced not merely with a U.K. export drive, but also with a tendencyfor prices of competitive manufactured goods to fall relative toU.S. prices on a broad front.
It does not seem possible to quantify the effects of sucha competitive development (which would affect U.S. imports as wellas exports) but this potentiality needs to be considered in relationto cost and price developments here.

A - 7
Summing up the net effects of the sterling devaluation onthe U.S. trade balance in 1968, it is suggested here that these mightbe a $250 million incremental reduction.
Income and Fees from Investments
In recent years the U.S. has received about $400 millionper year as remittance of income, fees and royalties from directinvestment in the U.K. (Table 1). In the first half of 1967 incomereceipts were reduced, perhaps because of loTer earnings, but re-mittances may have accelerated after mid-year as a hedge againstdevaluation. As shown in Table 4, there was a sharp drop in earningsof the manufacturing affiliates in 1966, but this was reflectedprimarily in lower reinvested earnings.
The effect of devaluation, and associated U.K. measures,at least at the outset, may be to hold down sterling profits to theirrecent levels, though more may be earned on exports. Manufacturingsales of U.S. subsidiaries are primarily (2/3) within the U.K., butthe proportion exported may rise. Nevertheless, devaluation willprobably have an effect in 1968 primarily by lowering the dollarequivalent of sterling earnings and remittances. It has been assumedthat there would be a rise of some 10 per cent in U.S. direct-investmentincome and royalty receipts in 1968, which would imply a rise of about$40 million from the U.K. With the lower exchange rate, it now appearsthat these receipts might be some $50 million under expectations.
Other private income from investments in the U.K. is notvery large and is partly on dollar obligations. Income from equitysecurities, or other sterling assets, might be reduced by $5 millionor so. However, this might be more than offset by higher yields onshort-term capital. Similarly, income payments from the U.S. mightbe reduced because of some U.K. liquidations, but any rise in yieldsover the 1967 average would tend to offset such reductions.
Other Current Account
Receipts from U.K. tourists are quite small ($50-75 million)and presumably would now be somewhat smaller. U.S. tourists' ex-penditures in the U.K. are larger ($150-175 million) and probably willrise somewhat, on the theory that, while each visitor might be expectedto spend a certain amount of dollars in any case, a larger number mightbe attracted. However, if it can be assumed that most of any increasewould be at the expense of other countries (London as a substitute forParis), the net negative effect on tourism might be on the order of$20 million. Savings on military expenditures, which are over $150 mil-lion annually in the U.K., are expected to be only minimal because noreduction is likely in the large proportion of the total that representstroop pay.

A - 8
The remaining current account items are relatively minor,but on balance devaluation might reduce the dollar equivalent ofreceipts from such things as film rentals and other royalties andfees by $10 million. The foregoing estimates are summarized inTable 4.
Effect on Capital Account
The only major long-term capital flow from the UnitedStates to the U.K. in recent years has been for direct investments.That flow averaged about $2CO million annually in 1963-65, theserose to $384 million in 1966, though part of the latter amount wasprobably financed by the issuance of Euro-bonds by U.S. financingaffiliates of the companies. In the first half of 1967 the rate ofoutflow was comparable to the 1966 rate, and the latest survey ofinvestment plans for the U.K. by U.S. companies indicated a sus-tained rate of plant and equipment expenditures in 1967 and only asmall decline in 1968. Of course, the survey was conducted muchbefore devaluation.
How this flow will go in 1968 and thereafter depends verylargely on whether U.S. managements become convinced that their U.K.plant capacity can now be advantageously built up to competeeffectively in world trade. If the outcome for the U.K. currentaccount is at least as good as that assumed above, there may notbe any decline from the relatively high recent level of outflow.In fact, if the U.K. affiliates have been reducing their workingcapital in the U.K. to a bare minimum, as seems likely, there mightbe a temporary increase in the rate of outflow. Of course, ifprospects for the viability of the U.K. economy were to weakenfurther, the capital flow would be expected to decline considerably.
In a larger context, however, it may be that U.S. companieswill not alter their overall foreign investment plans as a conse-quence of events in the U.K., but will instead vary the location oftheir investments. For instance, any doubts about the future ofU.K. industry, taken together with some advantages that may beoffered by tax changes in Germany, might leave total capital flowsunchanged but with a shift toward Germany. Another considerationis in the operation of the Commerce voluntary program, which alsowould tend to set upper limits on the aggregate capital outflow.
Other private capital flows between the U.S. and the U.K.have not been important recently, apart from the use of U.K. branchesof U.S. banks as intermediaries in the Euro-dollar market.
On balance, it does not seem possible at this time toquantify the direct effect of devaluation on U.S. capital flows,except to suggest that the overall total is less likely to beaffected than the flow to the U.K. alone.
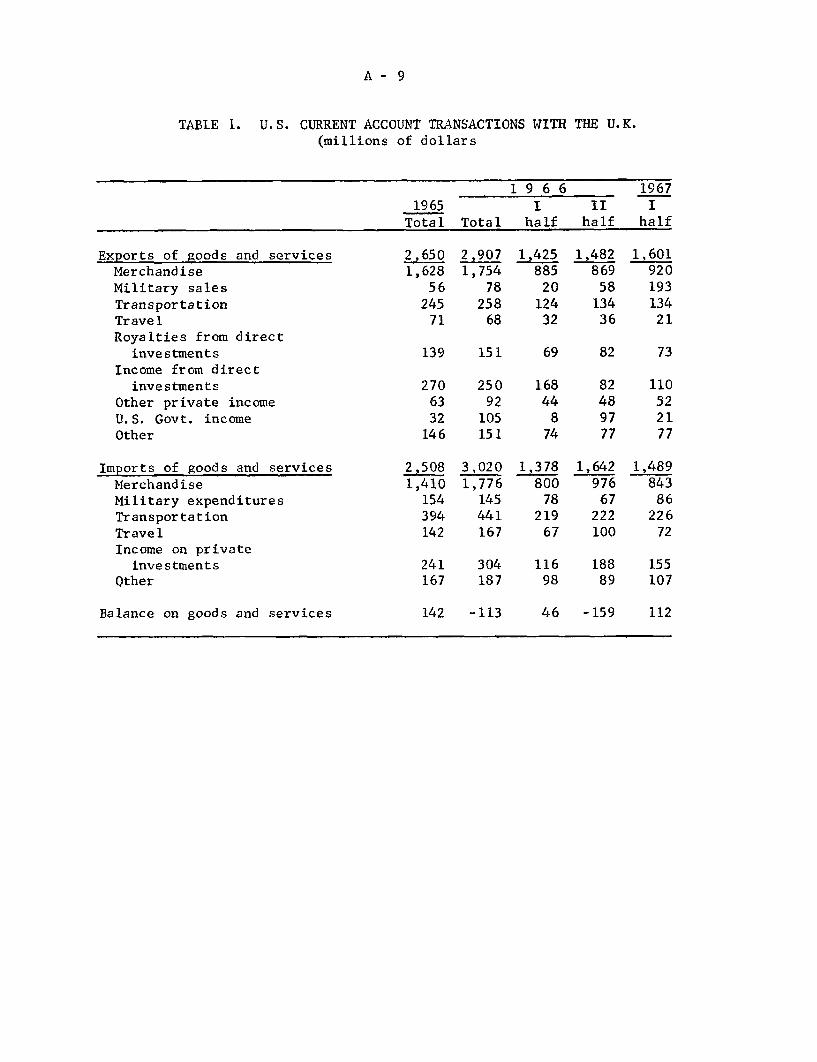
A - 9
TABLE 1. U.S. CURRENT ACCOUNT TRANSACTIONS WITH THE U.K.(millions of dollars
1 9 6 6 19671965 I II I
Total Total half half half
Exports of goods and servicesMerchandiseMilitary salesTransportationTravelRoyalties from direct
investmentsIncome from direct
investmentsOther private incomeU.S. Govt. incomeOther
Imports of goods and servicesMerchandiseMilitary expendituresTransportationTravelIncome on private
investmentsOther
Balance on goods and services
2 6501,628
5624571
2,9071,754
7825868
139 151
2706332
146
2,5081,410
154394142
25092
105151
3,0201,776
145441167
241 304167 187
142 -113
1,42588520
12432
1,48286958
13436
1,60192019313421
69 82 73
16844
874
1,37880078
21967
11698
1,64297667
222100
110522177
1,48984386
22672
188 15589 107
46 -159 112
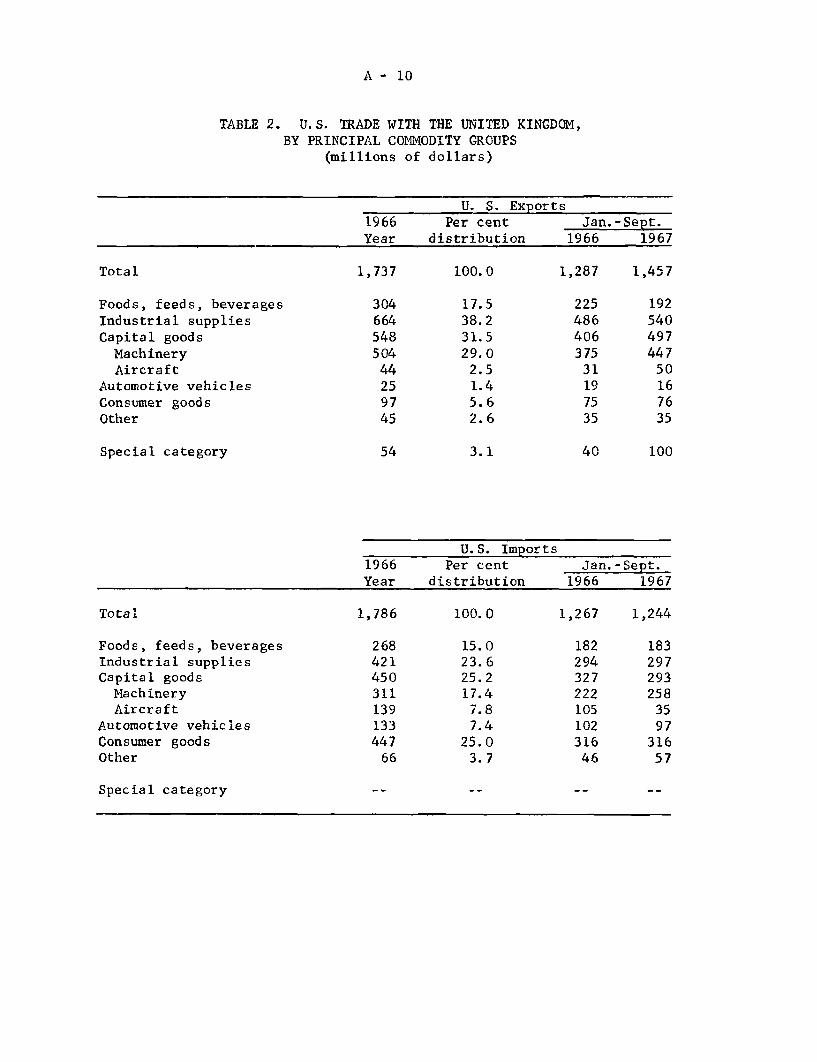
A - 10
TABLE 2. U.S. TRADE WITH THE UNITED KINGDOM,BY PRINCIPAL COMMODITY GROUPS
(millions of dollars)
U. S. Exports1966 Per cent Jan. - Sept.Year distribution 1966 1967
Total 1,737 100.0 1,287 1,457
Foods, feeds, beverages 304 17.5 225 192Industrial supplies 664 38.2 486 540Capital goods 548 31.5 406 497
Machinery 504 29.0 375 447Aircraft 44 2.5 31 50
Automotive vehicles 25 1.4 19 16Consumer goods 97 5.6 75 76Other 45 2.6 35 35
Special category 54 3.1 40 100
U.S. Imports1966 Per cent Jan.-Sept.Year distribution 1966 1967
Total 1,786 100.0 1,267 1,244
Foods, feeds, beverages 268 15.0 182 183Industrial supplies 421 23.6 294 297Capital goods 450 25.2 327 293Machinery 311 17.4 222 258Aircraft 139 7.8 105 35
Automotive vehicles 133 7.4 102 97Consumer goods 447 25.0 316 316Other 66 3.7 46 57
Special category

A - 11
TABLE 3. RECEIPTS FROM U.S. DIRECT INVESTMENTS IN THE U.K.(millions of dollars)
1 9 6 5 1 9 6 6Total Mfg. Other Total Mfg. Other
U.S. share in earningsof U.K. affiliates 498 419 79 427 359 68
Reinvested earnings 242 220 22 190 160 30U.S. receipts of dividends,
interest and profits 263 204 59 251 208 43U.S. receipts of fees and
royalties 139 n.a. n.a. 151 n.a. n.a.
Note: The sum of reinvested earnings and U.S. receipts of dividends,interest and profits does not equal the U.S. share in earningsbecause of (1) effects of tax payments, (2) the exclusion ofinterest from earnings, and (3) differing country allocationsof earnings and remittances. These data differ slightly frommore recent balance of payments data.
TABLE 4. SUMMARY OF ESTIMATED EFFECTS OF U.K. DEVALUATIONON THE U.S. BALANCE OF PAYMENTS CURRENT ACCOUNT
(in millions of dollars)
Change from earlierprojected 1968
U.S. exports to U.K. -100U.S. exports to other countries -100U.S. imports (U.K. and other countries) - 50U.S. receipts of income and fees - 50U.S. military expenditures + 10Tourism and other current account - 30
Total -320

A -12
TABLE 5. UNITED STATES AND UNITED KINGDOM SHARES OF TOTALIMPORTS OF MAJOR WORLD AREAS, 1965 AND 1966
(per cent)
1965 1 9 6 6U.S. U.K. U.S. U.K.
Canada 70.0 7.2 72.4 6.5Western Europe 11.0 7.8 10.7 7.8
Common Market 11.6 5.3 11.2 5.2Australia, New Zealand,
South Africa 20.1 28.5 20.5 27.6Latin America 43.0 4.8 43.7 4.4
Middle East 17.5 12.5 18.0 12.8Other Africa 9.7 14.8 10.3 13.4Other Asia 23.8 10.3 24.8 8.6Japan 28.9 2.0 27.9 2.3
Note: Other Africa excludes U.A.R.Other Asia excludes Middle East countries.