Embed Size (px)
Citation preview
Microstructural and metamorphic evolution of a high-pressuregranitic orthogneiss during continental subduction(Orlica–Snie _znik dome, Bohemian Massif)
F. CHOPIN,1 K. SCHULMANN,1 P. ST IPSKA ,1 J . E . MARTELAT,2 P. PITRA,3 O. LEXA4 , 5 AND B. PETRI1
1Ecole et Observatoire des Sciences de la Terre, Institut de Physique du Globe – CNRS UMR7516, Universite de Strasbourg,1 rue Blessig, F-67084, Strasbourg Cedex, France ([email protected])2Laboratoire de Geologie de Lyon – CNRS UMR5276, Universite Claude Bernard et Ecole Normale Superieure, F-69622,Villeurbanne, France3Geosciences Rennes – CNRS UMR6118, Universite Rennes 1, Campus de Beaulieu, F-35042 Rennes Cedex, France4Institute of Petrology and Structural Geology, Charles University, Albertov 6, CZ-12843 Prague 2, Czech Republic5Czech Geological Survey, Klarov 3, CZ-11821 Prague, Czech Republic
ABSTRACT A microstructural and metamorphic study of a naturally deformed medium- to high-pressure graniticorthogneiss (Orlica–Snie _znik dome, Bohemian Massif) provides evidence of behaviour of the felsic crustduring progressive burial along a subduction-type apparent thermal gradient (�10 �C km)1). Thegranitic orthogneisses develops three distinct microstructural types, as follows: type I – augenorthogneiss, type II – banded orthogneiss and type III – mylonitic orthogneiss, each representing anevolutionary stage of a progressively deformed granite. Type I orthogneiss is composed of partiallyrecrystallized K-feldspar porphyroclasts surrounded by wide fronts of myrmekite, fully recrystallizedquartz aggregates and interconnected monomineralic layers of recrystallized plagioclase. Compositionallayering in the type II orthogneiss is defined by plagioclase- and K-feldspar-rich layers, both of whichshow an increasing proportion of interstitial minerals, as well as the deformation of recrystallizedmyrmekite fronts. Type III orthogneiss shows relicts of quartz and K-feldspar ribbons preserved in afine-grained polymineralic matrix. All three types have the same assemblage (quartz + plagio-clase + K-feldspar + muscovite + biotite + garnet + sphene ± ilmenite), but show systematic vari-ations in the composition of muscovite and garnet from types I to III. This is consistent with theequilibration of the three types at different positions along a prograde P)T path ranging from<15 kbarand <700 �C (type I orthogneiss) to 19–20 kbar and >700 �C (types II and III orthogneisses). Thedeformation types thus do not represent evolutionary stages of a highly partitioned deformation atconstant P)T conditions, but reflect progressive formation during the burial of the continental crust.The microstructures of the type I and type II orthogneisses result from the dislocation creep of quartzand K-feldspar whereas a grain boundary sliding-dominated diffusion creep regime is the characteristicof the type III orthogneiss. Strain weakening related to the transition from type I to type IImicrostructures was enhanced by the recrystallization of wide myrmekite fronts, and plagioclase andquartz, and further weakening and strain localization in type III orthogneiss occurred via grainboundary sliding-enhanced diffusion creep. The potential role of incipient melting in strain localizationis discussed.
Key words: crust rheology; eclogite granitic orthogneiss; European Variscan belt; petrological modelling;quantitative microstructural analysis.
INTRODUCTION
This study concerns the metamorphism and deforma-tion of granitoids during their subduction to (ultra)-high-pressure [(U)HP] conditions. Quartzofeldspathicrocks form the most important part of the continentalcrust, and an understanding of their rheologicalbehaviour in a wide range of natural physical condi-tions is therefore the subject of many microstructuralstudies (e.g. Gapais, 1989; Handy, 1990). A detailedstudy of deformation gradients in metagranites is a
common approach to evaluate the role of strain par-titioning between minerals of contrasting rheology(Handy, 1994) and variations in mechanisms of dy-namic recrystallization in progressively strained rocks(e.g. Schulmann et al., 1996). Several studies haveshown that quartz and feldspar in metagranitesrecrystallize dynamically by dislocation creep atgreenschist facies (Shigematsu & Tanaka, 2000; Ishiiet al., 2007; Menegon et al., 2008) or amphibolite fa-cies conditions (Bose & Sengupta, 2003). At granulitefacies conditions, dislocation creep is still an important
J. metamorphic Geol., 2012, 30, 347–376 doi:10.1111/j.1525-1314.2011.00970.x
� 2012 Blackwell Publishing Ltd 34 7
deformation mechanism operating both in quartz andfeldspar (Martelat et al., 1999). At low metamorphicgrades and high finite strain, grain-size reduction andcrystallization of new minerals from aqueous fluidslead to the development of granular flow of fine-grained polyphase aggregates (Stunitz & Fitzgerald,1993; Lonka et al., 1998; Jerabek et al., 2007). Atamphibolite and granulite facies conditions and high-strain intensities, a small fraction of interstitial melt isresponsible for the transition from dislocation creep tograin boundary sliding-accommodated diffusion creep(Zavada et al., 2007; Schulmann et al., 2008).
Studies of progressive deformation in (U)HP meta-granites associated with burial of the continental crustinto great depths are rare (Lenze & Stockhert, 2007).Metagranites commonly form large boudins, which donot experience important deformation during eitherburial or exhumation (e.g. Chopin et al., 2003; Lenze &Stockhert, 2007; Hacker et al., 2010). Only locally,plastic flow operating at (U)HP conditions has beenreported, for instance in the Qinling–Dabie–Sulu oro-genic belt (Zhao et al., 2005). The lack of distributeddeformation in granitoids buried to great depths can beexplained by the low level of differential stress, or morelikely, to strain localization in narrow shear zones orweaker rock types such as (U)HP metasedimentaryroks (Stockhert & Renner, 1998; Stockhert, 2002). Inaddition, granitic orthogneisses spatially associatedwith eclogites do not typically contain mineral assem-blages characteristic of (U)HP conditions (Chopinet al., 2003; Menold et al., 2009; Peterman et al., 2009),and it is therefore not clear whether they shared thesame metamorphic evolution as coexisting rocks withthe eclogite facies assemblages (e.g. Cooke & O�Brien,2001; Stıpska et al., 2006). Consequently, no observa-tional evidence of the prograde metamorphism anddeformation of felsic rocks during burial and subduc-tion at (U)HP conditions is available.
In order to fill this gap, we examined a deformationgradient in a (U)HP eclogite-bearing granitic orthog-neiss from the Orlica–Snie _znik dome (OSD), whereeclogites generally occur as small bodies in weaklydeformed orthogneisses. In contrast, the orthogneissdirectly adjacent to the eclogite slivers show astrong strain gradient. To understand such strainlocalization, a detailed microstructural, geochemicaland petrological study was undertaken and combinedwith pseudosection modelling on granitic orthogneissesthat show a strain gradient from augen, through ban-ded to mylonitic types. The P–T conditions of defor-mation were estimated and various deformationmechanisms in the orthogneisses identified. Possiblereasons for major strain localization during continen-tal subduction are discussed.
GEOLOGICAL SETTING
The OSD is situated in the northeastern termination ofthe North European Variscan belt (Bohemian Massif,
Central Sudetes) at the contact with the Brunia mi-crocontinent (Aleksandrowski & Mazur, 2002; Mazuret al., 2006; Fig. 1a). It is composed of belts of high-grade granitoid orthogneiss, sometimes cored by(U)HP eclogites rocks (Brocker & Klemd, 1996;Stıpska et al., 2004, 2012), and surrounded byamphibolite facies metasedimentary rocks, togetherforming the Moldanubian root of the Variscan orogen(Fig. 1b; Chopin et al., 2012). The dome is mantled bysupercrustal units of supposed Neo-Proterozoic age inthe south (the Nove Mesto and Zabreh units; Mazur &Aleksandrowski, 2001) and by relicts of Cambro–Ordovician rift sequences (the Stare Mesto unit; Parryet al., 1997; Kroner et al., 2000; Stıpska et al., 2001)that collided with the Brunia microcontinent in the east(Schulmann & Gayer, 2000; Stıpska et al., 2006;Kosulicova & Stıpska, 2007). The protoliths of theorthogneisses and the metasedimententary rocks havea Cambro–Ordovician (Kroner et al., 2001) and Neo-proterozoic to Lower Ordovician origin (Jastrzebskiet al., 2010; Mazur et al., 2012) respectively. The pro-tolith age of the (U)HP rocks remains controversial(Anczkiewicz et al., 2007; Brocker et al., 2010).40Ar ⁄ 39Ar cooling ages of hornblende and mica(Chopin et al., 2012 and references therein), Rb ⁄ Srmetamorphic ages and U–Pb ages on metamorphiczircon (e.g. Brocker et al., 2009) from both theorthogneisses and the metasedimentary rocks cluster atc. 340 Ma. Recent studies have determined a succes-sion of three main episodes of deformation within anorogenic accretionnary wedge as represented by theOSD (Stıpska et al., 2004, 2012; Jastrzebski, 2009;Skrzypek et al., 2012; Chopin et al., 2012) as follows:(i) D1 is represented by the remnants of an earlyVariscan subhorizontal fabrics related to the penetra-tion of the Saxothuringian crust into the thickenedorogenic root, which is associated with N–S orogenicflow parallel to the eastern border of the Bruniapromontory (Fig. 1a); (ii) D2 is represented by sub-vertical structures associated with crustal scale foldingdue to E–W lateral shortening; and (iii) finally, bothtypes of fabrics are overprinted by a ubiquitous sub-horizontal fabric (D3) developed during ductile thin-ning and unroofing of the thickened crustal root.The study area is located around the town of
Miedzygorze, at the eastern periphery of the eclogitebelt (Smulikowski, 1967; Dumicz, 1989, 1993; Fig. 1c).In this area, (U)HP conditions for orthogneisses havebeen proposed by Brocker & Klemd (1996) based oninferred coesite pseudomorphs. Here, the early sub-horizontal fabric S1 is well preserved in the graniticorthogneiss that shows various macroscopic texturalvarieties ranging from augen orthogneiss (referred toas the Snie _znik type in the literature; e.g. Fischer, 1936)to banded and fine-grained mylonitic orthogneiss (theGieratow type). The foliation S1 and the N–S lineationL1 are defined by recrystallized augen and bands ofquartz, plagioclase and K-feldspar, and by the pre-ferred orientation of mica. The top-to-the-north sense
3 48 F . C H O P I N E T A L .
� 2012 Blackwell Publishing Ltd
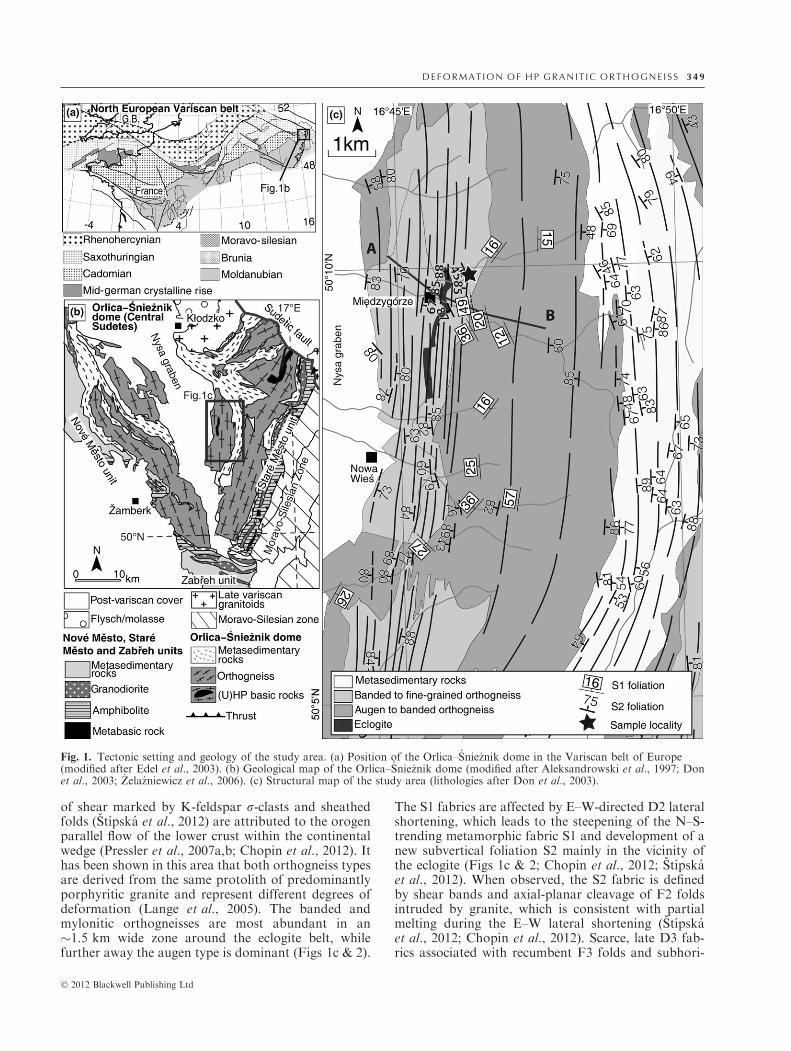
of shear marked by K-feldspar r-clasts and sheathedfolds (Stıpska et al., 2012) are attributed to the orogenparallel flow of the lower crust within the continentalwedge (Pressler et al., 2007a,b; Chopin et al., 2012). Ithas been shown in this area that both orthogneiss typesare derived from the same protolith of predominantlyporphyritic granite and represent different degrees ofdeformation (Lange et al., 2005). The banded andmylonitic orthogneisses are most abundant in an�1.5 km wide zone around the eclogite belt, whilefurther away the augen type is dominant (Figs 1c & 2).
The S1 fabrics are affected by E–W-directed D2 lateralshortening, which leads to the steepening of the N–S-trending metamorphic fabric S1 and development of anew subvertical foliation S2 mainly in the vicinity ofthe eclogite (Figs 1c & 2; Chopin et al., 2012; Stıpskaet al., 2012). When observed, the S2 fabric is definedby shear bands and axial-planar cleavage of F2 foldsintruded by granite, which is consistent with partialmelting during the E–W lateral shortening (Stıpskaet al., 2012; Chopin et al., 2012). Scarce, late D3 fab-rics associated with recumbent F3 folds and subhori-
Fig. 1. Tectonic setting and geology of the study area. (a) Position of the Orlica–Snie _znik dome in the Variscan belt of Europe(modified after Edel et al., 2003). (b) Geological map of the Orlica–Snie_znik dome (modified after Aleksandrowski et al., 1997; Donet al., 2003; _Zelazniewicz et al., 2006). (c) Structural map of the study area (lithologies after Don et al., 2003).
D E F O R M A T I O N O F HP G R A N I T I C O RT HO GN E I SS 34 9
� 2012 Blackwell Publishing Ltd
zontal centimetre-scale shear zones affect the S2 fabrics(Stıpska et al., 2012; Chopin et al., 2012).
Definition of structural types according to the finite straingradient
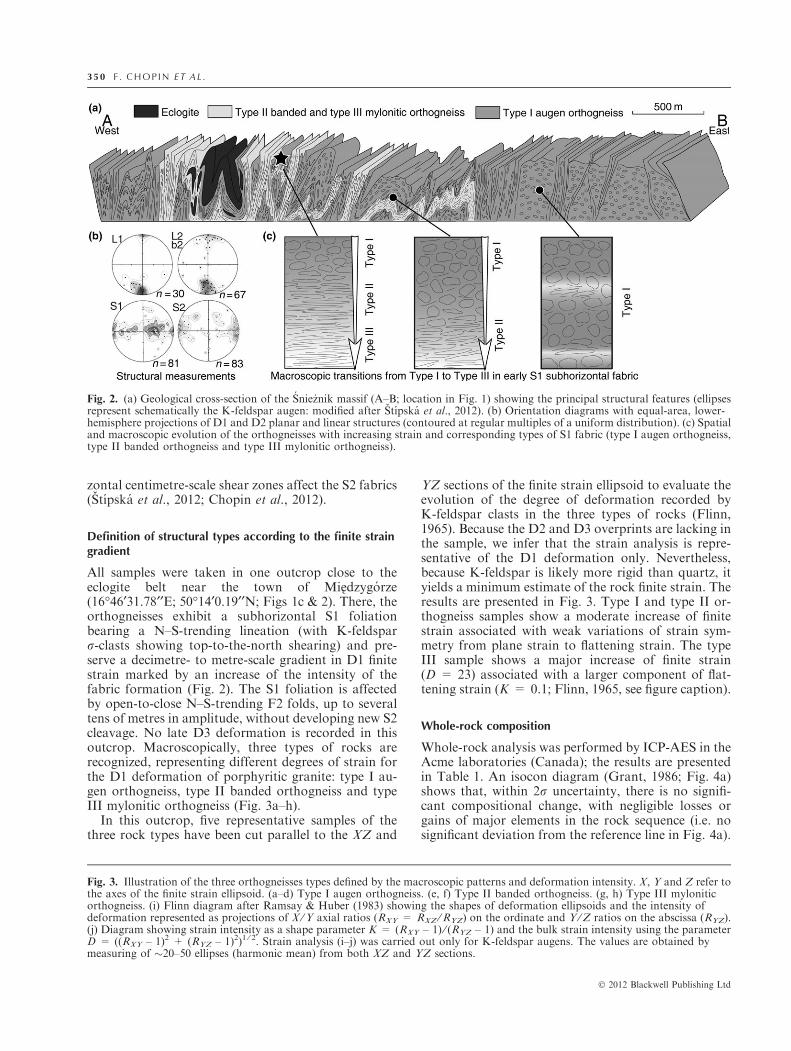
All samples were taken in one outcrop close to theeclogite belt near the town of Miedzygorze(16�46¢31.78¢¢E; 50�14¢0.19¢¢N; Figs 1c & 2). There, theorthogneisses exhibit a subhorizontal S1 foliationbearing a N–S-trending lineation (with K-feldsparr-clasts showing top-to-the-north shearing) and pre-serve a decimetre- to metre-scale gradient in D1 finitestrain marked by an increase of the intensity of thefabric formation (Fig. 2). The S1 foliation is affectedby open-to-close N–S-trending F2 folds, up to severaltens of metres in amplitude, without developing new S2cleavage. No late D3 deformation is recorded in thisoutcrop. Macroscopically, three types of rocks arerecognized, representing different degrees of strain forthe D1 deformation of porphyritic granite: type I au-gen orthogneiss, type II banded orthogneiss and typeIII mylonitic orthogneiss (Fig. 3a–h).
In this outcrop, five representative samples of thethree rock types have been cut parallel to the XZ and
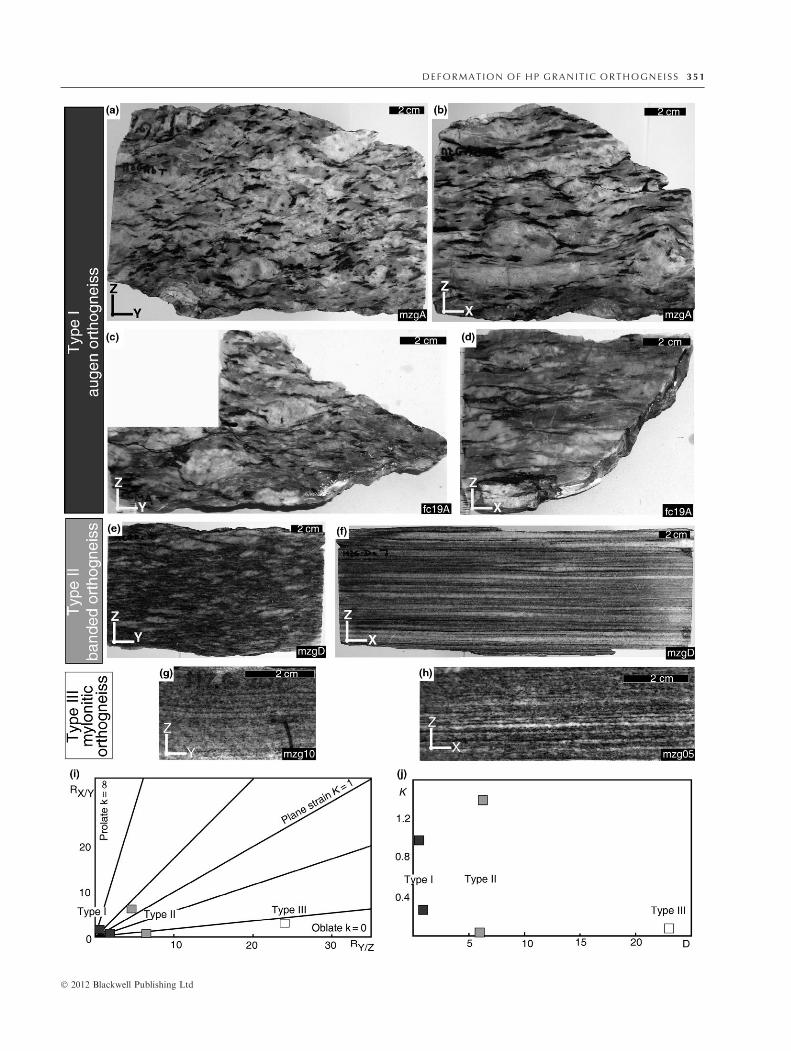
YZ sections of the finite strain ellipsoid to evaluate theevolution of the degree of deformation recorded byK-feldspar clasts in the three types of rocks (Flinn,1965). Because the D2 and D3 overprints are lacking inthe sample, we infer that the strain analysis is repre-sentative of the D1 deformation only. Nevertheless,because K-feldspar is likely more rigid than quartz, ityields a minimum estimate of the rock finite strain. Theresults are presented in Fig. 3. Type I and type II or-thogneiss samples show a moderate increase of finitestrain associated with weak variations of strain sym-metry from plane strain to flattening strain. The typeIII sample shows a major increase of finite strain(D = 23) associated with a larger component of flat-tening strain (K = 0.1; Flinn, 1965, see figure caption).
Whole-rock composition
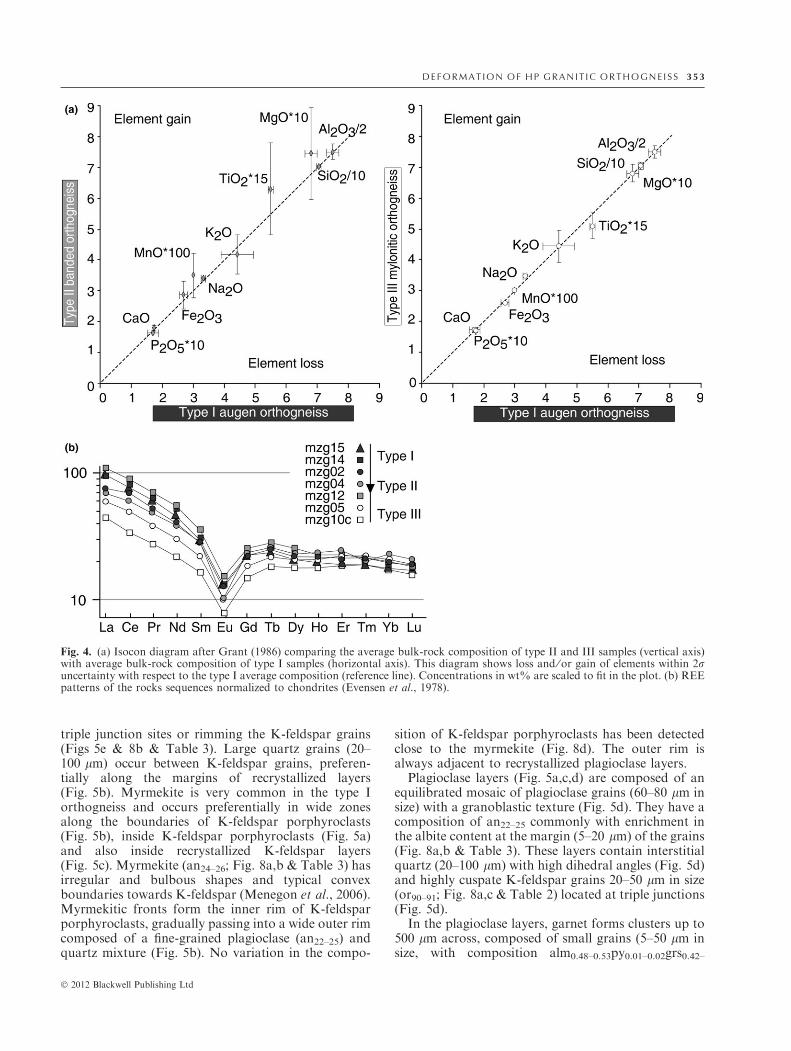
Whole-rock analysis was performed by ICP-AES in theAcme laboratories (Canada); the results are presentedin Table 1. An isocon diagram (Grant, 1986; Fig. 4a)shows that, within 2r uncertainty, there is no signifi-cant compositional change, with negligible losses orgains of major elements in the rock sequence (i.e. nosignificant deviation from the reference line in Fig. 4a).
Fig. 2. (a) Geological cross-section of the Snie _znik massif (A–B; location in Fig. 1) showing the principal structural features (ellipsesrepresent schematically the K-feldspar augen: modified after Stıpska et al., 2012). (b) Orientation diagrams with equal-area, lower-hemisphere projections of D1 and D2 planar and linear structures (contoured at regular multiples of a uniform distribution). (c) Spatialand macroscopic evolution of the orthogneisses with increasing strain and corresponding types of S1 fabric (type I augen orthogneiss,type II banded orthogneiss and type III mylonitic orthogneiss).
Fig. 3. Illustration of the three orthogneisses types defined by the macroscopic patterns and deformation intensity. X, Y and Z refer tothe axes of the finite strain ellipsoid. (a–d) Type I augen orthogneiss. (e, f) Type II banded orthogneiss. (g, h) Type III myloniticorthogneiss. (i) Flinn diagram after Ramsay & Huber (1983) showing the shapes of deformation ellipsoids and the intensity ofdeformation represented as projections of X ⁄Y axial ratios (RXY = RXZ ⁄RYZ) on the ordinate and Y ⁄Z ratios on the abscissa (RYZ).(j) Diagram showing strain intensity as a shape parameter K = (RXY – 1) ⁄ (RYZ – 1) and the bulk strain intensity using the parameterD = ((RXY – 1)2 + (RYZ – 1)2)1 ⁄ 2. Strain analysis (i–j) was carried out only for K-feldspar augens. The values are obtained bymeasuring of �20–50 ellipses (harmonic mean) from both XZ and YZ sections.
3 50 F . C H O P I N E T A L .
� 2012 Blackwell Publishing Ltd
D E F O R M A T I O N O F HP G R A N I T I C O RT HO GN E I SS 35 1
� 2012 Blackwell Publishing Ltd
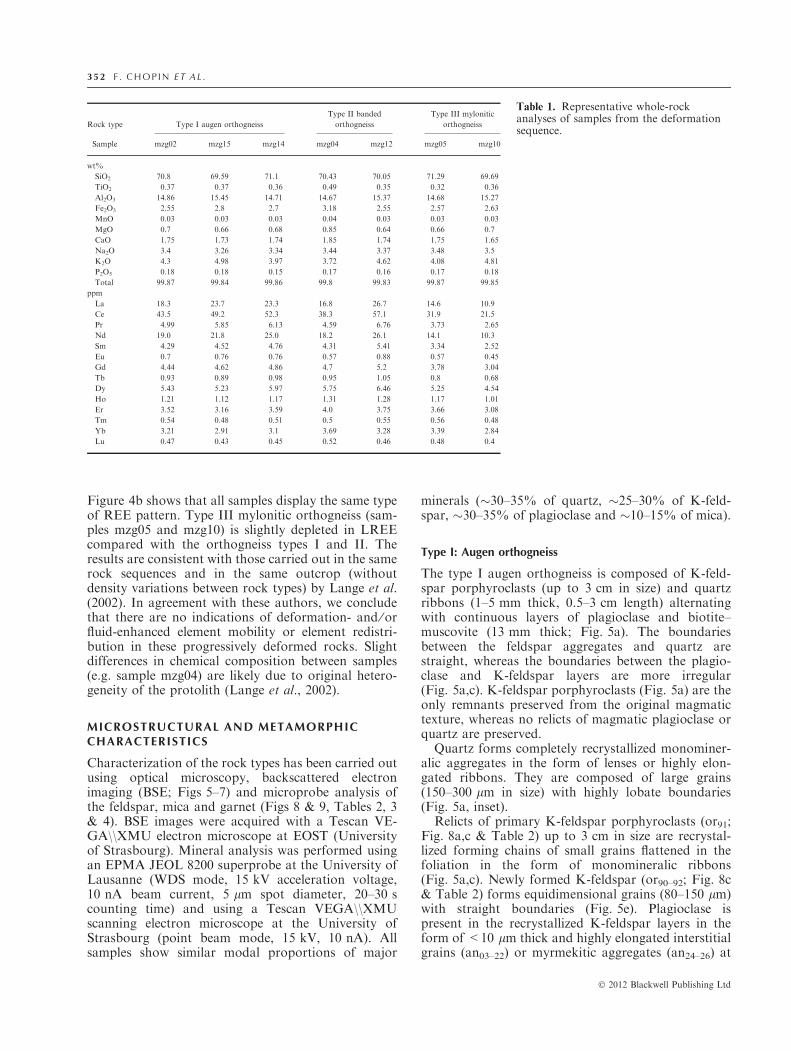
Figure 4b shows that all samples display the same typeof REE pattern. Type III mylonitic orthogneiss (sam-ples mzg05 and mzg10) is slightly depleted in LREEcompared with the orthogneiss types I and II. Theresults are consistent with those carried out in the samerock sequences and in the same outcrop (withoutdensity variations between rock types) by Lange et al.(2002). In agreement with these authors, we concludethat there are no indications of deformation- and ⁄ orfluid-enhanced element mobility or element redistri-bution in these progressively deformed rocks. Slightdifferences in chemical composition between samples(e.g. sample mzg04) are likely due to original hetero-geneity of the protolith (Lange et al., 2002).
MICROSTRUCTURAL AND METAMORPHICCHARACTERISTICS
Characterization of the rock types has been carried outusing optical microscopy, backscattered electronimaging (BSE; Figs 5–7) and microprobe analysis ofthe feldspar, mica and garnet (Figs 8 & 9, Tables 2, 3& 4). BSE images were acquired with a Tescan VE-GA\\XMU electron microscope at EOST (Universityof Strasbourg). Mineral analysis was performed usingan EPMA JEOL 8200 superprobe at the University ofLausanne (WDS mode, 15 kV acceleration voltage,10 nA beam current, 5 lm spot diameter, 20–30 scounting time) and using a Tescan VEGA\\XMUscanning electron microscope at the University ofStrasbourg (point beam mode, 15 kV, 10 nA). Allsamples show similar modal proportions of major
minerals (�30–35% of quartz, �25–30% of K-feld-spar, �30–35% of plagioclase and �10–15% of mica).
Type I: Augen orthogneiss
The type I augen orthogneiss is composed of K-feld-spar porphyroclasts (up to 3 cm in size) and quartzribbons (1–5 mm thick, 0.5–3 cm length) alternatingwith continuous layers of plagioclase and biotite–muscovite (13 mm thick; Fig. 5a). The boundariesbetween the feldspar aggregates and quartz arestraight, whereas the boundaries between the plagio-clase and K-feldspar layers are more irregular(Fig. 5a,c). K-feldspar porphyroclasts (Fig. 5a) are theonly remnants preserved from the original magmatictexture, whereas no relicts of magmatic plagioclase orquartz are preserved.Quartz forms completely recrystallized monominer-
alic aggregates in the form of lenses or highly elon-gated ribbons. They are composed of large grains(150–300 lm in size) with highly lobate boundaries(Fig. 5a, inset).Relicts of primary K-feldspar porphyroclasts (or91;
Fig. 8a,c & Table 2) up to 3 cm in size are recrystal-lized forming chains of small grains flattened in thefoliation in the form of monomineralic ribbons(Fig. 5a,c). Newly formed K-feldspar (or90–92; Fig. 8c& Table 2) forms equidimensional grains (80–150 lm)with straight boundaries (Fig. 5e). Plagioclase ispresent in the recrystallized K-feldspar layers in theform of <10 lm thick and highly elongated interstitialgrains (an03–22) or myrmekitic aggregates (an24–26) at
Table 1. Representative whole-rockanalyses of samples from the deformationsequence.
Rock type Type I augen orthogneiss
Type II banded
orthogneiss
Type III mylonitic
orthogneiss
Sample mzg02 mzg15 mzg14 mzg04 mzg12 mzg05 mzg10
wt%
SiO2 70.8 69.59 71.1 70.43 70.05 71.29 69.69
TiO2 0.37 0.37 0.36 0.49 0.35 0.32 0.36
Al2O3 14.86 15.45 14.71 14.67 15.37 14.68 15.27
Fe2O3 2.55 2.8 2.7 3.18 2.55 2.57 2.63
MnO 0.03 0.03 0.03 0.04 0.03 0.03 0.03
MgO 0.7 0.66 0.68 0.85 0.64 0.66 0.7
CaO 1.75 1.73 1.74 1.85 1.74 1.75 1.65
Na2O 3.4 3.26 3.34 3.44 3.37 3.48 3.5
K2O 4.3 4.98 3.97 3.72 4.62 4.08 4.81
P2O5 0.18 0.18 0.15 0.17 0.16 0.17 0.18
Total 99.87 99.84 99.86 99.8 99.83 99.87 99.85
ppm
La 18.3 23.7 23.3 16.8 26.7 14.6 10.9
Ce 43.5 49.2 52.3 38.3 57.1 31.9 21.5
Pr 4.99 5.85 6.13 4.59 6.76 3.73 2.65
Nd 19.0 21.8 25.0 18.2 26.1 14.1 10.3
Sm 4.29 4.52 4.76 4.31 5.41 3.34 2.52
Eu 0.7 0.76 0.76 0.57 0.88 0.57 0.45
Gd 4.44 4.62 4.86 4.7 5.2 3.78 3.04
Tb 0.93 0.89 0.98 0.95 1.05 0.8 0.68
Dy 5.43 5.23 5.97 5.75 6.46 5.25 4.54
Ho 1.21 1.12 1.17 1.31 1.28 1.17 1.01
Er 3.52 3.16 3.59 4.0 3.75 3.66 3.08
Tm 0.54 0.48 0.51 0.5 0.55 0.56 0.48
Yb 3.21 2.91 3.1 3.69 3.28 3.39 2.84
Lu 0.47 0.43 0.45 0.52 0.46 0.48 0.4
3 52 F . C H O P I N E T A L .
� 2012 Blackwell Publishing Ltd
triple junction sites or rimming the K-feldspar grains(Figs 5e & 8b & Table 3). Large quartz grains (20–100 lm) occur between K-feldspar grains, preferen-tially along the margins of recrystallized layers(Fig. 5b). Myrmekite is very common in the type Iorthogneiss and occurs preferentially in wide zonesalong the boundaries of K-feldspar porphyroclasts(Fig. 5b), inside K-feldspar porphyroclasts (Fig. 5a)and also inside recrystallized K-feldspar layers(Fig. 5c). Myrmekite (an24–26; Fig. 8a,b & Table 3) hasirregular and bulbous shapes and typical convexboundaries towards K-feldspar (Menegon et al., 2006).Myrmekitic fronts form the inner rim of K-feldsparporphyroclasts, gradually passing into a wide outer rimcomposed of a fine-grained plagioclase (an22–25) andquartz mixture (Fig. 5b). No variation in the compo-
sition of K-feldspar porphyroclasts has been detectedclose to the myrmekite (Fig. 8d). The outer rim isalways adjacent to recrystallized plagioclase layers.
Plagioclase layers (Fig. 5a,c,d) are composed of anequilibrated mosaic of plagioclase grains (60–80 lm insize) with a granoblastic texture (Fig. 5d). They have acomposition of an22–25 commonly with enrichment inthe albite content at the margin (5–20 lm) of the grains(Fig. 8a,b & Table 3). These layers contain interstitialquartz (20–100 lm) with high dihedral angles (Fig. 5d)and highly cuspate K-feldspar grains 20–50 lm in size(or90–91; Fig. 8a,c & Table 2) located at triple junctions(Fig. 5d).
In the plagioclase layers, garnet forms clusters up to500 lm across, composed of small grains (5–50 lm insize, with composition alm0.48–0.53py0.01–0.02grs0.42–
Fig. 4. (a) Isocon diagram after Grant (1986) comparing the average bulk-rock composition of type II and III samples (vertical axis)with average bulk-rock composition of type I samples (horizontal axis). This diagram shows loss and ⁄ or gain of elements within 2runcertainty with respect to the type I average composition (reference line). Concentrations in wt% are scaled to fit in the plot. (b) REEpatterns of the rocks sequences normalized to chondrites (Evensen et al., 1978).
D E F O R M A T I O N O F HP G R A N I T I C O RT HO GN E I SS 35 3
� 2012 Blackwell Publishing Ltd
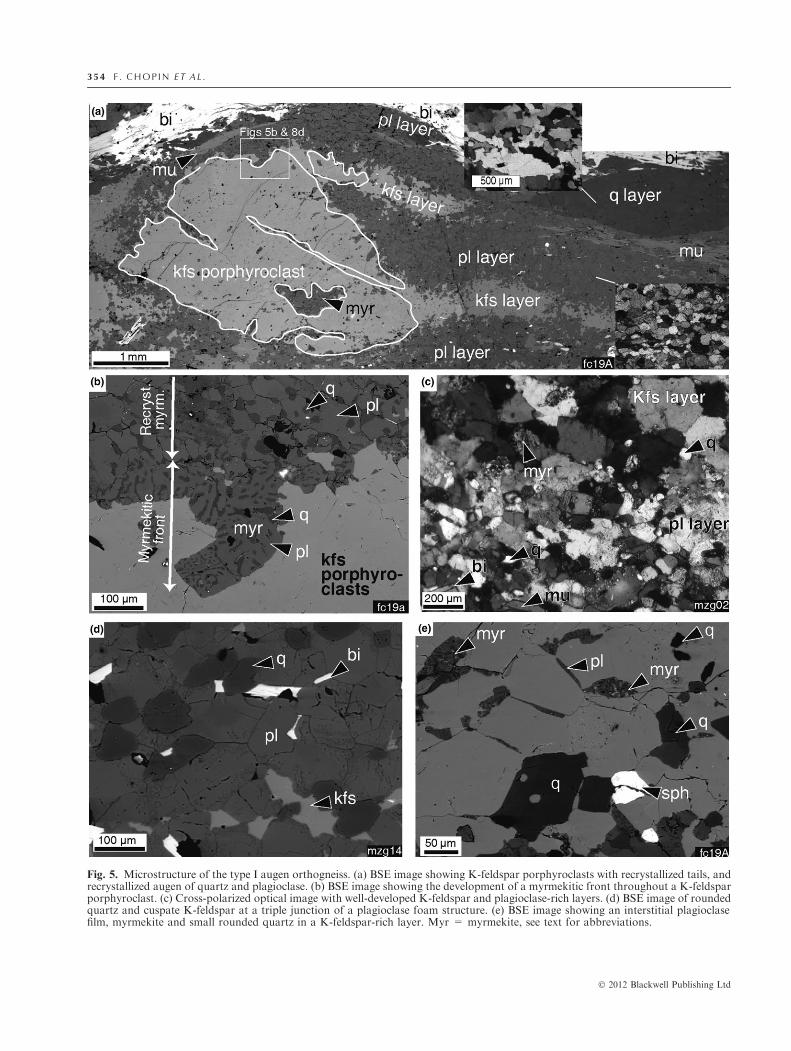
Fig. 5. Microstructure of the type I augen orthogneiss. (a) BSE image showing K-feldspar porphyroclasts with recrystallized tails, andrecrystallized augen of quartz and plagioclase. (b) BSE image showing the development of a myrmekitic front throughout a K-feldsparporphyroclast. (c) Cross-polarized optical image with well-developed K-feldspar and plagioclase-rich layers. (d) BSE image of roundedquartz and cuspate K-feldspar at a triple junction of a plagioclase foam structure. (e) BSE image showing an interstitial plagioclasefilm, myrmekite and small rounded quartz in a K-feldspar-rich layer. Myr = myrmekite, see text for abbreviations.
3 54 F . C H O P I N E T A L .
� 2012 Blackwell Publishing Ltd
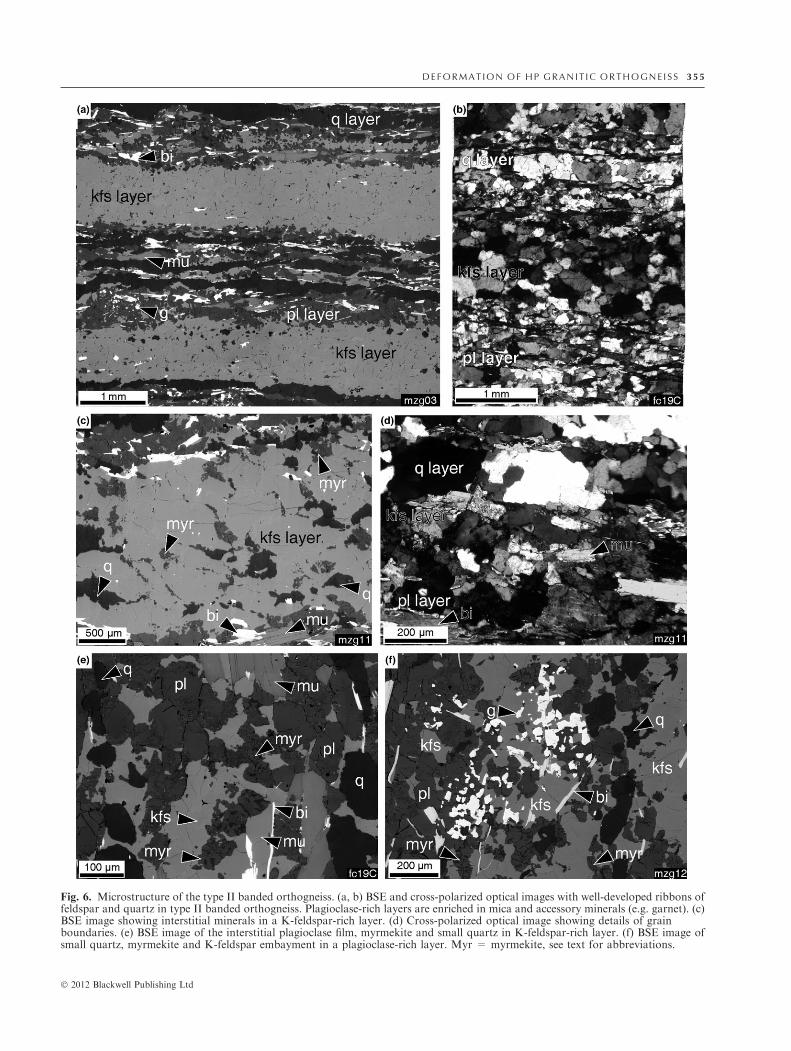
Fig. 6. Microstructure of the type II banded orthogneiss. (a, b) BSE and cross-polarized optical images with well-developed ribbons offeldspar and quartz in type II banded orthogneiss. Plagioclase-rich layers are enriched in mica and accessory minerals (e.g. garnet). (c)BSE image showing interstitial minerals in a K-feldspar-rich layer. (d) Cross-polarized optical image showing details of grainboundaries. (e) BSE image of the interstitial plagioclase film, myrmekite and small quartz in K-feldspar-rich layer. (f) BSE image ofsmall quartz, myrmekite and K-feldspar embayment in a plagioclase-rich layer. Myr = myrmekite, see text for abbreviations.
D E F O R M A T I O N O F HP G R A N I T I C O RT HO GN E I SS 35 5
� 2012 Blackwell Publishing Ltd
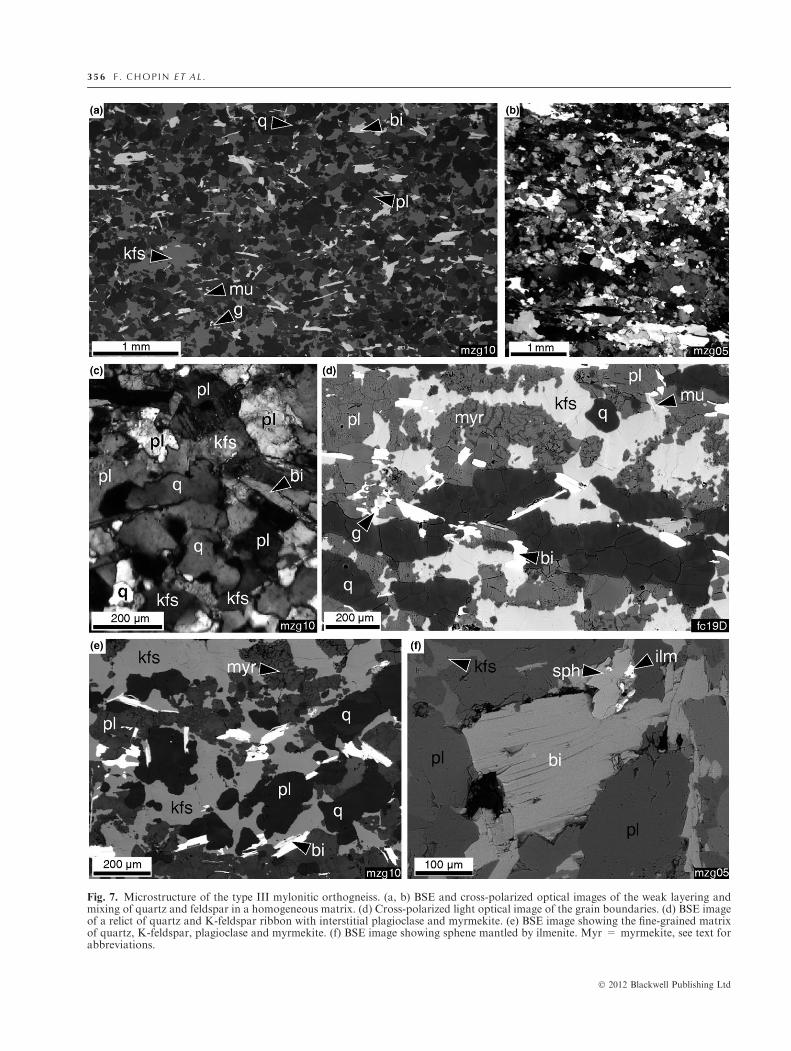
Fig. 7. Microstructure of the type III mylonitic orthogneiss. (a, b) BSE and cross-polarized optical images of the weak layering andmixing of quartz and feldspar in a homogeneous matrix. (d) Cross-polarized light optical image of the grain boundaries. (d) BSE imageof a relict of quartz and K-feldspar ribbon with interstitial plagioclase and myrmekite. (e) BSE image showing the fine-grained matrixof quartz, K-feldspar, plagioclase and myrmekite. (f) BSE image showing sphene mantled by ilmenite. Myr = myrmekite, see text forabbreviations.
3 56 F . C H O P I N E T A L .
� 2012 Blackwell Publishing Ltd
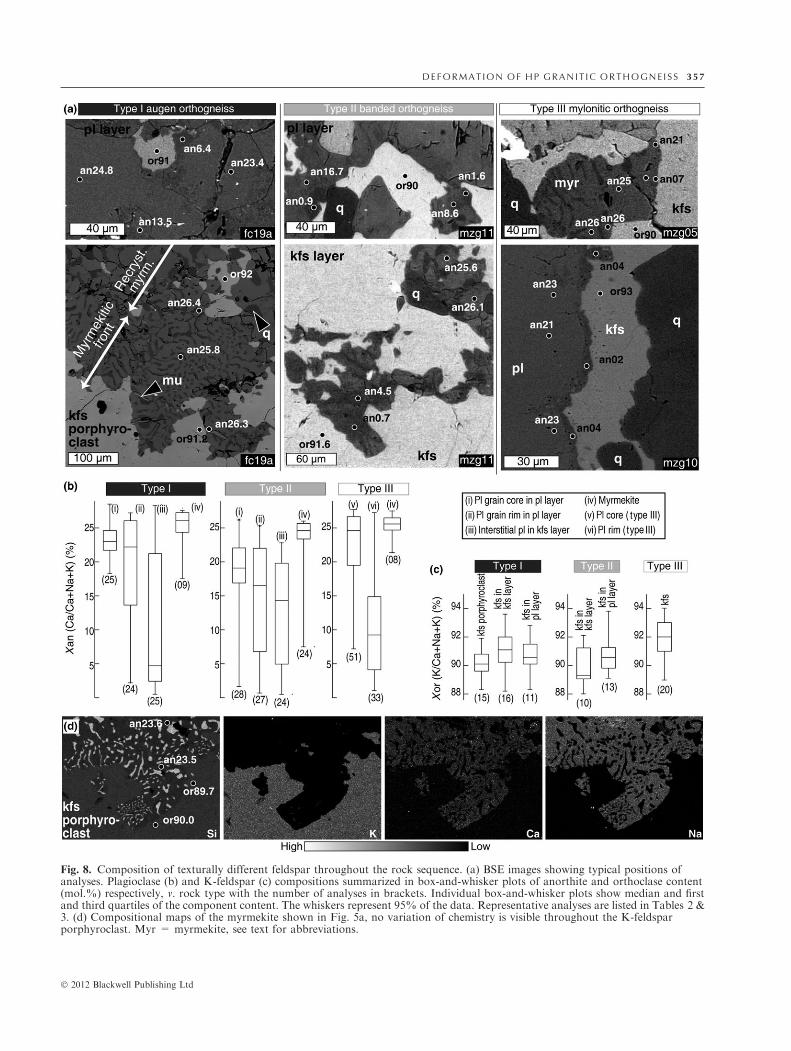
Fig. 8. Composition of texturally different feldspar throughout the rock sequence. (a) BSE images showing typical positions ofanalyses. Plagioclase (b) and K-feldspar (c) compositions summarized in box-and-whisker plots of anorthite and orthoclase content(mol.%) respectively, v. rock type with the number of analyses in brackets. Individual box-and-whisker plots show median and firstand third quartiles of the component content. The whiskers represent 95% of the data. Representative analyses are listed in Tables 2 &3. (d) Compositional maps of the myrmekite shown in Fig. 5a, no variation of chemistry is visible throughout the K-feldsparporphyroclast. Myr = myrmekite, see text for abbreviations.
D E F O R M A T I O N O F HP G R A N I T I C O RT HO GN E I SS 35 7
� 2012 Blackwell Publishing Ltd
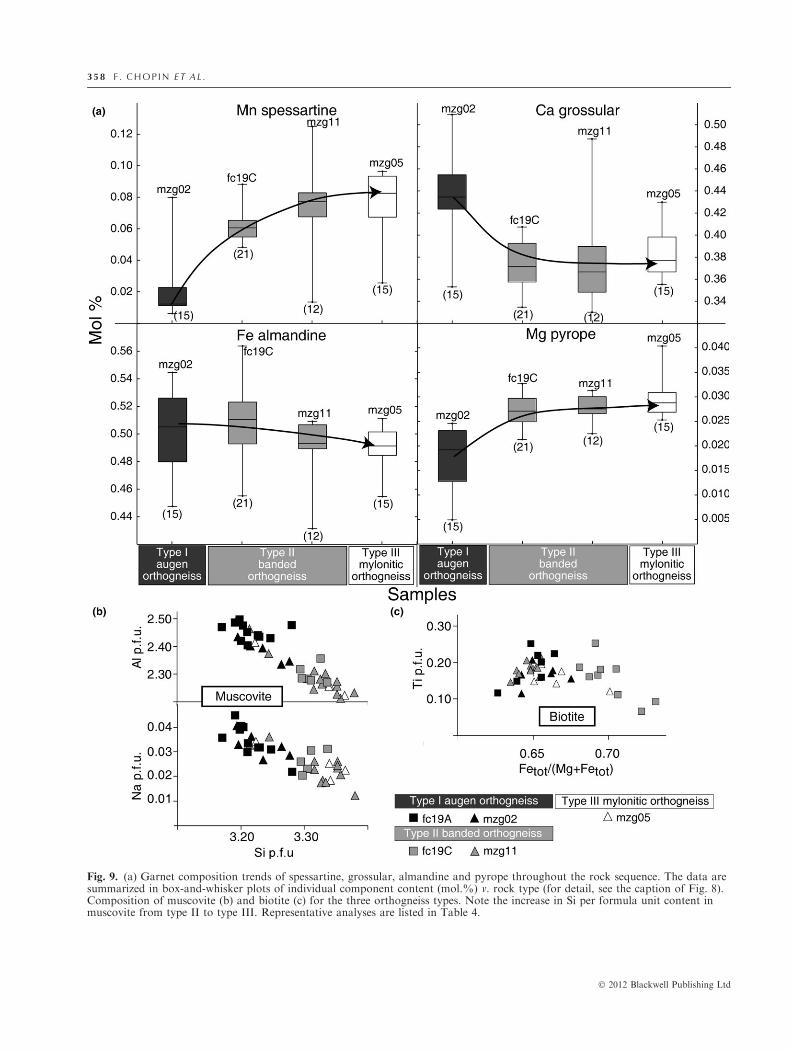
Fig. 9. (a) Garnet composition trends of spessartine, grossular, almandine and pyrope throughout the rock sequence. The data aresummarized in box-and-whisker plots of individual component content (mol.%) v. rock type (for detail, see the caption of Fig. 8).Composition of muscovite (b) and biotite (c) for the three orthogneiss types. Note the increase in Si per formula unit content inmuscovite from type II to type III. Representative analyses are listed in Table 4.
3 58 F . C H O P I N E T A L .
� 2012 Blackwell Publishing Ltd
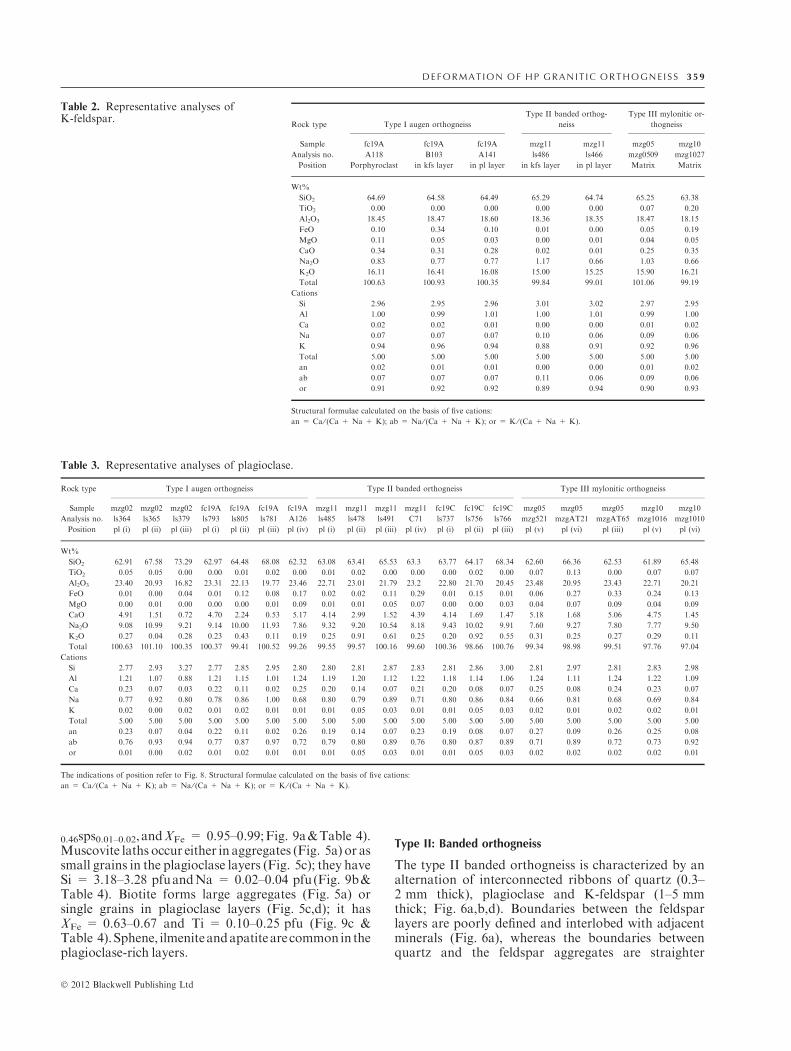
0.46sps0.01–0.02, andXFe = 0.95–0.99;Fig. 9a&Table 4).Muscovite laths occur either in aggregates (Fig. 5a) or assmall grains in the plagioclase layers (Fig. 5c); they haveSi = 3.18–3.28 pfuandNa = 0.02–0.04 pfu(Fig. 9b&Table 4). Biotite forms large aggregates (Fig. 5a) orsingle grains in plagioclase layers (Fig. 5c,d); it hasXFe = 0.63–0.67 and Ti = 0.10–0.25 pfu (Fig. 9c &Table 4).Sphene, ilmeniteandapatitearecommon in theplagioclase-rich layers.
Type II: Banded orthogneiss
The type II banded orthogneiss is characterized by analternation of interconnected ribbons of quartz (0.3–2 mm thick), plagioclase and K-feldspar (1–5 mmthick; Fig. 6a,b,d). Boundaries between the feldsparlayers are poorly defined and interlobed with adjacentminerals (Fig. 6a), whereas the boundaries betweenquartz and the feldspar aggregates are straighter
Table 2. Representative analyses ofK-feldspar.
Rock type Type I augen orthogneiss
Type II banded orthog-
neiss
Type III mylonitic or-
thogneiss
Sample fc19A fc19A fc19A mzg11 mzg11 mzg05 mzg10
Analysis no. A118 B103 A141 ls486 ls466 mzg0509 mzg1027
Position Porphyroclast in kfs layer in pl layer in kfs layer in pl layer Matrix Matrix
Wt%
SiO2 64.69 64.58 64.49 65.29 64.74 65.25 63.38
TiO2 0.00 0.00 0.00 0.00 0.00 0.07 0.20
Al2O3 18.45 18.47 18.60 18.36 18.35 18.47 18.15
FeO 0.10 0.34 0.10 0.01 0.00 0.05 0.19
MgO 0.11 0.05 0.03 0.00 0.01 0.04 0.05
CaO 0.34 0.31 0.28 0.02 0.01 0.25 0.35
Na2O 0.83 0.77 0.77 1.17 0.66 1.03 0.66
K2O 16.11 16.41 16.08 15.00 15.25 15.90 16.21
Total 100.63 100.93 100.35 99.84 99.01 101.06 99.19
Cations
Si 2.96 2.95 2.96 3.01 3.02 2.97 2.95
Al 1.00 0.99 1.01 1.00 1.01 0.99 1.00
Ca 0.02 0.02 0.01 0.00 0.00 0.01 0.02
Na 0.07 0.07 0.07 0.10 0.06 0.09 0.06
K 0.94 0.96 0.94 0.88 0.91 0.92 0.96
Total 5.00 5.00 5.00 5.00 5.00 5.00 5.00
an 0.02 0.01 0.01 0.00 0.00 0.01 0.02
ab 0.07 0.07 0.07 0.11 0.06 0.09 0.06
or 0.91 0.92 0.92 0.89 0.94 0.90 0.93
Structural formulae calculated on the basis of five cations:
an = Ca ⁄ (Ca + Na + K); ab = Na ⁄ (Ca + Na + K); or = K ⁄ (Ca + Na + K).
Table 3. Representative analyses of plagioclase.
Rock type Type I augen orthogneiss Type II banded orthogneiss Type III mylonitic orthogneiss
Sample mzg02 mzg02 mzg02 fc19A fc19A fc19A fc19A mzg11 mzg11 mzg11 mzg11 fc19C fc19C fc19C mzg05 mzg05 mzg05 mzg10 mzg10
Analysis no. ls364 ls365 ls379 ls793 ls805 ls781 A126 ls485 ls478 ls491 C71 ls737 ls756 ls766 mzg521 mzgAT21 mzgAT65 mzg1016 mzg1010
Position pl (i) pl (ii) pl (iii) pl (i) pl (ii) pl (iii) pl (iv) pl (i) pl (ii) pl (iii) pl (iv) pl (i) pl (ii) pl (iii) pl (v) pl (vi) pl (iii) pl (v) pl (vi)
Wt%
SiO2 62.91 67.58 73.29 62.97 64.48 68.08 62.32 63.08 63.41 65.53 63.3 63.77 64.17 68.34 62.60 66.36 62.53 61.89 65.48
TiO2 0.05 0.05 0.00 0.00 0.01 0.02 0.00 0.01 0.02 0.00 0.00 0.00 0.02 0.00 0.07 0.13 0.00 0.07 0.07
Al2O3 23.40 20.93 16.82 23.31 22.13 19.77 23.46 22.71 23.01 21.79 23.2 22.80 21.70 20.45 23.48 20.95 23.43 22.71 20.21
FeO 0.01 0.00 0.04 0.01 0.12 0.08 0.17 0.02 0.02 0.11 0.29 0.01 0.15 0.01 0.06 0.27 0.33 0.24 0.13
MgO 0.00 0.01 0.00 0.00 0.00 0.01 0.09 0.01 0.01 0.05 0.07 0.00 0.00 0.03 0.04 0.07 0.09 0.04 0.09
CaO 4.91 1.51 0.72 4.70 2.24 0.53 5.17 4.14 2.99 1.52 4.39 4.14 1.69 1.47 5.18 1.68 5.06 4.75 1.45
Na2O 9.08 10.99 9.21 9.14 10.00 11.93 7.86 9.32 9.20 10.54 8.18 9.43 10.02 9.91 7.60 9.27 7.80 7.77 9.50
K2O 0.27 0.04 0.28 0.23 0.43 0.11 0.19 0.25 0.91 0.61 0.25 0.20 0.92 0.55 0.31 0.25 0.27 0.29 0.11
Total 100.63 101.10 100.35 100.37 99.41 100.52 99.26 99.55 99.57 100.16 99.60 100.36 98.66 100.76 99.34 98.98 99.51 97.76 97.04
Cations
Si 2.77 2.93 3.27 2.77 2.85 2.95 2.80 2.80 2.81 2.87 2.83 2.81 2.86 3.00 2.81 2.97 2.81 2.83 2.98
Al 1.21 1.07 0.88 1.21 1.15 1.01 1.24 1.19 1.20 1.12 1.22 1.18 1.14 1.06 1.24 1.11 1.24 1.22 1.09
Ca 0.23 0.07 0.03 0.22 0.11 0.02 0.25 0.20 0.14 0.07 0.21 0.20 0.08 0.07 0.25 0.08 0.24 0.23 0.07
Na 0.77 0.92 0.80 0.78 0.86 1.00 0.68 0.80 0.79 0.89 0.71 0.80 0.86 0.84 0.66 0.81 0.68 0.69 0.84
K 0.02 0.00 0.02 0.01 0.02 0.01 0.01 0.01 0.05 0.03 0.01 0.01 0.05 0.03 0.02 0.01 0.02 0.02 0.01
Total 5.00 5.00 5.00 5.00 5.00 5.00 5.00 5.00 5.00 5.00 5.00 5.00 5.00 5.00 5.00 5.00 5.00 5.00 5.00
an 0.23 0.07 0.04 0.22 0.11 0.02 0.26 0.19 0.14 0.07 0.23 0.19 0.08 0.07 0.27 0.09 0.26 0.25 0.08
ab 0.76 0.93 0.94 0.77 0.87 0.97 0.72 0.79 0.80 0.89 0.76 0.80 0.87 0.89 0.71 0.89 0.72 0.73 0.92
or 0.01 0.00 0.02 0.01 0.02 0.01 0.01 0.01 0.05 0.03 0.01 0.01 0.05 0.03 0.02 0.02 0.02 0.02 0.01
The indications of position refer to Fig. 8. Structural formulae calculated on the basis of five cations:
an = Ca ⁄ (Ca + Na + K); ab = Na ⁄ (Ca + Na + K); or = K ⁄ (Ca + Na + K).
D E F O R M A T I O N O F HP G R A N I T I C O RT HO GN E I SS 35 9
� 2012 Blackwell Publishing Ltd
(Fig. 6d). Thin quartz monomineralic ribbons(Fig. 6b,d) are composed of recrystallized grains50 100 lm in size with serrated boundaries.
K-feldspar-rich layers are free of relict K-feldsparporphyroclasts (Fig. 6a–d). They are composed ofcompletely recrystallized subequant K-feldspar grains(50–80 lm) with a constant composition (or89–91;Fig. 8a,c & Table 2), which show almost straightboundaries commonly containing numerous interstitialminerals (Fig. 6c). The interstitial minerals are repre-sented by (i) small aggregates of plagioclase rangingfrom an05 to an20 (Fig. 8a,b & Table 3), (ii) myrmekiteaggregates 200 lm across (Figs 6c,e,f) oriented at highangle to the stretching direction; and (iii) isolated smallrounded quartz grains (20–50 lm) or quartz aggre-gates up to 100 lm in diameter mostly located at triplejunctions (Fig. 6e). Myrmekitic plagioclase shows acomposition similar to that present in the type I or-thogneiss (an25; Fig. 8b & Table 3).
Numerous grains of quartz, K-feldspar (or91;Fig. 8b,c & Table 2), muscovite, biotite and accessoryminerals (Fig. 6e,f) occur within the layers dominatedby plagioclase. Compared with the type I orthogneiss,the foam structure of the originally subequantplagioclase is interspersed with numerous highlycuspate interstitial K-feldspar grains (Fig. 6e,f) thatline rounded and lobate plagioclase (Fig. 6e,f). Smallmyrmekite aggregates with plagioclase of composition
an25 (Fig. 8b & Table 3) and interstitial quartz grains(50 lm) are also present within the recrystallizedK-feldspar layers and along their boundaries (Fig. 6-e,f). Plagioclase commonly shows an increase in albitecontent from the core to the rim (Fig. 8a,b & Table 3).Compared with the type I augen orthogneiss, smallgarnet grains (5–50 lm in size; Fig. 6f) are richer inspessartine and pyrope (alm0.49–0.52py0.03grs0.33–0.49sps0.05–0.08, XFe = 0.94–0.96; Fig. 9a & Table 4).No core–rim chemical variations have been observed.Mica is mostly dispersed in plagioclase-rich layers(Fig. 6). Muscovite (Si = 3.22–3.37 pfu and Na =0.01–0.04 pfu) shows a higher celadonite componentcompared with the type I orthogneiss (Fig. 9b &Table 4). Biotite has XFe = 0.63–0.73 and Ti = 0.07–0.25 pfu (Fig. 9c & Table 4). Sphene, ilmenite andapatite are common in the plagioclase–mica-rich lay-ers.
Type III: Mylonitic orthogneiss
In the type III mylonitic orthogneiss, discontinuousand narrow ribbons of feldspar and quartz <1 mmand 200 lm thick respectively are only a few millime-tres long (Fig. 7b,d). In some samples these ribbons areabsent (Fig. 7a). K-feldspar (or92; Fig. 8a,c & Table 2)and quartz are interspersed with zoned plagioclase(an20–26 for the core, an04–15 for the rim; Fig. 8a,b &
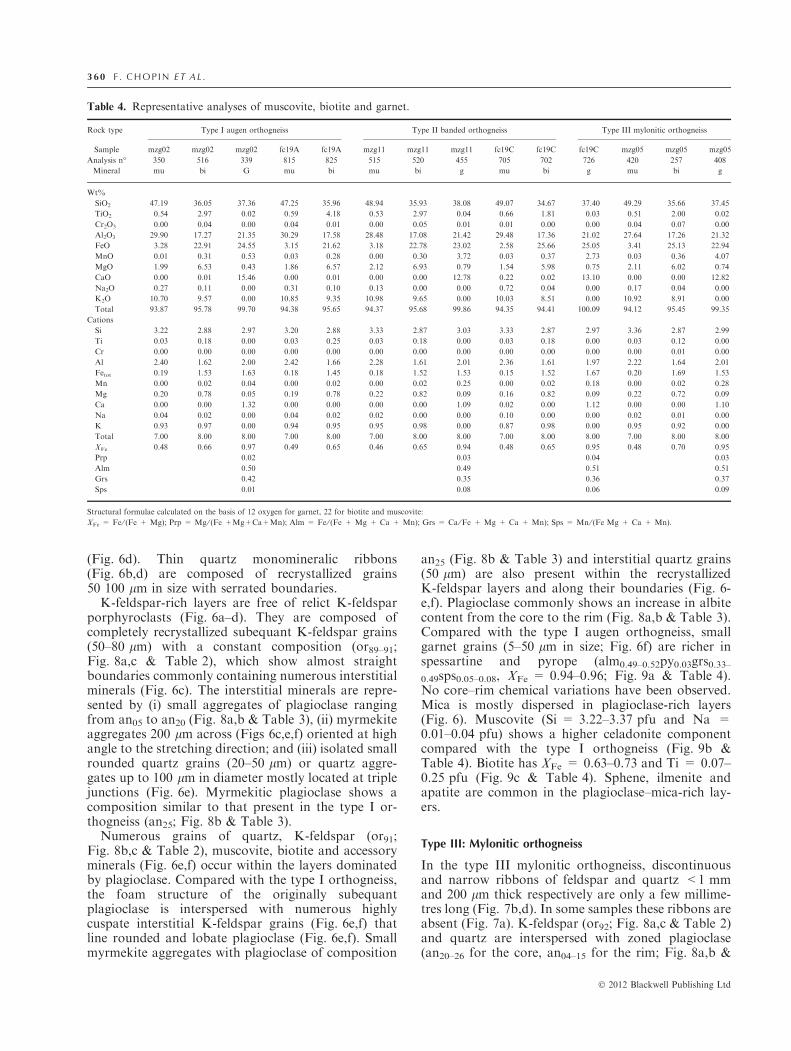
Table 4. Representative analyses of muscovite, biotite and garnet.
Rock type Type I augen orthogneiss Type II banded orthogneiss Type III mylonitic orthogneiss
Sample mzg02 mzg02 mzg02 fc19A fc19A mzg11 mzg11 mzg11 fc19C fc19C fc19C mzg05 mzg05 mzg05
Analysis n� 350 516 339 815 825 515 520 455 705 702 726 420 257 408
Mineral mu bi G mu bi mu bi g mu bi g mu bi g
Wt%
SiO2 47.19 36.05 37.36 47.25 35.96 48.94 35.93 38.08 49.07 34.67 37.40 49.29 35.66 37.45
TiO2 0.54 2.97 0.02 0.59 4.18 0.53 2.97 0.04 0.66 1.81 0.03 0.51 2.00 0.02
Cr2O3 0.00 0.04 0.00 0.04 0.01 0.00 0.05 0.01 0.01 0.00 0.00 0.04 0.07 0.00
Al2O3 29.90 17.27 21.35 30.29 17.58 28.48 17.08 21.42 29.48 17.36 21.02 27.64 17.26 21.32
FeO 3.28 22.91 24.55 3.15 21.62 3.18 22.78 23.02 2.58 25.66 25.05 3.41 25.13 22.94
MnO 0.01 0.31 0.53 0.03 0.28 0.00 0.30 3.72 0.03 0.37 2.73 0.03 0.36 4.07
MgO 1.99 6.53 0.43 1.86 6.57 2.12 6.93 0.79 1.54 5.98 0.75 2.11 6.02 0.74
CaO 0.00 0.01 15.46 0.00 0.01 0.00 0.00 12.78 0.22 0.02 13.10 0.00 0.00 12.82
Na2O 0.27 0.11 0.00 0.31 0.10 0.13 0.00 0.00 0.72 0.04 0.00 0.17 0.04 0.00
K2O 10.70 9.57 0.00 10.85 9.35 10.98 9.65 0.00 10.03 8.51 0.00 10.92 8.91 0.00
Total 93.87 95.78 99.70 94.38 95.65 94.37 95.68 99.86 94.35 94.41 100.09 94.12 95.45 99.35
Cations
Si 3.22 2.88 2.97 3.20 2.88 3.33 2.87 3.03 3.33 2.87 2.97 3.36 2.87 2.99
Ti 0.03 0.18 0.00 0.03 0.25 0.03 0.18 0.00 0.03 0.18 0.00 0.03 0.12 0.00
Cr 0.00 0.00 0.00 0.00 0.00 0.00 0.00 0.00 0.00 0.00 0.00 0.00 0.01 0.00
Al 2.40 1.62 2.00 2.42 1.66 2.28 1.61 2.01 2.36 1.61 1.97 2.22 1.64 2.01
Fetot 0.19 1.53 1.63 0.18 1.45 0.18 1.52 1.53 0.15 1.52 1.67 0.20 1.69 1.53
Mn 0.00 0.02 0.04 0.00 0.02 0.00 0.02 0.25 0.00 0.02 0.18 0.00 0.02 0.28
Mg 0.20 0.78 0.05 0.19 0.78 0.22 0.82 0.09 0.16 0.82 0.09 0.22 0.72 0.09
Ca 0.00 0.00 1.32 0.00 0.00 0.00 0.00 1.09 0.02 0.00 1.12 0.00 0.00 1.10
Na 0.04 0.02 0.00 0.04 0.02 0.02 0.00 0.00 0.10 0.00 0.00 0.02 0.01 0.00
K 0.93 0.97 0.00 0.94 0.95 0.95 0.98 0.00 0.87 0.98 0.00 0.95 0.92 0.00
Total 7.00 8.00 8.00 7.00 8.00 7.00 8.00 8.00 7.00 8.00 8.00 7.00 8.00 8.00
XFe 0.48 0.66 0.97 0.49 0.65 0.46 0.65 0.94 0.48 0.65 0.95 0.48 0.70 0.95
Prp 0.02 0.03 0.04 0.03
Alm 0.50 0.49 0.51 0.51
Grs 0.42 0.35 0.36 0.37
Sps 0.01 0.08 0.06 0.09
Structural formulae calculated on the basis of 12 oxygen for garnet, 22 for biotite and muscovite:
XFe = Fe ⁄ (Fe + Mg); Prp = Mg ⁄ (Fe +Mg+Ca+Mn); Alm = Fe ⁄ (Fe + Mg + Ca + Mn); Grs = Ca ⁄Fe + Mg + Ca + Mn); Sps = Mn ⁄ (Fe Mg + Ca + Mn).
3 60 F . C H O P I N E T A L .
� 2012 Blackwell Publishing Ltd
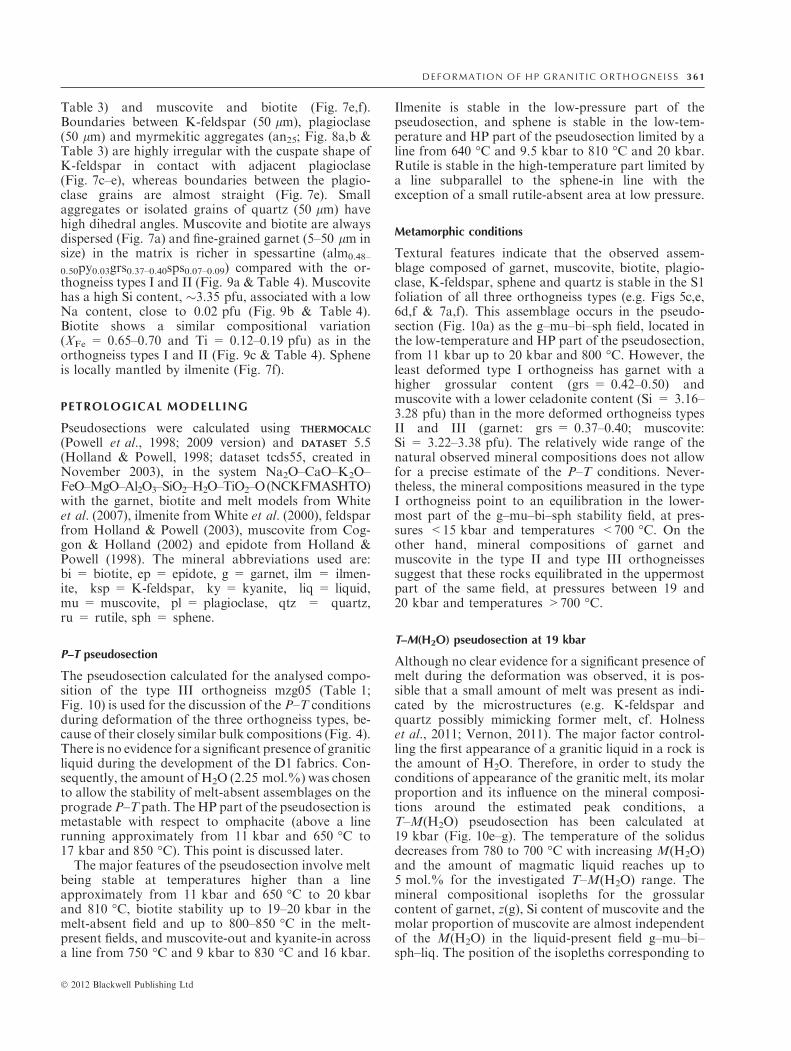
Table 3) and muscovite and biotite (Fig. 7e,f).Boundaries between K-feldspar (50 lm), plagioclase(50 lm) and myrmekitic aggregates (an25; Fig. 8a,b &Table 3) are highly irregular with the cuspate shape ofK-feldspar in contact with adjacent plagioclase(Fig. 7c–e), whereas boundaries between the plagio-clase grains are almost straight (Fig. 7e). Smallaggregates or isolated grains of quartz (50 lm) havehigh dihedral angles. Muscovite and biotite are alwaysdispersed (Fig. 7a) and fine-grained garnet (5–50 lm insize) in the matrix is richer in spessartine (alm0.48–
0.50py0.03grs0.37–0.40sps0.07–0.09) compared with the or-thogneiss types I and II (Fig. 9a & Table 4). Muscovitehas a high Si content, �3.35 pfu, associated with a lowNa content, close to 0.02 pfu (Fig. 9b & Table 4).Biotite shows a similar compositional variation(XFe = 0.65–0.70 and Ti = 0.12–0.19 pfu) as in theorthogneiss types I and II (Fig. 9c & Table 4). Spheneis locally mantled by ilmenite (Fig. 7f).
PETROLOGICAL MODELLING
Pseudosections were calculated using THERMOCALCTHERMOCALC
(Powell et al., 1998; 2009 version) and DATASETDATASET 5.5(Holland & Powell, 1998; dataset tcds55, created inNovember 2003), in the system Na2O–CaO–K2O–FeO–MgO–Al2O3–SiO2–H2O–TiO2–O(NCKFMASHTO)with the garnet, biotite and melt models from Whiteet al. (2007), ilmenite from White et al. (2000), feldsparfrom Holland & Powell (2003), muscovite from Cog-gon & Holland (2002) and epidote from Holland &Powell (1998). The mineral abbreviations used are:bi = biotite, ep = epidote, g = garnet, ilm = ilmen-ite, ksp = K-feldspar, ky = kyanite, liq = liquid,mu = muscovite, pl = plagioclase, qtz = quartz,ru = rutile, sph = sphene.
P–T pseudosection
The pseudosection calculated for the analysed compo-sition of the type III orthogneiss mzg05 (Table 1;Fig. 10) is used for the discussion of the P–T conditionsduring deformation of the three orthogneiss types, be-cause of their closely similar bulk compositions (Fig. 4).There is no evidence for a significant presence of graniticliquid during the development of the D1 fabrics. Con-sequently, the amount of H2O (2.25 mol.%) was chosento allow the stability of melt-absent assemblages on theprogradeP–T path. TheHP part of the pseudosection ismetastable with respect to omphacite (above a linerunning approximately from 11 kbar and 650 �C to17 kbar and 850 �C). This point is discussed later.
The major features of the pseudosection involve meltbeing stable at temperatures higher than a lineapproximately from 11 kbar and 650 �C to 20 kbarand 810 �C, biotite stability up to 19–20 kbar in themelt-absent field and up to 800–850 �C in the melt-present fields, and muscovite-out and kyanite-in acrossa line from 750 �C and 9 kbar to 830 �C and 16 kbar.
Ilmenite is stable in the low-pressure part of thepseudosection, and sphene is stable in the low-tem-perature and HP part of the pseudosection limited by aline from 640 �C and 9.5 kbar to 810 �C and 20 kbar.Rutile is stable in the high-temperature part limited bya line subparallel to the sphene-in line with theexception of a small rutile-absent area at low pressure.
Metamorphic conditions
Textural features indicate that the observed assem-blage composed of garnet, muscovite, biotite, plagio-clase, K-feldspar, sphene and quartz is stable in the S1foliation of all three orthogneiss types (e.g. Figs 5c,e,6d,f & 7a,f). This assemblage occurs in the pseudo-section (Fig. 10a) as the g–mu–bi–sph field, located inthe low-temperature and HP part of the pseudosection,from 11 kbar up to 20 kbar and 800 �C. However, theleast deformed type I orthogneiss has garnet with ahigher grossular content (grs = 0.42–0.50) andmuscovite with a lower celadonite content (Si = 3.16–3.28 pfu) than in the more deformed orthogneiss typesII and III (garnet: grs = 0.37–0.40; muscovite:Si = 3.22–3.38 pfu). The relatively wide range of thenatural observed mineral compositions does not allowfor a precise estimate of the P–T conditions. Never-theless, the mineral compositions measured in the typeI orthogneiss point to an equilibration in the lower-most part of the g–mu–bi–sph stability field, at pres-sures <15 kbar and temperatures <700 �C. On theother hand, mineral compositions of garnet andmuscovite in the type II and type III orthogneissessuggest that these rocks equilibrated in the uppermostpart of the same field, at pressures between 19 and20 kbar and temperatures >700 �C.
T–M(H2O) pseudosection at 19 kbar
Although no clear evidence for a significant presence ofmelt during the deformation was observed, it is pos-sible that a small amount of melt was present as indi-cated by the microstructures (e.g. K-feldspar andquartz possibly mimicking former melt, cf. Holnesset al., 2011; Vernon, 2011). The major factor control-ling the first appearance of a granitic liquid in a rock isthe amount of H2O. Therefore, in order to study theconditions of appearance of the granitic melt, its molarproportion and its influence on the mineral composi-tions around the estimated peak conditions, aT–M(H2O) pseudosection has been calculated at19 kbar (Fig. 10e–g). The temperature of the solidusdecreases from 780 to 700 �C with increasing M(H2O)and the amount of magmatic liquid reaches up to5 mol.% for the investigated T–M(H2O) range. Themineral compositional isopleths for the grossularcontent of garnet, z(g), Si content of muscovite and themolar proportion of muscovite are almost independentof the M(H2O) in the liquid-present field g–mu–bi–sph–liq. The position of the isopleths corresponding to
D E F O R M A T I O N O F HP G R A N I T I C O RT HO GN E I SS 36 1
� 2012 Blackwell Publishing Ltd
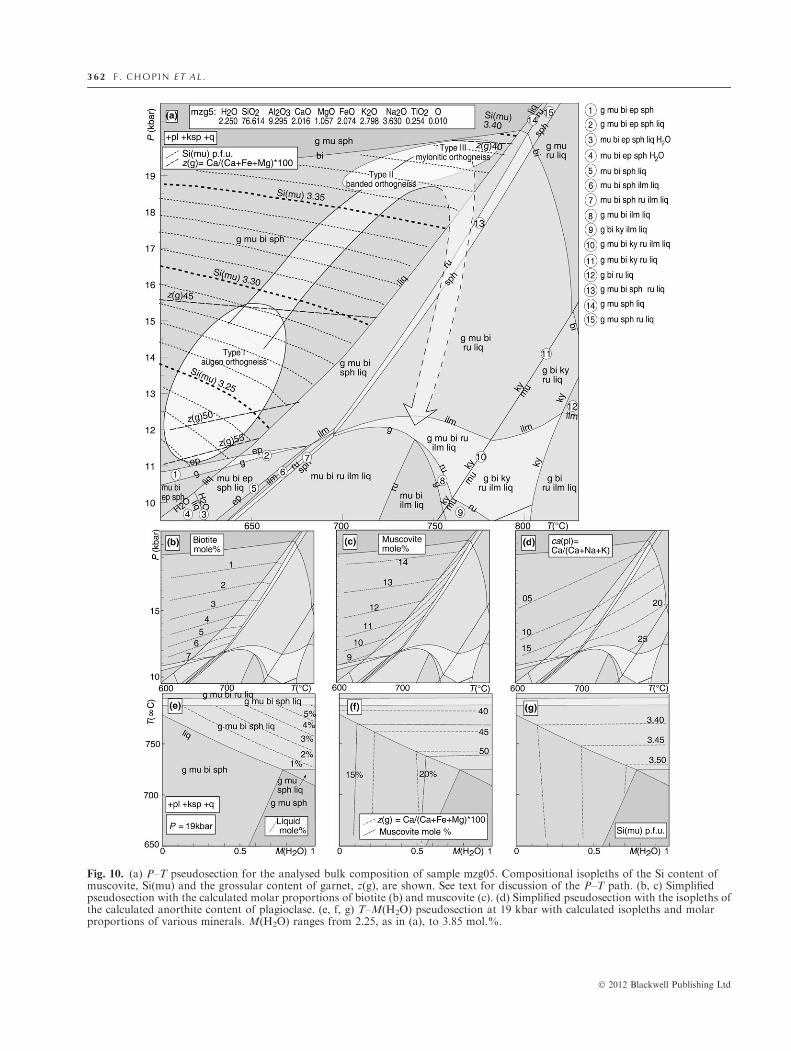
Fig. 10. (a) P–T pseudosection for the analysed bulk composition of sample mzg05. Compositional isopleths of the Si content ofmuscovite, Si(mu) and the grossular content of garnet, z(g), are shown. See text for discussion of the P–T path. (b, c) Simplifiedpseudosection with the calculated molar proportions of biotite (b) and muscovite (c). (d) Simplified pseudosection with the isopleths ofthe calculated anorthite content of plagioclase. (e, f, g) T–M(H2O) pseudosection at 19 kbar with calculated isopleths and molarproportions of various minerals. M(H2O) ranges from 2.25, as in (a), to 3.85 mol.%.
3 62 F . C H O P I N E T A L .
� 2012 Blackwell Publishing Ltd
the observed values of these parameters [z(g) = 0.37–0.40, Si(mu) = 3.22–3.38 pfu] at the estimated peaktemperature between 730 and 770 �C would not beinfluenced strongly by a slightly higher amount of H2Oresulting in the presence of several per cent of melt. It istherefore possible that, at the peak, the orthogneissmay have been fluid-absent or may have containedseveral per cent of melt.
QUANTITATIVE MICROSTRUCTURAL ANALYSIS
Quantitative microstructural analysis is the statisticalstudy of the spatial distribution of grains, their size,shape and boundaries. These microstructural parame-ters are sensitive to variations in physical conditions,finite strain and mineral reactions. Interpretation ofrock microstructures using a quantitative approachallows progressive evolution of the microstructures inthese orthogneiss samples to be determined, providinga better understanding of processes like grain coars-ening, nucleation and syn-deformational growth.
To evaluate quantitatively the microstructuralsequence described above, we evaluated the grain size,the crystal size distribution (CSD), the grain shape-preferred orientation (SPO), the grain boundary-pre-ferred orientation (GBPO) and the grain contactfrequency (GCF). For this, nine portions of XZ sec-tions of representative thin sections (three for eachtype; Fig. 11) were manually digitized with ESRIArcMap desktop GIS using the superposition of BSEand optical images (as examples compare Fig. 5a withFig. 11a). The maps of grains with full topology(polygons with phase name, textural parameters,location; Barraud, 2006) were analysed using theMATLABTM PolyLX toolbox V3.0. (Lexa, 2003;http://petrol.natur.cuni.cz/�ondro/polylx:home). Ex-cept for sample mzg10 (type III), in which ribbons areabsent, we also visually separated aggregates (mono-phase-rich layers) from interstitial minerals.
Grain-size statistics and CSD
Evolution of crystal size is evaluated first using thegrain-size equivalent area diameter, EAD = 2 ·(grain area ⁄ p)½ in aggregates (�a�) and interstitialminerals (�i�). Results are presented for each sampleas a box-and-whisker plot (Fig. 12a), in which themiddle 50% of the data are represented by the box(the first and third quartiles), with the median ofthe data set marked as a line (the second quartile);the whiskers extend to 95% of the data and representthe grain-size spread. From the type I to the type IIIorthogneiss, quartz aggregates show a decrease ofmean grain size from 110 to 50 lm in conjunctionwith a decreased spread. For K-feldspar in aggre-gates, a similar trend is present for both the grain-size mean (from 150 to 50 lm) and the grain-sizespread. Plagioclase grains in aggregates are moreequant with a slight decrease of the mean grain size
from 90 to 50 lm in all the rock types. Interstitialplagioclase in K-feldspar-rich layers shows a weakincrease of grain size from 30 to 50 lm withincreasing finite strain, whereas the mean grain sizeof interstitial quartz in feldspar layers and interstitialK-feldspar in plagioclase-rich layers remains constant(�10–50 lm).
Crystal nucleation rate, growth rate and coarseningduring metamorphism can be revealed using the tech-nique of CSD developed by Randolph & Larson(1971). This technique has been used for metamorphicrocks, for example, by Cashman & Ferry (1988), DıazAspiroz & Fernandez (2003) or, more recently, byFran�ek et al. (2011 and references therein). The latterauthors applied the method to confront differentstages of the textural maturation history in a singlerock type. We used the method of Peterson (1996)corrected for 2D analysis (Higgins, 2000, 2002; Higgins& Chandrasekharam, 2007), for which the construc-tion of a linear regression by plotting the natural log-arithm of the population density (N) as a function ofthe equivalent area diameter (L) produces two con-stants N0 (intercept, nuclei population density) and Gt
(slope, time-integrated growth rates; see the insets inFig. 12d). Each XZ section has been plotted separately(Fig. 12b–d) using the method of Lexa et al. (2005).
Quartz, K-feldspar and plagioclase show a system-atic evolution of Gt and N0 values from the type I tothe type III microstructures. The weakly deformedtype I microstructure was developed at lowest meta-morphic temperatures and forms a group with thehighest Gt and lowest N0 values. The type II and IIIbanded mylonite and ultramylonitic microstructureswere developed at higher temperatures (�700–750 �C)compared with the type I microstructures (�650 �C);they show an increase in N0 in conjunction withdecreasing Gt. This evolution is indicated by steepeningof the slopes of the CSD curves associated with anincrease in their upper intercept with the ordinate axis(insets in Fig. 12d). Sample fc19A (type I), whichshows a high value of N0 for K-feldspar, and samplemzg05 (type III), which shows a low N0 value forplagioclase, compared with samples of the same typeare outliers.
Grain shapes and SPO
The aspect ratio, i.e. the ratio between the long and theshort axis of the best fit ellipse, characterizes the grainshape (Panozzo, 1984). The SPO is calculated using theeigenvalue ratio of the Scheidegger–Watson orienta-tion tensor of individual linear segments of grainboundaries of each mineral (Lexa et al., 2005). Inprogressively deformed rocks, a high SPO is inter-preted to reflect a dislocation creep regime, whereaslow SPO can be related to the diffusion creep regime(Lexa et al., 2005).
In monomineralic aggregates, a constant and lowaspect ratio of each mineral is observed for all
D E F O R M A T I O N O F HP G R A N I T I C O RT HO GN E I SS 36 3
� 2012 Blackwell Publishing Ltd
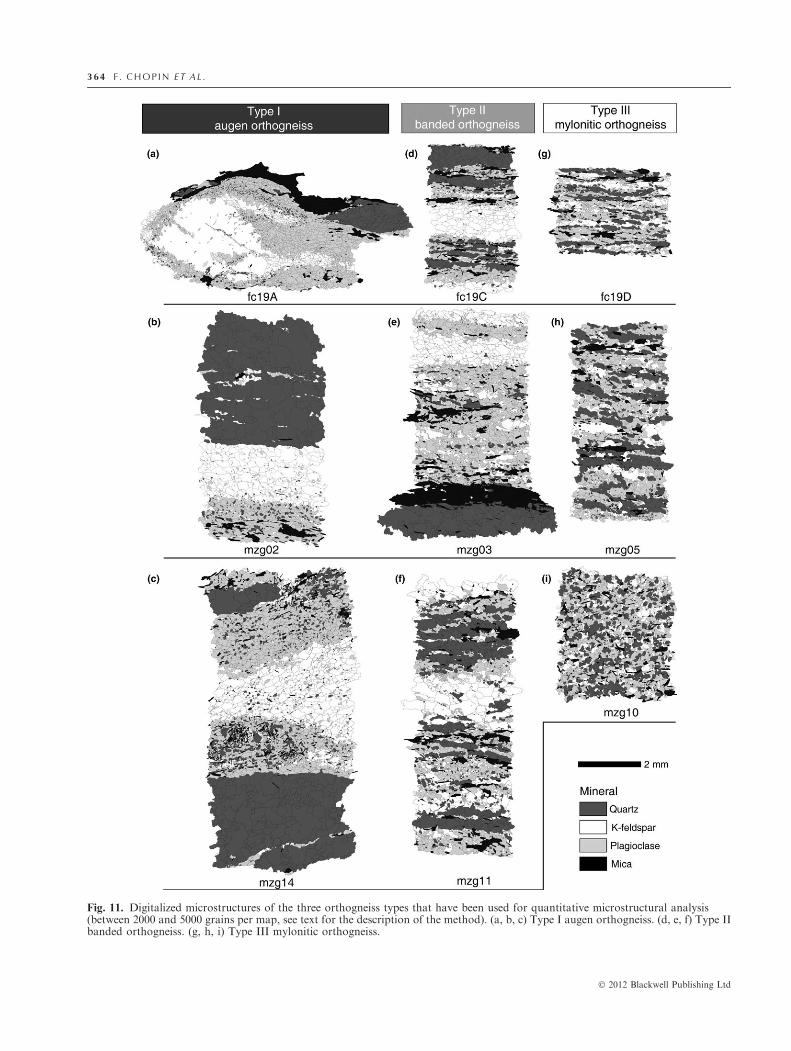
Fig. 11. Digitalized microstructures of the three orthogneiss types that have been used for quantitative microstructural analysis(between 2000 and 5000 grains per map, see text for the description of the method). (a, b, c) Type I augen orthogneiss. (d, e, f) Type IIbanded orthogneiss. (g, h, i) Type III mylonitic orthogneiss.
3 64 F . C H O P I N E T A L .
� 2012 Blackwell Publishing Ltd
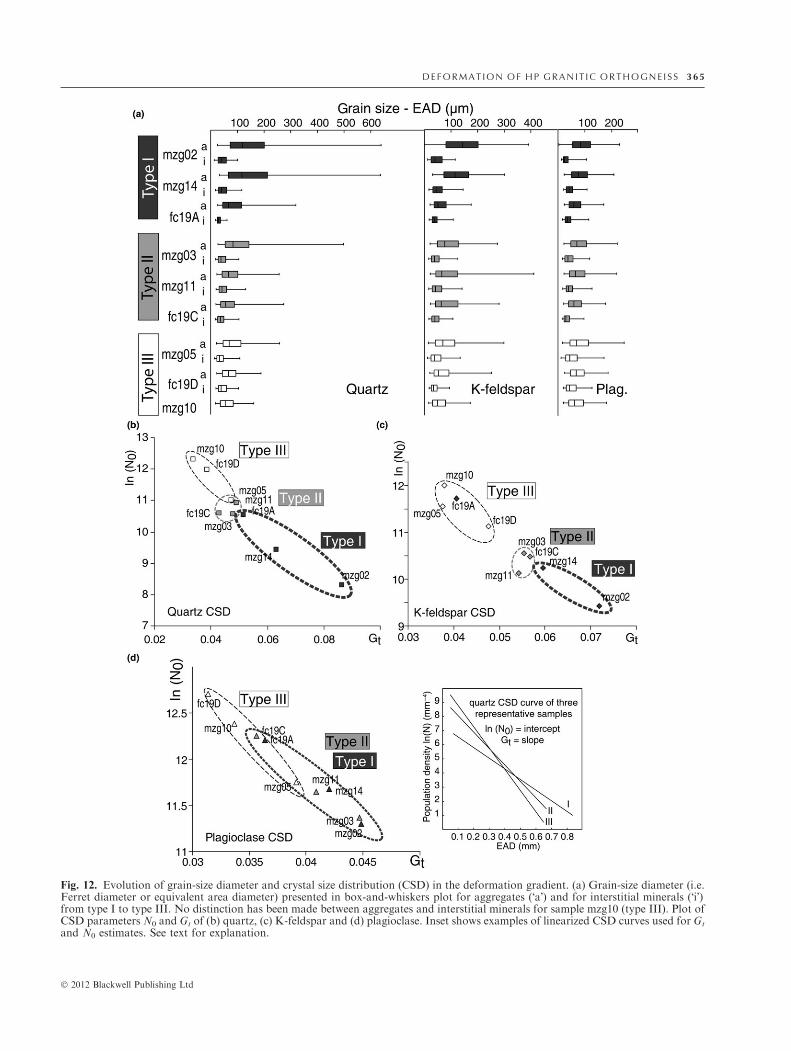
Fig. 12. Evolution of grain-size diameter and crystal size distribution (CSD) in the deformation gradient. (a) Grain-size diameter (i.e.Ferret diameter or equivalent area diameter) presented in box-and-whiskers plot for aggregates (�a�) and for interstitial minerals (�i�)from type I to type III. No distinction has been made between aggregates and interstitial minerals for sample mzg10 (type III). Plot ofCSD parameters N0 and Gt of (b) quartz, (c) K-feldspar and (d) plagioclase. Inset shows examples of linearized CSD curves used for Gt
and N0 estimates. See text for explanation.
D E F O R M A T I O N O F HP G R A N I T I C O RT HO GN E I SS 36 5
� 2012 Blackwell Publishing Ltd
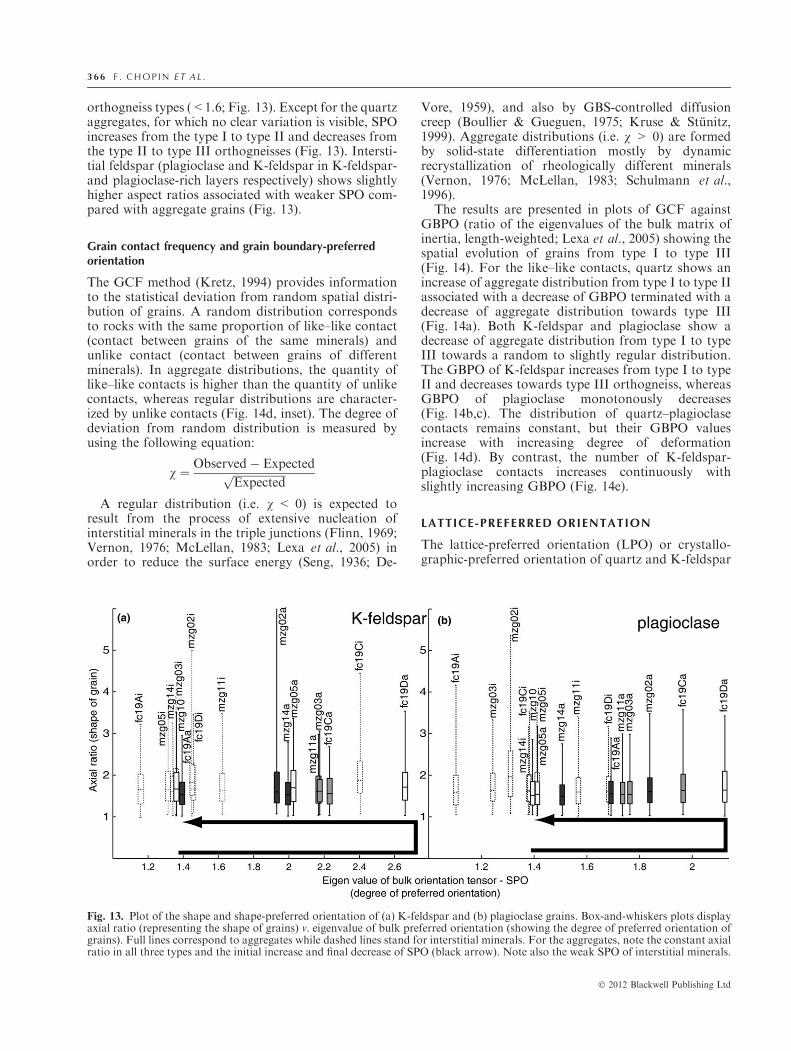
orthogneiss types (<1.6; Fig. 13). Except for the quartzaggregates, for which no clear variation is visible, SPOincreases from the type I to type II and decreases fromthe type II to type III orthogneisses (Fig. 13). Intersti-tial feldspar (plagioclase and K-feldspar in K-feldspar-and plagioclase-rich layers respectively) shows slightlyhigher aspect ratios associated with weaker SPO com-pared with aggregate grains (Fig. 13).
Grain contact frequency and grain boundary-preferredorientation
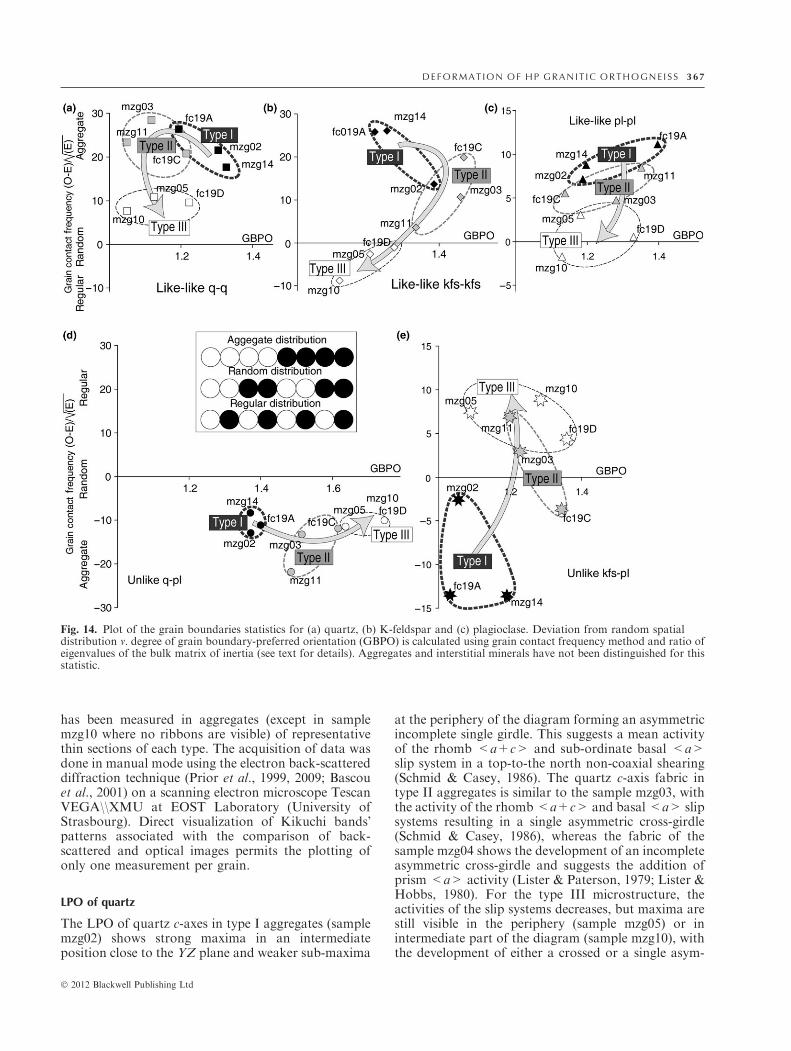
The GCF method (Kretz, 1994) provides informationto the statistical deviation from random spatial distri-bution of grains. A random distribution correspondsto rocks with the same proportion of like–like contact(contact between grains of the same minerals) andunlike contact (contact between grains of differentminerals). In aggregate distributions, the quantity oflike–like contacts is higher than the quantity of unlikecontacts, whereas regular distributions are character-ized by unlike contacts (Fig. 14d, inset). The degree ofdeviation from random distribution is measured byusing the following equation:
v ¼ Observed� Expectedffiffiffiffiffiffiffiffiffiffiffiffiffiffiffiffiffiffiffi
Expectedp
A regular distribution (i.e. v < 0) is expected toresult from the process of extensive nucleation ofinterstitial minerals in the triple junctions (Flinn, 1969;Vernon, 1976; McLellan, 1983; Lexa et al., 2005) inorder to reduce the surface energy (Seng, 1936; De-
Vore, 1959), and also by GBS-controlled diffusioncreep (Boullier & Gueguen, 1975; Kruse & Stunitz,1999). Aggregate distributions (i.e. v > 0) are formedby solid-state differentiation mostly by dynamicrecrystallization of rheologically different minerals(Vernon, 1976; McLellan, 1983; Schulmann et al.,1996).The results are presented in plots of GCF against
GBPO (ratio of the eigenvalues of the bulk matrix ofinertia, length-weighted; Lexa et al., 2005) showing thespatial evolution of grains from type I to type III(Fig. 14). For the like–like contacts, quartz shows anincrease of aggregate distribution from type I to type IIassociated with a decrease of GBPO terminated with adecrease of aggregate distribution towards type III(Fig. 14a). Both K-feldspar and plagioclase show adecrease of aggregate distribution from type I to typeIII towards a random to slightly regular distribution.The GBPO of K-feldspar increases from type I to typeII and decreases towards type III orthogneiss, whereasGBPO of plagioclase monotonously decreases(Fig. 14b,c). The distribution of quartz–plagioclasecontacts remains constant, but their GBPO valuesincrease with increasing degree of deformation(Fig. 14d). By contrast, the number of K-feldspar-plagioclase contacts increases continuously withslightly increasing GBPO (Fig. 14e).
LATTICE-PREFERRED ORIENTATION
The lattice-preferred orientation (LPO) or crystallo-graphic-preferred orientation of quartz and K-feldspar
Fig. 13. Plot of the shape and shape-preferred orientation of (a) K-feldspar and (b) plagioclase grains. Box-and-whiskers plots displayaxial ratio (representing the shape of grains) v. eigenvalue of bulk preferred orientation (showing the degree of preferred orientation ofgrains). Full lines correspond to aggregates while dashed lines stand for interstitial minerals. For the aggregates, note the constant axialratio in all three types and the initial increase and final decrease of SPO (black arrow). Note also the weak SPO of interstitial minerals.
3 66 F . C H O P I N E T A L .
� 2012 Blackwell Publishing Ltd
has been measured in aggregates (except in samplemzg10 where no ribbons are visible) of representativethin sections of each type. The acquisition of data wasdone in manual mode using the electron back-scattereddiffraction technique (Prior et al., 1999, 2009; Bascouet al., 2001) on a scanning electron microscope TescanVEGA\\XMU at EOST Laboratory (University ofStrasbourg). Direct visualization of Kikuchi bands�patterns associated with the comparison of back-scattered and optical images permits the plotting ofonly one measurement per grain.
LPO of quartz
The LPO of quartz c-axes in type I aggregates (samplemzg02) shows strong maxima in an intermediateposition close to the YZ plane and weaker sub-maxima
at the periphery of the diagram forming an asymmetricincomplete single girdle. This suggests a mean activityof the rhomb <a+c> and sub-ordinate basal <a>slip system in a top-to-the north non-coaxial shearing(Schmid & Casey, 1986). The quartz c-axis fabric intype II aggregates is similar to the sample mzg03, withthe activity of the rhomb<a+c> and basal <a> slipsystems resulting in a single asymmetric cross-girdle(Schmid & Casey, 1986), whereas the fabric of thesample mzg04 shows the development of an incompleteasymmetric cross-girdle and suggests the addition ofprism <a> activity (Lister & Paterson, 1979; Lister &Hobbs, 1980). For the type III microstructure, theactivities of the slip systems decreases, but maxima arestill visible in the periphery (sample mzg05) or inintermediate part of the diagram (sample mzg10), withthe development of either a crossed or a single asym-
Fig. 14. Plot of the grain boundaries statistics for (a) quartz, (b) K-feldspar and (c) plagioclase. Deviation from random spatialdistribution v. degree of grain boundary-preferred orientation (GBPO) is calculated using grain contact frequency method and ratio ofeigenvalues of the bulk matrix of inertia (see text for details). Aggregates and interstitial minerals have not been distinguished for thisstatistic.
D E F O R M A T I O N O F HP G R A N I T I C O RT HO GN E I SS 36 7
� 2012 Blackwell Publishing Ltd
metric girdle in samples mzg05 and mzg10 respectively,corresponding to a weak activity of basal <a>, rhomb<a+c> and prism <a> slip systems (Schmid &Casey, 1986). The characteristic feature of all thediagrams is the constant kinematics of non-coaxialshearing towards the north, which is concordant withthe top-to-the-north sense of shear visible in K-feld-spars r-clast (orogen parallel flow, Chopin et al., 2012).
LPO of K-feldspar
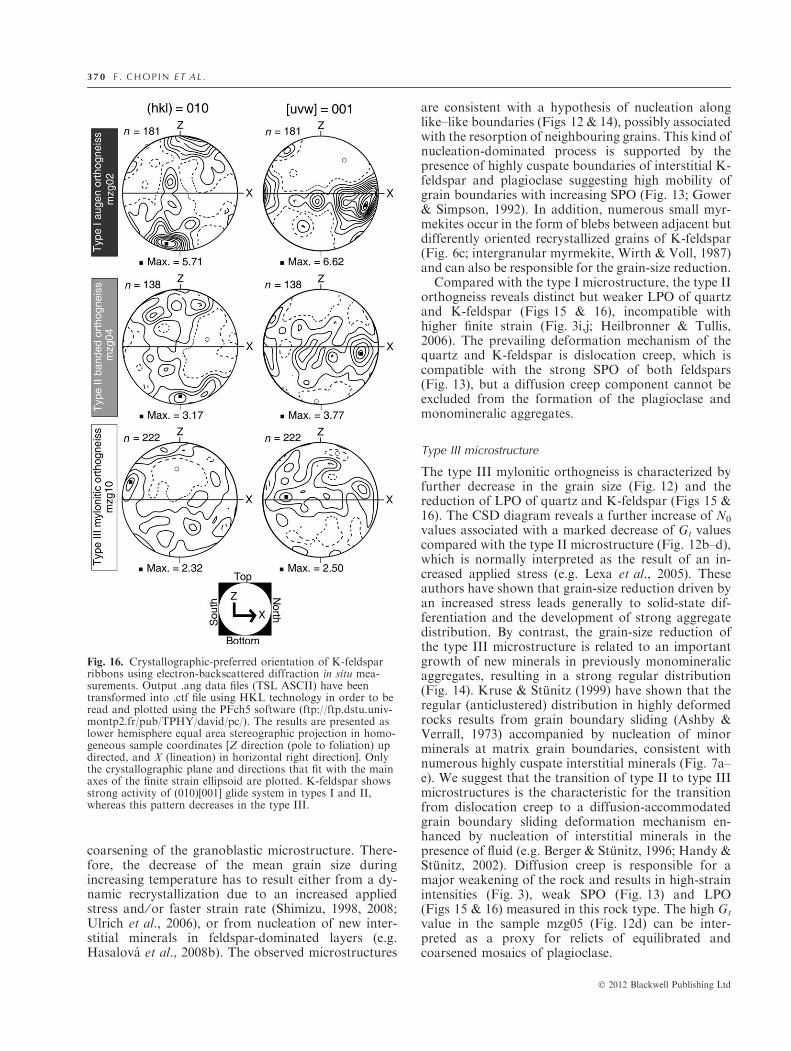
The LPO of K-feldspar in monomineralic aggregates inthe type I microstructure (sample mzg02) shows astrong preferred orientation of the (010) plane parallelto the sample foliation plane. This planar-preferredorientation is associated with a strong preferred ori-entation of the [001] axes parallel to the lineation. Thissuggests the activation of the [001](010) slip system(Willaime et al., 1979; Sacerdoti et al., 1980; Schul-mann et al., 1996; Franek et al., 2006). In the type IIaggregates (sample mzg04), activity of [001](010) is stillinferred but with weaker maxima compared with thetype I microstructure. This trend further continues inK-feldspar from the poly-mineral matrix of the type IIImicrostructure (sample mzg10), where the distributionof wide and weak maxima suggests a minor activity ofthe [001](010) slip system.
DISCUSSION
Significance of the estimated P–T conditions
It has been repeatedly reported from many areasrecording (U)HP metamorphism in basic rock typesthat the surrounding quartzofeldspathic rocks com-monly lack evidence of (U)HP metamorphism (seeProyer, 2003). Locally, the presence of coesite or dia-mond is the principal evidence of (U)HP metamor-phism (Chopin, 2003; Proyer, 2003; Peterman et al.,2009). It has been suggested that quartzofeldspathicrocks do not typically transform at (U)HP conditions(Peterman et al., 2009) and the absence of omphacitein granitic orthogneisses has been explained by kineticarguments (Oberhansli et al., 1983; Koons et al., 1987)or by the fact that in natural HP metagranites clino-pyroxene is less stable than garnet (Proyer, 2003).
Similar features are observed in the granitic or-thogneiss, for which the high Si content of muscoviteand presence of Ca-rich garnet indicate that theserocks were metamorphosed at HP conditions. How-ever, all samples lack omphacite even if they experi-enced strong deformation accompanied by dynamicrecrystallization of feldspar and quartz. We thereforeassume that omphacite did not nucleate and,accordingly, mineral equilibria were modelled withoutconsidering omphacite and are therefore thermody-namically metastable with respect to omphacite. Thisallowed modelling the observed assemblage in thepseudosection, including the stability of sphene at HP
(not observed in the presence of omphacite). Theagreement between the observed and modelledassemblages justifies a posteriori this approach.Therefore, the assemblage, the compositional isoplethsand the mineral composition of garnet and muscovitein the orthogneiss types II and III suggest burial at�19–20 kbar and >700 �C, interpreted as the P–Tconditions of the mylonitic deformation. The compo-sition of garnet and muscovite in the type I orthogneisssuggests equilibration at about <15 kbar and<700 �C. Because the three rock types are sampled ina continuous strain gradient, <1 m thick, affecting thesame metagranite, it is difficult to imagine that theyhad different P–T paths in the crust. The conditionsfor the least deformed orthogneiss type I are thereforeinterpreted as the conditions of the earliest incrementsof the D1 deformation encountered by the entire rocksequence on the prograde segment of the P–T evolu-tion. The preservation results from incomplete equili-bration of the mineral assemblage at HP, which isconsistent with the weakly deformed character of thetype I orthogneisses, as deformation is known to pro-mote chemical equilibration (e.g. Terry & Heidelbach,2006; in HP metagabbro). Such an interpretationsuggests that the different orthogneiss types preserveand reflect different stages of a single progressiveprograde deformation at different crustal depths.
Interpretation of deformation microstructures across afinite strain gradient
The microstructure of the type I augen orthogneissindicates that at this stage plagioclase was the weakestmineral, whereas K-feldspar ± quartz formed a rigidframework. Increasing deformation allows the forma-tion of alternating monomineralic layers (Jordan,1988). The quartz–feldspar mixture present in the typeIII mylonitic orthogneiss is associated with the devel-opment of a weak matrix (Handy, 1990, 1994).
Type I microstructure
K-feldspar porphyroclasts are surrounded bywide foliation-parallel myrmekite fronts indicating acompeting role of deformation and diffusion or fluidaccess associated with the myrmekite origin (Fig. 11-a,b; Simpson & Wintsch, 1989; Vernon, 1991, 2011).As with the study of Menegon et al. (2006), the X-raycompositional mapping does not reveal any zoning ofK, Na and Ca in myrmekite or in the host K-feldspar(Fig. 8d), implying the exclusive role of diffusion ofexternal Na+ along grain boundaries. Temperatureconditions of myrmekite origin can be semi-quantita-tively estimated using lamellar spacing (�10 lm)yielding values in the range of �580–660 �C (Wirth &Voll, 1987; Harlov & Wirth, 2000). The myrmekiterims around K-feldspar porphyroclasts are surroundedby a wider outer rim composed of an aggregate ofbulbous-elongated quartz and partly recrystallized
3 68 F . C H O P I N E T A L .
� 2012 Blackwell Publishing Ltd
plagioclase, which is in chemical and structural conti-nuity with the myrmekitic one (Fig. 8a,b,d). Thismicrostructure is interpreted as the result of dynamiccoarsening of vermicular myrmekites entirely replacingoriginal myrmekitic fronts in some samples (Fig. 11-a,b; Vernon et al., 1983; Vernon, 1991; Menegon et al.,2006). The replacement of K-feldspar by myrmekiteand its recrystallization and coarsening suggest animportant contribution of diffusion along grainboundaries during deformation (Menegon et al., 2006;Vernon, 2011). We suggest that the coarsening ofquartz results from the coalescence of vermicularquartz grains by a grain boundary diffusion processalong the boundaries of plagioclase grains. Similarly,the plagioclase mosaic originates by the reduction ofsurface area and coalescence of plagioclase forminglarger grains of regular shape and size. In the samplefc19A, the high value of N0 and low value of Gt forK-feldspar (Fig. 12c) may be due to the presence ofrecrystallized myrmekites (Figs 5a & 11a).
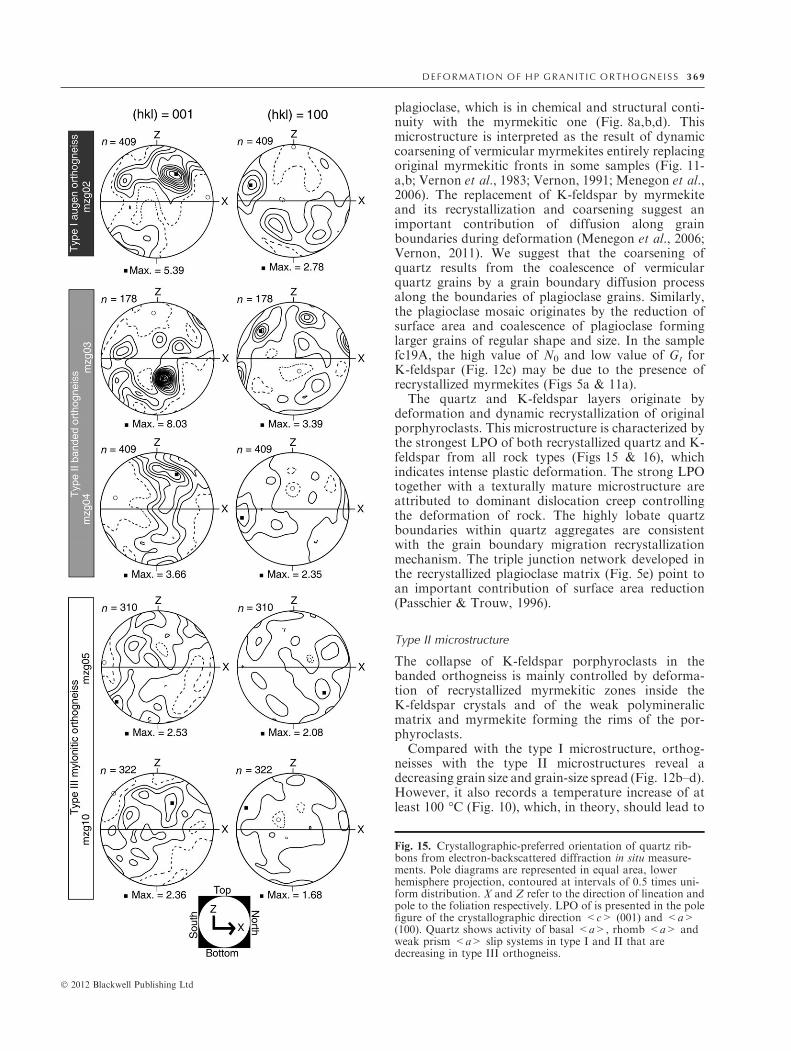
The quartz and K-feldspar layers originate bydeformation and dynamic recrystallization of originalporphyroclasts. This microstructure is characterized bythe strongest LPO of both recrystallized quartz and K-feldspar from all rock types (Figs 15 & 16), whichindicates intense plastic deformation. The strong LPOtogether with a texturally mature microstructure areattributed to dominant dislocation creep controllingthe deformation of rock. The highly lobate quartzboundaries within quartz aggregates are consistentwith the grain boundary migration recrystallizationmechanism. The triple junction network developed inthe recrystallized plagioclase matrix (Fig. 5e) point toan important contribution of surface area reduction(Passchier & Trouw, 1996).
Type II microstructure
The collapse of K-feldspar porphyroclasts in thebanded orthogneiss is mainly controlled by deforma-tion of recrystallized myrmekitic zones inside theK-feldspar crystals and of the weak polymineralicmatrix and myrmekite forming the rims of the por-phyroclasts.
Compared with the type I microstructure, orthog-neisses with the type II microstructures reveal adecreasing grain size and grain-size spread (Fig. 12b–d).However, it also records a temperature increase of atleast 100 �C (Fig. 10), which, in theory, should lead to
Fig. 15. Crystallographic-preferred orientation of quartz rib-bons from electron-backscattered diffraction in situ measure-ments. Pole diagrams are represented in equal area, lowerhemisphere projection, contoured at intervals of 0.5 times uni-form distribution. X and Z refer to the direction of lineation andpole to the foliation respectively. LPO of is presented in the polefigure of the crystallographic direction <c> (001) and <a>(100). Quartz shows activity of basal <a>, rhomb <a> andweak prism <a> slip systems in type I and II that aredecreasing in type III orthogneiss.
D E F O R M A T I O N O F HP G R A N I T I C O RT HO GN E I SS 36 9
� 2012 Blackwell Publishing Ltd
coarsening of the granoblastic microstructure. There-fore, the decrease of the mean grain size duringincreasing temperature has to result either from a dy-namic recrystallization due to an increased appliedstress and ⁄ or faster strain rate (Shimizu, 1998, 2008;Ulrich et al., 2006), or from nucleation of new inter-stitial minerals in feldspar-dominated layers (e.g.Hasalova et al., 2008b). The observed microstructures
are consistent with a hypothesis of nucleation alonglike–like boundaries (Figs 12 & 14), possibly associatedwith the resorption of neighbouring grains. This kind ofnucleation-dominated process is supported by thepresence of highly cuspate boundaries of interstitial K-feldspar and plagioclase suggesting high mobility ofgrain boundaries with increasing SPO (Fig. 13; Gower& Simpson, 1992). In addition, numerous small myr-mekites occur in the form of blebs between adjacent butdifferently oriented recrystallized grains of K-feldspar(Fig. 6c; intergranular myrmekite, Wirth & Voll, 1987)and can also be responsible for the grain-size reduction.Compared with the type I microstructure, the type II
orthogneiss reveals distinct but weaker LPO of quartzand K-feldspar (Figs 15 & 16), incompatible withhigher finite strain (Fig. 3i,j; Heilbronner & Tullis,2006). The prevailing deformation mechanism of thequartz and K-feldspar is dislocation creep, which iscompatible with the strong SPO of both feldspars(Fig. 13), but a diffusion creep component cannot beexcluded from the formation of the plagioclase andmonomineralic aggregates.
Type III microstructure
The type III mylonitic orthogneiss is characterized byfurther decrease in the grain size (Fig. 12) and thereduction of LPO of quartz and K-feldspar (Figs 15 &16). The CSD diagram reveals a further increase of N0
values associated with a marked decrease of Gt valuescompared with the type II microstructure (Fig. 12b–d),which is normally interpreted as the result of an in-creased applied stress (e.g. Lexa et al., 2005). Theseauthors have shown that grain-size reduction driven byan increased stress leads generally to solid-state dif-ferentiation and the development of strong aggregatedistribution. By contrast, the grain-size reduction ofthe type III microstructure is related to an importantgrowth of new minerals in previously monomineralicaggregates, resulting in a strong regular distribution(Fig. 14). Kruse & Stunitz (1999) have shown that theregular (anticlustered) distribution in highly deformedrocks results from grain boundary sliding (Ashby &Verrall, 1973) accompanied by nucleation of minorminerals at matrix grain boundaries, consistent withnumerous highly cuspate interstitial minerals (Fig. 7a–e). We suggest that the transition of type II to type IIImicrostructures is the characteristic for the transitionfrom dislocation creep to a diffusion-accommodatedgrain boundary sliding deformation mechanism en-hanced by nucleation of interstitial minerals in thepresence of fluid (e.g. Berger & Stunitz, 1996; Handy &Stunitz, 2002). Diffusion creep is responsible for amajor weakening of the rock and results in high-strainintensities (Fig. 3), weak SPO (Fig. 13) and LPO(Figs 15 & 16) measured in this rock type. The high Gt
value in the sample mzg05 (Fig. 12d) can be inter-preted as a proxy for relicts of equilibrated andcoarsened mosaics of plagioclase.
Fig. 16. Crystallographic-preferred orientation of K-feldsparribbons using electron-backscattered diffraction in situ mea-surements. Output .ang data files (TSL ASCII) have beentransformed into .ctf file using HKL technology in order to beread and plotted using the PFch5 software (ftp://ftp.dstu.univ-montp2.fr/pub/TPHY/david/pc/). The results are presented aslower hemisphere equal area stereographic projection in homo-geneous sample coordinates [Z direction (pole to foliation) updirected, and X (lineation) in horizontal right direction]. Onlythe crystallographic plane and directions that fit with the mainaxes of the finite strain ellipsoid are plotted. K-feldspar showsstrong activity of (010)[001] glide system in types I and II,whereas this pattern decreases in the type III.
3 70 F . C H O P I N E T A L .
� 2012 Blackwell Publishing Ltd
Role and nature of the fluid phase
The feldspar microstructures (Figs 5d, 6e & 7e) andlining of large K-feldspar grains by albite (Fig. 7b) canbe attributed to the presence of fluids or melts. How-ever, the influx of external fluids or melt has to beassociated with a major modification of bulk-rockchemistry and REE patterns, as shown by Marquer &Burkhard (1992) and Hasalova et al. (2008c) respec-tively. This was not observed in our study (Fig. 4)indicating that the system can be considered as chem-ically closed (see also Lange et al., 2002). Therefore,unlike the microstructural sequence studied by Hasa-lova et al. (2008a,b,c), the microstructural gradient ofthis study originated in a chemically closed system.
The pseudosection modelling shows that for the typeI orthogneiss, the estimated P–T conditions of meta-morphism are close to the wet solidus (Boettcher &Willie, 1968; Huang & Wyllie, 1973, 1981), suggestingthat hydrous fluid may be present. As shown byMenegon et al. (2006), the growth of myrmekite is dueto solid-state diffusion of Na+ along grain boundaries.This is confirmed by Vernon (2011 and referencestherein) who suggested that, apart from solid-statediffusion, the growth of myrmekite may be facilitatedby the presence of hydrous fluid. Indeed, the myr-mekites in the type I orthogneiss (Fig. 8d) show achemical composition typical for Na+ cation transportsimilar to that reported by Menegon et al. (2006). Thismay indicate that the formation of large myrmekitefronts may develop by a mechanism similar to thatproposed by Menegon et al. (2006) and Vernon (2011)under dry conditions or in the presence of hydrousfluids.
However, the estimated P–T conditions for the typeII and type III orthogneisses are above the limit of thewet solidus for a granite system, and therefore, hy-drous fluid cannot be stable (Boettcher & Willie, 1968;Huang & Wyllie, 1973, 1981); under these conditions,the only possible liquid is a silicate melt. The possi-bility of a low amount of melt is indicated not only bypseudosection modelling (Fig. 10e–g) but also by the
evolution from aggregate to random ⁄ regular mineraldistribution (Fig. 14), films and cuspate pools of pla-gioclase, K-feldspar and quartz possibly mimickingformer melt (Figs 5 & 6 & 7; Sawyer, 2001; Rosen-berg, 2001; Marchildon & Brown, 2002; Holnesset al., 2005; Holness, 2008, Holness et al., 2011; Ver-non, 2011).
Strain localization and softening during continentalsubduction
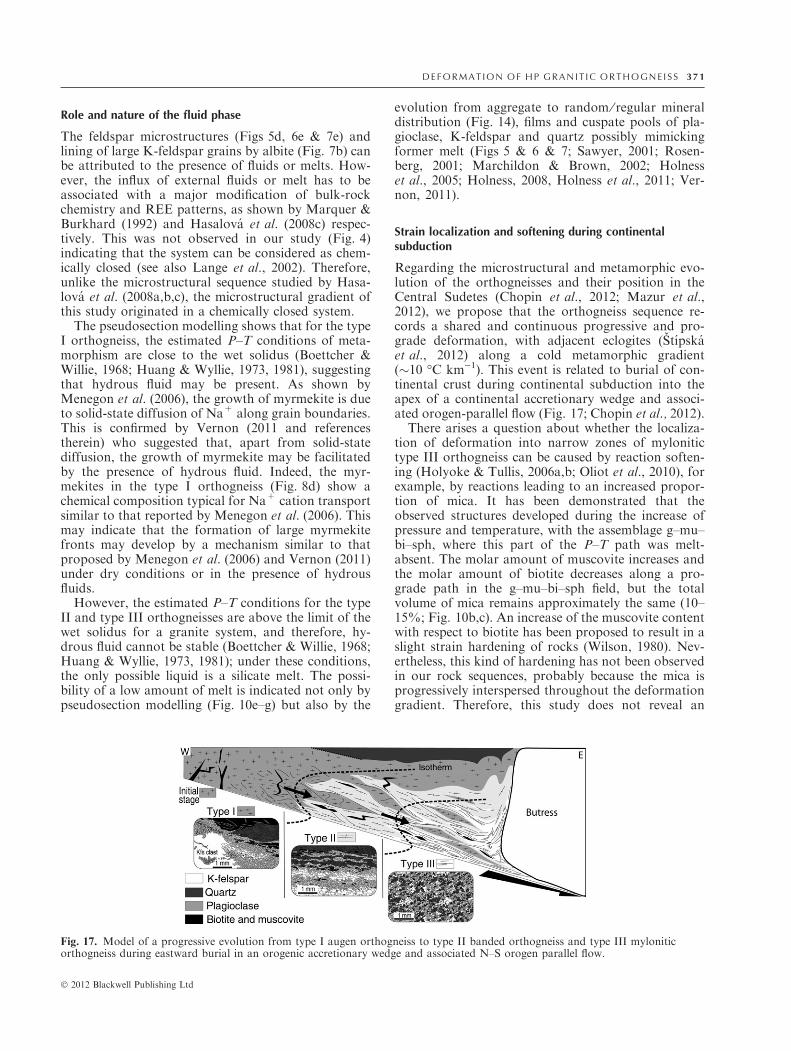
Regarding the microstructural and metamorphic evo-lution of the orthogneisses and their position in theCentral Sudetes (Chopin et al., 2012; Mazur et al.,2012), we propose that the orthogneiss sequence re-cords a shared and continuous progressive and pro-grade deformation, with adjacent eclogites (Stıpskaet al., 2012) along a cold metamorphic gradient(�10 �C km)1). This event is related to burial of con-tinental crust during continental subduction into theapex of a continental accretionary wedge and associ-ated orogen-parallel flow (Fig. 17; Chopin et al., 2012).
There arises a question about whether the localiza-tion of deformation into narrow zones of mylonitictype III orthogneiss can be caused by reaction soften-ing (Holyoke & Tullis, 2006a,b; Oliot et al., 2010), forexample, by reactions leading to an increased propor-tion of mica. It has been demonstrated that theobserved structures developed during the increase ofpressure and temperature, with the assemblage g–mu–bi–sph, where this part of the P–T path was melt-absent. The molar amount of muscovite increases andthe molar amount of biotite decreases along a pro-grade path in the g–mu–bi–sph field, but the totalvolume of mica remains approximately the same (10–15%; Fig. 10b,c). An increase of the muscovite contentwith respect to biotite has been proposed to result in aslight strain hardening of rocks (Wilson, 1980). Nev-ertheless, this kind of hardening has not been observedin our rock sequences, probably because the mica isprogressively interspersed throughout the deformationgradient. Therefore, this study does not reveal an
Fig. 17. Model of a progressive evolution from type I augen orthogneiss to type II banded orthogneiss and type III myloniticorthogneiss during eastward burial in an orogenic accretionary wedge and associated N–S orogen parallel flow.
D E F O R M A T I O N O F HP G R A N I T I C O RT HO GN E I SS 37 1
� 2012 Blackwell Publishing Ltd
increase of fine-grained reaction products that couldmodify the deformation mechanisms and induce amajor softening of the rock. The localization of thedeformation cannot be caused by reactions leading tosubstantial changes of mineral proportions in the senseof Holyoke & Tullis (2006a).
Although the type I augen orthogneiss was de-formed at <15 kbar and <700 �C, the type II ban-ded and type III mylonitic orthogneisses reflectpressures of 19–20 kbar at >700 �C. Thus, the strainpartitioning did not occur at constant P–T conditionsunlike other natural examples (Schulmann et al.,1996, 2008; Zavada et al., 2007; Oliot et al., 2010). Inthis study, the augen orthogneiss was buried to adepth of �40 km along a shear zone a few kilometresthick. Thus, for an inclination of the subduction zoneof �30�, it was passively transported �60 km alongthe shear zone from �40 km to a depth of �70 km,where the mylonitic orthogneiss finally reequilibrated(Fig. 17). The shear strain along the zone may varybetween 20 and 40 c depending on the width of thezone of active deformation (a few kilometres,Fig. 1c). This kind of strain localization requires ex-tremely efficient weakening mechanisms. We arguethat, in the present case, weakening was achieved bythe rheological collapse of strong feldspar porphyro-clasts through the recrystallization of myrmekite inthe type I microstructure and development of thebanded structure of the type II rocks. By contrast, insimilar rock types, it has been proposed that rheo-logical collapse of strong K-feldspar at granulite fa-cies conditions was achieved by recrystallization ofexsolution lamellae (Schulmann et al., 2008; Fran�eket al., 2011). Further weakening and strain localiza-tion were induced by the change of deformationmechanism from dislocation creep to grain boundary-enhanced diffusion creep, possibly in the presence ofmelt, leading to the development of type III myloniticorthogneiss. It is proposed that such a microstruc-tural evolution may represent a model for strainlocalization related to subduction of continental crust(Fig. 17).
ACKNOWLEDGEMENTS
Financial support of the French National GrantAgency (06-1148784 to K. Schulmann) is acknowl-edged. We thank J. Alibon (Universite de Lausanne)and G. Morvan (Universite de Strasbourg) fortechnical support. K. Malamoud (Universite JosephFourier) provided the .ang (TSL ASCII) to .ctf(HKLtechnology) conversion, which was used in thiswork. E. Skrzypek, J. Lehmann, S. Warden (Universitede Strasbourg) and E. Oliot (Universite de Franche-Comte) are thanked for their constructive commentsand discussions. We are grateful to R. Vernon and D.Czeck for detailed constructive reviews. M. Brown isthanked for his editorial work.
REFERENCES
Aleksandrowski, P. & Mazur, S., 2002. Collage tectonics in thenortheasternmost part of the Variscan Belt: the Sudetes,Bohemian Massif. In: Palaeozoic Amalgation of Central Eur-ope, Special Publications, 201 (eds Winchester, J.A., Pharaoh,T.C. & Vernier, J.), pp. 237–277. Geological Society of Lon-don, London.
Aleksandrowski, P., Kryza, R., Mazur, S. & _Zaba, J., 1997.Kinematic data on major Variscan strike-slip faults and shearzones in the Polish Sudetes, northeast Bohemian Massif.Geological Magazine, 134, 727–739.
Anczkiewicz, R., Szczepanski, J., Mazur, S. et al., 2007. Lu-Hfgeochronology and trace element distribution in garnet:implications for uplift and exhumation of ultra-highpressure granulites in the Sudetes, SW Poland. Lithos, 95,363–380.
Ashby, M.F. & Verrall, R.A., 1973. Diffusion-accomodated flowand superplasticity. Acta Metallurgica, 21, 149–163.
Barraud, J., 2006. The use of watershed segmentation and GISsoftware for textural analysis of thin sections. Journal ofVolcanology and Geothermal Research, 154, 17–33.
Bascou, J., Barruol, G., Vauchez, A., Mainprice, D. & Egydio-Silva, M., 2001. EBSD-measured lattice-preferred orientationsand seismic properties of eclogites. Tectonophysics, 342, 61–80.
Berger, A. & Stunitz, H., 1996. Deformation mechanisms andreaction of hornblende: examples from the Bergell tonalite(Central Alps). Tectonophysics, 257, 149–174.
Boettcher, A.L. & Willie, P.J., 1968. Melting of granite withexcess of water to 30 kilobars pressure. Journal of Geology, 76,235–244.
Bose, S. & Sengupta, S., 2003. High temperature mylonitizationof quartzofelspathic gneisses: example from the SchirmacherHills, East Antartica. Gondwana Research, 6, 805–816.
Boullier, A.M. & Gueguen, Y., 1975. SC-mylonites; origin ofsome mylonites by superplastic flow. Contributions to Miner-alogy and Petrology, 50, 93–104.
Brocker, M. & Klemd, R., 1996. Ultrahigh-pressure metamor-phism in the Snie _znik Mountains (Sudetes, Poland): P–Tconstraints and geological implications. Journal of Geology,104, 417–433.
Brocker, M., Klemd, R., Cosca, M., Brock, W., Larionov, A.N.& Rodionov, N., 2009. The timing of eclogite facies meta-morphism and migmatization in the Orlica–Snie _znik complex,Bohemian Massif: constraints from a multimethod geochro-nological study. Journal of Metamorphic Geology, 27, 385–403.
Brocker, M., Klemd, R., Kooijman, E., Berndt, J. & Larionov,A., 2010. Zircon geochronology and trace element character-istics of eclogites and granulites from the Orlica-Snie_znikcomplex, Bohemian Massif. Geological Magazine, 147, 339–362.
Cashman, K.V. & Ferry, J.M., 1988. Crystal size distribution(CSD) in rocks and the kinetics and dynamics of crystalliza-tion; 3. Metamorphic crystallization. Contributions to Miner-alogy and Petrology, 99, 401–415.
Chopin, C., 2003. Ultrahigh-pressure metamorphism: Tracingcontinental crust into the mantle. Earth and Planetary ScienceLetters, 212, 1–14.
Chopin, F., Schulmann, K. & Skrzypek, E., et al., 2012. Crustalinflux, indentation, ductile thinning and gravity redistributionin a continental wedge: building a Moldanubian mantledgneiss dome with underthrust Saxothuringian material(European Variscan belt). Tectonics, in print.
Coggon, R. & Holland, T.J.B., 2002. Mixing properties ofphengitic micas and revised garnet-phengite thermobarome-ters. Journal of Metamorphic Geology, 20, 683–696.
Cooke, R.A. & O�Brien, P.J., 2001. Resolving the relationshipbetween high P-T rocks and gneisses in collisional terranes: anexample from the Gfohl gneiss-granulite association in theMoldanubian Zone, Austria. Lithos, 58, 33–54.
3 72 F . C H O P I N E T A L .
� 2012 Blackwell Publishing Ltd
DeVore, G.W., 1959. Role of minimum interfacial free energy indetermining the macroscopic features of minerals assemblages.Journal of Geology, 67, 211–227.
Dıaz Aspiroz, M. & Fernandez, C., 2003. Characterization oftectono-metamorphic events using crystal size distribution(CSD) diagrams. A case study from the Acebuches metab-asites (SW Spain). Journal of Structural Geology, 25, 935–947.
Don, J., Skacel, J. & Gotowaa, R., 2003. The boundary zone ofthe East and West Sudetes on the 1:50 000 scale geologicalmap of the Velke Vrbno, Stare Mesto and Snieznik Meta-morphic Units. Geologia Sudetica, 35, 25–59.
Dumicz, M., 1989. Nastepstwo serii gnejsowych MasywuSnie _znika w swietle analizy mezostrukturalnej wybranychobszarow w jednostkach geologicznych Miedzygorza i Gi-eratowa (The Snie _znik Mts gneisses sequence in the light ofmesostructural analysis of some areas of the Miedzygorze andGieratow units). Geologia Sudetica, 24, 139–189.
Dumicz, M., 1993. The history of eclogites in the geologicalevolution of the Snie_znik crystalline complex based on meso-structural analysis (Historia eklogitow w ewolucji metamor-fiku Snie _znika w swietle analizy mezostrukturalnej). GeologiaSudetica, 27, 21–48.
Edel, J.B., Schulmann, K. & Holub, F.V., 2003. Anticlockwiseand clockwise rotations of the Eastern Variscides accommo-dated by dextral lithospheric wrenching: palaeomagnetic andstructural evidence. Journal of the Geological Society, 160,209–218.
Evensen, N.M., Hamilton, P.J. & O�Nions, R.K., 1978. Rare-earth abundances in chondritic meteorites. Geochimica etCosmochimica Acta, 42, 1199–1212.
Fischer, G., 1936. Der Bau des Glatzer Schneegebirges.Jahrbuch der Preußischen Geologischen Landesanstalt, 56,712–732.
Flinn, D., 1965. On the symmetry principle and the deformationellipsoid. Geological Magazine, 102, 36–45.
Flinn, D., 1969. Grain contacts in crystalline rocks. Lithos, 2,361–370.
Franek, J., Schulmann, K. & Lexa, O., 2006. Kinematic andrheological model of exhumation of high pressure granulites inthe Variscan orogenic root: example of the Blansky les gran-ulite, Bohemian Massif, Czech Republic. Mineralogy andPetrology, 86, 253–276.
Fran�ek, J., Schulmann, K., Lexa, O. et al., 2011. Origin of felsicgranulite microstructure by heterogeneous decomposition ofalkali feldspar and extreme weakening of orogenic lower crustduring the Variscan orogeny. Journal of Metamorphic Geol-ogy, 29, 103–130.
Gapais, D., 1989. Shear structures within deformed gran-ites: mechanical and thermal indicators. Geology, 17, 1144–1147.
Gower, R.J.W. & Simpson, C., 1992. Phase boundary mobilityin naturally deformed, high-grade quartzofeldspathic rocks:evidence for diffusional creep. Journal of Structural Geology,14, 301–313.
Grant, J.A., 1986. The isocon diagram – a simple solution toGresens� equation for metasomatic alteration. EconomicGeology, 81, 1976–1982.
Hacker, B.R., Andersen, T.B., Johnston, S. et al., 2010. High-temperature deformation during continental-margin subduc-tion & exhumation: the ultrahigh-pressure Western GneissRegion of Norway. Tectonophysics, 480, 149–171.
Handy, M.R., 1990. The solid-state flow of polymineralic rocks.Journal of Geophysical Research: Solid Earth and Planets,95(B6), 8647–8661.
Handy, M.R., 1994. Flow laws for rocks containing two non-linear viscous phases: a phenomenological approach. Journalof Structural Geology, 16, 287–301.
Handy, M.R. & Stunitz, H., 2002. Strain localization by frac-turing and reaction weakening – a mechanism for initiatingexhumation of subcontinental mantle beneath rifted margins.In: Deformation Mechanisms, Rheology and Tectonics: Current
Status and Futur Perspectives, Special Publication, 200 (eds DeMeers, S., De Bresser, J.H.P. & Pennock, G.), pp. 387–407.Geological Society of London, London.
Harlov, D.E. & Wirth, R., 2000. K-feldspar–quartz andK-feldspar–plagioclase phase boundary interactions ingarnet–orthopyroxene gneiss�s from the Val Strona di Ome-gna, Ivrea–Verbano Zone, northern Italy. Contributions toMineralogy and Petrology, 140, 148–162.
Hasalova, P., Janousek, V., Schulmann, K., Stıpska, P. & Erban,V., 2008a. From orthogneiss to migmatite: geochemicalassessment of the melt infiltration model in the Gfohl Unit(Moldanubian Zone, Bohemian Massif). Lithos, 102, 508–537.
Hasalova, P., Schulmann, K., Lexa, O. et al., 2008b. Origin ofmigmatites by deformation-enhanced melt infiltration of or-thogneiss: a new model based on quantitative microstructuralanalysis. Journal of Metamorphic Geology, 26, 29–53.
Hasalova, P., Stıpska, P., Powell, R., Schulmann, K., Janousek,V. & Lexa, O., 2008c. Transforming mylonitic metagranite byopen-system interactions during melt flow. Journal of Meta-morphic Geology, 26, 55–80.
Heilbronner, R. & Tullis, J., 2006. Evolution of c axis pole fig-ures and grain size during dynamic recrystallization: resultsfrom experimentally sheared quartzite. Journal of GeophysicalResearch: Solid Earth and Planets, 111, B10202.
Higgins, M.D., 2000. Measurement of crystal size distributions.American Mineralogist, 85, 1105–1116.
Higgins, M.D., 2002. Closure in crystal size distribution (CSD),verification of CSD calculations, and the significance of CSDfans. American Mineralogist, 87, 171–175.
Higgins, M.D. & Chandrasekharam, D., 2007. Nature of sub-volcanic magma chambers, Deccan province, India: evidencefrom quantitative textural analysis of plagioclase megacrystsin the Giant Plagioclase Basalts. Journal of Petrology, 48, 885–900.
Holland, T.J.B. & Powell, R., 1998. An internally consistentthermodynamic data set for phases of petrological interest.Journal of Metamorphic Geology, 16, 309–343.
Holland, T.J.B. & Powell, R., 2003. Activity-composition rela-tions for phases in petrological calculations: an asymmetricmulticomponent formulation. Contributions to Mineralogy andPetrology, 145, 492–501.
Holness, M.B., 2008. Decoding migmatite microstructures. In:Working with Migmatites, Short Course Series Volume 38 (ed.Sawyer, E.W.), pp. 57–76. Mineralogical Association ofCanada, Quebec City.
Holness, M.B., Cheadle, M.J. & McKenzie, D., 2005. On theuses of changes in dihedral angle to decode late-stagetextural evolution in cumulates. Journal of Petrology, 46,1565–1583.
Holness, M.B., Cesare, C. & Sawyer, E.W., 2011. Melted rocksunder the microscope: microstrucures and their interpretation.Elements, 7, 247–252.
Holyoke, C.W. & Tullis, J., 2006a. The interaction betweenreaction and deformation: an experimental study using abiotite + plagioclase + quartz gneiss. Journal of MetamorphicGeology, 24, 743–762.
Holyoke, C.W. & Tullis, J., 2006b. Mechanisms of weak phaseinterconnection and the effects of phase strength contrast onfabric development. Journal of Structural Geology, 28, 621–640.
Huang, W.L. & Wyllie, P.J., 1973. Melting relations of musco-vite-granite to 35 kbar as a model for fusion of metamor-phosed subducted oceanic sediments. Contributions toMineralogy and Petrology, 42, 1–14.
Huang, W.L. & Wyllie, P.J., 1981. Phase relationships of S-typegranite with H2O to 35 kbar: muscovite granite from HarneyPeak, South Dakota. Journal of Geophysical Research: SolidEarth and Planet, 86(B11), 10515–10529.
Ishii, K., Kanagawa, K., Shigematsu, N. & Okudaira, T., 2007.High ductility of K-feldspar and development of graniticbanded ultramylonite in the Ryoke metamorphic belt, SWJapan. Journal of Structural Geology, 29, 1083–1098.
D E F O R M A T I O N O F HP G R A N I T I C O RT HO GN E I SS 37 3
� 2012 Blackwell Publishing Ltd
Jastrzebski, M., 2009. A Variscan continental collision of theWest Sudetes and the Brunovistulian terrane: a contributionfrom structural and metamorphic record of the StronieFormation, the Orlica-Snie _znik Dome, SW Poland. Interna-tional Journal of Earth Sciences, 98, 1901–1923.
Jastrzebski, M., _Zelazniewicz, A., Nowak, I., Murtezi, M. &Larionov, A.N., 2010. Protolith age and provenance of me-tasedimentary rocks in Variscan allochthon units: U-PbSHRIMP zircon data from the Orlica–Snie _znik Dome, WestSudetes. Geological Magazine, 147, 416–433.
Jerabek, P., Stunitz, H., Heilbronner, R., Lexa, O. & Schul-mann, K., 2007. Microstructural-deformation record of anorogen-parallel extension in the vepor unit, West Carpathians.Journal of Structural Geology, 29, 1722–1743.
Jordan, P.G., 1988. The rheology of polymineralic rocks – anapproach. Geologische Rundschau, 77, 285–294.
Koons, P.O., Rubie, D.C. & Fruehgreen, G., 1987. The effects ofdisequilibrium and deformation on the mineralogical evolu-tion of quartz diorite during metamorphism in the eclogitefacies. Journal of Petrology, 28, 679–700.
Kosulicova, M. & Stıpska, P., 2007. Variations in the transientprograde geothermal gradient from chloritoid-stauroliteequilibria: a case study from the Barrovian and Buchan-typedomains in the Bohemian Massif. Journal of MetamorphicGeology, 25, 19–35.
Kretz, R., 1994. Metamorphic Crystallization. Wiley, New York.Kroner, A., Stıpska, P., Schulmann, K. & Jaeckel, P., 2000.
Chronological constraints on the pre-Variscan evolution ofthe northeastern margin of the Bohemian Massif, CzechRepublic. In: Orogenic processes; quantification and modellingin the Variscan Belt, Special Publication, 179 (eds Franke, W.,Haak, V., Oncken, O. & Tanner, D.), pp. 175–197. GeologicalSociety of London, London.
Kroner, A., Jaeckel, P., Hegner, E. & Opletal, M., 2001. Singlezircon ages and whole rock Nd isotopic systematics of earlyPalaeozoic granitoid gneisses from the Czech and Polish Su-detes (Jizerske hory, Krkonose Mountains and Orlice-SneznikComplex). International Journal of Earth Sciences, 90, 304–324.
Kruse, R. & Stunitz, H., 1999. Deformation mechanisms andphase distribution in mafic high-temperature mylonites fromthe Jotun Nappe, southern Norway. Tectonophysics, 303, 223–249.
Lange, U., Brocker, M., Mezger, K. & Don, J., 2002. Geo-chemistry and Rb-Sr geochronology of a ductile shear zone inthe Orlica-Snie_znik dome (West Sudetes, Poland). Interna-tional Journal of Earth Sciences, 91, 1005–1016.
Lange, U., Brocker, M., Armstrong, R., _Zelazniewicz, A.,Trapp, E. & Mezger, K., 2005. The orthogneisses of the Or-lica–Snie_znik complex (West Sudetes, Poland): geochemicalcharacteristics, the importance of pre-Variscan migmatizationand constraints on the cooling history. Journal of the Geo-logical Society, 162, 973–984.
Lenze, A. & Stockhert, B., 2007. Microfabrics of UHP meta-morphic granites in the Dora Maira Massif, western Alps - Noevidence of deformation at great depth. Journal of Metamor-phic Geology, 25, 461–475.
Lexa, O., 2003. Numerical Approaches in Structural and Micro-structural Analyses. Unpublished PhD thesis, Charles Uni-versity, Prague.
Lexa, O., Stıpska, P., Schulmann, K., Baratoux, L. & Kroner,A., 2005. Contrasting textural record of two distinct meta-morphic events of similar P-T conditions and different dura-tions. Journal of Metamorphic Geology, 23, 649–666.
Lister, G.S. & Hobbs, B.E., 1980. The simulation of fabricdevelopment during plastic deformation and its application toquartzite: the influence of deformation history. Journal ofStructural Geology, 2, 355–370.
Lister, G.S. & Paterson, M.S., 1979. The simulation of fabricdevelopment during plastic deformation and its application toquartzite: fabric transitions. Journal of Structural Geology, 1,99–115.
Lonka, H., Schulmann, K. & Venera, Z., 1998. Ductile defor-mation of tonalite in the Suomusjarvi shear zone, south-wes-tern Finland. Journal of Structural Geology, 20, 783–798.
Marchildon, N. & Brown, M., 2002. Grain-scale melt distribu-tion in two contact aureole rocks: implications for controls onmelt localization and deformation. Journal of MetamorphicGeology, 20, 381–396.
Marquer, D. & Burkhard, M., 1992. Fluid circulation, progres-sive deformation and mass-transfer processes in the uppercrust: the example of basement-cover relationships in theExternal Crystalline Massifs, Switzerland. Journal of Struc-tural Geology, 14, 1047–1057.
Martelat, J.E., Schulmann, K., Lardeaux, J.M., Nicollet, C. &Cardon, H., 1999. Granulite microfabrics and deformationmechanisms in southern Madagascar. Journal of StructuralGeology, 21, 671–687.
Mazur, S. & Aleksandrowski, P., 2001. The Tepla(?) ⁄ Saxothu-ringian suture in the Karkonosze-Izera massif, western Sude-tes, central European Variscides. International Journal ofEarth Sciences, 90, 341–360.
Mazur, S., Aleksandrowski, P., Kryza, R. & Oberc-Dziedzic, T.,2006. The Variscan Orogen in Poland. Geological Quarterly,50, 89–118.
Mazur, S., Szczepanski, P., Turniak, K. & McNaughton, N.J.,2012. Location of the Rheic suture in the eastern BohemianMassif: evidence from detrital zircon data. Terra Nova, inprint.
McLellan, E.L., 1983. Contrasting textures in metamorphic andanatectic migmatites - an example from the Scottish Caledo-nides. Journal of Metamorphic Geology, 1, 241–262.
Menegon, L., Pennacchioni, G. & Stunitz, H., 2006. Nucleationand growth of myrmekite during ductile shear deformation inmetagranites. Journal of Metamorphic Geology, 24, 553–568.
Menegon, L., Pennacchioni, G., Heilbronner, R. & Pittarello, L.,2008. Evolution of quartz microstructure and c-axis crystal-lographic preferred orientation within ductilely deformedgranitoids (Arolla unit, Western Alps). Journal of StructuralGeology, 30, 1332–1347.
Menold, C.A., Manning, C.E., Yin, A., Tropper, P., Chen, X.H.& Wang, X.F., 2009. Metamorphic evolution, mineral chem-istry and thermobarometry of orthogneiss hosting ultrahigh-pressure eclogites in the North Qaidam metamorphic belt,Western China. Journal of Asian Earth Sciences, 35, 273–284.
Oberhansli, R., Hunziker, J.C., Martinotti, G. & Stern, W.B.,1983. Geochemistry, geochronology and petrology of MonteMucrone: an example of eo-Alpine eclogitization of Permiangranitoids in the Sesia–Lanzo zone, Western Alps, Italy.Chemical Geology, 52, 165–184.
Oliot, E., Goncalves, P. & Marquer, D., 2010. Role of plagio-clase and reaction softening in a metagranite shear zone atmid-crustal conditions (Gotthard Massif, Swiss Central Alps).Journal of Metamorphic Geology, 28, 849–871.
Panozzo, R., 1984. Two-dimensional strain from the orientationof lines in a plane. Journal of Structural Geology, 6, 215–221.
Parry, M., Stıpska, P., Schulmann, K., Hrouda, F., Jezek, J. &Kroner, A., 1997. Tonalite sill emplacement at an obliqueplate boundary: northeastern margin of the Bohemian Massif.Tectonophysics, 280, 61–81.
Passchier, C.W. & Trouw, R.A. J., 1996. Microtectonics.Springer-Verlag, Berlin; Heidelberg, New York.
Peterman, E.M., Hacker, B.R. & Baxter, E.F., 2009. Phasetransformations of continental crust during subduction andexhumation: Western Gneiss Region, Norway. EuropeanJournal of Mineralogy, 21, 1097–1118.
Peterson, T.D., 1996. A refined technique for measuring crystalsize distributions in thin section. Contributions to Mineralogyand Petrology, 124, 395–405.
Powell, R., Holland, T. & Worley, B., 1998. Calculating phasediagrams involving solid solutions via non-linear equations,with examples using THERMOCALC. Journal of Metamor-phic Geology, 16, 577–588.
3 74 F . C H O P I N E T A L .
� 2012 Blackwell Publishing Ltd
Pressler, R.E., Schneider, D.A., Petronis, M.S., Holm, D.K. &Geissman, J.W., 2007a. Pervasive horizontal fabric and rapidvertical extrusion: lateral overturning and margin sub-parallelflow of deep crustal migmatites, northeastern BohemianMassif. Tectonophysics, 443, 19–36.
Pressler, R.E., Schneider, D.A., Petronis, M.S., Holm, D.K. &Geissman, J.W., 2007b. Pervasive horizontal fabric and rapidvertical extrusion: lateral overturning and margin sub-parallelflow of deep crustal migmatites, northeastern BohemianMassif. Tectonophysics, 443, 19–36.
Prior, D.J., Boyle, A.P., Brenker, F. et al., 1999. The applicationof electron backscatter diffraction and orientation contrastimaging in the SEM to textural problems in rocks. AmericanMineralogist, 84, 1741–1759.
Prior, D.J., Mariani, E. & Wheeler, J., 2009. EBSD in theearth sciences: applications, common practice, and chal-lenges. In: Electron Backscatter Diffraction in MaterialsScience (eds Schwartz, A.J., Kumar, M., Adams, B.L. &Field, D.P.), pp. 345–360. Springer-Verlag, Berlin; Heidel-berg, New York.
Proyer, A., 2003. The preservation of high-pressure rocks duringexhumation: metagranites and metapelites. Lithos, 70, 183–194.
Ramsay, J.G. & Huber, M.I., 1983. The Techniques of ModernStructural Geology. Volume 1: Strain Analysis. AcademicPress, London.
Randolph, A.D. & Larson, M.A., 1971. Theory of ParticleProcesses. Academic Press, New York.
Rosenberg, C., 2001. Deformation of partially molten granite: areview and comparison of experimental and natural casestudies. International Journal of Earth Sciences, 90, 60–76.
Sacerdoti, M., Labernardiere, H. & Gandais, M., 1980.Transmission electron microscope (TEM) study of geologi-cally deformed potassic feldspars. Bulletin de Mineralogie, 103,148–155.
Sawyer, E.W., 2001. Melt segregation in the continental crust:distribution and movement of melt in anatectic rocks. Journalof Metamorphic Geology, 19, 291–309.
Schmid, S.M. & Casey, M., 1986. Complete fabric analysis ofsome commonly observed quartz c-axis patterns. In: Mineraland Rock Deformation: Laboratory Studies; the PatersonVolume, Geophysical Monograph, 36 (eds Hobbs, B.E. &Heard, H.C.), pp. 263–286. American Geophysical Union,Washington, DC.
Schulmann, K. & Gayer, R., 2000. A model for a continentalaccretionary wedge developed by oblique collision: the NEBohemian Massif. Journal of the Geological Society, London,157, 401–416.
Schulmann, K., Mlcoch, B. & Melka, R., 1996. High-tempera-ture microstructures and rheology of deformed granite, Er-zgebirge, Bohemian Massif. Journal of Structural Geology, 18,719–733.
Schulmann, K., Martelat, J.E., Ulrich, S., Lexa, O., Stıpska, P.& Becker, J.K., 2008. Evolution of microstructure and melttopology in partially molten granitic mylonite: implicationsfor rheology of felsic middle crust. Journal of GeophysicalResearch: Solid Earth and Planets, 113, B10406.
Seng, H., 1936. Die Migmatitfrage und der Mechanismus para-kristalliner Pragung. Geologische Rundschau, 27, 471–492.
Shigematsu, N. & Tanaka, H., 2000. Dislocation creep of fine-grained recrystallized plagioclase under low-temperatureconditions. Journal of Structural Geology, 22(1), 65–79.
Shimizu, I., 1998. Stress and temperature dependence of re-crystallized grain size: a subgrain misorientation model. Geo-physical Research Letters, 25, 4237–4240.
Shimizu, I., 2008. Theories and applicability of grain size piez-ometers: the role of dynamic recrystallization mechanisms.Journal of Structural Geology, 30, 899–917.
Simpson, C. & Wintsch, R.P., 1989. Evidence for deformation-induced K-feldspar replacement by myrmekite. Journal ofMetamorphic Geology, 7, 261–275.
Skrzypek, E., Stıpska, P., Lexa, O., Schulmann, K. & Lexova,M., 2011. Prograde and retrograde metamorphic fabrics – akey for understanding burial and exhumation in orogens(Bohemian Massif). Journal of Metamorphic Geology, 29, 451–472.
Smulikowski, K., 1967. Eklogity Gor Snieznickich w Sudetach(Eclogites of the Snie_znik Mts in the Sudetes). GeologiaSudetica, 3, 157–174.
Stıpska, P., Schulmann, K., Thompson, A.B., Jezek, J. & Kro-ner, A., 2001. Thermo-mechanical role of a Cambro-Ordovi-cian paleorift during the Variscan collision: the NE margin ofthe Bohemian Massif. Tectonophysics, 332, 239–253.
Stıpska, P., Schulmann, K. & Kroner, A., 2004. Vertical extru-sion and middle crustal spreading of omphacite granulite: amodel of syn-convergent exhumation (Bohemian Massif,Czech Republic). Journal of Metamorphic Geology, 22, 179–198.
Stıpska, P., Pitra, P. & Powell, R., 2006. Separate or sharedmetamorphic histories of eclogites and surrounding rocks? Anexample from the Bohemian Massif. Journal of MetamorphicGeology, 24, 219–240.
Stıpska, P., Chopin, F. & Skrzypek, E.. et al., 2012. The juxta-position of eclogite and mid-crustal rocks in the Orlica-Snie_znik dome, Bohemian Massif. Journal of MetamorphicGeology, in print. doi: 10.1111/j.1525-1314.2011.00964.x.
Stockhert, B., 2002. Stress and deformation in subduction zones:insight from the record of exhumed metamorphic rocks. In:Deformation Mechanisms, Rheology and Tectonics, SpecialPublications, 200 (eds De Meers, S., Drury, M.R., De Bresser,J.H.P. & Pennock, G.), pp. 255–274. Geological Society ofLondon, London.
Stockhert, B. & Renner, J., 1998. Rheology of crustal rocks atultrahigh pressure. In: When Continents Collide: Geodynamicsand Geochemistry of Ultrahigh-Pressure Rocks (eds Hacker,B.R. & Liou, J.G.), pp. 57–95. Kluwer Academic Publishers,Dordrecht.
Stunitz, H. & Fitzgerald, J.D., 1993. Deformation of granitoidsat low metamorphic grade 2. Granular Flow in albite-richmylonites. Tectonophysics, 221, 299–324.
Terry, M.P. & Heidelbach, F., 2006. Deformation-enhancedmetamorphic reactions and the rheology of high-pressureshear zones, Western Gneiss Region, Norway. Journal ofMetamorphic Geology, 24, 3–18.
Ulrich, S., Thompson, A.B., Schulmann, K. & Casey, M., 2006.Microstructure mechanism map of dynamically recrystallizedmarble. Tectonophysics, 412, 173–182.
Vernon, R.H., 1976. Metamorphic Processes: Reactions andMicrostructure Development. Wiley, New York.
Vernon, R.H., 1991. Questions about myrmekite in deformedrocks. Journal of Structural Geology, 13, 979–985.
Vernon, R.H., 2011. Microstructures of melt-bearing regionalmetamorphic rocks. In: Origin and Evolution of PrecambrianHigh-Grade Gneiss Terrains, With Special Emphasis on theLimpopo Complex of Southern Africa (eds van Reenen, D.D.,Kramers, J.D., McCourt, S. & Perchuk, L.L.), GeologicalSociety of America Memoirs, 207, pp. 1–12.
Vernon, R.H., Williams, V.A. & D�Arcy, W.F., 1983. Grainsizereduction and foliation development in a deformed granitoidbatholith. Tectonophysics, 92, 123–145.
White, R.W., Powell, R., Holland, T.J.B. & Worley, B.A., 2000.The effect of TiO2 and Fe2O3 on metapelitic assemblages atgreenschist and amphibolite facies conditions: mineralequilibria calculations in the system K2O-FeO-MgO-Al2O3-SiO2- H2O-TiO2-Fe2O3. Journal of Metamorphic Geology, 18,497–511.
White, R.W., Powell, R. & Holland, T.J.B., 2007. Progressrelating to calculation of partial melting equilibria formetapelites. Journal of Metamorphic Geology, 25, 511–527.
Willaime, C., Christie, J.M. & Kovacs, M.-P., 1979. Experi-mental deformation of K-feldspar single crystals. Bulletin deMineralogie, 102, 168–177.
D E F O R M A T I O N O F HP G R A N I T I C O RT HO GN E I SS 37 5
� 2012 Blackwell Publishing Ltd
Wilson, C.J.L., 1980. Shear zones in a pegmatites: a study ofalbite-mica-quartz deformation. Journal of Structural Geology,2, 203–209.
Wirth, R. & Voll, G., 1987. Cellular intergrowth between quartzand sodium-rich plagioclase (myrmekite) – an analogue ofdiscontinuous precipitation in metal alloys. Journal of Mate-rials Science, 22, 1913–1918.
Zavada, P., Schulmann, K., Konopasek, J., Ulrich, S. & Lexa,O., 2007. Extreme ductility of feldspar aggregates – melt-en-hanced grain boundary sliding and creep failure: rheologicalimplications for felsic lower crust. Journal of Geophysical Re-search: Solid Earth and Planets, 112, B10210.
_Zelazniewicz, A., Nowak, I., Larionov, A. & Presnyakov, S.,2006. Syntectonic Lower Ordovician migmatite and post-tec-tonic Upper Visean syenite in the western limb of the Orlica-Snie _znik Dome, West Sudetes: U-Pb SHRIMP data fromzircons. Geologia Sudetica, 38, 63–80.
Zhao, Z.Y., Wei, C.J. & Fang, A.M., 2005. Plastic flow of coesiteeclogite in a deep continent subduction regime: microstruc-tures, deformation mechanisms and rheologic implications.Earth and Planetary Science Letters, 237, 209–222.
Received 10 April 2011; revision accepted 12 December 2011.
3 76 F . C H O P I N E T A L .
� 2012 Blackwell Publishing Ltd