Embed Size (px)
Citation preview
Precambrian Research, 32 (1986) 133--154 133 Elsevier Science Publishers B.V., Amsterdam -- Printed in The Netherlands
PROFILES OF ELEMENTAL CONCENTRATIONS IN PRECAMBRIAN PALEOSOLS ON BASALTIC AND GRANITIC PARENT MATERIALS
MICHAEL M. KIMBERLEY
Department of Marine, Earth & Atmospheric Sciences, North Carolina State University, Raleigh, NC 27695-8208 (U.S.A.)
DAVID E. GRANDSTAFF
Department of Geology, Temple University, Philadelphia, PA 19122 (U.S.A.)
(Received September 18, 1985; revision accepted January 26, 1986)
ABSTRACT
Kimberley, M.M. and Grandstaff, D.E., 1986. Profiles of elemental concentrations in Pre- cambrhn paleosols on basaltic and granitic parent materials. Precambrian Res., 32: 133--154.
Profiles of elemental concentrations are interpreted for four Precambrian paleosols, two develoved on basalt and two on granodiorite. All four paleosols appear to be the erosional remnants of originally thick soil-saprolite regoliths. The granitic paleosols are in South Africa where they underlie the 2.9--3.0 Ga Pongola Supergroup and the 2.8--2.9 Ga Dominion Reef Conglomerate. One of the basaltic paleosols also occurs in South Africa where it caps the Ventersdorp Basalt and underlies the 2.3 Ga Black Reef Quartzite. The other basaltic paleosol underlies sandstone of the 2.7 Ga Timiskaming Group in the Abitibi belt of the Canadian Shield. All four paleosols exhibit pronounced upward loss of sodium but no consistent loss of the heavier alkali elements, rubidium and cesium. Iron decreases upward above iron-rich basaltic parent rocks but there is no consistent loss of iron above iron-poor granitic parents. The rare-earth elements are less fractionated than during intensive modern weathering. Uranium locally has been fractionated from thorium, possibly due to oxidative dissolution during Precambrian weathering.
INTRODUCTION
The prime attributes studied in soil and paleosol are fabric and composi- tion. Many Precambrian paleosols have suffered metamorphic loss of primary fabric, at least partially. For these paleosols, the interpretation of chemical composition is potentially more informative of weathering conditions than is the study of fabric. Until recently, multi-elemental profiles through Pre- cambrian paleosols have been scarce (Holland, 1984). However, analysis of paleosol profiles is increasing rapidly (e.g., Grandstaff et al., 1986).
The purpose of this paper is to compare profiles of elemental concentra- tions in two basaltic and two granitic Precambrian paleosols to identify com- monly observed compositional trends. The metamorphic grade of these
0301-9268/86/$03.50 © 1986 Elsevier Science Publishers B.V.
134
paleosols is generally low but they all formed at major geologic contacts along which voluminous ground water may have flowed. Some common trends therefore may be related to common diagenesis rather than common weathering reactions.
The term paleosol is used to refer to the entire lithified regolith, not just the surficial material which was affected by plants. The bulk of Precambrian paleosol probably originated as saprolite. Modern saprolite is soft, weathered rock which continues to display primary rock fabric. It is devoid of plant roots except along some fractures. During weathering, saprolite has lost ions to solution and has thereby become porous but has not changed much in volume (Gardner et ah, 1978). Saprolite occurs commonly on igneous and metamorphic rocks in unglaciated areas and extends to depths of tens of meters.
Saprolite generally is overlain by a few tens of centimeters of soil devoid of rock fabric. This soil is less cohesive than the underlying saprolite and has much less preservation potential. Lowermost saprolite, the portion with the greatest preservation potential, is characterized by blocks of unweathered rock which are surrounded by rims of progressively more weathered materi- al. Both color and grainsize distinguish these rims from the enclosed un- weathered rock in m o d e m saprolite but even low-grade metamorphism par- tially homogenizes both color and grainsize.
CHEMICAL ANALYSIS OF THE PALEOSOLS
Given spatial irregularity of weathering, Precambrian paleosol may be much less homogeneous than most other rock types. Moreover, the geometry of the inhomogeneity of paleosol is generally irregular, unlike bedding in sedimentary rocks or compositional bands in gneiss. This inhomogeneity presents a challenge to the analyst who must either physically homogenize the rock or document the textural relationship of the material being analyzed.
The concentration of an easily leached element, e.g., sodium, commonly varies by an order of magnitude through a paleosol profile. For most analyti- cal techniques, accuracy is adversely affected by such variation but the technique used herein, instrumental neutron-activation analysis (INAA) is less affected than others (Muecke, 1980).
In many branches of petrology, experience has shown that analysis of a particular set of elements is adequate to predict the behavior of other ele- ments and to deduce the processes which produced a given rock suite. In the study of Precambrian paleosol, there is insufficient experience to justify such assumptions and the analyst is well advised to measure the concentra- tions of as many elements as possible. Fortunately, the increasing use of multi-elemental techniques like INAA and ICP (induction-coupled argon- plasma emission spectrometry) facilitate the simultaneous measurement of many elements.

135
GEOLOGIC SETTINGS OF THE PALEOSOLS
Elemental profiles are presented for two paleosols which developed on granitic and two on basaltic parent materials. All four paleosols are overlain by fluvial clastic sedimentary rocks and all four apparently were partly eroded prior to burial. The basaltic paleosols are referred to by the same names as the parent rock units (Kinojevis and Ventersdorp Basalts) whereas the granitic paleosols are named for the overlying clastic sedimentary units (Dominion Reef Conglomerate and Pongola Supergroup). The granitic paleosols are older than the basaltic examples, the Pongola Supergroup being about 2.9--3.0 Ga and the Dominion Reef Conglomerate about 2.8-- 2.9 Ga (Grandstaff et al., 1986). The Kinojevis and Ventersdorp paleosols are, respectively, about 2.7 Ga and 2.3 Ga (Button and Tyler, 1981; Cattell et al., 1984).
Although it is probable that at least part of the observed alteration of these putative paleosols was subaerial, much of the alteration may have been produced by water which had permeated a few meters of overlying sand be- fore weathering the igneous rocks. This type of saprolite development has affected sub-Cretaceous rocks near Washington, DC and may result in an age of weathering which is a few tens of million years younger than the immedi- ately overlying sand (Pavich and Obermeier, 1985).
One type of evidence against post-burial alteration would be variability in the degree of weathering of observed rip-up clasts. However, this type of variability has not yet been found above the paleosols described herein. There is no known process which would significantly increase the oxidation state of descending subsurface water and so even if oxidation had occurred under a thin cover of sand, documentation of oxidation would provide some information about atmospheric conditions.
Grandstaff et al. (1986) describe the geologic settings and present addi- tional compositional data for the pre-Pongola paleosol in a core near Jerico Dam, west of Amsterdam, and the Dominion paleosol in core ORHG, 15 km west of Klerksdorp, also in Transvaal, South Africa. They also defend the in- terpretation that the observed alteration is at least partly due to Precambrian weathering. The pre-Pongola, Dominion, and Ventersdorp paleosols of South Africa have long been attributed to weathering (Button and Tyler, 1981). Several paleosols occur within the Ventersdorp Basalt. The particular paleo- sol described herein is at the very top of the basalt, beneath the Black Reef Quartzite on the property of the President Stegn Mine, near Welkom, O.F.S. The core samples analyzed were obtained at the Anglo-American core yard in Welkom by D.E. Grandstaff.
Outcrop of the Kinojevis paleosol occurs at two localities in the Kirkland Lake area of northern Ontario near the major highway that connects Toron- to and Timmins (Fig. 1). These paleosol localities were recently discovered by L.S. Jensen who has mapped this area for 20 years with the Ontario Geological Survey. The paleosol underlies fluvial sandstone of the basal

136
\
Fig. 1. Loca t i on m a p for the o u t c r o p s o f Kinojevis paleosol in Ontar io , Canada. This area is rough ly 48014 ' n o r t h and 80o16 ' west. The Blanche River o u t c r o p is labeled B and the Kenogami Lake o u t c r o p is labeled K.
Timiskaming Group within the Abitibi belt of the Superior Province of the Canadian Shield (Kimberley et al., 1985). This 2.7 Ga paleosol is developed on the Kinojevis Basalt, a highly magnesian and/or ferriferous basalt (Jensen, 1976; Jensen and Langford, 1983).
Relative to other stratigraphic horizons, the Kinojevis-Timiskaming contact is poorly exposed in the Kirkland Lake area, apparently because of the relative ease of erosion of the paleosol. The contact dips almost vertically along the 20 km of strike length and thick peat covers the glacially scoured contact. Despite diligent searches by government geologists and gold pros- pectors, continuous exposure across the contact is known at only one locali- ty, on the east shore of Blanche River opposite Kenogami Landing where there is continuous outcrop from unweathered basalt through about 50 cm of sodium-depleted paleosol to overlying sandstone. The paleosol appears to be anomalously thin in this outcrop and this thinness probably minimized glacial erosion. The paleosol contains mineralized quartz veins which also helped resist erosion but which complicate interpretation of the chemical profile. The Blanche River profile is therefore presented in Table I rather than graphically like the other profiles in this paper.
The Blanche River outcrop of the Kinojevis paleosot is characterized by a lime-green sericite which decreases downward into darker chloritic basalt (Fig. 2). Samples at and below 50 cm display only slight coloration and their compositions in Table I do not exhibit obvious alteration by weathering. The Blanche River outcrop is most important for its textural evidence of a

TABLE I
Composition of paleosol profile at Blanche River
137
BT 5 c m 1 5 c m 2 5 c m 5 0 c m 9 0 c m 1 4 4 c m 2 6 7 c m
Na 1.26 1.51 0.29 0.72 2.05 2.09 2.88 0.92 Mg 2.14 2.59 6.13 2.69 2.55 2.14 2.86 2.07 A1 7.54 7.16 5.02 8.34 8.86 8.66 9.52 6.15 Sc 40.1 37.1 36.0 38.0 38.7 42.3 46.6 36.9 Ti 0.31 0.48 0.17 0.47 0.48 0.47 0.39 0.48 V 292 312 26 342 352 348 363 287 Cr 432 452 434 459 452 455 518 378 Mn 1470 649 179 889 716 805 834 1223 Fe 4.32 7.65 8.21 8.73 6.82 7.09 7.29 6.32 Co 35.1 38.5 26.6 38.5 37.1 31.5 23.2 28.8 As 3.2 n.d. n.d. n.d. n.d. n.d. 28.4 28.1 Rb 21.2 n.d. 40.1 n.d. n.d. n.d. n.d. n.d. Sb 0.23 n.d. 0.14 0.36 0.47 n.d. 1.78 1.15 Cs 2.75 n.d. 2.30 2.30 n.d. n.d. n.d. n.d. Ba 189 n.d. 302 n.d. n.d. n.d. n.d. n.d. La 0.83 1.78 0.70 0.54 1.85 2.45 2.12 2.39 Sm 0.92 1.37 1.40 0.86 1.04 1.19 1.42 1.35 Eu 0.11 0.23 0.36 0.11 0.11 0.18 0.32 0.20 Dy 0.90 1.23 0.84 n.d. 2.67 1.73 2.00 1.35 Yb 1.24 0.99 1.58 1.10 1.22 1.31 1.26 1.26 Lu 0.52 0.38 0.63 0.16 0.27 0.41 0.41 0.25 Hf 0.23 0.59 0.86 1.10 0.50 0.50 0.70 n.d.
INAA analyses of paleosol beneath Archean Timiskaming sandstone near Kirkland Lake, Canada. BT stands for basal Timiskaming sandstone. Samples of Kinojevis Basalt are labeled by their stratigraphic distance beneath the Timiskaming sandstone. Sodium, aluminum, iron, magnesium, and titanium are in percent. All other concentrations are in ppm.
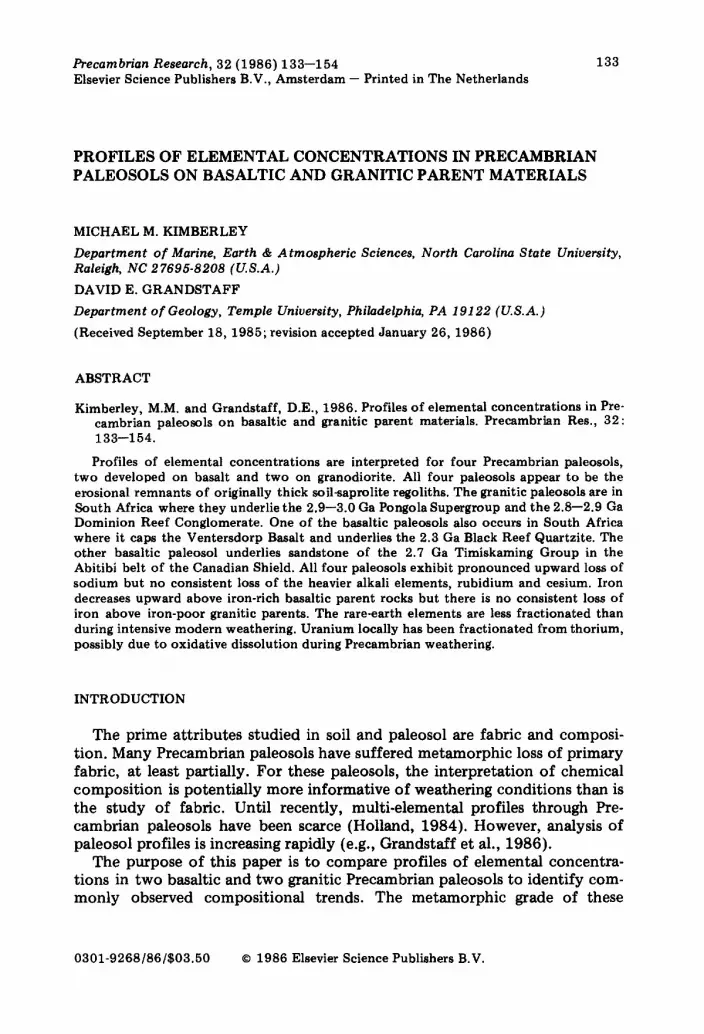
weathering origin for the sub-Timiskaming alteration, i.e., rip-up clasts of paleosol in the immediately overlying sandstone, a fracture pattern which resembles ped structure, and continuous gradation in color downward into unweathered basalt (Fig. 2). Fortunately, a thick unmineralized profile through this alteration zone is found in a drill core (#KLDC of Ontario Geological Survey) from about 2 km north-northwest of the town of Kirkland Lake (see Figs. 3, 4, 11, 18, 24).
Discontinuous outcrop of the Kinojevis--Timiskaming contact occurs along the south shore of Kenogami Lake, about 5 km west of the Blanche River outcrop (Fig. 1). The lack of continuous outcrop precludes precise determination of stratigraphic relationships but the paleosol profile is undoubtedly thicker than that along the Blanche River, perhaps a few tens of meters thick. Although absolute stratigraphic distances are unknown, relative positions have been estimated for five samples which have been analyzed to illustrate the chemical profile (Figs. 5, 6, 12, 13, 19). The upper-
138
FEATURES OF THE 2.7 Ga CONTACT AT BLANCHE RIVER
o •
TIMISKAMING
Ripped-up clastsof soft paleosol
Slightly transported so~l
Color altered
Highly fractured
Remnant of ped surface
KINOJEVIS
Fig. 2. Cross-sect ion of the paleosol deve loped on Kinojevis basal t at the Blanche River ou tc rop . Th ickness of the color-a l tered zone is less t h a n 2 m. Rip-up clasts of paleosol wi th in the basal T imi skaming s a n d s t o n e are a few cen t ime te r s in d iameter .
most sample in each of these figures is the lowest exposure of Timiskaming sandstone and the lowermost sample is fairly fresh basalt. The intervening three samples are paleosol. Recent weathering is not likely to have altered elemental concentrations in either the Kenogami Lake or the Blanche River outcrops, given only 80 frost-free days per year. All other samples described in this paper come from deep drill core.
B E H A V I O R O F A L K A L I E L E M E N T S IN THE P A L E O S O L S
In the drill core from north of the town of Kirkland Lake (Fig. 3), the Kinojevis paleosol grades upward through about 20 m from fresh basalt with over 2% Na to paleosol with one-tenth as much sodium. In the Kenogami Lake outcrop, the Kinojevis paleosol also displays a pronounced depletion in sodium, except for the uppermost sample (see Fig. 5). Like the Kenogami Lake outcrop, the Blanche River profile is peculiar in that the uppermost paleosol sample, only 5 cm beneath unquestionable sandstone, contains sub- stantial sodium (1.51% Na) whereas subadjacent paleosol samples at 15 and 25 cm contain much less sodium (0.29 and 0.72% Na in Table I).
The sodium profile through the Timiskaming--Kinojevis contact at the Blanche River outcrop (Table I) probably records Archean weathering but is not as easily interpreted as are the profiles in the drill core and the Kenogami Lake outcrop; the expected variation in other elements is not apparent in the Blanche River outcrop (Table I). The thickness of sodium-depleted paleosol at the Blanche River outcrop is less than 50 cm whereas it exceeds 12 m in the drill core (Fig. 3). The entire profile of the Blanche River outcrop (Table I) corresponds to about one-third of the core between the lowermost two samples in Fig. 3.

139
0.0 0.5 I.0 1.5 2.0 2.5 % Na
Timiskaming - sandstone
\ paleosol developed
1 on Kinojevis basalt
0.0 0.5 1.0 I.5 2.0
+ 20 m
+ 10m
+ Om
2.5 % Na
Fig. 3. Chemical profile of sodium in a 2.7 Ga paleosol on Kinojevis Basalt from a core near Kirkland Lake, Canada.
The thinness and minimal evidence of weathering in the Blanche River profile combine to indicate that it may represent the bottom of an originally thick saprolite which was almost entirely eroded before burial under Timis- kaming sandstone. In addition to its thinness, the Blanche River profile suf- fers from some compositional peculiarities. The outcrop exhibits hydro- thermal veins which appear to have been emplaced prior to paleosol weath- ering. Despite efforts to avoid sampling these veins, the lowermost analyzed sample exhibits anomalous gold (16 ppb), arsenic and antimony (Table I). Moreover, a strong, but unquantified, NAA peak was observed for tellurium. This mineralization may have produced sufficient primary heterogeneity to account for the irregular chemical profile, e.g., depletion of aluminum, titanium, and vanadium at 15 cm depth (Table I).
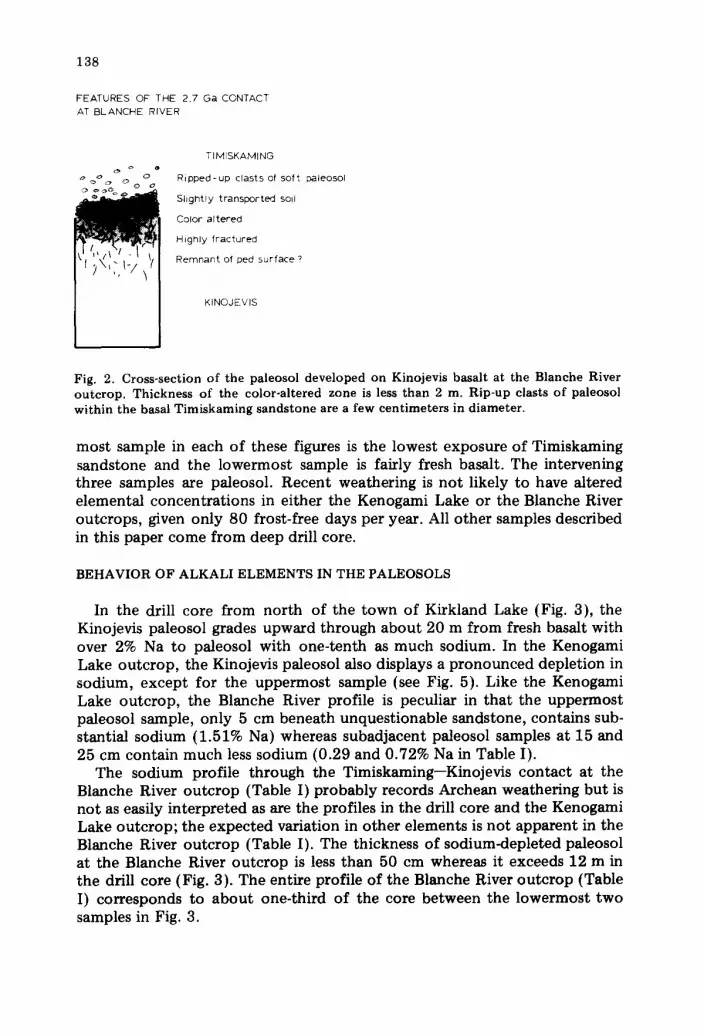
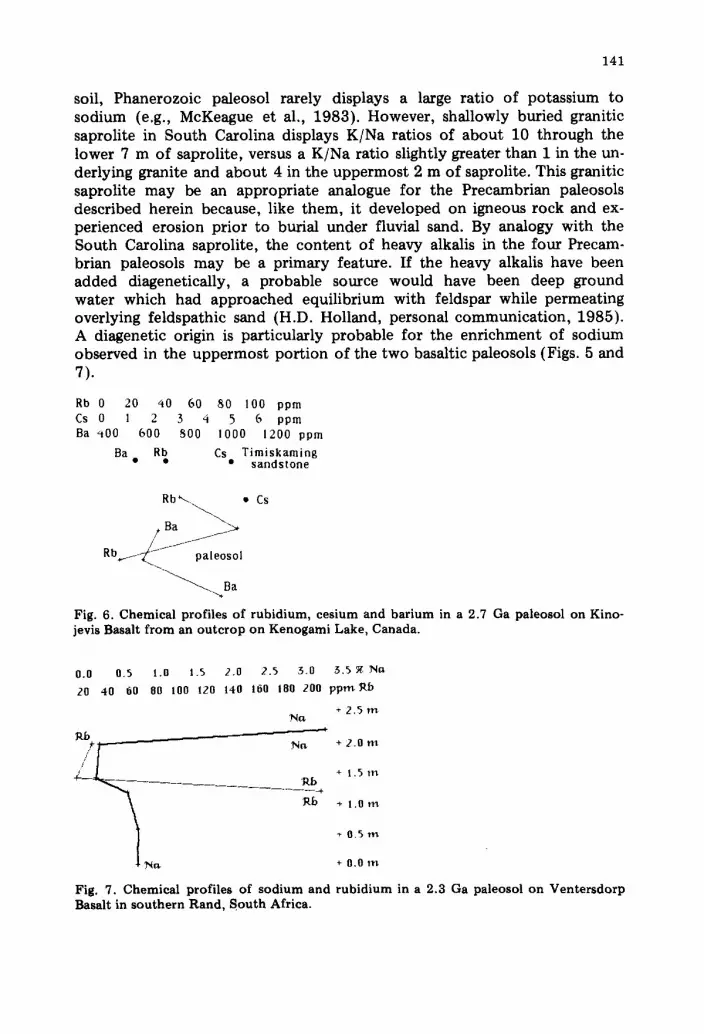
As in the Kenogami Lake profile, the basaltic Ventersdorp paleosol dis- plays a progressive upward loss of sodium, capped by a surficial layer of pro- nounced sodium enrichment (see Fig. 7). Both of the granitic paleosols (Dominion and prePongola) display only progressive upward loss of sodium (see Figs. 8, 10). This pronounced upward loss of sodium is the most con- sistent feature of paleosols of all ages. In the core from near Kirkland Lake (Fig. 3), the immediately overlying Timiskaming sandstone also is sodium- poor, apparently because of physical mixing with paleosol, but stratigraphi- tally higher sandstone contains over 2% Na. A sodium content in excess of 2% Na is not unexpected for the quartz-poor Timiskaming sandstones.
Upward loss of sodium is as characteristic of the granitic paleosols as it is of the basaltic examples. Upward loss of sodium is well documented in both the Dominion and prePongola profiles (see Figs. 8, 10). In the Dominion core, the lowermost three samples are quite fresh, with over 3% Na (see Fig. 8). Above that, sodium decreases to less than 0.3% Na through a transition zone which is about 5 m thick. Sodium decreases by another factor of two

140
through the uppermost 5 m of the paleosol. The Dominion profile may be classified on the basis of sodium content into a well weathered zone which is 5 m thick (uppermost seven samples), a weakly weathered zone which is roughly 5 m thick {0.5--2% Na), and an underlying unweathered zone. Al- though the uppermost 5 m are classified as 'well weathered' there probably was overlying saprolite and soil which was eroded prior to burial by the Dominion Reef Conglomerate. In the pre-Pongola paleosol, sodium similarly approaches complete removal in the uppermost 6 m but exceeds 3% Na in fresh granodiorite (see Fig. 10).
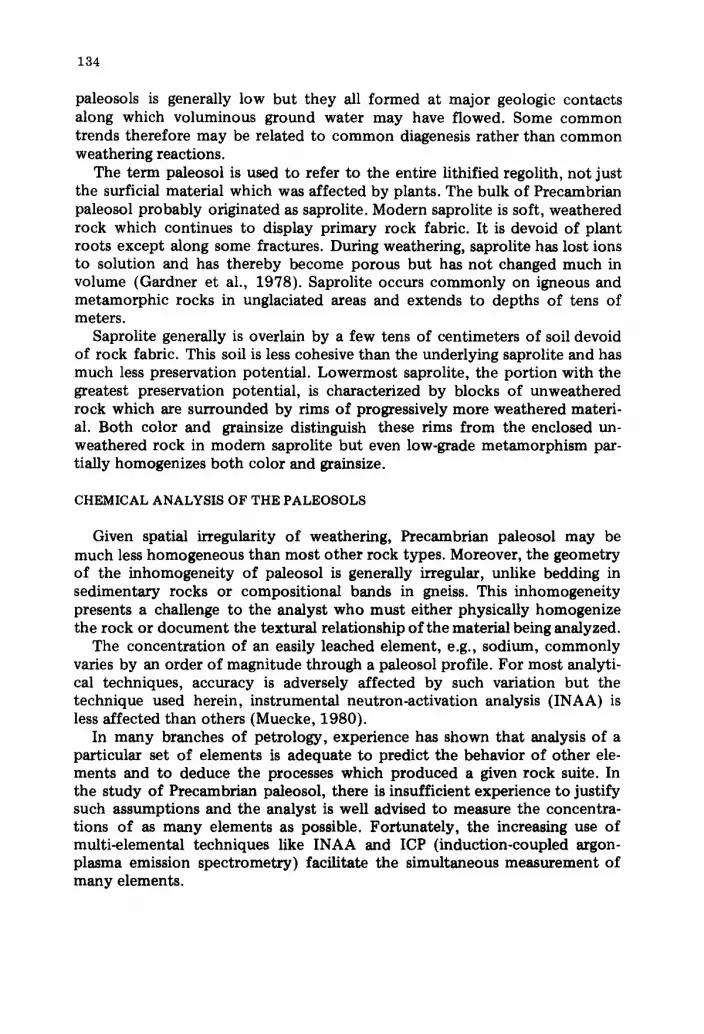
In stark contrast with sodium, the heavier alkali elements (K, Rb, Cs) commonly display no consistent upward decrease in the Precambrian paleo- sols studied to date. Potassium analyses for the Dominion and pre-Pongola paleosols are presented in Grandstaff et al. (1986). Heavier alkalis in all four paleosols are illustrated in Figs. 4, 6, 7, 8, and 10. Only the granitic paleosols (Dominion and pre-Pongola) contain sufficient rubidium and cesium to be uniformly detectable by INAA. These two elements correlate fairly closely in the two granitic paleosols but there is no obvious trend, except for a tendency for the highest concentration to occur in the middle of the paleo- sol (Figs. 8, 10). The Kinojevis and Ventersdorp profiles are similarly fea- tureless, except for one sample in the middle of the Ventersdorp profile which contains an order of magnitude more rubidium than other Venters- dorp samples (Fig. 7). The only detectable cesium in the Ventersdorp profile also occurs in this sample (6.3 ppm Cs at 1.2 m). The relative abundance of potassium and heavier alkalis in these and other Precambrian paieosols com- monly results in remarkably large ratios of potassium to sodium (e.g., Kimberley et al., 1980).
Modern soil exhibits severe loss of all alkalis (Na, K, Eb, Cs) especially under tropical conditions (e.g., Matheis and Pearson, 1982). Like modem
AIo 0 I 0 20 50 40 50 60 70 flO 90 ppm
Cs 0 I 2 3 4 5 6 7 8 9 ppm
Ba 0 200 400 600 800 ppm Cs Ba Ab
Cs~- /+ Ba \ R b +25m /
"YN/ paleosol j / +15 ,-.
Ba Cs Rb *1o m
Na 0 Mg 0
AI% 5
I 2 3 '~ Na 1 2 3 <Mg
6 "7 S 9 10 11 12 13
AI Na Mg TJmiskaming sands tone
Na - ~ I Nlg .... AI i
/J
paleosol , .
~', Na AI l '*Mg ~'- ,
Fig. 4. ( lef t ) Chemica l prof i les of r u b i d i u m , cesium and ba r ium in a 2.7 Ga paleosol o n K i n o j e v i s Basalt f r o m a core near Ki rk land Lake, Canada.
Fig. 5. ( r ight ) Chemica l prof i les of sodium, a l u m i n u m and m a g n e s i u m in a 2.7 Ga paleosol f rom an o u t c r o p o n Kenogami Lake, Canada.
141
soil, Phanerozoic paleosol rarely displays a large ratio of potassium to sodium (e.g., McKeague et al., 1983). However, shallowly buried granitic saprolite in South Carolina displays K/Na ratios of about 10 through the lower 7 m of saprolite, versus a K/Na ratio slightly greater than 1 in the un- derlying granite and about 4 in the uppermost 2 m of saprolite. This granitic saprolite may be an appropriate analogue for the Precambrian paleosols described herein because, like them, it developed on igneous rock and ex- perienced erosion prior to burial under fluvial sand. By analogy with the South Carolina saprolite, the content of heavy alkalis in the four Precam- brian paleosols may be a primary feature. If the heavy alkalis have been added diagenetically, a probable source would have been deep ground water which had approached equilibrium with feldspar while permeating overlying feldspathic sand (H.D. Holland, personal communication, 1985). A diagenetic origin is particularly probable for the enrichment of sodium observed in the uppermost portion of the two basaltic paleosols (Figs. 5 and 7).
Rb 0 20 ~0 60 80 I00 ppm Cs 0 I 2 3 4 5 6 ppm Ba ~00 600 800 I 0 0 0 1200 ppm
Ba • Rb Cs Timiskaming • * s a n d s t o n e
Rb ~'-- • Cs
? Ba
R b . _ - / - ' ~ ~ I paleosol
Ba
Fig. 6. Chemical prof i les o f rubidium, ces ium and barium in a 2.7 Ga paleoso l on Kino- jevis Basalt f rom an outcrop on Kenogami Lake, Canada.
0.0 0.5 1.0 1.5 2.0 2.5 3.0 3.5 % N[~ 20 40 60 80 I00 120 140 160 180 200 p p m ~ b
+ 2 . 5 m No
Rb
¢//" 4- . . . . __ l~.b + t. 5 m
+ 1.0 m
. + 0 . 0 m
Fig. 7. Chemical prof i les o f s o d i u m and rubidium in a 2 .3 Ga p a l e o s o l on Ventersdorp Basalt in southern Rand, S o u t h Africa.
142
0.0 0.5 1.0 1.5 2.0 2.5 3.0 3.5 %No 50 I00 150 200 250 300 p p m 2 3 4 5 6 7 8 9 p p m Cs
+ 1 5 m
/ ¢ . I
/ . j l ....
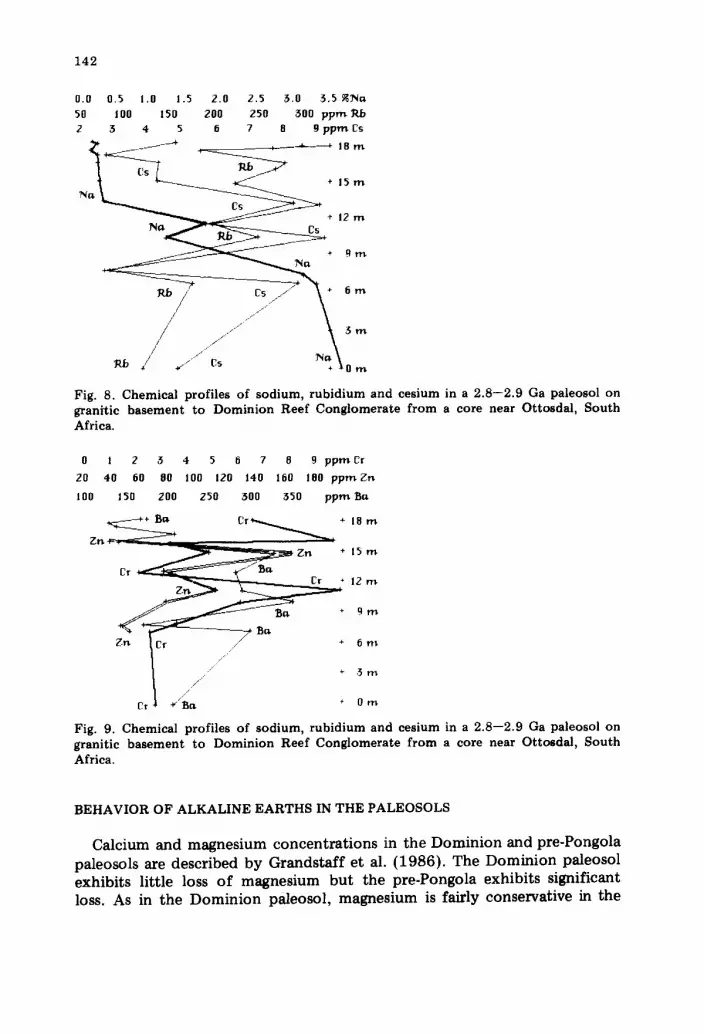
Fig. 8. Chemica l p rof i l es o f s o d i u m , r u b i d i u m a n d ce s ium in a 2 .8 - -2 .9 Ga pa leoso l on grani t ic b a s e m e n t t o D o m i n i o n R e e f C o n g l o m e r a t e f r o m a core nea r Ot tosda l , S o u t h
Africa.
0 ! 2 3 4 5 6 7 8 9 p p m Cr
20 40 60 80 I00 120 140 160 180 p p m Z n
I00 J50 200 250 300 350 p p m B~
z n ~ ~ C r y + 18 m
Cr't ~ 'Ba * O m
Fig. 9. Chemical profiles of sodium, rubidium and cesium in a 2.8--2.9 Ga paleosol on granitic basement to Dominion Reef Conglomerate from a core near Ottosdal, South
Africa.
BEHAVIOR OF ALKALINE EARTHS IN THE PALEOSOLS
Calcium and magnesium concentrations in the Dominion and pre-Pongola paleosols are described by Grandstaff et al. (1986). The Dominion paleosol exhibits little loss of magnesium but the pre-Pongola exhibits significant loss. As in the Dominion paleosol, magnesium is fairly conservative in the

143
• 0.0 0.5 1.0 1.5 2.0 2.5 3.0 $.5 % Na
0 50 I00 150 200 250 ppm
0.0 0.5 1.0 1.5 2.0 2.5 3.0 3.5 4.0 ppmCs 200 400 600 800 I000 1200 1400 1600 p p m B a Na Ba ~b
1 ~ . ~ _ _ Cs . . . . . * l S m
~ - .... Ba * 9 m
+ ~ m
N a * 0 r n Rb Cs Ba
Fig. 10. Chemica l prof i les o f sod ium, rub id ium, ces ium and b a r i u m in a 2 .9- -3 .0 Ga paleosol o n grani t ic b a s e m e n t to Pongola Supe rg roup f rom a core near Je r ico Dam, S o u t h Africa.
Kinojevis paleosol where exposed in the Kenogami Lake and Blanche River outcrops (Fig. 5, Table I). The lack of magnesium decrease in the Kinojevis outcrops probably reflects deep erosion prior to burial.
Barium exhibits no consistent trend in the Kinojevis profiles but in the others there is a tendency for barium to be most abundant in the middle of the paleosol. Like cesium, barium is strongly concentrated in a rubidium- rich sample in the middle of the Ventersdorp paleosol {Fig. 7). Barium reaches 1195 ppm at this horizon but is undetectable {less than 200 ppm) in other Ventersdorp samples. The tendency for barium enrichment in the middle of the profile is evident in both the pre-Pongola and Dominion profiles {Figs. 9, 10).
IRON A N D O T H E R E L E M E N T S O F T H E F I R S T T R A N S I T I O N SERIES
Holland {1984) has noted that scant data on Precambrian paleosols con- forms to the generalization that Precambrian paleosols which overlie iron- rich parent rocks tend to be poorer in iron than these parent rocks whereas paleosols which overlie iron-poor parent rocks tend to be enriched in iron. Iron profiles for the paleosols described herein provide some support for this generalization but also illustrate some complications.
The iron profile of Kinojevis Basalt in drill core apparently records some iron loss {Fig. 11). Fresh Kinojevis Basalt contains 10.7% Fe and this de- creases to about 8% Fe without significant loss of other elements which commonly correlate with iron in fresh basalt, i.e., scandium, chromium, and cobalt (Fig. 11). In the Kenogami Lake outcrop of this paleosol, there is a more pronounced upward loss of iron, f rom 7.8% to 4.8% Fe (Fig. 12). There is a correlative but greater loss of manganese, as would be expected if

144
iron has been removed by weathering. Other first-transition-series elements in this outcrop display trends which differ progressively from that of iron, i.e., cobalt, chromium, scandium, vanadium, and titanium (Figs• 12, 13). Collectively, these trends are interpreted to indicate that the iron and manganese profiles record both primary variation and weathering loss. Titanium and scandium presumably record only primary variation.
The iron profile in the Blanche River outcrop displays no trend in con- centrations (Table I), probably because weathering was minimal in this lowermost portion of the original saprolite. The overlying Timiskaming sandstone contains 4.3% Fe here (Table I), about 5% Fe in the drill core (Fig. 11), and 3.3% Fe in the Kenogami outcrop (Fig. 12). These values
Fe 5 6 7 8 9 I0 II 12 %Fe Co 0 50 I00 150 200 250 ppm
Cr I00 200 300 ~,00 500 600 ppm Sc I0 20 30 ~0 50 ppm
Fe~ ~ Co Cr ~'C/~ ~ _ _ ~ ...... <+C . . . . . . . . . ~ 2 . 2 / sandstone
Co Fe "Se *Cr
Co!TCr /+Fe ?Sc : / /
'L '1 paleosol ~, ~ +Join
, i
Fe 2 3 i 5 6 ~ S % Fe Mn 300 600 900 1200 1500 ppm Co 0 I0 20 30 e0 ppm Cr 0 100 200 300 eO0 500 ppm
FOe CoWCr M)n sandstone
Mn Fe Cr " . . ~ "---.._% Co
paleosol "~---~, Co& Mn
Fe Cr
Fig. 11. ( le f t ) Chemical profi les o f iron, cobalt , chromium and scandium in a 2.7 Ga paleoso l on Kinojevis Basalt f rom a core near Kirkland Lake, Canada.
Fig. 12 (right) Chemical profi les o f iron, manganese , cobalt and chromium in a 2.7 Ga paleoso l on Kinojevis Basalt f rom an ou tcrop on Kenogami Lake, Canada.
Ti 0 0.~ 0.8 1.2 1.6 %Ti
V I00 200 300 400 500 600ppm
Sc 0 I0 20 30 40 ppm
V e e T i Sc • sandstone
Ti ~ V ~ %5¢
pal ~" /
~ \,\ ~- V Se \
Fig. 13. Chemical profi les o f t i tanium, vanadium and scandium in a 2.7 Ga paleoso l on Kinojevis Basalt from an ou tcrop near Kenogami Lake, Canada.

1 4 5
probably reflect the incorporation of some iron-rich paleosol sediment into the basal sandstone. Unlike the underlying paleosol, the two Timiskaming samples in the drill core differ markedly in cobalt and chromium concen- trations (Fig. 11), probably because of physical sorting of grains. Manganese is abundant in the basal Timiskaming sandstone of the Kenogami Lake and Blanche River profiles (Fig. 12, Table I). River water apparently was not sufficiently reducing to dissolve much manganese in this area 2.7 Ga ago.
The lowermost sample of Ventersdorp Basalt is extremely iron-rich, 22.1% Fe which is equivalent to 31.6% Fe203 (Fig. 14). Given the low sodium content of this sample (0.56% Na), weathering apparently reached this depth and so this iron concentration may have been augmented by pre- cipitation from descending soil water. Although iron is less abundant in all higher samples, it fluctuates irregularly between 7.7% and 15% Fe (Fig. 14). The sharp drop in iron above the lowermost sample is accompanied by major decreases in cobalt and chromium but only minor decreases in nickel and scandium (Figs. 14, 15). A further upward decrease in iron coincides with
0 2 4 6 8 I0 12 14 16 18 20 22 % Fe
0 5 10 15 20 25 .50 55 4 0 4 5 p p m Sc
+ 2 . 5 m Sc Fe
+ 2 . O r e
"~',--- + 1,5 m
Fe ~ S_c_ ...... --'~f='* ~" 1.0 tvt
\ _ ____ ___----'--~-
~ i ~ o .5m
Sc 0.0 m Fe
Fig. 14. Chemical profiles of iron and scandium in a 2.3 Ga paleosol on Ventersdorp Basalt in southern Rand, South Africa.
0 20 4 0 60 80 I00 L20 140 p p m Cr
I0 20 30 40 50 60 70 80 90 ppm Co 50 !00 150 200 250 300 350 ppm Nt
+ 2 . 5 m C~ N~
C ° ~ - - ~ = ~ _ _ + 1 5 m
N~ Cr - - "~ ~ Co + O . O m
Fig. 15. Chemical profiles of chromium, cobalt and nickel in a 2.3 Ga paleosol on Ven- tersdorp Basalt in southern Rand, South Africa.
146
increases in all of these elements and may indicate iron loss from that horizon (1.2 m in Fig. 14) down to the iron-rich horizon of the lowest sample. The uppermost sample of paleosol is strongly enriched in all first- transition-series elements (Fig. 15), perhaps because of physical concentra- tion during saprolite erosion.
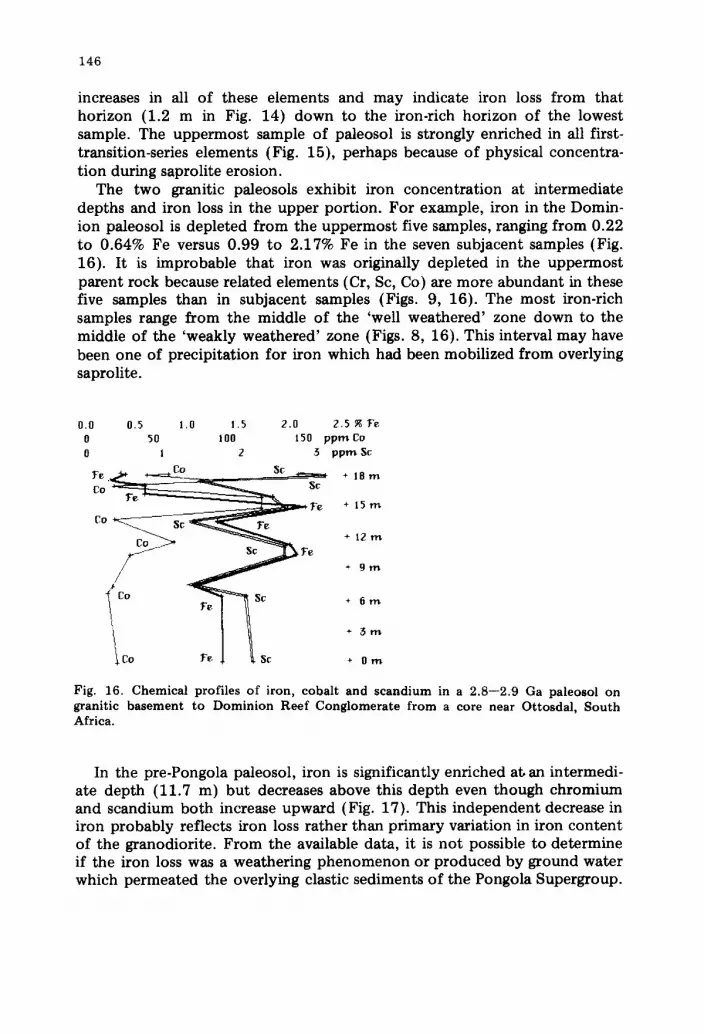
The two granitic paleosols exhibit iron concentration at intermediate depths and iron loss in the upper portion. For example, iron in the Domin- ion paleosol is depleted from the uppermost five samples, ranging from 0.22 to 0.64% Fe versus 0.99 to 2.17% Fe in the seven subjacent samples (Fig. 16). It is improbable that iron was originally depleted in the uppermost parent rock because related elements (Cr, Sc, Co) are more abundant in these five samples than in subjacent samples (Figs. 9, 16). The most iron-rich samples range from the middle of the 'well weathered' zone down to the middle of the 'weakly weathered' zone (Figs. 8, 16). This interval may have been one of precipitation for iron which had been mobilized from overlying saprolite.
0 .0 0.5 l.o !.5 2.0 2.5 % Fe 0 5{} 100 150 p p m C o {} ! 2 3 p p m Sc
F e ~ ~ Sc ~ + I B m Co " ~ ~ - - - - Z ~ ~ _ _ Sc
F e ~ F e + 1 5 m
Co
Co ~ J-J- ~ Fe
Co Sc + 6 m
+ ~ m
Co Fe I ~ Sc + {} m
Fig. 16. Chemica l p rof i les o f i ron , coba l t and s c a n d i u m in a 2 .8 - -2 .9 Ga pa leoso l on grani t ic b a s e m e n t to D o m i n i o n R e e f C o n g l o m e r a t e f r o m a core near Ot tosda l , S o u t h Africa.
In the pre-Pongola paleosol, iron is significantly enriched at, an intermedi- ate depth (11.7 m) but decreases above this depth even though chromium and scandium both increase upward (Fig. 17). This independent decrease in iron probably reflects iron loss rather than primary variation in iron content of the granodiorite. From the available data, it is not possible to determine if the iron loss was a weathering phenomenon or produced by ground water which permeated the overlying clastic sediments of the Pongola Supergroup.

147
1.5 2.0 2.5 3.0 3.5 4.0 4.5 5.0 % Fe 15 20 25 30 35 40 45 50 ppm Cr
1.0 2.0 3.0 4.0 5.0 6.0 7.0 8.0 ppmSc
Fe Cr Sc Cr " ~ _ ~ ~ * + 15 m
s~ r . . . . _ R _ _ ~ _ - ~ - . ~ . + 12 ~
+ 9 m
C r + 6m
+ 3 1 ~
+ 0 ~ Sc Fe
Cr
Fig. 17. Chemical profiles of iron, chromium and scandium in a 2.9--3.0 Ga paleosol on granitic basement to Pongola Supergroup from a core near Jerico Dam, South Africa.
RARE EARTH ELEMENTS IN THE PALEOSOLS
Rare-earth elements (REE) become strongly fractionated under modern tropical weathering conditions which produce bauxite. In Surinam, lantha- num, cerium and samarium have become concentrated at 3--4 m beneath the Earth's surface whereas europium migrated to 11 m and heavier REE apparently migrated even deeper (Topp et al., 1984). The ratio of La/Eu is 59 at 3 m and 6 at 11 m. This pattern of mobility conforms to the experi- mental evidence that heavy REE form more stable solute complexes than do the light REE (e.g., Wheelwright et al., 1953).
None of the REE profiles for the Precambrian paleosols exhibit the pat tern observed in aluminous soil of Surinam (Figs. 18--23). Specifically, there are no concentrations of La, Ce and Sm independent of Eu. However, it is possible that pre-burial erosion removed near-surface concentrations of the light REE. Core samples of the Kinojevis and Dominion paleosols exhibit europium enrichment at depth (Figs. 18, 21) and this may reflect some downward migration but the ratio of La/Eu does not vary by more than a factor of two in any of these profiles. REE fractionation in the preserved portion of the Precambrian saprolites clearly has not been as strong as in modern Surinam.
Granitic rocks of all ages contain much higher concentrations of REE than do mafic rocks, particularly light REE (e.g., Henderson, 1984). The Kinojevis Basalt and its paleosol contain very small concentrations of lan- thanum, less than 2.5 ppm La in two of the profiles (Fig. 19, Table I) and less than 5 ppm La in the other (Fig. 18). The Kinojevis is highly mafic, with alternating magnesium-rich and iron-rich facies (Jensen and Langford, 1983). The Proterozoic Ventersdorp Basalt is iron-rich in the analyzed pro-

148
file but generally less mafic than the Archean Kinojevis Basalt. The Venters- dorp profile contains correspondingly more lanthanum, up to 20 ppm La (Fig. 20). In the granitic paleosol beneath the Dominion Conglomerate, lanthanum reaches 57 ppm La (Fig. 21) and in the granitic paleosol beneath the Pongola Supergroup, it reaches 93.8 ppm La (Fig. 22).
The total concentration of REE varies substantially in the three South African profiles without much fractionation {Figs. 20--23). This variation probably reflects primary differences in the igneous rocks. In the Kinojevis profiles, REE are markedly concentrated in the Timiskaming sandstone
La 0 20 ziO 60 80 I00 La 0 I0 20 30 qO ppm Ce 130 150 170 190 210 Sm 0 1.0 2.0 3.0 ~.0 ppm Sm 0 2 4 6 8 I0 12 Izl 16 Eu 0 0.2 0.~ 0.6 0.8 ppm Eu 0 I 2 3 q Yb 0 0.3 0.6 0.9 1.2 ppm
Ce~.~ L a ~ ~Sm.Eo sandstone L~ Y~ Eu" Sm , . n d s . o . o
La t ~ ~\Eu ~Yb r ~ *2o m
I paleosol L / / / / ,.
! ~ ' \ +10 m (paleosol )! Sm "~ ~ Eu l i \ " ' * + 0 m ELI Sm Yb
Fig. 18. ( left) Chemical profiles o f REE (in p p m ) in a 2.7 Ga paleosol on Kinojevis Basalt from a core near Kirkland Lake, Canada.
Fig. 19. (right) Chemical profiles o f REE in a 2.7 Ga paleosol on Kinojevis Basalt from an outcrop on Kenogami Lake, Canada.
2 4 b 8 I0 12 14 Ib 18 20 pprrtCa 0 5 10 I'} 20 Z5 30 35 40 J,5 ppmCe
0.5 1.0 1.5 2.0 2.5 3.0 3.5 4.0 ppm~m 0.8 1.0 1,2 1.4 1.6 1 . 8 p p m ~ u
+ 2,5 m [-~ Sm ~'---- Ce * ~l~u
....... -~ " ~' • * 2.0 m
t o ~ ~-< ~- -_.. "i..:;:~ r.~, . 1.5,,
"'. + 1.0m
~ - ' - ~ - ~ L ~ 0,5 m Co +--~ ..... + 0.0m
Sm
Fig. 20. Chemical profiles of lanthanum, cerium, samarium and europium in a 2.8 Ga
paleosol on Ventersdorp Basalt, in southern Rand, South Africa.

149
relative to the paleosol (Figs. 18, 19) except in the Blanche River outcrop where the analyzed Timiskaming sample was collected immediately above the paleosol and included rip-up clasts of paleosol (Table I). The concen- tration of REE in the Timiskaming sandstone reflects a sediment source which included granitic rocks as well as weathered Kinojevis Basalt. Field relationships confirm a partially granitic source for the Timiskaming sand- stone (L.S. Jensen, personal communicat ion, 1985). Elements other than REE similarly indicate a granitic source; e.g., scandium in the three Kino- jevis profiles ranges from 30 to 46 ppm Sc in both fresh basalt and basaltic
I0 20 30 40 50 ppm La 0 20 40 60 80 I00 ppmCe
O.0 0.4 0.8 1.2 ppm Eu
- ~ ! ~. . ~ E u + 18m
~ C e ~ + 15 m
~ Ce E '~u~+ 12 m
I.~ ~ + 6 m
Fig. 21. Chemical profiles o f l an thanum, cer ium and eu rop ium in a 2.8--2.9 Ga paleosol on granitic basemen t to Domin ion R e e f Conglomera te f rom a core near Ottosdal , Sou th Africa.
O
20
I0 20 30 40 50 60 70 80 90 ppm/~
40 60 80 I00 120 140 160 180 200ppmCe
0 10 20 30 40 50 60 7 0 p p m N d
Nd + 12 m
La La
Nd 6 m
Ce ~ La Nd ~ + 0 m
Fig. 22. Chemical profi les of l an thanum, cer ium and n e o d y m i u m in a 2 .9--3.0 Ga paleo- sol o n granitic basement to Pongola Supergroup f rom a core near Jer ico Dam, Sou th Africa.

150
0 12 3 4 5 6 7 8 9 ppmsm 0.0 0.5 1.0 1.5 2.0 2.5 ppmEu 0.0 0.5 1.0 I.5 2.0 2.5 yb PPm
+ I5m
+ 12 m
+ 9m
+ rim
+ 3m
+ Dm
Fig. 23. Chemical profiles of samarium, europium and ytterbium in a 2.9-3.0 Ga paleo- sol on granitic basement to Pongola Supergroup from a core near Jerico Dam, South Africa.
paleosol but is only half as abundant in the Timiskaming, except for the paleosol-rich sample of Timiskaming sandstone at Blanche River (Figs. 11, 13, Table I).
BEHAVIOR OF URANIUM, THORIUM AND OTHER HEAVY ELEMENTS
Like the REE, uranium and thorium are scarce in the basaltic paleosols but more abundant in the granitic paleosols because of primary igneous
u 0 I 2 3 4 ppm
Th 0 3 6 9 12 I5 18 PPm
HI0 I 2 3 4 5 ppm
Hft + 25 m
I paleosol + 20 m t \
\: + 15m
Hf
HI0 1 2 3 4 5 ppm
Fig. 24. Chemical profiles of uranium, thorium and hafnium in a 2.7 Ga paleosol on Kinojevis Basalt from a core near Kirkland Lake, Canada.

151
fractionation. As with the REE, actinide scarcity is most pronounced in the highly mafic Kinojevis Basalt; it contains no detectable uranium or thorium in any of the three profiles. Our detection limit with INAA is less than 1 ppm for both elements. The overlying Timiskaming sandstone contains up to 3.5 ppm U and 17 ppm Th, indicative of a partially granitic source (Fig. 24). The less mafic Ventersdorp paleosol consistently exhibits thorium concen- trations, from 1.1 to 3.6 ppm Th, and erratically also exhibits uranium con- centrations in three samples, up to 3.4 ppm U (Fig. 25). The uranium does not correlate with thorium and may have been fractionated from thorium during oxidative weathering.
Uranium and thorium are both moderately abundant in the two granitic paleosols but concentrations vary greatly (Figs. 26, 27). In the Dominion
0.0 0.5 1.0 1.5 2.0 2.5 3.0 5.5 4.0 p p m U 0.0 0.5 1.0 1.5 2.0 2.5 3.0 3.5 4.0 ppmTh 1.0 1.5 2.0 2.5 3.0 3.5 4.0 4.5 5.0 ppm~l~
+ 2 . 5 m
~ l ~ ~ [ ] + 2.0 rrt
+ 1 . 5 m
~ l f ~ + 1 .0m
+ 0 . 5 m
[ ] ~r~ ~ ' ~ n! + o.o m
Fig. 25. Chemical profiles o f uranium, thorium and hafnium in a 2.3 Ga paleosol on Ventersdorp Basalt in southern Rand, South Africa.
0 I 2 3 4 5 6 7 8 9 p p m U
0 2 4 6 8 10 12 14 16 ppm Th 0.5 1.0 1.5 2.O 2.5 3.0 3.5 ppm ~If
U ~ - ~ ~ --+ ~ + 18m
U ~ - - / ~ . . ~ ~ ~ 15m U = + IZ m
Fig. 26. Chemical profiles of uranium, thorium and hafnium in a 2 .8 - -2 .9 Ga paleosol on granitic basement to Dominion Reef Conglomerate from a core near Ottosdal, South Africa.

152
1.0 1.5 2.0 2.5 ~.0 3.5 4.0 4.5 p p m U
2 4 6 8 10 12 14 16 18 20 22 p p m ] ~ 0.2 0.4 0.6 0.8 1.0 1.2 1.4 !.6 p p m T a
100 125 150 175 200 225 250 275 3 0 0 p p m Z r
U. Th Ta + 1 5 m
+ 1 2 m
. J
T h ~ ' ~ ~+ Ta + 0 m
Fig. 27. Chemica l p rof i les o f u r a n i u m , t h o r i u m , t a n t a l u m and z i r c o n i u m in a 2 . 9 - 3 . 0 Ga pa leoso l o n grani t ic b a s e m e n t to Pongo l a S u p e r g r o u p f r o m a core near Je r i co D a m ,
S o u t h Africa.
paleosol, which underlies uraniferous conglomerate, uranium and thorium are both concentrated about 6 m below the top of the paleosol but at sep- arate horizons about 1 m apart (Fig. 26). The origin of this pattern is unclear but may have involved minor chemical mobility of uranium. Like thorium, hafnium would have been chemically immobile and so it is not surprising that hafnium correlates better with thorium than with uranium (Fig. 26). In the pre-Pongola paleosot, uranium correlates closely with thorium in all but the uppermost sample (Fig. 27). Uranium is preferentially depleted from the uppermost samples of both the pre-Pongola and Dominion paleosols (Figs. 26, 27), possibly because of diagenetic leaching by ground water which flowed along the basal contact of overlying clastic sediments.
C O N C L U S I O N
Given variable destruction of fabric in metamorphosed Precambrian paleosol, the study of chemical profiles is more important than it is for Phanerozoic paleosol. Multi~elemental chemical profiles are particularly in- formative because they allow for comparison among related elements. Ele- mental groups discussed in the foregoing examples include the alkalis (Na, K, Rb, Cs), alkaline earths (Mg, Ba), the first transition series (Sc, Ti, V, Cr, Mn, Fe, Co, Ni, Zn), the lanthanides (La, Ce, Nd, Sm, Eu, Dy, Yb, Lu), and the actinides (Th, U). In primary igneous rocks, members of these groups com- monly correlate closely with each other whereas weathering and diagenetic processes more commonly fractionate them.
Multi-elemental data exist for only a few profiles through Precambrian paleosols (Holland, 1984). This paper and that of Grandstaff et al. (1986} in- clude a significant proportion of the extant profile data. Much more data

153
will be needed before justifiable generalizations may be made. It is note- worthy, however, that these additional data conform with the generalization by Holland (1984) that Precarnbrian paleosols tend to display greater loss of iron than do Phanerozoic paleosols, particularly Precambrian paleosols devel- oped on iron-rich rocks. Loss of iron characterizes both the Kinojevis and Ventersdorp basaltic paleosols described herein. The granitic paleosols (Dominion and pre-Pongola) exhibit iron concentration in the middle of the profile and some iron loss toward the top.
The potential relationship between iron loss and atmospheric oxidation state remains unclear. More work is needed both on theoretical modeling like that of Holland (1984) and iron dynamics in modem soil-saprolite. Only a small proportion of the chemical data on modern soil-saprolite is directly relevant to the study of paleosol because partial-leachate analyses predomi- nate over complete analyses (Retallack et al., 1984). Of the available com- plete analyses, few are of saprolite, the probable precursor to most Pre- cambrian paleosol (Gardner et al., 1978; Calvert et al., 1980).
Diagenetic effects on paleosol pose a major obstacle to environmental interpretation. Chief among these effects is potential 'reverse weathering' of alkalis. Weathering can almost completely remove alkali elements but these alkalis similarly can be leached by ground water from feldspathic sand above a buried soil. Substantial ground water probably permeated the known Pre- cambrian paleosols because these paleosols generally occur at an uncon- forrnity beneath coarse clastic sedimentary rocks. The four paleosols des- cribed herein occur in such a setting and all four exhibit enrichment in al- kalis heavier than sodium, possibly due to 'reverse weathering'. Locally, the uppermost paleosol samples similarly exhibit an enrichment in sodium which may be due to 'reverse weathering' or to physical mixing with clastic sedi- ment during burial.
Thorough understanding of Precarnbrian paleosol awaits additional data, particularly chemical data which is integrated with textural or paleotopo- graphic data (e.g., Kimberley et al., 1984). Subaerial Archean rocks of all kinds are rare and the three Archean paleosols discussed herein deserve special attention. It is not surprising that analyses of Archean paleosols now are scarce. Among all named rocks, Archean paleosol must be one of the least voluminous on earth.
REFERENCES
Button, A. and Tyler, N., 1981. The character and economic significance of Precam- brian paleoweathering and erosion surfaces in southern Africa. Econ. Geol., 75: 686--709.
Calvert, C.S., Buol, S.W. and Weed, S.B., 1980. Mineralogical characteristics and trans- formations of a vertical rock-saprolite-soil sequence in the North Carolina Piedmont. J. Soil Sci. Soc. Am., 44: 1096--1112.

154
Cattell, A., Krogh, T.E. and Arndt, N.T., 1984. Conflicting Sm--Nd whole rock and U--Pb zircon ages for Archean lavas from Newton Township, Abitibi Belt, Ontario. Earth Planet. Sci. Lett. , 70: 280--290.
Gardner, L.R., Kheoruenromne, I. and Chen, H.S., 1978. Isovolumetric geochemical in- vestigation of a buried granite saprolite near Columbia, SC, U.S.A. Geochim. Cos- mochim. Acta, 42: 417--424.
Grandstaff, D.E., Edelman, M.J., Foster, R.W., Zbinden, E. and Kimberley, M.M., 1986. Chemistry and mineralogy of Precambrian paleosols at the base of the Dominion and Pongola Groups (Transvaal, South Africa). Precambrian Res.,
Henderson, P., 1984. Rare Earth Element Geochemistry. Elsevier, Amsterdam, 510 pp. Holland, H.D., 1984. The Chemical Evolution of the Atmosphere and Oceans. Princeton
Univ. Press, 582 pp. Jensen, L.S., 1976. Regional stratigraphy and structure of the Timmins--Kirkland Lake
area, District of Cochrane and Timiskaming and Kirkland Lake area, District of Timis- kaming. Ontario Dept. Mines Misc. Pap. 67 ,183 pp.
Jensen, L.S. and Langford, F.F. , 1983. Geology and petrogenesis of the Archean Abitibi belt in the Kirkland Lake area, Ontario. Ontario Geol. Surv. Open-File Rep. 5455, 520 pp.
Kimberley, M.M., Tanaka, R.T. and Farr, M.R., 1980. Composition of middle Precam- brian uraniferous conglomerate in the Elliot Lake--Agnew Lake area of Canada. Precambrian Res., 12: 375--392.
Kimberley, M.M., Grandstaff, D.E. and Tanaka, R.T., 1984. Topographic control on Precambrian weathering in the Elliot Lake uranium district, Canada. J. Geol. Soc., 141: 229--233.
Kimberley, M.M., Jensen, L.S., Grandstaff, D.E. and Foster, R., 1985. Archean paleosol: weathered Kinojevis basalt beneath fluvial Timiskaming sandstone. Geol. Soc. Am. Abstr. Progr., 17: 629.
Matheis, G. and Pearson, M.J., 1982. Mineralogy and geochemical dispersion in lateritic soil profiles of northern Nigeria. Chem. Geol., 35: 129--145.
McKeague, J.A., Grant, D.R., Kodama, H., Beke, G.J. and Wang, C., 1983. Properties and genesis of a soil and the underlying gibbsite-bearing saprolite, Cape Breton Island, Canada. Can. J. Earth Sci., 20: 37--48.
Muecke, G.K., 198~. Neutron activation analysis in the geosciences. Mineral. Assoc. Can., Short Course Handb., 5: 279.
Pavich, M.J. and Obermeier, S.F., 1985. Saprolite formation beneath Coastal Plain sedi- ments near Washington, DC. Geol. Soc. Am. Bull., 96: 886--900.
Retallack, G., Grandstaff, D.E. and Kimberley, M.M., 1984. The promise and problems of Precambrian paleosols. Episodes, 7 : 8--12.
Topp, S.E., Salbu, B., Roalset, E. and Jorgensen, P., 1984. Vertical distribution of trace elements in laterite soil (Surinam). Chem. Geol., 47: 159--174.
Wheelwright, E.J., Spedding, F.H. and Schwarzenbach, G., 1953. The stability of the rare earth complexes with ethylene-diaminetetraacetic acid. J. Assoc. Chem. Soc., 75: 4196--4201.


