Embed Size (px)
Citation preview

Geol. Mag. 144 (3 ), 2007, pp. 1–10. c© 2007 Cambridge University Press 1doi:10.1017/S0016756807003354 Printed in the United Kingdom
Carbon isotope stratigraphy of the Precambrian–CambrianSukharikha River section, northwestern Siberian platform
ARTEM KOUCHINSKY∗†, STEFAN BENGTSON∗, VLADIMIR PAVLOV‡,BRUCE RUNNEGAR§, PETER TORSSANDER¶, EDWARD YOUNG‖ &KAREN ZIEGLER‖
∗Department of Palaeozoology, Swedish Museum of Natural History, Box 50007, SE-104 05 Stockholm, Sweden‡Institute of Physics of the Earth, Bol’shaya Gruzinskaya 10, Moscow 123995, Russia
§NASA Astrobiology Institute, MS 240–1, Ames Research Center, Moffett Field, California 94035, USA¶Department of Geology and Geochemistry, Stockholm University, SE-106 91 Stockholm, Sweden
‖Department of Earth and Space Sciences, University of California, Los Angeles, 595 Charles Young Drive East,Box 951567, Los Angeles, California 90095-1567, USA
(Received 2 May 2006; accepted 25 September 2006)
Abstract – A high-resolution carbon isotope profile through the uppermost Neoproterozoic–LowerCambrian part of the Sukharikha section at the northwestern margin of the Siberian platform showsprominent secular oscillations of δ13C with peak-to-peak range of 6–10 ‰. There are six minima,1n–6n, and seven maxima 1p–7p, in the Sukharikha Formation and a rising trend of δ13C from theminimum 1n of − 8.6 ‰ to maximum 6p of + 6.4 ‰. The trough 1n probably coincides with theisotopic minimum at the Precambrian–Cambrian boundary worldwide. Highly positive δ13C valuesof peaks 5p and 6p are typical of the upper portion of the Precambrian–Cambrian transitional bedsjust beneath the Tommotian Stage in Siberia. A second rising trend of δ13C is observed through theKrasnoporog and lower Shumny formations. It consists of four excursions with four major maxima thatcan be correlated with Tommotian–Botomian peaks II, IV, V, and VII of the reference profile from thesoutheastern Siberian platform. According to the chemostratigraphic correlation, the first appearancesof the index forms of archaeocyaths are earlier in the Sukharikha section than in the Lena–Aldanregion.
Keywords: Cambrian, carbon, isotope ratios, stratigraphy.
1. Introduction
Sedimentary rocks of Neoproterozoic–Cambrian ageare extensively developed on the Siberian platform,and their outcrops are accessible along river valleys.In contrast to the interior regions, strata at the marginsof the platform are often folded, and long continuoussuccessions of inclined beds can here be studied inrelatively compact sections. One of these sections atthe northwestern margin of the Siberian platform isexposed from 67◦ 12.516′ N, 87◦ 21.567′ E (see arrowA in Fig. 1) along ∼ 3 km upstream the SukharikhaRiver, a right tributary of the Enisej River (Rozanovet al. 1992; Rowland et al. 1998; Fig. 1. Theinvestigated Sukharikha section comprises a 845 mthick succession of the uppermost Neoproterozoic–Lower Cambrian predominantly carbonate deposits ofthe uppermost Izluchin, Sukharikha, Krasnoporog, andlower Shumny formations (transliteration of Russiannames and sedimentological information after Rowlandet al. 1998) in the eastern part of the Sukharikhaanticline (Fig. 1; Rowland et al. (1998, fig 2)). Thesampled uppermost part of the Izluchin Formationconsists of 57 m of siliciclastic shelf deposits rep-
†Author for correspondence: [email protected]
resented by reddish and grey argillites, siltstones,and sandstones with dolostone interbeds (Fig. 2). Itgrades into the Sukharikha Formation, which is heremeasured to be 543 m thick, consisting of mostlydolostones and subordinate limestones, with recurringflat pebble conglomerates, domal stromatolites, anddesiccation-cracked dololaminates (Rowland et al.1998). The thickness of the formation in the SukharikhaRiver valley varies according to other authors: 619 mafter Rowland et al. (1998), 570 m after Grigor’ev(1958) and Rozanov et al. (1992), and 560 m afterLuchinina et al. (1997). The contact between theSukharikha and Krasnoporog formations is regardeda sequence boundary, confirmed by a sharp transitionfrom the proximal carbonate-ramp deposits of theSukharikha Formation to the open-shelf KrasnoporogFormation. The latter consists of bioturbated lime mud-stones with subordinate archaeocyath–calcimicrobialbioherms and biostromes (Rowland et al. 1998). TheSukharikha–Krasnoporog boundary is marked by atransition from light grey lime mudstones below toreddish lime mudstones above, but no erosional surfacewas revealed during field studies. The KrasnoporogFormation is here measured to be ∼ 135 m thick (‘atleast 148 m’ after Rowland et al. (1998, p. 342),∼ 185 m after Luchinina et al. (1997, fig. 6), and

2 A. KOUCHINSKY AND OTHERS
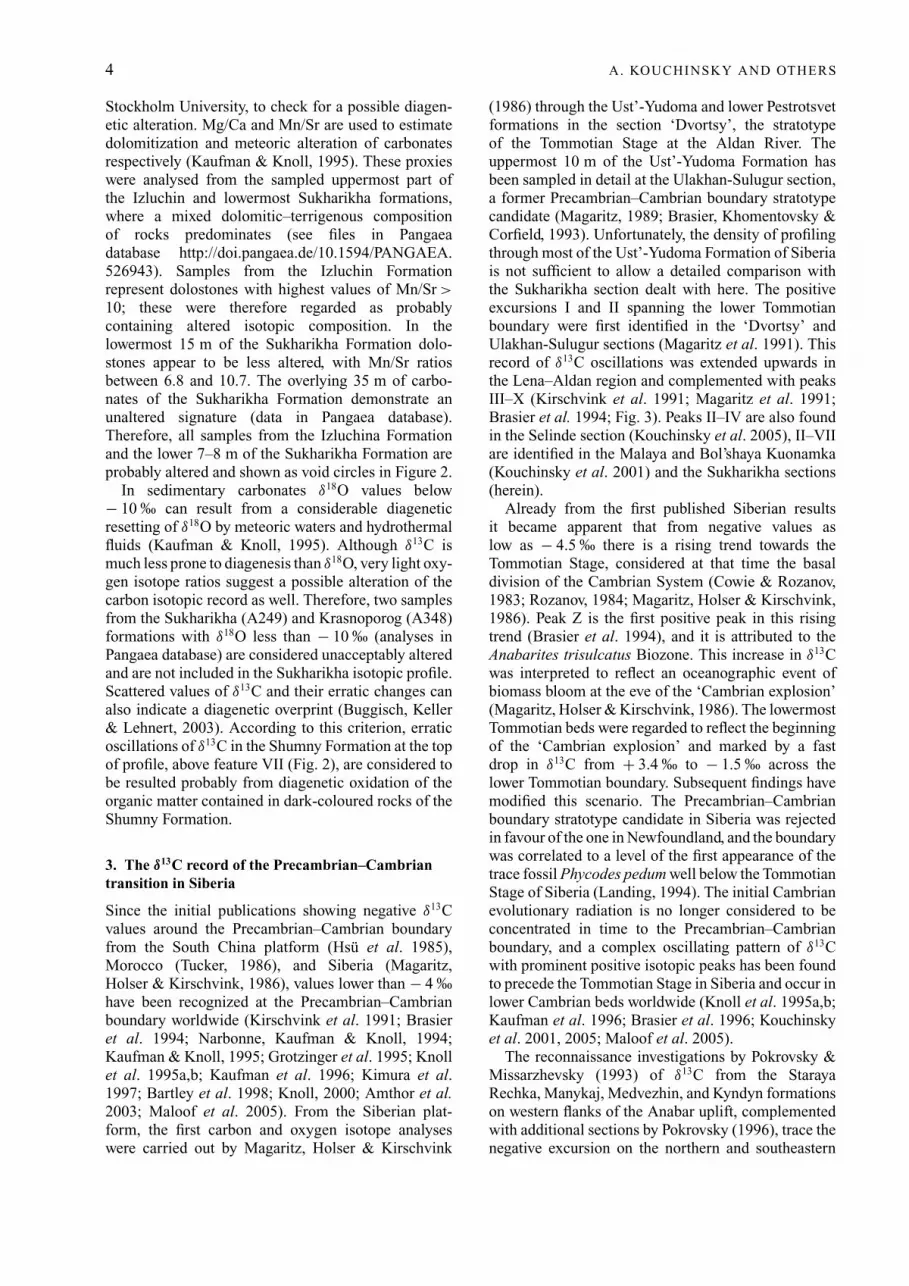
Figure 1. Location of the Sukharikha section (Su) at the margin of the Siberian platform and other sections discussed.
160–200 m after Astashkin et al. (1991) and Rozanovet al. (1992)) and grades into the deeper-water slopedeposits of the Shumny Formation, represented mostlyby dark-coloured carbonate turbidites and nodularlimestones (Rowland et al. 1998). The Shumny Form-ation is 239 m thick according to Savitsky, Shishkin &Shabanov (1967) and Rozanov et al. (1992). Samplingfrom the lower part of the formation (∼ 110 m) isreported herein (Fig. 2).
2. Material and methods
For the purpose of carbon isotope analyses, c. 530samples of whole-rock carbonates were collectedin August 2004 along the Sukharikha River. Thesamples were cut and their polished cleaned sectionsexamined with a light microscope. A Dremel MiniMitemicro-drill tool was used to extract rock powderfrom areas selected for their micritic composition.An amount of 200–400 µg was analysed from oneor more spots from each sample situated c. 1 cmapart. Carbon and oxygen isotopes from carbonatesof the samples were analysed with a Finnigan MAT253 equipped with a ThermoFinnigan Gasbench IIat the Department of Earth and Space Sciences,University of California, Los Angeles. The carbon
isotope composition is defined as a deviation in permilof the ratio 13C/12C and 18O/16O between a sampleand a standard expressed in the conventional δ13Cand δ18O notations relative to V-PDB. Secondarystandards used are NBS-19, IAEA-CO-1, IAEA-CO-8,and an internal laboratory standard, CARM-1. Allmeasurements are available in the Pangaea database(http://doi.pangaea.de/10.1594/PANGAEA.526943).
ThermoFinnigan Gasbench II enables a precisionof the carbonate analyses better than ± 0.1 ‰ forcarbon and oxygen that is comparable to dual inlettechniques typically used for such a purpose. Powderedsamples were loaded into septum-capped 12 ml glassvials (Labco exetainer) and placed into a heatedblock at 70 ◦C (40 vials per run including 6 vialswith the secondary and in-house standards). Thevials were then successively flush filled with helium(∼ 6 min/vial), loaded with a few droplets of ∼ 100 %phosphoric acid by a microlitre pump, and analysedusing an autosampler (∼ 20 min/vial). Time betweenthe beginning of sample digestion by phosphoric acidand measurements of isotope ratios in the resulting CO2
gas was ∼ 80 minutes.Elemental analyses, including Mg/Ca and Mn/Sr
ratios, were carried out with ICP-OES (Varian Vista ProAx) at the Department of Geology and Geochemistry,

Precambrian–Cambrian carbon isotope stratigraphy Siberia 3
Figure 2. Carbon and oxygen isotope profiles through the Sukharikha section. Carbon isotope peaks and troughs are numbered 1p–7pand 1n–6n respectively.
4 A. KOUCHINSKY AND OTHERS
Stockholm University, to check for a possible diagen-etic alteration. Mg/Ca and Mn/Sr are used to estimatedolomitization and meteoric alteration of carbonatesrespectively (Kaufman & Knoll, 1995). These proxieswere analysed from the sampled uppermost part ofthe Izluchin and lowermost Sukharikha formations,where a mixed dolomitic–terrigenous compositionof rocks predominates (see files in Pangaeadatabase http://doi.pangaea.de/10.1594/PANGAEA.526943). Samples from the Izluchin Formationrepresent dolostones with highest values of Mn/Sr >
10; these were therefore regarded as probablycontaining altered isotopic composition. In thelowermost 15 m of the Sukharikha Formation dolo-stones appear to be less altered, with Mn/Sr ratiosbetween 6.8 and 10.7. The overlying 35 m of carbo-nates of the Sukharikha Formation demonstrate anunaltered signature (data in Pangaea database).Therefore, all samples from the Izluchina Formationand the lower 7–8 m of the Sukharikha Formation areprobably altered and shown as void circles in Figure 2.
In sedimentary carbonates δ18O values below− 10 ‰ can result from a considerable diageneticresetting of δ18O by meteoric waters and hydrothermalfluids (Kaufman & Knoll, 1995). Although δ13C ismuch less prone to diagenesis than δ18O, very light oxy-gen isotope ratios suggest a possible alteration of thecarbon isotopic record as well. Therefore, two samplesfrom the Sukharikha (A249) and Krasnoporog (A348)formations with δ18O less than − 10 ‰ (analyses inPangaea database) are considered unacceptably alteredand are not included in the Sukharikha isotopic profile.Scattered values of δ13C and their erratic changes canalso indicate a diagenetic overprint (Buggisch, Keller& Lehnert, 2003). According to this criterion, erraticoscillations of δ13C in the Shumny Formation at the topof profile, above feature VII (Fig. 2), are considered tobe resulted probably from diagenetic oxidation of theorganic matter contained in dark-coloured rocks of theShumny Formation.
3. The δ13C record of the Precambrian–Cambriantransition in Siberia
Since the initial publications showing negative δ13Cvalues around the Precambrian–Cambrian boundaryfrom the South China platform (Hsu et al. 1985),Morocco (Tucker, 1986), and Siberia (Magaritz,Holser & Kirschvink, 1986), values lower than − 4 ‰have been recognized at the Precambrian–Cambrianboundary worldwide (Kirschvink et al. 1991; Brasieret al. 1994; Narbonne, Kaufman & Knoll, 1994;Kaufman & Knoll, 1995; Grotzinger et al. 1995; Knollet al. 1995a,b; Kaufman et al. 1996; Kimura et al.1997; Bartley et al. 1998; Knoll, 2000; Amthor et al.2003; Maloof et al. 2005). From the Siberian plat-form, the first carbon and oxygen isotope analyseswere carried out by Magaritz, Holser & Kirschvink
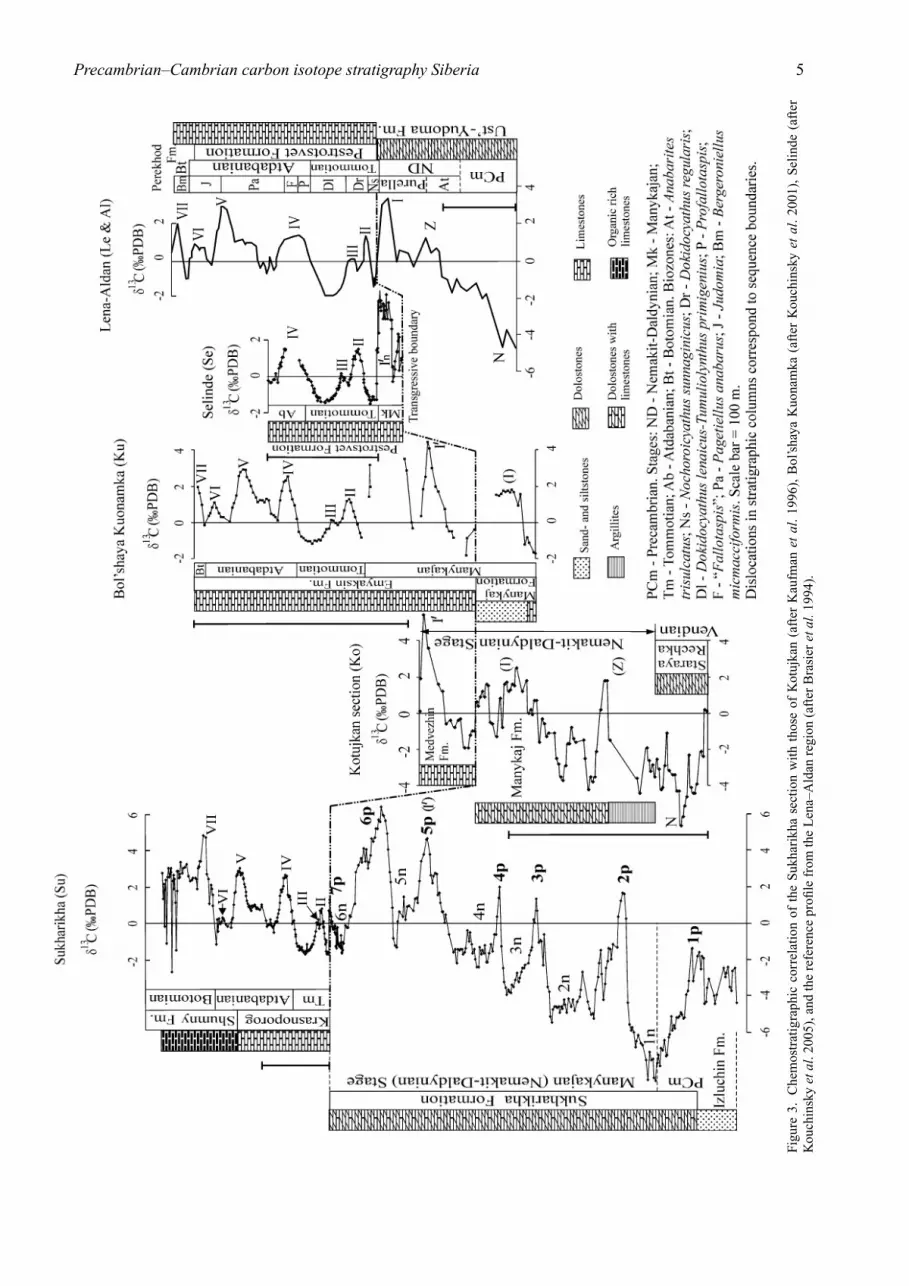
(1986) through the Ust’-Yudoma and lower Pestrotsvetformations in the section ‘Dvortsy’, the stratotypeof the Tommotian Stage at the Aldan River. Theuppermost 10 m of the Ust’-Yudoma Formation hasbeen sampled in detail at the Ulakhan-Sulugur section,a former Precambrian–Cambrian boundary stratotypecandidate (Magaritz, 1989; Brasier, Khomentovsky &Corfield, 1993). Unfortunately, the density of profilingthrough most of the Ust’-Yudoma Formation of Siberiais not sufficient to allow a detailed comparison withthe Sukharikha section dealt with here. The positiveexcursions I and II spanning the lower Tommotianboundary were first identified in the ‘Dvortsy’ andUlakhan-Sulugur sections (Magaritz et al. 1991). Thisrecord of δ13C oscillations was extended upwards inthe Lena–Aldan region and complemented with peaksIII–X (Kirschvink et al. 1991; Magaritz et al. 1991;Brasier et al. 1994; Fig. 3). Peaks II–IV are also foundin the Selinde section (Kouchinsky et al. 2005), II–VIIare identified in the Malaya and Bol’shaya Kuonamka(Kouchinsky et al. 2001) and the Sukharikha sections(herein).
Already from the first published Siberian resultsit became apparent that from negative values aslow as − 4.5 ‰ there is a rising trend towards theTommotian Stage, considered at that time the basaldivision of the Cambrian System (Cowie & Rozanov,1983; Rozanov, 1984; Magaritz, Holser & Kirschvink,1986). Peak Z is the first positive peak in this risingtrend (Brasier et al. 1994), and it is attributed to theAnabarites trisulcatus Biozone. This increase in δ13Cwas interpreted to reflect an oceanographic event ofbiomass bloom at the eve of the ‘Cambrian explosion’(Magaritz, Holser & Kirschvink, 1986). The lowermostTommotian beds were regarded to reflect the beginningof the ‘Cambrian explosion’ and marked by a fastdrop in δ13C from + 3.4 ‰ to − 1.5 ‰ across thelower Tommotian boundary. Subsequent findings havemodified this scenario. The Precambrian–Cambrianboundary stratotype candidate in Siberia was rejectedin favour of the one in Newfoundland, and the boundarywas correlated to a level of the first appearance of thetrace fossil Phycodes pedum well below the TommotianStage of Siberia (Landing, 1994). The initial Cambrianevolutionary radiation is no longer considered to beconcentrated in time to the Precambrian–Cambrianboundary, and a complex oscillating pattern of δ13Cwith prominent positive isotopic peaks has been foundto precede the Tommotian Stage in Siberia and occur inlower Cambrian beds worldwide (Knoll et al. 1995a,b;Kaufman et al. 1996; Brasier et al. 1996; Kouchinskyet al. 2001, 2005; Maloof et al. 2005).
The reconnaissance investigations by Pokrovsky &Missarzhevsky (1993) of δ13C from the StarayaRechka, Manykaj, Medvezhin, and Kyndyn formationson western flanks of the Anabar uplift, complementedwith additional sections by Pokrovsky (1996), trace thenegative excursion on the northern and southeastern
Precambrian–Cambrian carbon isotope stratigraphy Siberia 5
Figu
re3.
Che
mos
trat
igra
phic
corr
elat
ion
ofth
eS
ukha
rikh
ase
ctio
nw
ith
thos
eof
Kot
ujka
n(a
fter
Kau
fman
etal
.19
96),
Bol
’sha
yaK
uona
mka
(aft
erK
ouch
insk
yet
al.
2001
),S
elin
de(a
fter
Kou
chin
sky
etal
.200
5),a
ndth
ere
fere
nce
profi
lefr
omth
eL
ena–
Ald
anre
gion
(aft
erB
rasi
eret
al.1
994)
.

6 A. KOUCHINSKY AND OTHERS
Figure 4. Carbon isotope profiles from the Nokhtujsk section (after Pelechaty, 1998), Turukhansk section (after Bartley et al. 1998),and lower Olenyok reaches (after Knoll et al. 1995a). For legend see Figure 3.
Siberian platform. The former section at the mouth ofthe Kotujkan River has also been investigated in detailby Knoll et al. (1995b) and Kaufman et al. (1996).These authors found a lower negative δ13C excursion,N, reaching values as low as − 6.2 ‰ in the upperStaraya Rechka Formation and the upper unnamednegative excursion with two troughs of − 4.2 ‰ and− 3.7 ‰ in the middle part of the Manykaj Formation(Fig. 3). Hence, the lower boundary of the Nemakit-Daldynian Stage in this section is situated betweenthese two negative excursions. A rising trend towardspositive values, peaking in the Medvezhin and Kyndynformations, has been also reported (Pokrovsky &Missarzhevsky, 1993; Knoll et al. 1995b; Kaufmanet al. 1996). Two excursions in this rising trend weretentatively correlated with peaks Z and I of the Ust’-Yudoma Formation (Knoll et al. 1995b; Kaufman et al.1996; shown as (Z) and (I) in Fig. 3). The most promin-ent positive peak, I’, of + 5.4 ‰, occurs in the overlyingMedvezhin Formation (Fig. 3). This is not consistentwith the C-isotopic signature of the Tommotian Stagein the Lena–Aldan region, where such an excursionappears to be missing. A sizeable hiatus between peaksI and II of the reference profile has been suggested toexplain this difference (Knoll et al. 1995b; Kaufmanet al. 1996).
An isotope profile through the Neoproterozoic–Lower Cambrian has also been reported from theKhorbosuonka River section at the Olenyok uplift byKnoll et al. (1995a). It shows a negative excursion withminimum − 2.6 ‰ in the uppermost Turkut Formationand positive values up to + 4 ‰ in the upper KessyusaFormation (Fig. 4). A similar shift to negative valuesis reported from the upper Turkut Formation at theOlenyok River (Pelechaty, Kaufman & Grotzinger,1996; Pelechaty et al. 1996). However, the profile above
the negative excursion is not continuous, and it does notinclude the rising trend of δ13C towards the TommotianStage. The authors correlated the negative shift withthe Precambrian–Cambrian boundary, although thereported values in the Turkut Formation are higherthan the negative carbon isotope excursion spanningthe Precambrian–Cambrian boundary around the worldwith a δ13C spike lower than − 4 ‰ (Brasier et al. 1994;Knoll et al. 1995b; Kaufman et al. 1996; Maloof et al.2005).
Two negative excursions with values less than− 7.5 ‰ in the lower part and − 4.9 ‰ in the middlepart of the Platonovskaya Formation are reported byBartley et al. (1998) (Fig. 4). It is suggested that thelower excursion and preceding moderately negativevalues in the lowermost Platonovskaya Formation aresituated below the Nemakit-Daldynian Stage, while thesecond excursion is placed above. This conclusion issupported by a similar signature from the KotujkanRiver section (Pokrovsky & Missarzhevsky, 1993;Knoll et al. 1995b; Kaufman et al. 1996) and theAldan River (Brasier et al. 1994). At the AldanRiver, one negative excursion, N, is situated below andanother (unnamed excursion between peaks Z and I inFig. 3) above the lower Nemakit-Daldynian boundary(Magaritz et al. 1991). Thus, according to Bartleyet al. (1998), these two negative excursions maypossibly constrain its position.
Pelechaty (1998) investigated the Tynnaya Forma-tion of the Nokhtujsk section on the southern Siberianplatform, where isotopic interval N1 of negative shiftwith high-frequency negative oscillation as low as− 9 ‰ was revealed (Fig. 4). It has been suggestedthat the Tynnaya Formation shows a prolonged intervalN1 of oscillating negative values. Although δ18Ovalues from that section range between − 0.3 ‰

Precambrian–Cambrian carbon isotope stratigraphy Siberia 7
and − 20.5 ‰, consistent with possible diagenesis insome of the samples with very low numbers, theδ13C values were interpreted by Pelechaty (1998) asthe complete record of secular variation in δ13C ofthe Precambrian–Cambrian boundary carbon isotopeanomaly otherwise known as N (Knoll et al. 1995b).Pelechaty (1998) placed this series of 4–5 oscillationsbelow the boundary, suggesting that the shift to negativevalues precedes the boundary.
4. Carbon isotope results and stratigraphiccorrelation of the Sukharikha section
The negative δ13C values characterizing the Precam-brian–Cambrian boundary worldwide are encounteredin the Sukharikha section. The carbon isotope profilethrough the Sukharikha Formation begins with a dropof δ13C values from c. − 1.5 ‰ to as low as − 8.6 ‰and a subsequent rise to + 1.6 ‰ (Fig. 2). The profileshows six major negative excursions with a peak-to-peak amplitude of 6–10 ‰ and a conspicuous risingtrend of δ13C through the Sukharikha Formation with15 ‰ difference between the minimum − 8.6 ‰ andmaximum + 6.4 ‰. Major minima in the SukharikhaFormation are named 1n–6n; major positive peaksalternating with them are given their own numbers 1p to7p in the same ascending order (Fig. 2). Peak 1p occursat the boundary between the Sukharikha and Izluchinformations. The upper boundary of the SukharikhaFormation is marked by peak 7p followed by a fast dropof values from + 0.7 ‰ to − 1.7 ‰ in the KrasnoporogFormation (Figs 2 and 5). This boundary is constrainedbetween samples A300 and A301 situated 10 cmapart at 543 m from the bottom of the SukharikhaFormation.
The profile through the Sukharikha Formationshows that the lowermost Cambrian carbon isotopesignature has a complex pattern. There are threenegative excursions, 1n–3n, ranging from less than− 8 ‰ to − 4 ‰ in the lower Sukharikha Formation,and each of them can be potentially recognizedas the Precambrian–Cambrian boundary excursion.According to the chemostratigraphy, the Precambrian–Cambrian boundary can be placed as low as the absoluteminimum, 1n, in this series of oscillations. The lowestvalue, − 8.6 , occurs at the level of sample A51, 62.5 mabove the base of the Sukharikha Formation. Thereare, however, no diagnostic fossils from this level: thefirst skeletal remains (identified as Anabarites (?) fromthin sections of samples) occur 240 m above the base(380 m below the top) of the formation (Rowland etal. 1998). This is the position of the Precambrian–Cambrian boundary proposed by Rowland et al. (1998)on the basis of biostratigraphy. It is possible to placethis level between trough 2n and peak 3p of the isotopeprofile, because of the discrepancy between thicknessesof the Sukharikha Formation measured to be 619 m byRowland et al. (1998) and 543 m herein (Fig. 2).
Figure 5. Carbon and oxygen isotope profiles through thesequence boundary between the Sukharikha and Krasnoporogformations between samples A260 and A322 (collected with0.5 m intervals).
The first positive values in the rising trend from theUst’-Yudoma Formation of the southeastern Siberianplatform constitute peak Z (Brasier et al. 1994). Inthe Sukharikha section similar positive values arereached at peak 2p. Peaks 3p and 4p are of a similarmagnitude, however (c. + 2 ‰), and are thus alsocandidates for peak Z (Fig. 3). It is not possibleto make a definitive correlation of them because ofthe lack of adequately dense profiling through theUst’-Yudoma Formation and the scarcity of fossils inthe Sukharikha Formation (Khomentovsky & Karlova,2002). Peak 4p is the highest possible position of Z,though, because it is followed by high positive valuesof peak 5p that are unknown below cycle I of theuppermost Ust’-Yudoma Formation and are identifiedin pre-Tommotian strata elsewhere on the Siberianplatform (Kaufman et al. 1996; Kouchinsky et al.2001, 2005; Fig. 3). On the other hand, there is acloser similarity of peaks 2p and 3p with positivepeaks from the upper Manykaj Formation tentativelycorrelated with Z and I by Knoll et al. (1995b) andKaufman et al. (1996) (Fig. 3). The high positivevalues + 4.6 ‰ and + 6.4 ‰ of peaks 5p and 6p,respectively, are similar to those of oscillations knownfrom the Siberian platform in the lower PestrotsvetFormation of Selinde (Kouchinsky et al. 2005), thelower Emyaksin Formation of the Bol’shaya Kuonamkasections (Kouchinsky et al. 2001), the MedvezhinFormation of western Anabar (Kaufman et al. 1996),and the upper Kessyusa Formation of the Olenyok uplift(Knoll et al. 1995a).

8 A. KOUCHINSKY AND OTHERS
Results obtained from the uppermost SukharikhaFormation suggest that there are a negative excursion,6n, and a positive peak, 7p, below the drop ofvalues through the base of the Krasnoporog Formation(Fig. 2). The latter feature has apparently no exactmatch elsewhere, but it may be interpreted as atruncated uppermost pre-Tommotian excursion. Thecorresponding interval appears to be better preservedin the lower Pestrotsvet Formation of the Selindesection (Kouchinsky et al. 2005; Fig. 3). Datafrom the Lena–Aldan region, the lower PestrotsvetFormation of Selinde (Kouchinsky et al. 2005), andthe lower Emyaksin Formation of the Kuonamkasections (Kouchinsky et al. 2001) suggest that fastdropping values occur in the lower part of the N.sunnaginicus Biozone of the Tommotian Stage. Unlikethe sequence boundary between the Ust’-Yudoma andPestrotsvet formations in the Lena–Aldan region, thereis no evidence of erosion or any hiatus between theSukharikha and Krasnoporog formations at the samesequence boundary, although a change in colour andlithology occurs (Rozanov et al. 1969, 1992; Rowlandet al. 1998; personal observations by Vladimir Pavlov in2004). This seems to be in agreement with observationsby Rowland et al. (1998) of stylolitic dissolutionsurfaces within the upper part of the SukharikhaFormation. Consequently, peak 2p seems to be thelowest possible location of excursion Z; peak 5p istentatively correlated herein with excursion I’, andpeaks 6p–7p are within the I’n series of oscillations,where the upper peak 7p is truncated at the sequenceboundary (Kouchinsky et al. 2001, 2005).
The second rising trend of δ13C is observed throughthe Krasnoporog and lower Shumny formations (Figs2 and 3). It comprises four major excursions with sixmaximums that may be correlated with peaks II–VIIof the reference profile from the southeastern Siberianplatform (cf. Brasier et al. 1994). The δ13C signatureknown from the Tommotian–Botomian stages of theSiberian platform can be readily recognized in theKrasnoporog Formation. Peak II marks the Dokido-cyathus regularis Biozone of the Tommotian Stage.The subsequent oscillations with positive peaks III–VIIextend this record into the Botomian Stage, representedby the lower part of the Shumny Formation. Althoughthe Lower Botomian peak VII can be identified in thisportion, the higher isotopic record is more difficult torecognize from scattered values (Figs 2 and 3).
5. Biostratigraphic v. chemostratigraphiccorrelation with the Lena–Aldan region
A diverse complex of archaeocyaths with six speciesof the Nochoroicyathus sunnaginicus Biozone wasreported from the uppermost 2 m of the SukharikhaFormation by Rozanov et al. (1969). Subsequentpublications by other workers (Luchinina et al. 1997;Rowland et al. 1998; Khomentovsky & Karlova, 2002)
refer to this initial report, but do not confirm thepresence of archaeocyaths independently. According toKhomentovsky & Karlova (2002) the lower Tommotianboundary cannot be established biostratigraphically inthe Sukharikha section, because there are no diagnosticfossils belonging to the underlying pre-TommotianPurella Biozone there. On the contrary, archaeocyathsare well known from the lower 20 m of the KrasnoporogFormation (Rowland et al. 1998). The Nochoroicyathussunnaginicus–Dokidocyathus regularis boundary inthe Sukharikha section is indicated 1 m above the baseof the Krasnoporog Formation (Rowland et al. 1998) bythe first appearance of archaeocyaths Robustocyathusrobustus, Dictyocyathus translucidus, Cambrocyathel-lus tschuranicus, and Paranacyathus tuberculatus ofthe Dokidocyathus regularis Biozone. In contrast, che-mostratigraphic correlation with the stratotype sectionsuggests that the boundary is to be set at least as highas 3.5 m above the base (Figs 2, 3). According to thesame data, the Dokidocyathus lenaicus Biozone beginsat 18.5 m, but biostratigraphically it has been locatedat 11 m by Rowland et al. (1998). The Tommotian–Atdabanian boundary has been placed at 12.5 m abovethe base of the Krasnoporog Formation with the firstAtdabanian archaeocyaths Rotundocyathus dotatus andPliocyathus cf. Pliocyathus platyseptatus at this level(Rowland et al. 1998). Chemostratigraphy indicatesthat the boundary is located no lower than 50 mabove the base of the formation (Figs 2, 3). Theuppermost part of the Krasnoporog Formation con-tains archaeocyaths of the Carinacyathus squamosus–Botomocyathus zelenovi Biozone, belonging to theBotomian Stage (Rozanov et al. 1992). Trilobites ofthe Shumny Formation span the interval beginningwith the Calodiscus–Erbiella Biozone of the BotomianStage (Luchinina et al. 1997) and extending intothe Tomagnostus fissus–Paradoxides sacheri Biozoneof the Middle Cambrian (Rozanov et al. 1992).Chemostratigraphic correlation with the Lena–Aldanregion places the Atdabanian–Botomian boundarywithin the lowermost Shumny Formation, higher thansuggested by the biostratigraphy (Figs 2, 3).
Brasier et al. (1994) first noticed that chemostrati-graphic and biostratigraphic boundaries do not alwayscoincide between sections of the Lena–Aldan region ofthe Siberian platform. Diachroneity of biostratigraphicboundaries can be explained by faunal migrations orfacies unsuitable for preservation of index fossils. Aconcurrent explanation of chemo- and biostratigraphicboundary mismatch is a possible geochemical dia-chroneity, but the latter is more difficult to explain,because the sections discussed belong to the sameepicontinental basin of the Siberian platform withsurface ocean environments. Although absolute mag-nitudes of oscillations vary from one section to anotherdepending on local facies and diagenetic overprint (seeprofiles through the Tommotian–Botomian interval inFig. 3), a characteristic signature produced by trends

Precambrian–Cambrian carbon isotope stratigraphy Siberia 9
in changes of δ13C in the surface ocean can be usedfor intrabasinal and, probably, for global correlation.Hence, chemostratigraphy may well indicate that thefirst appearances discussed above are earlier in theSukharikha section than in the Lena–Aldan region.
6. Conclusions
Analysis of the carbon isotope profile through theSukharikha section in the northwestern margin ofthe Siberian platform reveals seven major oscillationswithin the Sukharikha Formation followed by fourmajor oscillations in the Krasnoporog and lowerShumny formations (Figs 2, 3). The evidence suggeststhat the δ13C negative anomaly characteristic of thePrecambrian–Cambrian boundary beds elsewhere isrecorded also in the Sukharikha section. There is aprominent negative shift in the lowermost SukharikhaFormation followed by a rising trend with secularoscillations towards highly positive excursions in theupper parts of the formation. The rising trend withinthe Sukharikha Formation comprises the negativeexcursions 1n–6n and positive excursions 1p–7p inascending order. Three prominent positive oscillationsin the upper Sukharikha Formation, peaks 5p–7p,precede excursion II of the Krasnoporog Formation.These peaks appear to be represented fragmentarilyin other sections of the northern Siberian platformwithin the interval containing the I’ and I’n series ofoscillations (Kaufman et al. 1996; Kouchinsky et al.2001, 2005). Peak 7p seems to be truncated at thesequence boundary between formations, suggestinga certain hiatus in accumulation. The second risingtrend of δ13C is observed through the Krasnoporogand Shumny formations and comprises four majorexcursions with six maximums identified as peaks II–VII in the Tommotian–Botomian interval of the refer-ence profile from the southeastern Siberian platform(cf. Brasier et al. 1994; Fig. 3). Chemostratigraphiccorrelation within the Siberian platform likely indicatesthat the first appearances of zonal index complexes ofarchaeocyaths are older in the Sukharikha section thanin the Lena–Aldan region.
Acknowledgements. We acknowledge support from theNASA Astrobiology Institute and the Swedish ResearchCouncil (Grant No. 621-2001-1751 to Stefan Bengtson andGrant No. 623-2003-207 to Artem Kouchinsky). ArtemKouchinsky is also supported from the NordCEE project.The authors are grateful to Martin Brasier and an anonymousreviewer for their invaluable comments on the manuscript.
References
AMTHOR, J. E., GROTZINGER, J. P., SCHRODER, S., BOWRING,S. A., RAMEZANI, J., MARTIN, M. W. & MATTER, A.2003. Extinction of Cloudina and Namacalathus at thePrecambrian–Cambrian boundary in Oman. Geology31, 431–4.
ASTASHKIN, V. A., PEGEL, T. V., SHABANOV, Y. Y., SUKHOV,S. S., SUNDUKOV, V. M., REPINA, L. N., ROZANOV, A. Y.& ZHURAVLEV, A. Y. 1991. The Cambrian System onthe Siberian Platform. Correlation chart and explanatorynotes. International Union of Geological SciencesPublication no. 27, 1–133.
BARTLEY, J. K., POPE, M., KNOLL, A. H., SEMIKHATOV,M. A. & PETROV, P. YU. 1998. A Vendian–Cambrianboundary succession from the northwestern margin ofthe Siberian Platform: stratigraphy, palaeontology, che-mostratigraphy and correlation. Geological Magazine135, 473–94.
BRASIER, M. D., KHOMENTOVSKY, V. V. & CORFIELD, R. M.1993. Stable isotopic calibration of the earliest skeletalfossil assemblages in eastern Siberia (Precambrian–Cambrian boundary). Terra Nova 5, 225–32.
BRASIER, M. D., ROZANOV, A. YU., ZHURAVLEV, A. YU.,CORFIELD, R. M. & DERRY, L. A. 1994. A carbon isotopereference scale for the Lower Cambrian successionin Siberia: report of IGCP project 303. GeologicalMagazine 131, 767–83.
BRASIER, M. D., SHIELDS, G., KULESHOV, V. N. &ZHEGALLO, E. A. 1996. Integrated chemo- andbiostratigraphic calibration of early animal evolu-tion: Neoproterozoic–early Cambrian of southwestMongolia. Geological Magazine 133, 445–85.
BUGGISCH, W., KELLER, M. & LEHNERT, O. 2003. Carbonisotope record of Late Cambrian to Early Ordoviciancarbonates of the Argentine Precordillera. Palaeogeo-graphy, Palaeoclimatology, Palaeoecology 195, 357–73.
COWIE, J. W. & ROZANOV, A. YU. 1983. Precambrian–Cambrian Boundary candidate, Aldan River, Yakutia,U.S.S.R. Geological Magazine 120, 129–39.
GRIGOR’EV, V. V. 1958. New discovery of a fauna in thenorthwestern Siberian Platform and the Lower Cambriansubdivision of the Igarka area. Doklady Akademii NaukSSSR 119, 137–39 (in Russian).
GROTZINGER, J. P., BOWRING, B. Z., SAYLOR, B. Z. &KAUFMAN, A. J. 1995. Biostratigraphic and geochrono-logic constraints on early animal evolution. Science 270,598–604.
HSU, K. J., OBERHANSLI, H., GAO, J. Y., SHU, S., HAIHONG,C. & KRAHENBUHL, U. 1985. ‘Strangelove ocean’before the Cambrian explosion. Nature 316, 806–11.
KAUFMAN, A. J. & KNOLL, A. H. 1995. Neoproterozoicvariations in the C-isotopic composition of seawater:Stratigraphic and biogeochemical implications. Pre-cambrian Research 73, 27–49.
KAUFMAN, A. J., KNOLL, A. H., SEMIKHATOV, M. A.,GROTZINGER, J. P., JACOBSEN, S. B. & ADAMS, W. 1996.Integrated chronostratigraphy of Proterozoic–Cambrianboundary beds in the western Anabar region, northernSiberia. Geological Magazine 133, 509–33.
KIMURA, H., MATSUMOTO, R., KAKUWA, Y., HAMDI, B.& ZIBASERESHT, H. 1997. The Vendian–Cambrian 13Crecord, North Iran: evidence for overturning of the oceanbefore the Cambrian explosion. Earth and PlanetaryScience Letters 147, E1–E7.
KIRSCHVINK, J. L., MAGARITZ, M., RIPPERDAN, R. L.,ZHURAVLEV, A. YU. & ROZANOV, A. YU. 1991. ThePrecambrian–Cambrian boundary: magnetostratigraphyand carbon isotopes resolve correlation problemsbetween Siberia, Morocco, and South China. GSA Today1, 69–71, 87, 91.
KHOMENTOVSKY, V. V. & KARLOVA, G. A. 2002. Gran-itsa nemakit-daldynskogo i tommotskoga yarusov

10 Precambrian–Cambrian carbon isotope stratigraphy Siberia
(vend-kembrij) Sibiri. [The boundary between Nemakit-Daldynian and Tommotian stages (Vendian–Cambrian)of Siberia.] Stratigraphy. Geological Correlation 10,13–34.
KNOLL, A. H. 2000. Learning to tell Neoproterozoic time.Precambrian Research 100, 3–20.
KNOLL, A. H., GROTZINGER, J. P., KAUFMAN, A. J. & KO-LOSOV, P. 1995a. Integrated approaches to terminalProterozoic stratigraphy: An example from the OlenekUplift, northeastern Siberia. Precambrian Research 73,251–70.
KNOLL, A. H., KAUFMAN, A. J., SEMIKHATOV, M. A.,GROTZINGER, J. P. & ADAMS, W. 1995b. Sizing up thesub-Tommotian unconformity in Siberia. Geology 23,1139–43.
KOUCHINSKY, A. V., BENGTSON, S., MISSARZHEVSKY, V. V.,PELECHATY, S., TORSSANDER, P. & VAL’KOV, A. K.2001. Carbon isotope stratigraphy and the problem of apre-Tommotian Stage in Siberia. Geological Magazine138, 387–96.
KOUCHINSKY, A. V., BENGTSON, S., PAVLOV, V., RUNNEGAR,B., VAL’KOV, A. & YOUNG, E. 2005. Pre-Tommotian ageof the lower Pestrotsvet Formation in the Selinde sectionon the Siberian platform: Carbon isotopic evidence.Geological Magazine 142, 1–7.
LANDING, E. 1994. Precambrian–Cambrian boundary globalstratotype ratified and a new perspective of the Cambriantime. Geology 22, 179–82.
LUCHININA, V. A., KOROVNIKOV, I. V., SIPIN, D. P., & FE-DOSEEV, A. V. 1997. Biostratigraphy of the UpperVendian–Lower Cambrian Sukharikha River section(Siberian platform). Geologiya i Geofizika 38, 1346–58(in Russian).
MAGARITZ, M. 1989. δ13C minima follow extinction events:A clue to faunal radiation. Geology 17, 337–40.
MAGARITZ, M., HOLSER, W. T. & KIRSCHVINK, J. L. 1986.Carbon isotope events across the Precambrian/Cambrianboundary on the Siberian Platform. Nature 320, 258–9.
MAGARITZ, M., LATHAM, A. J., KIRSCHVINK, J. L.,ZHURAVLEV, A. YU. & ROZANOV, A. YU. 1991.Precambrian–Cambrian boundary problem I: Carbonisotope correlations for Vendian and Tommotian timebetween Siberia and Morocco. Geology 19, 847–50.
MALOOF, A. C., SCHRAG, D. P., CROWLEY, J. L. & BOWRING,S. A. 2005. An expanded record of Early Cambriancarbon cycling from the Anti-Atlas Margin, Morocco.Canadian Journal of Earth Sciences 42, 2195–2216.
NARBONNE, G. M., KAUFMAN, A. J. & KNOLL, A. H. 1994.Integrated chemostratigraphy and biostratigraphy ofthe Windermere Supergroup, northwestern Canada:Implications for Neoproterozoic correlations and theearly evolution of animals. Geological Society ofAmerica Bulletin 106, 1281–92.
PELECHATY, S. M. 1998. Integrated chronostratigraphy of theVendian System of Siberia: implications for a globalstratigraphy. Journal of the Geological Society, London155, 957–73.
PELECHATY, S. M., GROTZINGER, J. P., KASHIRTSEV, V. A. &ZHERNOVSKY, V. P. 1996. Chemostratigraphic and se-
quence stratigraphic constraints on Vendian–Cambrianbasin dynamics, northeast Siberian craton. Journal ofGeology 104, 543–63.
PELECHATY, S. M., KAUFMAN, A. J. & GROTZINGER, J. P.1996. Evaluation of δ13C isotope stratigraphy forintrabasinal correlation: Vendian strata of northeastSiberia. Geological Society of America Bulletin 108,992–1003.
POKROVSKY, B. G. & MISSARZHEVSKY, V. V. 1993. Izo-topnaya korrelyatsiya pogranichnykh tolsch dokembriyai kembriya Sibirskoj platformy. [Isotopic correlationof Precambrian and Cambrian boundary beds of theSiberian Platform.] Doklady Akademii Nauk 329, 768–71 (in Russian).
POKROVSKY, B. G. 1996. Granitsa Proterozoya i Paleo-zoya: izotopnye anomalii v razrezakh Sibirskoj plat-formy i global’nye izmeneniya prirodnoj sredy. [TheProterozoic–Palaeozoic boundary: Isotopic anomaliesin sections of the Siberian platform and global chagesof the environment.] Litologiya i poleznye iskopaemye4, 376–92 (in Russian).
ROWLAND, S. M., LUCHININA, V. A., KOROVNIKOV, I. V.,SIPIN, D. P., TARLETSKOV, A.. & FEDOSEEV, A. V. 1998.Biostratigraphy of the Vendian–Cambrian SukharikhaRiver section, northwestern Siberian Platform. Cana-dian Journal of Earth Sciences 35, 339–52.
ROZANOV, A. YU. 1984. The Precambrian–Cambrian bound-ary in Siberia. Episodes 7, 20–4.
ROZANOV, A. YU., MISSARZHEVSKY, V. V., VOLKOVA, N. A.,VORONOVA, L. G., KRYLOV, I. N., KELLER, B. M., KORO-LYUK, I. K., LENDZION, K., MICHNIAK, R., PYKHOVA,N. G. & SIDOROV, A. D. 1969. Tommotskij yarus iproblema nizhnej granitsy kembriya. [The TommotianStage and the problem of the lower boundary of theCambrian.] Trudy Geologicheskogo Instituta AN SSSR206, 1–380.
ROZANOV, A. YU., REPINA, L. N., APOLLONOV, M. K.,SHABANOV, YU. YA., ZHURAVLEV, A. YU., PEGEL’, T. V.,FEDOROV, A. B., ASTASHKIN, V. A., ZHURAVLEVA, I. T.,EGOROVA, L. I., CHUGAEVA, M. N., DUBININA, S. V., ER-MAK, V. V., ESAKOVA, N. V., SUNDUKOV, V. V., SUKHOV,S. S. & ZHEMCHUZHNIKOV, V. G. 1992. Kembrij Sibiri.[The Cambrian of Siberia.] Novosibirsk: Nauka, 135p.(in Russian).
ROZANOV, A. YU. & ZHURAVLEV, A. YU. 1992. The LowerCambrian fossil record of the Soviet Union. In Originand Early Evolution of the Metazoa (eds J. H. Lipps &P. W. Signor), pp. 205–82. New York: Plenum.
SAVITSKY, V. E., SHISHKIN, B. B. & SHABANOV, YU. YA.1967. O stratigraficheskom raschlenenii dokembrijskikhi kembrijskikh otlozhenij Igarskogo rajona. [On strati-graphic subdivision of the Precambrian and Cambriandeposits of the Igarka region.] In Materialy po re-gional’noj geologii Sibiri. [Materials to a regionalgeology of Siberia.] (ed. V. I. Krasnov), pp. 133–49.Novosibirsk: SNIIGGiMS.
TUCKER, M. E. 1986. Carbon isotope excursions in Precam-brian/Cambrian boundary beds, Morocco. Nature 319,48–50.


