Embed Size (px)
Citation preview

www.elsevier.com/locate/jfoodeng
Journal of Food Engineering 83 (2007) 531–540
Changes in the physical properties of bananas on applying HTSTpulse during air-drying
Kelly Hofsetz a,*, Celso Costa Lopes a, Miriam Dupas Hubinger a,*,Luis Mayor b, Alberto M. Sereno b
a Department of Food Engineering, Faculty of Food Engineering, State University of Campinas, P.O. Box 6121, 13083-862 Campinas, SP, Brazilb REQUIMTE, Department of Chemical Engineering, Faculty of Engineering, University of Porto, P-4200-465 Porto, Portugal
Received 19 December 2006; received in revised form 29 March 2007; accepted 1 April 2007Available online 14 April 2007
Abstract
The effect of high temperature (HTST) pulse on the air-drying of banana slices was studied and compared with the conventional air-drying process. The Exponential and Page models fitted the experimental data of the dehydration kinetics for both processes well. Thedifferent drying treatments led to distinctive structural changes in the samples, affecting the shrinkage and porosity. The combinedHTST/air-drying process simultaneously puffed and dried the banana slices, resulting in reduced shrinkage compared with the conven-tional air-dried samples. For conventionally air-dried samples, the increase in porosity reached a value of 32% at the end of the process.During the HTST/air-drying process, the porosity increment reached values of from 45% to 53% at the end of drying, resulting in theformation of a highly porous structure, which occurred together with an expansion in volume. Structural observations of the bananasamples during the processes studied were able to explain the volume and porosity changes.� 2007 Elsevier Ltd. All rights reserved.
Keywords: Dehydration; Shrinkage; Porosity; Puffing; Structure
1. Introduction
Air-drying is the most common drying methodemployed for foodstuffs. It offers dehydrated products thatcan have an extended shelf life, but the quality of a conven-tionally dried product is often reduced as compared to thatof the original foodstuff, with an impact in quality in termsof colour, rehydration ratio, texture and other characteris-tics (Ratti, 2001). Recently, microwave drying hasappeared as a rapid and efficient drying method as com-pared to conventional hot air-drying. However, due to itshigh cost, microwave drying cannot compete with conven-tional air-drying. Therefore, essentially for economic rea-sons, it has been suggested that it should be applied only
0260-8774/$ - see front matter � 2007 Elsevier Ltd. All rights reserved.
doi:10.1016/j.jfoodeng.2007.04.003
* Corresponding authors. Tel.: +55 19 35214036/4043; fax: +55 19 35214027.
E-mail addresses: [email protected] (K. Hofsetz), [email protected] (M.D. Hubinger).
in the last stages of air-drying (Maskan, 2000). Despitemany advantages, such as good rehydration properties,high quality products and little or no shrinkage, freeze-drying has always been recognized as the most expensiveprocess for manufacturing dehydrated products (Ratti,2001; Saca & Lozano, 1992). Another cheaper alternativeto produce materials with similar qualities to those offreeze-dried products is called puffing. A puffing processinvolves the release or expansion of vapour or gas withinthe product, either to create an internal structure or toexpand and/or rupture an existing one (Payne, Taraba, &Saputra, 1989). Some puffing methods include explosionpuffing (Saca & Lozano, 1992), high temperature fluidisedbeds (Kim & Toledo, 1987), the application of vacuumdehydration (Krokida, Zogzas, & Maroulis, 1997), and ahigh temperature and short time drying pulse (Schultzet al., 2007; Varnalis, Brennan, & MacDougall, 2001).
A high temperature and short time (HTST) drying pulsecombined with hot air-drying process represents an
Nomenclature
aw water activity, dimensionlessAD air-drying stageADP conventional air-drying processHTST high temperature and short time drying pulsek constant of drying models, min�n
MR moisture ratio, dimensionlessMRexp,i ith experimental moisture ratio, dimensionlessMRpre,i ith predicted model moisture ratio, dimension-
lessn Page’s model exponent, dimensionlessN number of sampling timesRMSE root mean square errorR2 coefficient of determinationSb bulk shrinkage ratio (Vb/Vb0)t drying time, minV volume, m3
X moisture content (dry basis), kg water kg drysolid�1
z number of constants in the drying model
Subscripts
b bulke equilibriumexp experimentalo initialp particlepre predictedw water
Greek symbols
e porosity (%)v2 chi-square, reduced mean square deviation
532 K. Hofsetz et al. / Journal of Food Engineering 83 (2007) 531–540
alternative to eliminate the previous blanching stage, andpromote better sensory characteristics in the final product,especially those associated with crispness. After HTSTpulse the food must be further air-dried to reduce the wateractivity (aw) to a value that will inhibit the growth anddevelopment of pathogenic and spoilage microorganisms,significantly reducing enzyme activity and the rate at whichundesirable chemical and deteriorative reactions occur(Brennan, 1994).
One of the most important physical properties that char-acterises the quality of dried, crispy foods is porosity. Theloss of water that occurs during drying causes a reductionin cell tissue size, which is usually referred to as shrinkage.The two properties have been studied in many dehydratedfood products (Krokida & Maroulis, 1997; Ratti, 1994).Helium stereopycnometry (Krokida & Maroulis, 1997),mercury porosimetry (Karathanos, Anglea, & Karel,1993) and the measurement of the volume of ground anddegasified samples (Nieto, Salvatori, Castro, & Alzamora,2004) were some of the methods used to determine theporosity of food materials. Recently, Sereno, Silva, andMayor (2007) have proposed a non-destructive methodbased on gas pycnometry to determine the particle densityand porosity of foods and materials with high moisturecontent. Moreover, the measurement of the porosity offoods can be accomplished by image processing/analysis,using either an image from a microscope or, in the caseof macroporous foods, an image directly captured from avideo camera and macro lens (Barret, 2002).
The main objectives of this work were to study the effectof a HTST pulse on the porosity and shrinkage of convectiveair-dried banana pieces, and compare the results with thoseobtained in a conventional air-drying process (ADP). Inaddition, the structural changes produced in convective
air-dried banana with and without the application of aHTST pulse were observed by microscopy techniques, andwere related to the shrinkage and porosity changes.
2. Material and methods
2.1. Material preparation
Banana fruits from Madeira Island (Portugal), with aninitial moisture content between 70% and 75% (w.b.), werepurchased in a local market and stored at 20 �C until reach-ing 20 �Brix. The bananas were then peeled and both endsremoved and discarded. The fruit was cut into 1 cm thickdiscs and each disc cut into quarters and placed on the traydryer in a single layer.
2.2. Drying equipment
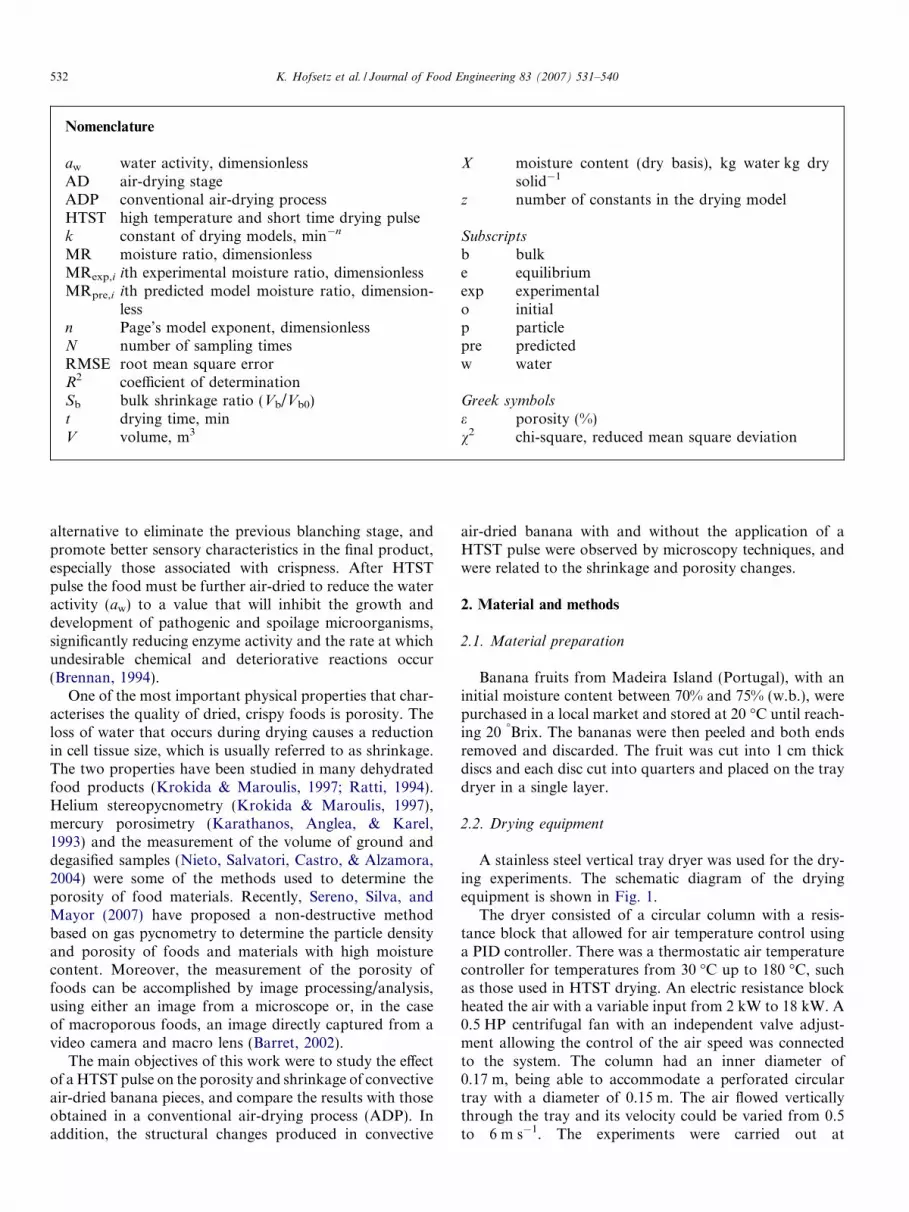
A stainless steel vertical tray dryer was used for the dry-ing experiments. The schematic diagram of the dryingequipment is shown in Fig. 1.
The dryer consisted of a circular column with a resis-tance block that allowed for air temperature control usinga PID controller. There was a thermostatic air temperaturecontroller for temperatures from 30 �C up to 180 �C, suchas those used in HTST drying. An electric resistance blockheated the air with a variable input from 2 kW to 18 kW. A0.5 HP centrifugal fan with an independent valve adjust-ment allowing the control of the air speed was connectedto the system. The column had an inner diameter of0.17 m, being able to accommodate a perforated circulartray with a diameter of 0.15 m. The air flowed verticallythrough the tray and its velocity could be varied from 0.5to 6 m s�1. The experiments were carried out at

R1 R4R2 R5R3 R6
R1ONOFF
FAN GERAL
R2 R3 R4 R5 R6
11
10
1
3
8
69
7
2
4
5
Fig. 1. Schematic diagram of the drying equipment (1 = air flow input, 2 = centrifugal fan, 3 = air valve adjustment, 4 = electric resistance block,5 = circular tube, 6 = drawer to accommodate one drying tray, 7 = circular dryer column, 8 = air flow output, 9 = thermocouple, 10 = electric panel,11 = PID controller).
K. Hofsetz et al. / Journal of Food Engineering 83 (2007) 531–540 533
3.5 m s�1. The relative humidity of the air was about 38%at 20 �C and about 4% during the HTST pulse.
2.3. Drying process
In order to obtain a crispy, stable product, drying wasperformed to water activity values below 0.3.
According to previous experiments, browning is evi-denced by a toasted smell or a burnt flavour (Demirel &Turhan, 2003), and excessive drying, caused either by atoo high drying temperature or a too long drying time,causes surface hardening and browning of the material(Kim & Toledo, 1987). In order to avoid these problems,preliminary tests, based on previous experiments (Hofsetz& Lopes, 2005), were conducted to determine the best con-ditions for the HTST pulse on the puffing of bananas. Dry-ing times of 23 min at 130 �C, 15 min at 140 �C and 12 minat 150 �C for the HTST pulse were chosen, and were sub-sequently used for the experimental runs. After the HTSTpulse, the temperature was adjusted to 70 �C. This periodof a gradual decrease in the HTST pulse temperature tothe air-drying temperature at 70 �C was called the ‘‘coolingperiod”, and took 25 min. Finally, the drying time requiredto produce crispy banana pieces with a water activity below0.3, was determined as being an air-drying stage (AD) of5 h (300 min) at 70 �C.
For the conventional air-drying process (ADP) the sam-ples were dried at 70 �C by convection air-drying for 8 h(480 min).
Both drying processes, HTST/AD and ADP, were car-ried out in the same equipment described in Section 2.2.
Table 1 shows the drying conditions and sampling timesfor the HTST/AD and ADP processes during the drying ofthe bananas.
2.4. Experimental determinations
2.4.1. Soluble solids (�Brix)
The Soluble solids contents of the fresh samples as Brixwere determined with an Abbe refractometer (Abbe-3L,Bausch & Lomb, Rochester, NY, USA) at 25 �C.
2.4.2. Particle and bulk volume, porosity and shrinkage
The particle volume (Vp) was measured using a gas pyc-nometer, built to work with wet solids according to themethodology proposed by Sereno et al. (2007).
The bulk volume (Vb) was determined from the buoyantforces of the samples when immersed in n-heptane (Loz-ano, Rotstein, & Urbicain, 1980).
The porosity was calculated from the bulk volume (Vb)and particle volume (Vp), using the equation (Mohsenin,1970):
Table 1Drying conditions and sampling times for the HTST/AD and ADP processes during the drying of the bananas with an airflow of 3.5 ms�1
Drying process Sampling times (min)
ADP-70 �C-8 ha 0 15 30 45 60 75 90 105 135 180 240 300 360 420 480 –
HTST pulse Cooling period AD stage
HTST(130 �C–23 min)/ADb 0 1 3 15 18 23 28 33 38 43 48 108 168 228 288 348HTST(140 �C–15 min)/ADb 0 1 3 9 12 15 20 25 30 35 40 100 160 220 280 340HTST(150 �C–12 min)/ADb 0 1 3 7 9 12 17 22 27 32 37 97 157 217 277 337
a ADP, conventional air-drying process.b HTST, high temperature and short time drying pulse; AD, air-drying stage.
534 K. Hofsetz et al. / Journal of Food Engineering 83 (2007) 531–540
e ð%Þ ¼ 1� V p
V b
� �� 100: ð1Þ
Porosity changes were presented as an increment of thesample porosity at a certain drying time (e) as comparedto its initial porosity (e0):
De ð%Þ ¼ e� e0: ð2ÞVolume changes of individual samples were expressed asthe bulk shrinkage ratio (Sb) of the sample bulk volumeafter a certain drying time (Vb) as compared to its initialbulk volume (Vb0).
Sb ¼V b
V b0
: ð3Þ
The particle volume (Vp) and bulk volume (Vb) measure-ments were made using four samples removed from thedryer at different sampling times (Table 1). Each experi-mental point shown as variation in shrinkage or porosityis the average value of these four samples.
2.4.3. Moisture content
After the volume determination, the moisture contentwas obtained by drying the samples to constant mass in avacuum oven (Vaciotem J.P. Selecta S.A. Abrera, Barce-lona, Spain) at 70 �C, followed by the AOAC standard pro-cedure (AOAC, 1996). The sample mass was determinedusing a digital balance (Sartorius GM, BP 211D,Germany).
The moisture content determination was made usingfour samples removed from the dryer at different samplingtimes (Table 1). Each experimental point was the averagevalue of these four samples.
2.4.4. Water activity (aw)
Water activity was determined using a Decagon CX-2Thygrometer (Aqualab� – Decagon Devices Inc., Pullman,WA, USA) at 25 �C.
2.4.5. Structure observations
Structural changes in the banana during drying werestudied using a stereomicroscope. Two independent dryingexperiments were carried out. In one case, the samples weredried using an HTST(150 �C–12 min)/AD process, and inthe other case the samples were dried using an ADP-70 �C–8 h process. Samples were removed from the dryer
at different sampling times (Table 1) and were cut in halfusing a stainless steel blade to observe the internal struc-ture. Images of the samples were taken with a stereomicro-scope (Olympus SZ-11, Tokyo, Japan). A digital colourvideo camera (SONY Exwavehad, Tokyo, Japan) wasattached to the microscope and then connected to a TVmonitor and a personal computer. Images were calibratedusing a 2 mm long stage micrometer (Leitz Wetzlar, Ger-many) with 0.01 mm intervals. The images were processedusing the Paint Shop Pro 4.12 software.
2.5. Mathematical modelling of the drying processes
The moisture ratio (MR) during the drying experimentswas calculated using the following equation:
MR ¼ X � X e
X 0 � X e
; ð4Þ
where X, Xe and X0 are the moisture content at a time t, theequilibrium moisture content and the initial moisture con-tent. For the fits, the equilibrium moisture contents (Xe)were equal to 0.05 kg water kg dry solid�1, 0.02 kgwater kg dry solid�1, 0.01 kg water kg dry solid�1 and0.03 kg water kg dry solid�1 (dry basis) for the HTST(130 �C–23 min)/AD, HTST(140 �C–15 min)/AD, HTST(150 �C–12 min)/AD and ADP-70 �C-8 h processes, respec-tively. These equilibrium moisture contents values are re-ferred to the final point of the drying process, whenwater activity values reached figures around 0.3, as ex-plained in Section 2.3.
The experimental results for the moisture ratio versusdrying time were fitted to simplified expressions of asemi-theoretical model, the Exponential model Eq. (5),and to an empirical model, the Page model Eq. (6).
MR ¼ X � X e
X 0 � X e
¼ expð�k � tÞ; ð5Þ
MR ¼ X � X e
X 0 � X e
¼ expð�k � tnÞ; ð6Þ
where, t is the drying time, k is a constant of drying mod-els and n is a dimensionless Page’s model exponent addedto improve the model prediction in addition to the con-stant k.
The non-linear regression analysis was performed usingthe software Statistica�, version 5.0. The coefficient of

K. Hofsetz et al. / Journal of Food Engineering 83 (2007) 531–540 535
determination (R2), the reduced mean square of the devia-tion – Chi-square (v2) – and the root mean square error(RMSE) were used to evaluate the goodness of fit (Ertekin& Yaldiz, 2004; Ozdemir & Devres, 1999):
v2 ¼PN
i¼1ðMRexp; i �MRpre;iÞ2
N � z; ð7Þ
RMSE ¼PN
i¼1ðMRpre; i�MRexp; iÞ2
N
" #1=2
; ð8Þ
where, MRexp,i is the ith experimental moisture ratio,MRpre,i is the ith predicted model moisture ratio, N is thenumber of sampling times (Table 1), and z is the numberof constants in the drying model.
3. Results and discussion
3.1. Drying behaviour and drying kinetics of bananas
Fig. 2 presents the experimental moisture ratio versustime during the drying of bananas using the HTST/ADand ADP processes. Each experimental point in the figurerepresents the average value of four samples, as explainedin Section 2.4.3, where the maximum standard deviationwas 0.009 for ADP-70 �C-8 h, 0.01 for HTST(130 �C–23 min)/AD, 0.008 for HTST(140 �C–15 min)/AD, and0.01 for HTST(150 �C–12 min)/AD.
For the ADP process, the typical behaviour reported forthe convective drying of fruits and vegetables could beobserved. Initially the moisture decrease was fast, and, asfrom a certain time/moisture content (about 100 min;MR = 0.08; in the present case), the moisture content
0.00
0.20
0.40
0.60
0.80
1.00
0 100 200 300 400 500time (min)
MR
HTST(130˚C-23min)/AD
HTST(140˚C-15min)/AD
HTST(150˚C-12min)/AD
ADP-70˚C-8h
Fig. 2. Experimental moisture ratio versus time during the drying ofbananas using the HTST/AD and ADP processes with an airflow of3.5 ms�1.
decreased more slowly up to the end of the drying process.A period with a constant drying rate was not found, andthe drying always occurred in the falling rate period. Thisbehaviour is similar to that observed during the convectivedrying of bananas in other studies (Demirel & Turhan,2003; Maskan, 2000).
The drying behaviour of the HTST/AD process showedsignificant differences when compared to ADP; the mois-ture decrease was more accentuated in the initial stage ofthe drying process. The high temperature pulse enhancedwater diffusion through the banana tissue. Furthermore,water evaporation due to the high temperatures of thepulse and the pressure increased due to vapour heating,created a ‘‘puffing effect” that accelerated water removal.
As a consequence, the ADP process resulted in a finalproduct with a final moisture ratio similar to that obtainedin the HTST/AD process, but took longer to dry. The com-bined HTST/AD process required a total drying time of348 min for the HTST (130 �C–23 min)/AD process toattain the equilibrium moisture content and water activity(aw) below 0.3 (aw = 0.291 ± 0.003; MR = 0.002 ± 0.002);340 min for the HTST (140 �C–15 min)/AD process(aw = 0.285 ± 0.004; MR = 0.003 ± 0.001); and 337 minfor the HTST (150 �C–12 min)/AD process (aw = 0.276± 0.003; MR = 0.002 ± 0.001). As expected, the combinedHTST pulse with hot air-drying saved at least 30% in totaldrying time, as compared to the ADP samples, whichreached aw values above 0.3 after 480 min (8 h) of process-ing (aw = 0.386 ± 0.001; MR = 0.005 ± 0.002).
In Fig. 2, the three curves with HTST pulse showed asimilar gradual decline up to a MR of about 0.20 and dry-ing time below 20 min. After further drying time, the threecurves entered the ‘‘cooling period” and subsequently theAD stage at different drying time/moisture content points,resulting in different curve behaviours since for the sameMR value, the samples were at different temperatures.For the HTST (150 �C–12 min)/AD process, the ‘‘coolingperiod” started at a drying time = 13 min/MR = 0.29 andthe AD stage at 38 min/MR = 0.16, for the HTST(140 �C–15 min)/AD process, the ‘‘cooling period” startedat a drying time = 16 min/MR = 0.13 and the AD stageat 41 min/MR = 0.01, and for the HTST (130 �C–23 min)/AD process, the ‘‘cooling period” started at adrying time = 24 min/MR = 0.07 and the AD stage at49 min/MR = 0.009. Moreover, the results in Fig. 2 sug-gest that in the range of temperatures used for the HTSTpulse (130–150 �C) processes, the drying time had a signif-icant influence on the dehydration rates, whereas, the tem-perature itself had a smaller influence on these rates, whencomparing the different HTST conditions. A longer pulsetime led to longer puffing times and to the removal of largeramounts of water vapour due to pressure unbalances cre-ated in the puffing stage.
The statistical results for the Exponential and Pagemodels and their constants and coefficients during the dry-ing of bananas by the HTST/AD and ADP processes arepresented in Table 2. For both models the fit was good,

Table 2Statistical results for the Exponential and Page models and their constants and coefficients during the drying of bananas by the HTST/AD and ADPprocesses
Drying process Model Drying constants Goodness of fit
k (min�n) n R2 v2 RMSE
ADP-70 �C-8 ha Exponential 0.0270 1 0.994 0.0009 0.0291Page 0.0549 0.8148 0.998 0.0004 0.0184
HTST(130 �C–23 min)/ADb Exponential 0.1219 1 0.998 0.0005 0.0214Page 0.1595 0.8805 0.999 0.0003 0.0149
HTST(140 �C–15 min)/ADb Exponential 0.1436 1 0.998 0.0004 0.0192Page 0.1945 0.8585 0.999 0.0000 0.0055
HTST(150 �C–12 min)/ADb Exponential 0.0919 1 1.000 0.0045 0.0652Page 0.2161 0.6423 0.998 0.0011 0.0305
a ADP, conventional air-drying process.b HTST, high temperature and short time drying pulse; AD, air-drying stage.
536 K. Hofsetz et al. / Journal of Food Engineering 83 (2007) 531–540
in general presenting R2 values of about 0.99. Observingthe three parameters used in the analysis of the goodnessof fit (R2, v2 and RMSE) it can be said that the Page modelfitted the experimental data slightly better. The predictedmoisture ratios during the drying of bananas obtained byfitting Page model are presented in Fig. 3, and in general,the fit was good, presenting good agreement between theexperimental data and predicted values for moisture ratio.
The estimated values for the k and n constants of thePage model, shown in Table 2, ranging from 0.0549 to0.2161 min�n and from 0.6423 to 0.8148, respectively, arein the order of those found in the literature for the convec-tive drying of bananas (Dandamrongrak, Young, &Mason, 2002). It is interesting to observe that the k values
0.00
0.20
0.40
0.60
0.80
1.00
0 120 240 360 480time (min)
MR
HTST(130˚C-23min)/AD
HTST(140 C-15min)/AD
HTST(150 C-12min)/AD
ADP-70˚C-8h
Page model
0.00
0.20
0.40
0.60
0.80
1.00
0 20 40 60time (min)
MR
Fig. 3. Comparison of the experimental and predicted moisture ratiosduring the drying of bananas obtained by fitting the Page model to thedata for the HTST/AD and ADP processes with an airflow of 3.5 ms�1.
increased with the temperature for all treatments, whereas,the n values decreased with increase in temperature anddecrease in pulse time. The n parameter is empirical andsome authors have related this parameter to the processconditions (Azzouz, Guizani, Jomaa, & Belghith, 2002).The k parameter has been associated with the drying rate,being a measure of the rate of moisture transfer from thematerial, and in this way, an increase in the k parameterwith temperature has been reported during the convectivedrying of agricultural products (Karathanos & Belessiotis,1999; Simal, Femenia, Garau, & Rossello, 2005). Anincrease in the process drying temperature increases themoisture transfer rate from the material, which results inan increase in the k values.
0.00
0.20
0.40
0.60
0.80
1.00
0.00 0.20 0.40 0.60 0.80 1.00MR
Sb
HTST(130˚C-23min)/AD
HTST(140˚C-15min)/AD
HTST(150˚C-12min)/AD
ADP-70˚C-8h
Fig. 4. Experimental shrinkage data versus moisture ratio during thedrying of bananas for HTST/AD and ADP processes with an airflow of3.5 ms�1.

K. Hofsetz et al. / Journal of Food Engineering 83 (2007) 531–540 537
3.2. Shrinkage and porosity changes in banana samples
during drying
Fig. 4 shows the shrinkage data versus moisture ratioduring the drying of bananas for HTST/AD and ADP pro-cesses. The black circles surrounding some points indicatethe end of the HTST pulse. Each experimental point repre-sents the average value of four samples, as explained in Sec-tion 2.4.2, where the maximum mean standard deviationwas 0.034 for ADP-70 �C–8 h, 0.035 for HTST(130 �C–23 min)/AD, 0.032 for HTST(140 �C–15 min)/AD, and0.032 for HTST(150 �C–12 min)/AD.
The volume of the samples during ADP decreased line-arly with the decrease in moisture content up to the end ofthe process (Sb = 0.3). This linear decrease in volume dur-ing convective drying was previously observed in banana(Katekawa & Silva, 2004) as well as in other agriculturalproducts (Lozano, Rotstein, & Urbicain, 1983; Ratti,1994), and corresponds to a continuous collapse of thesolid matrix of the vegetable tissue as a consequence ofthe contracting stresses produced by the removal of thewater (Mayor & Sereno, 2004).
It was observed that the shrinkage behaviour was simi-lar under all the HTST/AD conditions (Fig. 4), presentingnon-linear dependence on the moisture ratio. Initially, thevolume decreased linearly, then increased again and finallydecreased up to the end of the process, reaching from 51%to 60% of the initial volume depending on the HTST con-ditions. It can be said that the shrinkage of the HTST/ADsamples was less accentuated than that observed in theADP samples. Saca and Lozano (1992) observed the samebehaviour during the explosion puffing of bananas, when
0
10
20
30
40
50
60
0.00 0.20 0.40 0.60 0.80 1.00MR
HTST(130˚C-23min)/AD
HTST(140˚C-15min)/AD
HTST(150˚C-12min)/AD
ADP-70ºC-8h
Δε (
%)
Fig. 5. Experimental porosity data versus moisture ratio during the dryingof bananas for HTST/AD and ADP processes with an airflow of 3.5 ms�1.
the explosion puffed bananas shrank less than the conven-tionally air-dried ones.
With respect to porosity changes, Fig. 5 shows theexperimental porosity data versus moisture ratio duringthe drying of bananas for HTST/AD and ADP processes.The black circles surrounding some points indicate theend of the HTST pulse. The maximum standard deviationwas 3.6% for ADP-70 �C-8 h, 3% for HTST(130 �C–23 min)/AD, 3.4% for HTST(140 �C–15 min)/AD, and3.5% for HTST(150 �C–12 min)/AD. Before drying, thefresh samples presented porosity values of about 10%. Itcan be seen that for the ADP process, the porosityincreased continuously up to the end of the process, reach-ing a porosity increase value of about 32%. This behaviourwas similar to that observed during the convective dryingof bananas in other studies (Krokida & Maroulis, 1997;Saca & Lozano, 1992). The decrease in volume togetherwith the formation of some pores in the material duringdehydration may have been the cause of this porosityincrease.
As in the case of the volume changes, the behaviour ofthe porosity variations during the HTST/AD processes(Fig. 5) was similar for all the treatments. Initially, up toMR = 0.7, the porosity remained practically constant, fol-lowed by a marked porosity increase. After the HTSTpulse, the porosity increase was less accentuated up tothe end of the process, reaching values ranging from 45%to 53% depending on the HTST condition. The porosityattained at the end of the combined process was very high,similar to that obtained in freeze-dried food products(Krokida, Karathanos, & Maroulis, 1998).
3.3. Structural changes in banana samples during drying
Fig. 6 shows the structural changes of banana samples atdifferent sampling times for the ADP-70 �C-8 h process. Acontinuous decrease in sample volume was observed duringdrying, but it was not isotropic and was more accentuatedin some zones (top and bottom of the samples in Fig. 6c–g)than in others, probably due to the fibre-oriented structureof the banana fruit. Due to this anisotropic shrinkage, theshape of the samples changed considerably. The formationof medium sized pores was also observed during the finalstage of the process (8 h).
The changes in volume, porosity and structure duringthe HTST/AD process can be better understood whenthese phenomena are explained together. For this purpose,Fig. 7 shows the structural changes of banana samples atdifferent sampling times for the HTST(150 �C–15 min)/AD process. At the beginning of the pulse (3 min;MR = 0.7), the banana samples shrank uniformly due towater loss and the porosity remained practically constant.Fig. 7b shows a photograph of a sample at this point inthe process. With the advance of the pulse (9 min;MR = 0.4), the puffing process started to occur. This pro-cess involved vapourisation and expansion of the waterwithin the fruit due to the high temperature applied, and

Fig. 6. Structural changes of banana samples at different sampling times for the ADP-70 �C-8 h process. (a) Fresh banana sample; (b) after 45 min ofADP; (c) after 1 h of ADP; (d) after 3 h of ADP; (e) after 4 h of ADP; (f) after 6 h of ADP; (g) after 8 h of ADP.
Fig. 7. Structural changes of banana samples at different sampling times for the HTST(150 �C–15 min)/AD process. (a) Fresh banana sample; (b) after3 min of HTST pulse; (c) after 9 min of HTST pulse; (d) after 12 min of HTST pulse; (e) after 22 min of the cooling period; (f) after 37 min of the coolingperiod; (g) after 5 h of the AD stage.
538 K. Hofsetz et al. / Journal of Food Engineering 83 (2007) 531–540
the formation of big pores can be observed (Fig. 7c). Theincipient formation of a crust on the external surface canalso be observed, probably due to Maillard browning(Gogus, Wedzicha, & Lamb, 1998) and caramelization(Wilford, Sabarez, & Price, 1997) of the polysaccharidespresent in the banana tissue, mainly sugars and starch,due to the high temperatures attained in this zone. During
puffing, the volume started to increase and partially com-pensated the initial shrinkage (Fig. 4) and the porosityincreased quickly (Fig. 5). At the end of the pulse(12 min; MR = 0.3), the porosity was still increasing(Fig. 5) but the volume had stopped its recovery (Fig. 4).A considerable increase in the formation of big pores canbe observed and the crust on the external surface of the

K. Hofsetz et al. / Journal of Food Engineering 83 (2007) 531–540 539
samples was totally formed (Fig. 7d). During the ‘‘coolingperiod”, the volume decreased due to water removal butthis decrease was not very accentuated due to the crust for-mation, which offered resistance to shrinkage and main-tained sample shape (Fig. 7e and f). At the end of theprocess (Fig. 7g), a less shrunken product with higherporosity was obtained, as compared to that obtained inthe ADP process.
4. Conclusions
The HTST/AD processes result in the saving of at least30% in total drying time when compared with the ADPprocess. The use of the Page and Exponential models inthe modelling of the drying kinetics is adequate for bothprocesses.
The volume of the ADP dried samples decreases consid-erably at the end of the process (30% of the initial volume),and a linear decrease in volume with the decrease in mois-ture ratio is observed. On an average, the porosity increasesuniformly during ADP, reaching increment values of about32%.
HTST/AD samples present smaller decreases in volume(51–60% of the initial volume) than the ADP samples. Thevolume variations during the process is not uniform,decreasing at the beginning of the process, increasing dur-ing the puffing stage and decreasing again in the ‘‘coolingperiod” and the AD stage. The porosity increase at theend of the process is higher (45–53%) than that found inthe ADP process.
Structural observations of the dehydrated bananas showthat the HTSD/AD samples present a crust on the externalsurface and big pores inside of the samples. It is believe thatthis crust offers resistance to shrinkage in the latter stagesof the HTST/AD process. The ADP samples show no crustformation and a medium-small pore structure.
Acknowledgements
The author Kelly Hofsetz is grateful to Capes-Grices,Brazil (proc. BEX 1466/04-6) and to CNPq, Brazil (proc.141294/2003-5) for Grants; also to FAPESP and for theuse of the facilities provided by Requimte/Department ofChemical Engineering at the University of Porto, Portugal.
References
AOAC. (1996). Official methods of analysis. In Proceedings of the
fourteenth associations of analytical chemists, Washington, DC.Azzouz, S., Guizani, A., Jomaa, W., & Belghith, A. (2002). Moisture
diffusivity and drying kinetic equation of convective drying of grapes.Journal of Food Engineering, 55, 323–330.
Barret, A. H. (2002). Structure-functionality relationships in foods. In G.Welti-Chanes, V. Barbosa-Canovas, & J. M. Aguilera (Eds.), Engi-
neering and food for the twenty-first century (pp. 29.1–29.6). New York:CRC Press.
Brennan, J. G. (1994). General principles of dehydration. In Food
dehydration: A dictionary and guide (pp. 5–15). Oxford: Elsevier.
Dandamrongrak, R., Young, G., & Mason, R. (2002). Evaluation ofvarious pre-treatments for the dehydration of banana and selection ofsuitable drying models. Journal of Food Engineering, 55, 139–146.
Demirel, D., & Turhan, M. (2003). Air-drying behavior of DwarfCavendish and Gros Michel banana slices. Journal of Food Engineer-
ing, 59, 1–11.Ertekin, C., & Yaldiz, O. (2004). Drying of eggplant and selection of a
suitable thin layer drying model. Journal of Food Engineering, 63,349–359.
Gogus, F., Wedzicha, B. L., & Lamb, J. (1998). Modelling of Maillardreaction during the drying of a model matrix. Journal of Food
Engineering, 35, 445–458.Karathanos, V. T., & Belessiotis, V. G. (1999). Application of a thinlayer
equation to drying data of fresh and semi-dried fruits. Journal of
Agricultural Engineering Research, 74(4), 355–361.Karathanos, V., Anglea, S., & Karel, M. (1993). Collapse of structure
during drying of celery. Drying Technology, 11(5), 1005–1023.Katekawa, M. E., & Silva, M. A. (2004). Study of porosity behavior in
convective drying of bananas. In Proceedings of the fourteenth
international drying symposium, Sao Paulo, Brazil.Kim, M. H., & Toledo, R. T. (1987). Effect of osmotic dehydration
and high temperature fluidized bed drying on properties ofdehydrated rabbiteye blueberries. Journal of Food Science, 52(4),980–984/989.
Krokida, M. K., Karathanos, V. T., & Maroulis, Z. B. (1998). Effect offreeze-drying conditions on shrinkage and porosity of dehydratedagricultural products. Journal of Food Engineering, 35, 369–380.
Krokida, M. K., & Maroulis, Z. B. (1997). Effect of drying method onshrinkage and porosity. Drying Technology, 15(10), 2441–2458.
Krokida, M. K., Zogzas, N. P., & Maroulis, Z. B. (1997). Modelingshrinkage and porosity during vacuum dehydration. International
Journal of Food Science and Technology, 32, 445–458.Hofsetz, K., & Lopes, C. C. (2005). Crispy banana obtained by the
combination of a high temperature and short time drying stage and adrying process. Brazilian Journal of Chemical Engineering, 22(2),285–292.
Lozano, J. E., Rotstein, E., & Urbicain, M. J. (1983). Shrinkage, porosityand bulk density of foodstuffs at changing moisture contents. Journal
of Food Science, 48, 1497–1502/1553.Lozano, J. E., Rotstein, E., & Urbicain, M. J. (1980). Total porosity and
open-pore porosity in the drying of fruits. Journal of Food Science, 45,1403–1407.
Maskan, M. (2000). Microwave/air and microwave finish drying ofbanana. Journal of Food Engineering, 44, 71–78.
Mayor, L., & Sereno, A. M. (2004). Modeling shrinkage during convectivedrying of food materials: A review. Journal of Food Engineering, 61,373–386.
Mohsenin, N. N. (1970). Physical properties of plant and animalmaterials. In Gordon and Breach Science Publisher, NewYork, USA.
Nieto, A. B., Salvatori, D. M., Castro, M. A., & Alzamora, S. M. (2004).Structural changes in apple tissue during glucose and sucrose osmoticdehydration: Shrinkage, porosity density and microscopic features.Journal of Food Engineering, 61, 269–278.
Ozdemir, M., & Devres, Y. O. (1999). The thin layer drying characteristicsof hazelnuts during roasting. Journal of Food Engineering, 42, 225–233.
Payne, F. A., Taraba, J. L., & Saputra, D. (1989). A review of puffingprocesses for expansion of biological products. Journal of Food
Engineering, 10, 183–197.Ratti, C. (2001). Hot air and freeze-drying of high-value foods: A review.
Journal of Food Engineering, 49, 311–319.Ratti, C. (1994). Shrinkage during drying of foodstuffs. Journal of Food
Engineering, 23, 91–105.Saca, S. A., & Lozano, J. E. (1992). Explosion puffing of bananas.
International Journal of Food Science and Technology, 27, 419–426.Schultz, E. L., Mazzuco, M. M., Machado, R. A. F., Bolzan, A., Quadri,
M. B., & Quadri, M. G. N. (2007). Effect of pre-treatments on drying,density and shrinkage of apple slices. Journal of Food Engineering,
78(3), 1103–1110.

540 K. Hofsetz et al. / Journal of Food Engineering 83 (2007) 531–540
Sereno, A. M., Silva, M. A., & Mayor, L. (2007). Determination of theparticle density and porosity in foods and porous materials with highmoisture content. International Journal of Food Properties, 10 (3), inpress.
Simal, S., Femenia, A., Garau, M. C., & Rossello, C. (2005). Use ofExponential, Page’s and diffusional models to simulate the dryingkinetics of kiwi fruit. Journal of Food Engineering, 66, 323–328.
Varnalis, A. I., Brennan, J. G., & MacDougall, D. B. (2001). A proposedmechanism of high temperature puffing of potato. Part I. The influenceof blanching and drying conditions on the volume of puffed cubes.Journal of Food Engineering, 48, 361–367.
Wilford, L. G., Sabarez, H., & Price, W. E. (1997). Kinetics ofcarbohydrate change during dehydration of d’Agen prunes. Food
Chemistry, 59(1), 149–155.


![Regionalization amidst 'State-Shrinkage' [p.p. 5-28]](https://img.dokumen.tips/doc/110x75/631b937b3e8acd9977057dea/regionalization-amidst-state-shrinkage-pp-5-28.jpg)