Embed Size (px)
Citation preview
materials
Article
Shrinkage Study and Strength Aspects of Concrete withFoundry Sand and Coconut Shell as a Partial Replacement forCoarse and Fine Aggregate
Kalyana Chakravarthy Polichetty Raja 1,*, Ilango Thaniarasu 1, Mohamed Abdelghany Elkotb 2,3 ,Khalid Ansari 4 and C Ahamed Saleel 2
�����������������
Citation: Raja, K.C.P.; Thaniarasu, I.;
Elkotb, M.A.; Ansari, K.; Saleel, C.A.
Shrinkage Study and Strength
Aspects of Concrete with Foundry
Sand and Coconut Shell as a Partial
Replacement for Coarse and Fine
Aggregate. Materials 2021, 14, 7420.
https://doi.org/10.3390/ma14237420
Academic Editor: Alessandro
P. Fantilli
Received: 4 July 2021
Accepted: 3 November 2021
Published: 3 December 2021
Publisher’s Note: MDPI stays neutral
with regard to jurisdictional claims in
published maps and institutional affil-
iations.
Copyright: © 2021 by the authors.
Licensee MDPI, Basel, Switzerland.
This article is an open access article
distributed under the terms and
conditions of the Creative Commons
Attribution (CC BY) license (https://
creativecommons.org/licenses/by/
4.0/).
1 Department of Civil Engineering, Vels Institute of Science, Technology & Advanced Studies,Chennai 600117, India; [email protected]
2 Mechanical Engineering Department, College of Engineering, King Khalid University, P.O. Box 394,Abha 61421, Saudi Arabia; [email protected] (M.A.E.); [email protected] (C.A.S.)
3 Mechanical Engineering Department, Faculty of Engineering, Kafrelsheikh University, Sakha Road,Kafr Elsheikh 33516, Egypt
4 Department of Civil Engineering, Yeshwantrao Chavan College of Engineeeing, Nagpur 441110, India;[email protected]
* Correspondence: [email protected]
Abstract: The demand for natural aggregates (river sand) is increasing day by day, leading to thedestruction of the environment, a burden that will be passed on to young people. Further, wastesfrom various industries are being dumped in landfills, which poses serious environmental problems.In order to ensure sustainability, both the issues mentioned above can be solved by utilizing industrialwaste as aggregate replacement in the concrete construction industry. This research is done to find outthe results using two substances viz., waste foundry sand (WFS) and coconut shell (CS) substitute forriver sand and coarse aggregate. Many researchers have found the maximum benefits of substitutedsubstances used in cement, which has material consistency. This current observation explores thesestrong waste properties of waste-infused concrete and cement, which experience shrinkage fromdrying out. The replacement levels for waste foundry sand were varied, between 10%, 20%, and30%, and for CS, it was 10% and 20%. The experimental outcomes are evident for the strength, whichincreases by using WFS, whereas the strength decreases by increasing the CS level. The concretethat experiences shrinkage from drying out is included in the waste material, showing a highermagnitude of drying shrinkage than conventional concrete.
Keywords: concrete; waste foundry sand; coconut shell; shrinkage
1. Introduction
Concrete is a continuously evolving material used to fulfill the projected civil infras-tructure requirements of the 21st century. Sustainability and durability are the desirablecharacteristics of concrete infrastructure. There is an increasing concern about the use ofnatural resources and river sand mining for concrete production. The depletion of naturalresources for civil infrastructure construction should be reduced and given high precedenceby infrastructure designers. Adaption of sustainable construction materials along withdurability are grand challenges for current and future civil engineers. Over the past fewdecades, researchers have experimented with different wastages obtained from industriessuch as foundry sand, steel slag, copper slag, palm oil clinker, etc., for river sand used as asubstitute for concrete. More research was done on the first and third material out of thewastages mentioned above. Foundry sand, a by-product from the metal casting industry,is generated in large quantities and dumped as an environmentally degrading landfill.Foundry sand is more suitable for the replacement of fine aggregate when compared toother industrial wastes, which are fresh as well as hardened substances of cement. Khatib
Materials 2021, 14, 7420. https://doi.org/10.3390/ma14237420 https://www.mdpi.com/journal/materials
Materials 2021, 14, 7420 2 of 19
has widely studied this effect [1]; Coconut shell is discarded as agricultural waste, com-monly dumped as landfill. Few researchers have studied the effect of utilizing coconutshells for non-structural applications. This effect has been widely studied by Pennarasi,G [2]; The alternate uses of coconut shells and their feasibility for structural applicationswere not fully evaluated.
The tremendous growth in the industrial sector has led to industrial waste productsin a large quantity. Industrial growth faces a few challenges such as resource efficiency andproductivity to ensure that the material is utilized effectively at all stages of its lifecycle tillits disposal. Industrial waste is a material that is declared useless during any industrialactivity such as production, mining, and construction. Based on the characteristics of thewaste, it can be either classified as hazardous waste and non-hazardous waste. The disposalmethod depends on the type of waste generated. The most commonly adopted wastedisposal methods are landfill and incineration. Almost all the countries face a problemof waste accumulation, and both of the disposal methods mentioned above cause highdegradation to the environment. The incineration method causes air pollution due to thedispersion of very fine particles in the atmosphere, whereas the method of a landfill posesa serious impact on the environment through the leaching of toxic chemicals. We need topreserve the environment for our future generations through sustainable development [2].Environment sustainability and circular economy have become a part of the industrialsector to reduce natural resources and minimize waste generation. The different types ofwaste generated from the industrial and agricultural sectors need to be categorized, andviable alternatives need to be studied. Globally, 11 billion tons of industrial waste weregenerated, and 600 million tons of agricultural waste is generated in India [3]. Industrialwaste includes by-products such as slag, fly ash, sludge, glass, foundry sand, scrap metal,tires, etc. The agricultural waste produced as a result of various agricultural activitiesincludes rice husk ash, bagasse, saw dust, groundnut shell, coconut shell, rice, and wheatstraw. Numerous researches have been carried out to check the suitability of the abovestated industrial/agricultural waste as a building material.
2. Literature Review2.1. General
The author assessed that these concrete properties are incorporated with green foundrysand and chemical foundry sand. They came to the conclusion that the concretes whichare made with metallurgical byproducts diffuse lower gravitational attraction as well asobtain maximum compressive strength at high temperature than ordinary concrete [4].They examined concrete durability as well as abrasion resistance substances, which areincorporated with waste foundry sand in ratios of 0%, to n% which are a multiple of5. Adding wastages generated from foundry industries enhanced the concrete strength.The concrete compressive strength increased to 8.25–17%, the modulus of elasticity by1.67–6.35% and the split tensile strength to 3.55–10.40%, depending on the WFS content [5].
The replacement of 100% coarse aggregate with coconut shell and replaced cementwith different percentages of ground granulated blast furnace slag (GGBS). The resultsrevealed that the use of coconut shell for the entire replacement of coarse aggregateproduces lightweight concrete, which ultimately reduces the compressive strength butachieves the target strength. The incorporation of ground granulated blast furnace slag(GGBS) for cement replacement increases the quality of concrete, since silica and aluminacontents are used for the hydration process [5]. They examined the results that wereachieved by substituting the coarse aggregate with 10%, 20%, 30%, and 40% of CS. Theauthors concluded that rising CS level in concrete decreases the compressive strength,but the strength can be maintained similar to conventional concrete either by reducingthe percentage of weight of water and cement or by increasing the concrete content. Theconcrete flexural behavior with coconut shell, GGBS, and manufactured sand. The flexuralbehavior of under- and over-reinforced members with coconut shell were designed andtested for deflection and crack width. The results obtained are comparable with the
Materials 2021, 14, 7420 3 of 19
permissible values stated by (IS:456 (2000). They characterized the plastic shrinkage anddeflection behavior of coconut shell concrete through casting two-way slabs of size 533 mm× 838 mm × 40 mm. Five different concrete mixes with varying percentage (25%, 50%,75%, 100%) of coconut shell were used as the coarse aggregate replacement [6]. The slabwas tested on a loading frame that was supported on all four sides. The plastic shrinkageof slabs was measured in terms of the number of cracks formed, the maximum crack width,and crack length. The increase in percentage of CS decreases the compressive strength andthe plastic shrinkage crack area, whereas the deflection increases. Though the deflectionof CS concrete is higher than conventional concrete, it satisfies the maximum deflectionrequirement as per IS 456.The comparative study of concrete with coconut shell (CS) andpalm kern shell (PKS) as coarse aggregates. CS and PKS are replaced in gradation of 0%,25%, 50%, 75%, and 100% for two mix ratios such as (1:1:2 and 1:2:4). A total of 320 cubeswere cast of size 100 × 100 × 100 mm to test the compressive strength of concrete. Fromthe results, the authors have declared that the compressive strength of the concrete for alltwo mix ratios decreased with an increase in the percentage of the shells. However, theCS concrete showed higher compressive strength when compared to PKS concrete. Basedon the comparative cost analysis, CS and PKS concrete have 30% and 42% cost reduction,respectively. It was decided that CS is more suitable than PKS for the replacement ofconventional coarse aggregate on the basis of strength/economy ratio. From the extensiveliterature review conducted, it is evident that cement mixed with high quality silica sandwhich is substituted for fine aggregate and coconut shell as coarse aggregate needs to beexperimented for shrinkage effects along with the strength properties to make it a suitablematerial for structural concrete [7].
2.2. Research Significance
The best way to utilize this industrial waste is to hide it inside the concrete withoutbeing detrimental to the environment. Although prior investigations have reported thatthe strength of concrete depends on high quality silica sand and coarse aggregate, theunderlying mechanism of shrinkage was not fully understood. The factors affecting theshrinkage of concrete is due to concrete constituents, mixed proportion, age of concreteat loading, duration of loading, size of member, and environmental conditions (ACICommittee 209 (2005)). Drying shrinkage occurs when the volume changes due to lossof moisture content from the surface of the pores during the drying process of concrete.The code has also proposed standard values for shrinkage strain to be used in the designfor normal ingredients of concrete such as river sand, crushed stone, ordinary Portlandcement, and portable water. However, if the constituents of the concrete such as riversand, crushed stone, ordinary Portland cement, and portable water are being alteredfor sustainability, then it is necessary to predict the shrinkage of sustainable concrete.This study has examined the time dependent deformation of concrete, i.e., shrinkage byreplacing fine aggregate with different percentages of discarded foundry sand from metalcasting industries and by replacing coarse aggregate with different percentages of wastecoconut shell from the agricultural industry. However, for validating the efficacy of sandand coconut shell to impart desirable quality criteria, standard tests were taken up to studythe strength and durability standards. Attention given to the experiment is two-fold:
• A proportionate mix ratio for M20 grade of concrete is used to ascertain the strength,with different percentages of discarded foundry sand for natural river sand andcoconut shell for coarse aggregate;
• To evaluate the concrete shrinkage behavior with various ratios of foundry sand andcoconut shell as per ASTM standards.
3. Experimental Investigation3.1. Materials
The mix-proportioning of M20 grade of concrete is made by evaluating the physicalproperties of concrete constituents such as cement, river sand, coarse aggregate foundry
Materials 2021, 14, 7420 4 of 19
sand, and coconut shell, as per Indian Standards (IS:2386 (1963); IS:383 (1970)). A total ofseven mix proportions including normal concrete, designated as CC, were designed as perIS: 10262 (2009) by considering a concrete and water proportion of 0.5. The foundry sandacts partially as a replacement for fine aggregate, with various percentages of replacementsuch as 10%, 20%, and 30% weight of the fine aggregate, and CS was used for substitutingcrushed stone by 10% and 20%. Mixes were combined and are depicted in Table 1.
Table 1. Strength properties of WFS-WCS concrete.
Mix % WFS % CS Slump CompressiveStrength (MPa)
FlexuralStrength (MPa)
Split TensileStrength (MPa)
CC - - 50 28.3 3.88 2.83
M11 10 10 49 28.9 3.92 2.99M21 20 10 41 30.4 4.12 2.95M31 30 10 32 32.1 4.26 2.88M12 10 20 41 27.5 3.86 2.79M22 20 20 38 24.2 3.69 2.62M32 30 20 30 22.3 3.57 2.5
The whole elements could be combined by heat as well as the aggregates added, whichwere in a saturated dry condition. As the water absorption is not same for different aggre-gates, correction for the water cement ratio was made and superplasticizer (CONPLASTSP430) was added (1% by weight of cement) for compensation. The mixing was done toachieve a uniform mixture. The specimens required for testing the mechanical propertieswere cast as per IS 1199 (1959)].
3.2. Methods
The fresh properties and hardened properties such as slump, compression strength,split tensile strength and flexural strength were found as per IS 516:1959. The experimenta-tion was undergone for the first phase, in which coconut shell was partially replaced forcoarse aggregate. The test was then conducted for fresh concrete and hardened concrete.The optimum percentage of replacement was derived. For fresh concrete, a slump testwas conducted for various replacement. The tests conducted for hardened concrete arecompressive strength, split tensile strength, flexural strength, and modulus of elasticityafter 28 days of curing. The following testing methods are explained in detail.
3.2.1. Slump Cone Test
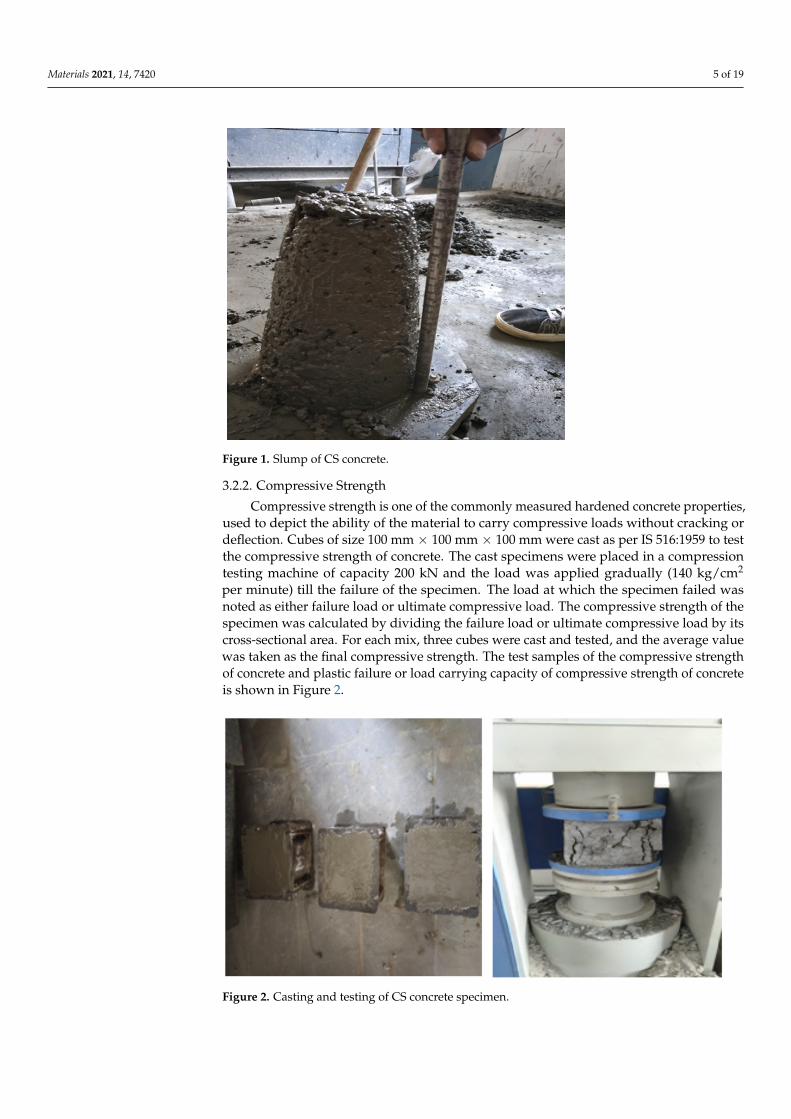
The slump cone test is the basic test adopted to examine the fresh concrete propertyusing its consistency. The slump value obtained is used to determine the workability of thefresh mix for further usage. The slump cone test was performed as per IS 1199: 1959. Theapparatus consists of a mold with a height of 30 cm and a top and bottom diameter of 10 cmand 20 cm, respectively; along with a tamping rod of 16 mm diameter and 0.6 m long. Themold is filled in four layers by tamping each layer with 25 blows with the rounded end ofthe tamping rod. In order to measure the slump value, the mold should be cleaned outsideand raised immediately after levelling the top surface. After the concrete has subsided, theslump value was measured as the difference of height between the top surface of the moldand the highest point of the specimen. For the shallow condition, the degree of workabilitywas very low and the slump value was minimum. The light reinforced section degreeof workability was low and the slump value was between 25 and 75 mm. The heavilyreinforced section degree of workability was medium and the slump value was between 75and 100 mm. The heavily reinforced section without vibration, i.e., Tremie concrete degreeof workability was high and slump value was between 100 and 150 mm. The degree ofworkability of heavy reinforced section was shown in Figure 1.
Materials 2021, 14, 7420 5 of 19
Materials 2021, 14, x FOR PEER REVIEW 5 of 20
be cleaned outside and raised immediately after levelling the top surface. After the con-crete has subsided, the slump value was measured as the difference of height between the top surface of the mold and the highest point of the specimen. For the shallow condition, the degree of workability was very low and the slump value was minimum. The light reinforced section degree of workability was low and the slump value was between 25 and 75 mm. The heavily reinforced section degree of workability was medium and the slump value was between 75 and 100 mm. The heavily reinforced section without vibra-tion, i.e., Tremie concrete degree of workability was high and slump value was between 100 and 150 mm. The degree of workability of heavy reinforced section was shown in Figure 1.
Figure 1. Slump of CS concrete.
3.2.2. Compressive Strength Compressive strength is one of the commonly measured hardened concrete proper-
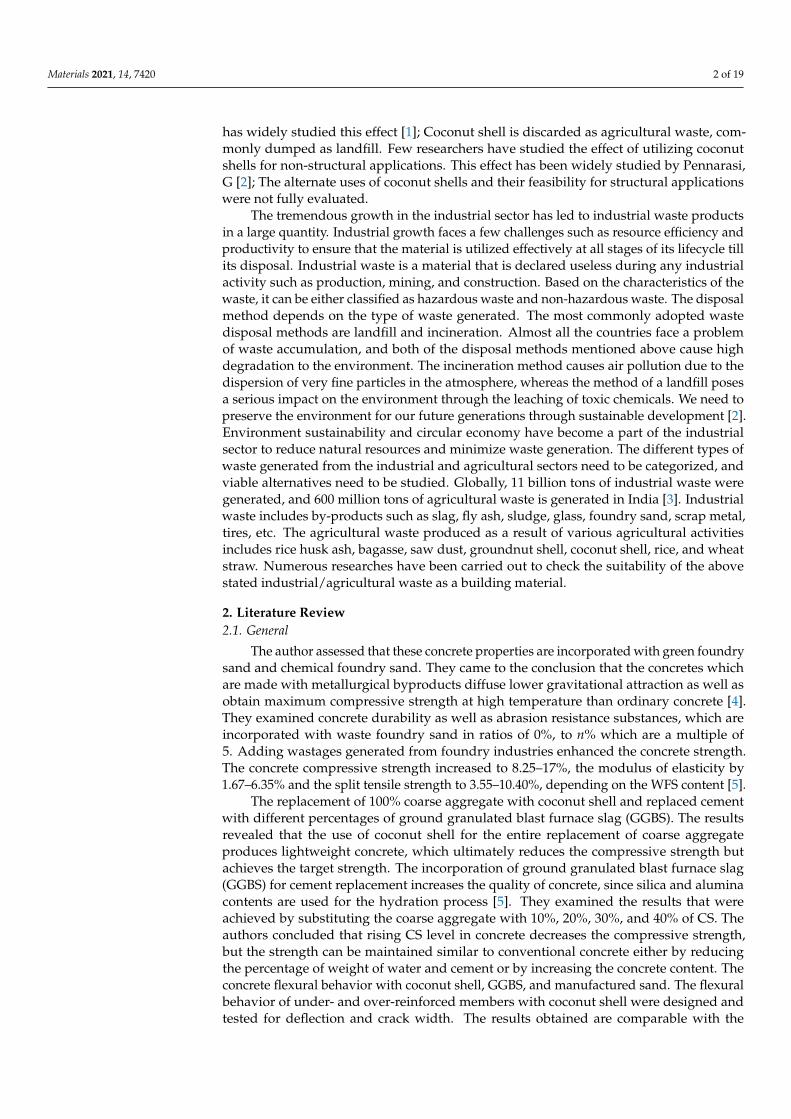
ties, used to depict the ability of the material to carry compressive loads without cracking or deflection. Cubes of size 100 mm × 100 mm × 100 mm were cast as per IS 516: 1959 to test the compressive strength of concrete. The cast specimens were placed in a compres-sion testing machine of capacity 200 kN and the load was applied gradually (140 kg/cm2 per minute) till the failure of the specimen. The load at which the specimen failed was noted as either failure load or ultimate compressive load. The compressive strength of the specimen was calculated by dividing the failure load or ultimate compressive load by its cross-sectional area. For each mix, three cubes were cast and tested, and the average value was taken as the final compressive strength. The test samples of the compressive strength of concrete and plastic failure or load carrying capacity of compressive strength of con-crete is shown in Figure 2.
Figure 1. Slump of CS concrete.
3.2.2. Compressive Strength
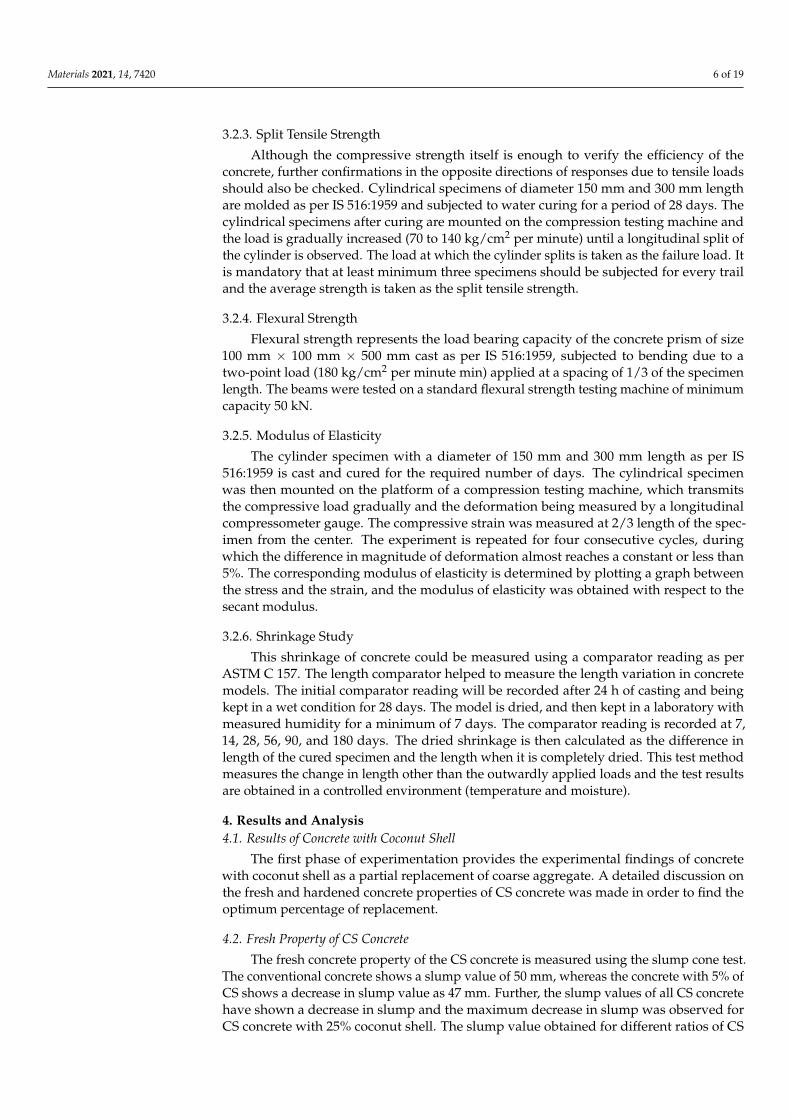
Compressive strength is one of the commonly measured hardened concrete properties,used to depict the ability of the material to carry compressive loads without cracking ordeflection. Cubes of size 100 mm × 100 mm × 100 mm were cast as per IS 516:1959 to testthe compressive strength of concrete. The cast specimens were placed in a compressiontesting machine of capacity 200 kN and the load was applied gradually (140 kg/cm2
per minute) till the failure of the specimen. The load at which the specimen failed wasnoted as either failure load or ultimate compressive load. The compressive strength of thespecimen was calculated by dividing the failure load or ultimate compressive load by itscross-sectional area. For each mix, three cubes were cast and tested, and the average valuewas taken as the final compressive strength. The test samples of the compressive strengthof concrete and plastic failure or load carrying capacity of compressive strength of concreteis shown in Figure 2.
Materials 2021, 14, x FOR PEER REVIEW 6 of 20
Figure 2. Casting and testing of CS concrete specimen.
3.2.3. Split Tensile Strength Although the compressive strength itself is enough to verify the efficiency of the con-
crete, further confirmations in the opposite directions of responses due to tensile loads should also be checked. Cylindrical specimens of diameter 150 mm and 300 mm length are molded as per IS 516: 1959 and subjected to water curing for a period of 28 days. The cylindrical specimens after curing are mounted on the compression testing machine and the load is gradually increased (70 to 140 kg/cm2 per minute) until a longitudinal split of the cylinder is observed. The load at which the cylinder splits is taken as the failure load. It is mandatory that at least minimum three specimens should be subjected for every trail and the average strength is taken as the split tensile strength.
3.2.4. Flexural Strength Flexural strength represents the load bearing capacity of the concrete prism of size
100 mm × 100 mm × 500 mm cast as per IS 516: 1959, subjected to bending due to a two-point load (180 kg/cm2 per minute min) applied at a spacing of 1/3 of the specimen length. The beams were tested on a standard flexural strength testing machine of minimum ca-pacity 50 kN.
3.2.5. Modulus of Elasticity The cylinder specimen with a diameter of 150 mm and 300 mm length as per IS 516:
1959 is cast and cured for the required number of days. The cylindrical specimen was then mounted on the platform of a compression testing machine, which transmits the compres-sive load gradually and the deformation being measured by a longitudinal compressom-eter gauge. The compressive strain was measured at 2/3 length of the specimen from the center. The experiment is repeated for four consecutive cycles, during which the differ-ence in magnitude of deformation almost reaches a constant or less than 5%. The corre-sponding modulus of elasticity is determined by plotting a graph between the stress and the strain, and the modulus of elasticity was obtained with respect to the secant modulus.
3.2.6. Shrinkage Study This shrinkage of concrete could be measured using a comparator reading as per
ASTM C 157. The length comparator helped to measure the length variation in concrete models. The initial comparator reading will be recorded after 24 h of casting and being kept in a wet condition for 28 days. The model is dried, and then kept in a laboratory with measured humidity for a minimum of 7 days. The comparator reading is recorded at 7,
Figure 2. Casting and testing of CS concrete specimen.
Materials 2021, 14, 7420 6 of 19
3.2.3. Split Tensile Strength
Although the compressive strength itself is enough to verify the efficiency of theconcrete, further confirmations in the opposite directions of responses due to tensile loadsshould also be checked. Cylindrical specimens of diameter 150 mm and 300 mm lengthare molded as per IS 516:1959 and subjected to water curing for a period of 28 days. Thecylindrical specimens after curing are mounted on the compression testing machine andthe load is gradually increased (70 to 140 kg/cm2 per minute) until a longitudinal split ofthe cylinder is observed. The load at which the cylinder splits is taken as the failure load. Itis mandatory that at least minimum three specimens should be subjected for every trailand the average strength is taken as the split tensile strength.
3.2.4. Flexural Strength
Flexural strength represents the load bearing capacity of the concrete prism of size100 mm × 100 mm × 500 mm cast as per IS 516:1959, subjected to bending due to atwo-point load (180 kg/cm2 per minute min) applied at a spacing of 1/3 of the specimenlength. The beams were tested on a standard flexural strength testing machine of minimumcapacity 50 kN.
3.2.5. Modulus of Elasticity
The cylinder specimen with a diameter of 150 mm and 300 mm length as per IS516:1959 is cast and cured for the required number of days. The cylindrical specimenwas then mounted on the platform of a compression testing machine, which transmitsthe compressive load gradually and the deformation being measured by a longitudinalcompressometer gauge. The compressive strain was measured at 2/3 length of the spec-imen from the center. The experiment is repeated for four consecutive cycles, duringwhich the difference in magnitude of deformation almost reaches a constant or less than5%. The corresponding modulus of elasticity is determined by plotting a graph betweenthe stress and the strain, and the modulus of elasticity was obtained with respect to thesecant modulus.
3.2.6. Shrinkage Study
This shrinkage of concrete could be measured using a comparator reading as perASTM C 157. The length comparator helped to measure the length variation in concretemodels. The initial comparator reading will be recorded after 24 h of casting and beingkept in a wet condition for 28 days. The model is dried, and then kept in a laboratory withmeasured humidity for a minimum of 7 days. The comparator reading is recorded at 7,14, 28, 56, 90, and 180 days. The dried shrinkage is then calculated as the difference inlength of the cured specimen and the length when it is completely dried. This test methodmeasures the change in length other than the outwardly applied loads and the test resultsare obtained in a controlled environment (temperature and moisture).
4. Results and Analysis4.1. Results of Concrete with Coconut Shell
The first phase of experimentation provides the experimental findings of concretewith coconut shell as a partial replacement of coarse aggregate. A detailed discussion onthe fresh and hardened concrete properties of CS concrete was made in order to find theoptimum percentage of replacement.
4.2. Fresh Property of CS Concrete
The fresh concrete property of the CS concrete is measured using the slump cone test.The conventional concrete shows a slump value of 50 mm, whereas the concrete with 5% ofCS shows a decrease in slump value as 47 mm. Further, the slump values of all CS concretehave shown a decrease in slump and the maximum decrease in slump was observed forCS concrete with 25% coconut shell. The slump value obtained for different ratios of CS
Materials 2021, 14, 7420 7 of 19
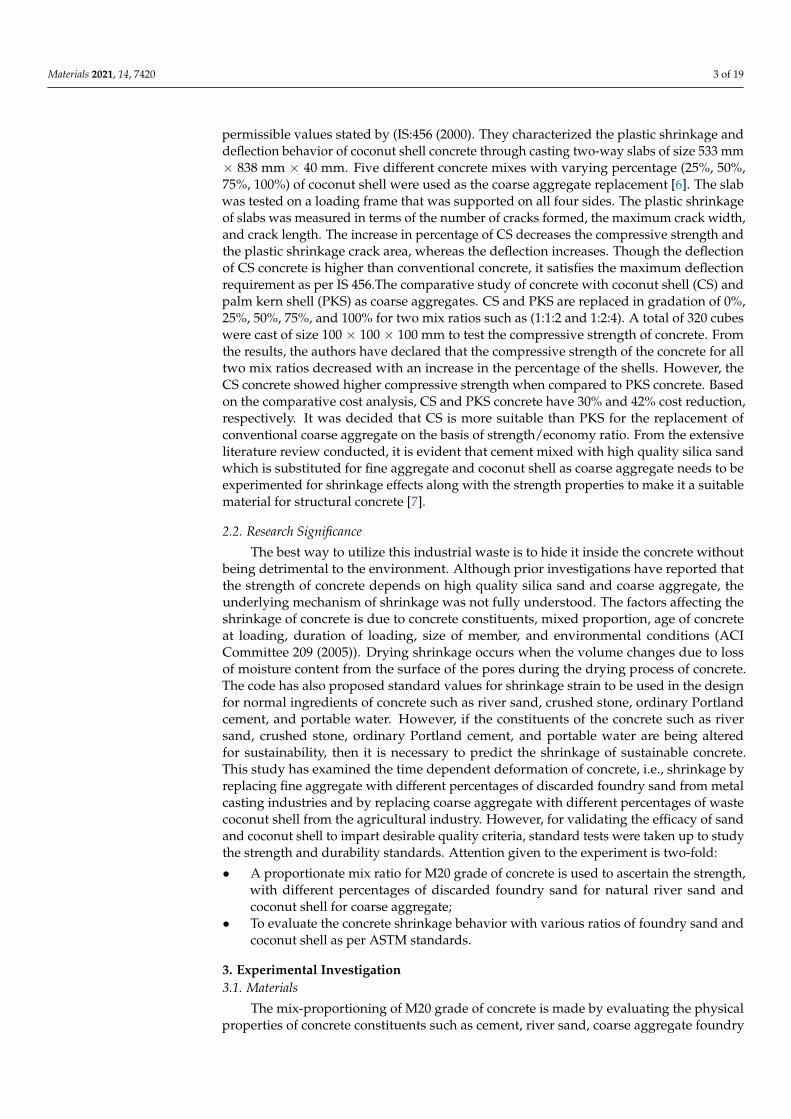
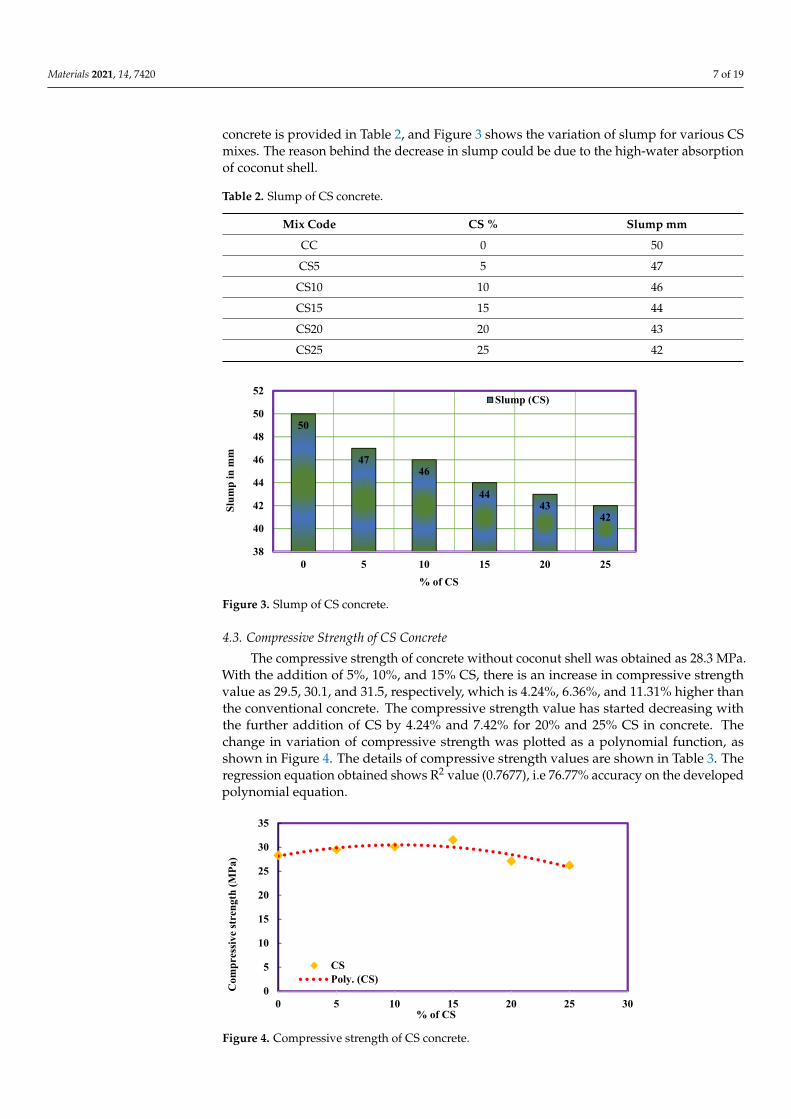
concrete is provided in Table 2, and Figure 3 shows the variation of slump for various CSmixes. The reason behind the decrease in slump could be due to the high-water absorptionof coconut shell.
Table 2. Slump of CS concrete.
Mix Code CS % Slump mm
CC 0 50
CS5 5 47
CS10 10 46
CS15 15 44
CS20 20 43
CS25 25 42
Materials 2021, 14, x FOR PEER REVIEW 7 of 20
14, 28, 56, 90, and 180 days. The dried shrinkage is then calculated as the difference in length of the cured specimen and the length when it is completely dried. This test method measures the change in length other than the outwardly applied loads and the test results are obtained in a controlled environment (temperature and moisture).
4. Results and Analysis 4.1. Results of Concrete with Coconut Shell
The first phase of experimentation provides the experimental findings of concrete with coconut shell as a partial replacement of coarse aggregate. A detailed discussion on the fresh and hardened concrete properties of CS concrete was made in order to find the optimum percentage of replacement.
4.2. Fresh Property of CS Concrete The fresh concrete property of the CS concrete is measured using the slump cone test.
The conventional concrete shows a slump value of 50 mm, whereas the concrete with 5% of CS shows a decrease in slump value as 47 mm. Further, the slump values of all CS concrete have shown a decrease in slump and the maximum decrease in slump was ob-served for CS concrete with 25% coconut shell. The slump value obtained for different ratios of CS concrete is provided in Table 2, and Figure 3 shows the variation of slump for various CS mixes. The reason behind the decrease in slump could be due to the high-water absorption of coconut shell.
Table 2. Slump of CS concrete.
Mix Code CS % Slump mm CC 0 50 CS5 5 47
CS10 10 46 CS15 15 44 CS20 20 43 CS25 25 42
Figure 3. Slump of CS concrete.
4.3. Compressive Strength of CS Concrete The compressive strength of concrete without coconut shell was obtained as 28.3
MPa. With the addition of 5%, 10%, and 15% CS, there is an increase in compressive strength value as 29.5, 30.1, and 31.5, respectively, which is 4.24%, 6.36%, and 11.31%
50
4746
4443
42
38
40
42
44
46
48
50
52
0 5 10 15 20 25
Slum
p in
mm
% of CS
Slump (CS)
Figure 3. Slump of CS concrete.
4.3. Compressive Strength of CS Concrete
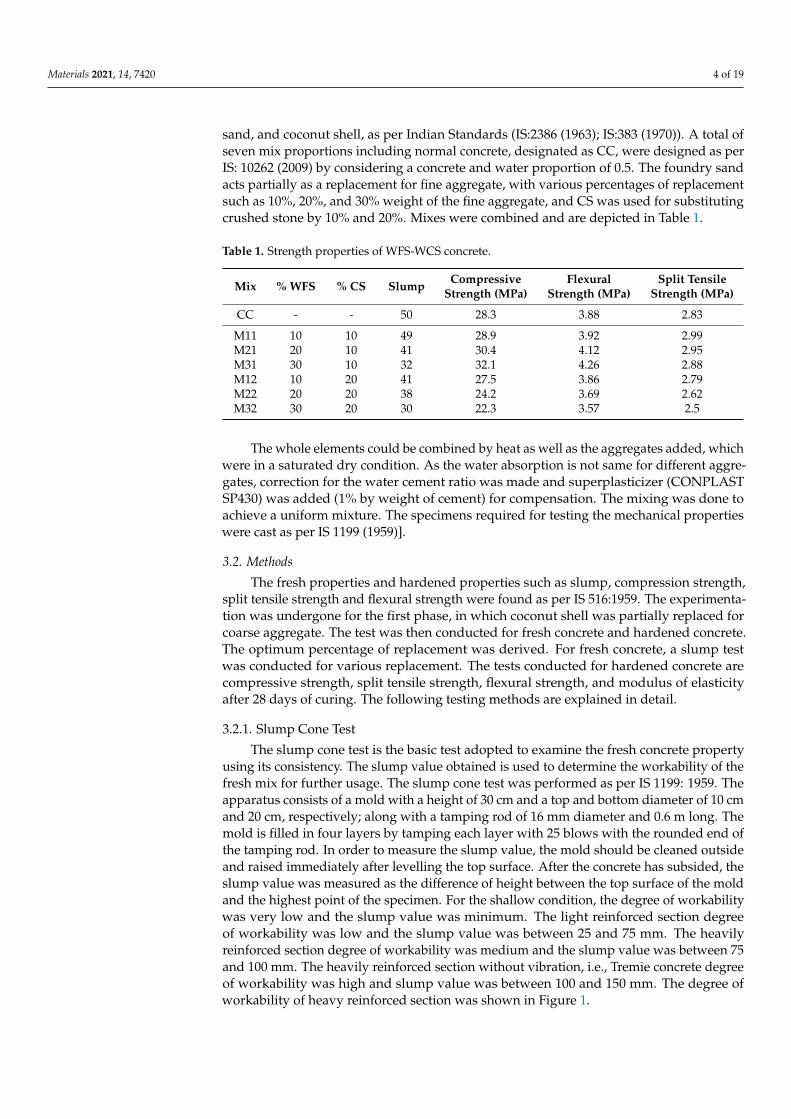
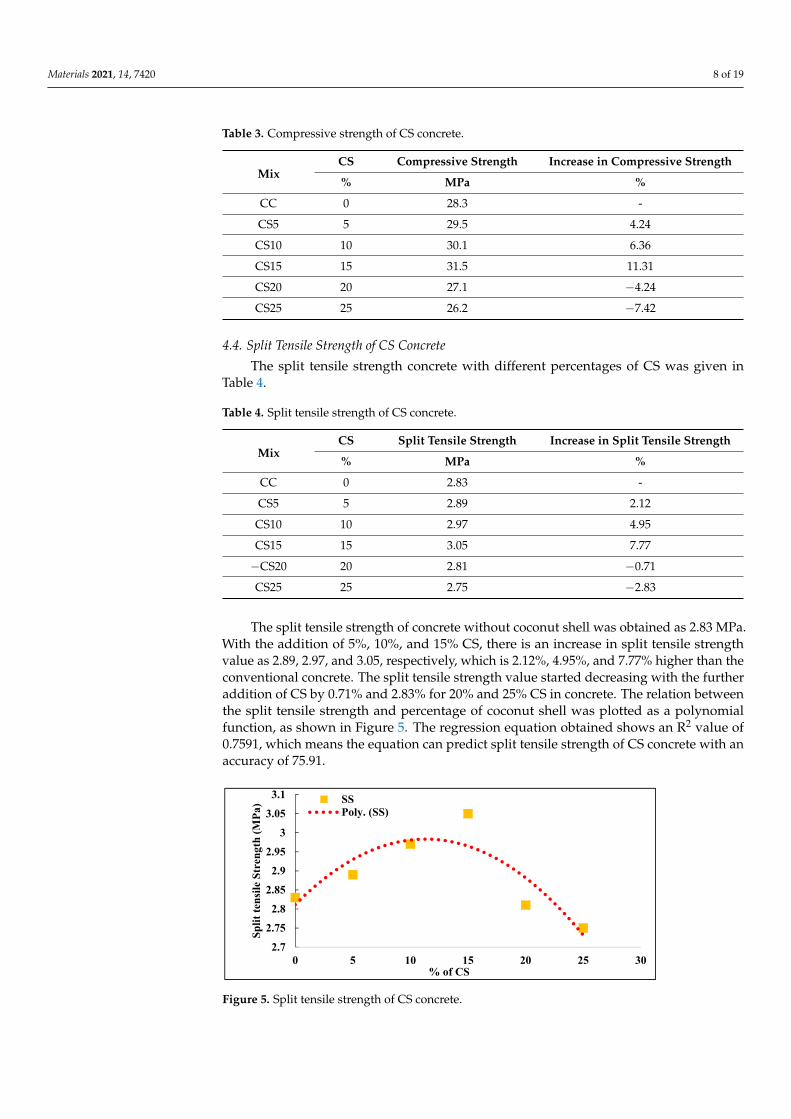
The compressive strength of concrete without coconut shell was obtained as 28.3 MPa.With the addition of 5%, 10%, and 15% CS, there is an increase in compressive strengthvalue as 29.5, 30.1, and 31.5, respectively, which is 4.24%, 6.36%, and 11.31% higher thanthe conventional concrete. The compressive strength value has started decreasing withthe further addition of CS by 4.24% and 7.42% for 20% and 25% CS in concrete. Thechange in variation of compressive strength was plotted as a polynomial function, asshown in Figure 4. The details of compressive strength values are shown in Table 3. Theregression equation obtained shows R2 value (0.7677), i.e 76.77% accuracy on the developedpolynomial equation.
Materials 2021, 14, x FOR PEER REVIEW 8 of 20
higher than the conventional concrete. The compressive strength value has started de-creasing with the further addition of CS by 4.24% and 7.42% for 20% and 25% CS in con-crete. The change in variation of compressive strength was plotted as a polynomial func-tion, as shown in Figure 4. The details of compressive strength values are shown in Table 3. The regression equation obtained shows R2 value (0.7677), i.e 76.77% accuracy on the developed polynomial equation.
Table 3. Compressive strength of CS concrete.
Mix CS Compressive Strength Increase in Compressive Strength % MPa %
CC 0 28.3 - CS5 5 29.5 4.24 CS10 10 30.1 6.36 CS15 15 31.5 11.31 CS20 20 27.1 −4.24 CS25 25 26.2 −7.42
Figure 4. Compressive strength of CS concrete.
4.4. Split Tensile Strength of CS Concrete The split tensile strength concrete with different percentages of CS was given in Table 4.
Table 4. Split tensile strength of CS concrete.
Mix CS Split tensile Strength Increase in Split Tensile Strength % MPa %
CC 0 2.83 - CS5 5 2.89 2.12 CS10 10 2.97 4.95 CS15 15 3.05 7.77 −CS20 20 2.81 −0.71 CS25 25 2.75 −2.83
The split tensile strength of concrete without coconut shell was obtained as 2.83 MPa. With the addition of 5%, 10%, and 15% CS, there is an increase in split tensile strength value as 2.89, 2.97, and 3.05, respectively, which is 2.12%, 4.95%, and 7.77% higher than
0
5
10
15
20
25
30
35
0 5 10 15 20 25 30
Com
pres
sive s
tren
gth
(MPa
)
% of CS
CSPoly. (CS)
Figure 4. Compressive strength of CS concrete.
Materials 2021, 14, 7420 8 of 19
Table 3. Compressive strength of CS concrete.
MixCS Compressive Strength Increase in Compressive Strength
% MPa %
CC 0 28.3 -
CS5 5 29.5 4.24
CS10 10 30.1 6.36
CS15 15 31.5 11.31
CS20 20 27.1 −4.24
CS25 25 26.2 −7.42
4.4. Split Tensile Strength of CS Concrete
The split tensile strength concrete with different percentages of CS was given inTable 4.
Table 4. Split tensile strength of CS concrete.
MixCS Split Tensile Strength Increase in Split Tensile Strength
% MPa %
CC 0 2.83 -
CS5 5 2.89 2.12
CS10 10 2.97 4.95
CS15 15 3.05 7.77
−CS20 20 2.81 −0.71
CS25 25 2.75 −2.83
The split tensile strength of concrete without coconut shell was obtained as 2.83 MPa.With the addition of 5%, 10%, and 15% CS, there is an increase in split tensile strengthvalue as 2.89, 2.97, and 3.05, respectively, which is 2.12%, 4.95%, and 7.77% higher than theconventional concrete. The split tensile strength value started decreasing with the furtheraddition of CS by 0.71% and 2.83% for 20% and 25% CS in concrete. The relation betweenthe split tensile strength and percentage of coconut shell was plotted as a polynomialfunction, as shown in Figure 5. The regression equation obtained shows an R2 value of0.7591, which means the equation can predict split tensile strength of CS concrete with anaccuracy of 75.91.
Materials 2021, 14, x FOR PEER REVIEW 9 of 20
the conventional concrete. The split tensile strength value started decreasing with the fur-ther addition of CS by 0.71% and 2.83% for 20% and 25% CS in concrete. The relation between the split tensile strength and percentage of coconut shell was plotted as a poly-nomial function, as shown in Figure 5. The regression equation obtained shows an R2 value of 0.7591, which means the equation can predict split tensile strength of CS concrete with an accuracy of 75.91.
Figure 5. Split tensile strength of CS concrete.
4.5. Flexural Strength of CS Concrete The flexural strength of concrete without coconut shell was obtained as 3.88 MPa.
With the addition of 5%, 10%, 15%, and 20% CS, there is an increase in flexural strength value as 3.98, 4.12, 4.28, and 3.89, respectively, which is 2.58%, 6.19%, 10.31%, and 0.26% higher than the conventional concrete. The flexural strength value of 25% CS has alone shown a decrease in strength by 1.55%. Flexural strength results have shown a different trend when compared to compressive strength and split tensile strength. The flexural strength concrete with different percentages of CS are given in Table 5. The change in variation of flexural was plotted as a polynomial function, as shown in Figure 6. The re-gression equation obtained shows the R2 value (0.7069), i.e., a 70.69% accuracy on the de-veloped polynomial equation to predict the flexural strength of CS concrete.
Figure 6. Flexural strength of CS concrete.
2.72.752.8
2.852.9
2.953
3.053.1
0 5 10 15 20 25 30
Split
tens
ile S
tren
gth
(MPa
)
% of CS
SSPoly. (SS)
3.5
3.7
3.9
4.1
4.3
4.5
0 5 10 15 20 25 30
Flex
ural
Str
engt
h (M
Pa)
% of CS
FSPoly. (FS)
Figure 5. Split tensile strength of CS concrete.
Materials 2021, 14, 7420 9 of 19
4.5. Flexural Strength of CS Concrete
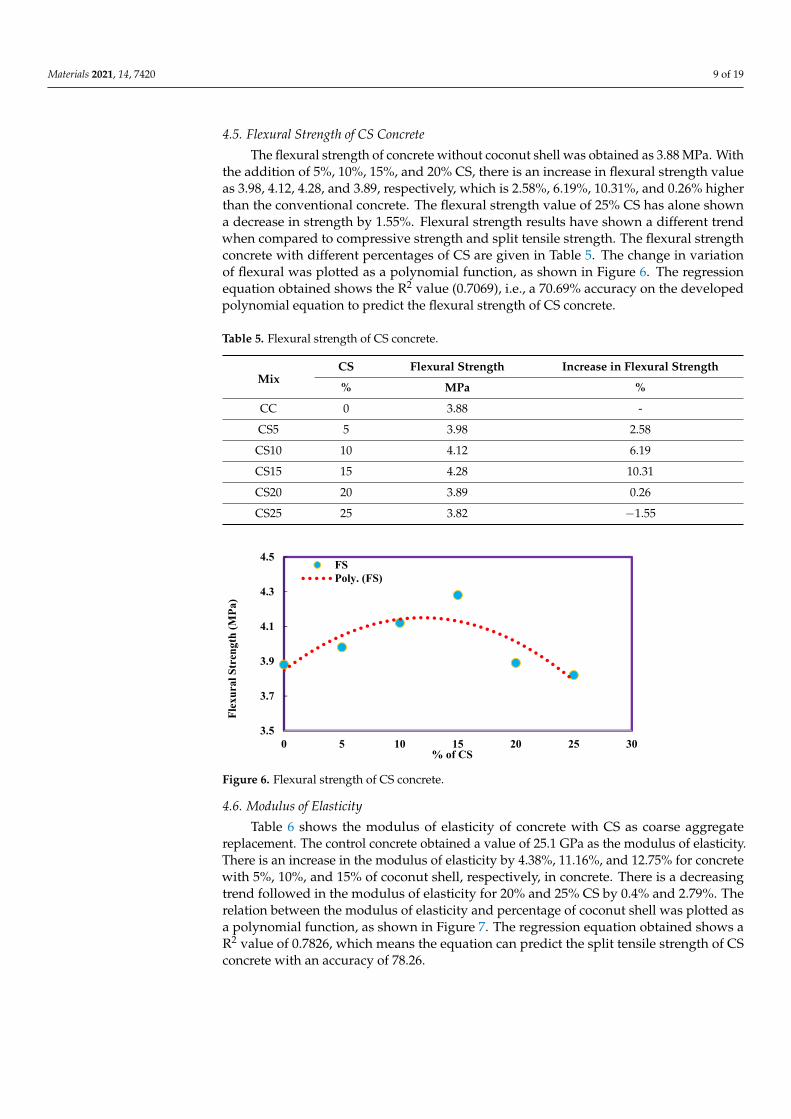
The flexural strength of concrete without coconut shell was obtained as 3.88 MPa. Withthe addition of 5%, 10%, 15%, and 20% CS, there is an increase in flexural strength valueas 3.98, 4.12, 4.28, and 3.89, respectively, which is 2.58%, 6.19%, 10.31%, and 0.26% higherthan the conventional concrete. The flexural strength value of 25% CS has alone showna decrease in strength by 1.55%. Flexural strength results have shown a different trendwhen compared to compressive strength and split tensile strength. The flexural strengthconcrete with different percentages of CS are given in Table 5. The change in variationof flexural was plotted as a polynomial function, as shown in Figure 6. The regressionequation obtained shows the R2 value (0.7069), i.e., a 70.69% accuracy on the developedpolynomial equation to predict the flexural strength of CS concrete.
Table 5. Flexural strength of CS concrete.
MixCS Flexural Strength Increase in Flexural Strength
% MPa %
CC 0 3.88 -
CS5 5 3.98 2.58
CS10 10 4.12 6.19
CS15 15 4.28 10.31
CS20 20 3.89 0.26
CS25 25 3.82 −1.55
Materials 2021, 14, x FOR PEER REVIEW 9 of 20
the conventional concrete. The split tensile strength value started decreasing with the fur-ther addition of CS by 0.71% and 2.83% for 20% and 25% CS in concrete. The relation between the split tensile strength and percentage of coconut shell was plotted as a poly-nomial function, as shown in Figure 5. The regression equation obtained shows an R2 value of 0.7591, which means the equation can predict split tensile strength of CS concrete with an accuracy of 75.91.
Figure 5. Split tensile strength of CS concrete.
4.5. Flexural Strength of CS Concrete The flexural strength of concrete without coconut shell was obtained as 3.88 MPa.
With the addition of 5%, 10%, 15%, and 20% CS, there is an increase in flexural strength value as 3.98, 4.12, 4.28, and 3.89, respectively, which is 2.58%, 6.19%, 10.31%, and 0.26% higher than the conventional concrete. The flexural strength value of 25% CS has alone shown a decrease in strength by 1.55%. Flexural strength results have shown a different trend when compared to compressive strength and split tensile strength. The flexural strength concrete with different percentages of CS are given in Table 5. The change in variation of flexural was plotted as a polynomial function, as shown in Figure 6. The re-gression equation obtained shows the R2 value (0.7069), i.e., a 70.69% accuracy on the de-veloped polynomial equation to predict the flexural strength of CS concrete.
Figure 6. Flexural strength of CS concrete.
2.72.752.8
2.852.9
2.953
3.053.1
0 5 10 15 20 25 30
Split
tens
ile S
tren
gth
(MPa
)
% of CS
SSPoly. (SS)
3.5
3.7
3.9
4.1
4.3
4.5
0 5 10 15 20 25 30
Flex
ural
Str
engt
h (M
Pa)
% of CS
FSPoly. (FS)
Figure 6. Flexural strength of CS concrete.
4.6. Modulus of Elasticity
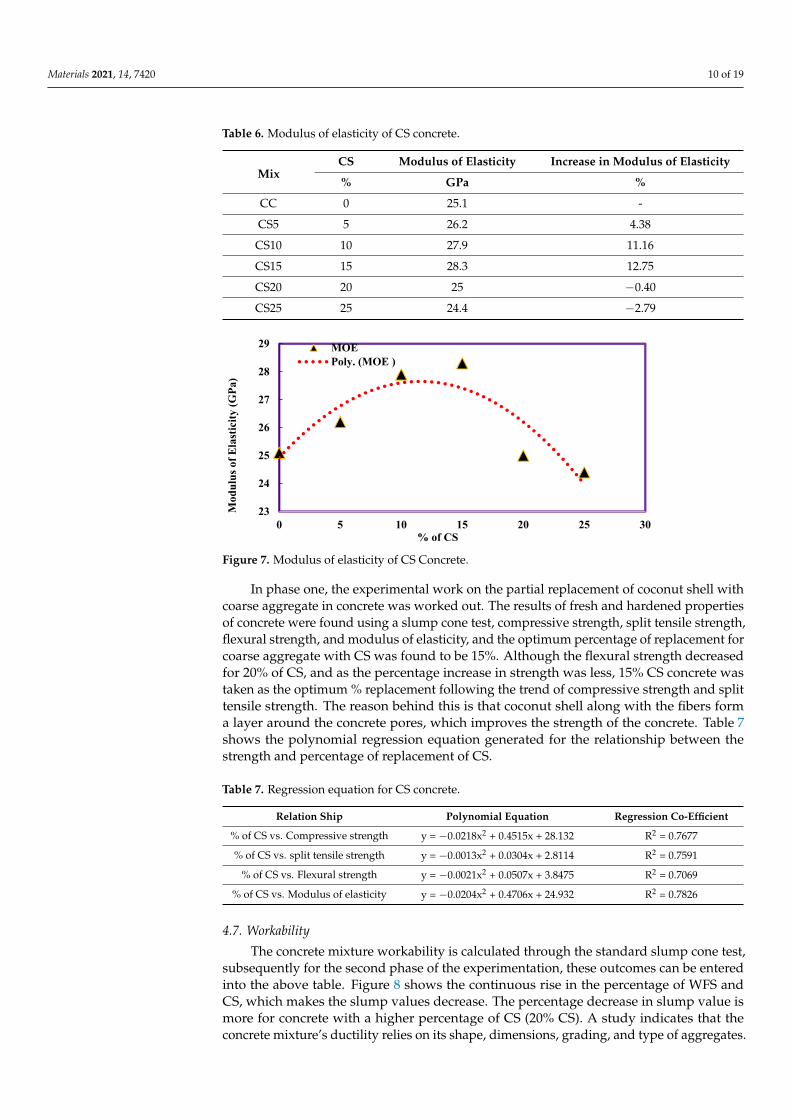
Table 6 shows the modulus of elasticity of concrete with CS as coarse aggregatereplacement. The control concrete obtained a value of 25.1 GPa as the modulus of elasticity.There is an increase in the modulus of elasticity by 4.38%, 11.16%, and 12.75% for concretewith 5%, 10%, and 15% of coconut shell, respectively, in concrete. There is a decreasingtrend followed in the modulus of elasticity for 20% and 25% CS by 0.4% and 2.79%. Therelation between the modulus of elasticity and percentage of coconut shell was plotted asa polynomial function, as shown in Figure 7. The regression equation obtained shows aR2 value of 0.7826, which means the equation can predict the split tensile strength of CSconcrete with an accuracy of 78.26.
Materials 2021, 14, 7420 10 of 19
Table 6. Modulus of elasticity of CS concrete.
MixCS Modulus of Elasticity Increase in Modulus of Elasticity
% GPa %
CC 0 25.1 -
CS5 5 26.2 4.38
CS10 10 27.9 11.16
CS15 15 28.3 12.75
CS20 20 25 −0.40
CS25 25 24.4 −2.79
Materials 2021, 14, x FOR PEER REVIEW 10 of 20
Table 5. Flexural strength of CS concrete.
Mix CS Flexural Strength Increase in Flexural Strength % MPa %
CC 0 3.88 - CS5 5 3.98 2.58 CS10 10 4.12 6.19 CS15 15 4.28 10.31 CS20 20 3.89 0.26 CS25 25 3.82 −1.55
4.6. Modulus of Elasticity Table 6 shows the modulus of elasticity of concrete with CS as coarse aggregate re-
placement. The control concrete obtained a value of 25.1 GPa as the modulus of elasticity. There is an increase in the modulus of elasticity by 4.38%, 11.16%, and 12.75% for concrete with 5%, 10%, and 15% of coconut shell, respectively, in concrete. There is a decreasing trend followed in the modulus of elasticity for 20% and 25% CS by 0.4% and 2.79%. The relation between the modulus of elasticity and percentage of coconut shell was plotted as a polynomial function, as shown in Figure 7. The regression equation obtained shows a R2 value of 0.7826, which means the equation can predict the split tensile strength of CS concrete with an accuracy of 78.26.
Table 6. Modulus of elasticity of CS concrete.
Mix CS Modulus of Elasticity Increase in Modulus of Elasticity % GPa %
CC 0 25.1 - CS5 5 26.2 4.38 CS10 10 27.9 11.16 CS15 15 28.3 12.75 CS20 20 25 −0.40 CS25 25 24.4 −2.79
Figure 7. Modulus of elasticity of CS Concrete.
In phase one, the experimental work on the partial replacement of coconut shell with coarse aggregate in concrete was worked out. The results of fresh and hardened properties of concrete were found using a slump cone test, compressive strength, split tensile
23
24
25
26
27
28
29
0 5 10 15 20 25 30
Mod
ulus
of E
last
icity
(GPa
)
% of CS
MOEPoly. (MOE )
Figure 7. Modulus of elasticity of CS Concrete.
In phase one, the experimental work on the partial replacement of coconut shell withcoarse aggregate in concrete was worked out. The results of fresh and hardened propertiesof concrete were found using a slump cone test, compressive strength, split tensile strength,flexural strength, and modulus of elasticity, and the optimum percentage of replacement forcoarse aggregate with CS was found to be 15%. Although the flexural strength decreasedfor 20% of CS, and as the percentage increase in strength was less, 15% CS concrete wastaken as the optimum % replacement following the trend of compressive strength and splittensile strength. The reason behind this is that coconut shell along with the fibers forma layer around the concrete pores, which improves the strength of the concrete. Table 7shows the polynomial regression equation generated for the relationship between thestrength and percentage of replacement of CS.
Table 7. Regression equation for CS concrete.
Relation Ship Polynomial Equation Regression Co-Efficient
% of CS vs. Compressive strength y = −0.0218x2 + 0.4515x + 28.132 R2 = 0.7677
% of CS vs. split tensile strength y = −0.0013x2 + 0.0304x + 2.8114 R2 = 0.7591
% of CS vs. Flexural strength y = −0.0021x2 + 0.0507x + 3.8475 R2 = 0.7069
% of CS vs. Modulus of elasticity y = −0.0204x2 + 0.4706x + 24.932 R2 = 0.7826
4.7. Workability
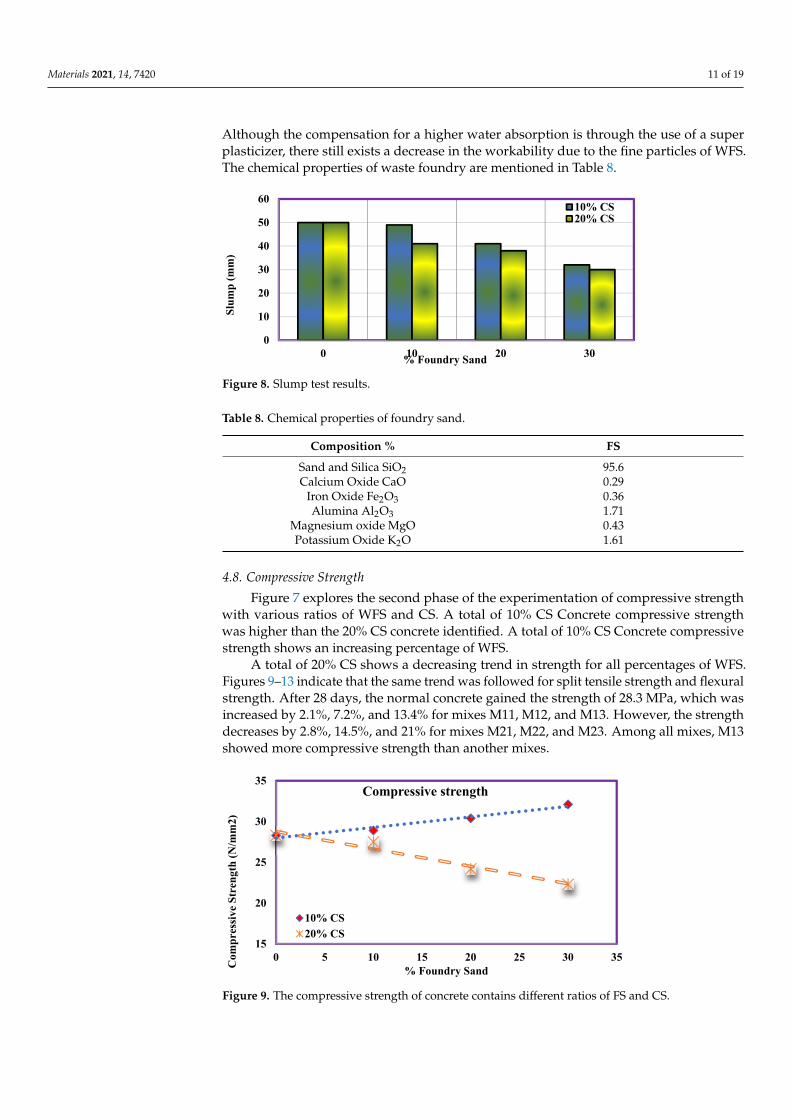
The concrete mixture workability is calculated through the standard slump cone test,subsequently for the second phase of the experimentation, these outcomes can be enteredinto the above table. Figure 8 shows the continuous rise in the percentage of WFS andCS, which makes the slump values decrease. The percentage decrease in slump value ismore for concrete with a higher percentage of CS (20% CS). A study indicates that theconcrete mixture’s ductility relies on its shape, dimensions, grading, and type of aggregates.
Materials 2021, 14, 7420 11 of 19
Although the compensation for a higher water absorption is through the use of a superplasticizer, there still exists a decrease in the workability due to the fine particles of WFS.The chemical properties of waste foundry are mentioned in Table 8.
Materials 2021, 14, x FOR PEER REVIEW 11 of 20
strength, flexural strength, and modulus of elasticity, and the optimum percentage of re-placement for coarse aggregate with CS was found to be 15%. Although the flexural strength decreased for 20% of CS, and as the percentage increase in strength was less, 15% CS concrete was taken as the optimum % replacement following the trend of compressive strength and split tensile strength. The reason behind this is that coconut shell along with the fibers form a layer around the concrete pores, which improves the strength of the con-crete. Table 7 shows the polynomial regression equation generated for the relationship between the strength and percentage of replacement of CS.
Table 7. Regression equation for CS concrete.
Relation Ship Polynomial Equation Regression Co-Efficient
% of CS vs. Compressive strength y = −0.0218x2 + 0.4515x + 28.132 R2 = 0.7677 % of CS vs. split tensile strength y = −0.0013x2 + 0.0304x + 2.8114 R2 = 0.7591
% of CS vs. Flexural strength y = −0.0021x2 + 0.0507x + 3.8475 R2 = 0.7069 % of CS vs. Modulus of elasticity y = −0.0204x2 + 0.4706x + 24.932 R2 = 0.7826
4.7. Workability The concrete mixture workability is calculated through the standard slump cone test,
subsequently for the second phase of the experimentation, these outcomes can be entered into the above table. Figure 8 shows the continuous rise in the percentage of WFS and CS, which makes the slump values decrease. The percentage decrease in slump value is more for concrete with a higher percentage of CS (20% CS). A study indicates that the concrete mixture’s ductility relies on its shape, dimensions, grading, and type of aggregates. Alt-hough the compensation for a higher water absorption is through the use of a super plas-ticizer, there still exists a decrease in the workability due to the fine particles of WFS. The chemical properties of waste foundry are mentioned in Table 8.
Table 8. Chemical properties of foundry sand.
Composition % FS Sand and Silica SiO2 95.6 Calcium Oxide CaO 0.29
Iron Oxide Fe2O3 0.36 Alumina Al2O3 1.71
Magnesium oxide MgO 0.43 Potassium Oxide K2O 1.61
Figure 8. Slump test results.
0
10
20
30
40
50
60
0 10 20 30
Slum
p (m
m)
% Foundry Sand
10% CS20% CS
Figure 8. Slump test results.
Table 8. Chemical properties of foundry sand.
Composition % FS
Sand and Silica SiO2 95.6Calcium Oxide CaO 0.29
Iron Oxide Fe2O3 0.36Alumina Al2O3 1.71
Magnesium oxide MgO 0.43Potassium Oxide K2O 1.61
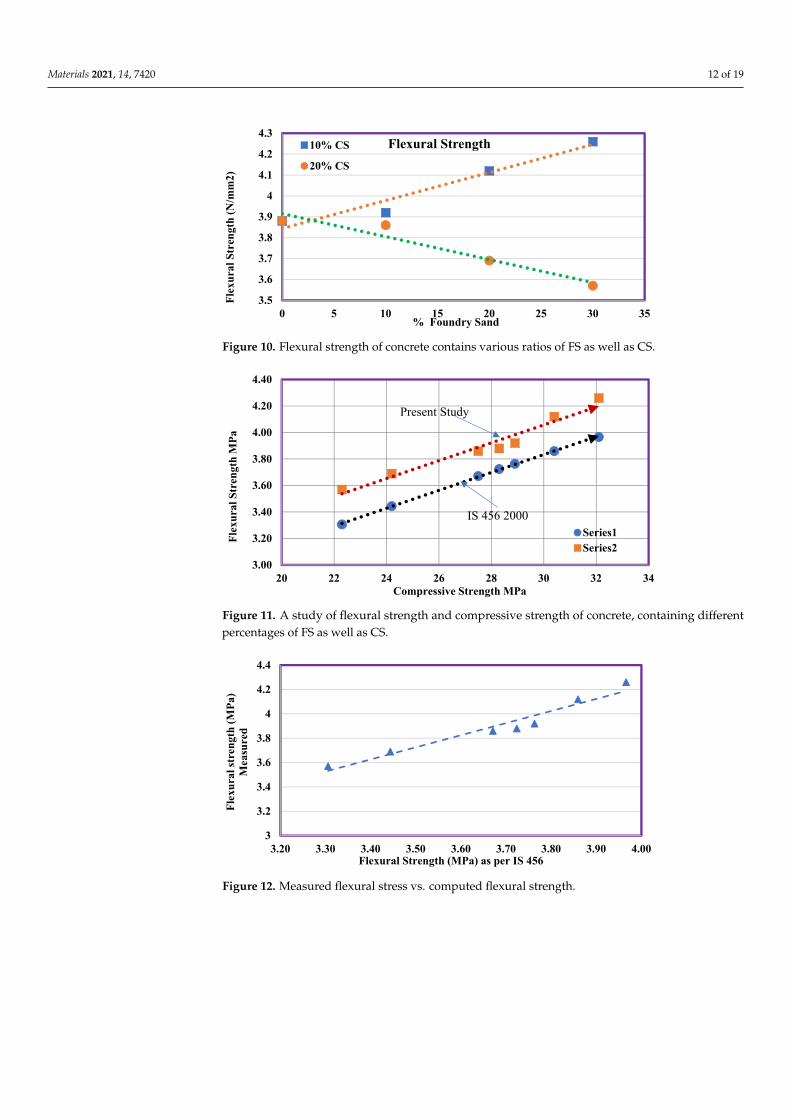
4.8. Compressive Strength
Figure 7 explores the second phase of the experimentation of compressive strengthwith various ratios of WFS and CS. A total of 10% CS Concrete compressive strengthwas higher than the 20% CS concrete identified. A total of 10% CS Concrete compressivestrength shows an increasing percentage of WFS.
A total of 20% CS shows a decreasing trend in strength for all percentages of WFS.Figures 9–13 indicate that the same trend was followed for split tensile strength and flexuralstrength. After 28 days, the normal concrete gained the strength of 28.3 MPa, which wasincreased by 2.1%, 7.2%, and 13.4% for mixes M11, M12, and M13. However, the strengthdecreases by 2.8%, 14.5%, and 21% for mixes M21, M22, and M23. Among all mixes, M13showed more compressive strength than another mixes.
Materials 2021, 14, x FOR PEER REVIEW 12 of 20
4.8. Compressive Strength Figure 7 explores the second phase of the experimentation of compressive strength
with various ratios of WFS and CS. A total of 10% CS Concrete compressive strength was higher than the 20% CS concrete identified. A total of 10% CS Concrete compressive strength shows an increasing percentage of WFS.
A total of 20% CS shows a decreasing trend in strength for all percentages of WFS. Figures 9–13 indicate that the same trend was followed for split tensile strength and flex-ural strength. After 28 days, the normal concrete gained the strength of 28.3 MPa, which was increased by 2.1%, 7.2%, and 13.4% for mixes M11, M12, and M13. However, the strength decreases by 2.8%, 14.5%, and 21% for mixes M21, M22, and M23. Among all mixes, M13 showed more compressive strength than another mixes.
Figure 9. The compressive strength of concrete contains different ratios of FS and CS.
4.9. Flexural Strength Figure 10 shows the second phase of the experimentation of flexural strength, which
uses various ratios of WFS and CS. This also shows the same trend of compressive strength results. The concrete conducted a laboratory test and gained a flexural strength of 3.88 MPa at 28 days, which increased by 1.1%, 6.2%, and 9.8% for mixes M11, M12, and M13. However, the flexural strength decreased by 0.5%, 4.9%, and 7.9% for mixes M21, M22, and M23.
M13 exhibits a higher flexural strength when compared to other mixes. Only a mar-ginal decrease in flexural strength was found for concrete made with 20% CS and all the values are less than 10%. A linear relationship in the form of y = ax + b is used for fitting the figures with a correlation coefficient R2 value more than 0.9. The high value of R2 in-dicates that there exists a strong relationship between the percentage addition of WFS and CS with that of the strength values.
15
20
25
30
35
0 5 10 15 20 25 30 35Com
pres
sive S
tren
gth
(N/m
m2)
% Foundry Sand
Compressive strength
10% CS20% CS
Figure 9. The compressive strength of concrete contains different ratios of FS and CS.
Materials 2021, 14, 7420 12 of 19Materials 2021, 14, x FOR PEER REVIEW 13 of 20
Figure 10. Flexural strength of concrete contains various ratios of FS as well as CS.
The compressive strength of concrete calculated for 28 days was analyzed with the flexural strength of concrete. The experimental value of the flexural strength of concrete for 28 days was referred with the values according to IS 456: 2000. The values obtained were shown in Table 9. The flexural strength outcomes from the current study are higher than the values as per IS 456:2000. The estimated equation of flexural strength as per IS 456: 2000 is given by
Fr = 0.7 √fck (MPa). (1)
Table 9. Comparison of experimental and predicted values of flexural strength.
Mix % WFS % CS Compressive Strength (MPa) Flexural Strength (MPa)
Experimental IS 456: 2000 CC - - 28.3 3.88 3.72
M11 10 10 28.9 3.92 3.76 M21 20 10 30.4 4.12 3.86 M31 30 10 32.1 4.26 3.97 M12 10 20 27.5 3.86 3.67 M22 20 20 24.2 3.69 3.44 M32 30 20 22.3 3.57 3.31
Figure 11 shows the comparison of flexural strength and concrete compressive strength, which contains various ratios of WFS as well as CS. Compressive strength has a direct relationship with flexural strength, and it acts as an index for flexural and split ten-sile strength. The relationship among the strengths is influenced by various factors such as method of testing, type of aggregate, quality of concrete, and admixtures [8–10].
3.5
3.6
3.7
3.8
3.9
4
4.1
4.2
4.3
0 5 10 15 20 25 30 35
Flex
ural
Str
engt
h (N
/mm
2)
% Foundry Sand
Flexural Strength10% CS
20% CS
Figure 10. Flexural strength of concrete contains various ratios of FS as well as CS.Materials 2021, 14, x FOR PEER REVIEW 14 of 20
Figure 11. A study of flexural strength and compressive strength of concrete, containing different percentages of FS as well as CS.
Figure 12 indicates that the flexural strength measured using Equation (1) was plot-ted against the experimental values. There exists a strong relationship with the measured and experimental flexural strength values, which is evident from the R2 value (0.94).
Figure 12. Measured flexural stress vs. computed flexural strength.
4.10. Split Tensile Strength The second phase of the experimentation of split tensile strength contains various
percentages of WFS as well as CS, as shown in Figure 6. In a month, the controlled concrete gained the strength of 2.83 MPa, which was increased by 2.8%, 4.2%, and 5.3% for mixes M11, M12, and M13. However, the strength decreases by 1.4%, 7.4%, and 11.6% for mixes M21, M22, and M23. Among all mixes, M13 showed higher split tensile stress than other mixes.
This split tensile strength for 10% CS was more in comparison with 20% CS. Similar to compressive strength and flexural strength, there exists a high correlation coefficient for split tensile strength as well, as shown in Figure 13. There exists a positive correlation for 10% CS whereas there exists a negative correlation for 20% CS.
3.00
3.20
3.40
3.60
3.80
4.00
4.20
4.40
20 22 24 26 28 30 32 34
Flex
ural
Str
engt
h M
Pa
Compressive Strength MPa
Series1Series2
Present Study
IS 456 2000
3
3.2
3.4
3.6
3.8
4
4.2
4.4
3.20 3.30 3.40 3.50 3.60 3.70 3.80 3.90 4.00
Flex
ural
stre
ngth
(MPa
) M
easu
red
Flexural Strength (MPa) as per IS 456
Figure 11. A study of flexural strength and compressive strength of concrete, containing differentpercentages of FS as well as CS.
Materials 2021, 14, x FOR PEER REVIEW 14 of 20
Figure 11. A study of flexural strength and compressive strength of concrete, containing different percentages of FS as well as CS.
Figure 12 indicates that the flexural strength measured using Equation (1) was plot-ted against the experimental values. There exists a strong relationship with the measured and experimental flexural strength values, which is evident from the R2 value (0.94).
Figure 12. Measured flexural stress vs. computed flexural strength.
4.10. Split Tensile Strength The second phase of the experimentation of split tensile strength contains various
percentages of WFS as well as CS, as shown in Figure 6. In a month, the controlled concrete gained the strength of 2.83 MPa, which was increased by 2.8%, 4.2%, and 5.3% for mixes M11, M12, and M13. However, the strength decreases by 1.4%, 7.4%, and 11.6% for mixes M21, M22, and M23. Among all mixes, M13 showed higher split tensile stress than other mixes.
This split tensile strength for 10% CS was more in comparison with 20% CS. Similar to compressive strength and flexural strength, there exists a high correlation coefficient for split tensile strength as well, as shown in Figure 13. There exists a positive correlation for 10% CS whereas there exists a negative correlation for 20% CS.
3.00
3.20
3.40
3.60
3.80
4.00
4.20
4.40
20 22 24 26 28 30 32 34
Flex
ural
Str
engt
h M
Pa
Compressive Strength MPa
Series1Series2
Present Study
IS 456 2000
3
3.2
3.4
3.6
3.8
4
4.2
4.4
3.20 3.30 3.40 3.50 3.60 3.70 3.80 3.90 4.00
Flex
ural
stre
ngth
(MPa
) M
easu
red
Flexural Strength (MPa) as per IS 456
Figure 12. Measured flexural stress vs. computed flexural strength.

Materials 2021, 14, 7420 13 of 19Materials 2021, 14, x FOR PEER REVIEW 15 of 20
Figure 13. Split tensile strength contains various percentages of FS as well as CS.
4.11. Drying Shrinkage The drying shrinkage strains were calculated based on the equation below (2).
εsh = (CRi − CR)/L, (2)
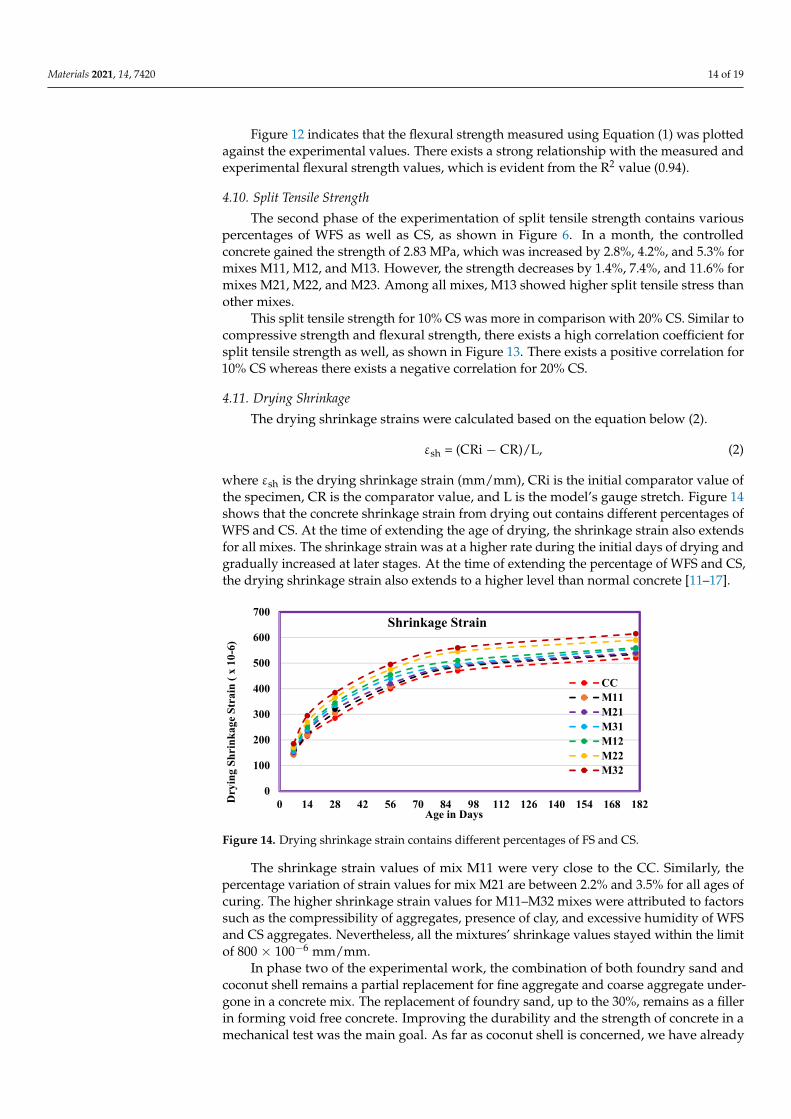
where εsh is the drying shrinkage strain (mm/mm), CRi is the initial comparator value of the specimen, CR is the comparator value, and L is the model’s gauge stretch. Figure 14 shows that the concrete shrinkage strain from drying out contains different percentages of WFS and CS. At the time of extending the age of drying, the shrinkage strain also ex-tends for all mixes. The shrinkage strain was at a higher rate during the initial days of drying and gradually increased at later stages. At the time of extending the percentage of WFS and CS, the drying shrinkage strain also extends to a higher level than normal con-crete [11–17].
Figure 14. Drying shrinkage strain contains different percentages of FS and CS.
The shrinkage strain values of mix M11 were very close to the CC. Similarly, the per-centage variation of strain values for mix M21 are between 2.2% and 3.5% for all ages of curing. The higher shrinkage strain values for M11–M32 mixes were attributed to factors such as the compressibility of aggregates, presence of clay, and excessive humidity of WFS and CS aggregates. Nevertheless, all the mixtures’ shrinkage values stayed within the limit of 800 × 100−6 mm/mm.
2.4
2.5
2.6
2.7
2.8
2.9
3
3.1
0 5 10 15 20 25 30 35
Split
Ten
sile
Stre
ngth
(N/m
m2)
% Foundry Sand
Split Tensile StressStress
10% CS
20% CS
0
100
200
300
400
500
600
700
0 14 28 42 56 70 84 98 112 126 140 154 168 182Dry
ing
Shri
nkag
e Str
ain
( x 1
0-6)
Age in Days
Shrinkage Strain
CCM11M21M31M12M22M32
Figure 13. Split tensile strength contains various percentages of FS as well as CS.
4.9. Flexural Strength
Figure 10 shows the second phase of the experimentation of flexural strength, whichuses various ratios of WFS and CS. This also shows the same trend of compressive strengthresults. The concrete conducted a laboratory test and gained a flexural strength of 3.88 MPaat 28 days, which increased by 1.1%, 6.2%, and 9.8% for mixes M11, M12, and M13.However, the flexural strength decreased by 0.5%, 4.9%, and 7.9% for mixes M21, M22,and M23.
M13 exhibits a higher flexural strength when compared to other mixes. Only amarginal decrease in flexural strength was found for concrete made with 20% CS and allthe values are less than 10%. A linear relationship in the form of y = ax + b is used forfitting the figures with a correlation coefficient R2 value more than 0.9. The high value ofR2 indicates that there exists a strong relationship between the percentage addition of WFSand CS with that of the strength values.
The compressive strength of concrete calculated for 28 days was analyzed with theflexural strength of concrete. The experimental value of the flexural strength of concrete for28 days was referred with the values according to IS 456:2000. The values obtained wereshown in Table 9. The flexural strength outcomes from the current study are higher thanthe values as per IS 456:2000. The estimated equation of flexural strength as per IS 456:2000is given by
Fr = 0.7√
fck (MPa). (1)
Table 9. Comparison of experimental and predicted values of flexural strength.
Mix % WFS % CSCompressive
Strength (MPa)Flexural Strength (MPa)
Experimental IS 456:2000
CC - - 28.3 3.88 3.72
M11 10 10 28.9 3.92 3.76M21 20 10 30.4 4.12 3.86M31 30 10 32.1 4.26 3.97M12 10 20 27.5 3.86 3.67M22 20 20 24.2 3.69 3.44M32 30 20 22.3 3.57 3.31
Figure 11 shows the comparison of flexural strength and concrete compressive strength,which contains various ratios of WFS as well as CS. Compressive strength has a directrelationship with flexural strength, and it acts as an index for flexural and split tensilestrength. The relationship among the strengths is influenced by various factors such asmethod of testing, type of aggregate, quality of concrete, and admixtures [8–10].
Materials 2021, 14, 7420 14 of 19
Figure 12 indicates that the flexural strength measured using Equation (1) was plottedagainst the experimental values. There exists a strong relationship with the measured andexperimental flexural strength values, which is evident from the R2 value (0.94).
4.10. Split Tensile Strength
The second phase of the experimentation of split tensile strength contains variouspercentages of WFS as well as CS, as shown in Figure 6. In a month, the controlledconcrete gained the strength of 2.83 MPa, which was increased by 2.8%, 4.2%, and 5.3% formixes M11, M12, and M13. However, the strength decreases by 1.4%, 7.4%, and 11.6% formixes M21, M22, and M23. Among all mixes, M13 showed higher split tensile stress thanother mixes.
This split tensile strength for 10% CS was more in comparison with 20% CS. Similar tocompressive strength and flexural strength, there exists a high correlation coefficient forsplit tensile strength as well, as shown in Figure 13. There exists a positive correlation for10% CS whereas there exists a negative correlation for 20% CS.
4.11. Drying Shrinkage
The drying shrinkage strains were calculated based on the equation below (2).
εsh = (CRi − CR)/L, (2)
where εsh is the drying shrinkage strain (mm/mm), CRi is the initial comparator value ofthe specimen, CR is the comparator value, and L is the model’s gauge stretch. Figure 14shows that the concrete shrinkage strain from drying out contains different percentages ofWFS and CS. At the time of extending the age of drying, the shrinkage strain also extendsfor all mixes. The shrinkage strain was at a higher rate during the initial days of drying andgradually increased at later stages. At the time of extending the percentage of WFS and CS,the drying shrinkage strain also extends to a higher level than normal concrete [11–17].
Materials 2021, 14, x FOR PEER REVIEW 15 of 20
Figure 13. Split tensile strength contains various percentages of FS as well as CS.
4.11. Drying Shrinkage The drying shrinkage strains were calculated based on the equation below (2).
εsh = (CRi − CR)/L, (2)
where εsh is the drying shrinkage strain (mm/mm), CRi is the initial comparator value of the specimen, CR is the comparator value, and L is the model’s gauge stretch. Figure 14 shows that the concrete shrinkage strain from drying out contains different percentages of WFS and CS. At the time of extending the age of drying, the shrinkage strain also ex-tends for all mixes. The shrinkage strain was at a higher rate during the initial days of drying and gradually increased at later stages. At the time of extending the percentage of WFS and CS, the drying shrinkage strain also extends to a higher level than normal con-crete [11–17].
Figure 14. Drying shrinkage strain contains different percentages of FS and CS.
The shrinkage strain values of mix M11 were very close to the CC. Similarly, the per-centage variation of strain values for mix M21 are between 2.2% and 3.5% for all ages of curing. The higher shrinkage strain values for M11–M32 mixes were attributed to factors such as the compressibility of aggregates, presence of clay, and excessive humidity of WFS and CS aggregates. Nevertheless, all the mixtures’ shrinkage values stayed within the limit of 800 × 100−6 mm/mm.
2.4
2.5
2.6
2.7
2.8
2.9
3
3.1
0 5 10 15 20 25 30 35
Split
Ten
sile
Stre
ngth
(N/m
m2)
% Foundry Sand
Split Tensile StressStress
10% CS
20% CS
0
100
200
300
400
500
600
700
0 14 28 42 56 70 84 98 112 126 140 154 168 182Dry
ing
Shri
nkag
e Str
ain
( x 1
0-6)
Age in Days
Shrinkage Strain
CCM11M21M31M12M22M32
Figure 14. Drying shrinkage strain contains different percentages of FS and CS.
The shrinkage strain values of mix M11 were very close to the CC. Similarly, thepercentage variation of strain values for mix M21 are between 2.2% and 3.5% for all ages ofcuring. The higher shrinkage strain values for M11–M32 mixes were attributed to factorssuch as the compressibility of aggregates, presence of clay, and excessive humidity of WFSand CS aggregates. Nevertheless, all the mixtures’ shrinkage values stayed within the limitof 800 × 100−6 mm/mm.
In phase two of the experimental work, the combination of both foundry sand andcoconut shell remains a partial replacement for fine aggregate and coarse aggregate under-gone in a concrete mix. The replacement of foundry sand, up to the 30%, remains as a fillerin forming void free concrete. Improving the durability and the strength of concrete in amechanical test was the main goal. As far as coconut shell is concerned, we have already
Materials 2021, 14, 7420 15 of 19
shown in phase one that a 15% replacement shows optimum value. In combination of bothcoconut shell and foundry sand in same concrete, a 25% replacement of foundry sand and15% replacement of coconut shell remains the optimum value of replacement of aggregatesin concrete [18–22].
4.12. SEM Analysis
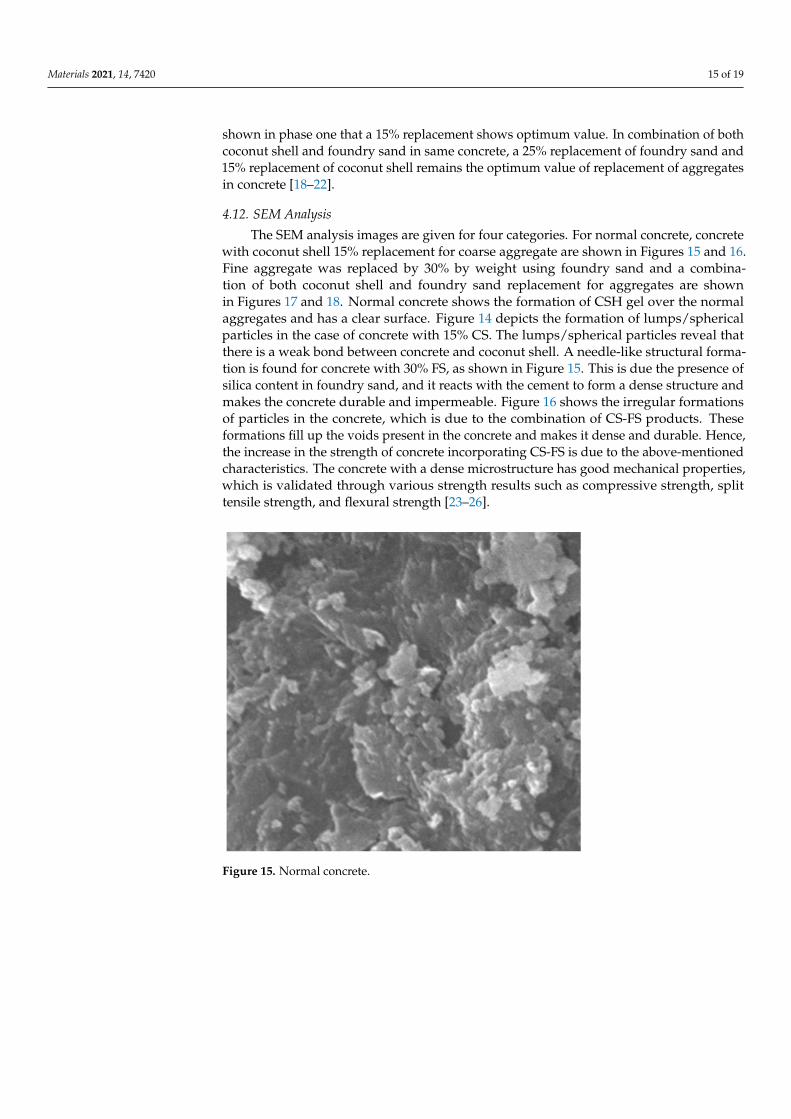
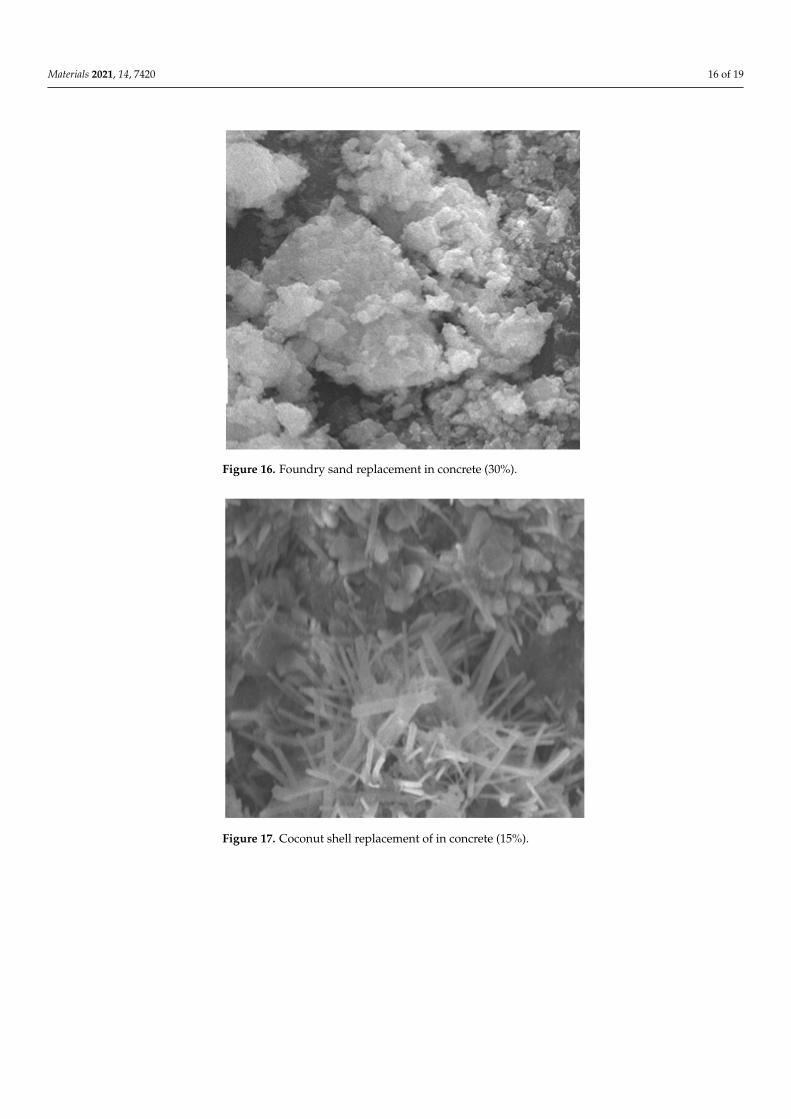
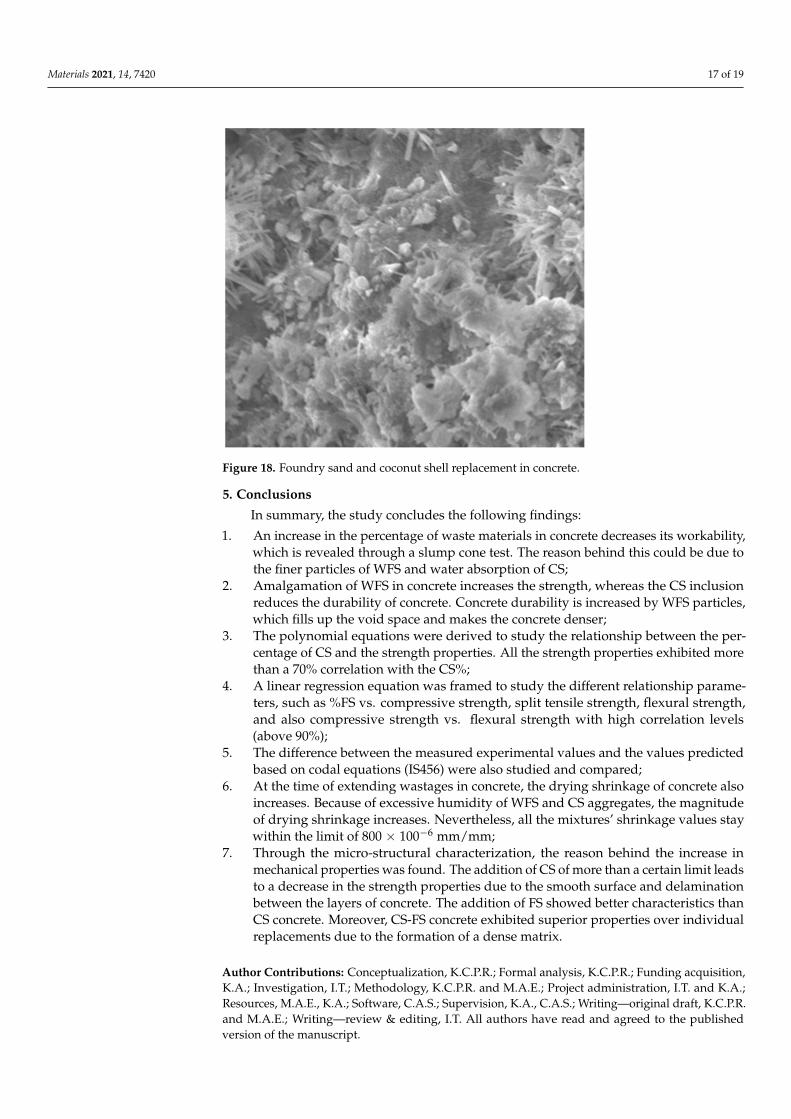
The SEM analysis images are given for four categories. For normal concrete, concretewith coconut shell 15% replacement for coarse aggregate are shown in Figures 15 and 16.Fine aggregate was replaced by 30% by weight using foundry sand and a combina-tion of both coconut shell and foundry sand replacement for aggregates are shownin Figures 17 and 18. Normal concrete shows the formation of CSH gel over the normalaggregates and has a clear surface. Figure 14 depicts the formation of lumps/sphericalparticles in the case of concrete with 15% CS. The lumps/spherical particles reveal thatthere is a weak bond between concrete and coconut shell. A needle-like structural forma-tion is found for concrete with 30% FS, as shown in Figure 15. This is due the presence ofsilica content in foundry sand, and it reacts with the cement to form a dense structure andmakes the concrete durable and impermeable. Figure 16 shows the irregular formationsof particles in the concrete, which is due to the combination of CS-FS products. Theseformations fill up the voids present in the concrete and makes it dense and durable. Hence,the increase in the strength of concrete incorporating CS-FS is due to the above-mentionedcharacteristics. The concrete with a dense microstructure has good mechanical properties,which is validated through various strength results such as compressive strength, splittensile strength, and flexural strength [23–26].
Materials 2021, 14, x FOR PEER REVIEW 16 of 20
In phase two of the experimental work, the combination of both foundry sand and coconut shell remains a partial replacement for fine aggregate and coarse aggregate un-dergone in a concrete mix. The replacement of foundry sand, up to the 30%, remains as a filler in forming void free concrete. Improving the durability and the strength of concrete in a mechanical test was the main goal. As far as coconut shell is concerned, we have already shown in phase one that a 15% replacement shows optimum value. In combina-tion of both coconut shell and foundry sand in same concrete, a 25% replacement of foundry sand and 15% replacement of coconut shell remains the optimum value of re-placement of aggregates in concrete [18–22].
4.12. SEM Analysis The SEM analysis images are given for four categories. For normal concrete, concrete
with coconut shell 15% replacement for coarse aggregate are shown in Figures 15 and 16. Fine aggregate was replaced by 30% by weight using foundry sand and a combination of both coconut shell and foundry sand replacement for aggregates are shown in Figures 17 and 18. Normal concrete shows the formation of CSH gel over the normal aggregates and has a clear surface. Figure 14 depicts the formation of lumps/spherical particles in the case of concrete with 15% CS. The lumps/spherical particles reveal that there is a weak bond between concrete and coconut shell. A needle-like structural formation is found for con-crete with 30% FS, as shown in Figure 15. This is due the presence of silica content in foundry sand, and it reacts with the cement to form a dense structure and makes the con-crete durable and impermeable. Figure 16 shows the irregular formations of particles in the concrete, which is due to the combination of CS-FS products. These formations fill up the voids present in the concrete and makes it dense and durable. Hence, the increase in the strength of concrete incorporating CS-FS is due to the above-mentioned characteris-tics. The concrete with a dense microstructure has good mechanical properties, which is validated through various strength results such as compressive strength, split tensile strength, and flexural strength [23–26].
Figure 15. Normal concrete. Figure 15. Normal concrete.
Materials 2021, 14, 7420 16 of 19Materials 2021, 14, x FOR PEER REVIEW 17 of 20
Figure 16. Foundry sand replacement in concrete (30%).
Figure 17. Coconut shell replacement of in concrete (15%).
Figure 16. Foundry sand replacement in concrete (30%).
Materials 2021, 14, x FOR PEER REVIEW 17 of 20
Figure 16. Foundry sand replacement in concrete (30%).
Figure 17. Coconut shell replacement of in concrete (15%). Figure 17. Coconut shell replacement of in concrete (15%).
Materials 2021, 14, 7420 17 of 19Materials 2021, 14, x FOR PEER REVIEW 18 of 20
Figure 18. Foundry sand and coconut shell replacement in concrete.
5. Conclusions In summary, the study concludes the following findings:
1. An increase in the percentage of waste materials in concrete decreases its workability, which is revealed through a slump cone test. The reason behind this could be due to the finer particles of WFS and water absorption of CS;
2. Amalgamation of WFS in concrete increases the strength, whereas the CS inclusion reduces the durability of concrete. Concrete durability is increased by WFS particles, which fills up the void space and makes the concrete denser;
3. The polynomial equations were derived to study the relationship between the per-centage of CS and the strength properties. All the strength properties exhibited more than a 70% correlation with the CS%;
4. A linear regression equation was framed to study the different relationship parame-ters, such as %FS vs. compressive strength, split tensile strength, flexural strength, and also compressive strength vs. flexural strength with high correlation levels (above 90%);
5. The difference between the measured experimental values and the values predicted based on codal equations (IS456) were also studied and compared;
6. At the time of extending wastages in concrete, the drying shrinkage of concrete also increases. Because of excessive humidity of WFS and CS aggregates, the magnitude of drying shrinkage increases. Nevertheless, all the mixtures’ shrinkage values stay within the limit of 800 × 100−6 mm/mm;
7. Through the micro-structural characterization, the reason behind the increase in me-chanical properties was found. The addition of CS of more than a certain limit leads to a decrease in the strength properties due to the smooth surface and delamination between the layers of concrete. The addition of FS showed better characteristics than CS concrete. Moreover, CS-FS concrete exhibited superior properties over individual replacements due to the formation of a dense matrix.
Author Contributions: Conceptualization, K.C.P.R.; Formal analysis, K.C.P.R.; Funding acquisition, K.A.; Investigation, I.T.; Methodology, K.C.P.R. and M.A.E.; Project administration, I.T. and K.A.; Resources, M.A.E., K.A.; Software, C.A.S.; Supervision, K.A., C.A.S.; Writing—original draft, K.C.P.R. and M.A.E.; Writing—review & editing, I.T. All authors have read and agreed to the pub-lished version of the manuscript.
Figure 18. Foundry sand and coconut shell replacement in concrete.
5. Conclusions
In summary, the study concludes the following findings:
1. An increase in the percentage of waste materials in concrete decreases its workability,which is revealed through a slump cone test. The reason behind this could be due tothe finer particles of WFS and water absorption of CS;
2. Amalgamation of WFS in concrete increases the strength, whereas the CS inclusionreduces the durability of concrete. Concrete durability is increased by WFS particles,which fills up the void space and makes the concrete denser;
3. The polynomial equations were derived to study the relationship between the per-centage of CS and the strength properties. All the strength properties exhibited morethan a 70% correlation with the CS%;
4. A linear regression equation was framed to study the different relationship parame-ters, such as %FS vs. compressive strength, split tensile strength, flexural strength,and also compressive strength vs. flexural strength with high correlation levels(above 90%);
5. The difference between the measured experimental values and the values predictedbased on codal equations (IS456) were also studied and compared;
6. At the time of extending wastages in concrete, the drying shrinkage of concrete alsoincreases. Because of excessive humidity of WFS and CS aggregates, the magnitudeof drying shrinkage increases. Nevertheless, all the mixtures’ shrinkage values staywithin the limit of 800 × 100−6 mm/mm;
7. Through the micro-structural characterization, the reason behind the increase inmechanical properties was found. The addition of CS of more than a certain limit leadsto a decrease in the strength properties due to the smooth surface and delaminationbetween the layers of concrete. The addition of FS showed better characteristics thanCS concrete. Moreover, CS-FS concrete exhibited superior properties over individualreplacements due to the formation of a dense matrix.
Author Contributions: Conceptualization, K.C.P.R.; Formal analysis, K.C.P.R.; Funding acquisition,K.A.; Investigation, I.T.; Methodology, K.C.P.R. and M.A.E.; Project administration, I.T. and K.A.;Resources, M.A.E., K.A.; Software, C.A.S.; Supervision, K.A., C.A.S.; Writing—original draft, K.C.P.R.and M.A.E.; Writing—review & editing, I.T. All authors have read and agreed to the publishedversion of the manuscript.
Materials 2021, 14, 7420 18 of 19
Funding: The research was funded by King Khalid University.
Institutional Review Board Statement: Not applicable.
Informed Consent Statement: Not applicable.
Data Availability Statement: Not applicable.
Acknowledgments: The authors extend their appreciation to the Deanship of Scientific Researchat King Khalid University, Saudi Arabia for funding this work through General Research GroupProgram under Grant No: RGP. 2/108/42.
Conflicts of Interest: The authors declare no conflict of interest.
References1. Khatib, J.M.; Herki, B.A.; Kenai, S. Capillarity of concrete incorporating waste foundry sand. Constr. Build. Mater. 2013, 47,
867–871. [CrossRef]2. Jayaprithika, A.; Sekar, S.K. Stress-strain characteristics and flexuralbehaviour of reinforced Eco-friendly coconut shell con-crete.
Constr. Build. Mater. 2016, 117, 244–250. [CrossRef]3. Kumar, V.R.P.; Gunasekaran, K.; Shyamala, T. Characterization studyon coconut shell concrete with partial replacement of cement
by GGBS. J. Build. Eng. 2019, 26, 100830. [CrossRef]4. Kanojia, A.; Jain, S.K. Performance of coconut shell as coarse aggregatein concrete. Constr. Build. Materials. 2017, 140, 150–156.
[CrossRef]5. Siddique, R.; Singh, G. Utilization of waste foundry sand (WFS) in concrete manufacturing. Resour. Conserv. Recycl. 2011, 55,
885–892. [CrossRef]6. Gunasekaran, K.; Annadurai, R.; Chandar, S.P.; Anandh, S. Study for the relevance of coconut shell aggregateconcrete non-pressure
pipe. Ain Shams Eng. J. 2017, 8, 523–530. [CrossRef]7. Nithya, M.; Priya, A.K.; Muthukumaran, R.; Arunvivek, G.K. Properties of concrete containing waste foundry sand for par-tial
replacement of fine aggregate in concrete. Indian J. Eng. Mater. Sci. 2017, 24, 162–166.8. Shahidan, S.; Leman, A.S.; Senin, M.S.; Hannan, N.I.R.R. Suitability of Coconut Shell Concrete for Precast CoolWall Panel-A
Review. MATEC Web Conf. 2017, 87, 01005. [CrossRef]9. Mysore, T.H.M.; Patil, A.Y.; Raju, G.U.; Banapurmath, N.R.; Bhovi, P.M.; Afzal, A.; Alamri, S.; Saleel, C. Investigation of Me-
chanical and Physical Properties of Big Sheep Horn as an Alternative Biomaterial for Structural Applications. Materials 2021, 14,4039. [CrossRef] [PubMed]
10. Akhtar, M.N.; Khan, M.; Khan, S.A.; Afzal, A.; Subbiah, R.; Bakar, E.A. Determination of Non-Recrystallization Temperature forNiobium Microalloyed Steel. Materials 2021, 14, 2639. [CrossRef]
11. Nagaraja, S.; Nagegowda, K.U.; Kumar, V.A.; Alamri, S.; Afzal, A.; Thakur, D.; Kaladgi, A.R.; Panchal, S.; Saleel, C.A. Influ-enceof the Fly Ash Material Inoculants on the Tensile and Impact Characteristics of the Aluminum AA 5083/7.5SiC Compo-sites.Materials 2021, 14, 2452. [CrossRef]
12. Sathish, T.; Kaladgi, A.R.R.; Mohanavel, V.; Arul, K.; Afzal, A.; Aabid, A. Experimental Investigation of the Friction Stir Weldabilityof AA8006 with Zirconia Particle Reinforcement and Optimized Process Parameters. Materials 2021, 14, 2782. [CrossRef]
13. Sharath, B.N.; Venkatesh, C.V.; Afzal, A. Multi Ceramic Particles Inclusion in the Aluminium Matrix and Wear Characteri-zationthrough Experimental and Response Surface-Artificial Neural Networks. Materials 2021, 14, 2895. [CrossRef] [PubMed]
14. Sathish, T.; Mohanavel, V.; Ansari, K.; Saravanan, R.; Karthick, A.; Afzal, A.; Alamri, S.; Saleel, C.A. Synthesis and Charac-terization of Mechanical Properties and Wire Cut EDM Process Parameters Analysis in AZ61. Materials 2021, 14, 3689. [CrossRef]
15. Meignanamoorthy, M.; Ravichandran, M.; Mohanavel, V.; Afzal, A.; Sathish, T.; Alamri, S.; Khan, S.A.; Saleel, C.A. Micro-structure, Mechanical Properties, and Corrosion Behavior of Boron Carbide Reinforced Aluminum Alloy (Al-Fe-Si-Zn-Cu) MatrixComposites Produced via Powder Metallurgy Route. Materials 2021, 14, 4315. [CrossRef] [PubMed]
16. Kumbar, S.S.; Jadhav, D.A.; Jarali, C.S.; Talange, D.B.; Afzal, A.; Khan, S.A.; Asif, M.; Abdullah, M.Z. Enhancement in Ca-thodicRedox Reactions of Single-Chambered Microbial Fuel Cells with Castor Oil-Emitted Powder as Cathode Material. Materials 2021,14, 4454. [CrossRef] [PubMed]
17. Akhtar, M.N.; Sathish, T.; Mohanavel, V.; Afzal, A.; Arul, K.; Ravichandran, M.; Rahim, I.A.; Alhady, S.S.N.; Bakar, E.A.; Saleh, B.Optimization of Process Parameters in CNC Turning of Aluminum 7075 Alloy Using L27 Array-Based Taguchi Method. Materials2021, 14, 4470. [CrossRef]
18. Kaur, G.; Siddique, R.; Rajor, A. Micro-structural and metal leachate analysis of concrete made with fungal treated waste foundrysand. Constr. Build. Mater. 2013, 38, 94–100. [CrossRef]
19. Nithya, M.; Maheswaran, G.; Senthil Kumar, S. Experimental investigation on impact of sand mining in coastal regions andpotential reuse of silica sand as construction material. Indian J. Geo-Mar. Sci. 2016, 45, 885–888.
20. Pennarasi, G.; Soumya, S.; Gunasekaran, K. Study for the relevance ofcoconut shell aggregate concrete paver blocks. Mater. Today:Proc. 2019, 14, 368–378. [CrossRef]

Materials 2021, 14, 7420 19 of 19
21. Siddique, R.; Aggarwal, Y.; Aggarwal, P.; Kadri, E.H.; Bennacer, R. Strength, durability, and micro-structural properties of concretemade with used-foundry sand (UFS). Constr. Build. Mater. 2011, 25, 1916–1925. [CrossRef]
22. Chandrashekar, A.; Chaluvaraju, B.V.; Afzal, A.; Vinnik, D.A.; Kaladgi, A.R.; Alamri, S.; C., A.S.; Tirth, V. Mechanical andCorrosion Studies of Friction Stir Welded Nano Al2O3 Reinforced Al-Mg Matrix Composites: RSM-ANN Modelling Ap-proach.Symmetry 2021, 13, 537. [CrossRef]
23. ASTM C 157. Standard Test Method for Length Change of Hardened Hydraulic-Cement Mortar and Concrete; ASTM: West Conshohocken,PA, USA, 2008.
24. ACI Committee 209. Report on factors affecting Shrinkage and creep of hardened concrete. Concr. Int. 2005, 21, 1–11. [CrossRef]25. Etxeberria, M.; Pacheco, C.; Meneses, J.M.; Berridi, I. Properties of concrete using metallurgical industrial by-products as
aggregates. Constr. Build. Mater. 2010, 24, 1594–1600. [CrossRef]26. IS: 456-2000. Indian Standard Plain and Reinforced Concrete—Code of Practice; Bureau of Indian Standards: New Delhi, India, 2000.


