Embed Size (px)
Citation preview

warwick.ac.uk/lib-publications
A Thesis Submitted for the Degree of PhD at the University of Warwick
Permanent WRAP URL:
http://wrap.warwick.ac.uk/103087/
Copyright and reuse:
This thesis is made available online and is protected by original copyright.
Please scroll down to view the document itself.
Please refer to the repository record for this item for information to help you to cite it.
Our policy information is available from the repository home page.
For more information, please contact the WRAP Team at: [email protected]

Non-destructive approach for sprayed
concrete lining strength monitoring
by
Vishwajeet Ahuja
A thesis submitted in partial fulfilment of the requirements for the degree of
Doctor of Philosophy in Engineering
University of Warwick
School of Engineering
2017


i
Table of Contents
Abstract ........................................................................................................................... vii
Acknowledgements .......................................................................................................... ix
Declaration ....................................................................................................................... xi
List of Figures ................................................................................................................ xiii
List of Tables .............................................................................................................. xxvii
1 Introduction .................................................................................................................. 1
1.1 General scope .................................................................................................................... 1
1.2 Research motivation ......................................................................................................... 1
1.3 Research scope .................................................................................................................. 2
1.4 Thesis Outline ................................................................................................................... 2
2 Literature review .......................................................................................................... 5
2.1 Sprayed Concrete .............................................................................................................. 5
2.1.1 Sprayed concrete as tunnel lining ........................................................................... 5
2.2 Sprayed concrete ............................................................................................................... 7
2.2.1 Cement .................................................................................................................... 7
2.2.2 Water content ......................................................................................................... 8
2.2.3 Accelerating admixtures ......................................................................................... 8
2.2.4 Water reducing or plasticising admixtures ............................................................. 8
2.2.5 Set retarding admixtures ......................................................................................... 9
2.2.6 Aggregates .............................................................................................................. 9
2.2.7 Supplementary cementitious materials ................................................................... 9
2.2.8 Fibre reinforcement .............................................................................................. 10
2.3 Mechanical nature of sprayed concrete........................................................................... 10
2.4 Sprayed concrete strength development ......................................................................... 11
2.4.1 Stages of concrete strength development ............................................................. 11
2.4.2 Cement hydration and strength development ....................................................... 12
2.4.3 Factors affecting early age cement hydration ....................................................... 14
2.5 Maturity method ............................................................................................................. 14
2.5.1 Maturity functions ................................................................................................ 15
2.5.2 Strength and maturity relationships ...................................................................... 17

ii
2.5.3 Cross-over effect .................................................................................................. 20
2.6 Degree of hydration ........................................................................................................ 20
2.6.1 Definition .............................................................................................................. 20
2.6.2 Degree of hydration determination ....................................................................... 20
2.6.3 Ultimate degree of hydration ................................................................................ 21
2.7 Hydration kinetics ........................................................................................................... 22
2.8 Isothermal calorimetry .................................................................................................... 23
2.8.1 Heat flow and rate of hydration ............................................................................ 24
2.8.2 Final heat of hydration determination .................................................................. 25
2.8.3 Activation energy determination .......................................................................... 26
2.8.4 Normalised affinity ............................................................................................... 29
2.9 Thermogravimetric analysis ........................................................................................... 31
2.9.1 Non-evaporable water content .............................................................................. 31
2.9.2 Non-evaporable water content to degree of hydration ......................................... 32
2.10 Sprayed concrete strength determination ........................................................................ 33
2.10.1 Needle penetration test ......................................................................................... 33
2.10.2 Stud driving test .................................................................................................... 34
2.10.3 Core testing ........................................................................................................... 35
2.11 Thermal monitoring ........................................................................................................ 35
2.11.1 Thermal imaging .................................................................................................. 35
2.11.2 Thermal imaging and concrete ............................................................................. 36
3 Research methodology ............................................................................................... 55
3.1 Research aim and objectives ........................................................................................... 55
3.2 Research basis ................................................................................................................. 56
3.2.1 Maturity method – application and prerequisite ................................................... 57
3.3 Thermo-chemical evaluation .......................................................................................... 57
3.3.1 Isothermal calorimetry .......................................................................................... 58
3.3.2 Thermogravimetry ................................................................................................ 59
3.3.3 Calorimetric – thermogravimetric evaluation ....................................................... 61
3.4 Maturity function input parameters ................................................................................ 61
3.4.1 Activation energy and affinity constant................................................................ 61
3.4.2 Normalised kinetics .............................................................................................. 62

iii
3.5 Thermo-mechanical evaluation ....................................................................................... 62
3.5.1 Strength testing ..................................................................................................... 62
3.5.2 Thermal monitoring .............................................................................................. 62
3.5.3 Strength – maturity evaluation ............................................................................. 63
3.6 Thermo-chemo-mechanical modelling of sprayed concrete lining ................................. 64
3.7 Case studies .................................................................................................................... 64
3.7.1 Whitechapel Station Platform Tunnels – primary lining works ........................... 64
3.7.2 Bond Street Station Upgrade – secondary lining works ....................................... 66
3.8 Summary ......................................................................................................................... 67
4 Thermo-chemical evaluation of Whitechapel Station sprayed concrete mix ............ 87
4.1 Isothermal calorimetry .................................................................................................... 87
4.1.1 Plain pastes ........................................................................................................... 87
4.1.2 Mix Pastes ............................................................................................................ 88
4.1.3 Calorimetry outcome and summary ..................................................................... 90
4.2 Hydration kinetics evaluation ......................................................................................... 90
4.3 Thermogravimetric testing .............................................................................................. 93
4.3.1 Initial solid content baseline ................................................................................. 93
4.3.2 Non-evaporable content and degree of hydration determination ......................... 94
4.3.3 Thermogravimetry summary ................................................................................ 95
4.4 Calorimetric – thermogravimetric evaluation ................................................................. 96
4.4.1 Plain pastes ........................................................................................................... 96
4.4.2 Mix Pastes ............................................................................................................ 97
4.4.3 Evaluation summary ............................................................................................. 98
4.5 Hydration modelling parameters – activation energy and affinity constant ................... 98
4.5.1 Plain pastes ........................................................................................................... 98
4.5.2 Mix pastes ............................................................................................................. 99
4.5.3 Modelling parameter outcome and summary ..................................................... 100
4.6 Degree of hydration modelling ..................................................................................... 101
4.6.1 Isothermal modelling .......................................................................................... 101
4.6.2 Non-isothermal modelling .................................................................................. 102
4.6.3 Modelling challenges from field measurements ................................................. 103
4.7 Result summary ............................................................................................................ 103
5 Thermo-mechanical evaluation of Whitechapel sprayed concrete works ............... 137

iv
5.1 Panel testing results ...................................................................................................... 137
5.2 Strength – hydration relationship .................................................................................. 141
5.2.1 Anomalous strength values ................................................................................. 141
5.2.2 Establishing strength – hydration relationship ................................................... 142
5.2.3 Relationship verification .................................................................................... 143
5.2.4 Relationship application ..................................................................................... 144
5.3 Thermo-chemo-mechanical modelling of sprayed concrete lining ............................... 144
5.4 Summary ....................................................................................................................... 146
6 Thermo-chemo-mechanical evaluation of Bond Street Station Upgrade sprayed
concrete .................................................................................................................... 161
6.1 Isothermal calorimetry .................................................................................................. 161
6.1.1 Plain pastes ......................................................................................................... 161
6.1.2 Mix pastes ........................................................................................................... 162
6.2 Thermogravimetric testing ............................................................................................ 162
6.2.1 Intial solid content baseline ................................................................................ 163
6.2.2 Thermogravimetric degree of hydration ............................................................. 163
6.3 Calorimetric - thermogravimetric evaluation................................................................ 164
6.3.1 Final heat of hydration........................................................................................ 164
6.3.2 Calorimetric degree of hydration ........................................................................ 165
6.3.3 Normalised kinetics ............................................................................................ 165
6.4 Hydration modelling parameters – Activation energy and Affinity constant ............... 167
6.4.1 Activation energy and affinity constant.............................................................. 167
6.4.2 Activation energy variability .............................................................................. 167
6.4.3 Sprayed concrete hydration modelling ............................................................... 168
6.5 Thermo-mechanical evaluation of sprayed concrete .................................................... 168
6.5.1 Panel testing ....................................................................................................... 169
6.5.2 Establishing strength – hydration relationship ................................................... 169
6.5.3 Relationship application ..................................................................................... 170
6.5.4 Whitechapel station and Bond Street station relationship comparative ............. 171
6.5.5 Strength – hydration relationship verification .................................................... 172
6.6 Summary ....................................................................................................................... 173
7 Conclusions and further research ............................................................................. 207
7.1 Conclusions ................................................................................................................... 207

v
7.1.1 Thermo-chemical evaluation .............................................................................. 207
7.1.2 Thermo-mechanical evaluation .......................................................................... 209
7.2 Further research recommendations ............................................................................... 210
8 References ................................................................................................................ 213
Appendices ................................................................................................................... 225
Appendix A Whitechapel station .................................................................................. 225
A1 Cement pastes – thermogravimetric weight loss profiles ......................................... 225
A2 Cement pastes – thermogravimetric degree of hydration estimates ......................... 233
A3 Cement pastes – measured heat of hydration ........................................................... 235
A4 Cement pastes – degree of hydration development histories ................................... 237
A5 Cement pastes – normalised kinetics characteristics ................................................ 243
A6 Sprayed concrete – test panel temperature histories ................................................ 245
A7 Sprayed concrete – in-situ strengths and modelled degree of hydration values of
test panels ................................................................................................................. 251
A8 Sprayed concrete – modelled panel strengths .......................................................... 255
A9 Sprayed concrete – lining temperature histories ...................................................... 259
A10 Sprayed concrete – modelled lining strengths.......................................................... 263
Appendix B Bond Street station upgrade ..................................................................... 267
B1 Cement pastes – isothermal calorimetric data .......................................................... 267
B2 Cement pastes – thermogravimetric weight loss profiles ......................................... 275
B3 Cement pastes – thermogravimetric degree of hydration estimates ......................... 287
B4 Cement pastes – measured heat of hydration ........................................................... 289
B5 Cement pastes – degree of hydration development histories ................................... 291
B6 Cement pastes – normalised kinetics characteristics ................................................ 303
B7 Sprayed concrete – strength histories of calibration test panel ................................ 307
B8 Sprayed concrete – temperature histories of calibration test panel .......................... 309
B9 Sprayed concrete – modelled degree of hydration of calibration test panels at time
of strength testing ..................................................................................................... 313


vii
Abstract
Sprayed concrete lining (SCL) is an important part of soft ground tunnelling. It provides
immediate ground support and maintains tunnel stability. A quick set and rapid strength
development of freshly sprayed concrete are crucial for maintaining SCL integrity. An inadequate
strength development leads to the SCL failure and tunnel instability. This poses serious health and
safety risks to construction workers and nearby structures. Therefore, early age strength
development monitoring forms a crucial aspect of SCL construction. Currently used testing
methods, namely needle penetrometer, stud-driving and uniaxial compressive testing of cored
samples, are of destructive nature. To avoid damage to the freshly sprayed lining and to mitigate
safety hazards to testing operatives, testing is performed on test panels. Current test methods,
however, test a very small part of the sprayed concrete. Since the temperature histories of the lining
section are different from the test panels, the outcomes are local in nature and provide an
incomplete picture of the SCL strength gain. Thus, there remains a need for a test method with a
capability of testing large volumes of the sprayed concrete works remotely, holistically and non-
destructively.
The maturity method is well established for normal concretes and allows maturity and hence
strength to be calculated from a temperature history. A new method called Strength Monitoring
Using Thermal Imaging seeks to apply this principle to accelerated sprayed concrete using an
Arrhenius equation based maturity function, but there are significant challenges to overcome to
obtain the input parameters. This research establishes a thermo-chemo-mechanical evaluation
methodology for obtaining the input parameters and verifies its reliability through two detailed
case studies on live tunnelling projects.
The two-staged methodology involved thermo-chemical evaluation of a total of twelve
cement pastes, through isothermal calorimetry and thermogravimetry, and thermo-mechanical
evaluation of two sprayed concrete mixes, through strength testing and thermal imaging of more
than fifty test panels.
The thermo-chemical evaluation revealed that the sprayed concrete has very different
hydration kinetics at different temperatures and the reference temperature approach is not valid for
the maturity assessments. The maturity modelling procedure was modified to account for kinetics
variability. The thermo-mechanical evaluation revealed that sprayed concrete holds a multilinear
strength – maturity relationship as against a single linear relationship for plain concrete.


ix
Acknowledgements
I would like to express my deepest gratitude to my supervisor, Dr Benoît Jones, for his
support, collegiality, and mentorship throughout the research and thesis work. I would like to thank
School of Engineering, University of Warwick for funding this research. I would like to thank for
Dr Stana Živanovic and other faculty members for their academic guidance.
I would like to extend my thanks to Alfred Staerk, Dan Maker, Josh Roy, Kevin Dollard,
Tom Lane, Moeen Uddin, Paul Donegan, Peter Leyton, Peter Punzengruber, Stephan Lakis,
Valdimir Tvrdy and other BBMV staff for extending their support at the Whitechapel Station site. I
would also like to extend my thanks to Anita Wu, Aled Davis, David Oates, Dave Terry, Fransico
Gallego, Jennifer Sampson, Liam Poole and other CoLOR staff for their support at the Bond Street
Station Upgrade site.
I am grateful to School of Engineering laboratory staff, especially Colin Banks and Martin
Davis, for their kind assistance.
A special thanks to my friends and colleagues, Bowen Yang and Hiep Dang, for their
encouragements and insights.
Finally, and most importantly, I’d like to pay a dedication to the love and motivation I
received from my family all these years.


xi
Declaration
This thesis is submitted to the University of Warwick in support of my application for the
degree of Doctor of Philosophy. It has been composed by myself and has not been submitted in any
previous application for any degree. The work presented (including data generated and data
analysis) was carried out by the author.
Parts of this thesis have been published as:
Ahuja, V. and Jones, B. 2016. Nondestructive Approach for Shotcrete Lining Strength Monitoring.
Shotcrete Magazine. 18(3), pp. 48–54.
Jones, B., Davies, A. and Ahuja, V. 2017. Sprayed concrete strength monitoring using thermal
imaging at Bond Street Station Upgrade In: Proceeding of the World Tunnel Congress 2017 –
Surface challenges – Underground solutions. Bergen, Norway, 9–15 June 2017, Bergen, pp. 1–
7.
Jones, B., Li, S. and Ahuja, V. 2014. Early strength monitoring of shotcrete using thermal imaging
In: T. Beck, O. Woldmo and S. Engen, eds. 7th International Symposium on Sprayed Concrete
– Modern Use of Wet Mix Sprayed Concrete for Underground Support. Sandefjørd, Norway,
16–19 June 2014, Sandefjørd: Tekna & Norsk Betongforening, pp. 245–254.


xiii
List of Figures
Figure 1-1 Application of thermal imaging for sprayed concrete lining thermal monitoring (Jones
and Li, 2013) .................................................................................................................. 4
Figure 1-2 Sprayed concrete strength modelling using the Arrhenius equation based maturity
method (Jones and Li, 2013) .......................................................................................... 4
Figure 2-1 Schematic of wet spraying process (Thomas, 2003) ....................................................... 39
Figure 2-2 Schematic view of dry spraying process (Thomas, 2003) .............................................. 39
Figure 2-3 NATM support measures (von Rabcewicz, 1965) .......................................................... 40
Figure 2-4 Typical grading curve for the sprayed concrete (EFNARC, 1996) ................................ 40
Figure 2-5 Inverse relationship between concrete compressive strength and concrete porosity
[Jones (2007) after Byfors (1980)] ............................................................................... 41
Figure 2-6 Phases of concrete strength development (Byfors, 1980) ............................................... 41
Figure 2-7 Rate of clinker hydration on initial content basis [drawn using fixed water content data
from Bogue and Lerch (1934)] .................................................................................... 42
Figure 2-8 Compressive strength development in clinker pastes [redrawn from Bogue and Lerch
(1934)] .......................................................................................................................... 42
Figure 2-9 Cement paste microstructure development during the hydration process [Kurdowski
(2014) after Scrivener and Pratt (1984)]. a) unhydrated cement grain; b) after 10 min;
c) after 10 h; d) after 18 h; e) during the 1–3 days; and f) after 14 days. ..................... 43
Figure 2-10 Formation of hydration products [Kurdowski (2014) after Locher and Richartz
(1974)] .......................................................................................................................... 44
Figure 2-11 Compressive strength and degree of hydration relationship of various concretes of
different w/c ratios [Jones (2007) after Byfors (1980)] ............................................... 45
Figure 2-12 Nurse-Saul maturity function (Carino, 2004) ............................................................... 45
Figure 2-13 Impact of activation energy value for age conversion factors at different temperatures.
Tr = 23°C (Carino, 2004) .............................................................................................. 46
Figure 2-14 “Cross-over effect” in strength development caused by curing temperature (Carino and
Lew, 2001) ................................................................................................................... 46
Figure 2-15 Schematic arrangement of isothermal heat conduction calorimeter (Wadsö, 2003) ..... 47

xiv
Figure 2-16 Typical heat flow curve observed during isothermal hydration of Portland cement at
20°C .............................................................................................................................. 47
Figure 2-17 Rate of heat release and heat of hydration of cement pastes during isothermal curing
(Escalante-Garcia and Sharp, 2000) ............................................................................. 48
Figure 2-18 Powder X-ray Diffraction pattern for ferrite rich cement residue from nitric acid /
methanol extraction (Stutzman, 1996) ......................................................................... 48
Figure 2-19 Activation energy determination by plotting natural logs of rate of reaction vs inverse
of temperature (K). ....................................................................................................... 49
Figure 2-20 Hydration kinetics for shotcrete – normalised affinity (Hellmich et al., 1999) ............ 49
Figure 2-21 A plot of rate of hydration vs degree of hydration from isothermal calorimetry (Ahuja
and Jones, 2016) ........................................................................................................... 50
Figure 2-22 Normalised rate of hydration curves obtained from rate of hydration vs degree of
hydration shown in Ahuja and Jones (2016) ................................................................ 50
Figure 2-23 Activation energy and affinity constant determination [deduced from Ahuja and Jones
(2016)] .......................................................................................................................... 51
Figure 2-24 CSH gel structure model for hydrated Portland cement (Feldman and Sereda, 1968) . 51
Figure 2-25 Typical thermogravimetric and differential thermogravimetric curves of hydrated
cement paste (Almeida and Sichieri, 2006) ................................................................. 52
Figure 2-26 Early strength classes of young sprayed concrete (redrawn from EN 14487-1:2005) .. 52
Figure 2-27 Meyco Needle Penetrometer ......................................................................................... 53
Figure 2-28 Calibration curve for needle penetrometer (redrawn from EN 14488-2:2006) ............ 53
Figure 2-29 Hilti DX-450CT Testing Apparatus – Pneumatic gun, stud and pull-out equipment ... 54
Figure 2-30 Core drilling machine (image credit www.JZX-tools.com).......................................... 54
Figure 3-1 Four channel I-Cal 4000 HPC calorimeter operated using Calcommander software ..... 71
Figure 3-2 I-Cal 4000 HPC top view showing 4 channel arrangement ............................................ 71
Figure 3-3 Rate of heat release and heat of hydration measured using I-Cal 4000 HPC ................. 72
Figure 3-4 Rate of heat release vs heat of hydration plot developed using I-Cal 4000 HPC data.... 72
Figure 3-5 PL-STA 1500 used for thermogravimetric analysis of hydrated cement pastes ............. 73
Figure 3-6 Plot showing weight loss and temperature rise during thermogravimetric testing of
hydrated cement paste .................................................................................................. 73
Figure 3-7 Measured weight loss profile of anhydrous and hydrated cement samples .................... 74

xv
Figure 3-8 Interpreted weight loss profiles of anhydrous and hydrated cement samples for non-
evaporable water content.............................................................................................. 74
Figure 3-9 Final heat of hydration estimation through calorimetric vs thermogravimetric
evaluation ..................................................................................................................... 75
Figure 3-10 Cement hydration kinetics deduced from calorimetric data and final heat of
hydration ...................................................................................................................... 75
Figure 3-11 Normalised kinetics developed from cement hydration kinetics .................................. 76
Figure 3-12 FLIR E60bx thermal imaging camera used for sprayed concrete monitoring .............. 76
Figure 3-13 Sprayed concrete strength development and temperature evolution histories developed
from panel testing ......................................................................................................... 77
Figure 3-14 Hydration modelling of sprayed concrete using temperature evolution histories ......... 77
Figure 3-15 Strength - maturity relationship for sprayed concrete ................................................... 78
Figure 3-16 Application of sprayed concrete strength – maturity relationship demanding
relationship re-evaluation for first three hours of age .................................................. 78
Figure 3-17 Longitudinal section of sprayed concrete lining thermal monitoring ........................... 79
Figure 3-18 Cross-section for sprayed concrete lining thermal imaging .......................................... 80
Figure 3-19 Whitechapel station construction layout (Picture courtesy BBMV) showing test
panels’ spray locations ................................................................................................. 81
Figure 3-20 Meyco Potenza (picture courtesy www.tunneltalk.com) .............................................. 82
Figure 3-21 Whitechapel station sprayed concrete panel testing and thermal monitoring ............... 83
Figure 3-22 3D layout of existing and new upgrade works for Bond Street Station Upgrade (BSSU)
site (Picture courtesy Dr Sauer and Partners)............................................................... 84
Figure 3-23 Meyco Oruga (picture courtesy www.tunneltalk.com) ................................................. 85
Figure 3-24 A dimensional comparison of wooden formwork used for test panels used for BSSU
thermo-mechanical evaluation with a site engineer ..................................................... 86
Figure 4-1 Rate of heat release histories for WC1 paste ................................................................ 107
Figure 4-2 Heat of hydration histories for WC1 paste.................................................................... 107
Figure 4-3 Rate of heat release histories for WC2 paste ................................................................ 108
Figure 4-4 Heat of hydration histories for WC2 paste.................................................................... 108
Figure 4-5 Rate of heat release histories for WC3 paste ................................................................ 109
Figure 4-6 Heat of hydration histories for WC3 paste.................................................................... 109

xvi
Figure 4-7 Rate of heat release histories for WC4 paste ................................................................ 110
Figure 4-8 Heat of hydration histories for WC4 paste.................................................................... 110
Figure 4-9 Rate of heat release vs heat of hydration for WC1 paste .............................................. 111
Figure 4-10 Normalised rate of heat release vs heat of hydration for WC1 paste .......................... 111
Figure 4-11 Rate of heat release vs heat of hydration for WC2 paste ............................................ 112
Figure 4-12 Normalised rate of heat release vs heat of hydration for WC2 paste .......................... 112
Figure 4-13 Rate of heat release vs heat of hydration for WC3 paste ............................................ 113
Figure 4-14 Normalised rate of heat release vs heat of hydration for WC3 paste .......................... 113
Figure 4-15 Rate of heat release vs heat of hydration for WC4 paste ............................................ 114
Figure 4-16 Normalised rate of heat release vs heat of hydration for WC4 paste .......................... 114
Figure 4-17 Thermogravimetric weight loss for anhydrous cement and microsilica powder ........ 115
Figure 4-18 Weight loss assessment of anhydrous powder on ignited mass basis ......................... 115
Figure 4-19 Thermogravimetric weight loss profile for admixtures .............................................. 116
Figure 4-20 Theoretical weight loss correction profile of initial solid mass on ignited mass
basis ............................................................................................................................ 116
Figure 4-21 Weight loss assessment for WC2 pastes cured at 20°C .............................................. 117
Figure 4-22 Weight loss assessment for WC1 pastes cured at 20°C .............................................. 117
Figure 4-23 Weight loss assessment for WC3 pastes cured at 20°C .............................................. 118
Figure 4-24 Weight loss assessment for WC4 pastes cured at 20°C .............................................. 118
Figure 4-25 Final heat of hydration estimation for WC1 paste ...................................................... 119
Figure 4-26 Calorimetric vs thermogravimetric degree of hydration for WC1 paste ..................... 119
Figure 4-27 Degree of hydration development history for WC1 paste cured at 20°C ................... 120
Figure 4-28 Normalised kinetic curves for WC1 paste .................................................................. 120
Figure 4-29 Final heat of hydration estimation for WC2 paste ...................................................... 121
Figure 4-30 Calorimetric vs thermogravimetric degree of hydration for WC2 paste ..................... 121
Figure 4-31 Degree of hydration development history for WC2 paste at 20°C ............................. 122
Figure 4-32 Normalised kinetic curves for WC2 paste .................................................................. 122
Figure 4-33 Final heat of hydration estimation for WC3 paste ...................................................... 123
Figure 4-34 Calorimetric vs thermogravimetric degree of hydration for WC3 paste ..................... 123

xvii
Figure 4-35 Degree of hydration development history for WC3 paste cured at 20°C ................... 124
Figure 4-36 Normalised kinetic curves for WC3 paste .................................................................. 124
Figure 4-37 Final heat of hydration estimation for WC4 paste ...................................................... 125
Figure 4-38 Thermogravimetric vs corrected calorimetric degree of hydration for WC4 paste .... 125
Figure 4-39 Degree of hydration development history for WC4 paste cured at 20°C ................... 126
Figure 4-40 Normalised kinetic curves for WC4 paste .................................................................. 126
Figure 4-41 Activation energy determination for WC1 paste ........................................................ 127
Figure 4-42 Variable activation energy profile for WC1 paste ...................................................... 127
Figure 4-43 Activation energy determination for WC2 paste ........................................................ 128
Figure 4-44 Variable activation energy profile for WC2 paste ...................................................... 128
Figure 4-45 Activation energy determination for WC3 paste ........................................................ 129
Figure 4-46 Variable activation energy profile for WC3 paste ...................................................... 129
Figure 4-47 Activation energy determination for WC4 paste ........................................................ 130
Figure 4-48 Variable activation energy profile for WC4 paste ...................................................... 130
Figure 4-49 Realigned WC4 normalised kinetic curves for variable activation energy
evaluation ................................................................................................................... 131
Figure 4-50 Re-evaluated activation energy profiles of WC3 and WC4 pastes ............................. 131
Figure 4-51 Measured and calculated hydration rates for WC1 paste using 20°C normalised
curve ........................................................................................................................... 132
Figure 4-52 Measured and calculated degree of hydration development for WC1 paste using 20°C
normalised curve ........................................................................................................ 132
Figure 4-53 Measured and calculated hydration rates for WC4 paste using 20°C normalised
curve ........................................................................................................................... 133
Figure 4-54 Measured and calculated degree of hydration development for WC4 paste using 20°C
normalised curve ........................................................................................................ 133
Figure 4-55 Extended view of normalised kinetic curves for WC4 paste ...................................... 134
Figure 4-56 Measured and calculated degree of hydration development for WC4 paste using
temperature specific normalised curve ....................................................................... 134
Figure 4-57 Degree of hydration development modelling under non-isothermal conditions ......... 135

xviii
Figure 5-1 Panel Set 1 – Strength and temperature histories (Zones Z1 and Z2 represent the
strength estimates obtained through the penetrometer and the standard stud-driving
methods, respectively) ............................................................................................... 147
Figure 5-2 Panel Set 1 – modelled rate of hydration and degree of hydration development.......... 147
Figure 5-3 Panel Set 2 – Strength and temperature histories (Zones Z1 and Z2 represent the
strength estimates obtained through the penetrometer and the standard stud-driving
methods, respectively) ............................................................................................... 148
Figure 5-4 Panel Set 2 – modelled rate of hydration and degree of hydration development.......... 148
Figure 5-5 Panel Set 3 – Strength and temperature histories (Zones Z1 and Z2 represent the
strength estimates obtained through the penetrometer and the standard stud-driving
methods, respectively) ............................................................................................... 149
Figure 5-6 Panel Set 3 – modelled rate of hydration and degree of hydration development.......... 149
Figure 5-7 Panel Set 4 – Strength and temperature histories (Zone Z2 represents the strength
estimates obtained through the standard stud-driving method) ................................. 150
Figure 5-8 Panel Set 4 – modelled rate of hydration and degree of hydration development.......... 150
Figure 5-9 Panel Set 5 – Strength and temperature histories (Zones Z1 and Z2 represent the
strength estimates obtained through the penetrometer and the standard stud-driving
methods, respectively) ............................................................................................... 151
Figure 5-10 Panel Set 5 – modelled rate of hydration and degree of hydration development........ 151
Figure 5-11 Panel Set 6 – Strength and temperature histories (Zones Z1 and Z2 represent the
strength estimates obtained through the penetrometer and the standard stud-driving
methods, respectively) ............................................................................................... 152
Figure 5-12 Panel Set 6 – modelled rate of hydration and degree of hydration development........ 152
Figure 5-13 Panel Set 7 – Strength and temperature histories (Zones Z2 and Z3 represent the
strength estimates obtained through the standard and special stud-driving methods,
respectively) ............................................................................................................... 153
Figure 5-14 Panel Set 7 – modelled rate of hydration and degree of hydration development........ 153
Figure 5-15 Panel Set 8 – Strength and temperature histories (Zones Z1, Z2, and Z3 represent the
strength estimates obtained through the penetrometer, the standard stud-driving, and
the special stud-driving methods, respectively) ......................................................... 154
Figure 5-16 Panel Set 8 – modelled rate of hydration and degree of hydration development........ 154

xix
Figure 5-17 Strength vs hydration panel data from all panel sets (Zones Z1, Z2, and Z3 represent
the strength estimates obtained through the penetrometer, the standard stud-driving,
and the special stud-driving methods, respectively) .................................................. 155
Figure 5-18 Linear relationship using non-erroneous strength – hydration data ............................ 155
Figure 5-19 Linear relationship using excluding penetrometer data .............................................. 156
Figure 5-20 Linear relationship for accelerated set phase using penetrometer strength data ......... 156
Figure 5-21 Linear relationship for rapid hardening phase using stud-driving strength data ......... 157
Figure 5-22 Linear relationship for standard strength development phase ..................................... 157
Figure 5-23 Elliptical transition T1 between R1 and R2 ................................................................ 158
Figure 5-24 Elliptical transition T2 between R2 and R3 ................................................................ 158
Figure 5-25 Multi-segmented strength – hydration relationship for Mix P1 .................................. 159
Figure 5-26 Real-time strength development modelling for Panel Set 1........................................ 159
Figure 5-27 Sprayed concrete lining (SCL) strength development monitoring approach .............. 160
Figure 5-28 Strength development modelling for sprayed concrete lining (Panel Set 5) ............... 160
Figure 6-1 Rate of heat release for plain pastes at 20°C isothermal curing .................................... 177
Figure 6-2 Heat of hydration for plain pastes at 20°C isothermal curing ....................................... 177
Figure 6-3 Rate of heat release for mix pastes at 20°C isothermal curing ..................................... 178
Figure 6-4 Heat of hydration for mix pastes at 20°C isothermal curing ......................................... 178
Figure 6-5 Thermogravimetric weight loss profile of anhydrous cementitious materials .............. 179
Figure 6-6 Thermogravimetric weight loss profiles of admixtures ................................................ 179
Figure 6-7 Theoretical weight loss baseline for plain pastes .......................................................... 180
Figure 6-8 Theoretical weight loss baseline for mix pastes............................................................ 180
Figure 6-9 Thermogravimetric weight loss profiles of (a) BS1P paste, (b) BS2P paste, (c) BS3P
paste, and (d) BS4P paste ........................................................................................... 181
Figure 6-10 Thermogravimetric weight loss profiles of (a) BS1M paste, (b) BS2P M pastes, (c)
BS3M paste, and (d) BS4M paste .............................................................................. 182
Figure 6-11 Final heat of hydration determination for (a) BS1P paste, (b) BS2P paste, (c) BS3P
paste, and (d) BS4P paste ........................................................................................... 183
Figure 6-12 Final heat of hydration determination for (a) BS1M paste, (b) BS2M paste, (c) BS3M
paste, and (d) BS4M paste ......................................................................................... 184
Figure 6-13 Summary of final heat of hydration for Bond St cement pastes ................................. 185

xx
Figure 6-14 Final heat of hydration for Whitechapel and Bond St samples ................................... 185
Figure 6-15 Calorimetric degree of hydration curves for (a) BS1P paste, (b) BS2P paste, (c) BS3P
paste, and (d) BS4P paste cured at 20°C .................................................................... 186
Figure 6-16 Degree of hydration curves for (a) BS1M paste, (b) BS2M paste, (c) BS3M paste, and
(d) BS4M paste cured at 20°C ................................................................................... 187
Figure 6-17 Normalised kinetics for plain pastes at 20°C .............................................................. 188
Figure 6-18 Normalised kinetics for mix pastes at 20°C ................................................................ 188
Figure 6-19 Normalised kinetics for BS1P paste ........................................................................... 189
Figure 6-20 Normalised kinetics for BS2P paste ........................................................................... 189
Figure 6-21 Normalised kinetics for BS3P paste ........................................................................... 190
Figure 6-22 Normalised kinetics for BS4P paste ........................................................................... 190
Figure 6-23 Normalised kinetics for BS1M paste .......................................................................... 191
Figure 6-24 Normalised kinetics for BS2M paste .......................................................................... 191
Figure 6-25 Normalised kinetics for BS3M paste .......................................................................... 192
Figure 6-26 Normalised kinetics for BS4M paste .......................................................................... 192
Figure 6-27 20°C normalised kinetics comparative of Whitechapel and Bond St cement
samples ....................................................................................................................... 193
Figure 6-28 20°C normalised kinetics comparative of Whitechapel and Bond St admixed
samples ....................................................................................................................... 193
Figure 6-29 Summary of activation energy determined using peak hydration rate ........................ 194
Figure 6-30 Instantaneous activation energy for Whitechapel and Bond St cement samples ........ 194
Figure 6-31 Summary of varying activation energy profiles .......................................................... 195
Figure 6-32 Instantaneous activation energy for Whitechapel and Bond St mixes ........................ 195
Figure 6-33 Panel Set 1 – Strength and temperature histories (Zones S1, S2, S3, and S4 represent
strength estimates obtained using the penetrometer, standard stud-driving, special
stud-driving method, and core testing, respectively) ................................................. 196
Figure 6-34 Panel Set 1 – Modelled rate of hydration and degree of hydration development ....... 196
Figure 6-35 Panel Set 2 – Strength and temperature histories (Zones S1, S2, S3, and S4 represent
strength estimates obtained using the penetrometer, standard stud-driving, special
stud-driving method, and core testing, respectively) ................................................. 197
Figure 6-36 Panel Set 2 – Modelled rate of hydration and degree of hydration development ....... 197

xxi
Figure 6-37 Panel Set 3 – Strength and temperature histories (Zones S1, S2, S3, and S4 represent
strength estimates obtained using the penetrometer, standard stud-driving, special
stud-driving method, and core testing, respectively) ................................................. 198
Figure 6-38 Panel Set 3 – Modelled rate of hydration and degree of hydration development ....... 198
Figure 6-39 Strength – hydration relationship – Preliminary analysis (Zones S1, S2, S3, and S4
represent strength estimates obtained using the penetrometer, standard stud-driving,
special stud-driving method, and core testing, respectively) ..................................... 199
Figure 6-40 Strength – hydration relationship (up to dormancy trough) ........................................ 199
Figure 6-41 Strength – hydration relationship R2 for accepted post dormancy data ..................... 200
Figure 6-42 Strength – hydration relationship – Transition T1 between R1 and R2 ...................... 200
Figure 6-43 Multi-segmented strength – hydration relationship (R1-T1-R2) ................................ 201
Figure 6-44 Comparison of modelled and measured strength – Panel Set 1 .................................. 201
Figure 6-45 Comparison of modelled and measured strength – Panel Set 2 .................................. 202
Figure 6-46 Comparison of modelled and measured strength – Panel Set 3 .................................. 202
Figure 6-47 BS4P comparison with reformulated WC4 paste ....................................................... 203
Figure 6-48 Bond St and Whitechapel strength-hydration relationship comparison ...................... 203
Figure 6-49 Post-calibration strength testing of sprayed concrete at Bond St (Zones S1, S2, S3
represent strength estimates obtained using the penetrometer, standard stud-driving,
and special stud-driving method, respectively) .......................................................... 204
Figure 6-50 Calibration strength testing of sprayed concrete at Bond St (Zones S1, S2, S3 represent
strength estimates obtained using the penetrometer, standard stud-driving, and special
stud-driving method, respectively) ............................................................................. 204
Figure 6-51 Post-calibration panel strength testing and modelling ................................................ 205
Figure 6-52 Post-calibration lining strength testing and modelling ............................................... 205
Figure 6-53 Data with Bond St and Whitechapel strength-hydration relationship ......................... 206
Figure A1-1 Thermogravimetric weight loss profiles for WC1 paste at 10°C ............................... 227
Figure A1-2 Thermogravimetric weight loss profiles for WC1 paste at 30°C ............................... 227
Figure A1-3 Thermogravimetric weight loss profiles for WC1 paste at 40°C ............................... 228
Figure A1-4 Thermogravimetric weight loss profiles for WC2 paste at 10°C ............................... 228
Figure A1-5 Thermogravimetric weight loss profiles for WC2 paste at 30°C ............................... 229

xxii
Figure A1-6 Thermogravimetric weight loss profiles for WC2 paste at 40°C ............................... 229
Figure A1-7 Thermogravimetric weight loss profiles for WC3 paste at 10°C ............................... 230
Figure A1-8 Thermogravimetric weight loss profiles for WC3 paste at 30°C ............................... 230
Figure A1-9 Thermogravimetric weight loss profiles for WC3 paste at 40°C ............................... 231
Figure A1-10 Thermogravimetric weight loss profiles for WC4 paste at 10°C ............................. 231
Figure A1-11 Thermogravimetric weight loss profiles for WC4 paste at 30°C ............................. 232
Figure A1-12 Thermogravimetric weight loss profiles for WC4 paste at 40°C ............................. 232
Figure A4-1 Degree of hydration development – WC1 paste at 10°C ........................................... 237
Figure A4-2 Degree of hydration development – WC1 paste at 30°C ........................................... 237
Figure A4-3 Degree of hydration development – WC1 paste at 40°C ........................................... 238
Figure A4-4 Degree of hydration development – WC2 paste at 10°C ........................................... 238
Figure A4-5 Degree of hydration development – WC2 paste at 30°C ........................................... 239
Figure A4-6 Degree of hydration development – WC2 paste at 40°C ........................................... 239
Figure A4-7 Degree of hydration development – WC3 paste at 10°C ........................................... 240
Figure A4-8 Degree of hydration development – WC3 paste at 30°C ........................................... 240
Figure A4-9 Degree of hydration development – WC3 paste at 40°C ........................................... 241
Figure A4-10 Degree of hydration development – WC4 paste at 10°C ......................................... 241
Figure A4-11 Degree of hydration development – WC4 paste at 30°C ......................................... 242
Figure A4-12 Degree of hydration development – WC4 paste at 40°C ......................................... 242
Figure A8-1 Strength modelling – Panel Set 2 ............................................................................... 255
Figure A8-2 Strength modelling – Panel Set 3 ............................................................................... 255
Figure A8-3 Strength modelling – Panel Set 4 ............................................................................... 256
Figure A8-4 Strength modelling – Panel Set 5 ............................................................................... 256
Figure A8-5 Strength modelling – Panel Set 6 ............................................................................... 257
Figure A8-6 Strength modelling – Panel Set 7 ............................................................................... 257
Figure A8-7 Strength modelling – Panel Set 8 ............................................................................... 258
Figure A10-1 Strength modelling – Section 1 (corresponding to Panel Set 2) .............................. 263
Figure A10-2 Strength modelling – Section 2 (corresponding to Panel Set 3) .............................. 263
Figure A10-3 Strength modelling – Section 3 (corresponding to Panel Set 4) .............................. 264

xxiii
Figure A10-4 Strength modelling – Section 5 (corresponding to Panel Set 6) .............................. 264
Figure A10-5 Strength modelling – Section 6 (corresponding to Panel Set 7) .............................. 265
Figure A10-6 Strength modelling – Section 7 (corresponding to Panel Set 8) .............................. 265
Figure B1-1 Rate of heat release histories – BS1P paste ................................................................ 267
Figure B1-2 Heat of hydration histories – BS1P paste ................................................................... 267
Figure B1-3 Rate of heat release histories – BS2P paste ................................................................ 268
Figure B1-4 Heat of hydration histories – BS2P paste ................................................................... 268
Figure B1-5 Rate of heat release histories – BS3P paste ................................................................ 269
Figure B1-6 Heat of hydration histories – BS3P paste ................................................................... 269
Figure B1-7 Rate of heat release histories – BS4P paste ................................................................ 270
Figure B1-8 Heat of hydration histories – BS4P paste ................................................................... 270
Figure B1-9 Rate of heat release histories – BS1M paste .............................................................. 271
Figure B1-10 Heat of hydration histories – BS1M paste................................................................ 271
Figure B1-11 Rate of heat release histories – BS2M paste ............................................................ 272
Figure B1-12 Heat of hydration histories – BS2M paste................................................................ 272
Figure B1-13 Rate of heat release histories – BS3M paste ............................................................ 273
Figure B1-14 Heat of hydration histories – BS3M paste................................................................ 273
Figure B1-15 Rate of heat release histories – BS4M paste ............................................................ 274
Figure B1-16 Heat of hydration histories – BS4M paste................................................................ 274
Figure B2-1 Thermogravimetric weight loss profiles for BS1P paste at 10°C............................... 275
Figure B2-2 Thermogravimetric weight loss profiles for BS1P paste at 30°C............................... 275
Figure B2-3 Thermogravimetric weight loss profiles for BS1P paste at 40°C............................... 276
Figure B2-4 Thermogravimetric weight loss profiles for BS2P paste at 10°C............................... 276
Figure B2-5 Thermogravimetric weight loss profiles for BS2P paste at 30°C............................... 277
Figure B2-6 Thermogravimetric weight loss profiles for BS2P paste at 40°C............................... 277
Figure B2-7 Thermogravimetric weight loss profiles for BS3P paste at 10°C............................... 278
Figure B2-8 Thermogravimetric weight loss profiles for BS3P paste at 30°C............................... 278
Figure B2-9 Thermogravimetric weight loss profiles for BS3P paste at 40°C............................... 279
Figure B2-10 Thermogravimetric weight loss profiles for BS4P paste at 10°C ............................ 279

xxiv
Figure B2-11 Thermogravimetric weight loss profiles for BS4P paste at 30°C ............................ 280
Figure B2-12 Thermogravimetric weight loss profiles for BS4P paste at 40°C ............................ 280
Figure B2-13 Thermogravimetric weight loss profiles for BS1M paste at 10°C ........................... 281
Figure B2-14 Thermogravimetric weight loss profiles for BS1M paste at 30°C ........................... 281
Figure B2-15 Thermogravimetric weight loss profiles for BS1M paste at 40°C ........................... 282
Figure B2-16 Thermogravimetric weight loss profiles for BS2M paste at 10°C ........................... 282
Figure B2-17 Thermogravimetric weight loss profiles for BS2M paste at 30°C ........................... 283
Figure B2-18 Thermogravimetric weight loss profiles for BS2M paste at 40°C ........................... 283
Figure B2-19 Thermogravimetric weight loss profiles for BS3M paste at 10°C ........................... 284
Figure B2-20 Thermogravimetric weight loss profiles for BS3M paste at 30°C ........................... 284
Figure B2-21 Thermogravimetric weight loss profiles for BS3M paste at 40°C ........................... 285
Figure B2-22 Thermogravimetric weight loss profiles for BS4M paste at 10°C ........................... 285
Figure B2-23 Thermogravimetric weight loss profiles for BS4M paste at 30°C ........................... 286
Figure B2-24 Thermogravimetric weight loss profiles for BS4M paste at 40°C ........................... 286
Figure B5-1 Degree of hydration development history of BS1P paste at 10°C ............................. 291
Figure B5-2 Degree of hydration development history of BS1P paste at 30°C ............................. 291
Figure B5-3 Degree of hydration development history of BS1P paste at 40°C ............................. 292
Figure B5-4 Degree of hydration development history of BS2P paste at 10°C ............................. 292
Figure B5-5 Degree of hydration development history of BS2P paste at 30°C ............................. 293
Figure B5-6 Degree of hydration development history of BS2P paste at 40°C ............................. 293
Figure B5-7 Degree of hydration development history of BS3P paste at 10°C ............................. 294
Figure B5-8 Degree of hydration development history of BS3P paste at 30°C ............................. 294
Figure B5-9 Degree of hydration development history of BS3P paste at 40°C ............................. 295
Figure B5-10 Degree of hydration development history of BS4P paste at 10°C ........................... 295
Figure B5-11 Degree of hydration development history of BS4P paste at 30°C ........................... 296
Figure B5-12 Degree of hydration development history of BS4P paste at 40°C ........................... 296
Figure B5-13 Degree of hydration development history of BS1M paste at 10°C .......................... 297
Figure B5-14 Degree of hydration development history of BS1M paste at 30°C .......................... 297
Figure B5-15 Degree of hydration development history of BS1M paste at 40°C .......................... 298

xxv
Figure B5-16 Degree of hydration development history of BS2M paste at 10°C .......................... 298
Figure B5-17 Degree of hydration development history of BS2M paste at 30°C .......................... 299
Figure B5-18 Degree of hydration development history of BS2M paste at 40°C .......................... 299
Figure B5-19 Degree of hydration development history of BS3M paste at 10°C .......................... 300
Figure B5-20 Degree of hydration development history of BS3M paste at 30°C .......................... 300
Figure B5-21 Degree of hydration development history of BS3M paste at 40°C .......................... 301
Figure B5-22 Degree of hydration development history of BS4M paste at 10°C .......................... 301
Figure B5-23 Degree of hydration development history of BS4M paste at 30°C .......................... 302
Figure B5-24 Degree of hydration development history of BS4M paste at 40°C .......................... 302


xxvii
List of Tables
Table 2-1 Typical steel fibre reinforced sprayed concrete mix (wet process) .................................. 37
Table 2-2 Typical oxide and clinker content for CEM I................................................................... 37
Table 2-3 Typical properties of sprayed concrete (Thomas, 2008) .................................................. 37
Table 2-4: Heat of hydration for pure compounds of cement clinkers (Lerch and Bogue, 1934) .... 37
Table 2-5 Weight loss of cement paste with increase in temperature (Alarcon-Ruiz et al., 2005) .. 38
Table 2-6 Typical SCL tests and related scope for urban tunnels .................................................... 38
Table 3-1 Sprayed concrete mix at Whitechapel Station SCL works ............................................... 69
Table 3-2 Cement paste ingredients – Whitechapel Station ............................................................. 69
Table 3-3 Sprayed concrete mix at Bond Street Station Upgrade SCL works ................................. 69
Table 3-4 Cement paste ingredients – Bond St station upgrade ....................................................... 70
Table 4-1 Rate of heat release (dQ/dt) and heat of hydration (Q) for WC1 paste .......................... 105
Table 4-2 Rate of heat release (dQ/dt) and heat of hydration (Q) for WC2 paste .......................... 105
Table 4-3 Rate of heat release (dQ/dt) and heat of hydration (Q) for WC3 paste .......................... 105
Table 4-4 Rate of heat release (dQ/dt) and heat of hydration (Q) for WC4 paste .......................... 105
Table 4-5 Weight loss profiles at the different temperatures .......................................................... 106
Table 4-6 Heat and degree of hydration corrections....................................................................... 106
Table 4-7 Normalised kinetics (Nk) curve characteristics for WC4 pastes ..................................... 106
Table 4-8 Hydration modelling parameters for different pastes ..................................................... 106
Table 6-1 Peak rate of hydration obtained from isothermal calorimetric testing of plain pastes ... 175
Table 6-2 Peak rate of hydration obtained from isothermal calorimetric testing of mix pastes ..... 175
Table 6-3 Thermogravimetric weight loss profiles of cement paste ingredients at key
temperatures ............................................................................................................... 175
Table 6-4 Correction for the plain pastes ....................................................................................... 176
Table 6-5 Correction for mix pastes ............................................................................................... 176
Table 6-6 Hydration modelling parameters for plain pastes ........................................................... 176
Table 6-7 Hydration modelling parameters for mix pastes ............................................................ 176

xxviii
Table A2-1 Non-evaporable water content and degree of hydration estimates for WC1 paste ...... 233
Table A2-2 Non-evaporable water content and degree of hydration estimates for WC2 paste ...... 233
Table A2-3 Non-evaporable water content and degree of hydration estimates for WC3 paste ...... 233
Table A2-4 Non-evaporable water content and degree of hydration estimates for WC4 paste ...... 234
Table A3-1 Measured heat of hydration values – WC1 paste ........................................................ 235
Table A3-2 Measured heat of hydration values – WC2 paste ........................................................ 235
Table A3-3 Measured heat of hydration values – WC3 paste ........................................................ 235
Table A3-4 Measured heat of hydration values – WC4 paste ........................................................ 236
Table A5-1 Normalised kinetic curve characteristics – WC1 pastes .............................................. 243
Table A5-2 Normalised kinetic curve characteristics – WC2 pastes .............................................. 243
Table A5-3 Normalised kinetic curve characteristics – WC3 pastes .............................................. 243
Table A6-1 Temperature histories – Panel Set 1 ............................................................................ 245
Table A6-2 Temperature histories – Panel Set 2 ............................................................................ 246
Table A6-3 Temperature histories – Panel Set 3 ............................................................................ 247
Table A6-4 Temperature histories – Panel Set 4 ............................................................................ 247
Table A6-5 Temperature histories – Panel Set 5 ............................................................................ 248
Table A6-6 Temperature histories – Panel Set 6 ............................................................................ 248
Table A6-7 Temperature histories – Panel Set 7 ............................................................................ 249
Table A6-8 Temperature histories – Panel Set 8 ............................................................................ 250
Table A7-1 Panel Set 1 – In-situ strength (fc,in-situ) .......................................................................... 251
Table A7-2 Panel Set 1 – Modelled degree of hydration (model) ................................................... 251
Table A7-3 Panel Set 2 – In-situ strength (fc,in-situ) .......................................................................... 251
Table A7-4 Panel Set 2 – Modelled degree of hydration (model) ................................................... 251
Table A7-5 Panel Set 3 – In-situ strength (fc,in-situ) .......................................................................... 252
Table A7-6 Panel Set 3 – Modelled degree of hydration (model) ................................................... 252
Table A7-7 Panel Set 4 – In-situ strength (fc,in-situ) .......................................................................... 252
Table A7-8 Panel Set 4 –Modelled degree of hydration (model) .................................................... 252
Table A7-9 Panel Set 5 – In-situ compressive strength (fc,in-situ) ..................................................... 252

xxix
Table A7-10 Panel Set 5 – Modelled degree of hydration (model) ................................................. 253
Table A7-11 Panel Set 6 – In-situ compressive strength (fc,in-situ) ................................................... 253
Table A7-12 Panel Set 6 – Modelled degree of hydration (model) ................................................. 253
Table A7-13 Panel Set 7 – In-situ compressive strength (fc,in-situ) ................................................... 253
Table A7-14 Panel Set 7 – Modelled degree of hydration (model) ................................................. 254
Table A7-15 Panel Set 8 – In-situ compressive strength (fc,in-situ) ................................................... 254
Table A7-16 Panel Set 8 – Modelled degree of hydration (model) ................................................. 254
Table A9-1 Temperature histories – Lining Section 1 ................................................................... 259
Table A9-2 Temperature histories – Lining Section 2 ................................................................... 259
Table A9-3 Temperature histories – Lining Section 3 ................................................................... 260
Table A9-4 Temperature histories – Lining Section 4 ................................................................... 260
Table A9-5 Temperature histories – Lining Section 5 ................................................................... 261
Table A9-6 Temperature histories – Lining Section 6 ................................................................... 261
Table A9-7 Temperature histories – Lining Section 7 ................................................................... 262
Table B3-1 Thermogravimetric degree of hydration estimates for BS1P paste ............................. 287
Table B3-2 Thermogravimetric degree of hydration () estimates for BS2P paste ....................... 287
Table B3-3 Thermogravimetric degree of hydration estimates for BS3P paste ............................. 287
Table B3-4 Thermogravimetric degree of hydration estimates for BS4P paste ............................. 287
Table B3-5 Thermogravimetric degree of hydration estimates for BS1M paste ............................ 288
Table B3-6 Thermogravimetric degree of hydration estimates for BS2M paste ............................ 288
Table B3-7 Thermogravimetric degree of hydration estimates for BS3M paste ............................ 288
Table B3-8 Thermogravimetric degree of hydration estimates for BS4M paste ............................ 288
Table B4-1 Measured heat of hydration values – BS1P paste ........................................................ 289
Table B4-2 Measured heat of hydration values – BS2P paste ........................................................ 289
Table B4-3 Measured heat of hydration values – BS3P paste ........................................................ 289
Table B4-4 Measured heat of hydration values – BS4P paste ........................................................ 289
Table B4-5 Measured heat of hydration values – BS1M paste ...................................................... 290
Table B4-6 Measured heat of hydration values – BS2M paste ...................................................... 290
Table B4-7 Measure heat of hydration values – BS3M paste ........................................................ 290

xxx
Table B4-8 Measured heat of hydration values – BS4M paste ...................................................... 290
Table B6-1 Normalised kinetics characteristics – BS1P paste ....................................................... 303
Table B6-2 Normalised kinetics characteristics – BS2P paste ....................................................... 303
Table B6-3 Normalised kinetics characteristics – BS3P paste ....................................................... 304
Table B6-4 Normalised kinetics characteristics – BS4P paste ....................................................... 304
Table B6-5 Normalised kinetics characteristics – BS1M paste ...................................................... 304
Table B6-6 Normalised kinetics characteristics – BS2M paste ...................................................... 305
Table B6-7 Normalised kinetics characteristics – BS3M paste ...................................................... 305
Table B6-8 Normalised kinetics characteristics – BS4M paste ...................................................... 305
Table B7-1 Calibration strength testing – Panel Set 1 .................................................................... 307
Table B7-2 Calibration strength testing – Panel Set 2 .................................................................... 307
Table B7-3 Calibration strength testing – Panel Set 3 .................................................................... 308
Table B8-1 Temperature histories – Panel Set 1 ............................................................................ 309
Table B8-2 Temperature histories – Panel Set 2 ............................................................................ 310
Table B8-3 Temperature histories – Panel Set 3 ............................................................................ 311
Table B9-1 Degree of hydration estimates for Panel Set 1 ............................................................. 313
Table B9-2 Degree of hydration estimates for Panel Set 2 ............................................................. 313
Table B9-3 Degree of hydration estimates for Panel Set 3 ............................................................. 313

1
1 Introduction
1.1 General scope
Underground spaces have been in use for thousands of years to meet various requirements,
such as resource mining, dwelling, or infrastructure. Underground infrastructure comes in different
forms – transportation (such as highways and railways), conveyance (such as hydropower, sewage,
storm water, and pipelines), and storage caverns (such as petroleum or natural gas). There are two
approaches for creating an underground space, namely open excavation and closed excavation. The
open excavation approach leads to infrastructure buried at shallow depths, such as water pipelines
and utility cables, and the closed excavation approach leads to infrastructure installed at shallow or
significant depths, such as sewage tunnels and urban rail tunnels. Both methods have their own
ground support requirements. Various types of geotechnical support systems have been developed
and are prescribed as required. Concrete, in different names, tends to find its place in the
geotechnical support systems, as precast concrete, cast in situ concrete, backfill concrete, or
sprayed concrete. It may be plain, fibre reinforced, or bar or mesh reinforced. One such
classification is the sprayed concrete and finds its use in both of the excavation approaches. This
research work investigates the early age strength development of sprayed concrete when used as a
closed excavation support measure, with a specific focus on tunnels, and explores a non-
destructive testing approach for its early age strength monitoring.
1.2 Research motivation
With its flexibility of application, sprayed concrete is a useful support measure for soft-
ground tunnelling, especially for the tunnels with varying cross-sections. Since soft ground
excavations often have a short stand-up time, the sprayed concrete requires sufficient strength
development since the time of spray to prevent instability. The immediate strength development is
achieved by using measures such as chemical accelerators with further strength development
rigorously monitored during its early age. Current early age strength monitoring methods (such as
penetrometer and stud-driving tests) are of destructive type, provide localised results, pose safety
challenges, and do not account for the impact of curing temperatures.
The ‘maturity method’ is a well-established non-destructive approach for early age strength
monitoring of concrete. The maturity method assesses the impact of temperature on concrete
maturity and correlates it with the strength development (Plowman, 1956; Lew and Reichard,

2
1978). As sprayed concrete is also a type of concrete, this approach may be valid, but has been
rarely attempted.
To implement this method to the large-scale sprayed concrete lining structures, a thermal
monitoring device with the capability of measuring temperatures remotely and covering large
surface areas is necessary. A non-contact infrared thermal imaging camera is useful for this
purpose. One such application of the infrared thermal monitoring for non-destructive strength
monitoring of the sprayed concrete lining was first proposed by Jones (2015)1 with its feasibility
demonstrated in a paper by Jones and Li (2013). In their work, Jones and Li (2013) demonstrated
the application of the thermal imaging technique on the sprayed concrete (Figure 1-1) and the use
of an Arrhenius equation based maturity function to model the strength (Figure 1-2). Although
Jones and Li (2013) used the maturity function input parameter values from the literature of
Hellmich et al. (1999), they recognised the need for establishing the sprayed concrete mix specific
input parameters. This need serves as the motivation for this research work.
1.3 Research scope
The research aims to apply the maturity method for the non-destructive strength assessment
of sprayed concrete, and requires the development of an experimental methodology for thermo-
chemo-mechanical evaluation of the sprayed concrete. The research work is divided into two steps
– a) thermo-chemical evaluation of sprayed concrete mix based cement pastes; and b) thermo-
mechanical evaluation of sprayed concrete works.
The thermo-chemical evaluation involves performing isothermal calorimetry and
thermogravimetric testing to establish the maturity function input values. The thermo-mechanical
evaluation involves the sprayed concrete strength testing and the thermal monitoring of the sprayed
concrete to establish the strength – maturity relationship. The general framework of the thermo-
mechanical evaluation remains the same as set out in the works of Jones and Li (2013) and Jones et
al. (2014). The thermo-chemo-mechanical evaluation methodology is validated through two case
studies.
1.4 Thesis Outline
This research work is divided into seven chapters. Chapter 1 is an introduction to the
research motivation and scope. Chapter 2 provides a detailed literature review on sprayed concrete
as a building material, maturity method, experimental deterimination of maturity function input
parameters, and the strength testing methods for young sprayed concrete. The final section of
Chapter 2 provides a background to the thermal imaging technique and its typical applications.
Chapter 3 focuses on detailing the adopted research methodology, testing programme and
analysis approach. The main phases include laboratory testing of cement paste and on-site testing
1 Initially filed with Intellectual Property Office in July, 2013 under Patent application no. GB1312750.1.

3
of sprayed concrete for establishing the maturity development and the strength – maturity
relationship, respectively. The methodology also introduces two case studies, Whitechapel Station
and Bond Street Station Upgrade sprayed concrete works, undertaken in this research.
Chapter 4 presents the thermo-chemical evaluation of the cement pastes based on the
Whitechapel Station sprayed concrete mix. The outcomes include heat of hydration, activation
energy, affinity constant and normalised kinetics of the cement paste. It also includes a discussion
of the thermo-chemo modelling procedure to assess the degree of hydration development of the
sprayed concrete.
Chapter 5 presents the thermo-mechanical evaluation of the strength and temperature data
collected from the Whitechapel Station sprayed concrete works. The temperature data are used to
model sprayed concrete maturity and establish a strength – maturity relationship. Thereafter, the
application of the maturity method to the lining works is demonstrated by applying the strength –
maturity relationship to the lining temperature histories. The final section presents a thermal
monitoring programme established as an outcome of the Whitechapel Station site work
experiences.
Chapter 6 presents the thermo-chemical, and thermo-mechanical evaluation results for the
Bond Street Station Upgrade sprayed concrete works. This case study utilises the experimental
lessons learnt from the first case study. The chapter also includes a discussion of the outcomes of
the two case studies and their comparison with the literature.
Chapter 7 is the final chapter which provides conclusions of the research work and further
research recommendations.

4
Figure 1-2 Sprayed concrete strength modelling using the Arrhenius equation based maturity
method (Jones and Li, 2013)
Figure 1-1 Application of thermal imaging for sprayed concrete lining thermal monitoring
(Jones and Li, 2013)

5
2 Literature review
2.1 Sprayed Concrete
Carl Ethan Akeley is widely acknowledged to be the inventor of sprayed concrete. He used a
dry-mix sprayed mortar (or Gunite), in 1907, for applying a durable coating to models of
prehistoric animals (Sprayed Concrete Association, 1999). Later in 1911, he obtained a patent for a
‘cement-gun’, an apparatus for mixing and applying plastic or adhesive materials. Soon after, the
addition of larger aggregates led to sprayed concrete, and eventually, a method of spraying
concrete was patented by Carl Weber in 1919. Today, sprayed concrete (also known as shotcrete)
is defined as concrete that is conveyed through a hose and pneumatically projected at high velocity
onto a surface (British Standards Institution, 2005a). The high velocity spray leads to placement
and compaction at the same time to produce a dense homogeneous mass, allowing its application to
any type or shape of surface, including vertical and overhead areas.
There are two placement methods, namely the ‘wet process’ and the ‘dry process.’ In the wet
process, the ingredients are mixed and conveyed through a pipeline to the nozzle to be
pneumatically placed. For the dry process, the dry ingredients, such as cement and aggregates, are
mixed and conveyed through a hose to a nozzle where water is added. Figure 2-1 and Figure 2-2
show the schematics of the wet and dry processes, respectively. In the case of the sprayed concrete
lining works, an accelerator (typically in liquid form) is also required for immediate set, and is
typically added at the nozzle for both the wet and dry processes. Once the accelerator has been
added, the sprayed concrete sets soon after and hardening begins.
Each process has its own pros and cons, which act as trade-offs based on the placement
requirements. For example, the dry process suffers from disadvantages of less control on water
content and aggregate, and high dust (Melbye and Dimmock, 2001). On the other hand, the wet
process requires extensive logistical arrangements, and it becomes inefficient for small volumes.
The dry process is well utilised when small volumes are required intermittently. From the
perspective of quality control and Health & Safety, the wet process is usually the preferred method
(BASF, 2014).
2.1.1 Sprayed concrete as tunnel lining
Sprayed concrete has been in use for tunnel linings for over a century. It was first
experimented with in 1914 by the Pittsburgh Bureau of Mines at the Bruceton Experimental Mine,

6
USA (King, 1996). While the first half of the 20th century saw few applications of sprayed concrete
for tunnelling (Kovári, 2003), it gained prominence in the 1950’s after successful application in
various projects in Venezuela, Austria and elsewhere in Europe.
Sprayed concrete lining, as designed and constructed today, has its roots in the New
Austrian Tunnelling Method (NATM). NATM prescribed immediate application of sprayed
concrete in conjunction with other ground support measures such as rockbolts and lattice girders
(Figure 2-3) to prevent ground loosening (von Rabcewicz, 1964a; von Rabcewicz, 1964b; von
Rabcewicz, 1965). Later on, the aspect of ground strength mobilisation was added to the NATM
philosophy (von Rabcewicz, 1969a; von Rabcewicz, 1969b; von Rabcewicz, 1969c). In all cases,
the support measures must be installed before the ground loosening can begin, i.e., within the
ground stand-up time, and are required to provide immediate response to the ground loading.
In soft-ground conventional tunnelling, the short stand-up time leaves sprayed concrete as
the preferred measure to provide quickest ring closure for full-face tunnel support. To sustain the
on-coming ground loading and prevent ground loosening, sprayed concrete must achieve an
immediate set and undergo a phase of rapid strength development to “attain a high carrying
capacity as quickly as possible” (von Rabcewicz, 1964a p. 454). Thus, sprayed concrete lining has
special constructional as well as post-construction performance criteria; the most significant issues
are listed below:
1. Constructional considerations:
a. pumpability through pump lines and hoses;
b. adhesion to sprayed surface, reducing rebound and falls; and
c. homogeneity from batching up till the placement.
2. Post-construction considerations:
a. early-age compressive strength gain;
b. long-term compressive strength;
c. ductile (tensile) failure;
d. durability;
e. fire resistance; and
f. permeability for water-tightness.
The sprayed concrete mixes are tailored to achieve the performance requirements and are
required to conform to standards such as EN 14487-1 (British Standards Institution, 2005a). The
most critical factors are typically the early age strength and the pumpability requirements (Thomas,
2008). While new performance enhancing materials are being constantly developed and applied, an
example mix design is shown in Table 2-1.
The key differences between a typical high strength concrete mix and a typical sprayed
concrete such as the one in Table 2-1 (Thomas, 2008) are as follows:

7
higher w/c ratio to ease mixing, pumping and spraying;
greater ordinary Portland cement content;
larger quantities of fine aggregates (or ‘over-sanded’ mix);
limiting maximum aggregate sizes to 10 mm;
use of accelerator to create an immediate set and accelerate the strength gain;
use of high range water-reducing (superplasticiser) admixtures to improve workability;
use of stabilisers/set-retarders to increase pot life of mixed concrete;
use of silica fume to improve immediate adhesion;
use of fibres to achieve uniform crack control.
Thus, the admixtures are mainly responsible for modifying the fresh concrete behaviour
during installation, and the post-installation mechanical performance is derived from the basic
ingredients, namely cement, supplementary cementitious materials, water, and aggregates.
2.2 Sprayed concrete
2.2.1 Cement
In general, ordinary Portland cement is used for the sprayed concrete mixes. Portland cement
consists of four different clinkers – C3S (alite), C2S (belite), C3A (aluminate), C4AF (alumino-
ferrite) along with some CS̅H2 (gypsum) content (Lerch and Bogue, 1934). The hydration of these
clinkers produces ‘cement gel’ and leads to strength development (Powers, 1958). EN 197-1
(British Standards Institution, 2011) defines Portland cement as a hydraulic material consisting of
at least two-thirds by mass of calcium silicates (alite and belite) with the remainder consisting of
aluminium and iron containing clinker phases with other minor compounds. All these compounds
are formed of different types of oxides such as CaO, SiO2, Al2O3, Fe2O3 and MgO.
Cement clinker content can vary a lot from one manufacturer to another. For consistency
purposes, standard classifications have been developed. The most prevalent classifications are
European Norms and American Standards. The American Standard ASTM C 150 (2007) classifies
cement from Type I to Type V, with further subcategories defined for blended cements in ASTM C
595 (2003). Type I refers to the ordinary Portland cement. The European Norm 197-1 (British
Standards Institution, 2011) classifies cement from CEM I to CEM IV with further subcategories
defined for blended cements. CEM I contains more than 95% clinker content. Table 2-2 provides
typical ranges of CEM I components. CEM II to CEM IV represents blended cements containing
supplementary cementitious materials (SCMs) such as fly ash and silica fume.
In general, the cement type is limited to the ordinary Portland cement, i.e., CEM I or Type I.
Other SCMs are carefully dosed to achieve a consistent concrete mix.

8
2.2.2 Water content
The water content in the concrete is expressed in terms of water-to-cement ratio by weight
(w/c). For complete hydration of cement, a w/c ratio of approximately 0.25 is sufficient (Powers,
1949). The minimum required water content, however, is not helpful in achieving the workability
of fresh concrete. For sprayed concrete, the pumpability requirements usually dictate a higher w/c
ratio. A higher w/c ratio would yield a higher porosity (Powers, 1958) and hence, a lower strength.
Therefore, it is desirable to minimise the w/c ratio. EFNARC (1996) restricts the maximum w/c to
0.55.
2.2.3 Accelerating admixtures
An accelerating admixture or the ‘accelerator’ is an admixture that can shorten the setting
time and/or accelerate the early age strength development (American Concrete Institute, 2013b).
EN 934-2 (British Standards Institution, 2001) categorises accelerating admixtures into two
categories – set accelerating, and hardening admixtures. The set accelerating admixture reduces the
time required for a fresh concrete mix’s transition from the plastic to a rigid state, and the
hardening admixture increases the rate of early age strength development. Calcium chloride is
known to be the most effective accelerator for concrete (American Concrete Institute, 2013b) but
its use has been “effectively outlawed” (The Concrete Society, 2017) due to its impact on the long-
term health of concrete. The next generation of accelerators included sodium silicate, alkali
aluminates and alkali carbonates/hydroxides and have all been used in sprayed concrete works
(Prudêncio Jr, 1998).
Over the last two decades, the traditional accelerators have been phased out in favour of
“alkali-free” accelerators, for personnel health and durability issues (Melbye and Dimmock, 2006).
The alkali-free accelerators mainly contain aluminium sulphate which reacts with lime to form
ettringite and gibbsite (Myrdal, 2007a). Ettringite creates rapid set and gibbsite further accelerates
the cement hydration progression, increasing the rate of early age strength development.
2.2.4 Water reducing or plasticising admixtures
A water reducing admixture helps reduce the water content of a given concrete mix without
affecting its consistency (British Standards Institution, 2001). When used to increase the slump
(workability) without decreasing the water content, it is referred to as a plasticising admixture. A
normal water reducer can decrease the water demand by up to 12% (American Concrete Institute,
2013b) by its action of dispersing the fine particles of cementitious materials.
The sprayed concrete installation method demands high workability and requires a special
type of water reducers, called high range water reducers (HRWR) or superplasticisers. The
superplasticisers allow reduction of 30% or more in water content without any side effect of
excessive set retardation (American Concrete Institute, 2013b). The superplasticisers are

9
melamine, naphthalene or polycarboxylate based organic compounds (Melbye and Dimmock,
2001). Out of these three, the polycarboxylate based HRWR are the most effective (American
Concrete Institute, 2013b) and thus, would be the preferred choice for the sprayed concrete mix
designers.
2.2.5 Set retarding admixtures
A set retarding admixture helps extend the time required for the fresh concrete to transition
from the plastic to the rigid state (British Standards Institution, 2001). The set retarding admixtures
are helpful in keeping the concrete workable for longer durations, and thus, increasing the pot life
of the fresh concrete. They are also useful in offsetting the unwanted effects of high temperatures
(American Concrete Institute, 2013b). In general, the retarders are based on hydroxycarboxylic
acids and can also contribute as water reducers (Melbye and Dimmock, 2001).
Since the retarders would be a source of reduction in the early age strength (Portland Cement
Association, 1988), a compatibility consideration is required while selecting the combination of the
accelerator, superplasticiser and retarder.
2.2.6 Aggregates
The strength of concrete increases with the increase of aggregate diameter. Therefore, cast
concrete uses the aggregate size of up to 40 mm (Neville, 2004). For sprayed concrete, the larger
the pieces, the more is the rebound loss (Thomas, 2008). Therefore, aggregate size is usually
limited to 8-10 mm with the overall aggregate grading curve biased towards the finer aggregates
(EFNARC, 1996), as shown in Figure 2-4. As noted in Table 2-1, a typical wet-mix sprayed
concrete has a 2:1 ratio between fine (< 4 mm) and coarse aggregates (4 – 8 mm), where half of the
fine aggregates will be medium or finer sand particles.
2.2.7 Supplementary cementitious materials
Common supplementary cementitious materials (SCM) for normal concrete include blast
furnace slag, silica fume (microsilica), pozzolana, fly ash, burnt shale and limestone (British
Standards Institution, 2011). In general, SCM are used as cement replacements for the normal
concrete but are used as additions in sprayed concrete (EFNARC, 1996).
Microsilica is the most effective SCM for the sprayed concrete (BASF, 2014). With its
specific surface area of 20,000 kg/m2, it makes the fresh concrete mix cohesive and less prone to
segregation (American Concrete Institute, 2013a). Microsilica also reduces bleeding, accelerates
hydration reaction (by providing additional nucleation sites), reduces permeability (by increasing
solid particle packing) and improves long-term strength by consuming Ca(OH)2 (a weaker
hydration product) to form the calcium silicate hydrates (American Concrete Institute, 2012).

10
A disadvantage of using the microsilica is the increased water demand and this can be
controlled, up to a certain limit, by adding superplasticisers. Therefore, the microsilica content is
restricted to about 15% of the cement content (American Concrete Institute, 2013a).
2.2.8 Fibre reinforcement
A fibre reinforced concrete contains discontinuous, discrete and uniformly dispersed
reinforcing fibres as the reinforcement (American Concrete Institute, 2006). The basic purpose of
the fibres is to improve the structural integrity of the concrete, such as the reduced crack width.
The European norm EN 14889 classifies the reinforcing fibres into two types – steel fibres
(British Standards Institution, 2006b) and polymer fibres (British Standards Institution, 2006c).
Steel fibres are the most commonly used fibres for the sprayed concrete (BASF, 2014).
2.3 Mechanical nature of sprayed concrete
Sprayed concrete, like any other Portland cement concrete, is a composite material
consisting of a binding medium (Portland cement and water) within which are embedded particles
or fragments of a relatively inert mineral filler. The binding medium, formed of Portland cement
and water, is typically referred to as hydrated cement paste or ‘cement-gel’ (Powers, 1958).
Initially, this medium is plastic in nature, with anhydrite cement occurring as dispersed particles in
the water. As the cement hydration progresses, the medium hardens to become a porous and
permeable solid.
The upper limit of important mechanical properties of the concrete, such as strength and
stiffness, are largely related to the upper limit of the density of matrix. This is so because more
porosity is observed in the binding medium and less in the aggregates. While the required values of
mechanical parameters for the sprayed concrete are project specific, many of them are prescribed
based on an understanding of the method of construction. Typical mechanical parameters for the
sprayed concrete are presented in Table 2-3.
For concrete, the compressive strength is “… one of its most important and useful properties
and one of the most easily determined…” (Derucher, 1978 p. 147). The strength of concrete is
governed by three main aspects, namely strength of the binding matrix or the cement paste,
strength of aggregates and strength of the interface between the two. Although a very dense cement
paste can have compressive strengths of more than 300 MPa (Neville, 2004), in comparison to
general rock aggregate strengths of 130–200 MPa, it is rarely achievable. This is so because the
binding matrix essentially inherits porosity caused by voids/pores left behind by changing forms of
water (hydration consumption or evaporation).
Like all porous materials, concrete also has an inverse relationship between strength and
porosity (Verbeck, 1978). One such representation has been shown in Figure 2-5. Thus, the
mechanical performance of the sprayed concrete can be increased by controlling porosity. There

11
are various categories of pores – gel pores, capillary pores and air voids (Thomas, 2008). The gel
pores are the interstices occurring in the cement gel and are typically less than 0.1 m. The
capillary pores occur due to the pore water and are of sizes ranging between 0.1 and 10 m. The
pores with sizes greater than 10 m are categorised as air voids. It should be noted that the cement
hydration can keep on happening even years after installation, the amount of cement gel keeps
filling in the voids and pores. This decrease in porosity leads to the continuous strength
development.
The strength of the interface between the hydrated cement paste and the aggregates is as
critical. It is the region where micro-cracks start developing, due to shrinkage and creep. These
micro-cracks if locally overloaded, propagate into hydrated cement paste and become macro-
cracks. Under compression, the concrete failure is governed by cracking under uniaxial or biaxial
loading and by crushing under multi-axial stress (Neville, 2004). It must be noted that due to the
heterogeneity of concrete, such a failure is essentially a random process and the stress existing at
the time of failure is intrinsically a variable value (Powers, 1966).
In summary, the concrete’s compressive strength depends on density. The density can be
improved by maximising binding matrix hydration and improving the binding matrix – aggregate
interaction.
2.4 Sprayed concrete strength development
2.4.1 Stages of concrete strength development
As mentioned earlier, the strength development or hardening of concrete occurs as the
cement and water reaction, or cement hydration, progresses. The hardening process may be
subdivided into four phases, as described by Byfors (1980) and is shown in Figure 2-6.
fresh concrete
early age
“almost” hardened concrete
hardened concrete
Fresh concrete is referred to as the visco-plastic or setting stage. It can be moulded easily.
Depending upon the mix and the environmental conditions, this process may vary from a few
minutes to several hours. Once concrete sets, hardening begins. It marks the beginning of the early
age. As Byfors (1980) observes:
“There is no precise definition of early age and the term can be used to
embrace the first hours, the first days, or, in certain cases, even the first weeks
depending on the situation in question, i.e., on the type of structure, the
composition of the concrete, the relevant curing conditions and on the objective to
be achieved.”

12
Thus, this stage may last varying from a few hours to more than a week. For tunnelling, the
sprayed concrete early age phase passes in less than 24 hours, with a critical observation period of
up to 3-day age. After that, the hardened sprayed concrete would be able to form a rigid shell
support.
Further hardening stages are achieved as hydration progresses. The stage of peak rate of
hydration can be marked as the beginning of the “almost” hardened concrete (Kondo and Ueda,
1968). One could mark the end of “almost” hardened concrete to the phase of arrival of a
diminished rate of hydration that is equivalent to the rate of hydration at the beginning of early age
of the concrete (post setting) with the concrete having achieved the mechanical properties similar
to that of the fully hardened concrete. Typically, 28-day strength is assumed to be fully hardened
concrete (Byfors, 1980). After this age, the hydration process has slowed down such that rate of
strength development may safely be assumed to have converged, though, this process may last for
decades, and the achieved strength may be substantially greater than 28-day age (Neville, 2004).
2.4.2 Cement hydration and strength development
The binding matrix or the “microstructure” development during the cement hydration is the
basis of the concrete strength development (Powers, 1966). The microstructure development
occurs as the cement clinker hydration progresses (Neville, 2004). The clinkers hydrate at different
rates (Figure 2-7) and contribute towards concrete strength at different ages and proportions
(Bogue and Lerch, 1934), as shown in Figure 2-8. C3A is the quickest to hydrate, and C2S is the
slowest one. C3S and C2S are the major contributors to the concrete strength. C3S contributes
towards early age strength while C2S contributes towards the long-term strength.
Since the aluminate clinkers (C3A) are the quickest to hydrate, they are good contributors to
the strength at the very early ages of the concrete. The resultant is usually a flash set and
undesirable for the long-term strength of the concrete (Neville, 2004). To avoid flash setting, C3A
hydration is controlled by adding 2-3% gypsum (CS̅H2) to the cement (Taylor, 1997b). CS̅H2
reacts with C3A to form ettringite or trisulphatealuminate (C6AS̅3H32). The ettringite forms a
barrier layer around the aluminate clinkers preventing further aluminate hydration (Bogue and
Lerch, 1934). Depending on the sulphate content in the cement, C6AS̅3H32 can further react with
C3A to form monosulphatealuminate or C4AS̅H12 (Bye, 1999). C4AS̅H12 can be further consumed
by aluminate clinkers to produce the “secondary” ettringite (Day, 1992).
Similar to above aluminate phases, the ferrite phases are also formed during hydration
reaction. Since ferrite phases are never independent of aluminate phases, these are impure forms of
ettringite and monosulphatealuminate phases and are typically named as AFm and AFt phases,
where ‘m’ represents monosulphate and ‘t’ represents trisulphate (Taylor, 1997a). The following is
the typical stoichiometry of the hydration reaction of the aluminate phases (Neville, 2004).

13
3 3 6
2 C A 6 H C AH 2 2-1
33 6 322CSH C A 3 26 H C AS H 2-2
33 6 32 4 12 2 C A C A H 4 H 3 C AS HS 2-3
32 4 12 6 322 C H C A H 16 H C S AS S H 2-4
4 6 12CH C AF 2 10 H C AFH 2-5
C3S is the second fastest clinker to hydrate. C3S hydration starts within 2 – 4 hours of water
addition and produces amorphous calcium silicate hydrates, referred to as CSH gel or fibres and
crystalline calcium hydroxide, Ca(OH)2 or simply CH (Bogue, 1956). CSH is the main contributor
to the concrete strength and is also formed from C2S hydration.
3 3 2 32 C S 6 H C S H 3 CH 2-6
2 3 2 32 C S 4 H C S H CH 2-7
The CH component is a weak and soluble product from calcium silicate hydration (Taylor,
1997a). If sufficient aluminate content is available, it can be consumed to form stronger aluminate
hydrates as follows:
3 4 13 C A 12 H CCH AH 2-8
Figure 2-9 shows a schematic representation of the formation of the hydration products
beginning from anhydrous cement grains to the age of 14 days [Kurdowski (2014) after Scrivener
and Pratt (1984)]. Figure 2-10 shows a chronological comparative illustration of hydration
products formation and the microstructure development [Kurdowski (2014) after Locher and
Richartz (1974)]. Since the hydration process of the sprayed concrete is usually manipulated or
controlled with the use of special ingredients such as retarder, superplasticiser, accelerator and
microsilica, the chronology, shown in Figure 2-10, will be altered.
It has been widely accepted (Byfors, 1980; RILEM, 1981) that a reasonably linear
relationship can be established between the cement hydration progress and the compressive
strength development (Figure 2-11). The cement hydration reaction progress is generally
represented in terms of the amount of reaction completion and is typically referred to as degree of
hydration (Powers, 1949; Bogue, 1956; Copeland et al., 1960; Byfors, 1980; Freiesleben Hansen
and Pedersen, 1985; Hellmich et al., 1999; Carino, 2004). An appropriate estimate of the degree of
hydration can, therefore, provide reasonable information on strength development for a given
concrete mix. This key aspect will be discussed in detail in Section 2.5.
2 C3A can form various type of hydrates, such as C4AH10, C2HA8, C4AH19 and C4AH13, depending on its
temperature during or after hydration (Kurdowski, 2014).

14
2.4.3 Factors affecting early age cement hydration
There are various factors affecting the rate of cement hydration. Key factors are as below:
1. Cement chemistry: Since different clinkers hydrate at different rates, the cement
ingredients are a key aspect. Other compounds such as gypsum, free lime and magnesia are
also hydration varying components and are required to be controlled (Helmuth and
Detwiler, 2006).
2. Cement particle size: The greater the surface area available for the hydration reactions, the
higher is the overall hydration rate, especially in the early ages (Neville, 2004). Thus, finer
cement particles lead to the higher early age hydration rate. The cement particle fineness is
measured in m2/kg and is referred to as Blaine Fineness.
3. Pore fillers: Finer additives such as microsilica and finely ground limestone filler are inert
by themselves (American Concrete Institute, 2013a). When added to the fresh concrete,
they can adsorb water on to their surface during batching creating additional nucleation
sites, which alters the rate of hydration reaction. In the long-term, they help improve
durability by either acting as a pore filler or reacting with hydration products to form a
more binding matrix (Bapat, 2013).
4. Admixtures: See Sections 2.2.3 and 2.2.5 for accelerating and retarding admixutres,
respectively.
5. Curing temperatures: The cement hydration is an exothermic process. Its kinetics is greatly
impacted by the curing temperatures. Higher curing temperatures increase the rate of
hydration while lower curing temperatures impede the hydration rate (Nurse, 1949; Saul,
1951; Carino, 2004).
On construction sites, curing temperature is an important variable and has a big impact on
short-term and long-term properties of concrete. The curing temperatures at the very early age of
the concrete are of great significance. Since the lower curing temperatures considerably impede the
cement hydration process, these are not desirable in the case of the tunnel lining, where early age
strength is of great concern. This aspect of temperature variation on the short-term and long-term
concrete properties has been studied since the late 1940’s under the name of concrete maturity
(Nurse, 1949; Saul, 1951; Bergström, 1953; Plowman, 1956; Chin, 1971; Lew and Reichard, 1978;
Byfors, 1980; Carino and Lew, 1983; Carino and Tank, 1992; Hellmich et al., 1999; De Schutter,
2004; Wade et al., 2010; Jones et al., 2014; Galobardes et al., 2015). The early studies led to the
development of the ‘maturity method’ (Carino, 2004), which is discussed in the next section.
2.5 Maturity method
The strength of concrete is known to be a function of its age and temperature history at early
ages (Byfors, 1980). The temperature, in the early ages, has a major impact on strength
development. This temperature dependence presents problems while estimating the in-situ strength

15
of the concrete if compared to the strength development data obtained under standard laboratory
conditions. To quantify such a temperature dependence, an approach called the maturity method
was developed (Carino and Lew, 2001).
The approach came to prominence around 1950 with the motivation of understanding the
strength development due to accelerated curing, such as steam curing (Nurse, 1949; Saul, 1951;
Bergström, 1953; Plowman, 1956). Since then, this method has also been applied to ordinary
curing conditions. This method requires obtaining the temperature history of the concrete during
the curing period. Initially, it was proposed to use the temperature history to compute a single
factor or an “index” that could be used as an indicator of the concrete strength. This index was
referred to as the “maturity” (Saul, 1951). Since then, various relationships or functions have been
developed to estimate the maturity of the concrete. Also, various correlations between the maturity
index and the concrete strength development have been proposed, and are discussed next.
2.5.1 Maturity functions
Maturity functions are used to convert the actual temperature history of the concrete to a
factor that is indicative of how much strength has developed. The roots of the earliest maturity
function are found in a series of papers, by various authors (McIntosh, 1949; Rastrup, 1954;
Plowman, 1956), dealing with accelerated curing methods for concrete.
McIntosh (1949) suggested that the product of time and concrete temperature above a datum
temperature (-1.1°C or 30°F) could be used to summarise the effects of the curing history. The
product of time and temperature above the datum temperature was called the “basic age.” Nurse
(1949) also suggested the use of the time-temperature product while explaining accelerated curing
using steam curing approach, though the datum temperature was not discussed in this work.
Saul (1951) suggested the term “maturity” for the product of time and temperature and
recommended using it with respect to a datum temperature (-10.5°C or 13°F), the lowest
temperature at which strength gain is observed. In his work, Saul presented the following principle,
later recognised as the “maturity rule”:
“Concrete of the same mix at the same maturity (reckoned in temperature-
time) has approximately the same strength whatever combination of temperature
and time go to make up that maturity.”
Thus, maturity is computed from the temperature history using the following equation, also
known as the Nurse-Saul function:
0
0
t
M T T t 2-9
where M = maturity at age t; T = average temperature of the concrete during time interval ∆t,
and T0 = datum temperature. The maturity calculations can be presented as shown in Figure 2-12.
Per this function, the maturity index could be developed in terms of °C.days (or °F.days) or

16
°C.hours (or °F.hours). For example, a sample cured at 30°C for 24 hours would have a maturity
equal to 720°C.hours or 30°C.days, if the datum temperature T0 were 0°C.
Rastrup (1954) introduced the equivalent age concept, a relatively convenient representation
of maturity. Here, the equivalent age represents the duration of the curing period at the reference
temperature that would result in the same maturity as the curing period at other temperatures. The
Nurse-Saul function can be used to convert a given temperature-time history to an equivalent age
of curing at a reference temperature as follows:
0
equivalent
0 0
t
r
T Tt t
T T
2-10
where tequivalent = equivalent age at the reference temperature; and Tr = reference temperature.
This function can further be simplified by representing temperature ratios as an age conversion
factor. This factor converts a curing interval ∆t into the equivalent curing interval at the standard
reference temperature. Thus, rewriting the above equation as follows helps generalise the concept:
equivalent equivalentt t 2-11
where equivalent as age conversion factor and can be written as follows:
0
equivalent
0r
T T
T T
2-12
The simplicity of this linear relationship brought it into wide usage but has a major
drawback of its inability to account for the quality of early age curing. In other words, this function
could not explain the “cross-over effect”, discussed in Section 2.5.3, caused by early-age
temperature variations.
Rastrup (1954) had based the equivalent age concept on modelling the heat released during
cement hydration. The model utilised the “well-known axiom from physical chemistry which
states: the reaction velocity is doubled if the temperature at which the process is taking place is
increased by 10oC.” This approach proved less accurate than the Nurse-Saul function (Wastlund,
1956). The equivalent age formulation is as follows.
0
10
equivalent
0
2
T Tt
t t
2-13
Copeland et al. (1960) suggested the use of the Arrhenius equation to describe the early rate
of cement hydration. Bažant and Najjar (1972) used this for the equivalent age calculation, and is
formulated as below:
a
r
1 1
equivalent
0
Et
R T Tt e t
2-14

17
where tequivalent = equivalent age at the reference curing temperature; T = average absolute
temperature of concrete during time interval ∆t (K); Tr = absolute reference temperature (K); Ea =
activation energy (J.mol-1); and R = universal gas constant (8.3144 J.mol-1.K-1). Here, the
exponential factor corresponds to the age conversion factor (equivalent) and can be written as below.
equivalent,Arrhenius
1 1a
r
E
R T T
2-15
Since the Arrhenius equation is intended to represent the exothermic reaction of two
reactants and cement is a multiphase reactant, the activation energy value has been always a
subject of investigation. Bažant and Najjar (1972) suggested a constant value of 20.8 kJ.mol-1 for
the activation energy. Freiesleben Hansen and Pederesen3 (1977) also used this formulation but
suggested a temperature dependent activation energy formulation as below.
-1for 20 C, 33.5 kJ. molaET 2-16
1
a 33.5 for 1.47 20 C, (20 ) kJ.mol TT E 2-17
Further discussions on the activation energy are made in Section 2.8.3.
Other functions, such as by Weaver and Sadgrove (1971), have been developed but are not
widely used, after the introduction of the Arrhenius equation based maturity function. Further
studies, such as Byfors (1980), demonstrated that the Arrhenius equation based function is the most
suitable to account for the effects of temperature variation on the strength gain, and other
mechanical properties as well. A comparative graph of age conversion factors given by the
aforementioned maturity functions is presented in Figure 2-13 from Carino (2004). It can be
observed that concrete maturity is very sensitive to the value of activation energy.
2.5.2 Strength and maturity relationships
The primary purpose of maturity functions is to estimate the concrete strength development
during, and after, construction. Thus, the strength (f) vs maturity (M) relationship is established and
then, translated for field measurement. This section summarises a few of the many such
relationships.
Nykanen (1956) developed an exponential strength-maturity relationship for near freezing
curing conditions as follows:
1 kMf f e 2-18
where f = instantaneous compressive strength; f∞ = final compressive strength, a function of
w/c ratio; M = maturity index; and k = a constant based on the initial rate of strength development
3 Use of this reference is being referred to as FH-P function.

18
Plowman (1956) proposed a semi-logarithmic function between the strength and the Nurse-
Saul maturity index.
1 2 logf c c M 2-19
where c1 and c2 are constants related to water-cement ratio and cement type. This
relationship is subject to limitations such as prediction of ever-increasing strength and linear
relationship at early maturities. Another proposed strength-maturity relationship is from the work
of Lew and Richard (1978) and is usually seen as an improvement over Plowman’s relationship
(Carino, 2004).
3
1
21 log 16.70C
Cf
C M
2-20
where C1 = limiting strength coefficient; C2 = coefficient of rate of strength gain; C3 =
coefficient varying between -1.5 and -4.3. The value of the coefficients are dependent on w/c ratio
and cement type and are deduced using the Nurse-Saul function with T0 = -12.2°C (or 10°F). The
value of 16.70°C.days represents a maturity offset, below which no strength development occurs.
Chin (1971) presented a hyperbolic strength-maturity function as the following:
1
Mf
M
S f
2-21
where M = maturity index; f∞ = final compressive strength; and S = initial slope of strength-
maturity curve. This relationship is a good representation of the asymptotic nature of the limiting
strength of concrete. Carino et al. (1983) noted that this relationship did not provide satisfactory
outcomes at lower values of maturity and suggested the use of an offset, M0. This offset represents
the maturity value at which strength development begins. The modified hyperbolic formulation is
expressed as follows.
0
01
M Mf
M M
S f
2-22
Freisleben Hansen and Pedersen (1985) suggested the following strength-maturity
relationship, basing it on the synonymy between the heat of hydration and maturity:
a
Mf f e
2-23
where f∞ = final compressive strength; M = maturity index; τ = characteristic time constant;
and a = shape parameter. This relationship is well suited to the very early part of the strength gain
curve when rapid strength development begins after a certain maturity has been attained. Also, the
asymptotic end is a good representation of the arrival of the limiting strength of the concrete.

19
Galobardes et al. (2015) used the maturity method on a wet-mix sprayed concrete. In their
work, the maturity was calculated in a fashion similar to the Nurse-Saul function (Eq. 2-9), but the
datum temperature (-10.5°C) was replaced by the assumed ambient temperature of 18°C. The
sprayed concrete strengths were correlated with the maturity through an exponential function, as
shown in Eq. 2-24.
1 2 3 exp exp f a a a M 2-24
where M represents maturity, and 1a , 2a and 3a are constants. The three constants have mix
specific values, established through curve fitting of strength and maturity data up to 12 hrs age, and
have no physical significance. Since the maturity estimation approach is different to Nurse-Saul
function, a direct comparison with any other strength – maturity formulation cannot be drawn.
Furthermore, the sprayed concrete involves using a combination of admixtures, and thus, can easily
modify the strength – maturity relationship formulation.
In summary, various maturity functions have been developed to account for the effects of
time and temperature on the strength development of the concrete. These functions are empirical
and do not necessarily follow the fundamental basis of cement hydration, except the Arrhenius
equation based maturity function. Additionally, the strength – maturity relationships are empirical
correlations and do not necessarily explain the physics behind it. Thus, a generic formulation
should be considered, such as presented by Bernhardt (1956). This formulation suggests that rate of
strength development is a function of instantaneous strength, ( f ) and temperature (T), as shown
below:
( ) ( )df
f Tdt
2-25
Now, developing these two functions with appropriate assumptions is key to the success of
any maturity function and strength-maturity relationship. The strength function ( f ) can be
simplified to a product of f∞, final compressive strength, and a function of the instantaneous degree
of hydration, (). The hydration dependent function () represents the intrinsic material function
developing as the cement hydration progresses. The above equation can be rewritten as follows:
( ) ( )df
f Tdt
2-26
where the product of () and (T) represents a maturity function. To develop an
appropriate strength development function, it is essential to understand cemefnt hydration kinetics
(see Section 2.7), choosing an appropriate hydration determination method such as described in
Sections 2.8 and 2.9.
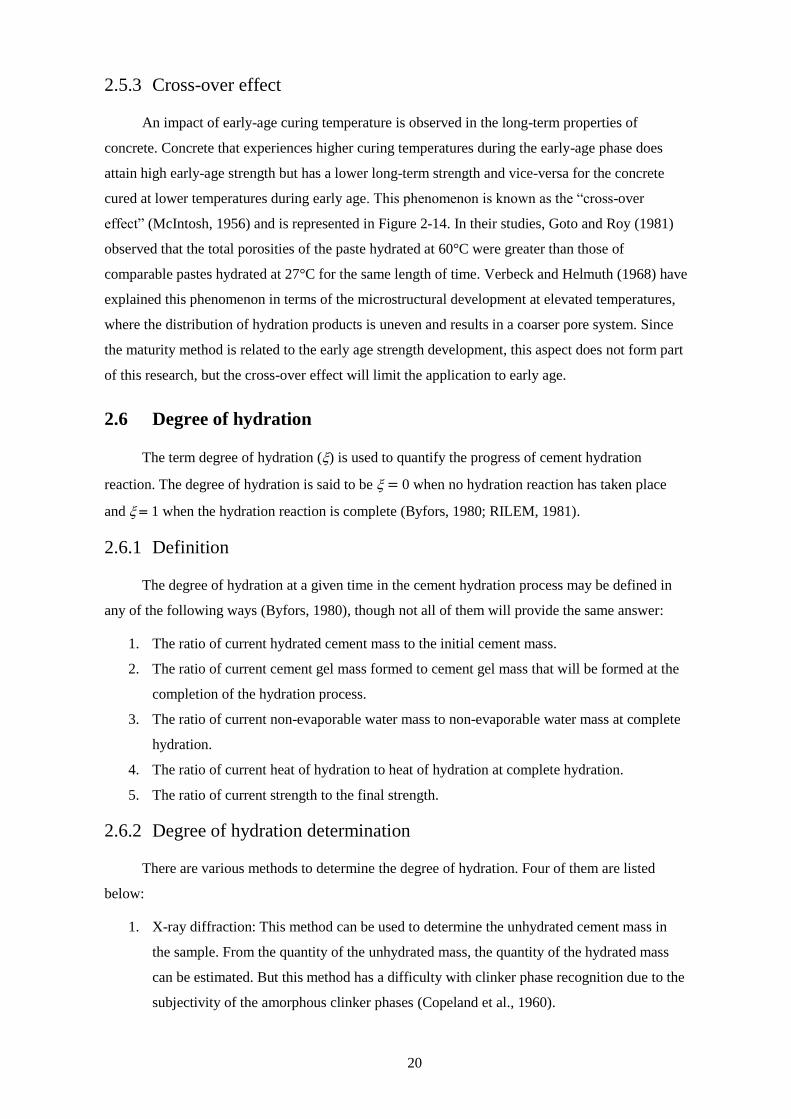
20
2.5.3 Cross-over effect
An impact of early-age curing temperature is observed in the long-term properties of
concrete. Concrete that experiences higher curing temperatures during the early-age phase does
attain high early-age strength but has a lower long-term strength and vice-versa for the concrete
cured at lower temperatures during early age. This phenomenon is known as the “cross-over
effect” (McIntosh, 1956) and is represented in Figure 2-14. In their studies, Goto and Roy (1981)
observed that the total porosities of the paste hydrated at 60°C were greater than those of
comparable pastes hydrated at 27°C for the same length of time. Verbeck and Helmuth (1968) have
explained this phenomenon in terms of the microstructural development at elevated temperatures,
where the distribution of hydration products is uneven and results in a coarser pore system. Since
the maturity method is related to the early age strength development, this aspect does not form part
of this research, but the cross-over effect will limit the application to early age.
2.6 Degree of hydration
The term degree of hydration () is used to quantify the progress of cement hydration
reaction. The degree of hydration is said to be =0 when no hydration reaction has taken place
and 1 when the hydration reaction is complete (Byfors, 1980; RILEM, 1981).
2.6.1 Definition
The degree of hydration at a given time in the cement hydration process may be defined in
any of the following ways (Byfors, 1980), though not all of them will provide the same answer:
1. The ratio of current hydrated cement mass to the initial cement mass.
2. The ratio of current cement gel mass formed to cement gel mass that will be formed at the
completion of the hydration process.
3. The ratio of current non-evaporable water mass to non-evaporable water mass at complete
hydration.
4. The ratio of current heat of hydration to heat of hydration at complete hydration.
5. The ratio of current strength to the final strength.
2.6.2 Degree of hydration determination
There are various methods to determine the degree of hydration. Four of them are listed
below:
1. X-ray diffraction: This method can be used to determine the unhydrated cement mass in
the sample. From the quantity of the unhydrated mass, the quantity of the hydrated mass
can be estimated. But this method has a difficulty with clinker phase recognition due to the
subjectivity of the amorphous clinker phases (Copeland et al., 1960).

21
2. Thermogravimetry: This method is useful to determine non-evaporable water (wn) quantity
for a hydrated cement sample. Igniting the hydrated sample to 1000°C releases its non-
evaporable water (wn). Comparing the determined non-evaporable water content with the
non-evaporable water content at complete hydration, the degree of hydration can be
established. Depending on the clinker content, the maximum non-evaporable water content
can vary from 18% to 26% on the cement mass basis (Powers and Brownyard, 1946).
Thus, this method requires prior knowledge of the maximum non-evaporable water, which
can be deduced by knowing the clinker content
3. Isothermal Calorimetry: Isothermal conduction calorimetry is the most convenient and
accurate way of studying heat of hydration between the ages of 30 mins to 3 days
(Copeland et al., 1960). Knowing the final heat of hydration (requires clinker content
information), the degree of hydration development can be very easily studied.
4. Compressive strength test: Compressive strength testing of isothermally cured concrete is
the simplest method to estimate the degree of hydration. Since the hydration process can
continue for years, it is very difficult to assess the final strength. For this reason, 28-day
strength is typically assumed as the “ultimate strength.” The “ultimate” strength is then
correlated with “ultimate degree of hydration” (Mills, 1966).
2.6.3 Ultimate degree of hydration
Since not all the water is chemically available for the hydration process due to the hydrate
product layer formation on to the anhydrous cement grains, the final degree of hydration ( = 1)
cannot be reached for a given concrete sample. To account for this, the “ultimate” degree of
hydration value (ult) is used. Various empirical relationships have been developed, such as from
the works of Mills (1966) and Waller (1999).
ult,Mills
1.031
0.194
w c
w c
2-27
3.3
ult,Waller 1w c
e 2-28
The above equations provide similar outcomes for lower w/c ratios (such as ult = 0.63 for
w/c = 0.3) but diverge for higher w/c values (such as ult varies from 0.74 to 0.81 for w/c = 0.5).
Hence, one cannot be sure which equation should be used to correlate the ultimate degree of
hydration with the ultimate strength of 28 days. Thus, these empirical relationships may be treated
as a useful starting point, but the experimental determination of the ultimate degree of hydration
for a given mix would be the best approach.
The application of the above relationships have been extended to account for supplementary
cementitious materials by some researchers (Gomes, 1997; Lura et al., 2003; Habel et al., 2006),
but are not required when low dosages, of 5% or so, are used. In the case of sprayed concretes, the

22
dosages of the supplementary cementitious materials, such as microsilica and limestone filler, are
not very high (such as 7% noted in Table 2-1). Therefore, it can be assumed the supplementary
cementitious materials would have very little impact on the value of the sprayed concrete’s
ultimate degree of hydration.
2.7 Hydration kinetics
Cement hydration is a temperature sensitive exothermic reaction and can be well
represented using the Arrhenius equation.
a
( )
E
RTT A e
2-29
where (T) is the rate of reaction (s-1) at the temperature T (K), A is the affinity constant 4 (s-
1), Ea is the activation energy (J.mol-1), and R is the ideal gas constant (J.mol-1.K-1). The rate of
hydration depends on the instantaneous degree of hydration. With the synonymy between the
degree of hydration and strength development, the rate of hydration function (d/dt) can be written
as follows:
( ) ( )
dfdtd
Tdt f
2-30
Here, () actually considers the use of the final strength (f∞) occurring at the final degree of
hydration (∞) of 1. If using ult as the reference, it must be factored into the hydration function.
For example, if the ultimate degree of hydration (ult) is estimated to be 0.7 with the ultimate
strength ( fult at 28 day strength) determined to be 40 MPa, then f∞ would be 57 MPa.
Further to this, since the concrete strength development starts after a certain amount of
hydration has been achieved, a hydration offset (0) must be used, similar to maturity offset (M0).
This offset should be included when defining () and can be represented as (- 0).
Reformulating the rate of hydration relationship would give the following:
a a
0
E E
RT RTdA e A e
dt
2-31
where Ã() 5 is normalised affinity (s-1). It must be noted that this equation is ideally suited
to an isolated sealed condition. In real time conditions, corrections for various site conditions such
as relative humidity, drying condition and temperature variation, may be required. Various authors
have defined Ã() as a characteristic of the binding matrix development but approach it with
4 The affinity constant represents the frequency of the favourably oriented collisions of the molecules of any
two reactants (Brown et al., 1997). 5 The symbol and terminological reference of the ‘normalised affinity’ is noted from Hellmich et al. (1999)

23
different property sets, such as a change in viscosity and sample temperature evolution (Hellmich
et al., 1999), and permeability (Cervera et al., 2002). See Section 2.8.4 for more information. One
common aspect is the consideration given to the heat of hydration as a measure of the degree of
hydration, an indicator towards considering the use of calorimetry – adiabatic, semi-adiabatic or
isothermal.
2.8 Isothermal calorimetry
In practice, the heat of hydration for cement is measured using a calorimeter. The measured
heat can represent the degree of hydration while the rate of heat release can represent the rate of
hydration. Different types of calorimeters include – adiabatic (isolated and no heat loss), semi-
adiabatic (isolated with controlled heat loss) and isothermal (heat flow at constant temperature).
The adiabatic and semi-adiabatic calorimeters measure temperature increments which are
further converted into the heat produced with the input of various parameters, such as specific heat
capacity and activation energy. Without the appropriate values, the total heat release cannot be
measured correctly. Theoretically, adiabatic and semi-adiabatic calorimeters are representative of
the temperature changes as they would occur in the real construction. Since there can be different
temperatures in different parts of the concrete; the results may very well not be applicable/relevant,
especially for massive concrete structures. The European Norm 197 describe two types of
calorimetric approaches – the solution method (British Standards Institution, 2010a) and the semi-
adiabatic method (British Standards Institution, 2010b). In the solution method, cement paste
testing is performed by dissolving the sample in a mixture of hydrofluoric and nitric acids. The
solution chemistry provides useful results from the age of 3 days onwards (Copeland et al., 1960)
while the semi-adiabatic calorimetry is useful for large concrete samples only.
The adiabatic calorimetric testing does not allow heat loss, and therefore, leads to high
temperatures during the process. This is a precise method of determining total heat, but the rate of
reaction is unlikely to be similar to site conditions. Therefore, it cannot be used to model the rate of
the cement hydration process. And hence, it is a less preferred and infrequently used testing
method. In the semi-adiabatic calorimeters, the samples are placed in the heat insulated cylinders,
and the temperature variation profile is developed while heat losses may occur. With the heat loss,
the temperature rise is not very high, and the rate of hydration is more realistic than adiabatic
testing. However, it also requires knowledge of the parameters such as specific heat capacity and
activation energy along with the heat loss measurements through the insulated cylinders.
The isothermal calorimetry involves measurement of the rate of heat production at constant
temperature conditions. The rate of heat release is directly proportional to the rate of reaction.
Direct measurement of heat flow means that parameters such as specific heat capacity of the
sample and activation energy are not required as input. Instead, conducting isothermal testing at
different temperatures is a useful method of determining the apparent activation energy. One

24
drawback of the isothermal testing is that only small sample sizes may be used. For this reason,
only cement pastes, sample size up to 70 g, and mortar, in the case of a larger sample, should be
used. In the case of semi-adiabatic testing, large samples of 3-5 kg are allowed. Thus, concrete
mixes with large size aggregates can be tested. In the case of the sprayed concrete, it would be
difficult to capture accelerator action unless the accelerated concrete were sprayed directly into the
test cell.
Overall, isothermal calorimetry for the cement paste is a simple method for the direct
representation of the cement hydration in the concrete. A schematic arrangement of an isothermal
calorimeter is shown in Figure 2-15. When studying heat of hydration through isothermal
calorimetry, the instantaneous degree of hydration is defined as the ratio of heat evolved to the heat
of hydration at the complete cement hydration.
2.8.1 Heat flow and rate of hydration
The key output from the isothermal calorimetry is the heat flow (dQ/dt in W/g of the cement
content). A typical heat flow output for Portland cement paste has been shown in Figure 2-16 6.
The temperature dependent heat flow is evaluated to determine the cumulative heat release (Q∞ in
J/g of cement). With the synonymy of the rate of hydration and rate of heat release, the heat flow
evolution can be expressed as follows:
( ) ( ) ( ) ( )dQ
Q T Q Tdt
2-32
and therefore,
dQdtd
dt Q
2-33
where Q∞ is the final heat of hydration (in J/g of the cement content). Similar to the
hydration offset, the heat release offset needs to be established. Christensen (2009) mentions that
the “…onset of the rise in the curve after the induction period is considered to correspond closely
with the time of initial setting.” Therefore, a heat flow offset (Q0) can be set at this point to
correspond with the hydration offset (0). Now, the heat flow can be formulated as follows:
0 ( )dQ
Q Q Tdt
0 0with Q Q Q 2-34
The heat flow during cement hydration is affected by the same factors as the rate of
hydration. These include the clinker composition, clinker fineness, and temperature of the reaction.
These are discussed as below:
6 Bullard et al. (2011) have reported secondary peak as ettringite rejenuvation and tertiary peak as AFt
AFm phase change. Jansen et al. (2012) have reported the secondary peak as post sulphate depletion C3A
dissolution. Pratt and Ghose (1983) have reported tertiary peak as C4AF dissolution. This research takes
the view of secondary and tertiary peaks being related to C3A and C4AF dissolution, respectively.

25
Composition: The final heat of hydration depends on cement composition and can be
calculated based on the heat of hydration of the individual clinker compounds. Typical
values of heat of hydration for cement clinkers are listed in Table 2-4. It is to be noted that
C3A and C3S hydrate rapidly and can be used to modify the early age hydration reaction.
Additionally, alkali content and gypsum may also contribute to the early-age hydration
rate.
Fineness: Blaine fineness is used to represent the fineness of cement and represents the
surface area of ground clinkers. A finer cement has higher active surface area, and this
speeds up the rate of hydration during early age. However, final heat is not significantly
affected.
Temperature: The rate of an exothermic reaction depends on the temperature of reactants.
The higher the temperature, the higher the reaction rate. For the cement hydration, the
reactant temperature is typically referred to as the curing temperature. Higher temperatures
lead to a quicker hydration rate while total heat release remains unaffected. Figure 2-17
shows the impact of the curing temperature on the rate of heat flow and heat of hydration
development of cement pastes during isothermal curing.
2.8.2 Final heat of hydration determination
The exothermic process of Portland cement hydration reaction can release heat of up to 525
J/g of cement content (Copeland et al., 1960). A direct method of assessing the final heat of
hydration, Q∞, is knowing the accurate clinker composition of the cement. Since the final heat of
hydration of different clinker types is available in the literature, such as Lerch and Bogue (1934),
proportional contributions can be accounted to estimate Q∞ for a given cement sample.
3 2 3 4 3 502 260 866 418 623 1167 849C S C S C A C AF SO FreeCaO MgOQ w w w w w w w 2-35
where wi are the weighted fractions of the individual components. Thus, it is essential to
know the clinker content and other minor components. This clinker content determination can be
made by one of two methods:
1. Bogue method according to ASTM C 150 (2007). This method uses oxide content to
calculate clinker content and depends on the alumina-ferric ratio.
2. Rietveld method from quantitative X-ray diffraction analysis according to ASTM C 1365
(2006). This method directly recognises clinker phases and performs a semi-quantitative
analysis to estimate the clinker content.
In the past, the Bogue method was the prevalent one but has been known to provide
erroneous results for certain C-S ratios (Neville, 2004). The Rietveld method has been found to be
more accurate and reliable for determining the clinker contents (Brunauer et al., 1956; Brunauer et
al., 1959; Kantro et al., 1964; Taylor, 1997b). More recently, this method has been gaining
popularity and is being utilised more and more (Bezjak, 1971; Stutzman, 1996; Scrivener et al.,

26
2004; Snellings, 2016). Figure 2-18 shows a typical XRD pattern of a Portland cement. It requires
a specialist’s skill to do phase recognition and rigorous Rietveld analysis for a multiphase cement
powder.
Folliard et al. (2008) present an extended model for final heat of hydration of the
cementitious system with multiple supplementary cementitious materials and is as the following:
, 100 120461 550 1800 330CEM CEM GGBF GGBF FA CaO FA SFQ Q w w w w w w 2-36
where wCEM is the ratio of cement to total cementitious content; wGGBF−100 = ratio of Grade
100 blast furnace slag (GGBF slag) to total cementitious content; wGGBF−120 = ratio of Grade 120
blast furnace slag (GGBF slag) to total cementitious content; wFA is the ratio of fly ash to total
cementitious content; wFA−CaO is the ratio of fly ash CaO to total fly ash; and wSF = ratio of silica
fume to total cementitious content.
An approximate determination of the final heat of hydration is to use the 7-day heat of
hydration measured by isothermal calorimetric testing, conducted at 20°C, as the ultimate heat of
hydration, Qult. Using empirical equations such as described in Section 2.6.3, ult can be estimated.
Thus,
7
ult
dayQQ
2-37
2.8.3 Activation energy determination
The concept of activation energy, proposed by the Swedish scientist Svante Arrhenius in
1888, explains the reactiveness or the inertness of chemical reactants towards the formation of
reaction products (Carino and Lew, 2001). This concept is most useful to explain exothermic
reactions where the chemical reactants are in a higher internal energy state than the reaction
products.
The term “activation energy” represents an energy barrier which the reactants need to
overcome before the chemical reaction may occur. Carino and Lew (2001) gave a simple analogy
of a brick standing upright. The lower energy state of the brick would be lying down horizontally.
For the brick to achieve this lower energy state, it must be pushed to the point of instability. After
this point of instability, the brick would fall on its own. The energy needed to bring the brick to the
point of instability represents the activation energy for this process.
At molecular levels, the chemical reactions are modelled as the collisions of the moving
molecules, and the kinetic energy of the molecules is considered as the dominant part of the total
internal energy of the molecules. An appropriate increase in the kinetic energy of the molecules, by
means of temperature rise or stirring, would push them into a higher internal energy state and
across the threshold energy barrier. In cementitious systems that have achieved an initial set, this

27
barrier is overcome by variation in the temperature and may be quantified as the heat energy
needed to initiate the reaction.
The activation energy is determined experimentally by means of plotting natural logs of
temperature sensitive rate of reaction of cement hydration versus the inverse of temperature. The
rate of cement hydration is determined using the synonymy of the cement hydration reaction with
the mechanical properties of the concrete, such as compressive strength, or heat of hydration. This
typically involves methods such as strength testing of isothermally cured concrete samples, as
described in ASTM C 1074 (2011), or isothermal calorimetry of the cement pastes (Copeland et
al., 1960).
The activation energy concept, as well as the Arrhenius equation, involves the assumption
that the chemical reactions are occurring between two reactants only. It is not the case for the
cementitious hydration process due to the presence of polymineralic clinkers. However, this
approach of determining the activation energy has been reasonably applied by various researchers
(Copeland et al., 1960; Byfors, 1980; Wadsö, 2001; Poole et al., 2007). Therefore, the values
obtained through such testing are referred to as the “apparent” activation energy (D’Aloia and
Chanvillard, 2002).
When using the heat of hydration as the mode of the activation energy determination, a
simple process would include determining the following:
1. Conduct isothermal calorimetry for at least three different temperatures, e.g. 20, 30 and
40°C;
2. Find the maximum heat flow (dQ/dt in mW/g) information from each isothermal test;
3. Calculate the natural logarithms of the above heat flow values [ln(dQ/dt)];
4. Calculate the testing temperature in Kelvin, e.g. approximately 293, 303 and 313 K;
5. Calculate the inverse of these temperature values, e.g. 3.41, 3.30 and 3.19 (x10-3);
6. Plot the values from Step 3 vs the values of Step 5;
7. Fit a linear relationship to these values; and
8. The gradient of the linear relationship represents the negative of activation energy over
ideal gas constant (-Ea/R). See Figure 2-19.
The following is a representation of the above procedure and has been simplified for two
temperatures as follows:
2
1
a
1 2
ln
1 1
T
T
dQ dt
dQ dtE R
T T
2-38

28
where dQ/dt = maximum rate of heat flow at a given temperature.
Alternatively, many empirical relationships have been developed over the last few decades.
As noted previously in the maturity method section, Freieslaben Hansen and Pedersen (1977)
defined a temperature dependent relationship for activation energy as follows:
o
a 33,500 1470 20 – J/mol, for curing temperature 20 C c cE T T 2-39
o
a 33,500 J/mol for curing temperature 20 CcE T 2-40
Schindler (2004), from a review of various works, presents a wide range of activation energy
values ranging from around 33 kJ/mol to more than 60 kJ/mol. In his studies, he developed an
empirical relationship for activation energy calculation as follows:
0.3 0.3 0.35
a C3A C4AF22100 BlaineE w w 2-41
where wC3A and wC4AF are weighted ratios of C3A and C4AF, respectively, in terms of total
cement content and Blaine is Blaine fineness in m2/kg. In another formulation, Maekawa et al.
(1999) have recommended using clinker specific activation energy values7 to model the hydration
kinetics. This approach is limited by two aspects – a) it requires pre-information of the status of the
clinker specific hydration progression, and b) it cannot be applied during early ages of the cement
hydration process.
Poole (2007) notes that it is unreasonable to consider much older data as cement production
requirements have changed since then. In his research studies of the impact of admixtures on
activation energy of Type I cement (ASTM C 1679, 2008), he found that superplasticisers,
retarders and accelerators tend to reduce Ea, though change is highly dependent on admixture
composition and may vary substantially for each type. The research also demonstrated that addition
of inert supplementary cementitious materials such as silica fume considerably reduces activation
energy by promoting alite hydration. Wirquin et al. (2002) conducted isothermal tests for CEM I
with superplasticiser and concluded that it reduces activation energy in the order of 3 kJ/mol. From
the review of various literature such as Broda et al. (2002), De Schutter & Taerwe (1995), and
Zákoutský et al. (2012) have recommended the activation energy for CEM I to be 32.2 kJ/mol.
Since cement is a mixture of different clinkers and each clinker reacts at a different rate,
would this methodology be valid if the activation energy changes with the degree of hydration
rather than remaining constant throughout the hydration reaction? No clear answer has been drawn
on this. D’Aloia and Chanvillard (2002) report that it can be considered constant in the very early
age but a decrease of up to 40% may be observed in later stages. This lowering of the activation
energy value can be explained via the understanding of the hydration process moving from the
kinetics-controlled process to the diffusion-controlled process. Kada-Benameur et al. (2000) have
7 Maekawa et al (1999), using the works of Suzuki et al (1990), determined the activation energy values of
C3S, C2S, C3A and C4AF as 42, 21, 54 and 32 kJ/mol, respectively.

29
indicated that Ea can be considered as constant for 0.05< <0.5, but may vary considerably outside
this range.
With various studies presenting a wide range of activation energy values, conducting
experiments on the required concrete mix or cement samples would be the most rational approach.
For more accurate determination of the activation energy, a more detailed approach of incremental
activation energy determination may be used. In this incremental approach, Ea is calculated as a
function of the degree of hydration. For calculation purposes, the rate of heat flow data from all the
temperatures is plotted versus the heat of hydration. Now, the heat flow values for different
temperatures are used for the selected heat of hydration values, e.g. 50, 100, 150, 200 and 250 J/g
of cementitious material. Other intermediate values may also be used appropriately. However, at
higher values of the degree of hydration, such as 0.5 suggested by Kada-Benameur et al. (2000),
this approach of calculation or even use of the Arrhenius equation may no longer be an appropriate
representation of microstructural development. This essentially comes out to be the case for
samples cured at higher temperatures, which leads to the crossover effect.
2.8.4 Normalised affinity
Hellmich et al. (1999) used the sprayed concrete temperature evolution and strength testing
data from the work of Huber (1991) and established the sprayed concrete’s hydration kinetics.
Using the previously described rate of hydration (d/dt) relationship, they deduced the normalised
affinity (Figure 2-20) by assuming the activation energy value of 32 kJ/mol and after performing
non-linear regression analysis on the normalised affinity data, the following formulation was
proposed.
1
1
A
A
b
A d
A
eA a
c
2-42
where aA, bA, cA and dA are all constants with a hydration offset =0.05.
Cervera et al. (2002) defined normalised affinity as a product of chemical affinity A and
normalised permeability (). These parameters are defined as independent functions of the degree
of hydration. This definition utilises the porous media behaviour of the binding matrix and
confines the application of this behaviour up to the ultimate degree of hydration, ult (calculated
using Mills equation). The normalised affinity Ã() has the following formulation:
A A 2-43
where
0ult
ult
;A
A kk
2-44
and

30
ult
n
e
2-45
with k and n being the model parameters and A0 is the initial chemical affinity.
To create a generic experimental normalised affinity determination approach, a statement
from Chanvillard and D’Aloia (1997) is considered that by “…defining the hydration degree in
terms of relative quantity of heat already generated, it can be noted that the relative quantity of
generated heat versus age of curves are affine, whatever the isothermal curing temperature of the
concrete is, and the affinity ratio follows the Arrhenius law.” This statement is expanded by
defining the normalised affinity as the product of the affinity constant A from the Arrhenius
function [(T)] and a normalised function N(), varying between 0 and 1, calculated by dividing
rate of hydration curves of different temperatures (Figure 2-21) by their respective peak values
(Figure 2-22).
*A A N 2-46
where
max max
dQddtdt
Nd dQ
dt dt
2-47
A similar formulation of N() has been employed by Pang et al. (2013) to compare the
cement hydration kinetics measured by isothermal calorimetry and chemical shrinkage.
The affinity constant A (sometimes referred to as the chemical affinity) is determined from
the activation energy calculations and is shown in Figure 2-23. Since the plot is developed using
the heat flow values, the affinity constant of 13.835 represents the natural log of the product of the
final heat of hydration and the affinity constant, i.e., ln(Q∞*A). If one was to assume the final heat
of hydration value were 500 J/g, the affinity constant would be calculated at 2040 s-1.
As discussed in Section 2.8.1, the end of the dormant period is the time where the strength
development begins, and a hydration offset is needed to account for this. In isothermal calorimetry,
it is difficult to separate heat of wetting and the heat from initial cement hydration before the
dormant period (Copeland et al., 1960; Poole et al., 2007; Pang et al., 2013). It becomes more
challenging when a sample is mixed externally and inserted into the calorimeter. Therefore, an
exact value of hydration offset cannot be determined solely by isothermal calorimetry and requires
additional verification. A measure of bound water in cement paste is a good indicator of the degree
of hydration and may be determined by thermogravimetric testing, and is explained in the
following section.

31
2.9 Thermogravimetric analysis
Thermogravimetric analysis (TGA) is about measuring the loss of weight of a given sample
with a change in temperature. In the case of cement, testing temperatures of up to 1000°C can be
used to study the components of the weight of hydrating and hydrated cement phases, such as non-
evaporable water and carbonate content.
In cement pastes, water is found as either free, physically adsorbed, or chemically bonded.
The free water is found in the capillary pores and the large air void spaces. The free water is a
function of relative humidity and can easily be evaporated. The physically adsorbed water is
attached to the hydrated cement surface through hydrogen bonding. The third part is the chemically
bound water which exists in the clinker hydrates (including AFt and AFm), CH, CSH gel and
interlayered water. A representation of interlayered bound water in the CSH gel has been shown in
Figure 2-24.
2.9.1 Non-evaporable water content
The three forms of water content can be categorised as either evaporable or non-evaporable
water content, where the non-evaporable content is seen as a key indicator of degree of hydration
(Bogue and Lerch, 1934; Powers, 1949; Copeland and Hayes, 1953; Copeland et al., 1960;
Danielsson, 1974; Byfors, 1980; Feldman and Cheng-Yi, 1985; Molina, 1992; Pane and Hansen,
2005; Fagerlund, 2009; Lothenbach et al., 2016). In general, the evaporable water content is the
volatile content that be can be removed by drying the sample at 105°C or using another comparable
method of drying treatment, such as P-drying and D-drying. The volatile content determined by
igniting the hydrated cement sample from 105°C to 1000°C and corrected for the loss on ignition
and carbonate content, forms the non-evaporable water content.
Some researchers, such as Danielsson (1974) and Fagerlund (2009), classify the free and
physically adsorbed water as the evaporable content and the bound water as the non-evaporable
water content. Many researchers (based on the used drying method) classify the free water, most of
the physically adsorbed water and some of the chemically bound water (mainly from AFt) as the
evaporable content, and the rest as the non-evaporable content. Thus, as Mills (1966) notes, the use
of 105°C as the drying treatment temperature is an arbitrary choice. On the other hand, Taylor
(1997b) points out that only a certain part of the chemically bound water can be categorised as the
non-evaporable content, thus excluding all the adsorbed, CSH interlayer and AFt dehydration
related content. Taylor (1997b) recommends using the temperature of 150°C as the boundary
between the evaporable and non-evaporable content.
Figure 2-25 shows typical thermogravimetric weight loss and differential thermogravimetric
curves. Table 2-5 shows the major weight loss phases and the relative temperature range.

32
2.9.2 Non-evaporable water content to degree of hydration
To determine the degree of hydration from the non-evaporable water content, one needs to
know the non-evaporable content that can be reached by the cement at its complete hydration.
Since each clinker has its own hydrate product, thus, the non-evaporable content contribution will
be different from each clinker. Depending on the clinker content the maximum non-evaporable
content can vary from 18 to 26% by weight of cement, with an average value of 22.7% accepted in
general for all cement types (Neville, 2004). Many researchers (Bogue and Lerch, 1934; Powers
and Brownyard, 1946; Copeland et al., 1960; Byfors, 1980) have developed relationships to
estimate the content specific value of the maximum non-evaporable water content. If the clinker
content of the cement is known, these relationships can be utilised. A few of the useful
relationships to assess the maximum non-evaporable water content (in %) are as below.
3 2 3 4n,B&L 0.192 C S + 0.112 C S+ 0.365 C A+ 0.316 C AFw 2-48
3 2 3 4n,P&B 0.187 C S + 0.158 C S+ 0.665 C A+ 0.213 C AFw 2-49
3 2 3 4n,Czernin 0.24 C S + 0.21 C S+ 0.40 C A+ 0.37 C AFw 2-50
3 2 3 4n,CK&V,1 0.228 C S + 0.168 C S+ 0.429 C A+ 0.132 C AFw 2-51
where n,B&Lw ,
n,P&Bw , n,Czerinw and
n,CK&V,1w represent the clinker based non-evaporable
water content definition from the works of Bogue and Lerch (1934), Powers and Brownyard
(1946), Byfors (1980) [after Czernin (1959)], and Copeland et al. (1960), respectively, and C3S,
C2S, C3A and C4AF represent the respective clinker weight content in percentages. Although all of
these relationships have been developed based on data analysis of testing done on a large number
of samples, they all provide different estimates of maximum non-evaporable content. The
variability can be related to the methods used for the sample treatment and the testing environment,
or even the method of assessing the clinker content (such as Bogue method or Rietveld analysis)
could have created a large divergence in the relationships.
Out of the above four, wn,Czernin closely resembles the stoichiometry presented in Section
2.4.2, such as C3S2H3 and C3AH6. One may argue that since these are the most stable hydrates,
using wn,Czernin would be a rational choice. However, these stoichiometries are rarely achieved for
all the clinkers at once (Neville, 2004). Therefore, this choice cannot be used without due
consideration. Additionally, the hydration products, especially the one from C3A hydration, have a
tendency to change their formulation during hydration depending on factors such as ambient
temperature (Kurdowski, 2014). Hence, using a constant value for all ages, though a widely used
approach, may not be the right one as a standalone method to convert the non-evaporable content
value into the degree of hydration value (Copeland et al., 1960). Thus, either one may follow the
relationship specific to the sample treatment / testing environment, or follow general guidelines
such as provided in Lothenbach et al. (2016) and corroborate the outcomes with other methods
such as X-ray diffraction and calorimetry.

33
In addition to wn,CK&V,1, Copeland et al. (1960) also analysed the test data on the basis of the
molar content of the oxides present in cement, and can be formulated on weight basis as follows:
2 2 3 2 3 3n,CK&V,2 0.321 CaO 0.150 SiO + 0.882 Al O 0.563 Fe O 0.563 SOw 2-52
where all the oxide content represents the respective percentage contribution by weight.
Taylor (1997b) has simplified this relationship to a value of 20.4%, assuming content proportions
for a typical cement to be 65% CaO, 21% SiO2, 5.5% A12O3, 3.0% Fe2O3 and 2.3% SO3. Since
oxide content is more consistent than the clinker content (such as noted in Table 2-2), , & ,2n CK Vw
would be a more rational representation of the maximum non-evaporable water content.
2.10 Sprayed concrete strength determination
Mechanical testing for sprayed concrete requires more input than typical concrete strength
testing. Due to the importance of early age strength development, stringent testing criteria have
been developed (British Standards Institution, 2006a). Due to the construction method of the
sprayed concrete lining, in-situ testing is the most suitable approach for strength determination.
Although, from the personnel safety perspective, it is not appropriate to perform in-situ tests until
the lining has achieved sufficient strength (usually above 0.5 MPa). Therefore, test panels are used
for the early age testing. The test panels are required to be sprayed simultaneously with the lining
as this will provide the most appropriate strength development profile (British Standards
Institution, 2005b). Typical strength development specifications have been defined as curves and
are referred to as J1, J2 and J3 curves [EN 14487-1 (British Standards Institution, 2005a)] and are
shown in Figure 2-26.
The European Norm EN 14488-2 (British Standards Institution, 2006a) has specified two
stages of testing for early age strength – needle penetration and stud driving. These tests are valid
for a limited range of strength values beyond which core testing is used. Cores may be taken from
the sprayed panel or the tunnel lining. Table 2-6 summarises different testing methods and related
general information typically used for sprayed concrete tunnelling works.
2.10.1 Needle penetration test
For penetration needle testing, a penetrometer with a 3mm diameter needle and capable of
recording force to an accuracy of 10N is required. When using the penetrometer, it should be
applied perpendicularly to the sprayed concrete layer and the needle is pushed into a depth of 15
mm in a single continuous movement. The test should be repeated if a large piece of aggregate or
reinforcement causes any hindrance. The test should be conducted ten times as quickly as possible
and the average value is calculated. Figure 2-27 shows a widely used penetrometer by Meyco. The
Meyco penetrometer provides outcomes in kgf and is converted to MPa units using the calibration
charts provided in EN 14488-2 (British Standards Institution, 2006a) as shown in Figure 2-28.
From the figure, it can be seen that the penetrometer needle measurements can be as much as 30%

34
off the true value and thus, have a large margin of error. Using the calibration charts, the following
kgf to MPa conversions are obtained:
For aggregate size of 8 mm or less, 1kgf = 0.015 MPa 2-53
For aggregate size of up to 16 mm, 1kgf = 0.018 MPa 2-54
2.10.2 Stud driving test
Stud driving is a two-step test – percussively firing a calibrated stud and thereafter, a stud
pull-out with tensile loading equipment. Figure 2-29 shows a widely utilised and accepted stud
driving apparatus developed by Hilti Corporation (2009). The following is the testing procedure:
a. Load stud driving equipment;
b. Apply the equipment perpendicularly to surface of sprayed concrete and drive in stud;
c. Repeat step b. to insert 10 studs keeping sufficient spacing (at least 80 mm);
d. Measure the projecting length of stud to determine penetration depths of stud (I);
e. Fasten pull-out equipment onto projected ends and apply tensile load to extract (E);
f. Repeat step e for all studs in same sequence of insertion (per step c);
g. Record all the pull-out force values;
h. Determine the ratio of pull-out force to penetration length for each stud ( EI
);
i. Averaged value should be used. An empirical relationship translates this average value into
a compressive strength.
EN 14488-2 (British Standards Institution, 2006a) prescribes the following relationships to
convert E I into compressive strength (fc) (equivalent to 200 mm cube):
cConcrete with limestone aggregate up to 8 mm , 2.7
6
7.
9
EIf
2-55
cConcrete with limestone aggregate up to 16 mm , 0.02
6. 9
6
EIf
2-56
cConcrete with siliceous aggregate up to 16 mm , 3.32
5. 3
1
EIf
2-57
Hilti Corporation (2009) has developed an additional testing method, called ‘special-
method’, to determine strengths in the range of 17 – 56 MPa. The same apparatus is used but
requires the use of yellow cartridges and gun power setting to 2. It uses the following fc – E I
relationship.

35
c 0.152 1.82E
fI
2-58
2.10.3 Core testing
The later age compressive strengths of sprayed concrete, typically 24 hours onwards, are
normally determined from cylindrical cored samples. These cylindrical cores are drilled from the
sprayed concrete panels and/or linings for final strength compressive strength determination.
Figure 2-30 shows a core-drilling machine.
The core drilling and testing are performed in accordance with EN 12504-1 (British
Standards Institution, 2009). Typically drilled core diameter is 100 mm and height can be specified
to be one or two times the diameter. These tests provide cylindrical compressive strength (MPa)
and require a conversion factor (Kin-situ) for equivalent in-situ cube strength.
in-situ,cube
2.5
11.5
K
2-59
where λ = height/diameter ratio of the core.
2.11 Thermal monitoring
The maturity method requires thermal monitoring of the concrete since the time of its
installation. It needs embedment of thermal sensors such as thermocouples. The thermal sensors
are embedded into the concrete either by fitting them on to reinforcement bars (Tikalsky et al.,
2003) or simply scooping and refilling the top surface of the freshly installed concrete(Hansen and
Surlaker, 2006).
In the case of wire mesh reinforced sprayed concrete lining, a thermal sensor (such as a
wireless sensor by SmartRock 2) can be fitted on to the wire meshes before installing them. With
the compacting impact caused during the spray, one cannot be sure if the sensor will stay at its
position or be dislodged. It can also be damaged and stop working. For the fibre reinforced sprayed
concrete lining, the thermal sensors would have to be installed one by one by scooping the top
surface. The scooping and embedment process will cause a major safety hazard for the installation
personnel as well as create an obstruction to ongoing construction activities. Additionally, in both
types of installation approaches, the thermal monitoring will not be fully representative of the all
parts of the lining, and hence, the data will be of a local nature. In this scenario, a contactless and
remote method of thermal (infrared) sensing would be an approach to perform thermal monitoring.
2.11.1 Thermal imaging
Thermal imaging or infrared (IR) imaging is based on the approach of detecting infrared
radiations, unseen by the human eye, emitted by a body (Bhalla et al., 2011). This allows to
evaluate temperature differences on the surface of an object.

36
Based on wavelength, the infrared spectrum is recognised in three components – Near-IR
(0.7 to 1.3 μm), Mid-IR (1.3 to 3 μm) and Thermal-IR (3 to over 30 μm) (FLIR Systems, 2012).
The key difference between the thermal-IR and the other two is that thermal-IR is emitted by an
object instead of reflected off it (FLIR Systems, 2013). The emission is because of what is
happening at the atomic level. This thermal-IR emission difference is represented as temperature
measurement, since, the amount of radiation emitted by an object increases with temperature;
therefore, it allows one to see variations in temperature, with or without visible illumination (FLIR
Systems, 2013).
The thermal imaging process provides thermograms (similar to photographs for the visible
spectrum).
2.11.2 Thermal imaging and concrete
Thermal imaging has been extensively used for non-destructive evaluation of hardened
concrete since 1960’s (Arnold et al., 1969; Moore et al., 1973; Manning and Holt, 1980; Weil,
1984; Titman, 1990; ACI 228.2R-98, 1998; Buyukozturk, 1998; Titman, 2001; Clark et al., 2003;
Weil, 2004; Cheng et al., 2008; Vemuri and Atadero, 2017). Its major application has been
detection of internal voids, cracks, and delaminations in concrete structures, such as bridge decks
and concrete pavements. Since then, it has found its way in different standards pertaining to
concrete testing in late 1980’s, such as British Standards Institution (1986) and ASTM D4788-88
(1997).
Though extensively applied on hardened concrete, thermography has been scarcely used for
monitoring of concrete in its early age, such as Burlingame (2004) and Azenha et al.(2011). While
Burlingame (2004) utilised thermal imaging for the internal quality monitoring of freshly installed
concrete, Azenha et al.(2011) monitored early age temperatures from thermal cracking prospective,
which is closer to the concept of maturity method.
Any thermal imaging device, such as by FLIR Systems, that can sense temperatures between
-20°C and +120°C (a reasonable assumption for sprayed concrete curing temperatures) would be
sufficient for the thermal monitoring purposes. This research will use one such thermal imaging
device.

37
Table 2-1 Typical steel fibre reinforced sprayed concrete mix (wet process)
Content Quantity (kg/m3) Ratio/dosage*
Cement (CEM I) 425 -
Water 195 0.46
Fine Aggregates (< 0.5 mm) 580 -
Fine Aggregates (0.5/4) 580 -
Coarse Aggregate (4/8) 500 -
Microsilica (Silica Fume) 30 7.1%
Steel Fibres 35 -
Retarder 1.3 0.3%
Superplasticiser 4.5 1.2%
Accelerator (added at spray nozzle) 21 – 25 5 – 6%
* Proportions are presented on cement weight basis
Table 2-2 Typical oxide and clinker content for CEM I
Oxide Content Clinkers Content
CaO C) 63-67% 3CaO.SiO2 C3S 55-65%
SiO2 (S) 18-20% 2CaO.SiO2 C2S 10-15%
Al2O3 (A) 3-5% 3CaO.Al2O3 C3A 7-9%
Fe2O3 (F) 3% 4CaO.Al2O3. Fe2O3 C4AF 6-8%
MgO 1.0-1.2% CaSO4.xH2O CS̅H2 5-6%
Alkali 0.3 -0.7%
SO3 (S̅) 2-3%
Table 2-3 Typical properties of sprayed concrete (Thomas, 2008)
Property Unit Age High quality sprayed
concrete
Compressive strength MPa 1 day 20
Compressive strength MPa 28 days 59
Elastic modulus GPa 28 days 34
Poisson’s ratio,v, - 28 days 0.48 - 0.18
Tensile strength MPa 28 days > 2 (est.)
Initial setting time mins (start - end) 1 – 3
Shrinkage % after 100 days 0.1 – 0.12
Specific creep % /MPa after 160 days 0.01 - 0.06
Density kg/m3 - 2140 – 2235
Total porosity % - 15 – 20
Permeability m/s - 2.0 x 10⁻¹² to 10-14
Microcracking cracks/m 28 days 1300
Coefficient of thermal expansion 1/K - 8.25 – 15 x 10-6
Table 2-4: Heat of hydration for pure compounds of cement clinkers (Lerch and Bogue,
1934)
Clinker Content Heat Release (J/g)
C3S 502
C2S 260
C3A 866
CAAF 418
S̅ 623
Free lime (CaO) 1167
Magnesia (MgO) 849

38
Table 2-5 Weight loss of cement paste with increase in temperature (Alarcon-Ruiz et al.,
2005)
Temperature Weight loss source
30 – 105°C removal of evaporable water
110 – 170°C decomposition of gypsum; ettringite / AFt;
partial decomposition of carboaluminate hydrates
180 – 300°C decomposition of CSH and carboaluminate hydrates
450 – 550°C dehydroxylation of CH
700 – 900°C decarbonation of calcium carbonate
Table 2-6 Typical SCL tests and related scope for urban tunnels
Stage Test Type Strength
range
Time and
Frequency
Typical Test
Apparatus
1 Penetration Needle 0.1 to 1.0 MPa Up to 1 hour
Mins –15, 30,60 Meyco Penetrometer
2 Stud Driving 3.0 to 16.0
MPa
Up to 24 hours
Hours – 3, 6, 12, 24
or as necessary
Hilti DX 450-CT with
pull-out apparatus
3 Core testing(Cores
from panels / lining)
16.0 MPa or
more
Up to 28 days
Days – 1, 3, 7, 14, 28
Compression Testing
machine

39
Figure 2-1 Schematic of wet spraying process (Thomas, 2003)
Figure 2-2 Schematic view of dry spraying process (Thomas, 2003)

40
Figure 2-4 Typical grading curve for the sprayed concrete (EFNARC, 1996)
Figure 2-3 NATM support measures (von Rabcewicz, 1965)

41
Figure 2-6 Phases of concrete strength development (Byfors, 1980)
Figure 2-5 Inverse relationship between concrete compressive strength and
concrete porosity [Jones (2007) after Byfors (1980)]

42
Figure 2-8 Compressive strength development in clinker pastes [redrawn from Bogue
and Lerch (1934)]
Figure 2-7 Rate of clinker hydration on initial content basis [drawn using
fixed water content data from Bogue and Lerch (1934)]

43
Figure 2-9 Cement paste microstructure development during the hydration process [Kurdowski (2014) after Scrivener and Pratt (1984)].
a) unhydrated cement grain; b) after 10 min; c) after 10 h; d) after 18 h; e) during the 1–3 days; and f) after 14 days.

44
Figure 2-10 Formation of hydration products [Kurdowski (2014) after
Locher and Richartz (1974)]

45
Figure 2-11 Compressive strength and degree of hydration relationship of various
concretes of different w/c ratios [Jones (2007) after Byfors (1980)]
Figure 2-12 Nurse-Saul maturity function (Carino, 2004)

46
Figure 2-13 Impact of activation energy value for age conversion factors
at different temperatures. Tr = 23°C (Carino, 2004)
Figure 2-14 “Cross-over effect” in strength development caused
by curing temperature (Carino and Lew, 2001)

47
Figure 2-16 Typical heat flow curve observed during isothermal
hydration of Portland cement at 20°C
Figure 2-15 Schematic arrangement of isothermal heat
conduction calorimeter (Wadsö, 2003)

48
Figure 2-17 Rate of heat release and heat of hydration of cement pastes
during isothermal curing (Escalante-Garcia and Sharp, 2000)
Figure 2-18 Powder X-ray Diffraction pattern for ferrite rich cement
residue from nitric acid / methanol extraction (Stutzman, 1996)

49
Figure 2-19 Activation energy determination by plotting natural logs of
rate of reaction vs inverse of temperature (K).
Figure 2-20 Hydration kinetics for shotcrete – normalised affinity (Hellmich et al., 1999)

50
Figure 2-21 A plot of rate of hydration vs degree of hydration from isothermal
calorimetry (Ahuja and Jones, 2016)
Figure 2-22 Normalised rate of hydration curves obtained from rate of hydration
vs degree of hydration shown in Ahuja and Jones (2016)

51
Figure 2-23 Activation energy and affinity constant determination
[deduced from Ahuja and Jones (2016)]
Figure 2-24 CSH gel structure model for hydrated Portland
cement (Feldman and Sereda, 1968)

52
Figure 2-25 Typical thermogravimetric and differential thermogravimetric
curves of hydrated cement paste (Almeida and Sichieri, 2006)
Figure 2-26 Early strength classes of young sprayed concrete (redrawn from EN
14487-1:2005)

53
Figure 2-27 Meyco Needle Penetrometer
Figure 2-28 Calibration curve for needle penetrometer (redrawn from
EN 14488-2:2006)

54
Figure 2-30 Core drilling machine (image credit www.JZX-tools.com)
Figure 2-29 Hilti DX-450CT Testing Apparatus – Pneumatic gun, stud and pull-
out equipment

55
3 Research methodology
This chapter describes the overall research methodology providing key details in terms of
research basis, prerequisites, experimental programme and the site application procedure.
The methodology has been divided into three aspects, namely thermo-chemical evaluation of
the cement pastes, thermal-mechanical evaluation of the sprayed concrete, and thermo-chemo-
mechanical modelling of the sprayed concrete lining.
The thermo-chemical evaluation involves isothermal calorimetry and thermogravimetric
testing of the cement pastes. The test results are evaluated to determine maturity function input
parameters, namely the activation energy, affinity constant and normalised kinetics.
The thermo-mechanical evaluation involves strength testing and thermal imaging of the
sprayed concrete test panels. The test results are evaluated to establish the strength – maturity
relationship, where maturity is determined by applying the thermo-chemical evaluation outcomes
on to the thermal imaging data.
The thermo-chemo-mechanical modelling presents a simplified approach of thermal imaging
of the sprayed concrete lining, and subsequently, describes the use of the thermo-chemical and
thermo-mechanical outcomes for the non-destructive strength assessment of the sprayed concrete
lining.
The overall metholodgy was applied at two construction sites, namely Whitechapel station
platform tunnels and Bond St station upgrade works. The thermo-chemical and thermo-
mechcanical testing details for each site are provided in a later section of the chapter.
3.1 Research aim and objectives
The overall aim of the research is to apply the maturity method for non-destructive strength
assessment of the sprayed concrete lining. The maturity method, as applied in concrete science,
requires measuring concrete’s temperature history to model the maturity development. The
maturity is further correlated to a concrete mix specific strength – maturity relationship to assess
the strength development. Thus, there are two aspects of the maturity method – a) maturity
modelling; and b) establishing strength – maturity relationship. With the view of addressing these
two aspects for the sprayed concrete lining, the following objectives are laid for this research:

56
a. choosing the concrete’s maturity development assessment basis;
b. selection of maturity modelling function;
c. assessing the sprayed concrete mix specific input parameters for the maturity
function;
d. establishing the maturity modelling procedure for sprayed concrete;
e. sprayed concrete mix specific strength testing and thermal monitoring;
f. establishing strength – maturity relationship for sprayed concrete mix; and
g. establishing thermal monitoring procedure for sprayed concrete lining.
These objectives are achieved by conducting two case studies, each related to the sprayed
concrete lining works of different tunnel construction sites.
The first four of the seven objectives pertain to maturity modelling of the sprayed concrete
and are to be addressed through a thermo-chemical evaluation of the sprayed concrete mix based
cement pastes. The thermo-chemical evaluation involves evaluating isothermal calorimetry
outcomes in conjunction with the thermogravimetry testing.
The fifth and sixth objectives are addressed through a thermo-mechanical evaluation of the
sprayed concrete, and are built on the thermo-chemical evaluation outcomes. The sprayed concrete
strength testing is made on sprayed concrete test panels. The strength testing methods include
penetrometer needle, stud-driving and core testing. The thermal monitoring involves measuring the
sprayed concrete’s temperature using an infrared camera.
The final objective addresses the special requirements of the thermal monitoring of the
sprayed concrete lining structure with a large circumferential spread.
While the experimental methods used in thermo-chemical and thermo-mechanical evaluation
are not uncommon, the novelty of the research lies in:
i. establishing a unique thermo-chemical experimental programme;
ii. the evaluation of thermo-chemical data to obtain maturity function input parameters;
iii. establishing a sprayed concrete maturity modelling procedure;
iv. establishing a thermal monitoring programme for sprayed concrete; and
v. establishing a thermal monitoring approach for sprayed concrete lining.
3.2 Research basis
The research concept is based on the maturity method, and it relies on the selection of the
maturity function and establishing the strength – maturity relationship (as discussed in Section
2.5). The maturity function models the cement hydration progression and the strength – maturity

57
relationship relates the concrete strength development to its maturity development, where the
concrete maturity is synonymous with the cement hydration development. In Section 2.5, it was
concluded that the cement hydration development could be modelled using an Arrhenius equation
based maturity function, given by:
a
0
E
RTdA e
dt
3-1
where d dt is the rate of cement hydration (s-1), 0 is the normalised kinetics of
cement hydration reaction as a function of degree of hydration (), 0 is the threshold degree of
hydration value after which the strength development begins, A is the affinity constant (s-1), Ea is
the activation energy (J.mol-1), R is the ideal gas constant (8.314 J.mol-1.K-1), and T is the absolute
temperature (K). It was also concluded that each concrete mix holds a unique strength – maturity
relationship, but only after a certain degree of cement hydration (or a threshold) has occurred.
3.2.1 Maturity method – application and prerequisite
Key steps for estimating the concrete strength development through the use of maturity
method are:
1. Thermal monitoring of concrete to record its temperature evolution history.
2. Convert the temperature evolution history into hydration development history using the
Arrhenius equation based maturity function.
3. Convert the hydration development history into the strength development history.
Application of the above methodology requires:
a) a thermal monitoring device/system;
b) establishing the maturity function modelling input parameters, such as the activation
energy; and
c) establishing the relationship between concrete strength and maturity.
Current research used thermal imaging for thermal monitoring, a thermo-chemical
evaluation of the sprayed concrete mix to establish the maturity function input parameters, and a
thermo-mechanical evaluation to establish the strength – maturity relationship.
3.3 Thermo-chemical evaluation
The heat of hydration and the non-evaporable water content developments of a hydrating
cement paste can be directly related to its degree of hydration development (Copeland et al., 1960).
Isothermal calorimetry and thermogravimetry are useful methods to study the heat of hydration
(Copeland et al., 1960; Sandberg and Walsh, 2010) and the non-evaporable water content (Powers,
1949; Copeland and Hayes, 1953; Wang et al., 2015), respectively.

58
A standalone isothermal calorimetric testing is useful to determine the activation energy of
the cement hydration reaction (Copeland et al., 1960; Wirquin et al., 2002; Sandberg and Walsh,
2010). To deduce the normalised kinetics and the affinity constant from the calorimetry data, one
needs to know the final heat of hydration value (Section 2.8.4). In current research work, a
calorimetric vs thermogravimetric evaluation has been used to estimate the final heat of hydration
of the cement. In general, a cement paste was tested at four different temperatures with four or
more thermogravimetric tests performed at different ages for each temperature, providing at least
16 data points for the final heat of hydration analysis. The 16-point evaluation methodology is
referred to as four temperature – four age (4T – 4A) thermo-chemical evaluation. Since each
sprayed concrete mix has multiple cementitious materials as well as admixtures, a systematic study
is made to understand the impact of each component on the cement hydration. The Whitechapel
station mix investigation involved four cement pastes and the Bond St mix investigation involved
eight cement pastes.
3.3.1 Isothermal calorimetry
Isothermal calorimetry was performed on the cement pastes based on the field case study
specific sprayed concrete mixes. A cement paste should include all the constituents that influence
the cement hydration reaction, and thus, involves the use of cementitious materials and admixtures
along with the cement and water.
The isothermal testing was performed using a four channel I-Cal 4000 HPC calorimeter
(Figure 3-1 and Figure 3-2), manufactured by Calmetrix. The I-Cal 4000 HPC requires external
mixing of the cement paste samples. It has the capability of running four samples, with 125 ml
containers, at once. It is operated through the Calcommander software, both for the temperature
control and the data logging.
The cement paste testing is performed at four different temperatures, namely 10, 20, 30, and
40°C. The sample preparation and the testing procedures were based on the manufacturer’s
guidelines and involved the following steps:
a) Set up the calorimeter at the required temperature and let it stabilise for up to 24 hours;
b) Prepare the water sample, including any liquid admixtures (such as superplasticiser and
retarder), and insert it in a calorimeter channel for conditioning for at least 3 hours;
c) Prepare the cement powder sample, including any other powder ingredients, in another
container;
d) Retrieve the conditioned water sample and add the cement and other powder ingredients;
e) Quickly mix the water and cement sample, insert into the calorimeter channel and start
data logging at 1-minute frequency;
f) After 30 minutes, retrieve the sample for the accelerator addition;

59
g) Add accelerator, stir vigorously for a few seconds and quickly reinsert the sample into the
calorimeter channel; and
h) Log data for seven days at a 1-minute frequency or until the measured heat flow is above-
established baseline flow, whichever is earlier.
The target test duration of 7 days was chosen. The duration, however, was shortened for tests
at the higher temperatures (such as at 40°C) and it was prolonged for the lower temperatures, (such
as at 10°C). The logged data includes voltage measurement and was converted into Power or Heat
flow (dQ/dt) by Calcommander. This heat flow data were extracted for the analysis purposes.
Calorimetric data processing
The logged rate of heat release (dQ/dt) data was obtained in Watts (W) and studied on per
gram of cement basis, i.e. W/g. Using Microsoft Excel, the rate of heat release data was integrated
to establish the heat of cement hydration (Q in J/g of cement) development history. Figure 3-3
shows a rate of heat release curve (dashed line) measured under 20°C isothermal curing. The solid
line represents the heat of hydration curves established from the rate of heat release data. Next, the
rate of heat release is plotted versus the heat of hydration and is useful to define the rate of heat
release as a function of the heat of hydration (Figure 3-4).
3.3.2 Thermogravimetry
Thermogravimetry provides information on the sample weight loss with the increase of
temperature. For the cement pastes, it can be used to determine the non-evaporable water and, thus,
estimate the degree of hydration of the sample at a given age. The thermogravimetric testing was
performed on the isothermally cured cement pastes at four different stages of hydration (such as
the dormancy flow and the peak flow) and have been marked in Figure 3-4. Since these stages
occurred at different ages for different temperatures, the testing age varied but had similar a degree
of hydration.
The sampling method for the thermogravimetric testing required disturbing the isothermal
curing conditions of the cement paste. Thus, each cement paste required an additional isothermal
testing as an independent and disturbed sample.
This thermogravimetric testing was performed using a PL-STA 1500 (Figure 3-5),
manufactured by Polymer Laboratories. PL-STA 1500 is operated using a thermal analysis
software, InfinityPro. The testing involved igniting the cement paste from room temperature to
1150°C with data logging at 1-second frequency. The equipment was calibrated for the sample
weights of 15 to 20 mg with a platinum crucible and a 50 ml/min flow of argon gas.
The sample ignition procedure is of generic nature, and was based on the laboratory
technician’s experience along with the guidelines noted in Lothenbach et al. (2016) . The sample
preparation approach was of unique nature. It did not employ any external drying methods (such as

60
P-drying and oven-drying), rather the sample was dried inside the furnance itself for 30 mins under
the inert environment of the argon gas. This deviation was needed to minimise the impact of the
accelerator on the cement hydration when testing the admixed cement pastes. The internal drying
approach was also applied for all cement pastes (with and without admixtures) for the purpose of
consistency. The overall testing procedure was as follows:
a) Retrieve the hydrating cement paste sample from the calorimeter channel;
b) Prepare the sample by grinding the paste to a particle size of less than 200 microns;
c) Add about 15 mg of the ground sample into the platinum crucible;
d) Close the furnace and start the argon gas at 50 ml per minute flow rate;
e) Increase the furnace temperature to 105°C @ 20°C per minute and hold for 30 minutes;
f) Increase the furnace temperature to 1150°C @ 20°C per minute and hold for 10 minutes;
and
g) Stop and let the furnace cool down.
Note that the furnace temperature was first raised from room temperature to 105°C and held
at that temperature for 30 minutes to remove all free water from the sample. Figure 3-6 is the
graphical representation of the described procedure. The non-evaporable water calculations were
made from weight loss occurring between 140°C to 1000°C with the correction for CO2 release at
around 700°C. The correction was determined by performing thermogravimetry on anhydrous
cement powder. Other weight loss corrections, due to the supplementary cementitious materials
and the admixtures, were also accounted for during the data processing.
Thermogravimetric data processing and analysis
The logged thermogravimetric data were imported and processed using Microsoft Excel.
Figure 3-7 shows sample weight loss profiles measured for an anhydrous cement sample (solid
line) and the hydrated cement sample (dashed line). Here, the anhydrous cement sample has a
weight of 100%, 99.7% and 96.5% at room temperature, 140°C and 1000°C, respectively.
Similarly, the hydrated cement sample has a weight of 100%, 96.8% and 83.4% at room
temperature, 140°C and 1000°C, respectively.
For the non-evaporable water content analysis, the measured data is evaluated on an ignited
mass basis, where ignited mass (measured at 1000°C) is treated as 100%, as shown in Figure 3-8.
Now, the anhydrous cement sample (solid line) has a weight of 103.6%, 103.4% and 100% at room
temperature, 140°C and 1000°C, respectively. The 3.4% weight loss between 140°C and 1000°C
represents the correction. Similarly, the hydrated cement sample has a weight of 119.6%, 116.1%
and 100% at room temperature, 140°C and 1000°C, respectively. The 16.1% weight loss between
140°C and 1000°C represents the uncorrected volatile content. Applying the correction of 3.4%,
the corrected volatile content is determined to be 12.7% on an ignited mass basis (measured at
1000°C). To arrive at the non-evaporable water content, the corrected volatile content of 12.7% is
divided by the initial cement mass of 103.6%, and provides the value of 12.3% as the non-

61
evaporable water content. Dividing the determined value of 12.3% with the maximum non-
evaporable water content of 20.4% (Section 2.9.2), the degree of hydration is calculated as 0.60.
In the case of a cement paste with supplementary cementitious materials and admixtures, the
above data will be processed in the same fashion to determine the corrected volatile content of
12.7% but would have the different initial cement content. As an example, let us assume the
cement paste was prepared using 90 g cement and 10 g microsilica and provided the same weight
loss profile as shown with solid line in Figure 3-7. The initial cement mass on ignited mass basis
would be 93%, and thus, the non-evaporable water content would be 12.7/93.3 = 13.6%.
Comparing it with the maximum non-evaporable content of 20.4%, the degree of hydration would
be calculated as 0.67.
3.3.3 Calorimetric – thermogravimetric evaluation
The calorimetric – thermogravimetric evaluation was made to establish the final heat of
hydration value. Four thermogravimetric tests were conducted for each cement paste at every
isothermal curing condition, and thus, four degree of hydration assessments for each isothermal
curing temperature. First, the measured heat of hydration values corresponding to the
thermogravimetric testing ages were extracted from the isothermal calorimetric results (such as
shown in Figure 3-3). Next, a plot of calorimetric heat vs thermogravimetric degree of hydration is
prepared, such as shown in Figure 3-9 for a cement paste isothermally cured at 20°C. The slope of
a linear relationship between the calorimetric and thermogravimetric data was adopted as the value
of the final heat of hydration (568 J/g in this case). For an increased statistical reliability, the final
heat of hydration value was deduced by using 16 data points for each cement paste (four
thermogravimetric outcomes from the four different curing temperatures).
Dividing the rate of heat release vs heat of hydration values, shown in Figure 3-4, by the
final heat of hydration value provides the rate of hydration evolution as a function of the degree of
hydration or simply the cement hydration kinetics (shown in Figure 3-10).
3.4 Maturity function input parameters
3.4.1 Activation energy and affinity constant
The activation energy determination requires using the peak rate of heat release values (such
as 3.76 mJ/g for 20°C curing seen in Figure 3-3) obtained from the four isothermal testing
temperatures. The activation energy determination for the cement pastes has been discussed in
Section 2.8.3. The affinity constant is an outcome of the activation energy calculations as discussed
in Section 2.8.4.

62
3.4.2 Normalised kinetics
The normalised kinetics represents the evolutionary path of the normalised rate of cement
hydration as the degree of hydration progresses. The normalised hydration kinetics (Figure 3-11)
was deduced by dividing hydration kinetics by its peak value (such as 6.62x10⁻⁶ s-1 in Figure 3-10)
providing a normalised hydration kinetics evolution as a function of the degree of hydration or
simply referred to as the normalised kinetics curve. The normalised rate of hydration (vertical axis)
can vary from 0 to 1.
For normal concrete, the normalised kinetics is independent of the curing temperature and in
this respect it is similar to the equivalent age concept of the maturity method. In the case of a
sprayed concrete mix, the use of admixtures caused divergence from the temperature independent
normalised kinetics. The related results and discussions are presented in Chapters 4 and 6 for
Whitechapel Station and Bond St sprayed concrete mixes, respectively.
3.5 Thermo-mechanical evaluation
The thermo-mechanical evaluation consisted of the thermal monitoring and strength testing
of the sprayed concrete. The thermal monitoring data was used to model the maturity development
of the sprayed concrete and was correlated with the strength development data to establish the
strength – maturity relationship.
3.5.1 Strength testing
In-situ strength testing was made on the sprayed concrete test panels (sprayed on
construction sites). The testing methods included the use of the needle penetrometer, stud-driving
and uniaxial compression testing of in-situ cores. The testing procedure and required calculations
have been discussed in Section 2.10. In terms of the strength testing frequency, the site specific
sprayed concrete strength testing practices were adopted. Since each testing method is applicable
for a certain range of strength (as noted in Table 2-6), the test method at the time of testing had to
be kept flexible.
Due to its construction method, the sprayed concrete is prone to variations such as its
heterogeneity, the nozzleman’s workmanship and the spraying equipment. Therefore, multiple sets
of panels (with each set having multiple panels) were tested to provide statistical reliability of the
testing results.
3.5.2 Thermal monitoring
A thermal imaging camera was used to monitor the surface temperature of the sprayed
concrete test panels. A capability of simultaneous thermal and digital imaging was required for
best record keeping for the temperature history development. For this reason, a FLIR E60bx was

63
used (see Figure 3-12). It can measure temperature in the range of -20°C to 120°C. An emissivity
factor of 0.95 was used for the sprayed concrete thermal imaging.
The sprayed concrete thermal imaging frequency was varied from few minutes, during first
hour after spray, to few hours after 24 hrs age.
3.5.3 Strength – maturity evaluation
The strength testing and thermal monitoring information were used to establish the strength
development and temperature evolution histories of the sprayed concrete. A sample plot of panel
strength and temperature histories is shown in Figure 3-13. The temperature histories were used to
model the rate of cement hydration evolution and the degree of cement hydration development
histories (Figure 3-14) using the modelling parameters established through thermo-chemical
evaluation. For an increased calculation accuracy, the temperature histories were discretised for
every 0.1 hours through linear interpolation and incrementally stepped for the degree of hydration
calculation, using modelling parameters determined through thermo-chemical evaluation. Next, the
degree of hydration values at the time of strength testing were deduced, and the strength vs
hydration plot was prepared (Figure 3-15). Since concrete is known to have a linear strength –
maturity relationship (Byfors, 1980; Carino et al., 1983), a linear strength – maturity relationship
was established. An evaluation of the relationship (Figure 3-16) presented some questions on the
application of the maturity method to the sprayed concrete as a material. The thermo-mechanical
results and related evaluations for the two case studies are presented in Chapters 5 and 6,
respectively.
Applicability of strength – maturity relationship
All the strength tests used in this research were performed in the top 100mm layer of the
sprayed concrete, thus, the strength – maturity relationship is relevant to the outer 100mm of the
sprayed concrete. Furthermore, since thermal imaging the temperature of the sprayed concrete
surface, the maturity can only be estimated for the near-surface zone of the sprayed concrete. Here,
it is assumed that the maturity modelling procedure and the strength – maturity relationship remain
valid for the outer 100 mm of the sprayed concrete lining.
A sprayed concrete lining has two surfaces. One is exposed to the air and the other is
exposed to the ground. If both the air and ground were considered to be the equivalent heat sinks,
the ground-side outer zone’s maturity development would be same as the air-side zone. Thus, the
strength – maturity relationship may be applied to the lining thicknesses of up to 200mm.
As the lining thickness increases, the heat of hydration conduction becomes inefficient and
builds up inside the sprayed concrete. The higher temperature will lead to an increased rate of
hydration. The maturity will therefore be under-estimated for the interior of the lining. Thus, the
interior of lining would have a maturity higher than the outer zone, and hence, will be stronger than
the outer zone.

64
3.6 Thermo-chemo-mechanical modelling of sprayed concrete lining
The final goal was to assess the sprayed concrete lining strength development. It involved
performing thermal monitoring of the sprayed concrete lining sections using thermal imaging. A
few lining sections were chosen for the thermal monitoring purposes. The thermal monitoring was
started after the spraying works of the final layer of the lining section had been completed.
Since the lining is a spread-out structure, thermal measurements only at key locations of the
lining sections (such as crown, shoulder and spring line) were made (Figure 3-17 and Figure 3-18).
Thus, the lining strength development is modelled for the key locations only. The thermal
monitoring frequency remained similar to the one used for the test panel thermal monitoring. The
following were the steps for the thermo-chemo-mechanical modelling of the sprayed concrete
lining:
1. Measure the lining surface temperatures (using thermal imaging) at the crown,
shoulders, and springline level;
2. Use the temperature measurements to develop the temperature history for each location;
3. Perform the linear interpolation of the temperature histories for every 0.1 hours;
4. Calculate the lining hydration development histories using the temperature history from
Step 3 and the modelling parameters, per Sections 3.3 and 3.4;
5. Apply the strength-hydration relationship, per Section 3.5.3, to the hydration
development histories from Step 4 to develop the lining strength development history.
The thermo-chemo-mechanical modelling would use the fully evaluated strength – maturity
relationship (instead of the one shown in Figure 3-15).
3.7 Case studies
The thermo-chemical and thermo-mechanical evaluation methodology was applied at two
construction sites, namely, Whitechapel Platform Tunnels and Bond Street Station Upgrade works.
The first case-study (Whitechapel station primary lining works) is used to streamline the
overall evaluation procedure based on the practical challenges faced. The second case-study (Bond
Street station secondary lining works) uses the streamlined evaluation procedure to see if the
methodology would work on another site.
3.7.1 Whitechapel Station Platform Tunnels – primary lining works
Whitechapel platform tunnelling works were part of the Crossrail project at Whitechapel
station in London, United Kingdom. The construction works were performed by BBMV, a joint
venture of Balfour Beatty, BeMo Tunnelling, Morgan Sindall, and Vinci Construction. The site
work included construction of a complex layout of shafts, platform tunnels, cross passages and
escalator barrels ((Figure 3-19). The tunnelling works involved sprayed concrete for both the

65
primary and the secondary lining works. The case study was undertaken during primary lining
works.
The sprayed concrete mix at the Whitechapel station works involved various ingredients –
cement, water, aggregates, microsilica slurry, steel fibres, superplasticiser, retarder, and
accelerator. All three admixtures are used in liquid form. The mix constituents are listed in Table
3-1.
The sprayed concrete mix was thermo-chemically evaluated via a parametric testing of four
cement pastes and were based on the specific mix proportions. The parametric testing was made to
understand the impact of the addition of the microsilica slurry and admixtures on the cement
hydration development. The content details of the four cement pastes were as follows:
a. WC1 paste including the cement powder and water;
b. WC2 paste including the cement powder, water and microsilica slurry8;
c. WC3 paste including the cement powder, water and admixtures; and
d. WC4 paste including the cement powder, water, microsilica slurry, and admixtures.
The above cement pastes were prepared in accordance with the site-specific sprayed
concrete mix proportions, and excluded aggregates and steel fibres. The mix constituents are listed
in Table 3-2.
With the use of admixtures, the WC3 and WC4 pastes are classified as above the ‘mix’
pastes, whereas the WC1 and WC2 pastes are classified as the ‘plain’ pastes. The WC4 paste
corresponds to the sprayed concrete mix.The detailed compositions of the pastes are listed in Table
3-2. With the addition of different components in the cement pastes, the w/c ratio varies from 0.41
(WC1 paste) to 0.51 (WC4 paste).
The thermo-mechanical evaluation was made through on-site strength testing and infrared
imaging of the sprayed concrete test panels. The sprayed concrete mix was designed for the wet
spray process and was sprayed using a Meyco Potenza (Figure 3-20), an 8 m long 4-wheel drive
mobile unit fitted with a Meyco Compacta boom (providing a spraying range of more than 15 m).
The concrete was pumped through Meyco Suprema 30, a double cylinder recipocatory pump,
which was mounted on the the spraying rig itself. The accelerator (Gecederal F 2000 HP) was fed
into the nozzle of Meyco Potenza in liquid form and added to the concrete right before the spray.
The site testing was undertaken over a period of few months, and involved spraying of eight
sets of five test panels, (thus, a total of 40 panels) under real time site conditions, where the five
panels in each set were sprayed at once. All sets of panels had same mix but were exposed to
8 The microsilica slurry was 50% microsilica solid and 50% water. Since the testing program was spread
over a few months, the slurry composition may have changed due to water evaporation. For consistency
purposes, the microsilica was added in powdered form and slurry equivalent water was added separately.
This applied to both the WC2 and WC4 pastes.

66
different environmental conditions (such as exposure to equipment heat and ventilation), and are
discussed in Chapter 5 with the dates, time and locations of the test panel sprays summarised in the
relevant appendices.
Each panel had a wooden formwork and provided a clear testing surface of 600 mm x 600
mm with a depth of 150 mm. A sprayed and tested panel has been shown in Figure 3-21. While the
strength testing was performed on the wider area of the panel (Figure 3-21a), the temperatures of
the central core surface were used to prepare the sprayed concrete temperature histories (as noted
in Figure 3-21b). The frequency of the thermal monitoring varied from every few minutes during
the first hour after spraying to every 6 hrs after the age of 24 hrs. The thermal monitoring was
undertaken for the test panels and the tunnel lining works.
3.7.2 Bond Street Station Upgrade – secondary lining works
Bond Street station, part of the London Underground railway scheme, required an upgrade to
accommodate features such as step-free access and connection to the new Crossrail station. The
construction works were undertaken by CoLOR, a joint venture of Costain and Laing O’Rourke.
Due to the congested urban area, the sprayed concrete lining works were performed in a very
complex layout (Figure 3-22). The case study was undertaken during the secondary sprayed
concrete lining works.
The sprayed concrete mix of the Bond St station upgrade works included cement,water,
aggregates, microsilica, calcium carbonate fines, superplasticiser, retarder, and accelerator. The
sprayed concrete mix details are shown in Table 3-3.
In comparison to the Whitechapel station mix, the Bond St mix had a different composition,
with the most prominent differences being listed below:
- the admixture manufacturer was different;
- microsilica, retarder, and superplasticiser were added in powder form;
- use of calcium carbonate fines as a supplementary cementitious material; and
- on-site batching was used at Whitechapel station, as against pre-batched silos containing
dry ingredients (cementitious material and admixtures) for the Bond St sprayed concrete
works.
The sprayed concrete mix was designed for the wet spray process and was sprayed using a
Meyco Oruga, a 4 m long crawler mobile unit fitted with Meyco Rama boom (providing a spraying
range of 7 m). All the dry ingredients were pre-batched as a dry mix and delivered to silos on site.
The water was added to the dry-mix to prepare the concrete and conveyed through pipes to the
spraying rig. The concrete was pumped using Meyco Suprema 20, a double cylinder recciprocating
pump. The accelerator (BASF SA 160) was fed into the nozzle of the spraying robot in liquid form
and added to the concrete right before the spray.

67
The thermo-chemical testing was made on eight cement pastes using different combinations
of the Bond St sprayed concrete mix constituents. Four of the eight pastes included admixtures and
are referred to as the ‘mix’ pastes. The other four pastes are referred to as the ‘plain’ pastes. The
four plain pastes were labelled as BS1P, BS2P, BS3P, and BS4P. The four mix pastes were
labelled as BS1M, BS2M, BS3M, and BS4M. The BS4M paste corresponds to the sprayed
concrete mix. The following were the ingredients of each paste:
1) BS1P paste – cement and water;
2) BS2P paste – cement, calcium carbonate fines, and water;
3) BS3P paste – cement, microsilica, and water;
4) BS4P paste – cement, calcium carbonate fines, microsilica, and water;
5) BS1M paste – BS1P paste ingredients, superplasticiser, retarder, and accelerator;
6) BS2M paste – BS2P paste ingredients, superplasticiser, retarder, and accelerator;
7) BS3M paste – BS3P paste ingredients, superplasticiser, retarder, and accelerator; and
8) BS4M paste – BS4P paste ingredients, superplasticiser, retarder, and accelerator.
The ingredient proportions are listed in Table 3-4 and are based on the sprayed concrete mix
information shown in Table 3-3. Considering the proportions of the microsilica and calcium
carbonate fines, the BS1, BS2, BS3 and BS4 type pastes had CEM I, CEM II/A-LL, CEM II/A-D,
and CEM II/A-M type binder (British Standards Institution, 2011), respectively.
The strength – hydration relationship for the Bond St sprayed concrete mix was established
through the calibration testing of the three sets of sprayed test panels. Each set had four panels with
each panel having wooden formwork. Each panel had a clear testing surface of 1000 mm x 1000
mm and were 200 mm deep (Figure 3-24). Further details are discussed in Chapter 6.
3.8 Summary
The research methodology outlined the procedure for thermo-chemical and thermo-
mechanical evaluation of the sprayed concrete works. The thermo-chemical evaluation involved
conducting isothermal and thermogravimetric testing of the sprayed concrete mix based cement
pastes to establish the Arrhenius equation based maturity function input parameters. The thermo-
mechanical evaluation involved establishing the strength – maturity relationship through
simultaneous strength testing and thermal monitoring of the sprayed concrete. The methodology
was validated by its application to two case studies having different sprayed concrete mixes.


69
Table 3-1 Sprayed concrete mix at Whitechapel Station SCL works
Content Type Quantity (kg/m3) Ratio/dosage*
Cement CEM I 52.5 N 420 -
Water - 173 0.41
Aggregate Limestone (0/4) 590 -
Aggregate Marine Sand (0/4) 590 -
Aggregate Limestone (2/6) 505 -
Microsilica slurry EMSAC 500 S 52 12.38%
Retarder Pantarhol 85 (VZ) 6 1.43%
Superplasticiser Pantarhit T100CR (FM) 4.8 1.14%
Accelerator Gecederal F 2000 HP Added at spray 5.50% (averaged)
Steel Fibres Steel HE 55/35 35 -
*Dosage in percentage (%) of cement weight basis
Table 3-2 Cement paste ingredients – Whitechapel Station
WC1 WC2 WC3 WC4 Water content
Ingredients Weight (g) Weight (g) Weight (g) Weight (g) (%)
Cement 42 42 42 42 -
Microsilica - 2.6 - 2.6 -
Water 17.3 19.9 17.3 19.9 -
Superplasticiser - - 0.48 0.48 29
Retarder - - 0.6 0.6 20
Accelerator - - 2.31 2.31 50
Paste weight 59.3 64.5 62.69 67.89 -
Total water 17.3 19.9 18.7 21.3 -
w/c 0.41 0.47 0.45 0.51 -
Table 3-3 Sprayed concrete mix at Bond Street Station Upgrade SCL works
Content Type Quantity (kg/m3) Ratio/dosage*
Cement CEM I 52.5 N 465 -
Water - 210 0.45
Aggregate Limestone (0/4) 1064.8 -
Aggregate Limestone (2/6) 545.3 -
Filler Calcium Carbonate 29.5
Microsilica Elkem 37 7.96%
Retarder Delvo 111 1.26 0.28%
Superplasticiser Rheobuild 2000 PF 8.4 1.81%
Accelerator Meyco SA 160 Added at spray 7.50% (averaged)
Steel Fibres Dramix RC65/35BN 35 -
*Dosage in percentage (%) of cement weight basis

70
Table 3-4 Cement paste ingredients – Bond St station upgrade
Cement paste content
BS1 BS2 BS3 BS4
Cementitious
materials
Cement 46.50 g 46.50 g 46.50 g 46.50 g
CaCO3 fines – 2.97 g – 2.97 g
Microsilica – – 3.70 g 3.70 g
Water 21.00 g 21.00 g 21.00 g 21.00 g
Plain paste (sum of
cementitious
materials and water)
BS1P BS2P BS3P BS4P
Total weight 67.50 g 70.47 g 71.20 g 74.17 g
w/c ratio 0.45 0.45 0.45 0.45
w/b ratio 0.45 0.42 0.42 0.40
Admixtures
Retarder 0.13 g
Superplasticiser 0.84 g
Accelerator 3.49 g (50% solid content)
Mix pastes (sum of
plain paste and
admixtures)
BS1M BS2M BS3M BS4M
Total weight 71.96 g 74.93 g 75.66 g 78.63
w/c ratio 0.49 0.49 0.49 0.49
w/b ratio 0.49 0.46 0.45 0.43

71
Figure 3-1 Four channel I-Cal 4000 HPC calorimeter operated using
Calcommander software
Figure 3-2 I-Cal 4000 HPC top view showing 4 channel arrangement

72
Figure 3-3 Rate of heat release and heat of hydration measured using I-Cal 4000 HPC
Figure 3-4 Rate of heat release vs heat of hydration plot developed using I-Cal
4000 HPC data

73
Figure 3-6 Plot showing weight loss and temperature rise during thermogravimetric testing of
hydrated cement paste
Figure 3-5 PL-STA 1500 used for thermogravimetric analysis of hydrated cement pastes
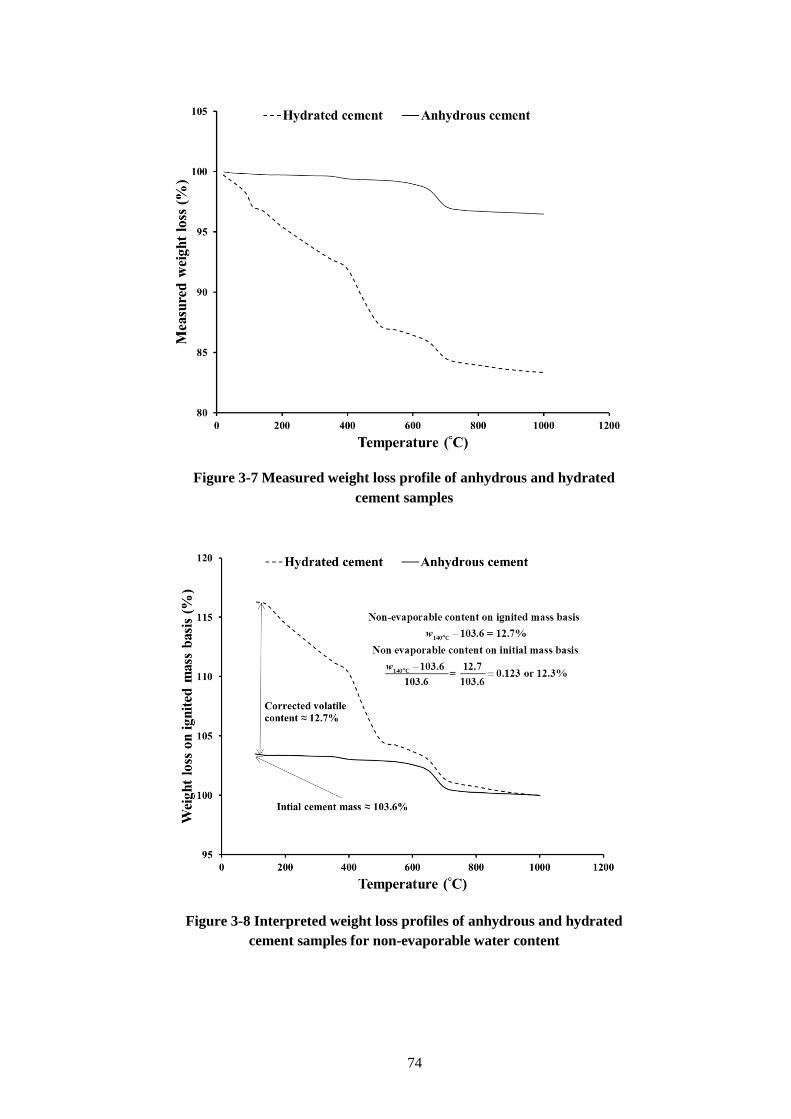
74
Figure 3-7 Measured weight loss profile of anhydrous and hydrated
cement samples
Figure 3-8 Interpreted weight loss profiles of anhydrous and hydrated
cement samples for non-evaporable water content

75
Figure 3-9 Final heat of hydration estimation through calorimetric vs
thermogravimetric evaluation
Figure 3-10 Cement hydration kinetics deduced from calorimetric data and
final heat of hydration

76
Figure 3-12 FLIR E60bx thermal imaging camera used for sprayed concrete
monitoring
Figure 3-11 Normalised kinetics developed from cement hydration kinetics

77
Figure 3-13 Sprayed concrete strength development and temperature evolution histories
developed from panel testing
Figure 3-14 Hydration modelling of sprayed concrete using temperature
evolution histories

78
Figure 3-15 Strength - maturity relationship for sprayed concrete
Figure 3-16 Application of sprayed concrete strength – maturity relationship
demanding relationship re-evaluation for first three hours of age

79
Figure 3-17 Longitudinal section of sprayed concrete lining thermal monitoring

80
Figure 3-18 Cross-section for sprayed concrete lining thermal imaging

81
Figure 3-19 Whitechapel station construction layout (Picture courtesy BBMV) showing test panels’ spray locations

82
Figure 3-20 Meyco Potenza (picture courtesy www.tunneltalk.com)

83
Figure 3-21 Whitechapel station sprayed concrete panel testing and thermal monitoring

84
Figure 3-22 3D layout of existing and new upgrade works for Bond Street Station Upgrade (BSSU) site (Picture courtesy Dr Sauer and Partners)

85
Figure 3-23 Meyco Oruga (picture courtesy www.tunneltalk.com)

86
Figure 3-24 A dimensional comparison of wooden formwork used for test panels
used for BSSU thermo-mechanical evaluation with a site engineer

87
4 Thermo-chemical evaluation of Whitechapel
Station sprayed concrete mix
The chapter presents the thermo-chemical evaluation of the Whitechapel station related
sprayed concrete mix. The evaluation was made through a parametric testing of four different
cement pastes (as described in Section 3.7.1). The evaluation included the two testing methods,
isothermal calorimetry and thermogravimetry, for the four cement pastes, namely the WC1, WC2,
WC3 and WC4 pastes. The isothermal calorimetry provided the activation energy. The
thermogravimetric testing supplemented the calorimetric data to establish the normalised kinetics
and affinity constant.
4.1 Isothermal calorimetry
The isothermal calorimetric testing of the each paste was made at four different
temperatures, namely 10, 20, 30 and 40°C. The testing output measured was voltage (V), which
was converted into power (W), i.e., the rate of heat release (dQ/dt) caused by the cement hydration
reaction.
4.1.1 Plain pastes
Figure 4-1 shows the calorimetric curves for the WC1 paste. For ease of representation, the
rates of heat release are presented in units of mW/g and show information for the first 100 hours of
testing9. The actual durations of the testing varied from 4 days (for 40°C testing) to 14 days (for
10°C testing). The dormancy trough10 occured as early as 1.0 hr age11 for the 40°C testing and as
late as 3.0 hrs for the 10°C testing while the rate of heat release varied from 0.55 mW/g (at 10°C)
to 0.95 mW/g (at 30°C). The 40°C WC1 paste achieved the post-dormancy peak value at the
earliest, by the age of 4.5 hrs with a rate of heat release of 12.05 mW/g, while the 10°C WC1 paste
reached the peak at the latest, by the age of 19.7 hrs with a rate of heat release of 1.82 mW/g. The
double hump at the peak flow stage of all four temperatures is caused by the sulphate depletion
(ASTM C 1679, 2008; Pratt and Ghose, 1983), where the second hump represents C3A dissolution.
9 The first peak at the time of mixing has not been shown in the curves but was used for hydration heat
calculations. 10
The dormancy trough is a shortened term for the dormancy trough minima. 11
The sample age is calculated from the time of mixing.

88
The rate of heat release curves were integrated12 to determine the heat of hydration
development. Figure 4-2 shows the heat of hydration curves (in J/g) corresponding to the
respective rate of heat release curves illustrated in Figure 4-1. In the first couple of hours, the heat
of hydration curve for 10°C testing is higher than the other curves, though the reaction kinetics
would be slower at the lower temperatures. This was caused by the external mixing approach of the
calorimetry, where the difference between testing temperature and laboratory temperature lead to
over or under heat flow condition from the sample during the first half hour. Therefore, each heat
of hydration curve required an offset correction. The rate of heat release and the heat of hydration
values at the age of dormancy trough and peak flow are listed in Table 4-1. Since the heat
differentials between the dormant and the peak flow phases (Q) are very similar, the degree of
hydration development must be also very similar, despite the significant variation in the
chronological ages between the two flow stages at different temperatures. In Figure 4-2, the 40°C
heat of hydration curve demonstrates the approach to ultimate degree of hydration13 by the age of
28 hrs. While the 30°C test shows signs of completion by the age of 3 days, the 20°C test curve
flattens by the age of 7 days (data not shown in the figure). On the other hand, with the magnitude
of the rate of heat release at the age of 14 days, it seems that the 10°C sample is far from the
approach to ultimate degree of hydration.
Figure 4-3 shows the rate of heat release curves for the WC2 pastes, measured at four
different temperatures. Though microsilica was added, the general behaviour of the hydration
reaction was observed to be similar to the WC1 paste. With the low dosage of microsilica and
additional water content (for slurry equivalency), it can be assumed to be a non-reactive
constituent, at least in early age. Therefore, the rate of heat release curves were interpreted on the
cement content basis only. This behavioural assumption is also confirmed by the age of occurrence
as well as the rate of heat release magnitude of dormant and peak flow, as listed in Table 4-2.
Figure 4-4 shows the heat of hydration curves developed for the WC2 pastes using the rate of heat
release curves illustrated in Figure 4-3. Similar to Figure 4-2, the curves require external mixing
correction. From the heat of hydration values listed in the table, it can be observed that the heat
differentials between the two stages (Q) are of the magnitude similar to that of the WC1 paste.
4.1.2 Mix Pastes
Since the WC3 paste is essentially a WC1 paste with admixtures in it, therefore, a
comparison is drawn between the two. Figure 4-5 shows the rate of heat release curves for the
WC3 paste. In general, the peak flow values for the WC3 paste were substantially lower than that
of the WC1 paste. Also, the dormancy and peak flow phases occurred at much later ages than the
WC1 paste. For example, the 20°C WC3 paste reached peak flow at 14.6 hrs with a rate of heat
12
The integration is made from the time of mixing. 13
The approach to ultimate degree of hydration (or flat lining) uses 95% of the measured value at the end of
the experiment as the benchmark.

89
release of 2.71 mW/g, whereas the 20°C WC1 paste reached peak flow at 10.1 hrs with a rate of
heat release of 3.76 mW/g. Furthermore, the 20°C heat differentials were of equivalent magnitude
(see Table 4-3). However, the same is not the case for other temperatures. For example, the heat
differential for the 30°C WC3 paste was 94.7 J/g in comparison to 74.7 J/g for the WC1 paste.
Though the prolonged duration of 11 hrs, when compared to 5 hrs for the 30°C WC1 paste, could
be the cause of the increased heat differential. The prolonged duration and the heat differential
variation can be attributed to the complex interactions of C3S and C3A with the admixtures. An
outcome of one such complex interaction was observed during the dormancy period of the 10°C
WC3 paste (Figure 4-5). The mix paste had the tendency to reach the dormancy trough between the
ages of 4 to 5 hrs but then slipped further down to a lower minimum around the age of 8 hrs. It
may be the outcome of the extended influence of the retarder and/or superplasticiser, delaying C3S
hydration progression. Thus, it can be commented that the retarder dosages should be reduced for
the concrete mix at lower temperatures, such as for cold weather concreting.
Figure 4-6 shows the heat of hydration curves for the WC3 paste obtained using data
presented in Figure 4-5. The higher initial values of the WC3 heat of hydration curves, in
comparison to the WC1 heat of hydration curves (Figure 4-2), occurs due to the accelerator
addition.
In the case of the WC4 paste (Figure 4-7), the dormancy troughs occur at later ages than the
WC2 paste, a pattern similar to the WC3 vs WC1 pastes. The age and rate of heat release values
are listed in Table 4-4. In comparison to the WC2 paste, the WC4 paste had noticeably higher
magnitudes of the rate of heat release at the dormancy troughs. For example, the 20°C WC2 paste
dormancy trough occurred at the age of 1.4 hrs with a rate of heat release of 0.82 mW/g in
comparison to 3.4 hrs with a rate of heat release of 1.10 mW/g for the WC4 paste.
When drawing a comparison between the WC3 and WC4 pastes, no noticeable difference
between the ages and rate of heat release magnitudes for the dormancy trough was seen. The peak
flow phase was also delayed and was of lower magnitude for the WC4 paste, similar to the WC3 vs
WC1 pastes. For example, the peak flow, for WC4 at 20°C, occurred at 12.8 hrs with a rate of heat
release of 2.84 mW/g, whereas it occurred at 10.2 hrs with a rate of heat release of 3.71 mW/g for
the WC2 paste.
Figure 4-8 shows heat of hydration curves for the WC4 paste. Similar to the WC3 paste, the
10°C curve had a very high offset value of over 50 J/g at the age of 1 hr, which was much higher
than that for the 40°C curve and thus, requires correction. In terms of the heat differentials, the heat
released between the dormancy trough and peak flow stages for the WC4 paste (Table 4-4) was
smaller than the WC3 paste and can be easily related to shortened durations of transition from
dormancy to peak flow. Comparing the heat differential with the transition duration, the WC4 paste
has a higher kinetics rate than the WC3 paste and this may be attributed to the presence of
microsilica.

90
4.1.3 Calorimetry outcome and summary
The accelerator addition increased the rate of heat release for the pre-dormancy phase of the
mix pastes and is due to the continuous activity of the accelerator with C3A and any available CH
(Myrdal, 2007a). Thereafter, the mix pastes had lower rates of heat release in comparison to the
plain pastes.
The plain pastes passed the dormant and peak flow phases sooner than the mix pastes and
was in contrast to the expectation created by the addition of accelerator. This behaviour may have
been caused by the extended influence of retarder and/or superplasticiser on C3S hydration, and
was prominently observed for the 10°C curing.
The external mixing affected the initial heat of hydration values and would require
correction. The need of correction is more prominent at 10°C, and 40°C pastes, as they are the
farthest from the room temperatures. In general, there is a reasonable solution for the plain pastes
by using the dormant flow condition as a datum to estimate the initial value. However, it is hard to
comment on how far this datum is from the actual value. This is not of great concern for the plain
concrete, as strength development occurs after initial set has been achieved, which happens only
after the dormancy trough has been passed (Christensen, 2006). Applying the same approach to the
mix pastes may not be appropriate, since the pre-dormancy phase influences the hydration
progression, and requires further study (presented in Section 4.4).
During the early age, the plain pastes had minimal impact from the microsilica addition,
which can be attributed to a low dosage of 6% and non-reactiveness in the early age reaction. In
the case of the mix pastes, the addition of microsilica made quite an impression on the hydration
kinetics, measured as the higher rate of heat release for the WC4 pastes with the dormancy and
peak flow phases reached earlier than the WC3 pastes.
4.2 Hydration kinetics evaluation
To understand hydration kinetics development, a plot of the heat flow vs accumulated heat
of hydration is used. Figure 4-9 shows such a plot for the WC1 paste and was developed using the
information presented in Figure 4-1 and Figure 4-2. The curves have been plotted from the
dormancy trough onwards. Due to the external mixing approach of the calorimetry, each curve has
an offset involved in it and needs a correction. Since the 20°C calorimetric testing conditions were
the closest to the laboratory ambient temperatures, the heat of hydration value of 17 J/g at the 20°C
dormancy trough is assumed closest to the actual value. Thus, the starting points of the four curves
(from Figure 4-9) were set to the value of 17 J/g. Next, the curves were divided by their respective
peak magnitudes to establish the normalised rate vs heat of hydration curves and are shown in
Figure 4-10. The so obtained normalised rate curves are representative of the temperature
independent behaviour of the cement hydration.

91
The 20°C, 30°C and 40°C normalised curves share near-identical formation, such as the
presence and location of the secondary and tertiary peaks, the indicators of C3A dissolution (Jansen
et al., 2012) and C4AF dissolution (Pratt and Ghose, 1983), respectively. For the 10°C curve, only
the secondary peak is observed. It may be an outcome of concurrent dissolution of C3A and C4AF,
leading to the secondary and tertiary peak overlapping and thus, broadening of the normalised rate
curve. In addition, the curves have a varying magnitude of normalised rate at the beginning. Since
having the same starting point was an assumption, this variation can be expected.
The generalised formulation of the normalised curves represents the evolution of the
hydration kinetics with respect to the heat of hydration, and is represented as a function of the heat
of hydration0 final[( ) ]if Q Q Q , where Qi is the instantaneous heat of hydration; Q0 is the datum
heat; Qfinal is the final heat of hydration; and varies between 0 and 1. Using the above formulation,
a calorimetric curve for given temperature T, can be formulated as follows:
T 0 final T peakd /d = [( ) ] [d /d ]iiQ t f Q Q Q Q t 4-1
With the rate of heat release being the product of Qfinal and the rate of hydration (d/dt), the
above formulation can be used to evaluate the hydration kinetics as follows:
T 0 T peakd /d = ( ) [d /d ]iit f t 4-2
with 0( )if being the analogous representation of
0 final[( ) ]if Q Q Q and is referred to as
the normalised kinetics14.
Assuming that the cement paste has achieved its ultimate hydration in 7 days at 20°C, the 7-
day calorimetric heat for 20°C represents the ultimate heat of hydration. Using Mills (1966) or
Waller (1999) equation, the ultimate degree of hydration (ult) can be estimated. For the WC1 paste
with w/c ratio of 0.41, ult estimates vary from 0.70 (Mills equation) to 0.74 (Waller equation).
With the 20°C 7-day heat of hydration of 334 J/g, the final heat of hydration (Qfinal) estimates vary
from 450 to 477 J/g. Using Qfinal = 450 J/g, peak dT=20/dt is estimated to be 0.72 day-1 occurring at
≈ 0.22. Alternatively, if the cement clinker content is known, Qfinal can be directly calculated
(Riding et al., 2012).
The WC2 paste was analysed in the same fashion. Figure 4-11 shows the rate of heat release
vs the heat of hydration plot prepared using data shown in Figure 4-3 and Figure 4-4. Similar to the
WC1 paste, the normalised curves were corrected using the 20°C dormancy trough as a datum and
normalised to their respective peak value to deduce the normalised rate of heat release (Figure
4-12). Comparing Figure 4-10 and Figure 4-12, the two cement pastes show similar patterns, such
as the tertiary peaks for 20°C, 30°C and 40°C curves, and a broadened 10°C curve. Since the WC2
14
In this thesis, the normalised kinetic data is represented as a curve only and no function is defined.
Though, the standard notation of a continuous curve would be (), but will be represented by the shown
notation or Nk.

92
water content is different to the WC1 water content, therefore, ult estimates would be different to
that for the WC1 paste. With the low dosage of the microsilica, it is assumed that ult can be
estimated by using the water-binder (w/b) ratio (0.45) in the Waller equation, providing ult,Waller of
0.77. Thus, Qfinal was estimated to be 428 J/g, and subsequently, the peak d/dt at 20°C is
determined to be 0.75 day-1 at ≈ 0.23 (comparable to the WC1 paste outcomes).
Figure 4-13 shows the rate of heat release vs the heat of hydration curves developed for the
WC3 pastes using the data shown in Figure 4-5 and Figure 4-6. Similar to the WC1 and WC2
pastes, the normalised rate curves were developed for all four temperatures and are shown in
Figure 4-14. Here, the 20°C dormancy datum was not useful to fully align the normalised curves.
On the one hand, the 10°C curve is in close agreement with the 20°C, on the other hand, 30°C and
40°C curves are in close agreement with each other. Thus, the use of the dormancy trough as the
datum may not be the right approach for pastes or concrete with admixtures and further
investigation is require to determine the exact datum value.
In terms of curve formulation, no secondary peak is noted in any of the curves. This can be
attributed to the excess sulphate content provided by the alkali-free accelerator, a consumer of C3A
producing ettringite (Myrdal, 2007b) and thus, the absence of a sulphate depletion point. Though it
is possible that C3A dissolution occurs in concurrence to the alkali-free accelerator-induced
ettringite formation. The tertiary peak due to C4AF is observed in all of the curves. In contrast to
the 10°C curves of the WC1 and WC2 pastes, the WC3 paste curve has the tertiary peak, and the
curve is not broadened around the primary peak area. Though the WC3 paste was an extended
formulation of the WC1 paste, the accelerator-clinker reaction would change the final heat of
hydration of the WC3 paste and required further investigation along with the uncertainty of
external mixing correction and datum location.
Figure 4-15 shows the rate of heat release vs the heat of hydration curves for the WC4 paste
and is developed using the data shown in Figure 4-7 and Figure 4-8. Figure 4-16 shows the datum
adjusted and normalised curves developed using Figure 4-15 data. The WC4 normalised curves
have formulation similar to the WC3 paste, such as the absence of the secondary peak. Similar to
the WC3 paste, there are uncertainties in terms of Qfinal, external mixing correction and datum
location. Therefore, thermogravimetric testing was performed for the cement pastes to assess the
degree of hydration development by measuring the non-evaporable water content (wn) development
in the cement pastes.

93
4.3 Thermogravimetric testing
The main goal of the thermogravimetric testing is to establish the degree of hydration ()
development of the cement pastes at the key stages of the hydration reaction, namely dormancy
flow and peak flow. The thermogravimetric testing methodology has been detailed in Section
3.3.2.
4.3.1 Initial solid content baseline
Figure 4-17 shows the measured weight loss profiles (100% being the weight at the room
temperature) of anhydrous cement and microsilica powder samples used for the case study. For
cement powder, a small quantity of CH is observed (the weight loss around 400°C), indicating the
presence of a small amount of pre-hydrated silicate clinker (Taylor, 1997b). The weight loss
occuring between 600°C and 800°C represents the release of CO2 from CaCO3. In the case of
microsilica powder, a total weight loss of less than 3% is observed until the temperature of 1000°C.
As explained in Section 3.3.2, the non-evaporable content determination is to be made on an
ignited mass basis. Figure 4-18 shows such an interpretation of Figure 4-17 data. Thus, the initial
anhydrous sample weight of the WC1 paste would be 103.4% at the temperature of 140°C 15. Since
the microsilica content in the pastes is much lower than the cement content, the combined weight
loss, such as for the WC2 paste, is assessed in theoretical proportions and is determined to be
103.3%. Similarly, the admixtures were ignited to determine the respective weight loss profiles and
are shown in Figure 4-19.
These weight losses were proportioned per the paste contents and were used to develop
theoretical weight loss corrections. For proportioning, the sample weight at the temperature of
140°C was used as the theoretical solid content of the sample. Then, the weight losses of different
ingredients were proportioned to respective weight loss profiles. The theoretical initial solid
content for the WC3 and WC4 pastes was determined to be 105.0% and 105.4%, respectively.
Figure 4-20 shows the theoretical profiles of the four pastes and Table 4-5 lists the profile values at
ignited, dry, and initial stages. With the complicated accelerator – clinker reactions, the theoretical
weight loss would vary as the accelerator was consumed and converted into hydration products. To
quantify its consumption in a consistent manner, the theoretical weight loss profiles of the mix
pastes were assumed to be same as the respective plain paste weight loss profiles. In summary, the
weight losses measured by the thermogravimetric testing of the WC1 and WC3 pastes were
corrected by 3.4%, while the WC2 and WC4 pastes were corrected by 3.3%.
15
Taylor (1997b) recognises the weight loss corrected for CO2 content measured after 150°C as the non-
evaporable content. In the current research, post 105°C drying phase, the weight loss began only after
140°C. Since with the rate of 20°C/min rate of temperature increase, the weight loss phase shift can occur
(Lothenbach et al., 2016), therefore, the weight loss between 140°C and 1000°C was chosen for the non-
evaporable water content determination.

94
4.3.2 Non-evaporable content and degree of hydration determination
Figure 4-22 shows the weight loss profiles of the 20°C WC1 paste. The tests were conducted
at five different ages, namely 1.5, 8, 29, 72 and 166 hrs 16. The profiles have been plotted using the
weight loss measure between 140°C and 1000°C. The corrected non-evaporable water content on
ignited mass basis, wn was determined as follows:
n 140 1000 corr 140 corr100w w w w w w 4-3
where w140 is the sample weight at 140°C, w1000 is the sample weight at 1000°C (always
100%), wcorr is the required weight correction. Applying wcorr of 3.4% for the WC1 paste, wn was
determined to be increasing from 0.7% at 1.5 hr age to 12.8% at the age of 166 hrs.
In terms of hydration products, 1.5 hr being a dormant phase, wn of 0.7% relates to
dehydroxylated ettringite and/or Aft phase (Lothenbach et al., 2016). For 24 hour testing, the
weight loss around 450°C demonstrates the development of portlandite (or CH), an indicator of
CSH formation due to C3S hydration (Taylor, 1997b). With the information on portlandite, it is
concluded that CSH is the major contributor towards the increase in the measured weight loss.
Other minor contributors would include phases like that of AFt and aluminate hydrates. The
increased portlandite content at the age of 30 hrs represents further hydration of silicate clinkers,
but mostly C3S. The increased weight loss between 700°C and 750°C is interpreted to be a
contribution from C3SscH15 and C4AcH11 , the carbonate equivalents of AFm and AFt phases,
respectively (Lothenbach et al., 2016). The enlarged portlandite segments for the 72 hrs and 166
hrs profiles is interpreted as the contribution from belite hydration, a later age contributor to C-S-H
(Taylor, 1997b).
As discussed in Section 3.3.3, to deduce the degree of hydration (), wn is reassessed on the
initial cement mass basis and then compared to the non-evaporable content at final hydration (on
the initial cement mass basis).
n
n,max
w
c
w
c
4-4
where c is initial cement mass (103.6% for the WC1 paste, see Table 4-5) and n,maxw c is
the non-evaporable content at final hydration on the initial cement mass basis (20.4% or 0.204).
Thus, for the WC1 paste, the above formulation changes as follows:
16
The testing ages represent the time gap between the time of mixing and the time of the sample reaching
the temperature of 105°C, representing the arrest of hydration development. Since there is a lag of 10 – 15
mins between the time of sampling and the sample reaching the temperature of 105°C, an appropriate age
correction is applied up to the age of 24 hrs.

95
n
n 140WC1
103.4103.6
0.204 21.0 21.0
w
w w
4-5
With the increase in isothermal curing temperature, the required age of the
thermogravimetric testing decreased. For instance, the age of the peak flow phase varied from
around 20 hr for 10°C testing to around 5 hr for 40°C testing. The weight profiles for the 10°C,
30°C, and 40°C WC1 pastes are provided in Appendix A1. The calculated non-evaporable content
and subsequently determined thermogravimetric degree of hydration values are tabulated in
Appendix A2.
Figure 4-21 shows the weight loss profiles for the 20°C WC2 paste at four different stages of
hydration. With the correction of 3.3% and initial cement content of 97.6% (noted in Table 4-5),
the degree of hydration formulation changes as follows:
140WC2
103.3
19.9
w
4-6
Figure 4-23 shows the weight loss profile for the 20°C WC3 paste. With the chosen
correction value of 3.4% and the established initial cement content value of 101.7% (noted in
Table 4-5), the following formulation was used for the degree of hydration determination.
140WC3
103.4
20.7
w
4-7
Figure 4-24 shows the weight loss profile for the 20°C WC4 paste. With the chosen
correction value of 3.3% and the established initial cement content value of 95.8% (noted in Table
4-5), the following formulation was used for the degree of hydration determination.
140WC4
103.3
19.5
w
4-8
Similar to the WC1 paste, further information on the weight profiles and the calculated
thermogravimetric degree of hydration estimates at different temperatures has been provided in
Appendices A1 and A2.
4.3.3 Thermogravimetry summary
Using 7 day age of the sample cured at 20°C as the definition of ultimate degree of
hydration, it is concluded the addition of the microsilica (WC1 vs WC2, and WC3 vs WC4), and
admixtures (WC1 vs WC3, and WC2 vs WC4), increase the ultimate degree of hydration of the
cement content.

96
4.4 Calorimetric – thermogravimetric evaluation
The calorimetric – thermogravimetric evaluation involved establishing the final heat of
hydration of all four pastes by comparing the calorimetric heat with the thermogravimetric degree
of hydration outcomes, as described in Section 3.3.3. The calorimetric heat of hydration values at
the ages of thermogravimetric testing have been tabulated in Appendix A3.
4.4.1 Plain pastes
Figure 4-25 is a calorimetric heat – thermogravimetric hydration plot for the WC1 pastes,
developed by plotting the relevant values from Appendices A2 and A3. The gradient of the linear
correlation represents the final heat of hydration (Qfinal) and was estimated to be 524 J/g of the
cement. Dividing the heat of hydration development curves by Qfinal provided the degree of
hydration development curves but required external mixing correction.
For the external mixing correction, the calorimetric (C) and thermogravimetric (TG)
hydration values were compared. First, the differences between the two sets, i.e. (TGC), were
calculated for respective temperatures. Then, a correction value is determined so that the sum of
these differences is zero for the data set at a given temperature T, i.e., (TGC)T = 0. Thus, the
four data sets have their own correction values. Table 4-6 lists these corrections in terms of both
the degree of hydration correction (correction) and the heat of hydration correction (Qcorrection). Figure
4-26 presents a comparison of the corrected calorimetric degree of hydration vs thermogravimetric
degree of hydration estimates.
Figure 4-27 presents a comparison of the calorimetric (solid line) and thermogravimetric
(markers) hydration histories of the 20°C WC1 paste, demonstrating the appropriateness of the
analysis method to convert a temperature specific heat of hydration history into a degree of
hydration development history. The secondary vertical axis represents the normalised heat flow
history (dashed line) and was deduced by normalising the calorimetric heat flow curve to its peak
value of 3.76 mW/g (as noted in Table 4-1). The degree of hydration development history plots at
other curing temperatures are provided in Appendix A4.
Plotting the normalised heat flow history vs hydration development history is referred to as
the normalised kinetics curve. Figure 4-28 shows the normalised kinetic curves for the four WC1
pastes. It is essentially an experimentally corrected representation of Figure 4-10. The
characteristic values of the normalised kinetics curves are provided in Appendix A5.
Figure 4-29 shows the heat of hydration vs the thermogravimetric degree of hydration data
for the WC2 pastes. The final heat of hydration was determined to be approximately 547 J/g. The
higher heat of hydration value of the WC2 paste, in comparison to the WC1 paste, can be attributed
to the additional hydration reactions caused by the microsilica. Next, the external mixing
corrections were determined using the same approach as for the WC1 paste. Figure 4-30 shows the

97
corrected calorimetric degree of hydration vs thermogravimetric degree of hydration. The corrected
heat of hydration curves were divided by the final heat of hydration of 547 J/g to develop the
degree of hydration development curves.
Figure 4-31 shows the calorimetric hydration history (solid line), thermogravimetric
hydration history (markers), and normalised heat flow history (dashed line) for the 20°C WC2
paste. Figure 4-32 shows the normalised kinetics curves established for the WC2 paste by plotting
the normalised heat flow histories vs the hydration development histories from the four WC2
pastes. The characteristic values of the normalised kinetics curves are provided in Appendix A5.
4.4.2 Mix Pastes
The calorimetric – thermogravimetric evaluation of the WC3 paste provided the final heat of
hydration value of 507 J/g of cement (Figure 4-33). With the use of the accelerator, a higher value
was anticipated, as greater ettringite formation would occur, but was not the case. The lower
estimation could be an outcome of the simplified theoretical weight loss correction of 3.5%. Since
the accelerator reaction can provide hydration products different from the typical clinker hydrates,
the non-evaporable water content versus the heat of hydration relationship can vary. The
calorimetric heat values, shown in Figure 4-33, were corrected for external mixing heat loss/gain.
Figure 4-34 shows the corrected calorimetric degree of hydration vs the thermogravimetric degree
of hydration. Figure 4-35 shows the calorimetric and thermogravimetric hydration development
histories of the 20°C WC3 paste, developed by applying the external mixing correction and the
final heat of hydration.
Figure 4-36 shows the normalised kinetics curves of the WC3 paste. Unlike the plain pastes,
the normalised kinetics of the WC3 paste is unique for every curing temperature. This is caused by
the complex interaction between admixtures, the clinkers, hydration products, and intermediate by-
product, occurring at different stages and in different ways depending on the temperature. Thus,
the WC3 paste normalised kinetics, unlike the plain pastes, is temperature dependent. The
characteristic values of the normalised kinetics curves are provided in Appendix A5.
The calorimetric – thermogravimetric evaluation of the WC4 paste provided the final heat of
hydration value of 524 J/g (Figure 4-37). Similar to the plain paste, the addition of microsilica
increased the final heat of hydration value. Also, similar to the WC3 vs WC1 paste, the addition of
admixtures decreased the final heat of hydration of the WC4 paste. Next, the calorimetric values
were corrected for the external mixing using the previously explained correction process. Figure
4-38 shows the corrected calorimetric vs thermogravimetric degree of hydration data, and has an
improved coefficient of determination of 0.990 in comparison to 0.975 observed in Figure 4-37.
Figure 4-39 presents a comparison of calorimetric and thermogravimetric hydration development
histories obtained for the 20°C WC4 paste.

98
Figure 4-40 shows the normalised kinetics curves of the WC4 paste established by applying
the external mixing corrections and the final heat of hydration to the curves illustrated in Figure
4-16. Similar to the WC3 paste, the addition of the admixtures made the WC4 normalised kinetics
temperature sensitive. The characteristic values of the WC4 normalised curve are provided in
Table 4-7.
4.4.3 Evaluation summary
The addition of the microsilica increased the final heat of hydration of the cement pastes.
The addition of the admixtures decreased the final heat of hydration of the cement pastes. The
normalised kinetics of the plain pastes was independent of the curing temperature, and the
dormancy trough can be a suitable hydration datum for hydration modelling. In contrast to the
plain pastes, the normalised kinetics of the mix pastes was temperature sensitive, and the dormancy
trough datum approach is not valid.
4.5 Hydration modelling parameters – activation energy and affinity
constant
4.5.1 Plain pastes
The activation energy (Ea) determination approach, as explained in Section 2.8.3, presumes
that the peak rate of heat release values occur at the same degree of hydration and thus, can be used
to determine Ea. Using this approach, the natural logs of peak rate of heat release values listed in
Table 4-1 were plotted versus the inverse of the respective temperature values (in K) to determine
Ea for the WC1 paste, as shown in Figure 4-41. With the negative of the slope (i.e., 5589.5)
representing aE
R, Ea was determined to be 46.5 kJ/mol. The constant of 20.4 represents the natural
log of the product of the final heat of hydration and the affinity constant [ln(Qfinal * A)], where Qfinal
was inputted in mJ/g to obtain A in s-1. With Qfinal ≈ 524 J/g (see Figure 4-25) for the WC1 paste, A
was determined to be 1332.5 s-1.
In Figure 4-41, two points (corresponding to 20 and 30°C) are above the linear trend line
while the other two (corresponding to 10 and 40°C) are below. Translating it in terms of results,
the calculated rates at 10 and 40°C would be higher than the measured rates while 20°C and 30°C
calculated rates would be lower than the measured values. For example, the peak rates of heat
release are calculated to be 1.87, 3.66, 6.86, and 12.36 mW/g at the temperatures of 10°C, 20°C,
30°C, and 40°C, respectively. While, the measured values were 1.82, 3.76, 7.02, and 12.05 mW/g
at the temperatures 10°C, 20°C, 30°C, and 40°C, respectively (see Table 4-1)17. This difference
17
The peak hydration values used to determine the modelling parameters corresponded to the secondary
peak. If the values from the primary peaks were used, Ea would be 44.8 kJ/mol.

99
would propagate throughout the calculations, leading to under or overestimation of the degree of
hydration development.
The above determination has been based on the general assumption of the peak hydration
rates occurring at the same degree of hydration. With the availability of experimentally calibrated
calorimetric data, Ea can be evaluated at any degree of hydration () value. Figure 4-42 shows such
an analysis made for the WC1 paste. The activation energy (solid line), shown on the primary Y-
axis, has a variable profile. The variation can be broken down into four main phases and becomes
clearer by drawing a comparison with the averaged normalised kinetics curve (dashed line, plotted
on secondary Y-axis). The first segment corresponds to post-dormancy C-S-H and ettringite
formation, where Ea varies between 45 – 46 kJ/mol. The second segment corresponds to the
approach of the secondary peak and causes a spike, and can be attributed to the concurrent
formation of CSH and C3A dissolution. The downward tendency of the third segment would be an
indicator of the hydration process moving towards a diffusion based hydration mechanism. The
fourth segment would correspond to C4AF hydration, with Ea varying from 41 kJ/mol at ≈ 0.4 to
about 48 kJ/mol at ≈ 0.51. Thereafter, a downward tendency is seen and would represent the
beginning of the C2S dominant hydration phase.
Figure 4-43 shows Ea determination for the WC2 paste using the peak rate of heat release
values listed in Table 4-2. With Qfinal ≈ 547 J/g, Ea and A were determined as 45.4 kJ/mol and 866
s-1, respectively (Table 4-8). Similar to the WC1 paste, a variable Ea profile was prepared for the
WC2 paste and is shown in Figure 4-44. The WC2 Ea profile has characteristics similar to that of
the WC1 paste, such as the occurrence of the two spikes (Segments 2 and 4) corresponding to C3A
and C4AF hydration, respectively.
4.5.2 Mix pastes
Figure 4-45 shows the Ea and A plot for the WC3 paste. Ea and A were determined to be 35.6
kJ/mol and 10.7 s-1 (determined using Qfinal = 506.7 J/g of cement), respectively. The lower Ea
value for the WC3 paste (in comparison to the plain pastes) can be attributed to the addition of
admixtures (Poole, 2007).
The multi-segmented variable Ea profile, shown in Figure 4-46, also presents the scenario of
the lowered activation energy. To evaluate the key zones of the multi-segmented profile, a
comparison has to be drawn with the respective normalised kinetics curves shown in Figure 4-36.
Since all pastes have paste specific normalised kinetics, the variable Ea profile segmentation is
paste specific. The first segment, related to sharp rise, would be representative of the complicated
interactions between the cement clinkers and the admixtures, in particular the accelerator. The
second (horizontal) segment lay at approximately 35 kJ/mol and is closer to the Ea value of 33
kJ/mol expected for C3S clinkers (D’Aloia and Chanvillard, 2002). Thus, it can be considered to be
a zone dominated by C3S hydration, and with little or no ettringite formation. The third segment is

100
interpreted to be the indistinguishable secondary peak occurring simultaneously with C3S
hydration. The fourth segment may correspond to C4AF hydration. Thus, the use of admixtures,
especially the accelerator, has changed the hydration development behaviour.
For the WC4 paste, Ea and A were determined to be 38.4 kJ/mol and 36.0 s-1, respectively,
(Figure 4-47). The WC4 Ea profile (Figure 4-48) has a different pattern to the WC3 profile. In the
first segment, the profile rises sharply from approximately 28 kJ/mol at ≈ 0.12 to around 40
kJ/mol at ≈ 0.28. Thereafter, a hump is observed rising to the value of 48 kJ/mol at ≈ 0.4 and
then, a decline to about 42 kJ/mol is observed till ≈ 0.49. With no clear phase indicator available,
the hump is seen as the conjunction of Segments 2 and 3, with C3A hydration occurring at ≈ 0.4,
though the end of the segment is an arbitrary choice. Similarly, the beginning and end of the fourth
segment (supposedly the C4AF hydration) are also arbitrary limits with no clear explanation.
Before speculating any clinker hydration or admixture impact as a reason for a wide range of
Ea for the WC3 and WC4 pastes, the normalised curves from Figure 4-40 were revisited. A trial
was made to rearrange these curves in a way that all the post-dormancy slopes of all curves align
along a common slope, with the 20°C curve used as the datum profile (Figure 4-49). The
rearranged normalised kinetics curves provided more consistent Ea profiles (dashed line in Figure
4-50) and could be broken into segments – < 0.28, 0.28 < < 0.48, and 0.48 < < 0.54,
corresponding to hydration stages dominated by C3S, C3A and C4AF hydration, respectively. Here,
the Ea variability was an outcome of the arrangement of the four normalised kinetics curves. Thus,
for the hydration modelling of the mix pastes, the Ea variability can be accommodated by using
temperature sensitive normalised kinetics values. The solid line represents the WC3 Ea profile
redeveloped on the same lines and is of similar nature, but with an offset of 2 – 3 kJ/mol. This
offset can be seen as the outcome of the microsilica addition.
4.5.3 Modelling parameter outcome and summary
The lowering of the activation energy of the cementitious systems due to the admixtures is in
agreement with the findings of Poole (2007). Poole (2007) attributes lowering of the activation
energy to dispersion mechanism induced by the superplasticiser and acceleration of C3A hydration
by the accelerator as well as the retarder. Though the outcomes are in line with Poole (2007), no
other comparative such as the scale of change in magnitude could be made due to various reasons.
Firstly, Poole (2007) obtained the results by using one admixture at a time whereas the mix pastes
had three admixtures at once. Therefore, it is not clear which is the dominant mechanism.
Secondly, the admixtures formulations used in the mix pastes were different than used by Poole
(2007). Lastly, Poole (2007) used a different calculation procedure. Thus, any detailed comparison
would be irrelevant.

101
In terms of the microsilica addition, the low dosage of microsilica caused a minimal
decrease in the activation energy of the plain pastes, representing inertness of the microsilica
towards the cement hydration. This is in contrast to Poole (2007), who reported a substantial
decrease due to the microsilica addition and explained it on the basis of the increased nucleation
sites for the cement hydration. Comparing the plain paste ages at the dormant and peak flow stages
at the different curing temperatures (Table 4-1 and Table 4-2), it is concluded the increased
nucleation site phenomenon did not occur, at least until the peak flow stage. Furthermore, since the
calculation method used by Poole (2007) is different than used in this research, such a comparison
may not be relevant. Barbosa et al. (2005) have reported that addition of microsilica increases the
activation energy. Since the outcome was based on the strength testing results and used hyperbolic
fitting approach (per ASTM C 1074), no direct comparison could be drawn.
In contrast to the plain pastes, the microsilica created a higher impression in the mix pastes,
increasing the activation energy from 36 kJ/mol (WC3) to 38 kJ/mol (WC4). The increase in
activation energy indicates the retarding nature of microsilica for the cement pastes with
admixtures. Comparing the mix paste ages at the dormant and peak flow stages (Table 4-3 and
Table 4-4), the shorter ages do indicate higher reactivity, attributable to the increased nucleation
sites. The reason for such a contrary behaviour is unclear at this stage. Further investigations would
require more testing and is out of the scope of this research.
An evaluation of the activation energy variability profiles revealed that the plain pastes had
similar profiles, but with a small offset. The mix paste activation energy profiles were different and
inconsistent among themselves. An investigation through the normalised kinetics suggested that
the admixed cementitious systems must be modelled using temperature sensitive normalised
kinetics.
4.6 Degree of hydration modelling
4.6.1 Isothermal modelling
Typical maturity methods, such as the ‘equivalent age’, presume that the normalised kinetics
of cement hydration (0( )if or Nk) is the same at all temperatures. The plain pastes were found
to be in close agreement with this assumption, as seen in Figure 4-40 and Figure 4-44. A curve at a
reference temperature, such as 20°C, can be chosen to model development. The following
formulation can be used under isothermal conditions:
T
0
d /d it
i iit t 4-9
0 a
0
( ) exp( / ) it
i i if A E RT t 4-10

102
Figure 4-51 shows the measured and modelled d/dt at the different testing temperatures for
the WC1 pastes. The lines represent the measured hydration rates while the markers represent the
modelled hydration rates. For ease of representation, only a few points of modelled rates are
shown. The modelled rates were calculated using Ea = 46.5 kJ/mol, A = 1332.5 s-1 and the
normalised kinetics at T = 20°C (shown in Figure 4-40). Next, these calculated rates were
integrated to develop the hydration development histories, and are shown in Figure 4-52. Here, the
hydration development was modelled from the dormancy trough onwards and using t = 0.1 hrs.
The measured and modelled histories were found to be in close agreement during the early ages, as
is the scope of the maturity method. The later age variation between the measured and modelled
profiles of T = 40°C is because the normalised kinetics for T = 40°C tends to zero by = 0.6 while
the 20°C curve has not.
Using the same approach for the mix pastes, such as for the WC4 paste, the outcomes were
inconsistent. Figure 4-53 compares the measured rate of hydration and the rates of hydration
calculated using the 20°C normalised kinetics. Since the early age calculated rates of hydration at
30°C and 40°C were over predicted, the respective degree of hydration development histories were
overestimated (Figure 4-54).
Figure 4-55 in conjunction with Figure 4-40 shows the full extent of the normalised kinetics
evolution between the zone of the accelerator addition and the dormancy trough. With the
significant variation of each profile, it is more reasonable to model the hydration development
using the temperature specific normalised kinetics curves. Figure 4-56 presents the comparison
between the measured and modelled hydration development histories, demonstrating the accuracy
of the modelling approach.
4.6.2 Non-isothermal modelling
Under non-isothermal conditions, the isothermal formulation is changed to the following:
T
0
d /d i
i
t
i ii
t t 4-11
0 a
0
( ) exp( / ) i
i
t
i i i iTf A E RT t 4-12
The application of the formulation is explained through the algorithm presented in Figure
4-57. If Ti < 10, then Nk,i value for T = 10°C is used. Similarly, if Ti > 40°C, Nk,i is determined from
the 40°C curve. When applying this algorithm for concrete hydration modelling, the input
temperature Ti would correspond to the measured temperature of the concrete. For example, at =
0.3, Nk,T=20°C = 0.894 and Nk,T=30°C = 0.933. To determine the normalised kinetics at 25°C, the two
values are interpolated to arrive at Nk,T=25°C = 0.913.

103
4.6.3 Modelling challenges from field measurements
The presented testing has been done on cement pastes. Though the final heat of hydration
and the thermogravimetric degree of hydration estimates were determined efficiently, the
normalised kinetics curves are representative of the cementitious system only and may show a
behavioural change in the presence of aggregates. Thus, a concurrent mortar testing may be a
helpful solution to study such an aspect.
4.7 Result summary
The thermo-chemical evaluation involved establishing the cement hydration modelling
parameters, namely the activation energy, the affinity constant and normalised kinetics for the
sprayed concrete mix. It was achieved through isothermal calorimetry and thermogravimetric
testing of four cement pastes, categorised as plain and mix pastes. The testing revealed that the
admixtures induce temperature sensitivity to the normalised kinetics and decrease the activation
energy for the cement hydration reaction. To incorporate the temperature sensitivity of the
normalised kinetics, the sprayed concrete hydration modelling would require temperature based
interpolation of the normalised kinetics curves.


105
Table 4-1 Rate of heat release (dQ/dt) and heat of hydration (Q) for WC1 paste
Dormant flow Peak flow Heat differentials
Temperature Age dQ/dt Q Age dQ/dt Q Q
(°C) hrs mW/g J/g hrs mW/g J/g J/g
10 3.1 0.55 30.8 19.7 1.82 112.4 81.6
20 1.6 0.81 16.7 10.1 3.76 98.4 81.7
30 1.1 0.95 1.6 6.0 7.02 76.3 74.7
40 1.0 0.70 -1.3 4.5 12.05 70.5 71.8
Table 4-2 Rate of heat release (dQ/dt) and heat of hydration (Q) for WC2 paste
Dormant flow Peak flow Heat differential
Temperature Age dQ/dt Q Age dQ/dt Q Q
(°C) hrs mW/g J/g hrs mW/g J/g J/g
10 3.0 0.58 32.4 19.4 1.84 114.6 82.2
20 1.4 0.82 16.7 10.2 3.71 99.2 82.5
30 1.2 0.95 2.2 6.1 6.86 79.1 76.9
40 1.1 0.79 9.5 4.6 11.69 85.0 75.5
Table 4-3 Rate of heat release (dQ/dt) and heat of hydration (Q) for WC3 paste
Dormant flow Peak flow Heat differential
Temperature Age dQ/dt Q Age dQ/dt Q Q
(°C) hrs mW/g J/g hrs mW/g J/g J/g
10 8.1 0.61 70.6 25.6 1.49 139.2 68.6
20 3.4 1.00 52.3 14.6 2.71 131.9 79.6
30 3.0 1.06 37.5 13.8 3.92 132.2 94.7
40 2.6 1.03 30.9 9.9 6.57 120.7 89.8
Table 4-4 Rate of heat release (dQ/dt) and heat of hydration (Q) for WC4 paste
Dormant flow Peak flow Heat differential
Temperature Age dQ/dt Q Age dQ/dt Q Q
(°C) hrs mW/g J/g hrs mW/g J/g J/g
10 5.7 0.77 70.5 20.4 1.56 137.2 66.7
20 3.4 1.10 55.2 12.8 2.84 127.9 72.7
30 2.9 1.36 50.6 9.8 4.51 127.9 77.3
40 2.3 1.53 27.1 7.2 7.60 108.8 81.7

106
Table 4-5 Weight loss profiles at the different temperatures
Weight loss
profile Sample type
Residue type
Initial mass Dry Ignited
Room temperature 140°C 1000°C
Measured
Cement 100.0 99.7 96.5
Microsilica 100.0 99.5 97.6
Accelerator 100.0 65.9 20.0
Superplasticiser 100.0 30.5 1.8
Retarder 100.0 20.6 17.2
Theoretical solid
content
WC1 103.6 103.4 100.0
WC2 103.6 103.3 100.0
WC3 107.2 105.2 100.0
WC4 106.9 105.0 100.0
Theoretical
cement (binder)
content
WC1 103.6 103.4 100.0
WC2 97.6 (103.6) 97.3 (103.3) 94.1 (100.0)
WC3 101.7 101.3 98.2
WC4 95.8 (101.7) 95.4 (101.3) 92.5 (98.3)
Table 4-6 Heat and degree of hydration corrections
Isothermal calorimetry testing temperature
10°C 20°C 30°C 40°C
Qcorrection correction Qcorrection correction Qcorrection correction Qcorrection correction
WC1 -14.6 -0.028 -2.6 -0.005 10.5 +0.020 11.6 +0.022
WC2 -5.5 -0.010 2.9 +0.005 18.5 +0.034 13.9 +0.025
WC3 -6.2 -0.012 -4.9 -0.010 3.0 +0.006 7.3 +0.014
WC4 -22.8 -0.044 -9.5 -0.018 -1.4 -0.003 15.7 +0.030
Table 4-7 Normalised kinetics (Nk) curve characteristics for WC4 pastes
10°C 20°C 30°C 40°C Average
Nk Nk Nk Nk Nk
initial 0.022 14.34 0.021 8.16 0.030 4.56 0.040 1.62 0.040 4.45
dormant 0.091 0.49 0.087 0.39 0.302 0.30 0.082 0.20 0.089 0.37
peak 0.218 1.00 0.226 1.00 0.242 1.00 0.238 1.00 0.232 1.00
0.1 0.100 0.55 0.100 0.50 0.100 0.34 0.100 0.36 0.100 0.44
0.2 0.200 0.99 0.200 0.99 0.200 0.96 0.200 0.96 0.200 0.97
0.3 0.300 0.77 0.300 0.89 0.300 0.93 0.300 0.92 0.300 0.88
0.4 0.400 0.39 0.400 0.43 0.400 0.56 0.400 0.57 0.400 0.49
0.5 0.500 0.21 0.500 0.21 0.500 0.23 0.500 0.25 0.500 0.22
0.6 0.600 0.13 0.600 0.12 0.600 0.12 0.600 0.10 0.600 0.12
Table 4-8 Hydration modelling parameters for different pastes
Using peak dQ/dt Using instantaneous dQ/dt
Qfinal Ea A Ea,i at i
J/g kJ/mol 1/s kJ/mol
WC1 524.5 46.5 1332.5 44.2±2.1 (0.04 < < 0.57)
WC2 547.4 45.4 866.5 43.9±1.7 (0.07 < < 0.58)
WC3 506.7 35.6 10.7 36.2±1.5 (0.12 < < 0.54)
WC4 527.7 38.4 36.0 40.6±5.4 (0.11 < < 0.60)

107
Figure 4-1 Rate of heat release histories for WC1 paste
Figure 4-2 Heat of hydration histories for WC1 paste

108
Figure 4-4 Heat of hydration histories for WC2 paste
Figure 4-3 Rate of heat release histories for WC2 paste

109
Figure 4-5 Rate of heat release histories for WC3 paste
Figure 4-6 Heat of hydration histories for WC3 paste

110
Figure 4-7 Rate of heat release histories for WC4 paste
Figure 4-8 Heat of hydration histories for WC4 paste

111
Figure 4-10 Normalised rate of heat release vs heat of hydration for WC1 paste
Figure 4-9 Rate of heat release vs heat of hydration for WC1 paste

112
Figure 4-11 Rate of heat release vs heat of hydration for WC2 paste
Figure 4-12 Normalised rate of heat release vs heat of hydration for WC2 paste

113
Figure 4-13 Rate of heat release vs heat of hydration for WC3 paste
Figure 4-14 Normalised rate of heat release vs heat of hydration for WC3 paste

114
Figure 4-15 Rate of heat release vs heat of hydration for WC4 paste
Figure 4-16 Normalised rate of heat release vs heat of hydration for WC4 paste

115
Figure 4-17 Thermogravimetric weight loss for anhydrous cement and microsilica powder
Figure 4-18 Weight loss assessment of anhydrous powder on ignited mass basis

116
Figure 4-19 Thermogravimetric weight loss profile for admixtures
Figure 4-20 Theoretical weight loss correction profile of initial solid mass on ignited mass basis

117
Figure 4-22 Weight loss assessment for WC1 pastes cured at 20°C
Figure 4-21 Weight loss assessment for WC2 pastes cured at 20°C

118
Figure 4-23 Weight loss assessment for WC3 pastes cured at 20°C
Figure 4-24 Weight loss assessment for WC4 pastes cured at 20°C

119
Figure 4-25 Final heat of hydration estimation for WC1 paste
Figure 4-26 Calorimetric vs thermogravimetric degree of hydration for WC1 paste

120
Figure 4-27 Degree of hydration development history for WC1 paste cured at 20°C
Figure 4-28 Normalised kinetic curves for WC1 paste

121
Figure 4-29 Final heat of hydration estimation for WC2 paste
Figure 4-30 Calorimetric vs thermogravimetric degree of hydration for WC2 paste

122
Figure 4-31 Degree of hydration development history for WC2 paste at 20°C
Figure 4-32 Normalised kinetic curves for WC2 paste

123
Figure 4-33 Final heat of hydration estimation for WC3 paste
Figure 4-34 Calorimetric vs thermogravimetric degree of hydration for WC3 paste

124
Figure 4-35 Degree of hydration development history for WC3 paste cured at 20°C
Figure 4-36 Normalised kinetic curves for WC3 paste

125
Figure 4-37 Final heat of hydration estimation for WC4 paste
Figure 4-38 Thermogravimetric vs corrected calorimetric degree of hydration for WC4 paste

126
Figure 4-39 Degree of hydration development history for WC4 paste cured at 20°C
Figure 4-40 Normalised kinetic curves for WC4 paste

127
Figure 4-41 Activation energy determination for WC1 paste
Figure 4-42 Variable activation energy profile for WC1 paste

128
Figure 4-43 Activation energy determination for WC2 paste
Figure 4-44 Variable activation energy profile for WC2 paste

129
Figure 4-45 Activation energy determination for WC3 paste
Figure 4-46 Variable activation energy profile for WC3 paste

130
Figure 4-47 Activation energy determination for WC4 paste
Figure 4-48 Variable activation energy profile for WC4 paste

131
Figure 4-49 Realigned WC4 normalised kinetic curves for variable activation energy evaluation
Figure 4-50 Re-evaluated activation energy profiles of WC3 and WC4 pastes

132
Figure 4-51 Measured and calculated hydration rates for WC1 paste using 20°C normalised
curve
Figure 4-52 Measured and calculated degree of hydration development for WC1 paste using
20°C normalised curve

133
Figure 4-53 Measured and calculated hydration rates for WC4 paste using 20°C normalised
curve
Figure 4-54 Measured and calculated degree of hydration development for WC4 paste using
20°C normalised curve
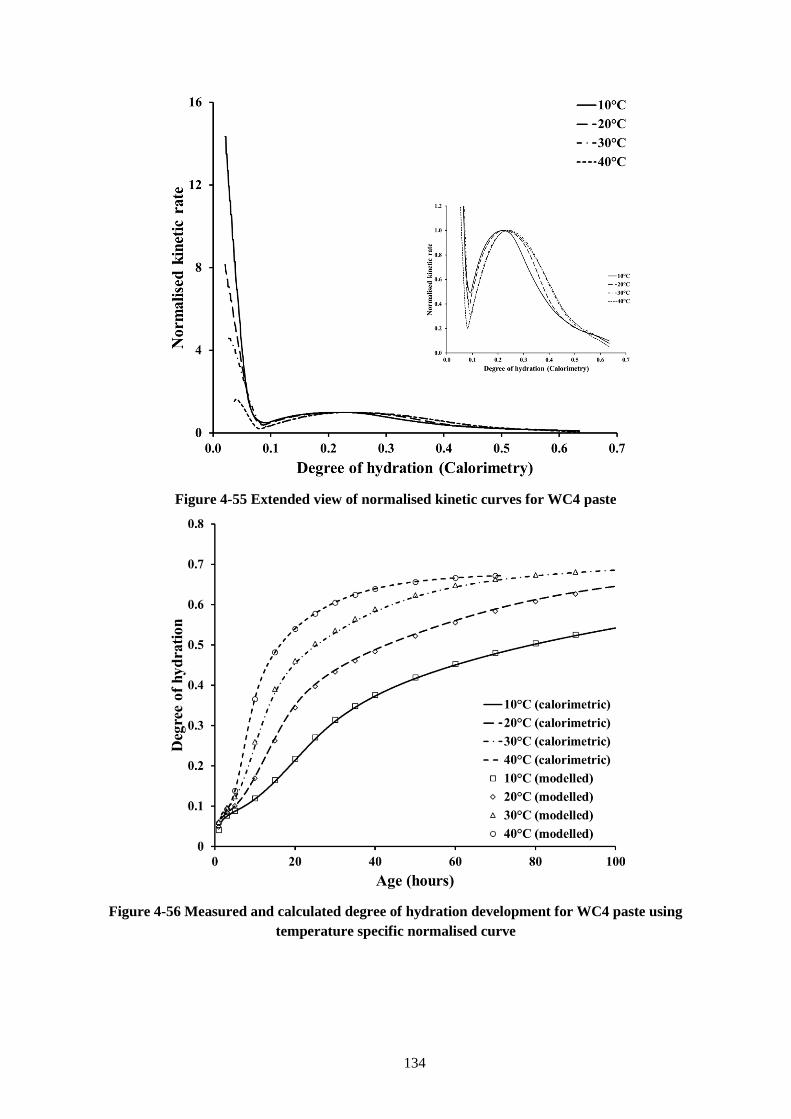
134
Figure 4-55 Extended view of normalised kinetic curves for WC4 paste
Figure 4-56 Measured and calculated degree of hydration development for WC4 paste using
temperature specific normalised curve

135
Figure 4-57 Degree of hydration development modelling under non-isothermal conditions


137
5 Thermo-mechanical evaluation of Whitechapel
sprayed concrete works
The thermo-mechanical evaluation of the sprayed concrete involved its thermal monitoring
and mechanical testing. The thermal monitoring was done using thermal imaging and the
mechanical testing using the sprayed concrete specific compressive strength testing methods,
namely the needle penetration and the stud-driving method. The thermal monitoring data were used
to evaluate the sprayed concrete maturity development through the Arrhenius equation based
maturity function. The thermo-chemical evaluation outcomes of the Whitechapel sprayed concrete
mix, presented in Chapter 4, were applied to model the sprayed concrete maturity development18.
This chapter presents outcomes of eight sets of sprayed panels tested for establishing
strength – hydration relationship. Each set consisted of five panels. With the goal of applying
maturity method on the sprayed concrete lining, seven lining sections were also thermally imaged
for strength development assessments.
5.1 Panel testing results
Panel Set 1
The first set of five panels was sprayed in a secluded and well-ventilated zone of under-
construction tunnel section. The panels were exposed to the ambient temperatures of around 15°C.
The fresh concrete mix (before spray) had a temperature of 15°C.
The testing schedule was proposed to be similar to the one listed in Table 2-6, though, tests
such as at 15 min, 30 min and 3 hrs could not be performed due to the lack of strength
development. The first successful penetrometer testing was possible at 1.1 hrs and was followed by
another one at 1.8 hrs. The 1.1 hr strengths ranged between 0.25 and 0.35 MPa (see Figure 5-1),
and 1.8 hr strengths were between 0.29 and 0.41 MPa. Thereafter, the stud-driving (standard Hilti)
method was used. Due to the slow strength development, the first stud-driving test could be made
at about 4 hrs, providing the in-situ compressive strength estimates of 2 – 4 MPa. The subsequent
stud-driving testing was deferred to 8 hrs due to site access restrictions. The 8 hr in-situ strengths
ranged from 9 and 10 MPa. Further strength testing was performed at 12 hrs and 25 hrs. The 12 hr
18
Since the concrete maturity development is an outcome of the cement hydration, the maturity development
was quantified in terms of the degree of hydration development, and the terms ‘maturity’ and ‘degree of
hydration’ (sometimes simply ‘hydration’) are interchangeable.

138
strengths were in the range of 14 – 16 MPa. The 25 hr testing had a considerable scatter, varying
between 17 and 25 MPa. The large scattering is attributed to the upper limit of 16 MPa of the
standard test method is 16 MPa (Hilti Corporation, 2009). Thus, the exceptionally high value of 25
MPa is not reliable. The zones Z1 and Z2 in Figure 5-1 are marked to classify to the penetrometer
and standard method data.
Figure 5-1 also shows the temperature histories of all the panels. The temperature histories
were developed from the thermal imaging data collected in parallel with the in-situ strength testing.
The panel surface temperatures immediately after the spray were in the range of 20 – 22°C, and
gradually decreased to around 18°C, staying in that range for next 2 hrs. The 2 hr period of
constant temperature represents the approach to the dormancy period. The cement hydration, once
renewed by the onset of the silicate hydration, led to the temperature rise. The temperature rise
continued until about 12 hrs, peaking at 25°C and then, falling to 18°C by 45 hrs. The temperature
histories for all panels are tabulated in Appendix A6.
Next, the temperature histories were used to model the degree of hydration development
using the thermo-chemical evaluation outcomes discussed in Chapter 4. The modelling procedure
was based on the flow chart shown in Figure 4-57 and used ti = 0.1 hrs. Figure 5-2 shows the
modelled rate of hydration and degree of hydration development. The modelled rate of hydration
curves indicate the post-accelerator dormancy trough and the peak flow phases occur around 2.5
hrs and 13 hrs, respectively. Thus, the modelled rates of hydration are in agreement with the
temperature evolution noted in Figure 5-1. The degree of hydration values at the time of strength
testing are tabulated in Appendix A7. The strength vs degree of hydration data were used to
establish the strength – hydration relationship. The relationship was established using the data from
all eight sets and is discussed in Section 5.2.
Panel Set 2
The second set was sprayed in the western section of East Bound Rail Tunnel (EBRT-W)
and corresponds to the lining works of the pilot tunnel Advance 177. The panels were sprayed at
the end of the lining spray. The fresh concrete mix had a temperature of 15°C. With the panels
being placed in the vicinity of the active excavation and spraying works; there was a frequent
change in the ambient conditions such as equipment heat, and humidity change (due to spraying
and ventilation).
Each panel was tested six times, thrice with the penetration needle (up to 1 hr) and thrice
with the standard Hilti method (at 6, 13 and 25 hrs). Since the panels had achieved a strength of
around 15 – 20 MPa (Figure 5-3), above the upper limit of the standard stud-driving test, by 13 hrs,
the 25 hr strengths may have been underestimated.
In terms of the temperature histories, a typical temperature variation pattern, similar to Set 1,
is observed. Though, the impact of ongoing construction works around the panels is seen in terms

139
of the higher temperatures of the panels when compared to Set 1. Figure 5-4 shows the rate of
hydration and degree of hydration curves modelled using the Set 2 temperature histories. The in-
situ strength and corresponding degree of hydration data are tabulated in Appendix A7.
Panel Set 3
The third set of five panels corresponds to the lining works related to Advance 186 of
EBRT-W pilot tunnel. The panels were sprayed at the end of lining works for the advance. The
fresh concrete mix had a temperature of 20°C. The panels were sprayed about 50 m behind the
lining works and were exposed to consistent ambient temperatures of 20°C.
Each panel was tested five times, thrice with penetrometer and twice with the standard
method (at 6 hrs and 30 hrs). Figure 5-5 shows the measured strengths as well as the temperature
histories of the Set 3 panels. The zones Z1 and Z2 in Figure 5-5 are marked to classify to the
penetrometer and standard method data. Comparing the 30 hr strengths with 25 hr strengths of Set
1 and Set 2, the 30 hr strengths are seen as the underestimated values. Figure 5-6 shows the rate of
hydration and degree of hydration development modelled using the temperature histories shown in
Figure 5-5. The strength and corresponding degree of hydration values are provided in Appendix
A7.
Panel Set 4
Figure 5-7 shows the strength development and thermal histories of the fourth set of panels.
The panels were sprayed at the end of the lining works of Advance 18 of the enlargement of the
eastern section of East Bound Rail Tunnel (EBRT-E), with fresh concrete mix having a pre-spray
temperature of less than 20°C. The panels were located at 3 m distance of the corresponding
section and were exposed to the significant variations in ambient conditions. The impact can be
observed during the very early hours where the surface temperatures immediately after spraying
were approximately 20°C but then remain constant at approximately 25°C during the dormancy
period. The dormancy period ended around 3 hrs with a temperature of 25°C and the peak
temperatures were observed at 7 hrs and varied between 28 and 32°C. Panel 4A was most exposed
to the ventilation system, and hence, had the lowest temperature profile. The strength testing was
conducted, with the standard method only, at 4, 7 and 18 hrs. Figure 5-8 shows the rate of
hydration and degree of hydration development curves modelled using the temperature histories
shown in Figure 5-7. The strength and corresponding degree of hydration values are provided in
Appendix A7.
Panel Set 5
Panel Set 5 was sprayed at the end of the lining works for Crossover Enlargement Advance
31 and had an ambient temperature of around 30°C. The fresh concrete mix had a temperature of
25°C. The panels were located at a distance of approximately 5 m from the corresponding lining
section. With a larger cross-section of enlargement excavation, the construction activities,

140
including ventilation, had no direct impact on the panels. Therefore, the panels remained exposed
to consistent ambient temperatures of around 30°C. Figure 5-9 shows the panel strength
development and temperature histories. With the strength estimates of 16 – 18 MPa by 12 hrs, the
panels had achieved the strengths beyond the standard method’s upper testing limit. Thus, no
further strength testing was made. Figure 5-10 shows the degree of hydration curves modelled
using the temperature histories shown in Figure 5-9. The strength and the corresponding degree of
hydration values are provided in Appendix A7.
Panel Set 6
The sixth set of sprayed panels was sprayed after the completion of the lining works of
Advance 37 of the Crossover Enlargement section. The fresh concrete had a temperature of over
25°C, and the panels were exposed to the ambient temperatures of around 30°C. Overall the Set 6
panels were exposed to conditions similar to the Set 5 panels. Figure 5-11 presents the strength and
temperature histories of the sprayed panels. With the strength estimates of 14 – 18 MPa by 12 hrs,
the panels had achieved the strengths beyond the standard method’s upper testing limit. Thus, no
further strength testing was undertaken. Figure 5-12 shows the rate of hydration and degree of
hydration development modelled using the temperature histories. The strength and corresponding
degree of hydration values are provided in Appendix A7.
Panel Set 7
The seventh set of five panels was sprayed after the completion of the lining works of
Crossover Enlargement Advance 64. The fresh concrete mix had a temperature of 28°C. The
panels were located at a distance of 5 m from the corresponding lining section and remained
exposed to the ambient temperatures of over 30°C. Figure 5-13 shows the strength and temperature
histories of the panel set. Each panel was tested four times, around 4, 6, 12 and 24 hrs. The 4, 6,
and 12 hrs testing was made using the standard Hilti method (classified as zone Z2). Observing the
12 hrs strengths of 15 to 18 MPa, the 24 hrs testing was performed using the special Hilti method
(classified as zone Z3). Figure 5-14 present the degree of hydration data modelled using the
temperature histories shown in Figure 5-13. The strength and corresponding degree of hydration
values are provided in Appendix A7.
Panel Set 8
Panel Set 8 was sprayed at the end of the lining works for Crossover enlargement Advance
76. The ambient conditions for Set 8 panels were similar to that of Set 7. Also, similar to Panel Set
7, the special Hilti method was used after the age of the 12 hrs. Figure 5-15 shows the strength and
temperature histories of the Set 8 panels, with zones Z1, Z2 and Z3 referring to the penetrometer,
the standard method and the special method data, respectively. Figure 5-16 shows the modelled
degree of hydration development for Panel Set 8. The temperature, strength, and corresponding
degree of hydration data are provided in Appendix A7.

141
5.2 Strength – hydration relationship
5.2.1 Anomalous strength values
Figure 5-17 shows the strength vs hydration data from all eight sets. The three zones, namely
Z1, Z2 and Z3 correspond to strengths determined from the penetrometer, standard Hilti and
special Hilti methods, respectively.
Since the standard Hilti method uses a calibration for converting stud penetration and pull-
out load outcomes to estimate the sprayed concrete strength, the outcomes around the lower and
upper limits (3 MPa and 16 MPa, respectively) may get misrepresented. At this stage of research,
the lower limit results were accepted as obtained but the upper limit results were scrutinised for
correctness through a dual consideration of the age and the maturity of the sprayed concrete. Some
of the standard method strengths below the upper testing limit of 16 MPa were excluded while
some of the standard method strengths over 16 MPa were included. The following is a discussion
of the exclusions.
The first investigation was made for Set 7 (Figure 5-13) and Set 8 (Figure 5-15). On time
scale, the strength development between 6 and 24 hrs seemed fine. Presuming there existed a linear
strength – hydration relationship since the age of 6 hrs, the 12 hr strengths (occurring around the
degree of hydration of 0.4) were interpreted as the underestimated outcomes. Though a biased
interpretation, it is a plausible scenario. Based on this investigation, a subzone under zone Z2
(referred to as Z2a) was classified for further anomalous data investigation. The subzone Z2a was
limited for the standard method strengths above 13 MPa and the degree of hydration above 0.4.
For Set 5 (Figure 5-9) and Set 6 (Figure 5-11), the 12 hr strength lay in the subzone Z2a. In
the absence of any other indicator, the 12 hrs strengths were considered to be acceptable outcomes.
In the case of Set 1 (Figure 5-1), considering the curing temperature histories and subsequent
modelled degree of hydration development, all standard method strengths were included with only
two exceptions. The two exceptions were the 25 hr strengths of Panels 1A and 1D. Panel 1A
strength was excluded due to its unusually high value of 25 MPa. Since Panel 1D showed a
negligible increase over a period of 13 hrs, from 16 MPa at 12 hr age to 17 MPa at 25 hr age, the
25 hr strength was excluded.
For Set 2, the negligible strength increase, for all five panels, between 12 and 25 hrs (see
Figure 5-3) were interpreted as underestimated values, and hence, excluded.
In the case of Set 3, since the 30 hr strengths and modelled degree of hydration values for
Set 3 were similar to the 24 hr values of Set 2, the 30 hr results for the Set 3 were excluded.
No exclusions were made for Set 4.
In summary, the curing temperatures influenced the sprayed concrete strength development
and required scrutiny of the standard method results around its upper testing limit of 16 MPa.

142
5.2.2 Establishing strength – hydration relationship
After applying the discussed corrections, the data was correlated linearly, as shown in Figure
5-18. The single relationship ofc 53.0 ( 0.041)f , with a standard error of 2.3 MPa, is not well
suited, in particular for the penetrometer data. The strength data could be more rationally analysed
when studied in conjunction with the normalised kinetics (included in Figure 5-18). Since most of
the penetrometer testing has been performed in the pre-dormancy zone of normalised kinetics, and
the linear strength – hydration relationship is known to occur after the dormancy period
(Christensen, 2006), thus, the penetrometer data must be analysed separately from the Hilti stud-
driving test data.
The stud-driving experimental data provided a linear relationship of c 43.2 ( 0.033)f ,
shown in Figure 5-19. Though the relationship is in better agreement than the previous one, the fit
is less satisfactory for < 0.15. Viewing the data in conjunction with the variable activation energy
profile shown in Figure 4-48, the zone of less satisfactory data can be correlated to the phase of
hydration influenced by the accelerator activity. Thus, the rate of strength development would be
different for the accelerator-induced hydration phase. Considering the accelerator influence ends
during 0.15 < < 0.20, the stud-driving results were further classified into two zones. With closer
investigation, the data up to ≈ 0.17 were chosen as the end of the accelerator influenced rapid
hardening phase. Thus, the sprayed concrete was found to have multiple phases of strength
development, which are being referred to as the ‘accelerated set’, the ‘rapid strength development’,
and the ‘standard strength development’ phases.
During the accelerated set phase, the strength results are quite scattered (Figure 5-20) and
present no clear relationship to hydration development, and can be related to the significant
variation of temperature specific normalised curves for the mix in early hydration (Figure 4-55).
The accelerated set phase is highly sensitive to factors such as the performance of admixtures and
spraying workmanship. Generalising the low strength development pattern from the penetrometer
data (0.061 < < 0.091), the following linear relationship (R1) was established:
c 9.1 ( 0.038) with a standard error of 0.1 MPaf 5-1
The large scatter of the data is attributed to the factors such as the fresh concrete mix
temperature, sprayer’s workmanship and, most importantly, the penetrometer calibration. In the
above relationship, the slope of 9.1 MPa is more important than the offset of 0.038. The offset can
be seen as the quality of the initial compaction achieved. Since the hydration is modelled from =
0.04, therefore, the relationship R1 would be applicable from the degree of hydration of 0.04
onwards only.
For the rapid strength development phase, a linear relationship was established by using
strength data for 0.083 < < 0.172. Thus, some of the penetrometer data have also been included.

143
The selection was based on the assumption that there is a sharp transition between the two adjacent
phases. Therefore, the last available penetrometer data should be considered. Figure 5-21 shows
the linear relationship (R2) deduced for the accelerator influenced rapid strength development
phase and is as follows:
c with a standard126.0 ( 0.08 error of 00 a) .8 MPf 5-2
With R1 and R2 intersecting at = 0.083 with fc = 0.4 MPa, R2 would be applicable for >
0.083 only. The rapid strength development is attributed to the set accelerator’s contribution
towards the strength development by thrusting C3S hydration with simultaneous consumption of
ettringite formation by Ca(OH)2 consumption (Myrdal, 2007a). Thus, the set accelerator also acts
as a rapid hardening agent.
Similarly, the third phase of the strength development was determined. Following the
assumption of using the last available value from the previous phase, strength data starting from as
low as = 0.112 was used to deduce the linear relationship R3 (Figure 5-22) and has the following
formulation:
c with a standard 40.4 ( 0.065) error of 1.7 MPaf 5-3
With R2 and R3 intersecting at = 0.148 and fc = 8.6 MPa, R3 is applicable for > 0.148
only. The segment R3 could be seen as the feature of the normal concrete, projecting the final
strength (fc,final) of 43 MPa at = 1.0, though the final strength could be much higher 43 MPa due
to later age strength contribution from C2S hydration. Since the relationship has been deduced
based on strength data of up to 1 day age, the relationship R3 must not be seen as the indicator of
long-term strengths. Moreover, the maturity method is about the early age strengths and not the
long-term strengths.
In summary, the admixtures, especially the accelerator, changed the maturity path of the
cement hydration and in turn changing strength – hydration relationship from a unique linear
relationship to a multilinear relationship.
5.2.3 Relationship verification
The in-situ core strengths for the sprayed concrete works are available from the 3, 28 and 90
days testing. Using the strengths from the lining sections corresponding to Panel Sets 2 – 7, the
mean 3, 28 and 90 days strengths were 36.6, 42.0 and 44.8 MPa, respectively, with a standard error
of 1.7, 1.0 and 1.3 MPa, respectively.
With the final segment R3 projecting the final compressive strength of approximately 43
MPa, it can be argued that the relationship is predicting fc,ultimate (typically 28 day strength) rather
than fc,final. Since the relationship has been deduced based on the strength data for the ages of 1 day,
it would not be able to account the later age strength development due to C2S hydration, a
substantial contributor in the later ages. In the absence of later age testing, it is not reasonable to
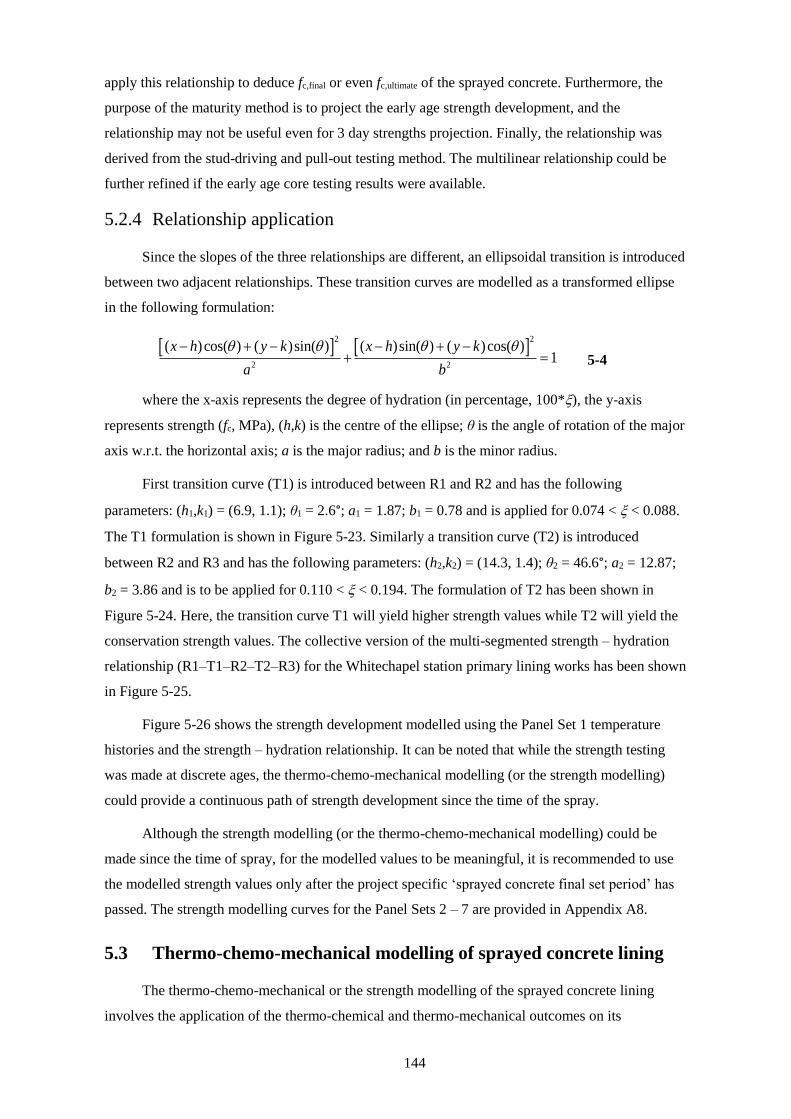
144
apply this relationship to deduce fc,final or even fc,ultimate of the sprayed concrete. Furthermore, the
purpose of the maturity method is to project the early age strength development, and the
relationship may not be useful even for 3 day strengths projection. Finally, the relationship was
derived from the stud-driving and pull-out testing method. The multilinear relationship could be
further refined if the early age core testing results were available.
5.2.4 Relationship application
Since the slopes of the three relationships are different, an ellipsoidal transition is introduced
between two adjacent relationships. These transition curves are modelled as a transformed ellipse
in the following formulation:
2 2
2 2
( )cos( ) ( )sin( ) ( )sin( ) ( )cos( )1
x h y k x h y k
a b
5-4
where the x-axis represents the degree of hydration (in percentage, 100*), the y-axis
represents strength (fc, MPa), (h,k) is the centre of the ellipse; θ is the angle of rotation of the major
axis w.r.t. the horizontal axis; a is the major radius; and b is the minor radius.
First transition curve (T1) is introduced between R1 and R2 and has the following
parameters: (h1,k1) = (6.9, 1.1); θ1 = 2.6°; a1 = 1.87; b1 = 0.78 and is applied for 0.074 < < 0.088.
The T1 formulation is shown in Figure 5-23. Similarly a transition curve (T2) is introduced
between R2 and R3 and has the following parameters: (h2,k2) = (14.3, 1.4); θ2 = 46.6°; a2 = 12.87;
b2 = 3.86 and is to be applied for 0.110 < < 0.194. The formulation of T2 has been shown in
Figure 5-24. Here, the transition curve T1 will yield higher strength values while T2 will yield the
conservation strength values. The collective version of the multi-segmented strength – hydration
relationship (R1–T1–R2–T2–R3) for the Whitechapel station primary lining works has been shown
in Figure 5-25.
Figure 5-26 shows the strength development modelled using the Panel Set 1 temperature
histories and the strength – hydration relationship. It can be noted that while the strength testing
was made at discrete ages, the thermo-chemo-mechanical modelling (or the strength modelling)
could provide a continuous path of strength development since the time of the spray.
Although the strength modelling (or the thermo-chemo-mechanical modelling) could be
made since the time of spray, for the modelled values to be meaningful, it is recommended to use
the modelled strength values only after the project specific ‘sprayed concrete final set period’ has
passed. The strength modelling curves for the Panel Sets 2 – 7 are provided in Appendix A8.
5.3 Thermo-chemo-mechanical modelling of sprayed concrete lining
The thermo-chemo-mechanical or the strength modelling of the sprayed concrete lining
involves the application of the thermo-chemical and thermo-mechanical outcomes on its

145
temperature history. Figure 5-27 summarises the overall process utilised in the lining strength
modelling. After the step of the strength – hydration relationship establishment, the further steps
were the lining thermal monitoring, hydration modelling and applying the strength – hydration
relationship. The thermal monitoring data for seven lining sections, pertaining to Panel Sets 2 – 7,
were available (tabulated in Appendix A9). Similar to the modelling procedure applied for the
Panel Set 1 to obtain Figure 5-26, the sprayed concrete lining strength development was modelled
for all seven section. Figure 5-28 shows the strength modelling of the lining section corresponding
to one of the seven panel sets. The outcomes for other six sections are provided in Appendix A10.
The consistency of thermal monitoring and understanding of the applicability of the
evaluation outcomes is as essential as the evaluation process. For thermal monitoring consistency,
the thermal imaging requirements for the large-scale lining structure must be optimised. There are
three aspects of the lining imaging – what to image, how to image and at what frequency. Figure
3-17 and Figure 3-18 recognised three major areas for thermal monitoring, namely crown,
shoulders and springline levels, and answers the question of what to image. Since the measured
temperature is an averaged value of the certain surface area (such as the average temperature of
38.8°C 19 in Figure 3-21), it is essential that same area is captured each time. Therefore, the camera
must be located at same position (at least same distance) each time.
Since the normalised kinetics (a hydration modelling parameter discussed in Section 4.6.2)
is highly sensitive to a temperature up to the dormancy phase, the lining should be more frequently
imaged during the very early age. The following thermal imaging frequency is suggested for the
tunnel sprayed concrete works:
a. every 5 minutes up to the age of 1 hr;
b. every 15 minutes between ages of 1 hr and 3 hrs;
c. every 30 minutes between the age of 3 hrs and 6 hrs;
d. every 1 hr between ages of 6 hrs and 12 hrs;
e. every 3 hrs between the age of 12 hrs and 24 hrs; and
f. every 6 hrs thereafter.
Also, a thermal imaging camera capable of simultaneous thermal and digital imaging is
suggested for best record keeping of the thermal monitoring data, especially when multiple
sections are monitored at once.
The applicability of evaluation outcomes is about the necessity of updating the evaluation
results for the projects that can span over a number of years. Since the thermo-chemical and
thermo-mechanical evaluation outcomes are mix specific, any change in the mix design would
require re-evaluation, especially for the activation energy. The activation energy can also change if
there is a cement clinker content variation, which is more likely to occur for the construction works
19
The average temperature corresponds to the rectangular area (with white outline) in the thermal image.

146
spanning more than few months. Thus, it is suggested to keep evaluating and updating the
activation energy values. Since the activation determination was made for peak heat flow values
(Section 4.5.2), the calorimetric testing durations of less than one day are required.
5.4 Summary
The thermo-mechanical evaluation of the Whitechapel station tunnelling works involved
thermal monitoring and strength testing of 40 test panels. The 40 test panels were sprayed in an
eight-staged programme, spread over a period of five months. Each stage involved spraying a set
of five panels at once. Each set of panels were exposed to different ambient conditions and
exhibited different curing temperature histories.
The curing temperature histories were established using the thermal monitoring data and
were used for the maturity modelling. The maturity modelling involved the use of the Arrhenius
equation based maturity function. The maturity function input parameter values were established
through the thermo-chemical evaluation of the sprayed concrete mixes and had been presented in
Chapter 4.
The strength testing involved the use of three different testing methods, namely needle
penetration, standard stud-driving and special stud-driving. The strength testing outcomes were
correlated with the respective maturity values to establish strength – maturity relationship.
The thermo-mechanical evaluation of the Whitechapel station sprayed concrete works
demonstrated that the sprayed concrete held a multi-segmented strength – maturity relationship
instead of a singular linear strength – maturity relationship. The thermo-mechanical evaluation also
helped to establish a thermal monitoring schedule for a consistent thermal monitoring of sprayed
concrete works.
The applicability of thermo-mechanical relationship on the sprayed concrete lining structure
was also demonstrated using real-time thermal monitoring data of seven sprayed concrete lining
sections.

147
Figure 5-1 Panel Set 1 – Strength and temperature histories (Zones Z1 and Z2 represent the
strength estimates obtained through the penetrometer and the standard stud-driving methods,
respectively)
Figure 5-2 Panel Set 1 – modelled rate of hydration and degree of hydration development

148
Figure 5-3 Panel Set 2 – Strength and temperature histories (Zones Z1 and Z2 represent the
strength estimates obtained through the penetrometer and the standard stud-driving methods,
respectively)
Figure 5-4 Panel Set 2 – modelled rate of hydration and degree of hydration development

149
Figure 5-5 Panel Set 3 – Strength and temperature histories (Zones Z1 and Z2 represent the
strength estimates obtained through the penetrometer and the standard stud-driving methods,
respectively)
Figure 5-6 Panel Set 3 – modelled rate of hydration and degree of hydration development

150
Figure 5-7 Panel Set 4 – Strength and temperature histories (Zone Z2 represents the strength
estimates obtained through the standard stud-driving method)
Figure 5-8 Panel Set 4 – modelled rate of hydration and degree of hydration development

151
Figure 5-9 Panel Set 5 – Strength and temperature histories (Zones Z1 and Z2 represent the
strength estimates obtained through the penetrometer and the standard stud-driving methods,
respectively)
Figure 5-10 Panel Set 5 – modelled rate of hydration and degree of hydration development

152
Figure 5-11 Panel Set 6 – Strength and temperature histories (Zones Z1 and Z2 represent the
strength estimates obtained through the penetrometer and the standard stud-driving methods,
respectively)
Figure 5-12 Panel Set 6 – modelled rate of hydration and degree of hydration development

153
Figure 5-13 Panel Set 7 – Strength and temperature histories (Zones Z2 and Z3 represent the
strength estimates obtained through the standard and special stud-driving methods,
respectively)
Figure 5-14 Panel Set 7 – modelled rate of hydration and degree of hydration development

154
Figure 5-15 Panel Set 8 – Strength and temperature histories (Zones Z1, Z2, and Z3 represent
the strength estimates obtained through the penetrometer, the standard stud-driving, and the
special stud-driving methods, respectively)
Figure 5-16 Panel Set 8 – modelled rate of hydration and degree of hydration development
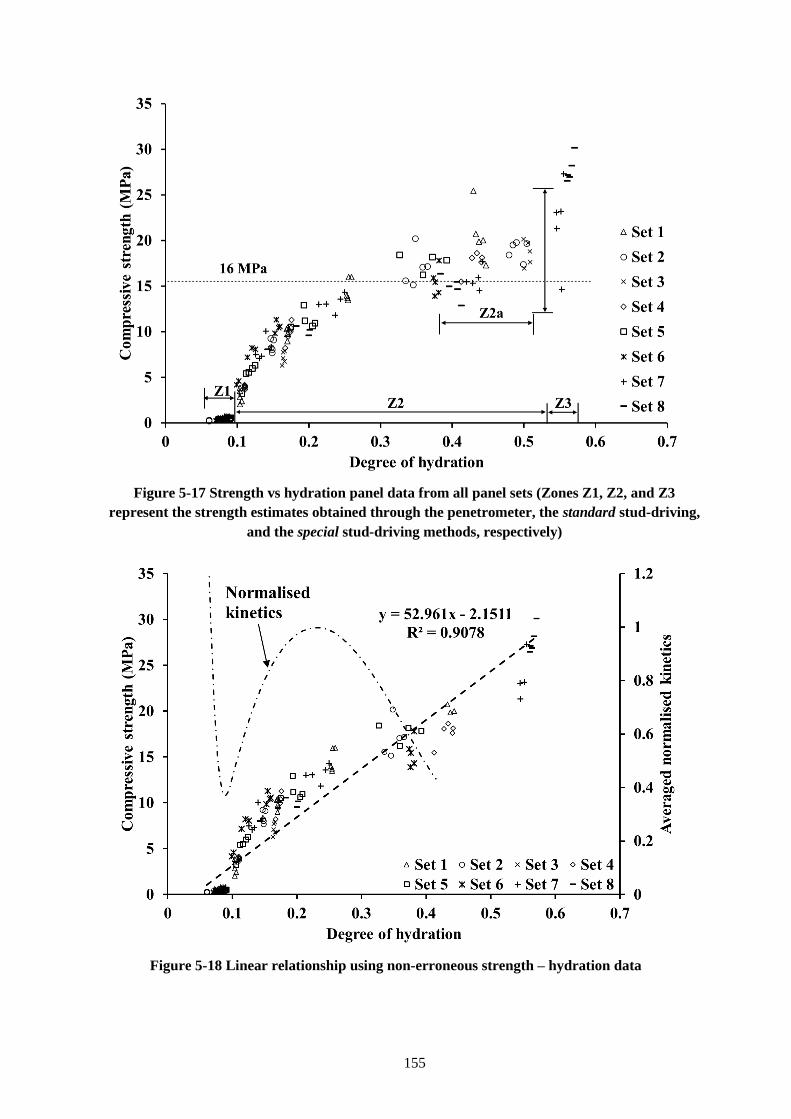
155
Figure 5-17 Strength vs hydration panel data from all panel sets (Zones Z1, Z2, and Z3
represent the strength estimates obtained through the penetrometer, the standard stud-driving,
and the special stud-driving methods, respectively)
Figure 5-18 Linear relationship using non-erroneous strength – hydration data

156
Figure 5-19 Linear relationship using excluding penetrometer data
Figure 5-20 Linear relationship for accelerated set phase using penetrometer strength data

157
Figure 5-21 Linear relationship for rapid hardening phase using stud-driving strength data
Figure 5-22 Linear relationship for standard strength development phase

158
Figure 5-23 Elliptical transition T1 between R1 and R2
Figure 5-24 Elliptical transition T2 between R2 and R3

159
Figure 5-25 Multi-segmented strength – hydration relationship for Mix P1
Figure 5-26 Real-time strength development modelling for Panel Set 1

160
Figure 5-27 Sprayed concrete lining (SCL) strength development monitoring approach
Figure 5-28 Strength development modelling for sprayed concrete lining (Panel Set 5)

161
6 Thermo-chemo-mechanical evaluation of Bond
Street Station Upgrade sprayed concrete
A second case-study was undertaken for the Bond St station upgrade works. The second
case-study performed the thermo-chemo-mechanical evaluation of the secondary lining sprayed
concrete mix by using the lessons learnt from first case-study, such as temperature sensitivity of
the normalised kinetics and the sprayed concrete’s thermal monitoring frequency. The evaluation
procedures, thermo-chemical and thermo-mechanical evaluations, were the same as for the
Whitechapel case-study.
The thermo-chemical evaluation of the Bond St sprayed concrete mix involved parametric
study of eight cement pastes (as described in Section 3.7.2) through isothermal calorimetry and
thermogravimetry. Four of the eight pastes included admixtures and are referred to as the ‘mix’
pastes. The other four pastes are referred to as the ‘plain’ pastes. The four plain pastes were
labelled as BS1P, BS2P, BS3P, and BS4P. The four mix pastes were labelled as BS1M, BS2M,
BS3M, and BS4M. The BS4M paste corresponds to the sprayed concrete mix.
The thermo-mechanical evaluation was conducted on twelve panels (three sets of four panels
each) through the sprayed concrete strength testing and thermal imaging. The panel testing is
referred to as the calibration testing. Post-calibration thermo-mechanical testing results were
available, and are analysed separately.
The chapter also compares the results with the Whitechapel station outcomes, and
summarises how Bond St mix outcomes validate the Whitechapel station outcomes.
6.1 Isothermal calorimetry
The above-described eight cement pastes were calorimetrically tested at four different
isothermal curing temperatures, namely 10, 20, 30 and 40°C. First the calorimetric outcomes of the
plain pastes (i.e., BS1P, BS2P, BS3P and BS4P) are presented and then, the results of the mix
pastes (i.e., BS1M, BS2M, BS3M and BS4M) are presented.
6.1.1 Plain pastes
Figure 6-1 shows the rate of heat release of the plain pastes measured during the isothermal
calorimetric testing made at the temperature of 20°C. While the 20°C testing durations varied
between 7 and 10 days, for clarity the data pertaining to the first 80 hrs is shown. The dormancy

162
troughs of the 20°C plain pastes occurred around the age of 1.5 hrs (since mixing), and had a
minimum dormancy heat flow of around 0.7 mW/g of cement. The addition of the microsilica and
calcium carbonate fines increased the heat release rate, with the calcium carbonate fines having
more influence than the microsilica. The same behaviour was observed for all curing temperatures
(see Table 6-1). Since the noted peak rates occurred after the sulphate depletion points, the rates
correspond to the secondary peak and thus, are representative of the C3A dissolution dominant
phase.
Figure 6-2 shows the heat of hydration curves obtained by integrating the rate of heat release
curves shown in Figure 6-1. The 10, 30, and 40°C plain paste data were processed in the same
fashion, and the outcomes are provided in Appendix B1.
6.1.2 Mix pastes
Figure 6-3 shows the rate of heat release measured during isothermal calorimetric testing of
the mix pastes at 20°C. While the 20°C testing durations varied between 9 and 10 days, the data
pertaining to only the first 80 hrs is shown. The 20°C mix pastes reached dormancy troughs later
than the plain pastes with a delay of 1 hr (when measured since the time of accelerator mixing).
The delay was caused by the post-accelerator addition influence of the retarder and
superplasticiser. Similar to the plain pastes, the addition of microsilica and calcium carbonate fines
increased the heat release rates of the mix pastes. Unlike the plain pastes, the microsilica
influenced the heat release rates as much as the calcium carbonates fines. The same behaviour was
reflected in the other isothermal test temperatures (see Table 6-2). Since the primary and secondary
peak interactions of the mix pastes are not distinguishable, it is hard to comment whether the
primary and secondary peaks overlap or the secondary peak is simply absent.
Figure 6-4 shows the heat of hydration curves obtained for the mix pastes by integrating the
rate of heat release curves shown in Figure 6-3. Similar data for the 10, 30, and 40°C mix pastes
are provided in Appendix B1.
6.2 Thermogravimetric testing
The thermogravimetric testing of the cement paste involved measuring the weight loss of the
sample by igniting it from room temperature to 1000°C, as described in Section 4.3.1. The weight
loss data, when corrected for the dry solid content, provided the non-evaporable water content of
the hydrated cement sample. The non-evaporable water content was compared with the non-
evaporable content at complete hydration of the cement paste to estimate the degree of hydration.
The dry solid content correction requires establishing the baseline profile by proportioning the
weight loss data of individual ingredients.

163
6.2.1 Intial solid content baseline
With eight different cement pastes under study, eight different baseline weight loss profiles
were established. All the ingredients were ignited one by one to determine their respective weight
loss profiles (shown in Figure 6-5 and Figure 6-6). The weight loss values for the ingredients at
key temperatures are listed in Table 6-3. The weight profiles of the six ingredients were added in
the proportions20 of the cement paste ingredients to establish the baseline profiles. The dry solid
corrections for the plain pastes were between 3.0% and 5.6%, with the detailed baseline profile
shown in Figure 6-7. The dry solid corrections for the mix pastes were between 3.7% and 6.3%,
with detailed baseline profiles shown in Figure 6-8. While the corrections for the plain pastes were
used as it is, the complicated accelerator consumption in the hydrating cement paste made the
correction complex. To achieve uniformity in the results, the correction from the plain pastes
(BS1P, BS2P, BS3P and BS4P) were used for the respective mix pastes (BS1M, BS2M, BS3M and
BS4M).
With the overall testing methodology described in Section 3.3.2 and its application
demonstrated in Section 4.3, only the outcomes for the 20°C pastes are presented here.
6.2.2 Thermogravimetric degree of hydration
Each paste was tested at four or more ages at the four different curing temperatures. Figure
6-9 and Figure 6-10 show the weight loss profiles (on ignited mass basis) of the 20°C plain and
mix pastes, respectively. The weight loss profiles at other temperatures are provided in Appendix
B2.
Using the procedure explained in Section 4.3.2, the following general formulation was
applied to convert a weight loss profile to the thermogravimetric degree of hydration value:
140 C baseline
Thermogravimetric0.204
w w
c
6-1
where Thermogravimetric is the thermogravimetric degree of hydration, 140 Cw is the weight loss
value at 140°C, baselinew is the baseline correction described in Section 6.2 (also shown in Figure
6-7), and c is the initial cement content [listed under initial mass (cement content) in Table 6-3].
The paste specific formulations are shown in Figure 6-9 and Figure 6-10. For example,
Thermogravimetric for the 20°C BS1P paste [Figure 6-9(a)] was determined as 0.05, 0.16, 0.52, and 0.62
at the ages of 2.5 hrs, 8.1 hrs, 48 hrs, and 168 hrs, respectively. The thermogravimetric degree of
hydration estimates at all temperatures are tabulated in Appendix B3. The calorimetric heat of
20
The weight of each component at 140°C was considered as the dry solid content and used to proportion
the weight loss profiles.

164
hydration values corresponding to the thermogravimetric testing ages are tabulated in Appendix
B4.
6.3 Calorimetric - thermogravimetric evaluation
The thermo-chemical evaluation involved correlating calorimetric and thermogravimetric
data of the cement pastes to establish their normalised kinetics. The evaluation involved the
following four steps: a) estimating the thermogravimetric degree of hydration; b) determining the
final heat of hydration; c) establishing the calorimetric degree of hydration curves; and d)
developing the normalised kinetics curves. Since eight pastes (four plain and four mix) have been
tested, eight sets of results are presented.
6.3.1 Final heat of hydration
Figure 6-11 and Figure 6-12 show the final heat of hydration values determined for the plain
and mix pastes, respectively, and used the calorimetric and thermogravimetric testing data from all
curing temperatures. For the plain pastes, the increase in the final heat of hydration from 500 J/g of
the cement21, for the BS1P paste [Figure 6-11(a)], to around 550 J/g of the cement for the other
three plain pastes is attributed to the increased binder content, leading to more reactions. A similar
pattern was observed for the mix pastes (Figure 6-12), where the BS1M paste [Figure 6-12(a)] has
the lowest final heat of hydration of 570 J/g of cement. The higher final heat of hydration values of
the mix pastes, in comparison to the plain pastes, is attributed to the increase in ettringite content
due to the alkali-free accelerator (Myrdal, 2007a).
Evaluating the final heat of hydration estimates on the binder mass basis (Figure 6-13), three
of four plain (BS1P, BS2P and BS3P) and the mix (BS1M, BS2M, and BS3M) pastes have similar
final heat of hydration estimates. Thus, the low dosages of the microsilica and calcium carbonate
fines contributed a similar amount of hydration heat as CEM I 52.5 N. In the case of the BS4P and
BS4M pastes, the higher dosage of the supplementary cementitious material (approximately 14%)
decreased the final heat of hydration value. Thus, only a limited quantity of the supplementary
cementitious materials participated in hydration reactions, at least in the early age hydration
process.
Comparison of Whitechapel Station and Bond St outcomes
Since the Whitechapel Station sprayed concrete mix did include calcium carbonate fines,
only the BS1P, BS1M, BS3P, and BS3M pastes were relevant in this context. Figure 6-14 draws a
comparison of the final heat of hydration values (on binder mass basis) of the two case studies.
21
Since the clinker content information was not available for this cement, the final heat of hydration
estimates could not be compared with any literature.

165
The final heat of hydration estimates for the plain pastes were not very different at
Whitechapel and Bond St. The minor differences are attributed to variables such as clinker
proportions. The mix pastes have very different outcomes. The Whitechapel mix pastes had a
lower final heat of hydration than the corresponding plain pastes, whereas the contrary was
observed for the Bond St mix pastes. At this stage, the variation is being attributed to the dosages
and formulations of the different admixtures, especially the accelerator.
6.3.2 Calorimetric degree of hydration
The calorimetric degree of hydration curves were obtained by dividing the isothermal
calorimetric curves by their respective final heat of hydration values. For example, the 20°C BS1P
curve (solid line in Figure 6-2) would be divided by 500 J/g [the final heat of hydration value
established in Figure 6-11(a)]. Before establishing the degree of hydration curves, each
calorimetric curve required an external mixing offset correction. The corrections were determined
using the procedure discussed in Section 4.4.1 and are listed in Table 6-4 and Table 6-5 for the
plain and mix pastes, respectively. The corrections were validated by plotting the
thermogravimetric degree of hydration (obtained from Section 6.2.2 calculations) in conjunction
with the calorimetric degree of hydration curves. Figure 6-15 and Figure 6-16 show the
calorimetric degree of hydration curves for the 20°C plain and mix pastes, respectively. The dashed
lines represent the normalised rate of heat release and were obtained by dividing the 20°C rate of
heat release curves shown in Figure 6-1 and Figure 6-3 by their respective peak values listed in
Table 6-2. The data pertaining to other testing temperatures are provided in Appendix B5.
6.3.3 Normalised kinetics
Figure 6-17 shows the normalised kinetics of the 20°C plain pastes and was prepared using
the data shown in Figure 6-15. For ease of comparison, the dormancy troughs of all the normalised
curves were arbitrarily assigned a degree of hydration value of 0.05. Each normalised curve has
near-identical behaviour in terms of the position, shape, and size of the primary, secondary, and
tertiary peaks caused by C3S, C3A and C4AF hydration. The only variable is the broadness of the
curve and is prominently different for the BS1P paste. The broadness of the curve corresponding to
the BS1P paste can be easily understood when seen in conjunction with the final heat of hydration
value of 500 J/g for the BS1P paste [Figure 6-11(a)]. If the final heat of hydration (Qfinal) of 550 J/g
[similar to Figure 6-11(d)] was used instead of the paste specific Qfinal, all of them had near-
identical characteristics (shown in Figure 6-17 inset). Thus, all four binders had a standard
normalised kinetics curve but were scaled differently on the degree of hydration axis, with an
inverse relationship to the final heat of hydration. In conclusion, the supplementary cementitious
materials did change the cement reactivity but did not modify the hydration path.
The normalised kinetics curves of the mix pastes isothermally cured at 20°C are presented in
Figure 6-18. For ease of representation, the 1 hr degree of hydration was assigned a reference value

166
of 0.1. Similar to the plain pastes, the broadness of the mix pastes’ normalised kinetics curves were
also inversely related to the final heat of hydration (shown in Figure 6-18 inset). Unlike the plain
pastes, the primary and secondary peak formations of the mix pastes are notably different from the
plain pastes, showing no clear distinction between the start and end of the primary and secondary
peaks. Furthermore, the shapes of the mix pastes’ peaks also vary amongst themselves. The
variation can be attributed to the complex interaction of the admixtures in the presence of the
supplementary cementitious materials, and are prominently different for the BS1M and BS4M
pastes.
Normalised kinetics at different temperatures
Figure 6-19 to Figure 6-22 show the normalised kinetics of the four plain pastes at the four
curing temperatures. Similar to the Whitechapel station plain pastes, the normalised curve is seen
as independent of temperature (such as shown in Figure 6-19 inset). Thus, normalised kinetics
curve from any curing temperature can be used for the hydration modelling of the paste specific
concrete mix.
Figure 6-23 to Figure 6-26 show the normalised kinetics of the four mix pastes at the four
curing temperatures. In all cases, the normalised kinetics curves have different formulation at
different temperatures (prominently for the 10°C and 40°C curves). Similar to the 20°C normalised
kinetics (shown in Figure 6-18), the normalised kinetics is also binder specific. Hence, the
normalised kinetics of the mix pastes is sensitive to both the temperature and binder type. It is also
concluded that the supplementary cementitious materials influence the cement hydration path in
the presence of the admixtures.
Key characteristics of the normalised kinetics curves are listed in Appendix B6.
Comparison of Whitechapel Station and Bond St outcomes
Figure 6-27 presents the 20°C normalised kinetics of the two CEM I 52.5 N samples. For the
ease of comparison, the dormancy troughs were arbitrarily assigned a value of 0.05. With the
difference in the primary and secondary peak interactions of the two samples, it is concluded that
the clinker contents vary for the two samples. The variation becomes more visible when the WC1
normalised kinetics is rescaled with the BS1P final heat of hydration (Qfinal,BS1P = 500 J/g) from
Qfinal,WC1 = 500 J/g (shown in Figure 6-27 inset).
Figure 6-28 draws a comparison between the normalised kinetics of the WC4 and BS3M
pastes (both contain cement and microsilica) as obtained from the 20°C pastes. Both curves have
different characteristics (such as the location of the dormancy trough and broadness). A
reformulation of the WC4 normalised curve (rescaling with the BS3M final heat of hydration and
relocating the dormancy trough to match BS3M dormancy trough) did not indicate any specific
relation between the two cement pastes. Since the admixtures, as well as their proportions, were
different in the two pastes, a different normalised kinetics was expected.

167
6.4 Hydration modelling parameters – Activation energy and Affinity
constant
6.4.1 Activation energy and affinity constant
The activation energy and affinity constant were determined using the peak heat release
rates22 provided in Table 6-1 and Table 6-2 for the plain and mix pastes, respectively and are
summarised in Figure 6-29.
The activation energy values of the plain pastes were of similar magnitude at approximately
46 kJ/mol (listed in Table 6-6). Thus, microsilica and calcium carbonate fines had a negligible
impact on the activation energy values. Similar behaviour was observed for the Whitechapel plain
pastes and has been discussed in Section 4.5.3.
In the case of the mix pastes, the BS1M paste showed the highest value of the activation
energy of 45.0 kJ/mol while the other three were in the range of 41 – 42 kJ/mol. The outlying
behaviour of the BS1M paste was also observed in terms of the heat release rates, as shown in
Figure 6-3. The magnitude of the activation energy variation is in contrast to the one seen in the
Whitechapel Station mix pastes (labelled as the WC3 and WC4 pastes, containing cement and
cement with microsilica, respectively). The WC3 (35.6 kJ/mol) and WC4 (38.4 kJ/mol) pastes
showed a greater decrease in the activation energy from the respective plain pastes [i.e., the WC1
(46.5 kJ/mol) and WC2 (45.4 kJ/mol) pastes, respectively]. The higher activation energy values for
the Bond St mix pastes could be explained through the normalised kinetics of the mix pastes. The
specific comparison would corroborate the BS1M paste (Figure 6-23) with the WC3 paste (Figure
4-36) and the BS3M paste (Figure 6-25) with the WC4 paste (Figure 4-40) along with the
comparative drawn in Figure 6-28. Since the peak heat release rates of the BS1M and BS3M pastes
do not coincide, the measured activation energy values may not be true representative of the mix
pastes throughout their hydration. Thus, a further investigation was made to adjudge the variability
of the activation energy as a function of the degree of hydration.
6.4.2 Activation energy variability
A variable activation energy profile was developed using the instantaneous heat release rates
of the four isothermal curing temperatures. Figure 6-30 presents the simplest case of the BS1P and
WC1 pastes. The C3A (secondary peak) and C4AF (tertiary peak) dissolution phases were
recognised by using the respective normalised kinetics curves of the BS1P and WC1 pastes (Figure
6-27 inset). The post-C4AF dissolution lowering of the activation energy profile is seen as an
indicator of diffusion dependent hydration (Kjellsen and Detwiler, 1992). The pre and post-C3A
22
The peak heat release rates were used with the assumption that the peak rate of heat release for a given
cement paste hydrating at any isothermal curing temperature occurs at the same degree of hydration and
thus, can be used as a reference for the activation energy determination Wadsö (2003).

168
dissolution phases are C3S hydration dominant phases. The activation energy variability in C3S
dominant phases could be seen as the temperature sensitivity of the normalised kinetics, requiring a
judgement on whether or not to account for the temperature sensitivity of the normalised kinetics.
For the BS1P paste, pre-C3A dissolution ( < 0.11) hydration modelling must account for the
temperature sensitivity of the normalised kinetics. Since the BS1P activation energy in Segment 2
is nearly constant, any normalised curve could be used as a reference for the hydration modelling.
The post-C4AF dissolution hydration modelling is not recommended. Thus, the BS1P variable
activation energy is summarised for Segments 1B, 2, and 3 (0.11 < <0.58) as 45.5±0.6 kJ/mol.
Segment 2 of the WC1 variable activation energy profile, though not well understood, was seen as
the progression towards diffusion-based hydration.
A similar evaluation of the BS2P, BS3P, and BS4P pastes provided mean values similar to
the ones estimated with the peak rate of heat release and had the standard deviations of around 1
kJ/mol. The evaluation outcomes are summarised in Figure 6-31.
In the case of the mix pastes, a comparison was drawn for the BS4P and WC4 pastes
(corresponding to the sprayed concrete mixes) and is shown Figure 6-32. The activation energy
profiles are in great contrast to each other. With the complicated nature of the temperature and
binder sensitive normalised kinetics of the two pastes, no conclusion could be drawn on the
activation energy variability. Thus, the mix pastes would always require temperature sensitive
normalised kinetics input during the hydration modelling of the sprayed concrete. Similar
activation energy profiles were observed for the BS2M, BS3M, and BS4M pastes. Though the mix
pastes’ activation energy profiles had a standard deviation of up to 4 kJ/mol, the mean values were
close to the respective values determined using the peak rate of heat release (listed in Table 6-7).
6.4.3 Sprayed concrete hydration modelling
The thermo-chemical outcomes of the BS4P pastes were used to model the degree of
hydration development of the sprayed concrete. The modelling procedure was the same as for the
previous case study (Section 4.6.3) and required the use of the temperature sensitive normalised
kinetics input during the hydration modelling.
6.5 Thermo-mechanical evaluation of sprayed concrete
The thermo-mechanical evaluation involved thermal monitoring and mechanical strength
testing of the sprayed concrete to establish the strength – hydration relationship. The testing
conducted for the thermo-mechanical evaluation is referred to as the calibration testing and the
strength – hydration relationship so obtained is referred to as the calibration relationship.
The thermal monitoring was performed with a FLIR E60bx camera using the guidelines
described in Section 5.3. Based on the Whitechapel testing experiences, in conjunction with the

169
Bond St project specification, the following testing programme (with a flexible schedule) was
adopted:
a) Penetrometer needle (British Standards Institution, 2006a) – typically between the ages of 5
mins and 1.5 hrs;
b) standard stud-driving and pull-out testing (British Standards Institution, 2006a; Hilti
Corporation, 2009) – typically between the ages of 3 and 12 hrs;
c) special stud-driving and pull-out testing (Hilti Corporation, 2009) – typically between the
ages of 12 and 24 hrs; and
d) uniaxial compressive strength testing of 100 x 100 mm in-situ cores (British Standards
Institution, 2009) – typically from the age of 12 hrs onwards.
Since the stud-driving methods provide strength equivalent to a 200 mm cube (Hilti
Corporation, 2009), the in-situ core strengths were converted to the in-situ cube strengths.
6.5.1 Panel testing
The strength testing was made on three sets of four test panels each. The testing was
conducted over a period of three consecutive days in winter with one set sprayed each day. All the
panel sets were sprayed in the tunnel but away from the active construction zone and thus, were
exposed to consistent ambient conditions with intermittent exhaust ventilation.
Figure 6-33 shows the strength development and the temperature histories (lines without
markers plotted) of Panel Set 1. The segments S1, S2, S3, and S4, indicate the strengths obtained
using the penetrometer, standard stud-driving, special stud-driving and core testing methods,
respectively. The temperature histories were used to model the rate of hydration and the degree of
hydration development histories utilising the modelling procedure applied in Section 5.1. Figure
6-34 shows the modelled degree of hydration development (primary Y-axis) and the modelled rate
of hydration evolution histories (secondary Y-axis) for Panel Set 1. The strength, temperature, and
degree of hydration data are provided in Appendices B7, B8, and B9, respectively.
Figure 6-35 shows the strength and temperature histories of Panel Set 2, with segments S1,
S2, S3, and S4 marked on it to represent the different testing methods. Figure 6-36 shows the
modelled degree of hydration and rate of hydration evolution histories for Panel Set 2.
Figure 6-37 shows the strength development and the temperature histories of the four panels
corresponding to Panel Set 3. Figure 6-38 shows the modelled degree of hydration and rate of
hydration evolution histories of Panel Set 3.
6.5.2 Establishing strength – hydration relationship
The strength and degree of hydration data from all panel sets were plotted together as shown
in Figure 6-39, to establish the strength – hydration relationship. The strength data under segments
S1, S2, S3, and S4 correspond to the penetrometer, standard stud-driving, special stud-driving and

170
in-situ coring strengths. The special stud-driving strengths at the right end of S3 were scrutinised
w.r.t. the available in-situ core strengths and the following data were excluded by giving
precedence to core strengths.
Panel Set 1 (◊ markers): The three data points around the degree of hydration of 0.53 (25 hr
strengths in Figure 6-33) were categorised as outliers (underestimates) when compared to the
relevant core strength values (above 30 MPa) around the similar degree of hydration values.
Panel Set 3 (× markers): When seen in conjunction with Figure 6-37, Panel 3C exhibits a
minimal increase in strength between the ages of 12 hrs and 25 hrs. Comparing the 25 hrs strength
of 28 MPa with the 30 hrs core strength of 42 MPa, the 25 hrs stud-driving strength was neglected.
The potential reasons for above outliers could be the heterogeneity of the sprayed concrete,
improper testing, or the limitation of the special method’s calibration relationship.
Similar to Section 5.2.2, the strength data (segment S1 in Figure 6-39) behind the dormancy
trough of the normalised kinetics were analysed separately, providing the linear relationship R1
(Figure 6-40) as follows:
2
c 9.0 ( 0.078 with 0) .68 Rf 6-2
where fc and represent the compressive strength (in MPa) and the degree of hydration,
respectively. The degree of hydration of 0.08 (as an equivalent of 10 mins age for Set 3 panels) can
be thought of as the point of the accelerator-induced sprayed concrete final set. The post-dormancy
trough data (segments S2, S3 and S4) provided the linear R2 (Figure 6-41) as follows:
2
c 75.8 ( 0.132 with 0) .98 Rf 6-3
The R2 relationship would be applicable for strength modelling from the degree of hydration
offset of 0.14 (intersection of R1 and R2). Thus, R2 could be seen as a strength development phase
which is free from the admixture influence and may be treated as a ‘plain concrete initial set’
equivalent.
6.5.3 Relationship application
Similar to Section 5.2.4, an elliptical transition curve was introduced between the two linear
relationships (shown as T1 in Figure 6-42) and was modelled as a transformed ellipse with the
following formulation:
2 2
2 2
( )cos( ) ( )sin( ) ( )sin( ) ( )cos( )1
x h y k x h y k
a b
6-4
where the x-axis represents the degree of hydration (in percentage, 100*), the y-axis
represents strength (fc, MPa), (h,k = 10.9, 1.3) is the centre of the ellipse; θ = 46.8° is the angle of
rotation of the major axis w.r.t. the horizontal axis; a = 2.0 is the major radius; b = 0.80 is the

171
minor radius, and was applied for 0.126 < < 0.146. The collective version of the multi-segmented
strength – hydration relationship (R1–T1–R2) is shown in Figure 6-43.
Figure 6-44 shows the in-situ compressive strength for Set 1 (markers) overlaid by the
modelled strength curves, developed using the R1-T1-R2 relationship. The relationship can
provide useful estimates for the strength development as early as 15 minutes after the spray (Figure
6-44 inset) and can be seen as ‘sprayed concrete final set’. Similarly, Figure 6-45 and Figure 6-46
show a comparison of modelled and measured strengths of Panel Sets 2 and 3, respectively. Hence,
the established modelling parameters and strength – hydration relationship are well suited.
However, it must be remembered that the strength – maturity relationship is relevant to the strength
development of sprayed concrete as a material and not the structural integrity of the structure
which may be affected by workmanship defects, such as trapped rebound, poor compaction, and
lamination.
6.5.4 Whitechapel station and Bond Street station relationship comparative
The thermo-mechanical evaluation undertaken for the Whitechapel Station sprayed concrete
had provided a trilinear strength – hydration relationship (Figure 5-25), as against the bilinear
relationship for the Bond St sprayed concrete (Figure 6-43). For a meaningful discussion, the
Whitechapel relationship was reformulated in conjunction with the WC4 paste normalised kinetics.
First, the WC4 normalised kinetics curve was rescaled using the BS4M paste’s final heat of
hydration (580 J/g of cement) and repositioned using the BS4P paste’s dormancy trough as a
reference (Figure 6-47). A similar reformulation was performed for the Whitechapel station
strength – hydration relationship and is shown as W1–W2–W3 in Figure 6-48. B1–B2 represents
the Bond St relationship.
B1 and W1 span between ‘sprayed concrete final set’ and the ‘plain concrete initial set’
phases. The late start of W1 could be related to the lower accelerator dosage of the Whitechapel
station mix. The lower strength development during B1 and W1 would be an outcome of the
formation of weaker hydration products (such as ettringite and aluminate hydrates).
In contrast to B2, the Whitechapel station sprayed concrete had two phases of strength
development [W2–W3] in the post-dormancy region, where W2 and W3 were recognised as the
accelerator’s rapid hardening effect and the plain concrete behaviour, respectively. One way of
understanding would be the different activation energy in W2 and W3 phases. For example, a
lowered activation energy during W2 would lead to faster hydration and consequently, a flatter
slope of W2. Similarly, a higher activation energy for W3 would model slower hydration
development and therefore, steeper slope for W3. Choosing convenient activation energy values
for each segment would have surely brought W2–W3 into a single linear relationship. Furthermore,
using higher activation energy values for B1 and W1 can conveniently change the slopes to follow
respective relationships. Now the question is that did the accelerator increase the activation energy

172
in W1, and then decrease it in W2? Although there can be many possible scenarios such as the
retarder and superplasticiser inhibiting the accelerator performance during W1, all of them would
require more investigation. Moreover, the activation energy variability has been accounted for
through temperature sensitive normalised kinetics. The other explanation could be that different
hydrates contribute to strength in different proportions (Bogue and Lerch, 1934) in various
segments (such as aluminates only in W1 and C3S only in W2) and is seen as a more rational
explanation.
A noteworthy aspect of B2 and W2–W3 variation is the qualitative difference between the
two strength data sets. Firstly, the Whitechapel testing programme was spread over a period of five
months while the Bond St station programme was spread over a period of three consecutive days.
With the spread out testing durations at the Whitechapel site, variables such as the change in
cement clinker content would have affected the modelling parameters. Secondly, the Whitechapel
test panels were exposed to varying ambient conditions due to nearby construction activities while
the panels at Bond St station were located in consistent ambient conditions with no interference
from other construction activities. Thus, the conditions such as varying humidity could have
influenced the normalised kinetics of the cement hydration reactions. Thirdly, the test panels at
both sites were of different sizes and thus, had different sprayed concrete volumes. Next, the
Whitechapel test panels were sprayed by six different sprayers using two different spraying rigs in
comparison to two sprayers using the same spraying robot for the Bond St works. It could have led
to difference in workmanship, such as spraying distance and angle. Finally, the Whitechapel test
panels were sprayed at the end of the lining sprays (i.e. after large volumes of spraying, except for
Set 1) and the Bond St test spraying activity was performed specifically for the test panels. It could
have led to a difference in the spraying rig’s performance, such as pumping rates and accelerator
mixing. Thus, there was a need to make a qualitative comparison.
Some post-calibration testing had been made at the Bond St site alongside the on-going
lining works. The post-calibration testing shared features such as spread out testing programme,
exposure to varying ambient conditions and large volume spraying activities. The outcomes are
discussed in the following section.
6.5.5 Strength – hydration relationship verification
The post-calibration strength testing and thermal monitoring were conducted on five sprayed
concrete lining sections and seven test panels. The lining sections were tested with standard and
special stud-driving methods. The panels were tested with penetrometer, standard method, and
special method.
In general, the temperature histories of the post-calibration testing were comparable to the
calibration testing but the strength histories were different (shown in Figure 6-49 and Figure 6-50
for the post-calibration and calibration data, respectively). The strengths in segments S1, S2 and S3

173
correspond to the penetrometer, standard stud-driving and special stud-driving testing. The early-
age strength classes (J1, J2, and J3) as described in EN 14487-1 (British Standards Institution,
2005a) have been included for ease of comparison. The calibration and post-calibration strengths
were notably different between the ages of 4 hrs and 6 hrs. Since the temperature histories were
similar for both the calibration and the post-calibration testing, the strength modelling provided
conservative estimates up to the 8 hr age and higher estimates in later ages. Figure 6-51 and Figure
6-52, respectively, show in-situ and modelled strength comparatives for one of the seven panels
and one of five sprayed concrete lining sections.
When compared with the two relationships discussed in Section 6.5.4 and shown in Figure
6-48, the post-calibration strength – hydration data was found closer to the reformulated
Whitechapel relationship (Figure 6-53). Thus, sprayed concrete exposed to varying ambient
conditions sprayed as part of a large volume of spraying, and sprayed over the spread out durations
had a trilinear strength – hydration relationship. Whether it is the outcome of a preferential
hydration of early-age strength contributing C3S clinker or there is a need to improve the hydration
modelling procedure in such circumstances, the exact cause of the multi-segmented relationship is
not very clear at the current stage. It would be a subject of future research.
In conclusion, the strength – hydration relationship formulation of the sprayed concrete
cured under the real-time site conditions held similar multi-segmented formulation.
6.6 Summary
The thermo-chemo-mechanical evaluation of the sprayed concrete related to the Bond St
Station Upgrade secondary lining works was made in a two-stage approach. The two stages were
classified as the thermo-chemical and thermo-mechanical evaluation. The thermo-chemical
evaluation provided the Arrhenius equation based cement hydration modelling parameters, namely
the normalised kinetics, activation energy, and affinity constant. These parameters were applied to
the thermo-mechanical data of the sprayed to complete the thermo-chemo-mechanical evaluation.
The thermo-chemical evaluation involved isothermal calorimetry and thermogravimetric
testing of the cement pastes based on the sprayed concrete constituents. The thermo-chemical
evaluation of the Bond St mixdemonstrated that the supplementary cementitious materials
significantly influence the cement hydration mechanism in the presence of the admixtures, and in
turn, validated the Whitechapel station thermo-chemical outcomes. Thus, there is a need to deduce
the mix specific temperature sensitive normalised kinetics and activation energy.
The thermo-mechanical evaluation involved on-site testing of the sprayed concrete itself.
The thermal aspect involved measuring the surface temperatures of the sprayed concrete using the
remote technique of the thermal imaging. The mechanical testing involved using different strength
testing methods to estimate the sprayed concrete compressive strength. The thermal and
mechanical data were correlated by using the outcomes of the thermo-chemical evaluation. The

174
thermo-mechanical evaluation of the Bond St mix validated the Whitechapel station’s thermo-
mechanical outcomes by showing that the strength – hydration relationship will not be a single
linear relationship but may be bilinear or trilinear.
With the two case studies presented in this research work, the applicability of the evaluation
methodology, as well as applicability of thermal imaging as a tool for temperature measurement,
was reasonably validated.

175
Table 6-1 Peak rate of hydration obtained from isothermal calorimetric testing of plain
pastes
Peak rate of heat release for plain pastes
BS1P BS2P BS3P BS4P
Temperature Age
(hrs)
dQ/dt
(mW/g)
Age
(hrs)
dQ/dt
(mW/g)
Age
(hrs)
dQ/dt
(mW/g)
Age
(hrs)
dQ/dt
(mW/g)
10°C 15.83 2.07 15.6 2.11 16.08 2.05 14.9 2.15
20°C 8.93 4.02 8.50 4.21 8.6 4.09 8.33 4.23
30°C 5.22 7.51 5.03 7.83 5.05 7.58 4.85 7.87
40°C 3.67 13.35 3.57 13.83 3.57 13.37 3.43 13.92
Table 6-2 Peak rate of hydration obtained from isothermal calorimetric testing of mix pastes
Peak rate of heat release for mix pastes
BS1M BS2M BS3M BS4M
Temperature Age
(hrs)
dQ/dt
(mW/g)
Age
(hrs)
dQ/dt
(mW/g)
Age
(hrs)
dQ/dt
(mW/g)
Age
(hrs)
dQ/dt
(mW/g)
10°C 23.28 1.83 19.98 2.19 19.27 2.24 18.28 2.23
20°C 9.25 3.73 9.05 4.26 9.05 4.28 9.37 4.43
30°C 5.43 6.83 5.65 7.65 5.08 7.74 5.92 7.94
40°C 4.23 11.39 4.18 11.96 3.73 11.83 3.75 12.10
Table 6-3 Thermogravimetric weight loss profiles of cement paste ingredients at key
temperatures
Sample type
Residue type
Initial mass Dry Calcined
Room temperature 140°C 1000°C
Measured
weight loss
Cement 100.0 99.9 96.9
CaCO3 fines 100.0 100.0 57.1
Microsilica 100.0 99.6 97.6
Retarder 100.0 97.1 54.7
Superplasticiser 100.0 90.3 56.4
Accelerator 100.0 78.4 15.9
Theoretical
cement (binder)
content on
ignited mass
basis
BS1P 103.2 103.1 100.0
BS2P 99.4 (105.7) 99.4 (105.6) 96.4 (100.0)
BS3P 95.5 (103.1) 95.5 (103.0) 92.6 (100.0)
BS4P 92.3 (105.5) 92.3 (105.5) 89.5 (100.0)
BS1M 102.0 101.9 98.8
BS2M 98.5 (104.5) 98.4 (104.4) 95.4 (98.9)
BS3M 94.7 (102.0) 94.6 (101.9) 91.8 (98.9)
BS4M 91.7 (104.3) 91.6 (104.3) 88.9 (99.0)

176
Table 6-4 Correction for the plain pastes
BS1P BS2P BS3P BS4P
Q (J/g) Q (J/g) Q (J/g) Q (J/g)
10°C -16.1 -0.032 -2.5 -0.005 -5.6 -0.010 -13.4 -0.024
20°C -7.5 -0.015 +6.4 +0.012 +7.9 +0.015 -1.5 -0.003
30°C +5.7 +0.011 +20.7 +0.038 +26.2 +0.048 +15.7 +0.029
40°C +12.8 +0.026 +22.9 +0.042 +26.3 +0.048 +24.4 +0.044
Table 6-5 Correction for mix pastes
BS1M BS2M BS3M BS4M
Q (J/g) Q (J/g) Q (J/g) Q (J/g)
10°C -22.1 -0.039 -21.2 -0.035 0.0 0.000 -6.1 -0.011
20°C -4.0 -0.007 -3.5 -0.006 +13.6 +0.022 +9.9 +0.017
30°C +15.6 +0.027 +13.3 +0.022 +28.7 +0.046 +21.3 +0.037
40°C +17.5 +0.031 +13.8 +0.023 +39.4 +0.064 +29.5 +0.051
Table 6-6 Hydration modelling parameters for plain pastes
Qfinal Using peak dQ/dt Using instantaneous dQ/dt
Binder type J/g of
binder
J/g of
cement Ea A Ea,i at i
kJ/mol 1/s kJ/mol
CEM I 499.1 499.1 45.9 1209.9 45.5±0.6 (0.11 < < 0.58)
CEM II/A-LL 511.1 543.8 46.1 1274.4 44.5±1.2 (0.11 < < 0.58)
CEM II/A-D 503.2 543.2 46.0 1188.6 45.4±1.2 (0.11 < < 0.58)
CEM II/A-M 480.6 549.6 45.9 1138.8 45.7±1.0 (0.11 < < 0.58)
Table 6-7 Hydration modelling parameters for mix pastes
Qfinal Using peak dQ/dt Using instantaneous dQ/dt
Binder type J/g of
binder
J/g of
cement Ea A Ea,i at i
kJ/mol 1/s kJ/mol
CEM I 570.5 570.5 45.0 657.0 45.7±2.8 (0.11 < < 0.64)
CEM II/A-LL 561.9 597.8 41.9 205.7 42.5±2.5 (0.12 < < 0.63)
CEM II/A-D 572.0 617.6 41.3 154.5 41.2±3.4 (0.13 < < 0.62)
CEM II/A-M 508.3 581.2 41.8 206.5 42.3±3.8 (0.15 < < 0.62)

177
Figure 6-1 Rate of heat release for plain pastes at 20°C isothermal curing
Figure 6-2 Heat of hydration for plain pastes at 20°C isothermal curing

178
Figure 6-3 Rate of heat release for mix pastes at 20°C isothermal curing
Figure 6-4 Heat of hydration for mix pastes at 20°C isothermal curing

179
Figure 6-5 Thermogravimetric weight loss profile of anhydrous cementitious materials
Figure 6-6 Thermogravimetric weight loss profiles of admixtures

180
Figure 6-7 Theoretical weight loss baseline for plain pastes
Figure 6-8 Theoretical weight loss baseline for mix pastes

181
Figure 6-9 Thermogravimetric weight loss profiles of (a) BS1P paste, (b) BS2P paste, (c) BS3P paste, and (d) BS4P paste

182
Figure 6-10 Thermogravimetric weight loss profiles of (a) BS1M paste, (b) BS2P M pastes, (c) BS3M paste, and (d) BS4M paste

183
Figure 6-11 Final heat of hydration determination for (a) BS1P paste, (b) BS2P paste, (c) BS3P paste, and (d) BS4P paste

184
Figure 6-12 Final heat of hydration determination for (a) BS1M paste, (b) BS2M paste, (c) BS3M paste, and (d) BS4M paste

185
Figure 6-13 Summary of final heat of hydration for Bond St cement pastes
Figure 6-14 Final heat of hydration for Whitechapel and Bond St samples

186
Figure 6-15 Calorimetric degree of hydration curves for (a) BS1P paste, (b) BS2P paste, (c) BS3P paste, and (d) BS4P paste cured at 20°C

187
Figure 6-16 Degree of hydration curves for (a) BS1M paste, (b) BS2M paste, (c) BS3M paste, and (d) BS4M paste cured at 20°C

188
Figure 6-17 Normalised kinetics for plain pastes at 20°C
Figure 6-18 Normalised kinetics for mix pastes at 20°C

189
Figure 6-20 Normalised kinetics for BS2P paste
Figure 6-19 Normalised kinetics for BS1P paste

190
Figure 6-21 Normalised kinetics for BS3P paste
Figure 6-22 Normalised kinetics for BS4P paste
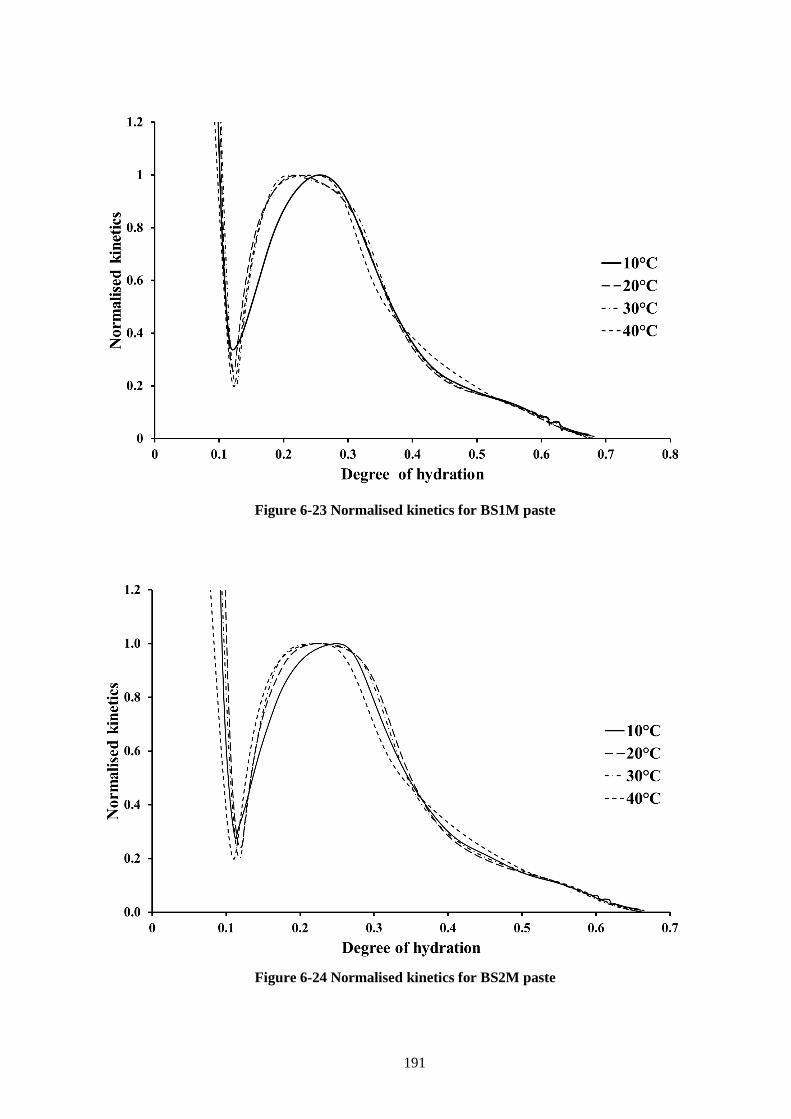
191
Figure 6-23 Normalised kinetics for BS1M paste
Figure 6-24 Normalised kinetics for BS2M paste

192
Figure 6-25 Normalised kinetics for BS3M paste
Figure 6-26 Normalised kinetics for BS4M paste

193
Figure 6-27 20°C normalised kinetics comparative of Whitechapel and Bond St cement samples
Figure 6-28 20°C normalised kinetics comparative of Whitechapel and Bond St admixed samples

194
Figure 6-29 Summary of activation energy determined using peak hydration rate
Figure 6-30 Instantaneous activation energy for Whitechapel and Bond St cement samples

195
Figure 6-31 Summary of varying activation energy profiles
Figure 6-32 Instantaneous activation energy for Whitechapel and Bond St mixes

196
Figure 6-33 Panel Set 1 – Strength and temperature histories (Zones S1, S2, S3, and S4
represent strength estimates obtained using the penetrometer, standard stud-driving, special
stud-driving method, and core testing, respectively)
Figure 6-34 Panel Set 1 – Modelled rate of hydration and degree of hydration development

197
Figure 6-35 Panel Set 2 – Strength and temperature histories (Zones S1, S2, S3, and S4
represent strength estimates obtained using the penetrometer, standard stud-driving, special
stud-driving method, and core testing, respectively)
Figure 6-36 Panel Set 2 – Modelled rate of hydration and degree of hydration development

198
Figure 6-37 Panel Set 3 – Strength and temperature histories (Zones S1, S2, S3, and S4
represent strength estimates obtained using the penetrometer, standard stud-driving, special
stud-driving method, and core testing, respectively)
Figure 6-38 Panel Set 3 – Modelled rate of hydration and degree of hydration development

199
Figure 6-39 Strength – hydration relationship – Preliminary analysis (Zones S1, S2, S3, and S4
represent strength estimates obtained using the penetrometer, standard stud-driving, special
stud-driving method, and core testing, respectively)
Figure 6-40 Strength – hydration relationship (up to dormancy trough)

200
Figure 6-41 Strength – hydration relationship R2 for accepted post dormancy data
Figure 6-42 Strength – hydration relationship – Transition T1 between R1 and R2

201
Figure 6-43 Multi-segmented strength – hydration relationship (R1-T1-R2)
Figure 6-44 Comparison of modelled and measured strength – Panel Set 1

202
Figure 6-45 Comparison of modelled and measured strength – Panel Set 2
Figure 6-46 Comparison of modelled and measured strength – Panel Set 3

203
Figure 6-47 BS4P comparison with reformulated WC4 paste
Figure 6-48 Bond St and Whitechapel strength-hydration relationship comparison

204
Figure 6-49 Post-calibration strength testing of sprayed concrete at Bond St (Zones S1, S2, S3
represent strength estimates obtained using the penetrometer, standard stud-driving, and
special stud-driving method, respectively)
Figure 6-50 Calibration strength testing of sprayed concrete at Bond St (Zones S1, S2, S3
represent strength estimates obtained using the penetrometer, standard stud-driving, and
special stud-driving method, respectively)

205
Figure 6-51 Post-calibration panel strength testing and modelling
Figure 6-52 Post-calibration lining strength testing and modelling

206
Figure 6-53 Data with Bond St and Whitechapel strength-hydration relationship

207
7 Conclusions and further research
The aim of the research was to apply the maturity method for non-destructive strength
assessments of the sprayed concrete lining. It required determining the sprayed concrete mix
specific input parameter values for the Arrhenius equation based maturity function and establishing
the strength – maturity relationship.
An experimental testing methodology was developed to deduce the maturity function input
parameters and establish a strength – maturity relationship. The maturity function input parameters
were determined through isothermal calorimetry and thermogravimetric testing of the sprayed
concrete mix based cement pastes. The strength – maturity relationship was established through
simultaneous on-site strength testing and thermal monitoring of the sprayed concrete.
The experimental methodology was applied to two different field case studies. Each case
study had a different sprayed concrete mix. The key novelty of the research was in the maturity
modelling of sprayed concrete’s admixture influenced cementitious system for non-destructive
strength assessments of the sprayed concrete.
7.1 Conclusions
7.1.1 Thermo-chemical evaluation
The thermo-chemical evaluation involved experimental determination of the maturity
function input parameters (such as the normalised kinetics and the activation energy) of the
sprayed concrete mix based cement paste.
Isothermal Calorimetry proved useful to measure rate of heat release of both the plain and
the admixed cement pastes. The low dosages of supplementary cementitious materials increased
the rates of heat release but did not alter the path of the cement hydration reaction, noted in terms
of clinker specific hydration peaks. On the other hand, the use of the admixtures decreased the rate
of heat release as well as were noted to have changed the path of hydration.
The external mixing process used for the isothermal calorimetry caused a discrepancy in
heat of hydration assessments, and no specific chronological age could be used as an initial offset
reference for the heat of hydration assessments for any given paste cured under the four different
isothermal conditions.

208
An equivalent age pertaining to the dormancy stage of the cement hydration could be
considered as a reference to measure heat of hydration for the plain cement pastes. However, no
such direct reference was possible for the mix pastes due to the influence of the admixtures. Thus,
when using the isothermal calorimetry for the admixed cement pastes (with external mixing
procedure), the heat of hydration assessments require additional testing (such as thermogravimetry
and X-ray diffraction) to establish the initial offset reference.
The offset corrections were determined by studying the non-evaporable water content of the
hydrating cement pastes through the thermogravimetric testing. The calorimetric –
thermogravimetric evaluations provided the final heat of hydration estimates, and subsequently,
proved useful to determine the offset corrections.
The final heat of hydration estimates showed that the low dosages of the supplementary
cementitious materials (microsilica and / or calcium carbonate fines) increased the final heat of
hydration value of the two CEM I 52.5 N samples. In the case of admixtures, one set of the
admixtures (a combination of retarder, superplasticiser, and accelerator) substantially increased the
final heat of hydration estimates while the other set exhibited the opposite trend. Thus, no specific
conclusion could be drawn with regards to the impact of the addition of admixtures on the final
heat of hydration.
The final heat of hydration estimates were used to deduce the rate of hydration and the
degree of hydration development curves from the calorimetric curves. The non-evaporable content
based degree of hydration estimates (especially during the early age) had higher variability in
comparison to the isothermal calorimetry outcomes. It was attributed to the differential hydration
rates of different clinkers which is further complicated when the admixtures (especially the
accelerators) were used. It was also recognised that the accuracy of the thermogravimetric degree
of hydration estimates could be increased by supplementing them with other testing techniques
such as X-ray diffraction.
The rate of hydration and degree of hydration curves were plotted against each other and
normalised with the respective peak rate of hydration to deduce the normalised kinetics curves of
the cement hydration reaction. The normalised kinetics represented the evolutionary path of the
normalised rate of cement hydration as a function of the degree of hydration.
The systematic evaluation of the cement pastes concluded that the low dosages of
supplementary cementitious materials (microsilica and / or calcium carbonate fines) increased the
cement reactivity but did not change the evolutionary path. The 20°C normalised kinetics of all
plain pastes was a good representation of the hydration paths of the respective pastes at the
temperatures above 20°C. The admixtures changed the reactivity as well as the path of the cement
hydration. In the presence of the admixtures, different supplementary cementitious materials
influenced the cement hydration path differently. Thus, the normalised kinetics of the admixed
cement pastes was sensitive to both the curing temperature and the binder type.

209
The activation energy was determined by using the peak rates of heat release at the four
different curing temperatures of the respective pastes. The activation energy of both CEM I 52.5 N
samples was determined as 46 kJ/mol. The low dosages of the supplementary cementitious
materials (microsilica and / or calcium carbonate fines) showed a negligible impact on the
activation energy, demonstrating no change in the chemical reactivity for the CEM II type binder.
The admixtures substantially lowered the activation energy of the cement samples, except
for one case which showed only a small change. A simultaneous use of the admixtures and the
supplementary cementitious materials also significantly decreased the activation energy. Since
each set had different types and quantities of admixtures, no conclusion could be drawn on the
impact of the individual admixtures on the activation energy value.
The maturity modelling for the plain pastes’ cementitious systems was possible using the
respective 20°C normalised kinetics as a reference. Due to the temperature sensitivity of the
normalised kinetics of the admixed cementitious systems, the normalised kinetics curves obtained
at all four isothermal curing tempeatures were used to evaluate the sprayed concrete hydration
development, employing interpolation at intermediate temperatures.
An investigation into the activation energy variability, as a function of the degree of
hydration, revealed that the admixtures induced volatility in the activation energy values as the
cement hydration progressed. This was attributed to the temperature and binder sensitivity of the
normalised kinetics. The activation energy variability was addressed by using temperature specific
normalised kinetics during the hydration modelling.
7.1.2 Thermo-mechanical evaluation
The Whitechapel station sprayed concrete thermal monitoring led to the conclusion that the
sprayed concrete needs to be monitored more frequently during its accelerated phase of hydration
(typically the first hour after spraying). The monitoring frequency can be gradually decreased in
the later ages. A schedule was developed as a guideline for future applications, recommending a
montoring frequency varying from 5 mins during first hour to 6 hrs after 24 hrs.
The strength testing outcomes of the two case studies demonstrated that the strength
estimates around the upper limit of 16 MPa of the standard stud-driving method could be
misleading. It is suggested to assess the correctness of the strength values through a dual
consideration of the age and the maturity of the sprayed correctness.
The thermo-mechanical evaluation of the two case studies demonstrated that the accelerator
induced ‘sprayed concrete final set’ does not represent the typically understood final set of the
plain concrete. The admixtures such as retarders had influenced the cement hydration in a way that
even the typically understood ‘plain concrete initial set’ occurred much later than the ‘sprayed
concrete final set’.

210
The two case studies showed that sprayed concrete may have a multilinear strength –
maturity relationship, as opposed to a single linear relationship for a plain concrete. Though the
relationship formulations for the Whitechapel station and the Bond St calibration testing were
different, the Bond St post-calibration testing data were closer to the Whitechapel station
relationship. A qualitative comparison of site activities (such as spraying volume and varying
ambient conditions) during the Whitechapel station and the Bond St post-calibration testing
indicated a correlation between the relationship formulation and the site activities. The precise
cause of the correlation could not be established and requires more case studies for verification.
7.2 Further research recommendations
The thermo-chemical parameters were obtained using the cement pastes isothermally cured
under a high relative humidity. Since the admixtures tend to have a different impact under different
curing conditions, the semi-adiabatic site conditions compounded by the construction activities,
such as the ventilation, pose a limitation on the applicability of these parameters. Thus, there is a
need to quantify the influence of the varying curing conditions on the sprayed concrete’s hydration
kinetics. A systematic semi-adiabatic testing of the admixed cement pastes and sprayed concrete is
recommended to investigate this.
The thermo-chemical parameters were determined using the case study specific mix
proportions. Any change in the proportions or even a minor fundamental variation of the cement
content would require re-evaluation of the parameters. Thus, there is a need for a systematic testing
to analyse the sensitivity of the thermo-chemical parameters to the variation of the ingredients.
At this stage of the research, it is not clear if the kinetics of the admixtures – cement
interaction changes in the presence of aggregates. A thermo-chemical evaluation of the sprayed
concrete mix including aggregates is recognised as an area for further research.
Also, it is not known how the high energy spraying action impacts the intensity of the
admixture – cement interaction in comparison to hand mixing of the accelerator in the laboratory.
Thus, it is also recommended to investigate the sensitivity of the accelerator to the spraying action
from the thermo-chemical viewpoint.
In the current research, thermogravimetric testing was performed on the small samples of
cement paste. A thermogravimetric study of samples taken from large scale sprayed concrete may
yield better results on the non-evaporable content development in the sprayed concrete.
Current young sprayed concrete strength testing methods, such as the needle penetrometer
and stud driving tests, are calibrated to the compressive strengths of cast concrete cubes. Since the
hydration kinetics and heterogeneity of sprayed concrete is different to cast concrete, there is a
need for better strength testing methods for the sprayed concrete material. It is recommended to
establish calibration relationships through the sprayed concrete testing itself, such as comparing the

211
sprayed concrete core strengths with stud-driving outcomes. Since the core drilling is not feasible
for the strengths below 20 MPa, an alternative method of preparing sprayed concrete cores needs to
be developed.
Current practice invloves converting the stud-driving outcomes to strengths through generic
calibration relationships that were developed more than 15 years ago, it would useful to revalidate
these relationship. It is further recommended to establish a practice of developing the sprayed
concrete mix specific calibration relationships.
The thermal imaging technique is helpful to assess the maturity of the outer crust of the
sprayed concrete lining but underestimates the maturity for the interior of the lining. Thus, it
provides conservative outcomes for the lining section with the thickness of more than 200mm.
Further thermodynamic studies may help improve maturity estimates of the interior of the thicker
lining sections, and make them more realisitic.
The strength – maturity relationship for the sprayed concrete was determined to be
multilinear in nature. There remains a need for more case studies to determine the cause of the
different formulations of the strength – maturity relationship obtained for the two case studies.


213
8 References
ACI 228.2R-98 1998. Nondestructive Test Methods for Evaluation of Concrete in Structures.
Farmington Hills, MI, USA: American Concrete Institute.
Ahuja, V. and Jones, B. 2016. Nondestructive Approach for Shotcrete Lining Strength Monitoring.
Shotcrete Magazine. 18(3), pp. 48–54.
Alarcon-Ruiz, L., Platret, G., Massieu, E. and Ehrlacher, A. 2005. The use of thermal analysis in
assessing the effect of temperature on a cement paste. Cement and Concrete Research. 35(3),
pp. 609–613.
Almeida, A. and Sichieri, E.P. 2006. Thermogravimetric Analyses and Mineralogical Study of
Polymer Modified Mortar with Silica Fume. Materials Research. 9(3), pp. 321–326.
American Concrete Institute 2006. ACI Education Bulletin E2-00 Reinforcement for concrete —
Materials and applications (ACI Committee E-701, ed.). Farmington Hills, MI, USA.
American Concrete Institute 2013a. ACI Education Bulletin E3-13 Cementitious materials for
concrete (ACI Committee E-701, ed.). Farmington Hills, MI, USA.
American Concrete Institute 2013b. ACI Education Bulletin E4-12: Chemical admixtures for
concrete (ACI Committee E-701, ed.). American Concrete Institute, Farmington Hills, MI,
USA.
American Concrete Institute 2012. Guide for the use of silica fume in concrete (ACI Committee
234, ed.). Farmington Hills, MI, USA.
Arnold, R., Furr, H. and Rouse, J. 1969. Infrared detection of concrete deterioration. Remote
Sensing Center, Texas A&M University, College Station, Texas.
ASTM C 1074 2011. Standard practice for estimating concrete strength by the maturity method.
ASTM International, West Conshohocken, PA, USA: ASTM International.
ASTM C 1365 2006. Standard test method for determination of the proportion of phases in
Portland cement and Portland-cement clinker using X-Ray powder diffraction analysis.
ASTM International, West Conshohocken, PA, USA: ASTM International.
ASTM C 150 2007. Standard specification for Portland cement. ASTM International, West
Conshohocken, PA, USA: ASTM International.
ASTM C 1679 2008. Standard practice for measuring hydration kinetics of hydraulic cementitious

214
mixtures using isothermal calorimetry. ASTM International, West Conshohocken, PA, USA:
ASTM International.
ASTM C 595 2003. Standard specification for blended cements. ASTM International, West
Conshohocken, PA, USA: ASTM International.
ASTM D4788-88 1997. Standard test method for detecting delaminations in bridge decks using
infrared thermography. ASTM International, West Conshohocken, PA, 1988.
Azenha, M., Faria, R. and Figueiras, H. 2011. Thermography as a technique for monitoring early
age temperatures of hardening concrete. Construction and Building Materials. 25(11), pp.
4232–4240.
Bapat, J. 2013. Silica Fume In: Mineral Admixtures in Cement and Concrete. CRC Press, pp. 61–
74.
Barbosa, M., Pinto, R. and Peres, L. 2005. The influence of silica fume on the apparent activation
energy of HPC mixtures In: P. Helene, E. Figueiredo, T. Holland and R. Bittencourt, eds.
Special publication 229: Quality of concrete structures and recent advances in concrete
materials and testing. American Concrete Institute, pp. 423–434.
BASF 2014. Sprayed concrete for ground support 13th ed. BASF Construction Chemicals Europe
Ltd.
Bažant, Z. and Najjar, L. 1972. Nonlinear water diffusion in non-saturated concrete. Matériaux et
Constructions. 5(25), pp. 3–20.
Bergström, S. 1953. Curing temperature, age and strength of concrete. Magazine of Concrete
Research. 5(14), pp. 61–66.
Bernhardt, C. 1956. Hardening of concrete at different temperatures In: RILEM Symposium on
Winter Concreting. Copenhagen: Danish Institute for Building Research, Copenhagen.
Bezjak, A. 1971. Quantitative determination of major and minor phases in Portland cements from
X-ray diffraction patterns represented by Fourier series. Cement and Concrete Research. 1(5),
pp. 475–492.
Bhalla, S., Tuli, S. and Arora, R. 2011. Defect Detection in Concrete Structures Using Thermal
Imaging Techniques. Experimental Techniques. 35(4), pp. 39–43.
Bogue, R. 1956. Research on Cement Clinker and Concrete. Skokie, Ill., USA: Portland Cement
Association.
Bogue, R. and Lerch, W. 1934. Hydration of Portland cement compounds. Industrial &
Engineering Chemistry. 26(8), pp. 837–847.
British Standards Institution 1986. BS 1881-201 Testing concrete — Part 201: Guide to the use of
non-destructive methods of test for hardened concrete. London: BSI Standards Publication.

215
British Standards Institution 2009. EN 12504-1 Testing concrete in structures — Part 1: Cored
specimens — Taking, examining and testing in compression. London: BSI Standards
Publication.
British Standards Institution 2005a. EN 14487-1 Sprayed concrete — Part 1: Definitions,
specifications and conformity. London: BSI Standards Publication.
British Standards Institution 2005b. EN 14488-1 Testing sprayed concrete — Part 1: Sampling
fresh and hardened concrete. London: BSI Standards Publication.
British Standards Institution 2006a. EN 14488-2 Testing sprayed concrete — Part 2: Compressive
strength of young sprayed concrete. London: BSI Standards Publication.
British Standards Institution 2006b. EN 14889-1 Fibres for concrete — Part 1: Steel fibres —
Definitions, specification and conformity. London: BSI Standards Publication.
British Standards Institution 2006c. EN 14889-2 Fibres for concrete — Part 2: Polymer fibres —
Definitions, specification and conformity. London: BSI Standards Publication.
British Standards Institution 2010a. EN 196-8 Methods of testing cement — Part 8: Heat of
hydration — Solution method. London: BSI Standards Publication.
British Standards Institution 2010b. EN 196-9 Methods of testing cement — Part 9: Heat of
hydration — Semi-adiabatic method. London: BSI Standards Publication.
British Standards Institution 2011. EN 197-1 Part 1 : Composition , specifications and conformity
criteria for common cements. London: BSI Standards Publication.
British Standards Institution 2001. EN 934-2 Admixtures for concrete , mortar and grout — Part 2:
Concrete admixtures — Definitions, requirements, conformity, marking and labelling.
London: BSI Standards Publication.
Broda, M., Wirquin, E. and Duthoit, B. 2002. Conception of an isothermal calorimeter for concrete
- Determination of the apparent activation energy. Materials and Structures. 35(August), pp.
389–394.
Brown, T., LeMay, H. and Bursten, B. 1997. Chemical Kinetics In: Chemistry: the central science.
Upper Saddle River, N.J., USA: Prentice Hall, pp. 491–538.
Brunauer, S., Copeland, L. and Bragg, R. 1956. The Stoichiometry of the Hydration of Tricalcium
Silicate at Room Temperature. I. Hydration in Paste Form. Skokie, Ill., USA: Portland
Cement Association.
Brunauer, S., Copeland, L., Kantro, D., Weise, C. and Schulz, E. 1959. Quantitative Determination
of the Four Major Phases in Portland Cement by X-Ray Analysis. Skokie, Ill., USA: Portland
Cement Association.
Bullard, J., Jennings, H., Livingston, R., Nonat, A., Scherer, G., Schweitzer, J., Scrivener, K. and

216
Thomas, J. 2011. Mechanisms of cement hydration. Cement and Concrete Research. 41(12),
pp. 1208–1223.
Burlingame, S.E. 2004. Application of infrared imaging to fresh concrete: monitoring internal
vibration In: MSc Thesis, Cornell University, Ithaca, NY, USA, p. 464.
Buyukozturk, O. 1998. Imaging of concrete structures. NDT&E International. 31(4), pp. 233–243.
Bye, G. 1999. Portland cement 2nd ed. Thomas Telford.
Byfors, J. 1980. Plain concrete at early ages. Stockholm: Swedish Cement and Concrete Research
Institute.
Carino, N. 2004. The Maturity Method In: V. M. Malhotra and N. J. Carino, eds. Nondestructive
Testing of Concrete. Boca Raton: CRC Press, p. 47.
Carino, N. and Lew, H. 1983. Temperature Effects on the Strength–Maturity Relation of Mortar.
ACI Journal. 80(3), pp. 177–182.
Carino, N. and Lew, H. 2001. The maturity method: from theory to application In: P. Chang, ed.
2001 Structures Congress & Exposition,May 21-23, 2001, Washington, D.C., American
Society of Civil Engineers. Washington, D.C: American Society of Civil Engineers, p. 19.
Carino, N., Lew, H. and Volz, C. 1983. Early age temperature effects on concrete strength
prediction by maturity method. Journal of American Concrete Institute. 80(2), p. 1983.
Carino, N. and Tank, R. 1992. Maturity functions for concretes made with various cements and
admixtures. ACI Materials Journal. 89(2), pp. 188–196.
Cervera, M., Faria, R., Oliver, J. and Prato, T. 2002. Numerical modelling of concrete curing,
regarding hydration and temperature phenomena. Computers and Structures. 80(18–19), pp.
1511–1521.
Chanvillard, G. and D’Aloia, L. 1997. Concrete strength estimation at early ages: modification of
the method of equivalent age. ACI Materials Journal. 94(6), pp. 520–530.
Cheng, C., Cheng, T. and Chiang, C. 2008. Defect detection of concrete structures using both
infrared thermography and elastic waves. Automation in Construction. 18(1), pp. 87–92.
Chin, F. 1971. Relation between strength and maturity of concrete. ACI Journal. 68(3), pp. 196–
203.
Christensen, B. 2006. Time of setting In: J. F. Lamond and J. H. Pielert, eds. Significance of tests
and properties of concrete and concrete-making materials, STP 169D. ASTM, pp. 86–98.
Clark, M., McCann, D. and Forde, M. 2003. Application of infrared thermography to the non-
destructive testing of concrete and masonry bridges. NDT & E International. 36(4), pp. 265–
275.

217
Copeland, L. and Hayes, J. 1953. The determination of non-evaporable water in hardened
Portland cement paste. Skokie, Ill., USA: Portland Cement Association.
Copeland, L., Kantro, D. and Verbeck, G. 1960. Chemistry of hydration of Portland cement In:
Chemistry of Cement - Proceedings of the Fourth International Symposium Proceedings of
the Fourth International Symposium. Washington, D.C., pp. 429–465.
D’Aloia, L. and Chanvillard, G. 2002. Determining the ‘apparent’ activation energy of concrete Ea
— numerical simulations of the heat of hydration of cement. Cement and Concrete Research.
32, pp. 1277–1289.
Danielsson, U. 1974. An apparatus for easy determination of the amount of bound water in cement
pastes yielding highly reproducible results. Matériaux et Constructions. 7(4), pp. 231–246.
Day, R. 1992. The effect of secondary ettringite formation on the durability of concrete: a literature
analysis. Portland Cement Association.
Derucher, K. 1978. Strength In: ASTM Committee C-9, ed. Significance of tests and properties of
concrete and concrete-making materials, STP 169B. Philadelphia, PA, USA: American
Society for Testing and Materials, pp. 146–161.
EFNARC 1996. European specification for sprayed concrete. European Federation of National
Associations of Specialist Contractors and Material Suppliers for the Construction Industry,
Farnham, UK.
Escalante-Garcia, I. and Sharp, J. 2000. The effect of temperature on the early hydration of
Portland cement and blended cements. Advances in Cement Research. 12(3), pp. 121–130.
Fagerlund, G. 2009. Chemically bound water as measure of degree of hydration - Method and
potential errors. Lund: Lund University.
Feldman, R. and Cheng-Yi, H. 1985. Properties of Portland cement-silica fume pastes I. Porosity
and surface properties. Cement and Concrete Research. 15(5), pp. 765–774.
Feldman, R. and Sereda, P. 1968. A model for hydrated Portland cement paste as deduced from
sorption-length change and mechanical properties. Matériaux et Constructions. 1(6), pp. 509–
520.
FLIR Systems 2013. The ultimate infrared handbook for R & D professionals. FLIR AB.
FLIR Systems 2012. What is Infrared? , pp. 1–6. [Accessed 29 May 2017]. Available from:
http://www.flir.com/about/display/?id=41536.
Folliard, K., Juenger, M., Schindler, A., Whigham, J. and Meadows, J. 2008. FHWA/TX-08/0-
4563-1 Prediction Model for Concrete Behavior. Austin.
Freiesleben Hansen, P. and Pedersen, E. 1985. Curing of concrete structures. CEB Information
Bulletin 166, 1985.

218
Freiesleben Hansen, P. and Pedersen, E. 1977. Maturity computer for controlling curing and
hardening of concrete. Nordisk Betong. 1(19), pp. 21–25.
Galobardes, I., Cavalaro, S., Goodier, C., Austin, S. and Rueda, Á. 2015. Maturity method to
predict the evolution of the properties of sprayed concrete. Construction and Building
Materials. 79, pp. 357–369.
Gomes, J. 1997. Mathematical models for assessing hydration and microstructure of cement
pastes. PhD Thesis, The University of Leeds, UK.
Goto, S. and Roy, D. 1981. The effect of w/c ratio and curing temperature on the permeability of
hardened cement paste. Cement and Concrete Research. 11(4), pp. 575–579.
Habel, K., Viviani, M., Denarié, E. and Brühwiler, E. 2006. Development of the mechanical
properties of an Ultra-High Performance Fiber Reinforced Concrete (UHPFRC). Cement and
Concrete Research. 36(7), pp. 1362–1370.
Hansen, W. and Surlaker, S. 2006. Embedded Wireless Temperature Monitoring Systems For
Concrete Quality Control. Ann Arbor, MI, USA.
Hellmich, C., Ulm, F.-J. and Mang, H. 1999. Multisurface chemoplasticity. I: Material model for
shotcrete. Journal of Engineering Mechanics. 125(June), pp. 692–701.
Helmuth, R. and Detwiler, R. 2006. The nature of concrete In: Significance of tests and properties
of concrete and concrete-making materials STP 169D. ASTM International, West
Conshohocken, PA, USA, pp. 5–15.
Hilti Corporation 2009. Determination of the early strength of sprayed concrete with stud driving
method with Hilti DX 450-SCT. Alpbach, Austria.
Jansen, D., Goetz-Neunhoeffer, F., Lothenbach, B. and Neubauer, J. 2012. The early hydration of
Ordinary Portland Cement (OPC): An approach comparing measured heat flow with
calculated heat flow from QXRD. Cement and Concrete Research. 42(1), pp. 134–138.
Jones, B. 2015. Apparatus & method for monitoring strength development of concrete. WO
2015/001344 A1. 2015-01-08.
Jones, B. 2007. Stresses in sprayed concrete tunnel junctions. PhD Thesis, University of
Southampton, UK.
Jones, B. and Li, S. 2013. Strength monitoring using thermal imaging. Tunnelling Journal.
(December 2013 / January 2014), pp. 40–43.
Jones, B., Li, S. and Ahuja, V. 2014. Early strength monitoring of shotcrete using thermal imaging
In: T. Beck, O. Woldmo and S. Engen, eds. 7th International Symposium on Sprayed
Concrete – Modern Use of Wet Mix Sprayed Concrete for Underground Support. Sandefjørd,
Norway, 16–19 June 2014, Sandefjørd: Tekna & Norsk Betongforening, pp. 245–254.

219
Kada-Benameur, H., Wirquin, E. and Duthoit, B. 2000. Determination of apparent activation
energy of concrete by isothermal calorimetry. Cement and Concrete Research. 30(2), pp.
301–305.
Kantro, D., Copeland, L., Weise, C. and Brunauer, S. 1964. Quantitative determination of major
phases in Portland cements by x-ray diffraction methods. Journal Of The PCA Research And
Development Laboratories Research And Development Laboratories. 6(1), pp. 20–40.
King, E.H. 1996. Shotcrete In: J. O. Bickel, T. R. Kuesel and E. H. King, eds. Tunnel Engineering
Handbook. Boston, MA: Springer US, pp. 220–230.
Kjellsen, K. and Detwiler, R. 1992. Reaction kinetics of Portland cement mortars hydrated at
different temperatures. Cement and Concrete Research. 22, pp. 112–120.
Kondo, R. and Ueda, S. 1968. Kinetics and mechanisms of the hydration of cements In: Chemistry
of Cement - Proceedings of the Fifth International Symposium., pp. 203–212.
Kovári, K. 2003. History of the sprayed concrete lining method—part I: Milestones up to the
1960s. Tunnelling and Underground Space Technology. 18(1), pp. 57–69.
Kurdowski, W. 2014. Cement and Concrete Chemistry. Krakow: Springer.
Lerch, W. and Bogue, R. 1934. The heat of hydration of portland cement pastes. Journal of
Research of the National Bureau of Standards. 12(May), pp. 645–664.
Lew, H. and Reichard, T. 1978. Prediction of Strength of Concrete from Maturity. ACI Special
Publication. 56(14), pp. 229–248.
Locher, F. and Richartz, W. 1974. Study of hydration mechanism of cement In: International
Symposium on Chemistry of Cement. Moscow, Russia.
Lothenbach, B., Durdziński, P. and De Weerdt, K. 2016. Thermogravimetric analysis In: K.
Scrivener, R. Snellings and B. Lothenbach, eds. A Practical Guide to Microstructural
Analysis of Cementitious Materials. Boca Raton: CRC Press, pp. 177–212.
Lura, P., Jensen, O.M. and Van Breugel, K. 2003. Autogenous shrinkage in high-performance
cement paste: An evaluation of basic mechanisms. Cement and Concrete Research. 33(2), pp.
223–232.
Manning, D. and Holt, F. 1980. Detecting delamination in concrete bridge decks. Concrete
International. 2(11), pp. 34–41.
McIntosh, J. 1949. Electrical curing of concrete. Magazine of Concrete Research. 1(1), pp. 21–28.
McIntosh, J. 1956. The effects of low-temperature curing on the compressive strength of concrete
In: RILEM Symposium on Winter Concreting. Copenhagen: Danish Institute for Building
Research, Copenhagen, p. 10.

220
Melbye, T. and Dimmock, R. 2001. Modern Advances and Applications of Sprayed Concrete
Modern Advances and Applications of Sprayed Concrete In: E. S. Bernard, ed. International
Conference on Engineering Developments in Shotcrete. Hobart, Tasmania, Australia, p. 25.
Melbye, T. and Dimmock, R. 2006. Sprayed Concrete : A Modern , Holistic Approach In:
International Symposium on Underground Excavation and Tunnelling. Bangkok, Thailand,
pp. 249–263.
Mills, R. 1966. Factors influencing cessation of hydration in water-cured cement pastes.
Symposium on structure of Portland cement paste and concrete, Highway Research Board
Special Report. (90), pp. 406–424.
Molina, L. 1992. On predicting the influence of curing conditions on the degree of hydration. CBI
report 5:92, Stockholm: Swedish Cement and Concrete Research Institute.
Moore, W., Swift, G. and Milberger, L. 1973. An instrument for detecting delamination in concrete
bridge decks. Highway Research Record. (451), pp. 44–52.
Myrdal, R. 2007a. Report No. SBF BK A07025: Accelerating admixtures for concrete In:
Advanced cementing materials: Controlling hydration development. Trondheim, Norway:
SINTEF Building and Infrastructure, p. 35.
Myrdal, R. 2007b. Report No. SBF BK A07035: Retarding admixtures for concrete In: Advanced
cementing materials: Controlling hydration development. Trondheim, Norway: SINTEF
Building and Infrastructure, p. 23.
Neville, A. 2004. Properties of Concrete 4th ed. London: Pearson - Princeton Hall.
Nurse, R. 1949. Steam curing of concrete. Magazine of Concrete Research. 1(2), pp. 79–88.
Nykanen, A. 1956. Hardening of concrete at different temperatures, especially below freezing
point In: RILEM Symposium on Winter Concreting. Copenhagen: Danish Institute for
Building Research, Copenhagen.
Pane, I. and Hansen, W. 2005. Investigation of blended cement hydration by isothermal
calorimetry and thermal analysis. Cement and Concrete Research. 35(6), pp. 1155–1164.
Pang, X., Bentz, D., Meyer, C., Funkhouser, G. and Darbe, R. 2013. A comparison study of
Portland cement hydration kinetics as measured by chemical shrinkage and isothermal
calorimetry. Cement and Concrete Composites. 39, pp. 23–32.
Plowman, J. 1956. Maturity and the strength of concrete. Magazine of Concrete Research. 8(22),
pp. 13–22.
Poole, J. 2007. Modeling temperature sensitivity and heat evolution of concrete. Ph.D. Thesis: The
University of Texas at Austin, Austin, TX.
Poole, J., Riding, K., Folliard, K., Juenger, M. and Schindler, A. 2007. Methods for Calculating

221
Activation Energy for Portland Cement. ACI Materials Journal. 104(1), pp. 303–311.
Portland Cement Association 1988. Design and Control of Concrete Mixtures 13th ed. Skokie, Ill.,
USA.
Powers, T. 1958. Structure and Physical Properties of Hardened Portland Cement Paste. Journal of
the American Ceramic Society. 41(1), pp. 1–6.
Powers, T. 1966. The nature of concrete In: ASTM Committee C-9, ed. Significance of tests and
properties of concrete and concrete-making materials, STP 169A. Philadelphia, PA, USA:
American Society for Testing and Materials, pp. 61–72.
Powers, T. 1949. The nonevaporable hardened water content paste — Its significance for concrete
research and its method of determination In: PCA Research Department Bulletin 29. Skokie,
Ill., USA: Portland Cement Association, p. 21.
Powers, T. and Brownyard, T. 1946. Studies of the Physical Properties of Hardened Portland
Cement Paste. Journal Of The American Concrete Institute. 18(2), pp. 101–132.
Pratt, P. and Ghose, A. 1983. Electron microscope studies of Portland cement microstructures
during setting and hardening. Philosophical transactions. Series A, Mathematical, physical,
and engineering sciences. 310(1511), pp. 93–103.
Prudêncio Jr, L. 1998. Accelerating admixtures for shotcrete. Cement and Concrete Composites.
20, pp. 213–219.
von Rabcewicz, L. 1969a. Stability of tunnels under rock load – part I. Water Power. 21(6), pp.
225–229.
von Rabcewicz, L. 1969b. Stability of tunnels under rock load – part II. Water Power. 21(7), pp.
266–273.
von Rabcewicz, L. 1969c. Stability of tunnels under rock load – part III. Water Power. 21(8), pp.
297–302.
von Rabcewicz, L. 1964a. The new Austrian tunnelling method – part I. Water Power. 16(11), pp.
453–457.
von Rabcewicz, L. 1964b. The new Austrian tunnelling method – part II. Water Power. 16(12), pp.
511–515.
von Rabcewicz, L. 1965. The new Austrian tunnelling method – part III. Water Power. 17(1), pp.
19–24.
Rastrup, E. 1954. Heat of Hydration in Concrete. Magazine of Concrete Research. 6(17), pp. 79–
92.
Riding, K., Poole, J., Folliard, K., Juenger, M. and Schindler, A. 2012. Modeling hydration of

222
cementitious systems. ACI Materials Journal. 109(2), pp. 225–234.
RILEM 1981. Properties of set concrete at early ages : State of the art report. Materials and
Structures. 14(84), pp. 399–450.
Sandberg, P. and Walsh, W. 2010. Use of calorimetry to select materials for shotcrete In:
Shotcrete: Elements of a System - Proceedings of the 3rd International Conference on
Engineering Developments in Shotcrete. Queensland, New Zealand, 15-17 March, 2010:
CRC Press, pp. 255–259.
Saul, A. 1951. Principles underlying the steam curing of concrete at atmospheric pressure.
Magazine of Concrete Research. 2(6), pp. 127–135.
Schindler, A. 2004. Effect of Temperature on Hydration of Cementitious Materials. ACI Materials
Journal. 101(1), pp. 72–81.
De Schutter, G. 2004. Applicability of degree of hydration concept and maturity method for
thermo-visco-elastic behaviour of early age concrete. Cement and Concrete Composites.
26(5), pp. 437–443.
De Schutter, G. and Taerwe, L. 1995. General hydration model for Portland cement and blast
furnace slag cement. Cement and Concrete Research. 25(3), pp. 593–604.
Scrivener, K., Füllmann, T., Gallucci, E., Walenta, G. and Bermejo, E. 2004. Quantitative study of
Portland cement hydration by X-ray diffraction/Rietveld analysis and independent methods.
Cement and Concrete Research. 34(9), pp. 1541–1547.
Scrivener, K. and Pratt, P. 1984. Microstructural studies of the hydration of C3A and C4AF
independently and in cement paste. Proceedings of British Ceramic Society. 35, pp. 207–219.
Snellings, R. 2016. X-ray powder diffraction applied to cement In: K. Scrivener, R. Snellings and
B. Lothenbach, eds. A Practical Guide to Microstructural Analysis of Cementitious
Materials. Boca Raton: CRC Press, pp. 107–176.
Sprayed Concrete Association 1999. Introduction to Sprayed Concrete. Sprayed Concrete
Association, Aldershot, Hampshire, UK.
Stutzman, P. 1996. Guide for X-Ray Powder Diffraction Analysis of Portland Cement and Clinker.
National Institute of Standards and Technology, Gaithersburg, MD.
Suzuki, Y., Tsuji, Y., Maekawa, K. and Okamura, H. 1990. Quantification of hydration-heat
generation process of cement in concrete. Concrete Library of JSCE. 16(December), pp. 111–
124.
Taylor, H. 1997a. Hydrated aluminate, ferrite and sulfate phases In: Cement chemistry. London:
Thomas Telford, pp. 157–186.
Taylor, H. 1997b. Hydration of Portland Cement In: Cement chemistry. London: Thomas Telford,

223
pp. 187–225.
The Concrete Society 2017. Calcuim chloride. [Accessed 24 May 2017]. Available from:
http://www.concrete.org.uk/fingertips-nuggets.asp?cmd=display&id=887.
Thomas, A. 2003. Numerical modelling of sprayed concrete lined (SCL) tunnels. Ph.D. Thesis:
University of Southampton, UK.
Thomas, A. 2008. Sprayed concrete lined tunnels: an introduction 1st ed. Abingdon, UK: Taylor
& Francis.
Tikalsky, P.E., Tepke, D., Camisa, S. and Soltez, S. 2003. FHWA-OR-DF-04-01 Maturity method
demonstration. Washington, DC: Federal Highway Administration.
Titman, D. 2001. Applications of thermography in non-destructive testing of structures. NDT and
E International. 34(2), pp. 149–154.
Titman, D. 1990. Some applications of infra-red thermography to civil engineering problems. The
British Journal of Non-destructive Testing. 32(12).
Vemuri, S. and Atadero, R. 2017. Case Study on Rapid Scanning Techniques for Concrete Bridge
Decks with Asphalt Overlay: Ground-Penetrating Radar and Infrared Thermography.
Practice Periodical on Structural Design and Construction. 22(2), pp. 1–8.
Verbeck, G. 1978. Pore Structure In: ASTM Committee C-9, ed. Significance of tests and
properties of concrete and concrete-making materials, STP 169B. Philadelphia, PA, USA:
American Society for Testing and Materials, pp. 262–275.
Verbeck, G. and Helmuth, R. 1968. Structure and physical properties of cement paste In:
Chemistry of Cement - Proceedings of the Fifth International Symposium. Tokyo, pp. 1–32.
Wade, S., Nixon, J., Schindler, A. and Barnes, R. 2010. Effect of temperature on the setting
behavior of concrete. Journal of Materials in Civil Engineering. 22(3), pp. 214–222.
Wadsö, L. 2003. An experimental comparison between isothermal calorimetry , semi-adiabatic
calorimetry and solution calorimetry for the study of cement hydration. Espoo, Finland:
Nordtest Tekniikantie.
Wadsö, L. 2001. lsothermal calorimetry for the study of cement hydration. Lund: Lund University.
Waller, V. 1999. Relations entre la composition des bétons, exothermie en cours de prise et
résistance en compression PhD Thesis. Ecole Nationale des Ponts et Chaussées, Paris.
Wang, J., Niu, D. and Zhang, Y. 2015. Microstructure and mechanical properties of accelerated
sprayed concrete. Materials and Structures. 49(4), pp. 1469–1484.
Wastlund, G. 1956. Hardening of concrete as influenced by temperature In: RILEM Symposium on
Winter Concreting. Copenhagen: Danish Institute for Building Research, Copenhagen.

224
Weaver, J. and Sadgrove, B. 1971. Striking times of formwork-tables of curing periods to achieve
given strengths. Construction Industry Research and Information Association, Rep. 36,
London.
Weil, G. 1984. Infrared Thermal Sensing Of Sewer Voids In: Procedding SPIE 446, Thermosense
VI: Thermal Infrared Sensing for Diagnostics and Control. Oak Brook, United States, pp.
116–121.
Weil, G. 2004. Infrared Thermographic Techniques In: V. Malhotra and N. Carino, eds. Handbook
on Nondestructive Testing of Concrete. Boca Raton: CRC Press, p. 14.
Wirquin, E., Broda, M. and Duthoit, B. 2002. Determination of the apparent activation energy of
one concrete by calorimetric and mechanical means - Influence of a superplasticizer. Cement
and Concrete Research. 32(8), pp. 1207–1213.
Zákoutský, J., Tydlitát, V. and Černý, R. 2012. Effect of temperature on the early-stage hydration
characteristics of Portland cement: a large-volume calorimetric study. Construction and
Building Materials. 36, pp. 969–976.

225
Appendices
Appendix A Whitechapel station
A1 Cement pastes – thermogravimetric weight loss profiles


227
Figure A1-1 Thermogravimetric weight loss profiles for WC1 paste at 10°C
Figure A1-2 Thermogravimetric weight loss profiles for WC1 paste at 30°C

228
Figure A1-3 Thermogravimetric weight loss profiles for WC1 paste at 40°C
Figure A1-4 Thermogravimetric weight loss profiles for WC2 paste at 10°C

229
Figure A1-5 Thermogravimetric weight loss profiles for WC2 paste at 30°C
Figure A1-6 Thermogravimetric weight loss profiles for WC2 paste at 40°C

230
Figure A1-7 Thermogravimetric weight loss profiles for WC3 paste at 10°C
Figure A1-8 Thermogravimetric weight loss profiles for WC3 paste at 30°C

231
Figure A1-9 Thermogravimetric weight loss profiles for WC3 paste at 40°C
Figure A1-10 Thermogravimetric weight loss profiles for WC4 paste at 10°C

232
Figure A1-11 Thermogravimetric weight loss profiles for WC4 paste at 30°C
Figure A1-12 Thermogravimetric weight loss profiles for WC4 paste at 40°C

233
A2 Cement pastes – thermogravimetric degree of
hydration estimates
Table A2-1 Non-evaporable water content and degree of hydration estimates for WC1 paste
Isothermal curing temperature
10°C 20°C 30°C 40°C
Age wn Age wn Age wn Age wn
hrs % - hrs % - hrs % - hrs % -
5.0 0.814 0.039 1.5 0.650 0.031 1.2 0.623 0.030 1.2 0.633 0.030
24.0 5.223 0.246 8.0 3.705 0.176 6.0 3.500 0.166 6.0 4.018 0.190
50.0 9.850 0.467 29.0 8.890 0.421 29.0 10.948 0.519 44.0 12.904 0.611
72.0 10.365 0.491 72.0 11.915 0.565 144 13.290 0.630 94.0 14.033 0.665
170 12.127 0.575 166 12.812 0.607
336 12.730 0.603
Table A2-2 Non-evaporable water content and degree of hydration estimates for WC2 paste
Isothermal curing temperature
10°C 20°C 30°C 40°C
Age wn Age wn Age wn Age wn
hrs % - hrs % - hrs % - hrs % -
4.0 0.970 0.049 1.7 0.288 0.015 1.7 0.425 0.021 1.2 1.339 0.030
24.0 4.549 0.229 9.5 3.738 0.188 7.0 4.890 0.246 4.6 4.003 0.190
48.0 9.076 0.457 30.0 8.629 0.435 26.0 9.890 0.498 48.0 12.264 0.611
72.0 10.191 0.513 72.0 10.978 0.553 144 12.710 0.640 94.0 13.473 0.665
168 11.442 0.576 168 12.425 0.626
336 12.681 0.639
Table A2-3 Non-evaporable water content and degree of hydration estimates for WC3 paste
Isothermal curing temperature
10°C 20°C 30°C 40°C
Age wn Age wn Age wn Age wn
hrs % - hrs % - hrs % - hrs % -
7.5 1.863 0.090 3.0 1.945 0.094 0.7 0.683 0.033 2.8 1.519 0.073
24.0 5.396 0.260 16.0 6.561 0.316 3.0 1.279 0.062 8.8 2.702 0.130
72.0 9.135 0.441 25.0 8.785 0.424 16.5 7.610 0.367 28.0 11.593 0.559
168.0 13.402 0.646 72.0 11.999 0.579 28.5 10.063 0.485 72.8 13.987 0.675
360.0 16.228 0.783 182.0 13.873 0.669 84.0 13.290 0.641
476.0 17.996 0.868 172.0 14.645 0.706

234
Table A2-4 Non-evaporable water content and degree of hydration estimates for WC4 paste
Isothermal curing temperature
10°C 20°C 30°C 40°C
Age wn Age wn Age wn Age wn
hrs % - hrs % - hrs % - hrs % -
4.5 1.322 0.068 3.5 1.824 0.093 0.7 0.390 0.020 2.3 1.330 0.068
21.0 4.633 0.237 11.5 4.401 0.225 3.5 2.106 0.108 4.8 3.0745 0.157
50.4 7.106 0.364 32.0 8.560 0.438 8.5 5.284 0.271 7.5 5.915 0.303
72.0 8.045 0.456 74.0 11.600 0.594 30.5 10.407 0.533 20.0 10.540 0.540
168.0 7.826 0.401 180.0 13.453 0.689 170.0 14.741 0.755 28.0 11.606 0.594
336.0 14.524 0.744 72.0 12.937 0.662
478.0 14.973 0.767

235
A3 Cement pastes – measured heat of hydration
Table A3-1 Measured heat of hydration values – WC1 paste
Isothermal curing temperature for thermogravimetry
10°C 20°C 30°C 40°C
Age Q Age Q Age Q Age Q
hrs J/g hrs J/g hrs J/g hrs J/g
5.0 34.9 1.5 16.5 1.2 1.8 1.2 -0.8
24.0 139.4 8.0 69.8 6.0 76.3 6.0 129.0
50.0 230.4 29.0 230.0 29.0 265.9 44.0 304.2
72.0 262.4 72.0 306.3 144.0 318.8 94.0 306.2
170.0 319.0 166.0 333.8
336.0 342.3
Table A3-2 Measured heat of hydration values – WC2 paste
Isothermal curing temperature for thermogravimetry
10°C 20°C 30°C 40°C
Age Q Age Q Age Q Age Q
hrs J/g hrs J/g hrs J/g hrs J/g
4.0 34.6 1.7 17.6 1.7 4.3 1.2 9.7
24.0 143.6 9.5 90.4 7.0 100.2 4.6 86.4
48.0 233.6 30.0 236.2 26.0 258.9 48.0 334.2
72.0 270.6 72.0 312.8 144.0 331.9 94.0 346.1
168.0 332.8 168.0 351.2
336.0 365.9
Table A3-3 Measured heat of hydration values – WC3 paste
Isothermal curing temperature for thermogravimetry
10°C 20°C 30°C 40°C
Age Q Age Q Age Q Age Q
hrs J/g hrs J/g hrs J/g hrs J/g
7.5 69.1 3.0 50.8 0.7 7.1 2.8 31.6
24.0 130.4 16.0 145.5 3.0 37.4 8.8 96.4
72.0 263.2 25.0 209.4 16.5 169.0 28.0 281.7
168.0 343.0 72.0 312.3 28.5 248.1 72.8 327.0
360.0 383.6 182.0 361.4 84.0 334.7
476.0 393.1 172.0 348.7

236
Table A3-4 Measured heat of hydration values – WC4 paste
Isothermal curing temperature for thermogravimetry
10°C 20°C 30°C 40°C
Age Q Age Q Age Q Age Q
hrs J/g hrs J/g hrs J/g hrs J/g
4.5 67.1 3.5 55.4 0.7 15.9 2.3 27.4
21.0 140.5 11.5 114.8 3.5 53.1 4.8 53.0
50.4 242.0 32.0 245.0 8.5 107.9 7.5 117.4
72.0 276.1 74.0 323.5 30.5 280.9 20.0 267.6
168.0 357.2 180.0 377.8 170.0 369.2 28.0 296.5
336.0 402.9
72.0 336.6
478.0 417.5

237
A4 Cement pastes – degree of hydration development
histories
Figure A4-1 Degree of hydration development – WC1 paste at 10°C
Figure A4-2 Degree of hydration development – WC1 paste at 30°C

238
Figure A4-3 Degree of hydration development – WC1 paste at 40°C
Figure A4-4 Degree of hydration development – WC2 paste at 10°C

239
Figure A4-5 Degree of hydration development – WC2 paste at 30°C
Figure A4-6 Degree of hydration development – WC2 paste at 40°C

240
Figure A4-7 Degree of hydration development – WC3 paste at 10°C
Figure A4-8 Degree of hydration development – WC3 paste at 30°C

241
Figure A4-9 Degree of hydration development – WC3 paste at 40°C
Figure A4-10 Degree of hydration development – WC4 paste at 10°C

242
Figure A4-11 Degree of hydration development – WC4 paste at 30°C
Figure A4-12 Degree of hydration development – WC4 paste at 40°C

243
A5 Cement pastes – normalised kinetics characteristics
Table A5-1 Normalised kinetic curve characteristics – WC1 pastes
10°C 20°C 30°C 40°C Average
Nk Nk Nk Nk Nk
initial 0.020 0.91 0.020 0.54 0.020 0.17 0.020 0.06 0.020 0.42
dormant 0.031 0.30 0.027 0.22 0.136 0.14 0.020 0.06 0.026 0.22
peak 0.185 1.00 0.183 1.00 0.166 1.00 0.158 1.00 0.175 0.99
0.1 0.100 0.90 0.100 0.91 0.100 0.89 0.100 0.86 0.100 0.89
0.2 0.200 0.99 0.200 0.98 0.200 0.94 0.200 0.93 0.200 0.96
0.3 0.300 0.69 0.300 0.65 0.300 0.60 0.300 0.60 0.300 0.64
0.4 0.400 0.32 0.400 0.31 0.400 0.26 0.400 0.26 0.400 0.29
0.5 0.500 0.14 0.500 0.17 0.500 0.16 0.500 0.14 0.500 0.15
0.6 0.600 0.03 0.600 0.03 0.600 0.02 0.600 0.01 0.600 0.02
Table A5-2 Normalised kinetic curve characteristics – WC2 pastes
10°C 20°C 30°C 40°C Average
Nk Nk Nk Nk Nk
initial 0.020 6.52 0.020 1.97 0.030 0.22 0.026 0.33 0.030 1.16
dormant 0.049 0.31 0.036 0.22 0.139 0.14 0.043 0.07 0.044 0.25
peak 0.200 1.00 0.186 1.00 0.179 1.00 0.182 1.00 0.188 0.99
0.1 0.100 0.82 0.100 0.89 0.100 0.84 0.100 0.77 0.100 0.83
0.2 0.200 1.00 0.200 0.99 0.200 0.97 0.200 0.98 0.200 0.99
0.3 0.300 0.74 0.300 0.66 0.300 0.64 0.300 0.67 0.300 0.68
0.4 0.400 0.38 0.400 0.32 0.400 0.30 0.400 0.33 0.400 0.34
0.5 0.500 0.15 0.500 0.16 0.500 0.15 0.500 0.16 0.500 0.16
0.6 0.600 0.06 0.600 0.05 0.600 0.03 0.600 0.05 0.600 0.05
Table A5-3 Normalised kinetic curve characteristics – WC3 pastes
10°C 20°C 30°C 40°C Average
Nk Nk Nk Nk Nk
initial 0.020 17.55 0.020 9.56 0.020 4.68 0.033 1.83 0.020 8.07
dormant 0.127 0.41 0.093 0.37 0.270 0.27 0.076 0.16 0.105 0.43
peak 0.262 1.00 0.251 1.00 0.266 1.00 0.254 1.00 0.258 1.00
0.1 0.100 0.66 0.100 0.42 0.100 0.37 0.100 0.31 0.100 0.44
0.2 0.200 0.87 0.200 0.94 0.200 0.88 0.200 0.92 0.200 0.90
0.3 0.300 0.96 0.300 0.94 0.300 0.97 0.300 0.95 0.300 0.96
0.4 0.400 0.55 0.400 0.49 0.400 0.60 0.400 0.58 0.400 0.55
0.5 0.500 0.24 0.500 0.23 0.500 0.27 0.500 0.24 0.500 0.25
0.6 0.600 0.16 0.600 0.14 0.600 0.13 0.600 0.10 0.600 0.13


245
A6 Sprayed concrete – test panel temperature histories
Table A6-1 Temperature histories – Panel Set 1
Date & time of spray: 12:50 hrs on 05/03/2014
Time (hrs) Temperature (°C)
1A 1B 1C 1D 1E
0.1 19.3 20.4 20.7 21.3 20.8
0.2 19.9 20.6 20.6 22.0 21.7
0.4 18.6 19.7 21.2 21.0 21.1
0.8 19.3 21.1 20.4 21.1 19.6
1.0 19.4 20.0 21.4 20.6 19.3
1.3 18.2 19.2 20.1 20.2 20.2
1.5 19.3 20.1 20.1 19.9 20.1
2.0 18.6 19.7 19.6 20.3 20.1
2.6 18.7 19.6 19.5 19.7 18.7
3.4 20.8 21.2 20.9 21.1 20.8
5.1 23.0 23.4 22.4 23.0 22.8
7.9 23.2 24.5 24.3 24.7 24.6
9.1 24.2 23.7 24.6 25.8 24.9
9.5 23.5 24.8 25.1 25.6 24.5
11.3 23.2 24.3 25.1 25.4 24.4
11.8 23.8 24.4 25.7 25.9 24.6
12.9 23.9 23.8 26.3 25.7 24.7
15.2 22.6 22.9 24.8 25.3 23.9
22.2 21.6 22.0 22.9 23.8 22.6
23.2 22.3 23.3 24.0 24.0 22.7
23.8 21.5 23.0 24.3 23.4 22.9
25.6 22.3 22.2 22.1 24.1 22.4
27.8 22.4 22.6 22.6 23.0 22.1
45.9 18.0 18.7 19.0 20.3 18.3
52.1 19.3 19.3 20.0 19.3 19.7

246
Table A6-2 Temperature histories – Panel Set 2
Date & time of spray: 10:00 hrs on 17/03/2014
Time (hrs) Temperature (°C)
2A 2B 2C 2D 2E
0.1 29.7 28.6 29.9 30.1 31.0
0.3 29.4 29.0 29.2 30.0 30.2
0.5 29.6 28.6 30.0 29.3 29.5
0.8 30.0 28.9 29.2 29.0 28.8
0.9 29.8 28.5 28.8 29.3 29.2
0.9 29.9 28.7 29.0 28.9 29.3
1.3 29.2 28.1 28.9 29.0 28.9
1.3 29.1 28.3 29.0 29.0 28.7
2.0 28.8 28.0 28.4 28.4 28.5
5.2 29.4 31.1 31.2 32.5 31.1
5.3 29.6 31.1 30.9 31.8 31.4
5.3 29.7 31.5 31.3 32.2 31.5
6.7 30.0 31.7 31.2 32.3 31.2
7.2 29.9 31.4 31.3 32.8 32.4
11.8 27.2 27.9 28.5 30.8 30.3
11.8 27.2 28.3 28.5 31.0 30.3
13.7 27.9 28.3 29.3 31.0 30.4
24.7 24.8 25.0 25.3 26.9 26.5
26.3 25.0 25.2 25.3 26.5 25.9
26.5 24.7 24.9 25.4 26.4 26.3
31.3 23.6 23.6 23.7 24.8 24.2
31.8 23.8 23.6 23.9 24.8 24.3
40.4 22.9 23.1 23.1 24.0 23.3
40.4 22.9 22.8 23.1 23.7 23.4
41.5 23.4 23.1 23.4 23.9 23.7
41.6 23.4 23.1 23.4 23.9 23.7

247
Table A6-3 Temperature histories – Panel Set 3
Date & time of spray: 04:15 hrs on 19/03/2014
Time (hrs) Temperature (°C)
3A 3B 3C 3D 3E
0.1 27.8 28.8 27.3 28.9 28.4
0.4 28.0 28.5 27.9 29.0 28.0
1.3 26.8 27.0 27.0 27.7 27.3
1.8 26.1 26.5 26.8 27.1 28.8
6.1 29.5 29.5 29.8 29.6 29.2
7.9 28.5 28.0 28.9 29.0 29.0
8.8 26.7 27.7 28.5 28.5 29.0
11.0 27.5 28.3 28.7 28.9 28.8
12.1 27.9 27.9 29.0 29.0 28.8
30.0 22.5 22.5 23.4 23.0 22.5
30.0 22.5 22.6 23.4 22.9 22.5
31.4 22.4 23.2 23.5 22.7 22.3
Table A6-4 Temperature histories – Panel Set 4
Date & time of spray: 17:15 hrs on 24/03/2014
Time (hrs) Temperature (°C)
4A 4B 4C 4D 4E
0.0 20.9 21.2 21.0 20.6 20.8
0.1 21.1 21.2 21.9 21.2 21.2
0.6 25.7 26.1 25.5 26.0 25.6
0.6 25.3 25.6 25.5 25.6 25.6
0.7 25.1 25.7 25.5 25.7 25.5
1.7 25.5 25.9 25.7 25.6 25.8
1.9 25.0 25.2 25.3 25.7 25.6
2.3 26.7 25.5 26.1 25.4 25.8
3.2 25.6 27.0 27.4 27.4 27.6
3.4 26.0 27.0 27.6 27.8 27.8
3.8 26.7 27.5 28.1 28.4 28.5
6.8 29.0 30.2 31.8 31.3 31.9
17.4 26.5 28.3 29.5 28.5 29.6
19.3 22.8 27.9 30.2 28.9 29.4
28.0 23.7 25.3 25.8 25.5 25.8
28.4 23.5 24.9 25.8 25.4 25.9
41.3 21.8 22.2 22.8 22.8 23.1
41.5 20.8 22.0 22.6 22.1 22.4

248
Table A6-5 Temperature histories – Panel Set 5
Date & time of spray: 17:15 hrs on 21/07/2014
Time (hrs) Temperature (°C)
5A 5B 5C 5D 5E
0.3 30.0 30.0 29.5 29.0 27.7
0.3 29.7 29.5 29.5 28.9 27.2
0.5 29.0 28.9 28.6 28.6 26.3
2.9 29.9 30.9 30.4 30.8 29.7
3.7 30.8 32.0 31.0 32.3 31.7
4.4 31.5 32.7 31.8 33.3 32.4
5.8 31.4 33.8 32.9 34.7 33.4
11.2 29.8 32.1 31.0 31.6 30.3
14.0 29.0 31.2 30.0 30.2 28.9
23.1 33.7 33.0 32.0 31.8 31.1
25.7 32.3 32.1 31.6 31.4 31.1
33.3 30.4 30.3 30.2 30.1 29.4
Table A6-6 Temperature histories – Panel Set 6
Date & time of spray: 03:25 hrs on 23/07/2014
Time (hrs) Temperature (°C)
6A 6B 6C 6D 6E
0.2 33.7 33.0 32.8 33.9 34.0
0.5 29.4 29.5 28.8 29.1 27.9
0.8 29.2 29.3 28.4 28.6 28.0
1.3 29.7 28.8 28.3 28.6 27.6
2.2 31.7 30.4 29.9 29.6 29.1
11.8 36.2 35.8 35.5 35.2 34.1
13.7 36.5 36.4 36.1 36.0 34.9
19.9 35.3 34.5 34.0 34.0 33.3
26.5 34.1 33.7 33.1 33.4 33.3
26.6 33.7 33.3 33.1 33.1 32.6
34.7 33.2 32.4 32.2 31.6 31.4
35.2 33.1 32.7 32.2 31.9 31.6

249
Table A6-7 Temperature histories – Panel Set 7
Date & time of spray: 05:35 hrs on 28/07/2014
Time (hrs) Temperature (°C)
7A 7B 7C 7D 7E
0.1 33.2 32.8 32.4 32.7 32.4
0.3 32.4 32.5 32.3 32.9 32.6
0.5 31.8 32.2 32.2 33.1 32.7
3.0 37.0 36.8 36.9 36.8 36.4
3.0 36.5 36.8 37.1 37.3 36.7
3.0 36.4 36.4 36.8 36.8 36.1
3.0 36.2 36.3 36.5 36.9 36.3
5.7 39.2 39.3 39.8 39.9 38.6
5.8 38.8 39.0 39.7 40.1 38.5
5.8 39.1 39.1 39.5 40.1 38.4
7.0 40.1 40.4 40.6 41.0 39.8
7.1 39.8 40.2 40.9 40.7 39.6
10.9 38.8 39.8 39.6 40.5 38.6
11.1 38.3 39.4 39.7 40.0 38.7
12.4 37.9 38.8 39.3 39.2 37.7
12.4 37.3 37.8 38.2 38.2 37.2
12.4 37.5 38.5 38.9 38.9 37.3
16.2 34.4 35.1 35.4 35.5 34.2
16.5 34.7 35.3 35.5 35.6 34.5
16.5 34.2 35.1 34.9 35.4 34.4
23.0 33.1 33.8 33.3 34.0 32.1
23.1 32.7 33.4 33.2 33.4 32.1
24.0 31.8 32.6 32.5 32.7 31.7
34.8 31.7 32.0 31.6 31.8 31.2
34.8 31.5 31.9 31.8 31.8 31.0
47.9 30.6 30.9 30.5 30.6 30.0

250
Table A6-8 Temperature histories – Panel Set 8
Date & time of spray: 05:40 hrs on 30/07/2014
Time (hrs) Temperature (°C)
8A 8B 8C 8D 8E
0.2 30.6 32.5 33.1 32.1 32.6
0.2 31.9 33.6 33.6 32.3 33.3
1.0 30.9 32.3 32.4 32.4 32.8
1.1 31.0 32.4 32.3 32.2 32.8
1.5 32.2 32.5 32.6 32.3 32.8
4.0 37.5 37.6 37.6 38.2 37.3
5.1 37.6 38.1 38.1 38.2 36.8
6.0 38.4 38.7 38.8 38.5 37.5
6.3 37.5 38.8 38.6 38.6 37.8
6.3 37.6 38.5 39.1 38.8 37.8
10.1 39.0 39.8 40.0 40.2 38.5
11.4 38.5 38.6 39.0 39.2 37.2
25.3 32.3 32.2 32.4 32.5 31.5
25.3 32.1 32.3 32.7 32.7 31.4
31.7 31.4 31.7 31.8 31.9 31.0
31.7 31.4 31.6 32.0 32.2 31.1

251
A7 Sprayed concrete – in-situ strengths and modelled
degree of hydration values of test panels
Table A7-1 Panel Set 1 – In-situ strength (fc,in-situ)
Testing
Method
1A 1B 1C 1D 1E
Age fc,in-situ fc,in-situ fc,in-situ fc,in-situ fc,in-situ
hrs MPa MPa MPa MPa MPa
Penetrometer
needle (Z1)
1.1 0.28 0.25 0.30 0.35 0.33
1.8 0.29 0.40 0.36 0.36 0.41
Standard stud-
driving (Z2)
4.2 2.41 2.85 2.04 3.50 3.85
8.4 10.27 10.43 10.30 9.79 8.97
12.2 13.97 13.70 15.98 15.99 13.47
25.2 25.43 20.72 20.03 17.28 19.87
Table A7-2 Panel Set 1 – Modelled degree of hydration (model)
1A 1B 1C 1D 1E
Age model model model model model
hrs - - - - -
1.1 0.079 0.077 0.077 0.078 0.078
1.8 0.086 0.084 0.084 0.084 0.084
4.2 0.106 0.104 0.104 0.104 0.104
8.4 0.172 0.170 0.169 0.170 0.170
12.2 0.253 0.254 0.256 0.259 0.255
25.2 0.430 0.433 0.443 0.447 0.437
Table A7-3 Panel Set 2 – In-situ strength (fc,in-situ)
Testing
Method
2A 2B 2C 2D 2E
Age fc,in-situ fc,in-situ fc,in-situ fc,in-situ fc,in-situ
hrs MPa MPa MPa MPa MPa
Penetrometer
needle (Z1)
0.3 0.32 0.23 0.26 0.29 0.28
0.5 0.34 0.29 0.34 0.31 0.32
1.0 0.41 0.34 0.36 0.36 0.39
Standard
stud-driving
(Z2)
5.5 8.23 9.26 7.70 9.13 8.04
12.5 15.60 15.16 20.20 17.17 17.08
25.0 18.44 19.54 19.81 19.69 17.41
Table A7-4 Panel Set 2 – Modelled degree of hydration (model)
2A 2B 2C 2D 2E
Age model model model model model
hrs - - - - -
0.3 0.061 0.060 0.061 0.061 0.061
0.5 0.074 0.074 0.074 0.074 0.074
1.0 0.084 0.084 0.084 0.084 0.084
5.5 0.147 0.147 0.148 0.151 0.148
12.5 0.335 0.345 0.348 0.366 0.359
25.0 0.479 0.484 0.489 0.504 0.499

252
Table A7-5 Panel Set 3 – In-situ strength (fc,in-situ)
Testing
Method
3A 3B 3C 3D 3E
Age fc,in-situ fc,in-situ fc,in-situ fc,in-situ fc,in-situ
hrs MPa MPa MPa MPa MPa
Penetrometer
needle (Z1)
0.4 0.23 0.31 0.27 0.26 0.27
1.0 0.28 0.31 0.34 0.36 0.36
1.6 0.35 0.34 0.33 0.37 0.38
Standard stud-
driving (Z2)
6.5 6.29 7.08 7.74 7.88 6.76
30.5 20.14 16.93 17.62 18.80 19.71
Table A7-6 Panel Set 3 – Modelled degree of hydration (model)
3A 3B 3C 3D 3E
Age model model model model model
hrs - - - - -
0.4 0.070 0.070 0.070 0.071 0.070
1.0 0.083 0.083 0.083 0.084 0.083
1.6 0.088 0.089 0.088 0.089 0.089
6.5 0.163 0.164 0.164 0.166 0.166
30.5 0.499 0.500 0.509 0.508 0.506
Table A7-7 Panel Set 4 – In-situ strength (fc,in-situ)
Testing
Method
4A 4B 4C 4D 4E
Age fc,in-situ fc,in-situ fc,in-situ fc,in-situ fc,in-situ
hrs MPa MPa MPa MPa MPa
Standard
stud-driving
(Z2)
4.0 4.14 3.96 3.67 3.85 4.07
7.0 8.21 9.45 10.40 9.98 11.28
18.0 15.48 18.06 17.62 18.63 18.13
Table A7-8 Panel Set 4 –Modelled degree of hydration (model)
4A 4B 4C 4D 4E
Age model model model model model
hrs - - - - -
4.0 0.110 0.111 0.111 0.111 0.111
7.0 0.167 0.171 0.175 0.174 0.176
18.0 0.412 0.428 0.441 0.434 0.442
Table A7-9 Panel Set 5 – In-situ compressive strength (fc,in-situ)
Testing
Method
5A 5B 5C 5D 5E
Age fc,in-situ Age fc,in-situ Age fc,in-situ Age fc,in-situ Age fc,in-situ
hrs MPa hrs MPa hrs MPa hrs MPa hrs MPa
Penetrometer
needle (Z1)
0.5 0.39 0.5 0.32 0.6 0.35 0.6 0.38 0.6 0.38
1.6 0.48 1.6 0.45 1.6 0.53 1.6 0.54 1.7 0.53
Standard
stud-driving
(Z2)
4.3 6.30 4.1 5.98 3.8 5.54 3.6 5.40 3.3 3.21
7.4 10.60 7.2 10.93 6.9 11.19 6.7 12.92 6.4 10.49
13.3 17.85 12.3 16.21 12.3 18.16 11.2 18.41

253
Table A7-10 Panel Set 5 – Modelled degree of hydration (model)
5A 5B 5C 5D 5E
Age model Age model Age model Age model Age model
hrs - hrs - hrs - hrs - hrs -
0.5 0.074 0.5 0.074 0.6 0.074 0.6 0.076 0.6 0.075
1.6 0.090 1.6 0.090 1.6 0.091 1.6 0.091 1.7 0.089
4.3 0.125 4.1 0.121 3.8 0.116 3.6 0.112 3.3 0.106
7.4 0.205 7.2 0.208 6.9 0.194 6.7 0.193 6.4 0.175
13.3 0.393 12.3 0.359 12.3 0.373 11.2 0.327
Table A7-11 Panel Set 6 – In-situ compressive strength (fc,in-situ)
Testing
method
6A 6B 6C 6D 6E
Age fc,in-situ Age fc,in-situ Age fc,in-situ Age fc,in-situ Age fc,in-situ
hrs MPa hrs MPa hrs MPa hrs MPa hrs MPa
Penetrometer
needle (Z1)
0.5 0.38 0.5 0.43 0.6 0.41 0.6 0.53 0.6 0.54
1.0 0.60 1.2 0.60 1.2 0.62 1.2 0.65 1.3 0.75
Standard
stud-driving
(Z2)
2.5 4.16 2.8 4.59 3.8 7.19 4.2 8.21 4.6 8.06
11.8 13.89 5.6 9.83 5.8 11.31 5.9 10.58 6.1 10.42
12.0 15.87 12.3 15.43 12.7 17.80 13.0 14.29
Table A7-12 Panel Set 6 – Modelled degree of hydration (model)
6A 6B 6C 6D 6E
Age model Age model Age model Age model Age model
hrs - hrs - hrs - hrs - hrs -
0.5 0.074 0.5 0.074 0.6 0.074 0.6 0.077 0.6 0.076
1.0 0.083 1.2 0.086 1.2 0.085 1.2 0.086 1.3 0.086
2.5 0.099 2.8 0.102 3.8 0.114 4.2 0.120 4.6 0.126
11.8 0.376 5.6 0.153 5.8 0.155 5.9 0.159 6.1 0.158
- - 12.0 0.374 12.3 0.376 12.7 0.381 13.0 0.381
Table A7-13 Panel Set 7 – In-situ compressive strength (fc,in-situ)
Testing
method
7A 7B 7C 7D 7E
Age fc,in-situ Age fc,in-situ Age fc,in-situ Age fc,in-situ Age fc,in-situ
hrs MPa hrs MPa hrs MPa hrs MPa hrs MPa
Standard
stud-driving
(Z2)
3.8 7.49 3.9 7.07 4.1 7.30 4.3 10.04 4.5 8.33
6.2 12.99 6.3 13.04 6.5 11.81 6.7 13.57 6.9 14.31
11.4 15.46 11.7 15.32 11.9 14.52 12.1 17.70 12.3 15.91
Special stud-
driving (Z3) 23.3 21.32 23.4 23.17 23.5 14.63 23.6 27.28 23.7 23.06

254
Table A7-14 Panel Set 7 – Modelled degree of hydration (model)
7A 7B 7C 7D 7E
Age model Age model Age model Age model Age model
hrs - hrs - hrs - hrs - hrs -
3.8 0.126 3.9 0.131 4.1 0.134 4.3 0.140 4.5 0.147
6.2 0.214 6.3 0.224 6.5 0.237 6.7 0.244 6.9 0.250
11.4 0.420 11.7 0.429 11.9 0.438 12.1 0.443 12.3 0.436
23.3 0.546 23.4 0.552 23.5 0.553 23.6 0.556 23.7 0.546
Table A7-15 Panel Set 8 – In-situ compressive strength (fc,in-situ)
Testing
method
8A 8B 8C 8D 8E
Age fc,in-situ Age fc,in-situ Age fc,in-situ Age fc,in-situ Age fc,in-situ
hrs MPa hrs MPa hrs MPa hrs MPa hrs MPa
Penetrometer
needle (Z1)
0.6 0.38 0.7 0.33 0.7 0.39 0.7 0.32 0.8 0.30
1.3 0.46 1.4 0.60 1.4 0.50 1.4 0.49 1.4 0.56
Standard stud-
driving (Z2)
4.4 8.02 5.3 9.44 5.6 10.59 5.9 10.17 6.1 9.54
10.4 16.29 10.7 14.93 10.9 15.44 11.2 12.82 11.4 14.64
Special stud-
driving (Z3) 25.5 26.49 25.8 26.92 26.0 28.18 26.4 30.12 26.8 27.13
Table A7-16 Panel Set 8 – Modelled degree of hydration (model)
8A 8B 8C 8D 8E
Age model Age model Age model Age model Age model
hrs - hrs - hrs - hrs - hrs -
0.6 0.077 0.7 0.077 0.7 0.077 0.7 0.079 0.8 0.079
1.3 0.088 1.4 0.088 1.4 0.088 1.4 0.088 1.4 0.089
4.4 0.142 5.3 0.170 5.6 0.182 5.9 0.201 6.1 0.200
10.4 0.384 10.7 0.396 10.9 0.406 11.2 0.413 11.4 0.407
25.5 0.560 25.8 0.564 26.0 0.567 26.4 0.571 26.8 0.561

255
A8 Sprayed concrete – modelled panel strengths
Figure A8-1 Strength modelling – Panel Set 2
Figure A8-2 Strength modelling – Panel Set 3

256
Figure A8-3 Strength modelling – Panel Set 4
Figure A8-4 Strength modelling – Panel Set 5

257
Figure A8-5 Strength modelling – Panel Set 6
Figure A8-6 Strength modelling – Panel Set 7

258
Figure A8-7 Strength modelling – Panel Set 8

259
A9 Sprayed concrete – lining temperature histories
Table A9-1 Temperature histories – Lining Section 1
Time (hrs) Temperature (°C)
Left shoulder Crown Right Shoulder
0.3 33.9 33.2 33.0
7.5 34.8 35.4 32.1
12.5 43.3 45.9 43.7
14.4 45.3 46.7 41.2
24.9 42.1 45.1 43.6
31.9 33.8 35.2 36.7
41.0 31.2 32.5 31.2
42.6 29.4 31.0 29.6
50.3 29.1 30.7 30.5
Table A9-2 Temperature histories – Lining Section 2
Time (hrs) Temperature (°C)
Left shoulder Crown Right Shoulder
0.2 28.4 28.6 27.7
1.4 28.8 28.8 27.7
8.1 35.1 38.2 35.7
8.5 38.8 39.1 36.5
8.7 39.3 38.5 38.4
11.9 41.7 40.4 39.8
31.5 35.4 34.8 34.0
32.1 35.1 34.3 34.5
32.2 35.0 33.1 33.6
32.4 34.1 32.9 33.5
32.4 33.9 32.5 33.4
32.5 34.5 33.1 33.7
51.4 29.7 29.1 28.5
51.4 29.7 29.0 28.6

260
Table A9-3 Temperature histories – Lining Section 3
Time (hrs) Temperature (°C)
Left shoulder Crown Right Shoulder
0.1 28.2 28.6 28.8
0.1 29.4 29.8 28.7
1.0 28.4 29.8 26.9
2.2 28.4 30.8 27.9
2.2 29.7 31.1 28.1
3.7 33.4 33.3 31.0
4.2 31.6 30.4 30.2
4.9 32.7 31.6 31.7
7.7 33.9 32.9 32.7
18.0 33.0 32.6 34.4
19.6 33.8 32.7 32.6
28.5 33.0 32.7 31.7
41.7 29.2 29.6 29.0
Table A9-4 Temperature histories – Lining Section 4
Time (hrs) Temperature (°C)
Left shoulder Crown Right Shoulder
0.3 32.7 32.3 30.7
0.4 32.2 31.6 29.9
0.4 31.9 31.6 30.0
0.7 31.6 30.5 30.0
3.1 34.6 35.4 34.6
3.8 34.7 34.6 32.8
4.6 33.2 34.7 34.6
6.1 35.2 39.2 35.9
13.8 35.1 41.1 34.9
23.4 35.4 36.0 35.1
26.0 36.9 38.5 37.6
33.8 33.6 34.3 32.4
34.4 34.6 35.8 32.6
37.4 33.3 34.6 32.6
39.7 33.2 34.2 32.6
45.4 35.8 37.1 35.8
53.8 39.9 38.3 35.7
60.2 37.8 36.1 34.2
68.6 39.8 37.3 36.3

261
Table A9-5 Temperature histories – Lining Section 5
Time (hrs) Temperature (°C)
Left shoulder Crown Right Shoulder
0.2 30.5 30.6 29.6
0.4 31.3 35.0 32.1
0.7 30.5 34.5 29.5
2.6 35.0 36.5 32.8
3.7 33.7 36.5 31.8
6.0 34.8 38.6 33.9
6.0 34.9 38.3 34.4
11.8 37.2 39.4 37.7
12.4 37.8 39.7 39.0
13.8 38.6 38.6 39.2
19.9 36.7 38.6 35.9
26.6 36.7 36.2 36.8
35.0 39.6 39.7 40.3
35.1 39.9 40.1 40.1
Table A9-6 Temperature histories – Lining Section 6
Time (hrs) Temperature (°C)
Left shoulder Crown Right Shoulder
0.6 29.6 29.2 28.7
3.1 34.9 37.1 31.2
4.7 34.9 36.4 30.6
5.9 38.5 39.0 36.4
7.2 38.9 41.8 35.7
11.1 40.8 40.4 35.1
16.5 34.9 36.2 35.4
24.0 37.5 38.4 32.4
35.4 37.2 38.9 35.8
48.4 35.6 36.2 33.1
50.2 33.4 34.5 33.3
53.3 34.5 35.7 33.0
55.5 35.3 35.2 32.3
59.2 35.3 36.3 34.1
60.9 34.8 36.7 33.3
74.5 38.7 39.7 33.8
76.0 35.4 36.1 32.3
81.0 34.6 36.7 33.0

262
Table A9-7 Temperature histories – Lining Section 7
Time (hrs) Temperature (°C)
Left shoulder Crown Right Shoulder
0.2 31.0 32.1 31.0
0.9 31.2 31.8 31.1
1.1 30.8 33.3 32.2
4.3 37.6 40.3 38.1
6.4 39.7 40.6 39.1
10.1 39.9 39.8 39.9
11.8 40.1 41.2 39.7
26.7 38.2 39.5 38.8
27.0 38.2 39.5 38.8
32.0 38.6 39.4 37.9

263
A10 Sprayed concrete – modelled lining strengths
Figure A10-1 Strength modelling – Section 1 (corresponding to Panel Set 2)
Figure A10-2 Strength modelling – Section 2 (corresponding to Panel Set 3)

264
Figure A10-3 Strength modelling – Section 3 (corresponding to Panel Set 4)
Figure A10-4 Strength modelling – Section 5 (corresponding to Panel Set 6)

265
Figure A10-5 Strength modelling – Section 6 (corresponding to Panel Set 7)
Figure A10-6 Strength modelling – Section 7 (corresponding to Panel Set 8)


267
Appendix B Bond Street station upgrade
B1 Cement pastes – isothermal calorimetric data
Figure B1-1 Rate of heat release histories – BS1P paste
Figure B1-2 Heat of hydration histories – BS1P paste

268
Figure B1-3 Rate of heat release histories – BS2P paste
Figure B1-4 Heat of hydration histories – BS2P paste

269
Figure B1-5 Rate of heat release histories – BS3P paste
Figure B1-6 Heat of hydration histories – BS3P paste

270
Figure B1-7 Rate of heat release histories – BS4P paste
Figure B1-8 Heat of hydration histories – BS4P paste

271
Figure B1-9 Rate of heat release histories – BS1M paste
Figure B1-10 Heat of hydration histories – BS1M paste

272
Figure B1-11 Rate of heat release histories – BS2M paste
Figure B1-12 Heat of hydration histories – BS2M paste

273
Figure B1-13 Rate of heat release histories – BS3M paste
Figure B1-14 Heat of hydration histories – BS3M paste

274
Figure B1-15 Rate of heat release histories – BS4M paste
Figure B1-16 Heat of hydration histories – BS4M paste

275
B2 Cement pastes – thermogravimetric weight loss profiles
Figure B2-1 Thermogravimetric weight loss profiles for BS1P paste at 10°C
Figure B2-2 Thermogravimetric weight loss profiles for BS1P paste at 30°C

276
Figure B2-3 Thermogravimetric weight loss profiles for BS1P paste at 40°C
Figure B2-4 Thermogravimetric weight loss profiles for BS2P paste at 10°C

277
Figure B2-5 Thermogravimetric weight loss profiles for BS2P paste at 30°C
Figure B2-6 Thermogravimetric weight loss profiles for BS2P paste at 40°C

278
Figure B2-7 Thermogravimetric weight loss profiles for BS3P paste at 10°C
Figure B2-8 Thermogravimetric weight loss profiles for BS3P paste at 30°C

279
Figure B2-9 Thermogravimetric weight loss profiles for BS3P paste at 40°C
Figure B2-10 Thermogravimetric weight loss profiles for BS4P paste at 10°C

280
Figure B2-11 Thermogravimetric weight loss profiles for BS4P paste at 30°C
Figure B2-12 Thermogravimetric weight loss profiles for BS4P paste at 40°C

281
Figure B2-13 Thermogravimetric weight loss profiles for BS1M paste at 10°C
Figure B2-14 Thermogravimetric weight loss profiles for BS1M paste at 30°C

282
Figure B2-15 Thermogravimetric weight loss profiles for BS1M paste at 40°C
Figure B2-16 Thermogravimetric weight loss profiles for BS2M paste at 10°C

283
Figure B2-17 Thermogravimetric weight loss profiles for BS2M paste at 30°C
Figure B2-18 Thermogravimetric weight loss profiles for BS2M paste at 40°C

284
Figure B2-19 Thermogravimetric weight loss profiles for BS3M paste at 10°C
Figure B2-20 Thermogravimetric weight loss profiles for BS3M paste at 30°C

285
Figure B2-21 Thermogravimetric weight loss profiles for BS3M paste at 40°C
Figure B2-22 Thermogravimetric weight loss profiles for BS4M paste at 10°C

286
Figure B2-23 Thermogravimetric weight loss profiles for BS4M paste at 30°C
Figure B2-24 Thermogravimetric weight loss profiles for BS4M paste at 40°C

287
B3 Cement pastes – thermogravimetric degree of
hydration estimates
Table B3-1 Thermogravimetric degree of hydration estimates for BS1P paste
10°C 20°C 30°C 40°C
Age Age Age Age
hrs - hrs - hrs - hrs -
1.8 0.032 2.5 0.045 1.1 0.034 0.9 0.034
16.9 0.185 8.1 0.164 5.1 0.167 3.7 0.157
69.0 0.500 48.0 0.516 71.0 0.637 27.4 0.615
300.0 0.699 168.0 0.622 194.0 0.693 92.0 0.681
Table B3-2 Thermogravimetric degree of hydration () estimates for BS2P paste
10°C 20°C 30°C 40°C
Age Age Age Age
hrs - hrs - hrs - hrs -
1.8 0.053 2.6 0.064 0.9 0.048 1.1 0.054
16.0 0.199 7.6 0.176 4.9 0.169 3.7 0.182
69.5 0.507 50.5 0.536 71.8 0.624 30.5 0.588
336.0 0.645 171.0 0.640 197.0 0.701 96.0 0.648
Table B3-3 Thermogravimetric degree of hydration estimates for BS3P paste
10°C 20°C 30°C 40°C
Age Age Age Age
hrs - hrs - hrs - hrs -
2.5 0.046 2.4 0.064 1.2 0.071 0.8 0.051
16.5 0.209 7.5 0.163 5.0 0.193 3.6 0.187
70.4 0.494 53.5 0.541 72.0 0.607 29.6 0.588
336.0 0.593 197.0 0.610 199.0 0.681 76.0 0.638
Table B3-4 Thermogravimetric degree of hydration estimates for BS4P paste
10°C 20°C 30°C 40°C
Age Age Age Age
hrs - hrs - hrs - hrs -
1.9 0.045 2.5 0.047 1.2 0.055 1.0 0.046
15.8 0.185 7.5 0.148 4.8 0.174 3.6 0.176
25.0 0.308 53.0 0.554 71.0 0.597 28.5 0.605
66.0 0.460 217.0 0.613 215.0 0.659 70.0 0.662
336.0 0.615

288
Table B3-5 Thermogravimetric degree of hydration estimates for BS1M paste
10°C 20°C 30°C 40°C
Age Age Age Age
hrs - hrs - hrs - hrs -
5.5 0.124 4.0 0.121 2.4 0.124 1.8 0.110
22.0 0.250 9.1 0.232 5.5 0.226 4.5 0.291
71.5 0.485 25.0 0.426 23.5 0.498 28.3 0.671
592.0 0.692 52.5 0.543 71.0 0.657 96.0 0.711
214.0 0.685
Table B3-6 Thermogravimetric degree of hydration estimates for BS2M paste
10°C 20°C 30°C 40°C
Age Age Age Age
hrs - hrs - hrs - hrs -
5.5 0.103 3.2 0.099 2.4 0.121 1.8 0.112
19.5 0.215 8.2 0.195 5.5 0.222 4.5 0.268
71.0 0.440 23.0 0.414 23.0 0.510 32.5 0.607
400.0 0.609 53.5 0.538 73.5 0.621 97.0 0.649
595.0 0.653 217.0 0.706 126.5 0.660
Table B3-7 Thermogravimetric degree of hydration estimates for BS3M paste
10°C 20°C 30°C 40°C
Age Age Age Age
hrs - hrs - hrs - hrs -
5.4 0.154 3.1 0.130 2.3 0.133 1.7 0.140
20.6 0.306 8.1 0.245 5.4 0.234 4.3 0.254
72.0 0.509 24.0 0.462 23.2 0.536 32.5 0.618
456.0 0.689 54.5 0.545 75.5 0.604 96.0 0.665
595.0 0.696 220.0 0.640
Table B3-8 Thermogravimetric degree of hydration estimates for BS4M paste
10°C 20°C 30°C 40°C
Age Age Age Age
hrs - hrs - hrs - hrs -
4.8 0.031 2.9 0.160 2.5 0.143 1.7 0.134
17.0 0.053 8.2 0.235 5.7 0.260 4.3 0.269
28.0 0.076 24.5 0.475 24.0 0.545 28.0 0.632
73.0 0.109 53.7 0.566 73.5 0.674 96.0 0.712
430.0 0.142 236.0 0.708

289
B4 Cement pastes – measured heat of hydration
Table B4-1 Measured heat of hydration values – BS1P paste
10°C 20°C 30°C 40°C
Age Q Age Q Age Q Age Q
hrs J/g hrs J/g hrs J/g hrs J/g
1.8 31.7 2.5 22.8 1.1 12.7 0.9 4.9
16.9 114.0 8.1 79.1 5.1 72.1 3.7 69.6
69.0 270.3 48.0 279.4 71.0 321.9 27.4 297.7
300.0 355.2 168.0 341.8 194.0 334.4 92.0 318.3
Table B4-2 Measured heat of hydration values – BS2P paste
10°C 20°C 30°C 40°C
Age Q Age Q Age Q Age Q
hrs J/g hrs J/g hrs J/g hrs J/g
1.8 32.1 2.6 24.9 0.9 11.9 1.1 4.8
16.0 111.7 7.6 78.1 4.9 71.1 3.7 74.4
69.5 275.7 50.5 291.8 71.8 326.8 30.5 306.1
336.0 354.2 171.0 349.1 197.0 345.8 96.0 323.3
Table B4-3 Measured heat of hydration values – BS3P paste
10°C 20°C 30°C 40°C
Age Q Age Q Age Q Age Q
hrs J/g hrs J/g hrs J/g hrs J/g
2.5 33.6 2.4 26.0 1.2 13.8 0.8 4.1
16.5 113.7 7.5 77.3 5.0 74.1 3.6 68.6
70.4 272.9 53.5 292.4 72.0 318.2 29.6 298.2
336.0 349.7 197.0 344.0 199.0 332.0 76.0 318.4
Table B4-4 Measured heat of hydration values – BS4P paste
10°C 20°C 30°C 40°C
Age Q Age Q Age Q Age Q
hrs J/g hrs J/g hrs J/g hrs J/g
1.9 34.3 2.5 27.1 1.2 13.1 1.0 0.3.4
15.8 115.2 7.5 80.9 4.8 73.8 3.6 74.8
25.0 175.6 53.0 295.2 71.0 322.7 28.5 305.8
66.0 273.3 217.0 351.4 215.0 343.6 70.0 337.0
336.0 354.6

290
Table B4-5 Measured heat of hydration values – BS1M paste
10°C 20°C 30°C 40°C
Age Q Age Q Age Q Age Q
hrs J/g hrs J/g hrs J/g hrs J/g
5.5 91.2 4.0 76.5 2.4 56.3 1.8 52.5
22.0 160.0 9.1 128.7 5.5 105.5 4.5 132.2
71.5 298.3 25.0 250.8 23.5 276.9 28.3 338.9
592.0 424.1 52.5 316.6 71.0 356.9 96.0 367.1
214.0 392.8
Table B4-6 Measured heat of hydration values – BS2M paste
10°C 20°C 30°C 40°C
Age Q Age Q Age Q Age Q
hrs J/g hrs J/g hrs J/g hrs J/g
5.5 90.1 3.2 75.1 2.4 58.0 1.8 51.9
19.5 166.5 8.2 125.5 5.5 116.4 4.5 134.6
71.0 313.0 23.0 253.7 23.0 286.8 32.5 353.9
400.0 419.8 53.5 329.5 73.5 366.7 97.0 380.8
595.0 429.6 217.0 401.1 126.5 381.9
Table B4-7 Measure heat of hydration values – BS3M paste
10°C 20°C 30°C 40°C
Age Q Age Q Age Q Age Q
hrs J/g hrs J/g hrs J/g hrs J/g
5.4 89.2 3.1 74.7 2.3 55.7 1.7 49.4
20.6 180.4 8.1 127.1 5.4 118.7 4.3 130.9
72.0 309.7 24.0 256.0 23.2 284.0 32.5 334.5
456.0 416.6 54.5 326.9 75.5 357.7 96.0 364.14
595.0 424.9 220.0 396.1
Table B4-8 Measured heat of hydration values – BS4M paste
10°C 20°C 30°C 40°C
Age Q Age Q Age Q Age Q
hrs J/g hrs J/g hrs J/g hrs J/g
4.8 91.0 2.9 73.8 2.5 62.0 1.7 49.6
17.0 158.8 8.2 128.9 5.7 129.2 4.3 135.0
28.0 228.8 24.5 260.5 24.0 295.8 28.0 332.4
73.0 312.7 53.7 329.2 73.5 371.2 96.0 379.7
430.0 411.7 236.0 403.4

291
B5 Cement pastes – degree of hydration development
histories
Figure B5-1 Degree of hydration development history of BS1P paste at 10°C
Figure B5-2 Degree of hydration development history of BS1P paste at 30°C

292
Figure B5-3 Degree of hydration development history of BS1P paste at 40°C
Figure B5-4 Degree of hydration development history of BS2P paste at 10°C

293
Figure B5-5 Degree of hydration development history of BS2P paste at 30°C
Figure B5-6 Degree of hydration development history of BS2P paste at 40°C

294
Figure B5-7 Degree of hydration development history of BS3P paste at 10°C
Figure B5-8 Degree of hydration development history of BS3P paste at 30°C

295
Figure B5-9 Degree of hydration development history of BS3P paste at 40°C
Figure B5-10 Degree of hydration development history of BS4P paste at 10°C

296
Figure B5-11 Degree of hydration development history of BS4P paste at 30°C
Figure B5-12 Degree of hydration development history of BS4P paste at 40°C

297
Figure B5-13 Degree of hydration development history of BS1M paste at 10°C
Figure B5-14 Degree of hydration development history of BS1M paste at 30°C

298
Figure B5-15 Degree of hydration development history of BS1M paste at 40°C
Figure B5-16 Degree of hydration development history of BS2M paste at 10°C

299
Figure B5-17 Degree of hydration development history of BS2M paste at 30°C
Figure B5-18 Degree of hydration development history of BS2M paste at 40°C

300
Figure B5-19 Degree of hydration development history of BS3M paste at 10°C
Figure B5-20 Degree of hydration development history of BS3M paste at 30°C

301
Figure B5-21 Degree of hydration development history of BS3M paste at 40°C
Figure B5-22 Degree of hydration development history of BS4M paste at 10°C
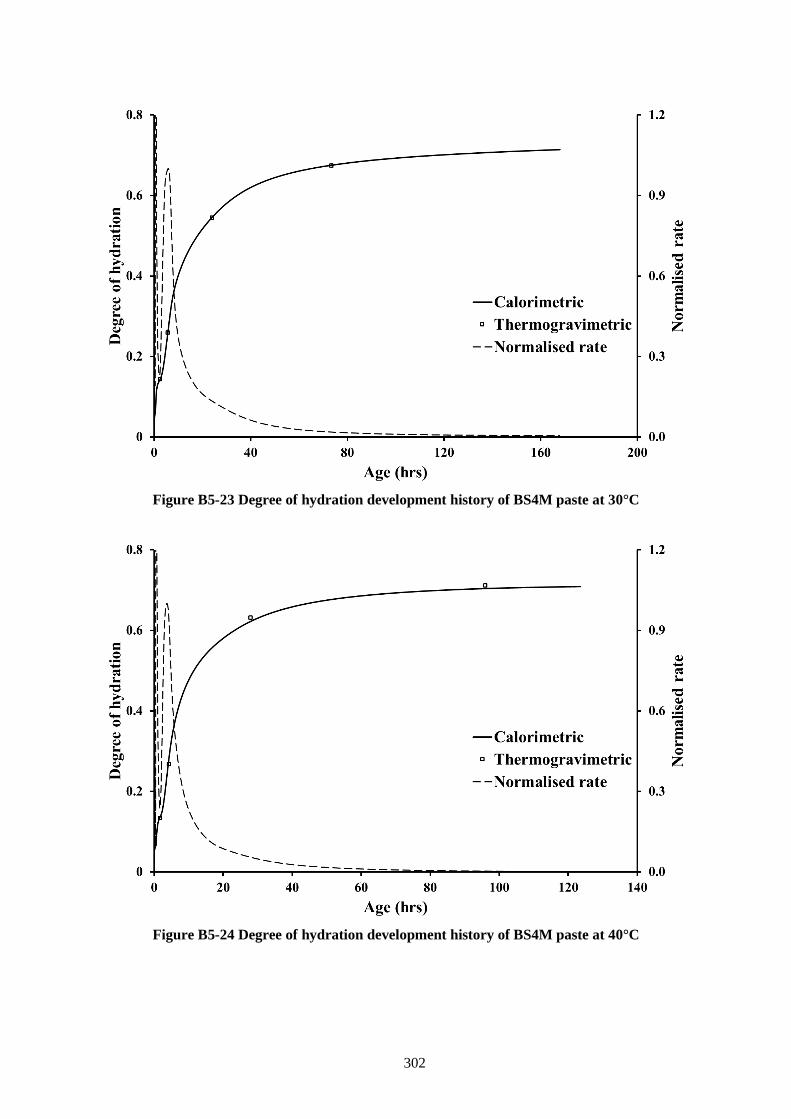
302
Figure B5-23 Degree of hydration development history of BS4M paste at 30°C
Figure B5-24 Degree of hydration development history of BS4M paste at 40°C

303
B6 Cement pastes – normalised kinetics characteristics
Table B6-1 Normalised kinetics characteristics – BS1P paste
10°C 20°C 30°C 40°C Average
Nk Nk Nk Nk Nk
initial 0.020 2.30 0.014 1.03 0.026 0.97 0.029 0.16 0.022 1.03
dormant 0.031 0.25 0.024 0.16 0.037 0.14 0.036 0.06 0.032 0.16
peak 0.180 1.00 0.167 1.00 0.162 1.00 0.162 1.00 0.168 1.00
0.1 0.100 0.87 0.100 0.89 0.100 0.80 0.100 0.81 0.100 0.84
0.2 0.200 0.98 0.200 0.95 0.200 0.95 0.200 0.96 0.200 0.96
0.3 0.300 0.72 0.300 0.64 0.300 0.67 0.300 0.71 0.300 0.68
0.4 0.400 0.38 0.400 0.33 0.400 0.36 0.400 0.38 0.400 0.36
0.5 0.500 0.17 0.500 0.17 0.500 0.17 0.500 0.16 0.500 0.17
0.6 0.600 0.07 0.600 0.06 0.600 0.07 0.600 0.06 0.600 0.07
Table B6-2 Normalised kinetics characteristics – BS2P paste
10°C 20°C 30°C 40°C Average
Nk Nk Nk Nk Nk
initial 0.039 3.58 0.037 1.59 0.051 0.58 0.042 0.14 0.022 1.47
dormant 0.054 0.24 0.050 0.17 0.061 0.13 0.049 0.09 0.032 0.16
peak 0.196 1.00 0.180 1.00 0.176 1.00 0.167 1.00 0.168 1.00
0.1 0.100 0.80 0.100 0.79 0.100 0.66 0.100 0.86 0.100 0.78
0.2 0.200 1.00 0.200 0.98 0.200 0.98 0.200 0.94 0.200 0.97
0.3 0.300 0.75 0.300 0.68 0.300 0.70 0.300 0.69 0.300 0.70
0.4 0.400 0.38 0.400 0.34 0.400 0.35 0.400 0.36 0.400 0.36
0.5 0.500 0.15 0.500 0.16 0.500 0.16 0.500 0.15 0.500 0.16
0.6 0.600 0.04 0.600 0.05 0.600 0.05 0.600 0.05 0.600 0.05

304
Table B6-3 Normalised kinetics characteristics – BS3P paste
10°C 20°C 30°C 40°C Average
Nk Nk Nk Nk Nk
initial 0.041 1.56 0.042 1.84 0.059 0.88 0.047 0.07 0.022 1.09
dormant 0.049 0.24 0.057 0.18 0.073 0.14 0.056 0.10 0.032 0.16
peak 0.193 1.00 0.186 1.00 0.187 1.00 0.172 1.00 0.168 1.00
0.1 0.100 0.84 0.100 0.75 0.100 0.55 0.100 0.66 0.100 0.70
0.2 0.200 1.00 0.200 0.99 0.200 0.99 0.200 0.98 0.200 0.99
0.3 0.300 0.72 0.300 0.67 0.300 0.71 0.300 0.70 0.300 0.70
0.4 0.400 0.34 0.400 0.32 0.400 0.40 0.400 0.35 0.400 0.35
0.5 0.500 0.15 0.500 0.16 0.500 0.16 0.500 0.14 0.500 0.15
0.6 0.600 0.03 0.600 0.04 0.600 0.04 0.600 0.03 0.600 0.03
Table B6-4 Normalised kinetics characteristics – BS4P paste
10°C 20°C 30°C 40°C Average
Nk Nk Nk Nk Nk
initial 0.029 1.64 0.029 1.24 0.041 0.58 0.042 0.09 0.022 0.89
dormant 0.038 0.24 0.040 0.18 0.051 0.14 0.049 0.10 0.032 0.17
peak 0.173 1.00 0.167 1.00 0.165 1.00 0.165 1.00 0.168 1.00
0.1 0.100 0.90 0.100 0.87 0.100 0.76 0.100 0.74 0.100 0.82
0.2 0.200 0.97 0.200 0.95 0.200 0.95 0.200 0.96 0.200 0.96
0.3 0.300 0.68 0.300 0.63 0.300 0.65 0.300 0.69 0.300 0.66
0.4 0.400 0.29 0.400 0.27 0.400 0.28 0.400 0.32 0.400 0.29
0.5 0.500 0.13 0.500 0.14 0.500 0.14 0.500 0.13 0.500 0.13
0.6 0.600 0.02 0.600 0.03 0.600 0.02 0.600 0.03 0.600 0.03
Table B6-5 Normalised kinetics characteristics – BS1M paste
10°C 20°C 30°C 40°C Average
Nk Nk Nk Nk Nk
initial 0.066 9.06 0.070 5.86 0.071 3.36 0.067 2.02 0.022 5.07
dormant 0.121 0.34 0.123 0.26 0.126 0.20 0.123 0.20 0.032 0.25
peak 0.256 1.00 0.222 1.00 0.209 1.00 0.243 1.00 0.168 1.00
0.1 0.100 1.08 0.100 1.36 0.100 1.41 0.100 0.90 0.100 1.19
0.2 0.200 0.87 0.200 0.98 0.200 1.00 0.200 0.98 0.200 0.96
0.3 0.300 0.90 0.300 0.88 0.300 0.30 0.300 0.86 0.300 0.74
0.4 0.400 0.36 0.400 0.34 0.400 0.36 0.400 0.38 0.400 0.36
0.5 0.500 0.18 0.500 0.17 0.500 0.17 0.500 0.19 0.500 0.18
0.6 0.600 0.08 0.600 0.07 0.600 0.08 0.600 0.09 0.600 0.08

305
Table B6-6 Normalised kinetics characteristics – BS2M paste
10°C 20°C 30°C 40°C Average
Nk Nk Nk Nk Nk
initial 0.063 8.07 0.067 5.25 0.065 2.87 0.062 1.84 0.022 4.51
dormant 0.148 0.27 0.119 0.24 0.118 0.20 0.111 0.20 0.032 0.23
peak 0.285 1.00 0.226 1.00 0.224 1.00 0.226 1.00 0.168 1.00
0.1 0.100 0.62 0.100 1.08 0.100 0.83 0.100 0.39 0.100 0.73
0.2 0.200 0.93 0.200 0.98 0.200 0.99 0.200 0.99 0.200 0.98
0.3 0.300 0.79 0.300 0.86 0.300 0.84 0.300 0.70 0.300 0.80
0.4 0.400 0.30 0.400 0.29 0.400 0.29 0.400 0.33 0.400 0.30
0.5 0.500 0.15 0.500 0.15 0.500 0.15 0.500 0.16 0.500 0.15
0.6 0.600 0.06 0.600 0.05 0.600 0.05 0.600 0.06 0.600 0.06
Table B6-7 Normalised kinetics characteristics – BS3M paste
10°C 20°C 30°C 40°C Average
Nk Nk Nk Nk Nk
initial 0.084 10.36 0.081 5.28 0.084 2.86 0.086 1.88 0.022 5.09
dormant 0.144 0.27 0.143 0.26 0.135 0.23 0.081 0.23 0.032 0.25
peak 0.275 1.00 0.251 1.00 0.224 1.00 0.173 1.00 0.168 1.00
0.1 0.100 6.21 0.100 4.32 0.100 2.15 0.100 1.88 0.100 3.64
0.2 0.200 0.82 0.200 0.91 0.200 0.98 0.200 0.95 0.200 0.92
0.3 0.300 0.96 0.300 0.94 0.300 0.89 0.300 0.89 0.300 0.92
0.4 0.400 0.33 0.400 0.31 0.400 0.31 0.400 0.40 0.400 0.34
0.5 0.500 0.15 0.500 0.15 0.500 0.14 0.500 0.15 0.500 0.15
0.6 0.600 0.06 0.600 0.05 0.600 0.04 0.600 0.05 0.600 0.05
Table B6-8 Normalised kinetics characteristics – BS4M paste
10°C 20°C 30°C 40°C Average
Nk Nk Nk Nk Nk
initial 0.087 9.52 0.086 5.13 0.082 2.81 0.075 1.85 0.022 4.83
dormant 0.147 0.29 0.145 0.25 0.141 0.23 0.137 0.24 0.032 0.25
peak 0.280 1.00 0.271 1.00 0.270 1.00 0.242 1.00 0.168 1.00
0.1 0.100 6.27 0.100 4.22 0.100 2.24 0.100 1.34 0.100 3.52
0.2 0.200 0.80 0.200 0.87 0.200 0.92 0.200 0.95 0.200 0.89
0.3 0.300 0.99 0.300 0.30 0.300 0.96 0.300 0.87 0.300 0.78
0.4 0.400 0.40 0.400 0.39 0.400 0.38 0.400 0.43 0.400 0.40
0.5 0.500 0.17 0.500 0.17 0.500 0.18 0.500 0.19 0.500 0.18
0.6 0.600 0.08 0.600 0.08 0.600 0.08 0.600 0.07 0.600 0.08


307
B7 Sprayed concrete – strength histories of calibration test
panel
Table B7-1 Calibration strength testing – Panel Set 1
Testing
method
1A 1B 1C 1D
Age Strength Age Strength Age Strength Age Strength
hrs MPa hrs MPa hrs MPa hrs MPa
Penetrometer
needle
0.42 0.00 0.33 0.28 0.28 0.21 0.20 0.19
0.58 0.20 0.53 0.45 0.40 0.32 0.35 0.29
0.92 0.36 0.83 0.62 0.62 0.44 0.50 0.39
1.25 0.41 1.13 0.64 0.95 0.56 0.83 0.50
Standard stud-
driving
4.5 3.9 3.7 4.0 4.0 3.7
12.5 12.2 6.5 8.6 6.8 11.5
Special stud-
driving
23.5 24.3 12.5 21.3 12.5 19.5 23.7 22.1 23.8 23.3
In-situ cores
26.4 31.2
28.4 35.1
50.3 35.4 50.5 37.4
648 65.9 648 66.2
Table B7-2 Calibration strength testing – Panel Set 2
Testing
method
2A 2B 2C 2D
Age Strength Age Strength Age Strength Age Strength
hrs MPa hrs MPa hrs MPa hrs MPa
Penetrometer
needle
0.33 0.22 0.25 0.21 0.25 0.22 0.17 0.19
0.50 0.31 0.42 0.29 0.50 0.29 0.50 0.31
1.00 0.52 1.00 0.47 1.00 0.45 1.00 0.51
Standard stud-
driving
3.4 2.4 3.7 2.9 3.9 2.5
5.8 7.8 6.0 10.3
Special stud-
driving
12.2 18.8 12.2 22.4 12.2 21.3
23.2 32.6 23.3 35.3 24.7 35.2
In-situ cores
30.8 35.9 29.4 37.3
51.6 41.1 52.8 38.7
1032 55.3 1032 57.7

308
Table B7-3 Calibration strength testing – Panel Set 3
Testing
method
3A 3B 3C 3D
Age Strength Age Strength Age Strength Age Strength
hrs MPa hrs MPa hrs MPa hrs MPa
Penetrometer
needle
0.55 0.42 0.57 0.37 0.58 0.32 0.67 0.38
0.83 0.54 0.92 0.44 0.75 0.40 0.92 0.39
1.42 0.59 1.42 0.57 1.37 0.56 1.33 0.51
Standard stud-
driving
2.9 2.7 3.1 2.6 3.3 3.4
6.6 13.1 6.8 13.6
Special stud-
driving
12.3 25.6 12.4 28.7 12.6 26.9
24.8 32.5 25.0 33.8 25.3 28.2
In-situ cores 30.0 41.6 29.8 39.1

309
B8 Sprayed concrete – temperature histories of calibration
test panel
Table B8-1 Temperature histories – Panel Set 1
1A 1B 1C 1D
Age Temperature Age Temperature Age Temperature Age Temperature
hrs °C hrs °C hrs °C hrs °C
0.0 21.9 0.0 22.0 0.0 21.9 0.1 25.4
0.1 22.7 0.1 22.6 0.2 22.6 0.3 24.3
0.2 21.9 0.1 23.3 0.3 22.4 0.4 24.2
0.2 21.2 0.2 24.1 0.3 22.1 0.4 23.7
0.3 22.6 0.3 23.6 0.4 20.1 0.4 23.7
0.4 22.7 0.4 23.6 0.5 23.0 0.7 23.7
0.5 21.4 0.5 21.4 0.8 22.6 1.0 24.0
0.6 23.7 0.6 23.6 1.0 22.4 1.4 23.4
0.7 22.7 0.9 23.8 1.3 22.8 1.6 23.1
0.9 23.0 1.0 23.9 1.4 22.9 3.0 22.9
1.0 22.7 1.1 23.2 1.6 23.2 3.4 23.7
1.2 22.7 1.4 22.9 3.0 23.0 4.1 26.2
1.4 22.6 1.5 22.8 3.4 24.3 4.7 30.2
1.6 22.4 1.8 23.0 4.2 26.3 6.5 35.0
1.8 22.0 3.2 23.2 4.8 30.0 7.4 34.5
3.2 23.2 3.6 23.9 6.6 34.1 7.9 34.6
3.6 22.9 4.3 25.4 7.4 33.6 9.0 34.7
4.3 24.3 4.9 28.3 7.9 33.5 10.2 34.9
5.0 27.1 6.7 33.1 9.1 33.6 11.1 34.4
6.8 31.8 7.5 32.9 10.2 33.4 11.9 33.9
7.5 31.7 8.0 32.3 11.2 33.7 19.6 30.7
8.1 31.9 9.2 33.7 12.0 33.0 22.3 28.6
9.3 33.2 10.3 32.7 19.6 30.6 26.5 21.7
10.4 33.4 11.3 33.5 22.3 29.7 32.0 20.6
11.3 33.9 12.1 33.4 24.2 28.2 33.0 20.6
12.1 34.1 19.8 31.5 26.6 24.3 33.8 20.7
19.8 31.8 22.4 29.6 32.1 24.4 36.9 20.7
22.5 29.9 24.3 29.3 33.0 24.0 43.4 20.1
24.4 29.2 26.7 24.9 33.9 24.1 46.2 19.9
26.7 26.2 32.2 25.2 36.9 23.4 48.0 19.3
32.2 24.7 33.1 24.9 43.4 22.1 60.8 16.4
33.2 24.0 34.0 24.7 46.2 21.4 69.1 17.9
34.0 23.7 37.1 23.7 48.0 20.6 77.2 17.7
37.1 23.5 43.5 22.4 60.8 19.1 81.0 19.1
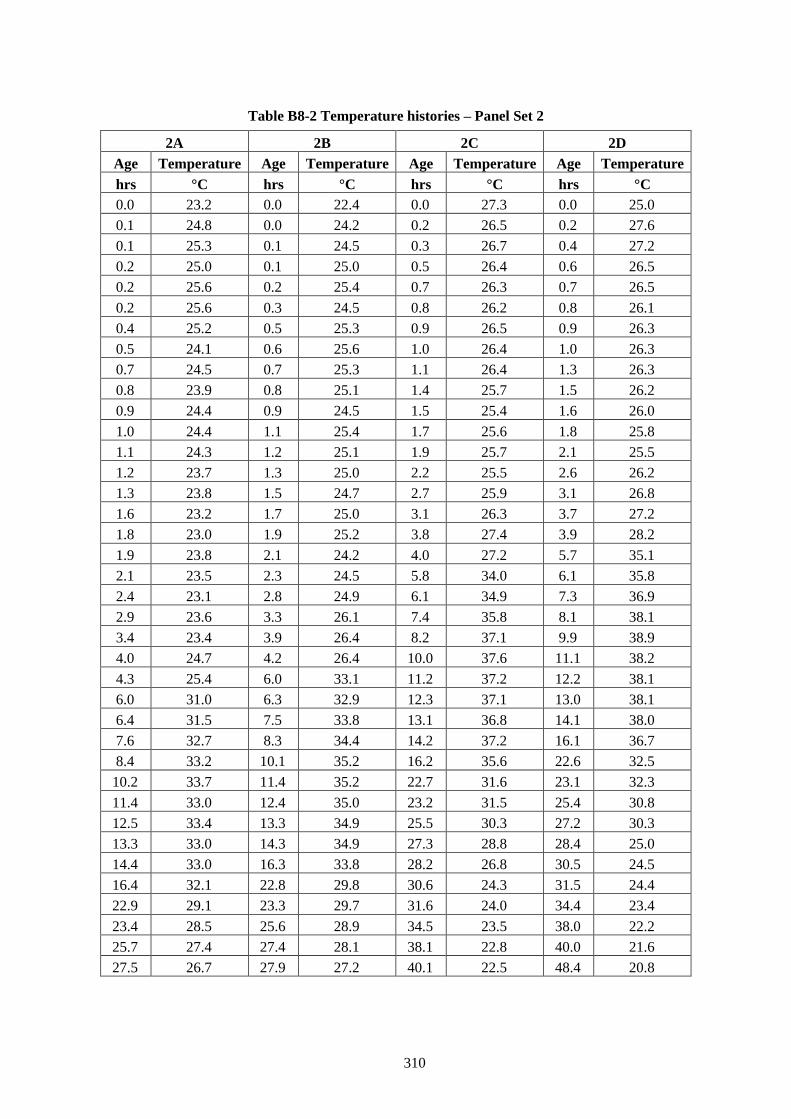
310
Table B8-2 Temperature histories – Panel Set 2
2A 2B 2C 2D
Age Temperature Age Temperature Age Temperature Age Temperature
hrs °C hrs °C hrs °C hrs °C
0.0 23.2 0.0 22.4 0.0 27.3 0.0 25.0
0.1 24.8 0.0 24.2 0.2 26.5 0.2 27.6
0.1 25.3 0.1 24.5 0.3 26.7 0.4 27.2
0.2 25.0 0.1 25.0 0.5 26.4 0.6 26.5
0.2 25.6 0.2 25.4 0.7 26.3 0.7 26.5
0.2 25.6 0.3 24.5 0.8 26.2 0.8 26.1
0.4 25.2 0.5 25.3 0.9 26.5 0.9 26.3
0.5 24.1 0.6 25.6 1.0 26.4 1.0 26.3
0.7 24.5 0.7 25.3 1.1 26.4 1.3 26.3
0.8 23.9 0.8 25.1 1.4 25.7 1.5 26.2
0.9 24.4 0.9 24.5 1.5 25.4 1.6 26.0
1.0 24.4 1.1 25.4 1.7 25.6 1.8 25.8
1.1 24.3 1.2 25.1 1.9 25.7 2.1 25.5
1.2 23.7 1.3 25.0 2.2 25.5 2.6 26.2
1.3 23.8 1.5 24.7 2.7 25.9 3.1 26.8
1.6 23.2 1.7 25.0 3.1 26.3 3.7 27.2
1.8 23.0 1.9 25.2 3.8 27.4 3.9 28.2
1.9 23.8 2.1 24.2 4.0 27.2 5.7 35.1
2.1 23.5 2.3 24.5 5.8 34.0 6.1 35.8
2.4 23.1 2.8 24.9 6.1 34.9 7.3 36.9
2.9 23.6 3.3 26.1 7.4 35.8 8.1 38.1
3.4 23.4 3.9 26.4 8.2 37.1 9.9 38.9
4.0 24.7 4.2 26.4 10.0 37.6 11.1 38.2
4.3 25.4 6.0 33.1 11.2 37.2 12.2 38.1
6.0 31.0 6.3 32.9 12.3 37.1 13.0 38.1
6.4 31.5 7.5 33.8 13.1 36.8 14.1 38.0
7.6 32.7 8.3 34.4 14.2 37.2 16.1 36.7
8.4 33.2 10.1 35.2 16.2 35.6 22.6 32.5
10.2 33.7 11.4 35.2 22.7 31.6 23.1 32.3
11.4 33.0 12.4 35.0 23.2 31.5 25.4 30.8
12.5 33.4 13.3 34.9 25.5 30.3 27.2 30.3
13.3 33.0 14.3 34.9 27.3 28.8 28.4 25.0
14.4 33.0 16.3 33.8 28.2 26.8 30.5 24.5
16.4 32.1 22.8 29.8 30.6 24.3 31.5 24.4
22.9 29.1 23.3 29.7 31.6 24.0 34.4 23.4
23.4 28.5 25.6 28.9 34.5 23.5 38.0 22.2
25.7 27.4 27.4 28.1 38.1 22.8 40.0 21.6
27.5 26.7 27.9 27.2 40.1 22.5 48.4 20.8

311
Table B8-3 Temperature histories – Panel Set 3
3A 3B 3C 3D
Age Temperature Age Temperature Age Temperature Age Temperature
hrs °C hrs °C hrs °C hrs °C
0.0 23.8 0.0 22.0 0.0 21.6 0.0 21.8
0.1 23.6 0.1 23.6 0.1 23.9 0.2 26.0
0.2 23.3 0.2 21.6 0.2 25.6 0.3 25.4
0.3 23.9 0.3 23.5 0.3 25.9 0.5 25.2
0.3 24.2 0.3 23.9 0.4 25.9 0.6 25.4
0.4 24.4 0.4 24.0 0.5 26.2 0.7 24.9
0.5 23.9 0.5 23.4 0.6 26.2 1.4 24.1
0.5 23.4 0.5 25.1 0.8 26.0 1.5 24.2
0.6 24.7 0.6 24.5 0.8 26.9 1.6 24.2
0.7 24.1 0.8 25.6 1.5 25.7 1.8 23.4
0.8 25.2 0.9 25.3 1.6 25.4 2.1 23.3
0.9 24.6 1.0 24.9 1.7 25.8 2.4 23.9
1.0 24.4 1.0 25.7 1.9 25.6 2.6 23.7
1.1 25.0 1.8 24.8 2.2 25.6 3.2 24.2
1.8 24.4 1.8 24.7 2.6 26.2 3.7 25.3
1.9 24.7 1.9 24.9 2.7 26.3 3.7 26.7
2.0 24.4 2.2 24.8 3.4 28.1 4.2 28.3
2.2 24.2 2.4 25.1 3.8 28.7 4.4 29.6
2.5 25.0 2.8 25.7 3.9 30.1 5.8 32.3
2.9 25.7 3.0 25.4 4.3 31.7 6.5 34.1
3.0 25.3 3.6 27.6 4.5 32.8 7.5 34.2
3.7 27.5 4.0 29.0 5.9 35.0 7.9 34.5
4.1 29.6 4.1 29.7 6.7 36.3 9.1 35.5
4.2 30.1 4.5 31.7 7.7 36.5 10.4 35.6
4.6 32.3 4.8 33.1 8.0 37.1 11.1 35.2
4.8 32.7 6.1 35.8 9.2 37.0 11.9 34.8
6.2 35.0 6.9 37.4 10.5 37.4 14.1 34.1
6.9 36.3 7.9 37.3 11.2 37.2 16.0 33.1
8.0 36.5 8.3 37.6 12.0 37.1 24.4 28.8
8.3 36.2 9.4 38.1 14.2 36.2 32.5 21.5
9.5 36.8 10.7 38.5 16.1 34.7 36.4 22.1
10.8 36.7 11.5 37.6 24.5 31.1 42.1 21.3
11.5 37.1 12.2 37.6 32.7 23.3 49.3 21.0
12.3 36.7 14.4 34.7 36.5 23.5
14.5 34.7 16.3 34.6 42.3 23.6
16.4 31.1 24.8 30.3 49.4 21.9
24.8 29.4 32.9 26.0


313
B9 Sprayed concrete – modelled degree of hydration of
calibration test panels at time of strength testing
Table B9-1 Degree of hydration estimates for Panel Set 1
1A 1B 1C 1D
Age Age Age Age
hrs - hrs - hrs - hrs -
0.4 0.095 0.3 0.092 0.3 0.088 0.2 0.080
0.6 0.101 0.5 0.101 0.4 0.096 0.3 0.093
0.9 0.109 0.8 0.108 0.6 0.103 0.5 0.099
1.2 0.113 1.1 0.113 0.9 0.109 0.8 0.108
4.5 0.156 3.7 0.141 4.0 0.148 28.4 0.549
12.5 0.421 6.5 0.247 6.8 0.271 50.5 0.604
23.5 0.527 12.5 0.425 12.5 0.430
26.4 0.542 23.7 0.528 23.8 0.529
50.3 0.605
Table B9-2 Degree of hydration estimates for Panel Set 2
2A 2B 2C 2D
Age Age Age Age
hrs - hrs - hrs - hrs -
0.3 0.095 0.2 0.086 0.3 0.092 0.5 0.104
0.5 0.102 0.4 0.098 0.5 0.105 1.0 0.114
1.0 0.112 1.0 0.112 1.0 0.114 29.4 0.582
3.4 0.139 3.7 0.149 3.9 0.163 52.8 0.622
5.8 0.216 6.0 0.242 12.2 0.449
12.2 0.420 12.2 0.433 24.7 0.558
23.2 0.524 23.3 0.537 30.8 0.580
51.6 0.618
Table B9-3 Degree of hydration estimates for Panel Set 3
3A 3B 3C 3D
Age Age Age Age
hrs - hrs - hrs - hrs -
0.6 0.102 0.6 0.102 0.6 0.105 0.7 0.107
0.8 0.109 0.9 0.110 0.8 0.109 0.9 0.111
1.4 0.116 1.4 0.117 1.4 0.117 1.3 0.116
2.9 0.133 3.1 0.136 3.3 0.144 29.8 0.563
6.6 0.293 6.8 0.308 12.6 0.459
12.3 0.448 12.4 0.458 25.3 0.561
24.8 0.548 25.0 0.559 30.0 0.579


